Embed Size (px)
Citation preview
Wells, B., Innocent, G. T., Eckersall, P. D., Mcculloch, E., Nisbet, A. J., and Burgess, S. T. (2013) Two major ruminant acute phase proteins, haptoglobin and serum amyloid A, as serum biomarkers during active sheep scab infestation. Veterinary Research, 44 (1). p. 103. ISSN 0928-4249 Copyright © 2013 The Authors http://eprints.gla.ac.uk/96582/ Deposited on: 29 August 2014
Enlighten – Research publications by members of the University of Glasgow
http://eprints.gla.ac.uk
VETERINARY RESEARCHWells et al. Veterinary Research 2013, 44:103http://www.veterinaryresearch.org/content/44/1/103
RESEARCH Open Access
Two major ruminant acute phase proteins,haptoglobin and serum amyloid A, as serumbiomarkers during active sheep scab infestationBeth Wells1*, Giles T Innocent2, Peter D Eckersall3, Eilidh McCulloch4, Alasdair J Nisbet1 and Stewart TG Burgess1
Abstract
Two ruminant acute phase proteins (APPs), haptoglobin (Hp) and serum amyloid A (SAA), were evaluated as serumbiomarkers (BMs) for sheep scab–a highly contagious ectoparasitic disease caused by the mite Psoroptes ovis, whichis a major welfare and production threat worldwide. The levels of both APPs increased in serum followingexperimental infestation of sheep with P. ovis, becoming statistically significantly elevated from pre-infestation levelsat 4 weeks post-infestation. Following successful treatment of infested sheep with an endectocide, Hp and SAAserum levels declined rapidly, with half lives of less than 3 days. In contrast, serum IgG levels which specificallybound the P. ovis-derived diagnostic antigen Pso o 2 had a half-life of 56 days. Taking into account pre-infestationserum levels, rapidity of response to infestation and test sensitivity at the estimated optimum cut-off values, SAAwas the more discriminatory marker. These studies illustrated the potential of SAA and Hp to indicate current sheepscab infestation status and to augment the existing Pso o 2 serological assay to give disease-specific indications ofboth infestation and successful treatment.
IntroductionSheep scab, caused by the infestation of sheep skin withthe highly contagious mite Psoroptes ovis, affects theproductivity and welfare of sheep as it produces in-tensely pruritic lesions and wool loss. These factors,along with the high cost of treatment, mean this diseasehas significant economic implications for the sheep in-dustries of affected countries [1]. In the UK, the inci-dence of the disease has increased to a level that it isnow endemic [2] with the national annual prevalence es-timated at > 7000 outbreaks [3]. This has resulted in thedisease being made notifiable in a number of countries(e.g. in Scotland through the Sheep Scab (Scotland)Order 2010 [4]), which has renewed the focus on accur-ate diagnosis for effective control. Accurate diagnosiscan be challenging - clinical signs in P. ovis infestedsheep may be minimal during early infestation (up toseveral months in the field) and easily missed but theseanimals represent a source of infestation [5]. In such a
* Correspondence: [email protected] Research Institute, Pentlands Science Park, Midlothian EH26 0PZ, UKFull list of author information is available at the end of the article
© 2013 Wells et al.; licensee BioMed Central LCommons Attribution License (http://creativecreproduction in any medium, provided the or
situation, mites can be difficult to locate and the sensi-tivity of the microscopic detection of mites in skinscrapings from these animals can be as low as 18% [6].In addition to P. ovis, other ectoparasites such as ticksand lice can induce skin reactions which may appearsimilar to those seen in early infestation with P. ovis[7,8] and dual infestations with more than one ectopara-site are common. The difficulties highlighted above inthe control and diagnosis of sheep scab illustrates the re-quirement for a sensitive and specific test which wouldindicate early infestation and also current disease status.Several immunoassays have been developed to detect
serum antibodies with specific reactivity to P. ovis anti-gens from infested sheep [9-11]. Recently we have suc-cessfully developed a diagnostic test which detects thehost’s antibody response to the P. ovis antigen Pso o 2.This test is highly specific and sensitive and can detectserum antibodies to Pso o 2 as early as two weeks post-infestation [12]. However, due to antibody persistence ofseveral months in the serum, the test cannot distinguishbetween currently-infested and recently-(successfully)treated sheep [13]. This is an important factor in anycontrol or eradication regime where demonstration of
td. This is an open access article distributed under the terms of the Creativeommons.org/licenses/by/2.0), which permits unrestricted use, distribution, andiginal work is properly cited.
Table 1 Sera samples used to test APP responses duringcommon infections and conditions of sheep
Infection / condition Number of samples
Early gestationa 10
Late gestationb 10
Gastro-intestinal nematodesc 6
Liver Fluke (Fasciola hepatica)d 6
Sucking lice (Linognathus spp.)e 4
Chewing lice (Bovicola ovis)e 4
Orff 6
Johnes diseaseg 6aEarly gestation was within 1 week of conception and blate gestation was1 week prior to expected lambing date (samples from Moredun ResearchInstitute (MRI)). cSamples from sheep with field-acquired gastro-intestinalnematode (GIN) infections were from Firth Mains Farm, UK (MRI); species in-cluded Teladorsagia circumcincta and Nematodirus battus. dSamples were takenfrom UK sheep with field-acquired infections of liver fluke (samples provide byDr H McDougall, MRI); esamples from lice infected but P. ovis-uninfested sheep(provided by Prof. N. Sargison, R(D)SVS, UK; fsamples from sheep infected ex-perimentally with orf virus or gMycobacterium avium subspeciesparatuberculosis (MRI).
Wells et al. Veterinary Research 2013, 44:103 Page 2 of 11http://www.veterinaryresearch.org/content/44/1/103
freedom from infestation following treatment forms partof legislation on movement restrictions etc. Therefore,an improved diagnostic test for sheep scab should combinethe pathogen specificity and early indication of infestation(as provided by the Pso o 2 ELISA [12]) with a biomarker(BM) element to differentiate between successfully-treatedanimals and those with active disease.Ideally, BMs should circulate at low levels in the
serum of healthy individuals, increase in titre rapidly fol-lowing the onset of disease and return to pre-infestationlevels soon after successful treatment or disease reso-lution [14]. As this describes the behaviour of inflamma-tory proteins and, as sheep scab produces an acuteinflammatory response within hours of infestation [15],we investigated two ruminant acute phase proteins(APPs)–haptoglobin (Hp) and serum amyloid A (SAA)–asBMs for sheep scab. Ruminants are unique in that Hp is amajor APP [16] and in sheep, as for cattle, APP produc-tion continues in chronic as well as acute infections, withroles in tissue repair. In cattle, Hp is synthesised only inresponse to inflammation [17] and Hp levels have beenused extensively to monitor inflammatory disease [18] butto date there has been very little work on the acute phaseresponse in sheep [16].This study investigates qualitative and quantitative
serum levels of Hp and SAA in sheep during experimen-tal infestations with P. ovis and the effects of successfultreatment on these APPs; reports Hp and SAA levelsduring other common conditions and diseases of sheepand in sheep diagnosed as clinically positive during anatural outbreak of sheep scab.
Materials and methodsSamples used in APP evaluationTime course trialTo supply sera for initial immunoblot analyses, blood wassampled from each of 6 Scotch Mule mixed sex 1-2 yearold sheep, by venous extraction, prior to infestation withP. ovis. Following infestation on the withers with approxi-mately 50 mites, blood was sampled weekly from each ani-mal for 6 weeks and sera were prepared by centrifugingwhole blood at 900 g for 10 min. Sera were then storedat −20 °C until use. This part of the study was termedthe “time-course trial” (TCT).
Primary infestation and treatment trialFor the quantitative analysis of Hp and SAA, sera wereobtained from 12 P. ovis-naïve, Scotch Mule, mixed sex,1-2 year old sheep infested with P. ovis mites as de-scribed above. Blood samples were acquired beforeexposure and then weekly over a 6 week period post-infestation. At 6 weeks post-infestation, all twelvesheep were treated with an injectable endectocide(Dectomax, Pfizer Animal Health) by intramuscular
injection at a dose of 1 mL per 33 kg bodyweight andblood was then sampled twice weekly for 2.5 weeks;then at 4, 9 and 14 weeks post-treatment. This partof the study was termed the “primary infestation andtreatment” (PIT) trial.
Secondary infestation and treatment trialFourteen weeks post-treatment the sheep were re-infestedwith P. ovis and blood samples were taken at 24 hourspost-infestation then weekly for a further 6 weeks. Onweek 6, sheep were treated with endectocide again, as de-scribed above, and blood was then sampled twice weeklyfor a further 2.5 weeks. This part of the study was termedthe “secondary infestation and treatment” (SIT) trial. Serawere prepared from each of the blood samples by centrifu-ging whole blood at 900 g then sera were stored at −20 °Cuntil use. Lesion areas were measured at the time ofeach blood sampling post-infestation until 2 weekspost-treatment by measuring the length and width ofthe main lesion on each sheep and recording the resultas an average mean lesion area (cm2) ± SEM.
Field acquired infestationsIn addition to these sera from experimental infestations,sera were also acquired from sheep with field-acquiredsheep scab infestations (n = 12). Sera were available forthese animals pre-infestation, at point of clinical diagno-sis and two months post-treatment [13].
Other common infectionsTo test the specificity of the Hp and SAA response, thesamples listed in Table 1 were used to analyse Hp and
Wells et al. Veterinary Research 2013, 44:103 Page 3 of 11http://www.veterinaryresearch.org/content/44/1/103
SAA levels during other common infections and condi-tions of sheep.
Qualitative analyses of the APPs: Haptoglobin (Hp) andSerum Amyloid A (SAA)Sera from each of 6 sheep in the TCT study were pooledaccording to time point post-infestation and were thendiluted 1:10 with dH₂O. Polyacrylamide gel electrophor-esis (SDS-PAGE), under denaturing conditions, was per-formed using NuPage BisTris 4-12% polyacrylamide gels(Invitrogen) with MES buffer (Invitrogen) according tothe manufacturer’s instructions.Gels were stained in SimplyBlue Safestain (Invitrogen)
following the manufacturer’s protocol. Bands which in-creased in intensity through the time course of infest-ation were excised from the gel and identified usingmatrix assisted laser desorption ionization (MALDI) atthe Moredun Proteomics Facility: Excised bands weredestained and subjected to reductive alkylation usingDTT and iodoacetamide. Gel pieces were digested over-night at 37 °C in trypsin and digests analysed on anUltraflex II MALDI-ToF-ToF mass spectrometer (BrukerDaltonics). The masses obtained were used for databasesearching with the MASCOT search engine using Swiss-Prot and local databases with a 50 ppm mass tolerancewindow. Significant matches from the Peptide Mass Fin-gerprint data were confirmed by MS/MS analysis usingthe search criteria above and an MS/MS tolerance win-dow of 0.5 Da.Immunoblotting was performed using sera from indi-
vidual sheep with different disease progression profilesin the TCT trial. Sheep 1 had a naturally-resolving le-sion, which was at maximum size at week 4 post-infestation, whilst the lesion from Sheep 5 and 6 showeda gradual expansion over the time course of infestation.Sera from these sheep from each time point in the TCTtrial were separated by SDS-PAGE as described aboveand then transferred to a nitrocellulose membrane byelectroblotting using the iBlot Western Blotting system(Invitrogen), following manufacturer’s instructions. Theblot was blocked using 3% gelatin from cold water fishskin (Aldrich) for 30 min prior to washing with washingbuffer/antibody diluent (10% PBS; 90% dH₂O, 29.22 gNaCl and 5 mL Tween 80 (Sigma-Aldrich). The blot wasincubated with the following antibodies for 1 h with wash-ing in between incubations: The primary antibody usedfor detecting Hp in the electrophoresed serum sampleswas a rabbit polyclonal anti-human Hp (Abcam, ab85846)used at a concentration of 1 μg/mL. The secondary anti-body conjugate used was a swine anti-rabbit IgG HRPconjugate (Dako, P0399) used at a concentration of0.5 μg/mL. Visualisation was by ECL Plus (GE Health-care) using the ImageQuant system (GE Healthcare).The primary antibody for the detection of SAA was a
rabbit polyclonal anti-human recombinant SAA (Abcam,ab59736) used at a concentration of 2 μg/mL. The conju-gate was a swine anti-rabbit HRP IgG (Dako P0399) usedat a concentration of 0.5 μg/mL. Band densities were esti-mated using the Quantity One software 4.6.2 (Bio-Rad).
Quantitative analyses of the AAPsHp concentrations were determined by ReactivLab andGlasgow University using a colorimetric assay (Reactiv-Lab Ltd, Wetherby, UK) based on the method describedby Eckersall et al. [19] and modified as described inInternational Patent Application WO 2012/085497 A1.Validation of this cross species assay for Hp was de-scribed in Crawford et al. [20]. For determination of theconcentration of Hp in ovine serum the assay was fur-ther validated. The intra-assay coefficient of variance(CV) was 5.5% calculated as the mean of CVs of samples(n = 47) run in duplicate in one assay, the inter-assayCVs using quality control samples of ovine serum were6.5% at a mean Hp of 0.34 g/L (n = 7), 5% at a mean Hpof 0.71 g/L (n = 7) and 11.5% at a mean Hp of 1.01 g/L(n = 5). The limit of detection was 0.02 g/L determinedas the concentration of Hp at 3 standard deviations fromthe mean of a blank sample. Hp concentrations werequantified in sheep sera from the PIT and SIT trials;from the field-acquired P. ovis infestations and fromsheep with other common conditions (Table 1). The Hpassay was performed on an ABX Pentra 400 analyser(Horiba Medical) using a calibration curve with a topHp standard of 1.48 mg/mL such that samples with Hpvalues greater than this were automatically diluted. Allsamples were tested in duplicate.For SAA, a commercially-available ELISA kit (TP-802,
Tridelta Development Ltd) was used to quantify levels ofthis APP in sheep sera. The manufacturer’s protocol wasfollowed using the same sera samples as described abovefor Hp. Samples were tested from individuals in dupli-cate alongside a SAA standard curve and all serum wasdiluted 1:500 in sample diluent buffer (Tridelta Develop-ment Ltd). The upper level of the range of the bovinestandards used was 300 ng/mL therefore all sera samplesshowing SAA values greater than this were further di-luted as required and re-analysed.
Analysis of serum IgG levels to the mite antigen Pso o 2An ELISA which measures the levels of Pso o 2-specificIgG in sheep serum [12] was used to allow post-infestationcomparisons of Pso o 2-specific IgG synthetic and decayprofiles (post-treatment) with those of Hp and SAA. Serumsamples from the PIT and SIT experimental trials wereused to assess persistence in antigen-specific IgG levelsafter treatment [11,13]. Serum samples were analysed upto, and including, 14 weeks post-treatment. The ELISAwas performed as previously described [12] with the
0
500
1000
1500
2000
2500
0 1 2 3 4 5 6 7 8
Mea
n le
sion
are
a cm
²
Week post-infestation / post-treatment
Treatment
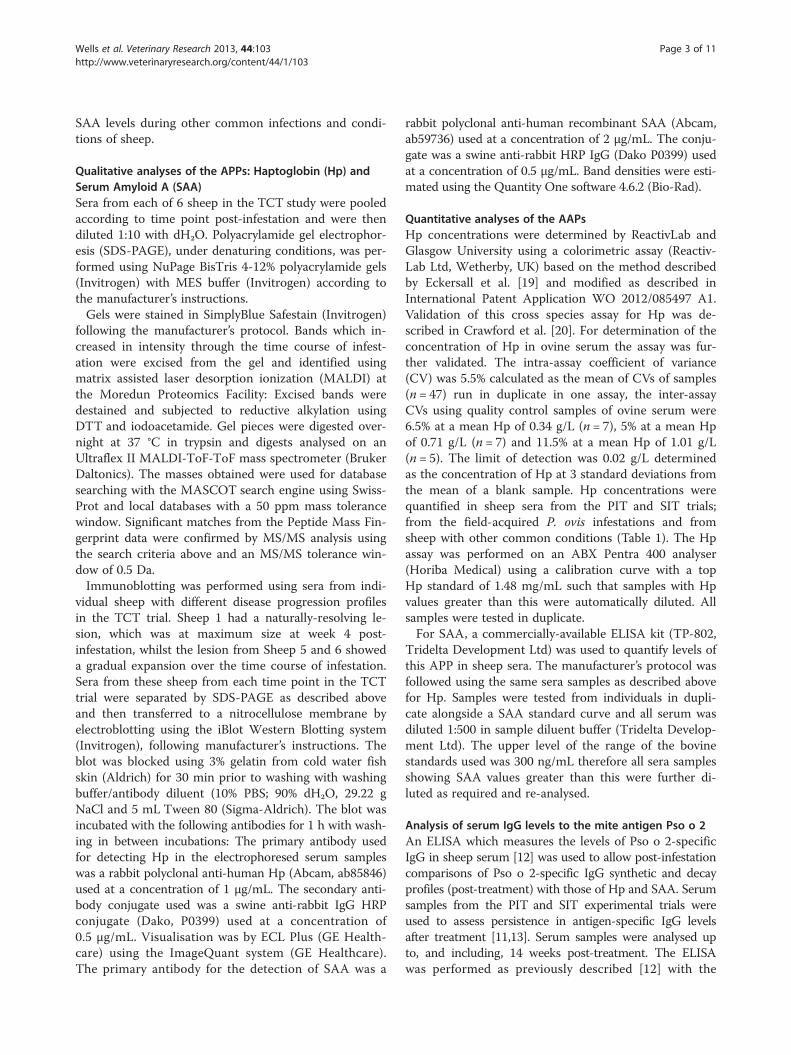
Figure 1 Skin lesion areas for sheep over a 6 week time courseof infestation with Psoroptes ovis and 2 weeks post-treatment(PIT trial data). *Values shown are means (± SEM, n = 12). Allanimals treated with Dectomax (Pfizer Animal Health) at6 weeks post-infestation.
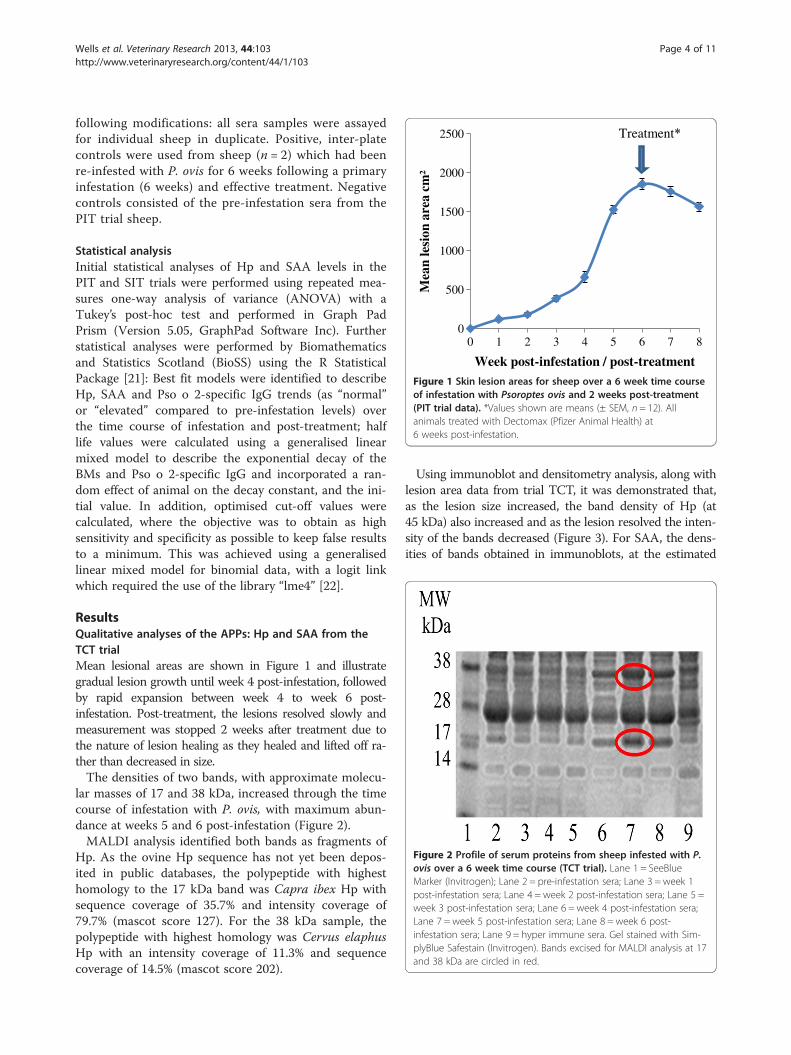
Figure 2 Profile of serum proteins from sheep infested with P.ovis over a 6 week time course (TCT trial). Lane 1 = SeeBlueMarker (Invitrogen); Lane 2 = pre-infestation sera; Lane 3 = week 1post-infestation sera; Lane 4 = week 2 post-infestation sera; Lane 5 =week 3 post-infestation sera; Lane 6 = week 4 post-infestation sera;Lane 7 = week 5 post-infestation sera; Lane 8 = week 6 post-infestation sera; Lane 9 = hyper immune sera. Gel stained with Sim-plyBlue Safestain (Invitrogen). Bands excised for MALDI analysis at 17and 38 kDa are circled in red.
Wells et al. Veterinary Research 2013, 44:103 Page 4 of 11http://www.veterinaryresearch.org/content/44/1/103
following modifications: all sera samples were assayedfor individual sheep in duplicate. Positive, inter-platecontrols were used from sheep (n = 2) which had beenre-infested with P. ovis for 6 weeks following a primaryinfestation (6 weeks) and effective treatment. Negativecontrols consisted of the pre-infestation sera from thePIT trial sheep.
Statistical analysisInitial statistical analyses of Hp and SAA levels in thePIT and SIT trials were performed using repeated mea-sures one-way analysis of variance (ANOVA) with aTukey’s post-hoc test and performed in Graph PadPrism (Version 5.05, GraphPad Software Inc). Furtherstatistical analyses were performed by Biomathematicsand Statistics Scotland (BioSS) using the R StatisticalPackage [21]: Best fit models were identified to describeHp, SAA and Pso o 2-specific IgG trends (as “normal”or “elevated” compared to pre-infestation levels) overthe time course of infestation and post-treatment; halflife values were calculated using a generalised linearmixed model to describe the exponential decay of theBMs and Pso o 2-specific IgG and incorporated a ran-dom effect of animal on the decay constant, and the ini-tial value. In addition, optimised cut-off values werecalculated, where the objective was to obtain as highsensitivity and specificity as possible to keep false resultsto a minimum. This was achieved using a generalisedlinear mixed model for binomial data, with a logit linkwhich required the use of the library “lme4” [22].
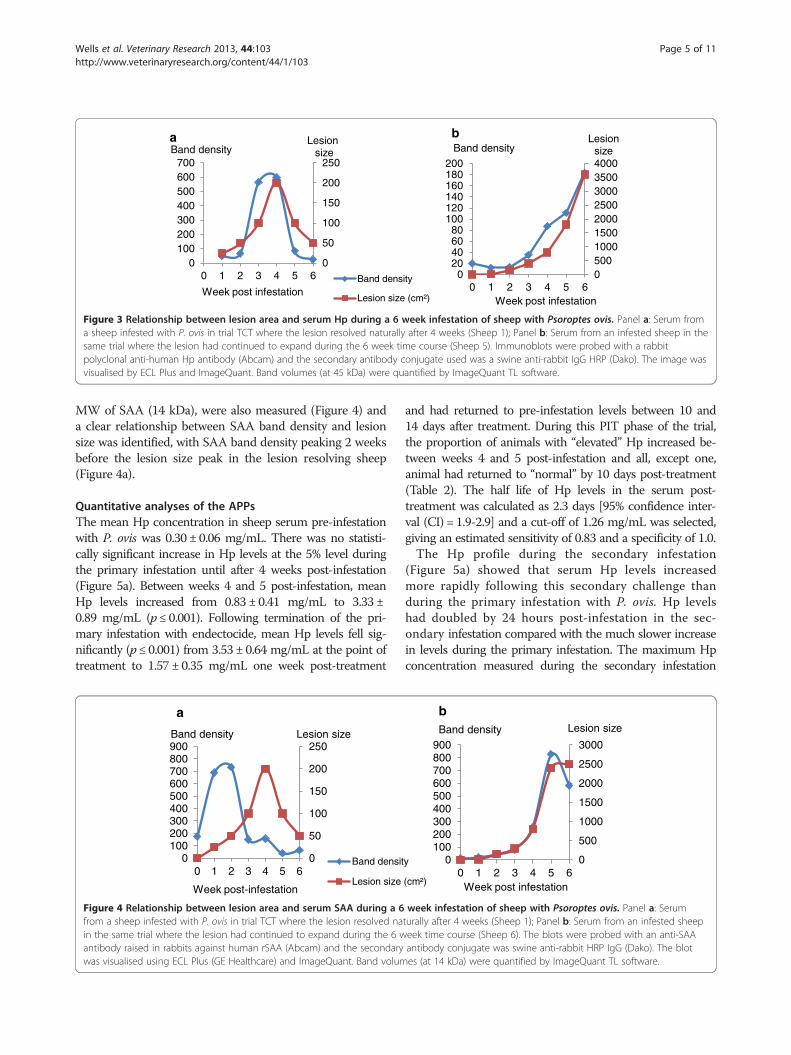
ResultsQualitative analyses of the APPs: Hp and SAA from theTCT trialMean lesional areas are shown in Figure 1 and illustrategradual lesion growth until week 4 post-infestation, followedby rapid expansion between week 4 to week 6 post-infestation. Post-treatment, the lesions resolved slowly andmeasurement was stopped 2 weeks after treatment due tothe nature of lesion healing as they healed and lifted off ra-ther than decreased in size.The densities of two bands, with approximate molecu-
lar masses of 17 and 38 kDa, increased through the timecourse of infestation with P. ovis, with maximum abun-dance at weeks 5 and 6 post-infestation (Figure 2).MALDI analysis identified both bands as fragments of
Hp. As the ovine Hp sequence has not yet been depos-ited in public databases, the polypeptide with highesthomology to the 17 kDa band was Capra ibex Hp withsequence coverage of 35.7% and intensity coverage of79.7% (mascot score 127). For the 38 kDa sample, thepolypeptide with highest homology was Cervus elaphusHp with an intensity coverage of 11.3% and sequencecoverage of 14.5% (mascot score 202).
Using immunoblot and densitometry analysis, along withlesion area data from trial TCT, it was demonstrated that,as the lesion size increased, the band density of Hp (at45 kDa) also increased and as the lesion resolved the inten-sity of the bands decreased (Figure 3). For SAA, the dens-ities of bands obtained in immunoblots, at the estimated
0
50
100
150
200
250
0100200300400500600700
0 1 2 3 4 5 6 Band density
Lesion size (cm²)Week post infestation
Band densityLesion
sizea
05001000150020002500300035004000
020406080
100120140160180200
0 1 2 3 4 5 6
Lesion size
Week post infestation
Band densityb
Figure 3 Relationship between lesion area and serum Hp during a 6 week infestation of sheep with Psoroptes ovis. Panel a: Serum froma sheep infested with P. ovis in trial TCT where the lesion resolved naturally after 4 weeks (Sheep 1); Panel b: Serum from an infested sheep in thesame trial where the lesion had continued to expand during the 6 week time course (Sheep 5). Immunoblots were probed with a rabbitpolyclonal anti-human Hp antibody (Abcam) and the secondary antibody conjugate used was a swine anti-rabbit IgG HRP (Dako). The image wasvisualised by ECL Plus and ImageQuant. Band volumes (at 45 kDa) were quantified by ImageQuant TL software.
Wells et al. Veterinary Research 2013, 44:103 Page 5 of 11http://www.veterinaryresearch.org/content/44/1/103
MW of SAA (14 kDa), were also measured (Figure 4) anda clear relationship between SAA band density and lesionsize was identified, with SAA band density peaking 2 weeksbefore the lesion size peak in the lesion resolving sheep(Figure 4a).
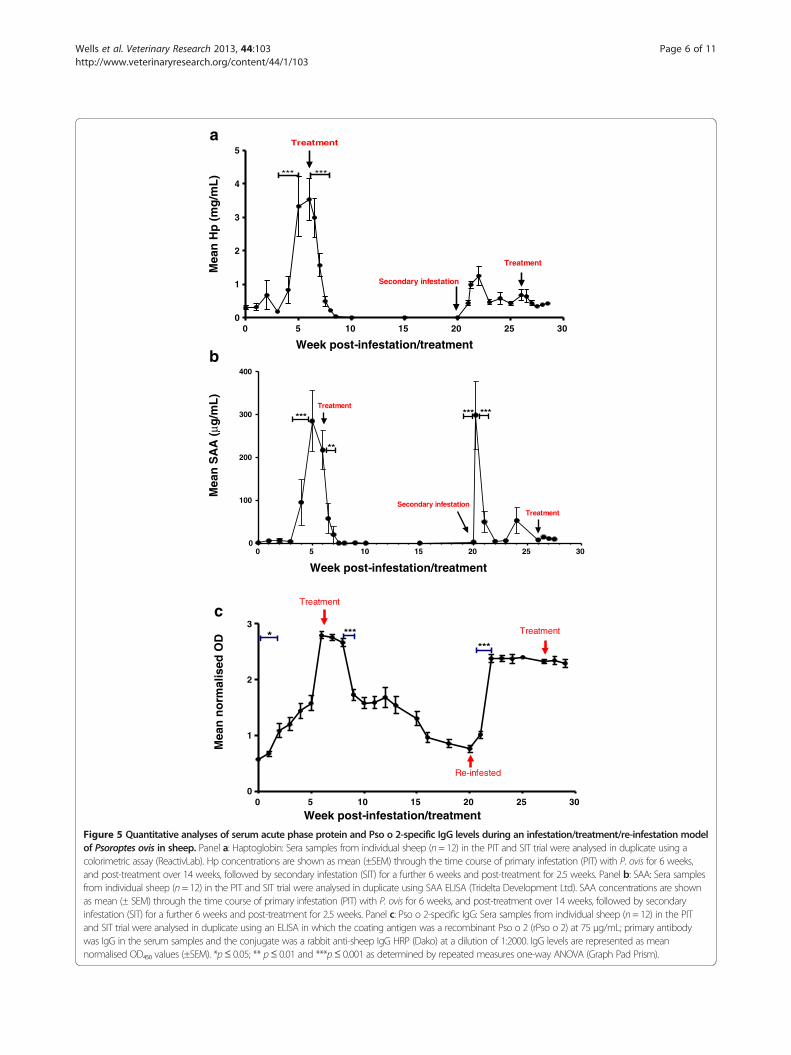
Quantitative analyses of the APPsThe mean Hp concentration in sheep serum pre-infestationwith P. ovis was 0.30 ± 0.06 mg/mL. There was no statisti-cally significant increase in Hp levels at the 5% level duringthe primary infestation until after 4 weeks post-infestation(Figure 5a). Between weeks 4 and 5 post-infestation, meanHp levels increased from 0.83 ± 0.41 mg/mL to 3.33 ±0.89 mg/mL (p ≤ 0.001). Following termination of the pri-mary infestation with endectocide, mean Hp levels fell sig-nificantly (p ≤ 0.001) from 3.53 ± 0.64 mg/mL at the point oftreatment to 1.57 ± 0.35 mg/mL one week post-treatment
0
50
100
150
200
250
0100200300400500600700800900
0 1 2 3 4 5 6Band densit
Lesion size Week post-infestation
Band density Lesion size
a
Figure 4 Relationship between lesion area and serum SAA during a 6from a sheep infested with P. ovis in trial TCT where the lesion resolved nain the same trial where the lesion had continued to expand during the 6 wantibody raised in rabbits against human rSAA (Abcam) and the secondarywas visualised using ECL Plus (GE Healthcare) and ImageQuant. Band volum
and had returned to pre-infestation levels between 10 and14 days after treatment. During this PIT phase of the trial,the proportion of animals with “elevated” Hp increased be-tween weeks 4 and 5 post-infestation and all, except one,animal had returned to “normal” by 10 days post-treatment(Table 2). The half life of Hp levels in the serum post-treatment was calculated as 2.3 days [95% confidence inter-val (CI) = 1.9-2.9] and a cut-off of 1.26 mg/mL was selected,giving an estimated sensitivity of 0.83 and a specificity of 1.0.The Hp profile during the secondary infestation
(Figure 5a) showed that serum Hp levels increasedmore rapidly following this secondary challenge thanduring the primary infestation with P. ovis. Hp levelshad doubled by 24 hours post-infestation in the sec-ondary infestation compared with the much slower increasein levels during the primary infestation. The maximum Hpconcentration measured during the secondary infestation
y
(cm²)
0
500
1000
1500
2000
2500
3000
0100200300400500600700800900
0 1 2 3 4 5 6
Band density Lesion size
Week post infestation
b
week infestation of sheep with Psoroptes ovis. Panel a: Serumturally after 4 weeks (Sheep 1); Panel b: Serum from an infested sheepeek time course (Sheep 6). The blots were probed with an anti-SAAantibody conjugate was swine anti-rabbit HRP IgG (Dako). The blotes (at 14 kDa) were quantified by ImageQuant TL software.
0 5 10 15 20 25 300
1
2
3
4
5
*** ***
Treatment
Treatment
Secondary infestation
0 5 10 15 20 25 300
100
200
300
400
***
**
*** ***Treatment
TreatmentSecondary infestation
0 5 10 15 20 25 300
1
2
3
Treatment
* ***
Re-infested
***
Treatment
a
b
c
Mea
n H
p (
mg
/mL
)M
ean
SA
A (
µg/m
L)
Mea
n n
orm
alis
ed O
D
Week post-infestation/treatment
Week post-infestation/treatment
Week post-infestation/treatment
Figure 5 Quantitative analyses of serum acute phase protein and Pso o 2-specific IgG levels during an infestation/treatment/re-infestation modelof Psoroptes ovis in sheep. Panel a: Haptoglobin: Sera samples from individual sheep (n= 12) in the PIT and SIT trial were analysed in duplicate using acolorimetric assay (ReactivLab). Hp concentrations are shown as mean (±SEM) through the time course of primary infestation (PIT) with P. ovis for 6 weeks,and post-treatment over 14 weeks, followed by secondary infestation (SIT) for a further 6 weeks and post-treatment for 2.5 weeks. Panel b: SAA: Sera samplesfrom individual sheep (n= 12) in the PIT and SIT trial were analysed in duplicate using SAA ELISA (Tridelta Development Ltd). SAA concentrations are shownas mean (± SEM) through the time course of primary infestation (PIT) with P. ovis for 6 weeks, and post-treatment over 14 weeks, followed by secondaryinfestation (SIT) for a further 6 weeks and post-treatment for 2.5 weeks. Panel c: Pso o 2-specific IgG: Sera samples from individual sheep (n= 12) in the PITand SIT trial were analysed in duplicate using an ELISA in which the coating antigen was a recombinant Pso o 2 (rPso o 2) at 75 μg/mL; primary antibodywas IgG in the serum samples and the conjugate was a rabbit anti-sheep IgG HRP (Dako) at a dilution of 1:2000. IgG levels are represented as meannormalised OD₄₅₀ values (±SEM). *p≤ 0.05; ** p≤ 0.01 and ***p≤ 0.001 as determined by repeated measures one-way ANOVA (Graph Pad Prism).
Wells et al. Veterinary Research 2013, 44:103 Page 6 of 11http://www.veterinaryresearch.org/content/44/1/103
Table 2 Distribution of sheep into “normal” and“elevated” groups for serum Hp and SAA concentrationacross the time course of primary infestation withPsoroptes ovis and treatment with an endectocide (PITtrial)
Biomarker Week 0 1 2 3 4 5 6** 6.5 7 7.5 8
Hp Normal* 12 11 11 11 10 4 2 2 7 11 12
Elevated 0 1 1 1 2 8 10 10 5 1 0
SAA Normal 12 9 10 11 4 0 0 7 11 12 12
Elevated 0 3 2 1 8 12 12 5 1 0 0
* The status of APP levels in sheep sera (n = 12 for each time point) wasdetermined by comparison to pre-infestation levels using the RStatistical Package.** All sheep were treated with an injectable endectocide at week 6 post-infestation. In these analyses the animals were described as being “normal” asin day 0 (pre-infestation) or “elevated”. As the results showed a normal distri-bution, all values above the 0.999 quantile of the distribution were consideredto be elevated, giving a 99.9% specificity and undefined sensitivity.
Wells et al. Veterinary Research 2013, 44:103 Page 7 of 11http://www.veterinaryresearch.org/content/44/1/103
was at 2 weeks post-infestation (week 22) with a value of1.25 ± 0.27 mg/mL. By week 3 in the secondary infestation,Hp levels had decreased to pre-infestation levels andremained at low levels for the remainder of the trial.SAA levels pre-infestation were 0.82 ± 0.53 μg/mL and
remained at this level over the first 3 weeks of primaryinfestation (PIT, Figure 5b). By week 4 post-infestation,SAA levels had increased to 95.24 ± 54.4 μg/mL and there-after peaked at week 5 (284.75 ± 71.144 μg/mL). Theincrease in serum SAA levels between weeks 3 and 5post-infestation was highly statistically significant (p ≤0.001). Post-treatment, serum SAA levels fell within3 days of treatment to 57.28 ± 34.75 μg/mL (p ≤ 0.05)and continued to decrease reaching pre-infestationlevels within 10 days post-treatment. The proportionof animals showing elevated serum SAA increased be-tween weeks 4 and 5 post-infestation and all exceptone animal had returned to normal by 10 days post-treatment (Table 2). The half life of SAA in the serumpost-treatment was estimated at 0.84 days (95% CI = 0.73-0.99) and a cut-off value of 29.5 μg/mL was selected toidentify “elevated” animals above that point or “normal”animals below it. This cut-off value provided an estimatedassay sensitivity of 1.0 and a specificity of 1.0.The secondary infestation was characterised by a rapid
increase in SAA concentration of the same magnitude ofthe primary infestation peak, but within 24 h post-secondary infestation. Within 2 weeks of infestation,
Table 3 Distribution of sheep into “normal” and “elevated” gcourse of a primary infestation with Psoroptes ovis and treatm
Week 0 1 2 3 4 5 6* 7 8 9
Normal 12 9 4 3 1 1 0 0 0 0
Elevated 0 3 8 9 11 11 12 12 12 12
* All animals were treated with injectable endectocide at week 6 post-infestation. Infestation) or “elevated”. As the results showed a normal distribution, all values abova 99.9% specificity and undefined sensitivity.
however, SAA levels had fallen to pre-infestation levels(2.26 ± 2.46 μg/mL) and they remained at this leveluntil the end of the trial.
Analysis of serum IgG levels to the mite antigen Pso o 2By week 2 post-primary infestation (PIT trial) the meannormalised OD₄₅₀ value measured in ELISAs to detectPso o 2-specific IgG in sheep serum had increased from0.57 ± 0.02 pre-infestation to 1.197 ± 0.115 (p ≤ 0.05) andcontinued to increase until week 6 post-primary infest-ation (Figure 5c). The antigen-specific IgG levels in-creased, exponentially, over time during the primaryinfestation period up to the point of treatment by 0.034OD450 units per day (95% CI = 0.032-0.037). By week 3post-infestation, 9 out of 12 animals showed an “ele-vated” Pso o 2-specific IgG level (Table 3). After termin-ation of the primary infestation with endectocide, themean OD₄₅₀ decreased from a 2 weeks post-treatmentvalue of 2.66 ± 0.07 to 1.73 ± 0.10 by 3 weeks post-treatment(p ≤ 0.001). After this initial decline, the OD450 values con-tinued to decline slowly and did not return to pre-infestation levels until the start of the secondary infestationtrial, which was 14 weeks post-treatment. The half life of theantibody levels to Pso o 2 following endectocide treatmentwas estimated as being 56 days with a decay rate of 0.012OD450 units per day (95% CI = 0.011-0.014). More than halfof the sheep in the PIT trial continued to show elevated Psoo 2-specific IgG levels at 14 weeks post-treatment. As theanti-Pso o 2 antibody levels increased at approximately threetimes the rate at which they decreased, it is evident thatantibody levels were not an accurate measure of current dis-ease status post-treatment, but were effective during theearly diagnosis of sheep scab during this trial.
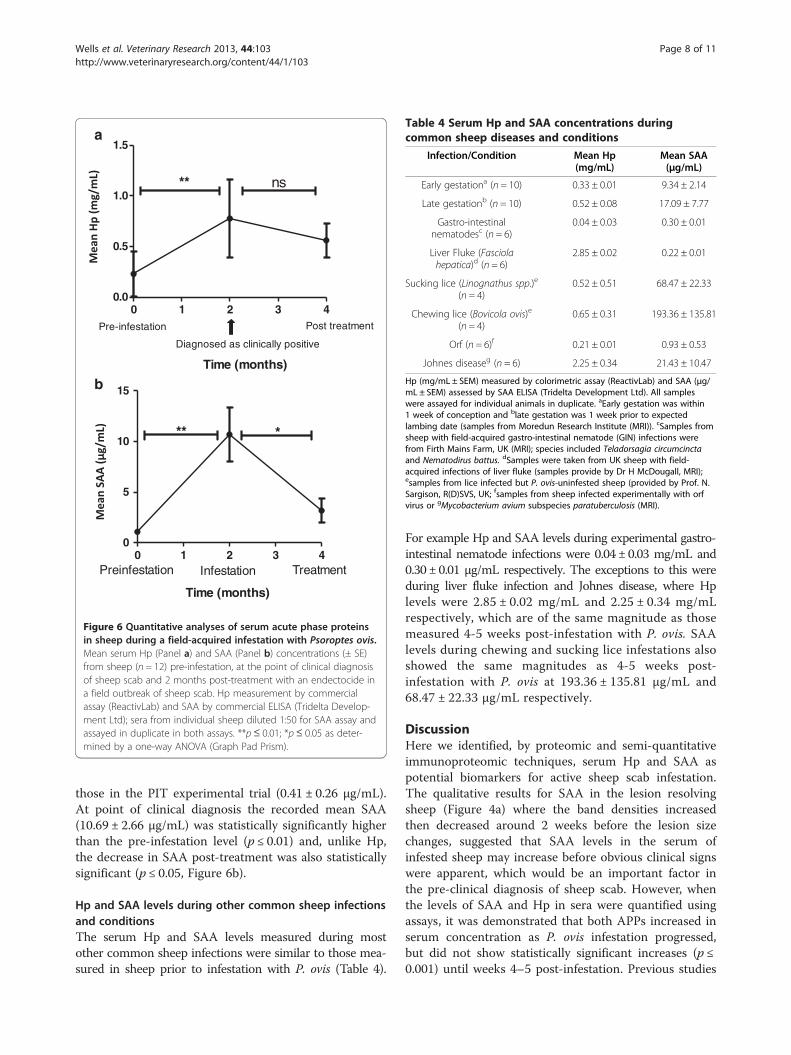
Assessment of APP levels in sheep during a fieldoutbreak of sheep scabThe pre-infestation levels of Hp (0.23 ± 0.22 mg/mL)were comparable to those, pre-infestation, in the PIT ex-perimental trial (0.29 ± 0.06 mg/mL) (Figure 6a). Follow-ing a field-acquired infestation with P. ovis, serum Hplevels were statistically significantly elevated at the point ofclinical diagnosis (p ≤ 0.01) but the decrease in Hp levels2 months post-treatment was not statistically significant.The pre-infestation levels of SAA (1.07 ± 0.24 μg/mL)
in these sheep (Figure 6b) were marginally higher than
roups for Pso o 2-specific serum IgG across the timeent with an endectocide (PIT trial)
10 11 12 13 14 15 16 17 18 19 20
0 0 0 1 1 1 2 4 5 5 6
12 12 12 11 11 11 10 8 7 7 6
this analysis the animals were described as being “normal” as in day 0 (pre-in-e the 0.999 quantile of the distribution were considered to be elevated, giving
0 1 2 3 40
5
10
15
Preinfestation
Time (months)
Infestation Treatment
** *
b
0 1 2 3 40.0
0.5
1.0
1.5
Pre-infestation
Diagnosed as clinically positive
Post treatment
** ns
Time (months)
a
Figure 6 Quantitative analyses of serum acute phase proteinsin sheep during a field-acquired infestation with Psoroptes ovis.Mean serum Hp (Panel a) and SAA (Panel b) concentrations (± SE)from sheep (n = 12) pre-infestation, at the point of clinical diagnosisof sheep scab and 2 months post-treatment with an endectocide ina field outbreak of sheep scab. Hp measurement by commercialassay (ReactivLab) and SAA by commercial ELISA (Tridelta Develop-ment Ltd); sera from individual sheep diluted 1:50 for SAA assay andassayed in duplicate in both assays. **p≤ 0.01; *p≤ 0.05 as deter-mined by a one-way ANOVA (Graph Pad Prism).
Table 4 Serum Hp and SAA concentrations duringcommon sheep diseases and conditions
Infection/Condition Mean Hp(mg/mL)
Mean SAA(μg/mL)
Early gestationa (n = 10) 0.33 ± 0.01 9.34 ± 2.14
Late gestationb (n = 10) 0.52 ± 0.08 17.09 ± 7.77
Gastro-intestinalnematodesc (n = 6)
0.04 ± 0.03 0.30 ± 0.01
Liver Fluke (Fasciolahepatica)d (n = 6)
2.85 ± 0.02 0.22 ± 0.01
Sucking lice (Linognathus spp.)e
(n = 4)0.52 ± 0.51 68.47 ± 22.33
Chewing lice (Bovicola ovis)e
(n = 4)0.65 ± 0.31 193.36 ± 135.81
Orf (n = 6)f 0.21 ± 0.01 0.93 ± 0.53
Johnes diseaseg (n = 6) 2.25 ± 0.34 21.43 ± 10.47
Hp (mg/mL ± SEM) measured by colorimetric assay (ReactivLab) and SAA (μg/mL ± SEM) assessed by SAA ELISA (Tridelta Development Ltd). All sampleswere assayed for individual animals in duplicate. aEarly gestation was within1 week of conception and blate gestation was 1 week prior to expectedlambing date (samples from Moredun Research Institute (MRI)). cSamples fromsheep with field-acquired gastro-intestinal nematode (GIN) infections werefrom Firth Mains Farm, UK (MRI); species included Teladorsagia circumcinctaand Nematodirus battus. dSamples were taken from UK sheep with field-acquired infections of liver fluke (samples provide by Dr H McDougall, MRI);esamples from lice infected but P. ovis-uninfested sheep (provided by Prof. N.Sargison, R(D)SVS, UK; fsamples from sheep infected experimentally with orfvirus or gMycobacterium avium subspecies paratuberculosis (MRI).
Wells et al. Veterinary Research 2013, 44:103 Page 8 of 11http://www.veterinaryresearch.org/content/44/1/103
those in the PIT experimental trial (0.41 ± 0.26 μg/mL).At point of clinical diagnosis the recorded mean SAA(10.69 ± 2.66 μg/mL) was statistically significantly higherthan the pre-infestation level (p ≤ 0.01) and, unlike Hp,the decrease in SAA post-treatment was also statisticallysignificant (p ≤ 0.05, Figure 6b).
Hp and SAA levels during other common sheep infectionsand conditionsThe serum Hp and SAA levels measured during mostother common sheep infections were similar to those mea-sured in sheep prior to infestation with P. ovis (Table 4).
For example Hp and SAA levels during experimental gastro-intestinal nematode infections were 0.04 ± 0.03 mg/mL and0.30 ± 0.01 μg/mL respectively. The exceptions to this wereduring liver fluke infection and Johnes disease, where Hplevels were 2.85 ± 0.02 mg/mL and 2.25 ± 0.34 mg/mLrespectively, which are of the same magnitude as thosemeasured 4-5 weeks post-infestation with P. ovis. SAAlevels during chewing and sucking lice infestations alsoshowed the same magnitudes as 4-5 weeks post-infestation with P. ovis at 193.36 ± 135.81 μg/mL and68.47 ± 22.33 μg/mL respectively.
DiscussionHere we identified, by proteomic and semi-quantitativeimmunoproteomic techniques, serum Hp and SAA aspotential biomarkers for active sheep scab infestation.The qualitative results for SAA in the lesion resolvingsheep (Figure 4a) where the band densities increasedthen decreased around 2 weeks before the lesion sizechanges, suggested that SAA levels in the serum ofinfested sheep may increase before obvious clinical signswere apparent, which would be an important factor inthe pre-clinical diagnosis of sheep scab. However, whenthe levels of SAA and Hp in sera were quantified usingassays, it was demonstrated that both APPs increased inserum concentration as P. ovis infestation progressed,but did not show statistically significant increases (p ≤0.001) until weeks 4–5 post-infestation. Previous studies
Wells et al. Veterinary Research 2013, 44:103 Page 9 of 11http://www.veterinaryresearch.org/content/44/1/103
have described increases in serum Hp and SAA levelsduring a range of inflammatory diseases in ruminants[16,23,24], but this is the first report of their elevationduring sheep scab disease.During a six week experimental infestation of sheep
with P. ovis, Hp levels in serum increased by more than10-fold to 3.5 mg/mL compared with pre-infestationlevels, whereas SAA levels increased approximately 1000-fold in the same period to 211 μg/mL. These levels weresimilar to those of Hp and SAA measured in Alpine ibex(Capra ibex) infested with clinical sarcoptic mange(Sarcoptes scabiei infestation) where mean Hp levelsduring naturally-acquired infestation increased to 3.72 ±0.65 mg/mL compared with healthy, uninfested controls(0.58 ± 0.09 mg/mL) and SAA levels were 130.7 ±0.16 μg/mL and 8.7 ± 0.13 μg/mL in infested anduninfested animals respectively [25]. Generally, majorAPPs are present at undetectable or very low levels inthe serum of healthy animals [26] but, recently, astudy investigating the APP response to scrapie insheep found large individual animal variation in Hpand SAA prior to clinical disease onset and it wassuggested that this may be due to underlying subclin-ical conditions [27]. Previous work has indicated thatHp and SAA are non-specific in terms of inflamma-tory disease, injury or infection, but highly sensitive,effective markers of inflammation in ruminants [16,24]suggesting that any inflammatory event in the animal maycause a temporary rise in Hp or SAA. In contrast to Hp,serum SAA was measured at lower levels in sheep serumprior to P. ovis infestation; mean SAA concentration pre-infestation during the PIT trial was 0.82 ± 0.53 μg/mL,representing only 0.29% of the peak SAA levels measuredat week 5 post-infestation. This suggests that SAA maypotentially be a more suitable BM than Hp to indicatecurrent disease status during P. ovis infestation in sheepalthough the biochemical assay for Hp has practical ad-vantages being an automated rapid assay which could beincorporated into routine biochemistry profile analysis incontrast to the ELISA system used for quantification ofSAA.In sheep infected with bacteria causing caseous lymph-
adenitis (CLA), serum Hp and SAA levels peaked by day7 post-infection, which is considered to be the point atwhich the acute disease becomes a chronic infection[28]. Hp and SAA have also been previously reported tobe measurable by day two post-infection in acute inflam-matory diseases such as mastitis and metritis [16]. Incontrast, the proportion of animals with a P. ovis-in-duced elevation in APPs did not occur until weeks 4-5post-infestation in the case of Hp (Table 2), or margin-ally earlier at week 4 for SAA (Table 2). A possible ex-planation for this is that disease initiation in sheep scabhas a “lag phase” at the start of infestation lasting for
several weeks as the mites become established, afterwhich the mite numbers increase exponentially [7]. Le-sion size development follows this pattern in mite num-bers, as the increasing numbers of mites move out fromthe margins of the lesion onto healthy skin, as shown bythe lesion size data recorded in the TCT trial (Figure 1).In order for a biomarker to be useful in the diagnosis
of current disease status in sheep exposed to P. ovis, it iscrucial that its levels in the serum decline rapidly aftertreatment or disease resolution. This study has demon-strated that Hp and SAA return to pre-infestation levelsrapidly following termination of P. ovis infestation, withhalf-lives of 2.3 days for Hp and 0.84 days for SAA, illus-trating the potential of including either or both of theseAPPs in an improved diagnostic test for sheep scabwhere knowledge of current disease status is important.For example, in the case of the Sheep Scab (Scotland)Order 2010, where confirmation of successful treatmentis required before movement restrictions are lifted fromthe affected farm. The legislation allows lifting of move-ment restrictions to occur 16 days following successfultreatment, when it is still difficult to assess by clinicalexamination. However, if Hp and /or SAA were used asBMs of current disease status, they would have returnedto baseline levels before 16 days indicating successfultreatment, as shown in Figure 5a and 5b.SAA was a more accurate discriminatory indicator of
current disease status in the PIT study than Hp, due tothe higher sensitivity and specificity obtained for theoptimised cut-off values which were estimated using thedata from the primary infestation and post-treatmentelement of the PIT trial.At the cut-off levels established for SAA and Hp by
statistical analysis of the PIT experimental trial results, itwas evident that, during secondary experimental infest-ation (i.e. re-infestation), mean Hp levels in the sera ofinfested sheep were below the Hp cut-off point at alltime points. In addition, for SAA, mean sera levels wereabove the cut-off point for 1 week only during this sec-ondary infestation period. This may reflect the alteredimmunological landscape during the pathogenesis of are-infestation, where lesion size and mite numbers arereduced compared with primary lesions [5] and may rep-resent a limitation for the use of BM assays althoughfield outbreak studies are now required to establish suit-able cut-off values in practice.When Hp and SAA levels were investigated during
other common diseases and conditions of sheep, theywere predominantly found to be at levels equivalent tosheep scab negative values, remaining below 0.6 mg/mLfor Hp and 22 μg/mL for SAA. Importantly, as gastro-intestinal nematodes (GIN) commonly affect sheep, Hpand SAA levels were not elevated during the GIN ex-perimental infections tested here. Although Hp was
Wells et al. Veterinary Research 2013, 44:103 Page 10 of 11http://www.veterinaryresearch.org/content/44/1/103
elevated in liver fluke and Johnes disease and SAA waselevated in lice infestation in this analysis, it is evidentfrom the standard errors in these results that there waslarge between animal variation and therefore these re-corded measurements may be due to other underlyingconditions. Analysis of additional sera samples fromsheep infected with these diseases would therefore berequired to confirm serum levels of Hp and SAA dur-ing these infections. In addition, as the BM assays reactto other inflammatory conditions, they should be usedin conjunction with the specific antibody assay whichhas been developed for sheep scab diagnosis and hasbeen shown not to cross-react with other commonsheep diseases and conditions, including biting lice[12]. Compared to Hp and SAA levels, the measure-ment of Pso o 2-specific IgG provided earlier, specific,diagnosis of P. ovis infestation as shown in Table 3,where the majority of animals showed an elevatedantigen-specific IgG response to Pso o 2 in the primaryinfestation by week 2 post-infestation. This was a simi-lar response to that previously reported using thisassay [12]. While this assay therefore provides rapid,sensitive and specific diagnosis of P. ovis infestation,antibody persistence (Figure 5c and [13]) prevents ac-curate diagnosis of current disease status e.g. aftertreatment or on disease resolution. When the decreases inHp and SAA levels post-treatment were compared tothose of the Pso o 2 specific IgG levels, it was evident thatHp and SAA gave a rapid indication of current disease sta-tus post-treatment, whereas high Pso o 2-specific IgGlevels were still measurable 20 weeks post-treatment. Thedifferences in half life also illustrated the differing re-sponses to treatment i.e. 56 days for the Pso o 2-specificIgG response, compared to 2.3 days for Hp and 0.84 daysfor SAA. However, as serum Hp and SAA levels increasein many inflammatory diseases in ruminants [16] theseAPPs could not be used in isolation for the diagnosis ofsheep scab. The relative merits of the tests measuring thePso o 2-specific IgG response and APP levels indicate thata combined diagnostic test incorporating both elementswould result in a highly specific test which would indicateboth pathogen specific early infestation (Pso o 2-specificIgG levels) and current disease status after treatment(SAA and/or Hp levels). This would provide the sheep in-dustry with a powerful diagnostic tool for sheep scab con-trol or eradication schemes.
Competing interestsThe authors declare they have no competing interests. PDE was a foundingDirector of ReactivLab Ltd and remains a shareholder and consultant.
Authors’ contributionsExperimental design and planning: BW, AJN, STGB; Biomarker analyses: BW,EM, PDE; Statistical analyses BW, STGB, GI; Drafting of the manuscript: BW,AJN, STGB, PDE, GI. All authors read and approved the manuscript.
AcknowledgementsThe authors gratefully acknowledge funding from a QMS/EBLEX/HCCpostgraduate studentship to support the work of BW; STGB gratefullyacknowledges UK Government funding from the Department forEnvironment, Food and Rural Affairs and AJN is funded by ScottishGovernment. GTI is partially funded by the Scottish Government. The authorswould like to acknowledge Neil Inglis of the Proteomics group at MRI forperforming the MALDI analysis and Mary Waterson, University of Glasgow forrunning the Hp assays.
Author details1Moredun Research Institute, Pentlands Science Park, Midlothian EH26 0PZ, UK.2Biomathematics & Statistics Scotland (BioSS), King’s Buildings, Mayfield Road,Edinburgh EH9 3JZ, UK. 3University of Glasgow, Sir Graeme Davies Building, 120University Place, Glasgow G12 8TA, UK. 4Reactivlab Ltd, Garscube Estate,Bearsden Rd, Glasgow G61 1QH, UK.
Received: 10 April 2013 Accepted: 17 October 2013Published: 31 October 2013
References1. Kirkwood A: History, Biology and Control of Sheep Scab. Parasitol Today
1986, 2:302–307.2. Van den Broek AH, Huntley JF: Sheep scab: the disease, pathogenesis and
control. J Comp Pathol 2003, 128:79–91.3. Bisdorff B, Milnes A, Wall R: Prevalence and regional distribution of scab,
lice and blowfly strike in Great Britain. Vet Rec 2006, 158:749–752.4. The Scottish government [http://www.legislation.gov.uk/ssi/2010/419/
contents/made]5. Bates P: Differences between primary and secondary infestations with
the sheep scab mite, Psoroptes ovis. Vet Rec 2000, 146:528–529.6. Bates P: The effective diagnosis of sheep scab: differential diagnosis,
sero-diagnosis and pen-side tests. Gov Vet J 2009, 20:32–37.7. Bates P: The pathogenisis and aging of sheep scab lesions. State Vet J
1997, 7:11–15.8. Sargison ND, Scott PR, Penny CD, Pirie RS: Effect of an outbreak of sheep
scab (Psoroptes ovis infestation) during mid-pregnancy on ewe bodycondition and lamb birthweight. Vet Rec 1995, 136:287–289.
9. Fisher WF: Precipitating antibodies in sheep infested with Psoroptes ovisthe sheep scab mite. J Parasitol 1972, 58:1218–1219.
10. Wassall DA, Kirkwood AC, Bates PG, Sinclair IJ: Enzyme linkedimmunosorbent assay for the detection of antibodies to the sheep scabmite Psoroptes ovis. Res Vet Sci 1987, 43:34–35.
11. Ochs H, Lonneux J, Losson BJ, Deplazes P: Diagnosis of psoroptic sheepscab with an improved enzyme linked immunosorbent assay. VetParasitol 2001, 96:233–242.
12. Nunn FG, Burgess ST, Innocent G, Nisbet AJ, Bates P, Huntley JF:Development of a serodiagnostic test for sheep scab using recombinantprotein Pso o 2. Mol Cell Probes 2011, 25:212–218.
13. Burgess ST, Innocent G, Nunn F, Frew D, Kenyon F, Nisbet AJ, Huntley JF:The use of a Psoroptes ovis serodiagnostic test for the analysis of anatural outbreak of sheep scab. Parasit Vectors 2012, 5:7.
14. Atkinson AJ, Colburn WA, DeGruttola VG, DeMets DL, Downing GJ, Hoth DF,Oates JA, Peck CC, Schooley RT, Spilker BA, Woodcock J, Zeger SL:Biomarkers and surrogate endpoints: preferred definitions andconceptual framework. Clin Pharmacol Ther 2001, 69:89–95.
15. Burgess ST, Frew D, Nunn F, Watkins CA, McNeilly TN, Nisbet AJ, Huntley JF:Transcriptomic analysis of the temporal host response to skin infestationwith the ectoparasitic mite Psoroptes ovis. BMC Genomics 2010, 11:624.
16. Eckersall PD, Bell R: Acute phase proteins: biomarkers of infection andinflammation in veterinary medicine. Vet J 2010, 185:23–27.
17. Dobryszycka W: Biological functions of haptoglobin–new pieces to an oldpuzzle. Eur J Clin Chem Clin Biochem 1997, 35:647–654.
18. Bannikov G, Hinds C, Rajala-Schultz P, Premanandan C, Rings D, Lakritz J:Serum haptoglobin-matrix metalloproteinase 9 (Hp-MMP 9) complex asa biomarker of systemic inflammation in cattle. Vet Immunol Immuno-pathol 2011, 139:41–49.
19. Eckersall P, Duthie S, Safi S, Moffatt D, Horadagoda NU, Doyle S, Parton R,Bennett D, Fitzpatrick J: An automated biochemical assay forhaptoglobin: prevention of interference from albumin. CompHaematol Int 1999, 9:117–124.
Wells et al. Veterinary Research 2013, 44:103 Page 11 of 11http://www.veterinaryresearch.org/content/44/1/103
20. Crawford K, Gow A, Marques A, Yool D, Eckersal P, McCulloch E, Lynn K,Mellanby R, Warman S: Serum haptoglobin concentrations in dogs withliver disease. Vet Rec. in press.
21. R Core Team [http://www.r-project.org]22. R-Forge. [https://r-forge.r-project.org/projects/lme4]23. Heegaard PM, Godson DL, Toussaint MJ, Tjornehoj K, Larsen LE, Viuff B,
Ronsholt L: The acute phase response of haptoglobin and serum amyloidA (SAA) in cattle undergoing experimental infection with bovinerespiratory syncytial virus. Vet Immunol Immunopathol 2000, 77:151–159.
24. Petersen HH, Nielsen JP, Heegaard PM: Application of acute phase proteinmeasurements in veterinary clinical chemistry. Vet Res 2004, 35:163–187.
25. Rahman MM, Lecchi C, Fraquelli C, Sartorelli P, Ceciliani F: Acute phaseprotein response in Alpine ibex with sarcoptic mange. Vet Parasitol 2010,168:293–298.
26. Cray C, Zaias J, Altman NH: Acute phase response in animals: a review.Comp Med 2009, 59:517–526.
27. Meling S, Bardsen K, Ulvund MJ: Presence of an acute phase response insheep with clinical classical scrapie. BMC Vet Res 2012, 8:113.
28. Eckersall PD, Lawson FP, Bence L, Waterston MM, Lang TL, Donachie W,Fontaine MC: Acute phase protein response in an experimental model ofovine caseous lymphadenitis. BMC Vet Res 2007, 3:35–41.
doi:10.1186/1297-9716-44-103Cite this article as: Wells et al.: Two major ruminant acute phaseproteins, haptoglobin and serum amyloid A, as serum biomarkersduring active sheep scab infestation. Veterinary Research 2013 44:103.
Submit your next manuscript to BioMed Centraland take full advantage of:
• Convenient online submission
• Thorough peer review
• No space constraints or color figure charges
• Immediate publication on acceptance
• Inclusion in PubMed, CAS, Scopus and Google Scholar
• Research which is freely available for redistribution
Submit your manuscript at www.biomedcentral.com/submit


![McCulloch Publication Guide - Small Engine Partsbarrettsmallengine.com/manual/mccullochpublicationsguide.pdf · McCulloch Parts. Title: mccpubsguide[1].tif Author: todd snider Created](https://img.pdfslide.net/doc/110x75/5a9d97087f8b9a28388c09cd/mcculloch-publication-guide-small-engine-par-parts-title-mccpubsguide1tif.jpg)