Embed Size (px)
Citation preview
Work method to analyze effects on vehicle
handling caused by geometrical deviation
Development of a tool interface combining RD&T and ADAMS/Car
Master’s Thesis in the Product Development Master Degree Program
KIM DALKARLS
EMELIE SUNDQVIST
Department of Product and Production Development
Division of Product Development
CHALMERS UNIVERSITY OF TECHNOLOGY
Gothenburg, Sweden 2012

III
Work method to analyze effects on vehicle handling
caused by geometrical deviation
Development of a tool interface combining RD&T and ADAMS/Car
Master’s Thesis in the Product Development Master Degree Program
KIM DALKARLS
EMELIE SUNDQVIST
Department of Product and Production Development
Division of Product Development
CHALMERS UNIVERSITY OF TECHNOLOGY
Gothenburg, Sweden 2012
IV
Work method to analyze effects on vehicle handling caused by geometrical deviation
Development of a tool interface combining RD&T and ADAMS/Car
Master’s Thesis in Product Development
KIM DALKARLS
EMELIE SUNDQVIST
© KIM DALKARLS & EMELIE SUNDQVIST, 2012
Master thesis / Department of Product and Production Development
Chalmers University of Technology
Department of Product and Production Development
Division of Product Development
Chalmers University of Technology
SE-412 96 Gothenburg
Sweden
Telephone: + 46 (0)31-772 1000
Cover: Volvo S60 D3 -2012, the car model that was driven on the test track in this
thesis. Reference: http://volvocarswallpapers.blogspot.se/2012/03/volvo-s60-d3-
kinetic-2012.html (Accessed: May 8th, 2012)
Gothenburg, Sweden 2012
V
Work method to analyze effects on vehicle handling caused by geometrical deviation
Development of a tool interface combining RD&T and ADAMS/Car
Master’s Thesis in the Product Development master program
KIM DALKARLS
EMELIE SUNDQVIST
Department of Product and Production development
Division of Product Development
Chalmers University of Technology
Abstract
The work presented in this report is a Master of Science thesis performed in
cooperation between Chalmers University of Technology and Volvo Cars Corporation
in Gothenburg, Sweden. The purpose has been to enable for analyzes on how
geometrical deviation in the wheel suspension affects a car's handling.
The goal with this master thesis has been to develop a work method with a tool
interface for analyzing how geometrical deviation in the suspension system affects car
handling. This work method should make it more efficient to develop new cars since
the analysis is more realistic which will decrease the number of physical prototypes.
In order to perform these analyzes, this thesis has connected the tolerance and
variation analysis software RD&T (Robust Design and Tolerancing) with the vehicle
dynamics software ADAMS/Car. A tool interface has been developed in RD&T that
will help the employees at VCC to select statistically possible cars with interesting
wheel angles and export them to ADAMS/Car for vehicle dynamics simulation.
The handling situation that was simulated and tested was vehicle drift, which is when
the car is drifting away from the centre line when releasing the steering wheel. The
different settings tested were nominal car, camber difference, toe zero, and toe out.
The cars were driven in 90 km/h while the steering wheel was released for 30
seconds. Also, some turning testing was performed in order to investigate the cars
reaction on right and left turns. The results were that these different settings had a big
impact on how the car’s handling behaviour was perceived and how much the car
drifted to the side. The driver felt difference in steering wheel vibration, having to
steer back to the middle and the car did not response as quick on steering as a nominal
car.
Cars with similar settings were selected from RD&T software and simulated in
ADAMS/Car. The virtual result coincided with the reality in most of the simulations.
Work was also made to try to select cars from a sensitivity analysis in
ADAMS/Insight. This work was never verified but is a recommendation for future
work.
Overall, the RD&T tool interface in combination with ADAMS/Car simulations can
be said to be representative for reality and gives a good estimation when building and
developing cars.
Keywords:
RD&T, ADAMS/Car, Variation Analysis, Sensitivity Analysis, Vehicle Dynamics,
Camber, Caster, Toe, Tolerances, Tool, Interface, ADAMS/Insight.

VI
VII
Contents
ABSTRACT V
CONTENTS VII
PREFACE IX
TERMS AND ABBREVIATIONS XI
1 INTRODUCTION 1
1.1 Background 1
1.2 Purpose 1
1.3 Goal and target 1
1.4 Problem description 2
1.5 Delimitations 2
1.6 Outline of the report 3
2 THEORY 5
2.1 Statistical definitions 5
2.2 Car definitions 5
2.2.1 Car suspension 6 2.2.2 Wheel angles 7
2.3 Problems in vehicle handling 9 2.3.1 Vehicle drift and pull 9
2.4 Interface design 9
3 METHOD 11
3.1 Identify customer needs 11 3.1.1 Interviews 11 3.1.2 Observation 12
3.2 Establish product specification 12
3.3 Concept generation 12
3.4 Concept selection 13
3.5 Testing and Refinement 13 3.5.1 Computer tests 13 3.5.2 Testing the tool interface and test drive 16
4 COMPUTER MODELLING 17
4.1 RD&T 17
4.1.1 Front suspension 17 4.1.2 Rear suspension 18 4.1.3 Measures 19
VIII
4.2 ADAMS/Car 20
4.2.1 Front suspension 20 4.2.2 Rear suspension 21 4.2.3 Simulation of vehicle drift 22
4.3 ADAMS/Insight 24
5 CONCEPT DEVELOPMENT 29
5.1 Identify customer needs 29 5.1.1 Interviews 29 5.1.2 Observing the product in use 29
5.2 Establish product specification 30
5.3 Concept generation 30
5.3.1 Development of tool interface 30 5.3.2 Testing and combining ideas to improve 33
6 RESULTS 37
6.1 Concept selection 37
6.1.1 Work method in RD&T 37 6.1.2 Tool interface 42 6.1.3 Sensitivity analysis 44
7 TESTING AND VERIFICATION 47
7.1 Simulation results 47
7.2 Test drive 51
7.3 Simulations vs. Reality 53
8 DISCUSSION AND CONCLUSIONS 55
8.1 Discussion 55
8.2 Conclusions 56
8.3 Recommendation for future work 56 8.3.1 Further development of tool interface 57
9 REFERENCES 59
APPENDIX I – MEASURES I
APPENDIX II – WHEEL ANGLE GEOMETRY V
APPENDIX III – PRODUCT SPECIFICATIONS VII
APPENDIX IV – INTERVIEW GUIDES IX
IX
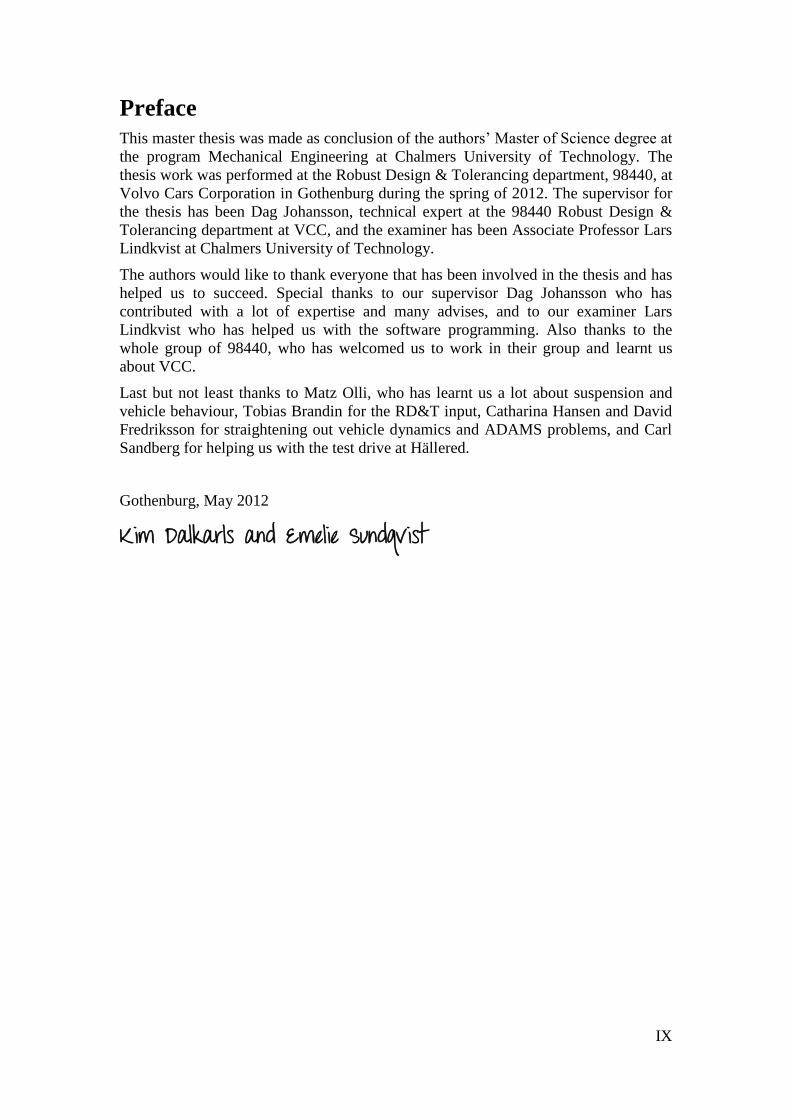
Preface
This master thesis was made as conclusion of the authors’ Master of Science degree at
the program Mechanical Engineering at Chalmers University of Technology. The
thesis work was performed at the Robust Design & Tolerancing department, 98440, at
Volvo Cars Corporation in Gothenburg during the spring of 2012. The supervisor for
the thesis has been Dag Johansson, technical expert at the 98440 Robust Design &
Tolerancing department at VCC, and the examiner has been Associate Professor Lars
Lindkvist at Chalmers University of Technology.
The authors would like to thank everyone that has been involved in the thesis and has
helped us to succeed. Special thanks to our supervisor Dag Johansson who has
contributed with a lot of expertise and many advises, and to our examiner Lars
Lindkvist who has helped us with the software programming. Also thanks to the
whole group of 98440, who has welcomed us to work in their group and learnt us
about VCC.
Last but not least thanks to Matz Olli, who has learnt us a lot about suspension and
vehicle behaviour, Tobias Brandin for the RD&T input, Catharina Hansen and David
Fredriksson for straightening out vehicle dynamics and ADAMS problems, and Carl
Sandberg for helping us with the test drive at Hällered.
Gothenburg, May 2012
Kim Dalkarls and Emelie Sundqvist

X
XI
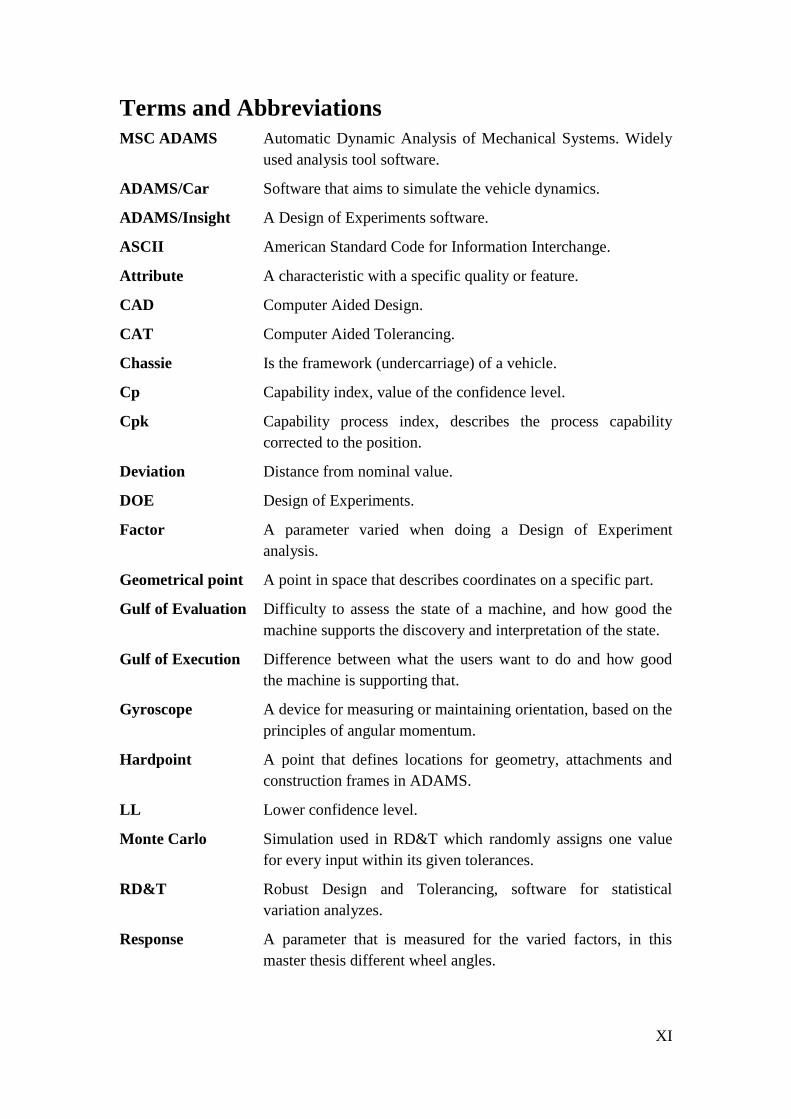
Terms and Abbreviations
MSC ADAMS Automatic Dynamic Analysis of Mechanical Systems. Widely
used analysis tool software.
ADAMS/Car Software that aims to simulate the vehicle dynamics.
ADAMS/Insight A Design of Experiments software.
ASCII American Standard Code for Information Interchange.
Attribute A characteristic with a specific quality or feature.
CAD Computer Aided Design.
CAT Computer Aided Tolerancing.
Chassie Is the framework (undercarriage) of a vehicle.
Cp Capability index, value of the confidence level.
Cpk Capability process index, describes the process capability
corrected to the position.
Deviation Distance from nominal value.
DOE Design of Experiments.
Factor A parameter varied when doing a Design of Experiment
analysis.
Geometrical point A point in space that describes coordinates on a specific part.
Gulf of Evaluation Difficulty to assess the state of a machine, and how good the
machine supports the discovery and interpretation of the state.
Gulf of Execution Difference between what the users want to do and how good
the machine is supporting that.
Gyroscope A device for measuring or maintaining orientation, based on the
principles of angular momentum.
Hardpoint A point that defines locations for geometry, attachments and
construction frames in ADAMS.
LL Lower confidence level.
Monte Carlo Simulation used in RD&T which randomly assigns one value
for every input within its given tolerances.
RD&T Robust Design and Tolerancing, software for statistical
variation analyzes.
Response A parameter that is measured for the varied factors, in this
master thesis different wheel angles.
XII
Robust design A design which are insensitive to manufacturing and assembly
variation.
rdt-file Computer file-format that is used in the software RD&T.
Sensitivity analysis Analysis to find out how big effect a varied factor has on an
attribute, i.e. the sensitivity of the factor.
sub-file Computer file-format that is used in the ADAMS software.
Suspension system System to control the car.
Tolerance A tolerance defines the allowed variation for a part.
UL Upper confidence level.
Variation How much it is possible for a measure to deviate from the
nominal value.
VCC Volvo Cars Cooperation.
1
1 Introduction
In this master thesis the main subject has been to analyze car handling effects due to
geometrical deviation. This report is the result from the work done.
1.1 Background
Volvo Cars’ vision is to be the world’s most progressive and desired luxury car brand [1]. To
achieve this, the perceived quality from customers must be on top and the driving experience
is one of the important interactions between the car and the person driving.
The visual quality of a product is dependent of the relationships between the different parts
(split-lines). The quality of the split-lines is dependent on the geometrical variation in the
individual parts (e.g. size, form and position) and how the parts are assembled together. If the
car is built with high precision it will give a good quality impression to the viewer but if not,
the final product will not meet the functional, esthetical and assembly requirement [2].
Working with robust design makes you anticipate the variations and you are able to avoid
them or keep the variations in between chosen limits, so called tolerances. Tolerances define
how much variation that is acceptable to be able to meet product functionality and aesthetics.
Robust designs are insensitive to manufacturing variation and allow for easier process
adjustment, shorter start and ramp-up times and global production with high and equal quality
level [3].
There is little literature available on how variation in suspension geometry affects vehicle
handling, and especially side motion handling problems e.g. vehicle pull, lead/drift and
wander [4]. Connecting geometry variation to vehicle handling could lead to a faster
development time for new cars. This because it will be easier to set requirements on the
wheel angles which will make the car perform better on the roads. Having a car behaving
badly on the road will not only be a safety issue for the passengers of the car, but also cause
higher tire wear and tear on the suspension system. Tires that run unevenly on the road will
cause particles from the road to be torn up and polluting the air contributing to a poor
environment [5]. Also, parts of the suspension system would be exhausted in a tighter
interval, forcing the customer to replace parts more often.
1.2 Purpose
The purpose of this master thesis has been to enable for analyzes on how geometrical
deviation affects car handling. This will help to predict the car's behaviour before building
prototypes and will be a helping tool when comparing different car concepts at an early stage.
1.3 Goal and target
The goal of this master thesis has been to find a work method with a tool interface for
analyzing how geometrical deviation in the suspension system affects car handlings. The
work method will make it more efficient to develop new cars. This way of working will also
make the result of the analysis more realistic since it is based on an outcome of the
simulations that is statistically possible.
2
The target was that by the end of the master thesis having a work method to analyze how
geometrical deviation in the suspension system affects the handling of a car. This work
method should be able to be implemented in the daily work at Volvo Cars.
1.4 Problem description
At Volvo Cars today, it is possible to analyze geometrical variations on assembled
components in static condition with the program RD&T (Robust Design and Tolerancing)
and simulate completely symmetric cars in ADAMS/Car. What you cannot do is to analyze
how geometrical deviation will affect the car's handling in a dynamic state. That is interesting
because it makes it possible to predict the behaviour of statistically possible cars before they
are built. This could be a tool for understanding what behaviour the cars will have with the
given tolerances and also to make the analyzes on specific cars.
A master thesis has previously been made by Johan Bengtsson and Anders Ingemarsson [4]
in this area and was the starting point for this master thesis. In their work, an approach was
found on how to investigate variations effect on handling and that variation on individual
parts actually has an impact on the car's handlings.
Problems to manage the large amount of data which made the analysis very time consuming,
and the lack of work method so that the employees at Volvo Cars did not know how they
should use it, led to that the developed tool never became a part of the daily work at Volvo
Cars. Hence, the problem can be divided into two questions; Which method to use in order to
make these kind of analyzes quick and easy? How should the tool be designed in order to
enable for this work method to function?
1.5 Delimitations
This master thesis has only focused on developing a general work method for analyzing how
geometrical deviations in the suspension system affect car handling. When validating the
interface between RD&T and ADAMS/Car, only one car model has been looked at, since it
should not matter which car model that is used for the analyzes. This could though affect the
outcome of the simulations results. None of the computer models used for the analysis has
been made by the thesis workers, but collected from databases and people at Volvo Cars.
There has not been any development of the MSC ADAMS software's, due to no possibilities
to affect the development of these. Instead, the focus has been on developing functions in
RD&T that are compatible with the ADAMS software.
Focus has not been on reducing development cost for VCC but to reduce lead-time and make
the work method fast and the tool interface easy to use. This could lead to a decreased cost
but that has not been investigated in this master thesis.
The work with sensitivity analysis has been a pre-study and limited to find out if it is possible
to use ADAMS/Insight for the analysis. The effects that were found in ADAMS/Insight have
not been mapped against all attributes since it would have required too much time and no
verification test has been made on a test track. This has been more of an investigation for
future work.
3
1.6 Outline of the report
This report is divided into six parts. First, some basic theories and definitions are described in
order to get a wider perspective of the area. In the Method chapter, the product development
process used is described with the tools for each development step. This is to introduce the
reader in how these methods are working. In the Computer modelling chapter, all the models
used are presented and explained. The Concept development chapter presents the results from
the phases; Identify customer’s needs, Establish product specification and Concept
generation, where also the development of the interface is showed. In the Result chapter, the
final concept selection is made for the work method with the tool interface. The Testing and
verification chapter presents the tests of the method and test results. Finally, the report
finishes off with discussion on improvements, conclusions and recommendations for future
work.

4
5
2 Theory
This section first discusses the theory of statistical deviation. Then the theory of the car
suspension system, wheel angles and their effects on car handling are described. Handling
phenomena's of vehicle drift and pull are also described and the theory ends up with some
theory on interface design.
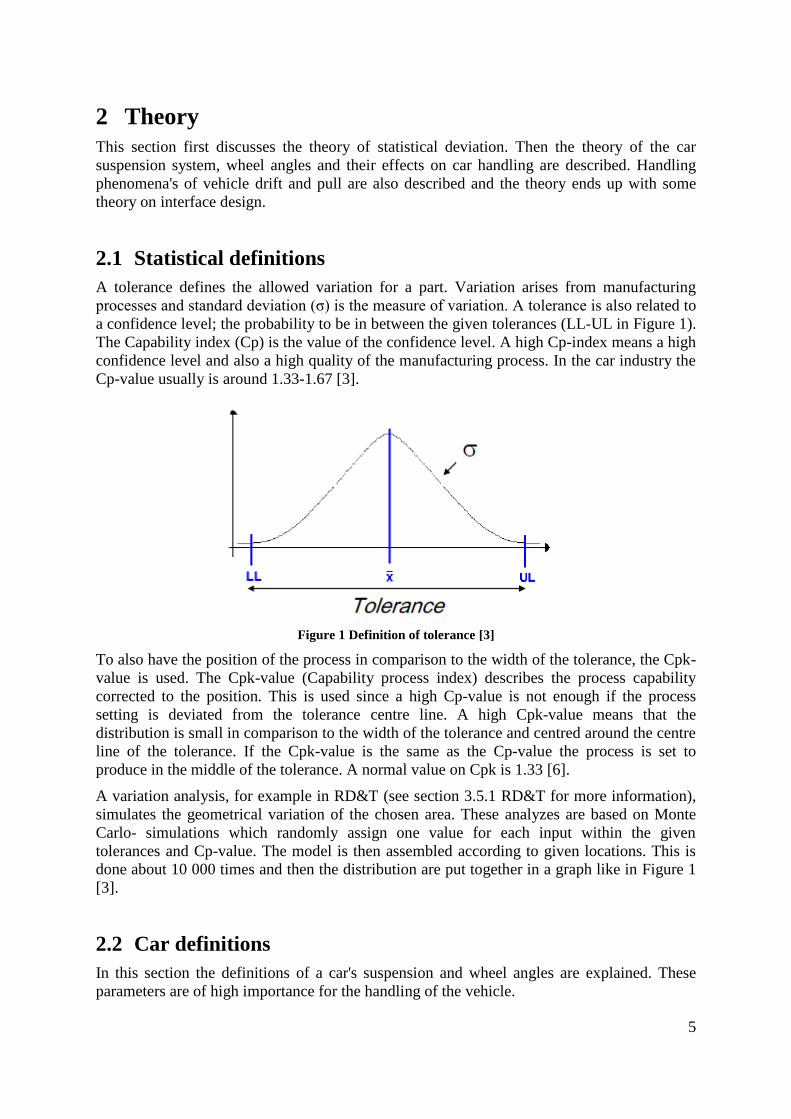
2.1 Statistical definitions
A tolerance defines the allowed variation for a part. Variation arises from manufacturing
processes and standard deviation (σ) is the measure of variation. A tolerance is also related to
a confidence level; the probability to be in between the given tolerances (LL-UL in Figure 1).
The Capability index (Cp) is the value of the confidence level. A high Cp-index means a high
confidence level and also a high quality of the manufacturing process. In the car industry the
Cp-value usually is around 1.33-1.67 [3].
Figure 1 Definition of tolerance [3]
To also have the position of the process in comparison to the width of the tolerance, the Cpk-
value is used. The Cpk-value (Capability process index) describes the process capability
corrected to the position. This is used since a high Cp-value is not enough if the process
setting is deviated from the tolerance centre line. A high Cpk-value means that the
distribution is small in comparison to the width of the tolerance and centred around the centre
line of the tolerance. If the Cpk-value is the same as the Cp-value the process is set to
produce in the middle of the tolerance. A normal value on Cpk is 1.33 [6].
A variation analysis, for example in RD&T (see section 3.5.1 RD&T for more information),
simulates the geometrical variation of the chosen area. These analyzes are based on Monte
Carlo- simulations which randomly assign one value for each input within the given
tolerances and Cp-value. The model is then assembled according to given locations. This is
done about 10 000 times and then the distribution are put together in a graph like in Figure 1
[3].
2.2 Car definitions
In this section the definitions of a car's suspension and wheel angles are explained. These
parameters are of high importance for the handling of the vehicle.
6
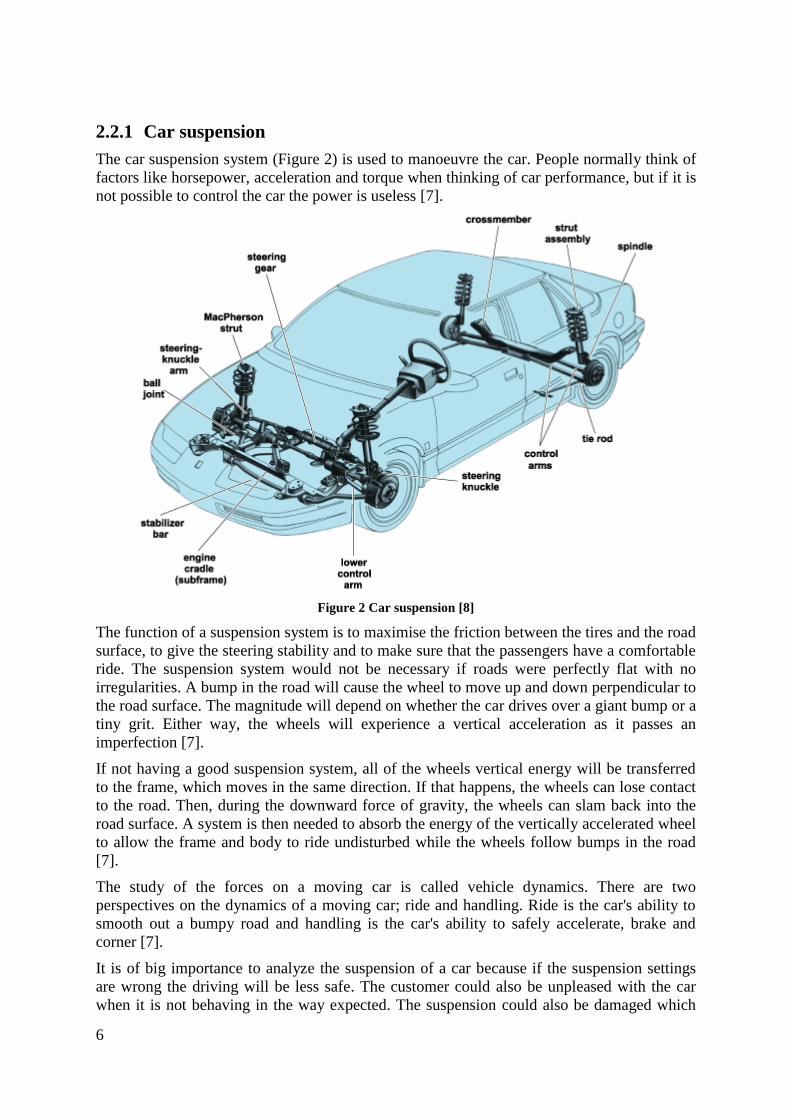
2.2.1 Car suspension
The car suspension system (Figure 2) is used to manoeuvre the car. People normally think of
factors like horsepower, acceleration and torque when thinking of car performance, but if it is
not possible to control the car the power is useless [7].
Figure 2 Car suspension [8]
The function of a suspension system is to maximise the friction between the tires and the road
surface, to give the steering stability and to make sure that the passengers have a comfortable
ride. The suspension system would not be necessary if roads were perfectly flat with no
irregularities. A bump in the road will cause the wheel to move up and down perpendicular to
the road surface. The magnitude will depend on whether the car drives over a giant bump or a
tiny grit. Either way, the wheels will experience a vertical acceleration as it passes an
imperfection [7].
If not having a good suspension system, all of the wheels vertical energy will be transferred
to the frame, which moves in the same direction. If that happens, the wheels can lose contact
to the road. Then, during the downward force of gravity, the wheels can slam back into the
road surface. A system is then needed to absorb the energy of the vertically accelerated wheel
to allow the frame and body to ride undisturbed while the wheels follow bumps in the road
[7].
The study of the forces on a moving car is called vehicle dynamics. There are two
perspectives on the dynamics of a moving car; ride and handling. Ride is the car's ability to
smooth out a bumpy road and handling is the car's ability to safely accelerate, brake and
corner [7].
It is of big importance to analyze the suspension of a car because if the suspension settings
are wrong the driving will be less safe. The customer could also be unpleased with the car
when it is not behaving in the way expected. The suspension could also be damaged which
7
could lead to an increasing gasoline consumption and tires which wears out faster [5]. Having
the wrong wheel angles set up could also lead to increased gasoline consumption, read more
about this in the next section, Wheel angles.
2.2.2 Wheel angles
Wheel angles controlled at the production plant at Volvo Cars are caster and camber angle for
the front wheel, camber angle and toe-in/toe-out for the rear wheel, and thrust angle. Camber
angle shall be checked for the individual spring strut [9].
The first thing that needs to be done before setting the wheel angles is to set the steering
wheel to the straight-on position. The centre lines of the four wheels are also assessed. The
wheel angles are then set in the following order; rear wheel toe-in/toe-out, thrust angle and
then front wheel toe-in/toe-out [9].
According to Volvo Cars experts the most interesting parameters to measure are the caster-,
camber and toe angles [33].
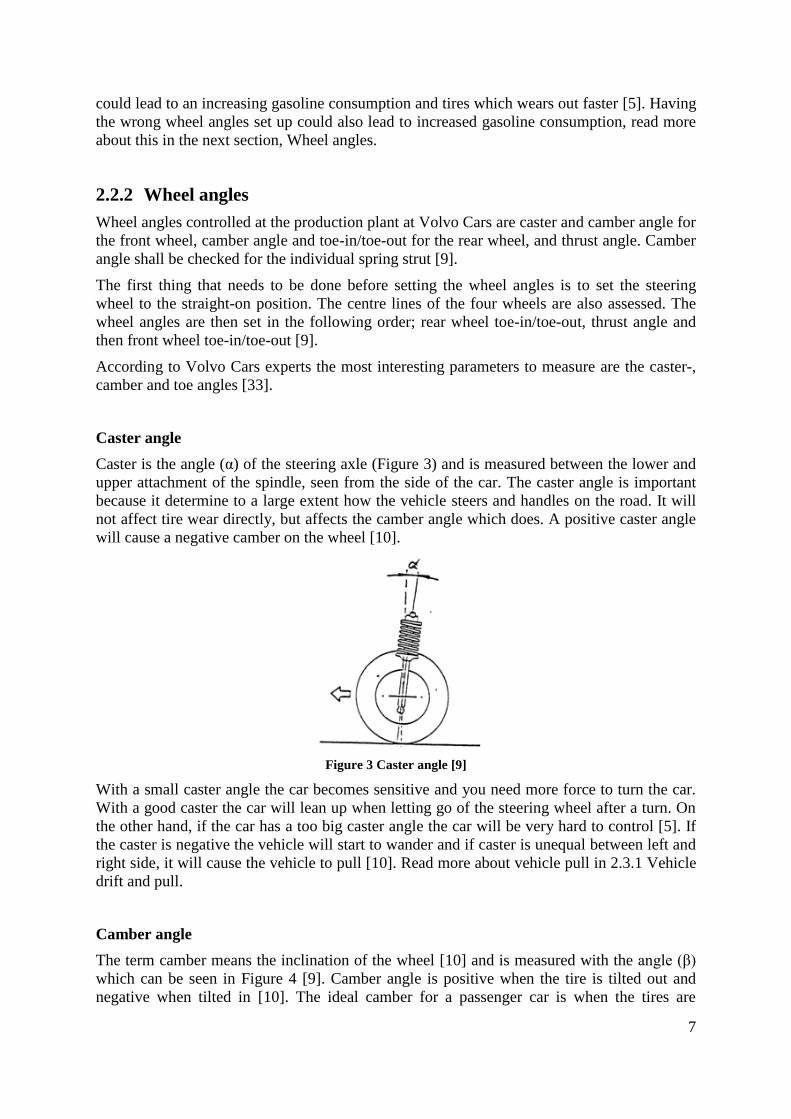
Caster angle
Caster is the angle (α) of the steering axle (Figure 3) and is measured between the lower and
upper attachment of the spindle, seen from the side of the car. The caster angle is important
because it determine to a large extent how the vehicle steers and handles on the road. It will
not affect tire wear directly, but affects the camber angle which does. A positive caster angle
will cause a negative camber on the wheel [10].
Figure 3 Caster angle [9]
With a small caster angle the car becomes sensitive and you need more force to turn the car.
With a good caster the car will lean up when letting go of the steering wheel after a turn. On
the other hand, if the car has a too big caster angle the car will be very hard to control [5]. If
the caster is negative the vehicle will start to wander and if caster is unequal between left and
right side, it will cause the vehicle to pull [10]. Read more about vehicle pull in 2.3.1 Vehicle
drift and pull.
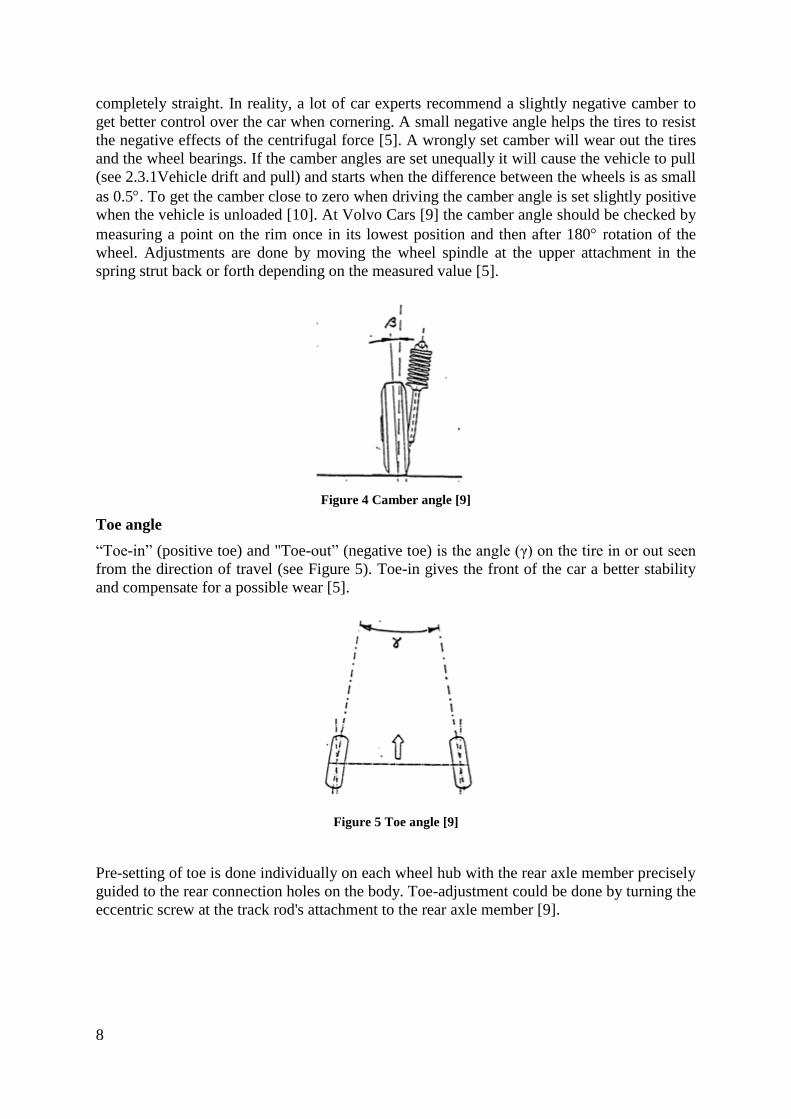
Camber angle
The term camber means the inclination of the wheel [10] and is measured with the angle (β)
which can be seen in Figure 4 [9]. Camber angle is positive when the tire is tilted out and
negative when tilted in [10]. The ideal camber for a passenger car is when the tires are
8
completely straight. In reality, a lot of car experts recommend a slightly negative camber to
get better control over the car when cornering. A small negative angle helps the tires to resist
the negative effects of the centrifugal force [5]. A wrongly set camber will wear out the tires
and the wheel bearings. If the camber angles are set unequally it will cause the vehicle to pull
(see 2.3.1Vehicle drift and pull) and starts when the difference between the wheels is as small
as 0.5. To get the camber close to zero when driving the camber angle is set slightly positive
when the vehicle is unloaded [10]. At Volvo Cars [9] the camber angle should be checked by
measuring a point on the rim once in its lowest position and then after 180 rotation of the
wheel. Adjustments are done by moving the wheel spindle at the upper attachment in the
spring strut back or forth depending on the measured value [5].
Figure 4 Camber angle [9]
Toe angle
“Toe-in” (positive toe) and "Toe-out” (negative toe) is the angle (γ) on the tire in or out seen
from the direction of travel (see Figure 5). Toe-in gives the front of the car a better stability
and compensate for a possible wear [5].
Figure 5 Toe angle [9]
Pre-setting of toe is done individually on each wheel hub with the rear axle member precisely
guided to the rear connection holes on the body. Toe-adjustment could be done by turning the
eccentric screw at the track rod's attachment to the rear axle member [9].
9
2.3 Problems in vehicle handling
The handling of a car is affected if its wheels are not correctly aligned. In this master thesis
focus has been on side motions, more specific on drift which could arise when handling the
vehicle. Drift have been chosen because it is an easy attribute to test on a test track and are
caused by the camber, caster and toe angles of the suspension [10].
2.3.1 Vehicle drift and pull
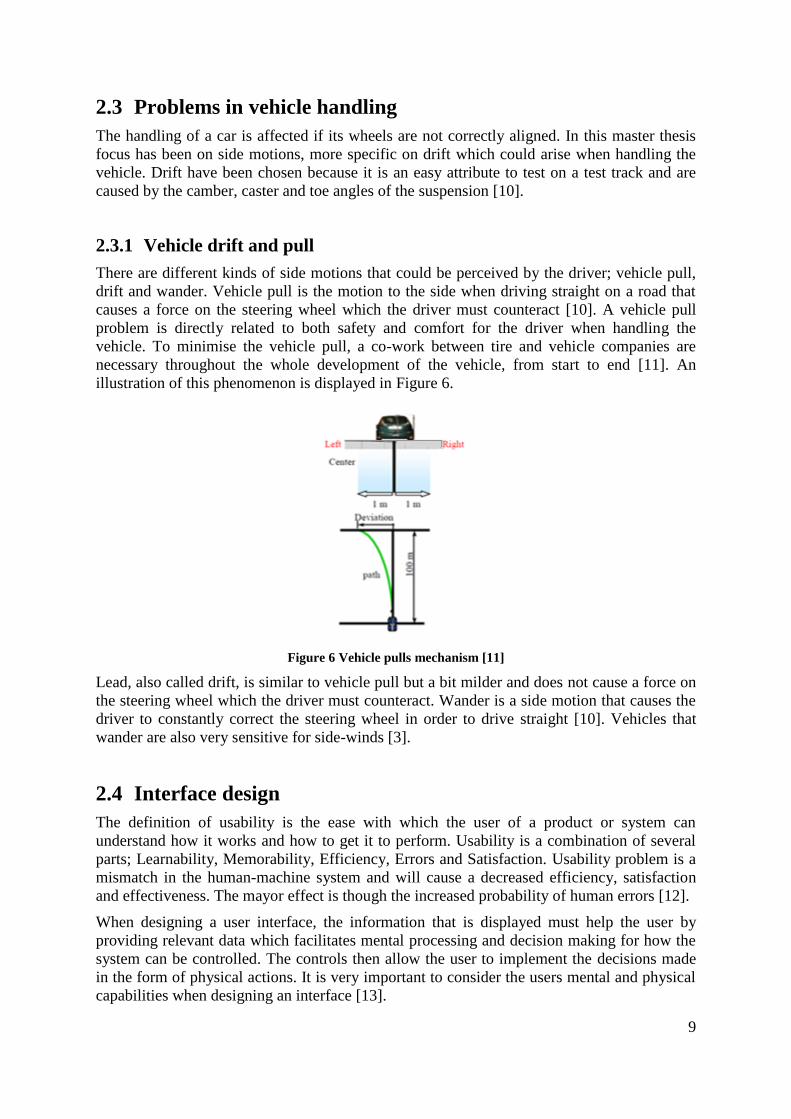
There are different kinds of side motions that could be perceived by the driver; vehicle pull,
drift and wander. Vehicle pull is the motion to the side when driving straight on a road that
causes a force on the steering wheel which the driver must counteract [10]. A vehicle pull
problem is directly related to both safety and comfort for the driver when handling the
vehicle. To minimise the vehicle pull, a co-work between tire and vehicle companies are
necessary throughout the whole development of the vehicle, from start to end [11]. An
illustration of this phenomenon is displayed in Figure 6.
Figure 6 Vehicle pulls mechanism [11]
Lead, also called drift, is similar to vehicle pull but a bit milder and does not cause a force on
the steering wheel which the driver must counteract. Wander is a side motion that causes the
driver to constantly correct the steering wheel in order to drive straight [10]. Vehicles that
wander are also very sensitive for side-winds [3].
2.4 Interface design
The definition of usability is the ease with which the user of a product or system can
understand how it works and how to get it to perform. Usability is a combination of several
parts; Learnability, Memorability, Efficiency, Errors and Satisfaction. Usability problem is a
mismatch in the human-machine system and will cause a decreased efficiency, satisfaction
and effectiveness. The mayor effect is though the increased probability of human errors [12].
When designing a user interface, the information that is displayed must help the user by
providing relevant data which facilitates mental processing and decision making for how the
system can be controlled. The controls then allow the user to implement the decisions made
in the form of physical actions. It is very important to consider the users mental and physical
capabilities when designing an interface [13].
10
Problems that can occur in the interaction between human and machine are depending on the
gulf of execution and on the gulf of evaluation [13]. Gulf of execution is the difference
between what the users want to do and how good the machine is supporting that (what you
can do with the machine). The users know what they want to do but not how they should do
it. The Gulf of evaluation is the difficulty to assess the state of a machine, and how good the
machine supports the discovery and interpretation of the state. The user perceives
information, but not how to interpret it [12].
This interaction gaps needs to be bridged in order for the system to work well since they
affect the user’s decision-making and actions [13].
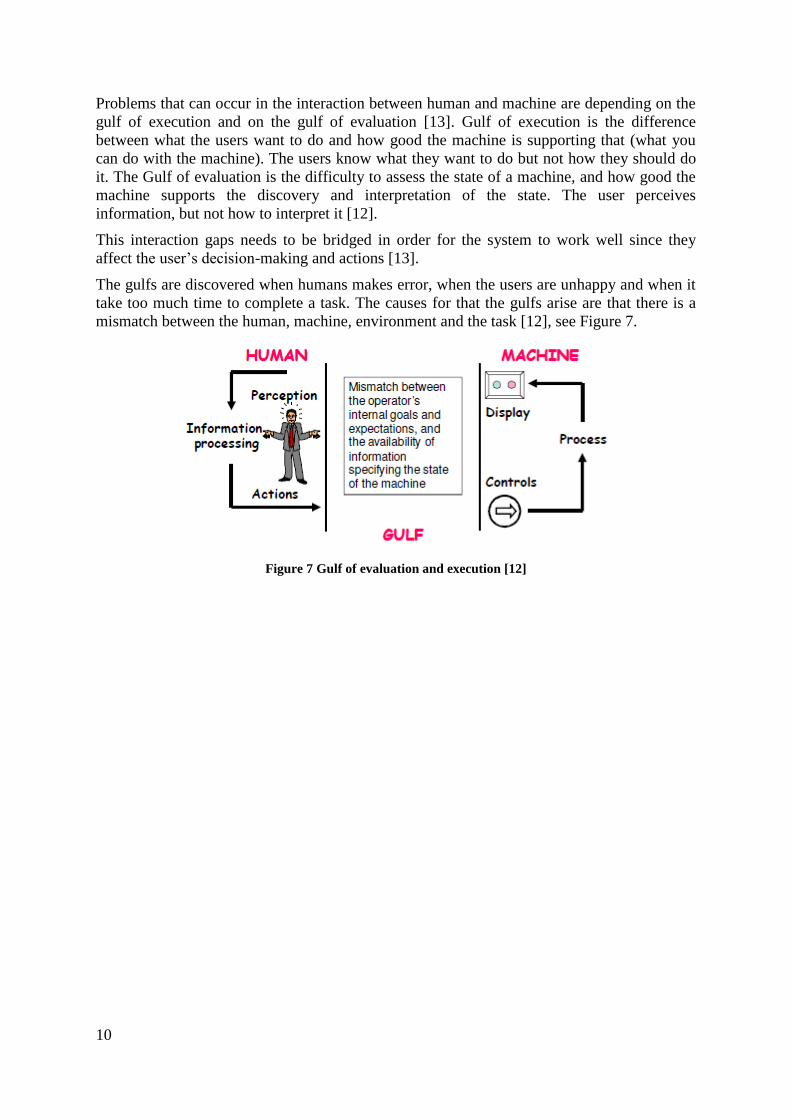
The gulfs are discovered when humans makes error, when the users are unhappy and when it
take too much time to complete a task. The causes for that the gulfs arise are that there is a
mismatch between the human, machine, environment and the task [12], see Figure 7.
Figure 7 Gulf of evaluation and execution [12]
11
3 Method
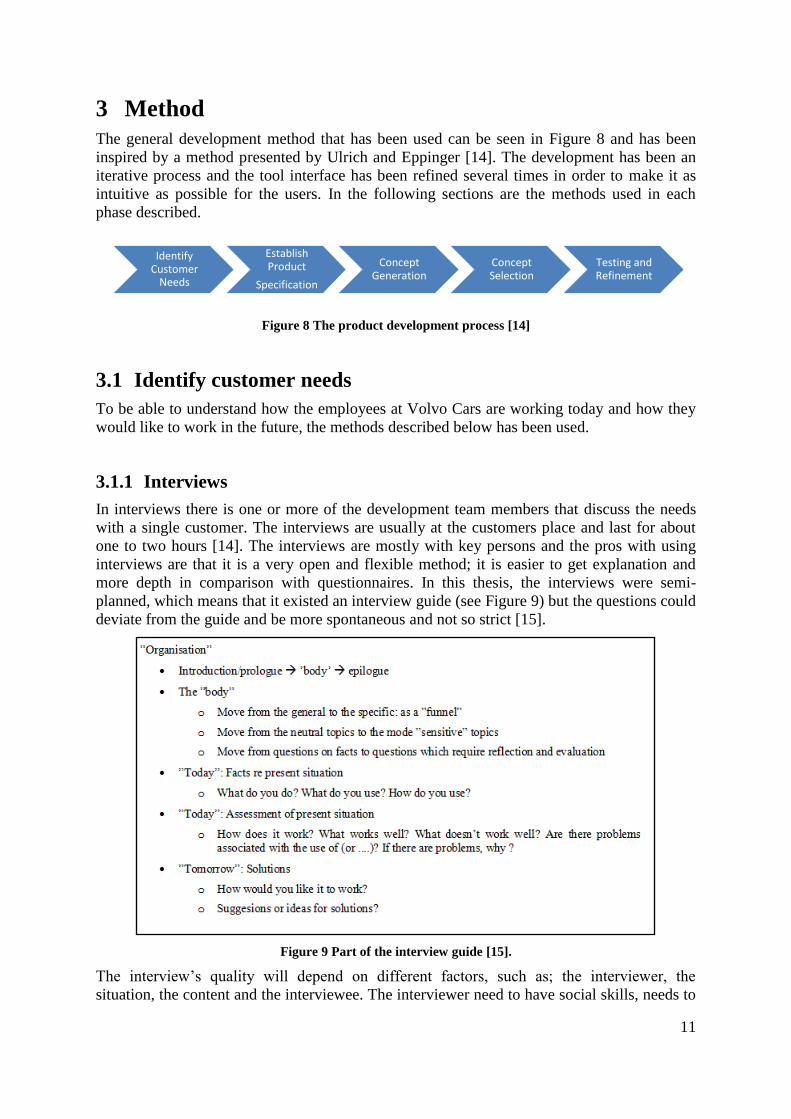
The general development method that has been used can be seen in Figure 8 and has been
inspired by a method presented by Ulrich and Eppinger [14]. The development has been an
iterative process and the tool interface has been refined several times in order to make it as
intuitive as possible for the users. In the following sections are the methods used in each
phase described.
Figure 8 The product development process [14]
3.1 Identify customer needs
To be able to understand how the employees at Volvo Cars are working today and how they
would like to work in the future, the methods described below has been used.
3.1.1 Interviews
In interviews there is one or more of the development team members that discuss the needs
with a single customer. The interviews are usually at the customers place and last for about
one to two hours [14]. The interviews are mostly with key persons and the pros with using
interviews are that it is a very open and flexible method; it is easier to get explanation and
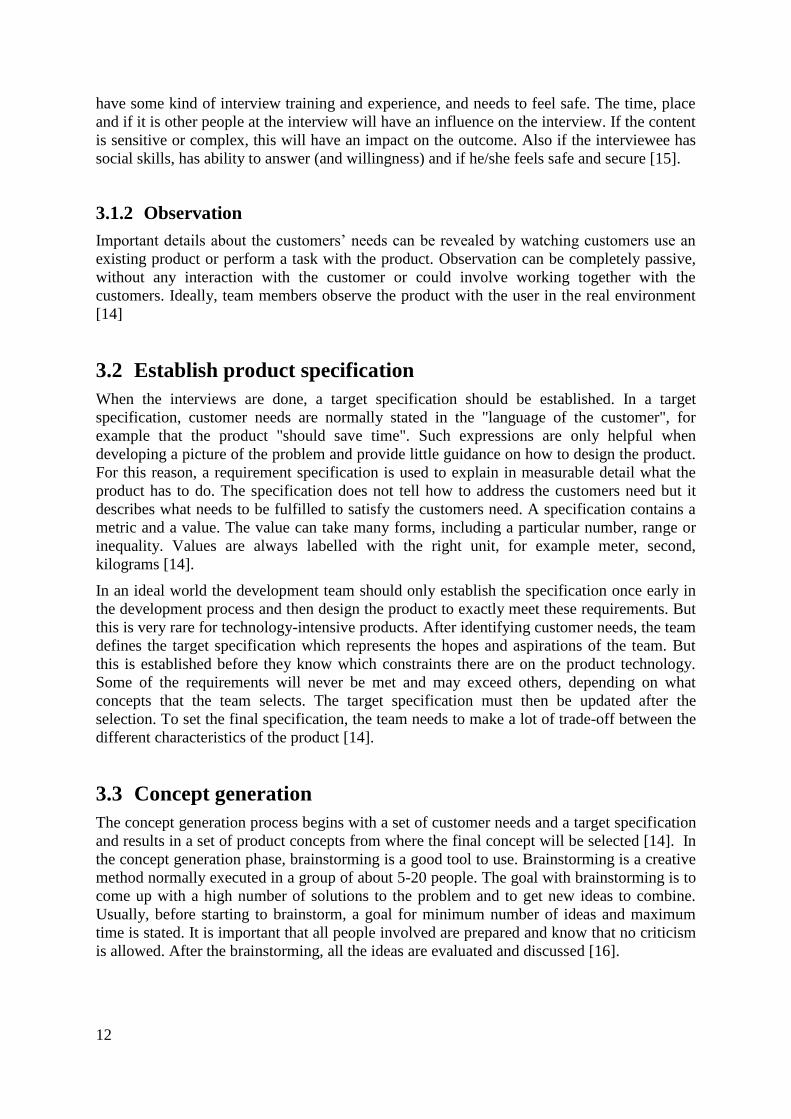
more depth in comparison with questionnaires. In this thesis, the interviews were semi-
planned, which means that it existed an interview guide (see Figure 9) but the questions could
deviate from the guide and be more spontaneous and not so strict [15].
Figure 9 Part of the interview guide [15].
The interview’s quality will depend on different factors, such as; the interviewer, the
situation, the content and the interviewee. The interviewer need to have social skills, needs to
Identify Customer
Needs
Establish Product
Specification
Concept Generation
Concept Selection
Testing and Refinement
12
have some kind of interview training and experience, and needs to feel safe. The time, place
and if it is other people at the interview will have an influence on the interview. If the content
is sensitive or complex, this will have an impact on the outcome. Also if the interviewee has
social skills, has ability to answer (and willingness) and if he/she feels safe and secure [15].
3.1.2 Observation
Important details about the customers’ needs can be revealed by watching customers use an
existing product or perform a task with the product. Observation can be completely passive,
without any interaction with the customer or could involve working together with the
customers. Ideally, team members observe the product with the user in the real environment
[14]
3.2 Establish product specification
When the interviews are done, a target specification should be established. In a target
specification, customer needs are normally stated in the "language of the customer", for
example that the product "should save time". Such expressions are only helpful when
developing a picture of the problem and provide little guidance on how to design the product.
For this reason, a requirement specification is used to explain in measurable detail what the
product has to do. The specification does not tell how to address the customers need but it
describes what needs to be fulfilled to satisfy the customers need. A specification contains a
metric and a value. The value can take many forms, including a particular number, range or
inequality. Values are always labelled with the right unit, for example meter, second,
kilograms [14].
In an ideal world the development team should only establish the specification once early in
the development process and then design the product to exactly meet these requirements. But
this is very rare for technology-intensive products. After identifying customer needs, the team
defines the target specification which represents the hopes and aspirations of the team. But
this is established before they know which constraints there are on the product technology.
Some of the requirements will never be met and may exceed others, depending on what
concepts that the team selects. The target specification must then be updated after the
selection. To set the final specification, the team needs to make a lot of trade-off between the
different characteristics of the product [14].
3.3 Concept generation
The concept generation process begins with a set of customer needs and a target specification
and results in a set of product concepts from where the final concept will be selected [14]. In
the concept generation phase, brainstorming is a good tool to use. Brainstorming is a creative
method normally executed in a group of about 5-20 people. The goal with brainstorming is to
come up with a high number of solutions to the problem and to get new ideas to combine.
Usually, before starting to brainstorm, a goal for minimum number of ideas and maximum
time is stated. It is important that all people involved are prepared and know that no criticism
is allowed. After the brainstorming, all the ideas are evaluated and discussed [16].
13
3.4 Concept selection
Ulrich and Eppinger [14] describe some methods which can be used when deciding which
concept to continue with:
External decision: The decision is done by the customer, client or some other external
person.
Product champion: An influential member of the Product development team deicide which
concept based on personal preference.
Intuition: The concept is chosen by its feel. The concept just seems better and no explicit
criteria or trade-offs are used.
Multivoting: Each member of the team votes for several concepts and the concept with most
votes wins.
Pros and cons: The development team lists the strengths and weaknesses of each concept and
makes a choice based on a group decision.
Prototype and test: Prototypes for each concept are built and tests are done. The decision is
then based on the test data.
Decision matrices: The team rates each concept against pre-specified selection criteria,
which may be weighted.
In this project, there have been different methods used to decide upon a final concept. The
main decision method used was pros and cons, where the different interface suggestions were
compared against each other. The pros and cons have also been compared to the requirement
list to find the interface that suits the customers best. There has also been testing of the
interface to see how it works when implemented. Some external decisions were also made by
people at Volvo Cars about how they want the interface to look like and which improvements
that needs to be made. The final concept is presented in the Result chapter.
3.5 Testing and Refinement
Here, the methods for making the analysis and testing of the concepts are described. Also, the
communication between the software RD&T and ADAMS/Car is described.
3.5.1 Computer tests
The main work of this thesis has been performed in the virtual environment, with the
software RD&T, ADAMS/Car and ADAMS/Insight. RD&T was used to analyze the
variation in a realistic suspension system with its tolerances and also for the selection process
for which car that should be analyzed in ADAMS/Car. ADAMS/Car has been used to analyze
the handling of the cars selected in RD&T. It has also been used to do the simulations needed
in order to run experiments in ADAMS/Insight. ADAMS/Insight was used for the sensitivity
analysis, i.e. how big impact a hardpoint had on a specific attribute if varied. This was
interesting when trying to find the worst car for a handling attribute in RD&T and also to find
cars that are poor on more than one attribute.
RD&T
RD&T (Robust Design & Tolerancing) is a CAT (Computer Aided Tolerancing) - tool
developed by Lars Lindkvist and Rikard Söderberg at Chalmers University of Technology.
The software uses a Windows environment and C++ as programming language [10]. With
14
RD&T, statistical variation simulation could be made which makes it possible to simulate and
visualise manufacturing and assembly deformations of the product before any physical
prototypes are being built. Different design concepts can thereby be analyzed and compared
at an early stage and the decision made will be of higher quality [2].
RD&T is based on Monte Carlo simulation which randomly assigns one value for every input
within the given tolerance. The model is then assembled according to a given locating
scheme, the created measures are calculated and the result is stored. This is repeated at least
10000 times and the distribution of the measures are calculated [3]. RD&T makes it possible
to assure the geometry in all its phases, from an early design to pre-production and
production. The goal is to make the product concept as robust to manufacturing variation as
possible and to be able to predict final variation in the products most critical dimensions [2].
The benefit of using virtual geometry assurance, for example with RD&T, is that it is
possible to minimize the need for costly physical prototypes. When problems are found as
early as possible in the development process it becomes easier and cheaper to fix them and
the development process becomes faster with efficient tools (time to market). Last but not
least the quality increases, which makes the customers satisfied [17].
ADAMS/Car
ADAMS (Automatic Dynamic Analysis of Mechanical Systems) is a widely used multibody
dynamics and motion analysis software. ADAMS is used to study the dynamics of moving
parts and how loads and forces are distributed throughout mechanical system [18]. It makes it
possible to predict how the final product will be before it is built.
In ADAMS you can create and test virtual prototypes of mechanical systems in a fraction of
the time and money necessary if making physical prototypes and tests. Unlike most CAD
software, ADAMS incorporates real physics by simultaneously solving equations for
kinematics, dynamics, statics, and quasi-statics [18].
With ADAMS/Car, it is easy to quickly build and test functional virtual prototypes of
complete vehicles and vehicle subsystems. It is possible to test about anything that can be
done with a physical car, creating own events with different roads and environments, things
that normally should be tested in a test lab or on a test track, but in a fraction of the time [19].
Some analyzes that could be made are braking, accelerating, drift, lane change; cornering and
straight ahead motion [20]. The models in ADAMS/Car are built up with variables and
design parameters containing hardpoints (define locations for geometry, attachments, and
construction frames), parameter variables (contain strings, integers, and real values) and
property files. Changing these variables enables you to test and simulate different behaviours
of a vehicle on various road conditions [21].
The first step when building an ADAMS model starts with building the physical attributes of
the movable parts in the mechanical system. Geometry can be defined from either existing
ADAMS parts or parts imported from CAD geometry. After that, constraints and motions to
describe part movements are added. Constraints define how the parts are attached to each
other and also how they are allowed to move. Forces can also be applied on your model to
affect part motion and reaction forces on constraints. This could be for flexible connectors
such as springs, dampers and bushings, but also for special forces such as aerodynamic forces
and tires [22].
15
RD&T – ADAMS/Car communication
To be able to connect the two software RD&T and ADAMS/Car, it needed to exist some sort
of communication method between them. In the master thesis done by Johan Bengtsson and
Anders Ingemarson [4], there were some functions developed in RD&T that enabled that
communication. It was built on importing coordinate data from ADAMS/Car for each
hardpoint into RD&T. A hardpoint is a point of reference which states the X-, Y- and Z-
coordinates for that point. This method was though not fully developed; hence this master
thesis was created.
In this thesis, this method thinking was adapted as well. Both software are compatible with
ASCII-encoding, which makes it possible for both software to read text-files of a certain
standard. This was used because the sub-files used in ADAMS/Car are text-files which
enabled RD&T to read and import that data. The importing of hardpoints in RD&T was
wanted to be able to vary these points together with the parts of the suspension system. Doing
so would make it possible to find the hardpoints position for specific measures, for example
wheel angles and then analyze the car with that specific hardpoint setup.
ADAMS/Insight
ADAMS/Insight is a Design-of-Experiments (DOE) software that also works with many
other ADAMS products. ADAMS/Insight enables design experiments for measuring the
performance of mechanical system. It also provides statistical tools for analyzing the results
in order to understand how to refine and improve the system [23]. The experiments measure
the performance of a physical prototype or the quality of a finished product [22].
Varying one factor at a time will not give the information about the interactions between the
factors, and if trying too many different factor combinations, multiple simulations are needed
which give a huge amount of data to evaluate. It will also take too much time. To help to
manage these time-consuming tasks, ADAMS/Insight provides planning and analyzing tools
for running a series of experiments. It also helps to determine relevant data to analyze, and
automates the entire experimental design process [22].
The first thing to do is to import an ADAMS/Car model with factors and responses to
ADAMS/Insight. Factors are the parameters that you want to vary in the experiment, in this
master thesis it is the hardpoints in the X, Y and Z direction. Response is the parameter that
you want to measure when varying the factors. In this master thesis the responses are the
wheel angles.
Then an experiment is made and run. There are different kinds of experiments that could be
done; in this master thesis the experiment type D-Optimal has been used. D-Optimal
produces a model that minimise the uncertainty of coefficients. It consists of a random
collection of rows from larger amount of candidates that are selected using minimization
criteria. The total number of runs and level for the factors can be specified in an experiment.
This function makes D-Optimal the most optimal choice in many simulations. D-Optimal
extends to larger design matrices. Therefore, finding a design that maximizes the determinant
D means finding a design where the factor effects are maximally independent of each other
[24].
The result is then published via HTML and contains the effects of each factor. Effects are the
difference between the factor at its maximum and minimum value, when all other factors are
at their nominal value. Effects can be both positive and negative. When positive is the
16
response increasing with a larger factor value and if negative decreases with larger factor
value [25]. The effects are calculated with the following formulas 1-3:
(1)
(2)
(3)
Where α is the response at its maximum value on the factor, β is the response at its minimum
value on the factor and n is the number of values.
In this master thesis ADAMS/Insight has been used to analyze how big impact a hardpoint
has on a specific attribute if varied. This is analyzed because different parts of the suspension
system are affecting an attribute differently and that could not be seen in the models used
today. This is interesting when trying to find the worst car in RD&T for an attribute and also
to find cars that are poor in more than one attribute.
3.5.2 Testing the tool interface and test drive
In this thesis, verification with a test drive was needed but also testing the tool interface with
users in order to see how they experienced the developed tool. Ulrich and Eppinger [14]
describe the method of concept testing with several steps. The first step is to define the
purpose of the concept test in order design an effective experimental method. The second step
is to choose a survey population, i.e. the potential customers. The team should choose a group
that reflects the final customers, which in this thesis are users of the tool interface and work
method. The third and fourth step is to choose survey format and to communicate the
concept, and for this there are different alternatives that can be used; verbal description,
sketch, photos, storyboard, video/demonstration, working prototypes etc. The more realistic
the prototype or demonstration, the more useful it is due to that customers can see and/or feel
the final product. The last steps of the testing procedure are to measure, analyze and interpret
the customer response and the results. This step can be a bit hard to do without adding own
biases and experience, so it is important to form clear statements for the customers to choose
between, for example using a scale with clear alternatives [14].
17
4 Computer modelling
To be able to make variation analysis in RD&T, a RD&T model was received from Matz Olli
at the Robust Design and Tolerancing department at Volvo Cars. After that, an ADAMS/Car
model that was used by the Vehicle Dynamics department at Volvo Cars was received from
Catharina Hansen to be able to make handling analysis. These two models are further
explained and shown in this chapter. Since the models used in this master thesis are
confidential the figures in this chapter has been replaced. This does not affect the explanation
of the models though.
4.1 RD&T
The model used in RD&T includes the front and rear suspension of the car. Within the car
industry a standard has been developed regarding the main reference system of the vehicles.
According to this standard the X-direction is in the length, the Y-direction the width and the
Z-direction in the height of the car [10].
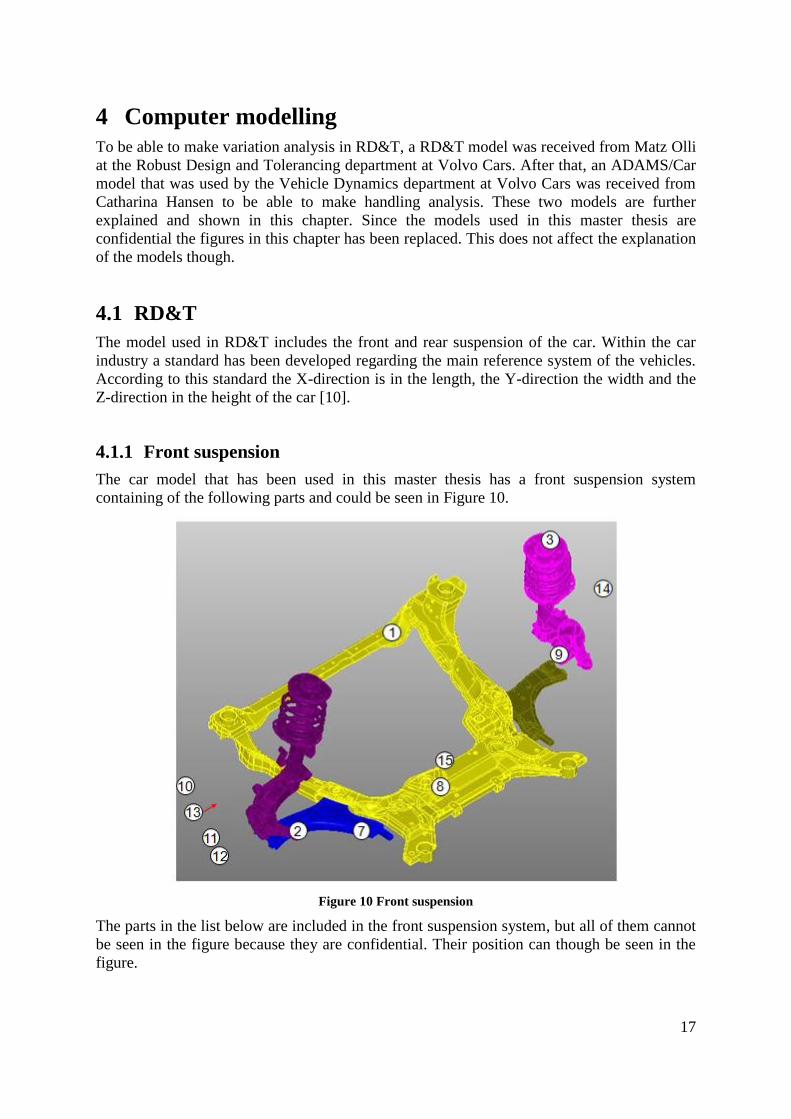
4.1.1 Front suspension
The car model that has been used in this master thesis has a front suspension system
containing of the following parts and could be seen in Figure 10.
Figure 10 Front suspension
The parts in the list below are included in the front suspension system, but all of them cannot
be seen in the figure because they are confidential. Their position can though be seen in the
figure.
18
1. Sub frame
2. Left/right lower control arm (LCA)
3. Left/right suspension strut
4. Left/right short long arm (SLA)
5. Left/right tie rod (TR)
6. Left/right wishbone (WB)
7. Bushings
8. Anti-roll bar (ARB)
9. Left/right anti-roll bar link
10. Left brake caliper
11. Left/right brake disc
12. Left/right dust cover
13. Left/right wheel bearing
14. Left/right wheelhouse
15. Electrical power assisted steering
(EPAS)
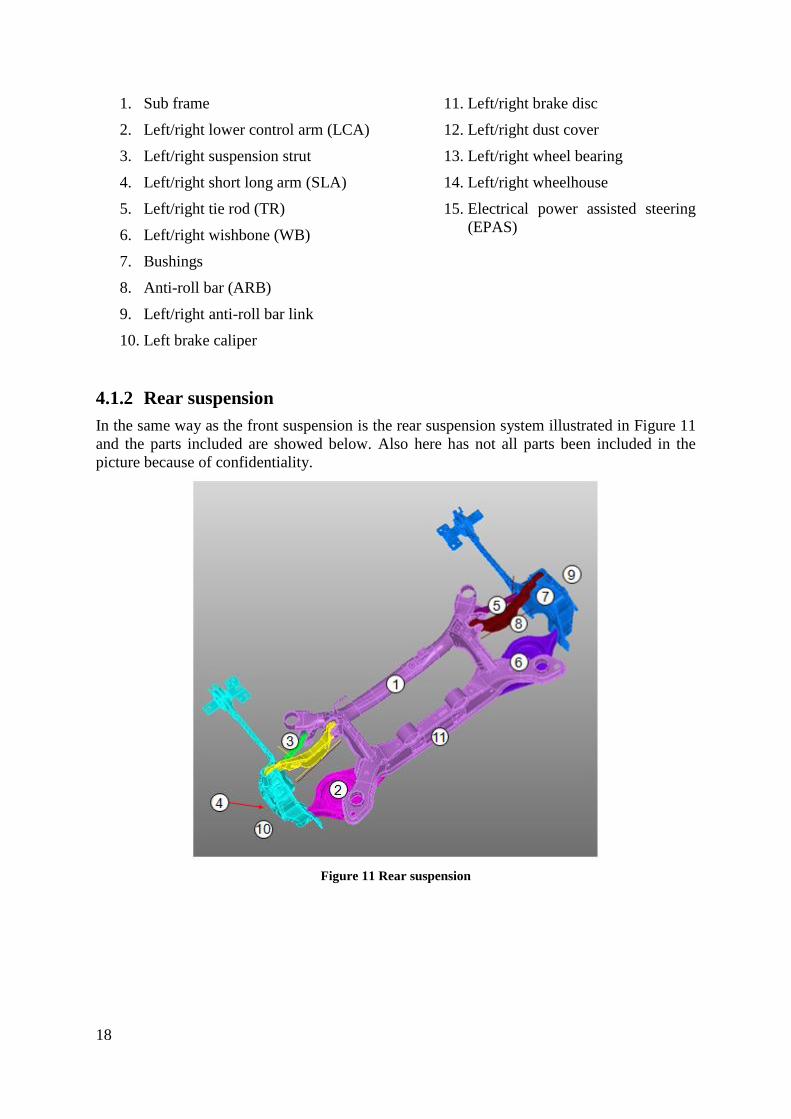
4.1.2 Rear suspension
In the same way as the front suspension is the rear suspension system illustrated in Figure 11
and the parts included are showed below. Also here has not all parts been included in the
picture because of confidentiality.
Figure 11 Rear suspension
19
1. Sub frame
2. Left/right lower control arm (LCA)
3. Left/right toe control arm (TCA)
4. Left/right knuckle
5. Left/right upper control arm (UCA)
6. Anti-roll bar
7. Left/right anti-roll bar link
8. Left/Right shock damper module (DM)
9. Left/right wheelhouse
10. Left/right wheel bearing
11. Leaf spring
4.1.3 Measures
Measures are set up for the critical dimensions or points that you want to analyze.
There are different kinds of measures, from point measures to measures between lines
and relations between holes and pins. With measures it is possible to analyze how a
point or line moves in relation to another or how it moves in relation to its nominal
position (this measures is called point-self or line-self) [26].
If wanted to measure the gap and flush measures between two parts, point-point
measures with a specified offset and direction can be created. Tolerances can then be
applied to one or both of these points in the same direction as the gap or flush
measure. Parallelism could also be measured to evaluate the relation between two
gap- or flush measures. It is defined as the difference between the biggest and smallest
gap- and flush measure [26].
If wanted to measure angles between two lines, the line-line measure can be used.
In this master thesis the caster, camber and toe angle have been measured since they
are the most interesting angles when analysing vehicle handling. How the angles have
been measured in RD&T can be seen in Appendix I.
For the car model used in this master thesis the front caster angle must be within ±
0.5º from the nominal line. There is also a requirement between the wheels, the side-
to-side measure, which is the difference between the caster on the right and left wheel.
In the front, the side to side caster must be less than 0.5º. In the rear suspension there
is no requirement on the caster angle at this time [27].
Individual toe on each wheel should not exceed ± 0.05º from the nominal value. This
is a requirement for both the rear and front suspension. This gives that the total toe
angle must be within ± 0.1º [27].
Camber needs to be within the interval ± 0.5º on the individual wheels. The side-to-
side measure for the front must be less than 0.4º while for the rear it must be less than
0.6º [27]. The whole requirement list for the wheel angle geometry can be seen in
Appendix II.
20
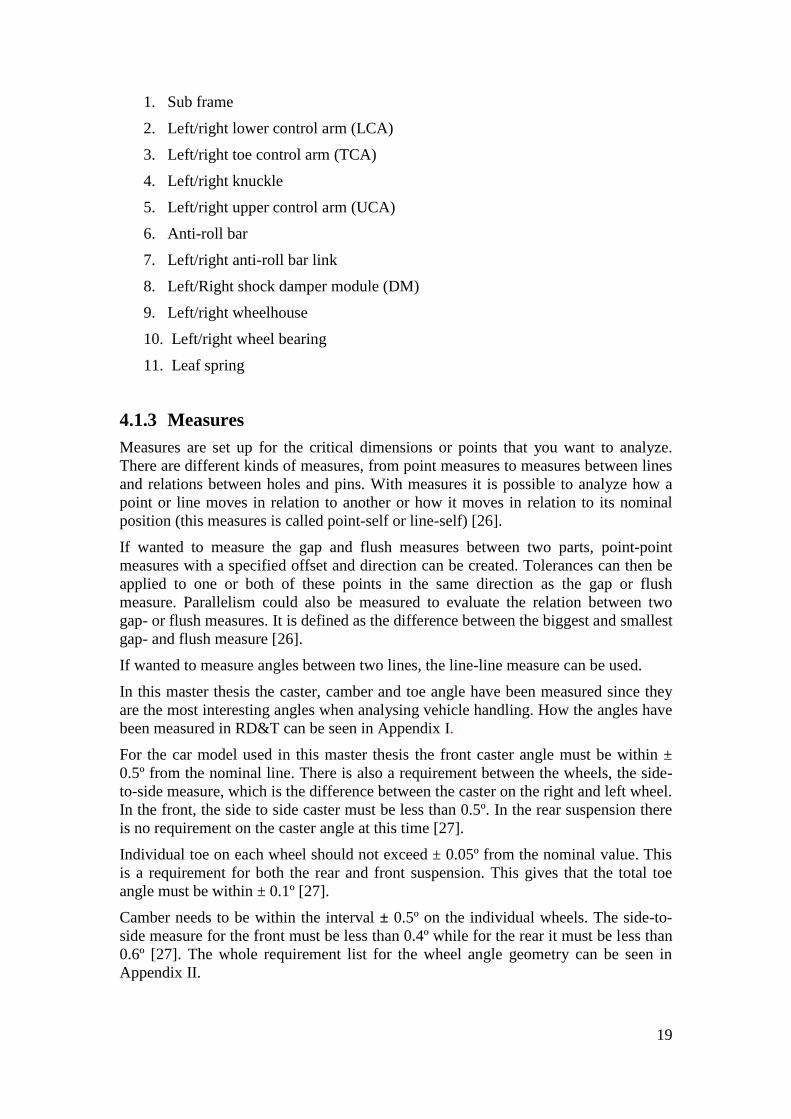
4.2 ADAMS/Car
A model was also built in ADAMS/Car. With the help from the Vehicle dynamics
department, the needed subsystems were found in their databases and assembled into
one car. The assembly contains of front and rear suspension, wheels and steering
system to make it as similar to the RD&T model as possible.
In the ADAMS graphical user interface (GUI), see Figure 12, the coordinate system
coincides with the reference system in RD&T with the X-coordinate as the length, the
Y-coordinate as the width and the Z-coordinate as the height of the vehicle. This is the
Volvo standard which enables the different functions and departments of the company
to speak the same reference language.
Figure 12 ADAMS GUI
Users at the Vehicle Dynamics department were asked which simulation that was the
most interesting to analyze when considering geometrical deviation. Catharina
Hansen [28] answered that the most common simulations were "Braking", "Vehicle
drift" and "Bump steer". In all these simulations the different wheel angles plays a big
role on the outcome of the simulation and how the handling of the vehicle is affected.
In this thesis, the focus will be on the handling situation “Vehicle Drift”.
Below, the model and the different simulations are described further.
4.2.1 Front suspension
The front suspension consists of the same parts as the RD&T model and the
hardpoints are shown in Figure 13.
21
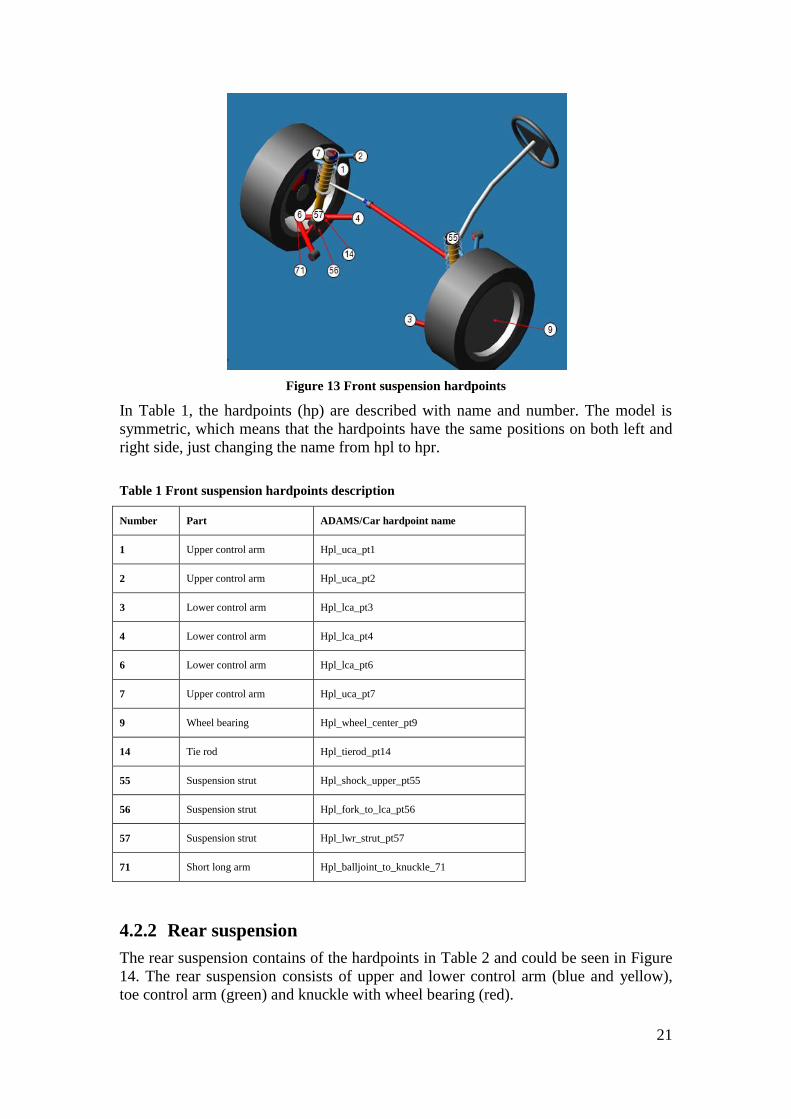
Figure 13 Front suspension hardpoints
In Table 1, the hardpoints (hp) are described with name and number. The model is
symmetric, which means that the hardpoints have the same positions on both left and
right side, just changing the name from hpl to hpr.
Table 1 Front suspension hardpoints description
Number Part ADAMS/Car hardpoint name
1 Upper control arm Hpl_uca_pt1
2 Upper control arm Hpl_uca_pt2
3 Lower control arm Hpl_lca_pt3
4 Lower control arm Hpl_lca_pt4
6 Lower control arm Hpl_lca_pt6
7 Upper control arm Hpl_uca_pt7
9 Wheel bearing Hpl_wheel_center_pt9
14 Tie rod Hpl_tierod_pt14
55 Suspension strut Hpl_shock_upper_pt55
56 Suspension strut Hpl_fork_to_lca_pt56
57 Suspension strut Hpl_lwr_strut_pt57
71 Short long arm Hpl_balljoint_to_knuckle_71
4.2.2 Rear suspension
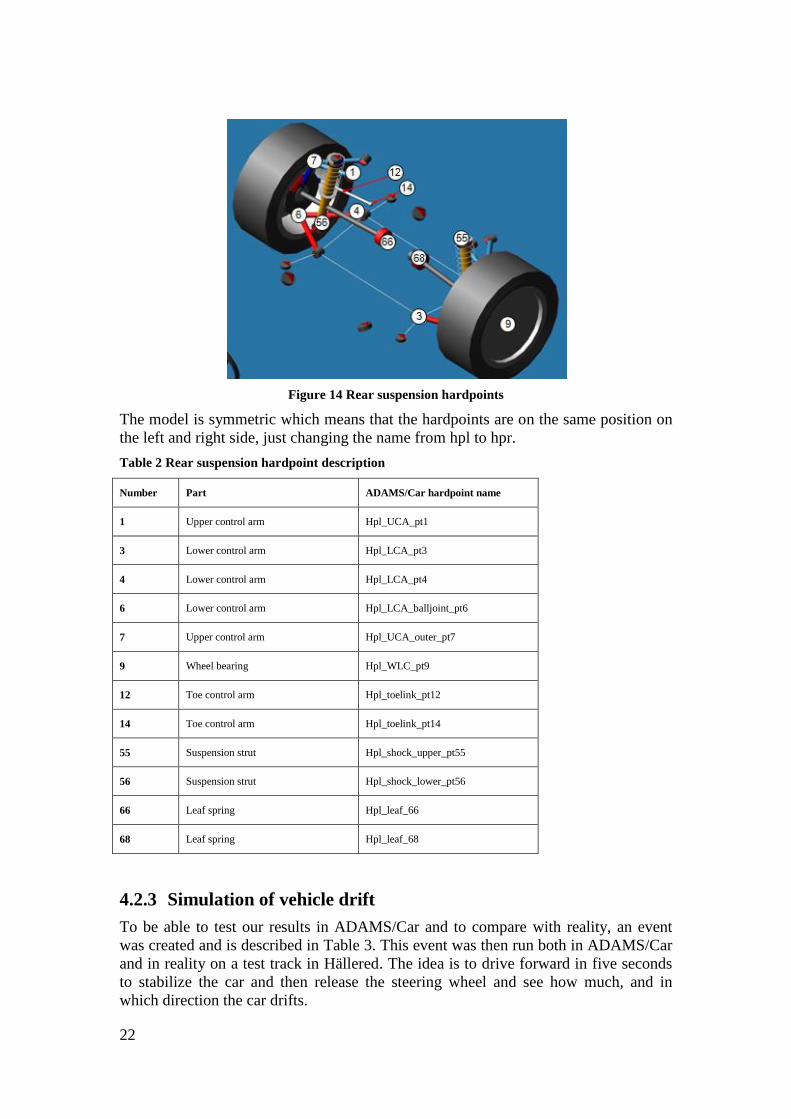
The rear suspension contains of the hardpoints in Table 2 and could be seen in Figure
14. The rear suspension consists of upper and lower control arm (blue and yellow),
toe control arm (green) and knuckle with wheel bearing (red).
22
Figure 14 Rear suspension hardpoints
The model is symmetric which means that the hardpoints are on the same position on
the left and right side, just changing the name from hpl to hpr.
Table 2 Rear suspension hardpoint description
Number Part ADAMS/Car hardpoint name
1 Upper control arm Hpl_UCA_pt1
3 Lower control arm Hpl_LCA_pt3
4 Lower control arm Hpl_LCA_pt4
6 Lower control arm Hpl_LCA_balljoint_pt6
7 Upper control arm Hpl_UCA_outer_pt7
9 Wheel bearing Hpl_WLC_pt9
12 Toe control arm Hpl_toelink_pt12
14 Toe control arm Hpl_toelink_pt14
55 Suspension strut Hpl_shock_upper_pt55
56 Suspension strut Hpl_shock_lower_pt56
66 Leaf spring Hpl_leaf_66
68 Leaf spring Hpl_leaf_68
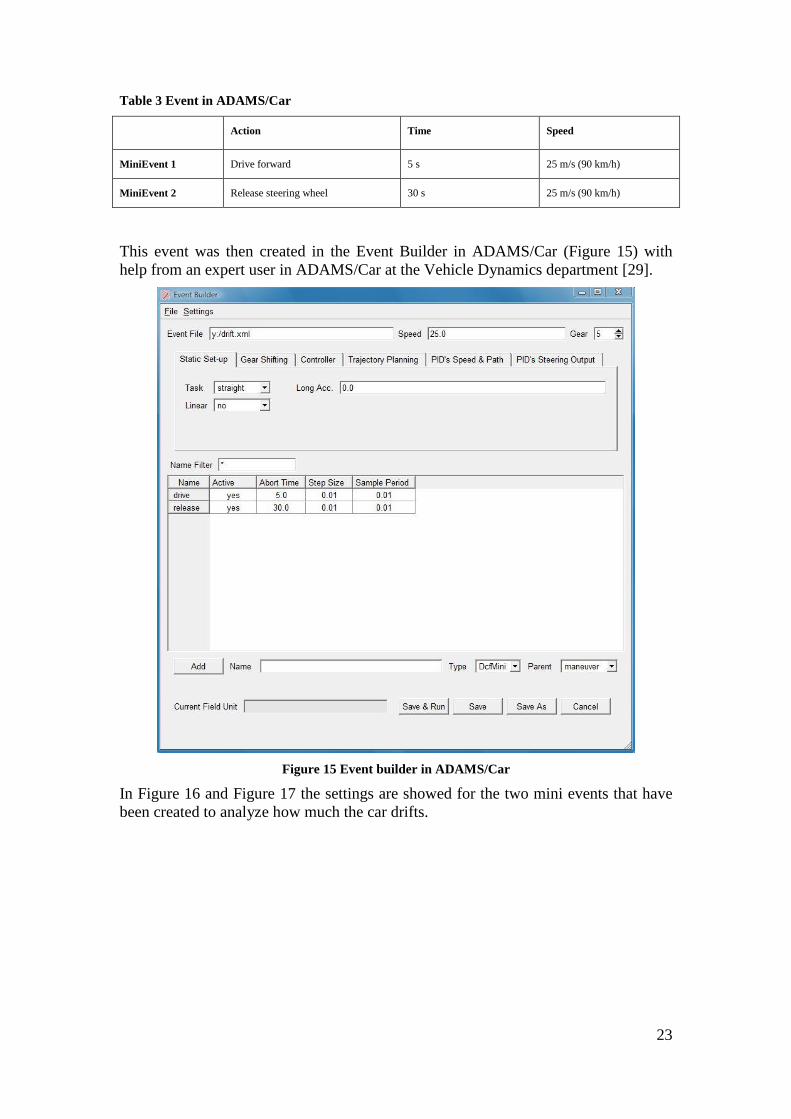
4.2.3 Simulation of vehicle drift
To be able to test our results in ADAMS/Car and to compare with reality, an event
was created and is described in Table 3. This event was then run both in ADAMS/Car
and in reality on a test track in Hällered. The idea is to drive forward in five seconds
to stabilize the car and then release the steering wheel and see how much, and in
which direction the car drifts.
23
Table 3 Event in ADAMS/Car
Action Time Speed
MiniEvent 1 Drive forward 5 s 25 m/s (90 km/h)
MiniEvent 2 Release steering wheel 30 s 25 m/s (90 km/h)
This event was then created in the Event Builder in ADAMS/Car (Figure 15) with
help from an expert user in ADAMS/Car at the Vehicle Dynamics department [29].
Figure 15 Event builder in ADAMS/Car
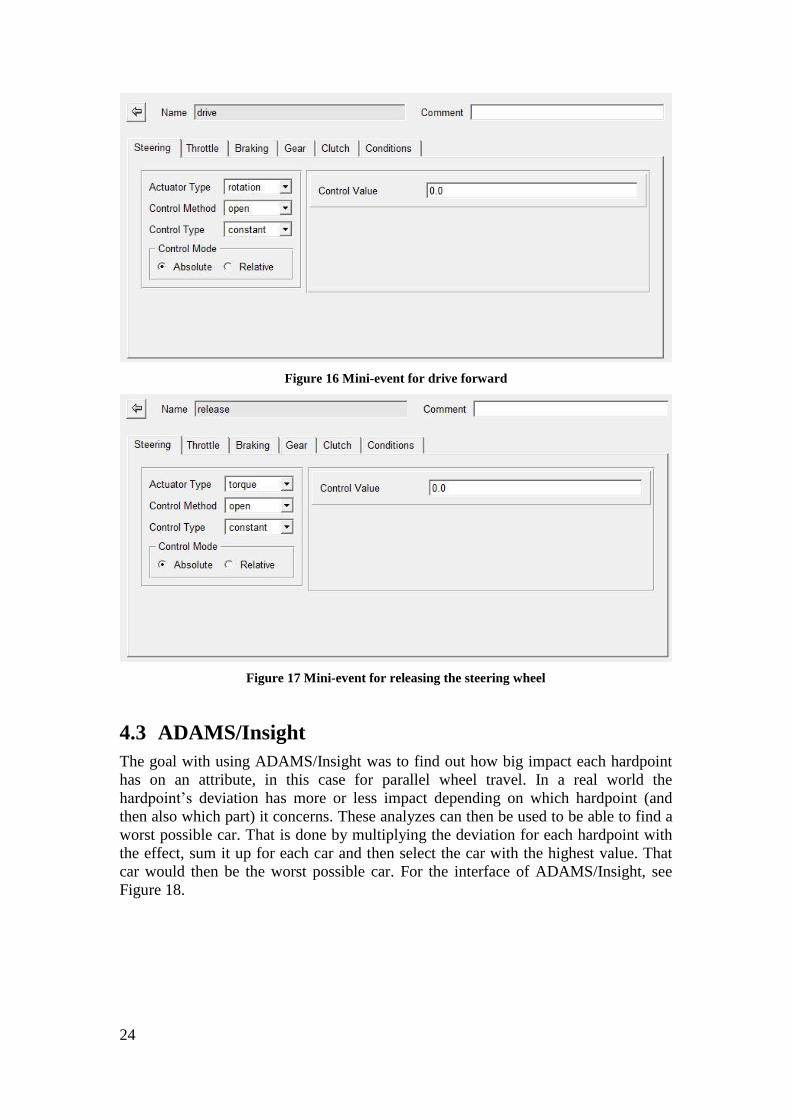
In Figure 16 and Figure 17 the settings are showed for the two mini events that have
been created to analyze how much the car drifts.
24
Figure 16 Mini-event for drive forward
Figure 17 Mini-event for releasing the steering wheel
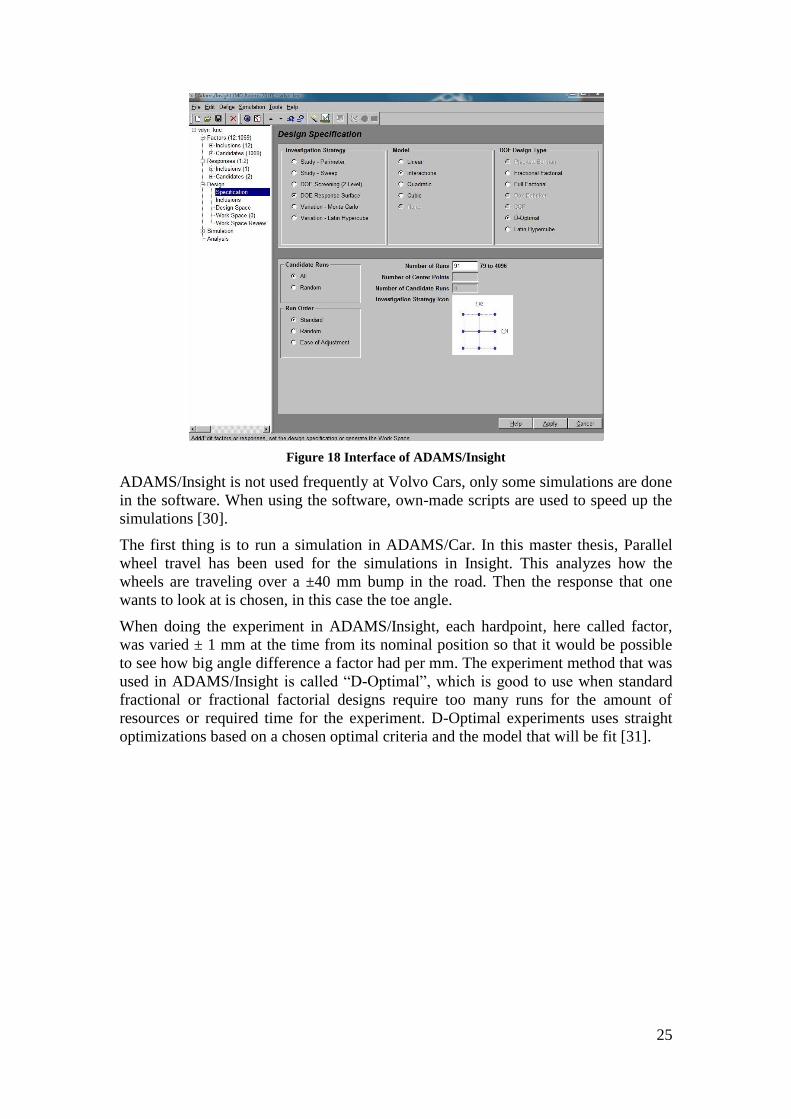
4.3 ADAMS/Insight
The goal with using ADAMS/Insight was to find out how big impact each hardpoint
has on an attribute, in this case for parallel wheel travel. In a real world the
hardpoint’s deviation has more or less impact depending on which hardpoint (and
then also which part) it concerns. These analyzes can then be used to be able to find a
worst possible car. That is done by multiplying the deviation for each hardpoint with
the effect, sum it up for each car and then select the car with the highest value. That
car would then be the worst possible car. For the interface of ADAMS/Insight, see
Figure 18.
25
Figure 18 Interface of ADAMS/Insight
ADAMS/Insight is not used frequently at Volvo Cars, only some simulations are done
in the software. When using the software, own-made scripts are used to speed up the
simulations [30].
The first thing is to run a simulation in ADAMS/Car. In this master thesis, Parallel
wheel travel has been used for the simulations in Insight. This analyzes how the
wheels are traveling over a ±40 mm bump in the road. Then the response that one
wants to look at is chosen, in this case the toe angle.
When doing the experiment in ADAMS/Insight, each hardpoint, here called factor,
was varied ± 1 mm at the time from its nominal position so that it would be possible
to see how big angle difference a factor had per mm. The experiment method that was
used in ADAMS/Insight is called “D-Optimal”, which is good to use when standard
fractional or fractional factorial designs require too many runs for the amount of
resources or required time for the experiment. D-Optimal experiments uses straight
optimizations based on a chosen optimal criteria and the model that will be fit [31].
26
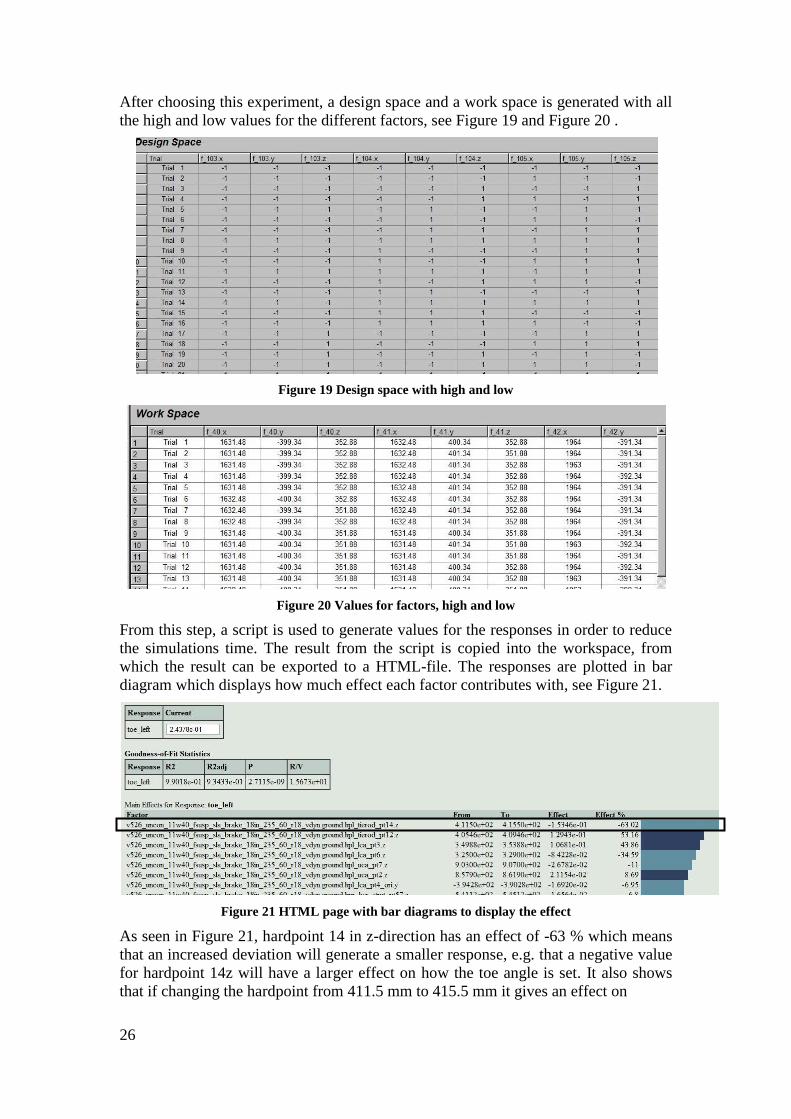
After choosing this experiment, a design space and a work space is generated with all
the high and low values for the different factors, see Figure 19 and Figure 20 .
Figure 19 Design space with high and low
Figure 20 Values for factors, high and low
From this step, a script is used to generate values for the responses in order to reduce
the simulations time. The result from the script is copied into the workspace, from
which the result can be exported to a HTML-file. The responses are plotted in bar
diagram which displays how much effect each factor contributes with, see Figure 21.
Figure 21 HTML page with bar diagrams to display the effect
As seen in Figure 21, hardpoint 14 in z-direction has an effect of -63 % which means
that an increased deviation will generate a smaller response, e.g. that a negative value
for hardpoint 14z will have a larger effect on how the toe angle is set. It also shows
that if changing the hardpoint from 411.5 mm to 415.5 mm it gives an effect on
27
-0.153° since it is the toe angle that is analyzed. To get this to deg/mm it is needed to
divide the hardpoint change with the effect. If only changing the factor one mm the
effect will “automatically” be in degree per mm.
“Goodness of fit” displays how well the results are estimated. R2 and R2adj should be
as close to 1 as possible for a perfect fit, and as one can see in the figure it is 0.99
respectively 0.93 which can be said to be a good fit.
The results from this analysis can be used to give hardpoint deviations an effect in
order to find a worst possible car. This means that it is possible to connect the
dynamic response from ADAMS/Insight with the static variation in RD&T, using
scale factors to calculate the worst case car in RD&T. To see how this is used in
practice in RD&T, see 6.1.3 Sensitivity analysis.

28
29
5 Concept development
In the concept development phase, the customer needs are established in a product
specification. The customers in this thesis are the employees as VCC. Then the
concept generation of the tool interface is described.
5.1 Identify customer needs
At Volvo Cars, there existed no functional work method for this types of analyzes. It
was possible to analyze geometrical variations on assembled components in static
condition with the program RD&T but it was not possible to analyze how geometrical
deviation would affect the car's handling in a dynamic state. The employees at the
department of Robust Design and Tolerancing are educated in the software RD&T,
and are daily users of the software. The employees of Vehicle Dynamics department
are daily users of the software ADAMS/Car, and some of them even work with
ADAMS/Insight on a daily basis.
In order to generate different ideas on how to design the tool interface, several
interviews were held to map the users and their thoughts. The interviews were made
with relevant people at Volvo Cars and the result is summarised in two product
specification (see Appendix III) and described in the next sections.
5.1.1 Interviews
Throughout the whole project, with main focus in the early stages, interviews with
relevant people were held in order to get as much information as possible on the
problem. There were mostly 1-2 people at the time during the interviews. To see the
interview guide used during the interviews, see Appendix IV.
The focus of the interviews was on how the employees perform the analysis today,
how they want to work in the future, and how the present process could be improved.
Due to that there is no existing work method or tool interface today, the interviewees
could think freely on how they wanted the tool to look like.
Some interesting ideas that came up during the interviews were that the users wanted
to be able to select which iteration – car – that should be exported from RD&T to
ADAMS/Car. Different possibilities on how this selection process could be solved
were also discussed. Some of the interviews were held in order for the authors to
understand which analysis that was performed in the software and also to get some
support when making the analysis. In total, 10 persons, both from Vehicle Dynamics
and Geometry department, were interviewed during the project and all of them
contributed with small pieces to the puzzle of how to solve the project goal.
5.1.2 Observing the product in use
In order to further improve the tool interface, a demonstration for one of the users was
held. The user was also able to try out the interface himself in order to find areas of
improvement. During this session, some interesting ideas came up that would make
the interface even better and more intuitive. One example was the sliding scales that
are used for making the selection. This is further described in the Result chapter.
30
5.2 Establish product specification
According to the product development method used, two specifications were made in
this thesis. First, a target specification was developed and after testing and
refinements a final specification was established, including values and limitations for
each requirement. Both the target and the requirement specification can be found in
Appendix III.
5.3 Concept generation
A brainstorming session was held in order to come up with different concepts and
ideas on work methods. These were then compared with each other in order to see if
the results were similar or if they differed in some ways. Aspects that were considered
when comparing these ideas were the requirements collected from the interviews.
Those aspects could for example be number of process steps, efficiency, how easy it
was to understand the process etc. Also, combining different concepts enabled coming
up with even more concepts. The development of the tool interface and the work
method is described below, and the final concept can be seen in the Result chapter.
5.3.1 Development of tool interface
To be able to create an efficient work method with as few software involved as
possible, a tool interface needed to be implemented in the software RD&T. As stated
in the requirement specification (see Appendix III), the interface should be user-
friendly and easy to handle. Together with three expert users [32] at Volvo Cars, some
different functions were discussed to be included in the tool interface.
In the start of the project, some functions already existed on how to export hardpoints
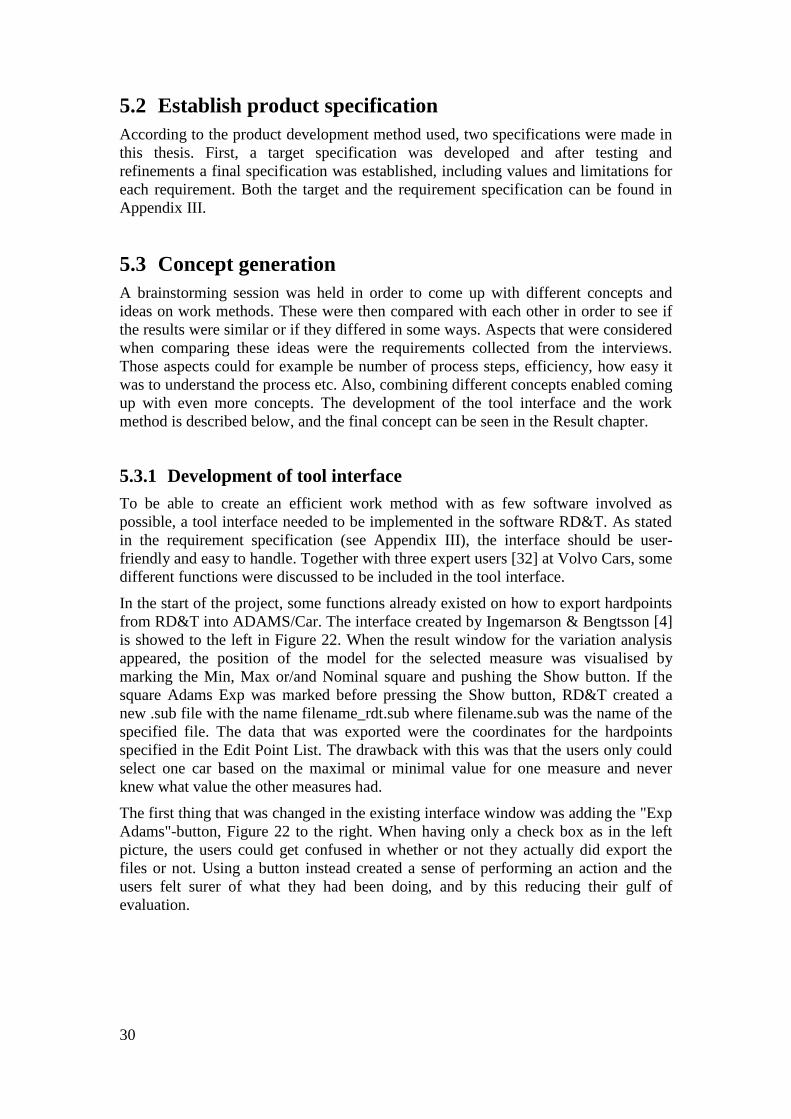
from RD&T into ADAMS/Car. The interface created by Ingemarson & Bengtsson [4]
is showed to the left in Figure 22. When the result window for the variation analysis
appeared, the position of the model for the selected measure was visualised by
marking the Min, Max or/and Nominal square and pushing the Show button. If the
square Adams Exp was marked before pressing the Show button, RD&T created a
new .sub file with the name filename_rdt.sub where filename.sub was the name of the
specified file. The data that was exported were the coordinates for the hardpoints
specified in the Edit Point List. The drawback with this was that the users only could
select one car based on the maximal or minimal value for one measure and never
knew what value the other measures had.
The first thing that was changed in the existing interface window was adding the "Exp
Adams"-button, Figure 22 to the right. When having only a check box as in the left
picture, the users could get confused in whether or not they actually did export the
files or not. Using a button instead created a sense of performing an action and the
users felt surer of what they had been doing, and by this reducing their gulf of
evaluation.
31
Figure 22 The result window for variation analysis before and after change of button
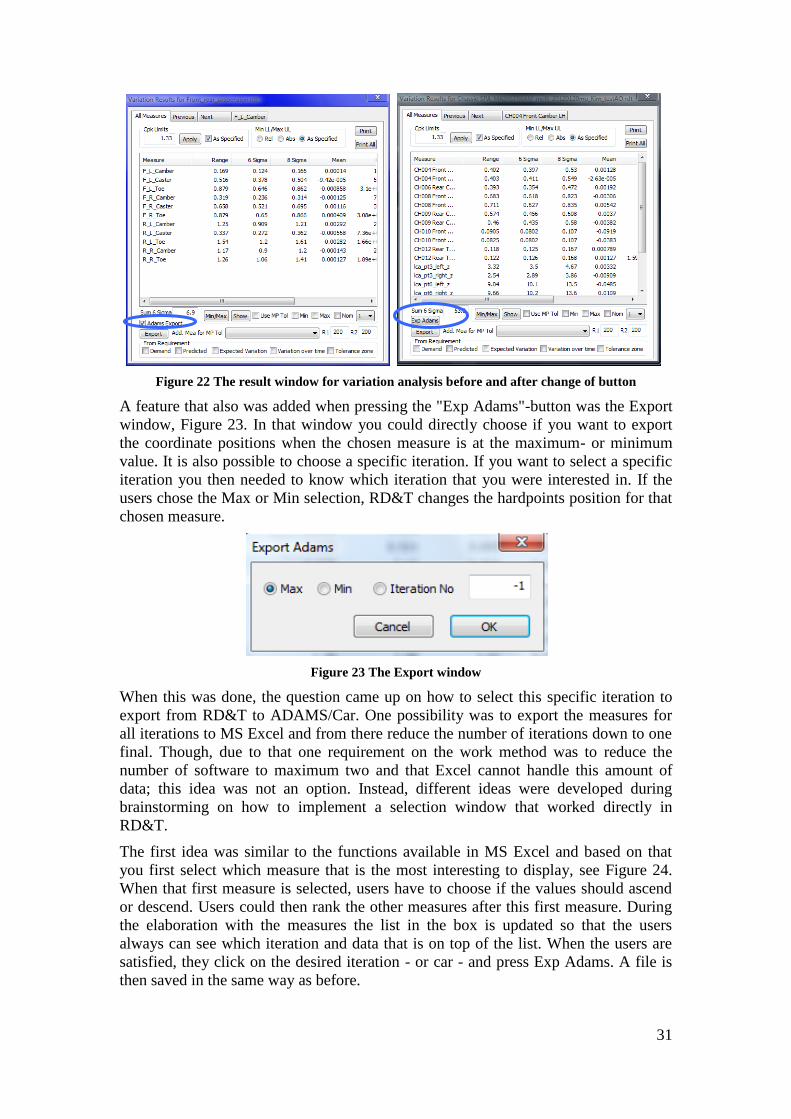
A feature that also was added when pressing the "Exp Adams"-button was the Export
window, Figure 23. In that window you could directly choose if you want to export
the coordinate positions when the chosen measure is at the maximum- or minimum
value. It is also possible to choose a specific iteration. If you want to select a specific
iteration you then needed to know which iteration that you were interested in. If the
users chose the Max or Min selection, RD&T changes the hardpoints position for that
chosen measure.
Figure 23 The Export window
When this was done, the question came up on how to select this specific iteration to
export from RD&T to ADAMS/Car. One possibility was to export the measures for
all iterations to MS Excel and from there reduce the number of iterations down to one
final. Though, due to that one requirement on the work method was to reduce the
number of software to maximum two and that Excel cannot handle this amount of
data; this idea was not an option. Instead, different ideas were developed during
brainstorming on how to implement a selection window that worked directly in
RD&T.
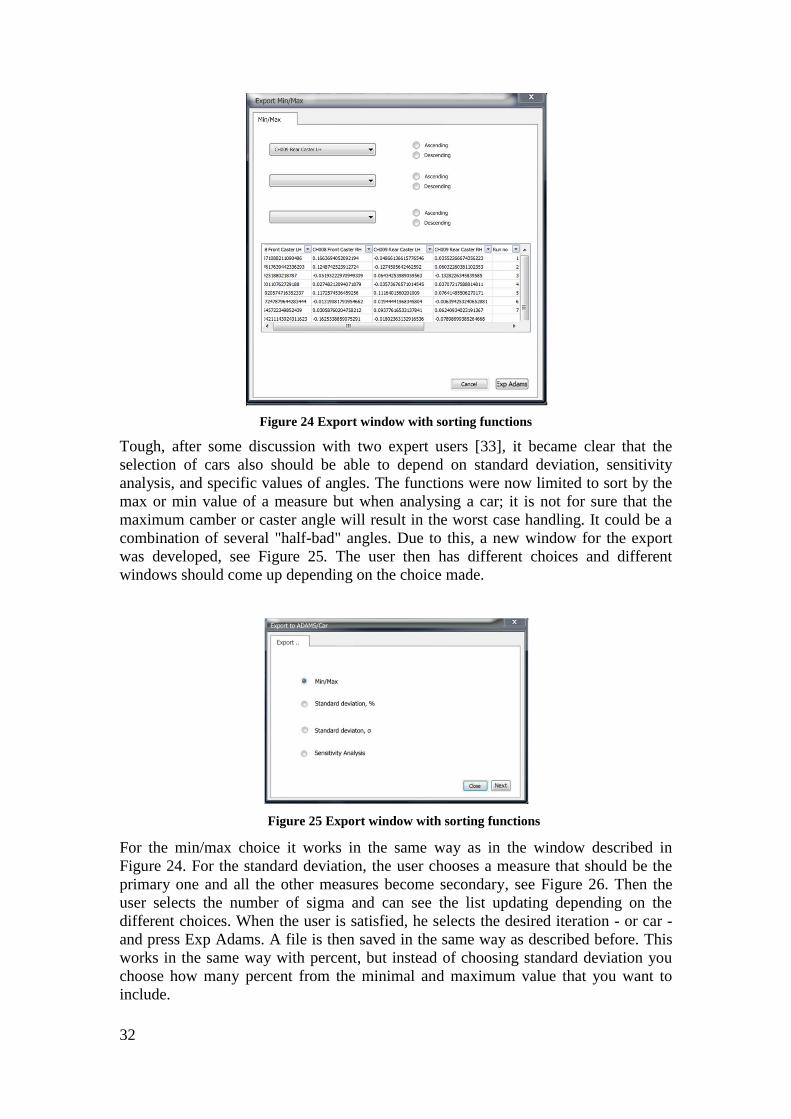
The first idea was similar to the functions available in MS Excel and based on that
you first select which measure that is the most interesting to display, see Figure 24.
When that first measure is selected, users have to choose if the values should ascend
or descend. Users could then rank the other measures after this first measure. During
the elaboration with the measures the list in the box is updated so that the users
always can see which iteration and data that is on top of the list. When the users are
satisfied, they click on the desired iteration - or car - and press Exp Adams. A file is
then saved in the same way as before.
32
Figure 24 Export window with sorting functions
Tough, after some discussion with two expert users [33], it became clear that the
selection of cars also should be able to depend on standard deviation, sensitivity
analysis, and specific values of angles. The functions were now limited to sort by the
max or min value of a measure but when analysing a car; it is not for sure that the
maximum camber or caster angle will result in the worst case handling. It could be a
combination of several "half-bad" angles. Due to this, a new window for the export
was developed, see Figure 25. The user then has different choices and different
windows should come up depending on the choice made.
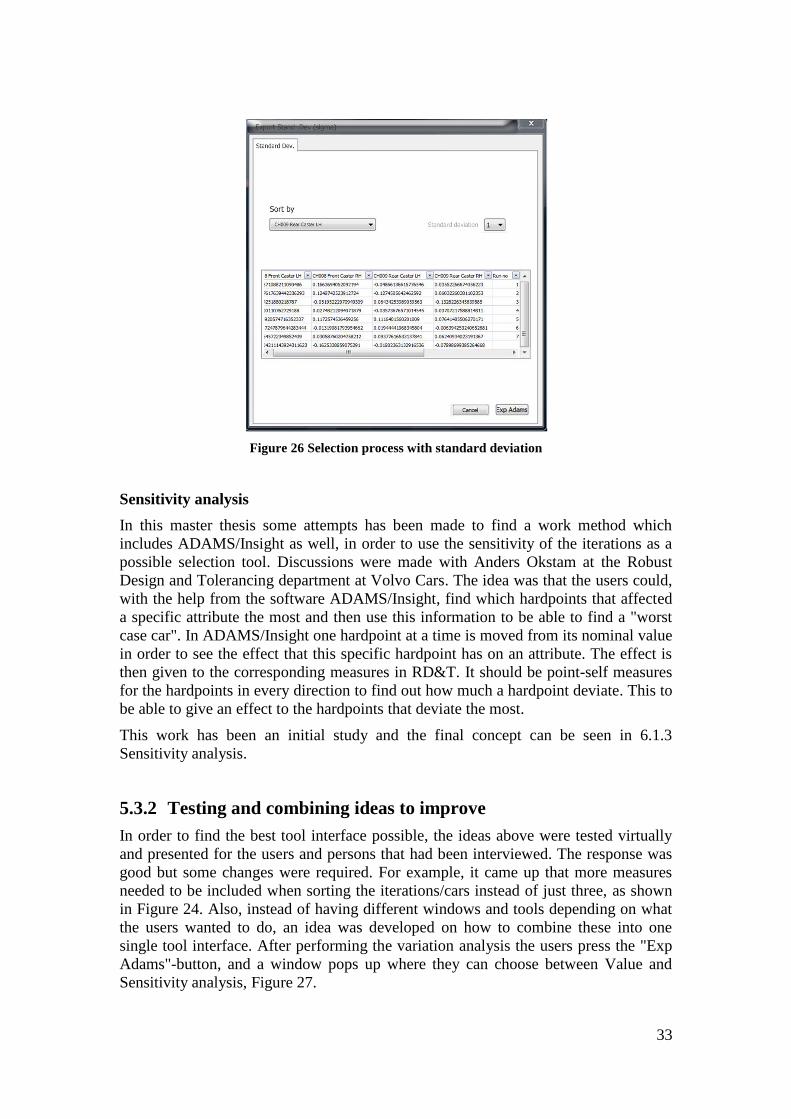
For the min/max choice it works in the same way as in the window described in
Figure 24. For the standard deviation, the user chooses a measure that should be the
primary one and all the other measures become secondary, see Figure 26. Then the
user selects the number of sigma and can see the list updating depending on the
different choices. When the user is satisfied, he selects the desired iteration - or car -
and press Exp Adams. A file is then saved in the same way as described before. This
works in the same way with percent, but instead of choosing standard deviation you
choose how many percent from the minimal and maximum value that you want to
include.
Figure 25 Export window with sorting functions
33
Figure 26 Selection process with standard deviation
Sensitivity analysis
In this master thesis some attempts has been made to find a work method which
includes ADAMS/Insight as well, in order to use the sensitivity of the iterations as a
possible selection tool. Discussions were made with Anders Okstam at the Robust
Design and Tolerancing department at Volvo Cars. The idea was that the users could,
with the help from the software ADAMS/Insight, find which hardpoints that affected
a specific attribute the most and then use this information to be able to find a "worst
case car". In ADAMS/Insight one hardpoint at a time is moved from its nominal value
in order to see the effect that this specific hardpoint has on an attribute. The effect is
then given to the corresponding measures in RD&T. It should be point-self measures
for the hardpoints in every direction to find out how much a hardpoint deviate. This to
be able to give an effect to the hardpoints that deviate the most.
This work has been an initial study and the final concept can be seen in 6.1.3
Sensitivity analysis.
5.3.2 Testing and combining ideas to improve
In order to find the best tool interface possible, the ideas above were tested virtually
and presented for the users and persons that had been interviewed. The response was
good but some changes were required. For example, it came up that more measures
needed to be included when sorting the iterations/cars instead of just three, as shown
in Figure 24. Also, instead of having different windows and tools depending on what
the users wanted to do, an idea was developed on how to combine these into one
single tool interface. After performing the variation analysis the users press the "Exp
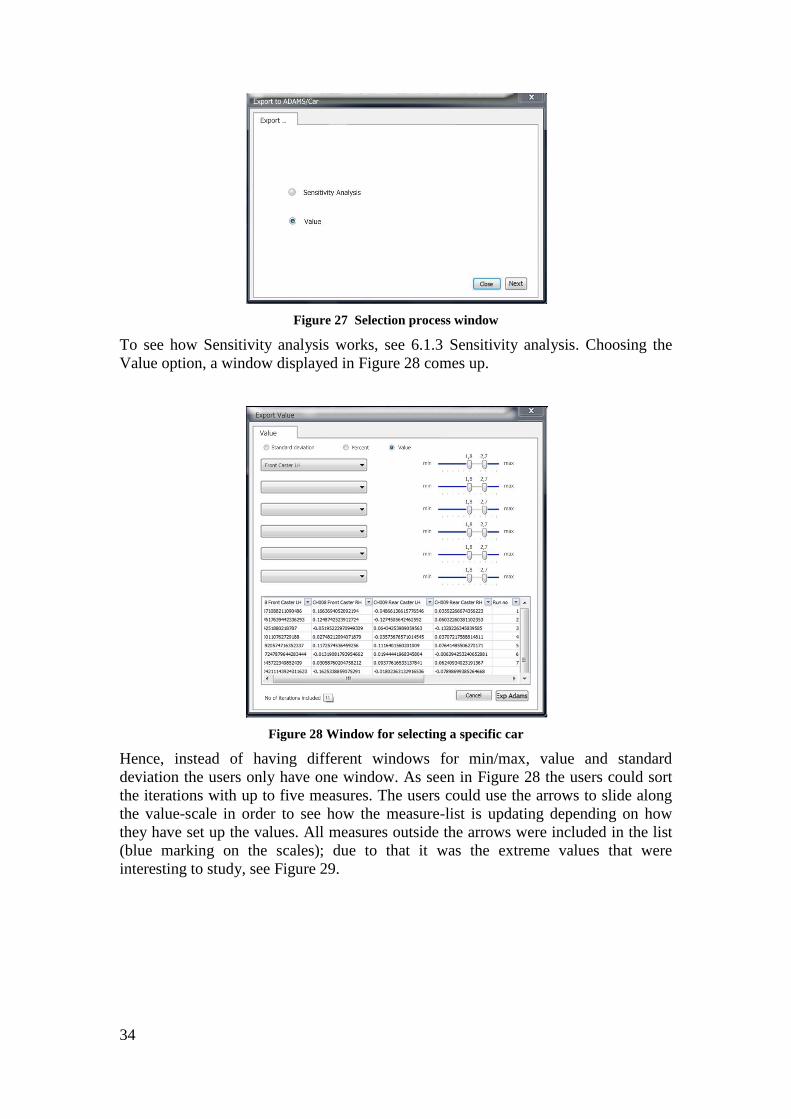
Adams"-button, and a window pops up where they can choose between Value and
Sensitivity analysis, Figure 27.
34
Figure 27 Selection process window
To see how Sensitivity analysis works, see 6.1.3 Sensitivity analysis. Choosing the
Value option, a window displayed in Figure 28 comes up.
Figure 28 Window for selecting a specific car
Hence, instead of having different windows for min/max, value and standard
deviation the users only have one window. As seen in Figure 28 the users could sort
the iterations with up to five measures. The users could use the arrows to slide along
the value-scale in order to see how the measure-list is updating depending on how
they have set up the values. All measures outside the arrows were included in the list
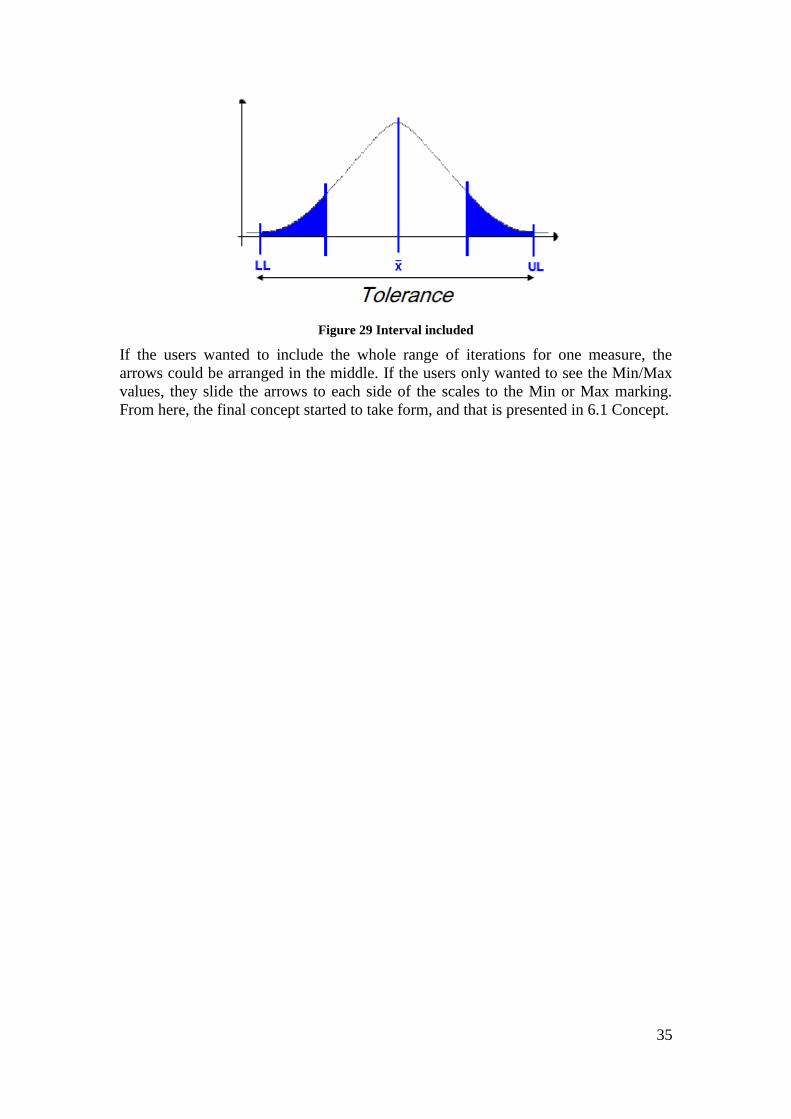
(blue marking on the scales); due to that it was the extreme values that were
interesting to study, see Figure 29.
35
Figure 29 Interval included
If the users wanted to include the whole range of iterations for one measure, the
arrows could be arranged in the middle. If the users only wanted to see the Min/Max
values, they slide the arrows to each side of the scales to the Min or Max marking.
From here, the final concept started to take form, and that is presented in 6.1 Concept.

36

37
6 Results
In this chapter, the selected concept with work method and tool interface is presented.
Due to no possibilities to verify the work with ADAMS/Insight, this step has not been
included in the final work method.
6.1 Concept selection
There have been different methods used to decide upon the final concept. The main
decision method used was pros and cons, where the different interface suggestions
were compared against each other. The pros and cons have also been compared to the
requirement list to find interface that suits the customers best. There has also been
testing of the interface to see how it works when implemented. Some external
decisions were also made by people at Volvo Cars about how they want the interface
to look like and which improvements that needs to be made.
In the final concept for the tool interface some new functions in RD&T were
developed that made it possible to communicate even better with ADAMS/Car. The
first thing that was developed was a general work method on how to work with these
two software in order to perform the simulations. All the steps of the work method are
presented in Figure 30. In the list below describes the reasons for why each step is
performed.
As stated in the Requirement specification assembled from interview answers, it was
preferred that respective department contribute with their knowledge and experience
to the work method. This meant that the users at Robust design and Tolerancing work
in the RD&T part of the method and the users at Vehicle Dynamics do the
ADAMS/Car part.
Figure 30 Work method steps
Build car model in ADAMS/Car – to simulate a nominal car
Run simulation in ADAMS/Car – could be done to compare a nominal car and a car
with geometrical deviation. This is not needed if one only want to analyze a car from
RD&T
Import hardpoint to RD&T – to connect the models in ADAMS/Car and RD&T
Build model in RD&T with measures – to measure the result from the simulation in
RD&T
Run simulation in RD&T – to find the geometrical variation
Select interesting car(s) – to simulate specific car(s) with chosen measures
Export chosen car(s) – to simulate how the geometrical deviation influence handling
Load new model in ADAMS/Car – to simulate the selected car
Run simulation in ADAMS/Car – to see the result on handling for the chosen car(s)
6.1.1 Work method in RD&T
The focus of this thesis has been to develop a work method combined with a tool
interface in order to simulate effects on handling caused by geometrical deviation.
Build car model in
ADAMS/Car
Run simulation in ADAMS/Car
Import Hardpoints
to RD&T
Build model in RD&T with
measures
Run simulation in
RD&T
Select interesting
car(s)
Export chosen car(s)
Load new model in
ADAMS/Car
Run simulation in ADAMS/Car
38
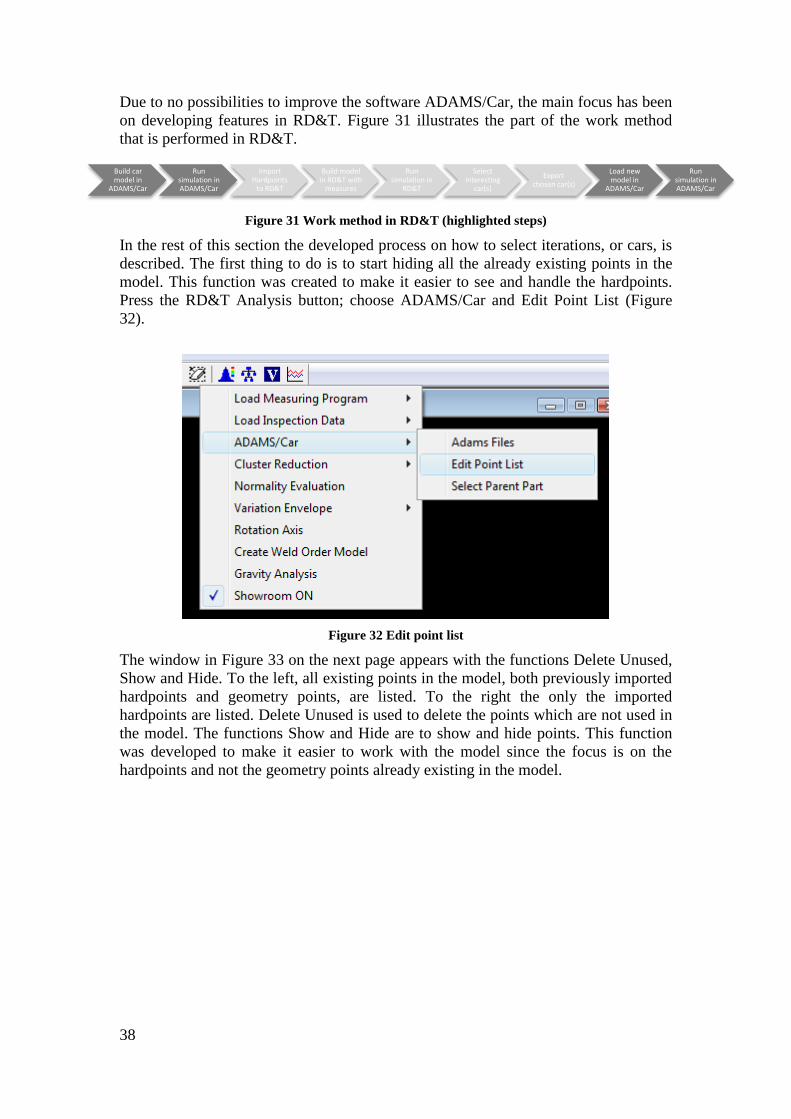
Due to no possibilities to improve the software ADAMS/Car, the main focus has been
on developing features in RD&T. Figure 31 illustrates the part of the work method
that is performed in RD&T.
Figure 31 Work method in RD&T (highlighted steps)
In the rest of this section the developed process on how to select iterations, or cars, is
described. The first thing to do is to start hiding all the already existing points in the
model. This function was created to make it easier to see and handle the hardpoints.
Press the RD&T Analysis button; choose ADAMS/Car and Edit Point List (Figure
32).
Figure 32 Edit point list
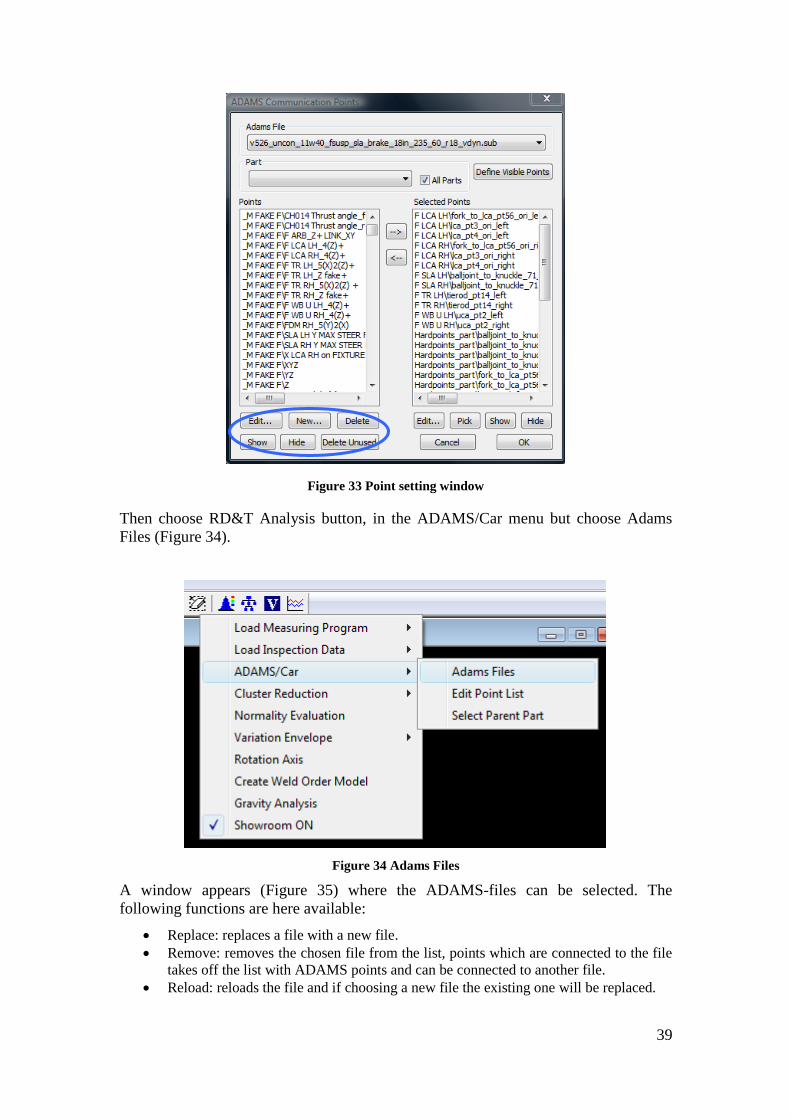
The window in Figure 33 on the next page appears with the functions Delete Unused,
Show and Hide. To the left, all existing points in the model, both previously imported
hardpoints and geometry points, are listed. To the right the only the imported
hardpoints are listed. Delete Unused is used to delete the points which are not used in
the model. The functions Show and Hide are to show and hide points. This function
was developed to make it easier to work with the model since the focus is on the
hardpoints and not the geometry points already existing in the model.
Build car model in
ADAMS/Car
Run simulation in ADAMS/Car
Import Hardpoints
to RD&T
Build model in RD&T with
measures
Run simulation in
RD&T
Select interesting
car(s)
Export chosen car(s)
Load new model in
ADAMS/Car
Run simulation in ADAMS/Car
39
Then choose RD&T Analysis button, in the ADAMS/Car menu but choose Adams
Files (Figure 34).
Figure 34 Adams Files
A window appears (Figure 35) where the ADAMS-files can be selected. The
following functions are here available:
Replace: replaces a file with a new file.
Remove: removes the chosen file from the list, points which are connected to the file
takes off the list with ADAMS points and can be connected to another file.
Reload: reloads the file and if choosing a new file the existing one will be replaced.
Figure 33 Point setting window
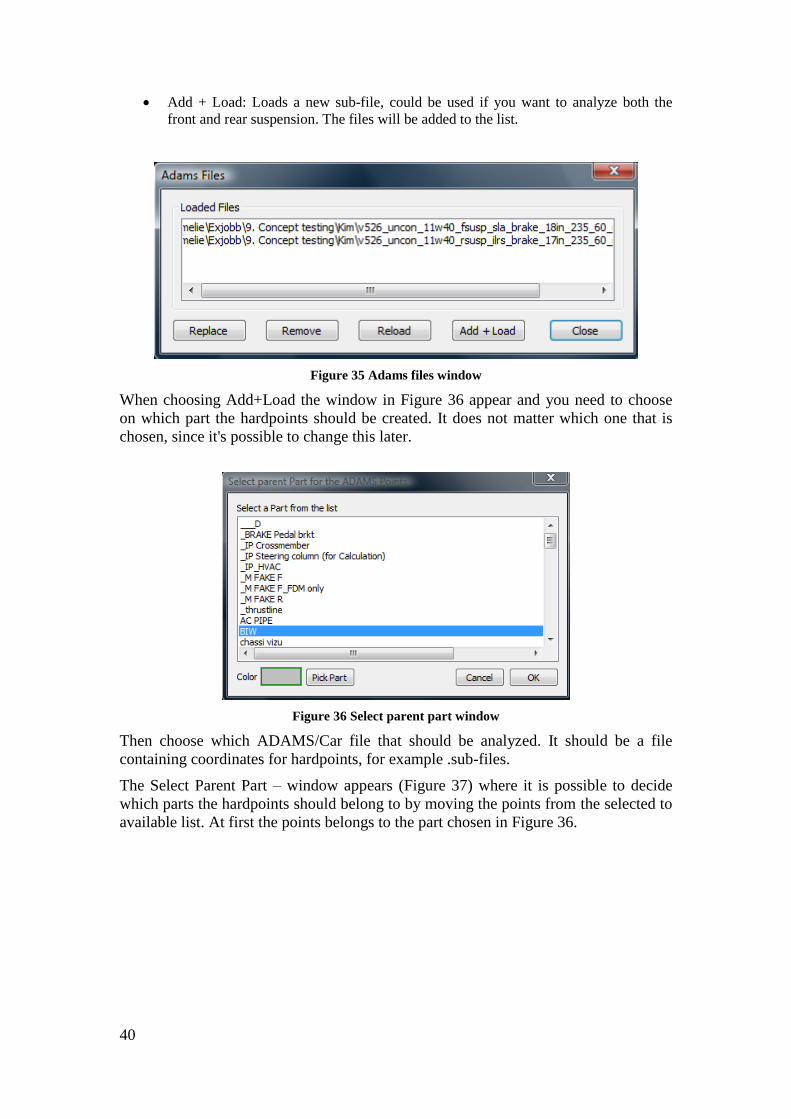
40
Add + Load: Loads a new sub-file, could be used if you want to analyze both the
front and rear suspension. The files will be added to the list.
Figure 35 Adams files window
When choosing Add+Load the window in Figure 36 appear and you need to choose
on which part the hardpoints should be created. It does not matter which one that is
chosen, since it's possible to change this later.
Figure 36 Select parent part window
Then choose which ADAMS/Car file that should be analyzed. It should be a file
containing coordinates for hardpoints, for example .sub-files.
The Select Parent Part – window appears (Figure 37) where it is possible to decide
which parts the hardpoints should belong to by moving the points from the selected to
available list. At first the points belongs to the part chosen in Figure 36.
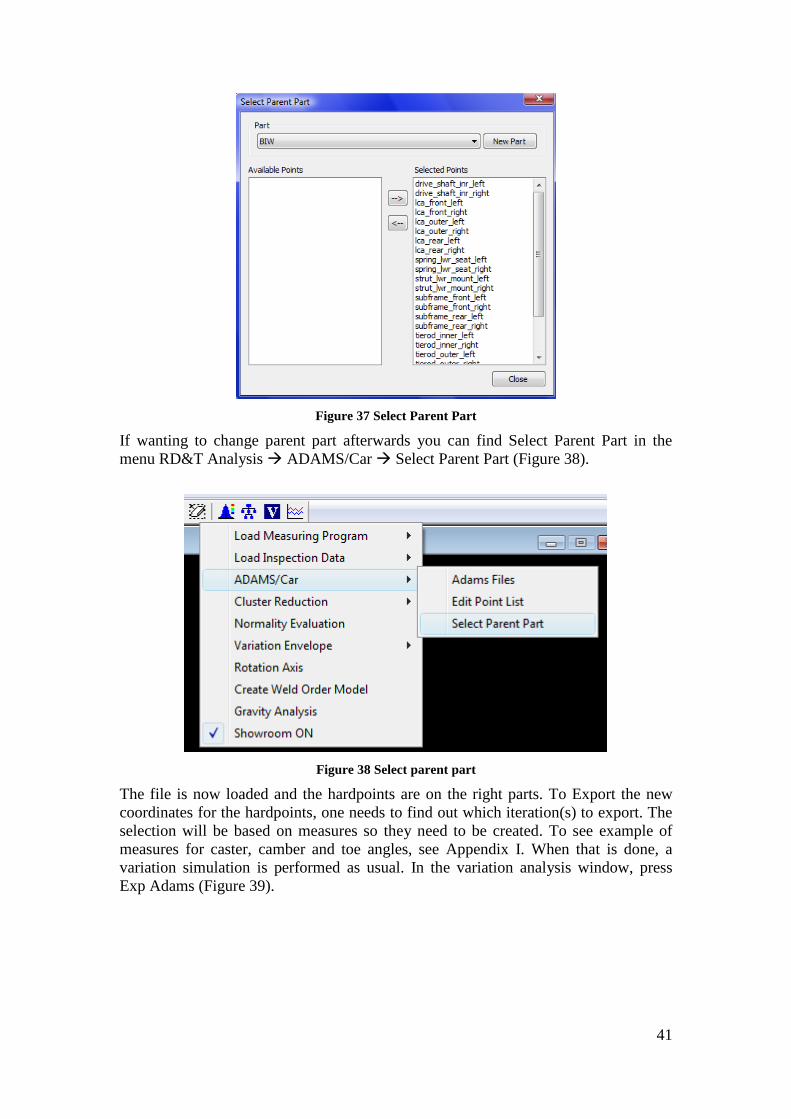
41
Figure 37 Select Parent Part
If wanting to change parent part afterwards you can find Select Parent Part in the
menu RD&T Analysis ADAMS/Car Select Parent Part (Figure 38).
Figure 38 Select parent part
The file is now loaded and the hardpoints are on the right parts. To Export the new
coordinates for the hardpoints, one needs to find out which iteration(s) to export. The
selection will be based on measures so they need to be created. To see example of
measures for caster, camber and toe angles, see Appendix I. When that is done, a
variation simulation is performed as usual. In the variation analysis window, press
Exp Adams (Figure 39).
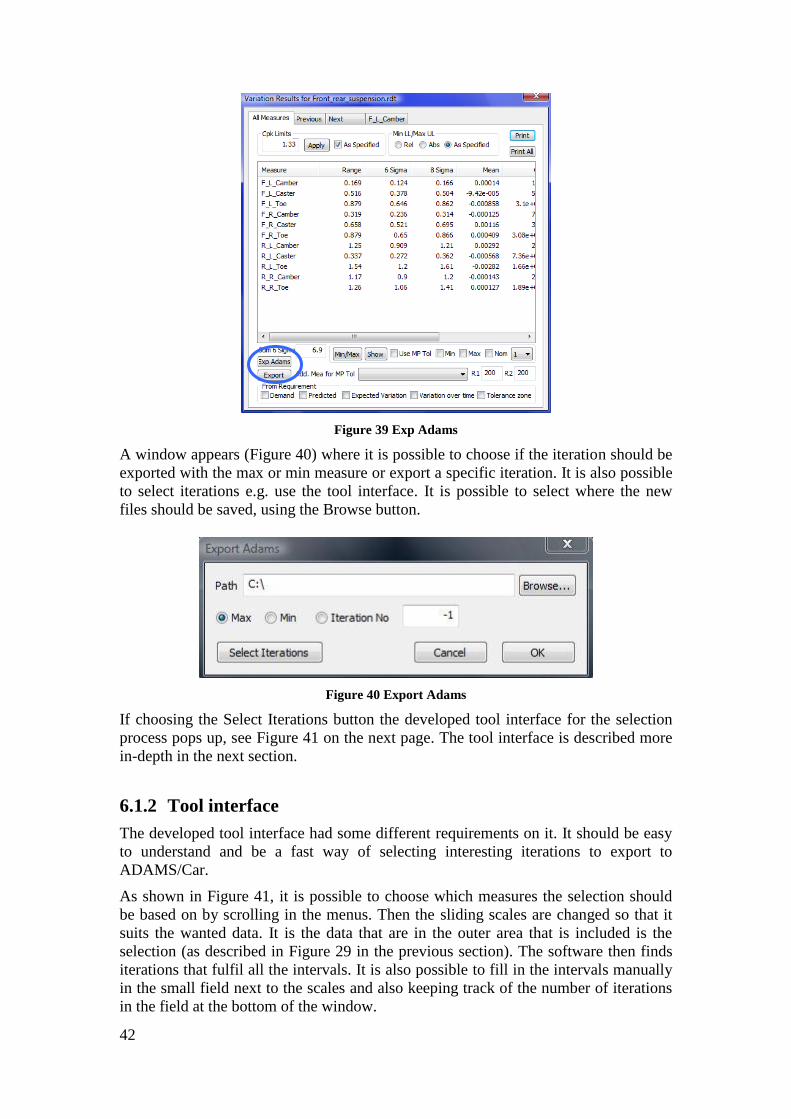
42
Figure 39 Exp Adams
A window appears (Figure 40) where it is possible to choose if the iteration should be
exported with the max or min measure or export a specific iteration. It is also possible
to select iterations e.g. use the tool interface. It is possible to select where the new
files should be saved, using the Browse button.
Figure 40 Export Adams
If choosing the Select Iterations button the developed tool interface for the selection
process pops up, see Figure 41 on the next page. The tool interface is described more
in-depth in the next section.
6.1.2 Tool interface
The developed tool interface had some different requirements on it. It should be easy
to understand and be a fast way of selecting interesting iterations to export to
ADAMS/Car.
As shown in Figure 41, it is possible to choose which measures the selection should
be based on by scrolling in the menus. Then the sliding scales are changed so that it
suits the wanted data. It is the data that are in the outer area that is included is the
selection (as described in Figure 29 in the previous section). The software then finds
iterations that fulfil all the intervals. It is also possible to fill in the intervals manually
in the small field next to the scales and also keeping track of the number of iterations
in the field at the bottom of the window.
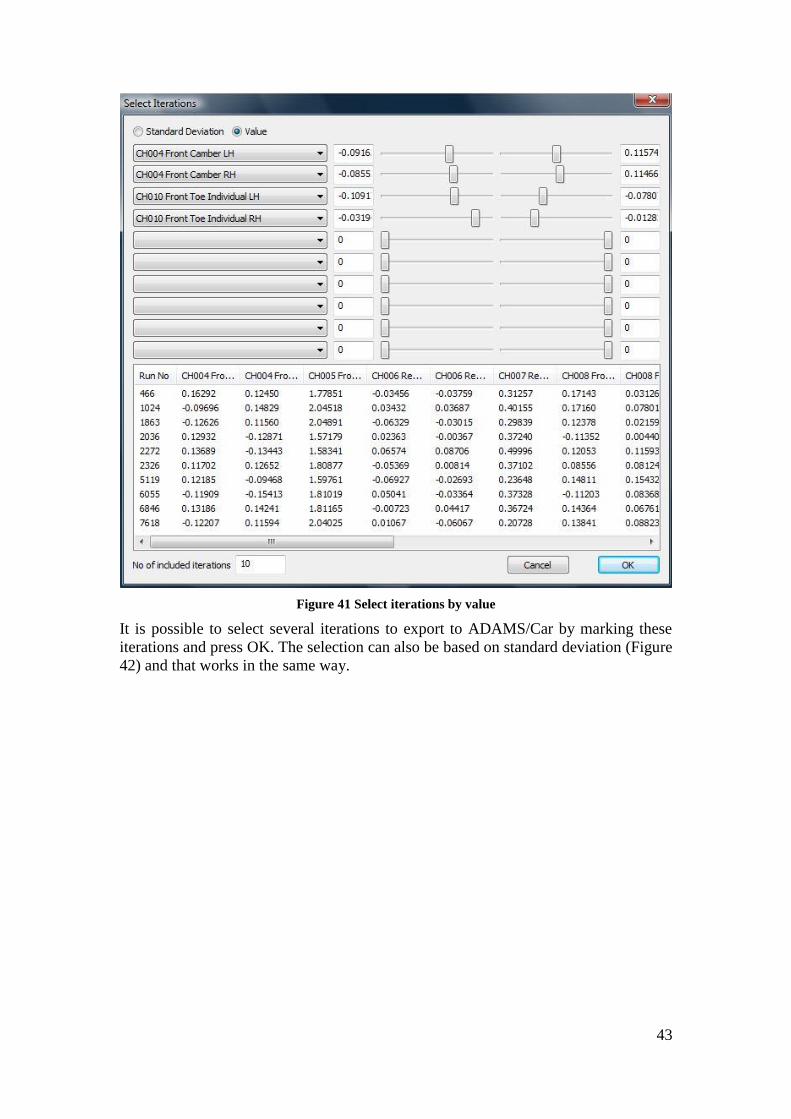
43
Figure 41 Select iterations by value
It is possible to select several iterations to export to ADAMS/Car by marking these
iterations and press OK. The selection can also be based on standard deviation (Figure
42) and that works in the same way.
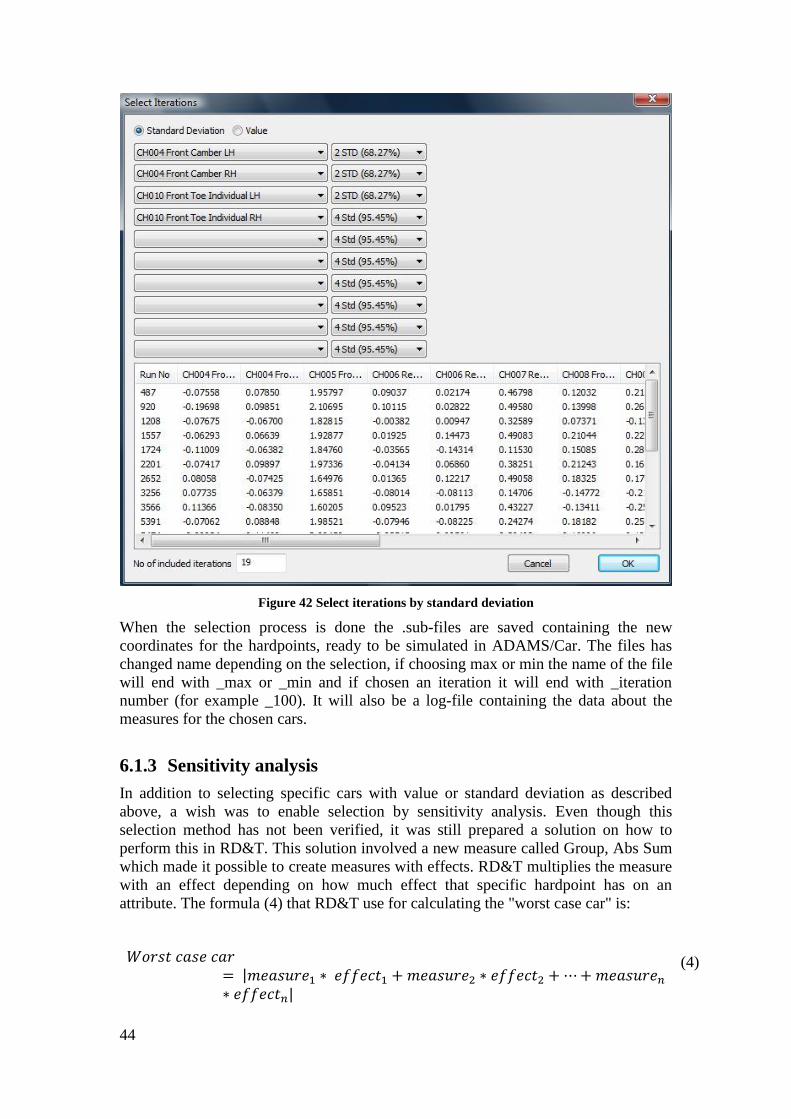
44
Figure 42 Select iterations by standard deviation
When the selection process is done the .sub-files are saved containing the new
coordinates for the hardpoints, ready to be simulated in ADAMS/Car. The files has
changed name depending on the selection, if choosing max or min the name of the file
will end with _max or _min and if chosen an iteration it will end with _iteration
number (for example _100). It will also be a log-file containing the data about the
measures for the chosen cars.
6.1.3 Sensitivity analysis
In addition to selecting specific cars with value or standard deviation as described
above, a wish was to enable selection by sensitivity analysis. Even though this
selection method has not been verified, it was still prepared a solution on how to
perform this in RD&T. This solution involved a new measure called Group, Abs Sum
which made it possible to create measures with effects. RD&T multiplies the measure
with an effect depending on how much effect that specific hardpoint has on an
attribute. The formula (4) that RD&T use for calculating the "worst case car" is:
(4)
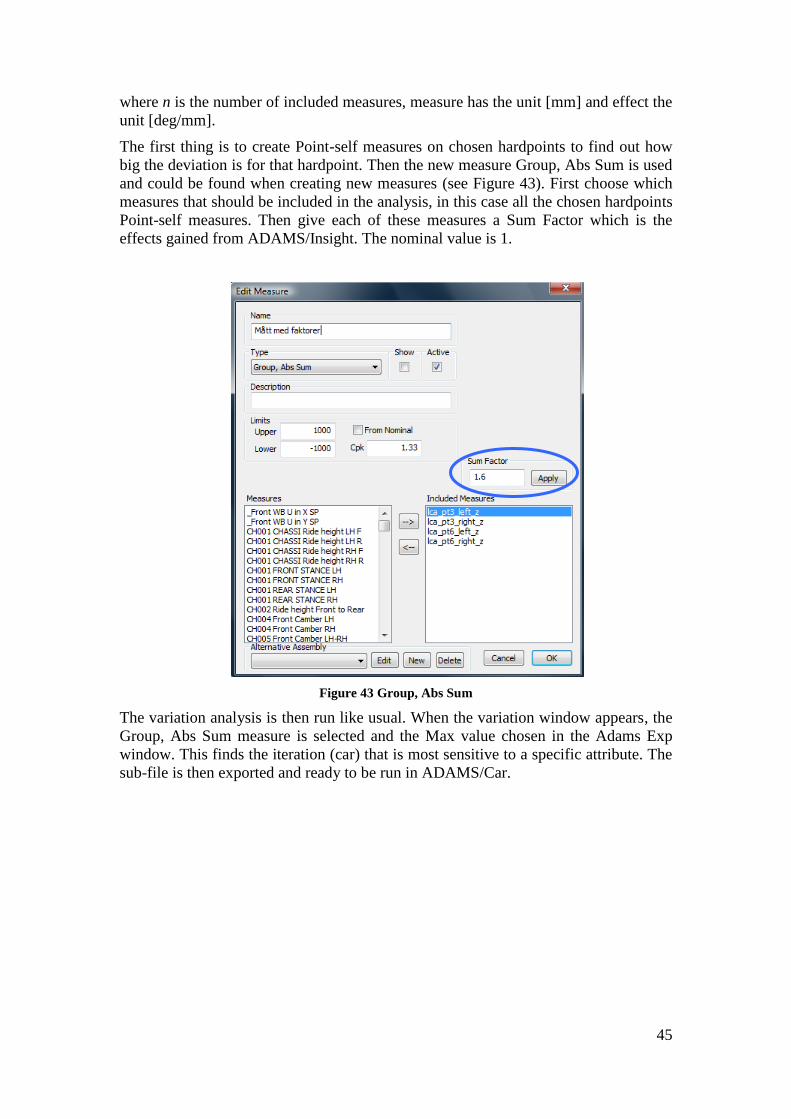
45
where n is the number of included measures, measure has the unit [mm] and effect the
unit [deg/mm].
The first thing is to create Point-self measures on chosen hardpoints to find out how
big the deviation is for that hardpoint. Then the new measure Group, Abs Sum is used
and could be found when creating new measures (see Figure 43). First choose which
measures that should be included in the analysis, in this case all the chosen hardpoints
Point-self measures. Then give each of these measures a Sum Factor which is the
effects gained from ADAMS/Insight. The nominal value is 1.
Figure 43 Group, Abs Sum
The variation analysis is then run like usual. When the variation window appears, the
Group, Abs Sum measure is selected and the Max value chosen in the Adams Exp
window. This finds the iteration (car) that is most sensitive to a specific attribute. The
sub-file is then exported and ready to be run in ADAMS/Car.

46
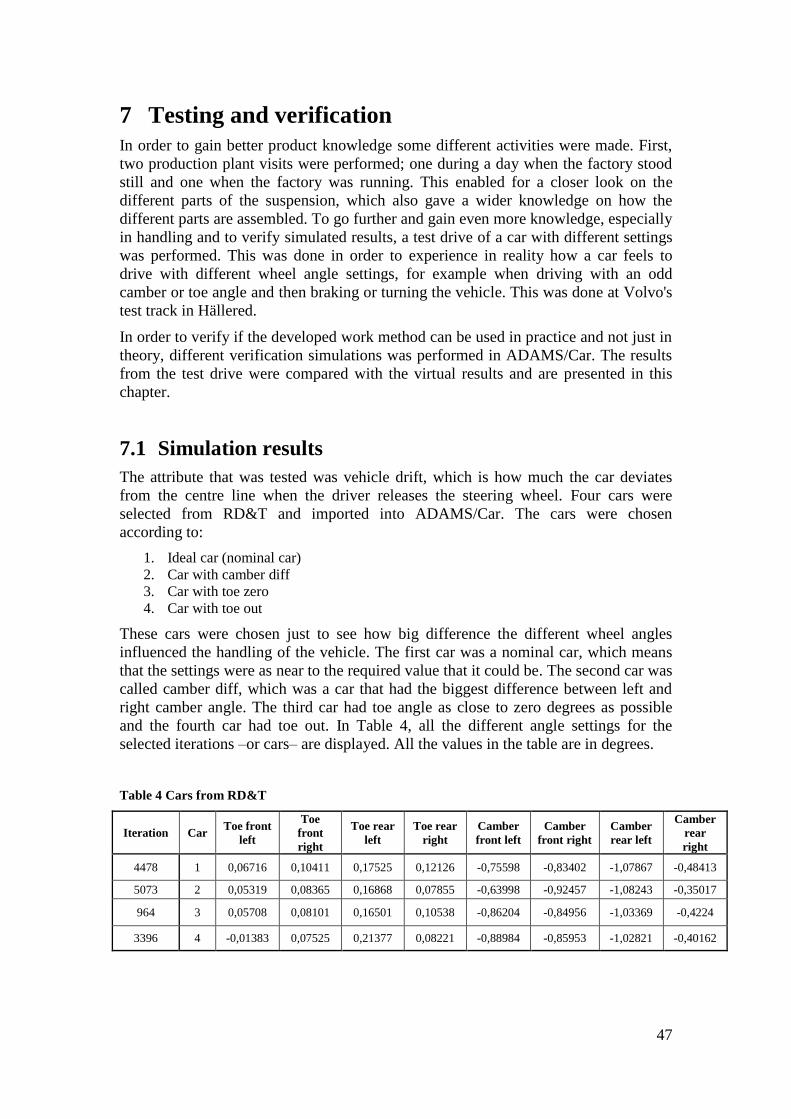
47
7 Testing and verification
In order to gain better product knowledge some different activities were made. First,
two production plant visits were performed; one during a day when the factory stood
still and one when the factory was running. This enabled for a closer look on the
different parts of the suspension, which also gave a wider knowledge on how the
different parts are assembled. To go further and gain even more knowledge, especially
in handling and to verify simulated results, a test drive of a car with different settings
was performed. This was done in order to experience in reality how a car feels to
drive with different wheel angle settings, for example when driving with an odd
camber or toe angle and then braking or turning the vehicle. This was done at Volvo's
test track in Hällered.
In order to verify if the developed work method can be used in practice and not just in
theory, different verification simulations was performed in ADAMS/Car. The results
from the test drive were compared with the virtual results and are presented in this
chapter.
7.1 Simulation results
The attribute that was tested was vehicle drift, which is how much the car deviates
from the centre line when the driver releases the steering wheel. Four cars were
selected from RD&T and imported into ADAMS/Car. The cars were chosen
according to:
1. Ideal car (nominal car)
2. Car with camber diff
3. Car with toe zero
4. Car with toe out
These cars were chosen just to see how big difference the different wheel angles
influenced the handling of the vehicle. The first car was a nominal car, which means
that the settings were as near to the required value that it could be. The second car was
called camber diff, which was a car that had the biggest difference between left and
right camber angle. The third car had toe angle as close to zero degrees as possible
and the fourth car had toe out. In Table 4, all the different angle settings for the
selected iterations –or cars– are displayed. All the values in the table are in degrees.
Table 4 Cars from RD&T
Iteration Car Toe front
left
Toe
front
right
Toe rear
left
Toe rear
right
Camber
front left
Camber
front right
Camber
rear left
Camber
rear
right
4478 1 0,06716 0,10411 0,17525 0,12126 -0,75598 -0,83402 -1,07867 -0,48413
5073 2 0,05319 0,08365 0,16868 0,07855 -0,63998 -0,92457 -1,08243 -0,35017
964 3 0,05708 0,08101 0,16501 0,10538 -0,86204 -0,84956 -1,03369 -0,4224
3396 4 -0,01383 0,07525 0,21377 0,08221 -0,88984 -0,85953 -1,02821 -0,40162
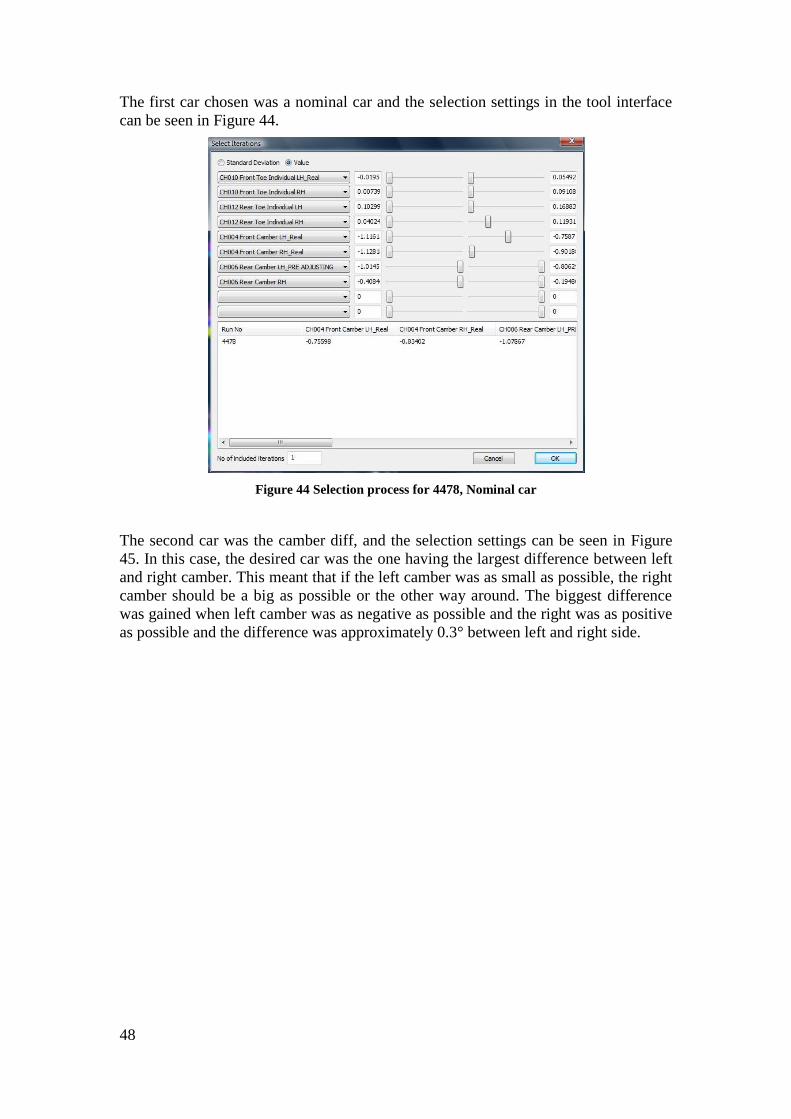
48
The first car chosen was a nominal car and the selection settings in the tool interface
can be seen in Figure 44.
Figure 44 Selection process for 4478, Nominal car
The second car was the camber diff, and the selection settings can be seen in Figure
45. In this case, the desired car was the one having the largest difference between left
and right camber. This meant that if the left camber was as small as possible, the right
camber should be a big as possible or the other way around. The biggest difference
was gained when left camber was as negative as possible and the right was as positive
as possible and the difference was approximately 0.3° between left and right side.
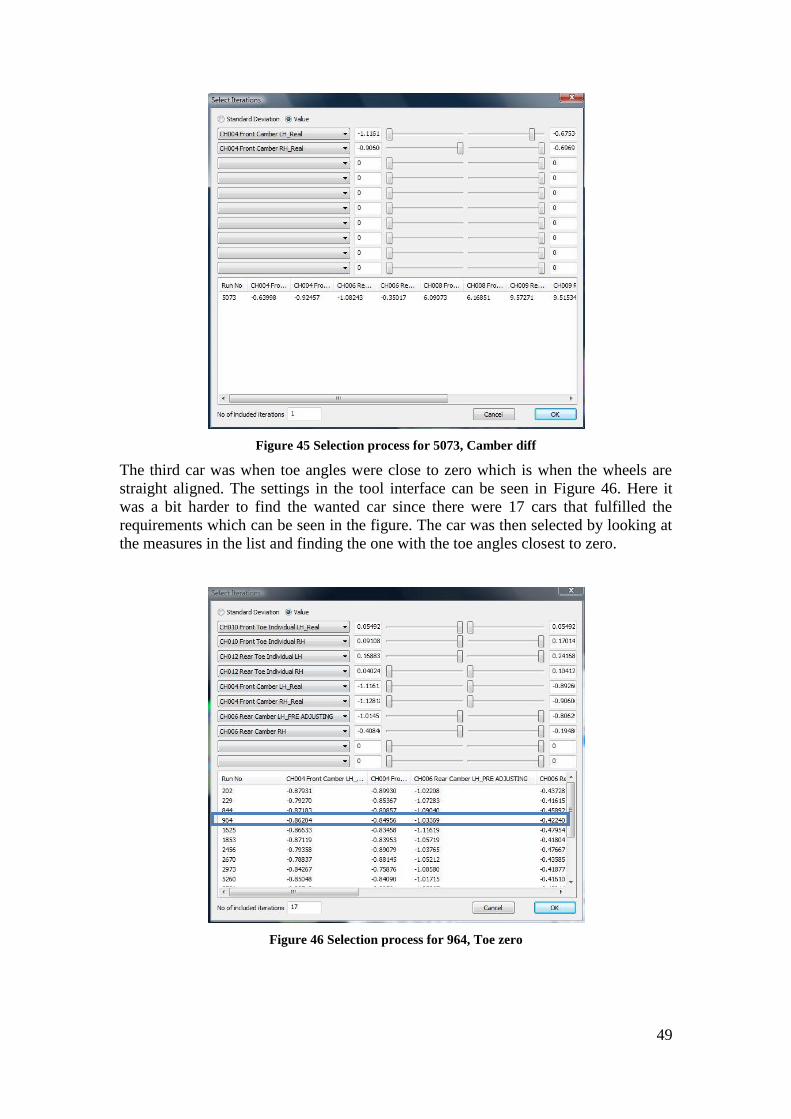
49
Figure 45 Selection process for 5073, Camber diff
The third car was when toe angles were close to zero which is when the wheels are
straight aligned. The settings in the tool interface can be seen in Figure 46. Here it
was a bit harder to find the wanted car since there were 17 cars that fulfilled the
requirements which can be seen in the figure. The car was then selected by looking at
the measures in the list and finding the one with the toe angles closest to zero.
Figure 46 Selection process for 964, Toe zero
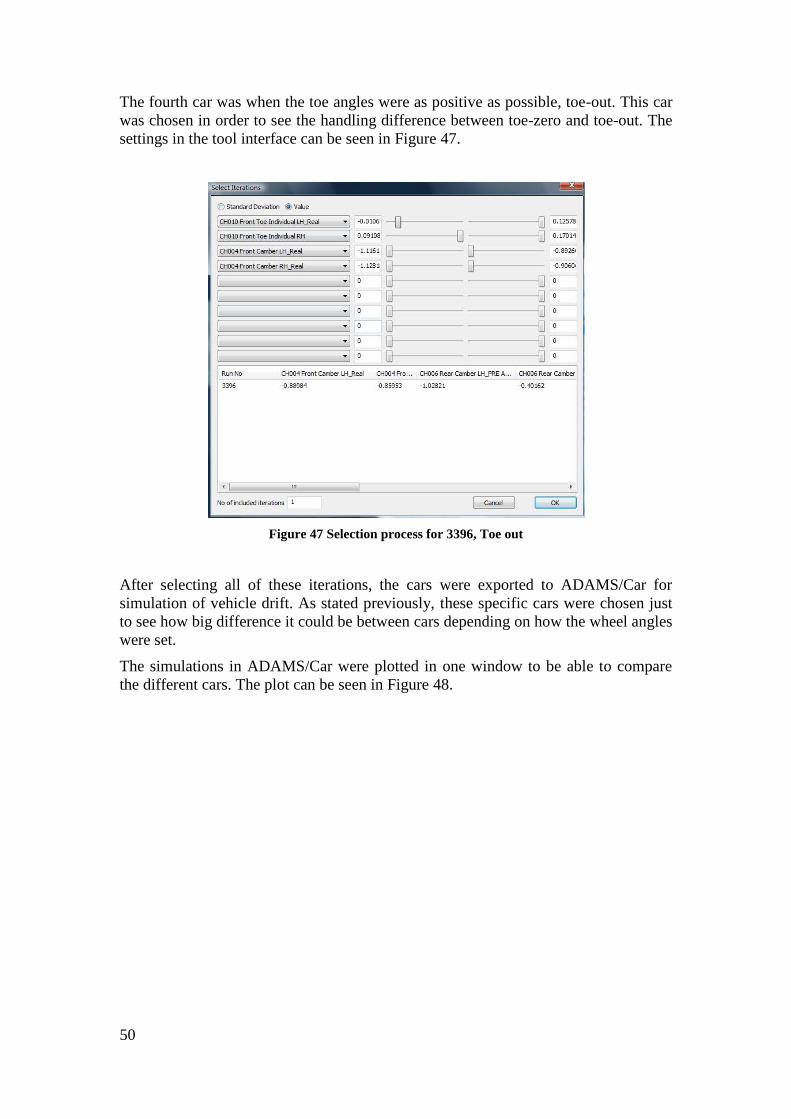
50
The fourth car was when the toe angles were as positive as possible, toe-out. This car
was chosen in order to see the handling difference between toe-zero and toe-out. The
settings in the tool interface can be seen in Figure 47.
Figure 47 Selection process for 3396, Toe out
After selecting all of these iterations, the cars were exported to ADAMS/Car for
simulation of vehicle drift. As stated previously, these specific cars were chosen just
to see how big difference it could be between cars depending on how the wheel angles
were set.
The simulations in ADAMS/Car were plotted in one window to be able to compare
the different cars. The plot can be seen in Figure 48.
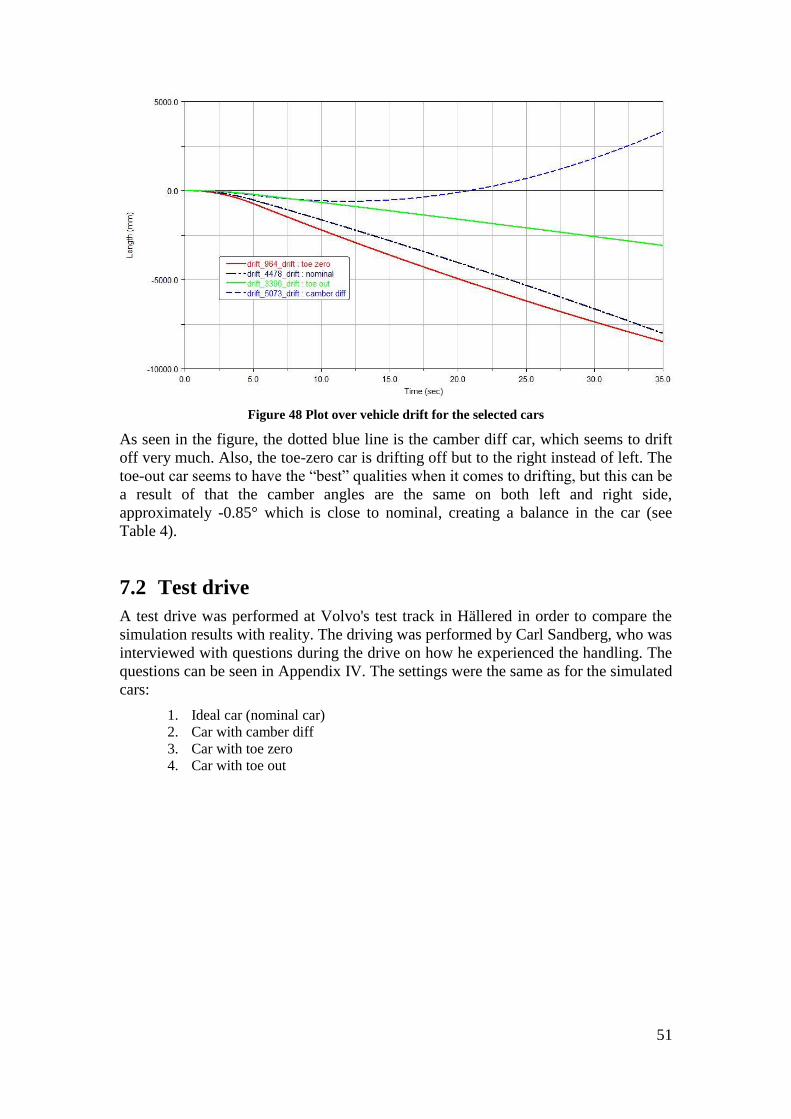
51
Figure 48 Plot over vehicle drift for the selected cars
As seen in the figure, the dotted blue line is the camber diff car, which seems to drift
off very much. Also, the toe-zero car is drifting off but to the right instead of left. The
toe-out car seems to have the “best” qualities when it comes to drifting, but this can be
a result of that the camber angles are the same on both left and right side,
approximately -0.85° which is close to nominal, creating a balance in the car (see
Table 4).
7.2 Test drive
A test drive was performed at Volvo's test track in Hällered in order to compare the
simulation results with reality. The driving was performed by Carl Sandberg, who was
interviewed with questions during the drive on how he experienced the handling. The
questions can be seen in Appendix IV. The settings were the same as for the simulated
cars:
1. Ideal car (nominal car)
2. Car with camber diff
3. Car with toe zero
4. Car with toe out
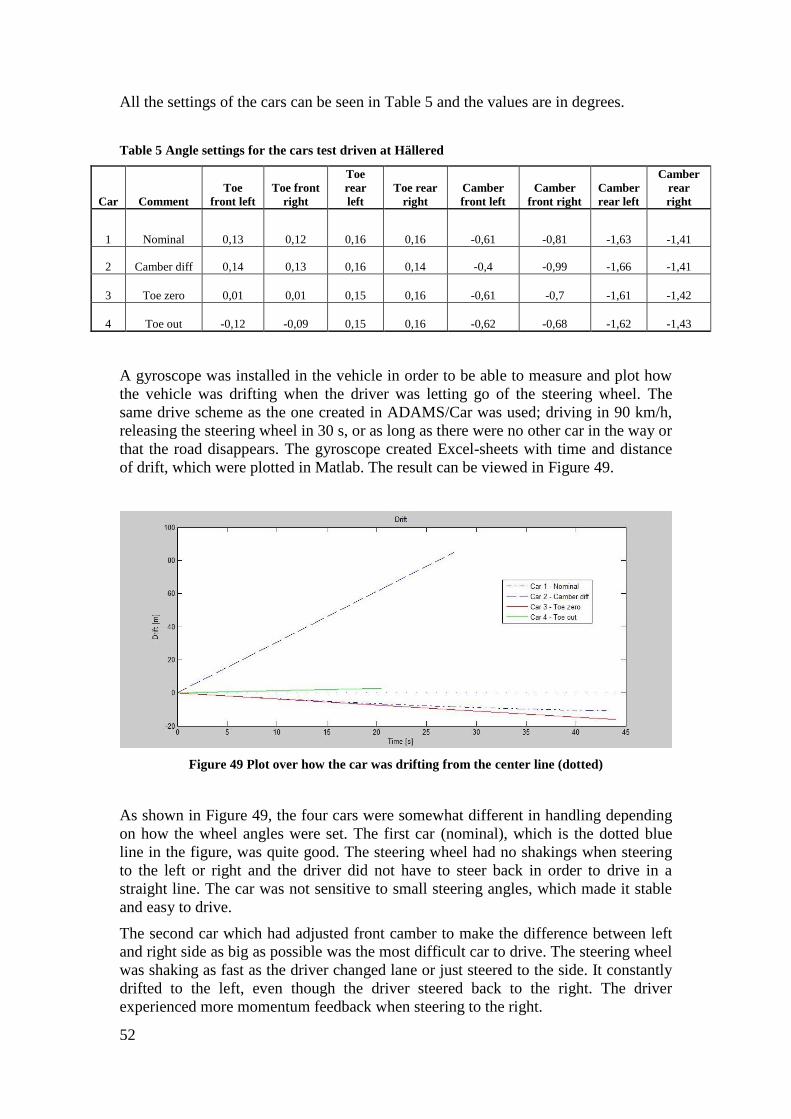
52
All the settings of the cars can be seen in Table 5 and the values are in degrees.
Table 5 Angle settings for the cars test driven at Hällered
Car Comment
Toe
front left
Toe front
right
Toe
rear
left
Toe rear
right
Camber
front left
Camber
front right
Camber
rear left
Camber
rear
right
1 Nominal 0,13 0,12 0,16 0,16 -0,61 -0,81 -1,63 -1,41
2 Camber diff 0,14 0,13 0,16 0,14 -0,4 -0,99 -1,66 -1,41
3 Toe zero 0,01 0,01 0,15 0,16 -0,61 -0,7 -1,61 -1,42
4 Toe out -0,12 -0,09 0,15 0,16 -0,62 -0,68 -1,62 -1,43
A gyroscope was installed in the vehicle in order to be able to measure and plot how
the vehicle was drifting when the driver was letting go of the steering wheel. The
same drive scheme as the one created in ADAMS/Car was used; driving in 90 km/h,
releasing the steering wheel in 30 s, or as long as there were no other car in the way or
that the road disappears. The gyroscope created Excel-sheets with time and distance
of drift, which were plotted in Matlab. The result can be viewed in Figure 49.
Figure 49 Plot over how the car was drifting from the center line (dotted)
As shown in Figure 49, the four cars were somewhat different in handling depending
on how the wheel angles were set. The first car (nominal), which is the dotted blue
line in the figure, was quite good. The steering wheel had no shakings when steering
to the left or right and the driver did not have to steer back in order to drive in a
straight line. The car was not sensitive to small steering angles, which made it stable
and easy to drive.
The second car which had adjusted front camber to make the difference between left
and right side as big as possible was the most difficult car to drive. The steering wheel
was shaking as fast as the driver changed lane or just steered to the side. It constantly
drifted to the left, even though the driver steered back to the right. The driver
experienced more momentum feedback when steering to the right.
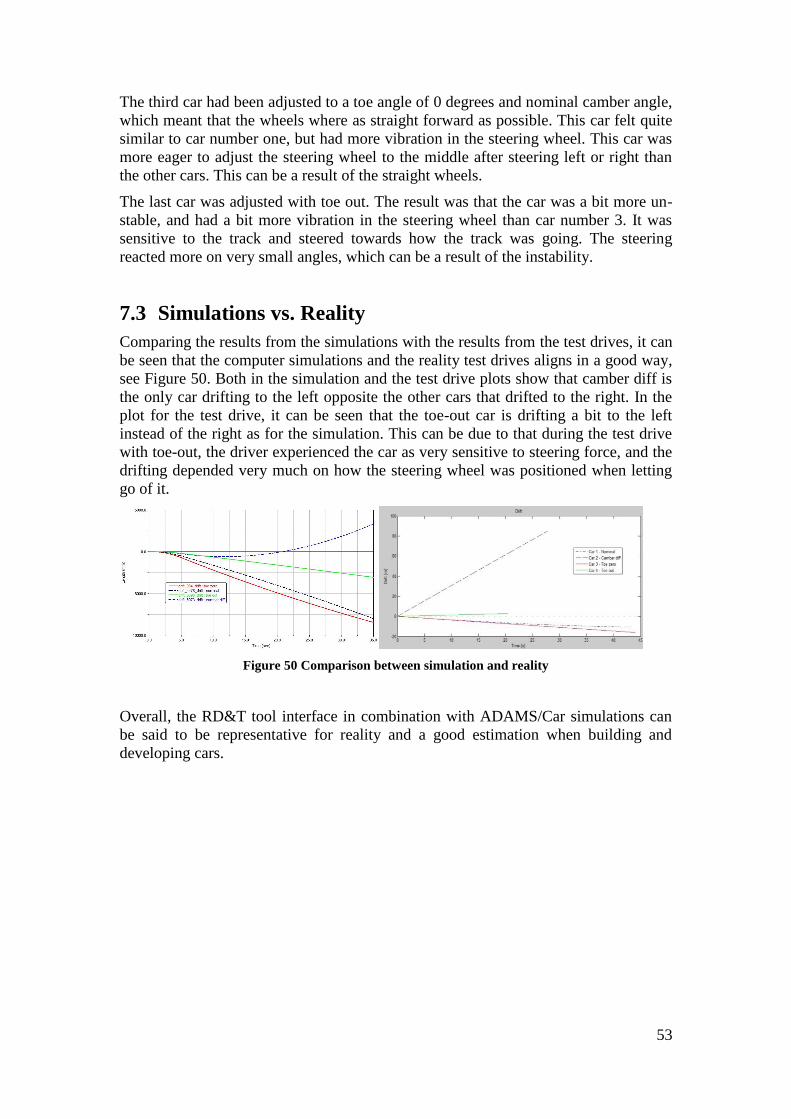
53
The third car had been adjusted to a toe angle of 0 degrees and nominal camber angle,
which meant that the wheels where as straight forward as possible. This car felt quite
similar to car number one, but had more vibration in the steering wheel. This car was
more eager to adjust the steering wheel to the middle after steering left or right than
the other cars. This can be a result of the straight wheels.
The last car was adjusted with toe out. The result was that the car was a bit more un-
stable, and had a bit more vibration in the steering wheel than car number 3. It was
sensitive to the track and steered towards how the track was going. The steering
reacted more on very small angles, which can be a result of the instability.
7.3 Simulations vs. Reality
Comparing the results from the simulations with the results from the test drives, it can
be seen that the computer simulations and the reality test drives aligns in a good way,
see Figure 50. Both in the simulation and the test drive plots show that camber diff is
the only car drifting to the left opposite the other cars that drifted to the right. In the
plot for the test drive, it can be seen that the toe-out car is drifting a bit to the left
instead of the right as for the simulation. This can be due to that during the test drive
with toe-out, the driver experienced the car as very sensitive to steering force, and the
drifting depended very much on how the steering wheel was positioned when letting
go of it.
Figure 50 Comparison between simulation and reality
Overall, the RD&T tool interface in combination with ADAMS/Car simulations can
be said to be representative for reality and a good estimation when building and
developing cars.

54
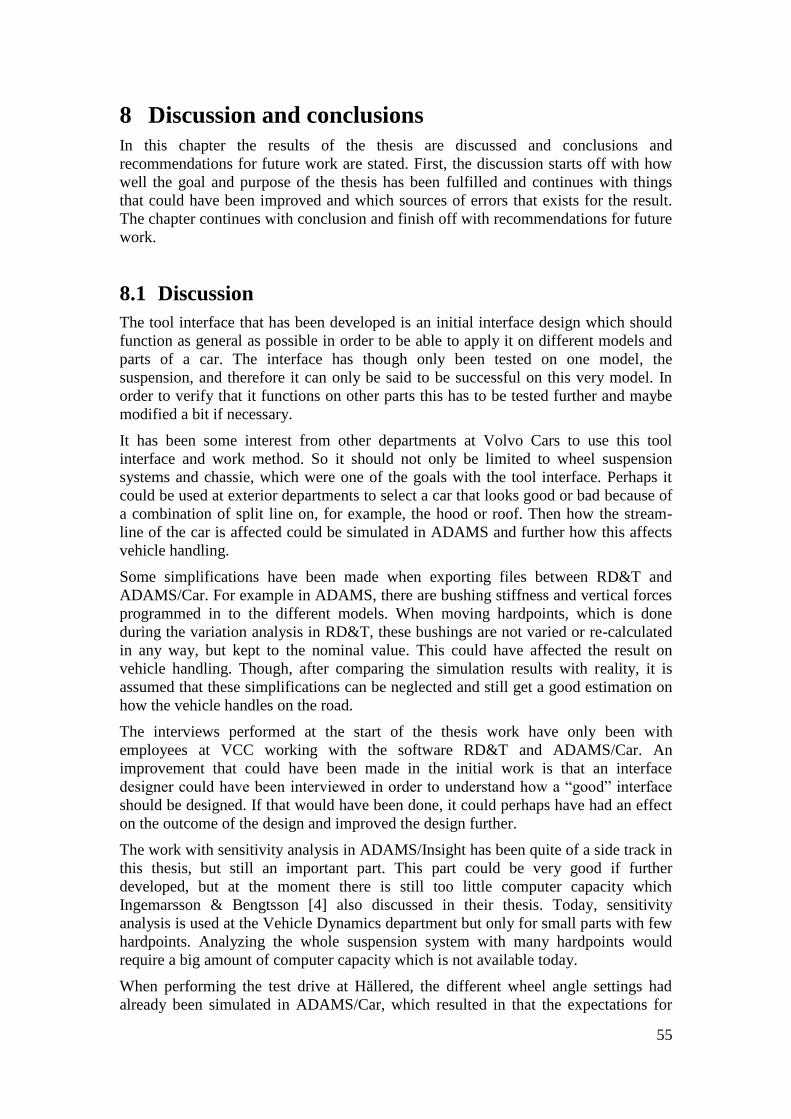
55
8 Discussion and conclusions
In this chapter the results of the thesis are discussed and conclusions and
recommendations for future work are stated. First, the discussion starts off with how
well the goal and purpose of the thesis has been fulfilled and continues with things
that could have been improved and which sources of errors that exists for the result.
The chapter continues with conclusion and finish off with recommendations for future
work.
8.1 Discussion
The tool interface that has been developed is an initial interface design which should
function as general as possible in order to be able to apply it on different models and
parts of a car. The interface has though only been tested on one model, the
suspension, and therefore it can only be said to be successful on this very model. In
order to verify that it functions on other parts this has to be tested further and maybe
modified a bit if necessary.
It has been some interest from other departments at Volvo Cars to use this tool
interface and work method. So it should not only be limited to wheel suspension
systems and chassie, which were one of the goals with the tool interface. Perhaps it
could be used at exterior departments to select a car that looks good or bad because of
a combination of split line on, for example, the hood or roof. Then how the stream-
line of the car is affected could be simulated in ADAMS and further how this affects
vehicle handling.
Some simplifications have been made when exporting files between RD&T and
ADAMS/Car. For example in ADAMS, there are bushing stiffness and vertical forces
programmed in to the different models. When moving hardpoints, which is done
during the variation analysis in RD&T, these bushings are not varied or re-calculated
in any way, but kept to the nominal value. This could have affected the result on
vehicle handling. Though, after comparing the simulation results with reality, it is
assumed that these simplifications can be neglected and still get a good estimation on
how the vehicle handles on the road.
The interviews performed at the start of the thesis work have only been with
employees at VCC working with the software RD&T and ADAMS/Car. An
improvement that could have been made in the initial work is that an interface
designer could have been interviewed in order to understand how a “good” interface
should be designed. If that would have been done, it could perhaps have had an effect
on the outcome of the design and improved the design further.
The work with sensitivity analysis in ADAMS/Insight has been quite of a side track in
this thesis, but still an important part. This part could be very good if further
developed, but at the moment there is still too little computer capacity which
Ingemarsson & Bengtsson [4] also discussed in their thesis. Today, sensitivity
analysis is used at the Vehicle Dynamics department but only for small parts with few
hardpoints. Analyzing the whole suspension system with many hardpoints would
require a big amount of computer capacity which is not available today.
When performing the test drive at Hällered, the different wheel angle settings had
already been simulated in ADAMS/Car, which resulted in that the expectations for
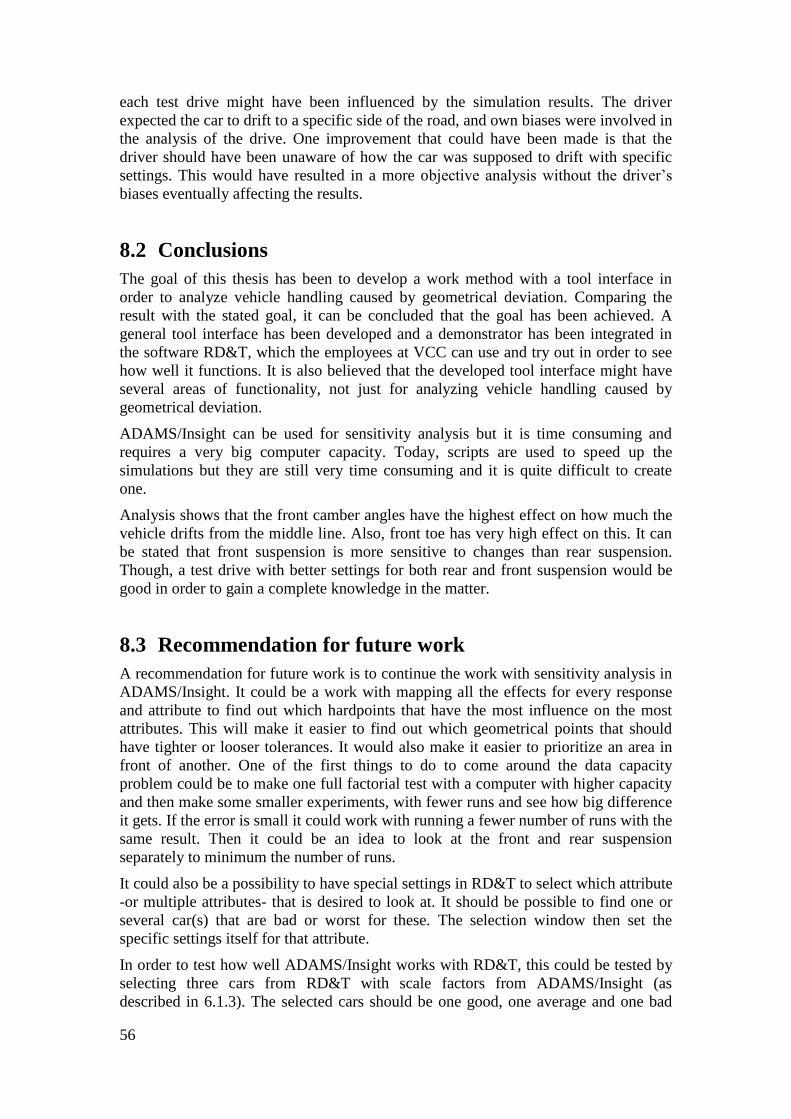
56
each test drive might have been influenced by the simulation results. The driver
expected the car to drift to a specific side of the road, and own biases were involved in
the analysis of the drive. One improvement that could have been made is that the
driver should have been unaware of how the car was supposed to drift with specific
settings. This would have resulted in a more objective analysis without the driver’s
biases eventually affecting the results.
8.2 Conclusions
The goal of this thesis has been to develop a work method with a tool interface in
order to analyze vehicle handling caused by geometrical deviation. Comparing the
result with the stated goal, it can be concluded that the goal has been achieved. A
general tool interface has been developed and a demonstrator has been integrated in
the software RD&T, which the employees at VCC can use and try out in order to see
how well it functions. It is also believed that the developed tool interface might have
several areas of functionality, not just for analyzing vehicle handling caused by
geometrical deviation.
ADAMS/Insight can be used for sensitivity analysis but it is time consuming and
requires a very big computer capacity. Today, scripts are used to speed up the
simulations but they are still very time consuming and it is quite difficult to create
one.
Analysis shows that the front camber angles have the highest effect on how much the
vehicle drifts from the middle line. Also, front toe has very high effect on this. It can
be stated that front suspension is more sensitive to changes than rear suspension.
Though, a test drive with better settings for both rear and front suspension would be
good in order to gain a complete knowledge in the matter.
8.3 Recommendation for future work
A recommendation for future work is to continue the work with sensitivity analysis in
ADAMS/Insight. It could be a work with mapping all the effects for every response
and attribute to find out which hardpoints that have the most influence on the most
attributes. This will make it easier to find out which geometrical points that should
have tighter or looser tolerances. It would also make it easier to prioritize an area in
front of another. One of the first things to do to come around the data capacity
problem could be to make one full factorial test with a computer with higher capacity
and then make some smaller experiments, with fewer runs and see how big difference
it gets. If the error is small it could work with running a fewer number of runs with the
same result. Then it could be an idea to look at the front and rear suspension
separately to minimum the number of runs.
It could also be a possibility to have special settings in RD&T to select which attribute
-or multiple attributes- that is desired to look at. It should be possible to find one or
several car(s) that are bad or worst for these. The selection window then set the
specific settings itself for that attribute.
In order to test how well ADAMS/Insight works with RD&T, this could be tested by
selecting three cars from RD&T with scale factors from ADAMS/Insight (as
described in 6.1.3). The selected cars should be one good, one average and one bad
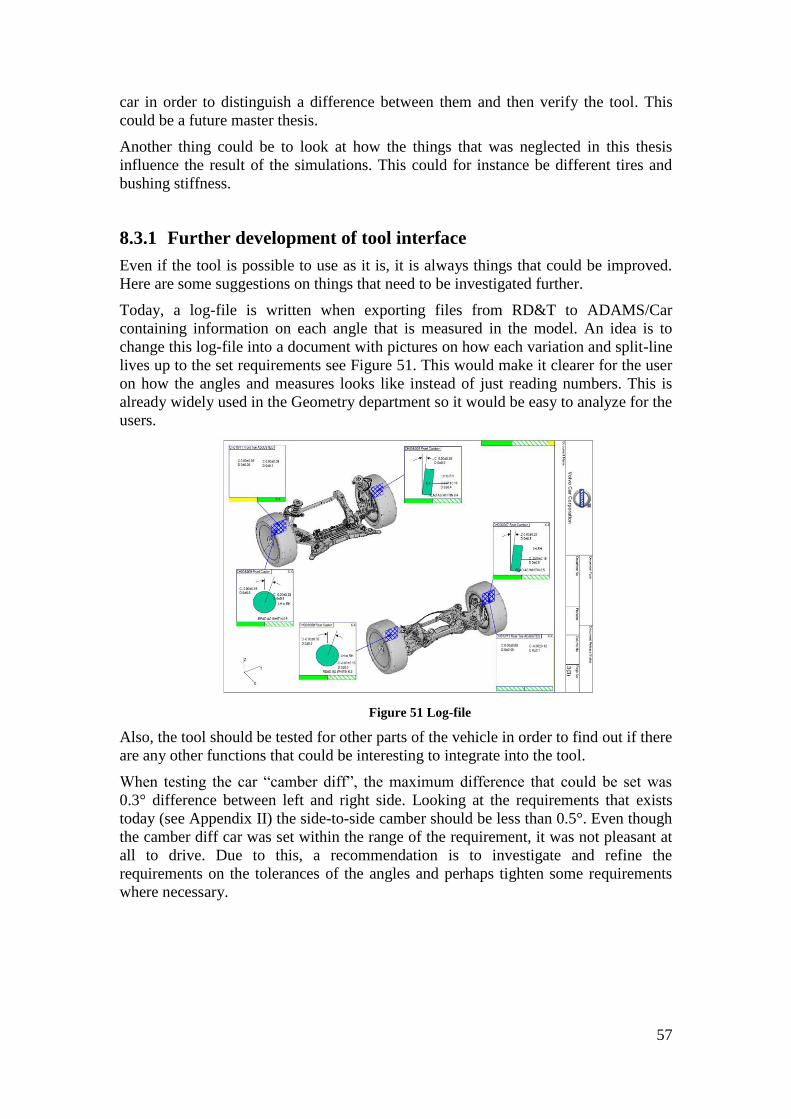
57
car in order to distinguish a difference between them and then verify the tool. This
could be a future master thesis.
Another thing could be to look at how the things that was neglected in this thesis
influence the result of the simulations. This could for instance be different tires and
bushing stiffness.
8.3.1 Further development of tool interface
Even if the tool is possible to use as it is, it is always things that could be improved.
Here are some suggestions on things that need to be investigated further.
Today, a log-file is written when exporting files from RD&T to ADAMS/Car
containing information on each angle that is measured in the model. An idea is to
change this log-file into a document with pictures on how each variation and split-line
lives up to the set requirements see Figure 51. This would make it clearer for the user
on how the angles and measures looks like instead of just reading numbers. This is
already widely used in the Geometry department so it would be easy to analyze for the
users.
Figure 51 Log-file
Also, the tool should be tested for other parts of the vehicle in order to find out if there
are any other functions that could be interesting to integrate into the tool.
When testing the car “camber diff”, the maximum difference that could be set was
0.3° difference between left and right side. Looking at the requirements that exists
today (see Appendix II) the side-to-side camber should be less than 0.5°. Even though
the camber diff car was set within the range of the requirement, it was not pleasant at
all to drive. Due to this, a recommendation is to investigate and refine the
requirements on the tolerances of the angles and perhaps tighten some requirements
where necessary.

58
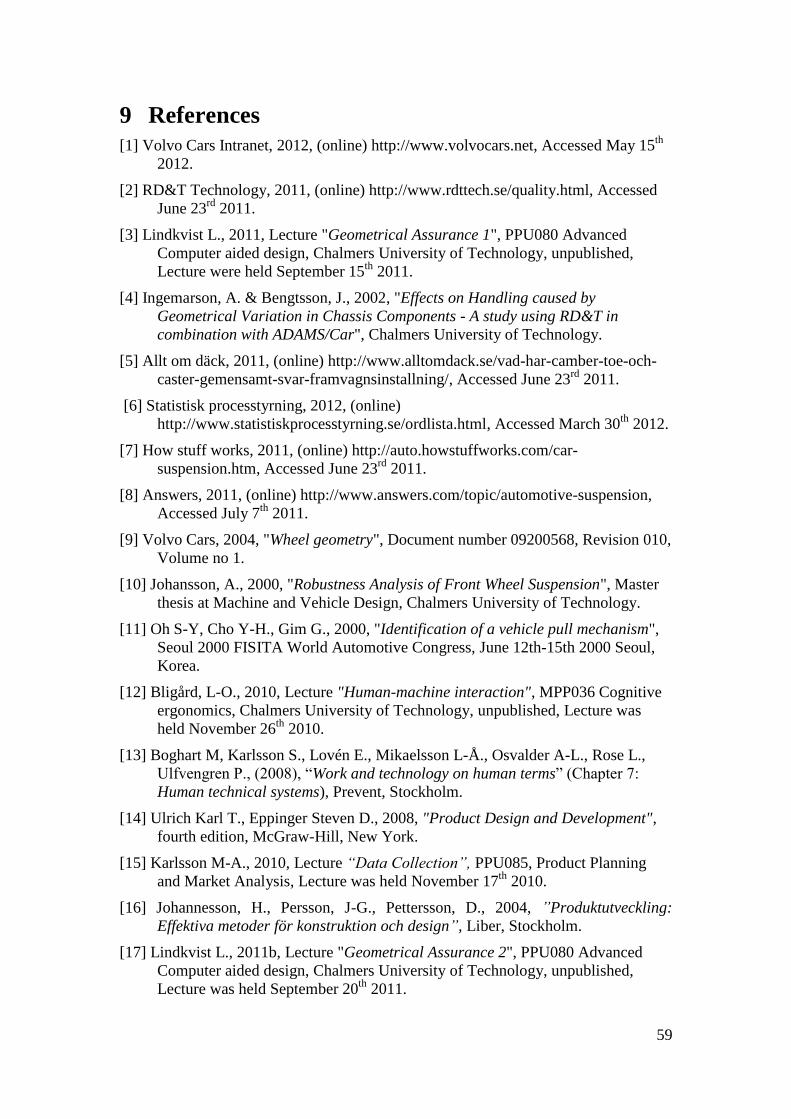
59
9 References
[1] Volvo Cars Intranet, 2012, (online) http://www.volvocars.net, Accessed May 15th
2012.
[2] RD&T Technology, 2011, (online) http://www.rdttech.se/quality.html, Accessed
June 23rd
2011.
[3] Lindkvist L., 2011, Lecture "Geometrical Assurance 1", PPU080 Advanced
Computer aided design, Chalmers University of Technology, unpublished,
Lecture were held September 15th
2011.
[4] Ingemarson, A. & Bengtsson, J., 2002, "Effects on Handling caused by
Geometrical Variation in Chassis Components - A study using RD&T in
combination with ADAMS/Car", Chalmers University of Technology.
[5] Allt om däck, 2011, (online) http://www.alltomdack.se/vad-har-camber-toe-och-
caster-gemensamt-svar-framvagnsinstallning/, Accessed June 23rd
2011.
[6] Statistisk processtyrning, 2012, (online)
http://www.statistiskprocesstyrning.se/ordlista.html, Accessed March 30th
2012.
[7] How stuff works, 2011, (online) http://auto.howstuffworks.com/car-
suspension.htm, Accessed June 23rd
2011.
[8] Answers, 2011, (online) http://www.answers.com/topic/automotive-suspension,
Accessed July 7th
2011.
[9] Volvo Cars, 2004, "Wheel geometry", Document number 09200568, Revision 010,
Volume no 1.
[10] Johansson, A., 2000, "Robustness Analysis of Front Wheel Suspension", Master
thesis at Machine and Vehicle Design, Chalmers University of Technology.
[11] Oh S-Y, Cho Y-H., Gim G., 2000, "Identification of a vehicle pull mechanism",
Seoul 2000 FISITA World Automotive Congress, June 12th-15th 2000 Seoul,
Korea.
[12] Bligård, L-O., 2010, Lecture "Human-machine interaction", MPP036 Cognitive
ergonomics, Chalmers University of Technology, unpublished, Lecture was
held November 26th
2010.
[13] Boghart M, Karlsson S., Lovén E., Mikaelsson L-Å., Osvalder A-L., Rose L.,
Ulfvengren P., (2008), “Work and technology on human terms” (Chapter 7:
Human technical systems), Prevent, Stockholm.
[14] Ulrich Karl T., Eppinger Steven D., 2008, "Product Design and Development",
fourth edition, McGraw-Hill, New York.
[15] Karlsson M-A., 2010, Lecture “Data Collection”, PPU085, Product Planning
and Market Analysis, Lecture was held November 17th
2010.
[16] Johannesson, H., Persson, J-G., Pettersson, D., 2004, ”Produktutveckling:
Effektiva metoder för konstruktion och design”, Liber, Stockholm.
[17] Lindkvist L., 2011b, Lecture "Geometrical Assurance 2", PPU080 Advanced
Computer aided design, Chalmers University of Technology, unpublished,
Lecture was held September 20th
2011.
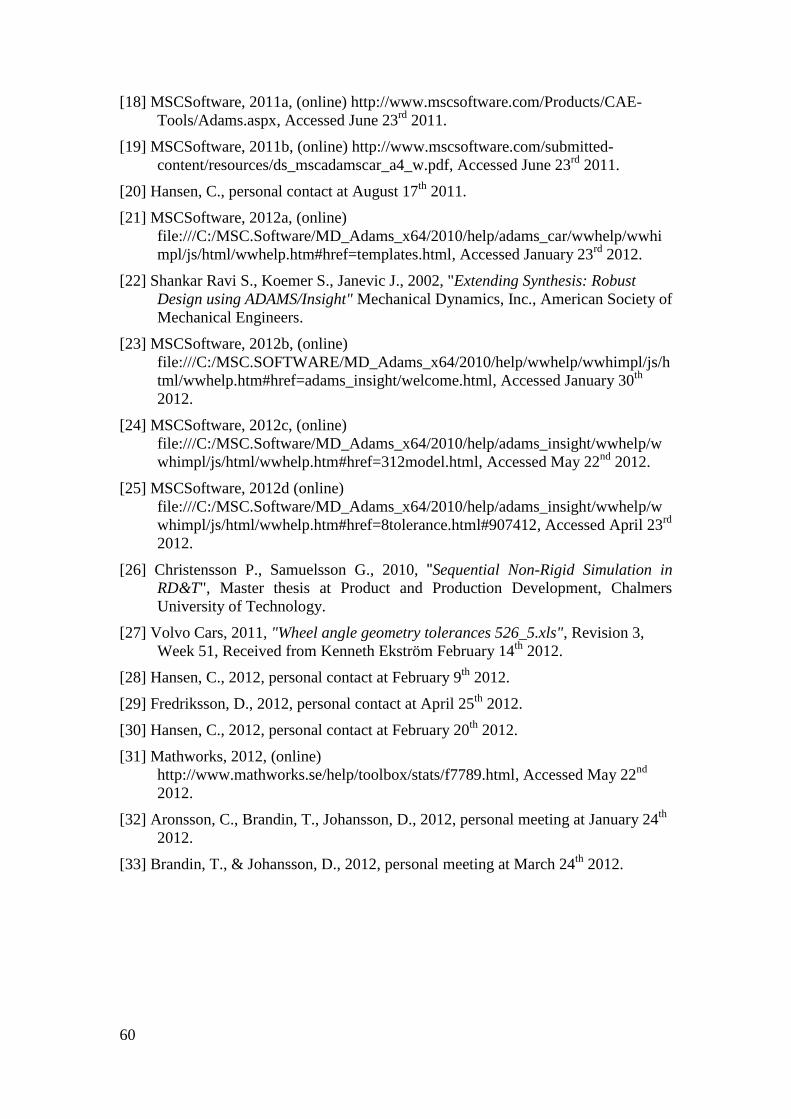
60
[18] MSCSoftware, 2011a, (online) http://www.mscsoftware.com/Products/CAE-
Tools/Adams.aspx, Accessed June 23rd
2011.
[19] MSCSoftware, 2011b, (online) http://www.mscsoftware.com/submitted-
content/resources/ds_mscadamscar_a4_w.pdf, Accessed June 23rd
2011.
[20] Hansen, C., personal contact at August 17th
2011.
[21] MSCSoftware, 2012a, (online)
file:///C:/MSC.Software/MD_Adams_x64/2010/help/adams_car/wwhelp/wwhi
mpl/js/html/wwhelp.htm#href=templates.html, Accessed January 23rd
2012.
[22] Shankar Ravi S., Koemer S., Janevic J., 2002, "Extending Synthesis: Robust
Design using ADAMS/Insight" Mechanical Dynamics, Inc., American Society of
Mechanical Engineers.
[23] MSCSoftware, 2012b, (online)
file:///C:/MSC.SOFTWARE/MD_Adams_x64/2010/help/wwhelp/wwhimpl/js/h
tml/wwhelp.htm#href=adams_insight/welcome.html, Accessed January 30th
2012.
[24] MSCSoftware, 2012c, (online)
file:///C:/MSC.Software/MD_Adams_x64/2010/help/adams_insight/wwhelp/w
whimpl/js/html/wwhelp.htm#href=312model.html, Accessed May 22nd
2012.
[25] MSCSoftware, 2012d (online)
file:///C:/MSC.Software/MD_Adams_x64/2010/help/adams_insight/wwhelp/w
whimpl/js/html/wwhelp.htm#href=8tolerance.html#907412, Accessed April 23rd
2012.
[26] Christensson P., Samuelsson G., 2010, "Sequential Non-Rigid Simulation in
RD&T", Master thesis at Product and Production Development, Chalmers
University of Technology.
[27] Volvo Cars, 2011, "Wheel angle geometry tolerances 526_5.xls", Revision 3,
Week 51, Received from Kenneth Ekström February 14th
2012.
[28] Hansen, C., 2012, personal contact at February 9th
2012.
[29] Fredriksson, D., 2012, personal contact at April 25th
2012.
[30] Hansen, C., 2012, personal contact at February 20th
2012.
[31] Mathworks, 2012, (online)
http://www.mathworks.se/help/toolbox/stats/f7789.html, Accessed May 22nd
2012.
[32] Aronsson, C., Brandin, T., Johansson, D., 2012, personal meeting at January 24th
2012.
[33] Brandin, T., & Johansson, D., 2012, personal meeting at March 24th
2012.
APPENDICES
APPENDIX I – MEASURES I
APPENDIX II – WHEEL ANGLE GEOMETRY V
APPENDIX III – PRODUCT SPECIFICATIONS VII
APPENDIX IV – INTERVIEW GUIDES IX
Department of Product and Production Development
Division of Product Development
CHALMERS UNIVERSITY OF TECHNOLOGY
Gothenburg, Sweden 2012

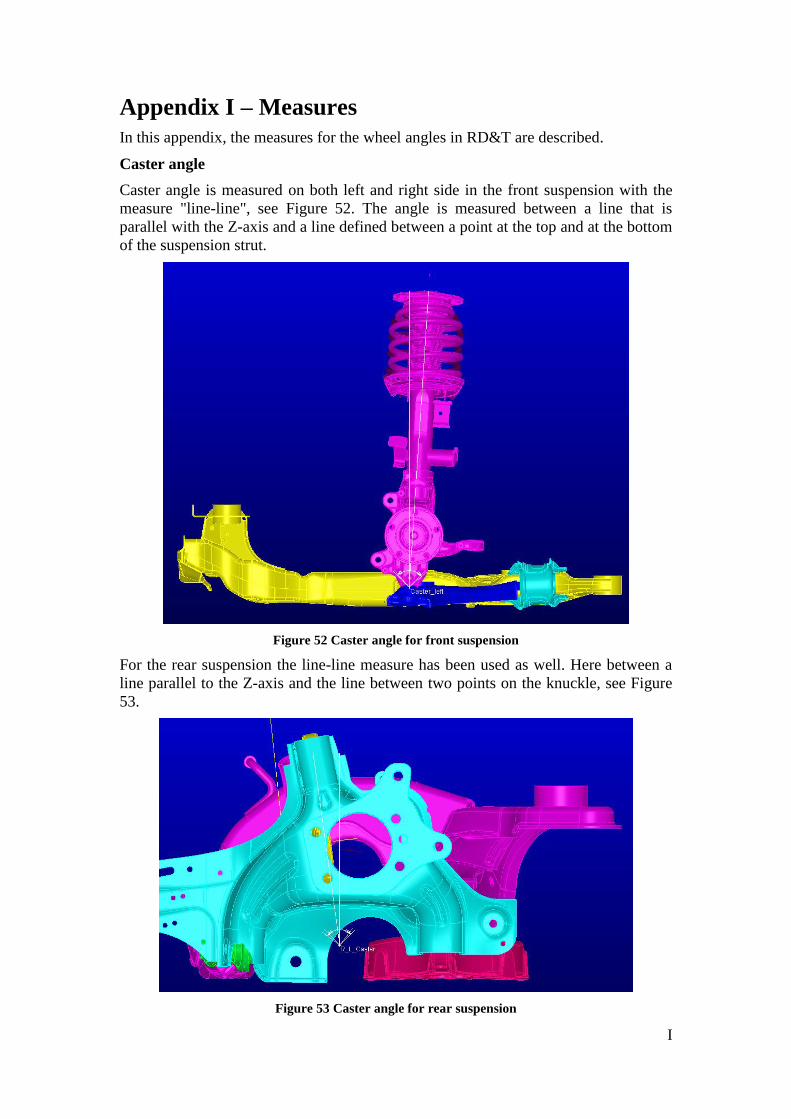
I
Appendix I – Measures
In this appendix, the measures for the wheel angles in RD&T are described.
Caster angle
Caster angle is measured on both left and right side in the front suspension with the
measure "line-line", see Figure 52. The angle is measured between a line that is
parallel with the Z-axis and a line defined between a point at the top and at the bottom
of the suspension strut.
Figure 52 Caster angle for front suspension
For the rear suspension the line-line measure has been used as well. Here between a
line parallel to the Z-axis and the line between two points on the knuckle, see Figure
53.
Figure 53 Caster angle for rear suspension
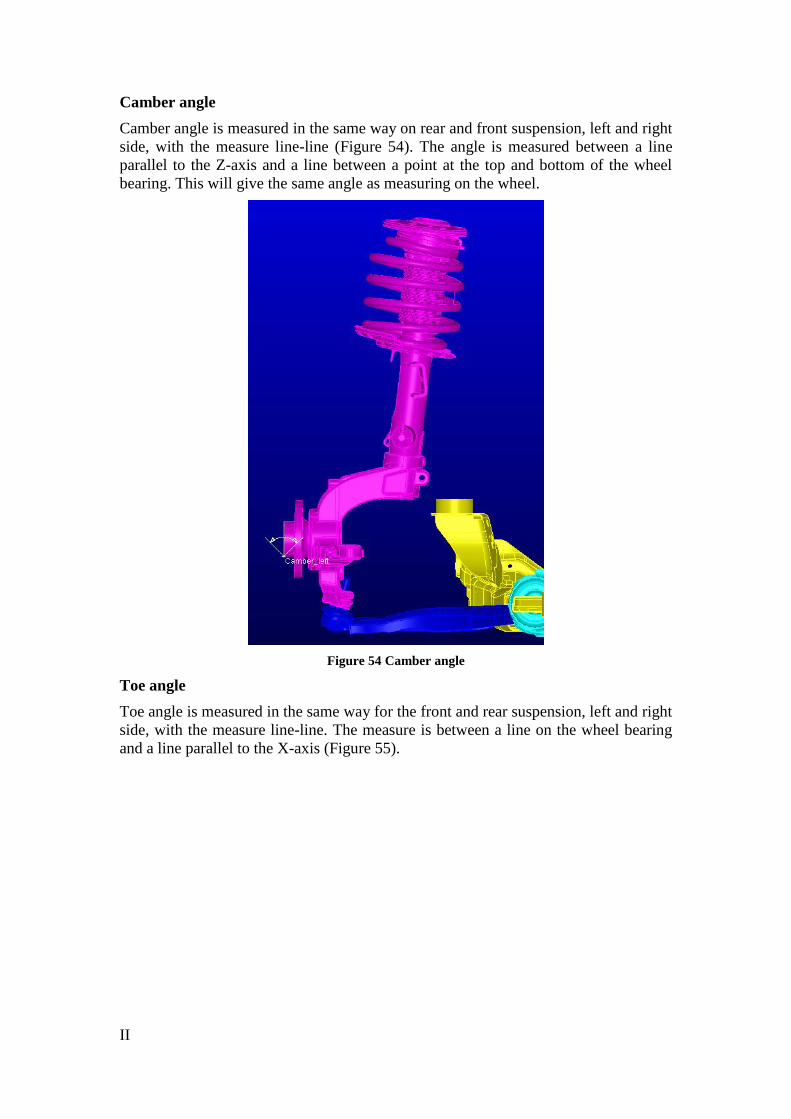
II
Camber angle
Camber angle is measured in the same way on rear and front suspension, left and right
side, with the measure line-line (Figure 54). The angle is measured between a line
parallel to the Z-axis and a line between a point at the top and bottom of the wheel
bearing. This will give the same angle as measuring on the wheel.
Figure 54 Camber angle
Toe angle
Toe angle is measured in the same way for the front and rear suspension, left and right
side, with the measure line-line. The measure is between a line on the wheel bearing
and a line parallel to the X-axis (Figure 55).
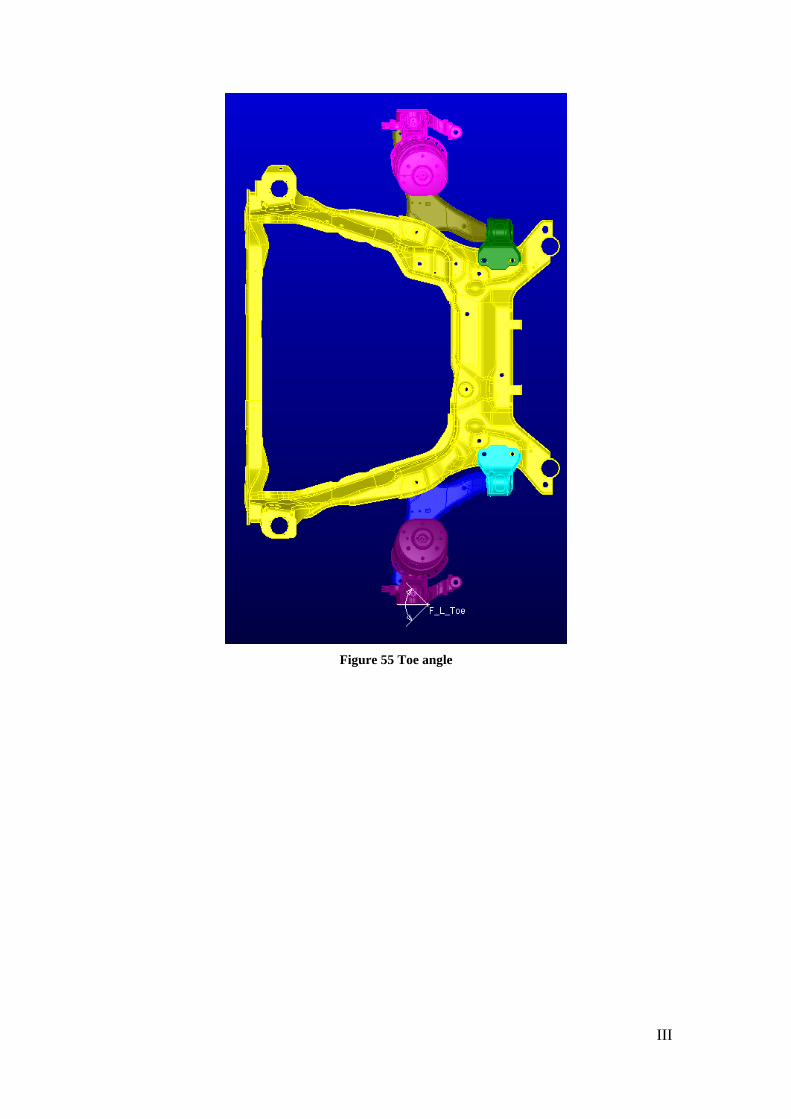
III
Figure 55 Toe angle

IV
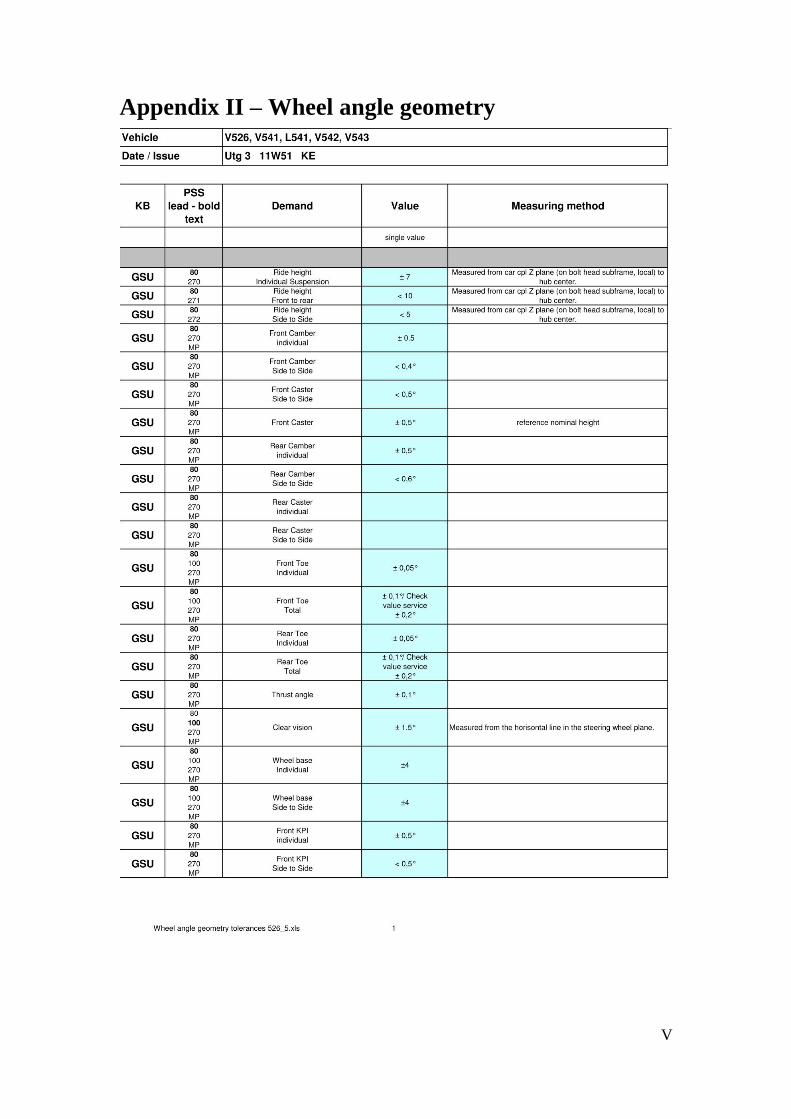
V
Appendix II – Wheel angle geometry
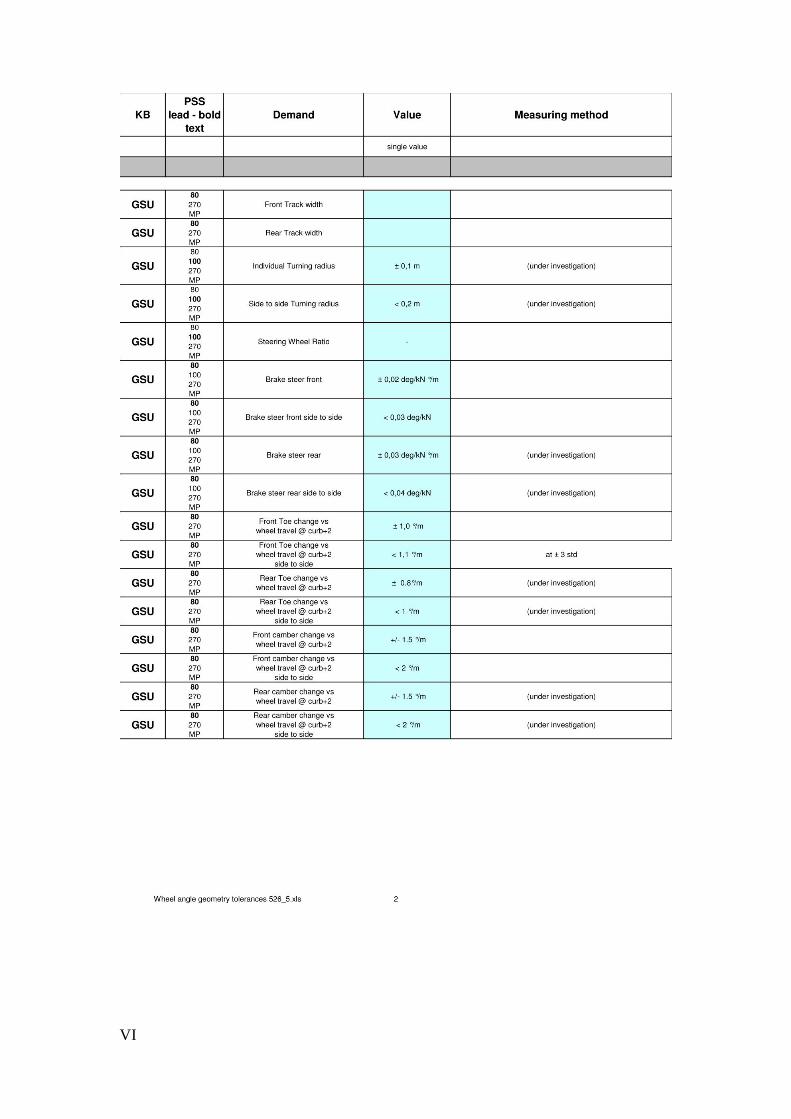
VI
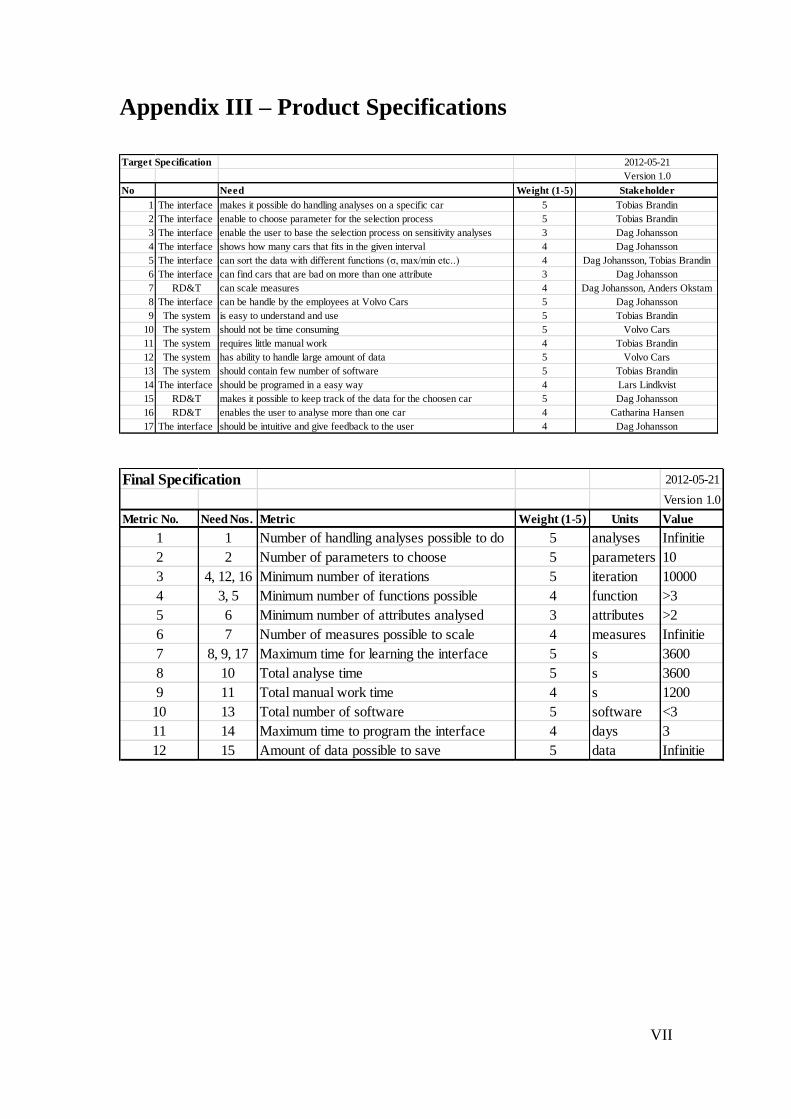
VII
Appendix III – Product Specifications
Target Specification 2012-05-21
Version 1.0
No Need Weight (1-5) Stakeholder
1 The interface makes it possible do handling analyses on a specific car 5 Tobias Brandin
2 The interface enable to choose parameter for the selection process 5 Tobias Brandin
3 The interface enable the user to base the selection process on sensitivity analyses 3 Dag Johansson
4 The interface shows how many cars that fits in the given interval 4 Dag Johansson
5 The interface can sort the data with different functions (σ, max/min etc..) 4 Dag Johansson, Tobias Brandin
6 The interface can find cars that are bad on more than one attribute 3 Dag Johansson
7 RD&T can scale measures 4 Dag Johansson, Anders Okstam
8 The interface can be handle by the employees at Volvo Cars 5 Dag Johansson
9 The system is easy to understand and use 5 Tobias Brandin
10 The system should not be time consuming 5 Volvo Cars
11 The system requires little manual work 4 Tobias Brandin
12 The system has ability to handle large amount of data 5 Volvo Cars
13 The system should contain few number of software 5 Tobias Brandin
14 The interface should be programed in a easy way 4 Lars Lindkvist
15 RD&T makes it possible to keep track of the data for the choosen car 5 Dag Johansson
16 RD&T enables the user to analyse more than one car 4 Catharina Hansen
17 The interface should be intuitive and give feedback to the user 4 Dag Johansson
Final Specification 2012-05-21
Version 1.0
Metric No. Need Nos. Metric Weight (1-5) Units Value
1 1 Number of handling analyses possible to do 5 analyses Infinitie
2 2 Number of parameters to choose 5 parameters 10
3 4, 12, 16 Minimum number of iterations 5 iteration 10000
4 3, 5 Minimum number of functions possible 4 function >3
5 6 Minimum number of attributes analysed 3 attributes >2
6 7 Number of measures possible to scale 4 measures Infinitie
7 8, 9, 17 Maximum time for learning the interface 5 s 3600
8 10 Total analyse time 5 s 3600
9 11 Total manual work time 4 s 1200
10 13 Total number of software 5 software <3
11 14 Maximum time to program the interface 4 days 3
12 15 Amount of data possible to save 5 data Infinitie

VIII
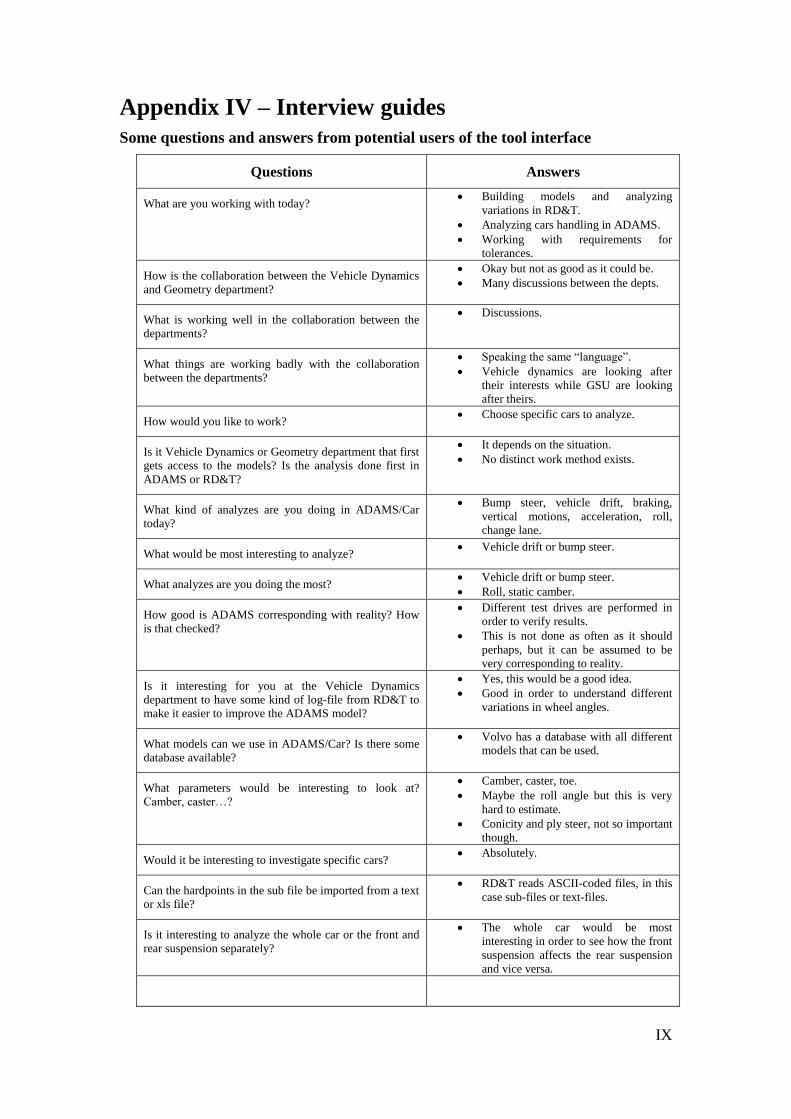
IX
Appendix IV – Interview guides
Some questions and answers from potential users of the tool interface
Questions Answers
What are you working with today? Building models and analyzing
variations in RD&T.
Analyzing cars handling in ADAMS.
Working with requirements for
tolerances.
How is the collaboration between the Vehicle Dynamics
and Geometry department?
Okay but not as good as it could be.
Many discussions between the depts.
What is working well in the collaboration between the
departments?
Discussions.
What things are working badly with the collaboration
between the departments?
Speaking the same “language”.
Vehicle dynamics are looking after
their interests while GSU are looking
after theirs.
How would you like to work? Choose specific cars to analyze.
Is it Vehicle Dynamics or Geometry department that first
gets access to the models? Is the analysis done first in
ADAMS or RD&T?
It depends on the situation.
No distinct work method exists.
What kind of analyzes are you doing in ADAMS/Car
today?
Bump steer, vehicle drift, braking,
vertical motions, acceleration, roll,
change lane.
What would be most interesting to analyze? Vehicle drift or bump steer.
What analyzes are you doing the most? Vehicle drift or bump steer.
Roll, static camber.
How good is ADAMS corresponding with reality? How
is that checked?
Different test drives are performed in
order to verify results.
This is not done as often as it should
perhaps, but it can be assumed to be
very corresponding to reality.
Is it interesting for you at the Vehicle Dynamics
department to have some kind of log-file from RD&T to
make it easier to improve the ADAMS model?
Yes, this would be a good idea.
Good in order to understand different
variations in wheel angles.
What models can we use in ADAMS/Car? Is there some
database available?
Volvo has a database with all different
models that can be used.
What parameters would be interesting to look at?
Camber, caster…?
Camber, caster, toe.
Maybe the roll angle but this is very
hard to estimate.
Conicity and ply steer, not so important
though.
Would it be interesting to investigate specific cars? Absolutely.
Can the hardpoints in the sub file be imported from a text
or xls file?
RD&T reads ASCII-coded files, in this
case sub-files or text-files.
Is it interesting to analyze the whole car or the front and
rear suspension separately?
The whole car would be most
interesting in order to see how the front
suspension affects the rear suspension
and vice versa.
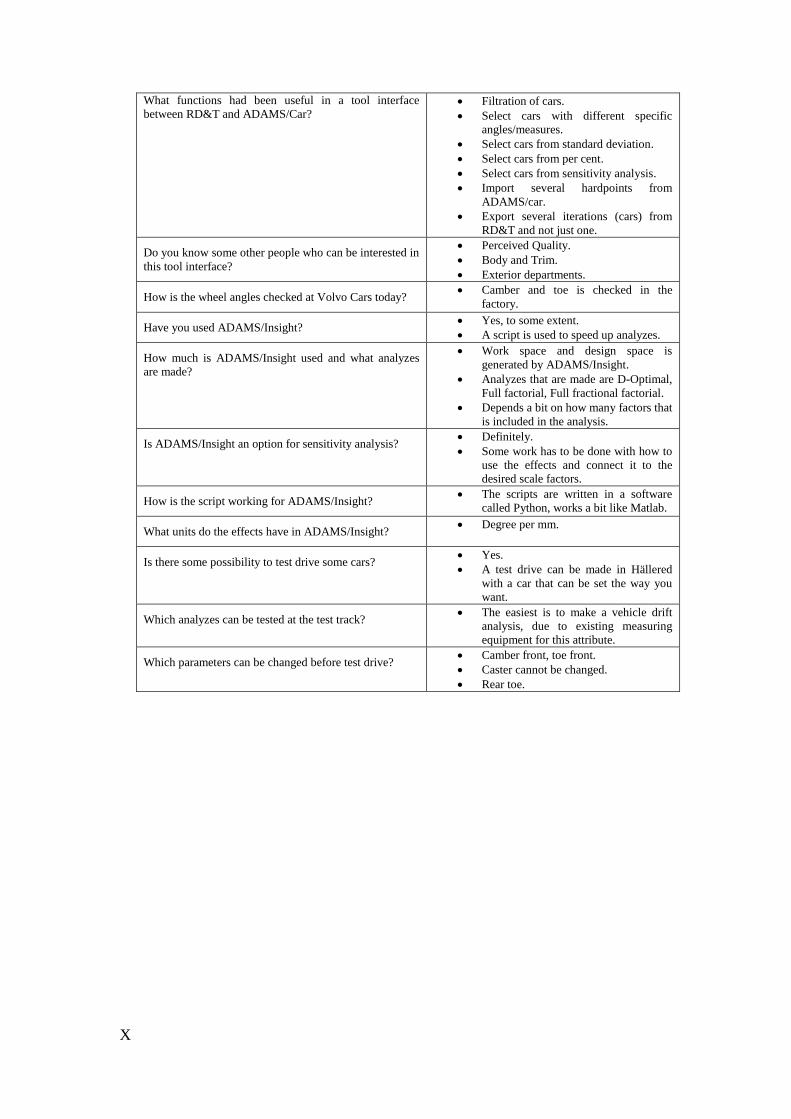
X
What functions had been useful in a tool interface
between RD&T and ADAMS/Car? Filtration of cars.
Select cars with different specific
angles/measures.
Select cars from standard deviation.
Select cars from per cent.
Select cars from sensitivity analysis.
Import several hardpoints from
ADAMS/car.
Export several iterations (cars) from
RD&T and not just one.
Do you know some other people who can be interested in
this tool interface?
Perceived Quality.
Body and Trim.
Exterior departments.
How is the wheel angles checked at Volvo Cars today? Camber and toe is checked in the
factory.
Have you used ADAMS/Insight? Yes, to some extent.
A script is used to speed up analyzes.
How much is ADAMS/Insight used and what analyzes
are made?
Work space and design space is
generated by ADAMS/Insight.
Analyzes that are made are D-Optimal,
Full factorial, Full fractional factorial.
Depends a bit on how many factors that
is included in the analysis.
Is ADAMS/Insight an option for sensitivity analysis? Definitely.
Some work has to be done with how to
use the effects and connect it to the
desired scale factors.
How is the script working for ADAMS/Insight? The scripts are written in a software
called Python, works a bit like Matlab.
What units do the effects have in ADAMS/Insight? Degree per mm.
Is there some possibility to test drive some cars? Yes.
A test drive can be made in Hällered
with a car that can be set the way you
want.
Which analyzes can be tested at the test track? The easiest is to make a vehicle drift
analysis, due to existing measuring
equipment for this attribute.
Which parameters can be changed before test drive? Camber front, toe front.
Caster cannot be changed.
Rear toe.
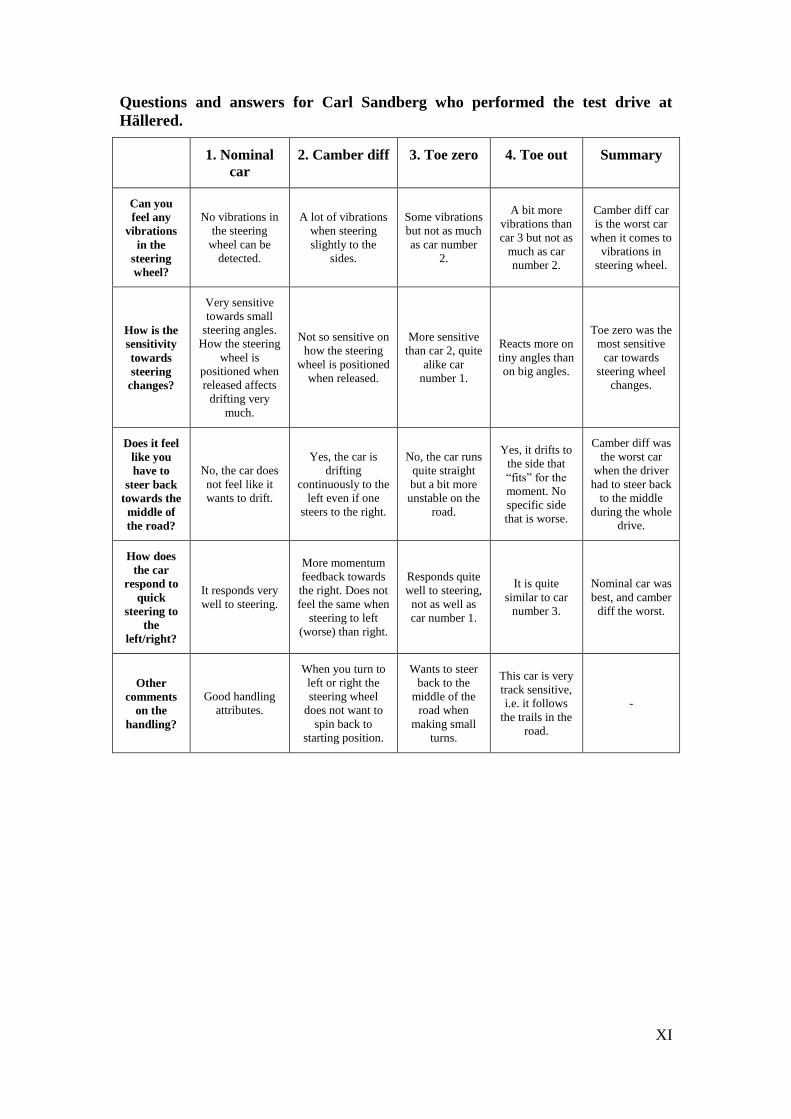
XI
Questions and answers for Carl Sandberg who performed the test drive at
Hällered.
1. Nominal
car
2. Camber diff 3. Toe zero 4. Toe out Summary
Can you
feel any
vibrations
in the
steering
wheel?
No vibrations in
the steering
wheel can be
detected.
A lot of vibrations
when steering
slightly to the
sides.
Some vibrations
but not as much
as car number
2.
A bit more
vibrations than
car 3 but not as
much as car
number 2.
Camber diff car
is the worst car
when it comes to
vibrations in
steering wheel.
How is the
sensitivity
towards
steering
changes?
Very sensitive
towards small
steering angles.
How the steering
wheel is
positioned when
released affects
drifting very
much.
Not so sensitive on
how the steering
wheel is positioned
when released.
More sensitive
than car 2, quite
alike car
number 1.
Reacts more on
tiny angles than
on big angles.
Toe zero was the
most sensitive
car towards
steering wheel
changes.
Does it feel
like you
have to
steer back
towards the
middle of
the road?
No, the car does
not feel like it
wants to drift.
Yes, the car is
drifting
continuously to the
left even if one
steers to the right.
No, the car runs
quite straight
but a bit more
unstable on the
road.
Yes, it drifts to
the side that
“fits” for the
moment. No
specific side
that is worse.
Camber diff was
the worst car
when the driver
had to steer back
to the middle
during the whole
drive.
How does
the car
respond to
quick
steering to
the
left/right?
It responds very
well to steering.
More momentum
feedback towards
the right. Does not
feel the same when
steering to left
(worse) than right.
Responds quite
well to steering,
not as well as
car number 1.
It is quite
similar to car
number 3.
Nominal car was
best, and camber
diff the worst.
Other
comments
on the
handling?
Good handling
attributes.
When you turn to
left or right the
steering wheel
does not want to
spin back to
starting position.
Wants to steer
back to the
middle of the
road when
making small
turns.
This car is very
track sensitive,
i.e. it follows
the trails in the
road.
-