Embed Size (px)
Citation preview
www.unido.org/afripanet
Tokyo Conference May 2007
UNITED NATIONSINDUSTRIAL DEVELOPMENT ORGANIZATION
FDI: Source of Sustainable Growth
Africa Foreign Investors Survey 2005
2007 Africa Day Symposium
Yoshiteru Uramoto
Deputy to the Director General
United Nations Industrial Development Organization
www.unido.org/afripanet
Tokyo Conference May 2007
UNITED NATIONSINDUSTRIAL DEVELOPMENT ORGANIZATION
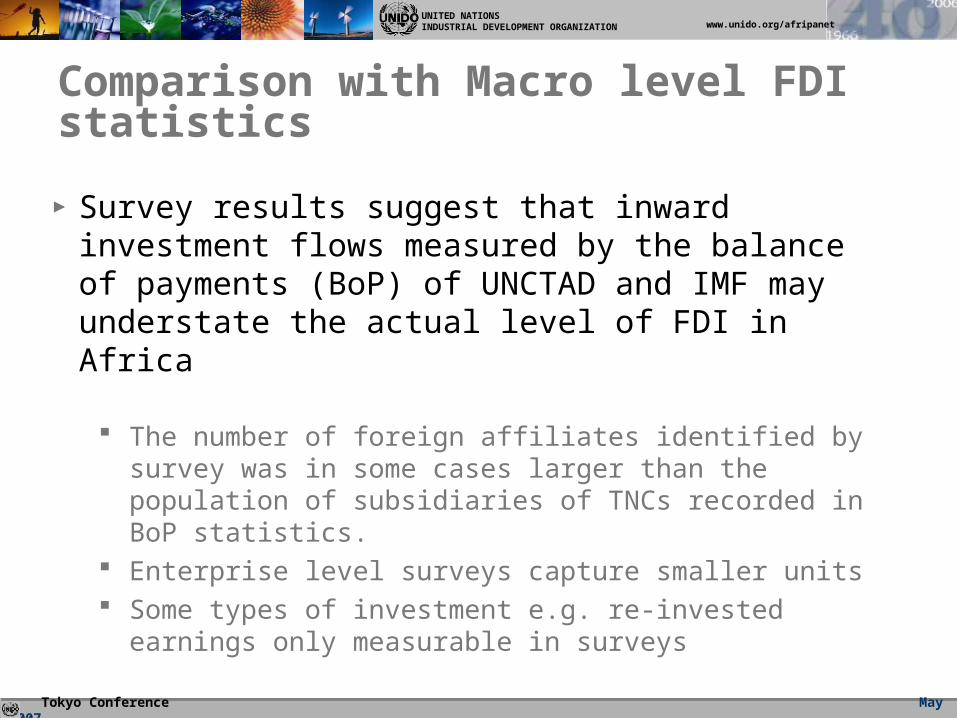
Comparison with Macro level FDI statistics
▶ Survey results suggest that inward investment flows measured by the balance of payments (BoP) of UNCTAD and IMF may understate the actual level of FDI in Africa
The number of foreign affiliates identified by survey was in some cases larger than the population of subsidiaries of TNCs recorded in BoP statistics.
Enterprise level surveys capture smaller units Some types of investment e.g. re-invested earnings only
measurable in surveys
www.unido.org/afripanet
Tokyo Conference May 2007
UNITED NATIONSINDUSTRIAL DEVELOPMENT ORGANIZATION
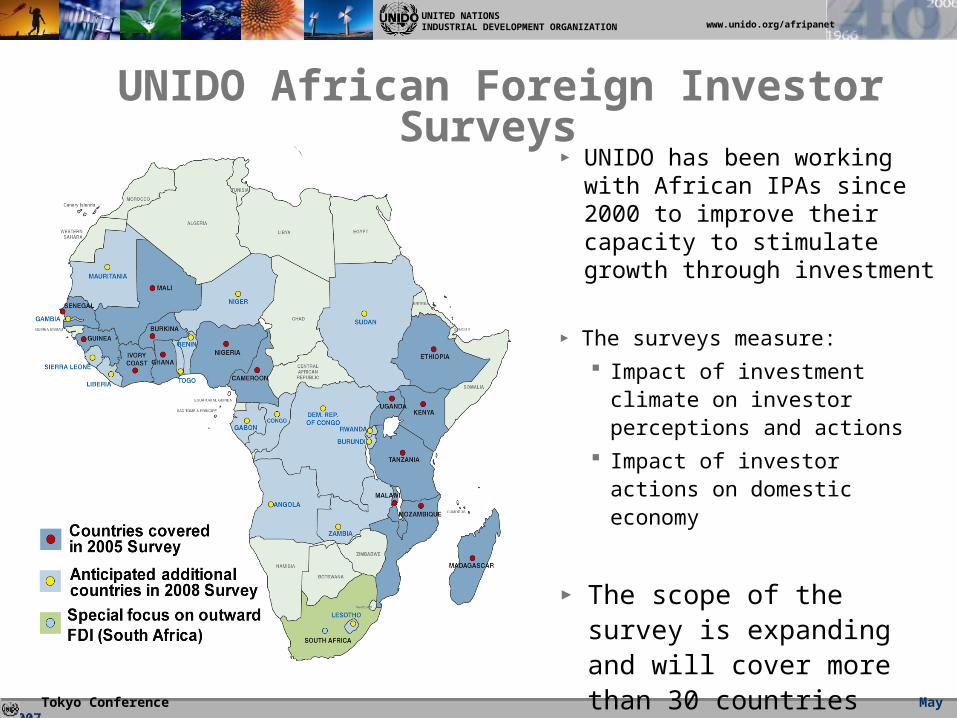
UNIDO African Foreign Investor Surveys
▶ UNIDO has been working with African IPAs since 2000 to improve their capacity to stimulate growth through investment
▶ The surveys measure: Impact of investment
climate on investor perceptions and actions
Impact of investor actions on domestic economy
▶ The scope of the survey is expanding and will cover more than 30 countries
www.unido.org/afripanet
Tokyo Conference May 2007
UNITED NATIONSINDUSTRIAL DEVELOPMENT ORGANIZATION
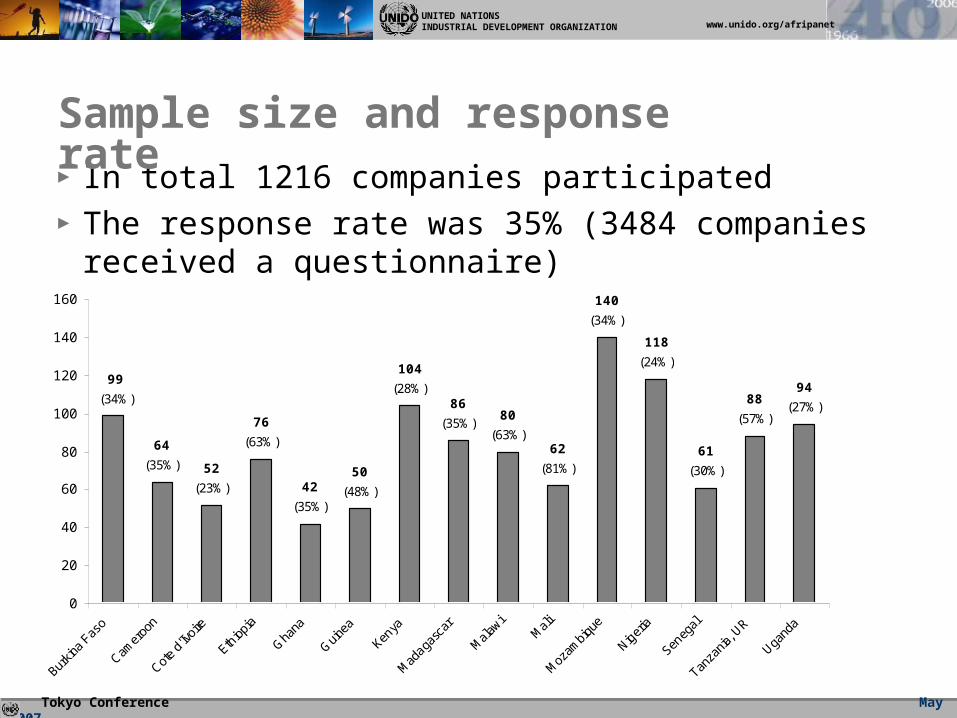
▶ In total 1216 companies participated▶ The response rate was 35% (3484 companies
received a questionnaire)
Sample size and response rate
94
(27%)88
(57%)
61
(30%)
118
(24%)
140
(34%)
76
(63%)
52
(23%)
64
(35%)
99
(34%)
42
(35%)
50
(48%)
104
(28%)86
(35%)80
(63%)62
(81%)
0
20
40
60
80
100
120
140
160
Burk
ina F
aso
Camer
oon
Cote d'
Ivoire
Ethio
pia
Ghana
Guinea
Keny
a
Madag
asca
r
Malawi
Mali
Mozam
bique
Nigeria
Sene
gal
Tanz
ania,
UR
Ugand
a
www.unido.org/afripanet
Tokyo Conference May 2007
UNITED NATIONSINDUSTRIAL DEVELOPMENT ORGANIZATION
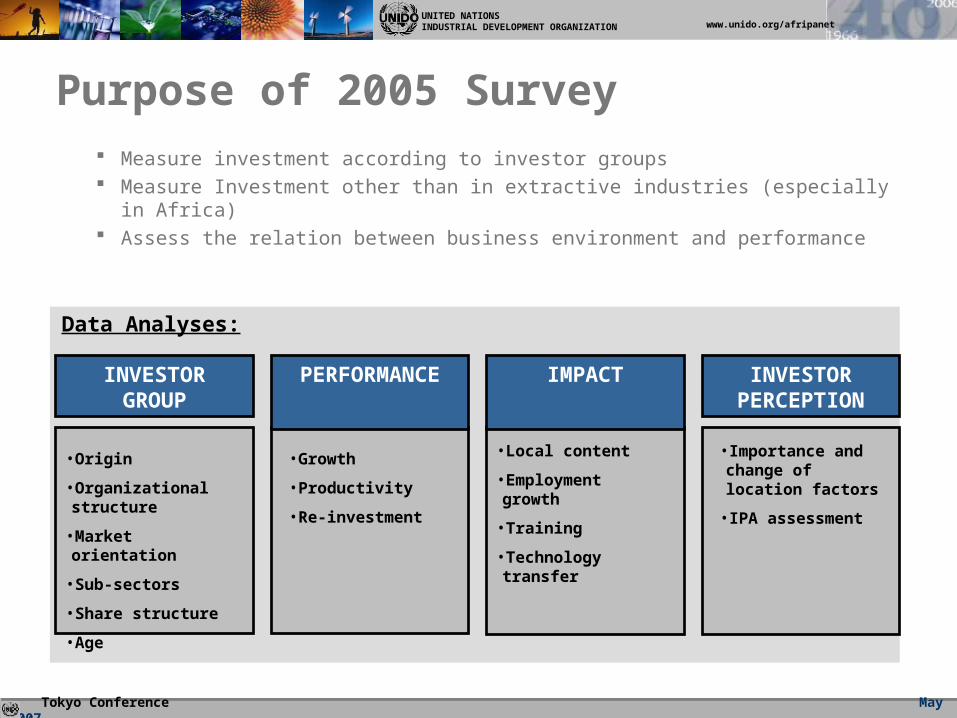
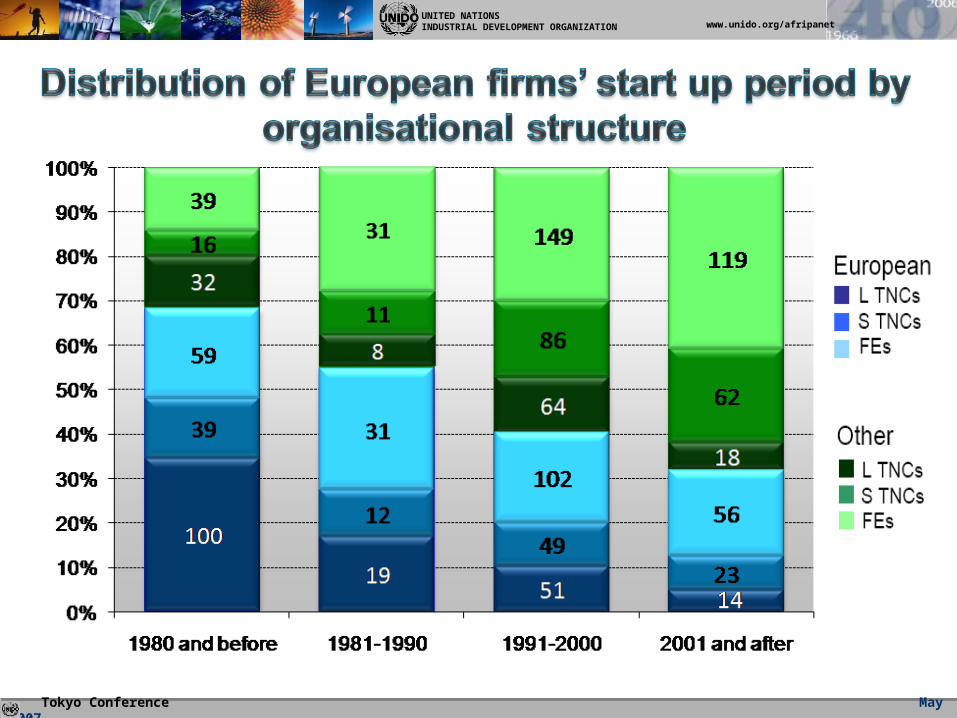
•Origin
•Organizational structure
•Market orientation
•Sub-sectors
•Share structure
•Age
•Growth
•Productivity
•Re-investment
PERFORMANCE IMPACTINVESTOR GROUP
•Local content
•Employment growth
•Training
•Technology transfer
INVESTOR PERCEPTION
•Importance and change of location factors
•IPA assessment
Measure investment according to investor groups Measure Investment other than in extractive industries (especially in Africa) Assess the relation between business environment and performance
Data Analyses:
Purpose of 2005 Survey
www.unido.org/afripanet
Tokyo Conference May 2007
UNITED NATIONSINDUSTRIAL DEVELOPMENT ORGANIZATION
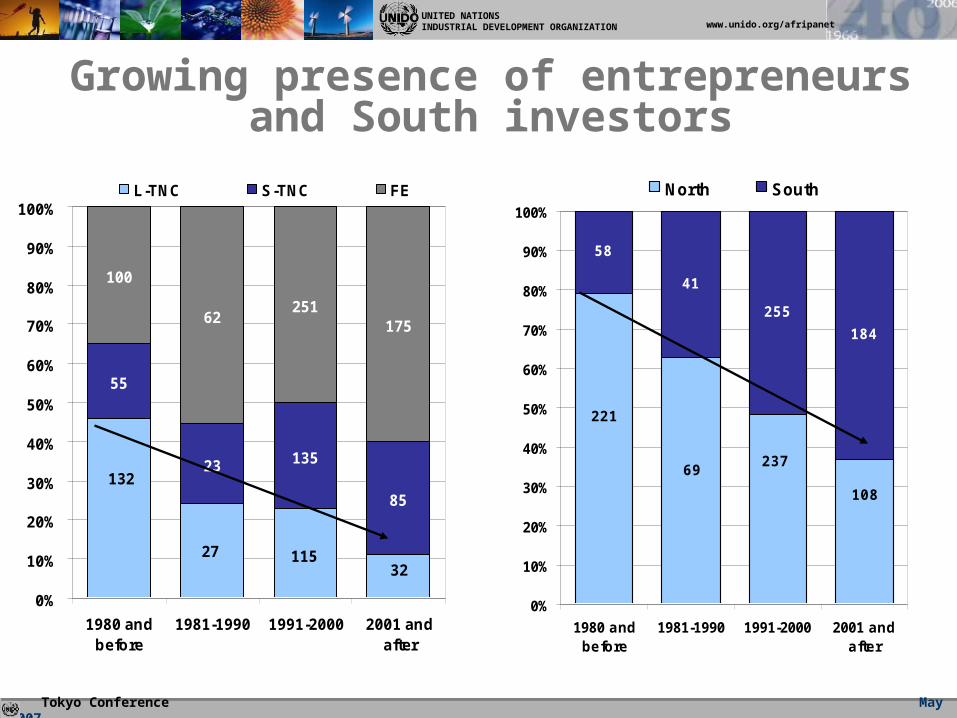
55
23 135
85132
3211527
100
62251
175
0%
10%
20%
30%
40%
50%
60%
70%
80%
90%
100%
1980 andbefore
1981-1990 1991-2000 2001 andafter
L-TNC S-TNC FE
58
41
255
184
69237
108
221
0%
10%
20%
30%
40%
50%
60%
70%
80%
90%
100%
1980 andbefore
1981-1990 1991-2000 2001 andafter
North South
Growing presence of entrepreneurs and South investors
www.unido.org/afripanet
Tokyo Conference May 2007
UNITED NATIONSINDUSTRIAL DEVELOPMENT ORGANIZATION
www.unido.org/afripanet
Tokyo Conference May 2007
UNITED NATIONSINDUSTRIAL DEVELOPMENT ORGANIZATION
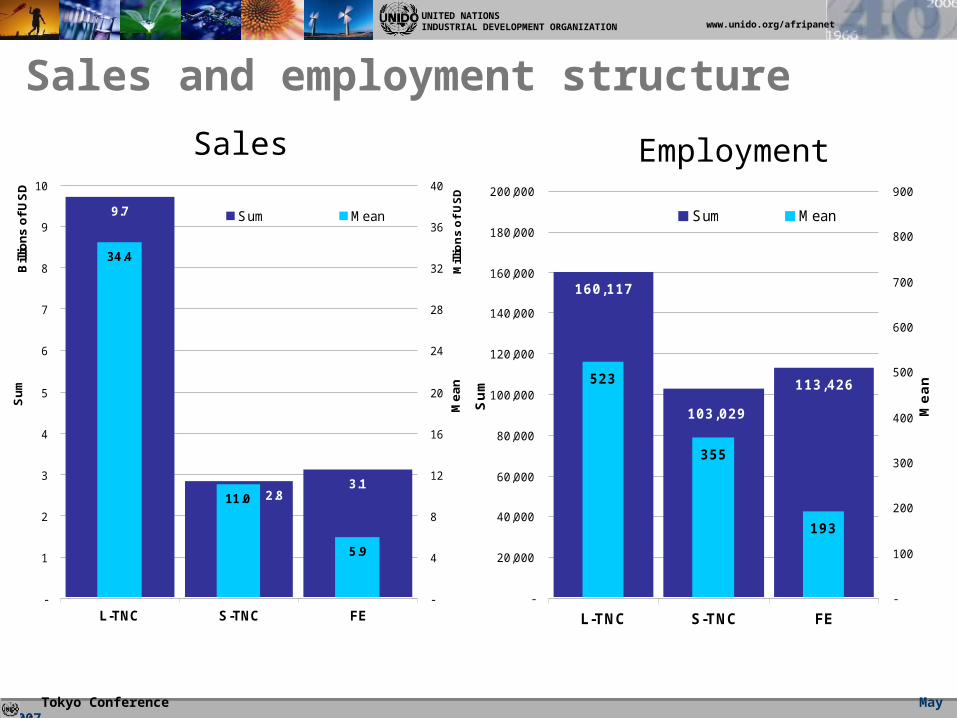
Sales and employment structure
3.12.8
9.7
34.4
11.0
5.9
-
1
2
3
4
5
6
7
8
9
10
L-TNC S-TNC FE
Bill
ion
s o
f U
SD
Su
m
-
4
8
12
16
20
24
28
32
36
40
Mill
ion
s o
f U
SD
Me
an
Sum Mean
Sales Employment
160,117
103,029
113,426523
355
193
-
20,000
40,000
60,000
80,000
100,000
120,000
140,000
160,000
180,000
200,000
L-TNC S-TNC FE
Sum
-
100
200
300
400
500
600
700
800
900
Mean
Sum Mean
www.unido.org/afripanet
Tokyo Conference May 2007
UNITED NATIONSINDUSTRIAL DEVELOPMENT ORGANIZATION
9
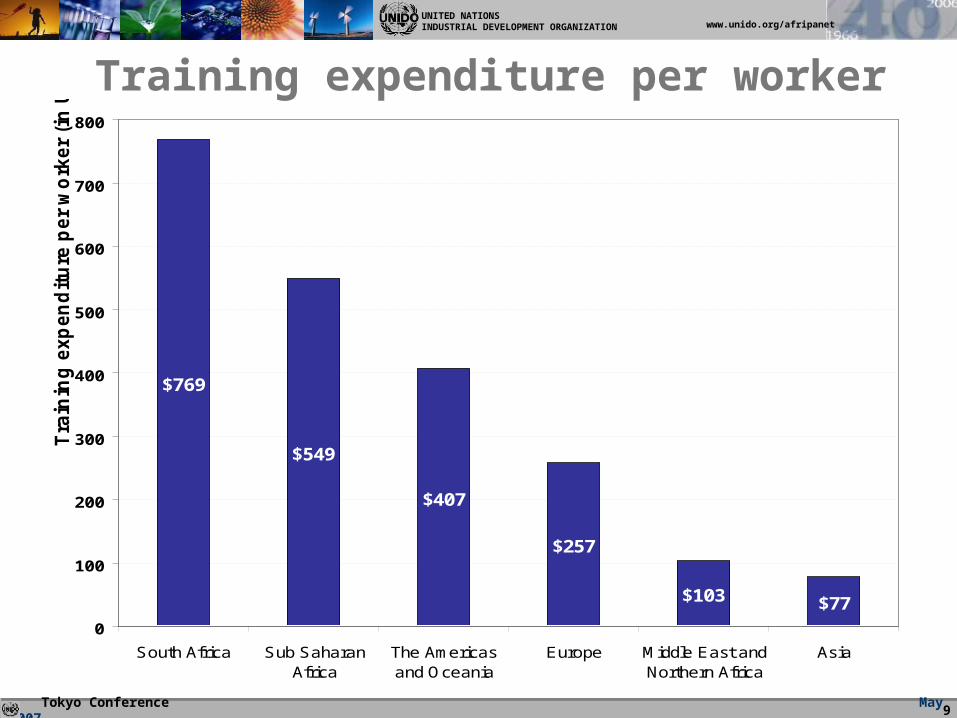
Training expenditure per worker
$769
$549
$407
$257
$103 $77
0
100
200
300
400
500
600
700
800
South Africa Sub SaharanAfrica
The Americasand Oceania
Europe Middle East andNorthern Africa
Asia
Tra
inin
g e
xp
en
dit
ure
per
wo
rker
(in
US
D)
www.unido.org/afripanet
Tokyo Conference May 2007
UNITED NATIONSINDUSTRIAL DEVELOPMENT ORGANIZATION
10
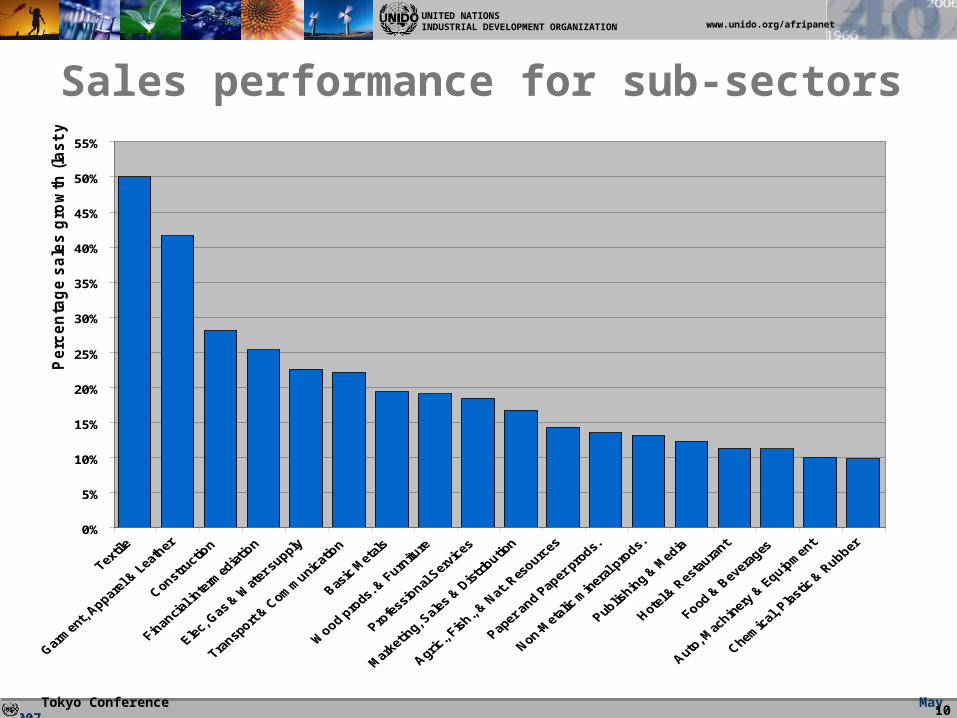
Sales performance for sub-sectors
0%
5%
10%
15%
20%
25%
30%
35%
40%
45%
50%
55%
Pe
rce
nta
ge
sa
les
gro
wth
(la
st
ye
ar)
www.unido.org/afripanet
Tokyo Conference May 2007
UNITED NATIONSINDUSTRIAL DEVELOPMENT ORGANIZATION
11
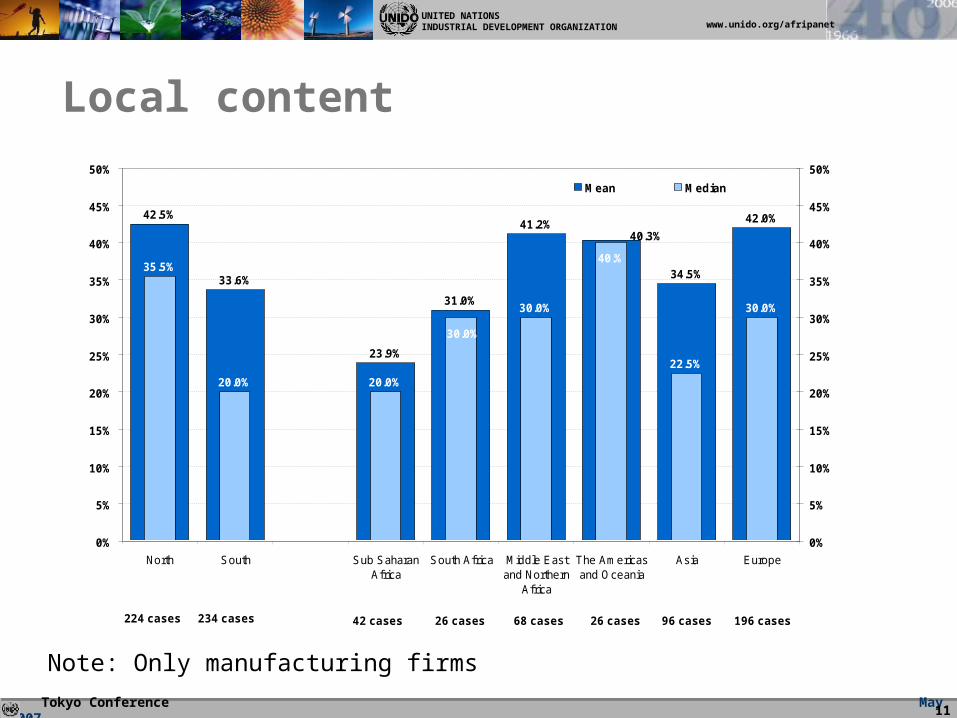
Local content
42.5%
33.6%
23.9%
31.0%
41.2%
34.5%
42.0%
40.3%
35.5%
20.0% 20.0%
30.0%
22.5%
30.0%
30.0%
40.%
0%
5%
10%
15%
20%
25%
30%
35%
40%
45%
50%
North South Sub SaharanAfrica
South Africa Middle Eastand Northern
Africa
The Americasand Oceania
Asia Europe
0%
5%
10%
15%
20%
25%
30%
35%
40%
45%
50%
Mean Median
224 cases 234 cases 42 cases 26 cases 68 cases 26 cases 96 cases 196 cases
Note: Only manufacturing firms
www.unido.org/afripanet
Tokyo Conference May 2007
UNITED NATIONSINDUSTRIAL DEVELOPMENT ORGANIZATION
12
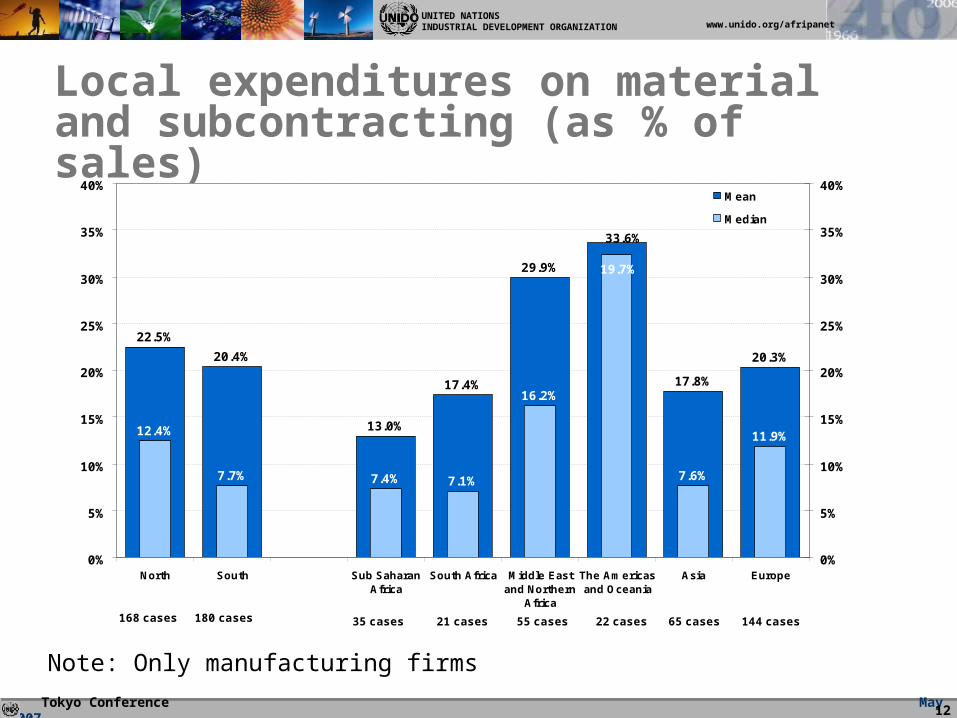
Local expenditures on material and subcontracting (as % of sales)
22.5%
20.4%
13.0%
17.4%
29.9%
17.8%
20.3%
33.6%
12.4%
7.7% 7.4% 7.1%
16.2%
7.6%
11.9%
19.7%
0%
5%
10%
15%
20%
25%
30%
35%
40%
North South Sub SaharanAfrica
South Africa Middle Eastand Northern
Africa
The Americasand Oceania
Asia Europe
0%
5%
10%
15%
20%
25%
30%
35%
40%Mean
Median
168 cases 180 cases 35 cases 21 cases 55 cases 22 cases 65 cases 144 cases
Note: Only manufacturing firms
www.unido.org/afripanet
Tokyo Conference May 2007
UNITED NATIONSINDUSTRIAL DEVELOPMENT ORGANIZATION
13
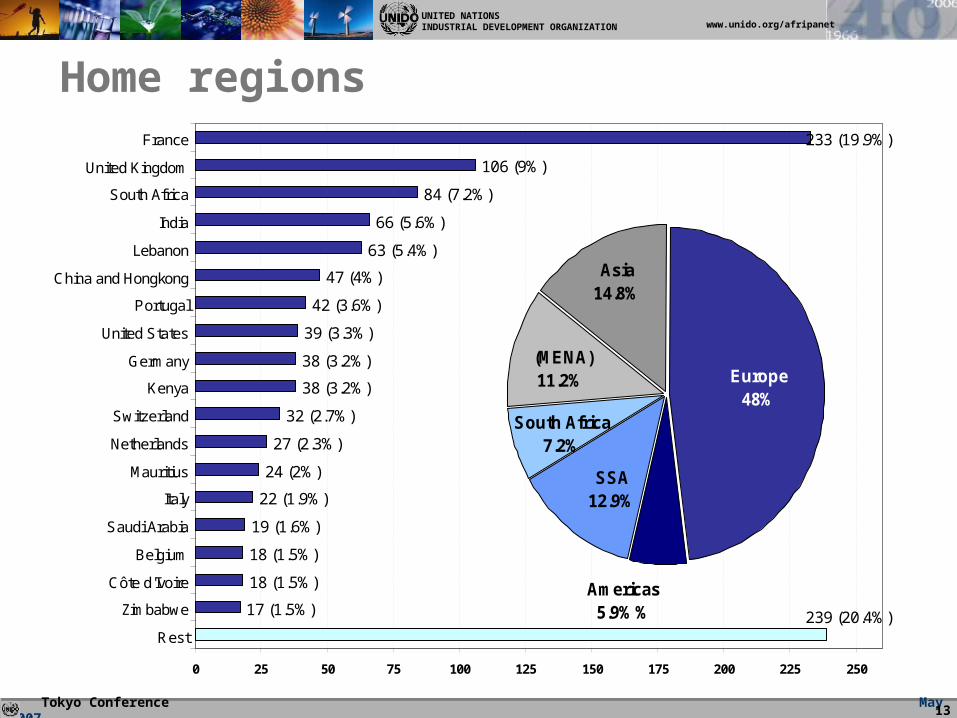
Home regions
239 (20.4%)17 (1.5%)
18 (1.5%)
18 (1.5%)
19 (1.6%)
22 (1.9%)
24 (2%)
27 (2.3%)
32 (2.7%)
38 (3.2%)
38 (3.2%)
39 (3.3%)
42 (3.6%)
47 (4%)
63 (5.4%)
66 (5.6%)
84 (7.2%)
106 (9%)
233 (19.9%)
0 25 50 75 100 125 150 175 200 225 250
Rest
Zimbabwe
Côte d'Ivoire
Belgium
Saudi Arabia
Italy
Mauritius
Netherlands
Switzerland
Kenya
Germany
United States
Portugal
China and Hongkong
Lebanon
India
South Africa
United Kingdom
France
Asia14.8%
(MENA)11.2%
South Africa7.2%
SSA12.9%
Europe48%
Americas5.9%%
www.unido.org/afripanet
Tokyo Conference May 2007
UNITED NATIONSINDUSTRIAL DEVELOPMENT ORGANIZATION
14
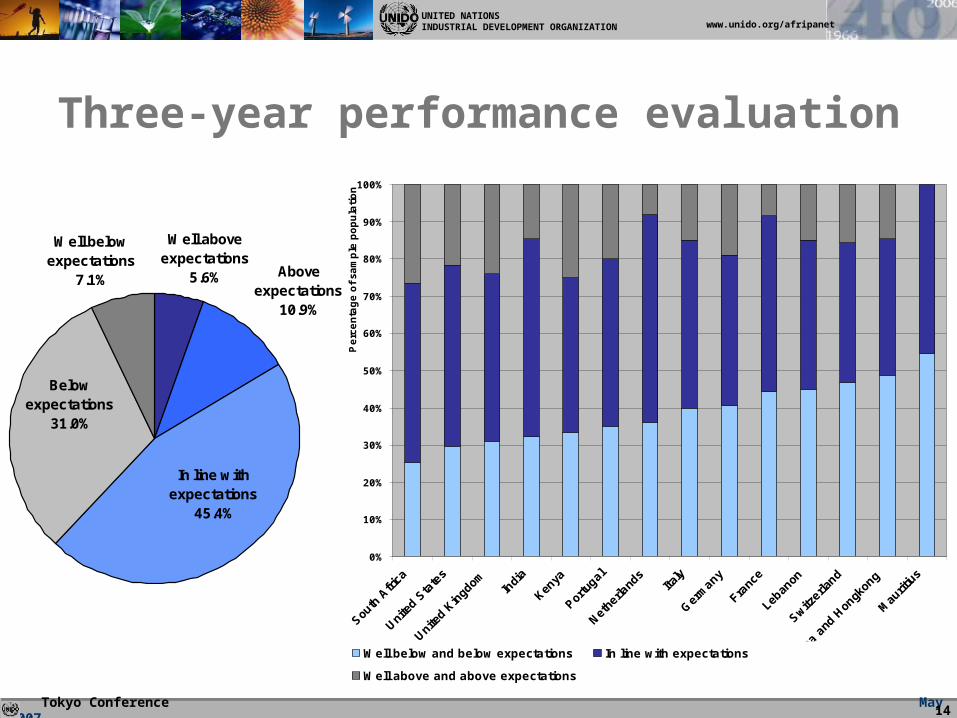
Three-year performance evaluation
Above expectations
10.9%
In line with expectations
45.4%
Below expectations
31.0%
Well below expectations
7.1%
Well above expectations
5.6%
0%
10%
20%
30%
40%
50%
60%
70%
80%
90%
100%
South A
frica
United Sta
tes
United Kin
gdom In
dia
Kenya
Portuga
l
Nethe
rland
sIta
ly
Ger
man
y
Fran
ce
Leba
non
Switzer
land
China
and
Hon
gkon
g
Mau
ritius
Perc
enta
ge o
f sa
mple
popula
tion
Well below and below expectations In line with expectations
Well above and above expectations
www.unido.org/afripanet
Tokyo Conference May 2007
UNITED NATIONSINDUSTRIAL DEVELOPMENT ORGANIZATION
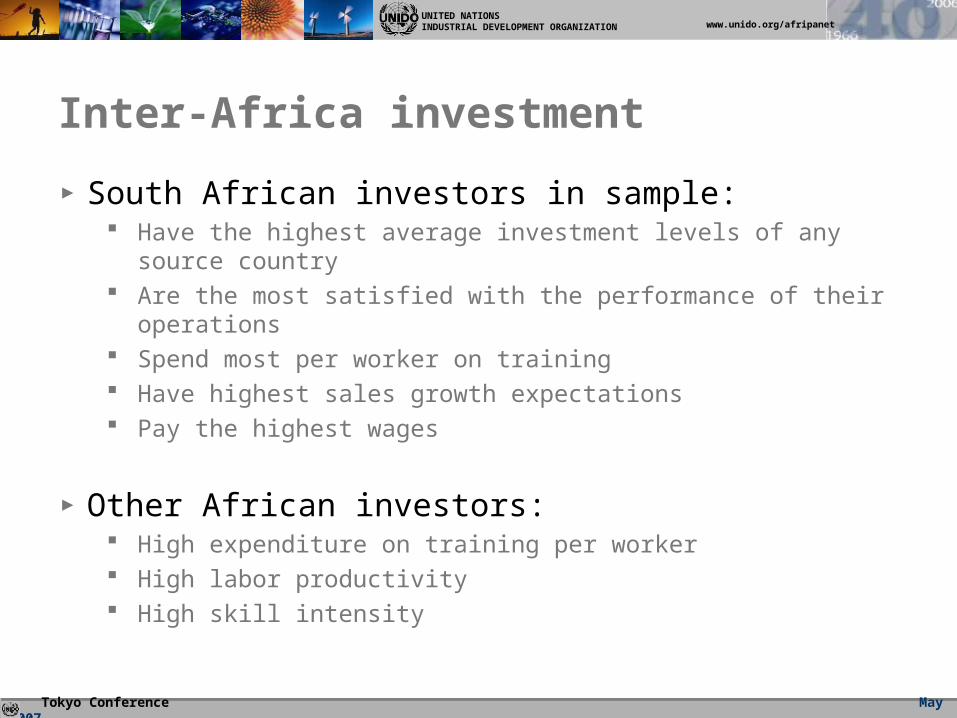
Inter-Africa investment
▶ South African investors in sample: Have the highest average investment levels of any source
country Are the most satisfied with the performance of their operations Spend most per worker on training Have highest sales growth expectations Pay the highest wages
▶ Other African investors: High expenditure on training per worker High labor productivity High skill intensity
www.unido.org/afripanet
Tokyo Conference May 2007
UNITED NATIONSINDUSTRIAL DEVELOPMENT ORGANIZATION
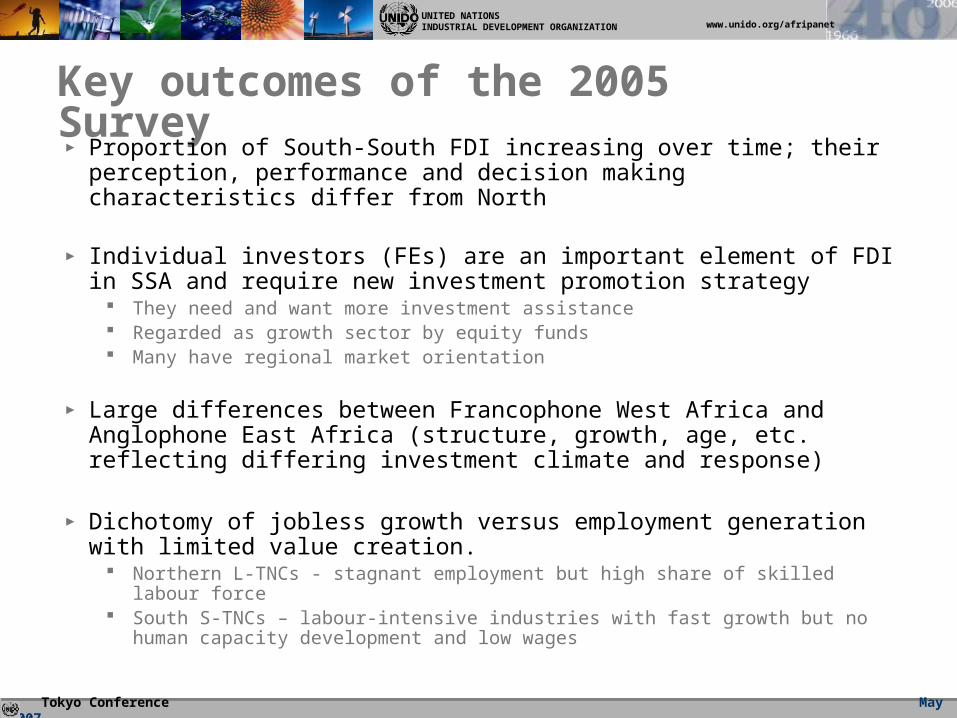
Key outcomes of the 2005 Survey▶ Proportion of South-South FDI increasing over time; their
perception, performance and decision making characteristics differ from North
▶ Individual investors (FEs) are an important element of FDI in SSA and require new investment promotion strategy
They need and want more investment assistance Regarded as growth sector by equity funds Many have regional market orientation
▶ Large differences between Francophone West Africa and Anglophone East Africa (structure, growth, age, etc. reflecting differing investment climate and response)
▶ Dichotomy of jobless growth versus employment generation with limited value creation.
Northern L-TNCs - stagnant employment but high share of skilled labour force South S-TNCs – labour-intensive industries with fast growth but no human
capacity development and low wages
www.unido.org/afripanet
Tokyo Conference May 2007
UNITED NATIONSINDUSTRIAL DEVELOPMENT ORGANIZATION
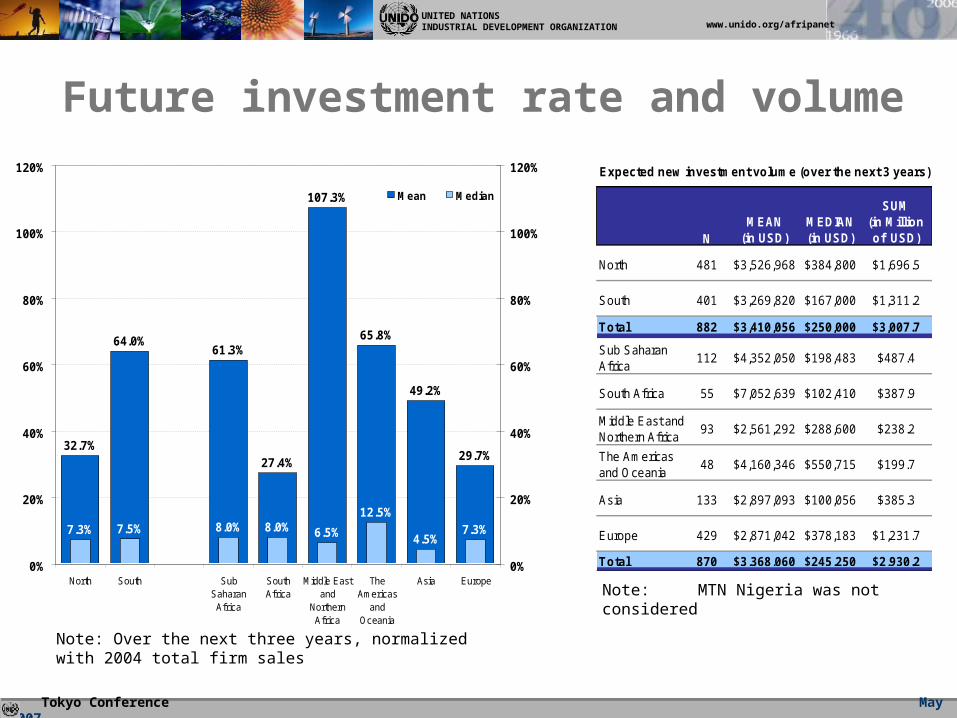
Future investment rate and volume
Note: Over the next three years, normalized with 2004 total firm sales
32.7%
64.0%61.3%
27.4%
107.3%
65.8%
49.2%
29.7%
7.3% 7.5% 8.0% 8.0%12.5%
4.5%7.3%6.5%
0%
20%
40%
60%
80%
100%
120%
North South SubSaharan
Africa
SouthAfrica
Middle Eastand
NorthernAfrica
TheAmericas
andOceania
Asia Europe0%
20%
40%
60%
80%
100%
120%
Mean Median
NMEAN
(in USD)MEDIAN (in USD)
SUM (in Million of USD)
North 481 $3,526,968 $384,800 $1,696.5
South 401 $3,269,820 $167,000 $1,311.2
Total 882 $3,410,056 $250,000 $3,007.7
Sub Saharan Africa
112 $4,352,050 $198,483 $487.4
South Africa 55 $7,052,639 $102,410 $387.9
Middle East and Northern Africa
93 $2,561,292 $288,600 $238.2
The Americas and Oceania
48 $4,160,346 $550,715 $199.7
Asia 133 $2,897,093 $100,056 $385.3
Europe 429 $2,871,042 $378,183 $1,231.7
Total 870 $3,368,060 $245,250 $2,930.2
Expected new investment volume (over the next 3 years)
Note: MTN Nigeria was not considered
www.unido.org/afripanet
Tokyo Conference May 2007
UNITED NATIONSINDUSTRIAL DEVELOPMENT ORGANIZATION
18
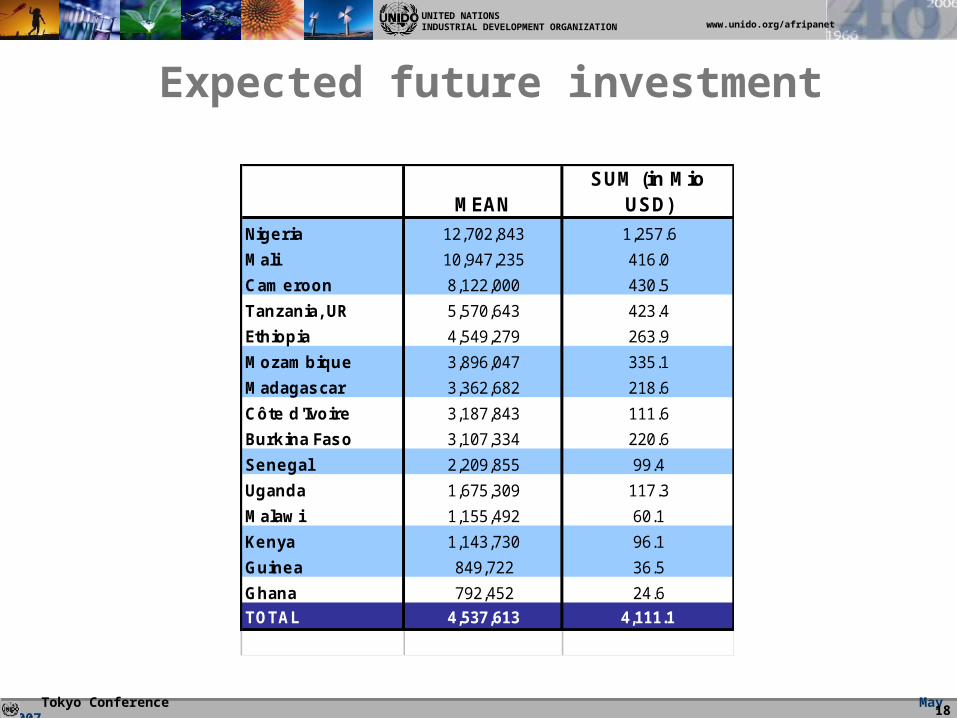
Expected future investment
MEANSUM (in Mio
USD)
Nigeria 12,702,843 1,257.6
Mali 10,947,235 416.0
Cam eroon 8,122,000 430.5
Tanzania, UR 5,570,643 423.4
Ethiopia 4,549,279 263.9
Mozam bique 3,896,047 335.1
Madagascar 3,362,682 218.6
Côte d'Ivoire 3,187,843 111.6
Burkina Faso 3,107,334 220.6
Senegal 2,209,855 99.4
Uganda 1,675,309 117.3
Malaw i 1,155,492 60.1
Kenya 1,143,730 96.1
Guinea 849,722 36.5
Ghana 792,452 24.6
TOTAL 4,537,613 4,111.1
www.unido.org/afripanet
Tokyo Conference May 2007
UNITED NATIONSINDUSTRIAL DEVELOPMENT ORGANIZATION
19
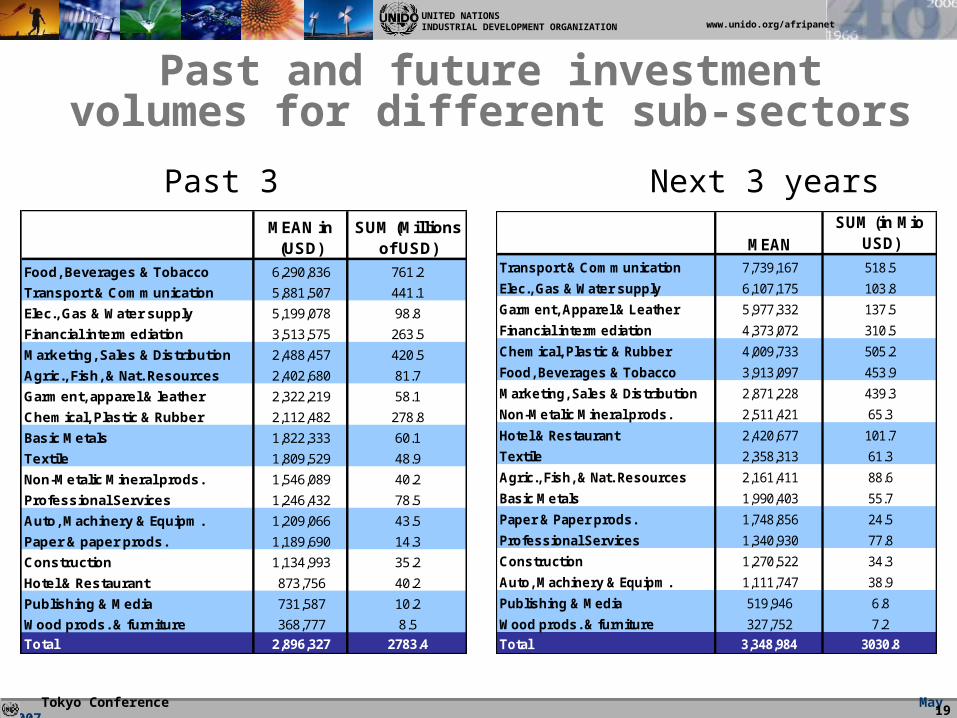
Past and future investment volumes for different sub-sectors
Past 3 years Next 3 years
MEANSUM (in Mio
USD)
Transport & Communication 7,739,167 518.5
Elec., Gas & Water supply 6,107,175 103.8
Garment, Apparel & Leather 5,977,332 137.5
Financial intermediation 4,373,072 310.5
Chemical, Plastic & Rubber 4,009,733 505.2
Food, Beverages & Tobacco 3,913,097 453.9
Marketing, Sales & Distribution 2,871,228 439.3
Non-Metalic Mineral prods. 2,511,421 65.3
Hotel & Restaurant 2,420,677 101.7
Textile 2,358,313 61.3
Agric., Fish, & Nat. Resources 2,161,411 88.6
Basic Metals 1,990,403 55.7
Paper & Paper prods. 1,748,856 24.5
Professional Services 1,340,930 77.8
Construction 1,270,522 34.3
Auto, Machinery & Equipm. 1,111,747 38.9
Publishing & Media 519,946 6.8
Wood prods. & furniture 327,752 7.2
Total 3,348,984 3030.8
MEAN in (USD)
SUM (Millions of USD)
Food, Beverages & Tobacco 6,290,836 761.2
Transport & Communication 5,881,507 441.1
Elec., Gas & Water supply 5,199,078 98.8
Financial intermediation 3,513,575 263.5
Marketing, Sales & Distribution 2,488,457 420.5
Agric., Fish, & Nat. Resources 2,402,680 81.7
Garment, apparel & leather 2,322,219 58.1
Chemical, Plastic & Rubber 2,112,482 278.8
Basic Metals 1,822,333 60.1
Textile 1,809,529 48.9
Non-Metalic Mineral prods. 1,546,089 40.2
Professional Services 1,246,432 78.5
Auto, Machinery & Equipm. 1,209,066 43.5
Paper & paper prods. 1,189,690 14.3
Construction 1,134,993 35.2
Hotel & Restaurant 873,756 40.2
Publishing & Media 731,587 10.2
Wood prods. & furniture 368,777 8.5
Total 2,896,327 2783.4
www.unido.org/afripanet
Tokyo Conference May 2007
UNITED NATIONSINDUSTRIAL DEVELOPMENT ORGANIZATION
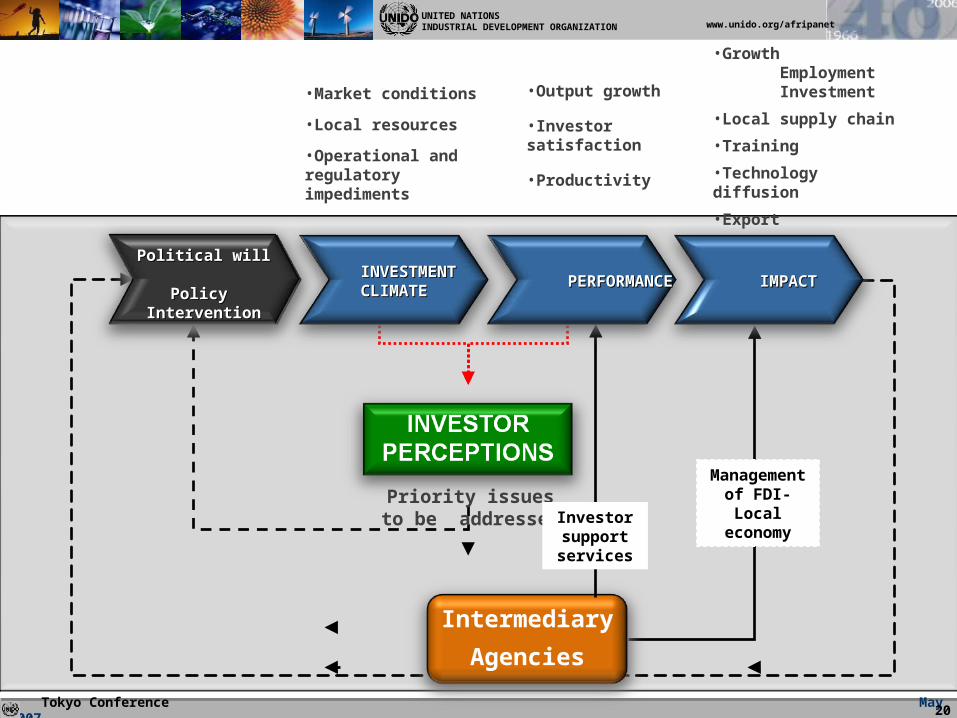
20
Intermediary
Agencies
Political willPolitical will INVESTMENTINVESTMENTCLIMATECLIMATE PERFORMANCEPERFORMANCE IMPACTIMPACT
Management of FDI-Local
economy
•Growth Employment Investment
•Local supply chain
•Training
•Technology diffusion
•Export
•Output growth
•Investor satisfaction
•Productivity
•Market conditions
•Local resources
•Operational and regulatory impediments
Priority issues to be addressed Investor
support services
Political willPolitical will
Policy Policy InterventionIntervention
www.unido.org/afripanet
Tokyo Conference May 2007
UNITED NATIONSINDUSTRIAL DEVELOPMENT ORGANIZATION
21
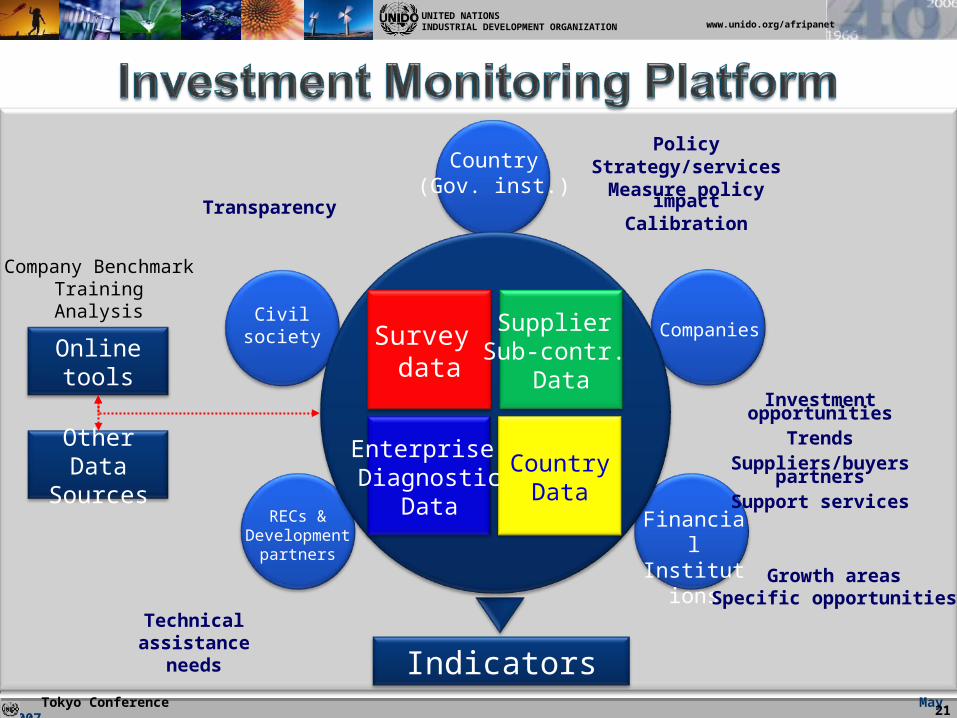
Indicators
PolicyStrategy/services
Measure policy impactCalibration
Survey data
CountryData
Enterprise Diagnostic
Data
Supplier Sub-contr.
Data
Country(Gov. inst.)
Civilsociety
RECs &Development
partners
FinancialInstitutions
Companies
Investment opportunitiesTrends
Suppliers/buyers partnersSupport services
Growth areasSpecific opportunities
Technical assistance
needs
Transparency
Online tools
Other Data
Sources
Company BenchmarkTrainingAnalysis
www.unido.org/afripanet
Tokyo Conference May 2007
UNITED NATIONSINDUSTRIAL DEVELOPMENT ORGANIZATION
22
www.unido.org/afripanet
Tokyo Conference May 2007
UNITED NATIONSINDUSTRIAL DEVELOPMENT ORGANIZATION
23
Thank you.
www.unido.org/afripanet
Mr. Yoshiteru Uramoto
Deputy to UNIDO Director General