Embed Size (px)
Citation preview
XX--ray diffraction: A tool for Materials ray diffraction: A tool for Materials ResearchResearch
Structure and Properties of functional materials
Email: [email protected]: [email protected]
S. N. AcharyS. N. AcharyChemistry Division Chemistry Division
BhabhaBhabha Atomic Research CentreAtomic Research CentreMumbai Mumbai –– 400 085400 085
(Out lines)(Out lines)
•• Functional MaterialsFunctional Materials
•• Rietveld refinementRietveld refinement
•• Selected examples of structure and properties Selected examples of structure and properties
•• Framework solidsFramework solids
•• PerovskitePerovskite and related materialsand related materials
•• Dilute magnetic semiconductorDilute magnetic semiconductor
•• OthersOthers
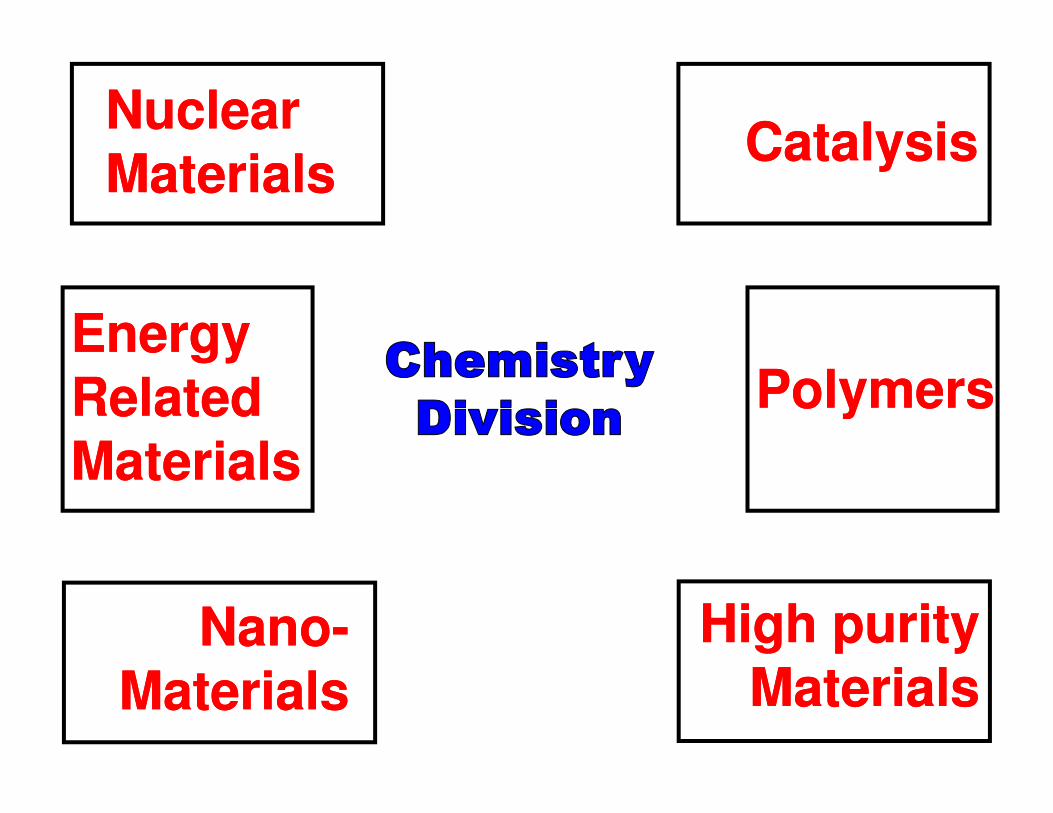
Nuclear Nuclear MaterialsMaterials
Energy Energy Related Related
CatalysisCatalysis
Polymers Polymers Related Related MaterialsMaterials
NanoNano--MaterialsMaterials
Polymers Polymers
High purity High purity MaterialsMaterials
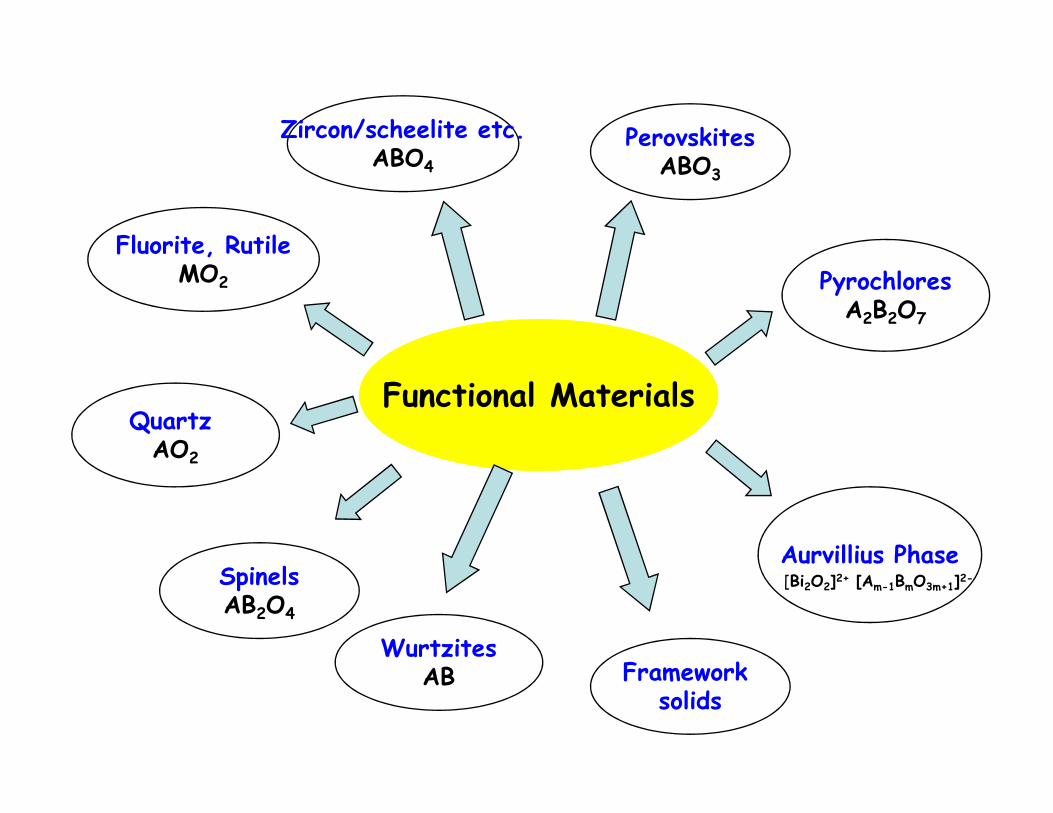
Functional Materials
Zircon/scheelite etc.ABO4
Fluorite, RutileMO2 Pyrochlores
A2B2O7
PerovskitesABO3
Quartz Functional Materials
WurtzitesAB
SpinelsAB2O4
Framework solids
Aurvillius Phase[Bi2O2]2+ [Am-1BmO3m+1]2-
Quartz AO2
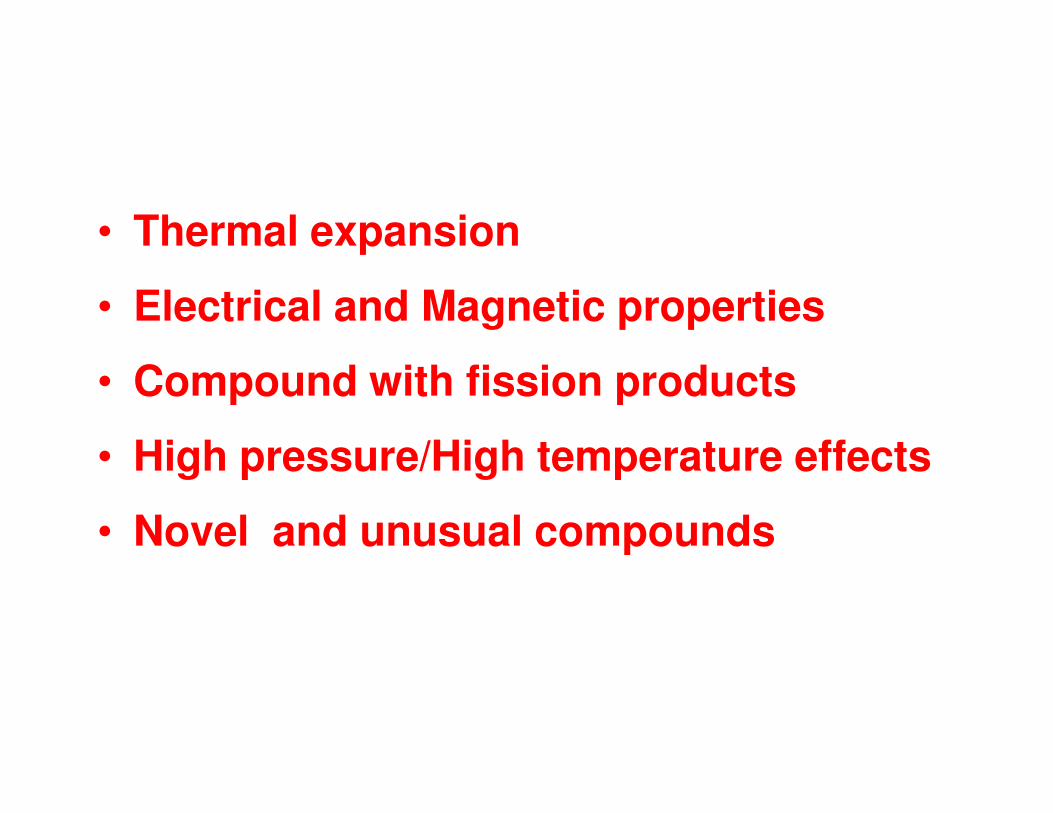
• Thermal expansion
• Electrical and Magnetic properties
• Compound with fission products
• High pressure/High temperature effects
• Novel and unusual compounds
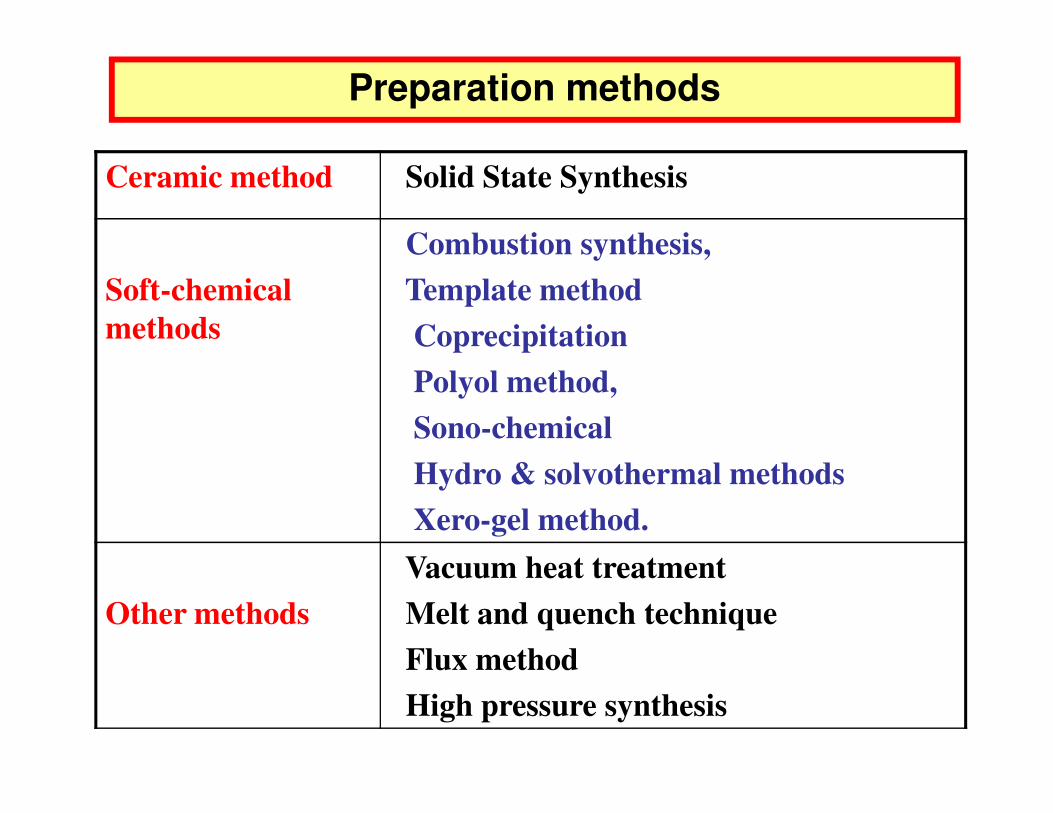
Ceramic method Solid State Synthesis
Soft-chemical methods
Combustion synthesis,Template methodCoprecipitationPolyol method,
Preparation methods
Sono-chemicalHydro & solvothermal methods Xero-gel method.
Other methodsVacuum heat treatmentMelt and quench techniqueFlux methodHigh pressure synthesis
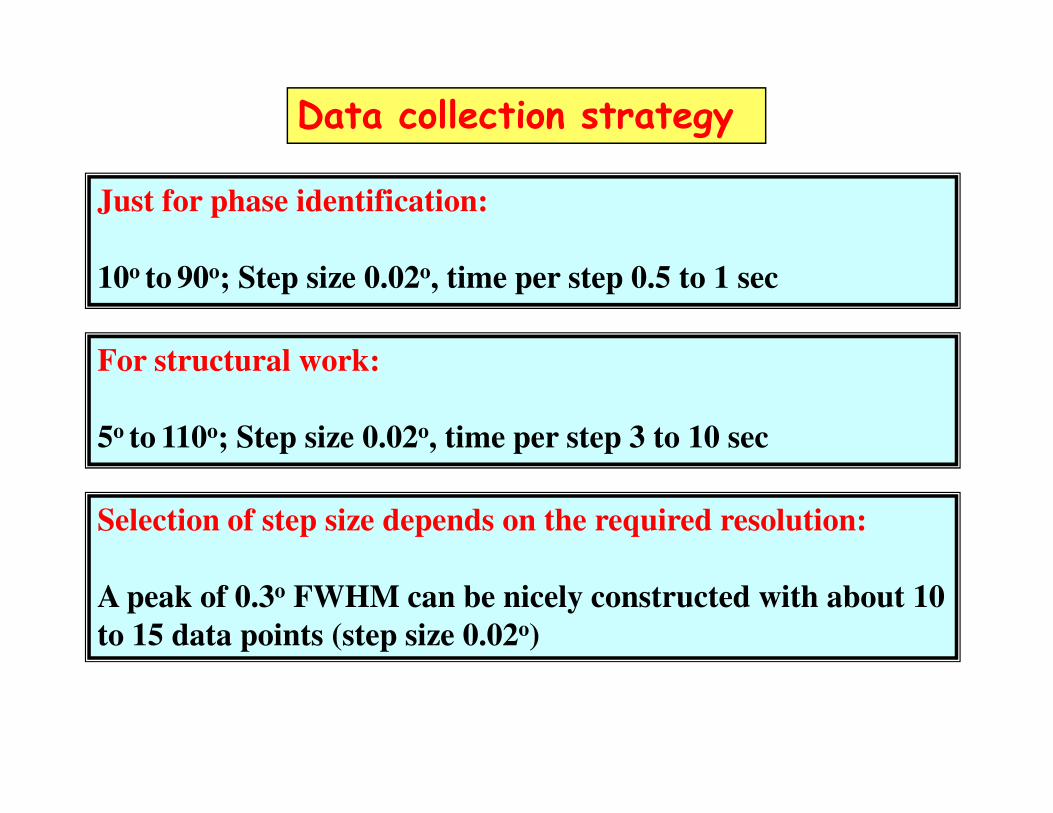
Data collection strategy
Just for phase identification:
10o to 90o; Step size 0.02o, time per step 0.5 to 1 sec
For structural work:
5o to 110o; Step size 0.02o, time per step 3 to 10 sec
Selection of step size depends on the required resolution:
A peak of 0.3o FWHM can be nicely constructed with about 10 to 15 data points (step size 0.02o)
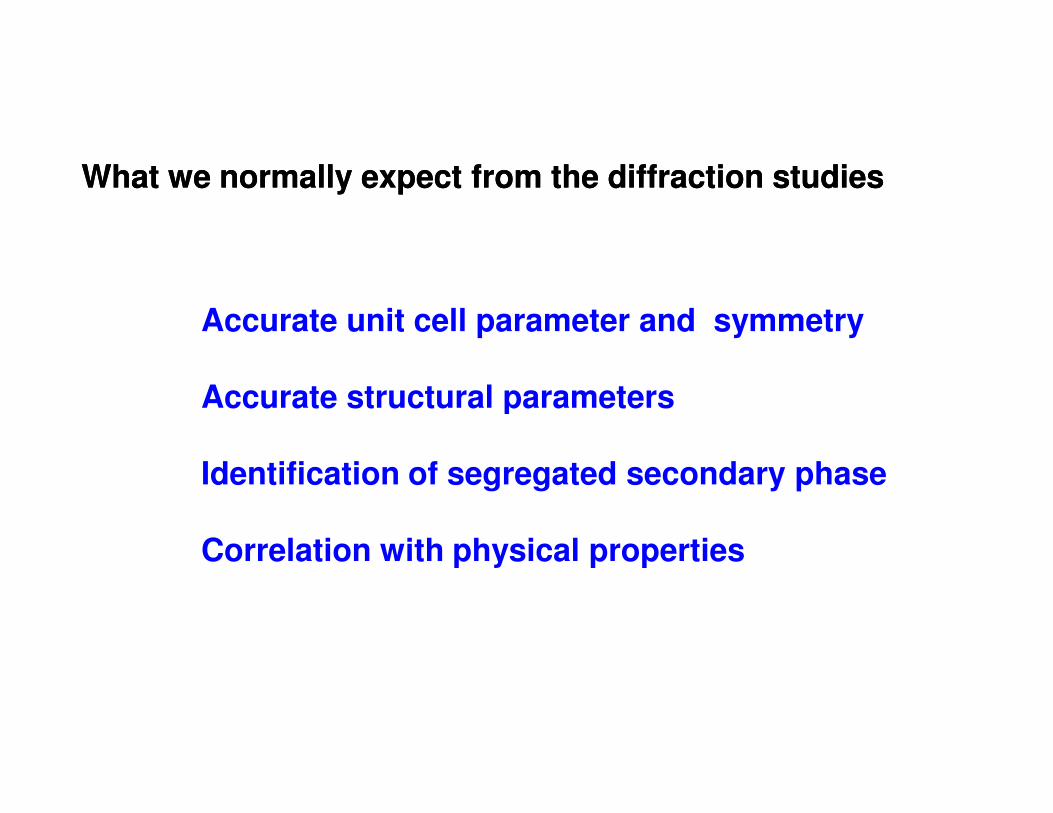
What we normally expect from the diffraction studiesWhat we normally expect from the diffraction studies
Accurate unit cell parameter and symmetry
Accurate structural parametersAccurate structural parameters
Identification of segregated secondary phase
Correlation with physical properties
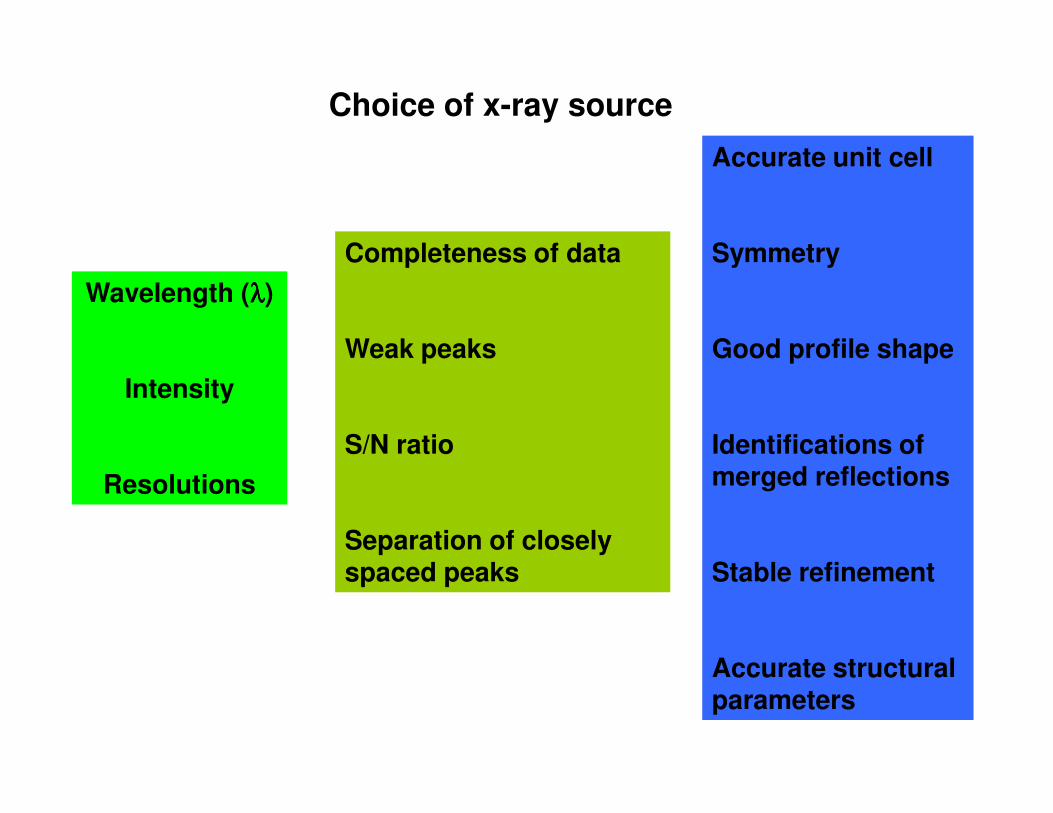
Choice of x-ray source
Wavelength (λλλλ)
Intensity
Completeness of data
Weak peaks
Accurate unit cell
Symmetry
Good profile shape
Resolutions
S/N ratio
Separation of closely spaced peaks
Identifications of merged reflections
Stable refinement
Accurate structural parameters
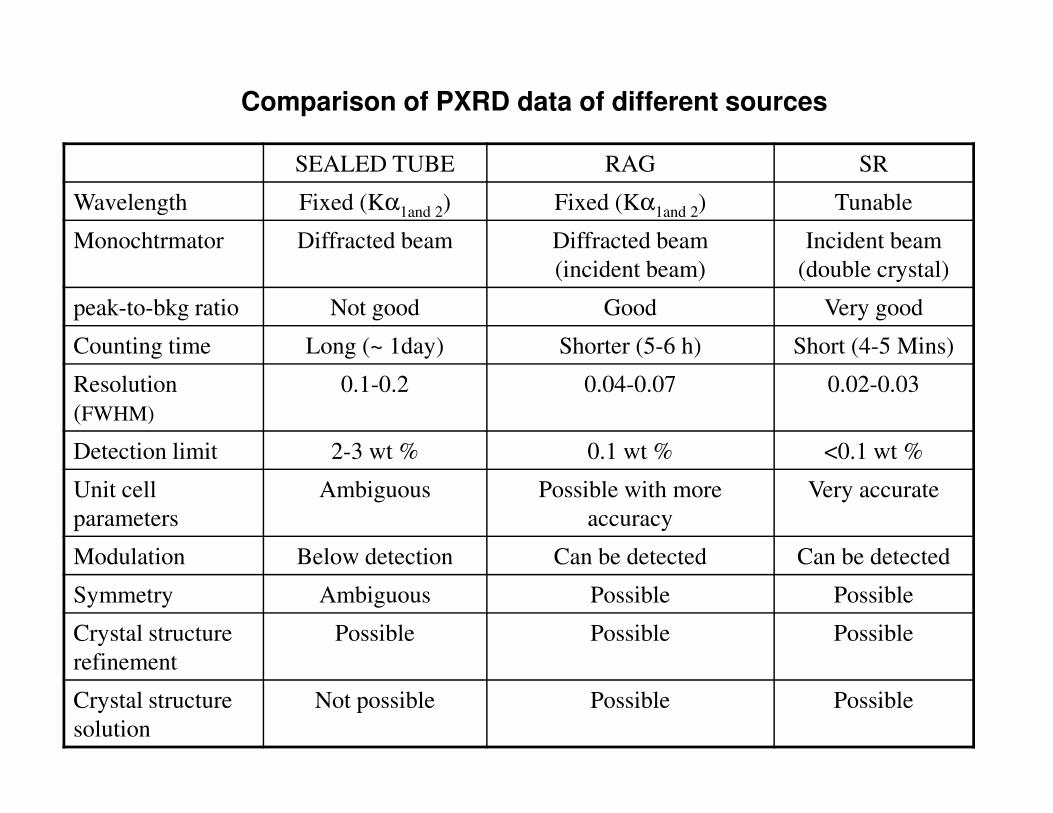
SEALED TUBE RAG SR
Wavelength Fixed (Kα1and 2) Fixed (Kα1and 2) Tunable
Monochtrmator Diffracted beam Diffracted beam
(incident beam)
Incident beam
(double crystal)
peak-to-bkg ratio Not good Good Very good
Counting time Long (~ 1day) Shorter (5-6 h) Short (4-5 Mins)
Resolution
(FWHM)
0.1-0.2 0.04-0.07 0.02-0.03
Comparison of PXRD data of different sources
(FWHM)
Detection limit 2-3 wt % 0.1 wt % <0.1 wt %
Unit cell
parameters
Ambiguous Possible with more
accuracy
Very accurate
Modulation Below detection Can be detected Can be detected
Symmetry Ambiguous Possible Possible
Crystal structure
refinement
Possible Possible Possible
Crystal structure
solution
Not possible Possible Possible
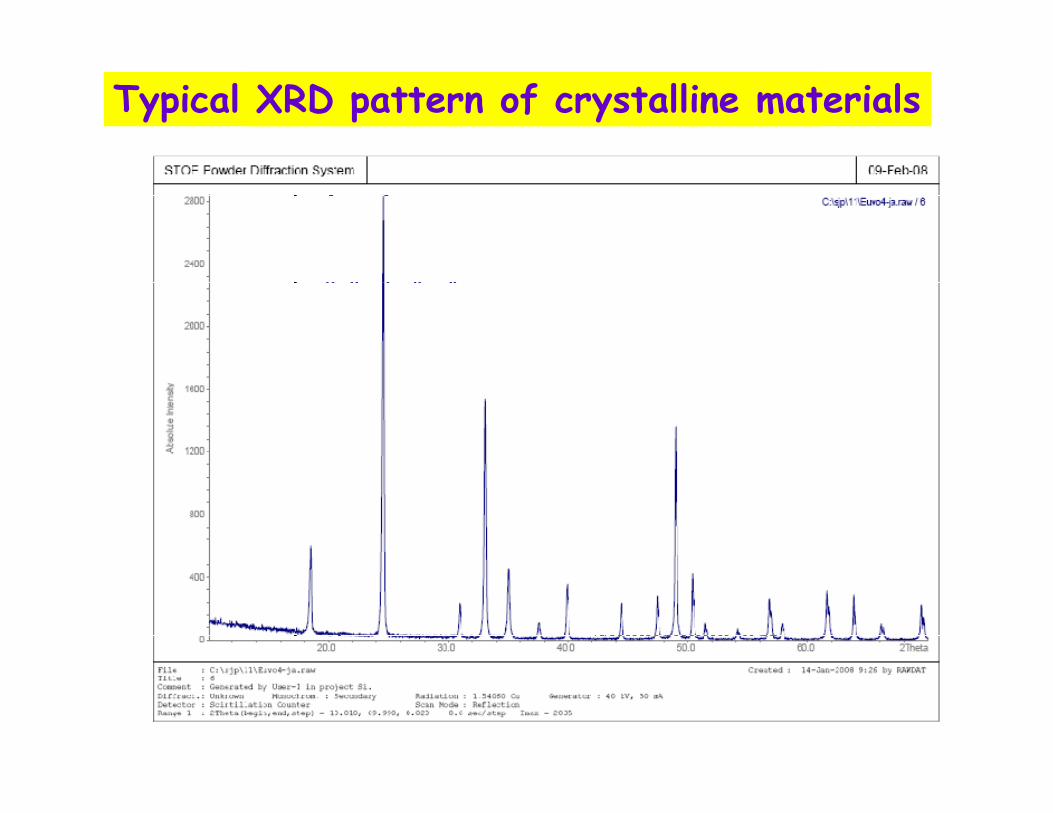
Comparative X-Ray Scattering
Crystals% I
2θθθθ
Typical XRD pattern of crystalline materials
Amorphous Solids or Liquids
Monoatomic gas
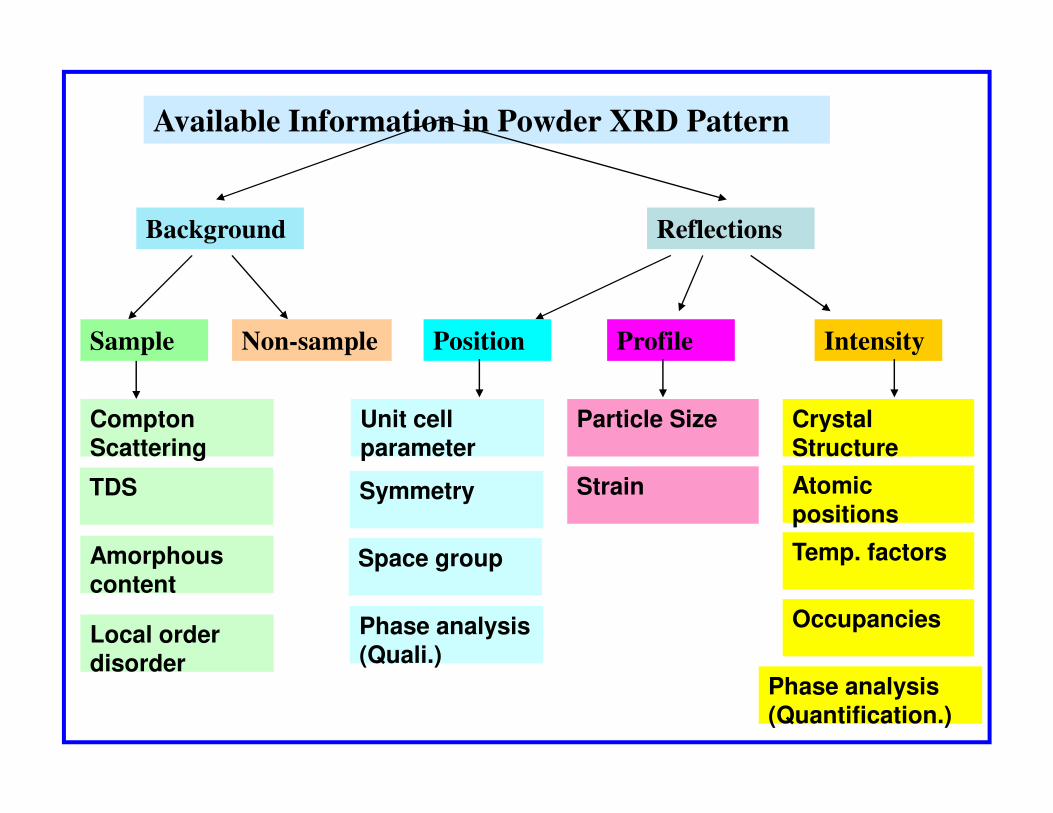
Available Information in Powder XRD Pattern
Background Reflections
Non-sampleSample
Compton
Position IntensityProfile
Unit cell Particle Size Crystal Compton Scattering
TDS
Amorphous content
Local order disorder
Unit cell parameter
Symmetry
Space group
Phase analysis (Quali.)
Particle Size
Strain
Crystal Structure
Atomic positions
Temp. factors
Occupancies
Phase analysis (Quantification.)
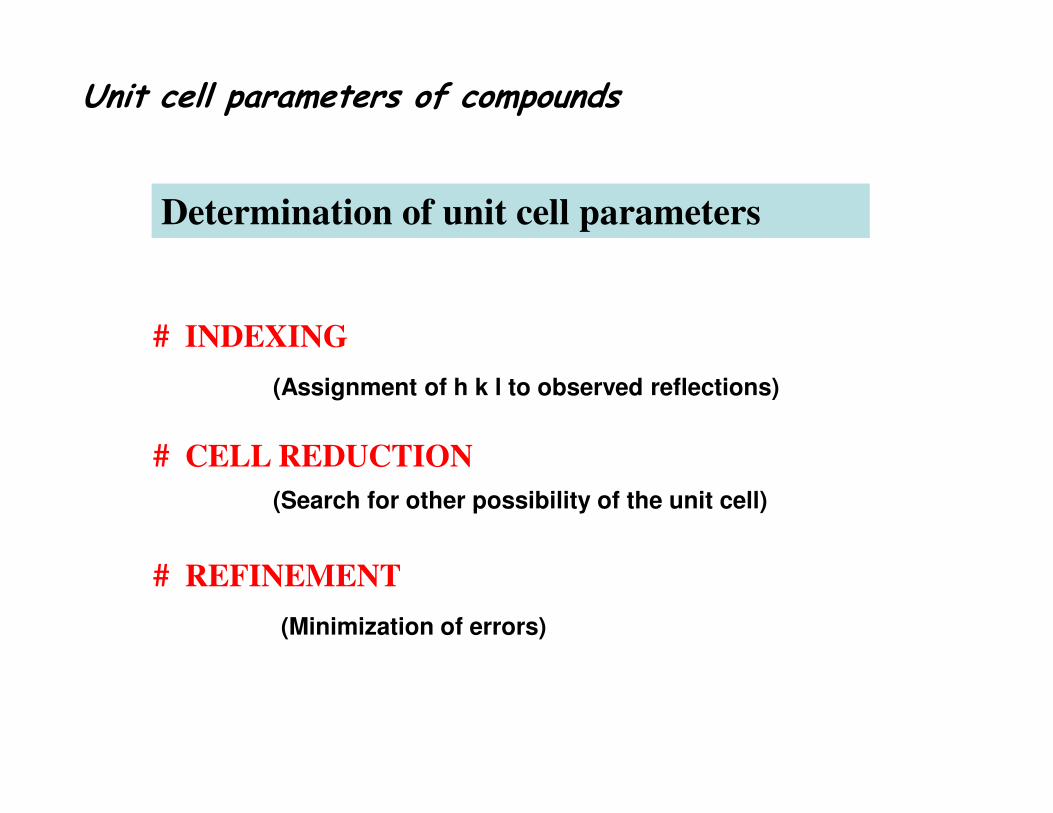
Determination of unit cell parameters
# INDEXING
(Assignment of h k l to observed reflections)
Unit cell parameters of compounds
# CELL REDUCTION
# REFINEMENT
(Search for other possibility of the unit cell)
(Minimization of errors)
(((( )))) (((( )))) (((( ))))CosγCosβCosαγCosβCosαCos
CosβCosαCosγca
lhCosαCosγCosβ
bc
kl CosγCosβCosα
ab
hkγSin
c
lβSin
b
kαSin
a
h
d ⋅⋅⋅⋅⋅⋅⋅⋅++++−−−−−−−−−−−−
−−−−⋅⋅⋅⋅++++−−−−⋅⋅⋅⋅++++−−−−⋅⋅⋅⋅++++++++++++====
21
2221
222
22
22
2
22
2
2
2
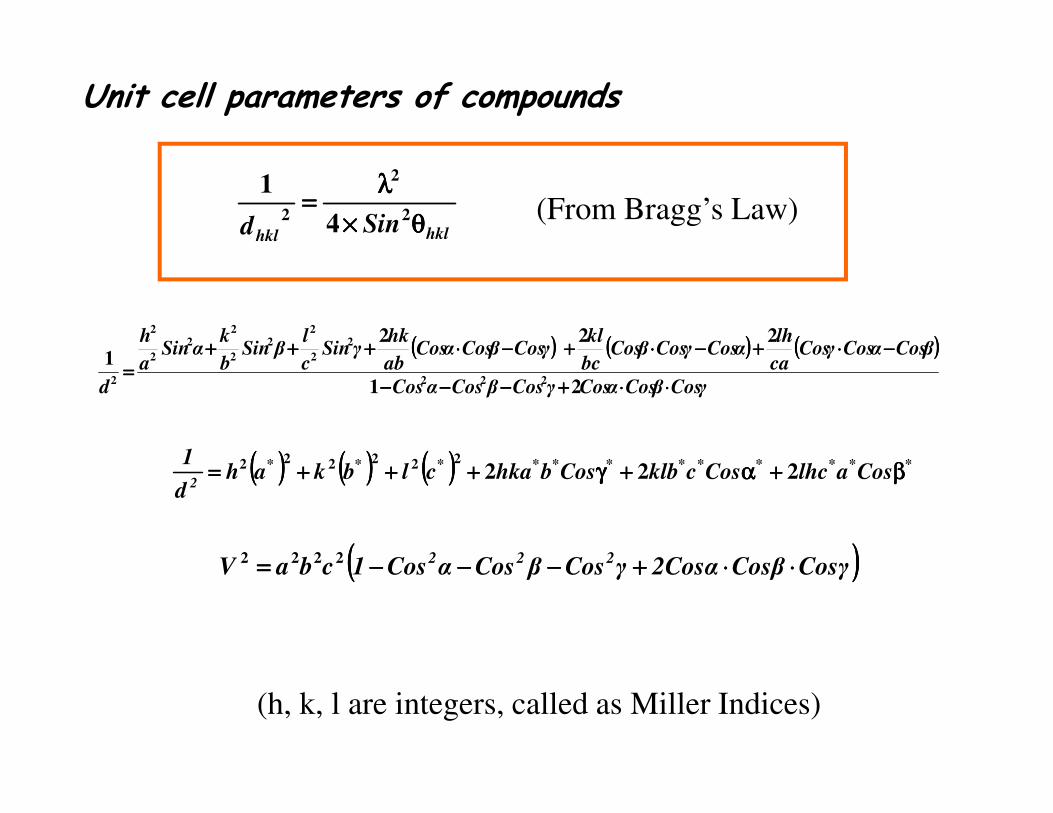
Unit cell parameters of compounds
hklhklSind θθθθ××××
λλλλ====
2
2
2 4
1(From Bragg’s Law)
(((( ))))CosγCosβ2CosαγCosβCosαCos1cbaV222 ⋅⋅⋅⋅⋅⋅⋅⋅++++−−−−−−−−−−−−==== 2222
(((( )))) (((( )))) (((( )))) ************
2CosalhcCoscklbCosbhkaclbkah
d
1ββββ++++αααα++++γγγγ++++++++++++==== 222
222222
(h, k, l are integers, called as Miller Indices)
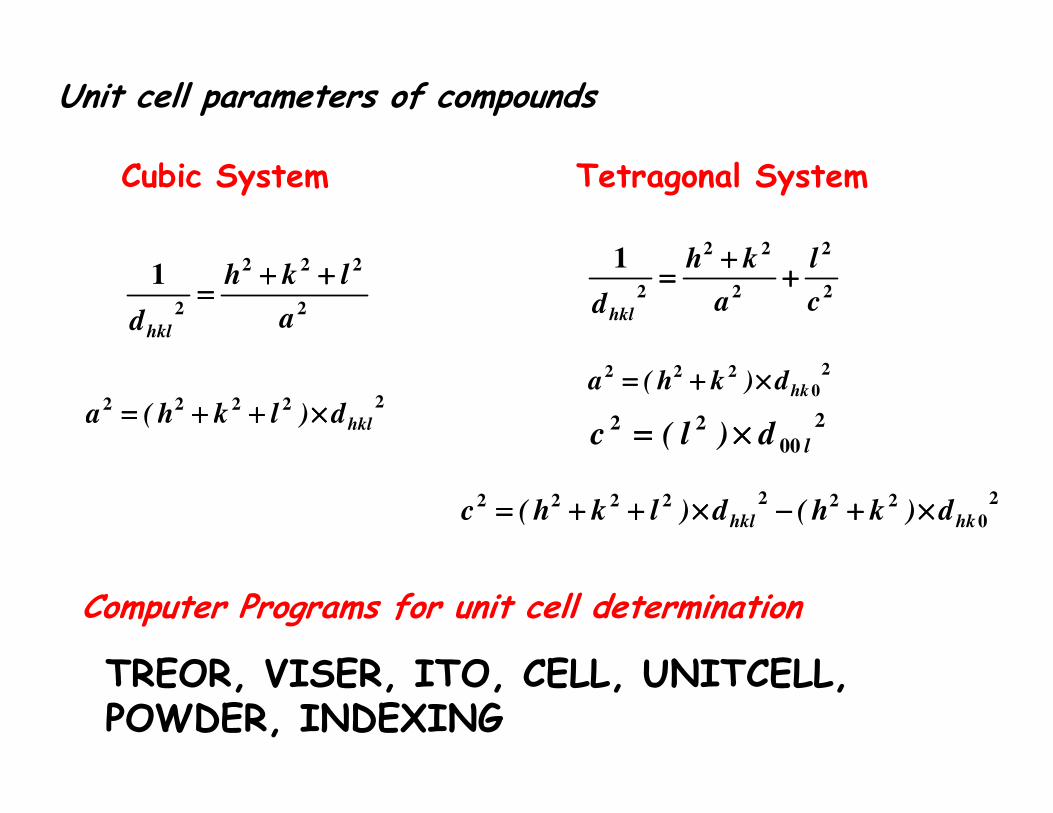
Cubic System
2
222
2
1
a
lkh
dhkl
++++++++====
22222 d)lkh(a ××××++++++++====
Unit cell parameters of compounds
2
2
2
22
2
1
c
l
a
kh
dhkl
++++++++
====
20
222hkd)kh(a ××××++++====
Tetragonal System
22222hkld)lkh(a ××××++++++++==== 2
0022
ld)l(c ××××====
20
2222222hkhkl d)kh(d)lkh(c ××××++++−−−−××××++++++++====
Computer Programs for unit cell determination
TREOR, VISER, ITO, CELL, UNITCELL, POWDER, INDEXING
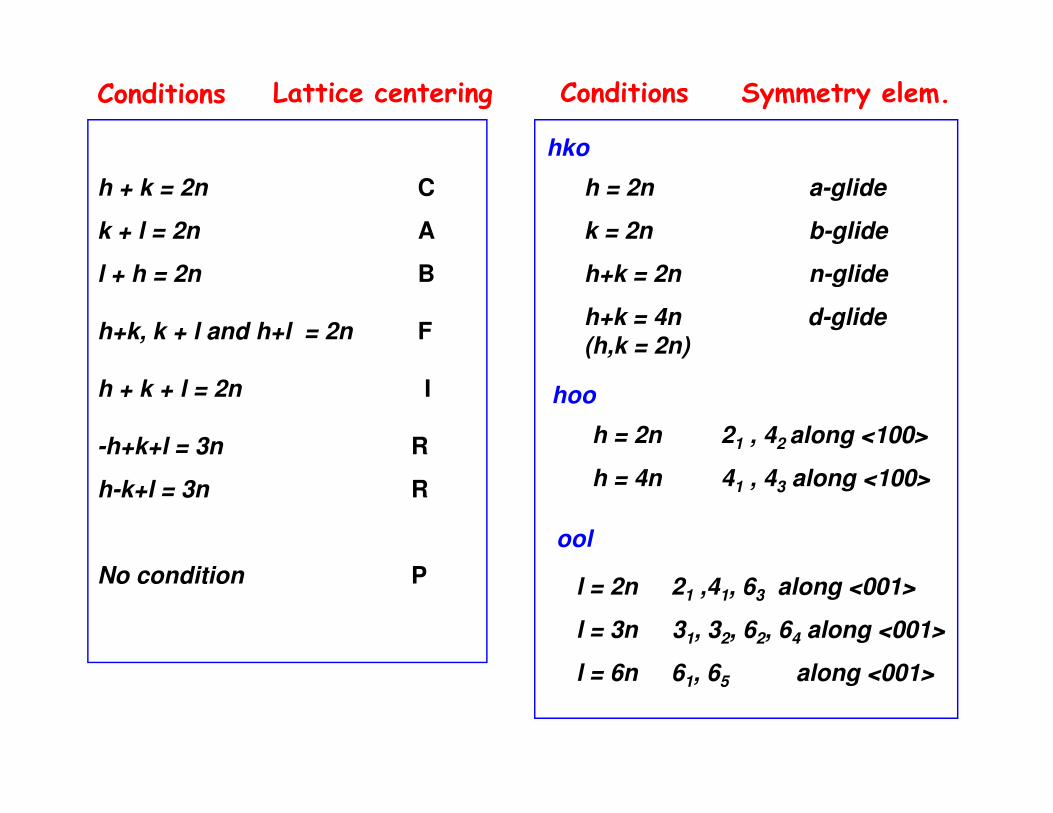
h + k = 2n C
k + l = 2n A
l + h = 2n B
h+k, k + l and h+l = 2n F
h + k + l = 2n I
Lattice centeringConditions Conditions Symmetry elem.
h = 2n a-glide
k = 2n b-glide
h+k = 2n n-glide
h+k = 4n d-glide(h,k = 2n)
hko
hoo
-h+k+l = 3n R
h-k+l = 3n R
No condition P
hoo
h = 2n 21 , 42 along <100>
h = 4n 41 , 43 along <100>
ool
l = 2n 21 ,41, 63 along <001>
l = 3n 31, 32, 62, 64 along <001>
l = 6n 61, 65 along <001>
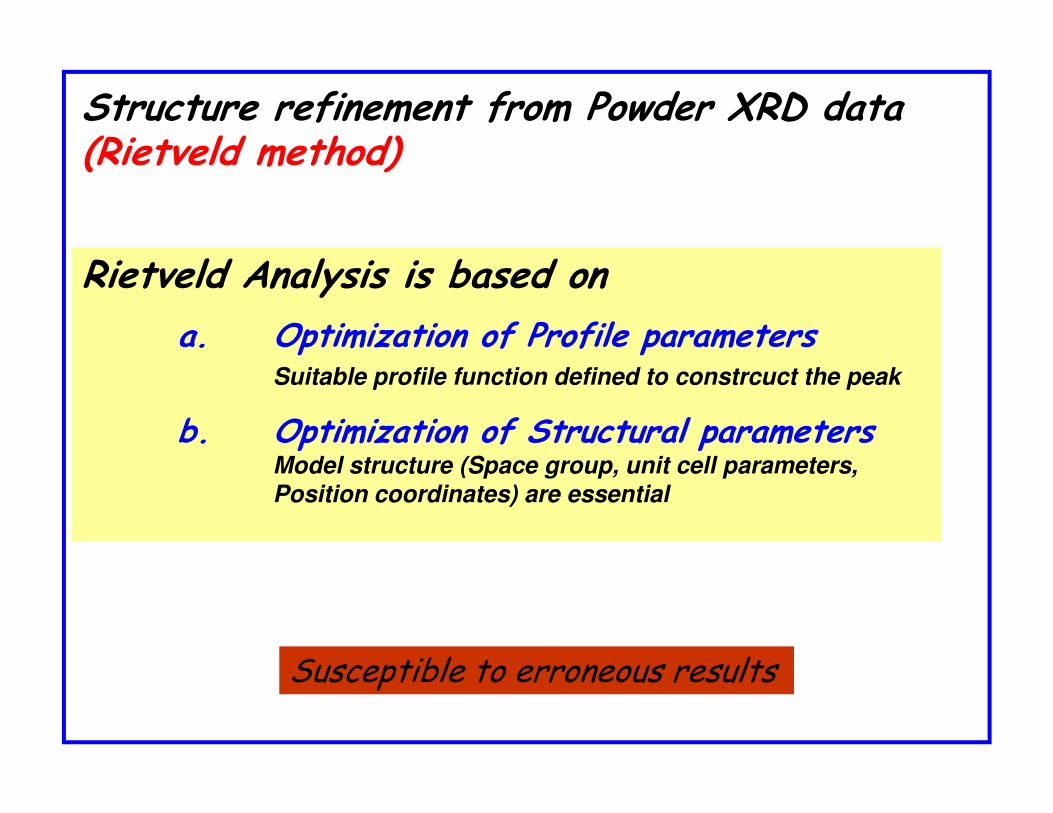
Structure refinement from Powder XRD data(Rietveld method)
Rietveld Analysis is based on
a. Optimization of Profile parameters Suitable profile function defined to constrcuct the peak
b. Optimization of Structural parametersModel structure (Space group, unit cell parameters,
Position coordinates) are essential
Susceptible to erroneous results
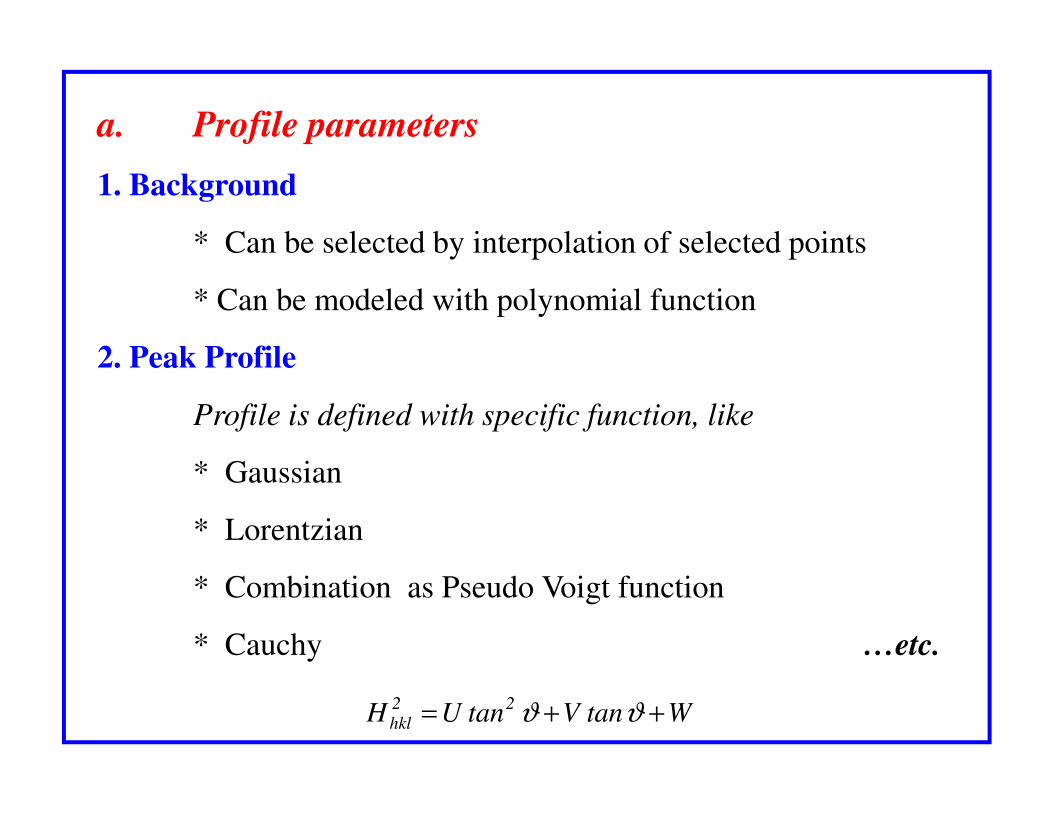
a. Profile parameters
1. Background
* Can be selected by interpolation of selected points
* Can be modeled with polynomial function
2. Peak Profile
Profile is defined with specific function, likeProfile is defined with specific function, like
* Gaussian
* Lorentzian
* Combination as Pseudo Voigt function
* Cauchy …etc.
WtanVtanUH22
hkl ++= ϑϑ
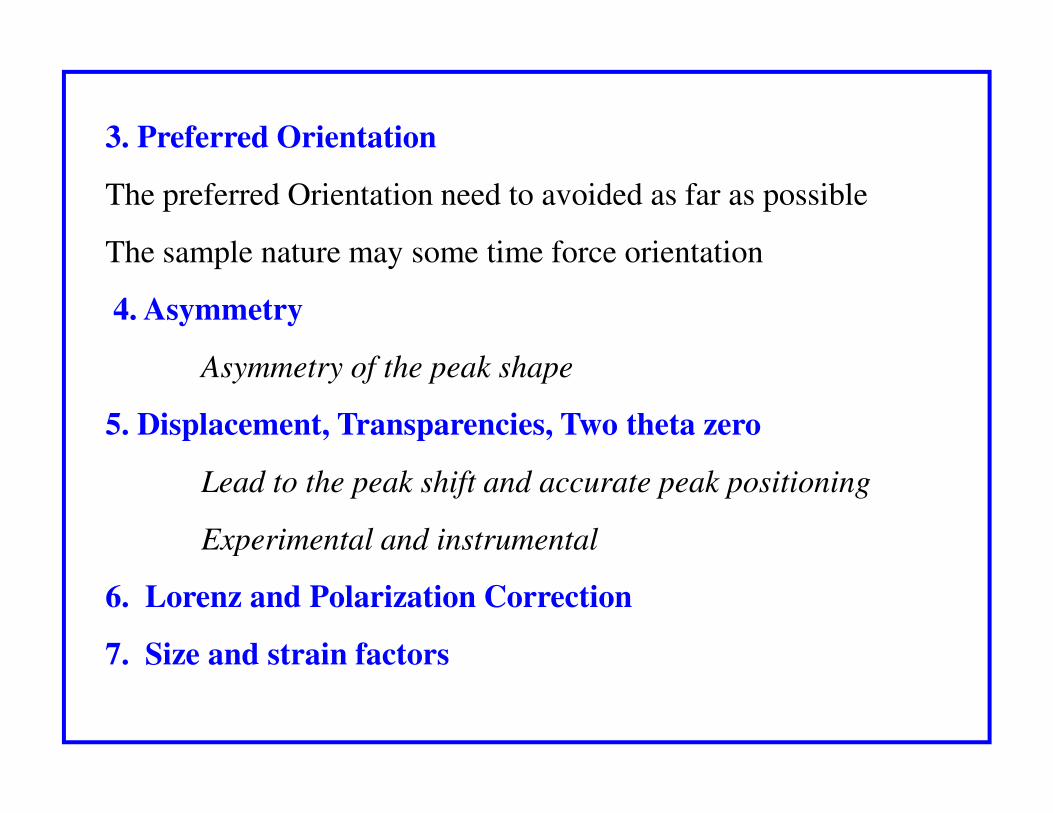
3. Preferred Orientation
The preferred Orientation need to avoided as far as possible
The sample nature may some time force orientation
4. Asymmetry
Asymmetry of the peak shape
5. Displacement, Transparencies, Two theta zero5. Displacement, Transparencies, Two theta zero
Lead to the peak shift and accurate peak positioning
Experimental and instrumental
6. Lorenz and Polarization Correction
7. Size and strain factors
1. Chemical details
2. Scattering factor/length of various atoms
3. Unit cell parameters and space group
b. Structural parameters
3. Unit cell parameters and space group
4. Positional details of all atoms
5. Occupancies
6. Thermal parameters (if available)
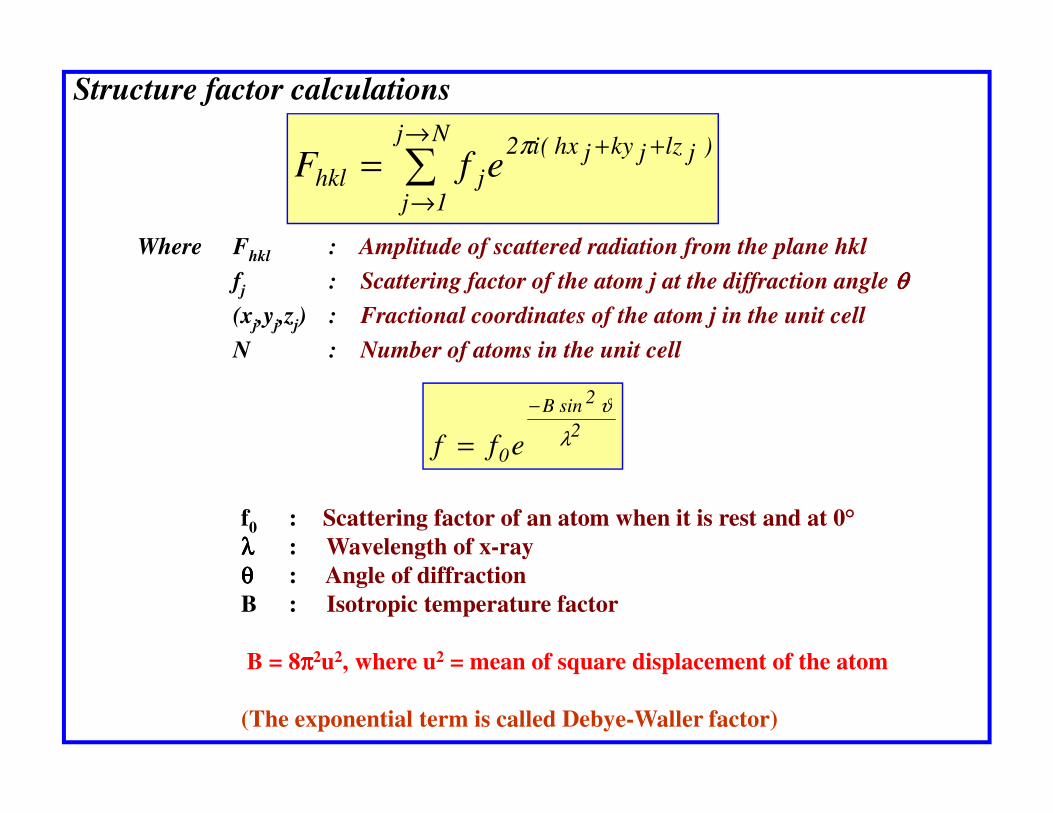
2sinB ϑ−
)jlzjkyjhx(i2Nj
1jjhkl efF
++→
→∑= π
Where Fhkl : Amplitude of scattered radiation from the plane hkl
fj : Scattering factor of the atom j at the diffraction angle θθθθ(xj,yj,zj) : Fractional coordinates of the atom j in the unit cell
N : Number of atoms in the unit cell
Structure factor calculations
2
2sinB
0eff λ
ϑ−
=
f0 : Scattering factor of an atom when it is rest and at 0°λλλλ : Wavelength of x-rayθθθθ : Angle of diffractionB : Isotropic temperature factor
B = 8ππππ2u2, where u2 = mean of square displacement of the atom
(The exponential term is called Debye-Waller factor)
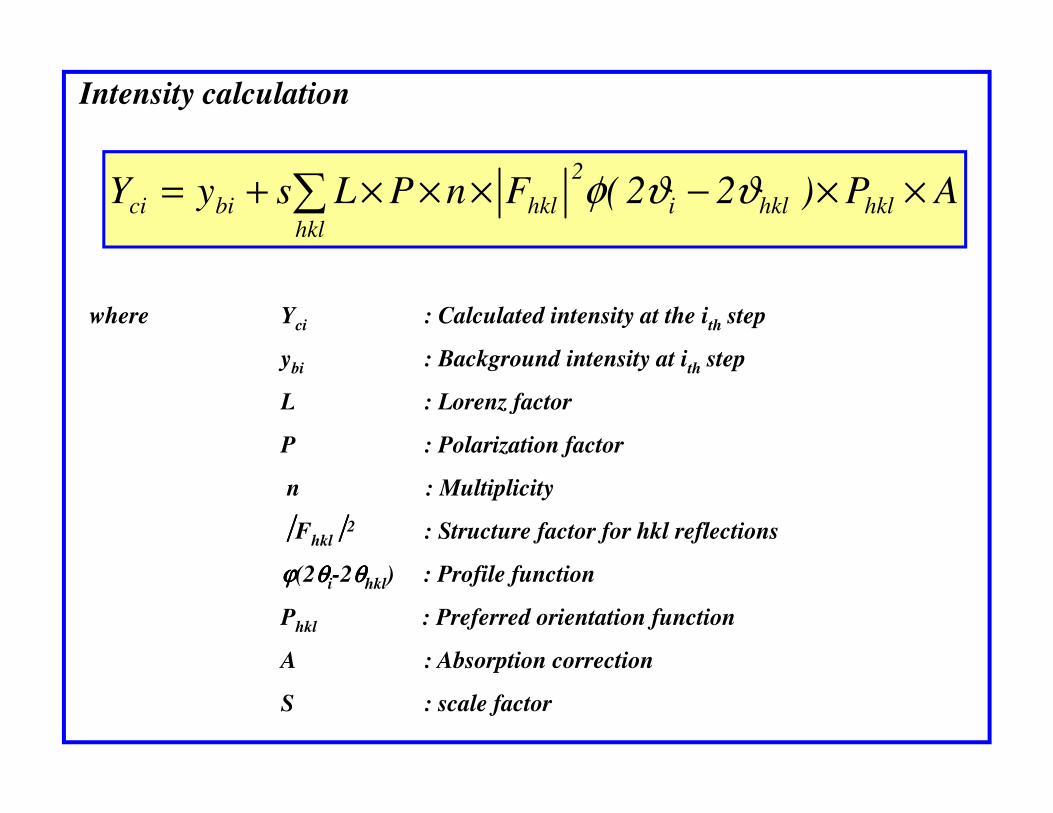
AP)22(FnPLsyY hklhkli
2
hklhklbici ××−×××+= ∑ ϑϑφ
Intensity calculation
where Yci : Calculated intensity at the ith step
ybi : Background intensity at ith step
L : Lorenz factorL : Lorenz factor
P : Polarization factor
n : Multiplicity
Fhkl2 : Structure factor for hkl reflections
ϕϕϕϕ(2θθθθi-2θθθθhkl) : Profile function
Phkl : Preferred orientation function
A : Absorption correction
S : scale factor
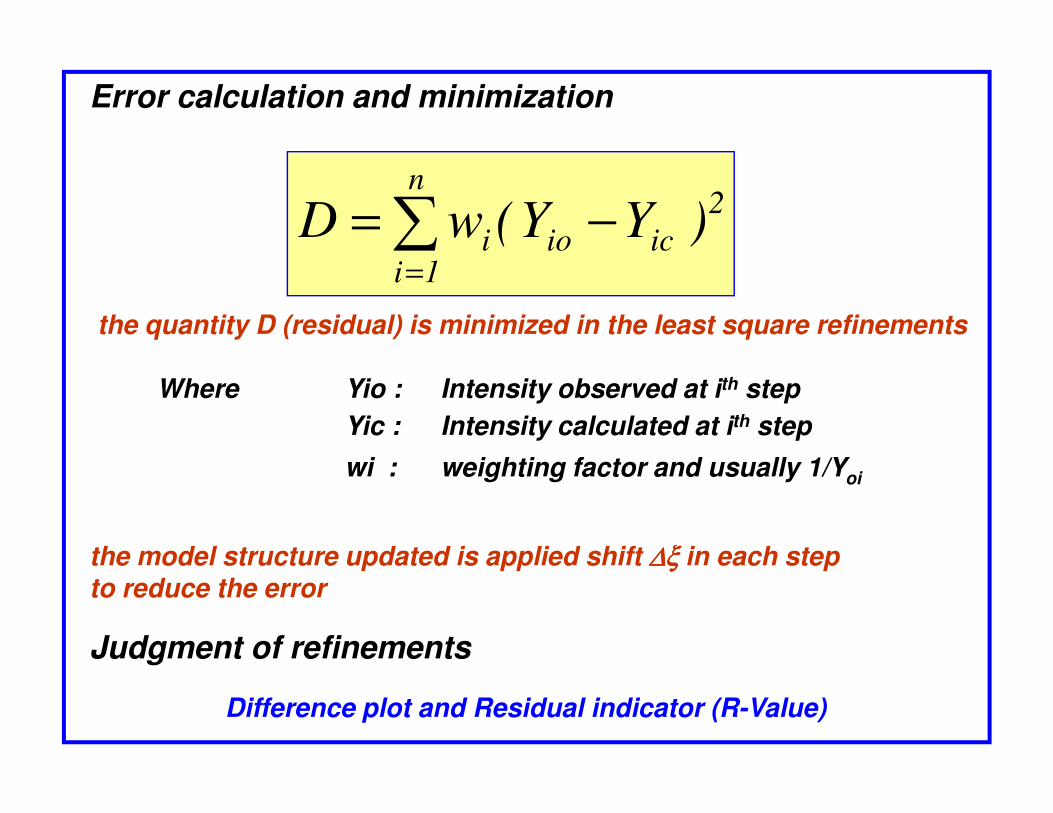
2
icio
n
1ii )YY(wD −= ∑
=
Where Yio : Intensity observed at ith step
Error calculation and minimization
the quantity D (residual) is minimized in the least square refinements
Yic : Intensity calculated at ith step
wi : weighting factor and usually 1/Yoi
the model structure updated is applied shift ∆ξ∆ξ∆ξ∆ξ in each stepto reduce the error
Judgment of refinements
Difference plot and Residual indicator (R-Value)
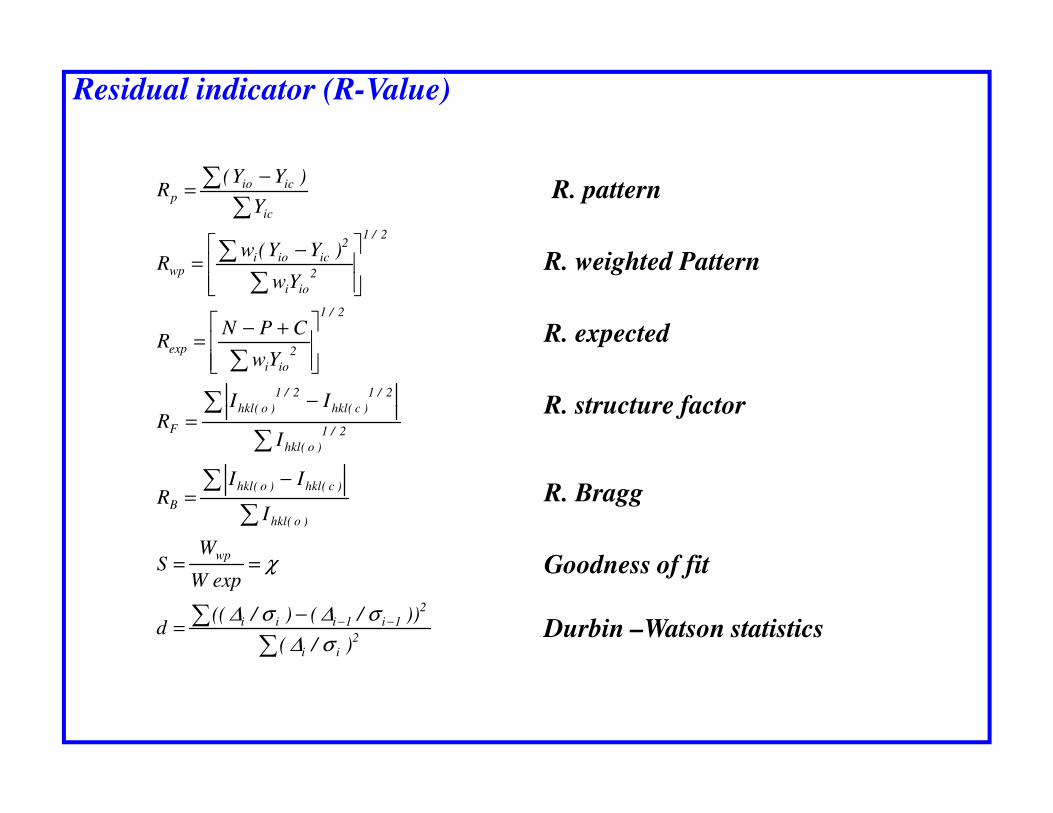
∑
∑
∑∑
∑∑
−
+−=
−=
−=
2/1
)c(hkl
2/1
)o(hkl
2/1
2
ioi
exp
2/1
2
ioi
2
icioiwp
ic
iciop
II
Yw
CPNR
Yw
)YY(wR
Y
)YY(R R. pattern
R. weighted Pattern
R. expected
R. structure factor
Residual indicator (R-Value)
∑∑
∑
∑
∑
∑
−−−=
==
−=
−=
2
ii
2
1i1iii
wp
)o(hkl
)c(hkl)o(hkl
B
2/1
)o(hkl
)c(hkl)o(hkl
F
)/(
))/()/((d
expW
WS
I
IIR
I
IIR
σ∆σ∆σ∆
χ
R. structure factor
R. Bragg
Goodness of fit
Durbin –Watson statistics
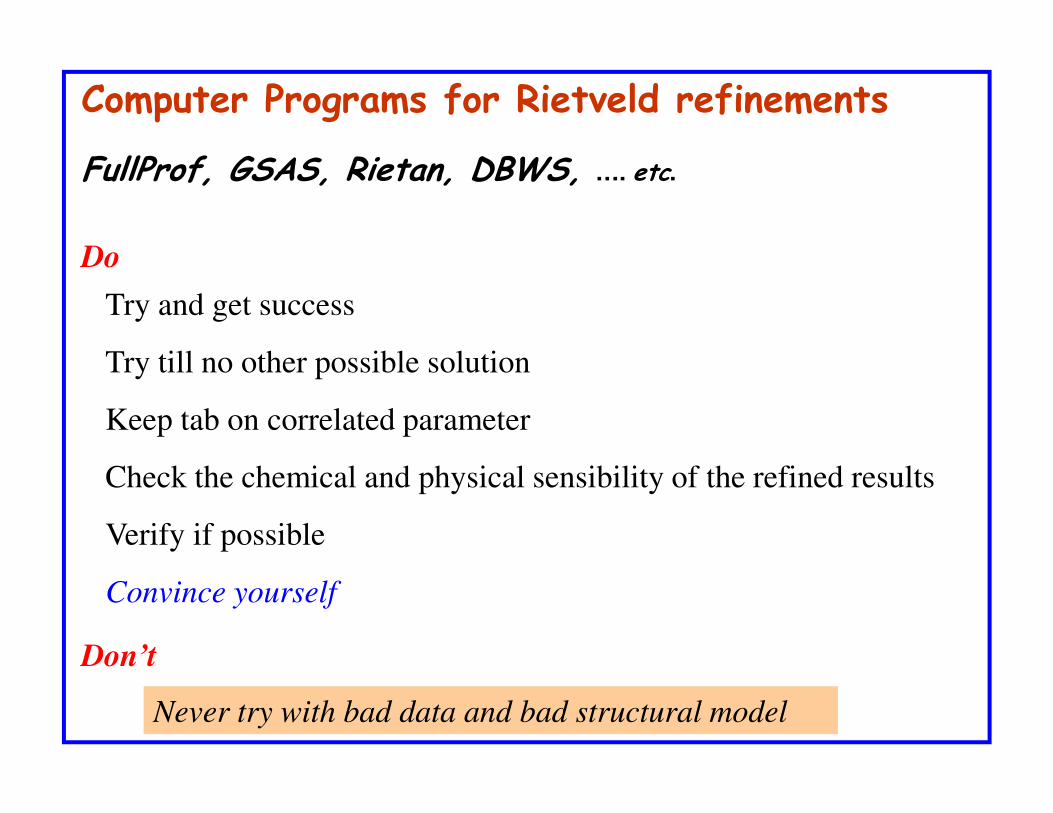
Do
Try and get success
Try till no other possible solution
Keep tab on correlated parameter
Computer Programs for Rietveld refinements
FullProf, GSAS, Rietan, DBWS, …. etc.
Keep tab on correlated parameter
Check the chemical and physical sensibility of the refined results
Verify if possible
Convince yourself
Don’t
Never try with bad data and bad structural model
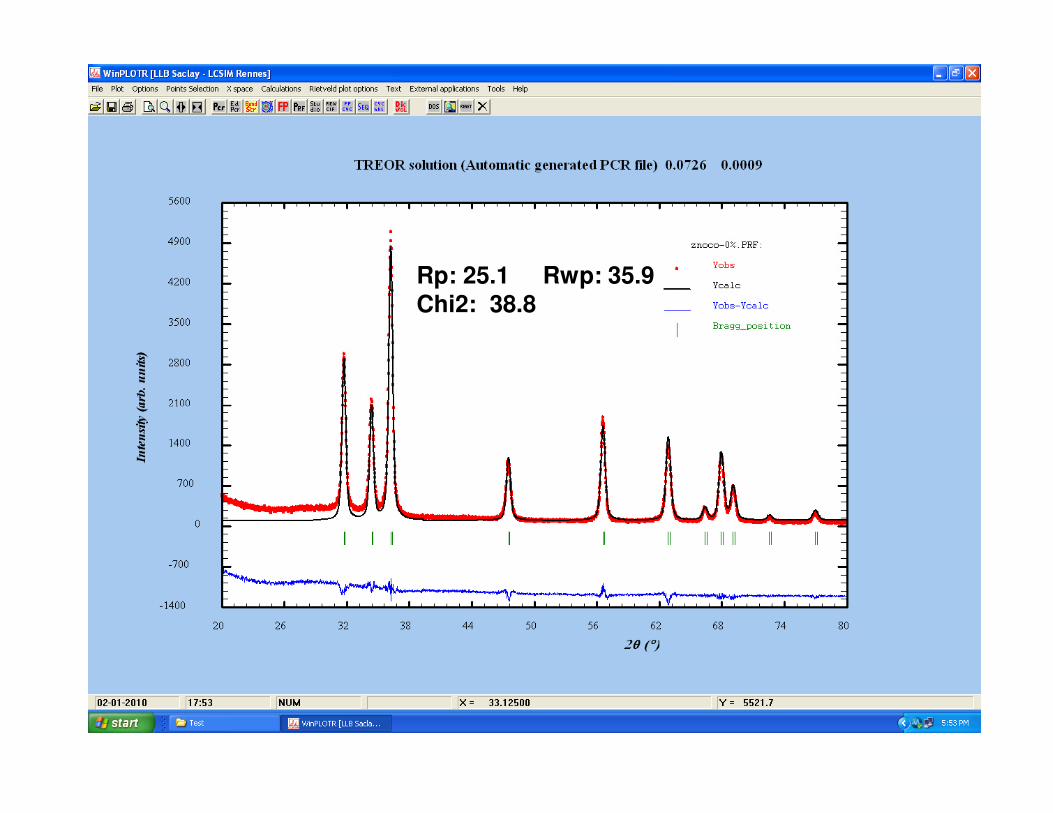
Rp: 25.1 Rwp: 35.9 Chi2: 38.8
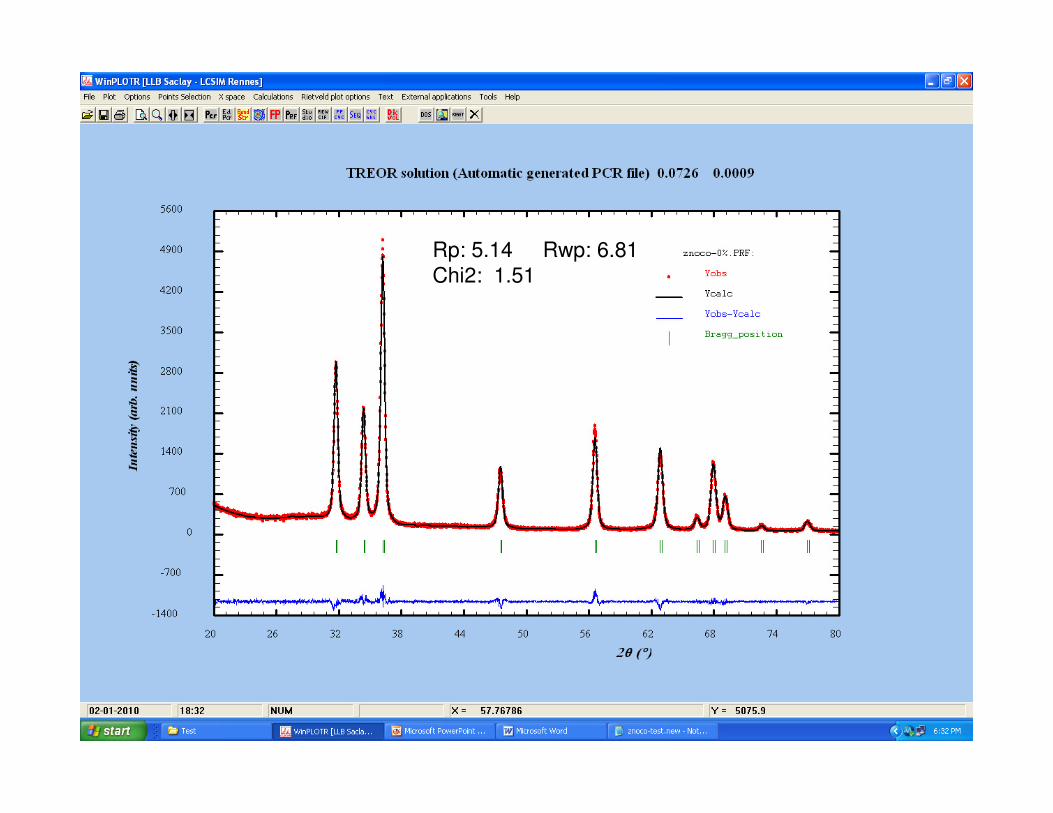
Rp: 5.14 Rwp: 6.81
Chi2: 1.51
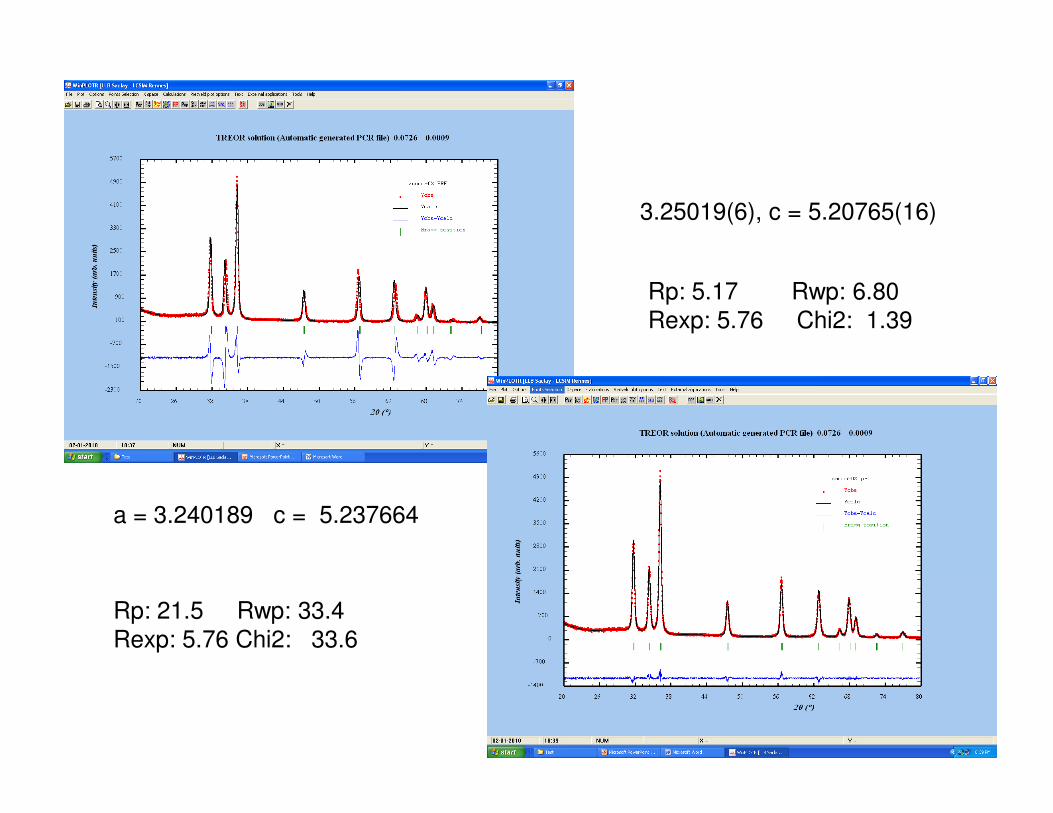
3.25019(6), c = 5.20765(16)
Rp: 5.17 Rwp: 6.80
Rexp: 5.76 Chi2: 1.39
a = 3.240189 c = 5.237664
Rp: 21.5 Rwp: 33.4
Rexp: 5.76 Chi2: 33.6
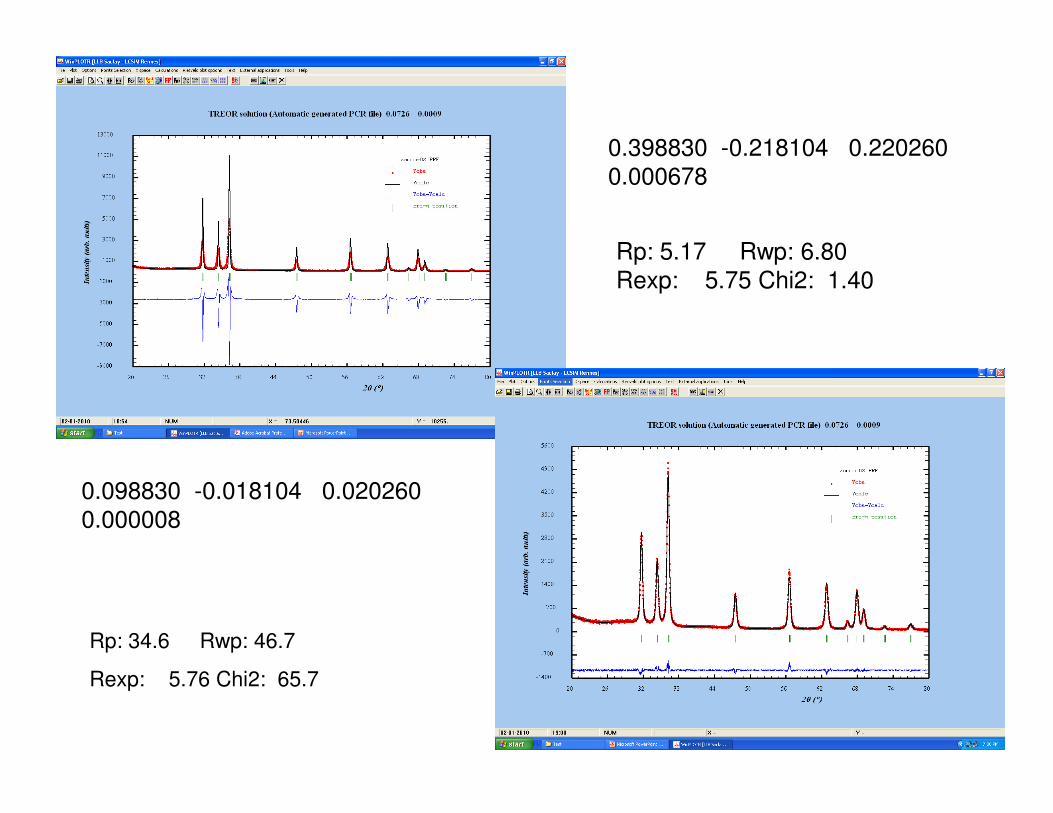
0.398830 -0.218104 0.220260
0.000678
Rp: 5.17 Rwp: 6.80
Rexp: 5.75 Chi2: 1.40
0.098830 -0.018104 0.020260
0.000008
Rp: 34.6 Rwp: 46.7
Rexp: 5.76 Chi2: 65.7
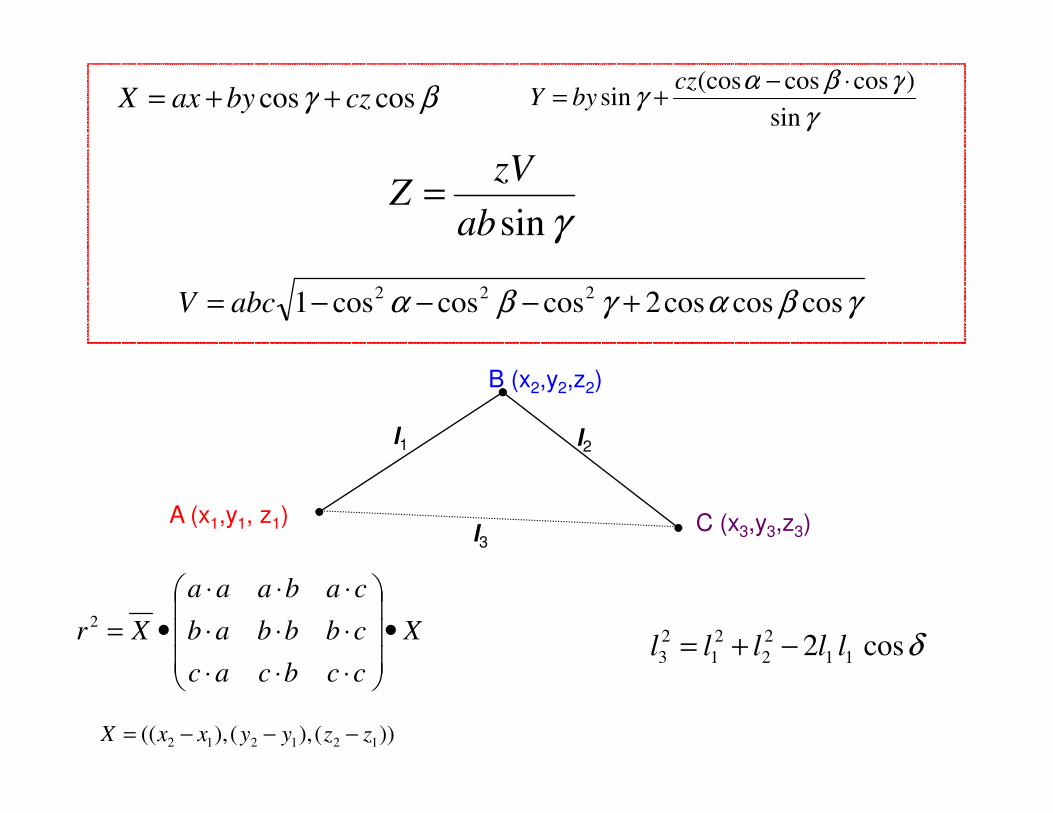
βγ coscos czbyaxX ++=γ
γβαγsin
)coscos(cossin
⋅−+=
czbyY
γsinab
zVZ =
γβαγβα coscoscos2coscoscos1 222 +−−−= abcV
B (x2,y2,z2)
X
ccbcac
cbbbab
cabaaa
Xr •
⋅⋅⋅⋅⋅⋅⋅⋅⋅
•=2
))(),(),(( 121212 zzyyxxX −−−=
l1 l2
l3A (x1,y1, z1) C (x3,y3,z3)
δcos2 11
2
2
2
1
2
3 lllll −+=
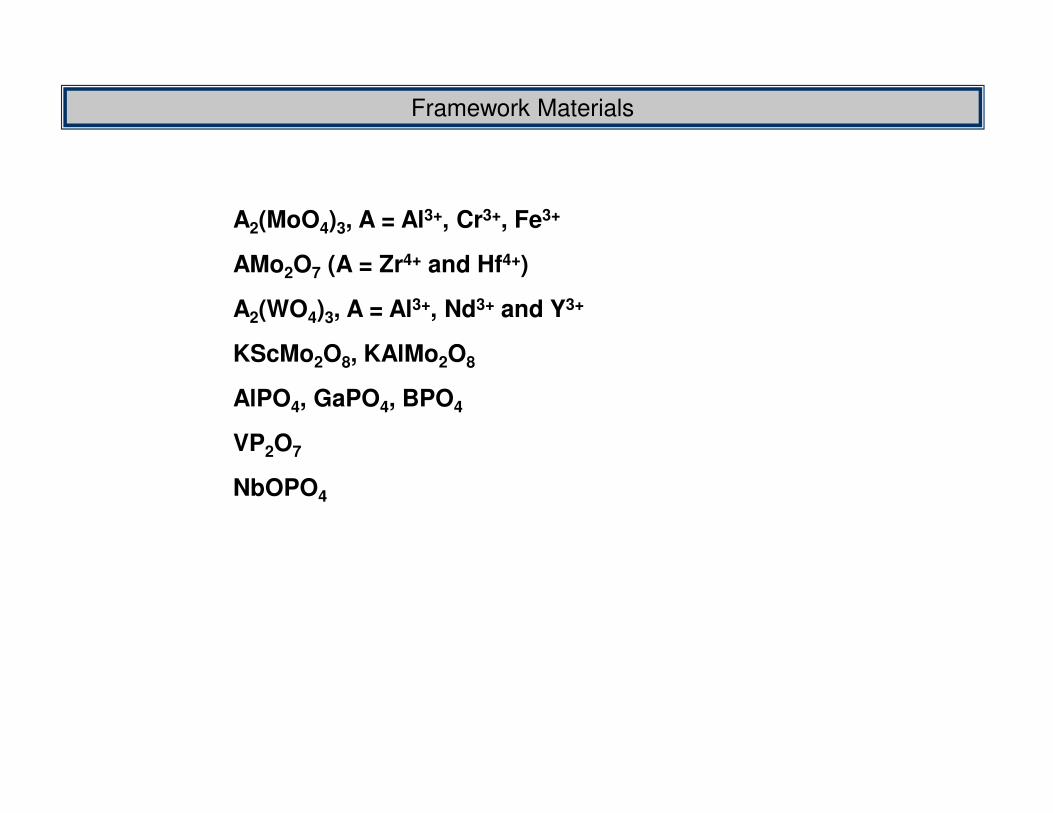
A2(MoO4)3, A = Al3+, Cr3+, Fe3+
AMo2O7 (A = Zr4+ and Hf4+)
A2(WO4)3, A = Al3+, Nd3+ and Y3+
KScMo2O8, KAlMo2O8
AlPO4, GaPO4, BPO4
Framework Materials
AlPO4, GaPO4, BPO4
VP2O7
NbOPO4
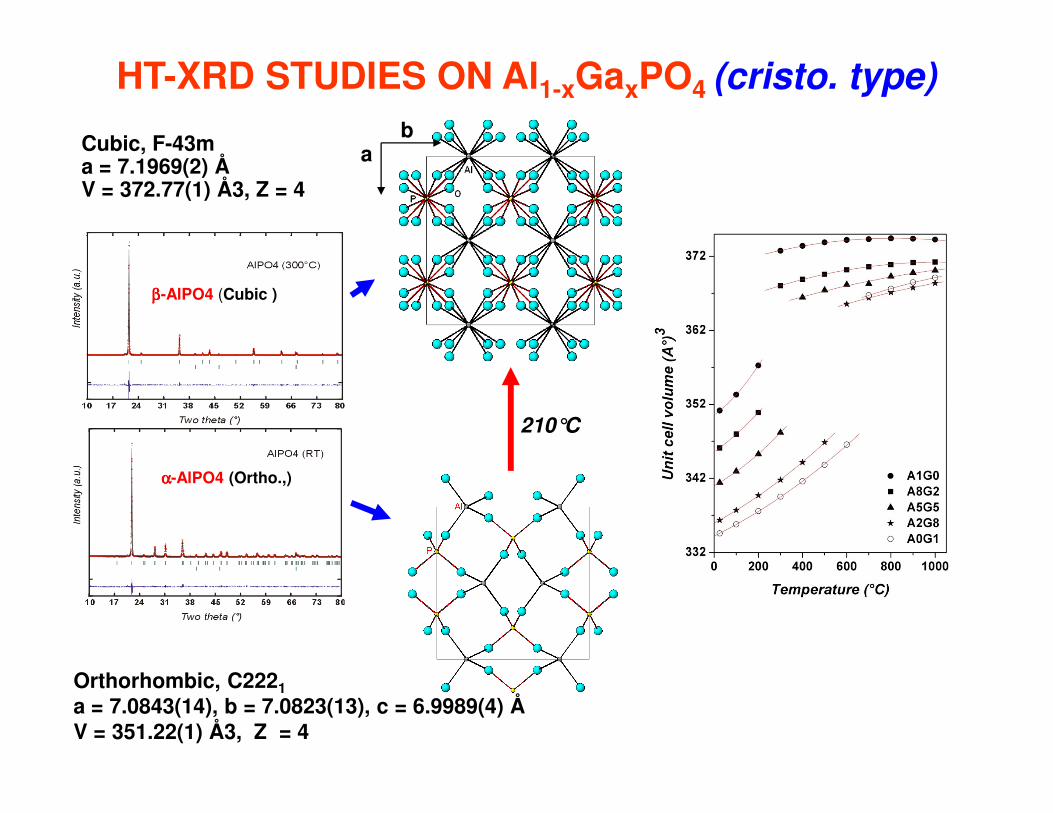
HT-XRD STUDIES ON Al1-xGaxPO4 (cristo. type)
ββββ-AlPO4 (Cubic )
ab
Cubic, F-43m a = 7.1969(2) Å V = 372.77(1) Å3, Z = 4
αααα-AlPO4 (Ortho.,)
Orthorhombic, C2221a = 7.0843(14), b = 7.0823(13), c = 6.9989(4) ÅV = 351.22(1) Å3, Z = 4
210°C
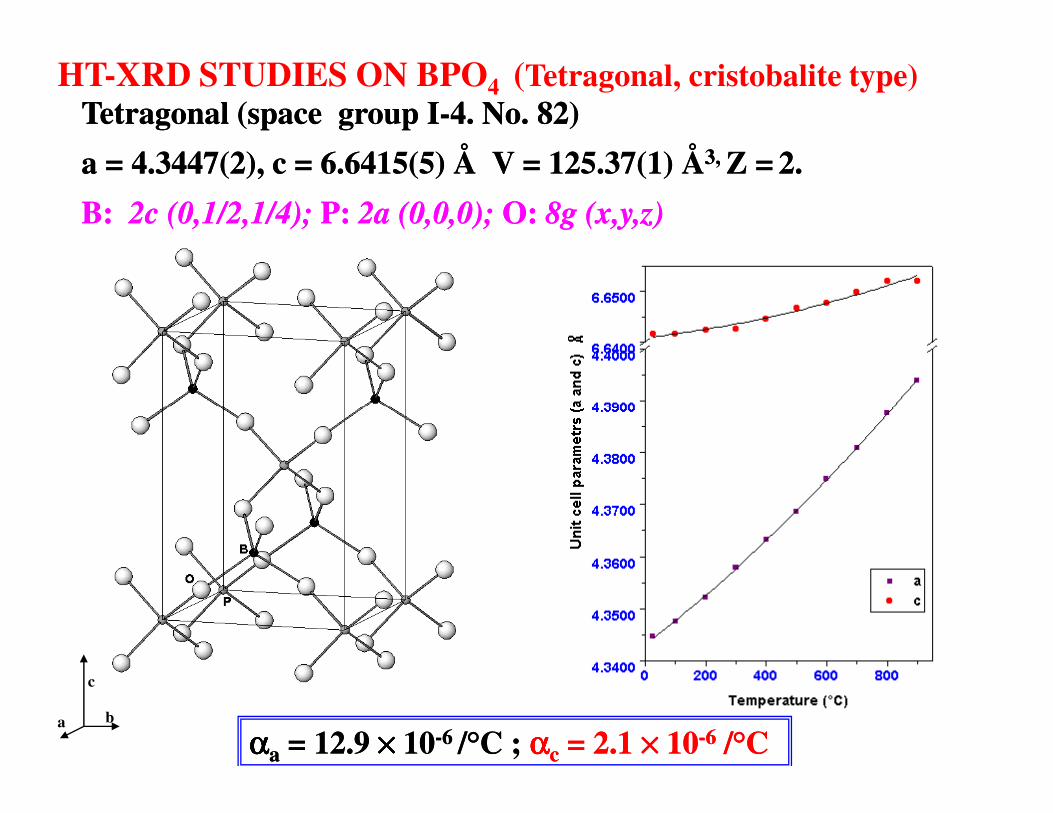
HT-XRD STUDIES ON BPO4 (Tetragonal, cristobalite type) Tetragonal (space group ITetragonal (space group I--4. No. 82)4. No. 82)
a = 4.3447(2), c = 6.6415(5) Å V = 125.37(1) Åa = 4.3447(2), c = 6.6415(5) Å V = 125.37(1) Å3, 3, Z =Z = 2.2.
B: B: 2c2c (0,1/2,1/4); (0,1/2,1/4); P: P: 2a (0,0,0); 2a (0,0,0); O: O: 8g (8g (x,y,zx,y,z) )
a b
c
ααααααααaa = = 12.9 12.9 ×××××××× 1010--6 6 //°°C ; C ; ααααααααcc = = 2.1 2.1 ×××××××× 1010--66 //°°CC

1. AlPO4 (at 300°C)
Variation thermal expansion coefficients with inter-polyhedralangle of Cristobalite type compounds
ααααV (/°C) = -191.32 + 4.33 ×××× [θθθθ]
- 0.02 ×××× [θθθθ]2
2. AlPO4 (at 300°C) (lit. data)
3. SiO2 (at 300°C) (lit. data)
4. Al0.8Ga0.2PO4 (300°C)
5. Al0.5Ga0.5PO4 (400°C)
6. Al0.2Ga0.8PO4 (600°C)
7. GaPO4 (700°C)
8. BPO4 (25°C)
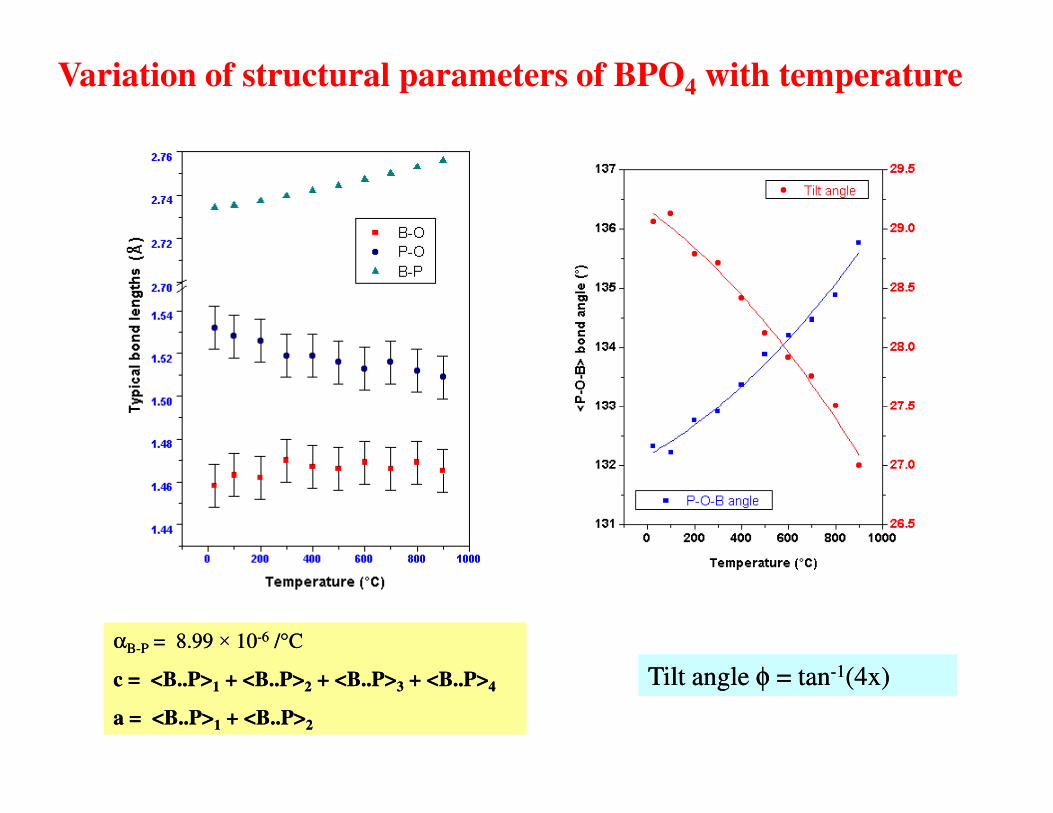
Variation of structural parameters of BPO4 with temperature
Tilt angle Tilt angle φφ = tan= tan--11(4x)(4x)
ααBB--PP = 8.99 = 8.99 ×× 1010--66 //°°CC
cc = <B..P>= <B..P>11 + <B..P>+ <B..P>22 + <B..P>+ <B..P>33 + <B..P>+ <B..P>44
aa = <B..P>= <B..P>11 + <B..P>+ <B..P>22
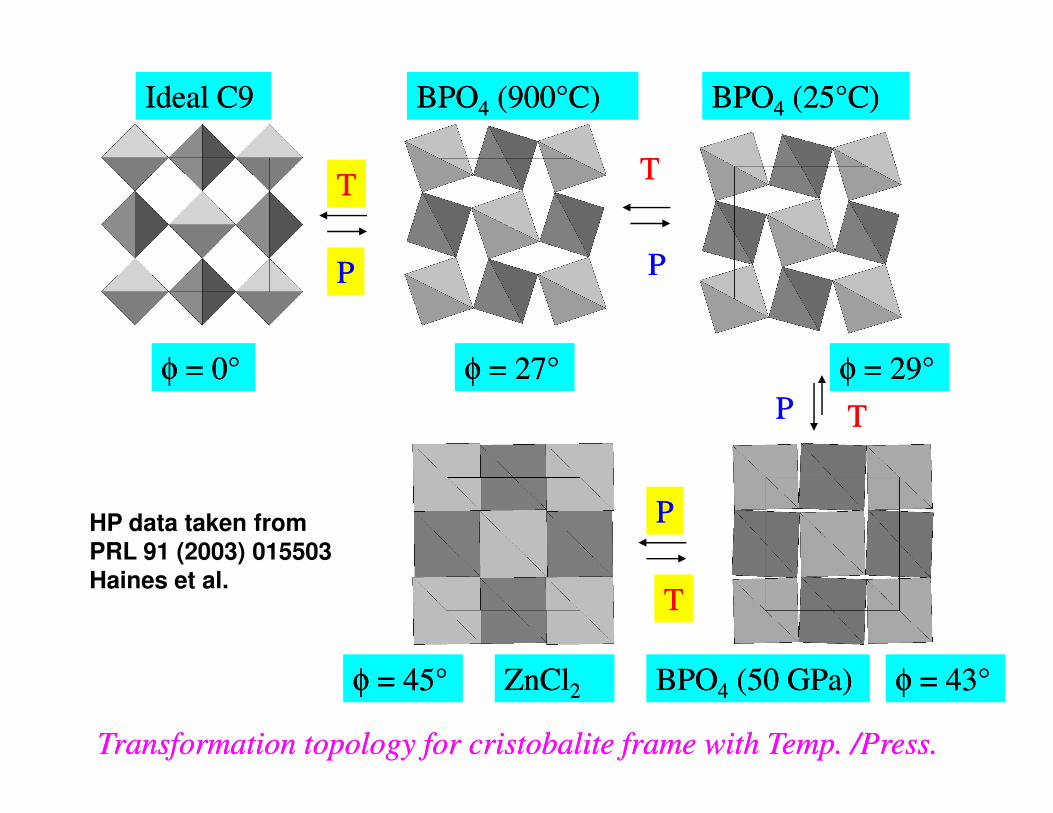
φφ = 0= 0°° φφ = 27= 27°° φφ = 29= 29°°
Ideal C9Ideal C9 BPOBPO44 (900(900°°C)C) BPOBPO44 (25(25°°C)C)
TTTT
TT
PP PP
PP
Transformation topology for cristobalite frame with Temp. /Press. Transformation topology for cristobalite frame with Temp. /Press.
φφ = 43= 43°°φφ = 45= 45°° BPOBPO44 (50 GPa)(50 GPa)ZnClZnCl22
TT
TT
PP
PPHP data taken from PRL 91 (2003) 015503Haines et al.
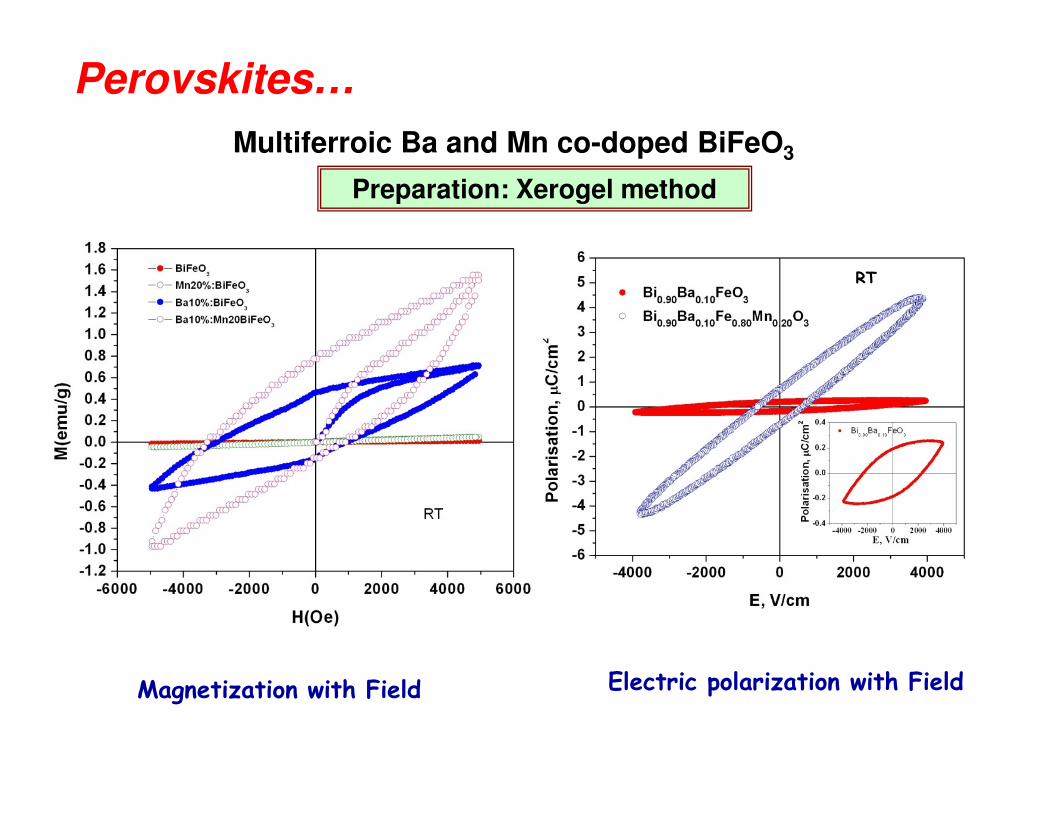
Multiferroic Ba and Mn co-doped BiFeO3
RT
Preparation: Xerogel method
Perovskites…
Magnetization with Field Electric polarization with Field
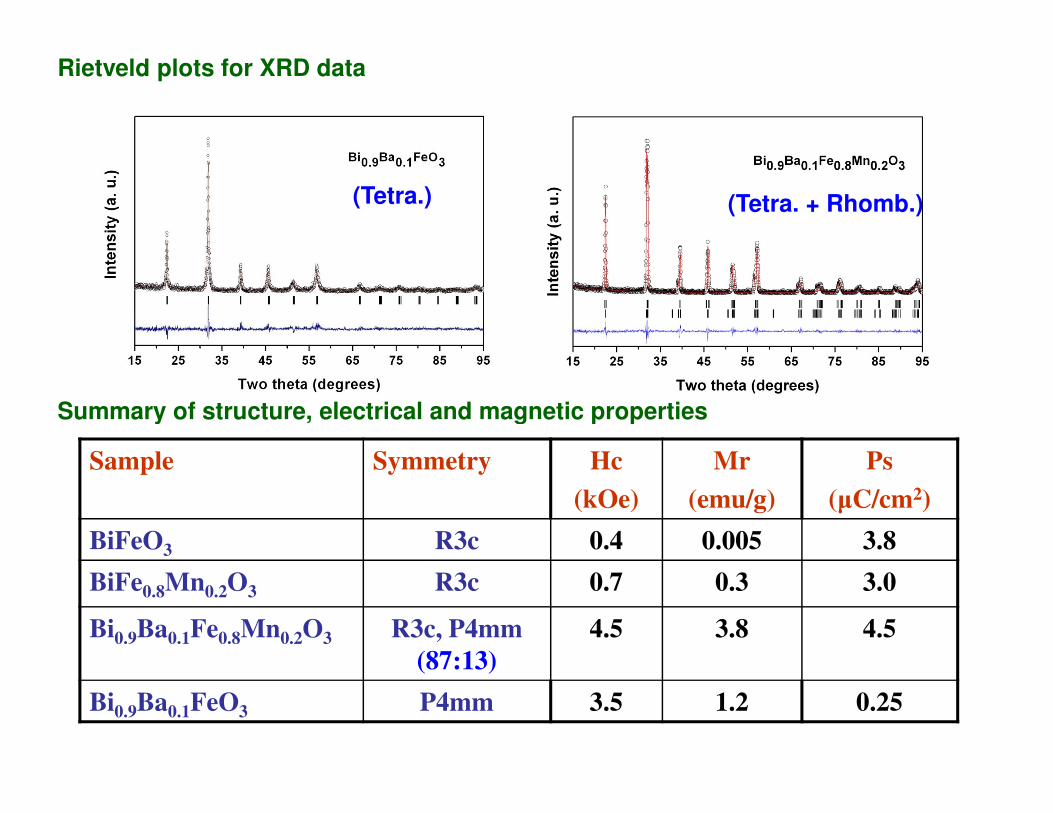
(Tetra.) (Tetra. + Rhomb.)
Rietveld plots for XRD data
Summary of structure, electrical and magnetic properties
Sample Symmetry Hc(kOe)
Mr(emu/g)
Ps(µC/cm2)
BiFeO3 R3c 0.4 0.005 3.8
BiFe0.8Mn0.2O3 R3c 0.7 0.3 3.0
Bi0.9Ba0.1Fe0.8Mn0.2O3 R3c, P4mm(87:13)
4.5 3.8 4.5
Bi0.9Ba0.1FeO3 P4mm 3.5 1.2 0.25
Summary of structure, electrical and magnetic properties
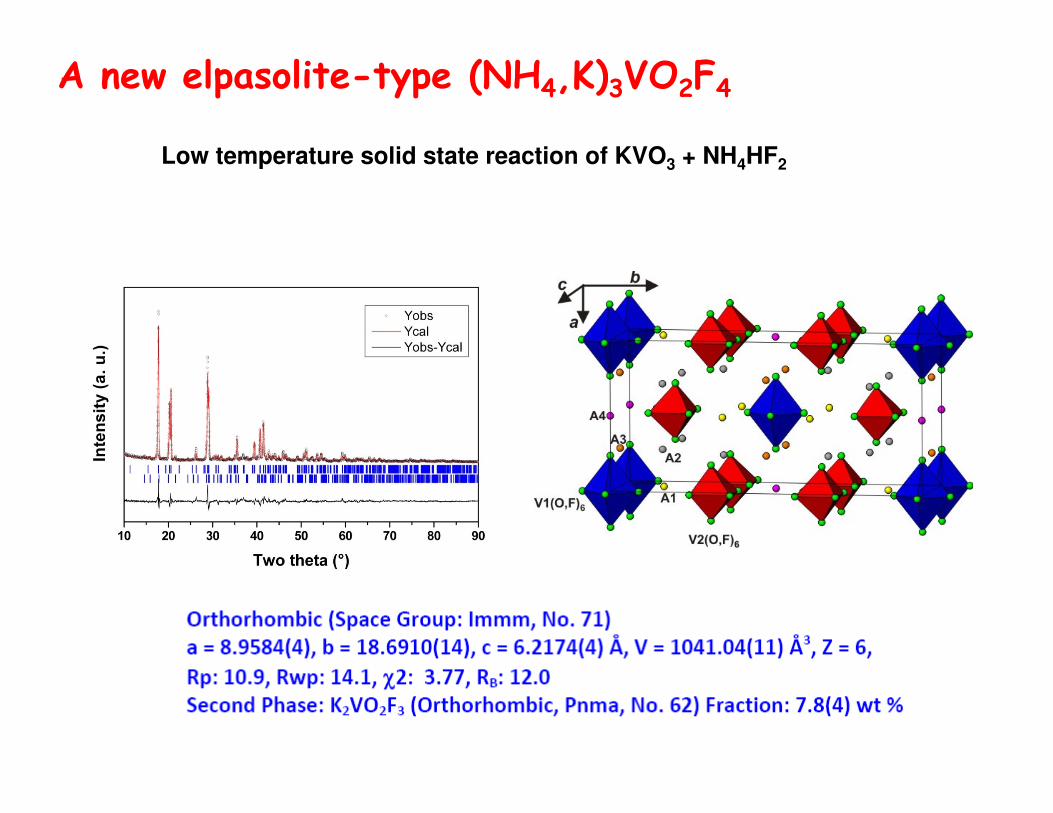
A new elpasolite-type (NH4,K)3VO2F4
Low temperature solid state reaction of KVO3 + NH4HF2
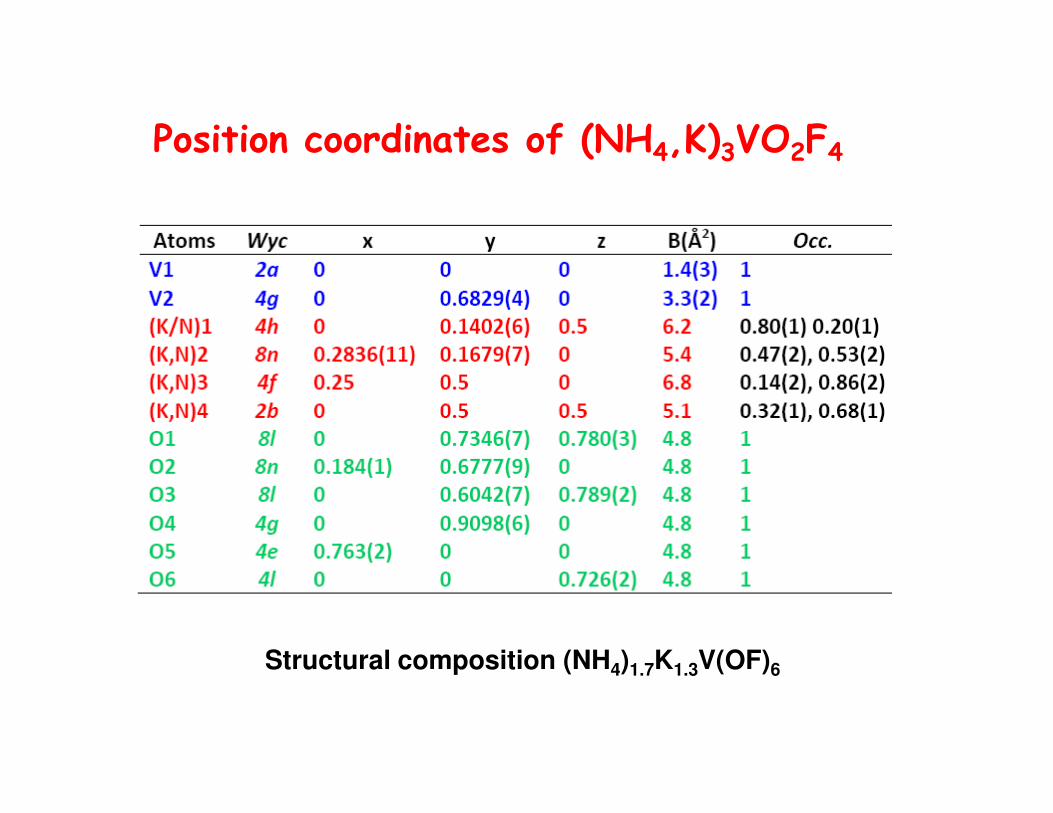
Position coordinates of (NH4,K)3VO2F4
Structural composition (NH4)1.7K1.3V(OF)6
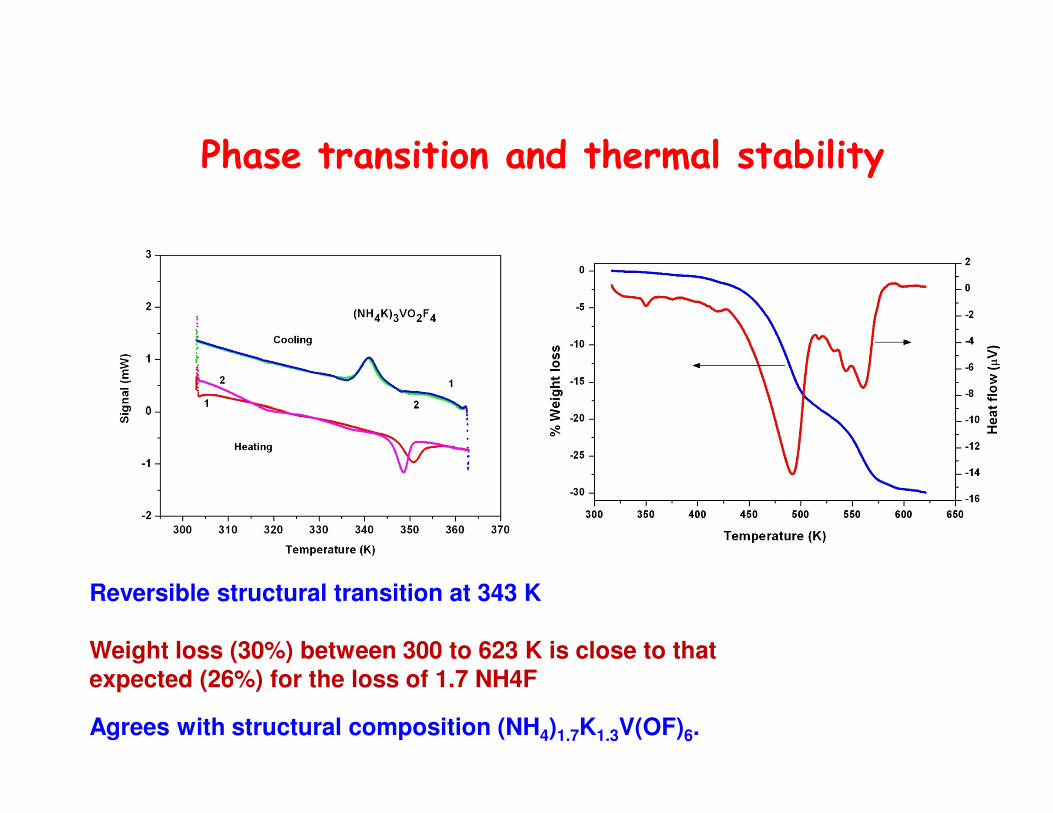
Phase transition and thermal stability
Reversible structural transition at 343 K
Weight loss (30%) between 300 to 623 K is close to thatexpected (26%) for the loss of 1.7 NH4F
Agrees with structural composition (NH4)1.7K1.3V(OF)6.
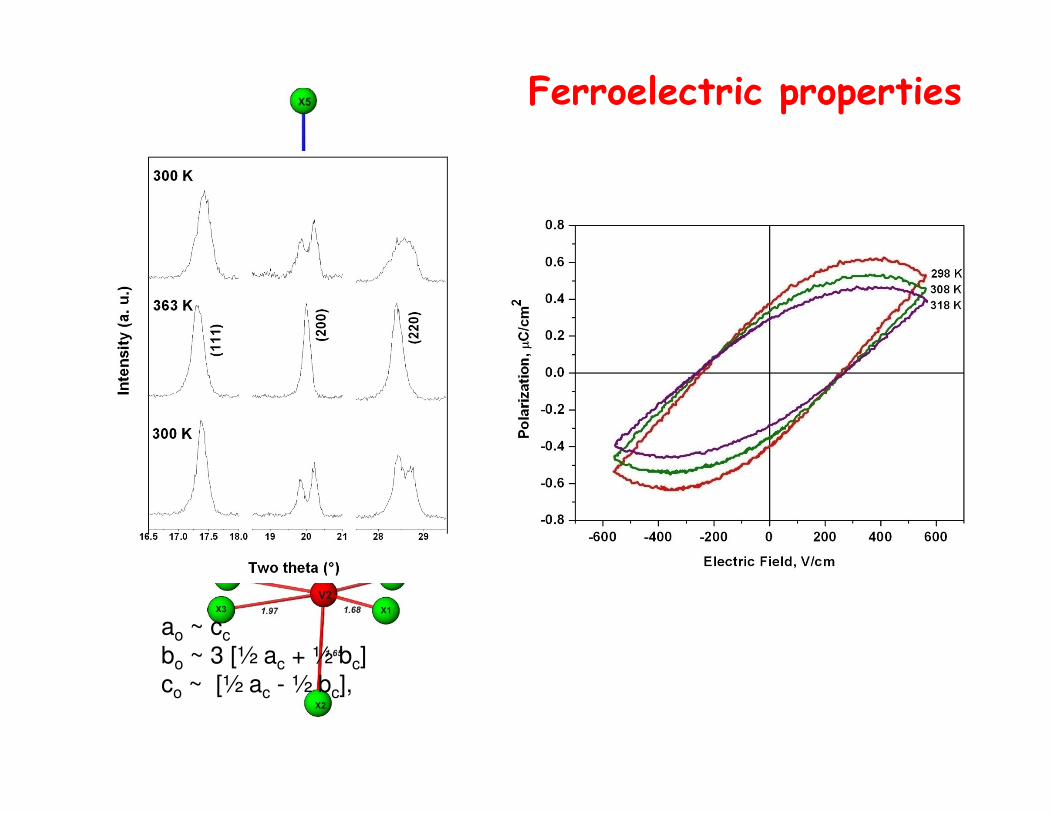
Ferroelectric properties
ao ~ cc
bo ~ 3 [½ ac + ½ bc]
co ~ [½ ac - ½ bc],
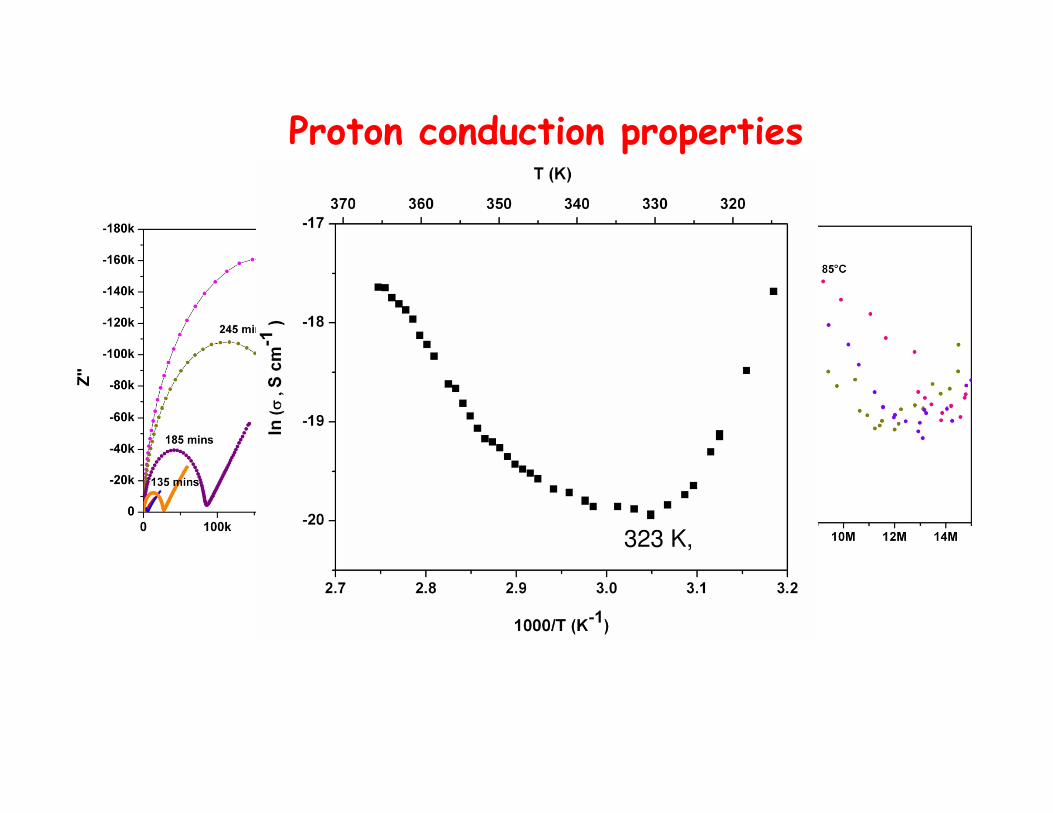
Proton conduction properties
323 K,
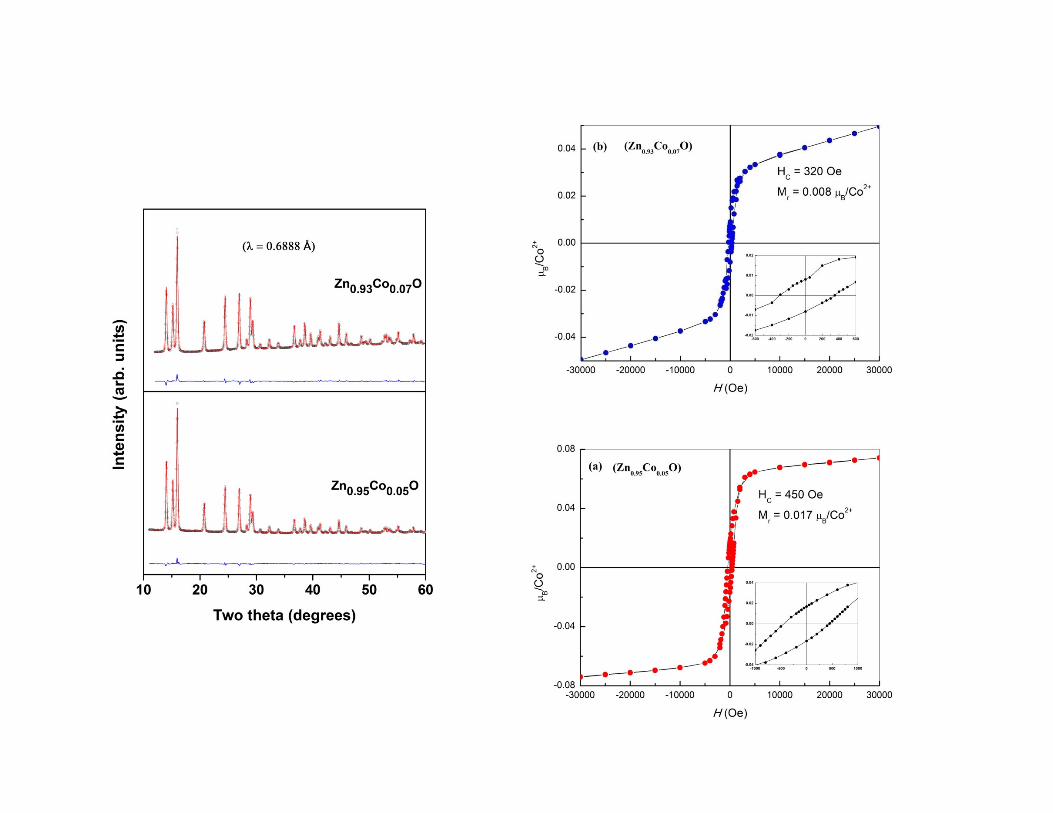
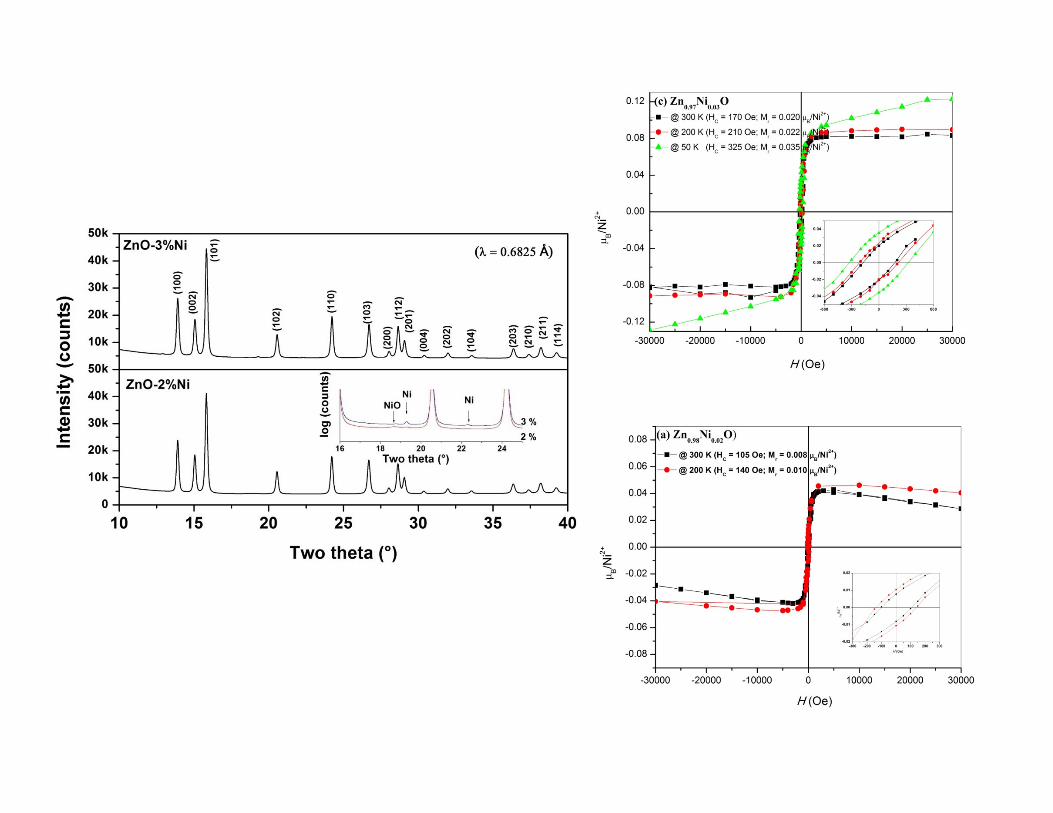
Dilute magnetic semiconductorDilute magnetic semiconductor
�� ZnOZnO--FeFe
�� ZnOZnO--CoCo
�� ZnOZnO--NiNi�� ZnOZnO--NiNi
�� InIn22OO33--FeFe
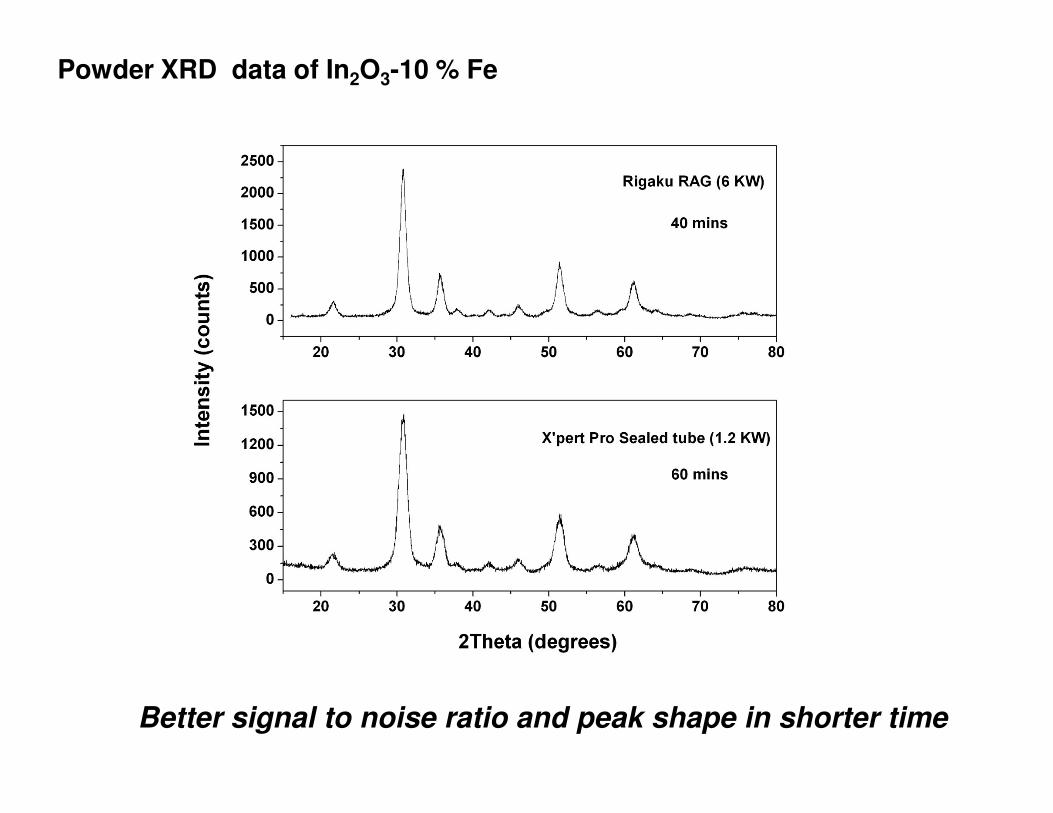
Powder XRD data of In2O3-10 % Fe
Better signal to noise ratio and peak shape in shorter time
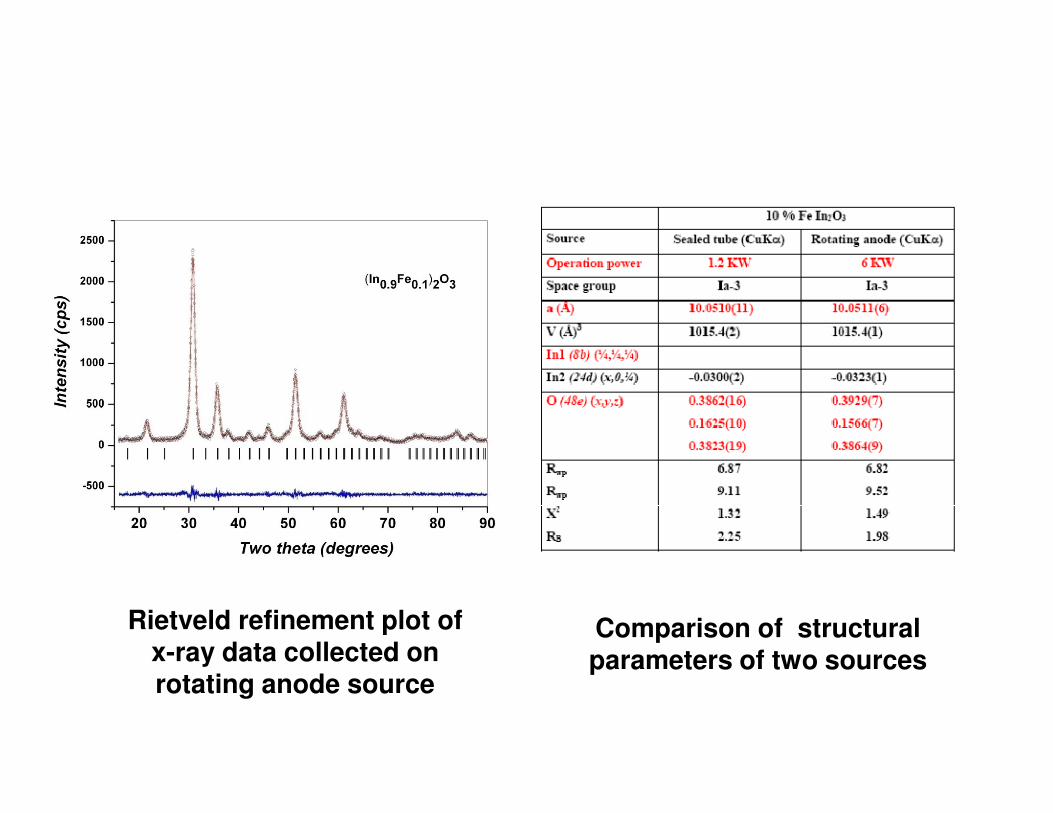
Rietveld refinement plot of x-ray data collected on rotating anode source
Comparison of structural parameters of two sources
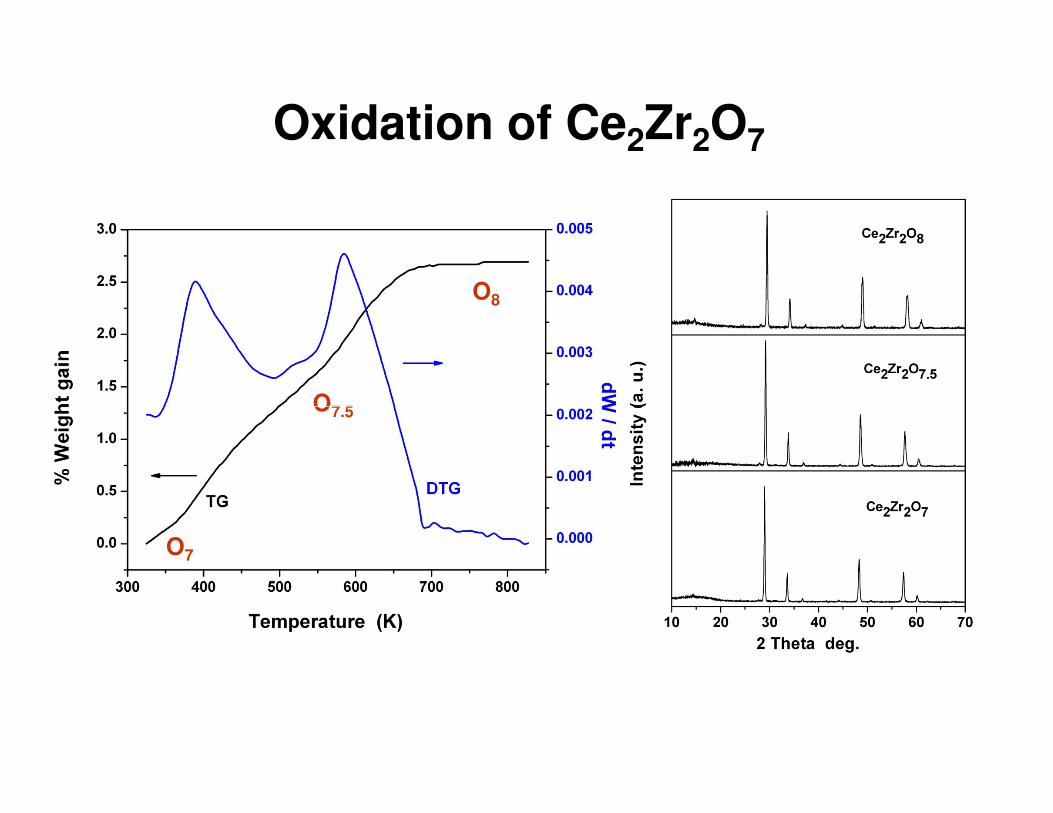
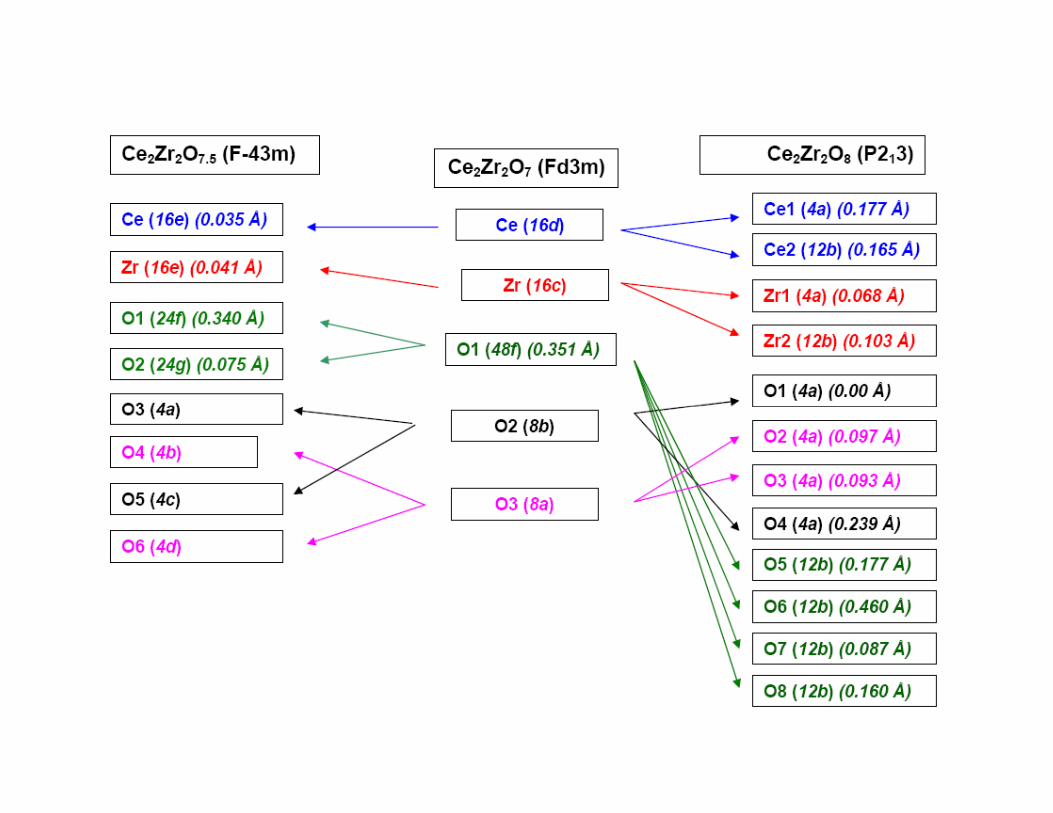
Oxidation of Ce2Zr2O7
O7.5
O8
O7
O7.5
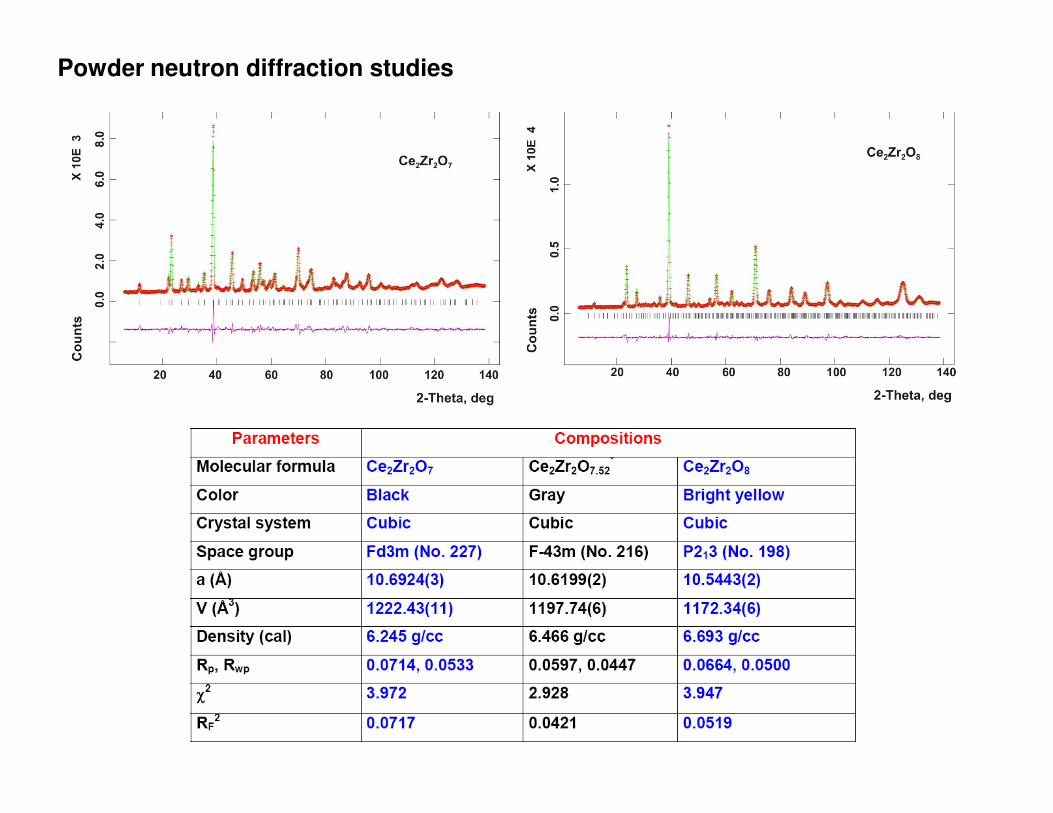
Powder neutron diffraction studies
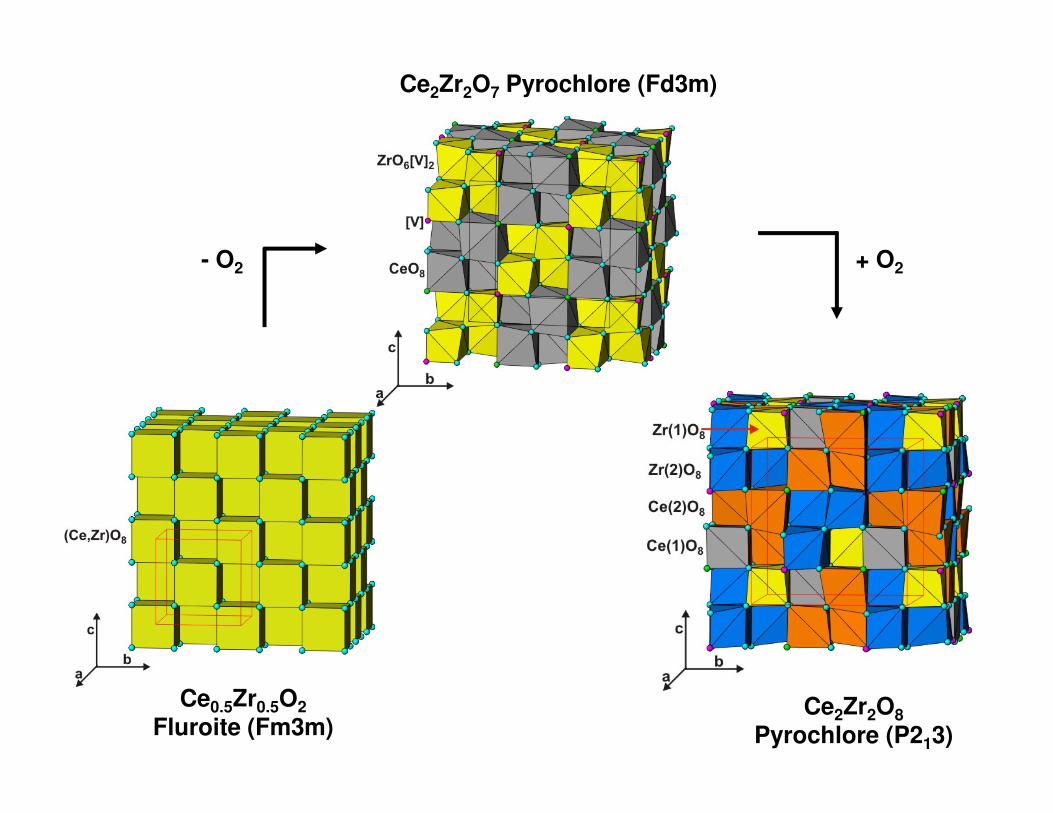
Ce2Zr2O7 Pyrochlore (Fd3m)
- O2 + O2
Ce0.5Zr0.5O2Fluroite (Fm3m)
Ce2Zr2O8Pyrochlore (P213)
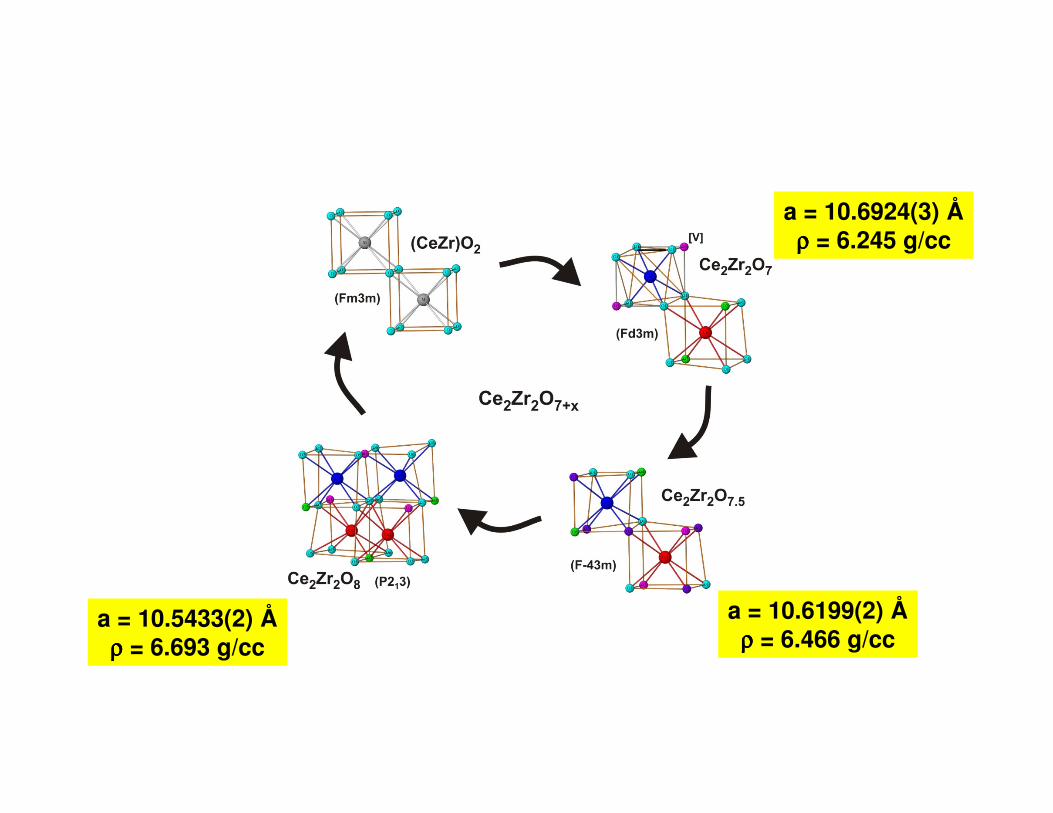
a = 10.6924(3) Åρρρρ = 6.245 g/cc
a = 10.6199(2) Åρρρρ = 6.466 g/cc
a = 10.5433(2) Åρρρρ = 6.693 g/cc
• Data quality has a significant role of the accurate structural parameters.
• The structure is never complete unless it is verified from single crystal data or refined from high resolution synchrotron data.
FinallyFinally …..
• The structure is never accurate if it failed to explain the properties.
• Though Rietveld analysis has large a number of limitation, so far this is the accepted method for ceramics oxides.

Dr. A. K. Dr. A. K. TyagiTyagi
Dr. D. DasDr. D. Das
Acknowledgements
Dr. S. K. DebDr. S. K. Deb
Dr. S. M. SharmaDr. S. M. Sharma
Colleagues and Collaborators Colleagues and Collaborators
from from ChDChD, FCD, SSPD, , FCD, SSPD,
HP&SRPD of BARC HP&SRPD of BARC
Dr. S. M. SharmaDr. S. M. Sharma
Dr. S. L. Dr. S. L. ChaplotChaplot
Organizers of workshopOrganizers of workshop

thank you very muchthank you very much