Hayley Evers-King Plymouth Marine Laboratory on behalf of EUMETSAT @HayleyEversKing , [email protected]
Accessing and working with Copernicus Marine data
• Copernicus programme structure • Sentinel 3:
• Altimetry (SRAL) • SST (SLSTR) • Ocean Colour (OLCI)
• Data levels and selecting the right data for your work
• Practical
Overview
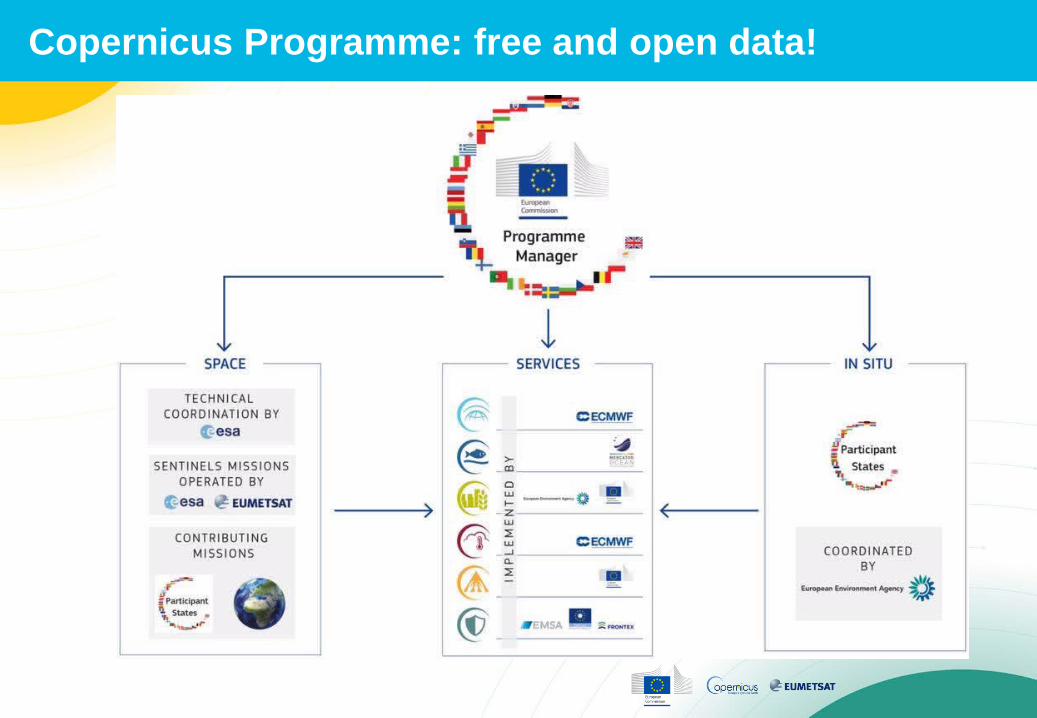
Copernicus Programme: free and open data!
Copernicus – Sentinel 3 marine data
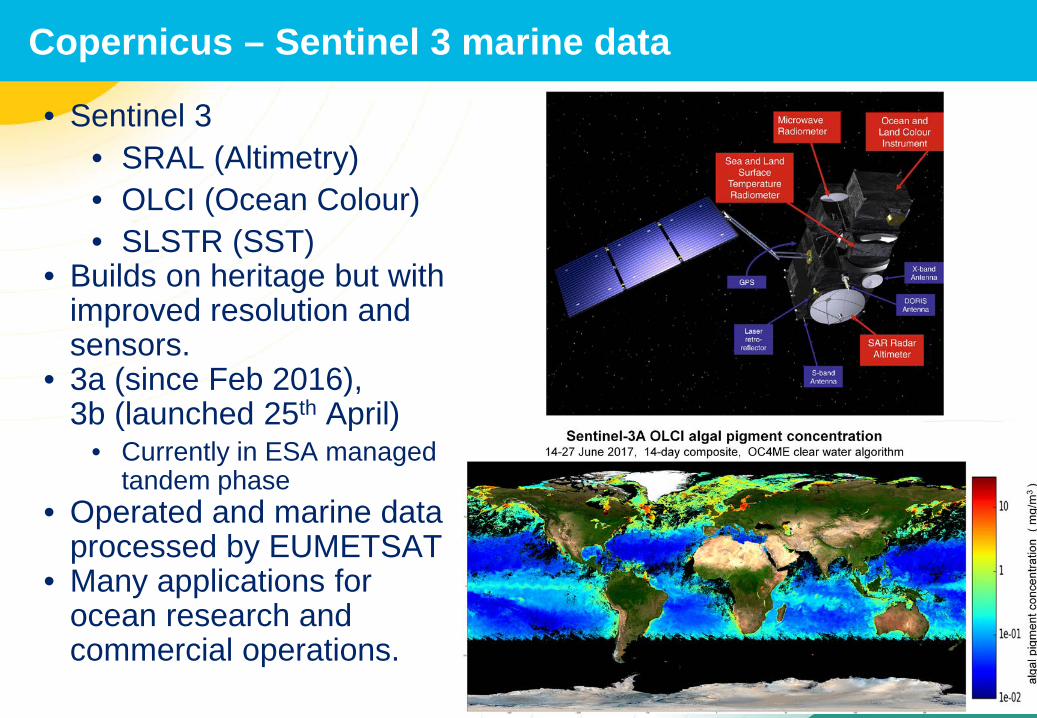
• Sentinel 3 • SRAL (Altimetry) • OLCI (Ocean Colour) • SLSTR (SST)
• Builds on heritage but with improved resolution and sensors.
• 3a (since Feb 2016), 3b (launched 25th April)
• Currently in ESA managed tandem phase
• Operated and marine data processed by EUMETSAT
• Many applications for ocean research and commercial operations.
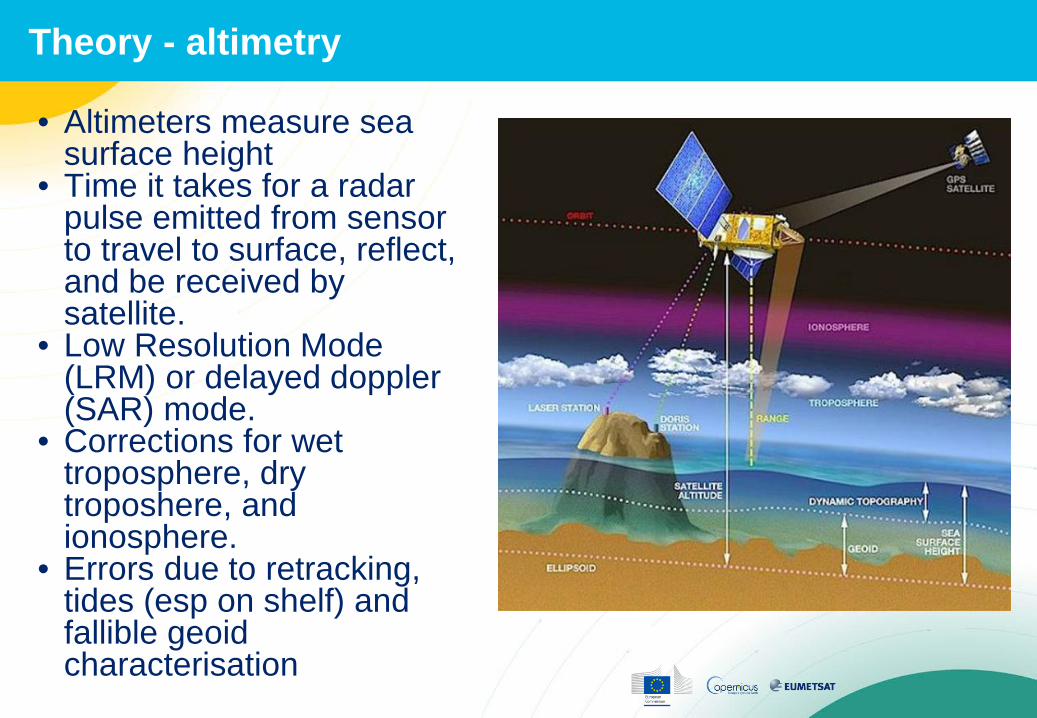
• Altimeters measure sea surface height
• Time it takes for a radar pulse emitted from sensor to travel to surface, reflect, and be received by satellite.
• Low Resolution Mode (LRM) or delayed doppler (SAR) mode.
• Corrections for wet troposphere, dry troposhere, and ionosphere.
• Errors due to retracking, tides (esp on shelf) and fallible geoid characterisation
Theory - altimetry
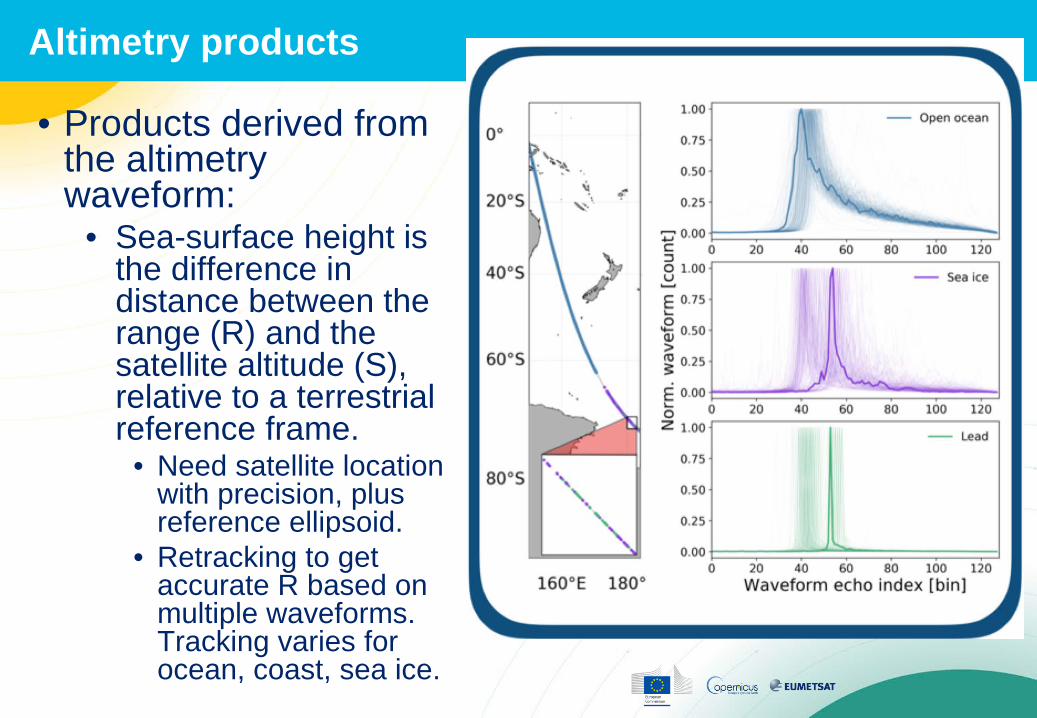
• Products derived from the altimetry waveform:
• Sea-surface height is the difference in distance between the range (R) and the satellite altitude (S), relative to a terrestrial reference frame.
• Need satellite location with precision, plus reference ellipsoid.
• Retracking to get accurate R based on multiple waveforms. Tracking varies for ocean, coast, sea ice.
Altimetry products
file:///.file/id=6571367.256578441
file:///.file/id=6571367.256578441
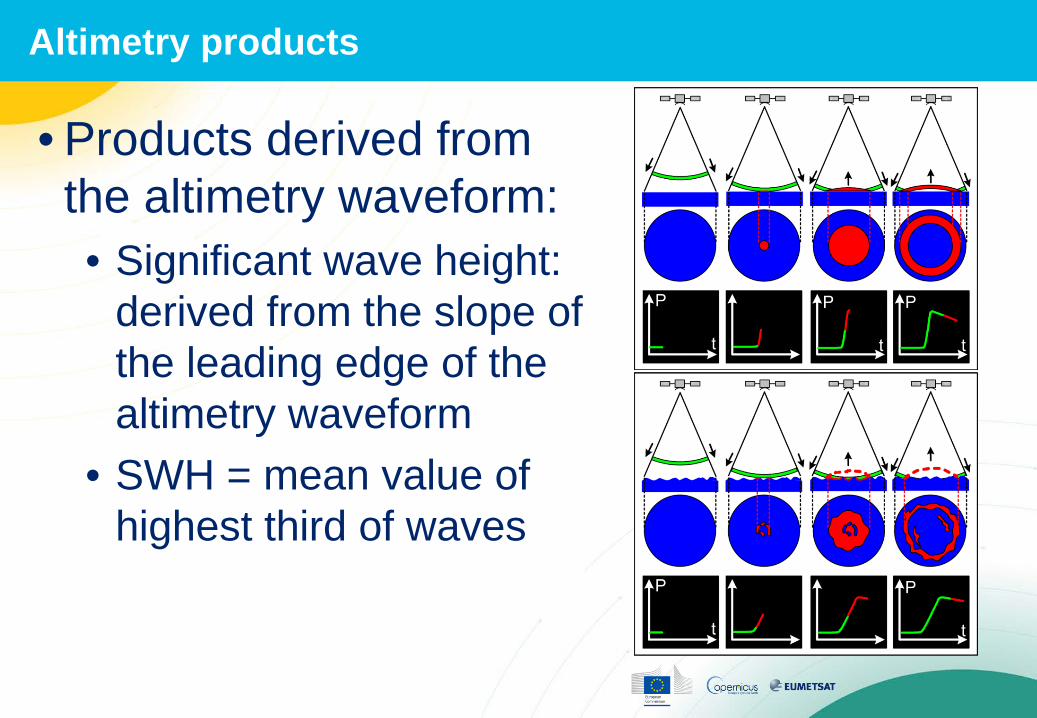
• Products derived from the altimetry waveform: • Significant wave height:
derived from the slope of the leading edge of the altimetry waveform
• SWH = mean value of highest third of waves
Altimetry products
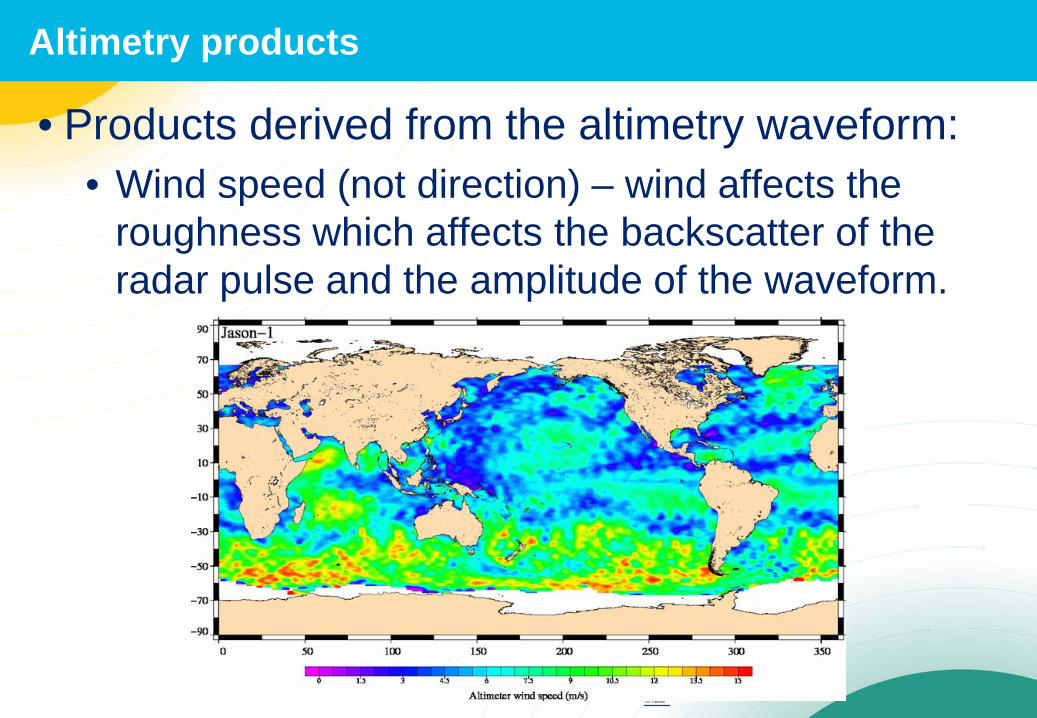
• Products derived from the altimetry waveform: • Wind speed (not direction) – wind affects the
roughness which affects the backscatter of the radar pulse and the amplitude of the waveform.
Altimetry products
• Synthetic aperture Radar ALtimeter (SRAL) on • Operates in SAR mode following Cryosat 2
legacy. • Improved resolution.
• Relies on highly accurate positioning (GNSS laser reflectors and DORIS)
• Improved retracking for coastal applications.
• More appropriate for ice measurements.
Sentinel 3 instruments: SRAL
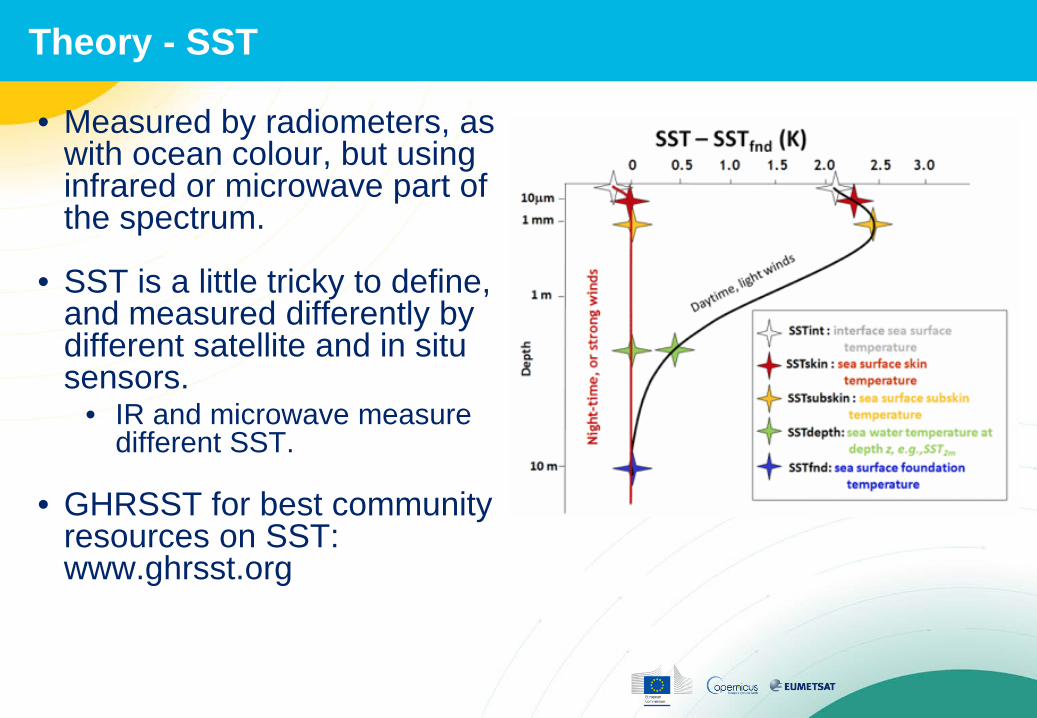
• Measured by radiometers, as with ocean colour, but using infrared or microwave part of the spectrum.
• SST is a little tricky to define,
and measured differently by different satellite and in situ sensors.
• IR and microwave measure different SST.
• GHRSST for best community
resources on SST: www.ghrsst.org
Theory - SST
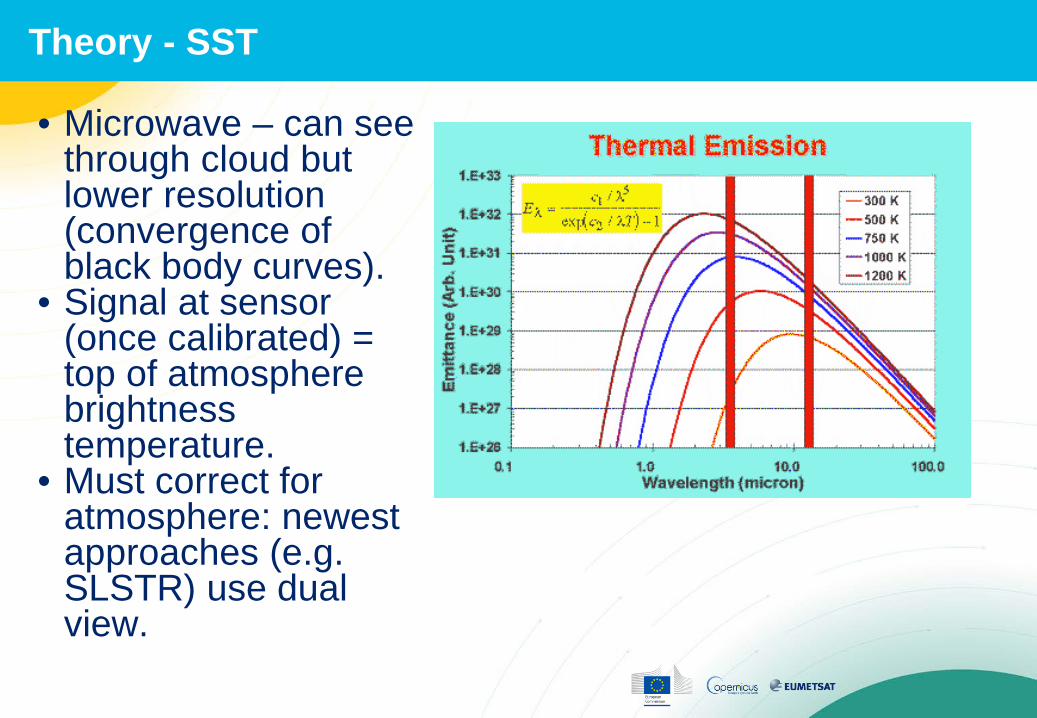
• Microwave – can see through cloud but lower resolution (convergence of black body curves).
• Signal at sensor (once calibrated) = top of atmosphere brightness temperature.
• Must correct for atmosphere: newest approaches (e.g. SLSTR) use dual view.
Theory - SST
• Excellent intercomparison of two types of SST here: http://www2.hawaii.edu/~jmaurer/sst/
• Merged SST products also exist. E.g. • GHRSST-PP • NASA MUR - Seek to get benefit of
coverage/resolution/accuracy from combining both TIR and microwave
SST products
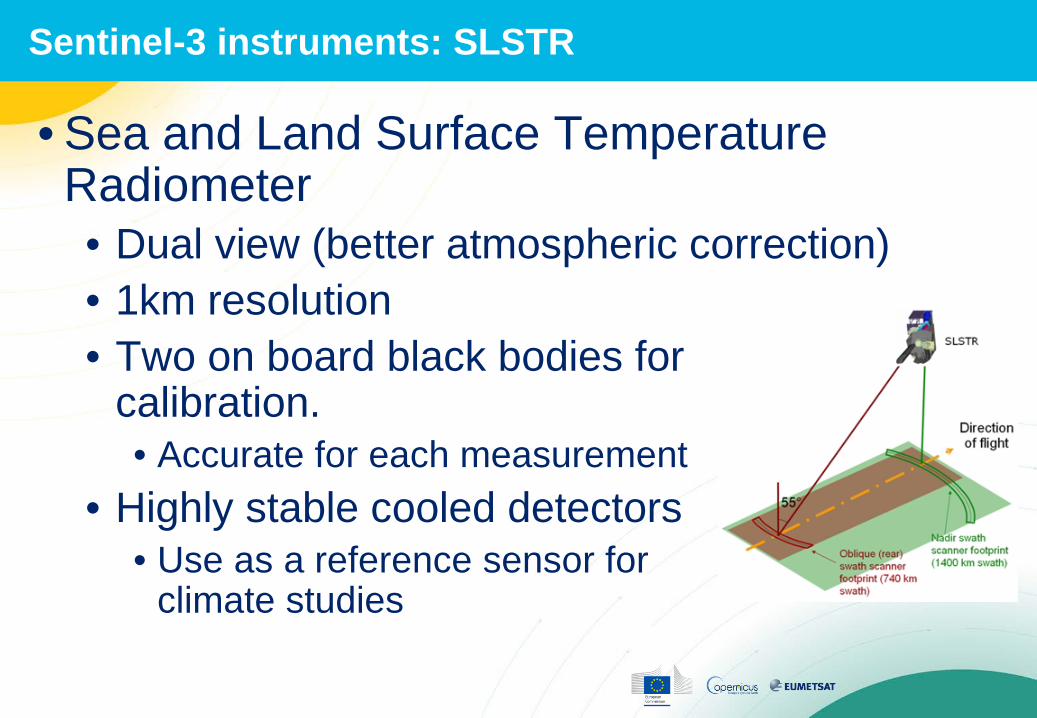
• Sea and Land Surface Temperature Radiometer • Dual view (better atmospheric correction) • 1km resolution • Two on board black bodies for
calibration. • Accurate for each measurement
• Highly stable cooled detectors • Use as a reference sensor for
climate studies
Sentinel-3 instruments: SLSTR
• Covered earlier this week!
Theory – Ocean Colour
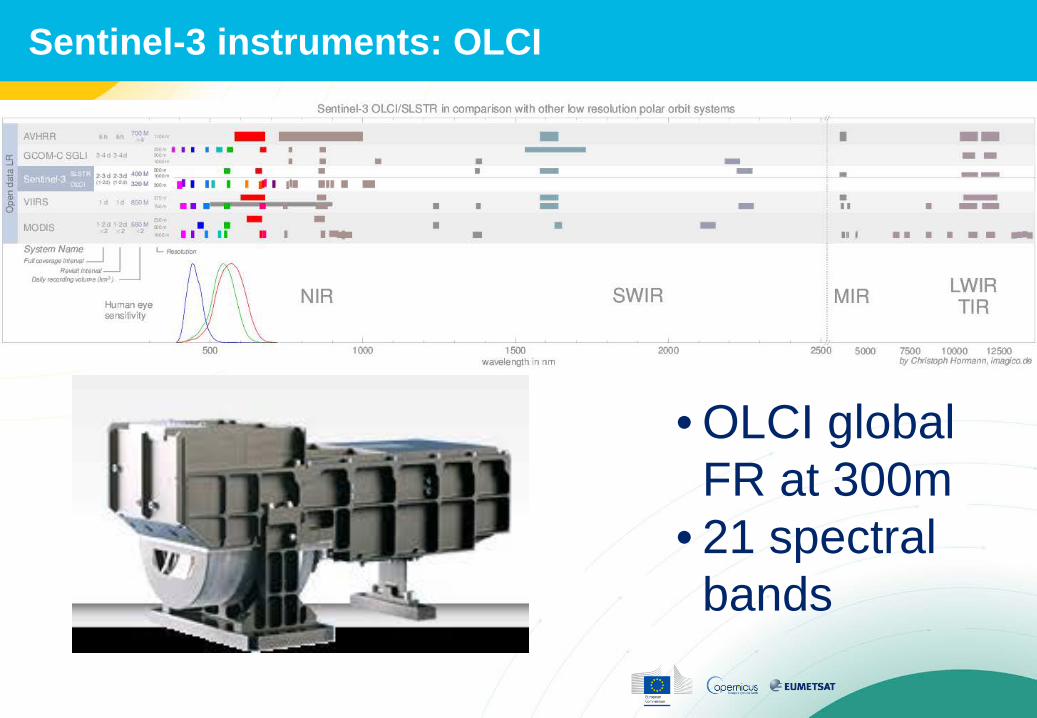
Sentinel-3 instruments: OLCI
file:///.file/id=6571367.258653850
• OLCI global FR at 300m
• 21 spectral bands
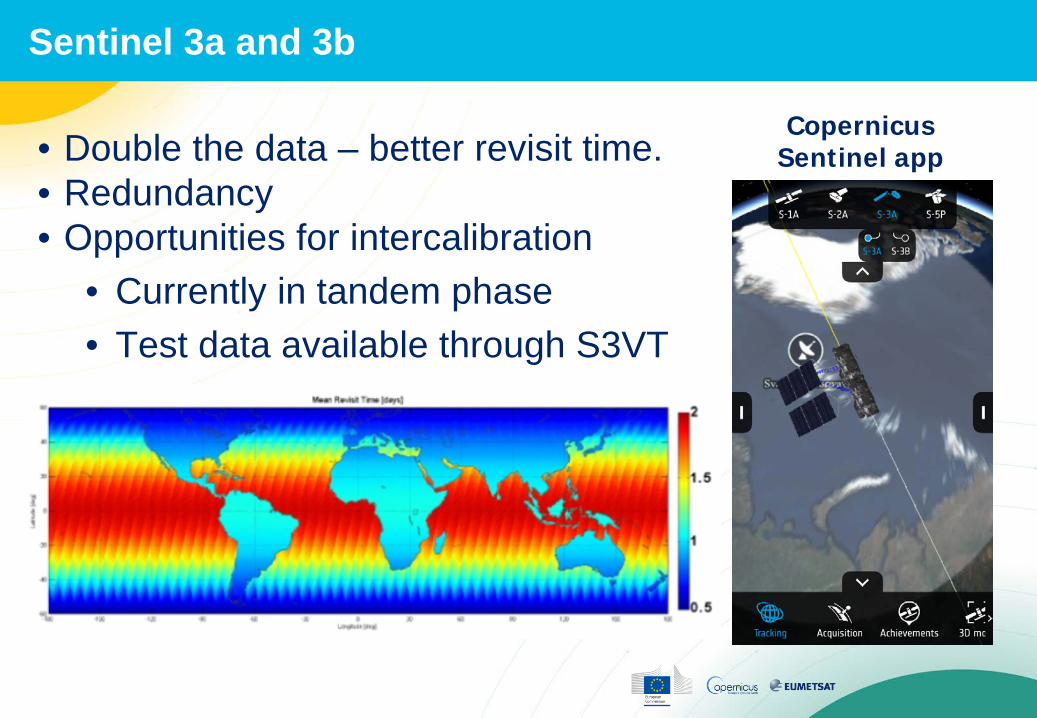
• Double the data – better revisit time. • Redundancy • Opportunities for intercalibration
• Currently in tandem phase • Test data available through S3VT
Sentinel 3a and 3b
Copernicus Sentinel app
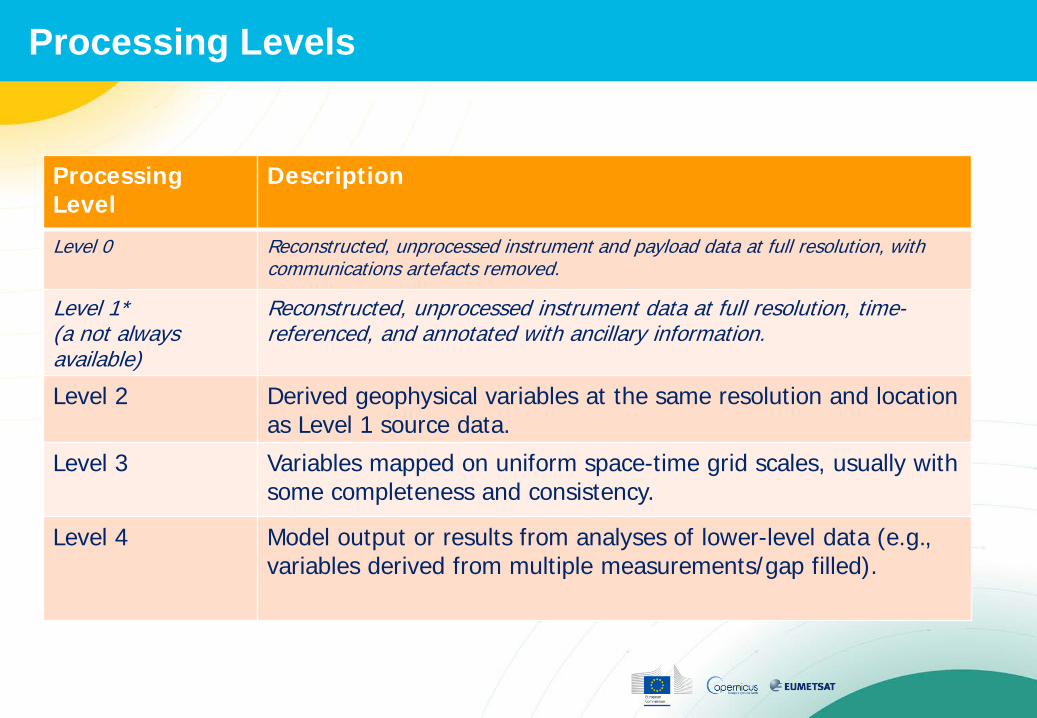
Processing Levels
Processing Level
Description
Level 0 Reconstructed, unprocessed instrument and payload data at full resolution, with communications artefacts removed.
Level 1* (a not always available)
Reconstructed, unprocessed instrument data at full resolution, time-referenced, and annotated with ancillary information.
Level 2 Derived geophysical variables at the same resolution and location as Level 1 source data.
Level 3 Variables mapped on uniform space-time grid scales, usually with some completeness and consistency.
Level 4 Model output or results from analyses of lower-level data (e.g., variables derived from multiple measurements/gap filled).
• SAFE format • Folder containing NetCDF files. • Also manifest file (.xml) • Can download individual files or all
• Timeliness: • NRT – Near Real Time • STC – Short Time Critical • NTC – Non Time Critical
General notes on formats/timeliness
Which data are best for me?
Level 1
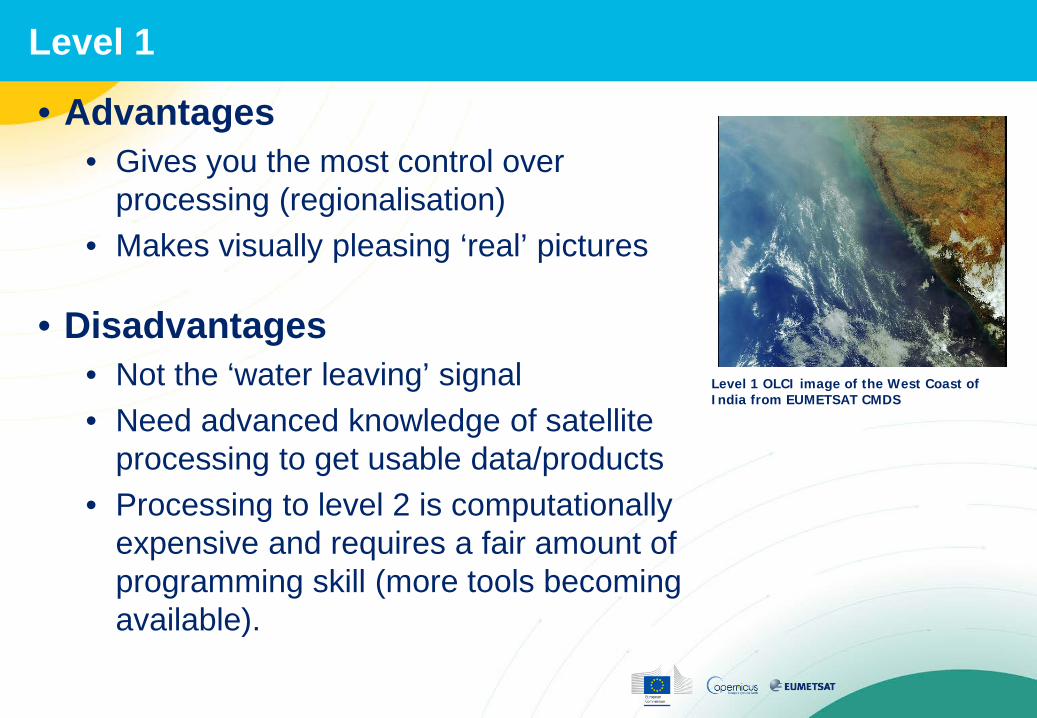
• Advantages • Gives you the most control over
processing (regionalisation) • Makes visually pleasing ‘real’ pictures
• Disadvantages
• Not the ‘water leaving’ signal • Need advanced knowledge of satellite
processing to get usable data/products • Processing to level 2 is computationally
expensive and requires a fair amount of programming skill (more tools becoming available).
Level 1 OLCI image of the West Coast of India from EUMETSAT CMDS
Level 2
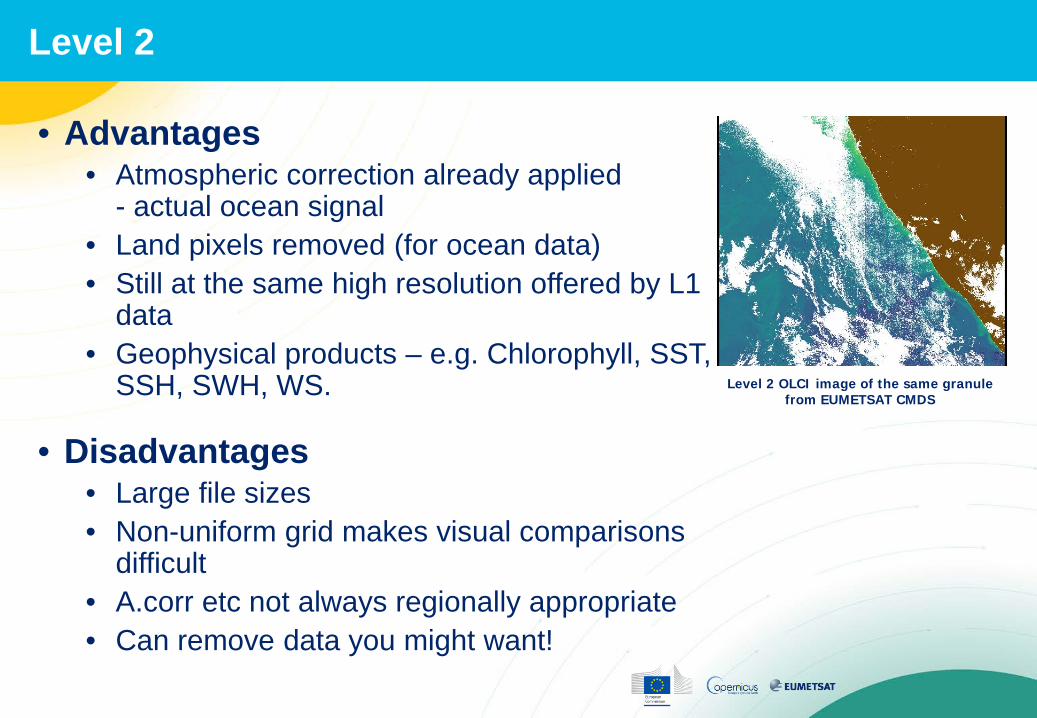
• Advantages • Atmospheric correction already applied
- actual ocean signal • Land pixels removed (for ocean data) • Still at the same high resolution offered by L1
data • Geophysical products – e.g. Chlorophyll, SST,
SSH, SWH, WS.
• Disadvantages • Large file sizes • Non-uniform grid makes visual comparisons
difficult • A.corr etc not always regionally appropriate • Can remove data you might want!
Level 2 OLCI image of the same granule from EUMETSAT CMDS
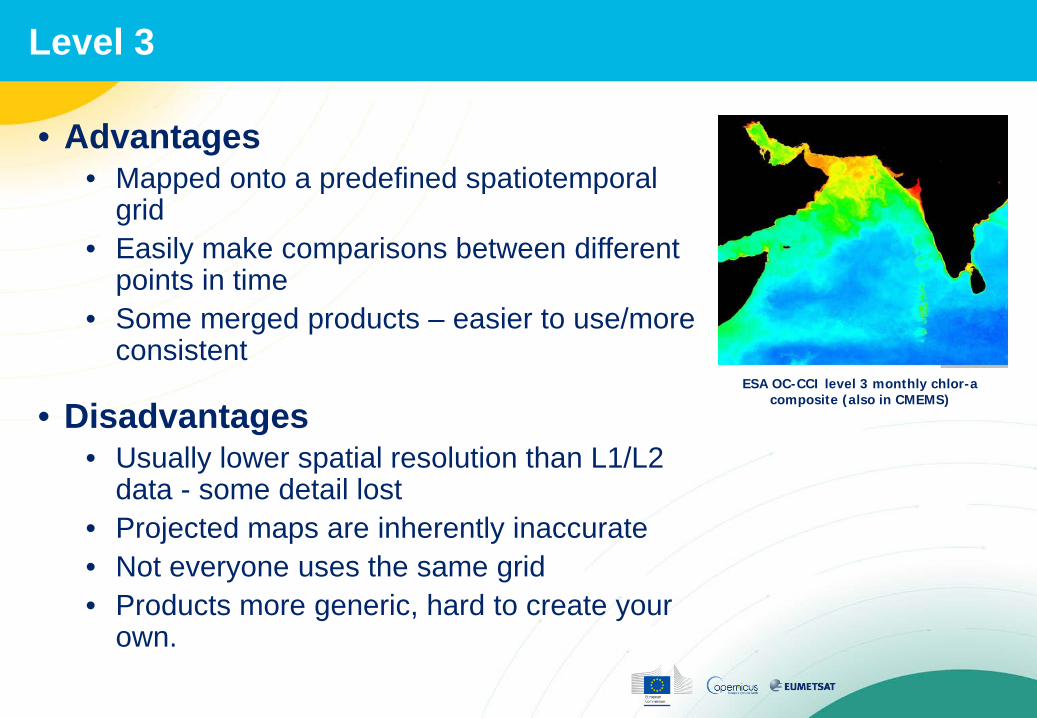
Level 3
• Advantages • Mapped onto a predefined spatiotemporal
grid • Easily make comparisons between different
points in time • Some merged products – easier to use/more
consistent
• Disadvantages • Usually lower spatial resolution than L1/L2
data - some detail lost • Projected maps are inherently inaccurate • Not everyone uses the same grid • Products more generic, hard to create your
own.
ESA OC-CCI level 3 monthly chlor-a composite (also in CMEMS)
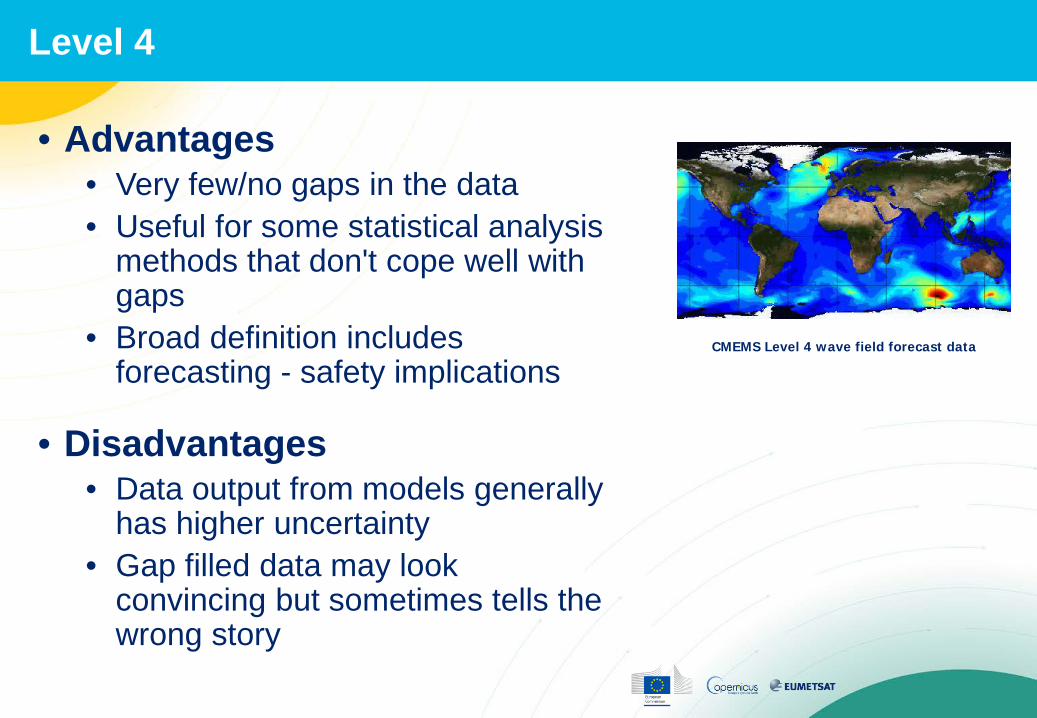
Level 4
• Advantages • Very few/no gaps in the data • Useful for some statistical analysis
methods that don't cope well with gaps
• Broad definition includes forecasting - safety implications
• Disadvantages • Data output from models generally
has higher uncertainty • Gap filled data may look
convincing but sometimes tells the wrong story
CMEMS Level 4 wave field forecast data
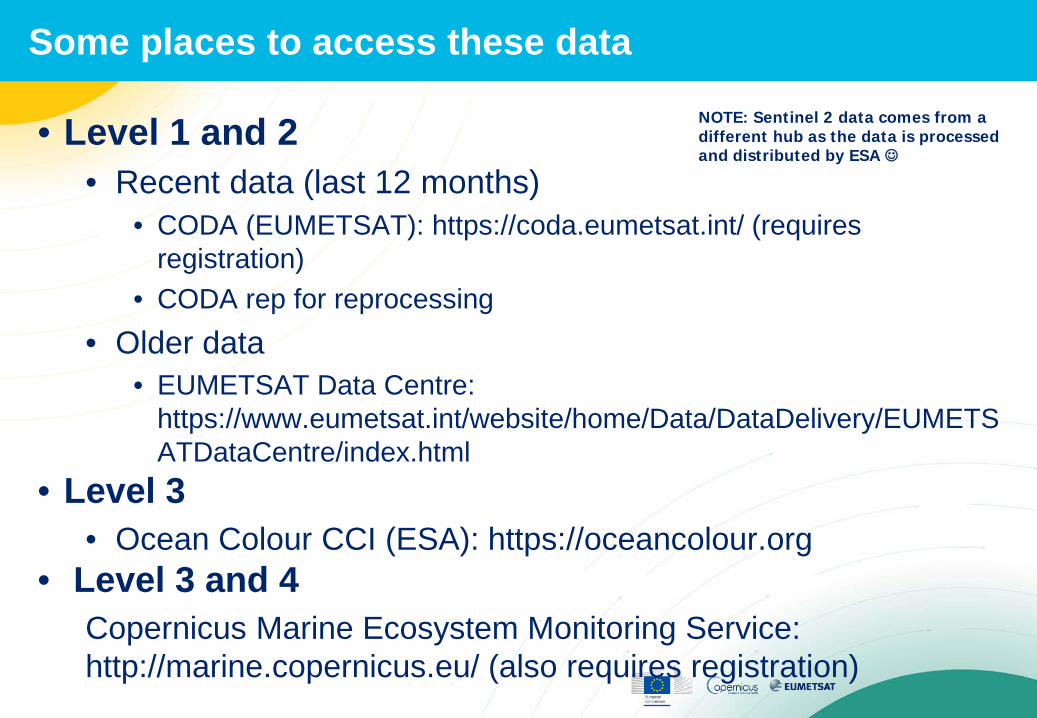
Some places to access these data
• Level 1 and 2 • Recent data (last 12 months)
• CODA (EUMETSAT): https://coda.eumetsat.int/ (requires registration)
• CODA rep for reprocessing • Older data
• EUMETSAT Data Centre: https://www.eumetsat.int/website/home/Data/DataDelivery/EUMETSATDataCentre/index.html
• Level 3 • Ocean Colour CCI (ESA): https://oceancolour.org
• Level 3 and 4 Copernicus Marine Ecosystem Monitoring Service: http://marine.copernicus.eu/ (also requires registration)
NOTE: Sentinel 2 data comes from a different hub as the data is processed and distributed by ESA
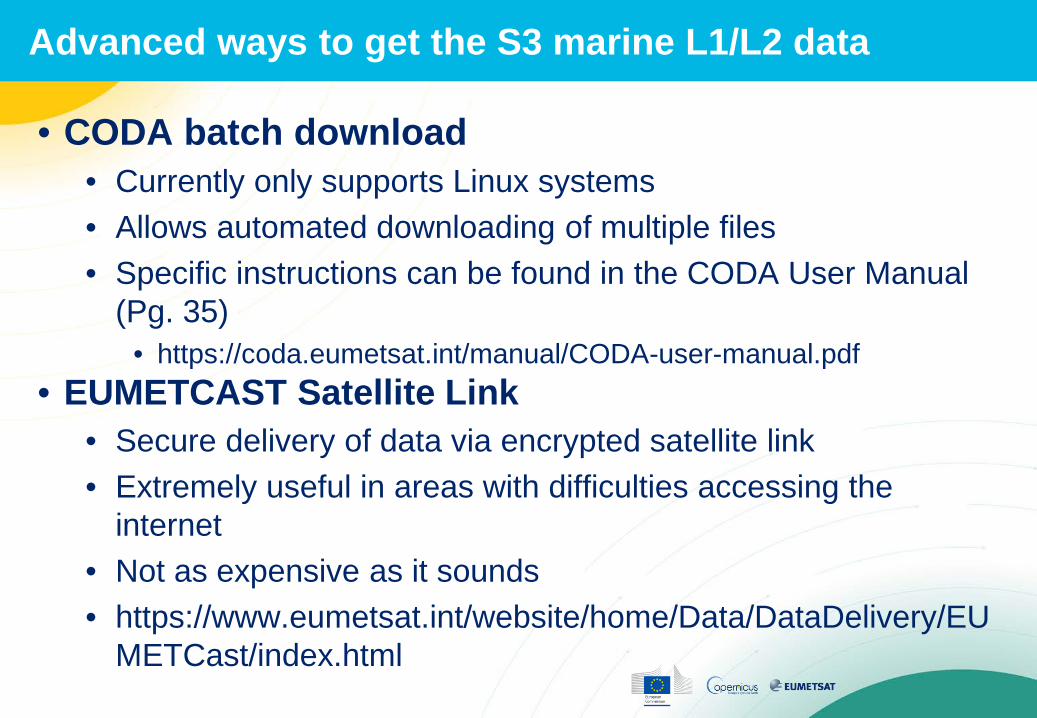
Advanced ways to get the S3 marine L1/L2 data
• CODA batch download • Currently only supports Linux systems • Allows automated downloading of multiple files • Specific instructions can be found in the CODA User Manual
(Pg. 35) • https://coda.eumetsat.int/manual/CODA-user-manual.pdf
• EUMETCAST Satellite Link • Secure delivery of data via encrypted satellite link • Extremely useful in areas with difficulties accessing the
internet • Not as expensive as it sounds • https://www.eumetsat.int/website/home/Data/DataDelivery/EU
METCast/index.html
• Help desk: contact [email protected] • Forum:
http://forums.eumetsat.int/forums/forum/copernicus-marine-calval/
• Product handbooks/notices (see links in practical) • Sentinel 3 validation team:
https://earth.esa.int/web/guest/pi-community/apply-for-data/ao-s?IFRAME_SRC=%2Fpi%2Fesa%3Fcmd%3Daodetail%26aoname%3DS3VT%26displayMode%3Dcenter%26targetIFramePage%3D%252Fweb%252Fguest%252Fpi-community%252Fapply-for-data%252Fao-s
Where to get help/get involved
• Further training opportunities: https://training.eumetsat.int/
• Funding for collaborative exchanges: https://www.eumetsat.int/website/home/TechnicalBulletins/Training/index.html
• Present your use of Copernicus data (support funding attached to conferences).
• Please feel free to reuse/share code etc provided here. We welcome suggestions and contributions to build sets of open source tutorials!
Opportunities through CMDS@EUMETSAT
• Main aims: • Look at how to download data from CODA:
https://coda.eumetsat.int/ • Work with data in SNAP/Python • Ask any questions!
• Documentation, code and test data here: http://bit.ly/COPIOCCG
Practical session
Recommended