ECONOMIC & CONSUMER CREDIT ANALYTICS
Case-Shiller®
Home Price Index ForecastsEXCLUSIVE FORECASTS OF THE MOST ACCURATE MEASURE OF U.S. HOME PRICES
Case-Shiller® Home Price Index Forecasts
The Case-Shiller Home Price Indexes are widely recognized as the most accurate measure of changes in house prices over time. They measure the total market, not just prices of homes purchased through conforming loans. Using Robert Shiller and Karl Case’s time-tested repeat-sales methodology, CSIs are value-weighted and based on observed changes in the value of actual sales. This methodology eliminates appraisal bias, filters out non-arm’s-length sales, and down-weights pairs with long intervals between sales to reduce the influence of extreme price changes.
Economic Expertise » More than 50 economists tracking regional economic conditions.
» Dedicated team of housing analysts.
» One of the first firms to warn of the housing bubble and downturn.
The Industry Standard » Trusted for decades by government entities, Wall Street, and
leading financial institutions worldwide
» Selected by S&P as the arbiter of house price futures trading on the Chicago Mercantile Exchange.
» Time-tested methodology validated and accepted by market and industry professionals.
The Most Accurate » Monthly forecasts ensure that current economic climate
is captured.
» Alternative economic scenarios allow for stress-testing and “what if” analysis.
» Selected by the FDIC in its stress tests of residential mortgage assets as the only accurate reflection of the market downturn in both timing and severity.
» Data quality measures never compromised for more coverage or higher frequency.
» Rigorous validation results in low thresholds of implied volatility, making the index more stable and thus more usable.
Key Features
Applications
Identify Market- Specific Opportunities » Target home equity and
credit card marketing.
» Incorporate market-based product pricing.
» Monitor changes in values across property types.
Manage Risk in RMBS Investments » Update mortgage pool
collateral values.
» Model defaults and prepayments.
» Balance exposure to at-risk markets with growth opportunities.
Service and Manage Mortgage Portfolios » Improve customer retention
and marketing.
» Monitor collateral coverage.
» Estimate gains and losses under multiple economic scenarios.
The most trustworthy and authoritative U.S. house price forecasts — available exclusively from Moody’s Economy.com and Fiserv since 2003.
» Moody’s Economy.com forecasts use a fully specified, transparent supply-and-demand model.
» The model identifies long-term influences such as income trends and demographics and cyclical factors such as unemployment, affordability, and changes in mortgage and foreclosure rates .
» Baseline—most likely—scenario as well as several alternative scenarios simulate the path of house prices under a range of conditions.
» Monthly forecasts ensure that current economic conditions are always reflected.
Dynamic Forecasts
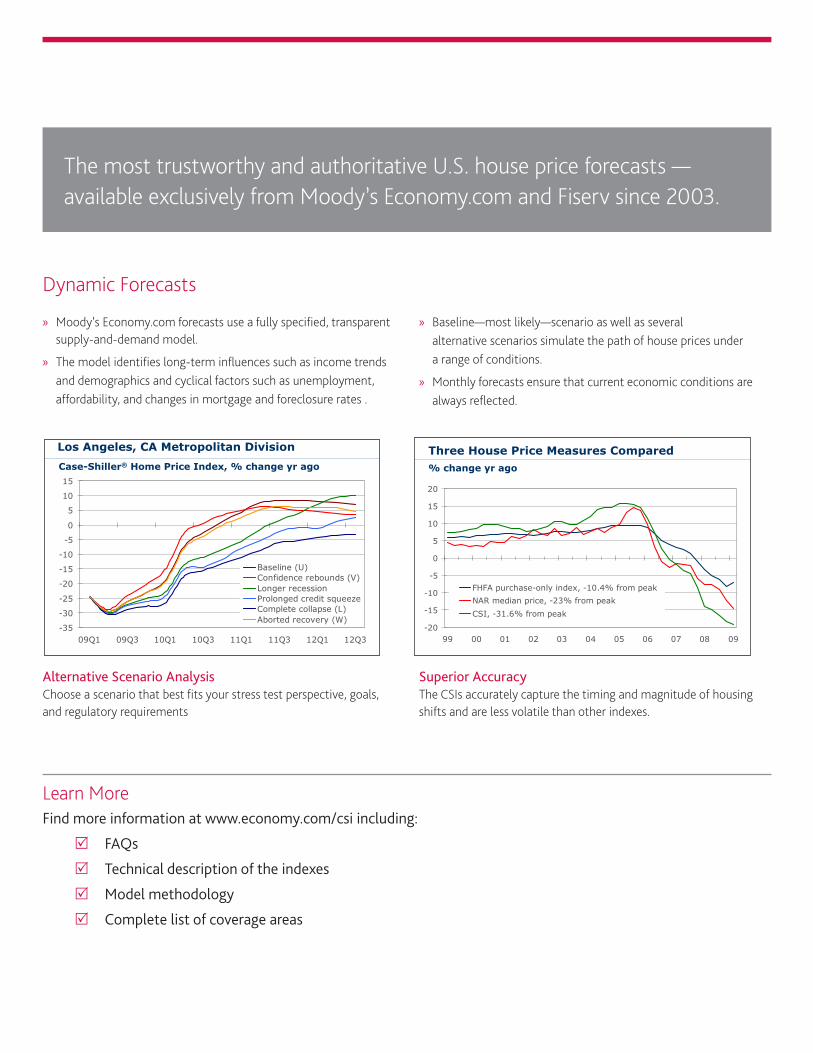
Los Angeles, CA Metropolitan Division
-35
-30
-25
-20
-15
-10
-5
0
5
10
15
09Q1 09Q3 10Q1 10Q3 11Q1 11Q3 12Q1 12Q3
Baseline (U)Confidence rebounds (V)Longer recessionProlonged credit squeezeComplete collapse (L)Aborted recovery (W)
Case-Shiller® Home Price Index, % change yr ago
Three House Price Measures Compared% change yr ago
-20
-15
-10
-5
0
5
10
15
20
99 00 01 02 03 04 05 06 07 08 09
FHFA purchase-only index, -10.4% from peak
NAR median price, -23% from peak
CSI, -31.6% from peak
Alternative Scenario AnalysisChoose a scenario that best fits your stress test perspective, goals, and regulatory requirements
Superior AccuracyThe CSIs accurately capture the timing and magnitude of housing shifts and are less volatile than other indexes.
Learn MoreFind more information at www.economy.com/csi including:
R FAQs
R Technical description of the indexes
R Model methodology
R Complete list of coverage areas
Copyright © 2010, Moody’s Analytics, Inc. All Rights Reserved.
Email us: [email protected] Or visit us: www.economy.com/csi
U.S./CANADA +1 866.275.3266
EMEA+44 (0) 20.7772.1646
ASIA/PACIFIC +61 2 9270 8111
OTHER LOCATIONS+1 610.235.5299
CONTACT US To find out how Case-Shiller Home Price Index forecasts can help meet your needs:
Case-Shiller® Home Price Index Forecasts
Forecast DatabaseMonthly forecast updates to the single-family aggregate index for:
» The United States.
» All census regions and divisions.
» All U.S. states.
» All U.S. metropolitan areas and divisions.
» Over 350 U.S. counties.
Coverage
Historical Database » Repeat-purchase indexes for all metro areas.
» Exclusive indexes for more than 100 markets, 350 counties and about 4,000 zip codes.
Both Datasets also include: » Three price tiers for over 40 metropolitan areas.
» Condominium data for more than 35 metropolitan areas..
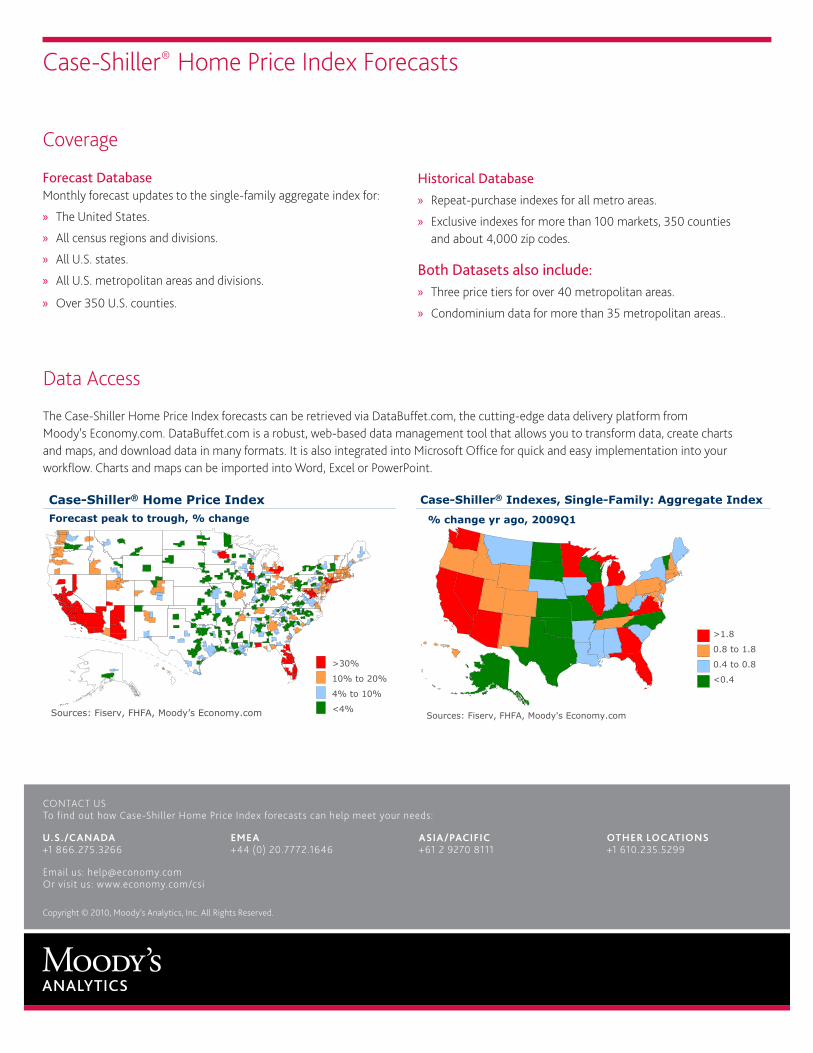
Data Access
The Case-Shiller Home Price Index forecasts can be retrieved via DataBuffet.com, the cutting-edge data delivery platform from Moody’s Economy.com. DataBuffet.com is a robust, web-based data management tool that allows you to transform data, create charts and maps, and download data in many formats. It is also integrated into Microsoft Office for quick and easy implementation into your workflow. Charts and maps can be imported into Word, Excel or PowerPoint.
Case-Shiller® Home Price Index
Sources: Fiserv, FHFA, Moody’s Economy.com
>30%
10% to 20%
4% to 10%
<4%
Forecast peak to trough, % change
Case-Shiller® Indexes, Single-Family: Aggregate Index
Sources: Fiserv, FHFA, Moody's Economy.com
>1.8
0.8 to 1.8
0.4 to 0.8
<0.4
% change yr ago, 2009Q1
Recommended