Controls on evapotranspiration (ET) and
its seasonality in select land surface models
In Support of The LBA-Model Intercomparison Project (MIP)
Brad ChristoffersenUniversity of Arizona
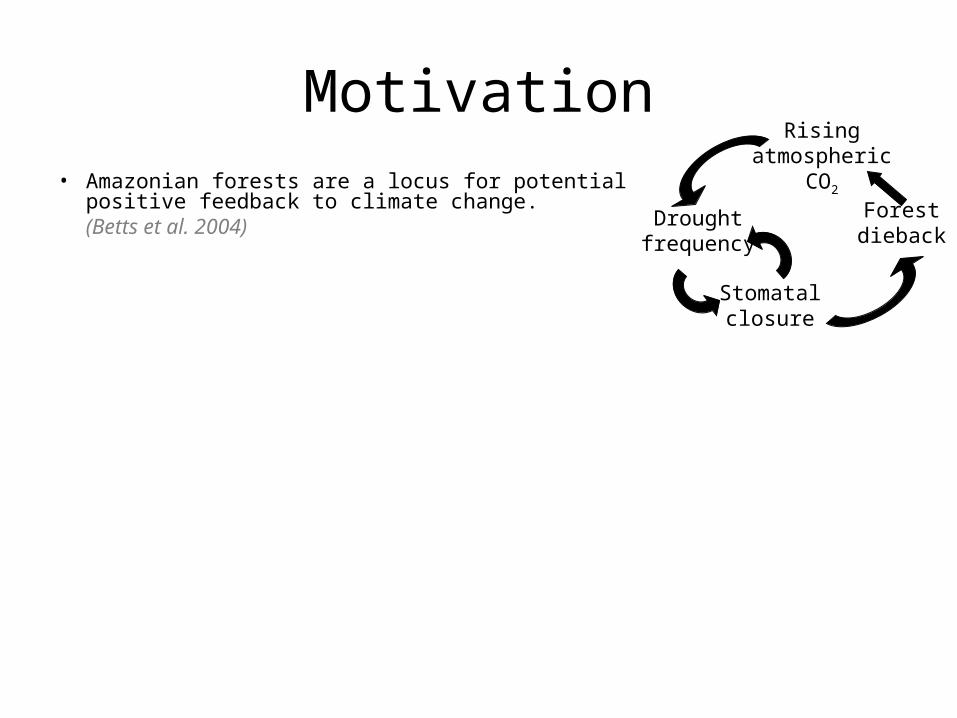
Motivation• Amazonian forests are a locus for potential
positive feedback to climate change.(Betts et al. 2004)
Rising atmospheric
CO2
Drought frequency
Forest dieback
Stomatal closure
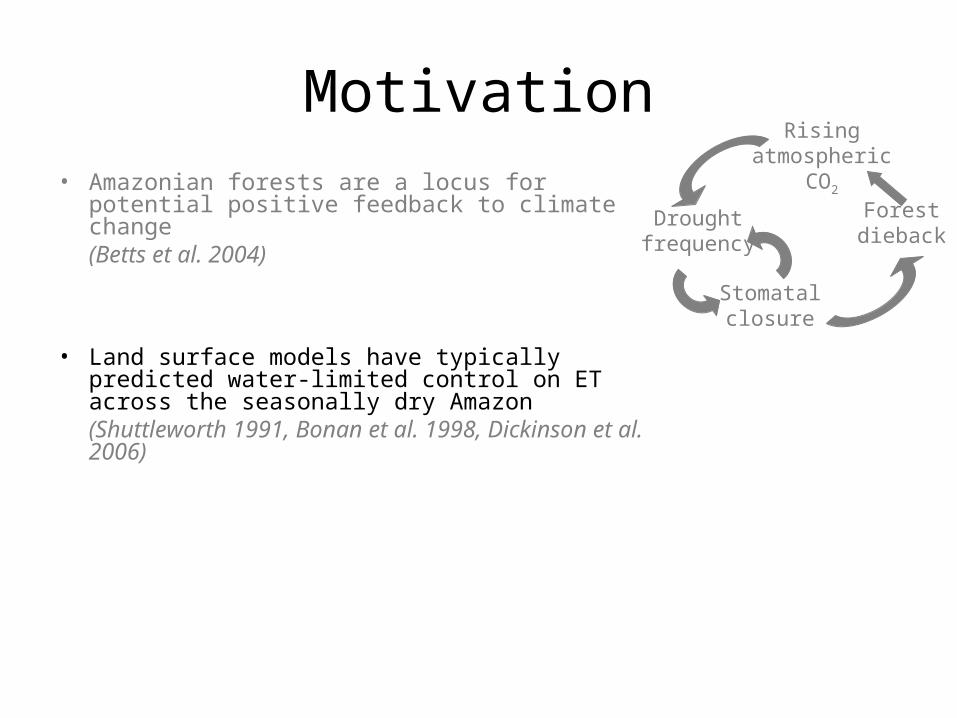
Motivation• Amazonian forests are a locus for
potential positive feedback to climate change(Betts et al. 2004)
• Land surface models have typically predicted water-limited control on ET across the seasonally dry Amazon(Shuttleworth 1991, Bonan et al. 1998, Dickinson et al. 2006)
Rising atmospheric
CO2
Drought frequency
Forest dieback
Stomatal closure
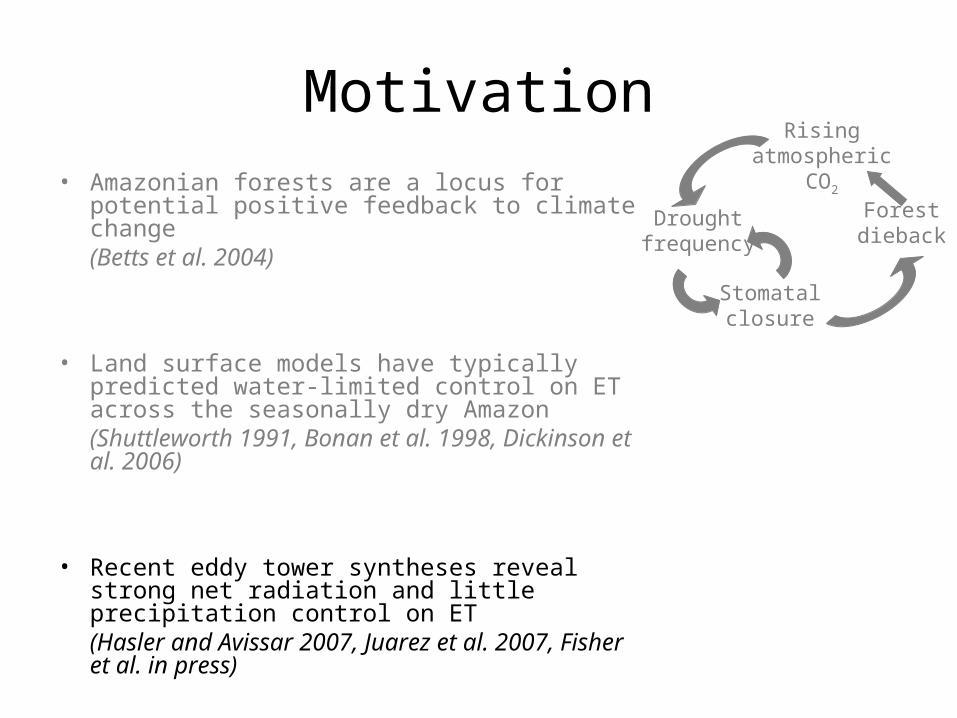
Motivation• Amazonian forests are a locus for
potential positive feedback to climate change(Betts et al. 2004)
• Land surface models have typically predicted water-limited control on ET across the seasonally dry Amazon(Shuttleworth 1991, Bonan et al. 1998, Dickinson et al. 2006)
• Recent eddy tower syntheses reveal strong net radiation and little precipitation control on ET(Hasler and Avissar 2007, Juarez et al. 2007, Fisher et al. in press)
Rising atmospheric
CO2
Drought frequency
Forest dieback
Stomatal closure
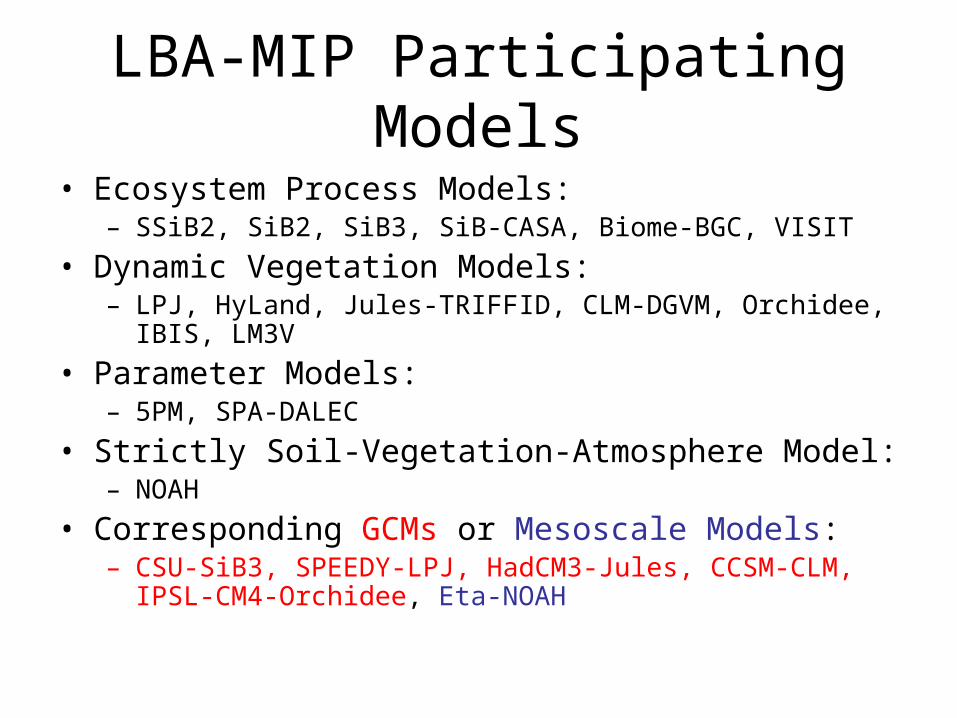
LBA-MIP Participating Models
• Ecosystem Process Models:– SSiB2, SiB2, SiB3, SiB-CASA, Biome-BGC, VISIT
• Dynamic Vegetation Models:– LPJ, HyLand, Jules-TRIFFID, CLM-DGVM, Orchidee, IBIS,
LM3V
• Parameter Models:– 5PM, SPA-DALEC
• Strictly Soil-Vegetation-Atmosphere Model:– NOAH
• Corresponding GCMs or Mesoscale Models:– CSU-SiB3, SPEEDY-LPJ, HadCM3-Jules, CCSM-CLM, IPSL-
CM4-Orchidee, Eta-NOAH
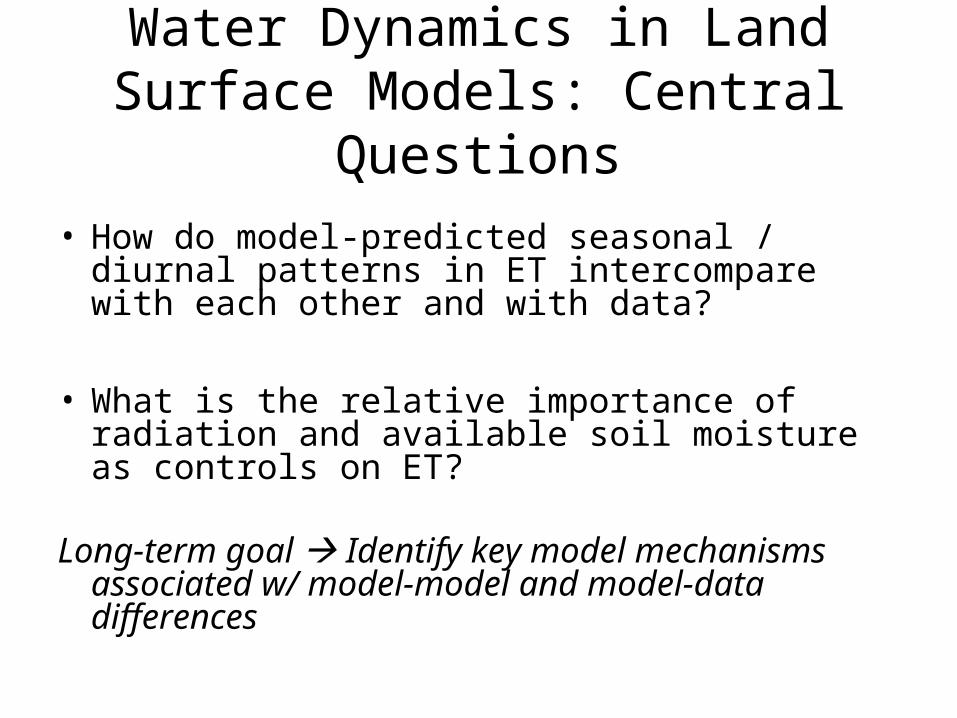
Water Dynamics in Land Surface Models: Central
Questions• How do model-predicted seasonal / diurnal
patterns in ET intercompare with each other and with data?
• What is the relative importance of radiation and available soil moisture as controls on ET?
Long-term goal Identify key model mechanisms associated w/ model-model and model-data differences
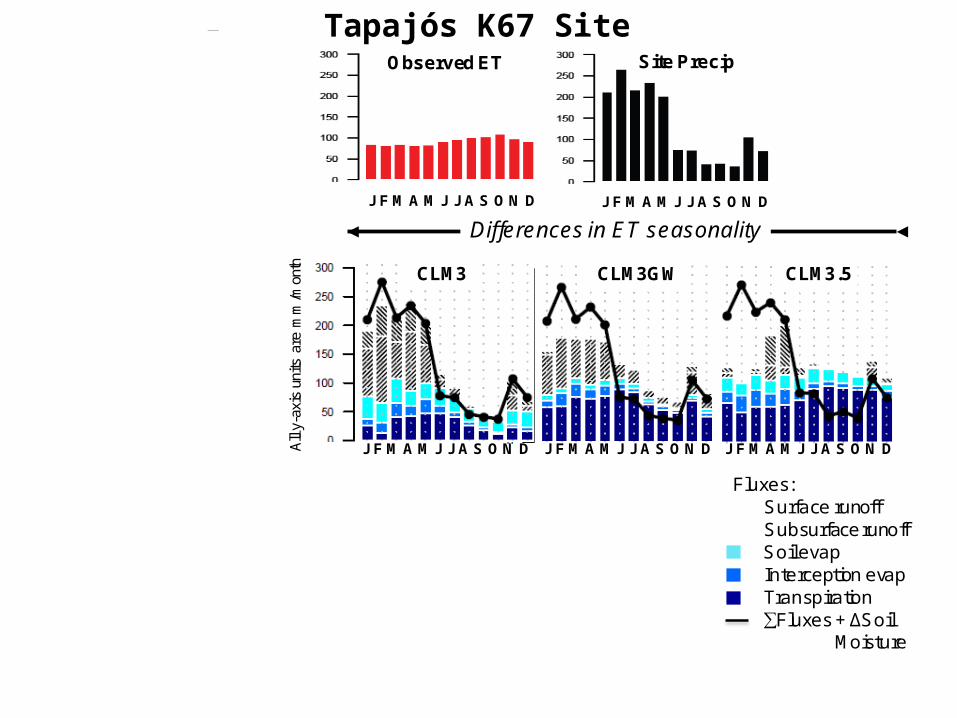
Differences in ET seasonality
Subsurface runoffSurface runoff
Soil evapInterception evapTranspiration
Mo
de
l-m
od
el
Inte
rco
mp
ari
so
n
Da
ta-M
od
el I
nte
rco
mp
ari
so
nJ F M A M J J A S O N D
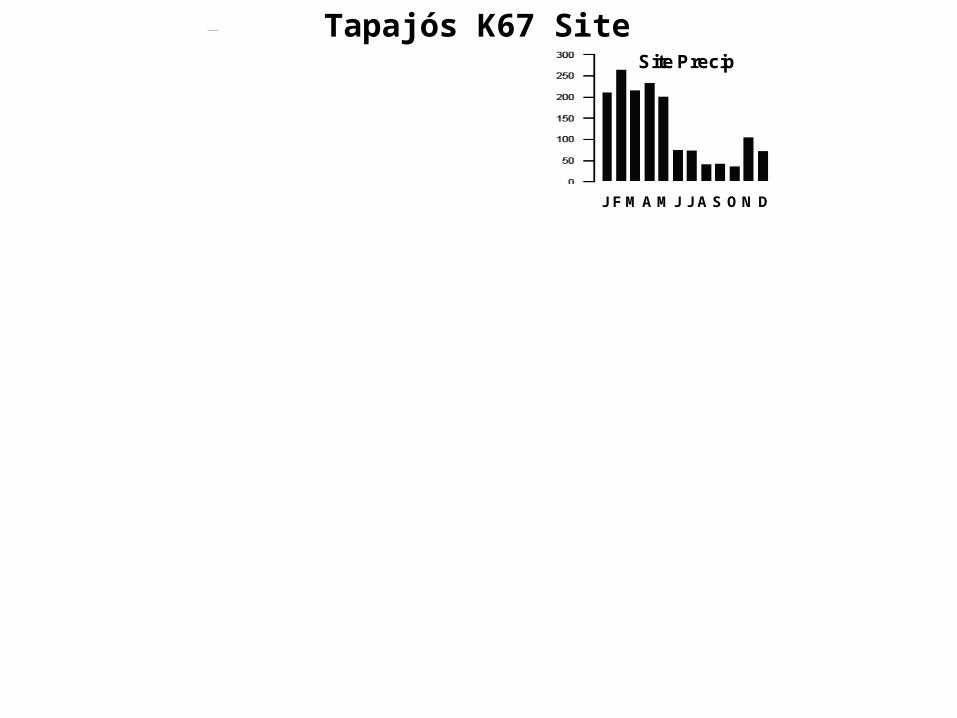
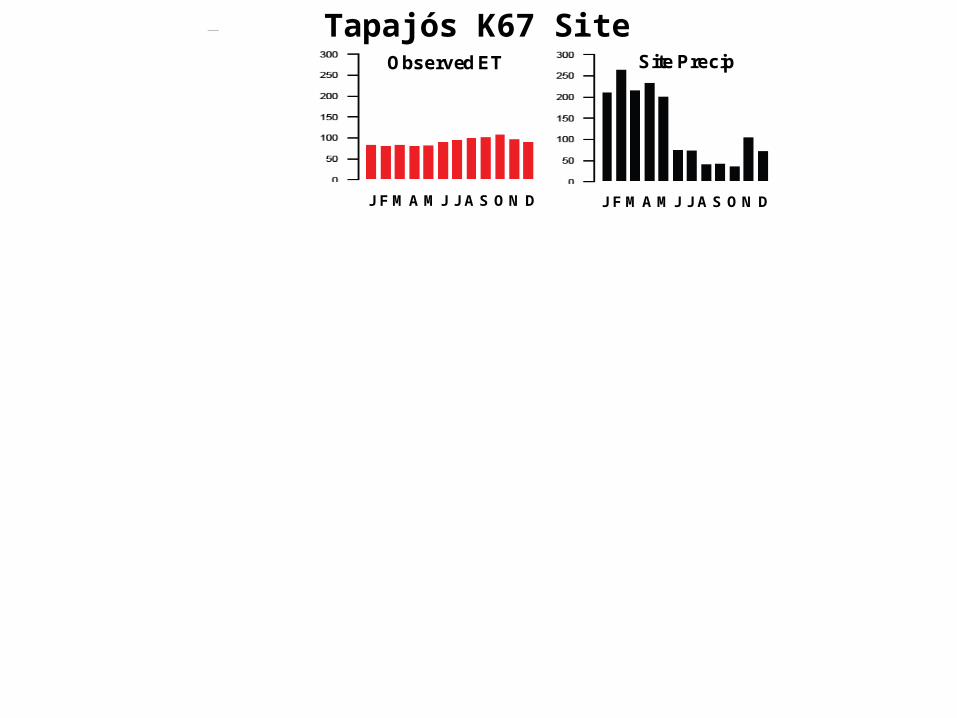
Site PrecipObserved ET
All
y-ax
is u
nits
are
mm
/mon
th
J F M A M J J A S O N D J F M A M J J A S O N D J F M A M J J A S O N D
J F M A M J J A S O N D J F M A M J J A S O N D
CLM3 CLM3GW CLM3.5
NOAH IBIS
∑Fluxes + ∆SoilMoisture
J F M A M J J A S O N D
Fluxes:
Tapajós K67 Site
Differences in ET seasonality
Subsurface runoffSurface runoff
Soil evapInterception evapTranspiration
Mo
de
l-m
od
el
Inte
rco
mp
ari
so
n
Da
ta-M
od
el I
nte
rco
mp
ari
so
nJ F M A M J J A S O N D
Site PrecipObserved ET
All
y-ax
is u
nits
are
mm
/mon
th
J F M A M J J A S O N D J F M A M J J A S O N D J F M A M J J A S O N D
J F M A M J J A S O N D J F M A M J J A S O N D
CLM3 CLM3GW CLM3.5
NOAH IBIS
∑Fluxes + ∆SoilMoisture
J F M A M J J A S O N D
Fluxes:
Tapajós K67 Site
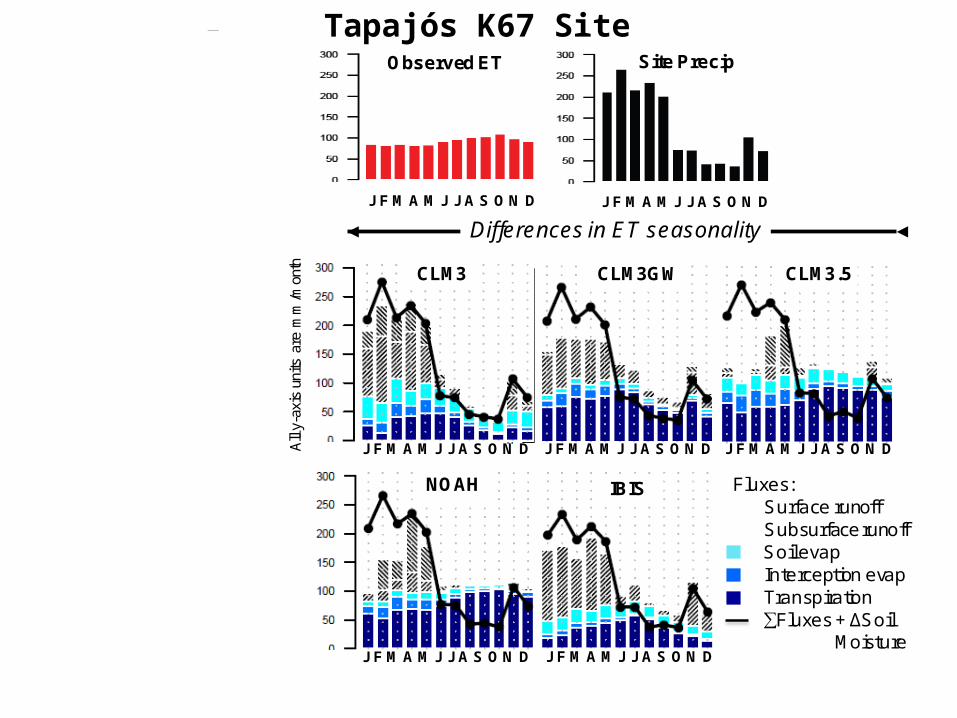
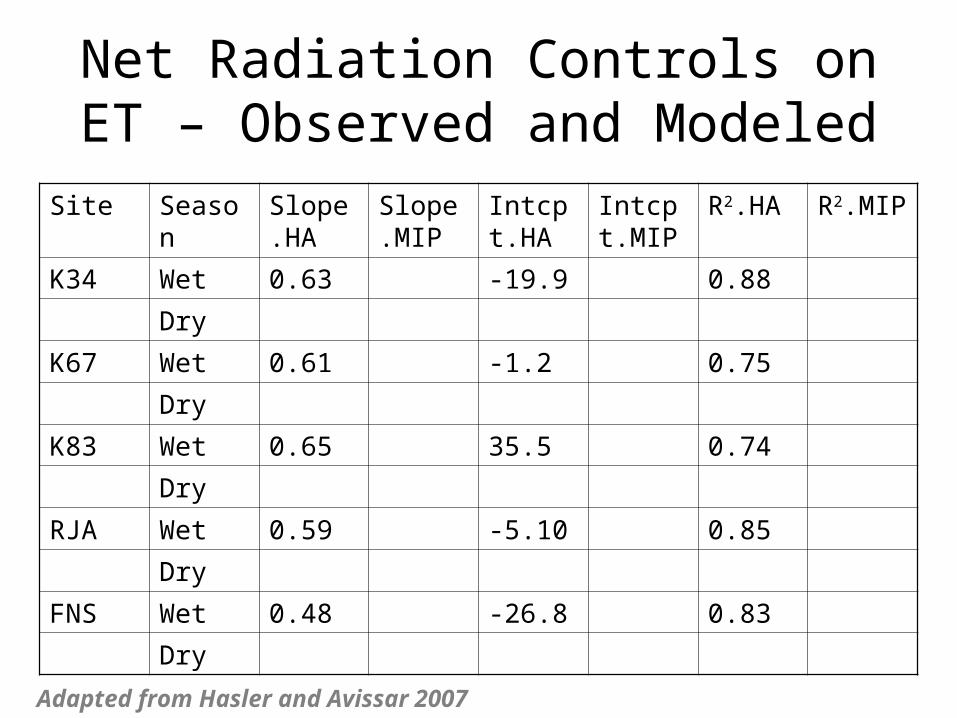
Net Radiation Controls on ET – Observed and Modeled
Net Radiation Controls on ET – Observed and Modeled
Site Season
Slope.HA
Slope.MIP
Intcpt.HA
Intcpt.MIP
R2.HA R2.MIP
K34 Wet 0.63 -19.9 0.88
Dry
K67 Wet 0.61 -1.2 0.75
Dry
K83 Wet 0.65 35.5 0.74
Dry
RJA Wet 0.59 -5.10 0.85
Dry
FNS Wet 0.48 -26.8 0.83
Dry
Adapted from Hasler and Avissar 2007
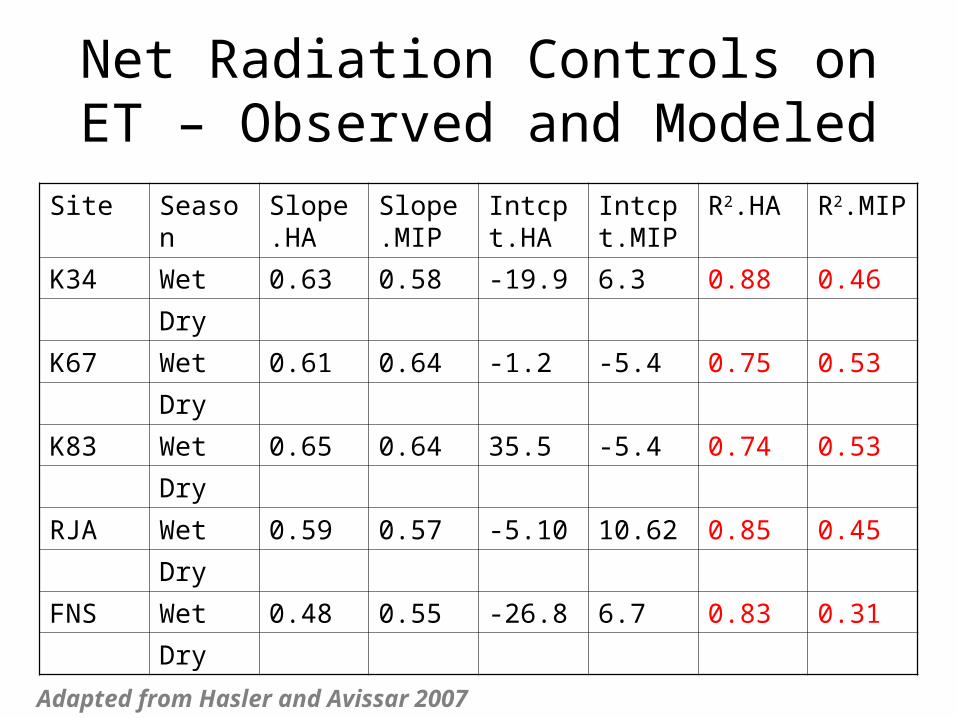
Net Radiation Controls on ET – Observed and Modeled
Site Season
Slope.HA
Slope.MIP
Intcpt.HA
Intcpt.MIP
R2.HA R2.MIP
K34 Wet 0.63 0.58 -19.9 6.3 0.88 0.46
Dry
K67 Wet 0.61 0.64 -1.2 -5.4 0.75 0.53
Dry
K83 Wet 0.65 0.64 35.5 -5.4 0.74 0.53
Dry
RJA Wet 0.59 0.57 -5.10 10.62 0.85 0.45
Dry
FNS Wet 0.48 0.55 -26.8 6.7 0.83 0.31
Dry
Adapted from Hasler and Avissar 2007
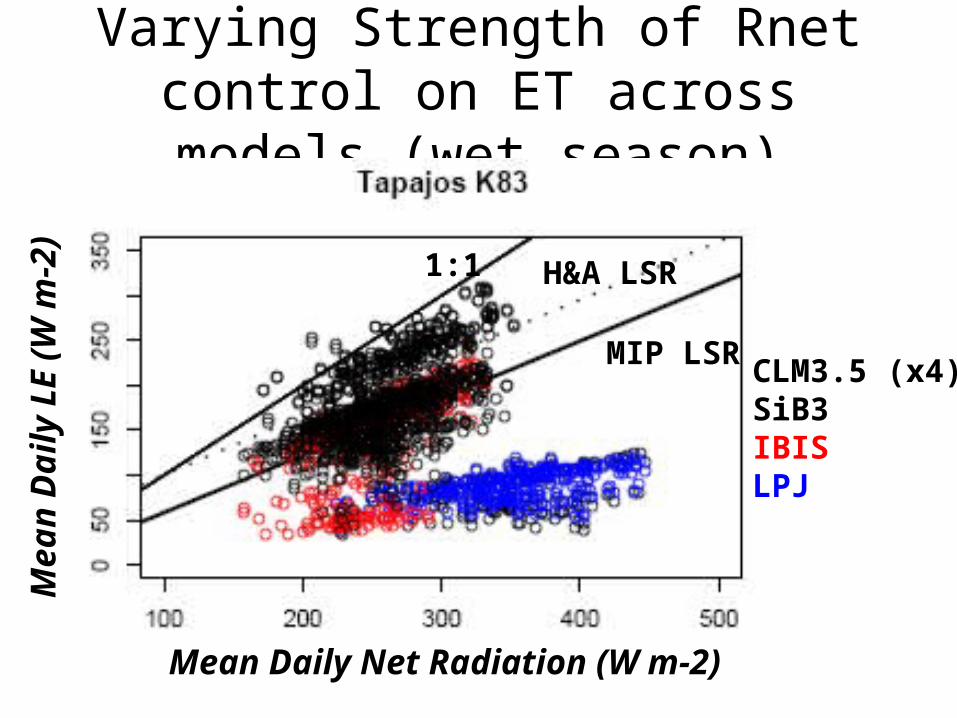
Varying Strength of Rnet control on ET across models
(wet season)
Mean Daily Net Radiation (W m-2)
Mean
Daily L
E (
W m
-2)
CLM3.5 (x4)SiB3IBISLPJ
1:1
MIP LSR
H&A LSR
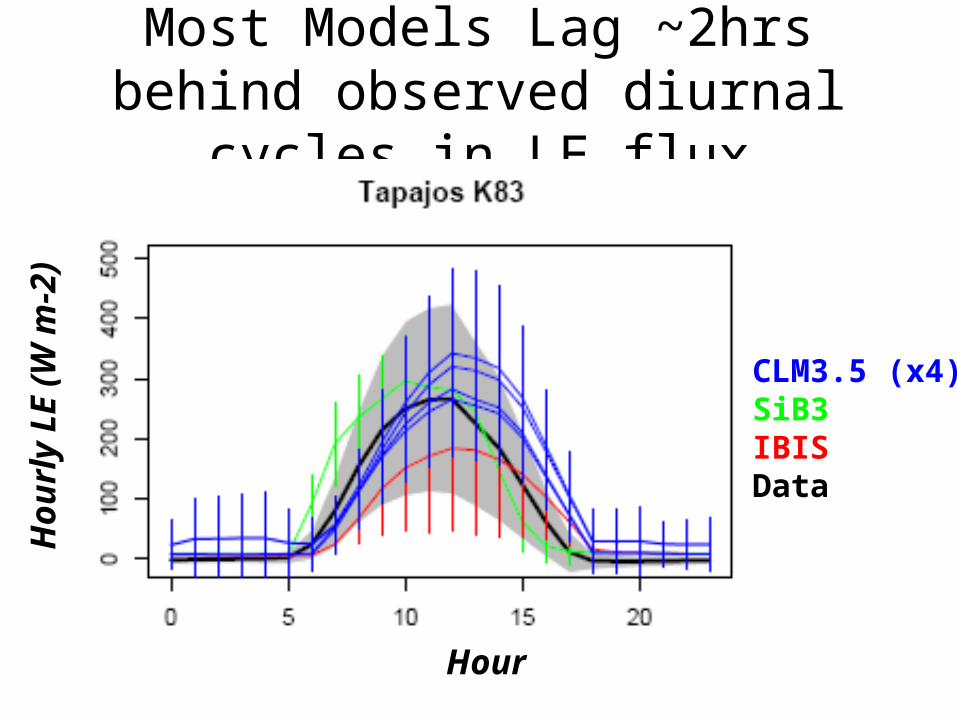
Most Models Lag ~2hrs behind observed diurnal cycles in LE
flux
Hour
Hou
rly L
E (
W m
-2)
CLM3.5 (x4)SiB3IBISData
Conclusions
• Considerable cross-model variance in predicted daily (and seasonal) patterns of ET
• Diurnal cycles of ET often lag those observed in data
• Controls on ET - Models in Semi-Agreement:– Net radiation exhibits dominant control on ET in
absence of water stress– Increased soil moisture storage capacity in
models shifts ET peak to dry season (in phase with net radiation)
Future Directions
• What model mechanisms give rise to these differences?
• What is the quantitative partitioning of relative controls of radiation and soil moisture on ET?
• Explore empirical bucket model capability of caputuring seasonal and interannual variability in modeled soil moisture.

Thanks!The LBA-MIP Team
GustavoNASA
BradUofA
ScottUofA
JulioINPA
LindseyUT-Austin
MargrietVrije U.
Laura
MarcosUFV
FannyPotsdam
NataliaUofA
DavidEdinburgh
Ian, CSU Ben, Potsdam
HewlleyUFV
Recommended