8/7/2019 Hs2 Economic Case
http://slidepdf.com/reader/full/hs2-economic-case 1/62
Economic Case
or HS2The Y Networkand London –West Midlands
February 2011
8/7/2019 Hs2 Economic Case
http://slidepdf.com/reader/full/hs2-economic-case 2/62
While the Department for Transport (DfT) has made every effort to ensure the information in this document is accurate,
DfT does not guarantee the accuracy, completeness or usefulness of that information and it cannot accept liability for
any loss or damages of any kind resulting from reliance on the information or guidance this document contains.
The Department for Transport has actively considered the needs of blind and partially sighted people in accessing this
document. The text will be made available in full on the Department’s website. The text may be freely downloaded and
translated by individuals or organisations for conversion into other accessible formats. If you have other needs in this
regard please contact the Department.
Department for Transport
Great Minster House
76 Marsham StreetLondon SW1P 4DR
Telephone 0300 330 3000
Website www.dft.gov.uk
© Crown copyright Queen’s Printer, 2011, except where otherwise stated
Copyright in the typographical arrangement rests with the Crown.
You may re-use this information (not including logos or third-party material) free of charge in any format or medium,
under the terms of the Open Government Licence. To view this licence, visit www.nationalarchives.gov.uk/doc/
open-government-licence/ or write to the Information Policy Team, The National Archives, Kew, London TW9 4DU,
or e-mail: [email protected].
To reproduce third-party material you need to obtain permission from the copyright holders concerned.
To reproduce maps, contact Ordnance Survey via their website www.ordnancesurvey.co.uk/oswebsite/business/
licences/ or write to Customer Service Centre, Ordnance Survey, Romsey Road, Southampton SO16 4GU.
To order further copies contact:
High Speed Rail: Investing in Britain’s Future, consultation orderline
Tel: 0300 321 1010
Web: http://highspeedrail.dft.gov.uk
ISBN 978 1 84864 119 8
Printed in Great Britain
8/7/2019 Hs2 Economic Case
http://slidepdf.com/reader/full/hs2-economic-case 3/62
3
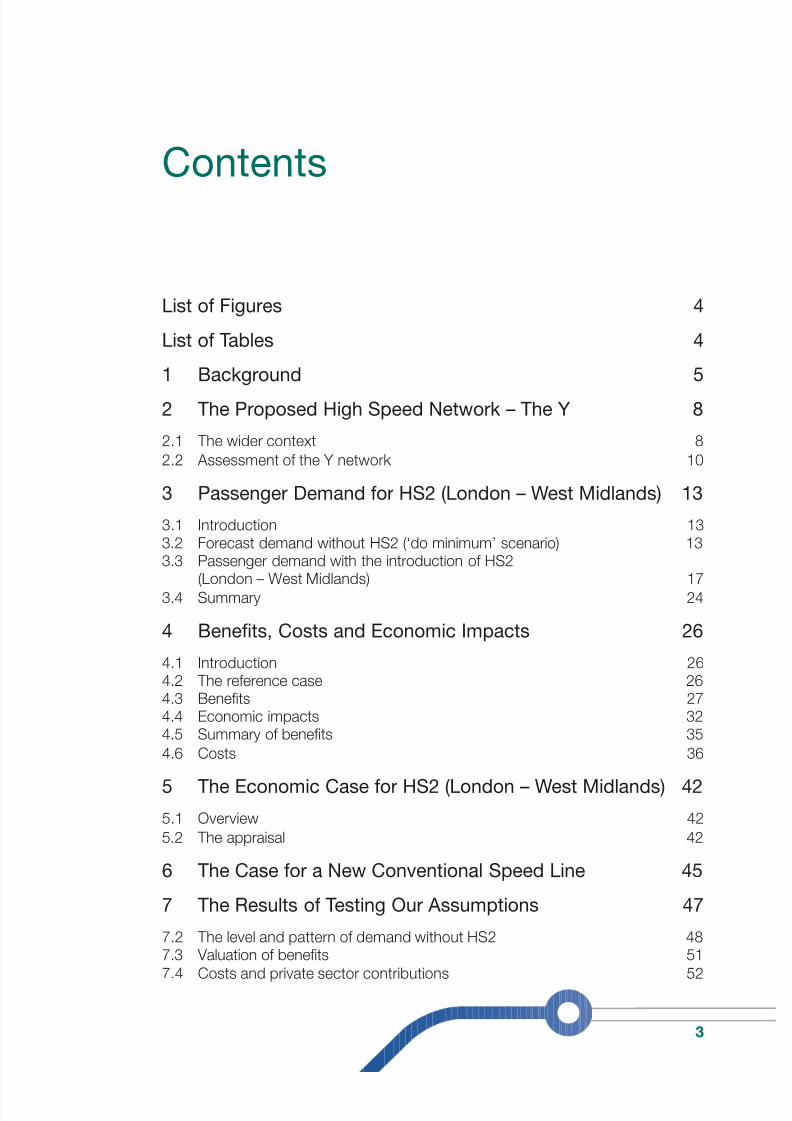
Contents
List of Figures 4
List of Tables 4
1 Background 5
2 The Proposed High Speed Network – The Y 8
2.1 The wider context 8
2.2 Assessment of the Y network 10
3 Passenger Demand for HS2 (London – West Midlands) 13
3.1 Introduction 133.2 Forecast demand without HS2 (‘do minimum’ scenario) 13
3.3 Passenger demand with the introduction of HS2(London – West Midlands) 17
3.4 Summary 24
4 Benets, Costs and Economic Impacts 26
4.1 Introduction 264.2 The reference case 264.3 Benets 274.4 Economic impacts 324.5 Summary of benets 35
4.6 Costs 36
5 The Economic Case for HS2 (London – West Midlands) 42
5.1 Overview 42
5.2 The appraisal 42
6 The Case for a New Conventional Speed Line 45
7 The Results of Testing Our Assumptions 47
7.2 The level and pattern of demand without HS2 487.3 Valuation of benets 51
7.4 Costs and private sector contributions 52
8/7/2019 Hs2 Economic Case
http://slidepdf.com/reader/full/hs2-economic-case 4/62
4
7.5 Scheme opening year 53
7.6 Summary 54
8 Conclusions and Further Information 55
9 Glossary of Economic Terms 56
Appendix 1 58
Service specication for HS2 (London – West Midlands) 58
Service specication assumptions for the Y network 60
List of Figures
Figure 1 Indicative map of the proposed Y shaped high speed rail network 9Figure 2 Long distance trips by mode, Great Britain 14Figure 3 Change in long distance daily trips after the introduction of
HS2 (London – West Midlands), in 2043 20Figure 4 Forecast daily load factors on a long distance services after the
introduction of HS2 (London – West Midlands), in 2043 21Figure 5 Proportion of passengers choosing to use Euston and Old Oak
Common by area 23Figure 6 Effects on the BCR of HS2 opening later 54
Figure A1 Service specication for HS2 (London – West Midlands) 59
Figure A2 Service specication assumptions for the Y network 61
List of Tables
Table 1 Comparison of existing journey times to the Y network 10Table 2 Quantied benets and costs (£ billions) of the Y network
(2009 PV/prices) and the resulting BCR 12Table 3 Source of trips, of passengers using HS2 (London – West Midlands) 19Table 4 Benets of HS2 (London – West Midlands) to transport users, by
business passengers and other passengers (£ million, 2009 PV) 31Table 5 Monetised benets to long distance passengers by origin of trip 32
Table 6 Monetised benets of HS2 (London – West Midlands) usingDepartment for Transport’s transport appraisal and Wider EconomicImpacts guidance (2009 PV/prices) 35
Table 7 Capital cost estimates for HS2 (London – West Midlands) preferredscheme excluding rolling stock; £ millions, Quarter 3 2009 prices 37
Table 8 Rolling stock capital cost estimates; £ millions, Quarter 3 2009 prices 40Table 9 Operating costs for HS2 (London – West Midlands) over the 60 year
appraisal period, by category 41Table 10 Quantied costs and benets (£ billions) of HS2 (2009 PV/prices)
and resulting BCR 43
N.B. Table totals may not be an exact sum of componentsdue to rounding.
8/7/2019 Hs2 Economic Case
http://slidepdf.com/reader/full/hs2-economic-case 5/62
5
1.1.1 This document is part of a set of documents
produced for the public consultation
on high speed rail and should be read
in conjunction with the main consultation
document which covers the strategic case
for high speed rail and the proposed line
of route for HS2 between London and the
West Midlands. Its purpose is to assist thereader in understanding the factors and
assumptions that we took into account
in estimating the economic benets and
economic costs of high speed rail.
1.1.2 This Economic Case document rst
describes the proposed high speed rail
network and the strategic level assessment
of a Y shaped network from London
to the West Midlands, Manchester andLeeds. It then describes a more detailed
assessment of the line to the West
Midlands (HS2). It sets out our forecast of
the specic impact of HS2, which in turn
drives the assessment of the economic
benets and wider impacts. We also set
out here our assessment of the costs.
We then explain our assessment of the
potential value for money of the London
to West Midlands scheme in economicterms (other impacts such as landscape
and noise are covered in the Appraisal of
Sustainability which is published alongside
this document). This document also sets
out how we have tested the sensitivity
of our assessment to changes in our
assumptions (for example around
economic growth forecasts).
Defning ‘business case’ and‘economic case’
1.1.3 A business case is the overall consideration
of the factors inuencing decisions onwhether to proceed with a scheme. These
cover: the strategic t with wider objectives,
value for money (covering the economic
case and environmental considerations),
commercial issues, nancial affordability
and how the project might be delivered.
Many of these factors cannot be quantied
in monetary terms and compared to each
other numerically. Our proposals for HS2
take full account of this wider picture,though some elements such as the
nancial case would be addressed in
more detail in the future if the proposals
are taken forwards following the public
consultation. This document focuses
on the economic case.
1.1.4 The economic appraisal of a transport
scheme seeks to cover the full economic
costs and full economic benets of ascheme and to quantify these in monetary
terms. We approached this on the basis
of the HM Treasury Green Book and of
Department for Transport’s Transport
Appraisal Guidance.1,2 We assess the
1 Chapter 5, The Green Book, HM Treasury, 2003
(http://www.hm-treasury.gov.uk/data_greenbook_
index.htm)
2 Department for Transport Online Transport Analysis
Guidance (WebTAG) (http://www.dft.gov.uk/webtag/)and National Trip End Model (NTEM) (http://www.dft.
gov.uk/tempro/)
1. Background
8/7/2019 Hs2 Economic Case
http://slidepdf.com/reader/full/hs2-economic-case 6/62
6
1. Background
direct impacts that HS2 would have on
transport users through, for instance,
journey time savings and reductions incrowding on trains. We also measure the
impacts, both positive and negative, that
HS2 would have on the classic rail
network. Finally, we look at some of the
wider economic impacts on the UK
economy, using Department for Transport
guidance to quantify and value these
impacts. The appraisal of quantied
benets provides a numerical result, a
‘Benet Cost Ratio’ or BCR. This ratiorepresents the level of benet per pound
(£) spent by Government (e.g. if a scheme
generates £2 of benet for every £1 spent
this is presented as a BCR of 2.0). We
explain this in more detail in Chapter 5.
1.1.5 In order to compare costs and benets
occurring at different points in time, our
appraisal brings all future year values to
a ‘Present Value’ (PV) in 2009. This isdone by adjusting future year values,
discounting them at 3.5% for 30 years
and 3% thereafter, in order to reect the
fact that benets and costs today are
valued more highly than those
in the future.
The robustness o our assumptions or theeconomic case
1.1.6 Investment in high speed rail is a major,probably once in a generation, decision
with a very long life. In line with Government
advice, we have assessed the economic
case over the construction period and 60
years of operation. This is a conservative
approach: we would expect the investment
in high speed rail to have a much longer
life. Our assessment of the future level of
demand for long distance travel and the
impact of introducing HS2 has beeninformed by evidence and guidance from
the Department for Transport which is
based on extensive research of trends
in transport demand. Our forecasts areset out in Chapter 3; we believe these
forecasts to be prudent. Using these
forecasts we apply Government guidance
on the calculation and valuation of
impacts to estimate the economic
case for HS2.
1.1.7 There will always be uncertainty about
future consumer behaviour and
circumstances when predicting so far intothe future. The level of demand and the
value we place on the benets that HS2
would have can have signicant impacts
on the overall case for the rail network.
It is therefore good practice for economic
and transport assessments to include a
thorough set of tests (sensitivity tests) to
explore the relationship between the
assumptions and the outputs (in this case
the BCR). The tests we have undertakenfor the proposed London to West Midlands
scheme are described in Chapter 7,
though we seek to highlight the key
factors that may affect the BCR
throughout this document.
The economic case in the context oprevious HS2 Ltd published documents
1.1.8 Since our March 2010 report was
published, some of the assumptionsand approaches used to generate the
economic case have been updated and
modied. Key assumptions that have
changed are listed below:
• Rail demand is now forecast to grow
more slowly than we forecast last year.
This is due to two factors. First, the
forecasts of Gross Domestic Product
(GDP) growth produced by the previousGovernment showed higher rates of
8/7/2019 Hs2 Economic Case
http://slidepdf.com/reader/full/hs2-economic-case 7/62
7
Economic Case for HS2
growth. The current Government
has transferred responsibility for GDP
forecasting to the independent Ofcefor Budget Responsibility, whose
forecasts show a lower rate of growth,
resulting in slower growth in rail demand.
Second, as announced in the October
2010 Spending Review rail fares will
now be higher between 2012 and
2015. We still assume rail demand will
stop growing – or ‘saturate’ – at the
same level but as a result of these two
factors this is now forecast to occurin 2043 rather than 2033. This is a
cautious forecasting assumption:
growth is unlikely simply to stop.
• Consistent with this, car and air travel
forecasts have been extended from
2033 to 2043 and adjusted for lower
economic growth.
• We have adjusted the way in which weforecast air travel demand as a result
of the recent decision not to provide a
third runway at Heathrow. We do not
constrain our forecast of aviation
demand. This better reects the
potential size of the market for long
distance travel across all modes.
• Values of time, fares and fuel prices
have been adjusted to reect continuedGDP growth until 2043, but at a lower
rate (in line with latest forecasts).
• The treatment of indirect taxation
reects the approach adopted in the
2010 Government Spending Review.
• Following a review of the economic
model during Summer 2010 which
detected an error, various changes and
improvements to the approach have
been made – particularly around how
we model station choice in London.
• We have reviewed the assumed service
patterns for HS2 and for use of the
capacity released on the West Coast
Main Line (WCML).
• Infrastructure costs have been
reviewed in the light of work by
Infrastructure UK, leading to a
reduction in the estimated cost
of tunnels.
• Operating costs have also been
reviewed resulting in a reduction
in costs.
• We now include the costs and benets
of a connection to HS1 and hence the
possibility of connecting to destinations
in continental Europe.
• The way we discount costs andbenets to 2009 present values has
been revised to be more consistent
with HM Treasury guidance.
• Our assessment of the network to
Manchester and Leeds includes a spur
to Heathrow.
8/7/2019 Hs2 Economic Case
http://slidepdf.com/reader/full/hs2-economic-case 8/62
8
2. The Proposed High Speed
Rail Network – The Y2.1 The wider context
2.1.1 Government set up HS2 Ltd in January
2009 to consider the case for new high
speed rail services between London and
Scotland and, in particular:
• to look at the feasibility of, andbusiness case for, a new high speed
rail line between London and the West
Midlands, and to develop associated
route proposals;
• to consider the potential development
of a high speed network beyond the
West Midlands at the level of broad
route corridors.
2.1.2 Reports on this remit were published
in March 2010. In October 2010 the
Government announced that its preferred
option for high speed rail north of
Birmingham is for two separate corridors
– one corridor direct to Manchester and
then connecting on to the WCML, and the
other to Leeds via the East Midlands and
South Yorkshire, with stations in both
areas, before connecting to the East
Coast Main Line.
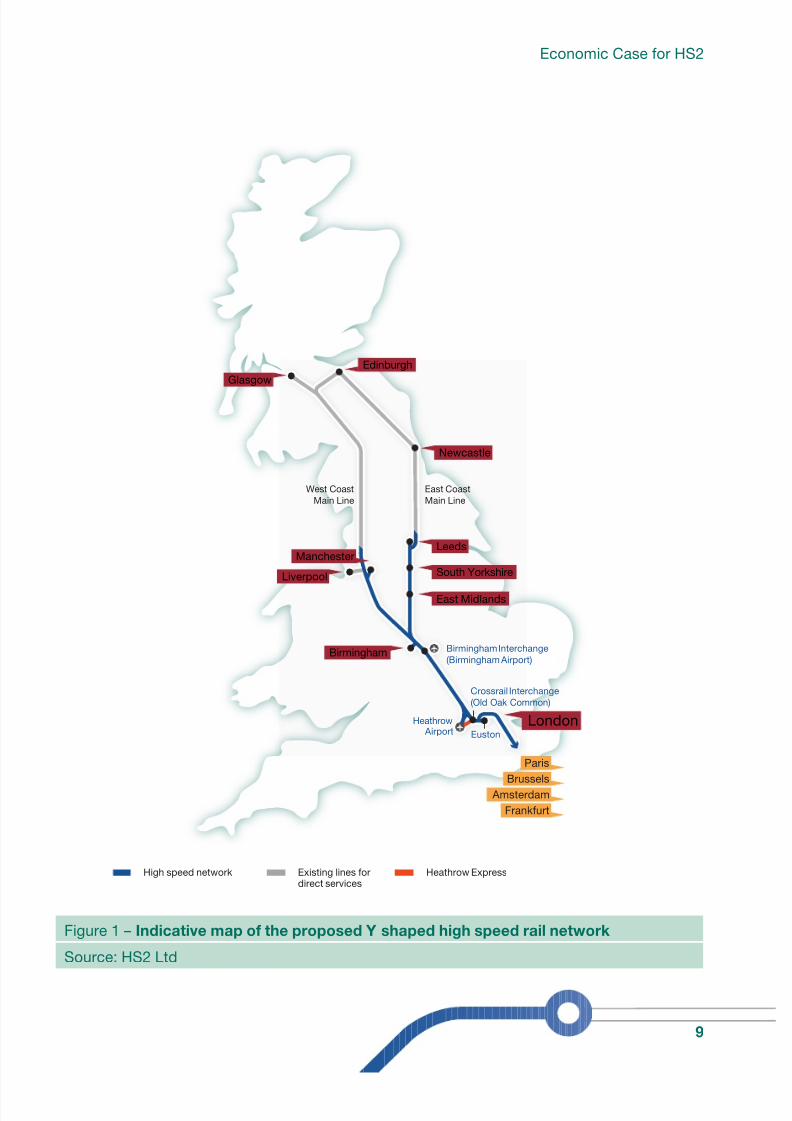
2.1.3 The broad plan for the network to
Manchester and Leeds including the
section between London and the West
Midlands is roughly the shape of a letter Y.
We refer to this as the ‘Y network’. Figure
1 below is an indicative map.
2.1.4 The Government’s choice of the Y network
was based on work by HS2 Ltd comparing
this conguration with a ‘reverse S’
conguration serving London to Birmingham,
Manchester and Leeds in a single line.
This work was published in October 20103.
The clear conclusion is that a Y conguration
as shown in Figure 1 is likely to offerthe best economic case for the basis
of the network.
2.1.5 Following this, also in October 2010, HS2
Ltd was asked by Government to prepare
a more detailed assessment of the
business case for extending the proposed
HS2 line from the West Midlands to
Manchester and Leeds and develop route
proposals, reporting in December 2011.
3 A report by HS2 Ltd on wider network options,
October 2010, Department for Transport (http:// www.dft.gov.uk/pgr/rail/pi/highspeedrail/hs2ltd/
networkoptions/)
8/7/2019 Hs2 Economic Case
http://slidepdf.com/reader/full/hs2-economic-case 9/62
9
Economic Case for HS2
Amsterdam
Paris
Frankfurt
Brussels
Birmingham Interchange
(Birmingham Airport)
Crossrail Interchange
(Old Oak Common)
HeathrowAirport Euston
Heathrow ExpressExisting lines fordirect services
High speed network
Birmingham
Manchester
Liverpool
Edinburgh
Newcastle
London
Leeds
East Midlands
Glasgow
West Coast
Main Line
East Coast
Main Line
South Yorkshire
Figure 1 – Indicative map o the proposed Y shaped high speed rail network
Source: HS2 Ltd
8/7/2019 Hs2 Economic Case
http://slidepdf.com/reader/full/hs2-economic-case 10/62
10
2. The Proposed High Speed Rail Network – The Y
2.2 Assessment o
the Y Network2.2.1 In the meantime we have provided an
updated high level assessment of the
Y network for HS2 Manchester and
Leeds. Signicant further optimisation
of both engineering design and service
patterns will be undertaken before a nal
report is submitted to the Government by
the end of the year. Our initial assessment is
calculated using a combination of detailedmodelling and estimates extrapolated from
our experience of work on HS2 (London
– West Midlands). We express the
extrapolated numbers as a range, but take
a mid-point to indentify a ‘central case’ BCR.
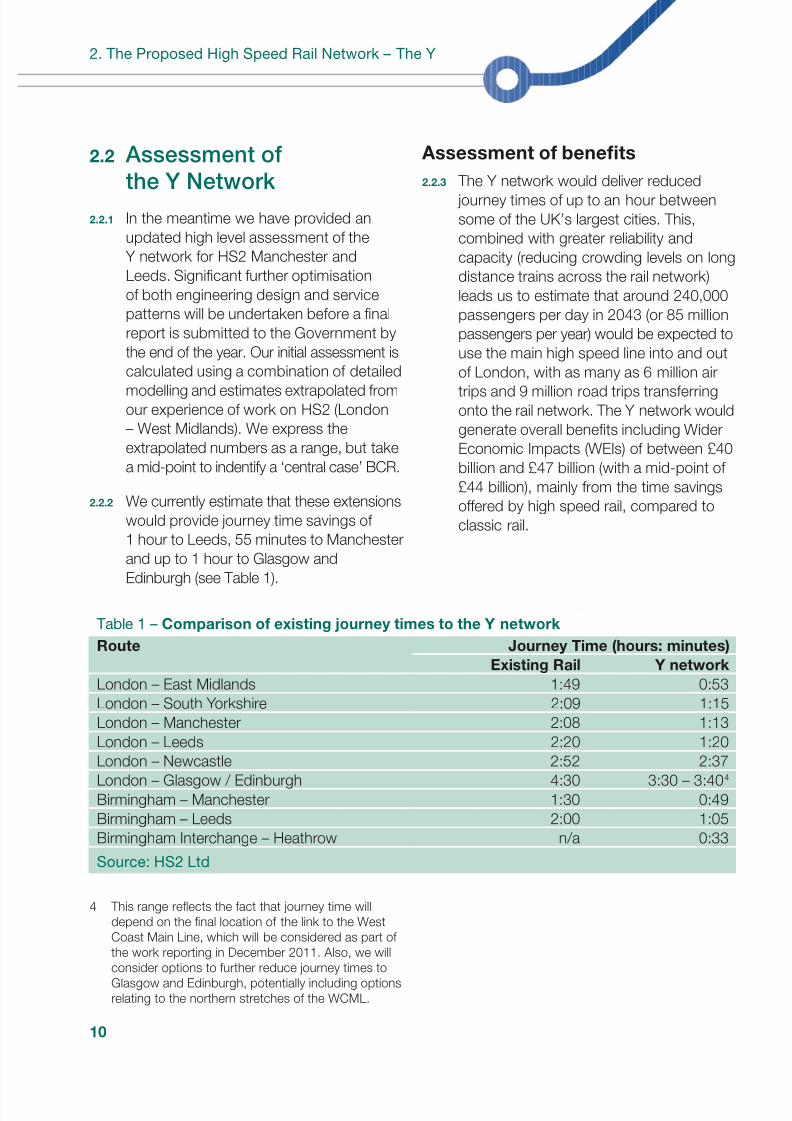
2.2.2 We currently estimate that these extensions
would provide journey time savings of
1 hour to Leeds, 55 minutes to Manchester
and up to 1 hour to Glasgow and
Edinburgh (see Table 1).
Table 1 – Comparison o existing journey times to the Y network
Route Journey Time (hours: minutes)
Existing Rail Y network
London – East Midlands 1:49 0:53
London – South Yorkshire 2:09 1:15
London – Manchester 2:08 1:13
London – Leeds 2:20 1:20
London – Newcastle 2:52 2:37London – Glasgow / Edinburgh 4:30 3:30 – 3:404
Birmingham – Manchester 1:30 0:49
Birmingham – Leeds 2:00 1:05
Birmingham Interchange – Heathrow n/a 0:33
Source: HS2 Ltd
4 This range reects the fact that journey time will
depend on the nal location of the link to the West
Coast Main Line, which will be considered as part of
the work reporting in December 2011. Also, we will
consider options to further reduce journey times to
Glasgow and Edinburgh, potentially including options
relating to the northern stretches of the WCML.
Assessment o benefts
2.2.3 The Y network would deliver reduced
journey times of up to an hour between
some of the UK’s largest cities. This,
combined with greater reliability and
capacity (reducing crowding levels on long
distance trains across the rail network)
leads us to estimate that around 240,000
passengers per day in 2043 (or 85 million
passengers per year) would be expected to
use the main high speed line into and out
of London, with as many as 6 million airtrips and 9 million road trips transferring
onto the rail network. The Y network would
generate overall benets including Wider
Economic Impacts (WEIs) of between £40
billion and £47 billion (with a mid-point of
£44 billion), mainly from the time savings
offered by high speed rail, compared to
classic rail.
8/7/2019 Hs2 Economic Case
http://slidepdf.com/reader/full/hs2-economic-case 11/62
11
Economic Case for HS2
2.2.4 Our assessment is based on the model
and the methodology used in our London
to West Midlands work. The serviceassumptions that underpin this are set
out in Appendix 1. Table 2 sets out the
components of benet. The modelled
quantied benets are £38.7 billion. In
addition to this we have made an estimate
of the benets from releasing capacity
on the Midland Main Line and East Coast
Main Line, both of which would otherwise
see signicant crowding by the 2030s.
In order to make an estimate of thesebenets, we looked at the modelled
benets from released capacity on the
WCML in our London to West Midlands
work, and made a deliberately cautious
assumption that we would receive only
half that level of benet from capacity
released on the Midland and East Coast
Main Lines combined.
2.2.5 There are other benets from improvementsto the transport network, leading to greater
efciency in the economy, as described in
more detail in Chapter 4. Our modelling
has shown that the proposed London to
West Midlands scheme would generate
Wider Economic Impacts of around
£4.0 billion. We would expect the Y to
deliver further benets. If these are in the
same proportion to transport benets as
for the London to West Midlands scheme,the Y network would deliver a further
£4.7 billion of benets. Indeed the proximity
of Leeds, South Yorkshire and the East
Midlands may mean agglomeration
benets are stronger than those observed
in the London to West Midlands scheme.
However, to be prudent, for these
estimates we have only taken half
the proportionate benets.
Assessment o costs
2.2.6 We have used estimates of the unit cost
of track in different situations (tunnel, at
surface and viaduct) to provide a high
level assessment of the likely costs of
extending the line to Manchester and Leeds
Based on this assessment, we estimate
that the total infrastructure capital cost of
the Y network including a link to Heathrow,
would be around £32.2 billion (Quarter 3,
2009 prices), including risk allowances
and optimism bias. Based on the costsestimated as part of the economic case
for HS2, we estimate that the Y would
require capital expenditure of £5.3 billion
(Quarter 3, 2009 prices) for rolling stock,
inclusive of optimism bias. Taken together
and taking into account when spending
would occur, these amount to £30.4
billion in present value terms.
2.2.7 The operating cost of a Y network would
be of the order of £1.1 billion per year,
of which £0.4 billion is attributable to a
London to West Midlands section and
£0.7 billion for the extensions northwards,
including a prudent 41% optimism bias.
These amount to a total of £17.0 billion
in 2009 Present Value terms over a 60
year appraisal period. In addition we can
reasonably assume that there would be a
reduction in long distance services on theMidland and East Coast Main Lines as the
new high speed services were introduced.
We have not yet modelled this but have
generated a range of operating cost
adjustments on the basis of adjusting
services to Nottingham, Shefeld, Leeds
and Newcastle. Our central point would
make only limited reductions in part
because we have not so far estimated
the additional costs of re-using thisreleased capacity to run new short
8/7/2019 Hs2 Economic Case
http://slidepdf.com/reader/full/hs2-economic-case 12/62
Table 2 – Quantifed Benefts and Costs (£ billions) o the Y network (2009 PV/prices)
and the resulting BCR
(1) Transport User Benets Business
Other
£25.2 bn
£13.1 bn
(2) Other quantiable benets (excl. Carbon) £0.4 bn
(3) Loss to Government of indirect taxes -£2.7 bn
(4) Estimate of additional released capacity
benets facilitated by the Y network
£1.3 bn
(£0 – £2.6 bn)
(5) Net Transport Benefts
= (1) + (2) + (3) + (4)
£37.3 bn
(£36.0 bn – £38.7 bn)(6) Wider Economic Impacts (WEIs) (London – West Midlands only) £4.0 bn
(7) Estimate of Additional WEIs from the Y network £2.3 bn
(£0 – £4.7 bn)
(8) Net Benefts including WEIs
= (5) + (6) +(7)
£43.7 bn
(£40.0 bn – £47.4 bn)
(9) Capital costs £30.4 bn
(10) Operating costs £17.0 bn
(11) Estimate of additional classic line cost
savings facilitated by the Y network
-£3.1 bn
(£0 – -£6.1 bn)
(12) Total Costs= (9) + (10) + (11)
£44.3 bn(£47.4 bn – £41.3 bn)
(13) Revenues £27.2 bn
(14) Net Costs to Government
= (12) – (13)
£17.1 bn
(£20.2 bn – £14.1 bn)
(15) BCR without WEIs
= (5) / (14)
2.2
(1.8 – 2.7)
(16) BCR with WEIs
= (8) / (14)
2.6
(2.0 – 3.4)
Source: HS2 Ltd
N.B. the numbers in brackets represent a range around the central numbers presented
above them.
12
2. The Proposed High Speed Rail Network – The Y
distance services on the Midland and
East Coast Main Lines. This is part of the
forward programme to December 2011.
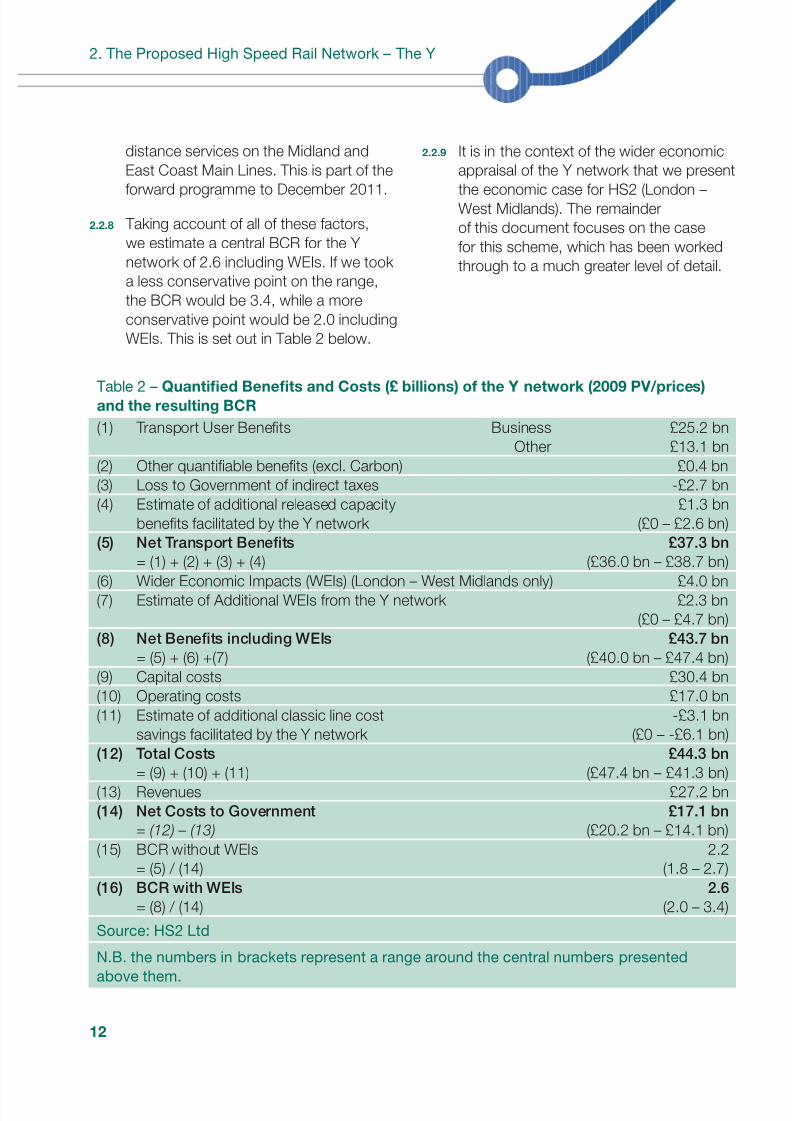
2.2.8 Taking account of all of these factors,
we estimate a central BCR for the Y
network of 2.6 including WEIs. If we took
a less conservative point on the range,
the BCR would be 3.4, while a more
conservative point would be 2.0 including
WEIs. This is set out in Table 2 below.
2.2.9 It is in the context of the wider economic
appraisal of the Y network that we present
the economic case for HS2 (London –West Midlands). The remainder
of this document focuses on the case
for this scheme, which has been worked
through to a much greater level of detail.
8/7/2019 Hs2 Economic Case
http://slidepdf.com/reader/full/hs2-economic-case 13/62
13
3. Passenger Demand for HS2
(London – West Midlands)3.1 Introduction
3.1.1 In this chapter we set out our estimate of
future demand for rail travel rst without and
then with HS2 (London – West Midlands)
and explain how we have tested our results
in relation to the inevitable uncertainty of
the future. We report on the forecasts thatwe have produced from our detailed work
relating to the recommended route of HS2
between London and the West Midlands.
We are currently developing those forecasts
to produce a detailed economic case for
the Y network by December 2011.
3.2 Forecast demandwithout HS2 (‘dominimum’ scenario)
3.2.1 Transport infrastructure has a long life.
We need long term forecasts to understand
future demand and hence capacityrequirements and to inform the economic
case for HS2. We have rst to consider
what the underlying future growth of
demand for travel is likely to be, without
HS2. We refer to these projections as our
‘do minimum’ assumptions.
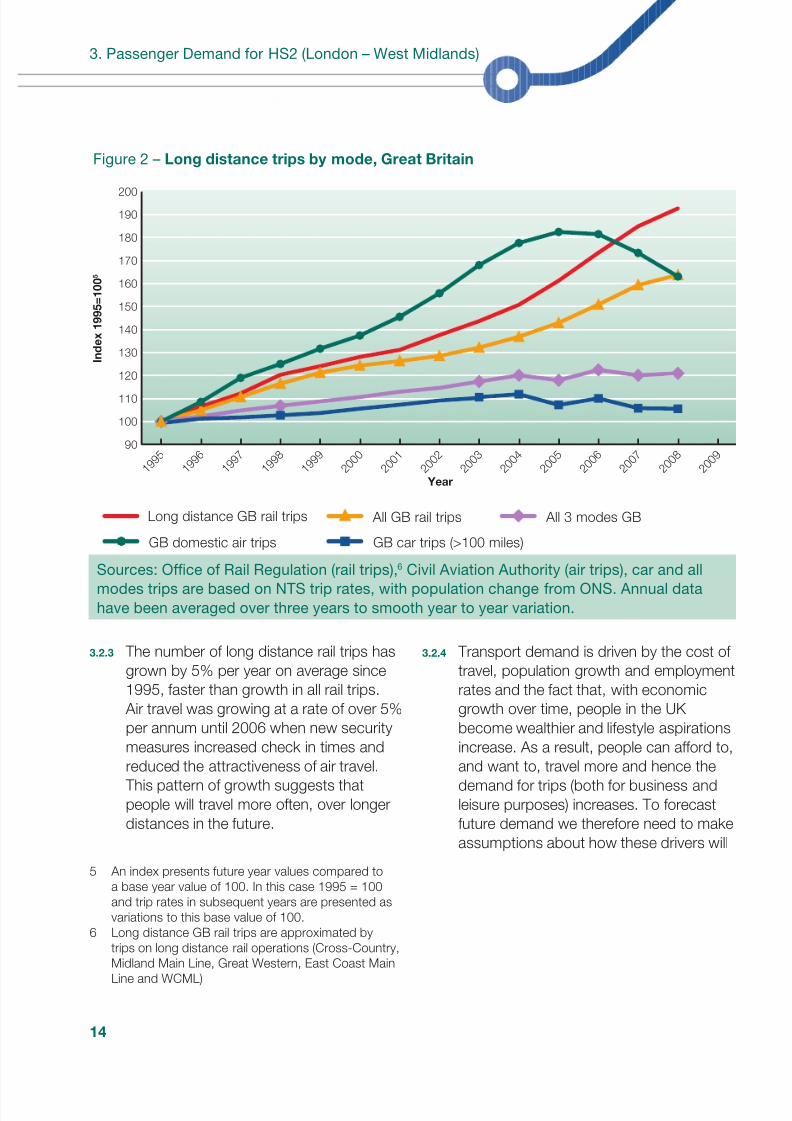
3.2.2 To do this, we have used evidence of how
transport demand has grown in the past.
Over the past 20 years we have seengrowth in demand for longer distance
trips, particularly on rail and air. This is
shown in Figure 2 below.
8/7/2019 Hs2 Economic Case
http://slidepdf.com/reader/full/hs2-economic-case 14/62
14
3. Passenger Demand for HS2 (London – West Midlands)
Figure 2 – Long distance trips by mode, Great Britain
200
190
180
170
160
150
140
130
120
110
100
90
Index 1995=100
5
Year1995
1996
1997
1998
1999
2000
2001
2002
2003
2004
2005
2006
2007
2008
2009
Long distance GB rail trips All GB rail trips
GB domestic air trips GB car trips (>100 miles)
All 3 modes GB
Sources: Ofce of Rail Regulation (rail trips),6 Civil Aviation Authority (air trips), car and allmodes trips are based on NTS trip rates, with population change from ONS. Annual data
have been averaged over three years to smooth year to year variation.
3.2.3 The number of long distance rail trips has
grown by 5% per year on average since
1995, faster than growth in all rail trips.
Air travel was growing at a rate of over 5%
per annum until 2006 when new security
measures increased check in times and
reduced the attractiveness of air travel.
This pattern of growth suggests that
people will travel more often, over longer
distances in the future.
5 An index presents future year values compared to
a base year value of 100. In this case 1995 = 100
and trip rates in subsequent years are presented as
variations to this base value of 100.
6 Long distance GB rail trips are approximated by
trips on long distance rail operations (Cross-Country,Midland Main Line, Great Western, East Coast Main
Line and WCML)
3.2.4 Transport demand is driven by the cost of
travel, population growth and employment
rates and the fact that, with economic
growth over time, people in the UK
become wealthier and lifestyle aspirations
increase. As a result, people can afford to,
and want to, travel more and hence the
demand for trips (both for business and
leisure purposes) increases. To forecast
future demand we therefore need to make
assumptions about how these drivers will
8/7/2019 Hs2 Economic Case
http://slidepdf.com/reader/full/hs2-economic-case 15/62
15
Economic Case for HS2
change in the future. We use a variety of
different sources for these assumptions.
3.2.5 For economic growth we have applied
medium term forecasts from the Ofce
for Budget Responsibility7, with long term
forecasts provided by HM Treasury.
Transport prices and population changes
are taken from standard Department for
Transport guidance and models.
3.2.6 The relationship between these drivers and
transport demand is taken from existingevidence and the Department for Transport’s
modelling guidance. For rail travel forecasts
we use the Department for Transport’s
recommended source – the Passenger
Demand Forecasting Handbook (PDFH).
For air travel forecasts we use modelling
undertaken for the Department for
Transport’s UK air passenger demand and
carbon dioxide (CO2) forecasts 20098.
3.2.7 Each of these forecasts builds an
understanding of the relationship
between demand and the key drivers
based on detailed analysis of past trends
(e.g. changes in the number of trips
between specic stations on the rail
network). Forecast growth in demand
is then based on the fundamental
assumption that past relationships
between these drivers and demandwill carry on into the future. Over the last
15 years growth rates for each mode of
transport have differed, so we have used
separate growth rates for each mode.
3.2.8 The forecasts, produced as discussed
above, suggest there will be continued
7 Ofce for Budget Responsibility ofcial budgetary
forecast, June 2010 (http://budgetresponsibility.
independent.gov.uk/publications.html)8 http://www.dft.gov.uk/pgr/aviation/atf/
co2forecasts09/
growth in demand for long distance trips.
The growth rates are expected to slow to
varying degrees, with car travel forecastsin particular affected by the expected slow
down in the rate of growth of car ownership.
By contrast, past trends do not suggest
any slow down in the growth in long
distance rail travel. We could therefore
project positive rail growth over the whole
life of the scheme. However, given how far
ahead we are looking, we have taken a
more cautious approach: we would expect
demand to atten off at some level infuture, for example because of constraints
on people’s time.
3.2.9 Given that we do not know exactly how
and when this would occur, we have
simply applied a cut off rather than a taper
which in theory would be more realistic.
For other rail appraisals the Department
for Transport typically uses a cut-off for
demand growth of 2026 as a referencepoint to ensure consistent comparison of
smaller scale schemes, such as investments
in rolling stock. This is not appropriate for
HS2 as a major long term investment that
would not even open before this cut-off
point. For our earlier work we capped
growth of rail demand in 2033, at a level
of demand in the WCML corridor that is
slightly more than double current levels.
With the lower current GDP forecasts, thiscap would now be hit later, in 2043.
This level of demand is consistent with
households becoming wealthier as GDP
per head grows and adopting lifestyles
with more frequent long distance travel as
demonstrated by those in higher income
bands today. We have also capped our
8/7/2019 Hs2 Economic Case
http://slidepdf.com/reader/full/hs2-economic-case 16/62
16
3. Passenger Demand for HS2 (London – West Midlands)
forecasts for growth of demand for other
transport modes at 2043.
Our resulting orecasts
3.2.10 Given our assumptions of continued
economic growth, we forecast that by
2043 people will on average be making
around 36% more trips per person of over
100 miles. This is equivalent to around
2.5 additional trips per person9 per year
across all modes. Most of this comes from
forecast growth in air and car trips, with
rail trips increasing by around 0.5 trips
per person per year. Taking account of
population growth we forecast the total
number of long distance trips (over 100
miles) to increase by 64% by 2043,
representing an increase of 1.4% per
year on average and reecting slower
growth than over the past 15 years.
3.2.11 This growth would represent a total of
9.5 long distance trips by all modes of
transport per person in 2043 across the
country as a whole. However, there are
signicant differences in the growth in
demand across the country, particularly
for longer distance trips to London.
For example rail trips from Glasgow to
London are expected to grow at a faster
rate than from Birmingham to London,
albeit from a far lower base of trips. The
number of rail trips per person per year
from Glasgow to London is expected to
rise by about one trip for every ten people
in the greater Glasgow area.
3.2.12 Without HS2, the result of this growth
would be increasing pressure on the
WCML. Long distance rail trips on the
WCML are forecast to more than double
9 Per person gures are calculated using the total
Ofce of National Statistics Census population.
by 2043. This means that, even though
some of the existing ‘Pendolino’ trains are
expected to have been lengthened fromnine to eleven cars, the average number
of seats occupied on trains leaving
London would be around 76% across the
day. On this basis, on weekdays by 2025
several peak period trains a day from
Manchester to London would have all
seats lled and people would be standing.
By 2043 some trains to all destinations in
peak periods would be full and passengers
would experience very crowded conditions.
3.1.13 The implications would be particularly
severe for those passengers wishing to
travel from stations that are a stopping
point on a service rather than the origin of
a service, for example Coventry or Stoke-
on-Trent. With signicantly higher numbers
of passengers boarding trains at Euston,
Birmingham and Manchester, trains would
become crowded before stopping atthese intermediate stations and, by 2043,
at peak times passengers might not be
able to board the service.
The reliability o our demand
orecasts
3.2.14 The Department for Transport’s
recommended approaches to forecasting
are based on extensive industry research.That does not mean they are not subject
to uncertainty. We cannot ignore this and
have considered the impact of a range of
assumptions on the economic case for
HS2 in Chapter 7. Areas that have been
tested include:
• The assumptions about the level of
demand for long distance travel without
HS2 (the ‘do minimum’);
8/7/2019 Hs2 Economic Case
http://slidepdf.com/reader/full/hs2-economic-case 17/62
17
Economic Case for HS2
• The valuation of benets from HS2,
particularly the value of time savings
and other impacts on businesspassengers; and
• The overall costs of the scheme.
3.2.15 One of the key uncertainties for
forecasting is the future level of demand.
There are different views of the future –
how the economy will grow, and how that
will drive growth in demand. However, the
rate of growth in demand actually deneswhen, rather than whether, a scheme
such as HS2 would be justied. Slower
growth would not necessarily mean that
HS2 would not be a worthwhile investment,
though it might suggest that the opening
year of HS2 should be later and/or that a
lower level of service should be provided
in the early years of operation. A higher
growth rate, by contrast, would argue
for the project to be accelerated if thatwere possible.
3.2.16 More important is the ultimate level of
demand. Higher levels of demand will
mean more passengers benet from
journey time savings, and the impact of
crowding relief will be greater. In addition,
greater numbers of passengers switching
modes would generate more revenue to
offset the cost of the scheme. Hence thehigher the level of demand, the stronger
the economic case.
3.2.17 Chapter 7 presents further details of these
and other sensitivity tests that have been
undertaken on the sensitivity of the
economic case to our assumptions.
3.3 Passenger demand with
the introduction o HS2(London – West Midlands)
3.3.1 HS2 would signicantly reduce journey
times for trips between London and a
number of the UK’s major cities. It would
reduce the journey times between London
and Birmingham city centres to as little as
49 minutes, cutting more than 30 minutes
off current journey times. It would also cut
typical journey times between London andmajor cities on the WCML to the north of
Birmingham by up to 30 minutes.
3.3.2 The less complex the mix of services on a
line, the easier it is to guarantee reliability.
The high speed line would have all services
running at the same speed which would
improve reliability. The reliability of train
services is important to people because
unreliability can disrupt their schedules,and if they expect poor reliability they tend
to factor in additional time to travel, which
reduces the time that they can spend on
other activities.
3.3.3 Not only would passengers benet from
faster and more reliable journeys, they
would also travel in less crowded conditions.
This would also benet those using the
existing network between London andthe West Midlands, after the introduction
of HS2.
3.3.4 Such signicant improvements in the
experience of travelling on the railway
would lead to changes in the way people
travel, with people choosing to travel on
different rail routes or by rail rather than
car or plane and, in some cases, to travel
more frequently than they previously
8/7/2019 Hs2 Economic Case
http://slidepdf.com/reader/full/hs2-economic-case 18/62
18
3. Passenger Demand for HS2 (London – West Midlands)
would have done. The WCML upgrade
provided similar signicant journey time
improvements and has seen trip growthof 36% between 2006 and 2009. This is
nearly treble that seen on the East Coast
Main Line (13%) in the same period.
Transport modelling
3.3.5 We have used transport modelling to
predict how people would respond to
HS2. A model is a computer-based
numerical reection of what may happen
in the real world and is constructed to
codify and make predictions about what
will happen in the future. Models are
sophisticated reections of what happens
in the real world based on many years of
observed behaviour.
3.3.6 Our model is a framework of different
models that have been integrated to
address each of the key considerations
for the design of HS2 in detail. It has four
key elements:
• A model (‘Long Distance’) which is
focused on long distance travel covering
trips by car, rail and air. This is the main
market for HS2;
• Two models (‘South’ and ‘Midlands’)
which look at shorter distance trips,
particularly in peak times, around theSouth and Midlands (of England).
These models ensure we can take
account of the impacts on passengers
on the classic network and particularly
the effects of using released capacity
for regional and local services;
• A model which looks at the market for
accessing Heathrow to catch onward
international ights; and
• A detailed model of which stations
people would choose to access the rail
network (high speed and classic) withinthe Birmingham and London areas.
This was designed to allow a better
understanding of the impact of
accessibility to new stations on the
HS2 line.
3.3.7 Each of these components predicts
how different types of passenger would
respond to the time savings and crowding
relief as a result of the introduction of HS2and new services using released capacity.
They do this by using both observed
behaviour of passengers and surveys –
where passengers are asked what choices
they would make given different scenarios.
3.3.8 These components contain signicant
detail on the forecast trips between
different locations. The Long Distance
model covers both the mode of travel andthe route taken between locations across
mainland Britain over road, rail and air
networks. The South and Midlands
models calculate the number of trips
and the route taken on the rail network
covering the South and certain sections
of the Midlands.
3.3.9 Our model suggests that in 2043 around
136,000 passengers would use HS2 eachday on the section between Birmingham
Interchange and Old Oak Common, with a
net increase of 53,000 passengers on the
whole GB rail network. Around two thirds
of the HS2 passengers would otherwise
have travelled by classic rail and would
enjoy the advantage of the faster services.
Faster journeys and increased capacity
would not only encourage people to use
HS2 in preference to the WCML, air androad travel, it would also lead to an
8/7/2019 Hs2 Economic Case
http://slidepdf.com/reader/full/hs2-economic-case 19/62
19
Economic Case for HS2
increase in the overall number of journeys
in the London to West Midlands corridor.
Reduced crowding and increased comfortof journeys, a greater range of services
provided on existing lines, new interchange
station locations and faster services on
HS2 would make rail travel more attractive
to those who would otherwise choose not
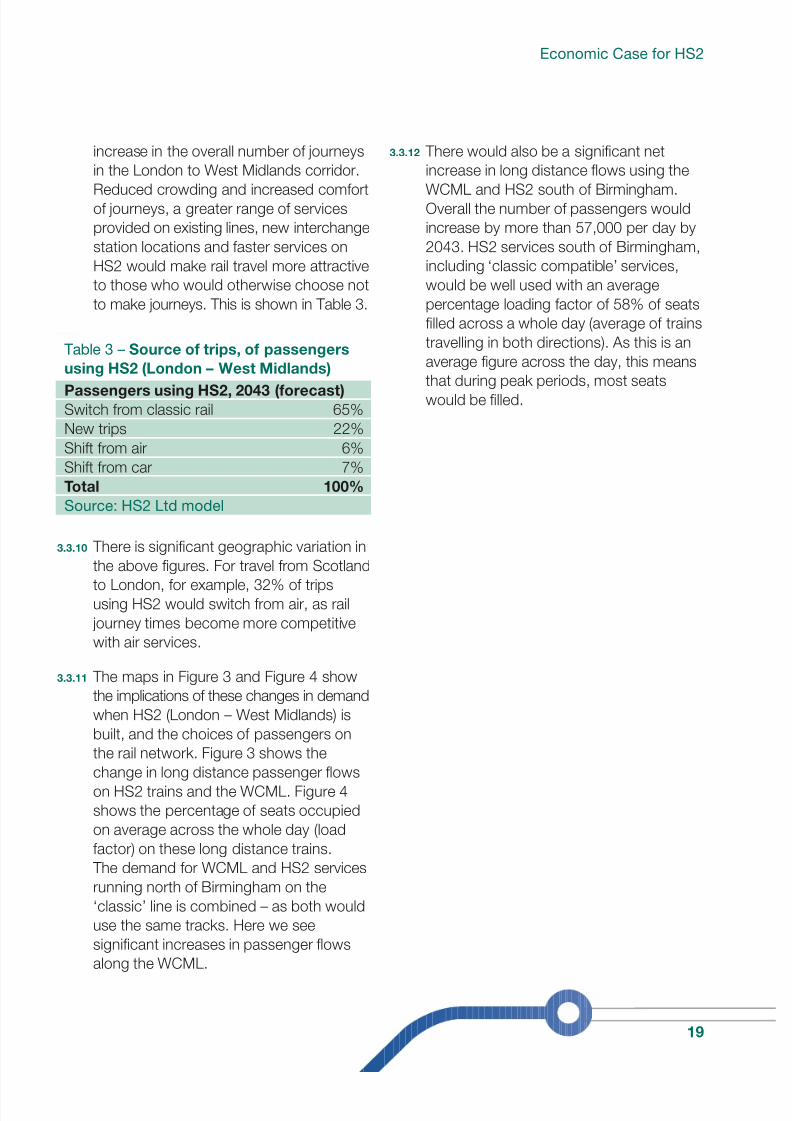
to make journeys. This is shown in Table 3.
Table 3 – Source o trips, o passengers
using HS2 (London – West Midlands)
Passengers using HS2, 2043 (orecast)
Switch from classic rail 65%
New trips 22%
Shift from air 6%
Shift from car 7%
Total 100%
Source: HS2 Ltd model
3.3.10 There is signicant geographic variation in
the above gures. For travel from Scotlandto London, for example, 32% of trips
using HS2 would switch from air, as rail
journey times become more competitive
with air services.
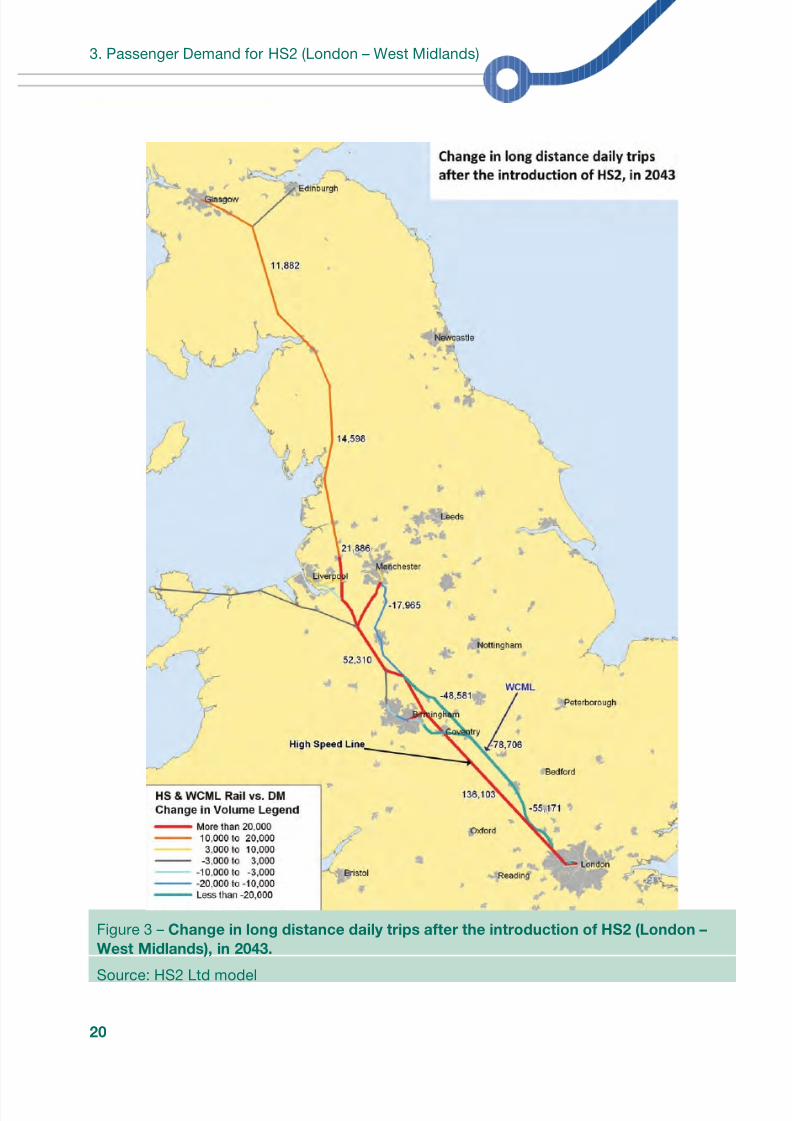
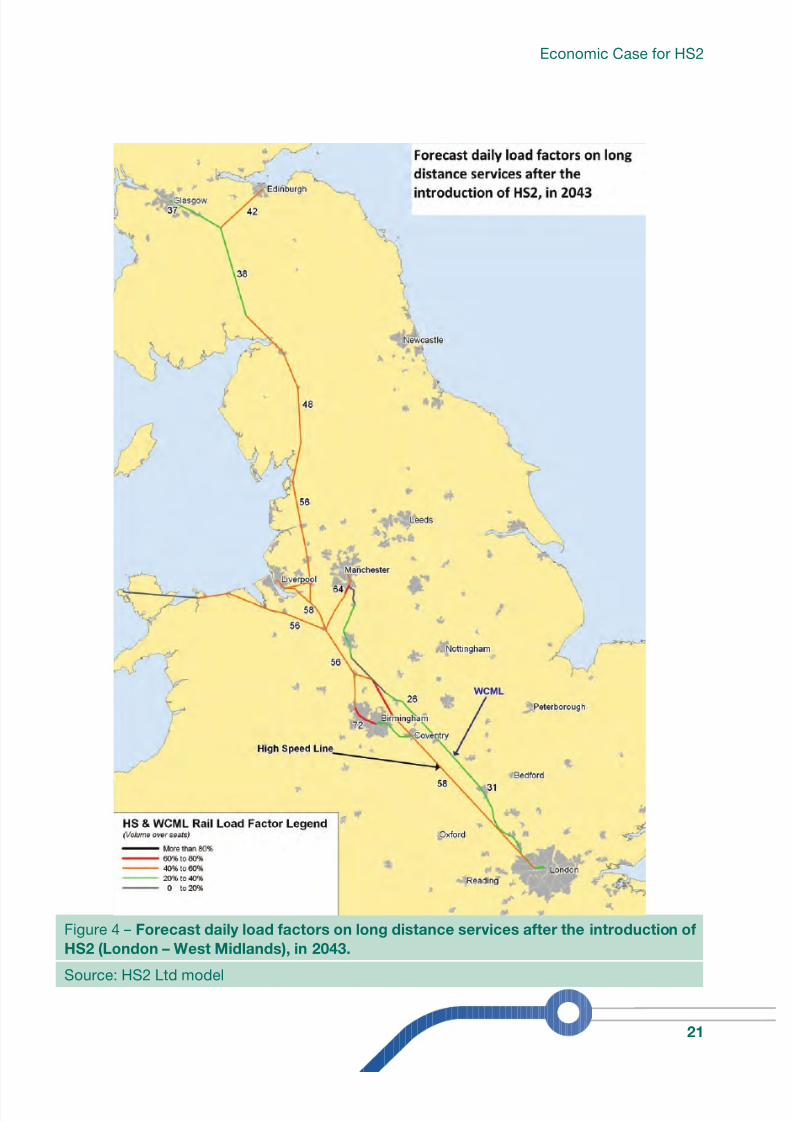
3.3.11 The maps in Figure 3 and Figure 4 show
the implications of these changes in demand
when HS2 (London – West Midlands) is
built, and the choices of passengers on
the rail network. Figure 3 shows thechange in long distance passenger ows
on HS2 trains and the WCML. Figure 4
shows the percentage of seats occupied
on average across the whole day (load
factor) on these long distance trains.
The demand for WCML and HS2 services
running north of Birmingham on the
‘classic’ line is combined – as both would
use the same tracks. Here we see
signicant increases in passenger owsalong the WCML.
3.3.12 There would also be a signicant net
increase in long distance ows using the
WCML and HS2 south of Birmingham.Overall the number of passengers would
increase by more than 57,000 per day by
2043. HS2 services south of Birmingham,
including ‘classic compatible’ services,
would be well used with an average
percentage loading factor of 58% of seats
lled across a whole day (average of trains
travelling in both directions). As this is an
average gure across the day, this means
that during peak periods, most seatswould be lled.
8/7/2019 Hs2 Economic Case
http://slidepdf.com/reader/full/hs2-economic-case 20/62
20
3. Passenger Demand for HS2 (London – West Midlands)
Figure 3 – Change in long distance daily trips ater the introduction o HS2 (London –
West Midlands), in 2043.
Source: HS2 Ltd model
8/7/2019 Hs2 Economic Case
http://slidepdf.com/reader/full/hs2-economic-case 21/62
21
Economic Case for HS2
Figure 4 – Forecast daily load actors on long distance services ater the introduction o
HS2 (London – West Midlands), in 2043.
Source: HS2 Ltd model
8/7/2019 Hs2 Economic Case
http://slidepdf.com/reader/full/hs2-economic-case 22/62
22
3. Passenger Demand for HS2 (London – West Midlands)
3.3.13 People would travel on HS2 for a range
of reasons. Faster journeys would attract
more business travel in the UK overall.However, the majority of HS2 journeys
(70%) would be made by people travelling
for other reasons, with leisure trips likely
to be particularly important.
3.3.14 The benets are not all to passengers on
the high speed line. Sixty ve per cent of
HS2 passengers would be expected to
transfer from classic rail and these would
be largely drawn from existing services onthe WCML. This provides an important
opportunity to re-organise services on the
WCML which are currently focussed on
providing city to city journeys. This would
be an important additional benet of HS2.
It could increase capacity on key commuter
routes into Birmingham and London, allow
increased services between Birmingham
and other regional destinations, and
provide more paths for freight services.
Using Released Capacity on the West
Coast Main Line
With most non-stopping services transferring
from the WCML route to HS2, those long-
distance services remaining, for example,
could all call at Milton Keynes, and an
enhanced service could be provided to the
various intermediate stations on the route.Similarly on the Northampton – Rugby –
Coventry – Birmingham New Street route, the
removal of some of the Euston – Birmingham
fast services would enable signicantly
more local and Cross-Country services.
Additional capacity for freight trafc would
also be available, particularly for trafc from
the East Coast or South Coast ports to the
distribution centres of the Midlands via thesouthern section of the West Coast Main Line.
Passenger origins and
destinations
3.3.15 The two new West Midlands stations that
we propose (a Birmingham city centre
station and an interchange station) would
handle 50,000 trips per day in 2043,
drawing on broadly the same markets as
those currently served by Birmingham
New Street and Birmingham International.
Our work to date suggests that 50-60%
of these passengers would use the HS2
central Birmingham station, Curzon Street.However, our modelling of station access
time in the West Midlands is currently
based on access by car. This means that
the model is almost certain to under-
estimate the relative importance of a city
centre station for which public transport
access would be critical.
3.3.16 As well as capturing rail trips from the
existing Birmingham International station,the Birmingham Interchange station would
attract additional park and ride trips from
the Birmingham hinterland, Coventry and
North Warwickshire and those areas of
the city for which the location would be
more convenient than Curzon Street.
It would also be designed to serve both
Birmingham Airport and the National
Exhibition Centre (NEC) by means of
a people mover similar to a shuttle atan airport.
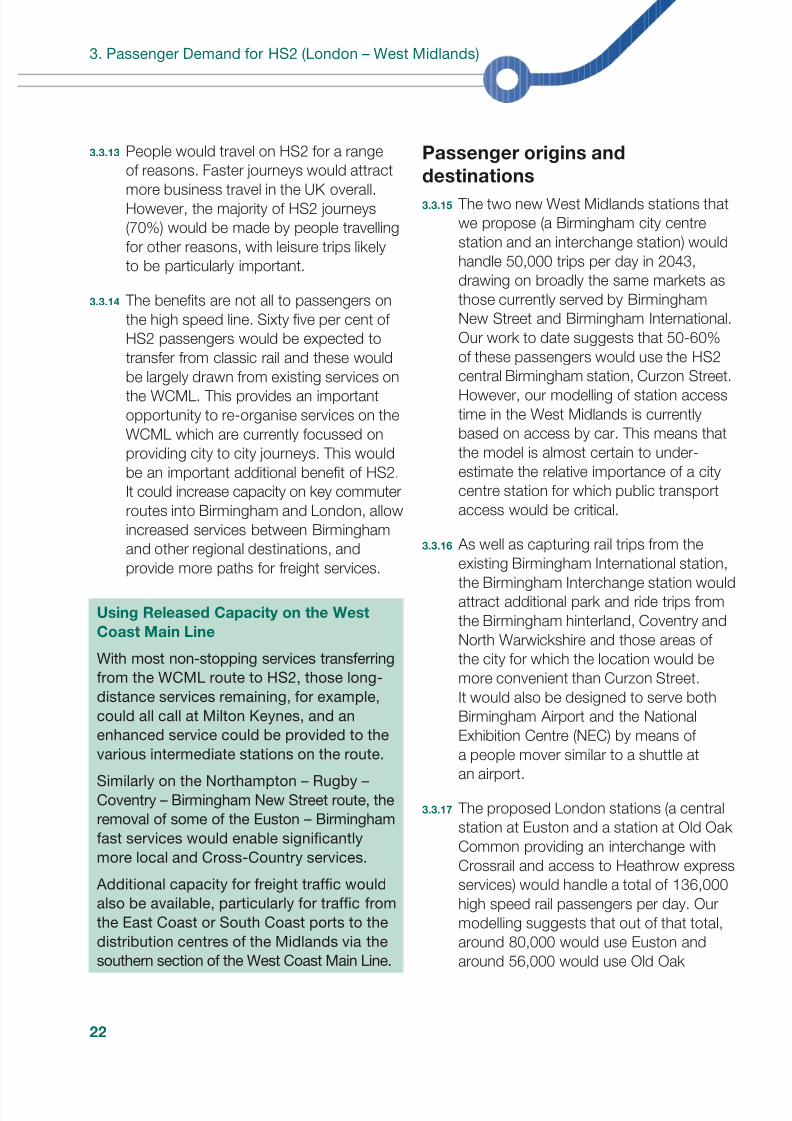
3.3.17 The proposed London stations (a central
station at Euston and a station at Old Oak
Common providing an interchange with
Crossrail and access to Heathrow express
services) would handle a total of 136,000
high speed rail passengers per day. Our
modelling suggests that out of that total,
around 80,000 would use Euston andaround 56,000 would use Old Oak
8/7/2019 Hs2 Economic Case
http://slidepdf.com/reader/full/hs2-economic-case 23/62
23
Economic Case for HS2
Common. Figure 5 illustrates the forecast
proportion of people accessing Euston
and Old Oak Common from various zonesin London. The colour green indicates
that the majority of people would access
Euston, blue that the majority would use
Old Oak Common. Our modelling suggests
that demand for the Old Oak Common
station would be mainly from east, west,
north west and north east London as well
as a small section of Westminster close to
Crossrail stations and the City of London.The majority of demand for Euston would
be from south and south east London
and north and central London including
the London Boroughs of Westminster,
Islington and Camden.
Figure 5 – Proportion o passengers choosing to use Euston and Old Oak Common
by area
Source: Mott Macdonald 2011 (data represents an example trip using HS2 from London
to Manchester).
8/7/2019 Hs2 Economic Case
http://slidepdf.com/reader/full/hs2-economic-case 24/62
24
3. Passenger Demand for HS2 (London – West Midlands)
3.3.18 As a result of HS2, the number of
passengers per day using Euston Mainline
Station is expected to increase by 32,000.Surveys of current passengers at Euston
suggest around 62% of passengers would
arrive or depart by London Underground
in the three hour morning peak. With
HS2 this would mean 5,500 additional
passengers using Euston Underground
Station in the morning peak period.
3.3.19 Both the Northern and Victoria lines which
stop at Euston are likely to be heavilycrowded by 2043 even without HS2.
Although the introduction of HS2 will add
to this pressure, the number of passengers
added by HS2 is likely to be relatively
small (around 2%) compared to the
number of passengers already forecast
to be on London Underground services
passing through Euston.
The tunnelled link withHigh Speed 1
3.3.20 HS2 is not only about travel within
Great Britain. A direct link to HS1 would
open up the opportunity for better rail
connections from the West Midlands
and beyond to France, Belgium and
other European destinations. Our work
suggests that in the rst phase, with a
high speed line only between London andthe West Midlands, these benets would
be relatively small, but with potential to
grow if the price of air travel increases
relative to HS2.
3.3.21 We also looked at the demand for direct
high speed rail services from the West
Midlands to Continental Europe based on
projections of air travel from the ve major
airports from the Midlands northwardsto six major destinations in Continental
Europe. The total potential rail trips
made as a result of modal shift would
be a sub-set of this market as some
passengers would continue to y. Newjourneys might also be generated from
passengers who would make the journey
if a faster and more convenient rail service
was available but we have made no
upwards adjustment for this factor.
3.3.22 Our modelling is based on a well established
relationship between the relative market
shares of rail and air, and rail journey
times. This shows that with a train timeof three and a half to four hours rail would
be likely to attract around half of the market.
On this basis our modelling predicts that
direct international services to and from
the West Midlands would carry around
4,850 passengers per day in 2033. It is,
of course, possible that extending the
high speed rail network beyond the West
Midlands, as well as a different pricing
or regulatory environment, could furtherincrease the market for international rail
travel. Even in that case, the likely future
demand for international high speed rail
services would justify a single track, rather
than double track link, to HS1.
3.4 Summary
3.4.1 We forecast that, in the absence of HS2,demand for long distance rail travel
between London and the West Midlands
between now and 2043 will more than
double. With HS2 in place, demand would
increase further. Rail journeys beginning
and ending in London are forecast to
grow faster than rail journeys nationally
and that longer distance journeys grow
faster as total incomes increase.
8/7/2019 Hs2 Economic Case
http://slidepdf.com/reader/full/hs2-economic-case 25/62
25
Economic Case for HS2
3.4.2 The forecast increase in demand without
HS2 would mean that even with the
additional capacity currently planned forthe WCML, the number of passengers
would increase to the extent that at peak
times the trains on the WCML would be
very crowded. Some passengers would
need to stand for entire journeys between
London and the West Midlands, Liverpool,
Manchester and Glasgow during peak
periods or not be able to travel at all on
some peak services on southern sections
of the line.
3.4.3 With the introduction of HS2 we forecast
136,000 passengers would choose to
travel on HS2 each day. Two thirds of
these passengers would be those who
previously used the classic rail network.
The demand for HS2 journeys beginning
and ending in London and the West
Midlands would be spread between the
two respective central stations and theinterchange stations.
3.4.4 In the next chapter we explain the benets
and costs that HS2 would bring and also
describe other economic impacts that
cannot be quantied in monetary terms.
8/7/2019 Hs2 Economic Case
http://slidepdf.com/reader/full/hs2-economic-case 26/62
26
4.1 Introduction
4.1.1 A monetary amount is attributed to each
‘unit’ of benet or non-nancial cost
(inconvenience) experienced by individual
people who would be affected by HS2.
This is calculated by assessing the extent
to which they would be willing to payfor the benet or the amount of money
that they would be willing to accept as
compensation for the inconvenience. The
monetary amount attributed to the benet
or inconvenience experienced by an
individual is set out in Department for
Transport transport appraisal guidance for
a wide range of benets and costs. This is
the source of inputs to our calculations
and hence the basis of the monetisationof costs and benets.
4.1.2 As explained in the introductory chapter,
we adjust all future values to a ‘Present
Value’ (PV).
4.1.3 The economic case should cover the
full expected period of use of the asset.
Transport infrastructure assets such as
tunnels and bridges have design livesin excess of 100 years. However, the
impacts of uncertainty and discounting
increase over time. In line with Department
for Transport practice for major capital
investments our appraisal has been
carried out over the construction period
plus 60 years of operation. This period
strikes a balance between design life of
major civil engineering assets and the
certainty and signicance of the presentvalue of future benets. All costs and
benets are given at the level of prices
prevailing in 2009 (‘2009 prices’).
4.1.4 Transport appraisal considers the impact
of an investment such as HS2 on the
whole experience of a journey including
the time spent travelling, nancial cost,
reliability and crowding. Time savings,crowding and reliability improvements are
measured using ‘values of time’ for which
there are established monetary values
published by Government. The process
for doing this is explained below.
4.1.5 The appraisal also estimates the impacts
on rail revenues, which could be used to
offset the costs of building, operating and
maintaining the railway. We measure the
net change in revenue to the railway as a
whole, which includes the revenue gained
by HS2 and as a result of released capacity,
but also the losses to the existing railway
as a result of passengers who switch to
HS2, and those who may choose not to
travel by rail because of the changes to
services on the existing network.
4.2 The reerence case
4.2.1 We have set out a ‘reference case’ against
which we can appraise HS2. This is a
full scenario setting out what transport
investment and services might be in the
absence of HS2 in 2026, the year that
HS2 (London – West Midlands) is assumed
to open. The reference case includes the
travel demand projections set out in the
‘do minimum’ scenario in Chapter 3.
4. Benets, Costs and
Economic Impacts
8/7/2019 Hs2 Economic Case
http://slidepdf.com/reader/full/hs2-economic-case 27/62
27
Economic Case for HS2
4.2.2 In creating our reference case for HS2
we have made assumptions about the
developments in transport in the UK thatwould be in place in 2026. These are
consistent with the outcome of the 2010
Spending Review:
• Any highways, rail and local transport
schemes that the Government has
committed to build before 201510;
• Lengthening of some Pendolino trains
on the WCML to eleven cars from nine;
• Continued investment in the roads
programme and London transport
beyond 2015, consistent with the
National Transport Model, which is
unlikely to be affected by the building
of a new high speed line;
• Investment in specic rail schemes
beyond 2015 – Thameslink, Crossrail
and the Intercity 125 High Speed Train
(HST) eet.
4.2.3 The transport model is rst run with the
reference case assumptions, and then
with the addition of HS2. The difference
between them is used as the basis for
assessing the benets of HS2.
4.2.4 We have assumed a service pattern for
HS2 (London – West Midlands) basedon three trains per hour in each direction
between London and Birmingham, rising
to four in the peak, using dedicated
rolling stock, and three trains per hour
to Manchester, two to Liverpool and one
to Glasgow using ‘classic-compatible’
trains. We have also assumed an adjusted
service pattern on the WCML, with the
withdrawal and adjustment of some long
10 This does not include Evergreen 3.
distance services and the introduction of
additional local and regional services
(see Appendix 1).
4.3 Benefts
4.3.1 In this chapter we set out the forecast
impacts on those who would travel
between London and the West Midlands
and beyond using HS2, as well as those
using the existing rail network. These are
categorised as journey time savings,reliability improvements, reduction in
crowding, (all of which are benets) and
‘other’ – including journey time to stations
and the choice of stations. A numerical
summary of these benets is then provided.
Journey time savings
4.3.2 Time is valued by everyone, albeit at
different rates. The ability to spend less
time travelling means that people can
achieve more in any one day which is a
benet. This time saving benet is a core
factor in transport appraisals and we
incorporate it by converting the benet
each person receives from time savings
into a monetary value which can then be
included in our value for money appraisal.
4.3.3 We calculate the monetary value of the
journey time savings described above
using the concept of “value of time”. This
is the amount of money a person would be
prepared to pay to save time or the amount
they would accept as compensation for
time lost. Values of time depend on who
is paying for a person’s time, either an
employer or the individual. That is why
we calculate values of time for working
and non-working time separately.
8/7/2019 Hs2 Economic Case
http://slidepdf.com/reader/full/hs2-economic-case 28/62
28
4 Benets, Costs and Economic Impacts
4.3.4 Working time values apply to journeys made
during the course of work and are based
on how much the time spent travelling coststhe employer. We have used working time
values published by the Department for
Transport11, which are based on the average
gross wage of transport users plus other
costs such as National Insurance, pensions
and overheads. These values assume that
workers are not able to work productively
during the course of their journey. This is
a standard assumption used in transport
appraisal. With the advent of technologiessuch as laptops and ‘wi’ internet networks
which allow people to work on trains we
recognise this is an area of debate. For
this reason we have tested the implications
of changing this assumption for the overall
economic case. Further details of this test
can be found in Chapter 7.
4.3.5 Non-working time values apply to journeys
made outside work such as commutingand leisure trips. The benet of saving time
to these passengers is less tangible – it
does not have a ‘price’ that we can directly
observe. Rather it means improvements
in the quality of life for that passenger
– perhaps allowing them to spend more
time at home with their family, or allowing
them to move house and commute further
to their job. We can estimate the benets
from research into individuals’ willingnessto pay for a quicker journey. This is done
by examining real or theoretical journey
choices between cheaper, slower journeys
and more expensive, quicker journeys. For
example, someone might be able to choose
to travel by intercity train in two hours at
a cost of £50 or travel by coach in ve
hours for £20. If they choose the train, it
11 Department for Transport WebTAG unit 3.5.6(http://www.dft.gov.uk/webtag/documents/expert/
unit3.5.6.php)
shows they are willing to pay at least £30
to save three hours; in other words their
value of time is at least £10 per hour. Wehave used non-working time values (based
on research into journey choices) published
by the Department for Transport. These
values of non-working time are lower than
the values of working time.
Reliability improvements
4.3.6 The reliability of train services is important
to people because unreliability can disrupt
their schedules, and if they expect poor
reliability they tend to factor in additional
time to travel, which reduces the time
that they can spend on other activities.
The less complex the mix of services on
a line, the easier it is to ensure reliability.
The proposed high speed line would have
all services running at the same speed
which would improve reliability.
4.3.7 We value improved reliability by translating
it into an equivalent journey time saving
and then applying the value of time. We
have used a measure of reliability, known
as average minutes lateness (AML), which
is calculated as the average lateness
across a number of trains. If for example
out of ve trains, four trains arrive on time
but the fth is fteen minutes late, the AML
would be three minutes. We have converted
improvements in AML as a result of HS2
into an equivalent journey time saving based
on Department for Transport guidance12
that rail passengers value one minute of
lateness the same as three minutes of
journey time. This equivalent journey time
saving is then multiplied by the value of
time to give the value of improved reliability.
12 Department for Transport WebTAG unit 3.5.7(http://www.dft.gov.uk/webtag/documents/expert/
unit3.5.7.php)
8/7/2019 Hs2 Economic Case
http://slidepdf.com/reader/full/hs2-economic-case 29/62
29
Economic Case for HS2
Reduction in crowding
4.3.8 People like to have as much comfort
and space as possible when travelling.
We value reduced crowding by using a
monetary value (the crowding penalty)
to reect in our model the discomfort
passengers experience from crowding
such as cramped conditions and reduced
ability to work or read, inability to sit with
travel companions or, under higher levels
of crowding, having to stand. The values
we use are from Department for Transportguidance13 and are based on surveys of
how much people would be willing to pay
to reduce crowding. The value differs
according to the type of passenger and
the level of crowding – with the value for
standing passengers signicantly higher
than for those with seats.
4.3.9 For example, each leisure passenger on a
train with more than 70% of seats taken
has a crowding penalty attributed to them
in our model. This is small (equivalent to
an additional 3% on top of the monetised
value of a minute of journey time). As the
crowding levels rise the penalty increases,
until when 100% of seats are taken, the
penalty used rises to the equivalent of an
additional 16% on top of journey time for
passengers with a seat. For a passenger
standing when 100% of seats are taken,the crowding penalty value is much higher,
at over three times the value placed on
journey time. The penalty continues to
increase as the level of crowding increases
and passengers have increasingly less
personal space.
13 Department for Transport WebTAG unit 3.15.4, taking
values from the Passenger Demand ForecastingHandbook section 4.1 (http://www.dft.gov.uk/
webtag/documents/expert/pdf/unit3.15.4.pdf)
4.3.10 We have assumed that both commuter
and business travellers are more tolerant of
crowding than leisure travellers. This reectsthe fact that both types of passengers
are travelling for, or in the course, of work.
Neither value reects the potential impact
on reduced productivity from, for example,
having to stand on trains. This is
addressed in our sensitivity testing.
Other Rail User Impacts
4.3.11 Our model considers the impact of HS2
on the entire journey experience – from
the point a passenger leaves their home
or ofce to the ultimate destination. It is
not just the experience of the passenger
whilst in the train. A number of other
journey aspects can affect passengers.
These include:
• The cost of getting to stations. New
stations may be nearer or further away,
affecting how passengers view the cost
of getting to that station;
• The length of time spent waiting for
trains. The more frequent trains are,
the less time passengers have to wait
for their train. Many long distance
passengers plan to catch a specic
train, but higher frequencies still bring
a benet in offering more choice and
exibility; and
• The number of changes. Passengers
generally do not like changing trains given
the risk of missing onward connections
and moving luggage. Providing more
direct journey opportunities results in
benets to passengers.
8/7/2019 Hs2 Economic Case
http://slidepdf.com/reader/full/hs2-economic-case 30/62
30
4. Benets, Costs and Economic Impacts
4.3.12 All these factors are reected in our
model. However, there is one area where
an adjustment needs to be made to themodel. Where there is a choice of different
stations a passenger could use, the
current model distributes passengers
between stations to reect different
preferences. In reality passengers choose
the station that best ts their preferences,
based on a range of factors. However,
the model articially calculates a disbenet
if that choice has been on the basis of
anything other than the lowest accesscost for the average user. An adjustment
will be made for this as part of our forward
programme. We expect it to slightly
increase the benets.
4.3.13 We estimate that international trips via the
HS1 connection would deliver a further
£0.4 billion in benets.
Non-rail User Impacts4.3.14 The vast majority of benets of HS2 would
accrue to rail passengers. However HS2
is also expected to attract trips from
private car users. Overall we expect that
7% of HS2 passengers would otherwise
have travelled by car which, from
Birmingham to London city-centre to
city-centre, currently takes approximately
two hours and thirty minutes14. As a result
we expect trafc on motorways between
London and the West Midlands to fall
by about 1%. Whilst this is only a small
proportion of total motorway trips, the
impact in terms of congestion could be
greater as on busy roads a small reduction
in the number of vehicles can make a
signicant difference to delays experienced.
We estimate that removing long distance
passengers from the roads would deliver
14 Source: www.transportdirect.info
around £1.8 billion in benets from lower
congestion, as well as reduced accidents
and improved air quality and noise impactsaround major roads.
Summary o Impacts
on Transport Users
4.3.15 We have attempted to capture all the
impacts of HS2 (London – West Midlands).
However, there are some impacts which
require more detail than is available at the
current stage of development. Theseinclude the benets of redeveloped stations
(for example, the redeveloped Euston would
bring benets to all passengers using it,
which we have not captured). If HS2 is
progressed, further work would set out
more clearly the quality of the station
facilities and area, which would allow us
to estimate the impacts. It is also likely that
reducing the numbers of trains running on
the WCML would improve the performanceof the route, making it easier for services
to recover from disruptions. We have
not counted any such reliability benets.
Finally, we have made no allowance for
private sector contributions, for example
towards station development, nor the
potential for increasing freight use on the
WCML as a result of capacity released
by HS2. All of these may improve the
economic case in due course. But noneare included at this stage, in Table 4
below, or in the overall economic case.
4.3.16 The total benets to transport users over
the course of the 60 year appraisal period,
separated by the type of benet and the
type of passenger are set out in Table 5
below. Net rail revenues would also increase
by £13.7 billion over the same period.
8/7/2019 Hs2 Economic Case
http://slidepdf.com/reader/full/hs2-economic-case 31/62
31
Economic Case for HS2
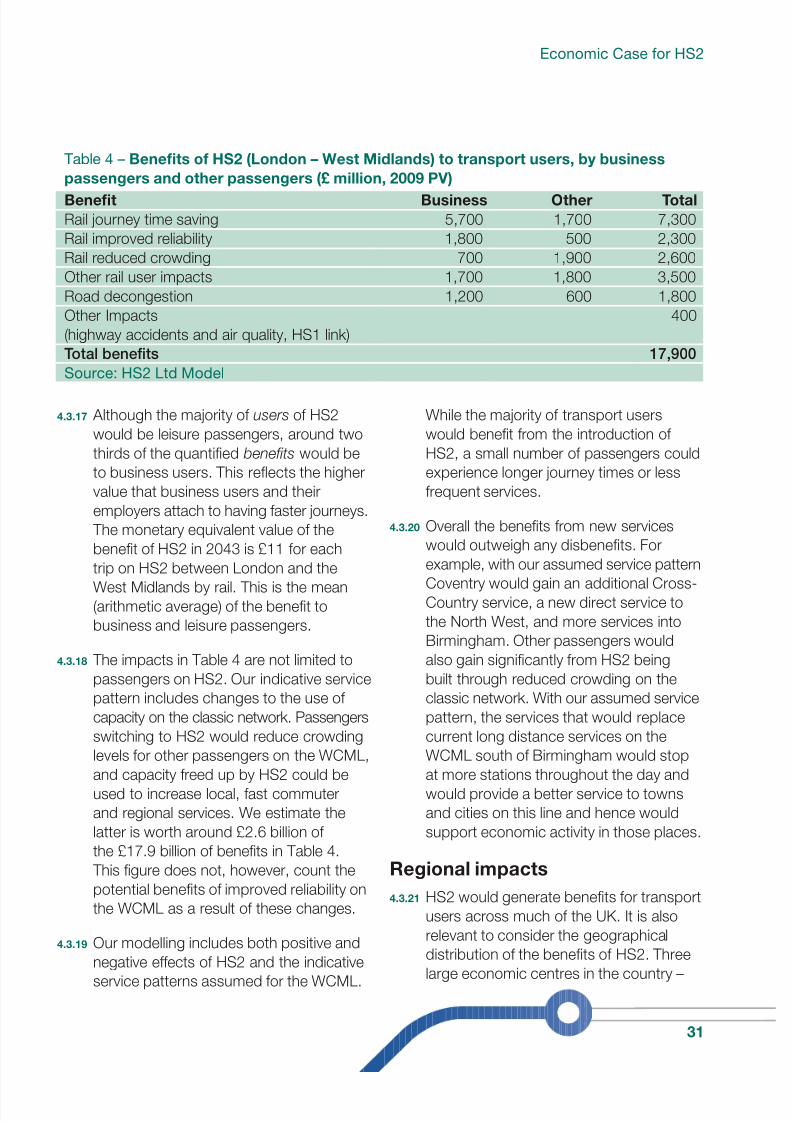
Table 4 – Benefts o HS2 (London – West Midlands) to transport users, by business
passengers and other passengers (£ million, 2009 PV)
Beneft Business Other Total
Rail journey time saving 5,700 1,700 7,300
Rail improved reliability 1,800 500 2,300
Rail reduced crowding 700 1,900 2,600
Other rail user impacts 1,700 1,800 3,500
Road decongestion 1,200 600 1,800
Other Impacts
(highway accidents and air quality, HS1 link)
400
Total benefts 17,900
Source: HS2 Ltd Model
4.3.17 Although the majority of users of HS2
would be leisure passengers, around two
thirds of the quantied benefts would be
to business users. This reects the higher
value that business users and their
employers attach to having faster journeys.
The monetary equivalent value of the
benet of HS2 in 2043 is £11 for each
trip on HS2 between London and theWest Midlands by rail. This is the mean
(arithmetic average) of the benet to
business and leisure passengers.
4.3.18 The impacts in Table 4 are not limited to
passengers on HS2. Our indicative service
pattern includes changes to the use of
capacity on the classic network. Passengers
switching to HS2 would reduce crowding
levels for other passengers on the WCML,and capacity freed up by HS2 could be
used to increase local, fast commuter
and regional services. We estimate the
latter is worth around £2.6 billion of
the £17.9 billion of benets in Table 4.
This gure does not, however, count the
potential benets of improved reliability on
the WCML as a result of these changes.
4.3.19 Our modelling includes both positive andnegative effects of HS2 and the indicative
service patterns assumed for the WCML.
While the majority of transport users
would benet from the introduction of
HS2, a small number of passengers could
experience longer journey times or less
frequent services.
4.3.20 Overall the benets from new services
would outweigh any disbenets. For
example, with our assumed service patternCoventry would gain an additional Cross-
Country service, a new direct service to
the North West, and more services into
Birmingham. Other passengers would
also gain signicantly from HS2 being
built through reduced crowding on the
classic network. With our assumed service
pattern, the services that would replace
current long distance services on the
WCML south of Birmingham would stopat more stations throughout the day and
would provide a better service to towns
and cities on this line and hence would
support economic activity in those places.
Regional impacts
4.3.21 HS2 would generate benets for transport
users across much of the UK. It is also
relevant to consider the geographical
distribution of the benets of HS2. Three
large economic centres in the country –
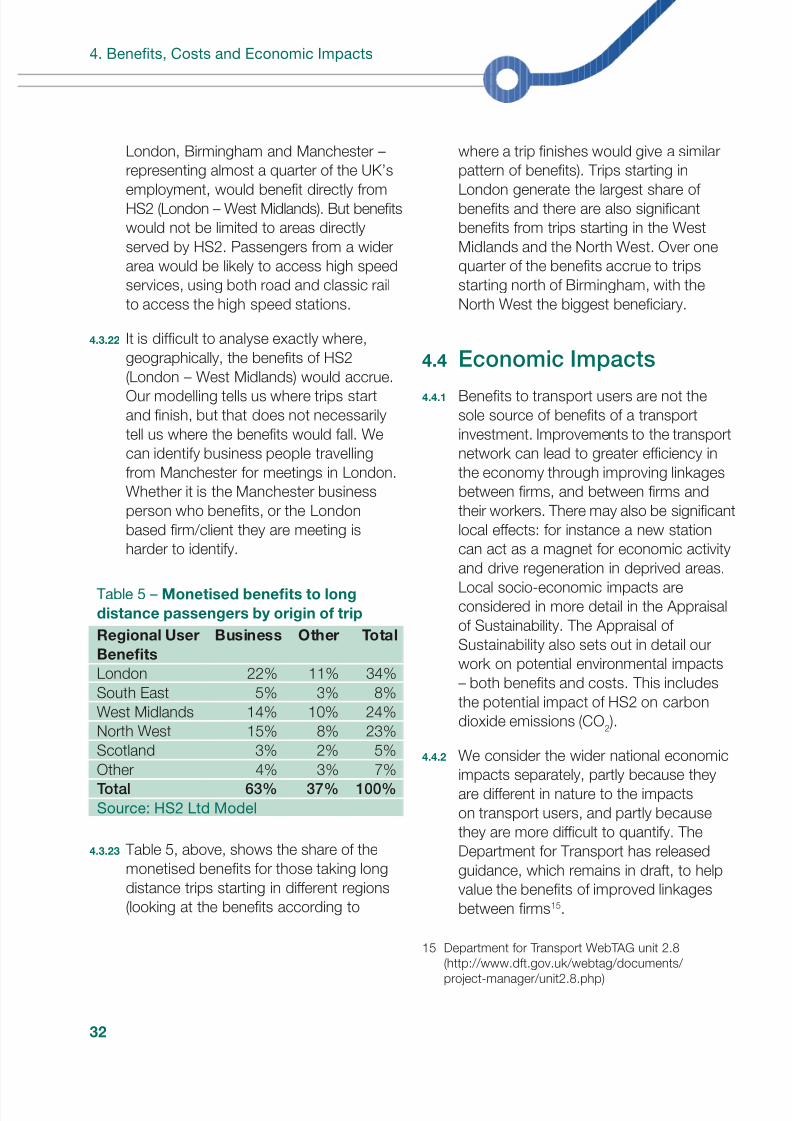
8/7/2019 Hs2 Economic Case
http://slidepdf.com/reader/full/hs2-economic-case 32/62
32
4. Benets, Costs and Economic Impacts
London, Birmingham and Manchester –
representing almost a quarter of the UK’s
employment, would benet directly fromHS2 (London – West Midlands). But benets
would not be limited to areas directly
served by HS2. Passengers from a wider
area would be likely to access high speed
services, using both road and classic rail
to access the high speed stations.
4.3.22 It is difcult to analyse exactly where,
geographically, the benets of HS2
(London – West Midlands) would accrue.Our modelling tells us where trips start
and nish, but that does not necessarily
tell us where the benets would fall. We
can identify business people travelling
from Manchester for meetings in London.
Whether it is the Manchester business
person who benets, or the London
based rm/client they are meeting is
harder to identify.
Table 5 – Monetised benefts to long
distance passengers by origin o trip
Regional User
Benefts
Business Other Total
London 22% 11% 34%
South East 5% 3% 8%
West Midlands 14% 10% 24%
North West 15% 8% 23%
Scotland 3% 2% 5%Other 4% 3% 7%
Total 63% 37% 100%
Source: HS2 Ltd Model
4.3.23 Table 5, above, shows the share of the
monetised benets for those taking long
distance trips starting in different regions
(looking at the benets according to
where a trip nishes would give a similar
pattern of benets). Trips starting in
London generate the largest share of benets and there are also signicant
benets from trips starting in the West
Midlands and the North West. Over one
quarter of the benets accrue to trips
starting north of Birmingham, with the
North West the biggest beneciary.
4.4 Economic Impacts
4.4.1 Benets to transport users are not the
sole source of benets of a transport
investment. Improvements to the transport
network can lead to greater efciency in
the economy through improving linkages
between rms, and between rms and
their workers. There may also be signicant
local effects: for instance a new station
can act as a magnet for economic activity
and drive regeneration in deprived areas.Local socio-economic impacts are
considered in more detail in the Appraisal
of Sustainability. The Appraisal of
Sustainability also sets out in detail our
work on potential environmental impacts
– both benets and costs. This includes
the potential impact of HS2 on carbon
dioxide emissions (CO2).
4.4.2 We consider the wider national economicimpacts separately, partly because they
are different in nature to the impacts
on transport users, and partly because
they are more difcult to quantify. The
Department for Transport has released
guidance, which remains in draft, to help
value the benets of improved linkages
between rms15.
15 Department for Transport WebTAG unit 2.8(http://www.dft.gov.uk/webtag/documents/
project-manager/unit2.8.php)
8/7/2019 Hs2 Economic Case
http://slidepdf.com/reader/full/hs2-economic-case 33/62
33
Economic Case for HS2
Wider Economic Impacts
4.4.3 Transport investments can have wider
economic benets, including better
linkages between rms resulting in
improvements in productivity extending
labour markets and allowing businesses
to attract more skilled employees and the
additional value to consumers of more
goods and services. These impacts,
known as ‘Wider Economic Impacts’
(WEIs) are additional to the Government’s
core method of comparing transportbenets and costs; but they are important
for a scheme of this nature and have been
calculated using Government guidance.
4.4.4 The Department for Transport has identied,
and provided guidance to value, several of
these impacts. They include:
• Agglomeration impacts. A transport
scheme such as HS2 can improve links
between rms. This would lead to a
greater clustering of rms, i.e. more
related businesses would be closer
together. This phenomenon of
clustering of similar rms could support
enhanced knowledge sharing, a greater
specialisation of staff resources, and
enhanced competition between
suppliers. Such productivity benets
to business are supportive of the wider
economy of a particular area.
• Labour market impacts. These are
mainly benets whereby shorter or
cheaper journeys encourage more people
into the labour force, or encourage
those who already have jobs to work
longer hours because their commute or
journey to a meeting takes less time. A
second benet in this category is where
people move to more productive jobs
because they are able to travel to them
more easily. Both of these effects would
boost the level of productivity in theeconomy. It has, however, only proved
possible to quantify the rst type of
impact. This proved to be very small and
is not, therefore, captured in Table 6.
• Imperect competition. The standard
transport appraisal approach calculates
the benets arising from a reduction in
transport costs to a rm. However, in
many cases the cost of production doesnot exactly match the value consumers
attach to the product or service produced.
Therefore the value of cost reduction
is likely to be greater than the simple
reduction in transport cost. This category
of benet, is referred to by the Department
for Transport as “Imperfect Competition”
and measures this additional value, over
and above the cost savings to business.
4.4.5 It is accepted that there are limitations on
the economic appraisal methodology that
we use for wider benets, so it is unlikely
to capture all of the indirect effects of HS2.
For example there may be complicated
effects on the distribution of economic
activity within the UK.
4.4.6 Overall we estimate Wider Economic
Impacts based on Department forTransport’s guidance would add a further
£4 billion (20% of the total benets) to the
benets of HS2. Seventy ve per cent of
this is due to agglomeration benets, with
the remainder mainly the result of the
increased output of imperfectly competitive
markets. There may be further benets
that have not been quantied here from
the opportunity to move to more productive
jobs. This may be signicant, but it has notbeen possible to consider it at this stage.
8/7/2019 Hs2 Economic Case
http://slidepdf.com/reader/full/hs2-economic-case 34/62
34
4. Benets, Costs and Economic Impacts
Potential land use changes could also
have an effect (see paragraphs 4.4.9 and
4.4.10 below).
4.4.7 The agglomeration impacts are based
on a methodology that focuses on
relationships within geographic regions,
with the size of those benets reducing
rapidly over longer distances. This means
that the current accepted methodology
suggests there would be only modest
agglomeration benets directly from an
inter-urban scheme such as HS2.
4.4.8 At the national level Wider Economic
Impacts as currently calculated therefore
comprise approximately one fth of the
overall economic case for HS2. However
at a regional and local level the effects of
HS2 on the distribution of activity could
be very much more signicant.
Patterns o economic development4.4.9 We have given consideration to the impacts
of changes in geographic patterns of
economic activity at local and regional
level that might result from HS2, but at
a qualitative level. In 2009 we undertook
some work, with input from Roger
Vickerman16 and Reg Harman17, looking
at international experience of the effect
of high speed rail on the patterns of
economic activity18.
16 Professor of European Economics and Dean of the
University of Kent, in Brussels.
17 Research Fellow, Centre for Transport and Society,
University of the West of England.18 Published as Appendix 3 of HS2 Demand Model
Analysis, March 2010.
4.4.10 This work shows that there are many
reasons for the success or failure of
individual high speed rail stations –often specic to the local circumstances.
However there are some consistent
messages in this literature.
• Integration is key. Simply building a
station or link to a high speed network is
not enough. For success to be achieved
the station has to be integrated into the
wider strategic plans of local agencies,
especially integration with the localtransport network. There are many
factors which are important in
regeneration beyond transport alone.
It is not surprising therefore that wider
strategies on land use planning and
even education and skills are needed
to successfully integrate a station into
the local and regional economy.
• Role as a hub. There are examples of success where a high speed rail station
also has hub-like connectivity with good
links to the local/regional rail network
as well as the high speed network.
Thus the station becomes a focus for
the regional economy as well as a
wider market supported by high speed.
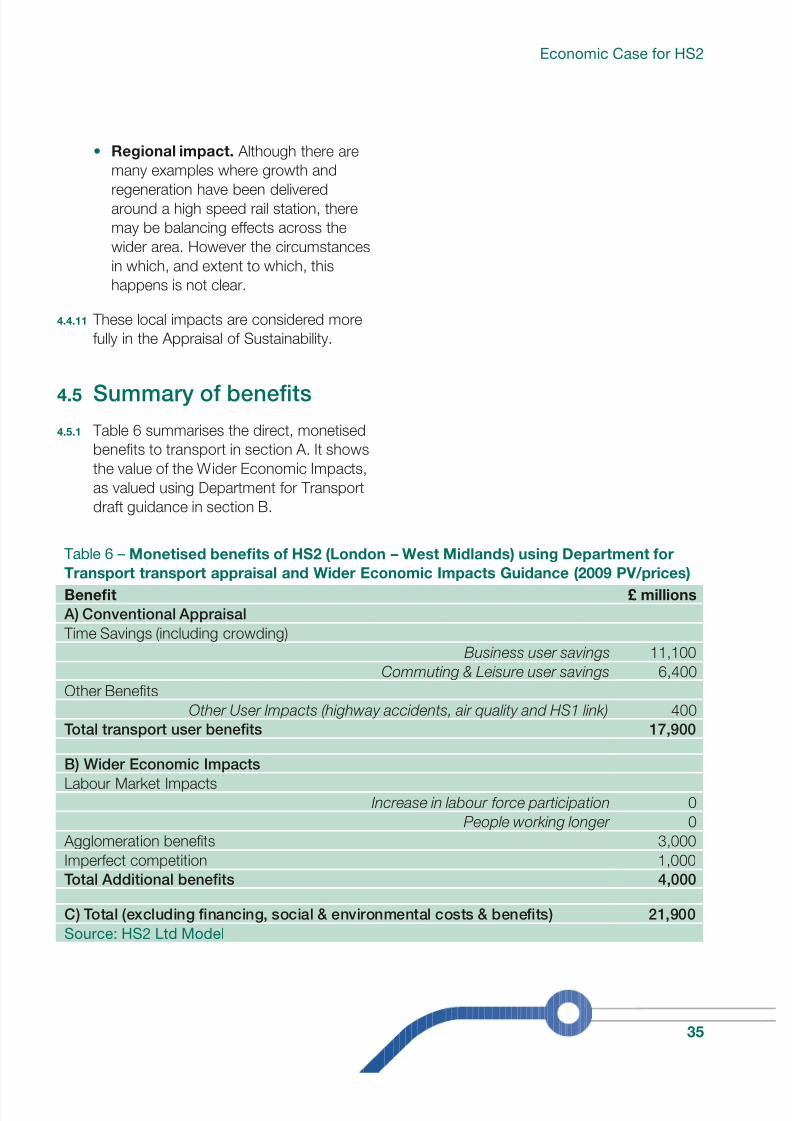
8/7/2019 Hs2 Economic Case
http://slidepdf.com/reader/full/hs2-economic-case 35/62
35
Economic Case for HS2
• Regional impact. Although there are
many examples where growth and
regeneration have been deliveredaround a high speed rail station, there
may be balancing effects across the
wider area. However the circumstances
in which, and extent to which, this
happens is not clear.
4.4.11 These local impacts are considered more
fully in the Appraisal of Sustainability.
4.5 Summary o benefts
4.5.1 Table 6 summarises the direct, monetised
benets to transport in section A. It shows
the value of the Wider Economic Impacts,
as valued using Department for Transport
draft guidance in section B.
Table 6 – Monetised benefts o HS2 (London – West Midlands) using Department or
Transport transport appraisal and Wider Economic Impacts Guidance (2009 PV/prices)
Beneft £ millions
A) Conventional Appraisal
Time Savings (including crowding)
Business user savings 11,100
Commuting & Leisure user savings 6,400
Other Benets
Other User Impacts (highway accidents, air quality and HS1 link) 400
Total transport user benefts 17,900
B) Wider Economic Impacts
Labour Market Impacts
Increase in labour orce participation 0
People working longer 0
Agglomeration benets 3,000
Imperfect competition 1,000
Total Additional benefts 4,000
C) Total (excluding fnancing, social & environmental costs & benefts) 21,900
Source: HS2 Ltd Model
8/7/2019 Hs2 Economic Case
http://slidepdf.com/reader/full/hs2-economic-case 36/62
36
4 Benets, Costs and Economic Impacts
4.6 Costs
4.6.1 We have described the demand for highspeed rail and the benets that it would
bring. The economic case also depends
on the costs of both the construction
and operation of the railway. Costs are
presented in this section at Quarter 3 of
2009 prices; they have been developed
based on prices at that point in time. The
costs are then converted into 2009 PV for
comparison to benets (which are also at
2009 PV) in the appraisal.
Capital Construction Costs
4.6.2 As with any major infrastructure project,
HS2 would come with a high capital cost,
although this would be offset to some
extent by revenues from passengers over
time. If the scheme progresses, a key aim
would be to reduce the planned costs of
the project, thus increasing value for money.
4.6.3 The components of the estimated cost
of HS2 are:
• Capital construction cost – the cost
of land purchases, design, materials,
construction (including labour and
power), allowance for risk and an
allowance for ‘optimism bias’. Optimism
bias reects the likelihood of project
planners estimating costs to be lower
than they eventually prove be. HM
Treasury therefore recommends that a
proportion of the total cost is added on
at the planning stage to allow for this.
• Rolling stock capital costs – the
purchase costs of rolling stock (trains)
plus an allowance for optimism bias.
• Operating costs – the operation and
maintenance of the railway including
train crew and station staff, the
maintenance of the rolling stock
including depots and a year of testing
the railway in 2025, before it opens,
again with optimism bias.
4.6.4 In order to estimate the likely range of highspeed construction costs we used different
estimating procedures specic to each
of the component elements of HS2 as
identied in detailed route planning. For
each route section we estimated the cost
of the scope of work shown on the detailed
route plan and section drawings. We
carried out a similar detailed process for
each station. Our set of estimating data was
derived from several sources includingsimilar major transport and other current
projects. The HS2 Ltd Cost and Risk
Model document19 provides more details
on our approach to calculating costs.
4.6.5 The capital construction cost of this
infrastructure is estimated at between
£16.0 and £17.7 billion. This includes
construction risk and an additional
£4.3 billion to cover additional risks inline with the HM Treasury guidance on
adjusting for ‘optimism bias’. This means
that overall a risk allowance of 64% has
been applied to costs. Table 7 shows
the approximate allocation between
sub-system components that make up
this total, for the mean of the range.
19 HS2 Ltd Cost and Risk Model document, December2009 (http://www.dft.gov.uk/pgr/rail/pi/highspeedrail/
hs2ltd/riskmodel/pdf/report.pdf)
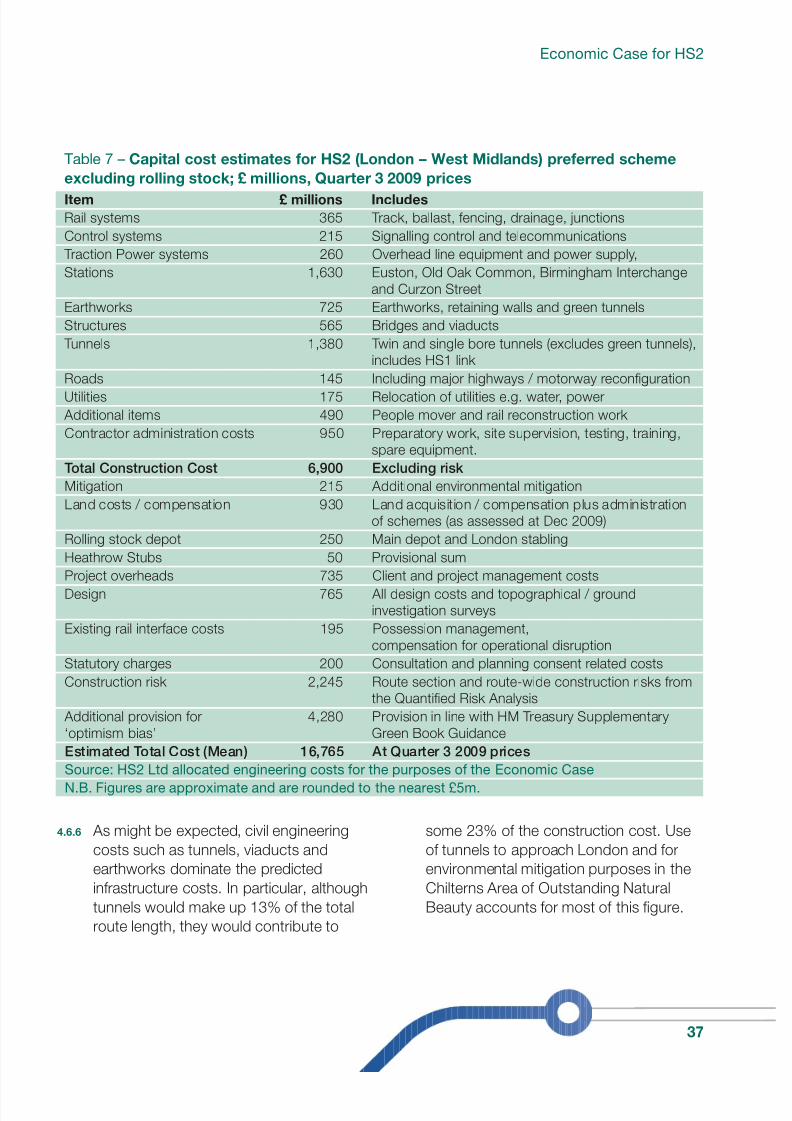
8/7/2019 Hs2 Economic Case
http://slidepdf.com/reader/full/hs2-economic-case 37/62
37
Economic Case for HS2
Table 7 – Capital cost estimates or HS2 (London – West Midlands) preerred scheme
excluding rolling stock; £ millions, Quarter 3 2009 prices
Item £ millions Includes
Rail systems 365 Track, ballast, fencing, drainage, junctions
Control systems 215 Signalling control and telecommunications
Traction Power systems 260 Overhead line equipment and power supply,
Stations 1,630 Euston, Old Oak Common, Birmingham Interchange
and Curzon Street
Earthworks 725 Earthworks, retaining walls and green tunnels
Structures 565 Bridges and viaducts
Tunnels 1,380 Twin and single bore tunnels (excludes green tunnels),
includes HS1 link
Roads 145 Including major highways / motorway recongurationUtilities 175 Relocation of utilities e.g. water, power
Additional items 490 People mover and rail reconstruction work
Contractor administration costs 950 Preparatory work, site supervision, testing, training,
spare equipment.
Total Construction Cost 6,900 Excluding risk
Mitigation 215 Additional environmental mitigation
Land costs / compensation 930 Land acquisition / compensation plus administration
of schemes (as assessed at Dec 2009)
Rolling stock depot 250 Main depot and London stabling
Heathrow Stubs 50 Provisional sum
Project overheads 735 Client and project management costs
Design 765 All design costs and topographical / ground
investigation surveys
Existing rail interface costs 195 Possession management,
compensation for operational disruption
Statutory charges 200 Consultation and planning consent related costs
Construction risk 2,245 Route section and route-wide construction risks from
the Quantied Risk Analysis
Additional provision for
‘optimism bias’
4,280 Provision in line with HM Treasury Supplementary
Green Book Guidance
Estimated Total Cost (Mean) 16,765 At Quarter 3 2009 pricesSource: HS2 Ltd allocated engineering costs for the purposes of the Economic Case
N.B. Figures are approximate and are rounded to the nearest £5m.
4.6.6 As might be expected, civil engineering
costs such as tunnels, viaducts and
earthworks dominate the predicted
infrastructure costs. In particular, although
tunnels would make up 13% of the total
route length, they would contribute to
some 23% of the construction cost. Use
of tunnels to approach London and for
environmental mitigation purposes in the
Chilterns Area of Outstanding Natural
Beauty accounts for most of this gure.
8/7/2019 Hs2 Economic Case
http://slidepdf.com/reader/full/hs2-economic-case 38/62
38
4. Benets, Costs and Economic Impacts
4.6.7 The scale and complexity of construction
of the two proposed stations in London,
particularly Euston, account for themajority of the station costs. For Euston,
given this would involve the existing station
being rebuilt, costs from the reconstruction
of St Pancras station were used as a
guide. Costs were assessed taking into
account factors such as the depth below
ground, the creation of track to approach
the station and the level of the main
station concourse. For Old Oak Common,
the costs were estimated with StratfordInternational station as a benchmark
because this is a similar design.
4.6.8 Earthworks, bridges and viaduct costs
depend on the proportion that these make
up of the line of route and the scale of the
viaducts, bridges and major earthworks
required given the land features of the
route. System costs, including rail and
control systems, make up a relativelysmall percentage of the overall costs.
The proportion is similar to other high
speed line projects across Europe.
4.6.9 A review of our key construction costs
has been undertaken. Costs for building
structures and embankments are
generally in line with those used by the
Highways Agency for comparable work.
A review of tunnel costs is much harderdue to the range of individual factors
affecting tunnel costs; our tunnel costs
have been compared to emerging
Crossrail tunnelling costs and ndings
from the Infrastructure UK construction
costs study completed during 201020 .
20 Infrastructure Cost Review: Main Report,Infrastructure UK, December 2010 (http://www.hm-
treasury.gov.uk/iuk_cost_review_index.htm)
Working with HM Treasury to reduce
capital cost orecasts
In 2009 we commissioned a ‘benchmarking’
study by independent consultants, BSL, which
investigated civil engineering costs in other
countries and compared them to costs in the
UK.21 This study showed that civil engineering
costs in the UK are up to twice what they
are in other comparable European countries.
Following this, we were asked to work with
Infrastructure UK (IUK), part of HM
Treasury, which advises the Government onlong-term infrastructure needs of the UK
and provides expertise to support major
projects such as HS2.
In December 2010 IUK produced a report
of this study, called the Infrastructure Cost
Review,20 investigating our ndings further,
as well as similar ndings from other
reports. It identies the scale of issues and
range of possible actions that could be
undertaken to reduce the cost of civil
engineering construction in UK.
The result of this work is that we have been
able to apply a reduction of approximately
£800m (including risk) to the previous total
forecast of tunnelling costs.
4.6.10 Land costs have been assessed for
the terminal stations and the preferred
line of route. Our advisors have estimatedthe land cost to be in the range of
£0.9 – 1.1 billion. This estimate still applies
following changes to the proposed line of
route since publication of our March 2010
report; however we have not undertaken
an update to the detailed land cost
estimate since March 2010.
21 Comparison of High Speed Lines’ CAPEX,BSL, November 2009 (http://www.hs2.org.uk/
assets/x/56773
8/7/2019 Hs2 Economic Case
http://slidepdf.com/reader/full/hs2-economic-case 39/62
39
Economic Case for HS2
Risk and our approach to
calculating this
4.6.11 We undertook an assessment of the
construction related risks for each route
sub-section. This reviewed the location-
specic risks associated with the scope
of the preferred scheme. We then
assessed and quantied construction
risks that could impact at the overall level
such as achievement of anticipated
contractor costs, resource availability and
ground conditions. An overall constructionrisk provision of £2.2 billion, equivalent to
22% of the total cost excluding risk and
optimism bias provision, has been included.
4.6.12 As well as the construction risks, other
factors relating to the delivery of such
a major infrastructure project have been
considered. The HM Treasury approach
identies adjustment percentages for
capital costs optimism bias that shouldbe used in the absence of more robust
evidence (i.e. at this particular stage of
the appraisal).
4.6.13 We made the following assumptions
which affect the level of provision for
optimism bias.
• The scope o work is fxed. It is
assumed that a material change in
scope would only be made after
evaluation of the incremental costs and
benets that it would bring to the HS2
business case; since we are making no
allowance for benets, no provision has
been made for additional costs from
material scope changes.
• Innovation is limited. All the
technology assumed in the design
intended for use from Day One isalready employed in Europe. In
designing a high speed railway
compliant with European Technical
Specications for Interoperability,
sub-systems used in Europe would
already have cross-acceptance for use
on HS2 at our required levels of
functionality and reliability.
4.6.14 We concluded that an additional provisionof 34% of the total estimated scheme
cost including construction risk should be
applied. This brings the total risk provision
to 64%.
Rolling Stock costs
4.6.15 Application of the rolling stock numbers
derived from the Day One train service
assumptions to the rolling stock unit costs
results in a rolling stock cost estimate as
shown below in Table 8:
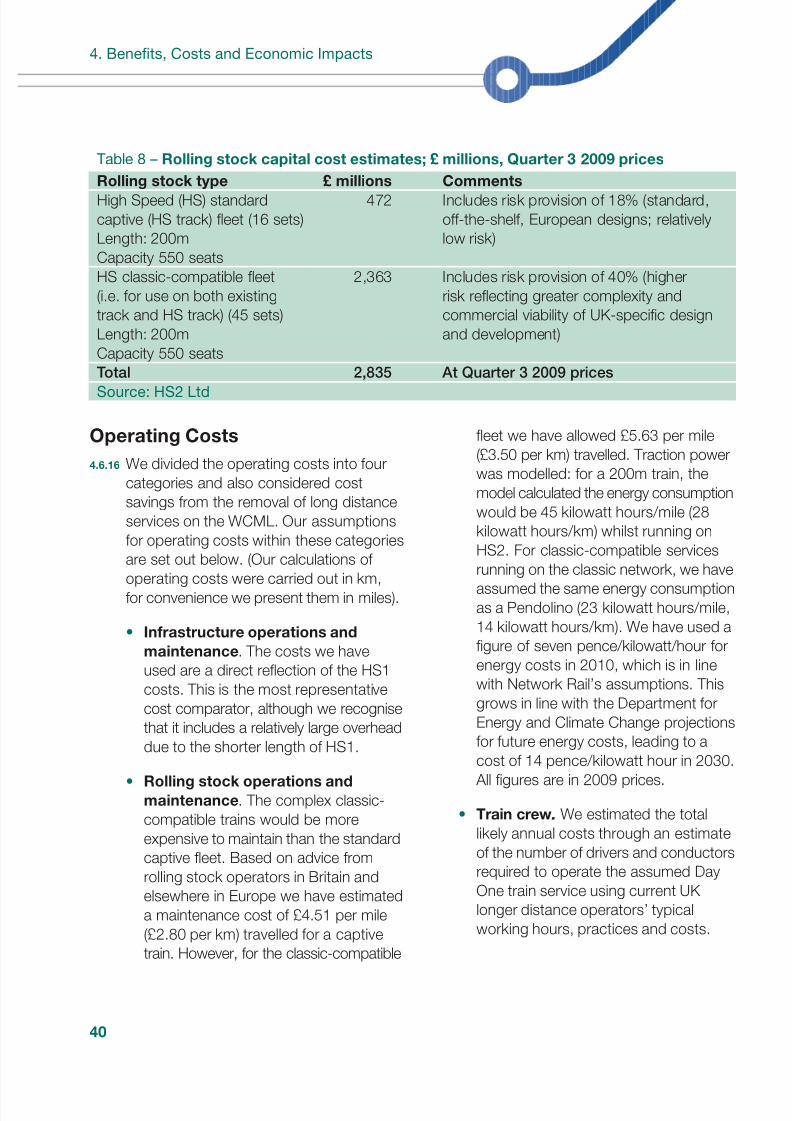
8/7/2019 Hs2 Economic Case
http://slidepdf.com/reader/full/hs2-economic-case 40/62
40
4. Benets, Costs and Economic Impacts
Table 8 – Rolling stock capital cost estimates; £ millions, Quarter 3 2009 prices
Rolling stock type £ millions Comments
High Speed (HS) standard
captive (HS track) eet (16 sets)
Length: 200m
Capacity 550 seats
472 Includes risk provision of 18% (standard,
off-the-shelf, European designs; relatively
low risk)
HS classic-compatible eet
(i.e. for use on both existing
track and HS track) (45 sets)
Length: 200m
Capacity 550 seats
2,363 Includes risk provision of 40% (higher
risk reecting greater complexity and
commercial viability of UK-specic design
and development)
Total 2,835 At Quarter 3 2009 pricesSource: HS2 Ltd
Operating Costs
4.6.16 We divided the operating costs into four
categories and also considered cost
savings from the removal of long distance
services on the WCML. Our assumptions
for operating costs within these categories
are set out below. (Our calculations of
operating costs were carried out in km,
for convenience we present them in miles).
• Inrastructure operations and
maintenance. The costs we have
used are a direct reection of the HS1
costs. This is the most representative
cost comparator, although we recognise
that it includes a relatively large overhead
due to the shorter length of HS1.
• Rolling stock operations and
maintenance. The complex classic-
compatible trains would be more
expensive to maintain than the standard
captive eet. Based on advice from
rolling stock operators in Britain and
elsewhere in Europe we have estimated
a maintenance cost of £4.51 per mile
(£2.80 per km) travelled for a captive
train. However, for the classic-compatible
eet we have allowed £5.63 per mile
(£3.50 per km) travelled. Traction power
was modelled: for a 200m train, the
model calculated the energy consumption
would be 45 kilowatt hours/mile (28
kilowatt hours/km) whilst running on
HS2. For classic-compatible services
running on the classic network, we haveassumed the same energy consumption
as a Pendolino (23 kilowatt hours/mile,
14 kilowatt hours/km). We have used a
gure of seven pence/kilowatt/hour for
energy costs in 2010, which is in line
with Network Rail’s assumptions. This
grows in line with the Department for
Energy and Climate Change projections
for future energy costs, leading to a
cost of 14 pence/kilowatt hour in 2030.All gures are in 2009 prices.
• Train crew. We estimated the total
likely annual costs through an estimate
of the number of drivers and conductors
required to operate the assumed Day
One train service using current UK
longer distance operators’ typical
working hours, practices and costs.
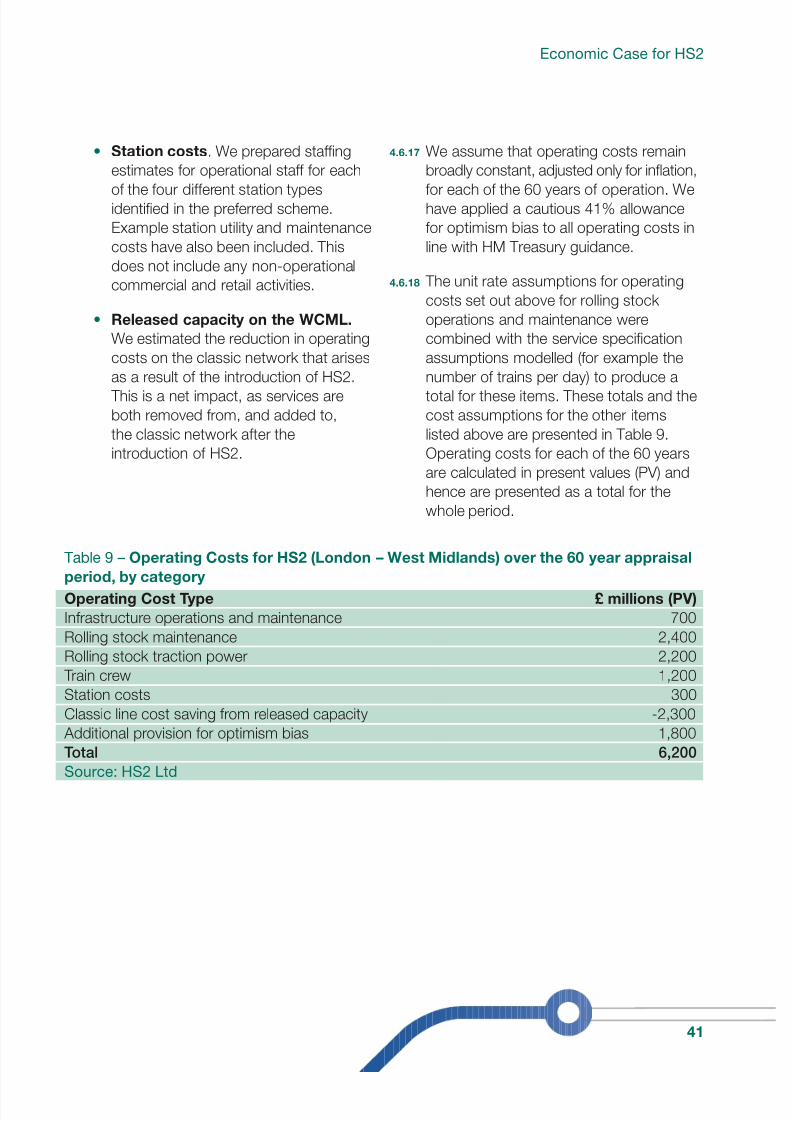
8/7/2019 Hs2 Economic Case
http://slidepdf.com/reader/full/hs2-economic-case 41/62
41
Economic Case for HS2
• Station costs. We prepared stafng
estimates for operational staff for each
of the four different station typesidentied in the preferred scheme.
Example station utility and maintenance
costs have also been included. This
does not include any non-operational
commercial and retail activities.
• Released capacity on the WCML.
We estimated the reduction in operating
costs on the classic network that arises
as a result of the introduction of HS2.This is a net impact, as services are
both removed from, and added to,
the classic network after the
introduction of HS2.
4.6.17 We assume that operating costs remain
broadly constant, adjusted only for ination,
for each of the 60 years of operation. Wehave applied a cautious 41% allowance
for optimism bias to all operating costs in
line with HM Treasury guidance.
4.6.18 The unit rate assumptions for operating
costs set out above for rolling stock
operations and maintenance were
combined with the service specication
assumptions modelled (for example the
number of trains per day) to produce atotal for these items. These totals and the
cost assumptions for the other items
listed above are presented in Table 9.
Operating costs for each of the 60 years
are calculated in present values (PV) and
hence are presented as a total for the
whole period.
Table 9 – Operating Costs or HS2 (London – West Midlands) over the 60 year appraisal
period, by category
Operating Cost Type £ millions (PV)
Infrastructure operations and maintenance 700
Rolling stock maintenance 2,400
Rolling stock traction power 2,200
Train crew 1,200
Station costs 300
Classic line cost saving from released capacity -2,300
Additional provision for optimism bias 1,800
Total 6,200Source: HS2 Ltd
8/7/2019 Hs2 Economic Case
http://slidepdf.com/reader/full/hs2-economic-case 42/62
42
5.1 Overview
5.1.1 We have considered the substantial
benets as well as costs of HS2 (the line
between London and the West Midlands).
In this chapter we draw this together
to consider the strength of the overall
economic case, and whether the benetsjustify the costs. Wider issues, such as
the potential for HS2 to contribute to
regeneration, likely job creation and the
carbon and other environmental impacts
are covered in the Appraisal of Sustainability.
5.1.2 The way in which we have carried out the
appraisal assumes that the Government
would both regulate and maintain the
high speed railway. However, more workon this is required at the next stage of
development to allow us to consider more
complex assumptions about, for example,
operating costs.
5.2 The Appraisal
5.2.1 Table 10 below summarises all of the key
economic impacts that can readily be
quantied and valued in monetary terms.
Each item is numbered and we refer to
some of these, by number, in the following
paragraphs. Our assessment of the impactof HS2 on carbon emissions can be found
in the Appraisal of Sustainability.
5.2.2 The net transport benets (item 4) would
be worth almost £16.5 billion. Benets to
business and other transport users would
represent the bulk of this (£11.1 billion
and £6.4 billion respectively), with small
further benets (£0.4 billion) from reductions
in accidents, noise and air quality fromlower road trafc and the HS1 connection.
From this we have subtracted the loss to
the Government of indirect tax revenue as
a result of fewer people travelling by car,
for example, lower fuel duty receipts; this
is £1.3 billion (item 3). A further £4.0 billion
could be added through Wider Economic
Impacts (item 5). The total benets of
the scheme, net of the loss of indirect
taxes are therefore estimated to be£20.6 billion (item 6).
5.2.3 Against these benets, the costs of HS2
would be substantial. Over the 60 years of
an appraisal, costs would be £24.0 billion
(item 9). The bulk of these are capital
costs (almost £18 billion). The remainder
(30% of costs) is the net impact on
operating costs, covering both HS2 trains
and the classic network.
5. The Economic Case for HS2
(London – West Midlands)
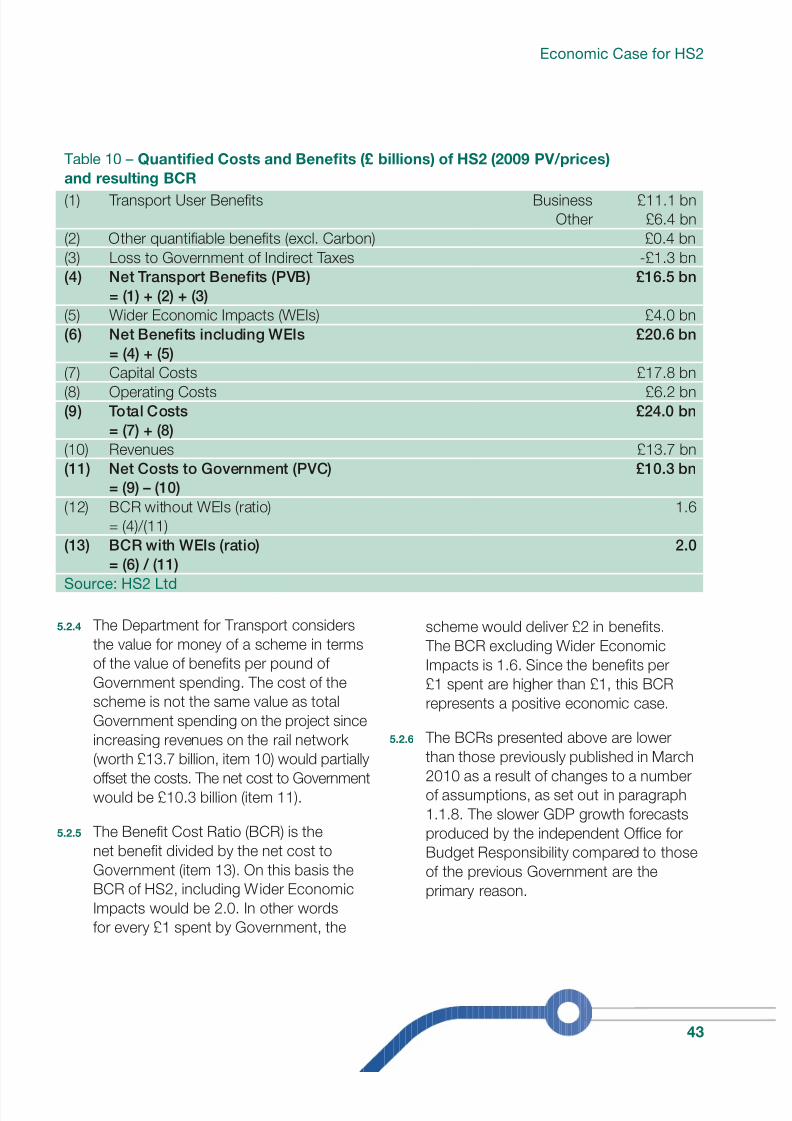
8/7/2019 Hs2 Economic Case
http://slidepdf.com/reader/full/hs2-economic-case 43/62
43
Economic Case for HS2
Table 10 – Quantifed Costs and Benefts (£ billions) o HS2 (2009 PV/prices)
and resulting BCR
(1) Transport User Benets Business
Other
£11.1 bn
£6.4 bn
(2) Other quantiable benets (excl. Carbon) £0.4 bn
(3) Loss to Government of Indirect Taxes -£1.3 bn
(4) Net Transport Benefts (PVB)
= (1) + (2) + (3)
£16.5 bn
(5) Wider Economic Impacts (WEIs) £4.0 bn
(6) Net Benefts including WEIs
= (4) + (5)
£20.6 bn
(7) Capital Costs £17.8 bn(8) Operating Costs £6.2 bn
(9) Total Costs
= (7) + (8)
£24.0 bn
(10) Revenues £13.7 bn
(11) Net Costs to Government (PVC)
= (9) – (10)
£10.3 bn
(12) BCR without WEIs (ratio)
= (4)/(11)
1.6
(13) BCR with WEIs (ratio)
= (6) / (11)
2.0
Source: HS2 Ltd
5.2.4 The Department for Transport considers
the value for money of a scheme in terms
of the value of benets per pound of
Government spending. The cost of the
scheme is not the same value as total
Government spending on the project since
increasing revenues on the rail network
(worth £13.7 billion, item 10) would partiallyoffset the costs. The net cost to Government
would be £10.3 billion (item 11).
5.2.5 The Benet Cost Ratio (BCR) is the
net benet divided by the net cost to
Government (item 13). On this basis the
BCR of HS2, including Wider Economic
Impacts would be 2.0. In other words
for every £1 spent by Government, the
scheme would deliver £2 in benets.
The BCR excluding Wider Economic
Impacts is 1.6. Since the benets per
£1 spent are higher than £1, this BCR
represents a positive economic case.
5.2.6 The BCRs presented above are lower
than those previously published in March2010 as a result of changes to a number
of assumptions, as set out in paragraph
1.1.8. The slower GDP growth forecasts
produced by the independent Ofce for
Budget Responsibility compared to those
of the previous Government are the
primary reason.
8/7/2019 Hs2 Economic Case
http://slidepdf.com/reader/full/hs2-economic-case 44/62
44
5. The Economic Case for HS2 (London – West Midlands)
5.2.7 The economic case set out here is based
on the evidence available at this point
in the design of the proposed scheme,drawing on detailed guidance from the
Department for Transport. There are
several further issues which HS2 Ltd
would address as further detail on the
design of the proposed scheme and
policies surrounding HS2 develop.
• Impact o competition and
regulatory regime. At this stage no
decisions have yet been taken by theGovernment on the regulation and
franchising arrangements within which
HS2 would operate. This would have
signicant impacts on the scope for
competition and the resulting revenues
HS2 may generate. This may also raise
questions about the balance of public
subsidy and the contribution of fare
payers on the existing rail network.
We would work to better understandthe implications of different assumptions
on competition and regulation for both
HS2 and the classic rail network.
• Financial case or HS2. We set out in
our March 2010 report possible options
for funding and delivering HS2. Further
work would be needed at the next stage
of development if it is decided to proceed
with the project. This would involvemodel development to allow us to
identify the impact of revenues on HS2
and classic rail networks separately
whereas, at present, the model calculates
the total impact across both.
• More detailed design o HS2. As the
design of the scheme becomes more
detailed, we would expect to reneour assessment of the economic case.
We have already identied some
benets (improved station design for
example) which we cannot accurately
estimate at this stage. Some of these
are included as sensitivity tests and the
results are presented in Chapter 7.
However others such as regional
timetable design, require signicant
further development of our forecastingmodels and sensitivity tests cannot be
run at this stage.
8/7/2019 Hs2 Economic Case
http://slidepdf.com/reader/full/hs2-economic-case 45/62
45
6.1.1 In addition to the sensitivity tests on
our central case assumptions that we
present in the next chapter, we have also
appraised the case for a new railway line
operating at a conventional speed (a new
classic line). This was carried out at a high
level: we applied cost and journey time
assumptions reecting conventionalspeeds to our preferred route for the
high speed line.
6.1.2 Apart from speed we used the same
specication as for the high speed line,
for example the service levels and station
stops, to assess this alternative. The
design criteria were also similar given
we assumed that a new line would be
built fully compliant with the TechnicalSpecications for Interoperability, as is
current UK Government policy for all
new lines.
6.1.3 This led us to conclude that the cost of
constructing the scheme to conventional
speed would only save about 9% of the
costs of the high speed line. We assumed
that operating and maintenance costs
would be comparable with the exceptionof train power costs. These would be
lower on a classic speed line and have
been assumed to be the same as those
of a Pendolino. An overall cost saving
of £1.5 billion in construction costs and
£75 million per year in operating costs
would therefore be possible.
6.1.4 Travelling between London and Birmingham,
following the same service pattern as the
high speed preferred package, would take
an extra 15 minutes, based on standard
maximum speeds on the UK network
and the acceleration performance of a
standard reference train. This would halve
the time saving from a high speed train.
6.1.5 This would reduce the number of people
travelling on the line by 9%, causing overall
benets to fall by 33%. Revenues wouldfall by 24%, which means that while
construction, operating and maintenance
costs would fall, the net cost saving (i.e.
cost minus revenues) would be around
£0.8 billion (2009 PV).
6.1.6 If the decision was taken to build a new
line, therefore, upgrading the line to high
speed would have a relatively small net
cost to Government, but would generate
signicant benets (time savings) to
passengers on HS2. As a result the
classic line alternative would have a worse
economic case than HS2. The incremental
case for a high speed line is very strong.
6.1.7 In most respects there would be little
difference in terms of the sustainability
performance of a new classic line
in comparison with HS2. The main
differences would be that a new classic
line would entail:
• Lower carbon emissions due to lower
energy demands of slower speed trains;
• Greater exibility to avoid sensitive
features in more detailed scheme
design owing to the tighter curves
of a slower speed line; and
6. The case for a new
conventional speed line
8/7/2019 Hs2 Economic Case
http://slidepdf.com/reader/full/hs2-economic-case 46/62
46
6. The case for a new conventional speed line
• Lower noise impacts due to the lower
operational speeds of the trains (in the
assessment of 2009 it was estimatedto affect some 1,500 people compared
with 4,000 or so for HS2 before
mitigation. In both cases there would
be scope to mitigate these impacts).
6.1.8 The BCR of a new classic line (excluding
Wider Economic Impacts) is estimated
to be around 1.0. This compares to the
equivalent BCR of 1.6 for HS2 (London –
West Midlands).
8/7/2019 Hs2 Economic Case
http://slidepdf.com/reader/full/hs2-economic-case 47/62
47
7.1.1 We have, as far as possible, sought
to apply conservative assumptions in
assessing the overall case for HS2 and
have subjected our judgement to the
views of an external analytical challenge
panel. On that basis the economic case
that we have set out clearly demonstrates
that under our central assumptions HS2
would offer value for money.
7.1.2 Throughout this document, wherever
we have discussed our assumptions,
we have explained in what way they have
been subject to sensitivity tests. This
chapter explains the details of the tests
and how the economic case would change
under the alternative assumptions tested.
At this stage we have not assessed the
level of Wider Economic Impacts for each
of the sensitivity tests. The results presented
below are therefore against a BCR which
excludes WEIs. The BCR for comparison
is 1.6.
7.1.3 The main sensitivity tests undertaken can
be summarised in the following three
sub-sections.
The level and pattern o demandwithout HS2
7.1.4 Demand is a key issue for HS2, with
higher forecasts of demand likely to result
in higher patronage on HS2, with the
associated benets and revenue. Within
this set of tests we cover the implications
of several different assumptions, including:
• Different rates of growth in demand,
which might occur as a result of
different economic conditions or
different relationships between income
and demand in the future;
• The level at which demand is
‘capped’ in the future and when
the cap applies; and
• The implications of different pricing
levels on car, air and rail travel.
The valuation o benefts o HS2
7.1.5 The valuation of benets can have many
and complex impacts on the overall
economic case. In particular the traditional
assumption that business passengers’travelling time is not productive has been
questioned. In this section we look at the
implications of productive use of time
spent travelling for the valuation of time
and other business benets. We also
consider the value business passengers
implicitly place on journey time savings
through the choices and travel decisions
that they make.
The cost o building and operating
the scheme
7.1.6 Whilst the construction of the proposed
scheme has been through a detailed
cost estimation process and an external
technical challenge panel to ensure it is
as robust as possible, there is inevitably
uncertainty at the current stage of design.
In this section we consider the implications
of different ranges of costs and their
implications for the economic case.
7. The results of testing
our assumptions
8/7/2019 Hs2 Economic Case
http://slidepdf.com/reader/full/hs2-economic-case 48/62
48
7. The results of testing our assumptions
7.1.7 We also consider the potential impacts
of private funding to support the scheme.
All of our work to date has beenconducted on the basis that HS2 would
be fully funded by Government. In practice
it is likely that the private sector would
contribute, particularly around station
development. By reducing costs to
Government, any such contributions
would tend to increase the BCR.
Scheme opening year
7.1.8 As with any scheme which is driven by
increasing levels of demand and forecast
capacity problems, the BCR of the scheme
is sensitive to the year in which it is opened.
7.2 The level and pattern odemand without HS2
7.2.1 There are too many variables to allowus to model and test every individual
assumption that makes up our demand
forecasts. However each of the variables
will in effect change one of four factors:
• The overall level of demand, particularly
for long distance travel;
• The rate of growth in travel;
• The pattern of demand across modes
and across the country; and
• The price of different modes.
Level o demand
7.2.2 Growth in transport demand is driven in
large part by growth in the economy and
population changes. We have capped
growth at a level which we believe is
plausible, though conservative, given the
evidence on the number of trips and the
characteristics of passengers today. That
cap is reached in 2043.
7.2.3 However there is uncertainty over the
maximum level of demand that might be
seen in the future. Recent trends have
suggested that there is no slow down in
overall growth in travel, particularly for
long distance travel. Rail travel still makes
up a small proportion of the long distance
travel market, and therefore has more
scope to grow. As such it would be
plausible that rail growth could continue
well beyond 2043.
7.2.4 If we assumed that demand continued
to grow for a further ve years (to 2048),
the BCR of HS2 excluding WEIs would
increase to 2.0. At this point, we estimate
that the average person would be
undertaking 0.7 additional rail trips of more
than 100 miles per year compared to
today. This is a plausible level of growth.
The difference between the trip rates of
the highest and lowest income quintiles
today is double this – and with incomes
expected to grow by almost 80% between
now and 2048 it is reasonable to assume
that average trip rates will rise accordingly.
8/7/2019 Hs2 Economic Case
http://slidepdf.com/reader/full/hs2-economic-case 49/62
8/7/2019 Hs2 Economic Case
http://slidepdf.com/reader/full/hs2-economic-case 50/62
50
7. The results of testing our assumptions
7.2.12 However it is useful to consider how
sensitive the economic case is to these
higher growth rates. If we were to capgrowth from Scotland at the levels forecast
for 2021, this would reduce the benets
by 6%, and reduce the overall BCR
excluding WEIs to 1.3.
Pattern o demand across modes
7.2.13 Our forecasts are based on extrapolating
past trends. While there is little evidence
of a slow down in the growth of long
distance rail demand, some argue that
the total market for long distance travel is
no longer growing – and that the growth
in rail demand is largely down to people
shifting from air and car.
7.2.14 To test the impact of this hypothesis, we
have assessed the (extreme) examples of
assuming no growth in car trips or air trips
beyond the levels seen in 2008. This is
equivalent to a 33% reduction in the car
trip rate (the number of trips per person
per year) by 2043 or a 53% reduction in
the air trip rate. In each case the freezing
of growth reduces the BCR excluding
WEIs to 1.5. Combining both examples
– equivalent to a 29% reduction in the
overall trip rates in 2043 – would reduce
the BCR excluding WEIs to 1.4.
7.2.15 This conrms that the key driver for the
economic case for HS2 is growth in rail
trips. Our forecasts show signicant
growth, particularly on certain long distance
ows into London, from a relatively low
starting point. Overall we forecast increases
in the number of rail trips over 100 miles
per person per year of 61% – an
additional 0.5 trips per person per year.
This translates into overall growth in long
distance rail demand of 95%. These are
higher increases for some of the key
trips that HS2 would serve; for example,
Birmingham to London rail trips are
forecast to increase by 129% – but eventhis is less than one extra trip to London
per person per year in Birmingham.
Pricing across the modes
7.2.16 Different price levels on road, rail and air
can also have complex impacts on the
demand and business case for HS2.
Higher prices on air and road will tend to
increase the number of passengers on rail
even without HS2. More rail passengers
will tend to mean more passengers on
HS2. In addition there is likely to be
greater mode shift to HS2, further
increasing demand and adding to
revenues. As a result a scenario with high
oil and carbon trading prices (amounting
to 37% higher air fares in 2043) would
increase the BCR excluding WEIs to 1.8.
7.2.17 Similarly, on an assumption that fuel duty
is increased by 50% more than currently
forecast by 2043, then the BCR excluding
WEIs would rise to 2.4. This is mainly driven
by growth in the overall size of the rail
market as a result of people choosing to
use rail rather than car travel, and hence
being attracted to HS2. A combination of
50% higher road fuel duty and 37% higher
air fares would increase the BCR excluding
WEIs to 2.7.
7.2.18 If rail prices increase, then the benets
decline. If rail fares increase by RPI + 2%
(instead of 1%) through to 2043, then
demand on the railway would be 24%
lower. Assuming that demand is capped at
this lower level the result is that the number
of passengers on HS2 would fall, leading
to lower benets and revenues overall
(despite the higher fares). This would mean
the BCR excluding WEIs falls to 0.9.
8/7/2019 Hs2 Economic Case
http://slidepdf.com/reader/full/hs2-economic-case 51/62
8/7/2019 Hs2 Economic Case
http://slidepdf.com/reader/full/hs2-economic-case 52/62
52
7 The results of testing our assumptions
of a journey. The way they actually behave
– the choices they make and the trade-offs
between time, cost and other factors –reects these issues. These choices
are reected in our model and show
that business passengers do value time
savings on trains, and that if anything,
they place a slightly higher value on this
than is recommended by the Department
for Transport.
Other Benefts
7.3.8 We have attempted to be as
comprehensive as possible in the
assessment of costs and benets.
However we have identied a number
of areas where we expect further work
may result in benets which have not
been captured so far. One such area
is the potential benets of improved
station design.
7.3.9 We would expect the redevelopment
of Euston would offer the potential to
signicantly enhance the passenger
experience. A better station layout would
minimise walk times between key areas
of the station, whilst better design of
information, seating, retail and other factors
would provide benets to passengers.
7.3.10 We do not attempt to value these
potential benets in our central case as
they would depend on the detailed design
of any nal station. However, Atkins has
undertaken a brief review of the potential
scale of the benets, based on the
projected number of passengers using the
station and evidence from similar station
enhancements. They have concluded
that the redesign of Euston station could
deliver benets of between £900 million
and £1.5 billion, which would increase the
BCR to around 1.7, excluding WEIs.
7.4 Costs and private sector
contributions7.4.1 Our estimates of costs have been built
from the bottom up, including detailed
assessment of the needs of the scheme
and comparison with costs of constructing
HS1 and other rail schemes. We have
included an allowance for risks and
‘optimism bias’ which adds 64% to
our infrastructure capital cost estimates.
These cost estimates have been testedwithin HS2 Ltd and by an independent
panel of experts.
7.4.2 However, there are ranges in our cost
estimates to reect different views of the
risks and future performance of the rail
network. In particular, on the costs of
construction, we report a range of
£16.0 to £17.7 billion. This is equivalent to
a range in the BCR excluding WEIs of 1.5
to 1.7. Recent work by the HM Treasury’s
Infrastructure UK has identied a number
of potential areas for greater efciency in
the construction of infrastructure projects,
and the actions to realise these. If these
delivered a further 15% reduction in costs,
the effect would be to increase the BCR
excluding WEIs to 2.0.
7.4.3 In line with HM Treasury guidance, the
level of optimism bias has been calculated
to take account of the specic nature of
HS2 and the status of our Quantied Risk
Assessment. An alternative approach used
by other schemes with less detailed risk
assessments is simply to apply a 66%
optimism bias to construction costs. This
falls within the range of costs calculated by
our approach. We believe our approach
is a better reection of the true risks
associated with the construction of HS2.
8/7/2019 Hs2 Economic Case
http://slidepdf.com/reader/full/hs2-economic-case 53/62
53
Economic Case for HS2
7.4.4 Another area of signicant costs for HS2
would be the purchase costs of rolling
stock. We have made allowances for thedegree of complexity in construction of
different types of rolling stock. Trains that
would operate on HS2 only (the ‘captive’
eet) are expected to be ‘off the shelf’ –
standard designs that are tried and tested
across Europe and therefore lower risk.
However, the classic compatible eet is
expected to be a bespoke design as they
would need to run on UK gauge railways.
As such we assume that these would costaround 50% more and have doubled the
allowance for risk and optimism bias. This
reects the greater xed set up costs in
design, and the greater uncertainty.
7.4.5 However, with a wider network –
potentially leading to larger orders of
classic compatible trains – it may be
possible to drive both cost efciencies
and mitigate risk. We have thereforetested the impact of using the same cost
estimates for the captive and classic
compatible eet. With this assumption,
the BCR would rise to 1.9 without WEIs.
7.4.6 The costs of operating and maintaining
the scheme depend on assumptions
about growth in electricity costs, wages
and productivity across the transport
network. Our central assumptions includesubstantial growth in overall costs,
including a near doubling of electricity
costs (in line with DECC forecasts).
We have also applied 41% optimism
bias on top of these, which we consider
conservative given that there is worldwide
experience of operating high speed rail.
7.4.7 We have considered a range around this.
Our lower cost estimate reects optimismbias at 10% and a slower increase in
electricity costs and greater productivity
gains in the rail industry. This would
increase the BCR without WEIs to 2.0.However, if productivity growth is slower
– or wage growth faster – than expected,
costs would increase resulting in a lower
BCR without WEIs of 1.4.
7.4.8 We have in our central case assumed
the project is entirely Government funded.
In practice we would expect scope to
gain private sector contributions, as HS2
would open up new opportunities fordevelopment and growth in and around
station locations in particular. Any such
contributions would reduce the costs to
Government, but also (since it is a cost
to the private sector) reduce the benets.
Even though it is not ‘free money’, such
contributions would tend to improve the
BCR of the scheme as the benets per £1
of Government spending will increase with
lower costs to Government. A contributionof £2 billion, for example, would increase
the BCR excluding WEIs to 1.7.
7.5 Scheme Opening Year
7.5.1 Our analysis is based on the assumption
that HS2 would open in 2026. This
represents the fastest realistic timescale
for a London to Birmingham Line. If thescheme opened later than this, the BCR
would increase – reecting demand
growth and the fact that there would be
more passengers from the opening of the
scheme. Figure 6 below indicates how the
BCR changes as the opening year of the
scheme is pushed back. By 2030, the BCR
excluding WEIs would have risen above
2.0. This would mean delaying the second
phase to Manchester and Leeds whichcould otherwise be open by 2032-33.
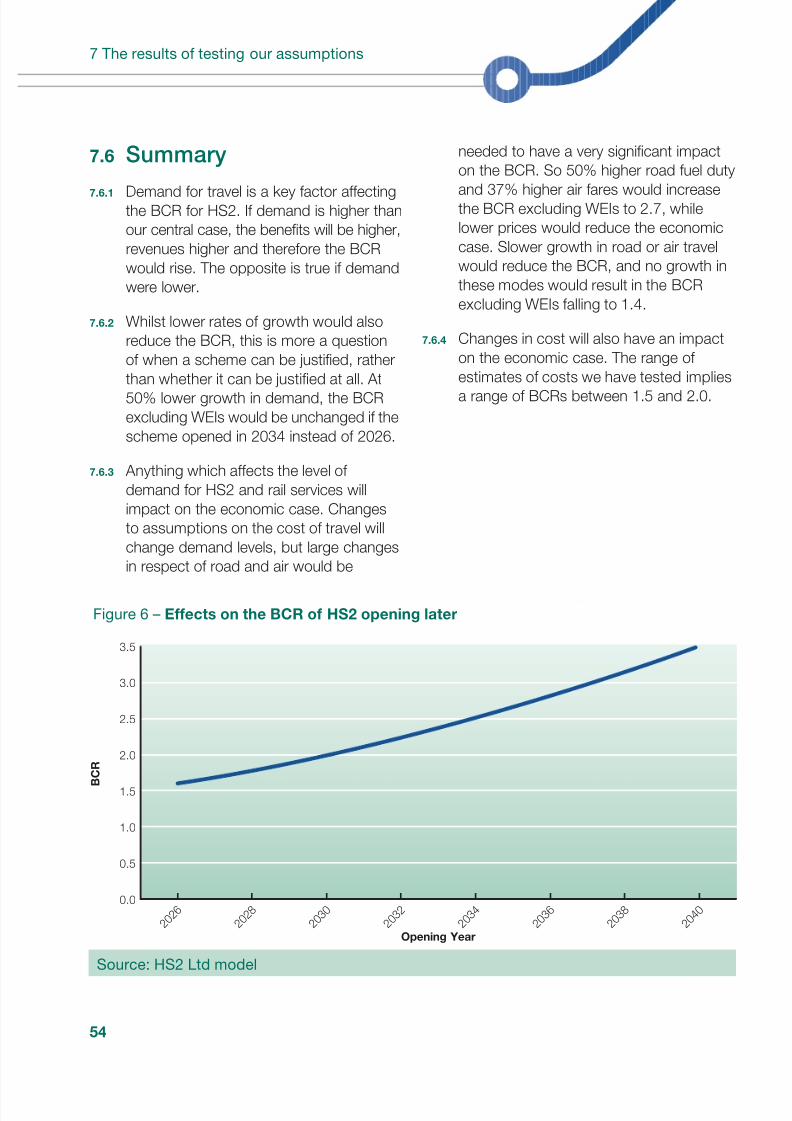
8/7/2019 Hs2 Economic Case
http://slidepdf.com/reader/full/hs2-economic-case 54/62
54
7 The results of testing our assumptions
7.6 Summary
7.6.1 Demand for travel is a key factor affectingthe BCR for HS2. If demand is higher than
our central case, the benets will be higher,
revenues higher and therefore the BCR
would rise. The opposite is true if demand
were lower.
7.6.2 Whilst lower rates of growth would also
reduce the BCR, this is more a question
of when a scheme can be justied, rather
than whether it can be justied at all. At50% lower growth in demand, the BCR
excluding WEIs would be unchanged if the
scheme opened in 2034 instead of 2026.
7.6.3 Anything which affects the level of
demand for HS2 and rail services will
impact on the economic case. Changes
to assumptions on the cost of travel will
change demand levels, but large changes
in respect of road and air would be
needed to have a very signicant impact
on the BCR. So 50% higher road fuel duty
and 37% higher air fares would increasethe BCR excluding WEIs to 2.7, while
lower prices would reduce the economic
case. Slower growth in road or air travel
would reduce the BCR, and no growth in
these modes would result in the BCR
excluding WEIs falling to 1.4.
7.6.4 Changes in cost will also have an impact
on the economic case. The range of
estimates of costs we have tested impliesa range of BCRs between 1.5 and 2.0.
Figure 6 – Eects on the BCR o HS2 opening later
3.5
3.0
2.5
2.0
1.5
1.0
0.5
0.0
BCR
Opening Year2026
2028
2030
2032
2034
2036
2038
2040
Source: HS2 Ltd model
8/7/2019 Hs2 Economic Case
http://slidepdf.com/reader/full/hs2-economic-case 55/62
55
8.1.1 There is a strong case for a high speed
rail network based on a Y conguration
connecting London, Birmingham,
Manchester and Leeds – the last via
the East Midlands and South Yorkshire.
A cautious strategic level assessment of
the Y conguration shows a BCR of 2.6,
including an estimate for WEIs. A highspeed line between London and
Birmingham would form the rst stage
on that network. As a stand alone
proposition, this still offers a positive
economic case on its own terms as well
as in the context of a wider network.
8.1.2 In the context of signicant increases
in demand for travel, especially long
distance, and hence overcrowding of the rail and road networks, HS2 would
bring signicant transport user benets
to regions across England and Scotland,
served both directly and indirectly (through
the link to the classic network and through
released capacity). It would also produce
benets to users of the WCML as well as
HS2 passengers. There would also be
Wider Economic Impacts, not all of which
have been possible to quantify, and otherimpacts on economic development,
regeneration and employment which
are largely positive. The Appraisal of
Sustainability published alongside this
document provides an appraisal of
these effects and all other sustainability
considerations covering environmental
and social issues.
8.1.3 The benets (including the WiderEconomic Impacts and other impacts),
converted into monetary terms, have
been weighed up against the capital and
operating costs of the scheme over 60
years using transport appraisal guidance
set out by the Department for Transport.
The result of this is a BCR for HS2 (London
– West Midlands) of 2.0. This reects our
‘central case’ assumptions. If we exclude the
Wider Economic Impacts the BCR is 1.6.
Further Inormation
8.1.4 Further information available as part of the
public consultation can be found:
• Online at http://highspeedrail.dft.gov.uk;
and
• At roadshow events along the London
– West Midlands line of route.
8.1.5 Documents of particular interest might be:
• The main consultation document,
for an overview of the Government’s
proposed national high speed rail
strategy, sustainability issues, the line
of route, and how to respond to the
consultation; and
• The Appraisal of Sustainability (AoS)
and a non-technical summary.
8.1.6 Further technical information is available at
www.hs2.org.uk:
• Question and Answer write up from
HS2 Ltd public technical seminars;
• Modelling technical notes; and
• Previous HS2 Ltd technical
publications.
8. Conclusions and
Further Information
8/7/2019 Hs2 Economic Case
http://slidepdf.com/reader/full/hs2-economic-case 56/62
56
Appraisal The assessment of the value of a project or
scheme, expressed in Present Value (PV) terms.
Beneft Cost Ratio (BCR) The net benet of a scheme divided by the net
cost to Government.
Central Case The set of assumptions for benets and costs
that HS2 Ltd believes reects the most likely
scenario for the purposes of modelling the
benets and costs of HS2.
Core Transport Appraisal The appraisal of core costs and benets. In
general, this means benets or costs that are
widely understood, and for which a monetary
value can be determined according to generally
accepted economic principles. This does not
include ‘Wider Economic Impacts’.
Demand The total quantity of a good or service that peoplewant to consume at the current market price.
Discount actor The discount factor is the annual percentage fall
in value that is associated with costs and benets
the further into the future they occur. HM Treasury
Green Book guidance sets the discount factor
at 3.5% for the rst 30 years from now and 3%
for the next 45 years.
Gross Domestic Product (GDP) A measure of total UK economic activity,dened as the sum of consumption, investment
and Government spending, plus net exports.
GDP growth means that there is an increase
in total economic activity, hence the economy
is described as ‘growing’.
Indirect Tax Revenue Tax revenue collected by the Government
from consumers through taxes on goods and
services via the seller. For example tax on fuel
and alcohol. Direct taxes are, for example,income tax and council tax, received directly
from taxpayers.
9. Glossary of Economic Terms
8/7/2019 Hs2 Economic Case
http://slidepdf.com/reader/full/hs2-economic-case 57/62
57
Economic Case for HS2
Macro-economic Relating to the economic activity of the whole
economy or country, as opposed to the
activities of individuals, households or rms.
Optimism bias The tendency of project planners to be optimistic
about the costs of a project/scheme and hence
underestimate the costs. HM Treasury guidance
states that when planning Government funded
projects, an allowance to compensate for this
tendency must be included. This is referred to
as an ‘allowance for optimism bias’.
Present Value (PV) The value of future monetary amounts, discounted(by a discount factor) to reect their current
value. This allows for comparison of future
monetary amounts (such as the benets and
costs of a scheme). In line with our March 2010
report we discount to 2009 in order to allow
comparison with numbers that we have
previously published.
Retail Price Index (RPI) An index of prices over time based on a broad
basket of consumer goods and services. It iscalculated and published monthly by the UK
Ofce of National Statistics (www.ons.gov.uk)
and it provides a broad measure of ination.
Supply The total quantity of a good or service
that providers want to sell at the current
market price.
Value o time People implicitly put a value on their own time,
in that they will trade a cheaper, slower journey
against a faster, more expensive one. It is
therefore appropriate to take account of this
value in assessing the impact of different
transport strategies or plans.
Wider Economic Impacts (WEIs) These include the benets from improved
linkages between rms and their workers,
which can lead to economies of scale and other
efciencies. Department for Transport’s guidance
for measuring these benets is not yet nalised,
and we therefore present BCRs with and withoutthese impacts.
8/7/2019 Hs2 Economic Case
http://slidepdf.com/reader/full/hs2-economic-case 58/62
58
Service specifcation or HS2(London – West Midlands)
Figure A1 depicts the proposed train service
specication of the dedicated high speed
services for HS2 (London West Midlands),
alongside the classic-compatible HS2 services
on Day One. This illustrates the services available
using HS2 in any given hour. The services are
grouped together by destination (left to right in
the gure) for ease of presentation; in practice,
services would be spread evenly throughout
each hour of operation.
Appendix 1
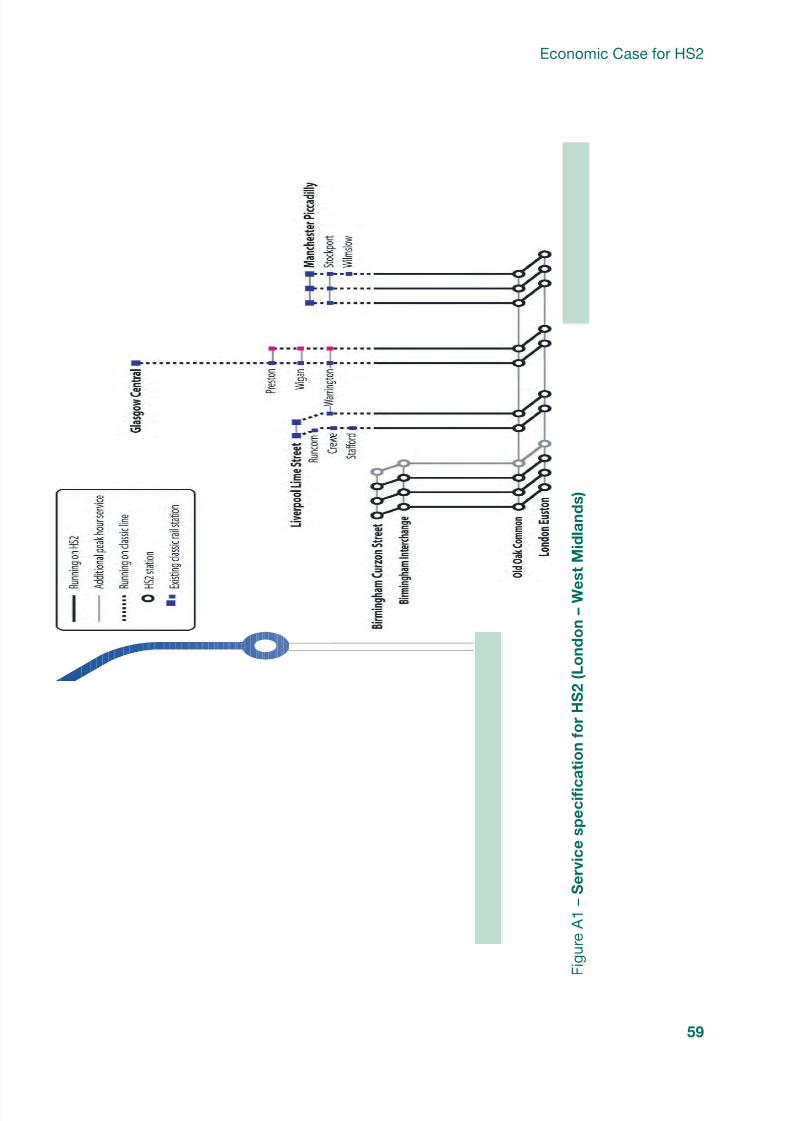
8/7/2019 Hs2 Economic Case
http://slidepdf.com/reader/full/hs2-economic-case 59/62
59
Economic Case for HS2
Figure A1 – Service specifcatio
n or HS2 (London – West Midlands)
8/7/2019 Hs2 Economic Case
http://slidepdf.com/reader/full/hs2-economic-case 60/62
60
Appendix 1
Service specifcation
assumptions or theY network
Figure A2 depicts the train service specication
assumptions used to calculate the costs and
benets of a Y network. This illustrates the
services potentially available using the Y network
in any given hour when the Y network opens.
The services are grouped together by destination
(left to right in the gure) for ease of presentation;
in practice, services to all destinations would bespread throughout each hour.
Our previous work did not model services to
Heathrow hence no Heathrow services are
shown in Figure A2. This is being explored
further in our current work during 2011, with
the aim of optimising service patterns across
the network.
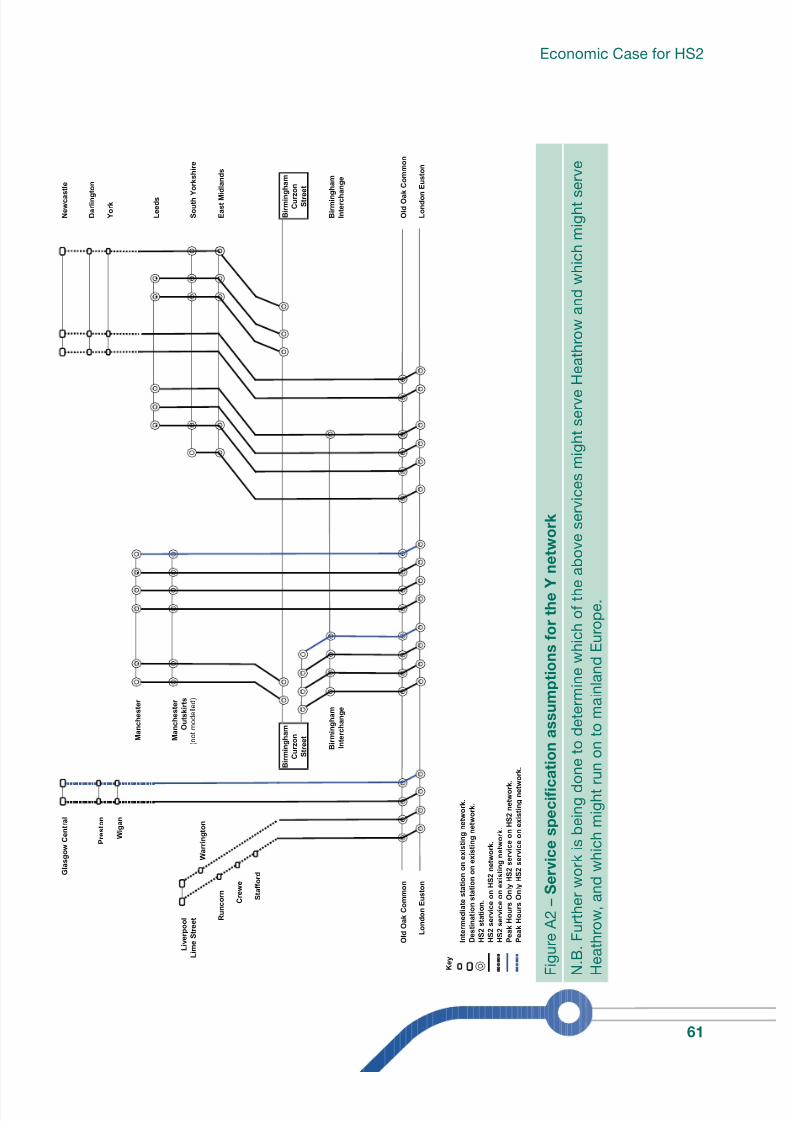
8/7/2019 Hs2 Economic Case
http://slidepdf.com/reader/full/hs2-economic-case 61/62
61
Economic Case for HS2
Glasgow Central
Newcastle
Darlingto
n
Preston
York
Wigan
Manchester
Leeds
Manchester
Liverpool
Outskirts
Lim
e Street
(not modelled)
South Yo
rkshire
Warrington
Runcorn
East Midlands
Crewe
Stafford
Birmingham
Birmingh
am
Interchange
Interchan
ge
Old Oak Common
Old Oak Common
London Euston
London E
uston
Key
Intermediate station on existing network.
Destination station on existing network.
HS2 station.
HS2 service on HS2 network.
HS2 service on existing network.
Peak Hours Only HS2 service on HS2 network.
Peak Hours Only HS2 service on existing network.Birm
ingham
C
urzon
Street
Birmingh
am
Curzon
Street
Figure A2 – Service specifcatio
n assumptions or the Y n
etwork
N.B. Further work is being done
to determine which of the above services might serve H
eathrow and which might se
rve
Heat
hrow, and which might run o
n to mainland Europe.

8/7/2019 Hs2 Economic Case
http://slidepdf.com/reader/full/hs2-economic-case 62/62
Recommended