D3.4 Smart Energy Supply and Demand, Integration of RES, storage,
management and Control
WP3, Task 3.3
Transition of EU cities towards a new concept of Smart Life and Economy
Deliverable due date: M36 – November 2019
Ref. Ares(2019)7391668 - 01/12/2019
THIS
DEL
IVER
AB
LE H
AS
NO
T YE
T B
EEN
AP
PR
OV
ED B
Y TH
E EC
Page 2 Page 2 D3.4 Smart energy supply and demand. integration of RES, storage, management and control
Project Acronym mySMARTLife
Project Title Transition of EU cities towards a new concept of Smart Life and Economy
Project Duration 1
st December 2016 – 30
th November 2021 (60 Months)
Deliverable D3.4 Smart Energy Supply and Demand. Integration of RES, storage, management and control
Diss. Level PU
Status Working
Verified by other WPs
Final version
Due date 30/11/2019
Work Package WP3
Lead beneficiary ENH
Contributing beneficiary(ies)
HAM, HAM-SN, HAW, TSY
Task description Report on the integration, performance and optimization of RES and storage energy systems in
the district heating and cooling network and buildings. Definition of the management and control
strategies of the systems.
Date Version Author Comments
07.11.2019 0.2 Doris Willmer (ENH) Final Template, Chapter 1.2, Remarks to Chapter 2.2
07.11.2019 0.3 Info Friese (TSYS) Chapter 5
13.11.2019 0.3.2 Simon Decher (HAW) Chapter 3
13.11.2019 0.4 Doris Willmer (ENH) Chapter 2.1
13.11.2019 0.4.1 Joachim Lange (SNH) Chapter 6.2
14.11.2019 0.4.2 Doris Willmer (ENH) Chapter 4
14.112019 0.5 Johannes Mielchen
HAM) Chapter 6.1, Chapter 1
14.11.2019 0.5.1 Doris Willmer (ENH) Chapter 1,2
14.11.2019 0.5.2 Johannes Mielchen
(HAM) Chapter 2.1
15.11.2019 1.0 Doris Willmer (ENH) Assembling, checking, Corrections
20.11.2019 2.0 Doris Willmer (ENH) Revision after Deliverable Meeting
21.11.2019 1.1 Kathtarina Lange
(HCU) Official review
21.11.2019 1.2 Julian Sahr (HAM) Internal review, additions Chapter 6
THIS
DEL
IVER
AB
LE H
AS
NO
T YE
T B
EEN
AP
PR
OV
ED B
Y TH
E EC
Page 3 Page 3 D3.4 Smart energy supply and demand. integration of RES, storage, management and control
Copyright notices
©2017 mySMARTLife Consortium Partners. All rights reserved. mySMARTLife is a HORIZON2020 Project supported by the
European Commission under contract No.731297. For more information on the project, its partners and contributors, please see
the mySMARTLife website (www.mysmartlife.eu). You are permitted to copy and distribute verbatim copies of this document,
containing this copyright notice, but modifying this document is not allowed. All contents are reserved by default and may not be
disclosed to third parties without the written consent of the mySMARTLife partners, except as mandated by the European
Commission contract, for reviewing and dissemination purposes. All trademarks and other rights on third party products
mentioned in this document are acknowledged and owned by the respective holders. The information contained in this
document represents the views of mySMARTLife members as of the date they are published. The mySMARTLife consortium
does not guarantee that any information contained herein is error-free, or up-to-date, nor makes warranties, express, implied, or
statutory, by publishing this document.
22.11.2019 2 Doris Willmer (ENH) Reworking after review
27.11.2019 3 Kaja Aniol (HAW) Copyediting
27.11.2019 3.1 Joachim Lange (SNH) additions Chapter 6.2
28.11.2019 4 Doris Willmer (ENH) Final version
30.11.2019 5 CAR Final check
THIS
DEL
IVER
AB
LE H
AS
NO
T YE
T B
EEN
AP
PR
OV
ED B
Y TH
E EC
Page 4 Page 4 D3.4 Smart energy supply and demand. integration of RES, storage, management and control
Table of Content
1. Executive summary ............................................................................................................................................. 10
2. Introduction .......................................................................................................................................................... 11
2.1 Purpose and target group ........................................................................................................................... 11
2.2 Contribution of partners .............................................................................................................................. 11
2.3 Relation to other activities in the project ..................................................................................................... 12
3. Integration, performance and optimization of RES in the district heating and cooling network and buildings .... 14
3.1 Low-ex District Heating Island .................................................................................................................... 15
3.1.1 Task description ...................................................................................................................................... 15
3.1.2 The impact and the frame of the intervention in a smart city .................................................................. 17
3.1.3 Prerequisites ........................................................................................................................................... 19
3.1.4 Previous steps and actual Status ........................................................................................................... 20
3.1.5 Conclusion .............................................................................................................................................. 20
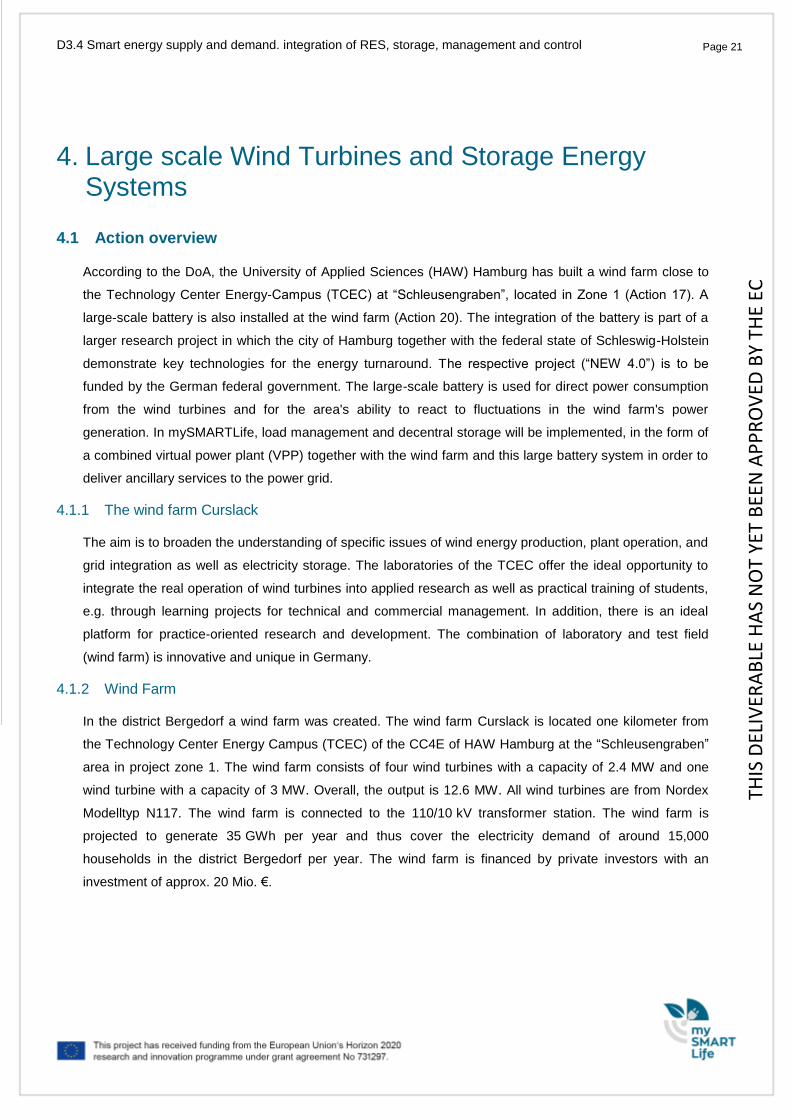
4. Large scale Wind Turbines and Storage Energy Systems .................................................................................. 21
4.1 Action overview ........................................................................................................................................... 21
4.1.1 The wind farm Curslack .......................................................................................................................... 21
4.1.2 Wind Farm............................................................................................................................................... 21
4.1.3 Large-scale battery ................................................................................................................................. 22
4.1.4 Research and Teaching .......................................................................................................................... 23
4.2 Specification of the wind turbines and Battery system ............................................................................... 24
4.3 Measurements and Results ........................................................................................................................ 27
4.3.1 Measurement of the Wind turbines from the test phase ......................................................................... 27
4.3.2 Measurements of the battery storage ..................................................................................................... 28
5. The roll of small-scale PV on Roofs in the Energy transition .............................................................................. 30
5.1 Task Description ......................................................................................................................................... 30
5.2 The impact and the frame of the interventions in the smart city ................................................................. 30
5.3 Prerequisites ............................................................................................................................................... 30
5.4 Previous steps and current status .............................................................................................................. 33
5.4.1 PV-project “Kampweg” ............................................................................................................................ 34
5.4.2 Further PV-projects with direct electricity power delivery ....................................................................... 36
5.4.3 Key Findings and the next steps ............................................................................................................. 39
5.5 Combination of PV-plant to support the climate handling with an ice-storage ........................................... 40
5.5.1 Task Deskription ..................................................................................................................................... 40
5.5.2 Examination of the entire period ............................................................................................................. 41
5.5.3 Investigation of maximum power consumption and maximum PV feed-in ............................................. 45
THIS
DEL
IVER
AB
LE H
AS
NO
T YE
T B
EEN
AP
PR
OV
ED B
Y TH
E EC
Page 5 Page 5 D3.4 Smart energy supply and demand. integration of RES, storage, management and control
5.5.4 Discussion of results ............................................................................................................................... 47
6. Current status of the management and control strategies (Action 9) .................................................................. 49
6.1 Task Deskription ......................................................................................................................................... 49
6.2 Prerequisites ............................................................................................................................................... 49
6.3 Current status ............................................................................................................................................. 50
6.4 Key Findings ............................................................................................................................................... 53
6.5 Next steps ................................................................................................................................................... 53
7. Innovative Buildings ............................................................................................................................................. 54
7.1 Smart home assistant living ........................................................................................................................ 54
7.1.1 Evolution of the Task .............................................................................................................................. 54
7.1.2 Stakeholders involved in this action ........................................................................................................ 56
7.1.3 Advantages and the roles of the different stakeholders ......................................................................... 57
7.1.4 Technical description .............................................................................................................................. 58
7.1.5 Financing of the implementation ............................................................................................................. 59
7.1.6 Implementation plan ................................................................................................................................ 60
7.1.7 Main challenges during the implementation ........................................................................................... 61
7.1.8 Conclusions and main benefits ............................................................................................................... 62
7.2 Smart metering ........................................................................................................................................... 63
7.2.1 Implementation of modern measuring devices and in-house Visualization ............................................ 63
7.2.2 Implementation of advanced measuring systems in the project area .................................................... 65
7.2.3 Implementation of multi metering in the project zone ............................................................................. 66
7.2.4 Conclusion Smart Metering..................................................................................................................... 67
8. Discussion of the results (till M36) ....................................................................................................................... 68
9. References .......................................................................................................................................................... 70
10. Appendix .......................................................................................................................................................... 72
THIS
DEL
IVER
AB
LE H
AS
NO
T YE
T B
EEN
AP
PR
OV
ED B
Y TH
E EC
Page 6 Page 6 D3.4 Smart energy supply and demand. integration of RES, storage, management and control
Table of Figures
Figure 3-1: Electricity power mix of Germany 1st half-year 2019, Source: Fraunhofer.ise ........................................ 14
Figure 3-2, Energy sources for heat consumption, Source: Umweltbundesamt (Federal Environment Agency) ...... 15
Figure 3-3: Storage in construction, source: ENH/Naturstrom ................................................................................... 16
Figure 3-4: CO2-free supply of commercial buildings and residential buildings, source: ENH/Naturstrom ............... 17
Figure 3-5, Project area “Schleusengraben” with the low-ex area “Schilfpark” .......................................................... 18
Figure 3-6, “Schilfpark”-Quarter at “Schleusengraben”, residential (blue), business (green), Fraunhofer (yellow) ... 19
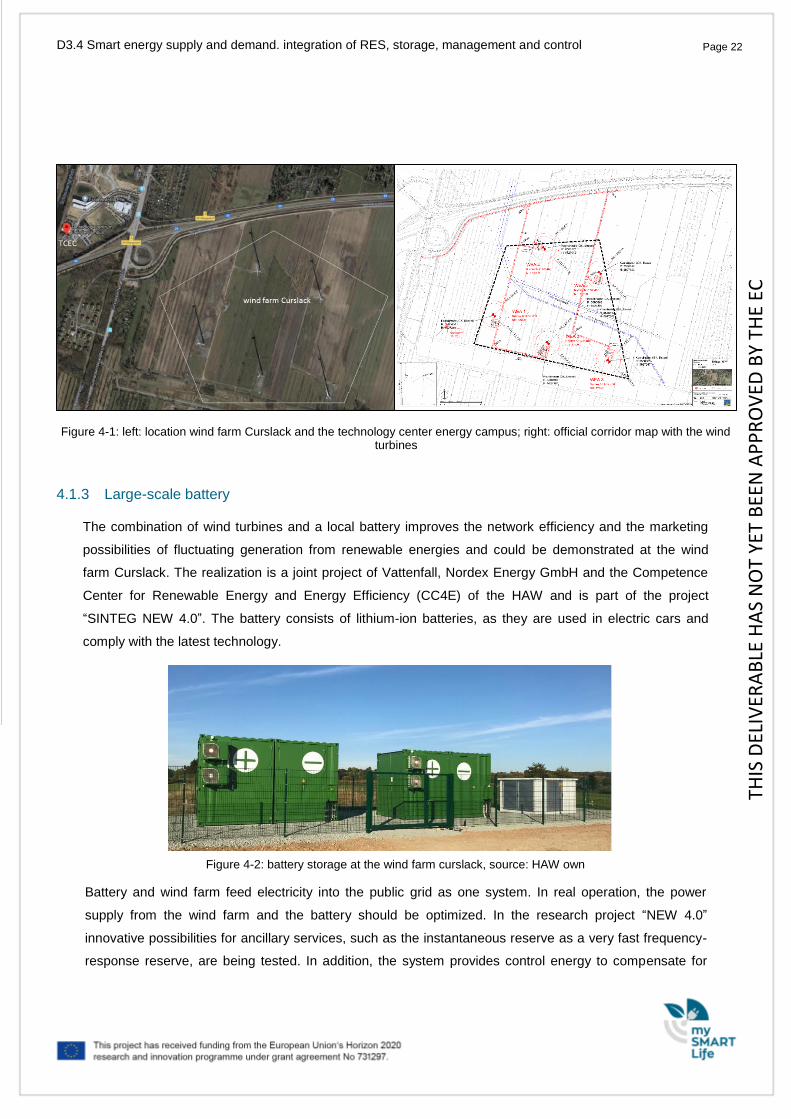
Figure 4-1: left: location wind farm Curslack and the technology center energy campus; right: official corridor map
with the wind turbines ................................................................................................................................................. 22
Figure 4-2: battery storage at the wind farm curslack, source: HAW own ................................................................. 22
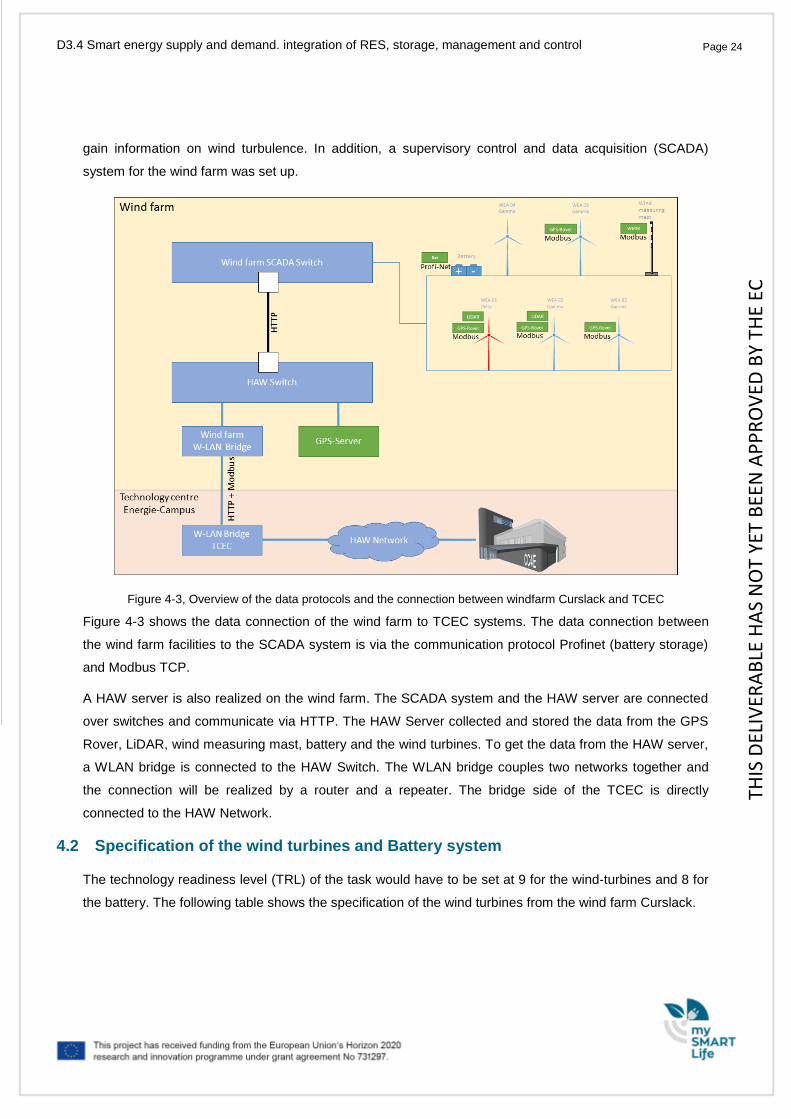
Figure 4-3, Overview of the data protocols and the connection between windfarm Curslack and TCEC .................. 24
Figure 4-4: electricity generation of the wind farm Curslack in the test phase ........................................................... 28
Figure 4-5: Active Power Measurement on the battery .............................................................................................. 29
Figure 4-6: state of charge of a battery in container one ............................................................................................ 29
Figure 5-1: Suitable and unfitted roof tops – source ENH .......................................................................................... 31
Figure 5-2: Concept of electricity tenant power supply – source: ENH-own .............................................................. 32
Figure 5-3: Extract from the risk analysis in Deliverable 8.6, source: ENH own ........................................................ 33
Figure 5-4: Screenshot of the “Solar-Atlas Hamburg”, Source: https://www.geoportal-
hamburg.de/Solaratlas/index.html# ............................................................................................................................ 34
Figure 5-5: Header of BEST No.6-Kampweg, source: ENH ....................................................................................... 35
Figure 5-6: PV-modules on the roof Kampweg 4, source: ENH ................................................................................. 35
Figure 5-7: PV-plant Ochsenwerder just before completion, Foto Clen Solar ........................................................... 36
Figure 5-8: Apiculture "Ochsenwerder, source: ENH/Map Google ............................................................................ 37
Figure 5-9: Installation plan of the PV-plant organic bakery, source: Clen solar (solar technician) ........................... 38
Figure 5-10: Organic Bakery Am Stadtrand, source: ENH/Map Google .................................................................... 39
Figure 5-11: Overview screen, 3D planning, source: hellosun (Solarteur) ................................................................. 40
Figure 5-12: GALAB power consumption (source: own) ............................................................................................ 42
Figure 5-13: Use of monocrystalline silicon solar cells (source: own) ........................................................................ 42
Figure 5-14: Use of copper indium selenium solar cells (source: own) ...................................................................... 43
Figure 5-15: Use of cadmium telluride solar cells (source: own) ................................................................................ 44
Figure 5-16: Use of polycrystalline silicon solar cells (source: own) .......................................................................... 44
Figure 5-17, Maximal GALAB Power compared to PV Power input (source: own) .................................................... 45
Figure 5-18: Day of maximal GALAB Power compared to max PV Power (source: own) ......................................... 46
Figure 5-19, GALAB Power compared to maximal PV Power input (source: own) .................................................... 47
Figure 6-1: mySMARTLife Open Urban platform with its architecture parts and its integration ................................. 50
THIS
DEL
IVER
AB
LE H
AS
NO
T YE
T B
EEN
AP
PR
OV
ED B
Y TH
E EC
Page 7 Page 7 D3.4 Smart energy supply and demand. integration of RES, storage, management and control
Figure 6-2: Landing page with anomaly detection status ........................................................................................... 51
Figure 6-3: Status of Electricity House Connection .................................................................................................... 51
Figure 6-4: Status of Photovoltaic system .................................................................................................................. 52
Figure 6-5: Status of Combined Heat and Power Plant.............................................................................................. 53
Figure 7-1: Location of the Bergedorf-Bille retirement complex at Leuschnerstraße 83a-f nearby the main
mySMARTLife project area in Hamburg-Bergedorf, source: FHH-Atlas. ................................................................... 55
Figure 7-2: Impressions of the retirement complex at Leuschnerstraße 83a-f and a sample floor plan of a 2-room
apartment, source: Bergedorf-Bille ............................................................................................................................. 56
Figure 7-3: Scheme of stakholders involved in the implementaton of the smart home systems, source: Borough of
Bergedorf, own source. ............................................................................................................................................... 57
Figure 7-4: Example of a smart home set from casenio, source Casenio.................................................................. 59
Figure 7-5: Information event at a local community centre of the housing cooperation, source: Borough of
Bergedorf. ................................................................................................................................................................... 60
Figure 7-6: Development and implementation scheme of the smart home action with the main contributions by the
stakeholders (source: Borough of Bergedorf, own source). ....................................................................................... 61
Figure 7-7: the display of the modern measuring device, source: SNH ..................................................................... 64
Figure 7-8: technology of the in-house Visualisation , source: SNH .......................................................................... 64
Figure 7-9: Short-time and Long-time History, source: SNH ...................................................................................... 65
Figure 7-10, advanced measuring system, source: SNH ........................................................................................... 66
Figure 7-11: system functionality of multi metering system ........................................................................................ 66
THIS
DEL
IVER
AB
LE H
AS
NO
T YE
T B
EEN
AP
PR
OV
ED B
Y TH
E EC
Page 8 Page 8 D3.4 Smart energy supply and demand. integration of RES, storage, management and control
Table of Tables
Table 2-1: Contribution of partners ............................................................................................................................. 11
Table 2-2: Relation to other activities in the project .................................................................................................... 12
Table 4-1, Technical specifications N117/2400 IEC 3a .............................................................................................. 25
Table 4-2, Technical specifications N117/3000 IEC 3a .............................................................................................. 26
Table 4-3, Technical specifications Battery System ................................................................................................... 27
Table 5-1: Specification of the PV-plant Kampweg .................................................................................................... 35
Table 5-2: Specification of the PV-plant Ochsenwerder ............................................................................................. 37
Table 5-3: Specification of the PV-plant Organic Bakery ........................................................................................... 38
Table 5-4: Specification of the PV-plant laboratory Schleusengraben ....................................................................... 41
Table 10-1: Solar irradiation data Hamburg Demonstration Site of potential Analysis .............................................. 72
THIS
DEL
IVER
AB
LE H
AS
NO
T YE
T B
EEN
AP
PR
OV
ED B
Y TH
E EC
Page 9 Page 9 D3.4 Smart energy supply and demand. integration of RES, storage, management and control
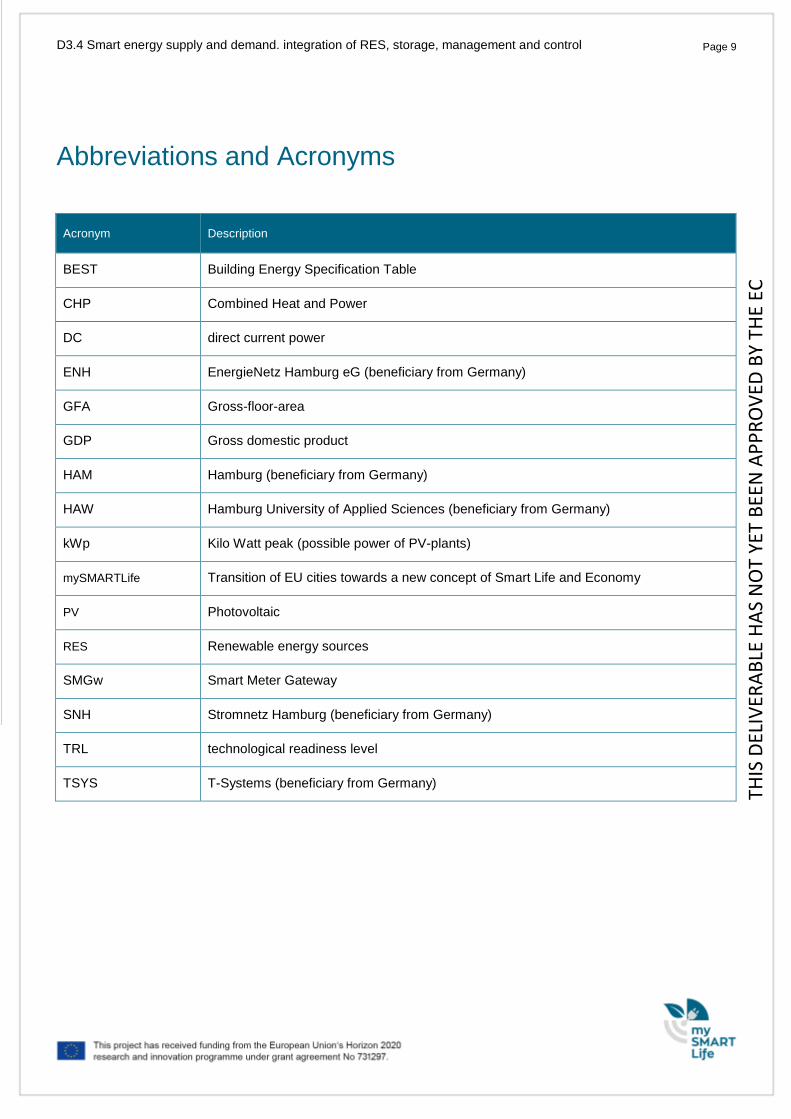
Abbreviations and Acronyms
Acronym Description
BEST Building Energy Specification Table
CHP Combined Heat and Power
DC direct current power
ENH EnergieNetz Hamburg eG (beneficiary from Germany)
GFA Gross-floor-area
GDP Gross domestic product
HAM Hamburg (beneficiary from Germany)
HAW Hamburg University of Applied Sciences (beneficiary from Germany)
kWp Kilo Watt peak (possible power of PV-plants)
mySMARTLife Transition of EU cities towards a new concept of Smart Life and Economy
PV Photovoltaic
RES Renewable energy sources
SMGw Smart Meter Gateway
SNH Stromnetz Hamburg (beneficiary from Germany)
TRL technological readiness level
TSYS T-Systems (beneficiary from Germany)
THIS
DEL
IVER
AB
LE H
AS
NO
T YE
T B
EEN
AP
PR
OV
ED B
Y TH
E EC
Page 10 Page 10 D3.4 Smart energy supply and demand. integration of RES, storage, management and control
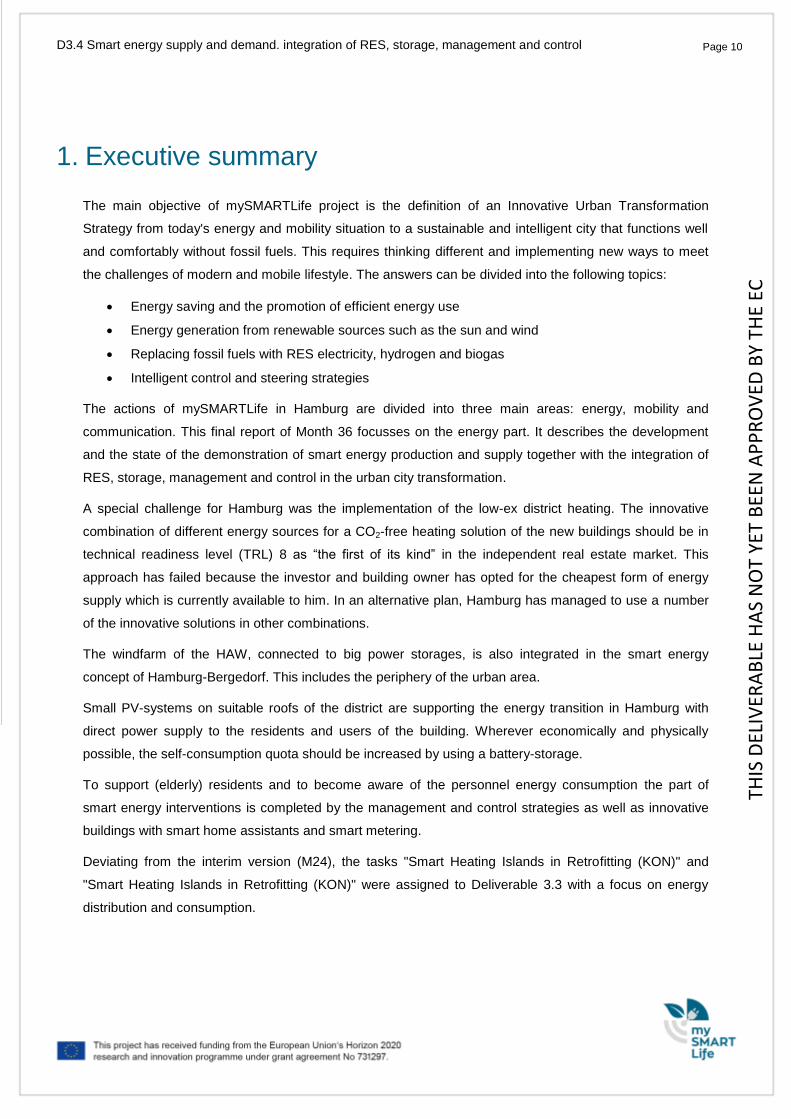
1. Executive summary
The main objective of mySMARTLife project is the definition of an Innovative Urban Transformation
Strategy from today's energy and mobility situation to a sustainable and intelligent city that functions well
and comfortably without fossil fuels. This requires thinking different and implementing new ways to meet
the challenges of modern and mobile lifestyle. The answers can be divided into the following topics:
Energy saving and the promotion of efficient energy use
Energy generation from renewable sources such as the sun and wind
Replacing fossil fuels with RES electricity, hydrogen and biogas
Intelligent control and steering strategies
The actions of mySMARTLife in Hamburg are divided into three main areas: energy, mobility and
communication. This final report of Month 36 focusses on the energy part. It describes the development
and the state of the demonstration of smart energy production and supply together with the integration of
RES, storage, management and control in the urban city transformation.
A special challenge for Hamburg was the implementation of the low-ex district heating. The innovative
combination of different energy sources for a CO2-free heating solution of the new buildings should be in
technical readiness level (TRL) 8 as “the first of its kind” in the independent real estate market. This
approach has failed because the investor and building owner has opted for the cheapest form of energy
supply which is currently available to him. In an alternative plan, Hamburg has managed to use a number
of the innovative solutions in other combinations.
The windfarm of the HAW, connected to big power storages, is also integrated in the smart energy
concept of Hamburg-Bergedorf. This includes the periphery of the urban area.
Small PV-systems on suitable roofs of the district are supporting the energy transition in Hamburg with
direct power supply to the residents and users of the building. Wherever economically and physically
possible, the self-consumption quota should be increased by using a battery-storage.
To support (elderly) residents and to become aware of the personnel energy consumption the part of
smart energy interventions is completed by the management and control strategies as well as innovative
buildings with smart home assistants and smart metering.
Deviating from the interim version (M24), the tasks "Smart Heating Islands in Retrofitting (KON)" and
"Smart Heating Islands in Retrofitting (KON)" were assigned to Deliverable 3.3 with a focus on energy
distribution and consumption.
THIS
DEL
IVER
AB
LE H
AS
NO
T YE
T B
EEN
AP
PR
OV
ED B
Y TH
E EC
Page 11 Page 11 D3.4 Smart energy supply and demand. integration of RES, storage, management and control
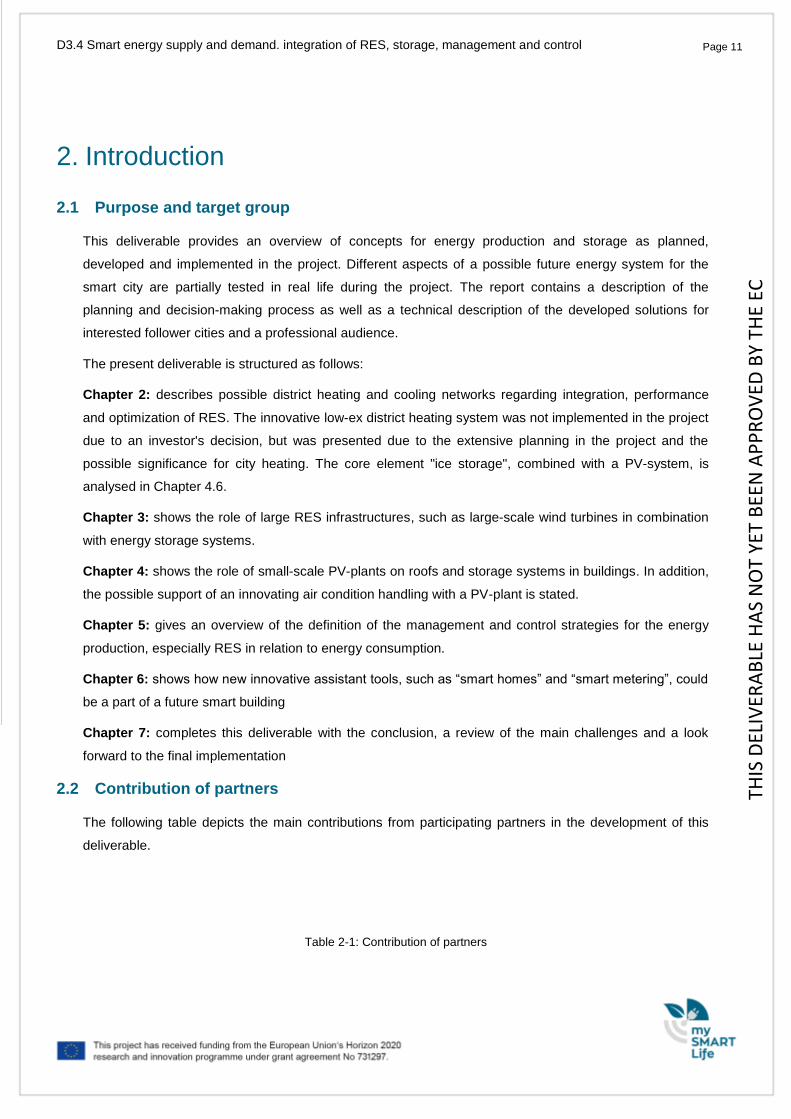
2. Introduction
2.1 Purpose and target group
This deliverable provides an overview of concepts for energy production and storage as planned,
developed and implemented in the project. Different aspects of a possible future energy system for the
smart city are partially tested in real life during the project. The report contains a description of the
planning and decision-making process as well as a technical description of the developed solutions for
interested follower cities and a professional audience.
The present deliverable is structured as follows:
Chapter 2: describes possible district heating and cooling networks regarding integration, performance
and optimization of RES. The innovative low-ex district heating system was not implemented in the project
due to an investor's decision, but was presented due to the extensive planning in the project and the
possible significance for city heating. The core element "ice storage", combined with a PV-system, is
analysed in Chapter 4.6.
Chapter 3: shows the role of large RES infrastructures, such as large-scale wind turbines in combination
with energy storage systems.
Chapter 4: shows the role of small-scale PV-plants on roofs and storage systems in buildings. In addition,
the possible support of an innovating air condition handling with a PV-plant is stated.
Chapter 5: gives an overview of the definition of the management and control strategies for the energy
production, especially RES in relation to energy consumption.
Chapter 6: shows how new innovative assistant tools, such as “smart homes” and “smart metering”, could
be a part of a future smart building
Chapter 7: completes this deliverable with the conclusion, a review of the main challenges and a look
forward to the final implementation
2.2 Contribution of partners
The following table depicts the main contributions from participating partners in the development of this
deliverable.
Table 2-1: Contribution of partners
THIS
DEL
IVER
AB
LE H
AS
NO
T YE
T B
EEN
AP
PR
OV
ED B
Y TH
E EC
Page 12 Page 12 D3.4 Smart energy supply and demand. integration of RES, storage, management and control
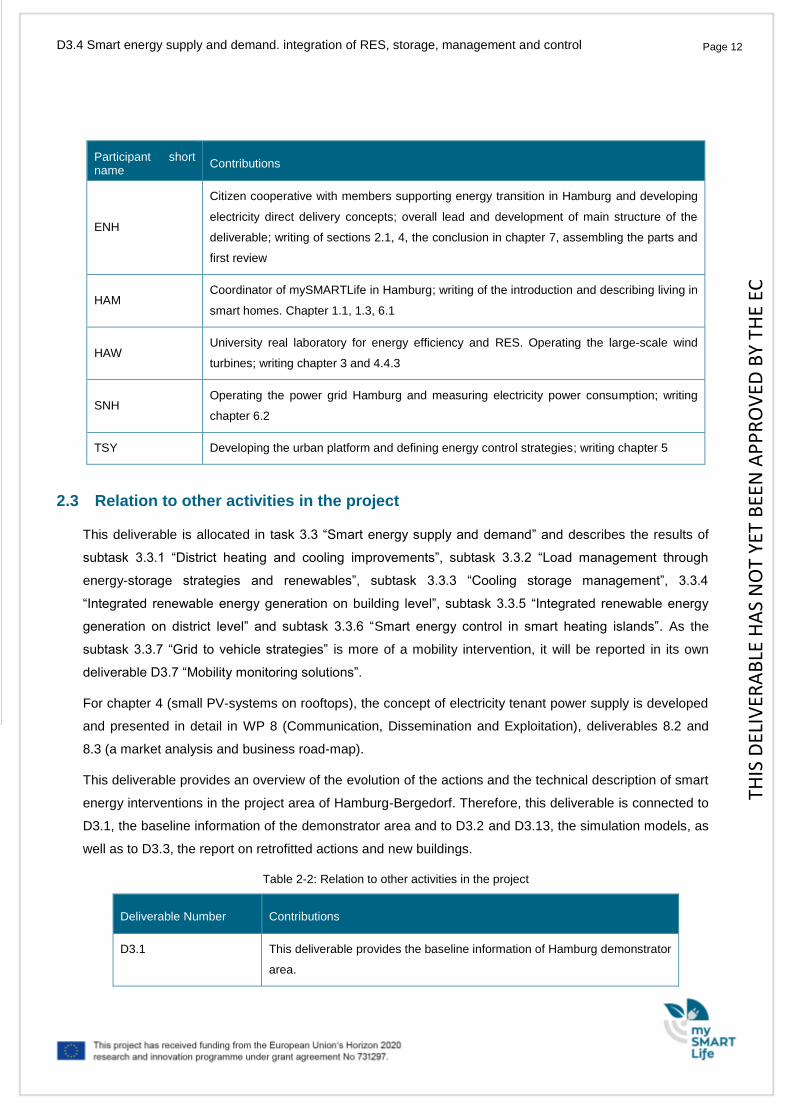
Participant short name
Contributions
ENH
Citizen cooperative with members supporting energy transition in Hamburg and developing
electricity direct delivery concepts; overall lead and development of main structure of the
deliverable; writing of sections 2.1, 4, the conclusion in chapter 7, assembling the parts and
first review
HAM Coordinator of mySMARTLife in Hamburg; writing of the introduction and describing living in
smart homes. Chapter 1.1, 1.3, 6.1
HAW University real laboratory for energy efficiency and RES. Operating the large-scale wind
turbines; writing chapter 3 and 4.4.3
SNH Operating the power grid Hamburg and measuring electricity power consumption; writing
chapter 6.2
TSY Developing the urban platform and defining energy control strategies; writing chapter 5
2.3 Relation to other activities in the project
This deliverable is allocated in task 3.3 “Smart energy supply and demand” and describes the results of
subtask 3.3.1 “District heating and cooling improvements”, subtask 3.3.2 “Load management through
energy-storage strategies and renewables”, subtask 3.3.3 “Cooling storage management”, 3.3.4
“Integrated renewable energy generation on building level”, subtask 3.3.5 “Integrated renewable energy
generation on district level” and subtask 3.3.6 “Smart energy control in smart heating islands”. As the
subtask 3.3.7 “Grid to vehicle strategies” is more of a mobility intervention, it will be reported in its own
deliverable D3.7 “Mobility monitoring solutions”.
For chapter 4 (small PV-systems on rooftops), the concept of electricity tenant power supply is developed
and presented in detail in WP 8 (Communication, Dissemination and Exploitation), deliverables 8.2 and
8.3 (a market analysis and business road-map).
This deliverable provides an overview of the evolution of the actions and the technical description of smart
energy interventions in the project area of Hamburg-Bergedorf. Therefore, this deliverable is connected to
D3.1, the baseline information of the demonstrator area and to D3.2 and D3.13, the simulation models, as
well as to D3.3, the report on retrofitted actions and new buildings.
Table 2-2: Relation to other activities in the project
Deliverable Number Contributions
D3.1 This deliverable provides the baseline information of Hamburg demonstrator
area.
THIS
DEL
IVER
AB
LE H
AS
NO
T YE
T B
EEN
AP
PR
OV
ED B
Y TH
E EC
Page 13 Page 13 D3.4 Smart energy supply and demand. integration of RES, storage, management and control
D3.2 and D3.13 This deliverable provides the description of the baseline report of Hamburg
and the simulation models of the building stock, energy systems,
transportation and urban infrastructure.
D3.3 Report on retrofitted actions and implemented actions new buildings
including RES and storages in Hamburg
D8.2 Technology and market supervision activities / Market analysis
D8.3 Report on business cases and business models / Business road-map
THIS
DEL
IVER
AB
LE H
AS
NO
T YE
T B
EEN
AP
PR
OV
ED B
Y TH
E EC
Page 14 Page 14 D3.4 Smart energy supply and demand. integration of RES, storage, management and control
3. Integration, performance and optimization of RES in the district heating and cooling network and buildings
While the energy transition in the section of electricity power production with renewable energies is
already well advanced, the fossil-free and, thus, not climate damaging heat generation is still in its infancy.
For this reason, particularly innovative and promising solutions have been planned for heat generation.
The overall objectives of this concept are the optimization and the integration of RES in the district
temperature management of business and residential building to find new ways of heating and cooling in
the city development. The conceptual approach should use the partial new construction within urban
conversion areas as a nucleus for the transformation primary of urban housing districts. The networking of
actors at district level (between the municipalities, public and private companies, citizens and civil society)
should enable the implementation of the technically innovative energy concept.
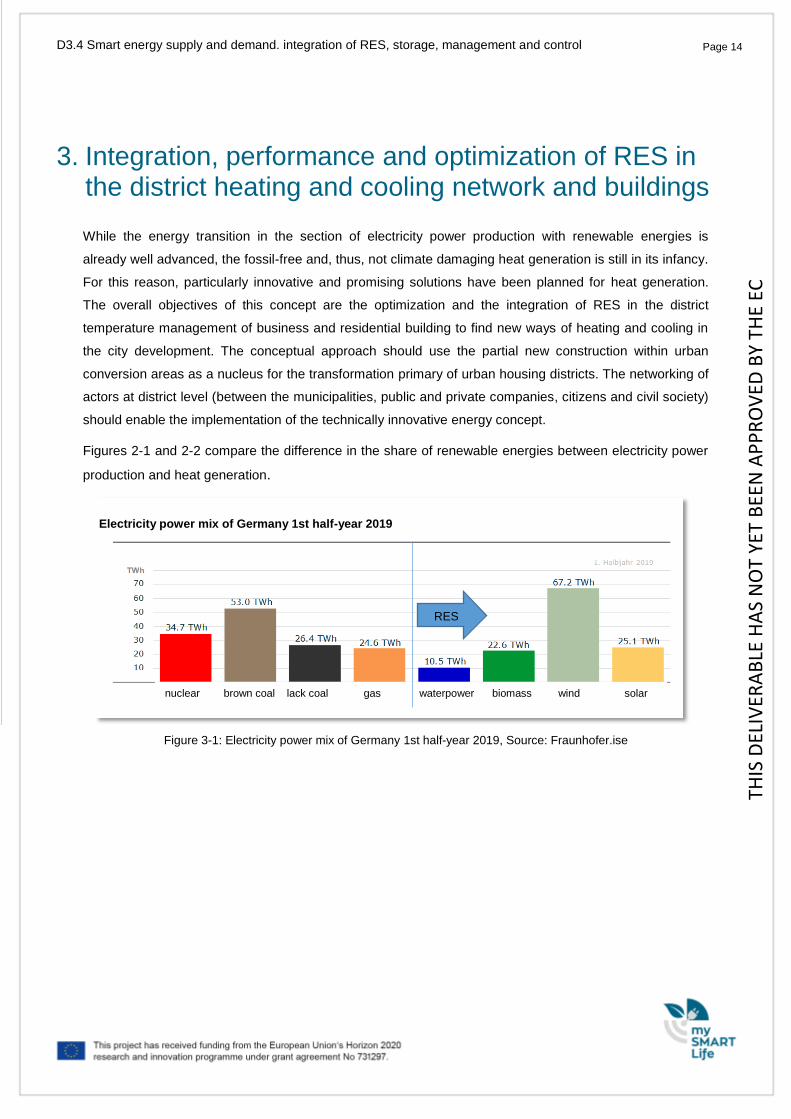
Figures 2-1 and 2-2 compare the difference in the share of renewable energies between electricity power
production and heat generation.
Figure 3-1: Electricity power mix of Germany 1st half-year 2019, Source: Fraunhofer.ise
nuclear brown coal lack coal gas waterpower biomass wind solar
Electricity power mix of Germany 1st half-year 2019
RES
THIS
DEL
IVER
AB
LE H
AS
NO
T YE
T B
EEN
AP
PR
OV
ED B
Y TH
E EC
Page 15 Page 15 D3.4 Smart energy supply and demand. integration of RES, storage, management and control
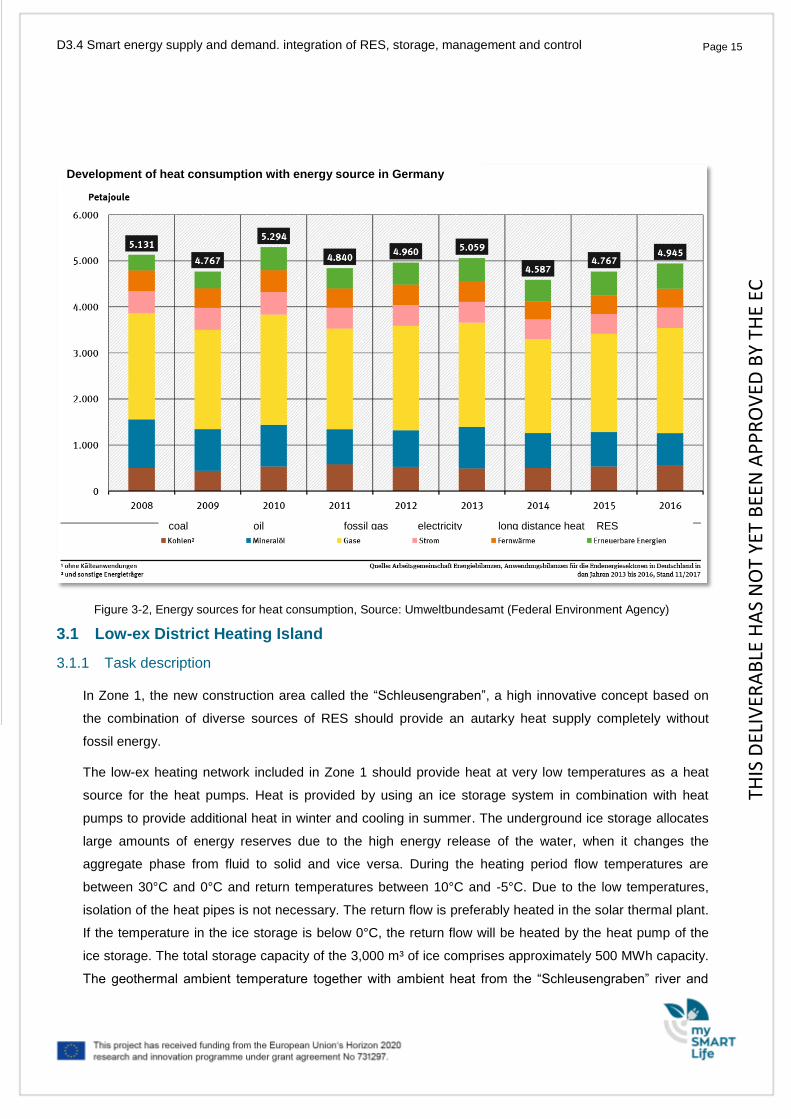
Figure 3-2, Energy sources for heat consumption, Source: Umweltbundesamt (Federal Environment Agency)
3.1 Low-ex District Heating Island
3.1.1 Task description
In Zone 1, the new construction area called the “Schleusengraben”, a high innovative concept based on
the combination of diverse sources of RES should provide an autarky heat supply completely without
fossil energy.
The low-ex heating network included in Zone 1 should provide heat at very low temperatures as a heat
source for the heat pumps. Heat is provided by using an ice storage system in combination with heat
pumps to provide additional heat in winter and cooling in summer. The underground ice storage allocates
large amounts of energy reserves due to the high energy release of the water, when it changes the
aggregate phase from fluid to solid and vice versa. During the heating period flow temperatures are
between 30°C and 0°C and return temperatures between 10°C and -5°C. Due to the low temperatures,
isolation of the heat pipes is not necessary. The return flow is preferably heated in the solar thermal plant.
If the temperature in the ice storage is below 0°C, the return flow will be heated by the heat pump of the
ice storage. The total storage capacity of the 3,000 m³ of ice comprises approximately 500 MWh capacity.
The geothermal ambient temperature together with ambient heat from the “Schleusengraben” river and
Development of heat consumption with energy source in Germany
coal oil fossil gas electricity long distance heat RES
THIS
DEL
IVER
AB
LE H
AS
NO
T YE
T B
EEN
AP
PR
OV
ED B
Y TH
E EC
Page 16 Page 16 D3.4 Smart energy supply and demand. integration of RES, storage, management and control
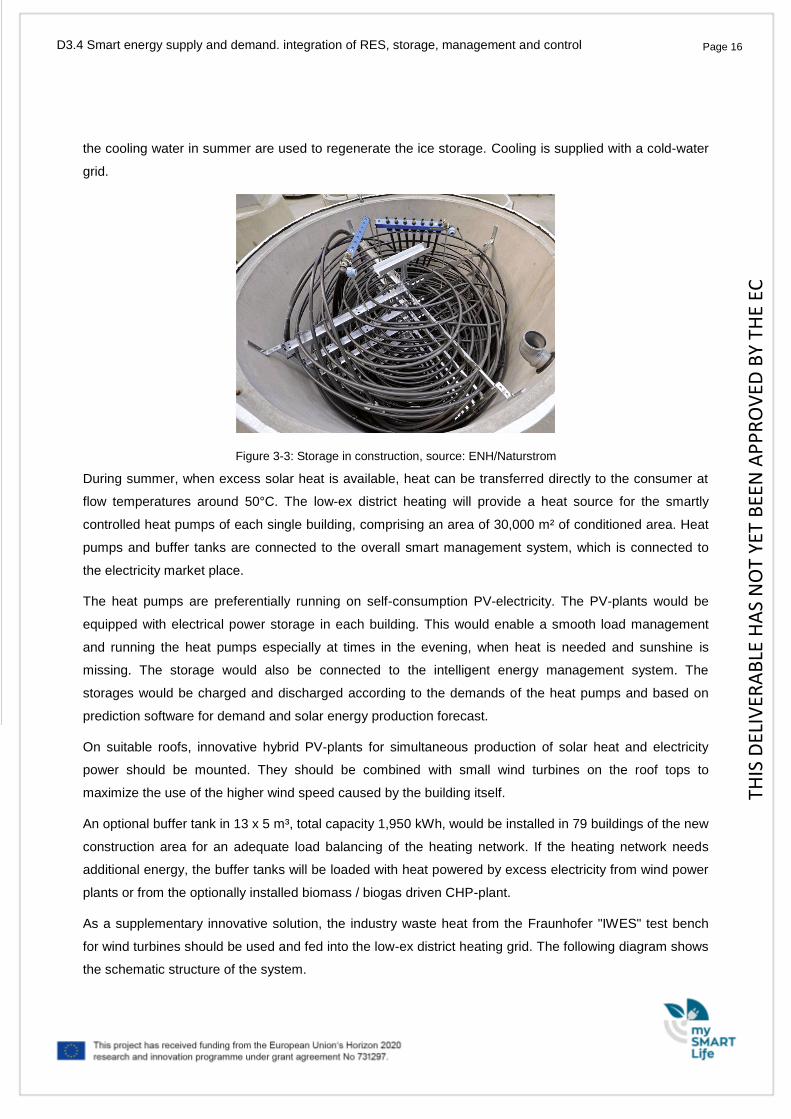
the cooling water in summer are used to regenerate the ice storage. Cooling is supplied with a cold-water
grid.
Figure 3-3: Storage in construction, source: ENH/Naturstrom
During summer, when excess solar heat is available, heat can be transferred directly to the consumer at
flow temperatures around 50°C. The low-ex district heating will provide a heat source for the smartly
controlled heat pumps of each single building, comprising an area of 30,000 m² of conditioned area. Heat
pumps and buffer tanks are connected to the overall smart management system, which is connected to
the electricity market place.
The heat pumps are preferentially running on self-consumption PV-electricity. The PV-plants would be
equipped with electrical power storage in each building. This would enable a smooth load management
and running the heat pumps especially at times in the evening, when heat is needed and sunshine is
missing. The storage would also be connected to the intelligent energy management system. The
storages would be charged and discharged according to the demands of the heat pumps and based on
prediction software for demand and solar energy production forecast.
On suitable roofs, innovative hybrid PV-plants for simultaneous production of solar heat and electricity
power should be mounted. They should be combined with small wind turbines on the roof tops to
maximize the use of the higher wind speed caused by the building itself.
An optional buffer tank in 13 x 5 m³, total capacity 1,950 kWh, would be installed in 79 buildings of the new
construction area for an adequate load balancing of the heating network. If the heating network needs
additional energy, the buffer tanks will be loaded with heat powered by excess electricity from wind power
plants or from the optionally installed biomass / biogas driven CHP-plant.
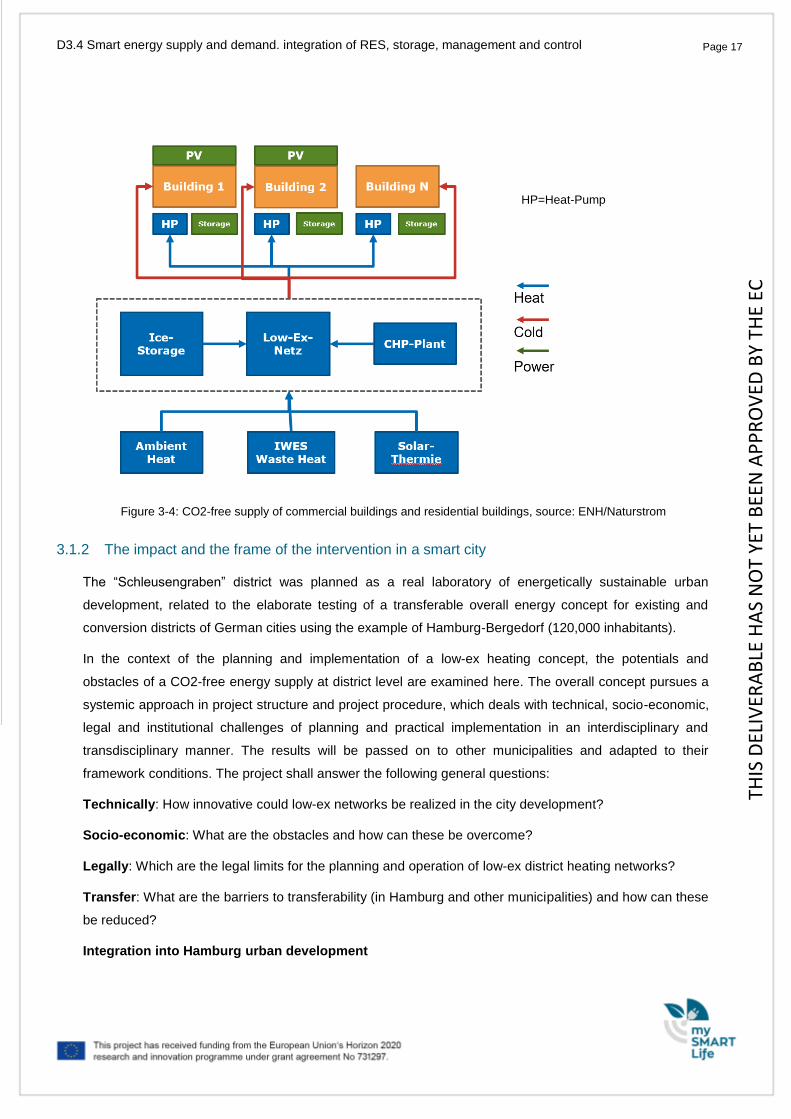
As a supplementary innovative solution, the industry waste heat from the Fraunhofer "IWES" test bench
for wind turbines should be used and fed into the low-ex district heating grid. The following diagram shows
the schematic structure of the system.
THIS
DEL
IVER
AB
LE H
AS
NO
T YE
T B
EEN
AP
PR
OV
ED B
Y TH
E EC
Page 17 Page 17 D3.4 Smart energy supply and demand. integration of RES, storage, management and control
Figure 3-4: CO2-free supply of commercial buildings and residential buildings, source: ENH/Naturstrom
3.1.2 The impact and the frame of the intervention in a smart city
The “Schleusengraben” district was planned as a real laboratory of energetically sustainable urban
development, related to the elaborate testing of a transferable overall energy concept for existing and
conversion districts of German cities using the example of Hamburg-Bergedorf (120,000 inhabitants).
In the context of the planning and implementation of a low-ex heating concept, the potentials and
obstacles of a CO2-free energy supply at district level are examined here. The overall concept pursues a
systemic approach in project structure and project procedure, which deals with technical, socio-economic,
legal and institutional challenges of planning and practical implementation in an interdisciplinary and
transdisciplinary manner. The results will be passed on to other municipalities and adapted to their
framework conditions. The project shall answer the following general questions:
Technically: How innovative could low-ex networks be realized in the city development?
Socio-economic: What are the obstacles and how can these be overcome?
Legally: Which are the legal limits for the planning and operation of low-ex district heating networks?
Transfer: What are the barriers to transferability (in Hamburg and other municipalities) and how can these
be reduced?
Integration into Hamburg urban development
HP=Heat-Pump
THIS
DEL
IVER
AB
LE H
AS
NO
T YE
T B
EEN
AP
PR
OV
ED B
Y TH
E EC
Page 18 Page 18 D3.4 Smart energy supply and demand. integration of RES, storage, management and control
The population of the Free and Hanseatic City of Hamburg will continue to grow until 2030 (Statistikamt
Nord 2015). The city of Hamburg relies on sustainable, inward urban development (FHH 2014a). The city
is aiming for a more efficient use of land within the existing development landscape and a promotion of the
energy transition, nature and climate protection (FHH 2015, 2014a). Three goals are crucial for the
Hamburg energy transition: Increasing energy efficiency, expanding and refurbishing existing energy
networks, including heat supply, and expanding renewable energies (FHH 2014b). The aim of the urban
planning at “Schleusengraben" district is to convert the district, shaped by trade and industry in recent
centuries, into a lively urban district (Mecanoo Architects et al., 2010).
In this way, the development areas along the “Schleusengraben” river are a reference point for the climate
protection concept of the Hamburg-Bergedorf district.
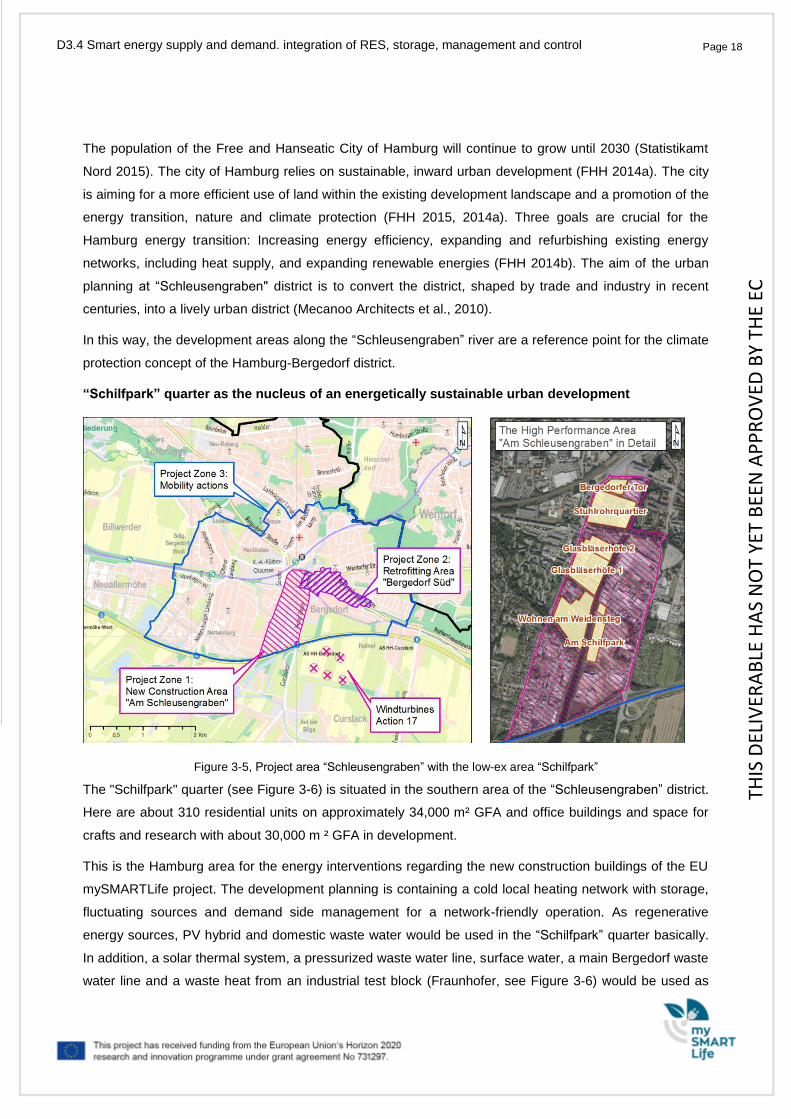
“Schilfpark” quarter as the nucleus of an energetically sustainable urban development
Figure 3-5, Project area “Schleusengraben” with the low-ex area “Schilfpark”
The "Schilfpark" quarter (see Figure 3-6) is situated in the southern area of the “Schleusengraben” district.
Here are about 310 residential units on approximately 34,000 m² GFA and office buildings and space for
crafts and research with about 30,000 m ² GFA in development.
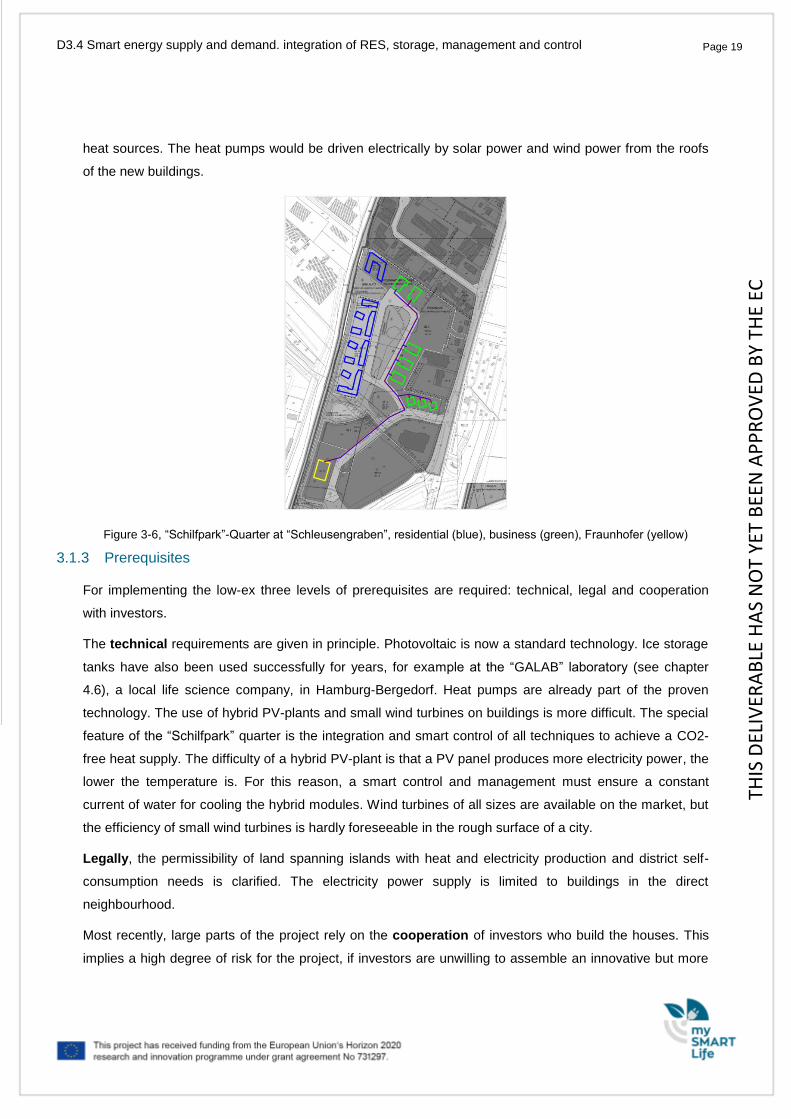
This is the Hamburg area for the energy interventions regarding the new construction buildings of the EU
mySMARTLife project. The development planning is containing a cold local heating network with storage,
fluctuating sources and demand side management for a network-friendly operation. As regenerative
energy sources, PV hybrid and domestic waste water would be used in the “Schilfpark” quarter basically.
In addition, a solar thermal system, a pressurized waste water line, surface water, a main Bergedorf waste
water line and a waste heat from an industrial test block (Fraunhofer, see Figure 3-6) would be used as
THIS
DEL
IVER
AB
LE H
AS
NO
T YE
T B
EEN
AP
PR
OV
ED B
Y TH
E EC
Page 19 Page 19 D3.4 Smart energy supply and demand. integration of RES, storage, management and control
heat sources. The heat pumps would be driven electrically by solar power and wind power from the roofs
of the new buildings.
Figure 3-6, “Schilfpark”-Quarter at “Schleusengraben”, residential (blue), business (green), Fraunhofer (yellow)
3.1.3 Prerequisites
For implementing the low-ex three levels of prerequisites are required: technical, legal and cooperation
with investors.
The technical requirements are given in principle. Photovoltaic is now a standard technology. Ice storage
tanks have also been used successfully for years, for example at the “GALAB” laboratory (see chapter
4.6), a local life science company, in Hamburg-Bergedorf. Heat pumps are already part of the proven
technology. The use of hybrid PV-plants and small wind turbines on buildings is more difficult. The special
feature of the “Schilfpark” quarter is the integration and smart control of all techniques to achieve a CO2-
free heat supply. The difficulty of a hybrid PV-plant is that a PV panel produces more electricity power, the
lower the temperature is. For this reason, a smart control and management must ensure a constant
current of water for cooling the hybrid modules. Wind turbines of all sizes are available on the market, but
the efficiency of small wind turbines is hardly foreseeable in the rough surface of a city.
Legally, the permissibility of land spanning islands with heat and electricity production and district self-
consumption needs is clarified. The electricity power supply is limited to buildings in the direct
neighbourhood.
Most recently, large parts of the project rely on the cooperation of investors who build the houses. This
implies a high degree of risk for the project, if investors are unwilling to assemble an innovative but more
THIS
DEL
IVER
AB
LE H
AS
NO
T YE
T B
EEN
AP
PR
OV
ED B
Y TH
E EC
Page 20 Page 20 D3.4 Smart energy supply and demand. integration of RES, storage, management and control
expensive heating technology for climate protection, but decide to implement a cheap solution. Exactly
this point led to failing of the low-ex district heating in mySMARTLife.
3.1.4 Previous steps and actual Status
ENH has dealt intensively with the innovative concept of the hybrid PV and small wind turbines.
Unfortunately, the whole intervention depends on the decision of the investor. ENH has been engaged in
intensive negotiations with the investors of the new residential and commercial buildings to convince them
of the innovative concept of combining several kinds of renewable energy. However, at least the investors
decided against the low-ex temperature district heating with Bio-methane CHP as well as solar energy and
preferred a cheap standard heating system based on cheap natural gas heating solutions. Such an
innovative system, as planned, cannot match up with the low costs of a gas-fired heating plant and public
funding.
Heat pumps were planned to be part of the low-ex district heating concept in order to regulate the heat
temperature within the buildings. In addition, Hybrid PV was supposed to produce additional heat as well
as the power to run the heat pumps. In sunless times the heat pumps of the low-ex heating would be
provided with power by the wind turbines. The combination of locally installed wind turbines and hybrid PV
to compensate the power used by the heat pumps on hot sunny days, would be the innovative and
performance-enhancing way for a well-balanced and completely fossil-free heat and power plant. The
combination distributes the hot water for use and thus ensures the cooling of the modules for an efficient
power production.
ENH examined intensively the possibility of the use of wind energy by small wind turbines in the building
area. This included a screening of the usable wind strengths, the average and the maximum wind speed.
In addition, a market analysis of the producers of wind turbines and suitable small-wind turbines was
carried out.
The analysis of the overall situation after the final rejection of the low-ex heating shows that the
implementation of the small wind turbines is no longer meaningfully. In addition, the investor refuses to
use his roofs to install RES in any form. So, this whole intervention cannot be addressed.
3.1.5 Conclusion
As described above, the implementation of such an innovative and carbon-free heating solution instead of
standard is much more expensive and more complicated in maintenance. It needs an investor highly
committed in climate protection to realize such purposes. The Hamburg consortium has developed an
alternative plan for innovative heating islands, which, as a new and innovative technology, stores
hydrogen in the natural gas network and uses it with a high level of admixture with natural gas in CHP
plants. This action is described in Deliverable 3.3.
THIS
DEL
IVER
AB
LE H
AS
NO
T YE
T B
EEN
AP
PR
OV
ED B
Y TH
E EC
Page 21 Page 21 D3.4 Smart energy supply and demand. integration of RES, storage, management and control
4. Large scale Wind Turbines and Storage Energy Systems
4.1 Action overview
According to the DoA, the University of Applied Sciences (HAW) Hamburg has built a wind farm close to
the Technology Center Energy-Campus (TCEC) at “Schleusengraben”, located in Zone 1 (Action 17). A
large-scale battery is also installed at the wind farm (Action 20). The integration of the battery is part of a
larger research project in which the city of Hamburg together with the federal state of Schleswig-Holstein
demonstrate key technologies for the energy turnaround. The respective project (“NEW 4.0”) is to be
funded by the German federal government. The large-scale battery is used for direct power consumption
from the wind turbines and for the area's ability to react to fluctuations in the wind farm's power
generation. In mySMARTLife, load management and decentral storage will be implemented, in the form of
a combined virtual power plant (VPP) together with the wind farm and this large battery system in order to
deliver ancillary services to the power grid.
4.1.1 The wind farm Curslack
The aim is to broaden the understanding of specific issues of wind energy production, plant operation, and
grid integration as well as electricity storage. The laboratories of the TCEC offer the ideal opportunity to
integrate the real operation of wind turbines into applied research as well as practical training of students,
e.g. through learning projects for technical and commercial management. In addition, there is an ideal
platform for practice-oriented research and development. The combination of laboratory and test field
(wind farm) is innovative and unique in Germany.
4.1.2 Wind Farm
In the district Bergedorf a wind farm was created. The wind farm Curslack is located one kilometer from
the Technology Center Energy Campus (TCEC) of the CC4E of HAW Hamburg at the “Schleusengraben”
area in project zone 1. The wind farm consists of four wind turbines with a capacity of 2.4 MW and one
wind turbine with a capacity of 3 MW. Overall, the output is 12.6 MW. All wind turbines are from Nordex
Modelltyp N117. The wind farm is connected to the 110/10 kV transformer station. The wind farm is
projected to generate 35 GWh per year and thus cover the electricity demand of around 15,000
households in the district Bergedorf per year. The wind farm is financed by private investors with an
investment of approx. 20 Mio. €.
THIS
DEL
IVER
AB
LE H
AS
NO
T YE
T B
EEN
AP
PR
OV
ED B
Y TH
E EC
Page 22 Page 22 D3.4 Smart energy supply and demand. integration of RES, storage, management and control
4.1.3 Large-scale battery
The combination of wind turbines and a local battery improves the network efficiency and the marketing
possibilities of fluctuating generation from renewable energies and could be demonstrated at the wind
farm Curslack. The realization is a joint project of Vattenfall, Nordex Energy GmbH and the Competence
Center for Renewable Energy and Energy Efficiency (CC4E) of the HAW and is part of the project
“SINTEG NEW 4.0”. The battery consists of lithium-ion batteries, as they are used in electric cars and
comply with the latest technology.
Battery and wind farm feed electricity into the public grid as one system. In real operation, the power
supply from the wind farm and the battery should be optimized. In the research project “NEW 4.0”
innovative possibilities for ancillary services, such as the instantaneous reserve as a very fast frequency-
response reserve, are being tested. In addition, the system provides control energy to compensate for
Figure 4-1: left: location wind farm Curslack and the technology center energy campus; right: official corridor map with the wind turbines
Figure 4-2: battery storage at the wind farm curslack, source: HAW own
THIS
DEL
IVER
AB
LE H
AS
NO
T YE
T B
EEN
AP
PR
OV
ED B
Y TH
E EC
Page 23 Page 23 D3.4 Smart energy supply and demand. integration of RES, storage, management and control
short-term fluctuations in the grid frequency. This should be avoided, as far as possible, shutdowns of
wind turbines in network overload.
The main three cases during the SINTEG-project NEW 4.0 will be investigate:
Instantaneous reserve
At the first moment of a frequency deviation, the instantaneous reserve makes an important contribution to
hold frequency. The instantaneous reserve is available to the conventional power plants by using
inherently rotating masses. The inertia torque of the generators stabilizes the frequency without additional
efforts. In the future, conventional power plants will be taken from the grid. Therefore, alternative or
supplementary solutions for a sufficient amount of instantaneous reserve are needed. The use of this
battery, to deliver instantaneous coverage, is to be further investigated in the project “NEW 4.0” as well as
recommendations for a legal framework to show off a business model.
Primary Control power
The primary control power is intended to regulate short-term load changes. Companies, who offer this
ancillary service, must secure that the maximum power is reached within a maximum of 30 seconds and is
available for at least 15 minutes. The activation of the primary reserve is affected by the frequency
deviation. The primary reserve provider measures the grid frequency independently at the place of
production or consumption and reacts immediately to the change in grid frequency. Temporal losses, such
as through communication links, are avoided and cause quick compensation. The entire control range of
the primary control power is in a control band of 49.8 and 50.2 Hz. From a frequency of 49.99 or 50.01 Hz,
the activation begins and the provider is obliged to counteract the frequency.
Reactive power
The reactive power is required for the operation of electrical distribution or transmission networks. It is
influenced by the behaviour of users of the power grid (including reference customers, generating
facilities) and the resulting reactive power behaviour of the components of the grid (e.g., lines,
transformers). The investigation will show to what extent a hybrid park can deliver reactive power by using
wind turbines and battery. Reactive power is currently not a market in Germany, because it will be
provided by the conventional power plants. Due to the future reduction of conventional power plants and
the predictable need for reactive power possible regulations should be analysed.
4.1.4 Research and Teaching
During the project period, 5 wind turbines, a battery storage and a wind measuring mast were built. For
further research, 4 wind turbines were equipped with GPS Rovers and 2 wind turbines were equipped with
LiDAR systems. The GPS rovers are used to determine the exact position of the gondola. The LiDAR
(light detection and ranging) system measures the horizontal wind speeds. The information can be used to
THIS
DEL
IVER
AB
LE H
AS
NO
T YE
T B
EEN
AP
PR
OV
ED B
Y TH
E EC
Page 24 Page 24 D3.4 Smart energy supply and demand. integration of RES, storage, management and control
gain information on wind turbulence. In addition, a supervisory control and data acquisition (SCADA)
system for the wind farm was set up.
Figure 4-3, Overview of the data protocols and the connection between windfarm Curslack and TCEC
Figure 4-3 shows the data connection of the wind farm to TCEC systems. The data connection between
the wind farm facilities to the SCADA system is via the communication protocol Profinet (battery storage)
and Modbus TCP.
A HAW server is also realized on the wind farm. The SCADA system and the HAW server are connected
over switches and communicate via HTTP. The HAW Server collected and stored the data from the GPS
Rover, LiDAR, wind measuring mast, battery and the wind turbines. To get the data from the HAW server,
a WLAN bridge is connected to the HAW Switch. The WLAN bridge couples two networks together and
the connection will be realized by a router and a repeater. The bridge side of the TCEC is directly
connected to the HAW Network.
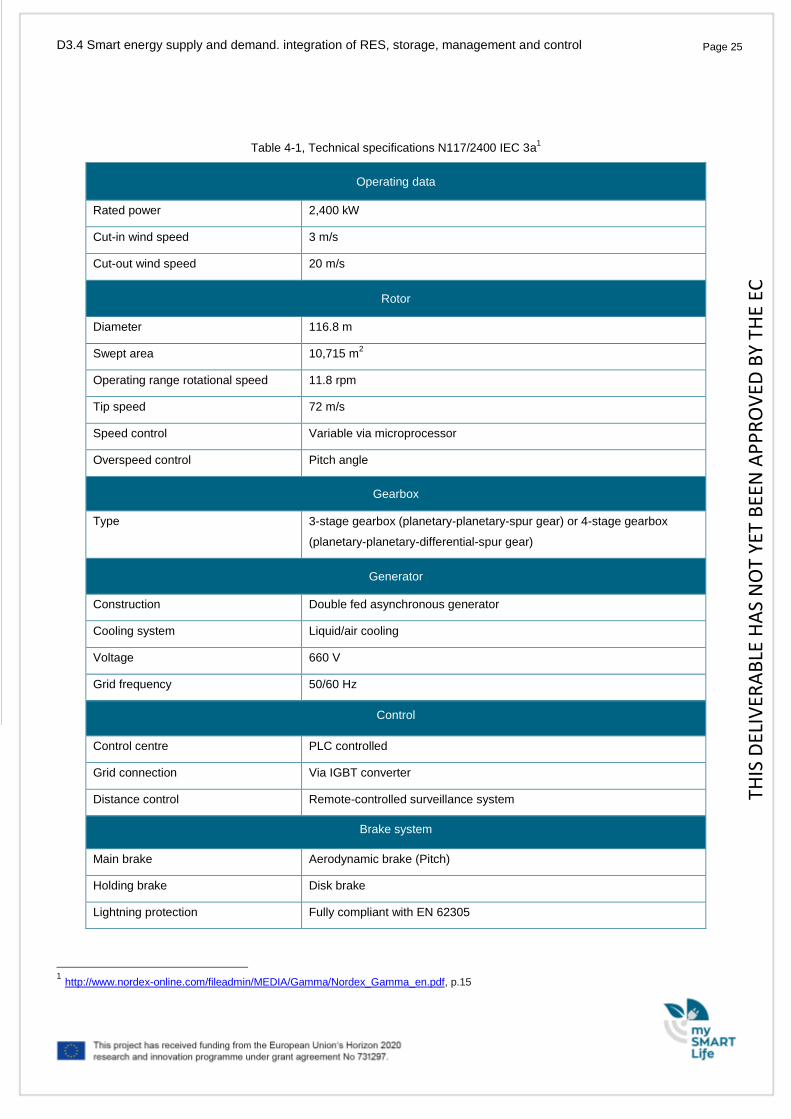
4.2 Specification of the wind turbines and Battery system
The technology readiness level (TRL) of the task would have to be set at 9 for the wind-turbines and 8 for
the battery. The following table shows the specification of the wind turbines from the wind farm Curslack.
THIS
DEL
IVER
AB
LE H
AS
NO
T YE
T B
EEN
AP
PR
OV
ED B
Y TH
E EC
Page 25 Page 25 D3.4 Smart energy supply and demand. integration of RES, storage, management and control
Table 4-1, Technical specifications N117/2400 IEC 3a1
Operating data
Rated power 2,400 kW
Cut-in wind speed 3 m/s
Cut-out wind speed 20 m/s
Rotor
Diameter 116.8 m
Swept area 10,715 m2
Operating range rotational speed 11.8 rpm
Tip speed 72 m/s
Speed control Variable via microprocessor
Overspeed control Pitch angle
Gearbox
Type 3-stage gearbox (planetary-planetary-spur gear) or 4-stage gearbox
(planetary-planetary-differential-spur gear)
Generator
Construction Double fed asynchronous generator
Cooling system Liquid/air cooling
Voltage 660 V
Grid frequency 50/60 Hz
Control
Control centre PLC controlled
Grid connection Via IGBT converter
Distance control Remote-controlled surveillance system
Brake system
Main brake Aerodynamic brake (Pitch)
Holding brake Disk brake
Lightning protection Fully compliant with EN 62305
1 http://www.nordex-online.com/fileadmin/MEDIA/Gamma/Nordex_Gamma_en.pdf, p.15
THIS
DEL
IVER
AB
LE H
AS
NO
T YE
T B
EEN
AP
PR
OV
ED B
Y TH
E EC
Page 26 Page 26 D3.4 Smart energy supply and demand. integration of RES, storage, management and control
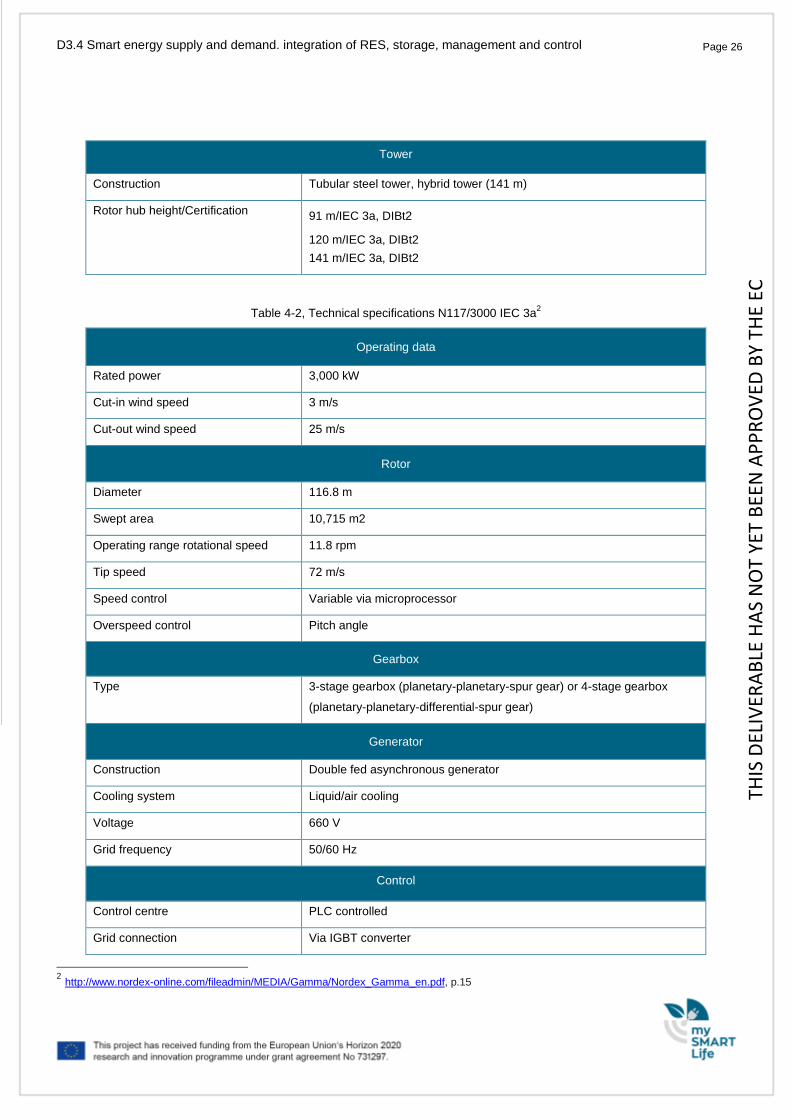
Tower
Construction Tubular steel tower, hybrid tower (141 m)
Rotor hub height/Certification 91 m/IEC 3a, DIBt2
120 m/IEC 3a, DIBt2
141 m/IEC 3a, DIBt2
Table 4-2, Technical specifications N117/3000 IEC 3a2
Operating data
Rated power 3,000 kW
Cut-in wind speed 3 m/s
Cut-out wind speed 25 m/s
Rotor
Diameter 116.8 m
Swept area 10,715 m2
Operating range rotational speed 11.8 rpm
Tip speed 72 m/s
Speed control Variable via microprocessor
Overspeed control Pitch angle
Gearbox
Type 3-stage gearbox (planetary-planetary-spur gear) or 4-stage gearbox
(planetary-planetary-differential-spur gear)
Generator
Construction Double fed asynchronous generator
Cooling system Liquid/air cooling
Voltage 660 V
Grid frequency 50/60 Hz
Control
Control centre PLC controlled
Grid connection Via IGBT converter
2 http://www.nordex-online.com/fileadmin/MEDIA/Gamma/Nordex_Gamma_en.pdf, p.15
THIS
DEL
IVER
AB
LE H
AS
NO
T YE
T B
EEN
AP
PR
OV
ED B
Y TH
E EC
Page 27 Page 27 D3.4 Smart energy supply and demand. integration of RES, storage, management and control
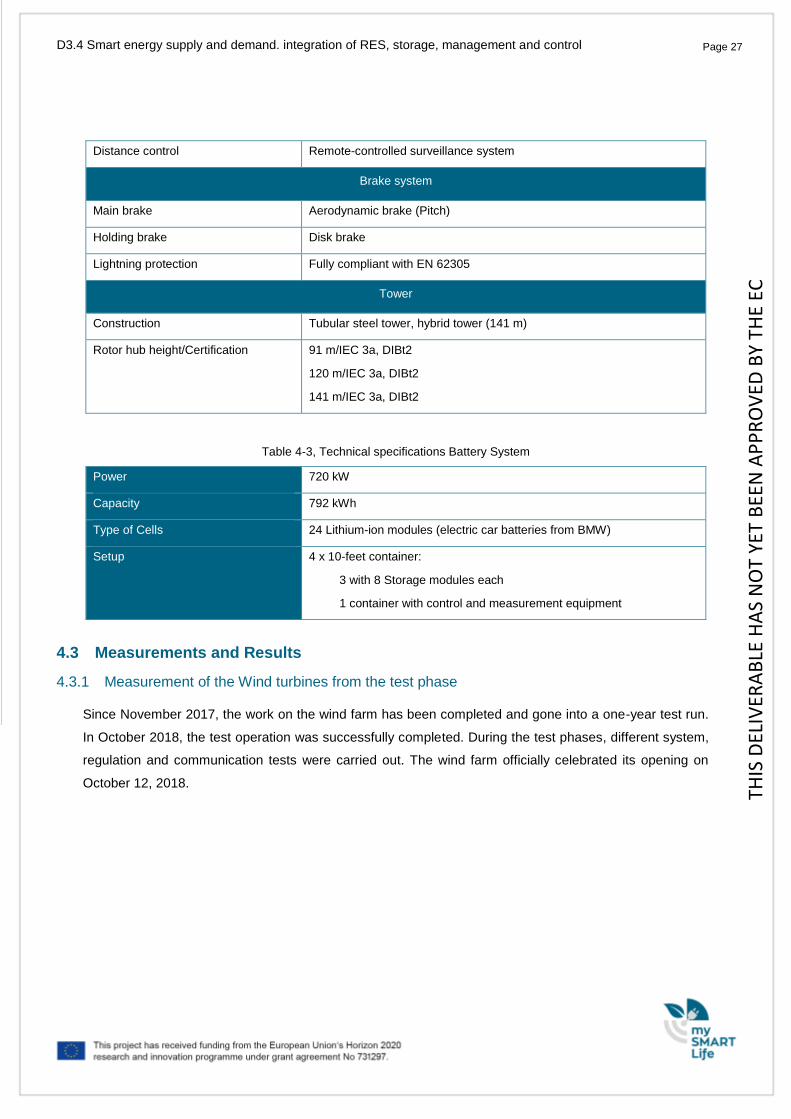
Distance control Remote-controlled surveillance system
Brake system
Main brake Aerodynamic brake (Pitch)
Holding brake Disk brake
Lightning protection Fully compliant with EN 62305
Tower
Construction Tubular steel tower, hybrid tower (141 m)
Rotor hub height/Certification 91 m/IEC 3a, DIBt2
120 m/IEC 3a, DIBt2
141 m/IEC 3a, DIBt2
Table 4-3, Technical specifications Battery System
Power 720 kW
Capacity 792 kWh
Type of Cells 24 Lithium-ion modules (electric car batteries from BMW)
Setup 4 x 10-feet container:
3 with 8 Storage modules each
1 container with control and measurement equipment
4.3 Measurements and Results
4.3.1 Measurement of the Wind turbines from the test phase
Since November 2017, the work on the wind farm has been completed and gone into a one-year test run.
In October 2018, the test operation was successfully completed. During the test phases, different system,
regulation and communication tests were carried out. The wind farm officially celebrated its opening on
October 12, 2018.
THIS
DEL
IVER
AB
LE H
AS
NO
T YE
T B
EEN
AP
PR
OV
ED B
Y TH
E EC
Page 28 Page 28 D3.4 Smart energy supply and demand. integration of RES, storage, management and control
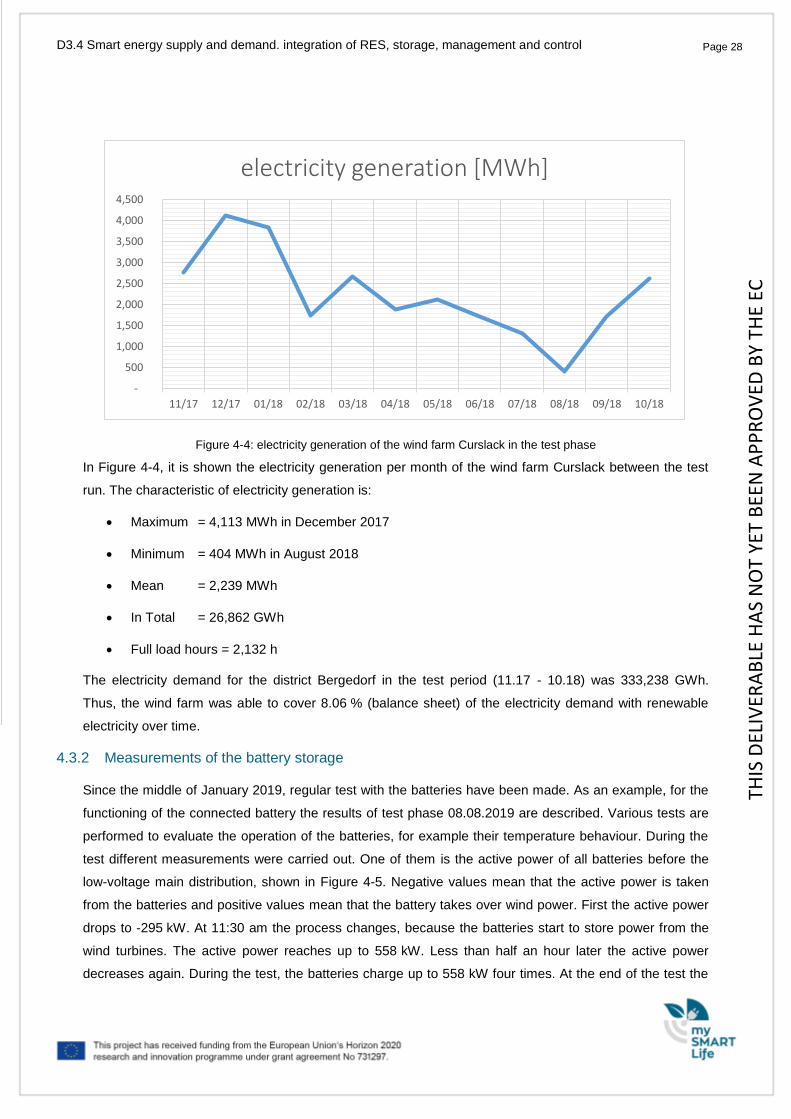
Figure 4-4: electricity generation of the wind farm Curslack in the test phase
In Figure 4-4, it is shown the electricity generation per month of the wind farm Curslack between the test
run. The characteristic of electricity generation is:
Maximum = 4,113 MWh in December 2017
Minimum = 404 MWh in August 2018
Mean = 2,239 MWh
In Total = 26,862 GWh
Full load hours = 2,132 h
The electricity demand for the district Bergedorf in the test period (11.17 - 10.18) was 333,238 GWh.
Thus, the wind farm was able to cover 8.06 % (balance sheet) of the electricity demand with renewable
electricity over time.
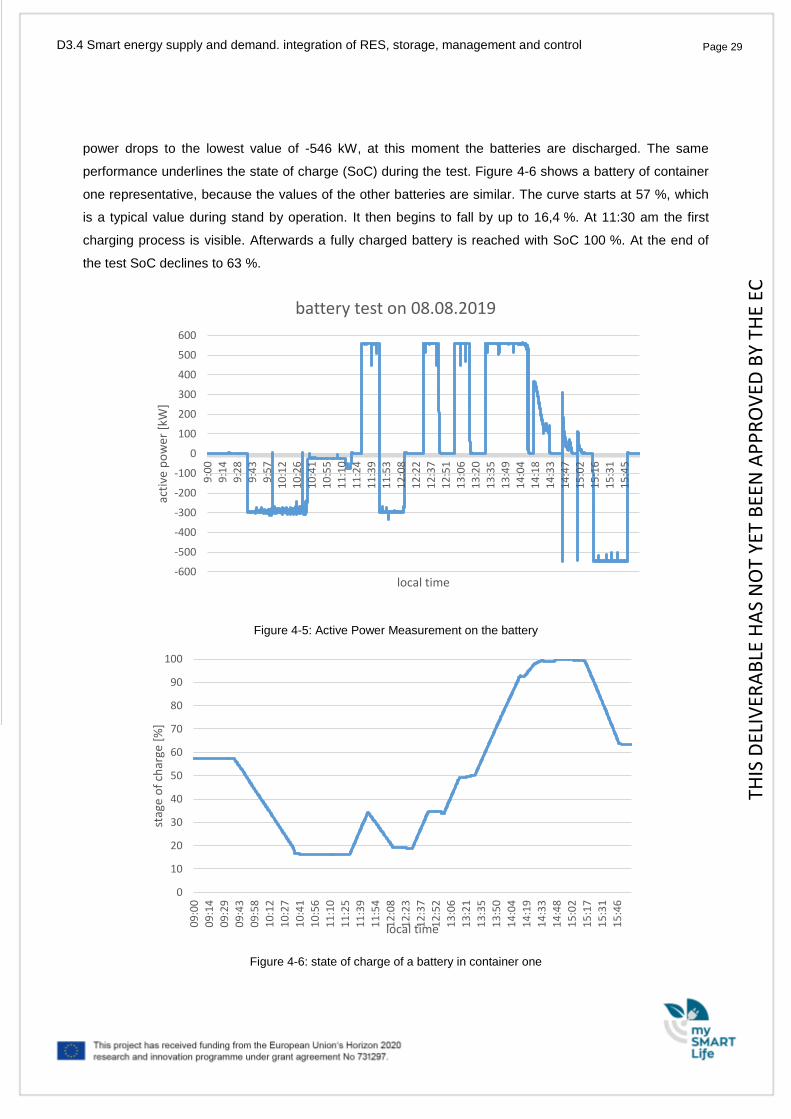
4.3.2 Measurements of the battery storage
Since the middle of January 2019, regular test with the batteries have been made. As an example, for the
functioning of the connected battery the results of test phase 08.08.2019 are described. Various tests are
performed to evaluate the operation of the batteries, for example their temperature behaviour. During the
test different measurements were carried out. One of them is the active power of all batteries before the
low-voltage main distribution, shown in Figure 4-5. Negative values mean that the active power is taken
from the batteries and positive values mean that the battery takes over wind power. First the active power
drops to -295 kW. At 11:30 am the process changes, because the batteries start to store power from the
wind turbines. The active power reaches up to 558 kW. Less than half an hour later the active power
decreases again. During the test, the batteries charge up to 558 kW four times. At the end of the test the
-
500
1,000
1,500
2,000
2,500
3,000
3,500
4,000
4,500
11/17 12/17 01/18 02/18 03/18 04/18 05/18 06/18 07/18 08/18 09/18 10/18
electricity generation [MWh]
THIS
DEL
IVER
AB
LE H
AS
NO
T YE
T B
EEN
AP
PR
OV
ED B
Y TH
E EC
Page 29 Page 29 D3.4 Smart energy supply and demand. integration of RES, storage, management and control
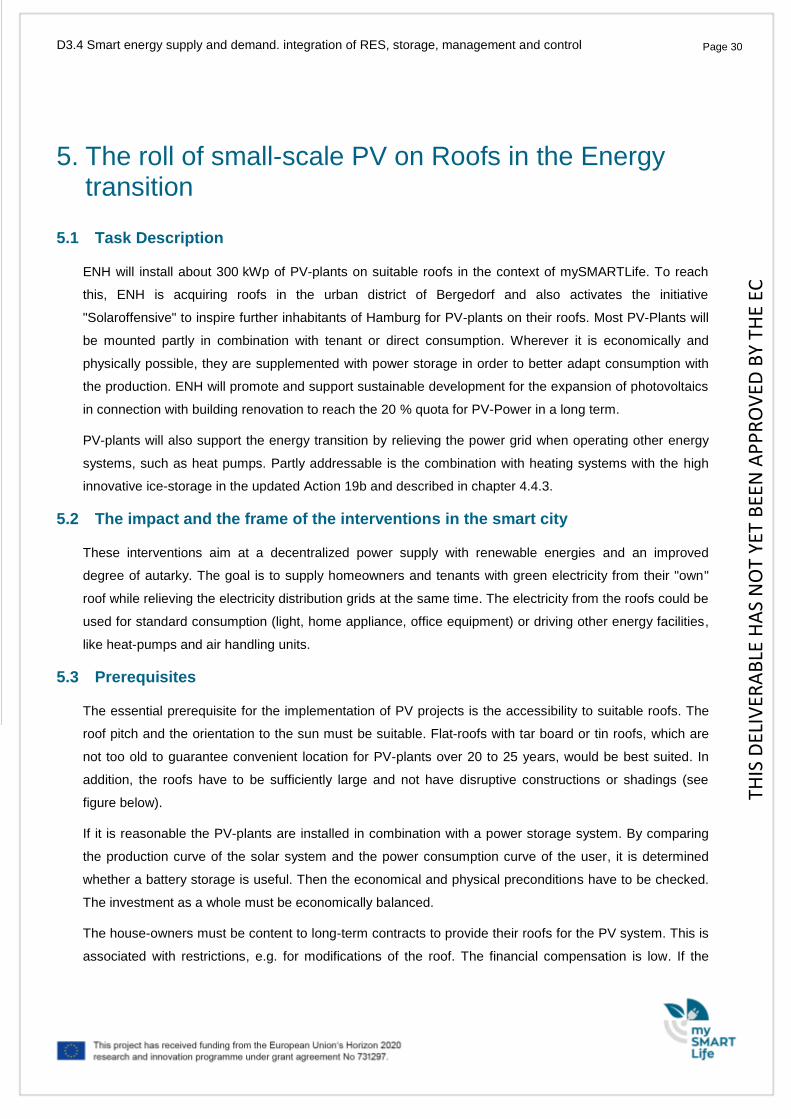
power drops to the lowest value of -546 kW, at this moment the batteries are discharged. The same
performance underlines the state of charge (SoC) during the test. Figure 4-6 shows a battery of container
one representative, because the values of the other batteries are similar. The curve starts at 57 %, which
is a typical value during stand by operation. It then begins to fall by up to 16,4 %. At 11:30 am the first
charging process is visible. Afterwards a fully charged battery is reached with SoC 100 %. At the end of
the test SoC declines to 63 %.
Figure 4-5: Active Power Measurement on the battery
Figure 4-6: state of charge of a battery in container one
-600
-500
-400
-300
-200
-100
0
100
200
300
400
500
600
9:0
09
:14
9:2
89
:43
9:5
71
0:1
21
0:2
61
0:4
11
0:5
51
1:1
01
1:2
41
1:3
91
1:5
31
2:0
81
2:2
21
2:3
71
2:5
11
3:0
61
3:2
01
3:3
51
3:4
91
4:0
41
4:1
81
4:3
31
4:4
71
5:0
21
5:1
61
5:3
11
5:4
5
acti
ve p
ow
er [
kW]
local time
battery test on 08.08.2019
0
10
20
30
40
50
60
70
80
90
100
09
:00
09
:14
09
:29
09
:43
09
:58
10
:12
10
:27
10
:41
10
:56
11
:10
11
:25
11
:39
11
:54
12
:08
12
:23
12
:37
12
:52
13
:06
13
:21
13
:35
13
:50
14
:04
14
:19
14
:33
14
:48
15
:02
15
:17
15
:31
15
:46
stag
e o
f ch
arge
[%
]
local time
THIS
DEL
IVER
AB
LE H
AS
NO
T YE
T B
EEN
AP
PR
OV
ED B
Y TH
E EC
Page 30 Page 30 D3.4 Smart energy supply and demand. integration of RES, storage, management and control
5. The roll of small-scale PV on Roofs in the Energy transition
5.1 Task Description
ENH will install about 300 kWp of PV-plants on suitable roofs in the context of mySMARTLife. To reach
this, ENH is acquiring roofs in the urban district of Bergedorf and also activates the initiative
"Solaroffensive" to inspire further inhabitants of Hamburg for PV-plants on their roofs. Most PV-Plants will
be mounted partly in combination with tenant or direct consumption. Wherever it is economically and
physically possible, they are supplemented with power storage in order to better adapt consumption with
the production. ENH will promote and support sustainable development for the expansion of photovoltaics
in connection with building renovation to reach the 20 % quota for PV-Power in a long term.
PV-plants will also support the energy transition by relieving the power grid when operating other energy
systems, such as heat pumps. Partly addressable is the combination with heating systems with the high
innovative ice-storage in the updated Action 19b and described in chapter 4.4.3.
5.2 The impact and the frame of the interventions in the smart city
These interventions aim at a decentralized power supply with renewable energies and an improved
degree of autarky. The goal is to supply homeowners and tenants with green electricity from their "own"
roof while relieving the electricity distribution grids at the same time. The electricity from the roofs could be
used for standard consumption (light, home appliance, office equipment) or driving other energy facilities,
like heat-pumps and air handling units.
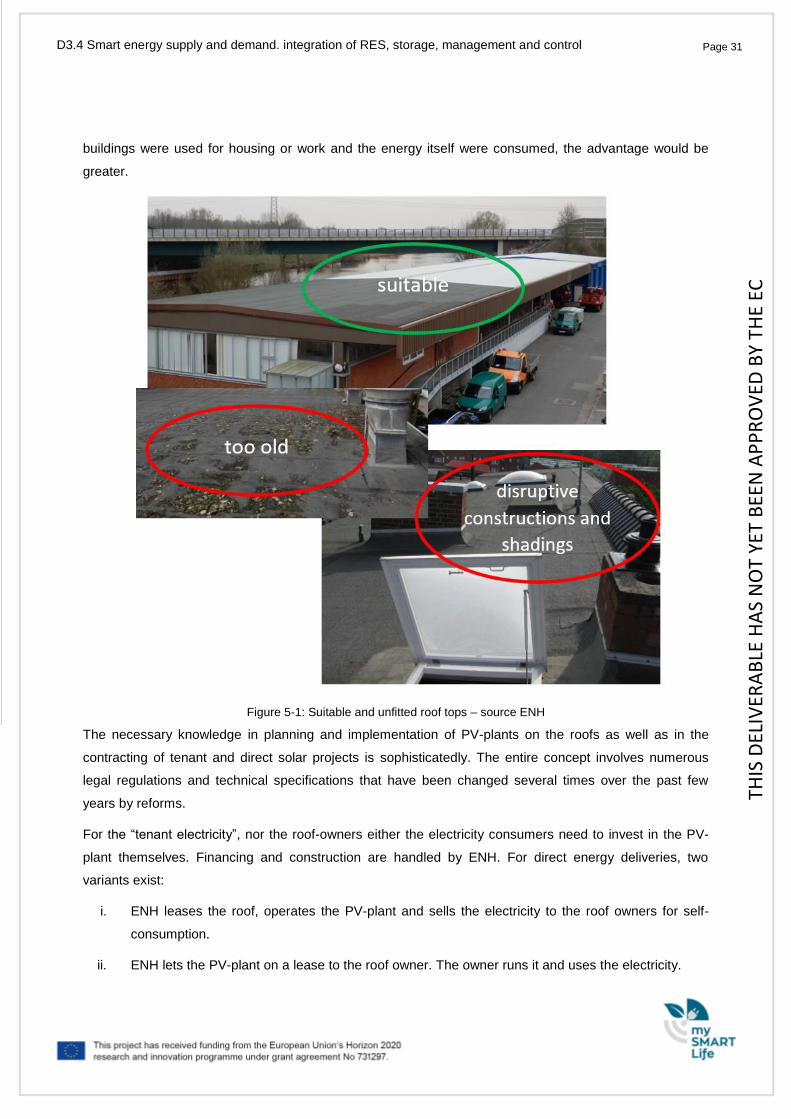
5.3 Prerequisites
The essential prerequisite for the implementation of PV projects is the accessibility to suitable roofs. The
roof pitch and the orientation to the sun must be suitable. Flat-roofs with tar board or tin roofs, which are
not too old to guarantee convenient location for PV-plants over 20 to 25 years, would be best suited. In
addition, the roofs have to be sufficiently large and not have disruptive constructions or shadings (see
figure below).
If it is reasonable the PV-plants are installed in combination with a power storage system. By comparing
the production curve of the solar system and the power consumption curve of the user, it is determined
whether a battery storage is useful. Then the economical and physical preconditions have to be checked.
The investment as a whole must be economically balanced.
The house-owners must be content to long-term contracts to provide their roofs for the PV system. This is
associated with restrictions, e.g. for modifications of the roof. The financial compensation is low. If the
THIS
DEL
IVER
AB
LE H
AS
NO
T YE
T B
EEN
AP
PR
OV
ED B
Y TH
E EC
Page 31 Page 31 D3.4 Smart energy supply and demand. integration of RES, storage, management and control
buildings were used for housing or work and the energy itself were consumed, the advantage would be
greater.
Figure 5-1: Suitable and unfitted roof tops – source ENH
The necessary knowledge in planning and implementation of PV-plants on the roofs as well as in the
contracting of tenant and direct solar projects is sophisticatedly. The entire concept involves numerous
legal regulations and technical specifications that have been changed several times over the past few
years by reforms.
For the “tenant electricity”, nor the roof-owners either the electricity consumers need to invest in the PV-
plant themselves. Financing and construction are handled by ENH. For direct energy deliveries, two
variants exist:
i. ENH leases the roof, operates the PV-plant and sells the electricity to the roof owners for self-
consumption.
ii. ENH lets the PV-plant on a lease to the roof owner. The owner runs it and uses the electricity.
THIS
DEL
IVER
AB
LE H
AS
NO
T YE
T B
EEN
AP
PR
OV
ED B
Y TH
E EC
Page 32 Page 32 D3.4 Smart energy supply and demand. integration of RES, storage, management and control
The reason for these two variants is justified by the legislation and the payable EEG-surcharge. In the first
case, 100 % of the surcharge must be paid to the grid operator. In the second case, only 40 % must be
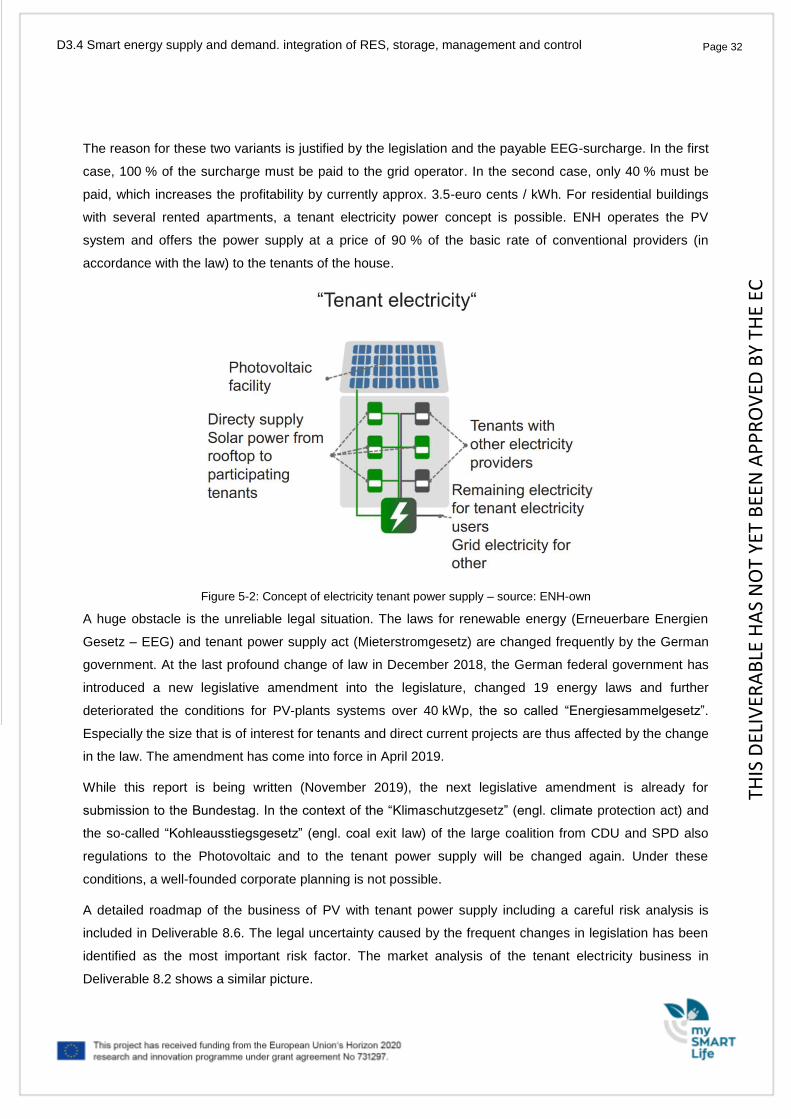
paid, which increases the profitability by currently approx. 3.5-euro cents / kWh. For residential buildings
with several rented apartments, a tenant electricity power concept is possible. ENH operates the PV
system and offers the power supply at a price of 90 % of the basic rate of conventional providers (in
accordance with the law) to the tenants of the house.
Figure 5-2: Concept of electricity tenant power supply – source: ENH-own
A huge obstacle is the unreliable legal situation. The laws for renewable energy (Erneuerbare Energien
Gesetz – EEG) and tenant power supply act (Mieterstromgesetz) are changed frequently by the German
government. At the last profound change of law in December 2018, the German federal government has
introduced a new legislative amendment into the legislature, changed 19 energy laws and further
deteriorated the conditions for PV-plants systems over 40 kWp, the so called “Energiesammelgesetz”.
Especially the size that is of interest for tenants and direct current projects are thus affected by the change
in the law. The amendment has come into force in April 2019.
While this report is being written (November 2019), the next legislative amendment is already for
submission to the Bundestag. In the context of the “Klimaschutzgesetz” (engl. climate protection act) and
the so-called “Kohleausstiegsgesetz” (engl. coal exit law) of the large coalition from CDU and SPD also
regulations to the Photovoltaic and to the tenant power supply will be changed again. Under these
conditions, a well-founded corporate planning is not possible.
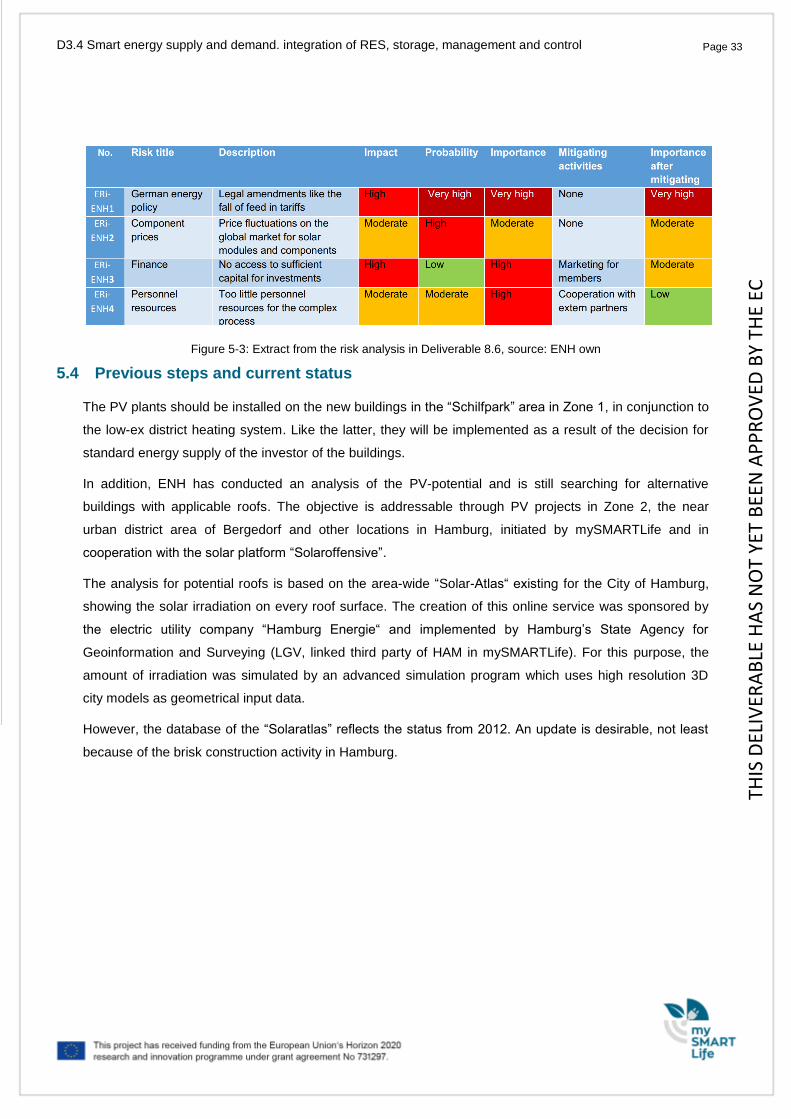
A detailed roadmap of the business of PV with tenant power supply including a careful risk analysis is
included in Deliverable 8.6. The legal uncertainty caused by the frequent changes in legislation has been
identified as the most important risk factor. The market analysis of the tenant electricity business in
Deliverable 8.2 shows a similar picture.
THIS
DEL
IVER
AB
LE H
AS
NO
T YE
T B
EEN
AP
PR
OV
ED B
Y TH
E EC
Page 33 Page 33 D3.4 Smart energy supply and demand. integration of RES, storage, management and control
Figure 5-3: Extract from the risk analysis in Deliverable 8.6, source: ENH own
5.4 Previous steps and current status
The PV plants should be installed on the new buildings in the “Schilfpark” area in Zone 1, in conjunction to
the low-ex district heating system. Like the latter, they will be implemented as a result of the decision for
standard energy supply of the investor of the buildings.
In addition, ENH has conducted an analysis of the PV-potential and is still searching for alternative
buildings with applicable roofs. The objective is addressable through PV projects in Zone 2, the near
urban district area of Bergedorf and other locations in Hamburg, initiated by mySMARTLife and in
cooperation with the solar platform “Solaroffensive”.
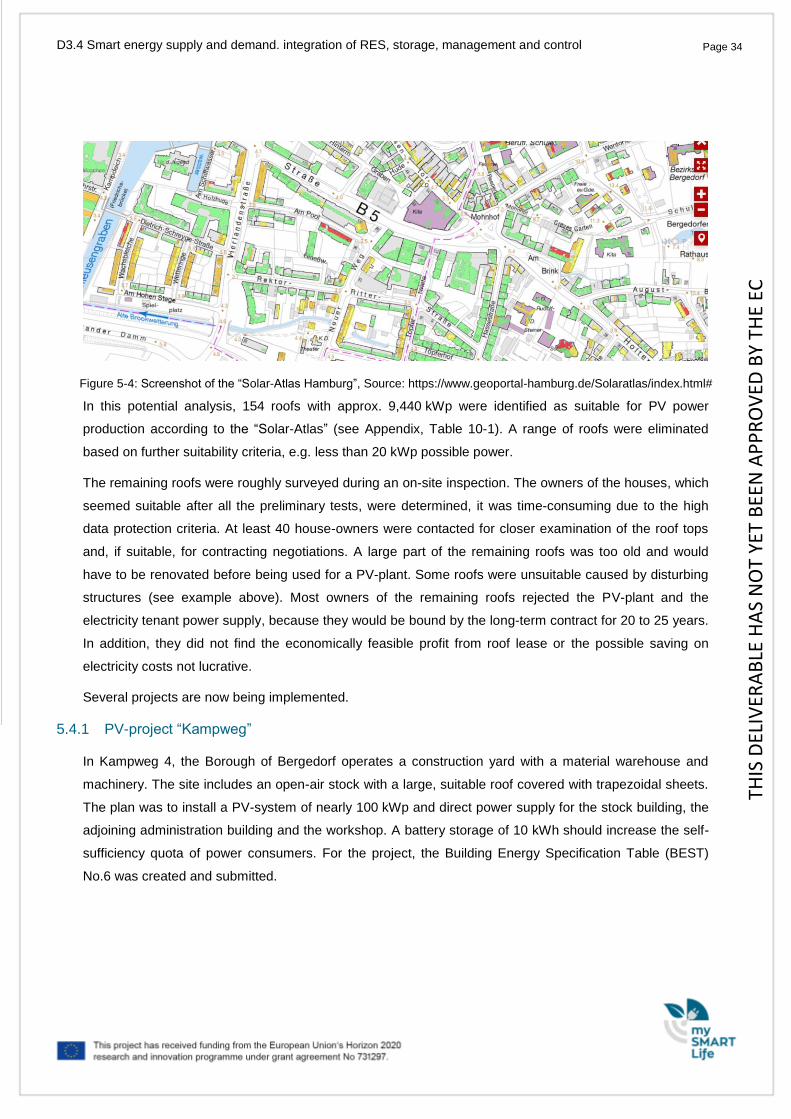
The analysis for potential roofs is based on the area-wide “Solar-Atlas“ existing for the City of Hamburg,
showing the solar irradiation on every roof surface. The creation of this online service was sponsored by
the electric utility company “Hamburg Energie“ and implemented by Hamburg’s State Agency for
Geoinformation and Surveying (LGV, linked third party of HAM in mySMARTLife). For this purpose, the
amount of irradiation was simulated by an advanced simulation program which uses high resolution 3D
city models as geometrical input data.
However, the database of the “Solaratlas” reflects the status from 2012. An update is desirable, not least
because of the brisk construction activity in Hamburg.
THIS
DEL
IVER
AB
LE H
AS
NO
T YE
T B
EEN
AP
PR
OV
ED B
Y TH
E EC
Page 34 Page 34 D3.4 Smart energy supply and demand. integration of RES, storage, management and control
Figure 5-4: Screenshot of the “Solar-Atlas Hamburg”, Source: https://www.geoportal-hamburg.de/Solaratlas/index.html#
In this potential analysis, 154 roofs with approx. 9,440 kWp were identified as suitable for PV power
production according to the “Solar-Atlas” (see Appendix, Table 10-1). A range of roofs were eliminated
based on further suitability criteria, e.g. less than 20 kWp possible power.
The remaining roofs were roughly surveyed during an on-site inspection. The owners of the houses, which
seemed suitable after all the preliminary tests, were determined, it was time-consuming due to the high
data protection criteria. At least 40 house-owners were contacted for closer examination of the roof tops
and, if suitable, for contracting negotiations. A large part of the remaining roofs was too old and would
have to be renovated before being used for a PV-plant. Some roofs were unsuitable caused by disturbing
structures (see example above). Most owners of the remaining roofs rejected the PV-plant and the
electricity tenant power supply, because they would be bound by the long-term contract for 20 to 25 years.
In addition, they did not find the economically feasible profit from roof lease or the possible saving on
electricity costs not lucrative.
Several projects are now being implemented.
5.4.1 PV-project “Kampweg”
In Kampweg 4, the Borough of Bergedorf operates a construction yard with a material warehouse and
machinery. The site includes an open-air stock with a large, suitable roof covered with trapezoidal sheets.
The plan was to install a PV-system of nearly 100 kWp and direct power supply for the stock building, the
adjoining administration building and the workshop. A battery storage of 10 kWh should increase the self-
sufficiency quota of power consumers. For the project, the Building Energy Specification Table (BEST)
No.6 was created and submitted.
THIS
DEL
IVER
AB
LE H
AS
NO
T YE
T B
EEN
AP
PR
OV
ED B
Y TH
E EC
Page 35 Page 35 D3.4 Smart energy supply and demand. integration of RES, storage, management and control
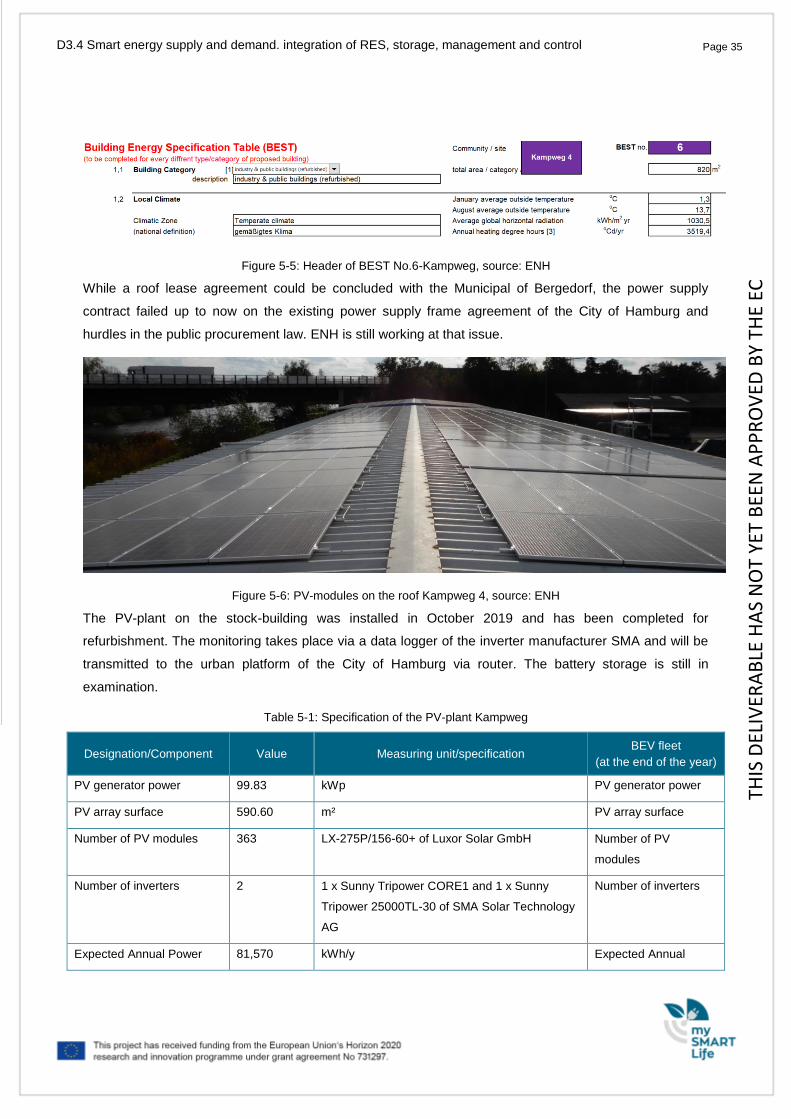
Figure 5-5: Header of BEST No.6-Kampweg, source: ENH
While a roof lease agreement could be concluded with the Municipal of Bergedorf, the power supply
contract failed up to now on the existing power supply frame agreement of the City of Hamburg and
hurdles in the public procurement law. ENH is still working at that issue.
Figure 5-6: PV-modules on the roof Kampweg 4, source: ENH
The PV-plant on the stock-building was installed in October 2019 and has been completed for
refurbishment. The monitoring takes place via a data logger of the inverter manufacturer SMA and will be
transmitted to the urban platform of the City of Hamburg via router. The battery storage is still in
examination.
Table 5-1: Specification of the PV-plant Kampweg
Designation/Component Value Measuring unit/specification BEV fleet
(at the end of the year)
PV generator power 99.83 kWp PV generator power
PV array surface 590.60 m² PV array surface
Number of PV modules 363 LX-275P/156-60+ of Luxor Solar GmbH Number of PV
modules
Number of inverters 2 1 x Sunny Tripower CORE1 and 1 x Sunny
Tripower 25000TL-30 of SMA Solar Technology
AG
Number of inverters
Expected Annual Power 81,570 kWh/y Expected Annual
THIS
DEL
IVER
AB
LE H
AS
NO
T YE
T B
EEN
AP
PR
OV
ED B
Y TH
E EC
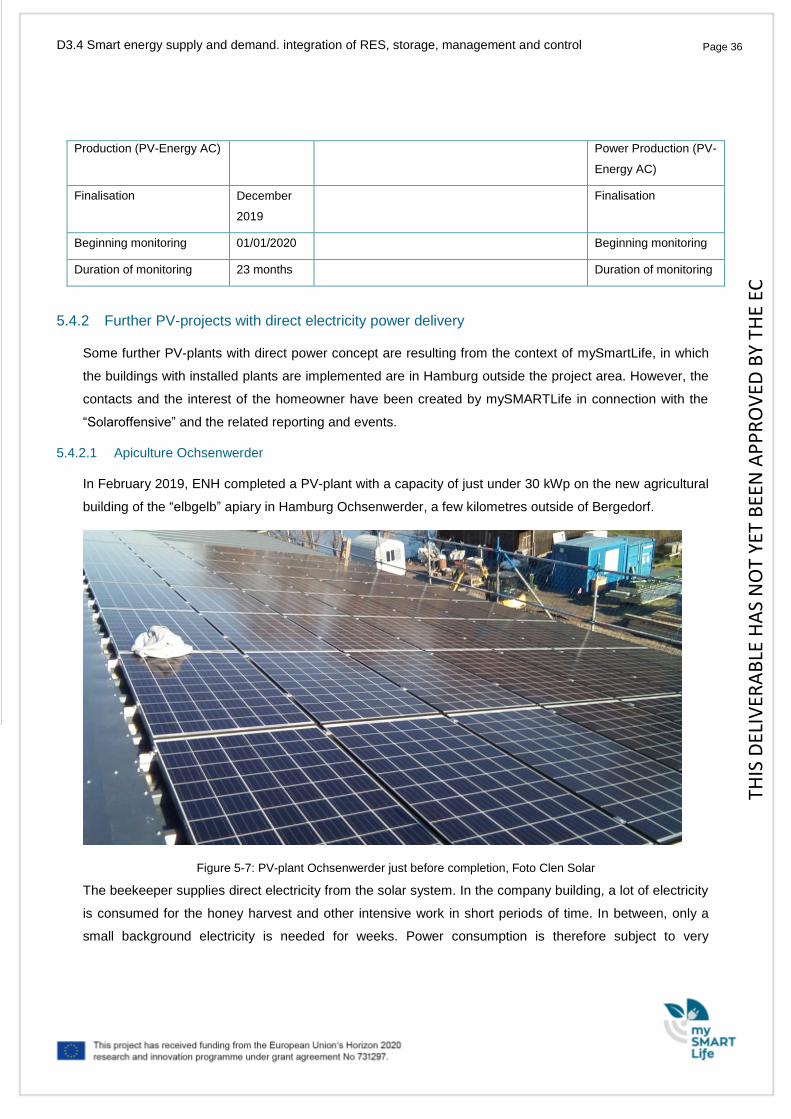
Page 36 Page 36 D3.4 Smart energy supply and demand. integration of RES, storage, management and control
Production (PV-Energy AC) Power Production (PV-
Energy AC)
Finalisation December
2019
Finalisation
Beginning monitoring 01/01/2020 Beginning monitoring
Duration of monitoring 23 months Duration of monitoring
5.4.2 Further PV-projects with direct electricity power delivery
Some further PV-plants with direct power concept are resulting from the context of mySmartLife, in which
the buildings with installed plants are implemented are in Hamburg outside the project area. However, the
contacts and the interest of the homeowner have been created by mySMARTLife in connection with the
“Solaroffensive” and the related reporting and events.
5.4.2.1 Apiculture Ochsenwerder
In February 2019, ENH completed a PV-plant with a capacity of just under 30 kWp on the new agricultural
building of the “elbgelb” apiary in Hamburg Ochsenwerder, a few kilometres outside of Bergedorf.
Figure 5-7: PV-plant Ochsenwerder just before completion, Foto Clen Solar
The beekeeper supplies direct electricity from the solar system. In the company building, a lot of electricity
is consumed for the honey harvest and other intensive work in short periods of time. In between, only a
small background electricity is needed for weeks. Power consumption is therefore subject to very
THIS
DEL
IVER
AB
LE H
AS
NO
T YE
T B
EEN
AP
PR
OV
ED B
Y TH
E EC
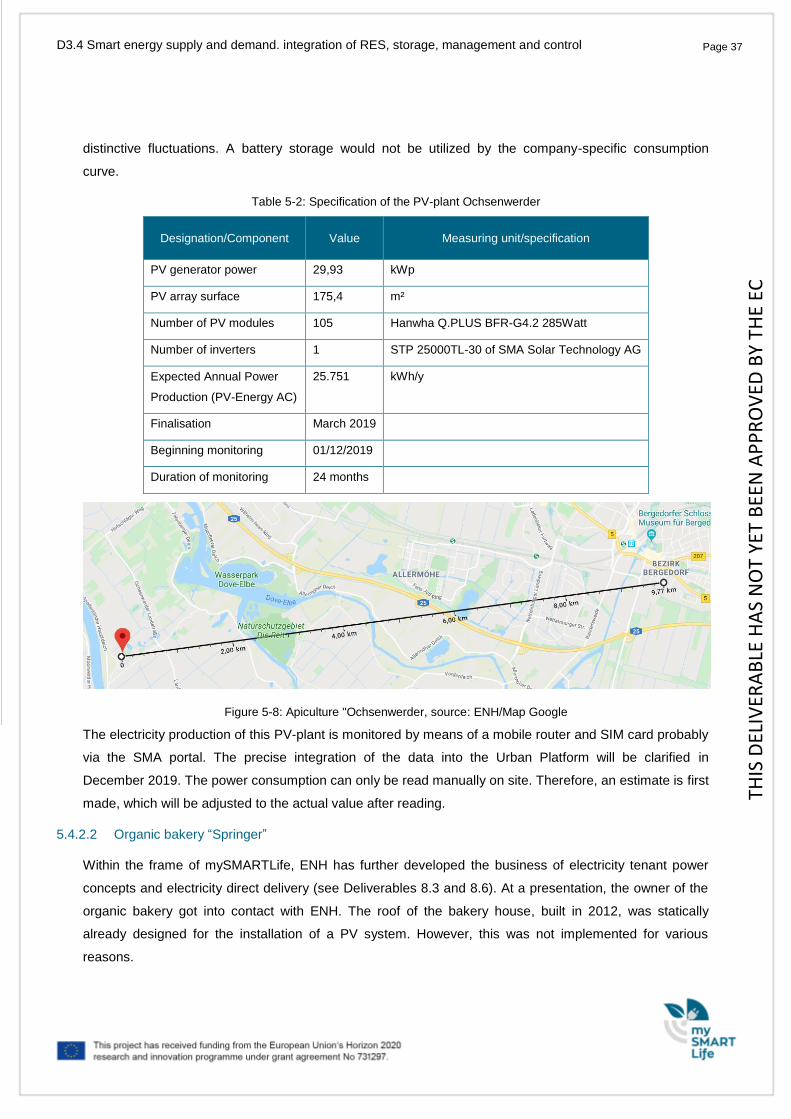
Page 37 Page 37 D3.4 Smart energy supply and demand. integration of RES, storage, management and control
distinctive fluctuations. A battery storage would not be utilized by the company-specific consumption
curve.
Table 5-2: Specification of the PV-plant Ochsenwerder
Designation/Component Value Measuring unit/specification
PV generator power 29,93 kWp
PV array surface 175,4 m²
Number of PV modules 105 Hanwha Q.PLUS BFR-G4.2 285Watt
Number of inverters 1 STP 25000TL-30 of SMA Solar Technology AG
Expected Annual Power
Production (PV-Energy AC)
25.751 kWh/y
Finalisation March 2019
Beginning monitoring 01/12/2019
Duration of monitoring 24 months
Figure 5-8: Apiculture "Ochsenwerder, source: ENH/Map Google
The electricity production of this PV-plant is monitored by means of a mobile router and SIM card probably
via the SMA portal. The precise integration of the data into the Urban Platform will be clarified in
December 2019. The power consumption can only be read manually on site. Therefore, an estimate is first
made, which will be adjusted to the actual value after reading.
5.4.2.2 Organic bakery “Springer”
Within the frame of mySMARTLife, ENH has further developed the business of electricity tenant power
concepts and electricity direct delivery (see Deliverables 8.3 and 8.6). At a presentation, the owner of the
organic bakery got into contact with ENH. The roof of the bakery house, built in 2012, was statically
already designed for the installation of a PV system. However, this was not implemented for various
reasons.
THIS
DEL
IVER
AB
LE H
AS
NO
T YE
T B
EEN
AP
PR
OV
ED B
Y TH
E EC
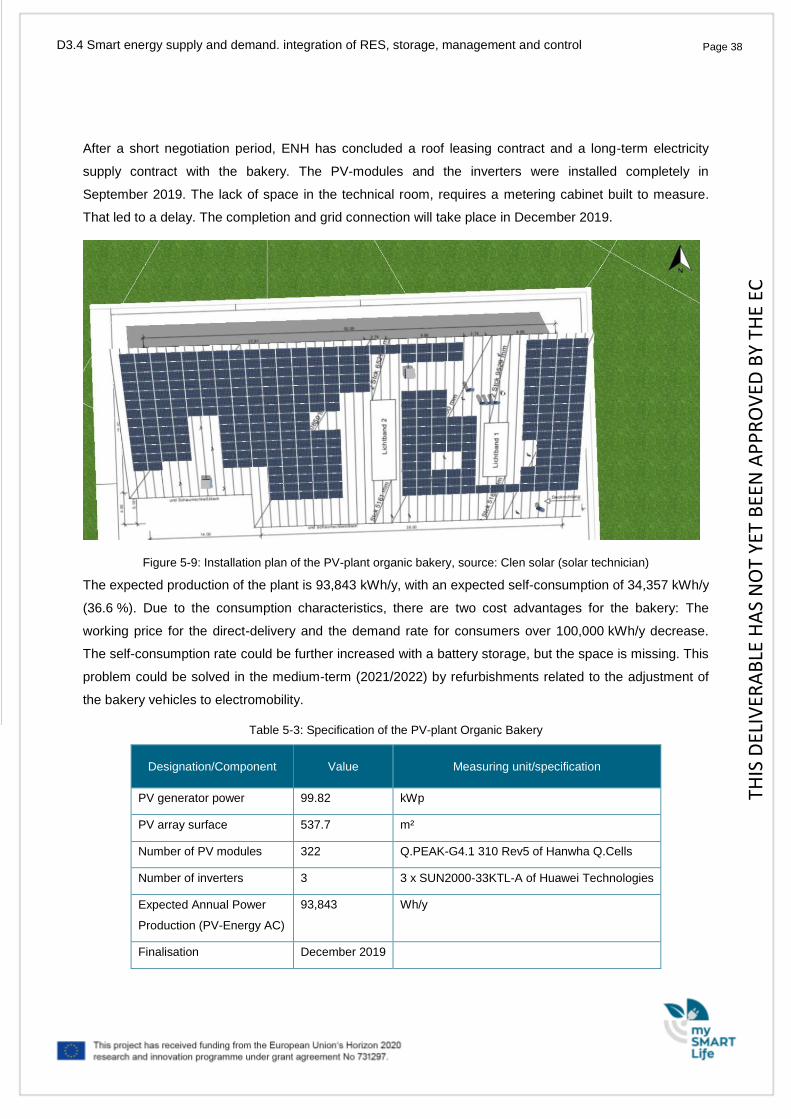
Page 38 Page 38 D3.4 Smart energy supply and demand. integration of RES, storage, management and control
After a short negotiation period, ENH has concluded a roof leasing contract and a long-term electricity
supply contract with the bakery. The PV-modules and the inverters were installed completely in
September 2019. The lack of space in the technical room, requires a metering cabinet built to measure.
That led to a delay. The completion and grid connection will take place in December 2019.
Figure 5-9: Installation plan of the PV-plant organic bakery, source: Clen solar (solar technician)
The expected production of the plant is 93,843 kWh/y, with an expected self-consumption of 34,357 kWh/y
(36.6 %). Due to the consumption characteristics, there are two cost advantages for the bakery: The
working price for the direct-delivery and the demand rate for consumers over 100,000 kWh/y decrease.
The self-consumption rate could be further increased with a battery storage, but the space is missing. This
problem could be solved in the medium-term (2021/2022) by refurbishments related to the adjustment of
the bakery vehicles to electromobility.
Table 5-3: Specification of the PV-plant Organic Bakery
Designation/Component Value Measuring unit/specification
PV generator power 99.82 kWp
PV array surface 537.7 m²
Number of PV modules 322 Q.PEAK-G4.1 310 Rev5 of Hanwha Q.Cells
Number of inverters 3 3 x SUN2000-33KTL-A of Huawei Technologies
Expected Annual Power
Production (PV-Energy AC)
93,843 Wh/y
Finalisation December 2019
THIS
DEL
IVER
AB
LE H
AS
NO
T YE
T B
EEN
AP
PR
OV
ED B
Y TH
E EC
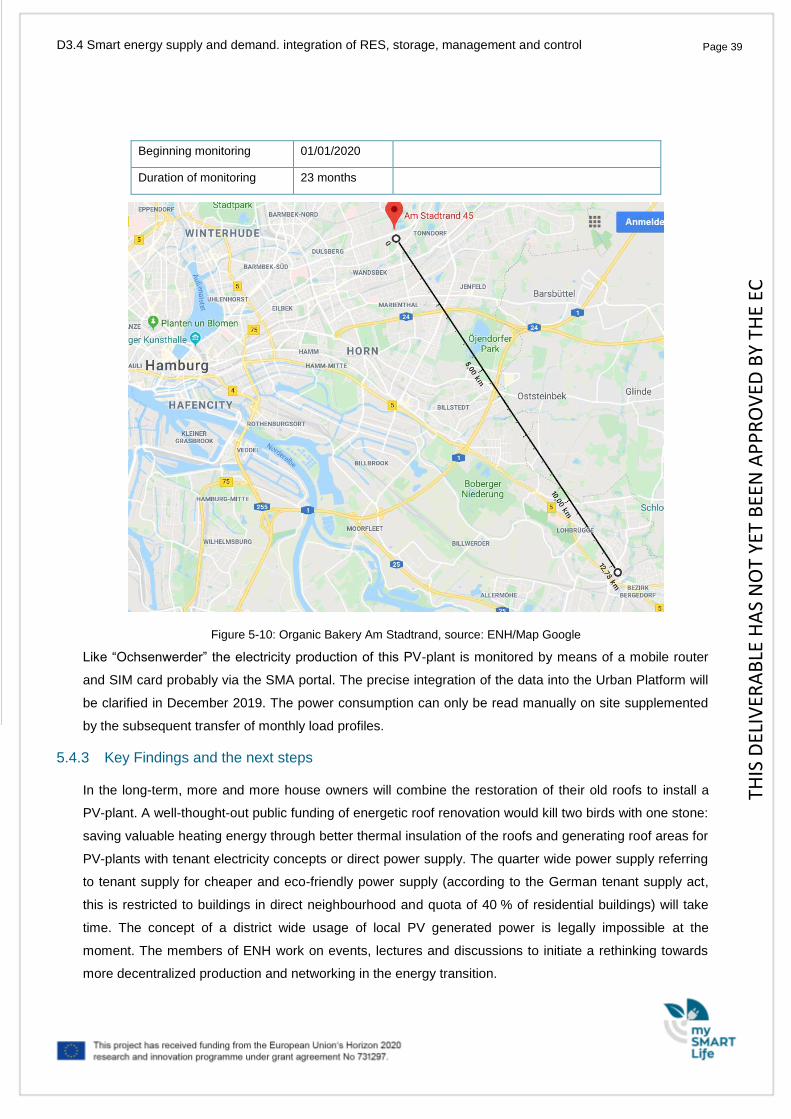
Page 39 Page 39 D3.4 Smart energy supply and demand. integration of RES, storage, management and control
Beginning monitoring 01/01/2020
Duration of monitoring 23 months
Figure 5-10: Organic Bakery Am Stadtrand, source: ENH/Map Google
Like “Ochsenwerder” the electricity production of this PV-plant is monitored by means of a mobile router
and SIM card probably via the SMA portal. The precise integration of the data into the Urban Platform will
be clarified in December 2019. The power consumption can only be read manually on site supplemented
by the subsequent transfer of monthly load profiles.
5.4.3 Key Findings and the next steps
In the long-term, more and more house owners will combine the restoration of their old roofs to install a
PV-plant. A well-thought-out public funding of energetic roof renovation would kill two birds with one stone:
saving valuable heating energy through better thermal insulation of the roofs and generating roof areas for
PV-plants with tenant electricity concepts or direct power supply. The quarter wide power supply referring
to tenant supply for cheaper and eco-friendly power supply (according to the German tenant supply act,
this is restricted to buildings in direct neighbourhood and quota of 40 % of residential buildings) will take
time. The concept of a district wide usage of local PV generated power is legally impossible at the
moment. The members of ENH work on events, lectures and discussions to initiate a rethinking towards
more decentralized production and networking in the energy transition.
THIS
DEL
IVER
AB
LE H
AS
NO
T YE
T B
EEN
AP
PR
OV
ED B
Y TH
E EC
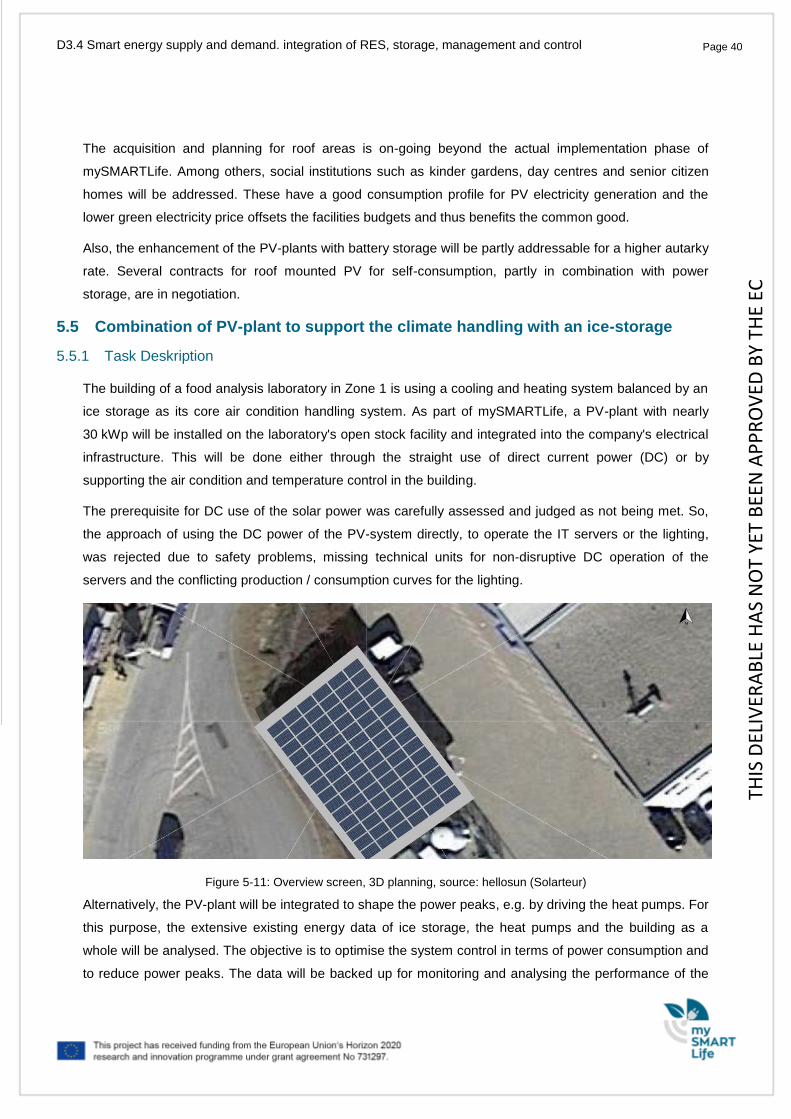
Page 40 Page 40 D3.4 Smart energy supply and demand. integration of RES, storage, management and control
The acquisition and planning for roof areas is on-going beyond the actual implementation phase of
mySMARTLife. Among others, social institutions such as kinder gardens, day centres and senior citizen
homes will be addressed. These have a good consumption profile for PV electricity generation and the
lower green electricity price offsets the facilities budgets and thus benefits the common good.
Also, the enhancement of the PV-plants with battery storage will be partly addressable for a higher autarky
rate. Several contracts for roof mounted PV for self-consumption, partly in combination with power
storage, are in negotiation.
5.5 Combination of PV-plant to support the climate handling with an ice-storage
5.5.1 Task Deskription
The building of a food analysis laboratory in Zone 1 is using a cooling and heating system balanced by an
ice storage as its core air condition handling system. As part of mySMARTLife, a PV-plant with nearly
30 kWp will be installed on the laboratory's open stock facility and integrated into the company's electrical
infrastructure. This will be done either through the straight use of direct current power (DC) or by
supporting the air condition and temperature control in the building.
The prerequisite for DC use of the solar power was carefully assessed and judged as not being met. So,
the approach of using the DC power of the PV-system directly, to operate the IT servers or the lighting,
was rejected due to safety problems, missing technical units for non-disruptive DC operation of the
servers and the conflicting production / consumption curves for the lighting.
Figure 5-11: Overview screen, 3D planning, source: hellosun (Solarteur)
Alternatively, the PV-plant will be integrated to shape the power peaks, e.g. by driving the heat pumps. For
this purpose, the extensive existing energy data of ice storage, the heat pumps and the building as a
whole will be analysed. The objective is to optimise the system control in terms of power consumption and
to reduce power peaks. The data will be backed up for monitoring and analysing the performance of the
THIS
DEL
IVER
AB
LE H
AS
NO
T YE
T B
EEN
AP
PR
OV
ED B
Y TH
E EC
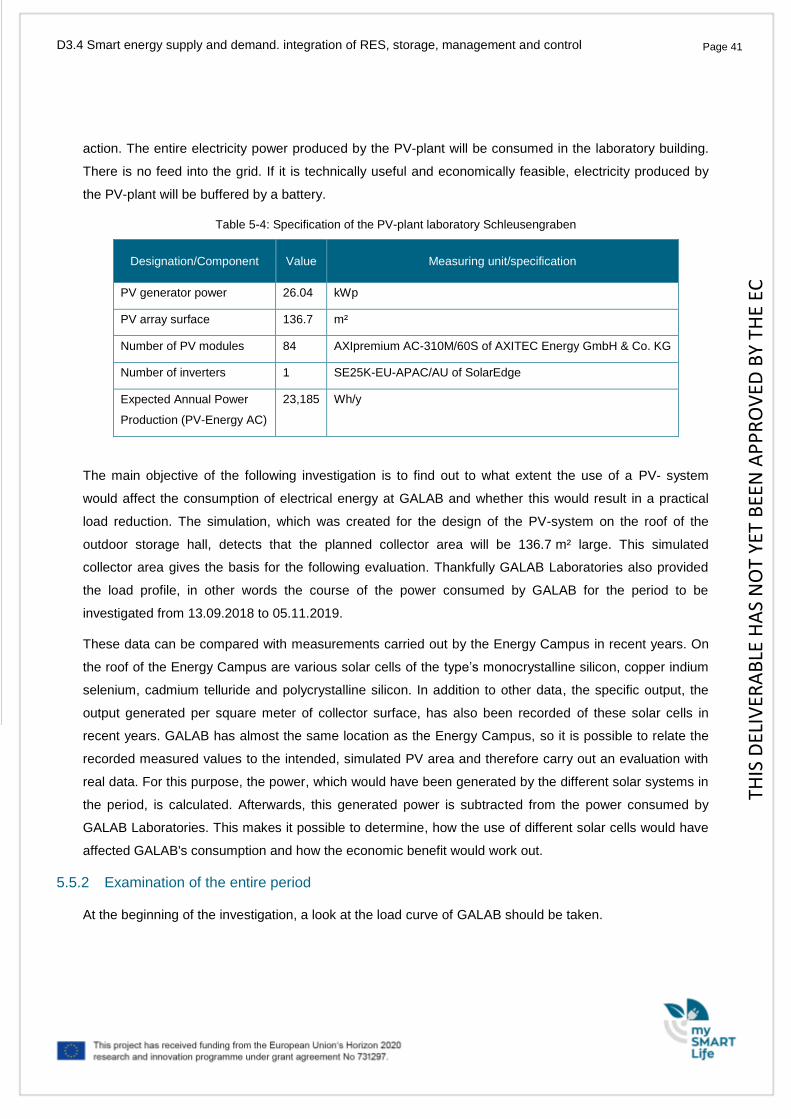
Page 41 Page 41 D3.4 Smart energy supply and demand. integration of RES, storage, management and control
action. The entire electricity power produced by the PV-plant will be consumed in the laboratory building.
There is no feed into the grid. If it is technically useful and economically feasible, electricity produced by
the PV-plant will be buffered by a battery.
Table 5-4: Specification of the PV-plant laboratory Schleusengraben
Designation/Component Value Measuring unit/specification
PV generator power 26.04 kWp
PV array surface 136.7 m²
Number of PV modules 84 AXIpremium AC-310M/60S of AXITEC Energy GmbH & Co. KG
Number of inverters 1 SE25K-EU-APAC/AU of SolarEdge
Expected Annual Power
Production (PV-Energy AC)
23,185 Wh/y
The main objective of the following investigation is to find out to what extent the use of a PV- system
would affect the consumption of electrical energy at GALAB and whether this would result in a practical
load reduction. The simulation, which was created for the design of the PV-system on the roof of the
outdoor storage hall, detects that the planned collector area will be 136.7 m² large. This simulated
collector area gives the basis for the following evaluation. Thankfully GALAB Laboratories also provided
the load profile, in other words the course of the power consumed by GALAB for the period to be
investigated from 13.09.2018 to 05.11.2019.
These data can be compared with measurements carried out by the Energy Campus in recent years. On
the roof of the Energy Campus are various solar cells of the type’s monocrystalline silicon, copper indium
selenium, cadmium telluride and polycrystalline silicon. In addition to other data, the specific output, the
output generated per square meter of collector surface, has also been recorded of these solar cells in
recent years. GALAB has almost the same location as the Energy Campus, so it is possible to relate the
recorded measured values to the intended, simulated PV area and therefore carry out an evaluation with
real data. For this purpose, the power, which would have been generated by the different solar systems in
the period, is calculated. Afterwards, this generated power is subtracted from the power consumed by
GALAB Laboratories. This makes it possible to determine, how the use of different solar cells would have
affected GALAB's consumption and how the economic benefit would work out.
5.5.2 Examination of the entire period
At the beginning of the investigation, a look at the load curve of GALAB should be taken.
THIS
DEL
IVER
AB
LE H
AS
NO
T YE
T B
EEN
AP
PR
OV
ED B
Y TH
E EC
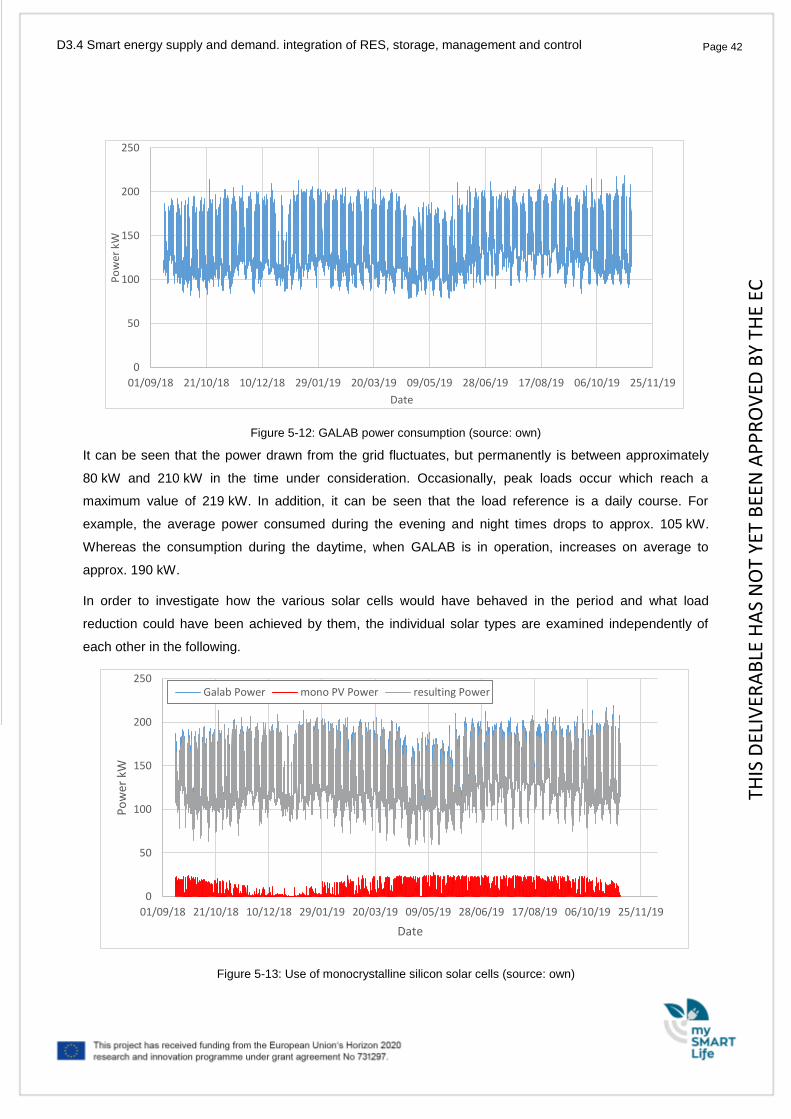
Page 42 Page 42 D3.4 Smart energy supply and demand. integration of RES, storage, management and control
Figure 5-12: GALAB power consumption (source: own)
It can be seen that the power drawn from the grid fluctuates, but permanently is between approximately
80 kW and 210 kW in the time under consideration. Occasionally, peak loads occur which reach a
maximum value of 219 kW. In addition, it can be seen that the load reference is a daily course. For
example, the average power consumed during the evening and night times drops to approx. 105 kW.
Whereas the consumption during the daytime, when GALAB is in operation, increases on average to
approx. 190 kW.
In order to investigate how the various solar cells would have behaved in the period and what load
reduction could have been achieved by them, the individual solar types are examined independently of
each other in the following.
Figure 5-13: Use of monocrystalline silicon solar cells (source: own)
0
50
100
150
200
250
01/09/18 21/10/18 10/12/18 29/01/19 20/03/19 09/05/19 28/06/19 17/08/19 06/10/19 25/11/19
Po
wer
kW
Date
0
50
100
150
200
250
01/09/18 21/10/18 10/12/18 29/01/19 20/03/19 09/05/19 28/06/19 17/08/19 06/10/19 25/11/19
Po
wer
kW
Date
Galab Power mono PV Power resulting Power
THIS
DEL
IVER
AB
LE H
AS
NO
T YE
T B
EEN
AP
PR
OV
ED B
Y TH
E EC
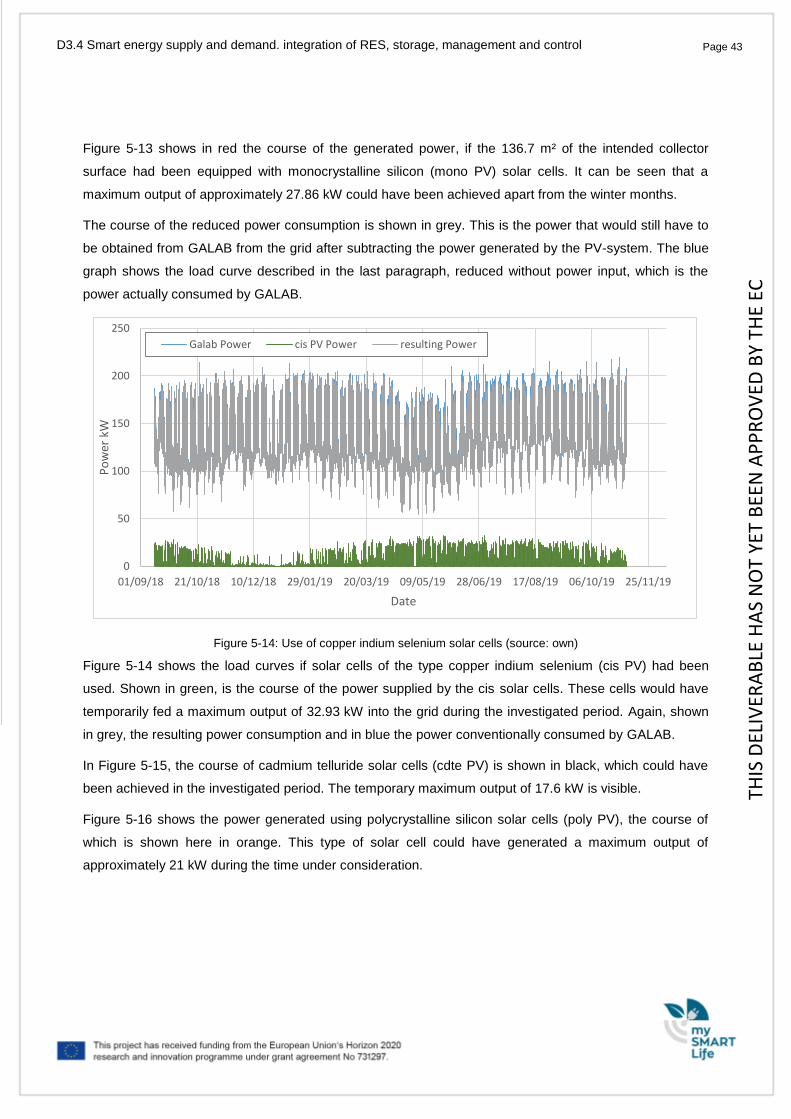
Page 43 Page 43 D3.4 Smart energy supply and demand. integration of RES, storage, management and control
Figure 5-13 shows in red the course of the generated power, if the 136.7 m² of the intended collector
surface had been equipped with monocrystalline silicon (mono PV) solar cells. It can be seen that a
maximum output of approximately 27.86 kW could have been achieved apart from the winter months.
The course of the reduced power consumption is shown in grey. This is the power that would still have to
be obtained from GALAB from the grid after subtracting the power generated by the PV-system. The blue
graph shows the load curve described in the last paragraph, reduced without power input, which is the
power actually consumed by GALAB.
Figure 5-14: Use of copper indium selenium solar cells (source: own)
Figure 5-14 shows the load curves if solar cells of the type copper indium selenium (cis PV) had been
used. Shown in green, is the course of the power supplied by the cis solar cells. These cells would have
temporarily fed a maximum output of 32.93 kW into the grid during the investigated period. Again, shown
in grey, the resulting power consumption and in blue the power conventionally consumed by GALAB.
In Figure 5-15, the course of cadmium telluride solar cells (cdte PV) is shown in black, which could have
been achieved in the investigated period. The temporary maximum output of 17.6 kW is visible.
Figure 5-16 shows the power generated using polycrystalline silicon solar cells (poly PV), the course of
which is shown here in orange. This type of solar cell could have generated a maximum output of
approximately 21 kW during the time under consideration.
0
50
100
150
200
250
01/09/18 21/10/18 10/12/18 29/01/19 20/03/19 09/05/19 28/06/19 17/08/19 06/10/19 25/11/19
Po
wer
kW
Date
Galab Power cis PV Power resulting Power
THIS
DEL
IVER
AB
LE H
AS
NO
T YE
T B
EEN
AP
PR
OV
ED B
Y TH
E EC
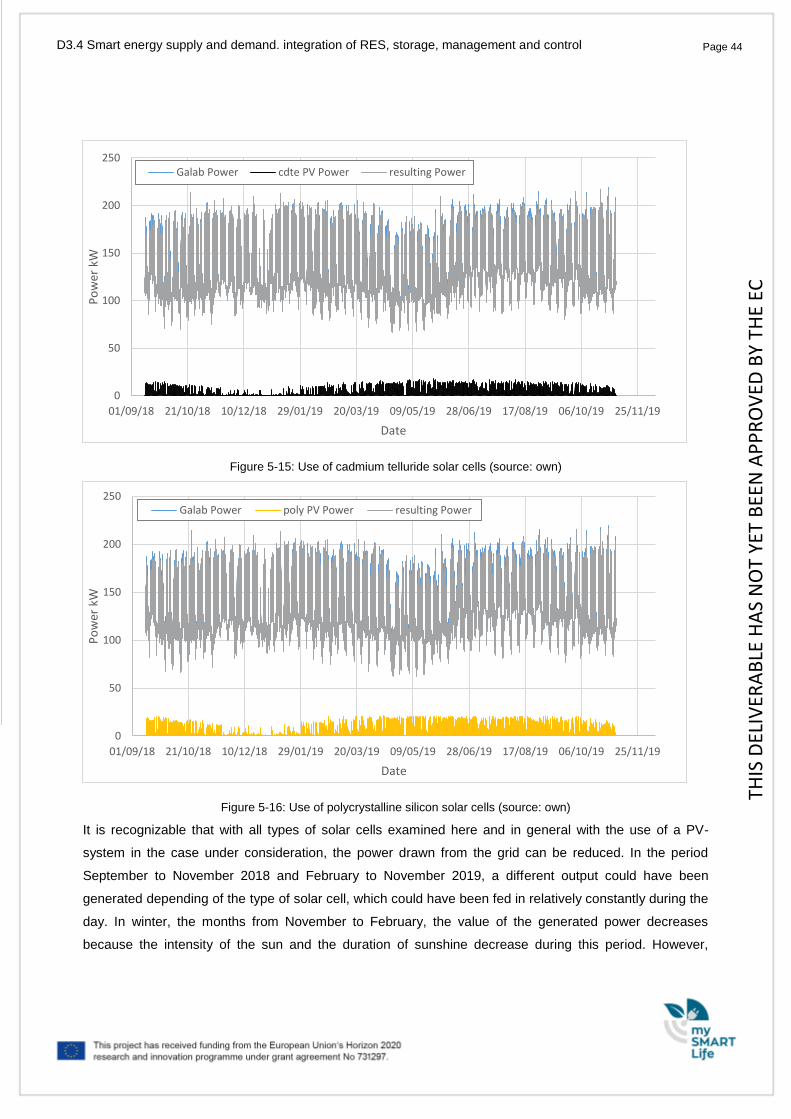
Page 44 Page 44 D3.4 Smart energy supply and demand. integration of RES, storage, management and control
Figure 5-15: Use of cadmium telluride solar cells (source: own)
Figure 5-16: Use of polycrystalline silicon solar cells (source: own)
It is recognizable that with all types of solar cells examined here and in general with the use of a PV-
system in the case under consideration, the power drawn from the grid can be reduced. In the period
September to November 2018 and February to November 2019, a different output could have been
generated depending of the type of solar cell, which could have been fed in relatively constantly during the
day. In winter, the months from November to February, the value of the generated power decreases
because the intensity of the sun and the duration of sunshine decrease during this period. However,
0
50
100
150
200
250
01/09/18 21/10/18 10/12/18 29/01/19 20/03/19 09/05/19 28/06/19 17/08/19 06/10/19 25/11/19
Po
wer
kW
Date
Galab Power cdte PV Power resulting Power
0
50
100
150
200
250
01/09/18 21/10/18 10/12/18 29/01/19 20/03/19 09/05/19 28/06/19 17/08/19 06/10/19 25/11/19
Po
wer
kW
Date
Galab Power poly PV Power resulting Power
THIS
DEL
IVER
AB
LE H
AS
NO
T YE
T B
EEN
AP
PR
OV
ED B
Y TH
E EC
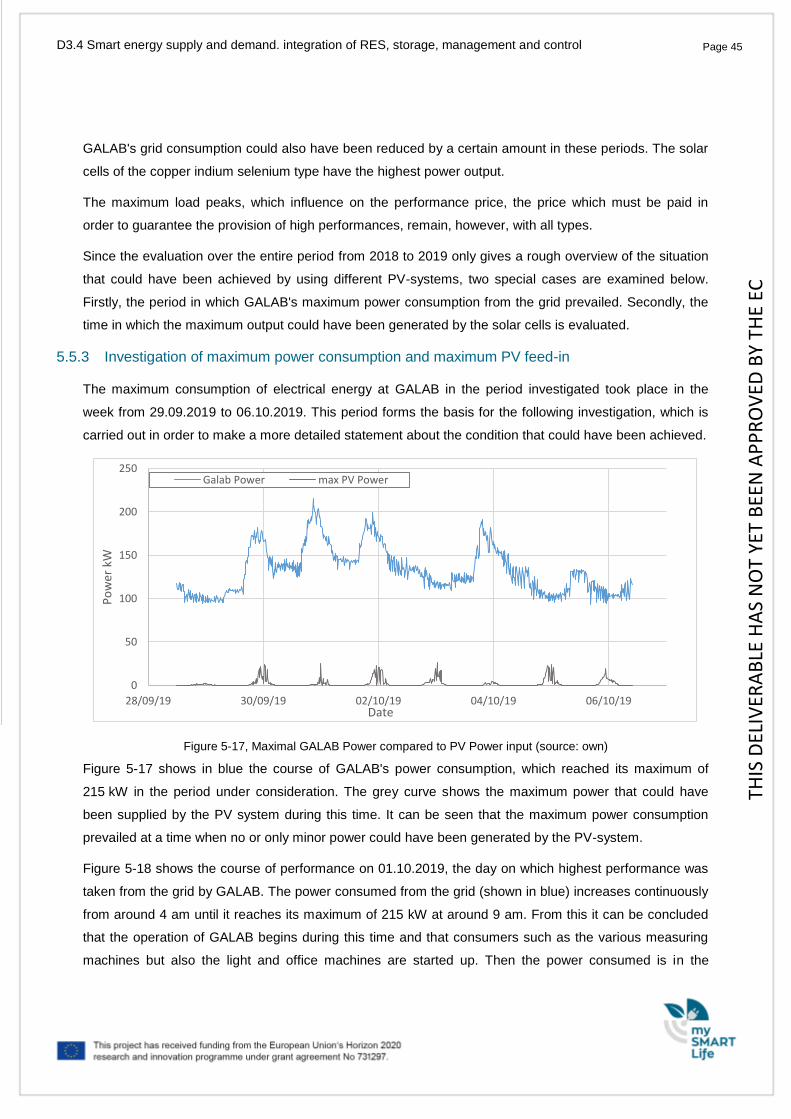
Page 45 Page 45 D3.4 Smart energy supply and demand. integration of RES, storage, management and control
GALAB's grid consumption could also have been reduced by a certain amount in these periods. The solar
cells of the copper indium selenium type have the highest power output.
The maximum load peaks, which influence on the performance price, the price which must be paid in
order to guarantee the provision of high performances, remain, however, with all types.
Since the evaluation over the entire period from 2018 to 2019 only gives a rough overview of the situation
that could have been achieved by using different PV-systems, two special cases are examined below.
Firstly, the period in which GALAB's maximum power consumption from the grid prevailed. Secondly, the
time in which the maximum output could have been generated by the solar cells is evaluated.
5.5.3 Investigation of maximum power consumption and maximum PV feed-in
The maximum consumption of electrical energy at GALAB in the period investigated took place in the
week from 29.09.2019 to 06.10.2019. This period forms the basis for the following investigation, which is
carried out in order to make a more detailed statement about the condition that could have been achieved.
Figure 5-17, Maximal GALAB Power compared to PV Power input (source: own)
Figure 5-17 shows in blue the course of GALAB's power consumption, which reached its maximum of
215 kW in the period under consideration. The grey curve shows the maximum power that could have
been supplied by the PV system during this time. It can be seen that the maximum power consumption
prevailed at a time when no or only minor power could have been generated by the PV-system.
Figure 5-18 shows the course of performance on 01.10.2019, the day on which highest performance was
taken from the grid by GALAB. The power consumed from the grid (shown in blue) increases continuously
from around 4 am until it reaches its maximum of 215 kW at around 9 am. From this it can be concluded
that the operation of GALAB begins during this time and that consumers such as the various measuring
machines but also the light and office machines are started up. Then the power consumed is in the
0
50
100
150
200
250
28/09/19 30/09/19 02/10/19 04/10/19 06/10/19
Po
wer
kW
Date
Galab Power max PV Power
THIS
DEL
IVER
AB
LE H
AS
NO
T YE
T B
EEN
AP
PR
OV
ED B
Y TH
E EC
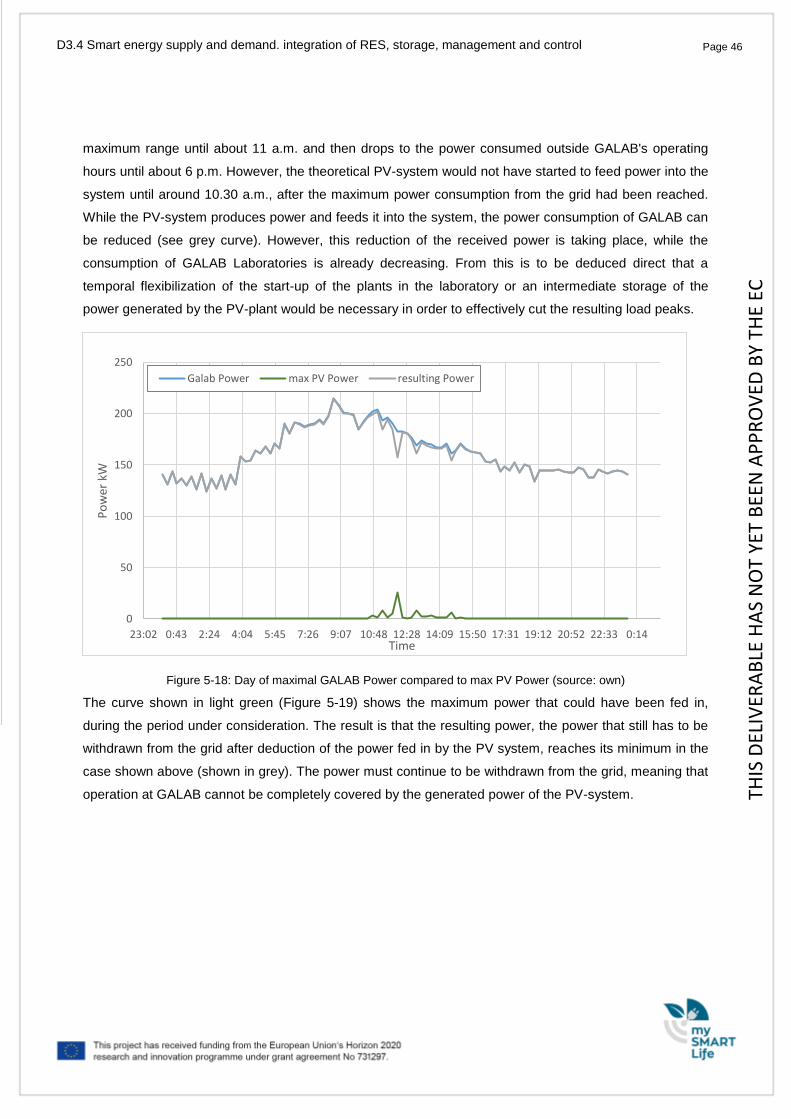
Page 46 Page 46 D3.4 Smart energy supply and demand. integration of RES, storage, management and control
maximum range until about 11 a.m. and then drops to the power consumed outside GALAB's operating
hours until about 6 p.m. However, the theoretical PV-system would not have started to feed power into the
system until around 10.30 a.m., after the maximum power consumption from the grid had been reached.
While the PV-system produces power and feeds it into the system, the power consumption of GALAB can
be reduced (see grey curve). However, this reduction of the received power is taking place, while the
consumption of GALAB Laboratories is already decreasing. From this is to be deduced direct that a
temporal flexibilization of the start-up of the plants in the laboratory or an intermediate storage of the
power generated by the PV-plant would be necessary in order to effectively cut the resulting load peaks.
Figure 5-18: Day of maximal GALAB Power compared to max PV Power (source: own)
The curve shown in light green (Figure 5-19) shows the maximum power that could have been fed in,
during the period under consideration. The result is that the resulting power, the power that still has to be
withdrawn from the grid after deduction of the power fed in by the PV system, reaches its minimum in the
case shown above (shown in grey). The power must continue to be withdrawn from the grid, meaning that
operation at GALAB cannot be completely covered by the generated power of the PV-system.
0
50
100
150
200
250
23:02 0:43 2:24 4:04 5:45 7:26 9:07 10:48 12:28 14:09 15:50 17:31 19:12 20:52 22:33 0:14
Po
wer
kW
Time
Galab Power max PV Power resulting Power
THIS
DEL
IVER
AB
LE H
AS
NO
T YE
T B
EEN
AP
PR
OV
ED B
Y TH
E EC
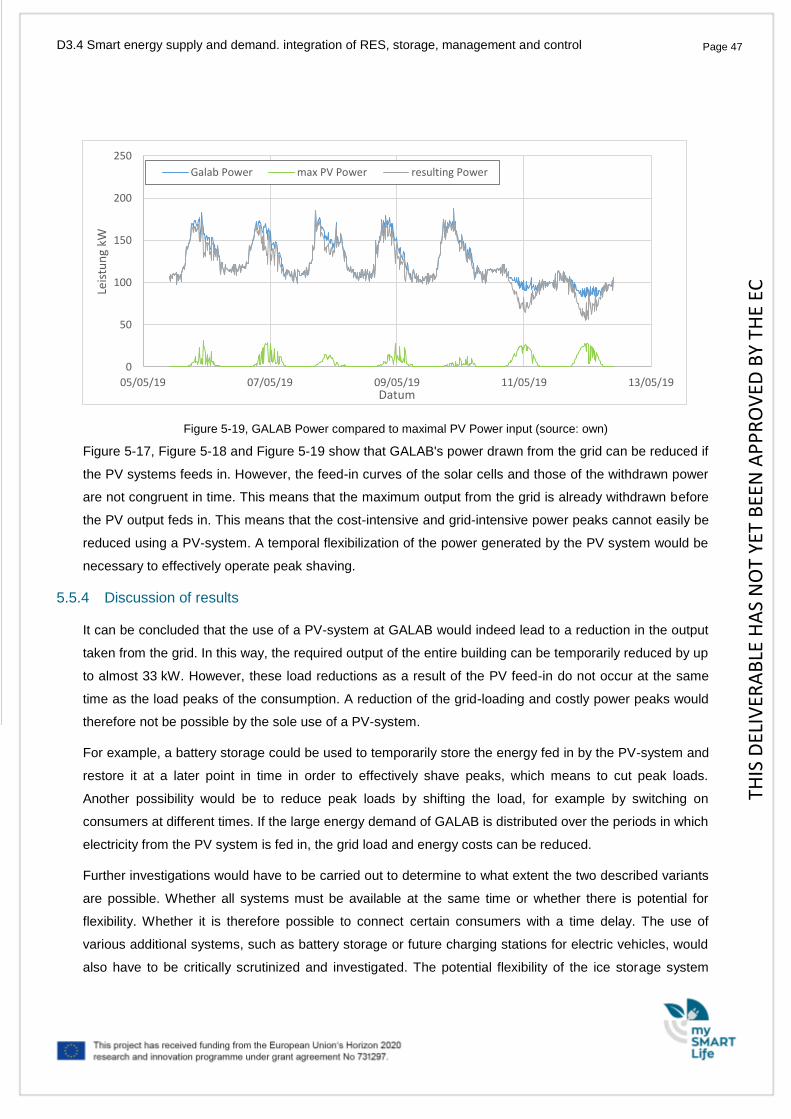
Page 47 Page 47 D3.4 Smart energy supply and demand. integration of RES, storage, management and control
Figure 5-19, GALAB Power compared to maximal PV Power input (source: own)
Figure 5-17, Figure 5-18 and Figure 5-19 show that GALAB's power drawn from the grid can be reduced if
the PV systems feeds in. However, the feed-in curves of the solar cells and those of the withdrawn power
are not congruent in time. This means that the maximum output from the grid is already withdrawn before
the PV output feds in. This means that the cost-intensive and grid-intensive power peaks cannot easily be
reduced using a PV-system. A temporal flexibilization of the power generated by the PV system would be
necessary to effectively operate peak shaving.
5.5.4 Discussion of results
It can be concluded that the use of a PV-system at GALAB would indeed lead to a reduction in the output
taken from the grid. In this way, the required output of the entire building can be temporarily reduced by up
to almost 33 kW. However, these load reductions as a result of the PV feed-in do not occur at the same
time as the load peaks of the consumption. A reduction of the grid-loading and costly power peaks would
therefore not be possible by the sole use of a PV-system.
For example, a battery storage could be used to temporarily store the energy fed in by the PV-system and
restore it at a later point in time in order to effectively shave peaks, which means to cut peak loads.
Another possibility would be to reduce peak loads by shifting the load, for example by switching on
consumers at different times. If the large energy demand of GALAB is distributed over the periods in which
electricity from the PV system is fed in, the grid load and energy costs can be reduced.
Further investigations would have to be carried out to determine to what extent the two described variants
are possible. Whether all systems must be available at the same time or whether there is potential for
flexibility. Whether it is therefore possible to connect certain consumers with a time delay. The use of
various additional systems, such as battery storage or future charging stations for electric vehicles, would
also have to be critically scrutinized and investigated. The potential flexibility of the ice storage system
0
50
100
150
200
250
05/05/19 07/05/19 09/05/19 11/05/19 13/05/19
Leis
tun
g kW
Datum
Galab Power max PV Power resulting Power
THIS
DEL
IVER
AB
LE H
AS
NO
T YE
T B
EEN
AP
PR
OV
ED B
Y TH
E EC
Page 48 Page 48 D3.4 Smart energy supply and demand. integration of RES, storage, management and control
used by GALAB should not be overlooked. In addition, it would have to be investigated how great the
energetic and monetary effects of such a load shift or load reduction by the PV-system and other
additional systems would be. These open questions will be investigated in the further course, especially in
the monitoring phase of the project.
THIS
DEL
IVER
AB
LE H
AS
NO
T YE
T B
EEN
AP
PR
OV
ED B
Y TH
E EC
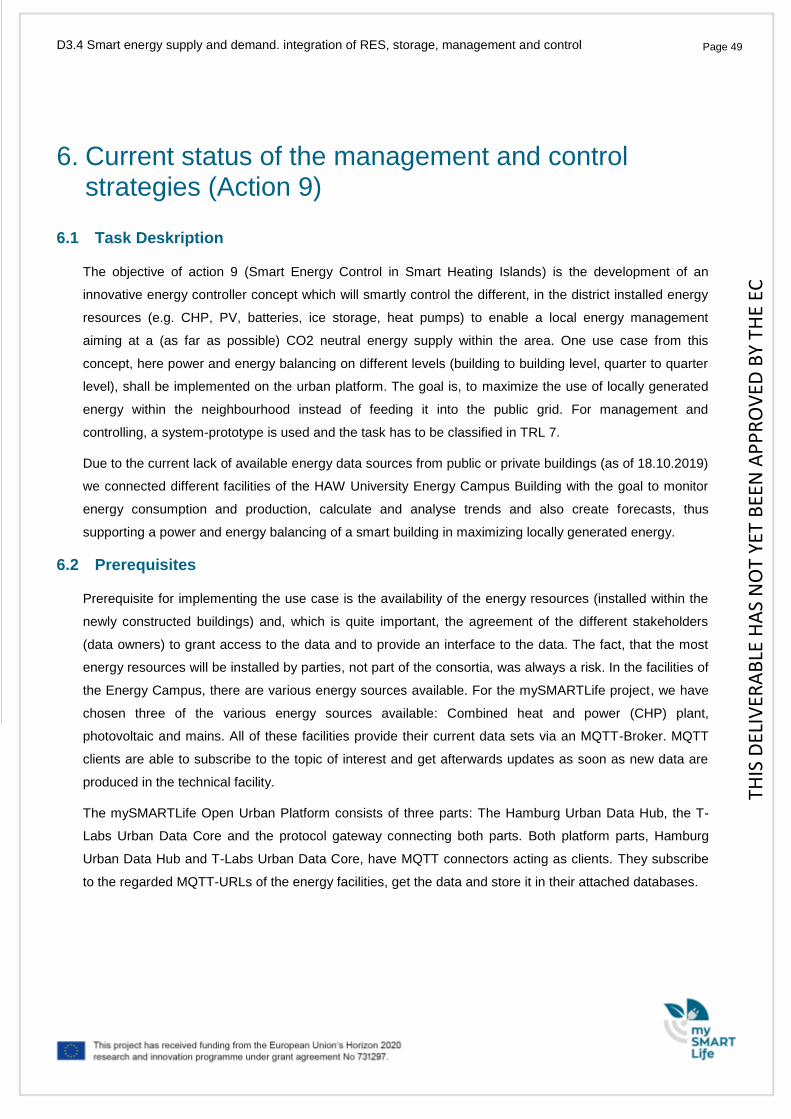
Page 49 Page 49 D3.4 Smart energy supply and demand. integration of RES, storage, management and control
6. Current status of the management and control strategies (Action 9)
6.1 Task Deskription
The objective of action 9 (Smart Energy Control in Smart Heating Islands) is the development of an
innovative energy controller concept which will smartly control the different, in the district installed energy
resources (e.g. CHP, PV, batteries, ice storage, heat pumps) to enable a local energy management
aiming at a (as far as possible) CO2 neutral energy supply within the area. One use case from this
concept, here power and energy balancing on different levels (building to building level, quarter to quarter
level), shall be implemented on the urban platform. The goal is, to maximize the use of locally generated
energy within the neighbourhood instead of feeding it into the public grid. For management and
controlling, a system-prototype is used and the task has to be classified in TRL 7.
Due to the current lack of available energy data sources from public or private buildings (as of 18.10.2019)
we connected different facilities of the HAW University Energy Campus Building with the goal to monitor
energy consumption and production, calculate and analyse trends and also create forecasts, thus
supporting a power and energy balancing of a smart building in maximizing locally generated energy.
6.2 Prerequisites
Prerequisite for implementing the use case is the availability of the energy resources (installed within the
newly constructed buildings) and, which is quite important, the agreement of the different stakeholders
(data owners) to grant access to the data and to provide an interface to the data. The fact, that the most
energy resources will be installed by parties, not part of the consortia, was always a risk. In the facilities of
the Energy Campus, there are various energy sources available. For the mySMARTLife project, we have
chosen three of the various energy sources available: Combined heat and power (CHP) plant,
photovoltaic and mains. All of these facilities provide their current data sets via an MQTT-Broker. MQTT
clients are able to subscribe to the topic of interest and get afterwards updates as soon as new data are
produced in the technical facility.
The mySMARTLife Open Urban Platform consists of three parts: The Hamburg Urban Data Hub, the T-
Labs Urban Data Core and the protocol gateway connecting both parts. Both platform parts, Hamburg
Urban Data Hub and T-Labs Urban Data Core, have MQTT connectors acting as clients. They subscribe
to the regarded MQTT-URLs of the energy facilities, get the data and store it in their attached databases.
THIS
DEL
IVER
AB
LE H
AS
NO
T YE
T B
EEN
AP
PR
OV
ED B
Y TH
E EC
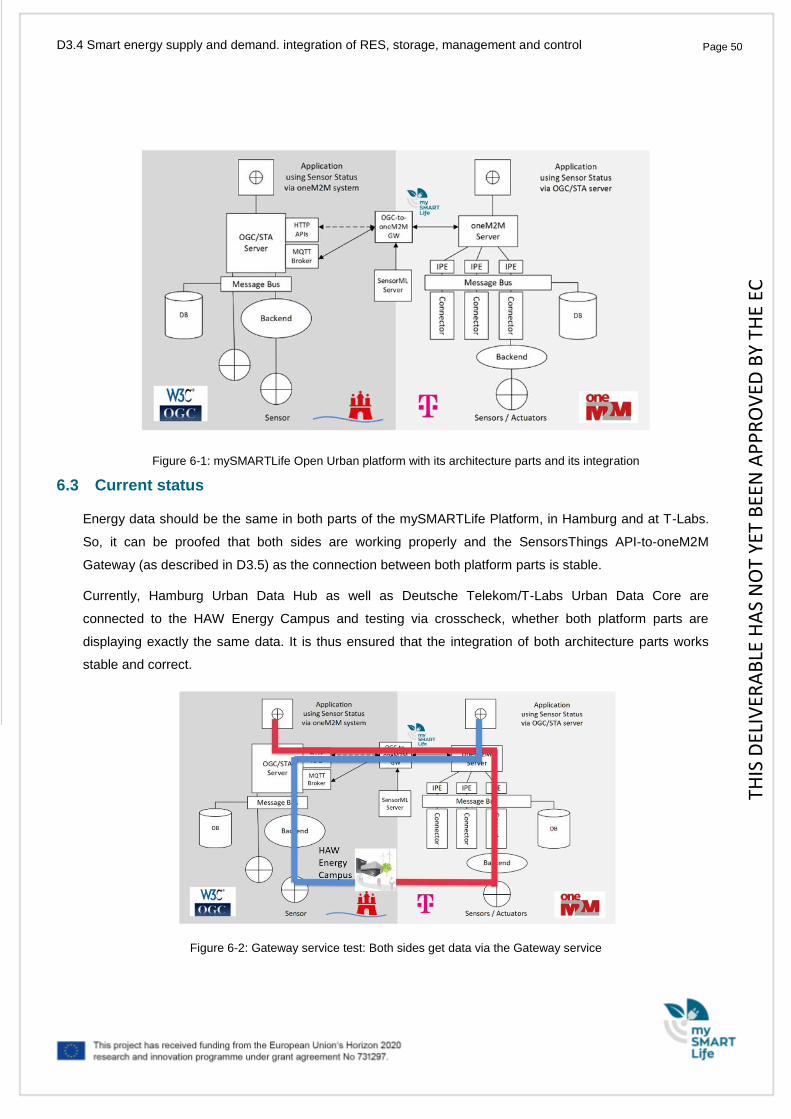
Page 50 Page 50 D3.4 Smart energy supply and demand. integration of RES, storage, management and control
Figure 6-1: mySMARTLife Open Urban platform with its architecture parts and its integration
6.3 Current status
Energy data should be the same in both parts of the mySMARTLife Platform, in Hamburg and at T-Labs.
So, it can be proofed that both sides are working properly and the SensorsThings API-to-oneM2M
Gateway (as described in D3.5) as the connection between both platform parts is stable.
Currently, Hamburg Urban Data Hub as well as Deutsche Telekom/T-Labs Urban Data Core are
connected to the HAW Energy Campus and testing via crosscheck, whether both platform parts are
displaying exactly the same data. It is thus ensured that the integration of both architecture parts works
stable and correct.
Figure 6-2: Gateway service test: Both sides get data via the Gateway service
THIS
DEL
IVER
AB
LE H
AS
NO
T YE
T B
EEN
AP
PR
OV
ED B
Y TH
E EC
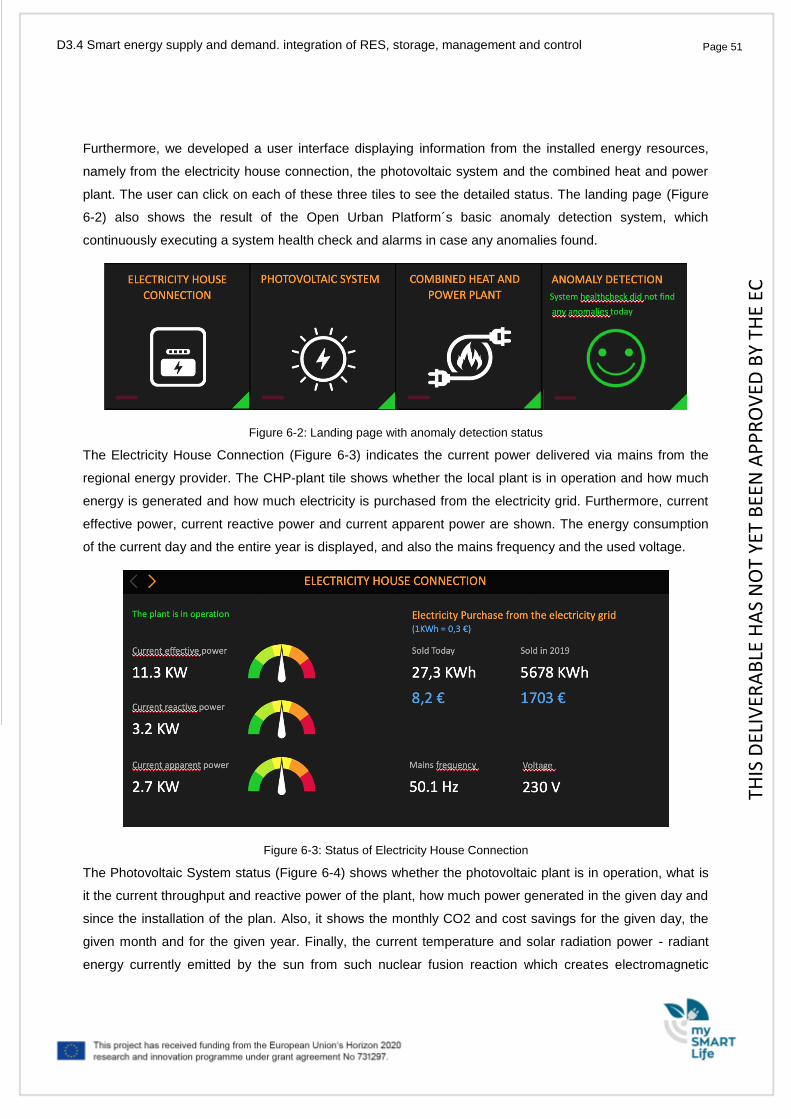
Page 51 Page 51 D3.4 Smart energy supply and demand. integration of RES, storage, management and control
Furthermore, we developed a user interface displaying information from the installed energy resources,
namely from the electricity house connection, the photovoltaic system and the combined heat and power
plant. The user can click on each of these three tiles to see the detailed status. The landing page (Figure
6-2) also shows the result of the Open Urban Platform´s basic anomaly detection system, which
continuously executing a system health check and alarms in case any anomalies found.
Figure 6-2: Landing page with anomaly detection status
The Electricity House Connection (Figure 6-3) indicates the current power delivered via mains from the
regional energy provider. The CHP-plant tile shows whether the local plant is in operation and how much
energy is generated and how much electricity is purchased from the electricity grid. Furthermore, current
effective power, current reactive power and current apparent power are shown. The energy consumption
of the current day and the entire year is displayed, and also the mains frequency and the used voltage.
Figure 6-3: Status of Electricity House Connection
The Photovoltaic System status (Figure 6-4) shows whether the photovoltaic plant is in operation, what is
it the current throughput and reactive power of the plant, how much power generated in the given day and
since the installation of the plan. Also, it shows the monthly CO2 and cost savings for the given day, the
given month and for the given year. Finally, the current temperature and solar radiation power - radiant
energy currently emitted by the sun from such nuclear fusion reaction which creates electromagnetic
THIS
DEL
IVER
AB
LE H
AS
NO
T YE
T B
EEN
AP
PR
OV
ED B
Y TH
E EC
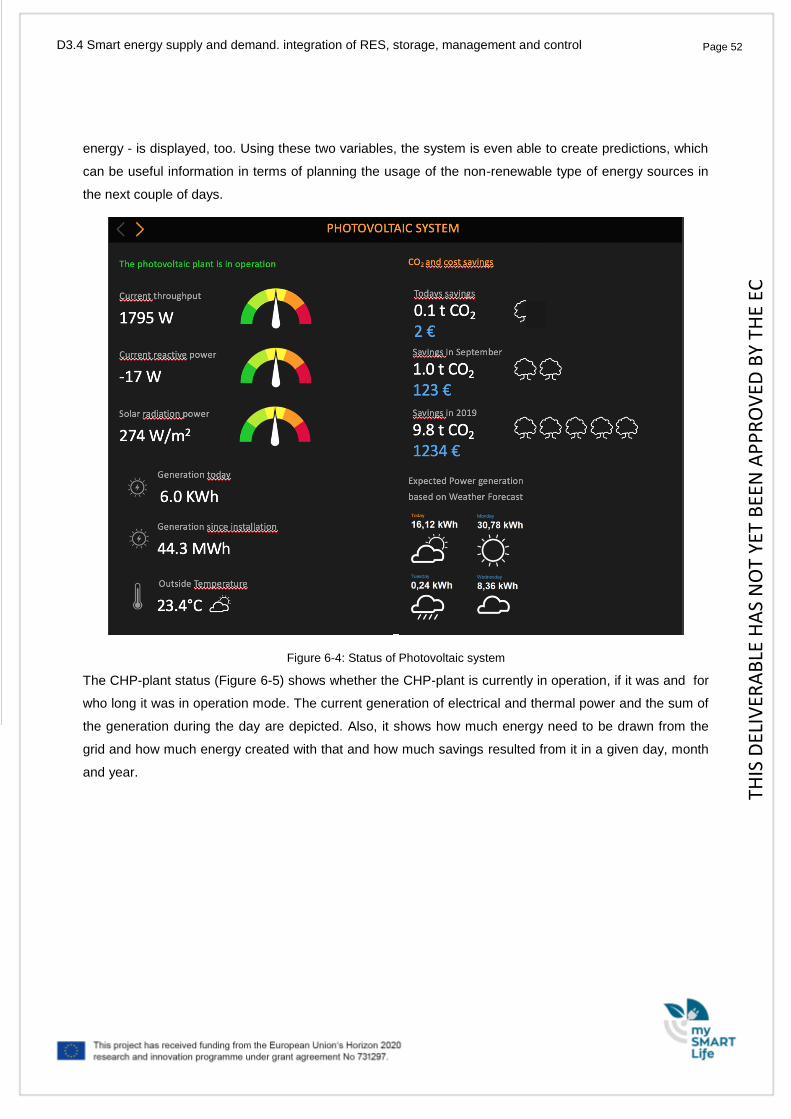
Page 52 Page 52 D3.4 Smart energy supply and demand. integration of RES, storage, management and control
energy - is displayed, too. Using these two variables, the system is even able to create predictions, which
can be useful information in terms of planning the usage of the non-renewable type of energy sources in
the next couple of days.
Figure 6-4: Status of Photovoltaic system
The CHP-plant status (Figure 6-5) shows whether the CHP-plant is currently in operation, if it was and for
who long it was in operation mode. The current generation of electrical and thermal power and the sum of
the generation during the day are depicted. Also, it shows how much energy need to be drawn from the
grid and how much energy created with that and how much savings resulted from it in a given day, month
and year.
THIS
DEL
IVER
AB
LE H
AS
NO
T YE
T B
EEN
AP
PR
OV
ED B
Y TH
E EC
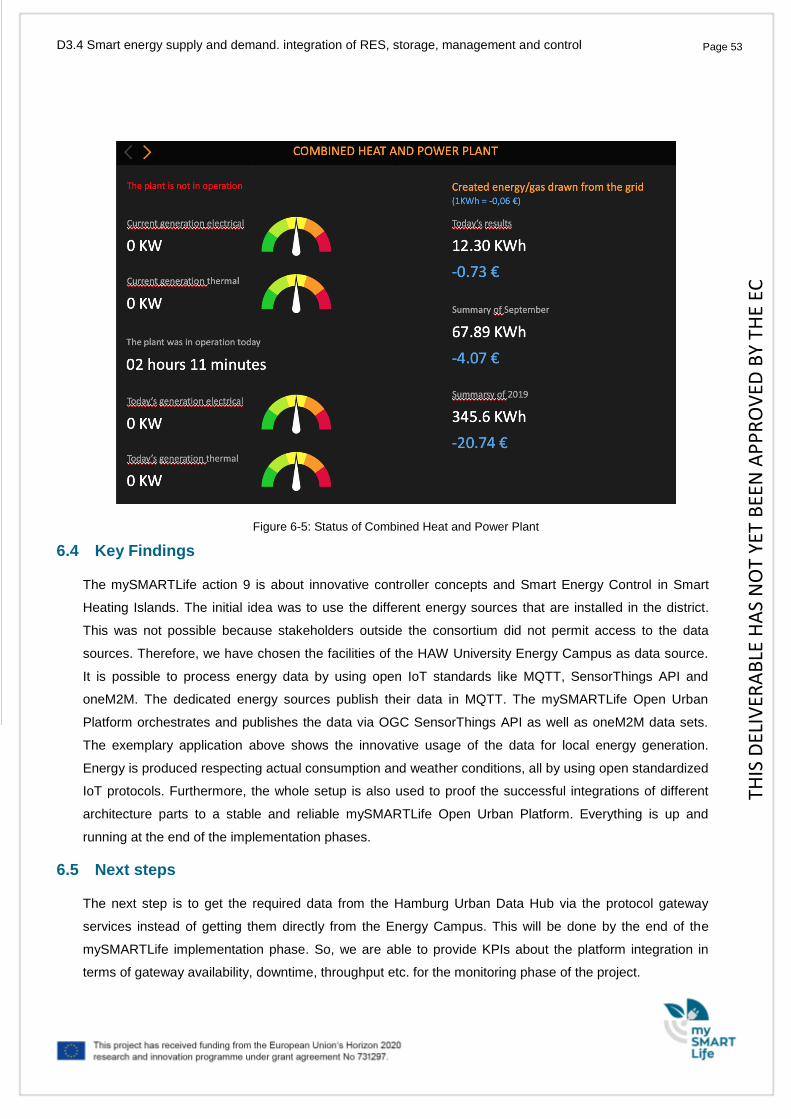
Page 53 Page 53 D3.4 Smart energy supply and demand. integration of RES, storage, management and control
Figure 6-5: Status of Combined Heat and Power Plant
6.4 Key Findings
The mySMARTLife action 9 is about innovative controller concepts and Smart Energy Control in Smart
Heating Islands. The initial idea was to use the different energy sources that are installed in the district.
This was not possible because stakeholders outside the consortium did not permit access to the data
sources. Therefore, we have chosen the facilities of the HAW University Energy Campus as data source.
It is possible to process energy data by using open IoT standards like MQTT, SensorThings API and
oneM2M. The dedicated energy sources publish their data in MQTT. The mySMARTLife Open Urban
Platform orchestrates and publishes the data via OGC SensorThings API as well as oneM2M data sets.
The exemplary application above shows the innovative usage of the data for local energy generation.
Energy is produced respecting actual consumption and weather conditions, all by using open standardized
IoT protocols. Furthermore, the whole setup is also used to proof the successful integrations of different
architecture parts to a stable and reliable mySMARTLife Open Urban Platform. Everything is up and
running at the end of the implementation phases.
6.5 Next steps
The next step is to get the required data from the Hamburg Urban Data Hub via the protocol gateway
services instead of getting them directly from the Energy Campus. This will be done by the end of the
mySMARTLife implementation phase. So, we are able to provide KPIs about the platform integration in
terms of gateway availability, downtime, throughput etc. for the monitoring phase of the project.
THIS
DEL
IVER
AB
LE H
AS
NO
T YE
T B
EEN
AP
PR
OV
ED B
Y TH
E EC
Page 54 Page 54 D3.4 Smart energy supply and demand. integration of RES, storage, management and control
7. Innovative Buildings
One main objective of the mySMARTLife project is the introduction of smart energy solutions. In the
previous chapters different solutions for the generation of renewable energies are presented combined
with strategies for a smart integration into the supply system of individual buildings, quarters or even larger
areas, which is the case when grid services are considered. The following chapter focuses on different
aspects of smart energy. With the implementation of a smart home assistant system and the roll out and
installation of different modern measuring systems, the demand side in the topic of smart energy is
covered in Hamburg within muSMARTLife too. The smart home system is implemented in retirement
apartments and is combined with a care service. This combined approach adds an additional social
aspect to the concepts of smart homes that not only allows conclusions regarding the functionality of the
implemented technology.
Another aspect that is already addressed in the smart home action, but even more in the smart metering
actions, is the idea to raise awareness regarding the personal energy consumption. The visualisation of
energy demands is a key measure for this. Once the demand is visualised it is can easier to connect the
personal energy consumption with the different actions in the household and eventually reduce the energy
consumption. Different metering technologies were planned to be introduced in the project area in
Hamburg-Bergedorf within mySMARTLife. Despite the efforts of the project partners, due to reasons that
could not be influenced not all technologies can be installed within the project duration for reasons beyond
their control.
7.1 Smart home assistant living
Against the background of a steadily aging society in Germany and in many parts of Europe, the smart
home solution implemented in mySMARTLife focuses on two main aspects: to offer helpful services for
elderly people in their daily life and to control and reduce the energy consumption of their main electricity
consumers in their apartments. Furthermore, with the integration of household services, offered by trained
people from outside of the regular labor market, a social aspect was integrated to provide an integrative
approach to this intervention.
7.1.1 Evolution of the Task
From the start of the project, several meetings with local investors and housing companies have been
conducted with the aim to promote the installation of smart home systems. The first attempt of the action
was an implementation of smart homes at the new buildings in project zone 1, the “Schleusengraben
area”, as a technical upgrade or service for possible tenants. Different aspects of smart home solutions
have been discussed, like systems with deep integration in the buildings infrastructure. These should have
helped to reduce energy consumption of households or included systems to organize community aspects,
THIS
DEL
IVER
AB
LE H
AS
NO
T YE
T B
EEN
AP
PR
OV
ED B
Y TH
E EC
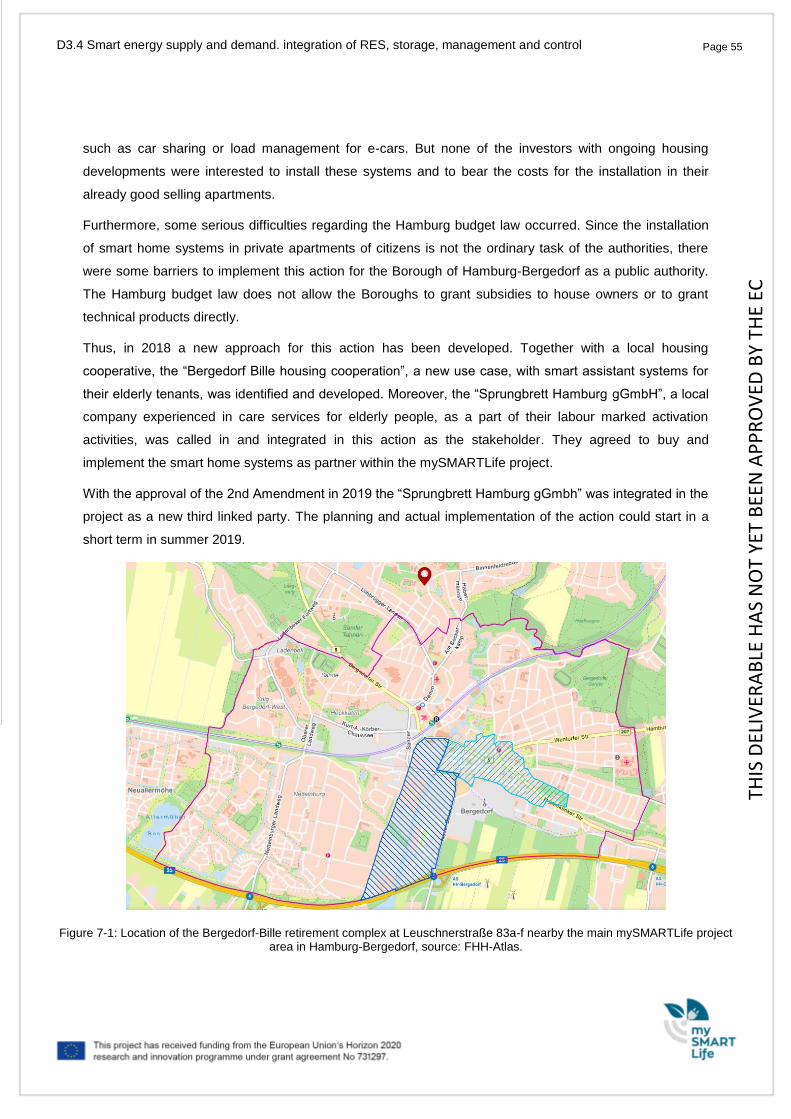
Page 55 Page 55 D3.4 Smart energy supply and demand. integration of RES, storage, management and control
such as car sharing or load management for e-cars. But none of the investors with ongoing housing
developments were interested to install these systems and to bear the costs for the installation in their
already good selling apartments.
Furthermore, some serious difficulties regarding the Hamburg budget law occurred. Since the installation
of smart home systems in private apartments of citizens is not the ordinary task of the authorities, there
were some barriers to implement this action for the Borough of Hamburg-Bergedorf as a public authority.
The Hamburg budget law does not allow the Boroughs to grant subsidies to house owners or to grant
technical products directly.
Thus, in 2018 a new approach for this action has been developed. Together with a local housing
cooperative, the “Bergedorf Bille housing cooperation”, a new use case, with smart assistant systems for
their elderly tenants, was identified and developed. Moreover, the “Sprungbrett Hamburg gGmbH”, a local
company experienced in care services for elderly people, as a part of their labour marked activation
activities, was called in and integrated in this action as the stakeholder. They agreed to buy and
implement the smart home systems as partner within the mySMARTLife project.
With the approval of the 2nd Amendment in 2019 the “Sprungbrett Hamburg gGmbh” was integrated in the
project as a new third linked party. The planning and actual implementation of the action could start in a
short term in summer 2019.
Figure 7-1: Location of the Bergedorf-Bille retirement complex at Leuschnerstraße 83a-f nearby the main mySMARTLife project area in Hamburg-Bergedorf, source: FHH-Atlas.
THIS
DEL
IVER
AB
LE H
AS
NO
T YE
T B
EEN
AP
PR
OV
ED B
Y TH
E EC
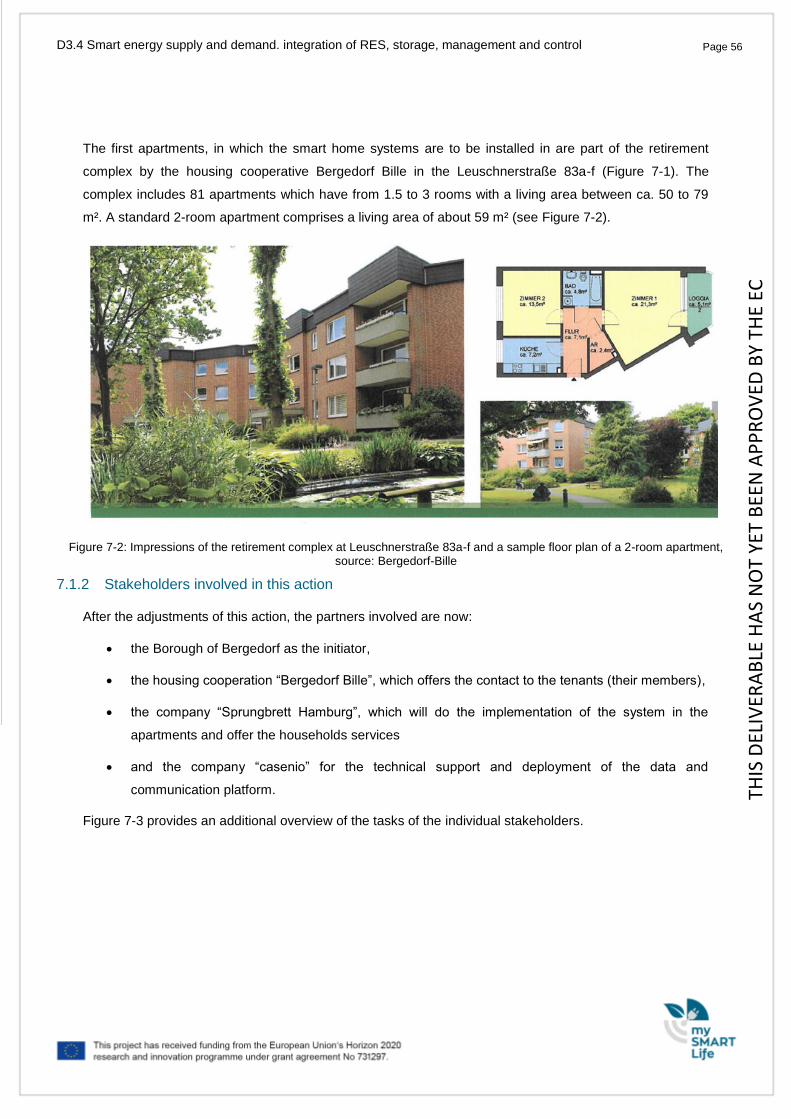
Page 56 Page 56 D3.4 Smart energy supply and demand. integration of RES, storage, management and control
The first apartments, in which the smart home systems are to be installed in are part of the retirement
complex by the housing cooperative Bergedorf Bille in the Leuschnerstraße 83a-f (Figure 7-1). The
complex includes 81 apartments which have from 1.5 to 3 rooms with a living area between ca. 50 to 79
m². A standard 2-room apartment comprises a living area of about 59 m² (see Figure 7-2).
Figure 7-2: Impressions of the retirement complex at Leuschnerstraße 83a-f and a sample floor plan of a 2-room apartment, source: Bergedorf-Bille
7.1.2 Stakeholders involved in this action
After the adjustments of this action, the partners involved are now:
the Borough of Bergedorf as the initiator,
the housing cooperation “Bergedorf Bille”, which offers the contact to the tenants (their members),
the company “Sprungbrett Hamburg”, which will do the implementation of the system in the
apartments and offer the households services
and the company “casenio” for the technical support and deployment of the data and
communication platform.
Figure 7-3 provides an additional overview of the tasks of the individual stakeholders.
THIS
DEL
IVER
AB
LE H
AS
NO
T YE
T B
EEN
AP
PR
OV
ED B
Y TH
E EC
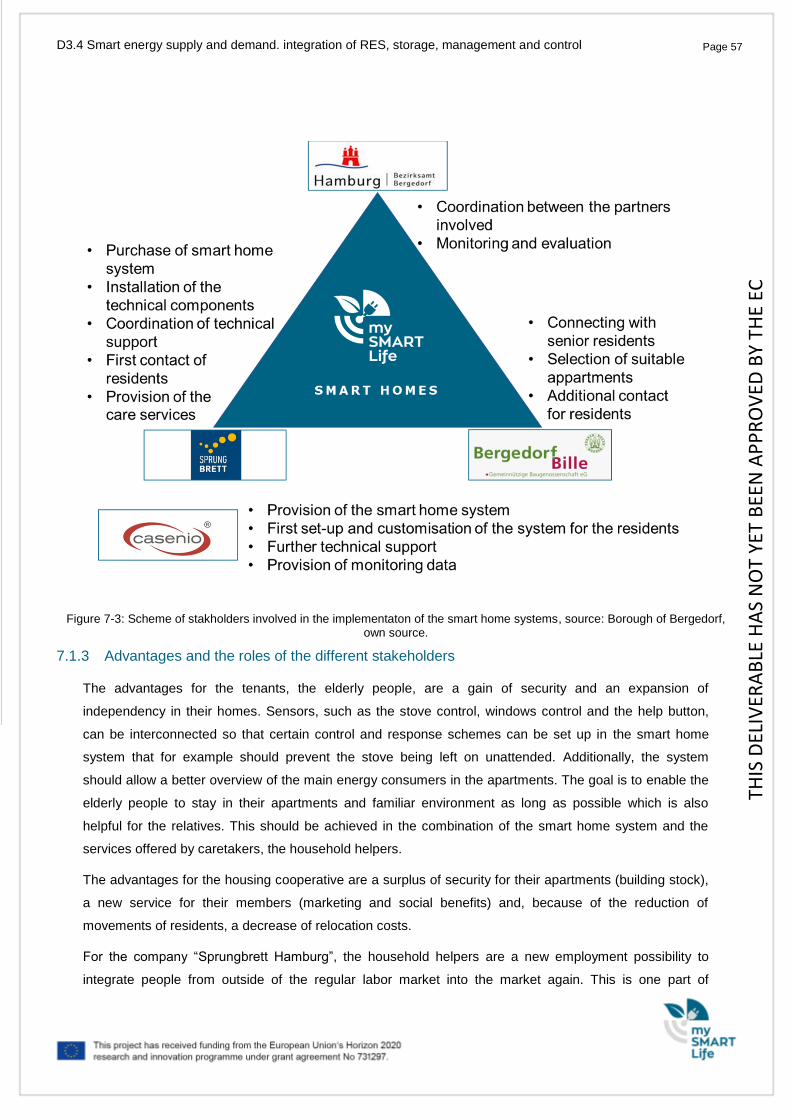
Page 57 Page 57 D3.4 Smart energy supply and demand. integration of RES, storage, management and control
Figure 7-3: Scheme of stakholders involved in the implementaton of the smart home systems, source: Borough of Bergedorf, own source.
7.1.3 Advantages and the roles of the different stakeholders
The advantages for the tenants, the elderly people, are a gain of security and an expansion of
independency in their homes. Sensors, such as the stove control, windows control and the help button,
can be interconnected so that certain control and response schemes can be set up in the smart home
system that for example should prevent the stove being left on unattended. Additionally, the system
should allow a better overview of the main energy consumers in the apartments. The goal is to enable the
elderly people to stay in their apartments and familiar environment as long as possible which is also
helpful for the relatives. This should be achieved in the combination of the smart home system and the
services offered by caretakers, the household helpers.
The advantages for the housing cooperative are a surplus of security for their apartments (building stock),
a new service for their members (marketing and social benefits) and, because of the reduction of
movements of residents, a decrease of relocation costs.
For the company “Sprungbrett Hamburg”, the household helpers are a new employment possibility to
integrate people from outside of the regular labor market into the market again. This is one part of
THIS
DEL
IVER
AB
LE H
AS
NO
T YE
T B
EEN
AP
PR
OV
ED B
Y TH
E EC
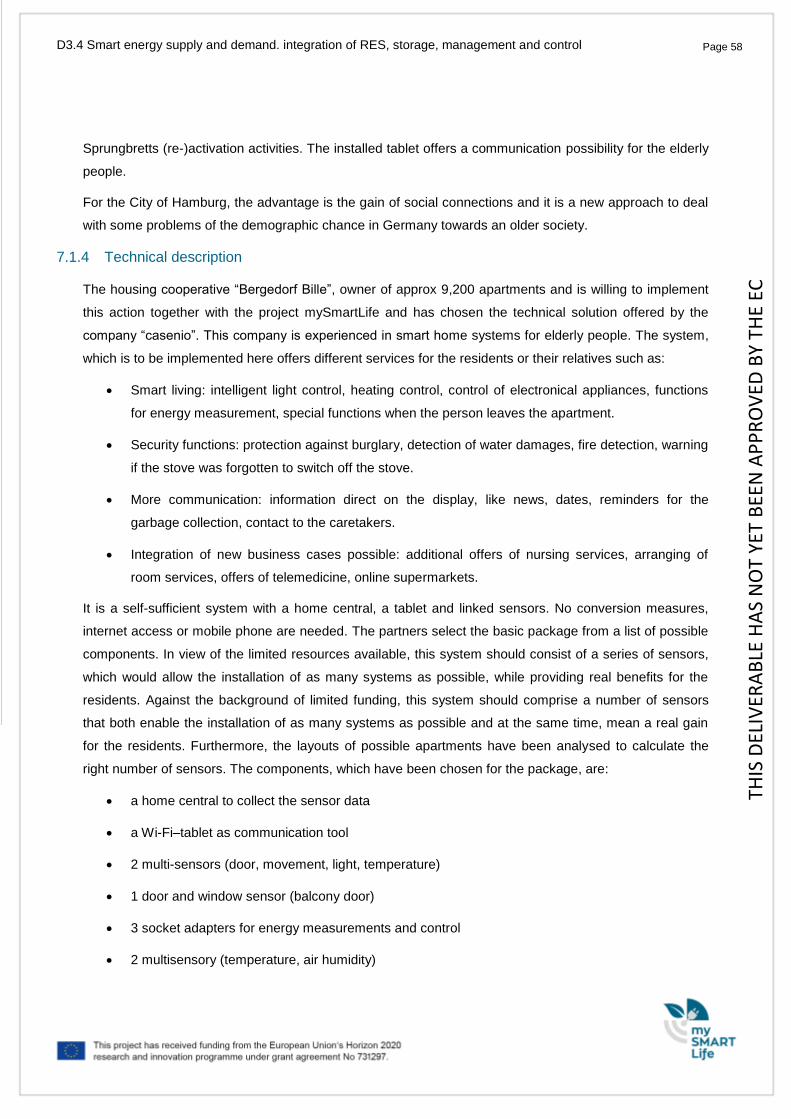
Page 58 Page 58 D3.4 Smart energy supply and demand. integration of RES, storage, management and control
Sprungbretts (re-)activation activities. The installed tablet offers a communication possibility for the elderly
people.
For the City of Hamburg, the advantage is the gain of social connections and it is a new approach to deal
with some problems of the demographic chance in Germany towards an older society.
7.1.4 Technical description
The housing cooperative “Bergedorf Bille”, owner of approx 9,200 apartments and is willing to implement
this action together with the project mySmartLife and has chosen the technical solution offered by the
company “casenio”. This company is experienced in smart home systems for elderly people. The system,
which is to be implemented here offers different services for the residents or their relatives such as:
Smart living: intelligent light control, heating control, control of electronical appliances, functions
for energy measurement, special functions when the person leaves the apartment.
Security functions: protection against burglary, detection of water damages, fire detection, warning
if the stove was forgotten to switch off the stove.
More communication: information direct on the display, like news, dates, reminders for the
garbage collection, contact to the caretakers.
Integration of new business cases possible: additional offers of nursing services, arranging of
room services, offers of telemedicine, online supermarkets.
It is a self-sufficient system with a home central, a tablet and linked sensors. No conversion measures,
internet access or mobile phone are needed. The partners select the basic package from a list of possible
components. In view of the limited resources available, this system should consist of a series of sensors,
which would allow the installation of as many systems as possible, while providing real benefits for the
residents. Against the background of limited funding, this system should comprise a number of sensors
that both enable the installation of as many systems as possible and at the same time, mean a real gain
for the residents. Furthermore, the layouts of possible apartments have been analysed to calculate the
right number of sensors. The components, which have been chosen for the package, are:
a home central to collect the sensor data
a Wi-Fi–tablet as communication tool
2 multi-sensors (door, movement, light, temperature)
1 door and window sensor (balcony door)
3 socket adapters for energy measurements and control
2 multisensory (temperature, air humidity)
THIS
DEL
IVER
AB
LE H
AS
NO
T YE
T B
EEN
AP
PR
OV
ED B
Y TH
E EC
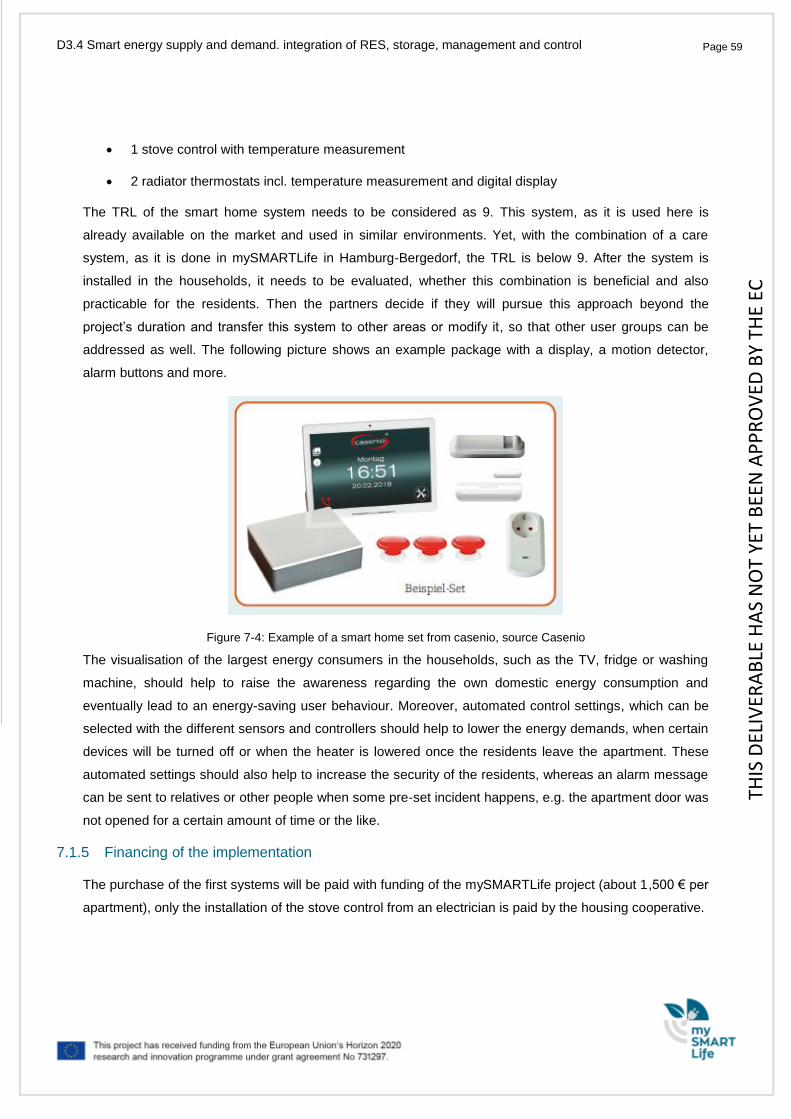
Page 59 Page 59 D3.4 Smart energy supply and demand. integration of RES, storage, management and control
1 stove control with temperature measurement
2 radiator thermostats incl. temperature measurement and digital display
The TRL of the smart home system needs to be considered as 9. This system, as it is used here is
already available on the market and used in similar environments. Yet, with the combination of a care
system, as it is done in mySMARTLife in Hamburg-Bergedorf, the TRL is below 9. After the system is
installed in the households, it needs to be evaluated, whether this combination is beneficial and also
practicable for the residents. Then the partners decide if they will pursue this approach beyond the
project’s duration and transfer this system to other areas or modify it, so that other user groups can be
addressed as well. The following picture shows an example package with a display, a motion detector,
alarm buttons and more.
Figure 7-4: Example of a smart home set from casenio, source Casenio
The visualisation of the largest energy consumers in the households, such as the TV, fridge or washing
machine, should help to raise the awareness regarding the own domestic energy consumption and
eventually lead to an energy-saving user behaviour. Moreover, automated control settings, which can be
selected with the different sensors and controllers should help to lower the energy demands, when certain
devices will be turned off or when the heater is lowered once the residents leave the apartment. These
automated settings should also help to increase the security of the residents, whereas an alarm message
can be sent to relatives or other people when some pre-set incident happens, e.g. the apartment door was
not opened for a certain amount of time or the like.
7.1.5 Financing of the implementation
The purchase of the first systems will be paid with funding of the mySMARTLife project (about 1,500 € per
apartment), only the installation of the stove control from an electrician is paid by the housing cooperative.
THIS
DEL
IVER
AB
LE H
AS
NO
T YE
T B
EEN
AP
PR
OV
ED B
Y TH
E EC
Page 60 Page 60 D3.4 Smart energy supply and demand. integration of RES, storage, management and control
The training of the household helpers is paid with national labour market funding. The hours of services for
the elderly people can be paid by their insurance when they have care level 1. Otherwise they have to pay
for the services on an hourly basis.
7.1.6 Implementation plan
The implementation of the action is still ongoing. After the Amendment, which included the reorganization
of this intervention, was approved, the responsible partners started directly with the implementation. Since
the Bergedorf Bille housing cooperative maintains a very good and direct contact to their cooperative
members, some suitable housing estates with nearly exclusively senior living could be identified and the
tenants be addressed.
When the elderly residents were addressed, it was ensured, that this was done via the established
channels and formats of the housing cooperative. This was done in order to avoid any possible fears of
the new technology. Altogether, by October 2019, two information events were accomplished, in a
neighbourhood meeting place of the cooperative, additional smaller events are planned for the following
months. At the first meeting on 22/08/2019, 81 tenants were invited and 17 people attended the event, of
whom 14 households expressed interest in a smart home system. At the second event on 08/10/2019,
335 tenants were even addressed and 48 tenants appeared, 32 households expressed interest.
Figure 7-5: Information event at a local community centre of the housing cooperation, source: Borough of Bergedorf.
In the next step, the tenants who have expressed interest are contacted and consulted separately by the
partner Sprungbrett. A date for the installation of the system is agreed upon together.
During the information events the tenants were also informed, that this measure is part of an EU research
project and that during the monitoring phase the collected energy data of the consumers will be evaluated
anonymously by the project. They were further informed that the HCU as well will address the users of a
THIS
DEL
IVER
AB
LE H
AS
NO
T YE
T B
EEN
AP
PR
OV
ED B
Y TH
E EC
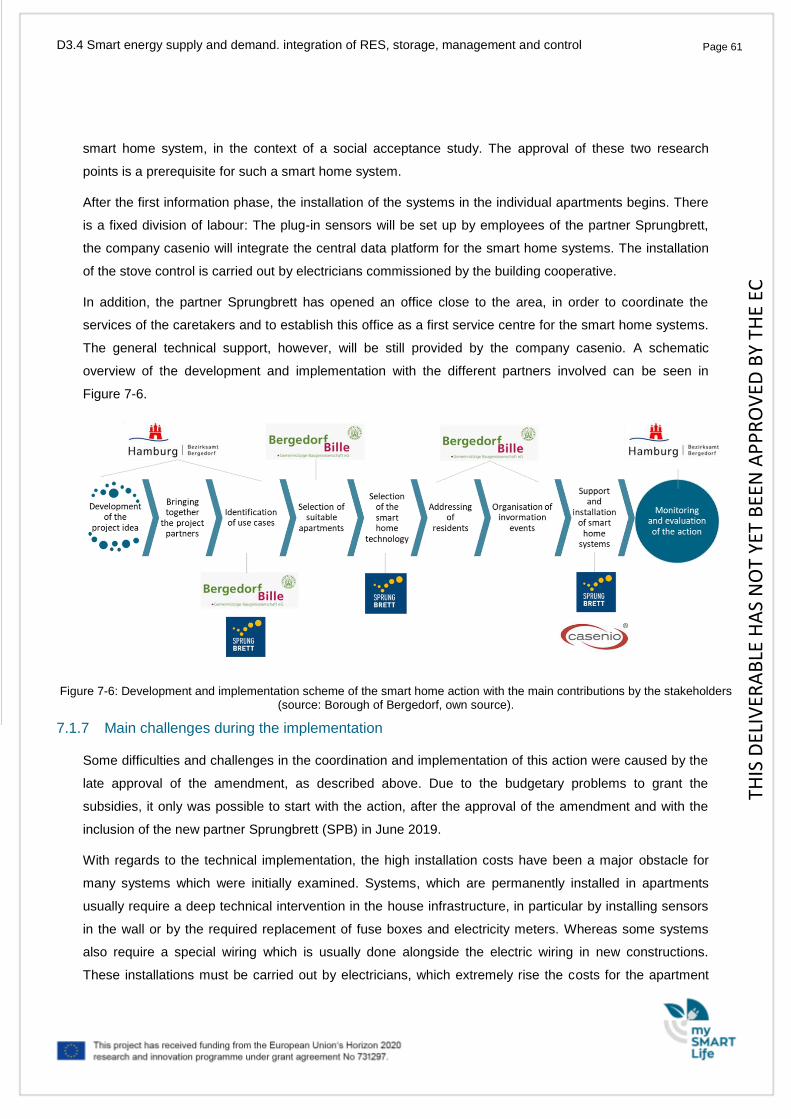
Page 61 Page 61 D3.4 Smart energy supply and demand. integration of RES, storage, management and control
smart home system, in the context of a social acceptance study. The approval of these two research
points is a prerequisite for such a smart home system.
After the first information phase, the installation of the systems in the individual apartments begins. There
is a fixed division of labour: The plug-in sensors will be set up by employees of the partner Sprungbrett,
the company casenio will integrate the central data platform for the smart home systems. The installation
of the stove control is carried out by electricians commissioned by the building cooperative.
In addition, the partner Sprungbrett has opened an office close to the area, in order to coordinate the
services of the caretakers and to establish this office as a first service centre for the smart home systems.
The general technical support, however, will be still provided by the company casenio. A schematic
overview of the development and implementation with the different partners involved can be seen in
Figure 7-6.
Figure 7-6: Development and implementation scheme of the smart home action with the main contributions by the stakeholders (source: Borough of Bergedorf, own source).
7.1.7 Main challenges during the implementation
Some difficulties and challenges in the coordination and implementation of this action were caused by the
late approval of the amendment, as described above. Due to the budgetary problems to grant the
subsidies, it only was possible to start with the action, after the approval of the amendment and with the
inclusion of the new partner Sprungbrett (SPB) in June 2019.
With regards to the technical implementation, the high installation costs have been a major obstacle for
many systems which were initially examined. Systems, which are permanently installed in apartments
usually require a deep technical intervention in the house infrastructure, in particular by installing sensors
in the wall or by the required replacement of fuse boxes and electricity meters. Whereas some systems
also require a special wiring which is usually done alongside the electric wiring in new constructions.
These installations must be carried out by electricians, which extremely rise the costs for the apartment
THIS
DEL
IVER
AB
LE H
AS
NO
T YE
T B
EEN
AP
PR
OV
ED B
Y TH
E EC
Page 62 Page 62 D3.4 Smart energy supply and demand. integration of RES, storage, management and control
owner. In addition, there is a high expenditure of time and a stressful construction phase for the tenant. A
further problem with the installation of smart home systems in existing buildings, is that the old apartments
usually have a wide variety of electrical infrastructure and are not uniform, which contains another cost
risk. Many apartments still have outdated wiring systems or fuse boxes that need to be replaced by the
owner, before a smart home system can be installed. At the same time, the housing cooperative is
demanding standards for technical equipment that should be installed (e.g. CE label, VDE label). Yet, not
all suppliers on the market have their products tested or certified at the different testing institutes.
Because of the reasons mentioned above, the partners of this intervention have decided to use a plug-in
system that avoids many of these problems. In addition, the installation and the removal of the systems is
very flexible. So large, cost-intensive interventions in the building infrastructure can be avoided and the
risks for the partners involved or the residents is minimised in case the system needs to be removed.
7.1.8 Conclusions and main benefits
The main aim of this action is to lower the barriers for landlords and tenants, to promote the dissemination
of smart home systems as a future infrastructure in the smart city. With the focus on the age group of
senior citizens and the integration of the everyday helpers into this technical action, a smart contribution to
the problems of an ageing society in Germany became a further focal point.
It has shown that the focus on a specific use case (smart homes for elderly people) was very useful during
the implementation of the action. At the same time, however, it needs to be recognized that this area does
not represent a typical field of action for the administration, as a citizen's home is a protected area. This
focus group made it even more important to lower the complexity of the system that should be installed.
The field of smart homes includes a large number of different possible systems and applications. The pre-
selection of a basic package, which was put together by the project partners who partly have extensive
experiences working with elderly people, reduced the complexity of the system and hence helped to
reduce communication efforts and accelerate the implementation.
Since the most parts of European cities are already built and will only be used further in the future, the use
of easy-to-install systems (Plug-In and Plug-Out) is an important success criteria. The existing housing
stock can thus be used more flexible and will be technically upgraded. The seniors can stay longer in their
familiar social environment and the number of moves between apartments can be reduced.
Furthermore, the integration and close coordination of the cooperative have proven to be helpful and have
contributed significantly to the successful implementation of the action. The cooperative supplied
important insights to its tenant’s structure and referred to the problem of the constantly aging members.
With their good contact to their members and well-established communication channels, they have
contributed significantly to the marketing of the systems and have achieved a high resonance among the
THIS
DEL
IVER
AB
LE H
AS
NO
T YE
T B
EEN
AP
PR
OV
ED B
Y TH
E EC
Page 63 Page 63 D3.4 Smart energy supply and demand. integration of RES, storage, management and control
cooperation members. Due to that, high expenditures for advertising, to address the tenants and to
convince them to install such a system, which is normally a problem, was avoided here.
In the following months, the monitoring will show whether the elderly residents will see the smart home
system as a benefit for their everyday life and if it will have an impact on their energy consumption. A
reduction is expected through an increased awareness of the own domestic energy consumption through
the visualization of the large consumers and better control of the heating and ventilation. In general,
however, the topic of smart homes is an interesting topic in the project, whereas this is one of the few
areas where citizens are in direct contact with smart infrastructures.
7.2 Smart metering
7.2.1 Implementation of modern measuring devices and in-house Visualization
In the project area 2,000 smart metering systems (modern measuring devices) will be installed in the
project area. The modern measuring device is the latest technology for counting electricity consumption.
So, this task is on the TRL 8. The basis for the introduction of modern measuring equipment is the law on
the digitization of the energy transition. The German legislator wants to achieve the goals of the energy
transition with the introduction of modern measuring equipment. An important goal of the energy transition
is the improvement of energy efficiency. The modern measuring device enables a more conscious use of
energy. The former technology only allowed reading the current count. In addition to the current power
consumption, the modern measuring system also shows the daily, weekly, monthly and annual electricity
consumption values of the last 24 months. The use of an interface via optional adapter is possible.
Although the technology is very new, modern measuring equipment is already available from
manufacturers are available from the manufacturer since May 2018. So more than 2000 modern
measuring systems have been ordered by Stromnetz Hamburg. A quality-assuring incoming goods
inspection was carried out and the measuring instruments were released for installation. Subsequently,
the orders to change the measuring equipment were created and arranged from conventional to modern.
Between October 2018 and April 2019, more than 2,000 conventional electricity meters were replaced by
modern measuring equipment in the project area.
THIS
DEL
IVER
AB
LE H
AS
NO
T YE
T B
EEN
AP
PR
OV
ED B
Y TH
E EC
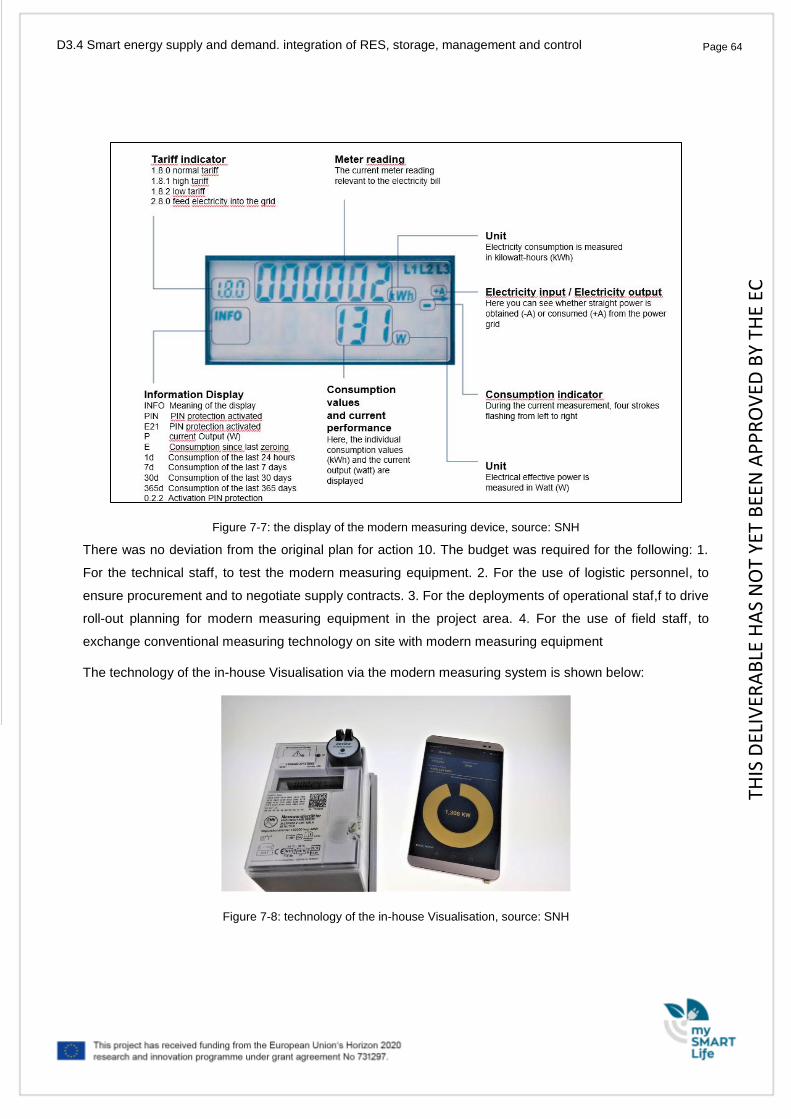
Page 64 Page 64 D3.4 Smart energy supply and demand. integration of RES, storage, management and control
Figure 7-7: the display of the modern measuring device, source: SNH
There was no deviation from the original plan for action 10. The budget was required for the following: 1.
For the technical staff, to test the modern measuring equipment. 2. For the use of logistic personnel, to
ensure procurement and to negotiate supply contracts. 3. For the deployments of operational staf,f to drive
roll-out planning for modern measuring equipment in the project area. 4. For the use of field staff, to
exchange conventional measuring technology on site with modern measuring equipment
The technology of the in-house Visualisation via the modern measuring system is shown below:
Figure 7-8: technology of the in-house Visualisation, source: SNH
THIS
DEL
IVER
AB
LE H
AS
NO
T YE
T B
EEN
AP
PR
OV
ED B
Y TH
E EC
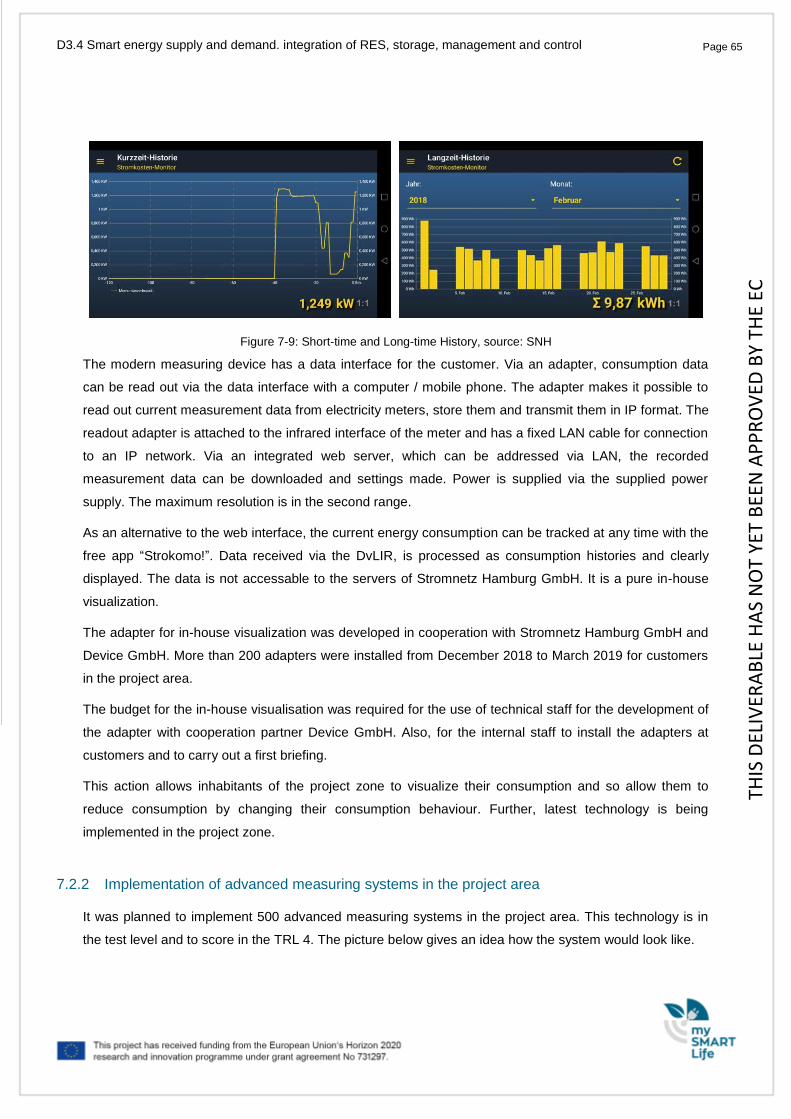
Page 65 Page 65 D3.4 Smart energy supply and demand. integration of RES, storage, management and control
Figure 7-9: Short-time and Long-time History, source: SNH
The modern measuring device has a data interface for the customer. Via an adapter, consumption data
can be read out via the data interface with a computer / mobile phone. The adapter makes it possible to
read out current measurement data from electricity meters, store them and transmit them in IP format. The
readout adapter is attached to the infrared interface of the meter and has a fixed LAN cable for connection
to an IP network. Via an integrated web server, which can be addressed via LAN, the recorded
measurement data can be downloaded and settings made. Power is supplied via the supplied power
supply. The maximum resolution is in the second range.
As an alternative to the web interface, the current energy consumption can be tracked at any time with the
free app “Strokomo!”. Data received via the DvLIR, is processed as consumption histories and clearly
displayed. The data is not accessable to the servers of Stromnetz Hamburg GmbH. It is a pure in-house
visualization.
The adapter for in-house visualization was developed in cooperation with Stromnetz Hamburg GmbH and
Device GmbH. More than 200 adapters were installed from December 2018 to March 2019 for customers
in the project area.
The budget for the in-house visualisation was required for the use of technical staff for the development of
the adapter with cooperation partner Device GmbH. Also, for the internal staff to install the adapters at
customers and to carry out a first briefing.
This action allows inhabitants of the project zone to visualize their consumption and so allow them to
reduce consumption by changing their consumption behaviour. Further, latest technology is being
implemented in the project zone.
7.2.2 Implementation of advanced measuring systems in the project area
It was planned to implement 500 advanced measuring systems in the project area. This technology is in
the test level and to score in the TRL 4. The picture below gives an idea how the system would look like.
THIS
DEL
IVER
AB
LE H
AS
NO
T YE
T B
EEN
AP
PR
OV
ED B
Y TH
E EC
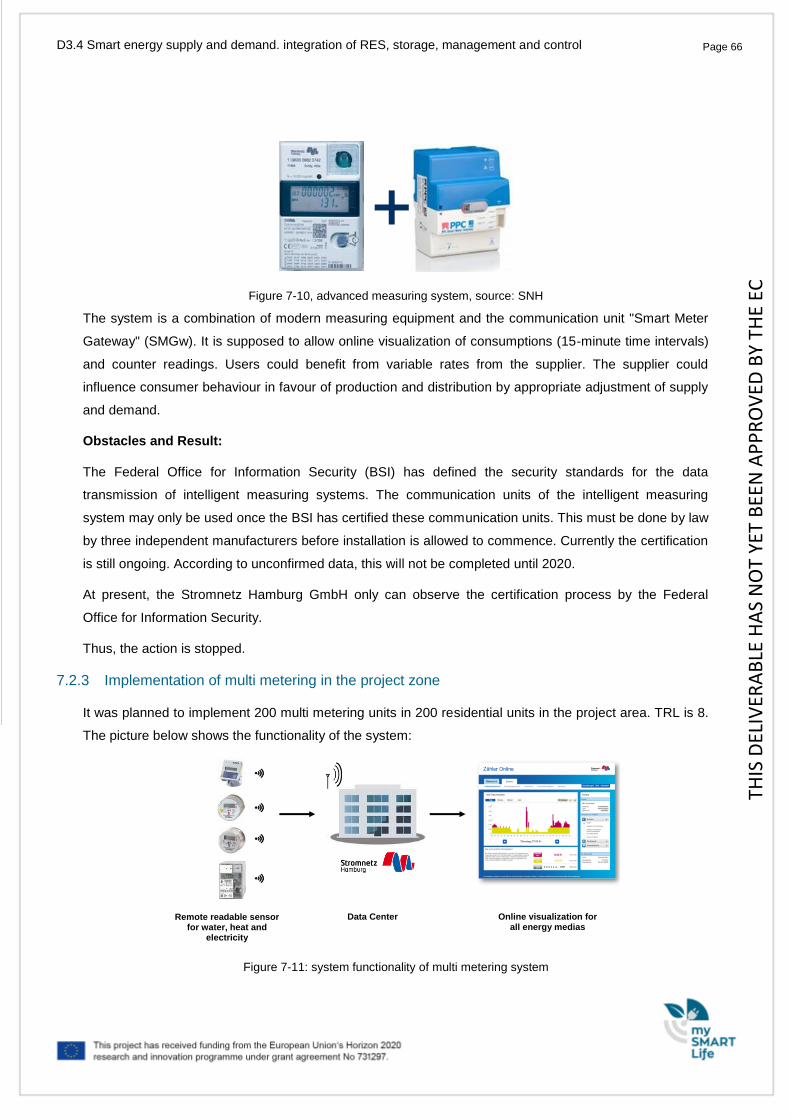
Page 66 Page 66 D3.4 Smart energy supply and demand. integration of RES, storage, management and control
Figure 7-10, advanced measuring system, source: SNH
The system is a combination of modern measuring equipment and the communication unit "Smart Meter
Gateway" (SMGw). It is supposed to allow online visualization of consumptions (15-minute time intervals)
and counter readings. Users could benefit from variable rates from the supplier. The supplier could
influence consumer behaviour in favour of production and distribution by appropriate adjustment of supply
and demand.
Obstacles and Result:
The Federal Office for Information Security (BSI) has defined the security standards for the data
transmission of intelligent measuring systems. The communication units of the intelligent measuring
system may only be used once the BSI has certified these communication units. This must be done by law
by three independent manufacturers before installation is allowed to commence. Currently the certification
is still ongoing. According to unconfirmed data, this will not be completed until 2020.
At present, the Stromnetz Hamburg GmbH only can observe the certification process by the Federal
Office for Information Security.
Thus, the action is stopped.
7.2.3 Implementation of multi metering in the project zone
It was planned to implement 200 multi metering units in 200 residential units in the project area. TRL is 8.
The picture below shows the functionality of the system:
Figure 7-11: system functionality of multi metering system
Online visualization for all energy medias
Data Center Remote readable sensor for water, heat and
electricity
THIS
DEL
IVER
AB
LE H
AS
NO
T YE
T B
EEN
AP
PR
OV
ED B
Y TH
E EC
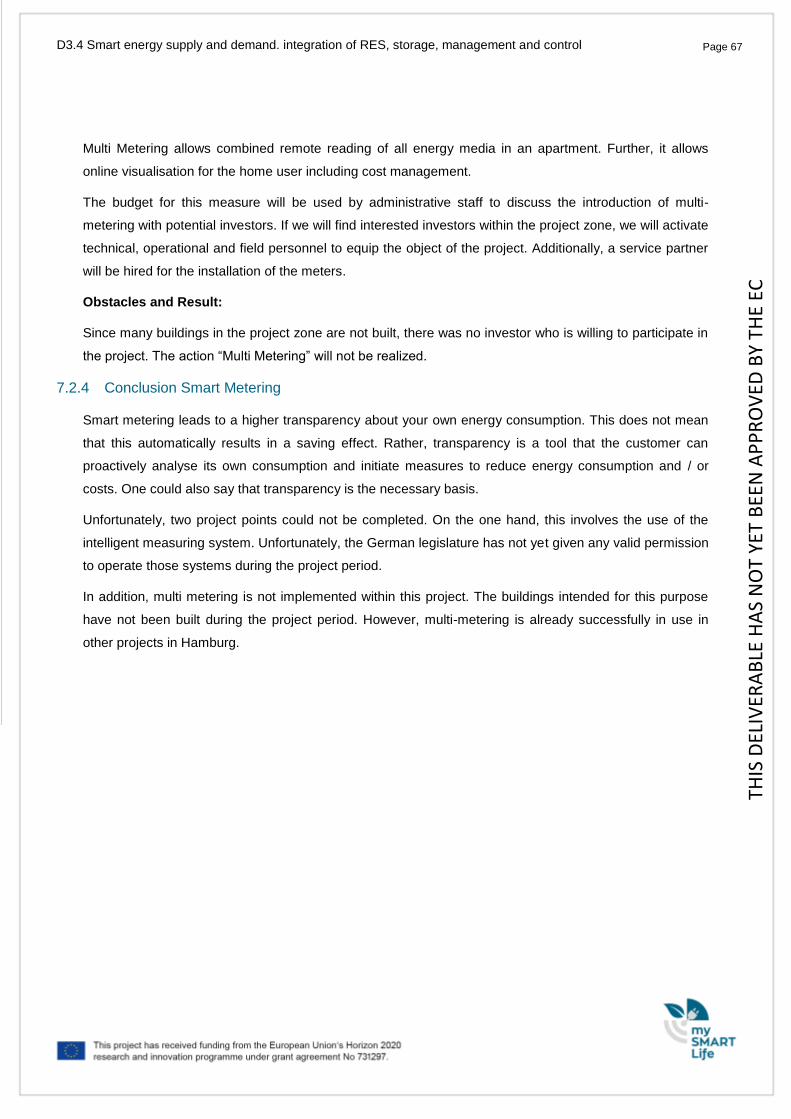
Page 67 Page 67 D3.4 Smart energy supply and demand. integration of RES, storage, management and control
Multi Metering allows combined remote reading of all energy media in an apartment. Further, it allows
online visualisation for the home user including cost management.
The budget for this measure will be used by administrative staff to discuss the introduction of multi-
metering with potential investors. If we will find interested investors within the project zone, we will activate
technical, operational and field personnel to equip the object of the project. Additionally, a service partner
will be hired for the installation of the meters.
Obstacles and Result:
Since many buildings in the project zone are not built, there was no investor who is willing to participate in
the project. The action “Multi Metering” will not be realized.
7.2.4 Conclusion Smart Metering
Smart metering leads to a higher transparency about your own energy consumption. This does not mean
that this automatically results in a saving effect. Rather, transparency is a tool that the customer can
proactively analyse its own consumption and initiate measures to reduce energy consumption and / or
costs. One could also say that transparency is the necessary basis.
Unfortunately, two project points could not be completed. On the one hand, this involves the use of the
intelligent measuring system. Unfortunately, the German legislature has not yet given any valid permission
to operate those systems during the project period.
In addition, multi metering is not implemented within this project. The buildings intended for this purpose
have not been built during the project period. However, multi-metering is already successfully in use in
other projects in Hamburg.
THIS
DEL
IVER
AB
LE H
AS
NO
T YE
T B
EEN
AP
PR
OV
ED B
Y TH
E EC
Page 68 Page 68 D3.4 Smart energy supply and demand. integration of RES, storage, management and control
8. Discussion of the results (till M36)
The low-ex district heating cannot be implemented in consequence of the decision of the investor. It is
often observed, that innovation and environmental protection do not play a roll in the independent real
estate market. Although the investor signalled in preliminary discussions the willingness to cooperate and
to implement the solution, he ultimately decided against the innovative low-ex concept in favour of a cheap
standard solution. Despite project financing from the project, the low-ex heating network is not in a
position to compete on the market with a cheap standard solution on the marked. As a result of this
experience, an expert plan "Energy" is currently being developed by the City of Hamburg, which defines
the requirements for future urban building projects.
In the windfarm, the demonstrators could be set up within the planned timeframe. A one-year test phase
with the wind farm was successfully implemented and the data connection from the wind farm control
room to the TCEC and the setup of the monitoring are set. As part of the Sinteg project, NEW 4.0,
innovative system services (instantaneous reserve, primary control, and reactive power management) are
carried out and evaluated in combination with the wind farm and the battery.
The expansion of PV-systems on roofs of existing tenements and commercial buildings with the
corresponding electricity supply concepts is progressing very slowly. The house-owners do not show a
strong interest because it is not profitable for them. However, they commit themselves in the long term of
20 to 25 years to provide their roof for the PV-plant. At the moment there are limits to the building
alterations. At least, tenants are interested in both – energetic restauration and green electricity power
delivery from the roof but the house-owners are not. These circumstances make it difficult to acquire roofs
and to initiate restauration. For this, a combined public funding program would certainly be meaningful, in
which an energetic roof retrofit is combined with the implementation of solar systems and tenant electricity
concepts.
It has shown, that the deployment of smart home solutions is a completely new field of activity for the
municipality. To this day, the apartment of a citizen is considered more private than an area of urban
development. For this reason, the district has sought the cooperation with a housing cooperative in order
to benefit from its experience and to ensure the operation of the smart homes after the project. Also, the
housing cooperation suggested to combine the topic of smart homes with the specific use case of
assistance for seniors, in order to achieve a higher acceptance of the systems among users. The
cooperation with the social company “Sprungbrett Hamburg” has made it possible to get into a positive
contact to elderly people. That was the prerequisite for getting the people interested in technology and
showing them the benefits. The procedure for the decision-making of the possible users is time-
consuming and the implementation is going on.
THIS
DEL
IVER
AB
LE H
AS
NO
T YE
T B
EEN
AP
PR
OV
ED B
Y TH
E EC
Page 69 Page 69 D3.4 Smart energy supply and demand. integration of RES, storage, management and control
The delays and obstacles to smart metering also make it clear that the current legal situation can block the
way for the intriduction of new innovative technologies for the energy transition. Approval procedures take
rather long in Germany. This concerns the approval of technical equipment as well as the approval of new
wind turbines. There is a need for change here in the interest of climate protection..
The IT area of management and control strategies is also hampered by the fact that planned buildings
were not built during the project's lifetime and the investors in the converted buildings did not have access
to their data. For this reason, the available data from the HAW energy campus were used as a basis.
Monitoring will also integrate the production data of the ENH PV-plants.
In total, the experiences in implementing of energy actions in mySMARTLife in Hamburg have shown that
the current cost structure of the energy market makes it difficult to install renewable energy installations. In
particular, the enormous electricity price discounts for large consumers justify that PV systems are not
economical for these consumers. Therefore, we can only implement part of tomorrow's innovative energy
generation and intelligent energy management options.
The challenges of the project did also show that the asset market is not ready for the widespread
implementation of these innovative techniques and that the further spread requires first political positioning
and reliable funding, so that these technologies would become the normal case.
THIS
DEL
IVER
AB
LE H
AS
NO
T YE
T B
EEN
AP
PR
OV
ED B
Y TH
E EC
Page 70 Page 70 D3.4 Smart energy supply and demand. integration of RES, storage, management and control
9. References
[1] Arbeitsgemeinschaft konsalt GmbH, MegaWATT GmbH und Metropol Grund GmbH (2014):
Energetische Stadtsanierung Bergedorf-Süd. Available at: http://konsalt.de/wp-
content/uploads/2014/06/2014-02-17-Endbericht-Bergedorf-Sued.pdf [13.11.2018].
[2] Arbeitsgemeinschaft konsalt GmbH, MegaWATT GmbH und Metropol Grund GmbH (2017):
Energetisches Sanierungsmanagement Bergedorf-Süd. Available at:
http://suche.transparenz.hamburg.de/dataset/endbericht-zum-energetischen-
sanierungsmanagement-bergedorf-sued [13.11.2018].
[3] Bundesministerium der Justiz und Verbraucherschutz. Erneuerbare Energien Gesetz – EEG.
Available: http://www.gesetze-im-internet.de/eeg_2014/index.html [20.11.2018]
[4] Bundesministerium für Umweltschutz, Naturschutz und nukleare Sicherheit.
Klimaschutzgesetz. Available: https://www.bmu.de/faqs/klimaschutzgesetz-vom-9-oktober-
2019/ [28.11.2018]
[5] Bundesministerium der Wirtschaft. Gesetz zur Förderung von Mieterstrom und zur Änderung
weiterer Vorschriften des Erneuerbare-Energien-Gesetzes. Available:
https://www.bmwi.de/Redaktion/DE/Downloads/M-O/mieterstrom-gesetz-
bgbl.pdf?__blob=publicationFile&v=4 [20.11.2018]
[6] Bundesministerium der Wirtschaft und Energie. Energiesammelgesetz. Available:
https://www.bmwi.de/Redaktion/DE/Artikel/Service/Gesetzesvorhaben/energiesammelgesetz.
html [20.11.2018]
[7] Bundesministerium der Wirtschaft und Energie. Kohleausstiegsgesetz. Available:
https://www.bmwi.de/Redaktion/DE/Pressemitteilungen/2019/20190704-bmwi-legt-rahmen-
der-kohleausstiegsgesetzgebung-vor.html [28.11.2018]
[8] DGS Deutsche Gesellschaft für Solarenergie e.V. Oberzig, Klaus. 2019.
Kohleausstiegsgesetz - Schlachtplan gegen die Erneuerbaren (Commentary on the Coal Exit
Act). https://www.dgs.de/news/en-detail/221119-kohleausstiegsgesetz-schlachtplan-gegen-
die-erneuerbaren/ [28.11.2018]
[9] FHH (Freie und Hansestadt Hamburg) (2014a): Grüne, gerechte, wachsende Stadt am
Wasser, Perspektiven der Stadtentwicklung für Hamburg
[10] FHH (Freie und Hansestadt Hamburg) (2015): Hamburger Klimaplan, Drucksache 21/2521
THIS
DEL
IVER
AB
LE H
AS
NO
T YE
T B
EEN
AP
PR
OV
ED B
Y TH
E EC
Page 71 Page 71 D3.4 Smart energy supply and demand. integration of RES, storage, management and control
[11] FHH (Freie und Hansestadt Hamburg) (2014b): Energiewende made in Hamburg.
Available:http://www.hamburg.de/energiewende/energiewende-in-
hamburg/3737996/hamburger-energiewende/ [11.07.2016]
[12] FHH (Freie und Hansestadt Hamburg) (2015): Solaratlas. Available: https://www.geoportal-
hamburg.de/Solaratlas/index.html# [15.11.2019]
[13] Fraunhofer-Institut für Solare Energiesysteme ISE.
https://www.ise.fraunhofer.de/content/dam/ise/de/documents/publications/studies/daten-zu-
erneuerbaren-energien/ISE_Stromerzeugung_2019_Halbjahr.pdf [07.11.2019]
[14] Mecanoo Architekten, Bezirksamt Bergedorf, Internationale Bauausstellung IBA Hamburg
GmbH (2010): Masterplan Schleusengärten Hamburg Bergedorf
[15] Nordex SE. http://www.nordex-online.com/fileadmin/MEDIA/Gamma/Nordex_Gamma_en.pdf
[15.11.2019]
[16] Statistikamt Nord. Zahlen und Fakten. Available: https://www.statistik-nord.de/zahlen-fakten/
[20.11.2018]
[17] Umweltbundesamt (Federal Environment Agency). Energieverbrauch für fossile und
erneuerbare Wärme. Available:
https://www.umweltbundesamt.de/daten/energie/energieverbrauch-fuer-fossile-erneuerbare-
waerme#textpart-1 [07.11.2019]
THIS
DEL
IVER
AB
LE H
AS
NO
T YE
T B
EEN
AP
PR
OV
ED B
Y TH
E EC
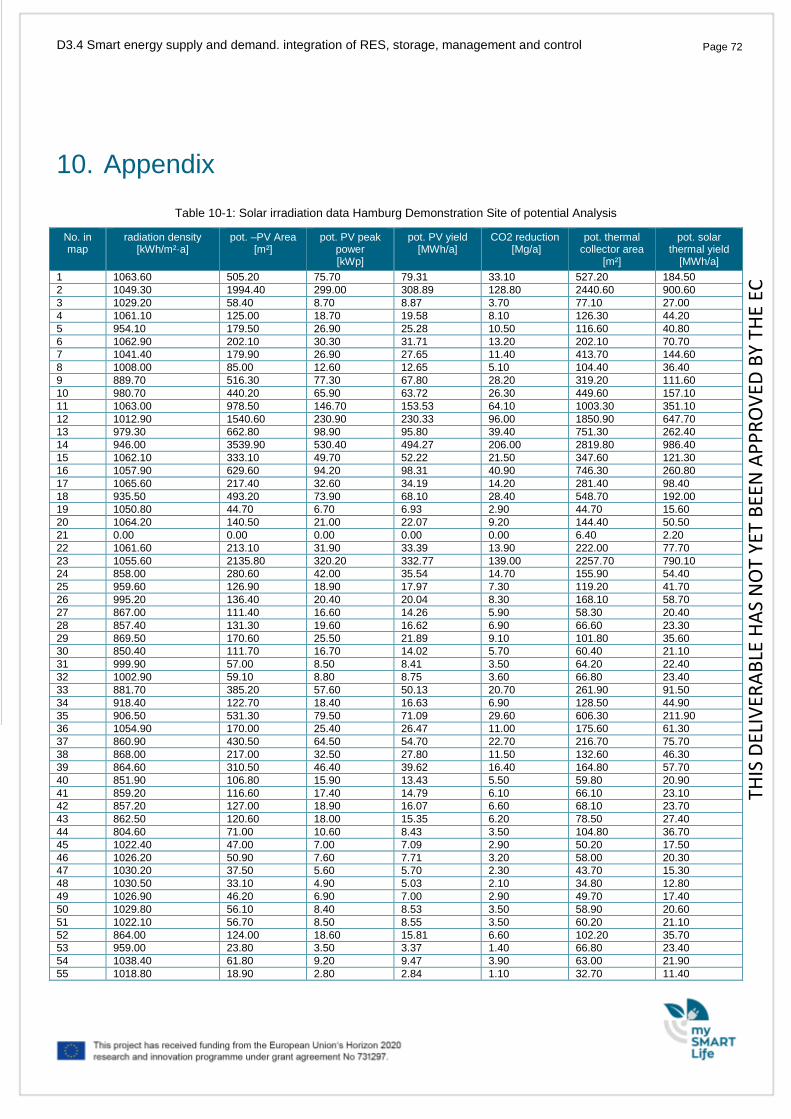
Page 72 Page 72 D3.4 Smart energy supply and demand. integration of RES, storage, management and control
10. Appendix
Table 10-1: Solar irradiation data Hamburg Demonstration Site of potential Analysis
No. in map
radiation density [kWh/m²·a]
pot. –PV Area [m²]
pot. PV peak power [kWp]
pot. PV yield [MWh/a]
CO2 reduction [Mg/a]
pot. thermal collector area
[m²]
pot. solar thermal yield
[MWh/a]
1 1063.60 505.20 75.70 79.31 33.10 527.20 184.50
2 1049.30 1994.40 299.00 308.89 128.80 2440.60 900.60
3 1029.20 58.40 8.70 8.87 3.70 77.10 27.00
4 1061.10 125.00 18.70 19.58 8.10 126.30 44.20
5 954.10 179.50 26.90 25.28 10.50 116.60 40.80
6 1062.90 202.10 30.30 31.71 13.20 202.10 70.70
7 1041.40 179.90 26.90 27.65 11.40 413.70 144.60
8 1008.00 85.00 12.60 12.65 5.10 104.40 36.40
9 889.70 516.30 77.30 67.80 28.20 319.20 111.60
10 980.70 440.20 65.90 63.72 26.30 449.60 157.10
11 1063.00 978.50 146.70 153.53 64.10 1003.30 351.10
12 1012.90 1540.60 230.90 230.33 96.00 1850.90 647.70
13 979.30 662.80 98.90 95.80 39.40 751.30 262.40
14 946.00 3539.90 530.40 494.27 206.00 2819.80 986.40
15 1062.10 333.10 49.70 52.22 21.50 347.60 121.30
16 1057.90 629.60 94.20 98.31 40.90 746.30 260.80
17 1065.60 217.40 32.60 34.19 14.20 281.40 98.40
18 935.50 493.20 73.90 68.10 28.40 548.70 192.00
19 1050.80 44.70 6.70 6.93 2.90 44.70 15.60
20 1064.20 140.50 21.00 22.07 9.20 144.40 50.50
21 0.00 0.00 0.00 0.00 0.00 6.40 2.20
22 1061.60 213.10 31.90 33.39 13.90 222.00 77.70
23 1055.60 2135.80 320.20 332.77 139.00 2257.70 790.10
24 858.00 280.60 42.00 35.54 14.70 155.90 54.40
25 959.60 126.90 18.90 17.97 7.30 119.20 41.70
26 995.20 136.40 20.40 20.04 8.30 168.10 58.70
27 867.00 111.40 16.60 14.26 5.90 58.30 20.40
28 857.40 131.30 19.60 16.62 6.90 66.60 23.30
29 869.50 170.60 25.50 21.89 9.10 101.80 35.60
30 850.40 111.70 16.70 14.02 5.70 60.40 21.10
31 999.90 57.00 8.50 8.41 3.50 64.20 22.40
32 1002.90 59.10 8.80 8.75 3.60 66.80 23.40
33 881.70 385.20 57.60 50.13 20.70 261.90 91.50
34 918.40 122.70 18.40 16.63 6.90 128.50 44.90
35 906.50 531.30 79.50 71.09 29.60 606.30 211.90
36 1054.90 170.00 25.40 26.47 11.00 175.60 61.30
37 860.90 430.50 64.50 54.70 22.70 216.70 75.70
38 868.00 217.00 32.50 27.80 11.50 132.60 46.30
39 864.60 310.50 46.40 39.62 16.40 164.80 57.70
40 851.90 106.80 15.90 13.43 5.50 59.80 20.90
41 859.20 116.60 17.40 14.79 6.10 66.10 23.10
42 857.20 127.00 18.90 16.07 6.60 68.10 23.70
43 862.50 120.60 18.00 15.35 6.20 78.50 27.40
44 804.60 71.00 10.60 8.43 3.50 104.80 36.70
45 1022.40 47.00 7.00 7.09 2.90 50.20 17.50
46 1026.20 50.90 7.60 7.71 3.20 58.00 20.30
47 1030.20 37.50 5.60 5.70 2.30 43.70 15.30
48 1030.50 33.10 4.90 5.03 2.10 34.80 12.80
49 1026.90 46.20 6.90 7.00 2.90 49.70 17.40
50 1029.80 56.10 8.40 8.53 3.50 58.90 20.60
51 1022.10 56.70 8.50 8.55 3.50 60.20 21.10
52 864.00 124.00 18.60 15.81 6.60 102.20 35.70
53 959.00 23.80 3.50 3.37 1.40 66.80 23.40
54 1038.40 61.80 9.20 9.47 3.90 63.00 21.90
55 1018.80 18.90 2.80 2.84 1.10 32.70 11.40
THIS
DEL
IVER
AB
LE H
AS
NO
T YE
T B
EEN
AP
PR
OV
ED B
Y TH
E EC
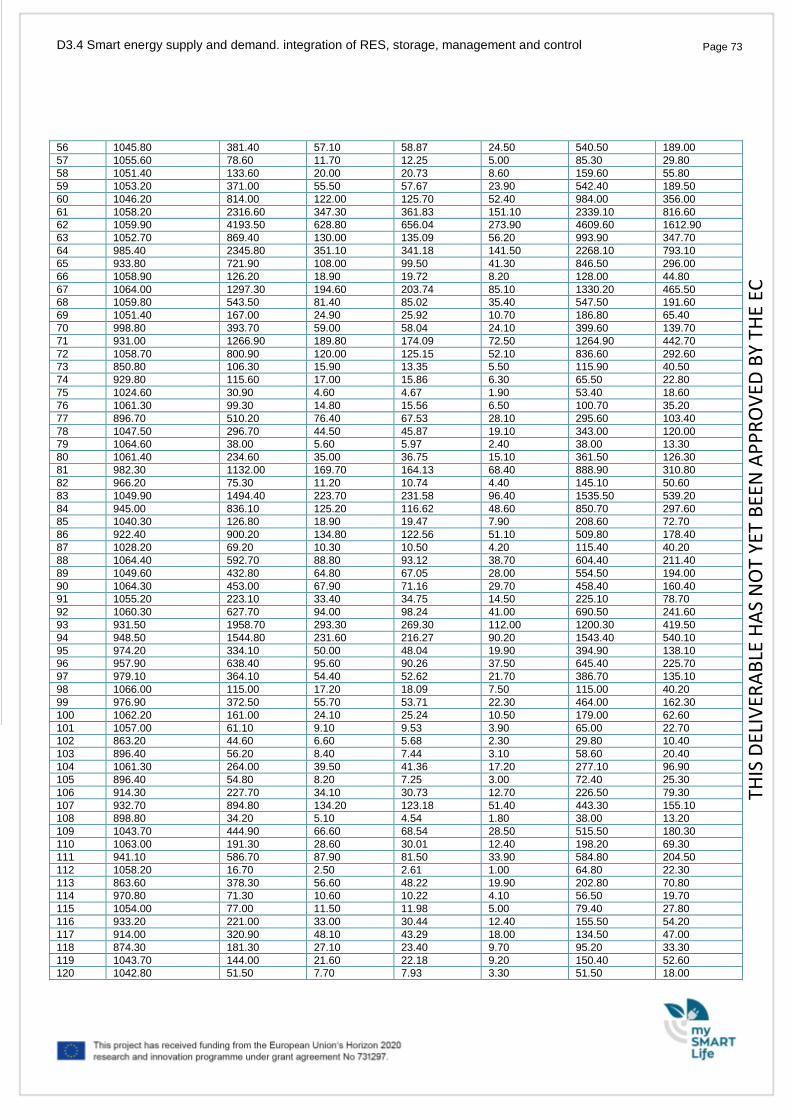
Page 73 Page 73 D3.4 Smart energy supply and demand. integration of RES, storage, management and control
56 1045.80 381.40 57.10 58.87 24.50 540.50 189.00
57 1055.60 78.60 11.70 12.25 5.00 85.30 29.80
58 1051.40 133.60 20.00 20.73 8.60 159.60 55.80
59 1053.20 371.00 55.50 57.67 23.90 542.40 189.50
60 1046.20 814.00 122.00 125.70 52.40 984.00 356.00
61 1058.20 2316.60 347.30 361.83 151.10 2339.10 816.60
62 1059.90 4193.50 628.80 656.04 273.90 4609.60 1612.90
63 1052.70 869.40 130.00 135.09 56.20 993.90 347.70
64 985.40 2345.80 351.10 341.18 141.50 2268.10 793.10
65 933.80 721.90 108.00 99.50 41.30 846.50 296.00
66 1058.90 126.20 18.90 19.72 8.20 128.00 44.80
67 1064.00 1297.30 194.60 203.74 85.10 1330.20 465.50
68 1059.80 543.50 81.40 85.02 35.40 547.50 191.60
69 1051.40 167.00 24.90 25.92 10.70 186.80 65.40
70 998.80 393.70 59.00 58.04 24.10 399.60 139.70
71 931.00 1266.90 189.80 174.09 72.50 1264.90 442.70
72 1058.70 800.90 120.00 125.15 52.10 836.60 292.60
73 850.80 106.30 15.90 13.35 5.50 115.90 40.50
74 929.80 115.60 17.00 15.86 6.30 65.50 22.80
75 1024.60 30.90 4.60 4.67 1.90 53.40 18.60
76 1061.30 99.30 14.80 15.56 6.50 100.70 35.20
77 896.70 510.20 76.40 67.53 28.10 295.60 103.40
78 1047.50 296.70 44.50 45.87 19.10 343.00 120.00
79 1064.60 38.00 5.60 5.97 2.40 38.00 13.30
80 1061.40 234.60 35.00 36.75 15.10 361.50 126.30
81 982.30 1132.00 169.70 164.13 68.40 888.90 310.80
82 966.20 75.30 11.20 10.74 4.40 145.10 50.60
83 1049.90 1494.40 223.70 231.58 96.40 1535.50 539.20
84 945.00 836.10 125.20 116.62 48.60 850.70 297.60
85 1040.30 126.80 18.90 19.47 7.90 208.60 72.70
86 922.40 900.20 134.80 122.56 51.10 509.80 178.40
87 1028.20 69.20 10.30 10.50 4.20 115.40 40.20
88 1064.40 592.70 88.80 93.12 38.70 604.40 211.40
89 1049.60 432.80 64.80 67.05 28.00 554.50 194.00
90 1064.30 453.00 67.90 71.16 29.70 458.40 160.40
91 1055.20 223.10 33.40 34.75 14.50 225.10 78.70
92 1060.30 627.70 94.00 98.24 41.00 690.50 241.60
93 931.50 1958.70 293.30 269.30 112.00 1200.30 419.50
94 948.50 1544.80 231.60 216.27 90.20 1543.40 540.10
95 974.20 334.10 50.00 48.04 19.90 394.90 138.10
96 957.90 638.40 95.60 90.26 37.50 645.40 225.70
97 979.10 364.10 54.40 52.62 21.70 386.70 135.10
98 1066.00 115.00 17.20 18.09 7.50 115.00 40.20
99 976.90 372.50 55.70 53.71 22.30 464.00 162.30
100 1062.20 161.00 24.10 25.24 10.50 179.00 62.60
101 1057.00 61.10 9.10 9.53 3.90 65.00 22.70
102 863.20 44.60 6.60 5.68 2.30 29.80 10.40
103 896.40 56.20 8.40 7.44 3.10 58.60 20.40
104 1061.30 264.00 39.50 41.36 17.20 277.10 96.90
105 896.40 54.80 8.20 7.25 3.00 72.40 25.30
106 914.30 227.70 34.10 30.73 12.70 226.50 79.30
107 932.70 894.80 134.20 123.18 51.40 443.30 155.10
108 898.80 34.20 5.10 4.54 1.80 38.00 13.20
109 1043.70 444.90 66.60 68.54 28.50 515.50 180.30
110 1063.00 191.30 28.60 30.01 12.40 198.20 69.30
111 941.10 586.70 87.90 81.50 33.90 584.80 204.50
112 1058.20 16.70 2.50 2.61 1.00 64.80 22.30
113 863.60 378.30 56.60 48.22 19.90 202.80 70.80
114 970.80 71.30 10.60 10.22 4.10 56.50 19.70
115 1054.00 77.00 11.50 11.98 5.00 79.40 27.80
116 933.20 221.00 33.00 30.44 12.40 155.50 54.20
117 914.00 320.90 48.10 43.29 18.00 134.50 47.00
118 874.30 181.30 27.10 23.40 9.70 95.20 33.30
119 1043.70 144.00 21.60 22.18 9.20 150.40 52.60
120 1042.80 51.50 7.70 7.93 3.30 51.50 18.00
THIS
DEL
IVER
AB
LE H
AS
NO
T YE
T B
EEN
AP
PR
OV
ED B
Y TH
E EC
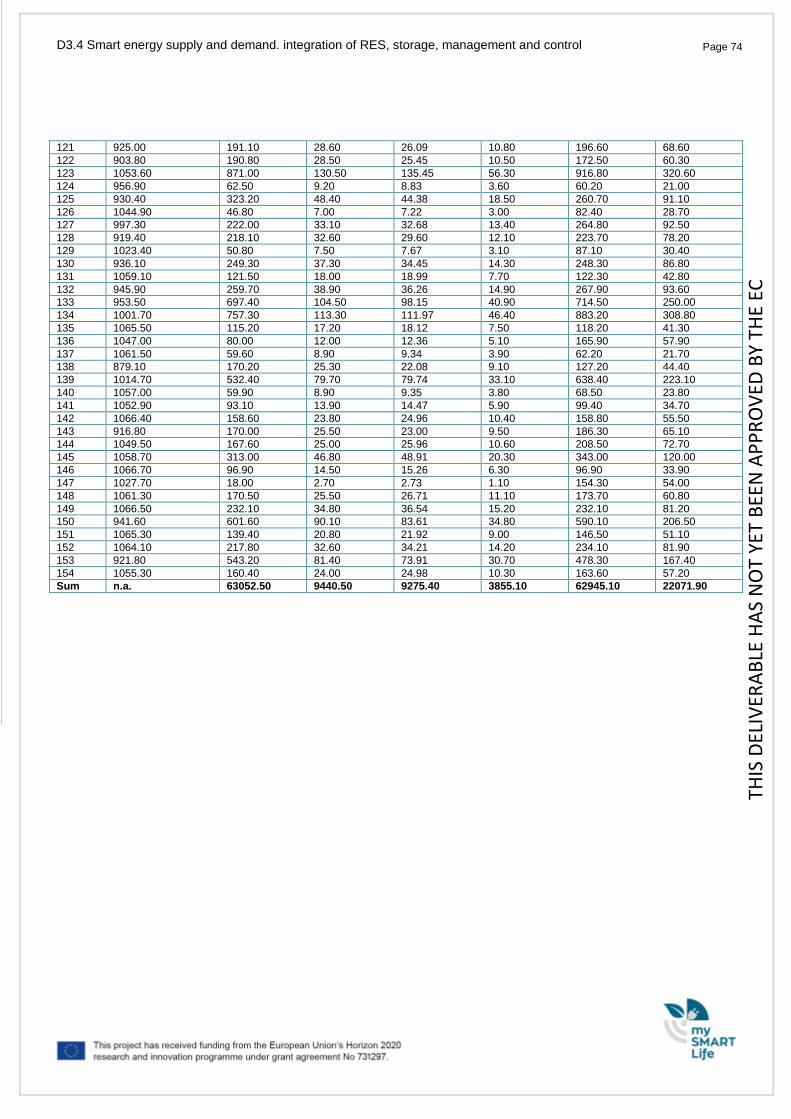
Page 74 Page 74 D3.4 Smart energy supply and demand. integration of RES, storage, management and control
121 925.00 191.10 28.60 26.09 10.80 196.60 68.60
122 903.80 190.80 28.50 25.45 10.50 172.50 60.30
123 1053.60 871.00 130.50 135.45 56.30 916.80 320.60
124 956.90 62.50 9.20 8.83 3.60 60.20 21.00
125 930.40 323.20 48.40 44.38 18.50 260.70 91.10
126 1044.90 46.80 7.00 7.22 3.00 82.40 28.70
127 997.30 222.00 33.10 32.68 13.40 264.80 92.50
128 919.40 218.10 32.60 29.60 12.10 223.70 78.20
129 1023.40 50.80 7.50 7.67 3.10 87.10 30.40
130 936.10 249.30 37.30 34.45 14.30 248.30 86.80
131 1059.10 121.50 18.00 18.99 7.70 122.30 42.80
132 945.90 259.70 38.90 36.26 14.90 267.90 93.60
133 953.50 697.40 104.50 98.15 40.90 714.50 250.00
134 1001.70 757.30 113.30 111.97 46.40 883.20 308.80
135 1065.50 115.20 17.20 18.12 7.50 118.20 41.30
136 1047.00 80.00 12.00 12.36 5.10 165.90 57.90
137 1061.50 59.60 8.90 9.34 3.90 62.20 21.70
138 879.10 170.20 25.30 22.08 9.10 127.20 44.40
139 1014.70 532.40 79.70 79.74 33.10 638.40 223.10
140 1057.00 59.90 8.90 9.35 3.80 68.50 23.80
141 1052.90 93.10 13.90 14.47 5.90 99.40 34.70
142 1066.40 158.60 23.80 24.96 10.40 158.80 55.50
143 916.80 170.00 25.50 23.00 9.50 186.30 65.10
144 1049.50 167.60 25.00 25.96 10.60 208.50 72.70
145 1058.70 313.00 46.80 48.91 20.30 343.00 120.00
146 1066.70 96.90 14.50 15.26 6.30 96.90 33.90
147 1027.70 18.00 2.70 2.73 1.10 154.30 54.00
148 1061.30 170.50 25.50 26.71 11.10 173.70 60.80
149 1066.50 232.10 34.80 36.54 15.20 232.10 81.20
150 941.60 601.60 90.10 83.61 34.80 590.10 206.50
151 1065.30 139.40 20.80 21.92 9.00 146.50 51.10
152 1064.10 217.80 32.60 34.21 14.20 234.10 81.90
153 921.80 543.20 81.40 73.91 30.70 478.30 167.40
154 1055.30 160.40 24.00 24.98 10.30 163.60 57.20
Sum n.a. 63052.50 9440.50 9275.40 3855.10 62945.10 22071.90
THIS
DEL
IVER
AB
LE H
AS
NO
T YE
T B
EEN
AP
PR
OV
ED B
Y TH
E EC
Recommended


![Smart [ er ] Economy | Governance | Education](https://img.pdfslide.net/doc/110x75/568168b5550346895ddf8e26/smart-er-economy-governance-education-56cf02ff2afcc.jpg)
