2014
Statistical Digest
Ministry of Education
Montserrat
i
Table of Contents
Table of Contents .......................................................................................................................................... i
Foreward ..................................................................................................................................................... iv
Message from the Director of Education ................................................................................................... v
Primary Education ...................................................................................................................................... 1
Compulsory Education in Montserrat ....................................................................................................... 2
Table 1: Enrolment and Number of Care Givers, 2013/14 ...................................................................... 3
Table 2: Number of Children Enrolled in Day Care Centres by Gender and Age, 2013/14 .......................... 3
Table 3: Percentage Share of Boys and Girls Enrolled in Day Care Centres by Age, 2013/14 ...................... 3
Table 4: Enrolment in Public Preschools 2013/14 ........................................................................................ 3
Table 5: Enrolment in Private Preschools 2013/14 ....................................................................................... 3
Table 6: Overall Enrolment in Preschools 2013/14 ..................................................................................... 3
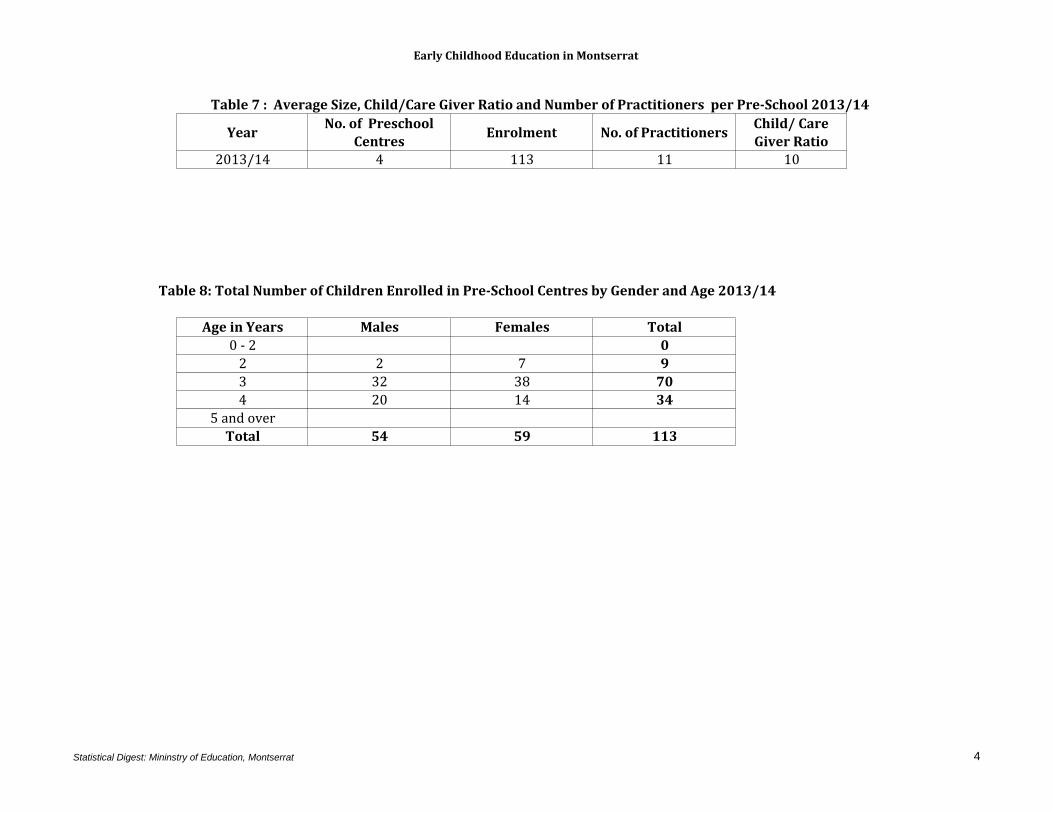
Table 7: Average Size, Child Care Giver Ratio and Number of Practitioners 2013/14 .................................. 4
Table 8: Total Number of Children Enrolled in Pre-School Centres by Gender and Age 2013/14 ............... 4
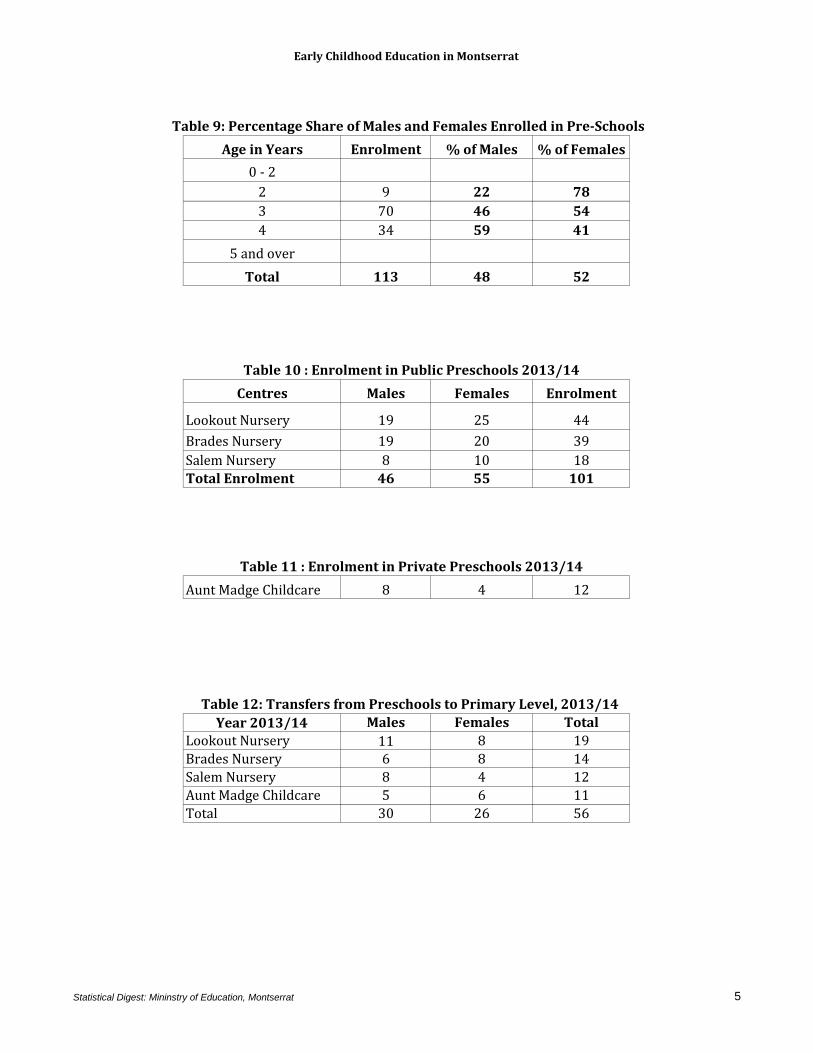
Table 9: Percentage Share of Males and Females Enrolled in Pre-School Centres by Age, 2013/14 ........... 5
Table 10: Enrolment in Public Preschools 2013/14 ...................................................................................... 5
Table 11: Enrolment in Private Preschools 2013/14..................................................................................... 5
Table 12: Transfers from Preschools to Primary Level, 2013/14 .................................................................. 5
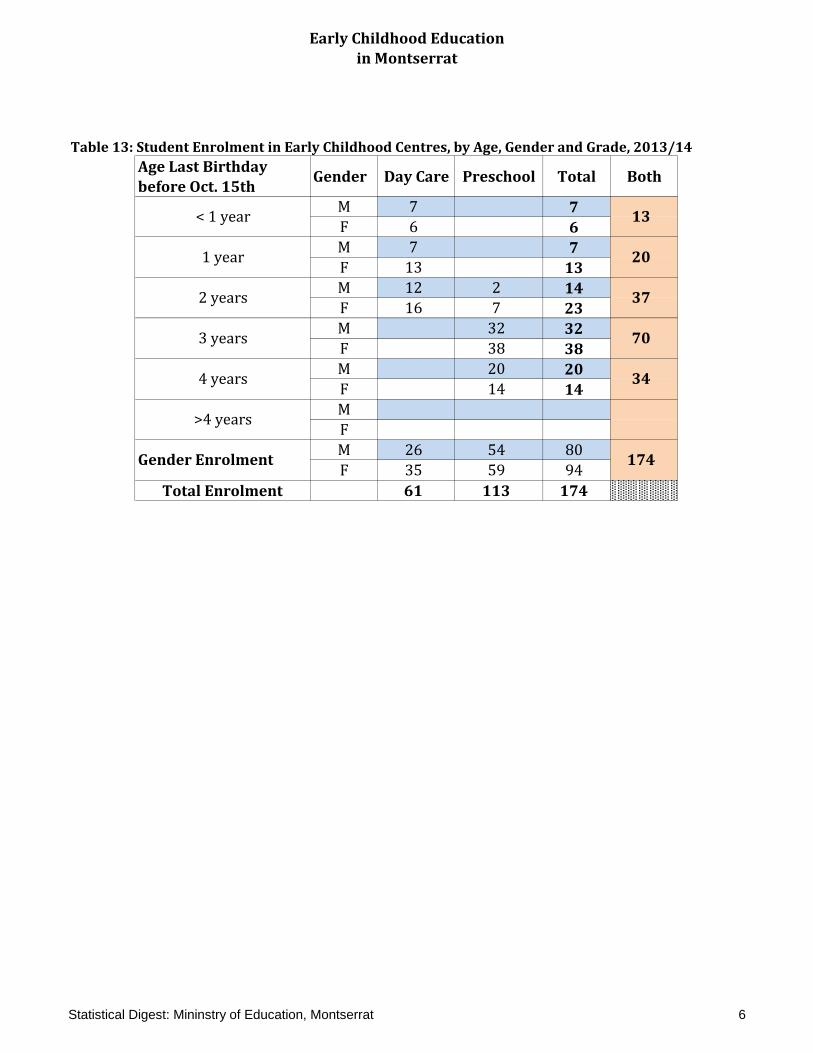
Table 13: Student Enrolment in Early Childhood Centres, by Age, Gender and Grade, 2013/14 ................ 6
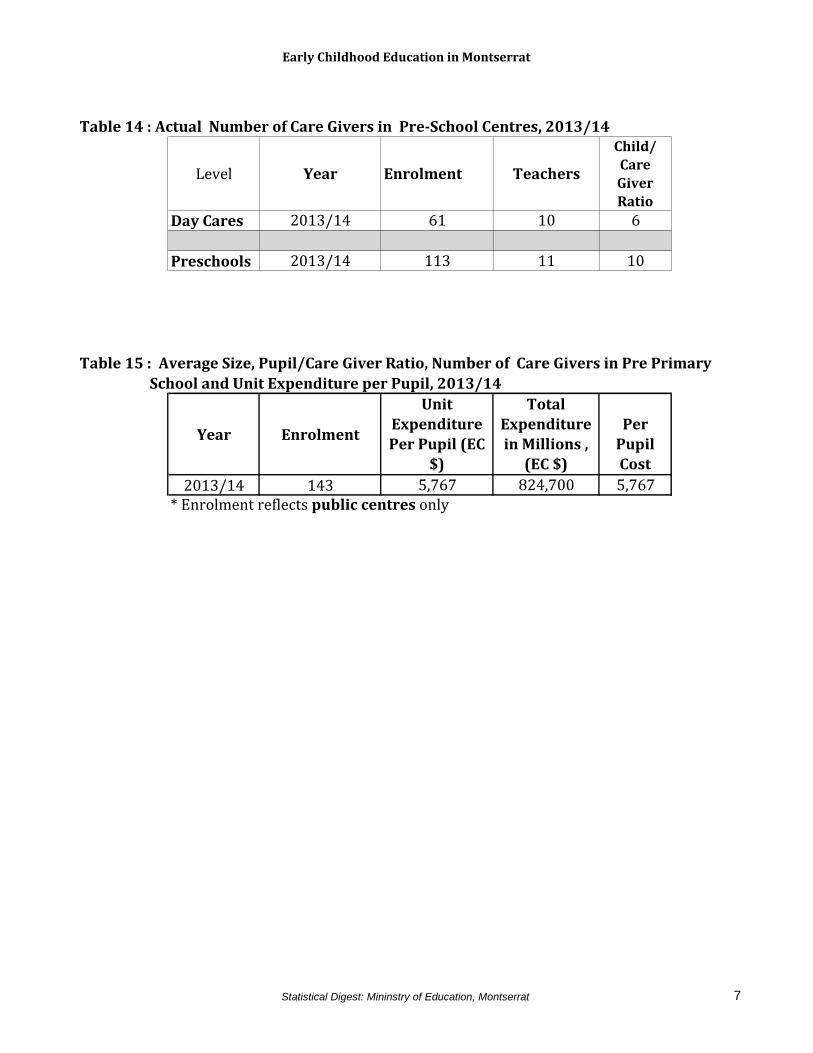
Table 14: Actual Number of Care Givers in Preschool Centres, 2013/14 ..................................................... 7
Table 15: Average Size, Pupil / Care Giver Ratio, Number of Care Givers in Pre-Primary School and Unit
Expenditure per Pupil, 2013/14 .................................................................................................................... 7
Table 16: Enrolment, Student / Teacher Ratio and Number of Schools, 2013/14 ....................................... 8
Table 17: Enrolment in Primary Schools, 2013/14 ....................................................................................... 8
Table 18: Total Student Leavers at the Primary School Level, 2013/14 ....................................................... 9
Table 19: Male Student Leavers at the Primary School Level, 2013/14 ....................................................... 9
Table 20: Female Student Leavers at the Primary School Level, 2013/14 .................................................... 9
Table 21: Transfers From Grade 6 to Secondary Level, 2013/14 .................................................................. 9
Table 22: Number of Teachers by Institution, 2013/14 .............................................................................. 10
ii
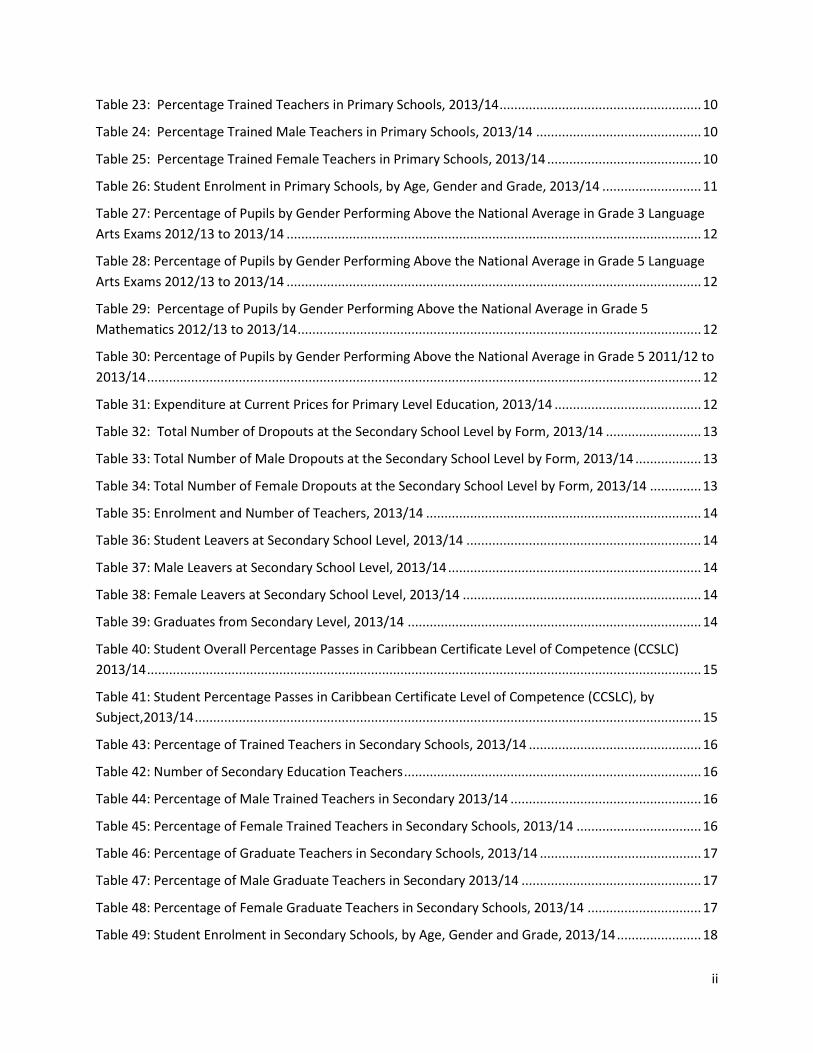
Table 23: Percentage Trained Teachers in Primary Schools, 2013/14 ....................................................... 10
Table 24: Percentage Trained Male Teachers in Primary Schools, 2013/14 ............................................. 10
Table 25: Percentage Trained Female Teachers in Primary Schools, 2013/14 .......................................... 10
Table 26: Student Enrolment in Primary Schools, by Age, Gender and Grade, 2013/14 ........................... 11
Table 27: Percentage of Pupils by Gender Performing Above the National Average in Grade 3 Language
Arts Exams 2012/13 to 2013/14 ................................................................................................................. 12
Table 28: Percentage of Pupils by Gender Performing Above the National Average in Grade 5 Language
Arts Exams 2012/13 to 2013/14 ................................................................................................................. 12
Table 29: Percentage of Pupils by Gender Performing Above the National Average in Grade 5
Mathematics 2012/13 to 2013/14 .............................................................................................................. 12
Table 30: Percentage of Pupils by Gender Performing Above the National Average in Grade 5 2011/12 to
2013/14 ....................................................................................................................................................... 12
Table 31: Expenditure at Current Prices for Primary Level Education, 2013/14 ........................................ 12
Table 32: Total Number of Dropouts at the Secondary School Level by Form, 2013/14 .......................... 13
Table 33: Total Number of Male Dropouts at the Secondary School Level by Form, 2013/14 .................. 13
Table 34: Total Number of Female Dropouts at the Secondary School Level by Form, 2013/14 .............. 13
Table 35: Enrolment and Number of Teachers, 2013/14 ........................................................................... 14
Table 36: Student Leavers at Secondary School Level, 2013/14 ................................................................ 14
Table 37: Male Leavers at Secondary School Level, 2013/14 ..................................................................... 14
Table 38: Female Leavers at Secondary School Level, 2013/14 ................................................................. 14
Table 39: Graduates from Secondary Level, 2013/14 ................................................................................ 14
Table 40: Student Overall Percentage Passes in Caribbean Certificate Level of Competence (CCSLC)
2013/14 ....................................................................................................................................................... 15
Table 41: Student Percentage Passes in Caribbean Certificate Level of Competence (CCSLC), by
Subject,2013/14 .......................................................................................................................................... 15
Table 43: Percentage of Trained Teachers in Secondary Schools, 2013/14 ............................................... 16
Table 42: Number of Secondary Education Teachers ................................................................................. 16
Table 44: Percentage of Male Trained Teachers in Secondary 2013/14 .................................................... 16
Table 45: Percentage of Female Trained Teachers in Secondary Schools, 2013/14 .................................. 16
Table 46: Percentage of Graduate Teachers in Secondary Schools, 2013/14 ............................................ 17
Table 47: Percentage of Male Graduate Teachers in Secondary 2013/14 ................................................. 17
Table 48: Percentage of Female Graduate Teachers in Secondary Schools, 2013/14 ............................... 17
Table 49: Student Enrolment in Secondary Schools, by Age, Gender and Grade, 2013/14 ....................... 18
iii
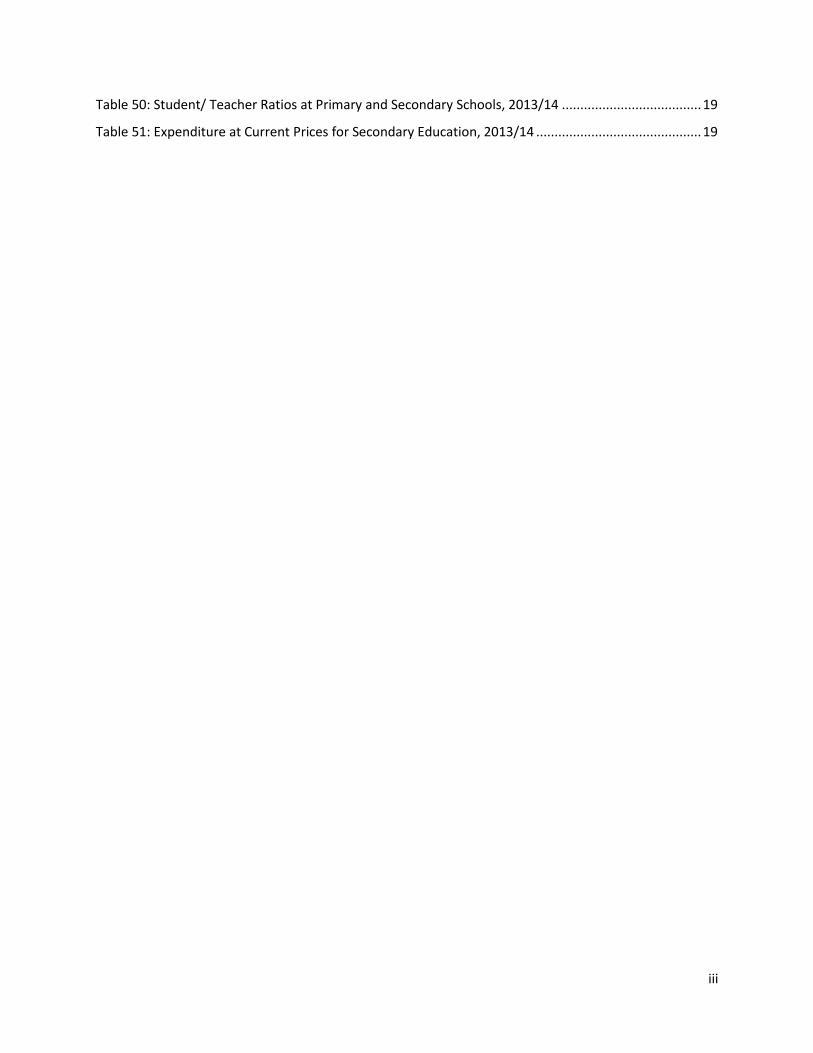
Table 50: Student/ Teacher Ratios at Primary and Secondary Schools, 2013/14 ...................................... 19
Table 51: Expenditure at Current Prices for Secondary Education, 2013/14 ............................................. 19

iv
Foreword
Ministry of Education, Montserrat, as a member of OECS and CARICOM has a mandate to provide
access to education that
1. ensures that “every learner succeeds” (OECS)
2. produces “creative and productive citizens for the 21st century” (CARICOM)
3. produces “well rounded and qualified life-long learners” (MoE’s EDP)
This inaugural Statistical Digest is designed to assist the Ministry of Education to track progress,
identify challenges, plan response strategies and make decisions that are data based/driven. The
digest is also designed to share pertinent information with our valued stakeholders: schools,
parents, children, government departments, regional and international organizations and donor
agencies.
This project was made possible with the technical support of Mr Kendall Khodra (St Lucia) and Mr
Keith Thomas (St Vincent and the Grenadines) which was funded by the OECS, EDMU.
Special thanks to Arietta Buffonge, Angelle Cassell, Tiffany Christopher, Madge Donoghue, Edith Duberry, Lorraine Francois, Eurlyn Jeffers, Gregory Julius, Wannis Persaud, Yasmin White and Sheron Burns.
Hon. Minister Colin Riley. Minister of Education, Youth Affairs and Sports

v
A Message from the Director of Education
The Ministry of Education, Youth Affairs and Sports subscribes to the general belief that
decisions which are made in the absence of real, accurate and timely date are fraught with risks
of failure. This is especially true in the social sector of human endeavour and is no less so in
education.
Education delivery is not a science and thus there are no equations or formulas to use to
guarantee success. Past performances are evaluated carefully periodically and trending is used
for forecasting and for forward planning.
Strategic planning (with its need for designing SMART performance indicators and targets)
cannot be done in the absence of real and usable data. One must be absolutely sure what
success looks like and this can only be previewed when accurate data is available.
As Director of Education I extend sincere gratitude to all those professionals who were involved
in the collection and presentation of data. This is an absolutely vital piece of work the result of
which will be used to inform decisions which are made at the local and regional level.
Mr Glenn Francis
Director of Education
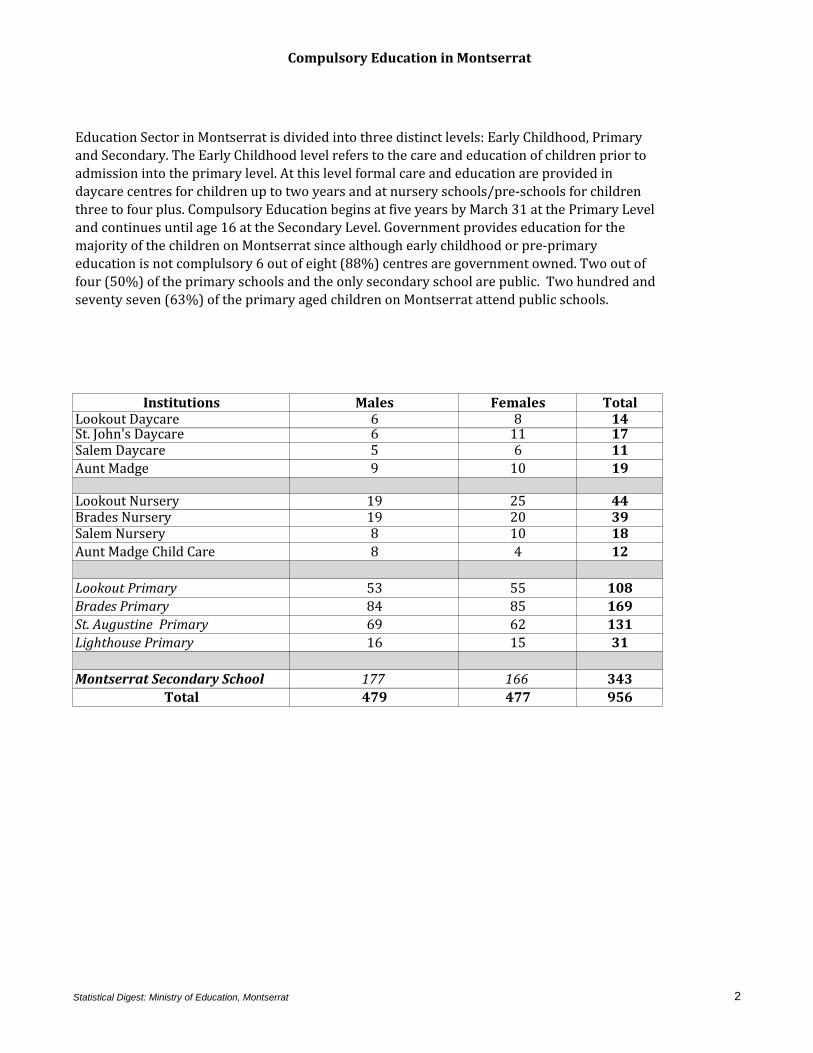
Compulsory Education in Montserrat
Institutions Males Females TotalLookout Daycare 6 8 14St. John's Daycare 6 11 17Salem Daycare 5 6 11
Aunt Madge 9 10 19
Lookout Nursery 19 25 44Brades Nursery 19 20 39Salem Nursery 8 10 18
Aunt Madge Child Care 8 4 12
Lookout Primary 53 55 108
Brades Primary 84 85 169
St. Augustine Primary 69 62 131
Lighthouse Primary 16 15 31
Montserrat Secondary School 177 166 343
Total 479 477 956
Education Sector in Montserrat is divided into three distinct levels: Early Childhood, Primary
and Secondary. The Early Childhood level refers to the care and education of children prior to
admission into the primary level. At this level formal care and education are provided in
daycare centres for children up to two years and at nursery schools/pre-schools for children
three to four plus. Compulsory Education begins at five years by March 31 at the Primary Level
and continues until age 16 at the Secondary Level. Government provides education for the
majority of the children on Montserrat since although early childhood or pre-primary
education is not complulsory 6 out of eight (88%) centres are government owned. Two out of
four (50%) of the primary schools and the only secondary school are public. Two hundred and
seventy seven (63%) of the primary aged children on Montserrat attend public schools.
Statistical Digest: Ministry of Education, Montserrat 2
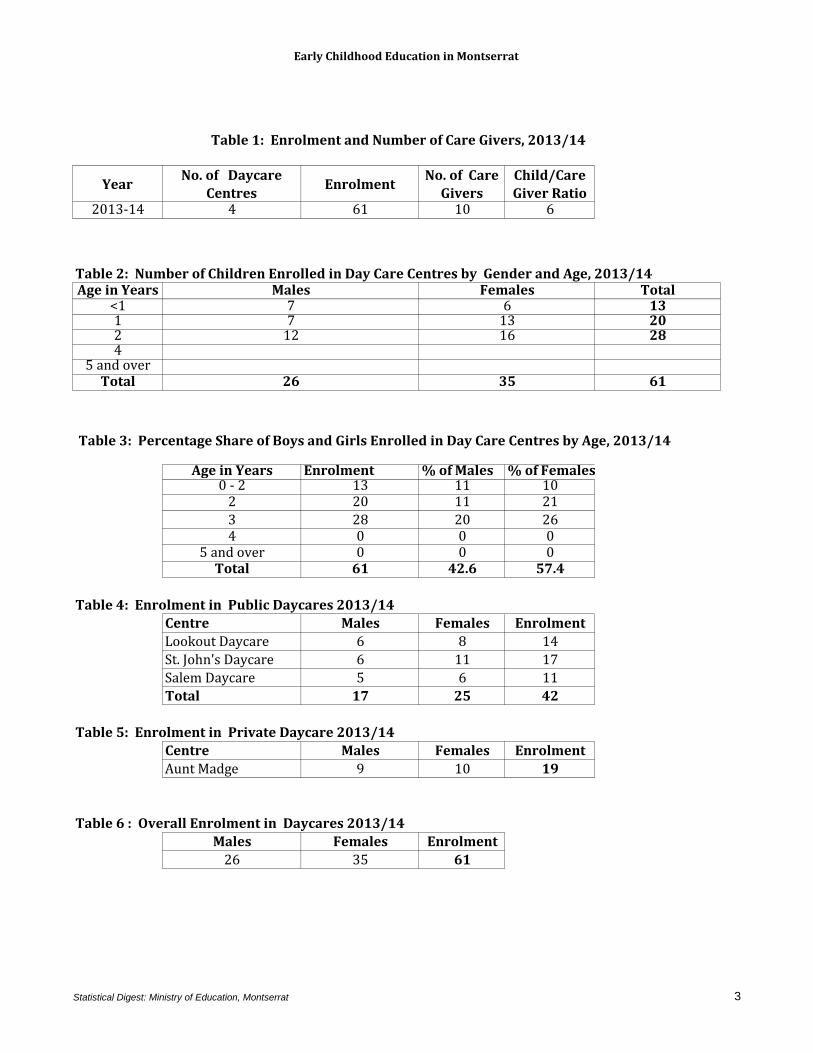
Early Childhood Education in Montserrat
YearNo. of Daycare
CentresEnrolment
No. of Care
Givers
Child/Care
Giver Ratio2013-14 4 61 10 6
Age in Years Total<1 131 202 284 0
5 and over 0Total 61
Table 3: Percentage Share of Boys and Girls Enrolled in Day Care Centres by Age, 2013/14
Age in Years Enrolment % of Males % of Females0 - 2 13 11 10
2 20 11 21
3 28 20 264 0 0 0
5 and over 0 0 0Total 61 42.6 57.4
Centre Males Females Enrolment
Lookout Daycare 6 8 14
St. John's Daycare 6 11 17
Salem Daycare 5 6 11
Total 17 25 42
Centre Males Females Enrolment
Aunt Madge 9 10 19
Males Females Enrolment
26 35 61
Table 1: Enrolment and Number of Care Givers, 2013/14
Table 2: Number of Children Enrolled in Day Care Centres by Gender and Age, 2013/14Males Females
7 6
Table 4: Enrolment in Public Daycares 2013/14
Table 5: Enrolment in Private Daycare 2013/14
Table 6 : Overall Enrolment in Daycares 2013/14
712
1316
26 35
Statistical Digest: Ministry of Education, Montserrat 3
Early Childhood Education in Montserrat
YearNo. of Preschool
CentresEnrolment No. of Practitioners
Child/ Care
Giver Ratio2013/14 4 113 11 10
Age in Years Males Females Total
0 - 2 0
2 2 7 9
3 32 38 70
4 20 14 34
5 and over 0
Total 54 59 113
Table 8: Total Number of Children Enrolled in Pre-School Centres by Gender and Age 2013/14
Table 7 : Average Size, Child/Care Giver Ratio and Number of Practitioners per Pre-School 2013/14
Statistical Digest: Mininstry of Education, Montserrat 4
Early Childhood Education in Montserrat
Age in Years Enrolment % of Males % of Females
0 - 2 0 #DIV/0! #DIV/0!
2 9 22 78
3 70 46 54
4 34 59 41
5 and over #REF! #REF! #REF!
Total 113 48 52
Centres Males Females Enrolment
Lookout Nursery 19 25 44
Brades Nursery 19 20 39
Salem Nursery 8 10 18
Total Enrolment 46 55 101
Aunt Madge Childcare 8 4 12
Year 2013/14 Males Females Total
Lookout Nursery 11 8 19
Brades Nursery 6 8 14
Salem Nursery 8 4 12
Aunt Madge Childcare 5 6 11
Total 30 26 56
Table 9: Percentage Share of Males and Females Enrolled in Pre-Schools
Table 12: Transfers from Preschools to Primary Level, 2013/14
Table 10 : Enrolment in Public Preschools 2013/14
Table 11 : Enrolment in Private Preschools 2013/14
Statistical Digest: Mininstry of Education, Montserrat 5
Early Childhood Education in Montserrat
Age Last Birthday
before Oct. 15thGender Day Care Preschool Total Both
M 7 7F 6 6M 7 7F 13 13M 12 2 14F 16 7 23M 32 32F 38 38M 20 20F 14 14M
F
M 26 54 80
F 35 59 94
Total Enrolment 61 113 174
Table 13: Student Enrolment in Early Childhood Centres, by Age, Gender and Grade, 2013/14
Gender Enrolment
3 years
4 years
>4 years
< 1 year
1 year
2 years
174
13
20
37
70
34
Statistical Digest: Mininstry of Education, Montserrat 6
Early Childhood Education in Montserrat
Level Year Enrolment Teachers
Child/ Care
Giver Ratio
Day Cares 2013/14 61 10 6
Preschools 2013/14 113 11 10
Year Enrolment
Unit Expenditure Per Pupil (EC
$)
Total Expenditure in Millions ,
(EC $)
Per Pupil Cost
2013/14 143 5,767 824,700 5,767* Enrolment reflects public centres only
Table 14 : Actual Number of Care Givers in Pre-School Centres, 2013/14
Table 15 : Average Size, Pupil/Care Giver Ratio, Number of Care Givers in Pre Primary
School and Unit Expenditure per Pupil, 2013/14
Statistical Digest: Mininstry of Education, Montserrat 7

1
Primary Education
Primary Education in Montserrat
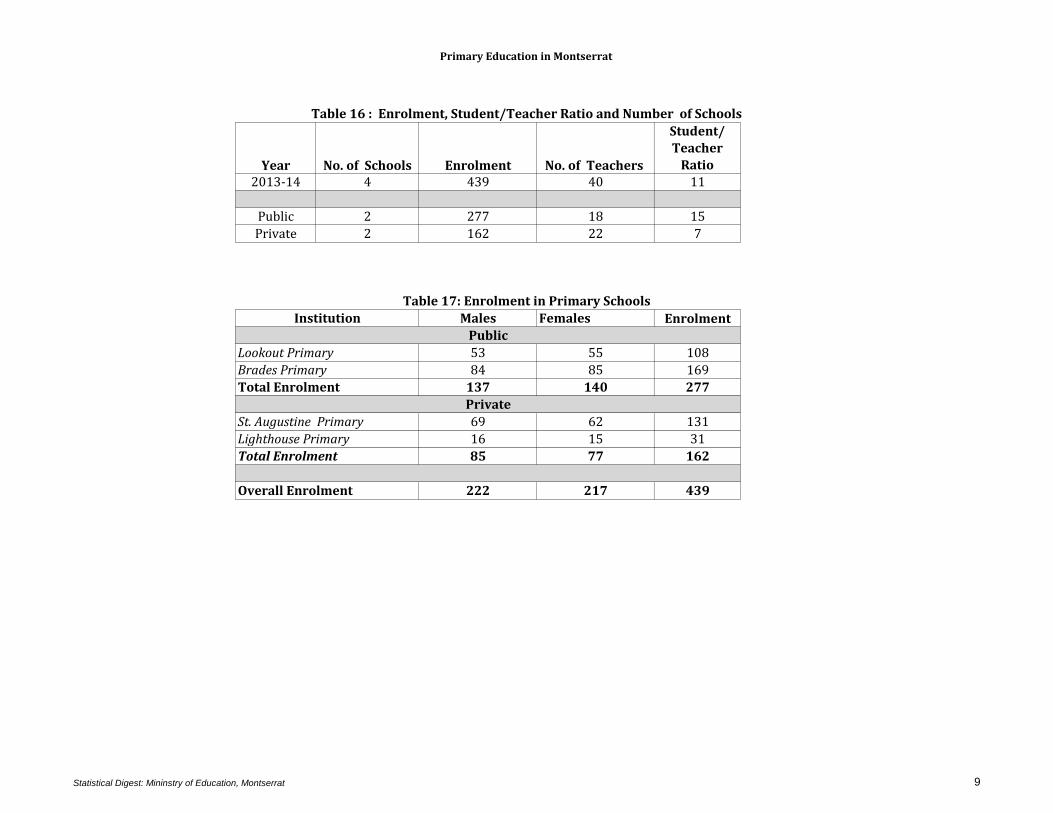
Year No. of Schools Enrolment No. of Teachers
Student/ Teacher
Ratio2013-14 4 439 40 11
Public 2 277 18 15
Private 2 162 22 7
Males Females Enrolment
Lookout Primary 53 55 108
Brades Primary 84 85 169
Total Enrolment 137 140 277
St. Augustine Primary 69 62 131
Lighthouse Primary 16 15 31
Total Enrolment 85 77 162
Overall Enrolment 222 217 439
Table 16 : Enrolment, Student/Teacher Ratio and Number of Schools
Table 17: Enrolment in Primary Schools
Institution
Private
Public
Statistical Digest: Mininstry of Education, Montserrat 9
Primary Education in Montserrat
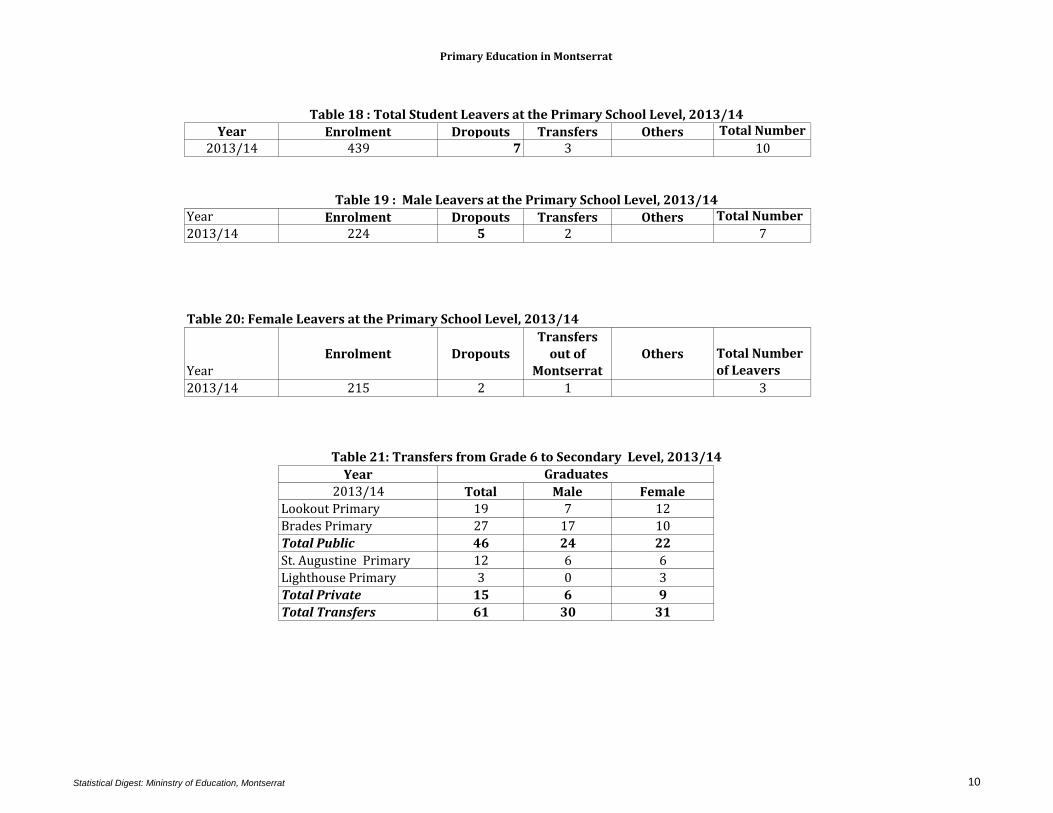
Year Enrolment Dropouts Transfers Others Total Number
2013/14 439 7 3 10
Year Enrolment Dropouts Transfers Others Total Number
2013/14 224 5 2 7
Table 20: Female Leavers at the Primary School Level, 2013/14
YearEnrolment Dropouts
Transfers out of
MontserratOthers Total Number
of Leavers
2013/14 215 2 1 3
Year2013/14 Total Male Female
Lookout Primary 19 7 12
Brades Primary 27 17 10
Total Public 46 24 22
St. Augustine Primary 12 6 6
Lighthouse Primary 3 0 3
Total Private 15 6 9
Total Transfers 61 30 31
Graduates
Table 19 : Male Leavers at the Primary School Level, 2013/14
Table 18 : Total Student Leavers at the Primary School Level, 2013/14
Table 21: Transfers from Grade 6 to Secondary Level, 2013/14
Statistical Digest: Mininstry of Education, Montserrat 10
Primary Education in Montserrat
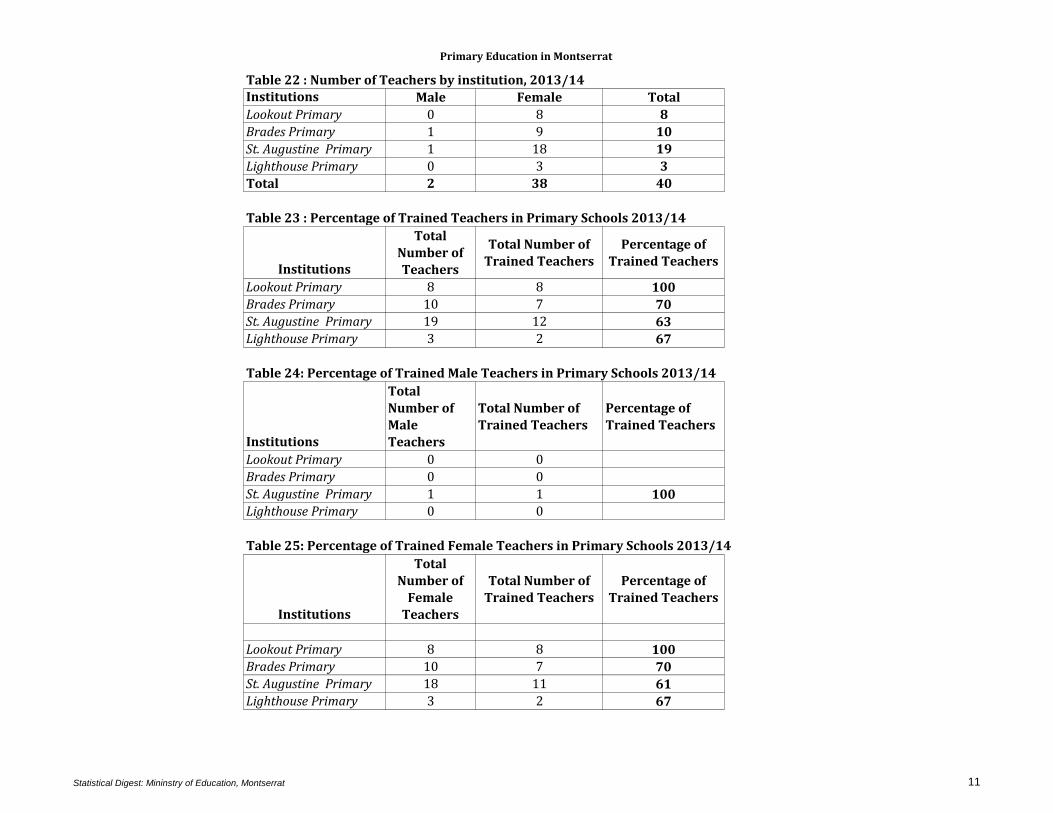
Table 22 : Number of Teachers by institution, 2013/14Institutions Male Female Total
Lookout Primary 0 8 8
Brades Primary 1 9 10
St. Augustine Primary 1 18 19
Lighthouse Primary 0 3 3
Total 2 38 40
Table 23 : Percentage of Trained Teachers in Primary Schools 2013/14
Institutions
Total Number of Teachers
Total Number of Trained Teachers
Percentage of Trained Teachers
Lookout Primary 8 8 100Brades Primary 10 7 70St. Augustine Primary 19 12 63Lighthouse Primary 3 2 67
Table 24: Percentage of Trained Male Teachers in Primary Schools 2013/14
Institutions
Total Number of Male Teachers
Total Number of Trained Teachers
Percentage of Trained Teachers
Lookout Primary 0 0 0Brades Primary 0 0 #DIV/0!St. Augustine Primary 1 1 100Lighthouse Primary 0 0 #DIV/0!
Table 25: Percentage of Trained Female Teachers in Primary Schools 2013/14
Institutions
Total Number of
Female Teachers
Total Number of Trained Teachers
Percentage of Trained Teachers
Lookout Primary 8 8 100Brades Primary 10 7 70St. Augustine Primary 18 11 61Lighthouse Primary 3 2 67
Statistical Digest: Mininstry of Education, Montserrat 11
Primary Education in Montserrat
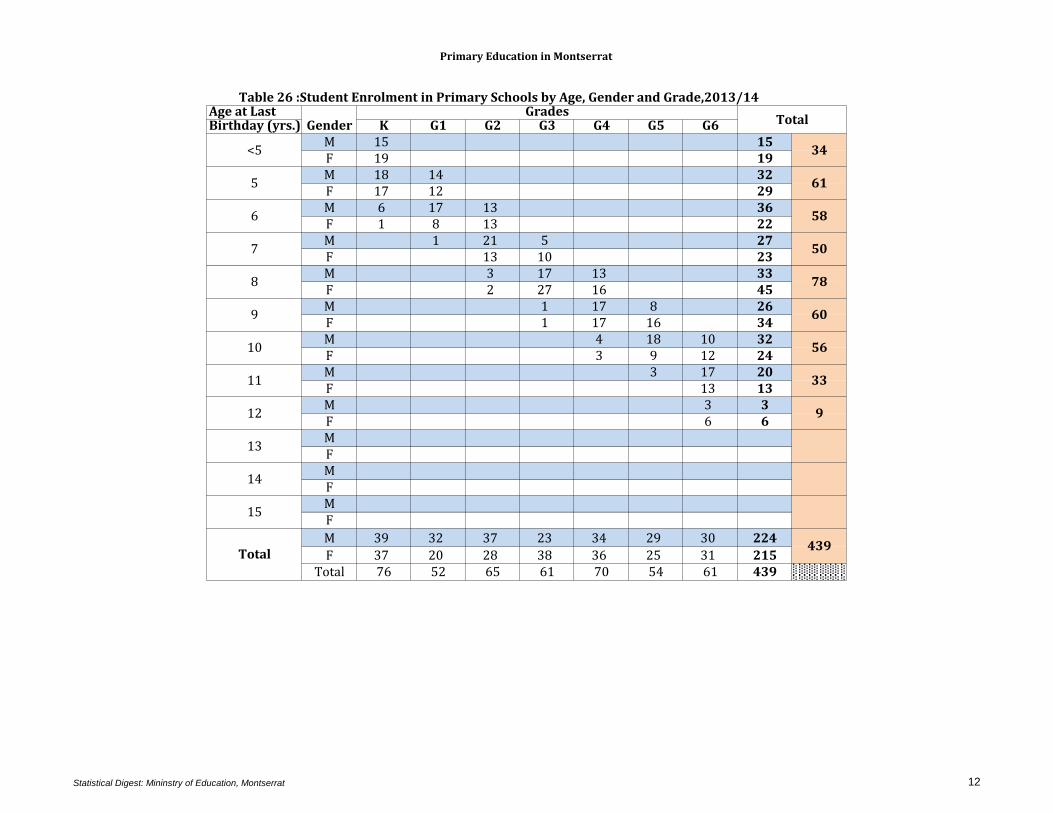
Age at LastBirthday (yrs.) K G1 G2 G3 G4 G5 G6
M 15 15F 19 19M 18 14 32F 17 12 29M 6 17 13 36F 1 8 13 22M 1 21 5 27F 13 10 23M 3 17 13 33F 2 27 16 45M 1 17 8 26F 1 17 16 34M 4 18 10 32F 3 9 12 24M 3 17 20F 13 13M 3 3F 6 6MFMFMF
M 39 32 37 23 34 29 30 224
F 37 20 28 38 36 25 31 215Total 76 52 65 61 70 54 61 439
Table 26 :Student Enrolment in Primary Schools by Age, Gender and Grade,2013/14
50
33
78
9
<5
5
6
9
7
8
60
GenderGrades
34
61
58
Total
Total439
10
11
14
15
56
13
12
Statistical Digest: Mininstry of Education, Montserrat 12
Primary Education in Montserrat
Institution
Male Female Total Male Female Total
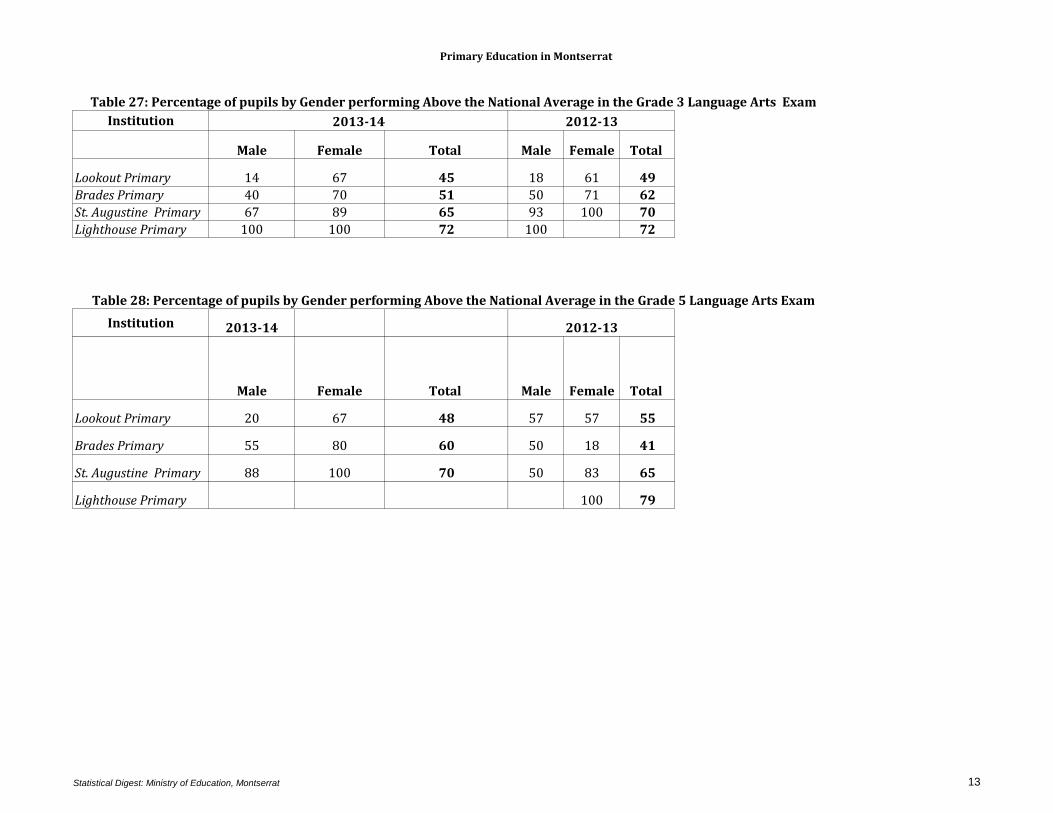
Lookout Primary 14 67 45 18 61 49
Brades Primary 40 70 51 50 71 62
St. Augustine Primary 67 89 65 93 100 70
Lighthouse Primary 100 100 72 100 72
Institution 2013-14
Male Female Total Male Female Total
Lookout Primary 20 67 48 57 57 55
Brades Primary 55 80 60 50 18 41
St. Augustine Primary 88 100 70 50 83 65
Lighthouse Primary 100 79
Table 27: Percentage of pupils by Gender performing Above the National Average in the Grade 3 Language Arts Exam
2013-14 2012-13
Table 28: Percentage of pupils by Gender performing Above the National Average in the Grade 5 Language Arts Exam
2012-13
Statistical Digest: Ministry of Education, Montserrat 13
Primary Education in Montserrat
Male Female Total Male Female Total
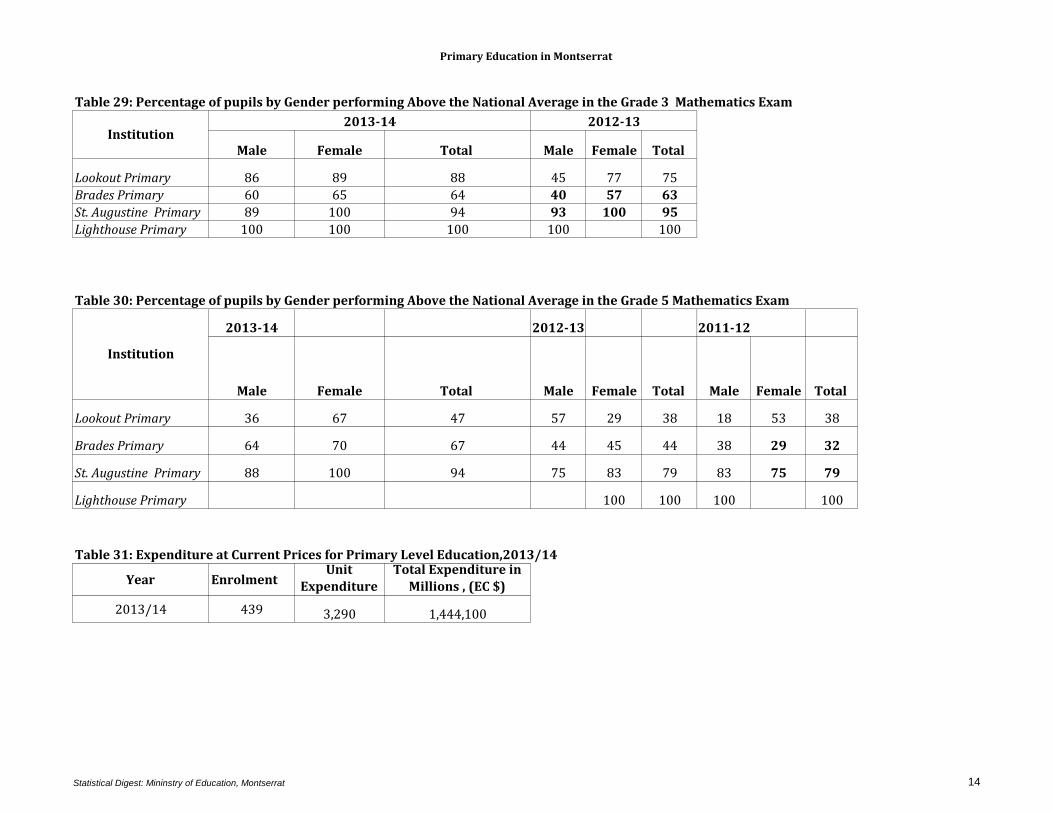
Lookout Primary 86 89 88 45 77 75
Brades Primary 60 65 64 40 57 63
St. Augustine Primary 89 100 94 93 100 95
Lighthouse Primary 100 100 100 100 100
2013-14 2012-13 2011-12
Male Female Total Male Female Total Male Female Total
Lookout Primary 36 67 47 57 29 38 18 53 38
Brades Primary 64 70 67 44 45 44 38 29 32
St. Augustine Primary 88 100 94 75 83 79 83 75 79
Lighthouse Primary 100 100 100 100
Table 31: Expenditure at Current Prices for Primary Level Education,2013/14
Year EnrolmentUnit
Expenditure Total Expenditure in
Millions , (EC $)
2013/14 439 3,290 1,444,100
Institution
2013-14 2012-13
Table 30: Percentage of pupils by Gender performing Above the National Average in the Grade 5 Mathematics Exam
Table 29: Percentage of pupils by Gender performing Above the National Average in the Grade 3 Mathematics Exam
Institution
Statistical Digest: Mininstry of Education, Montserrat 14

15
Secondary Education
Secondary Education in Montserrat
Total %Form 1Form 2 Form 3 Form 4 Form 5 Dropouts Dropouts
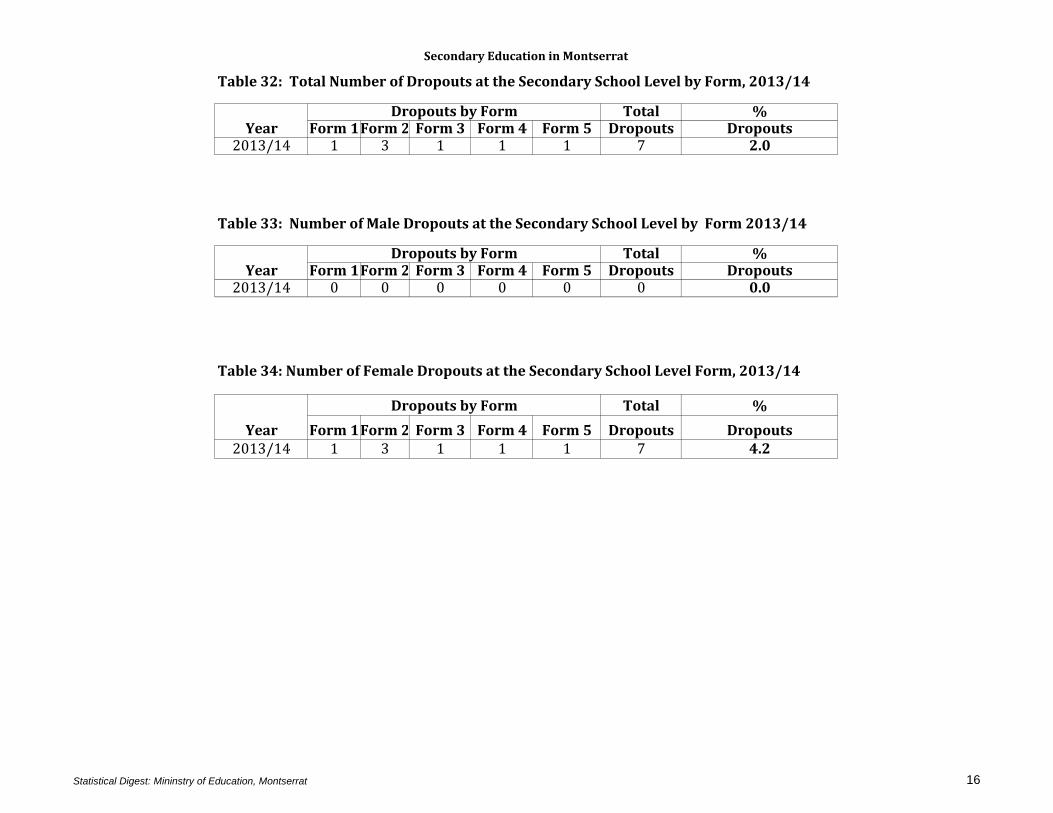
2013/14 1 3 1 1 1 7 2.0
Total %Form 1Form 2 Form 3 Form 4 Form 5 Dropouts Dropouts
2013/14 0 0 0 0 0 0 0.0
Total %
Form 1Form 2 Form 3 Form 4 Form 5 Dropouts Dropouts2013/14 1 3 1 1 1 7 4.2
Table 32: Total Number of Dropouts at the Secondary School Level by Form, 2013/14
Table 33: Number of Male Dropouts at the Secondary School Level by Form 2013/14
Year
Dropouts by Form
YearDropouts by Form
YearDropouts by Form
Table 34: Number of Female Dropouts at the Secondary School Level Form, 2013/14
Statistical Digest: Mininstry of Education, Montserrat 16
Secondary Education in Montserrat
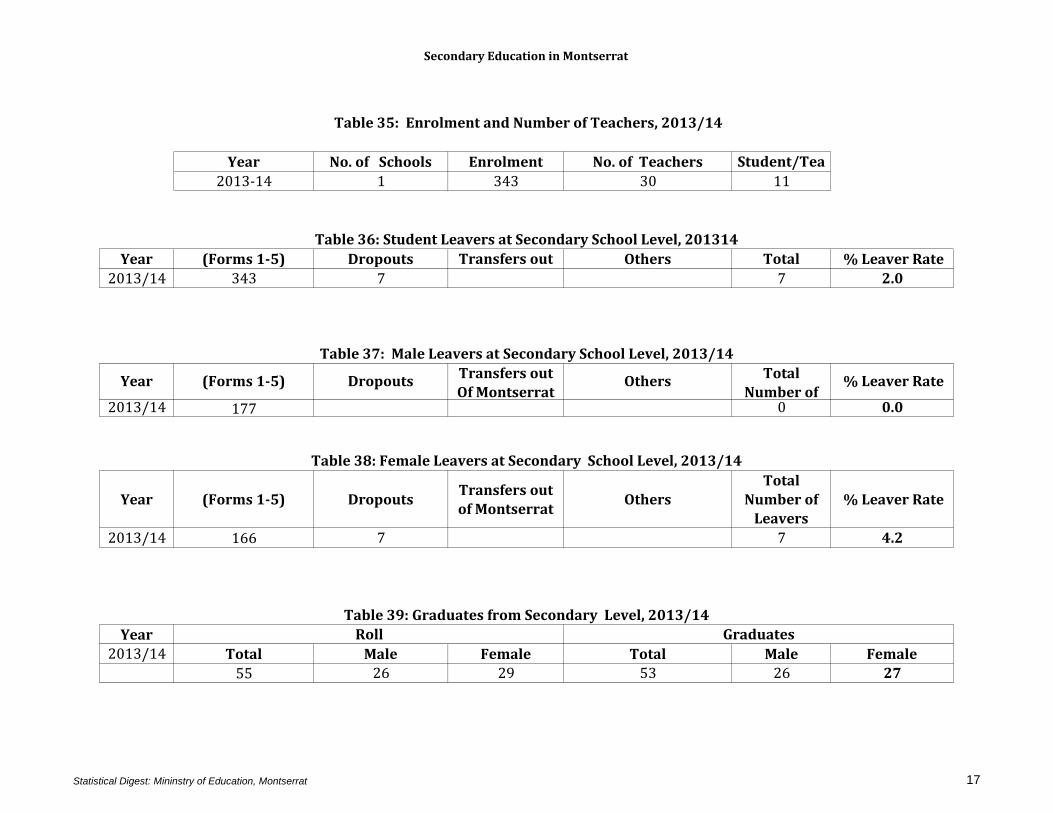
Year No. of Schools Enrolment No. of Teachers Student/Tea
cher Ratio2013-14 1 343 30 11
Year (Forms 1-5) Dropouts Transfers out
Of MontserratOthers Total
Number of % Leaver Rate
2013/14 343 7 7 2.0
2013/14 177 0 0.0
Year (Forms 1-5) DropoutsTransfers out
of MontserratOthers
Total
Number of
Leavers
% Leaver Rate
2013/14 166 7 7 4.2
Year
2013/14 Total Male Female Total Male Female
55 26 29 53 26 27
Table 35: Enrolment and Number of Teachers, 2013/14
Table 39: Graduates from Secondary Level, 2013/14
Table 38: Female Leavers at Secondary School Level, 2013/14
Table 37: Male Leavers at Secondary School Level, 2013/14
GraduatesRoll
Table 36: Student Leavers at Secondary School Level, 201314
Year (Forms 1-5) DropoutsTransfers out
Of MontserratOthers
Total
Number of % Leaver Rate
Statistical Digest: Mininstry of Education, Montserrat 17
Secondary Education in Montserrat
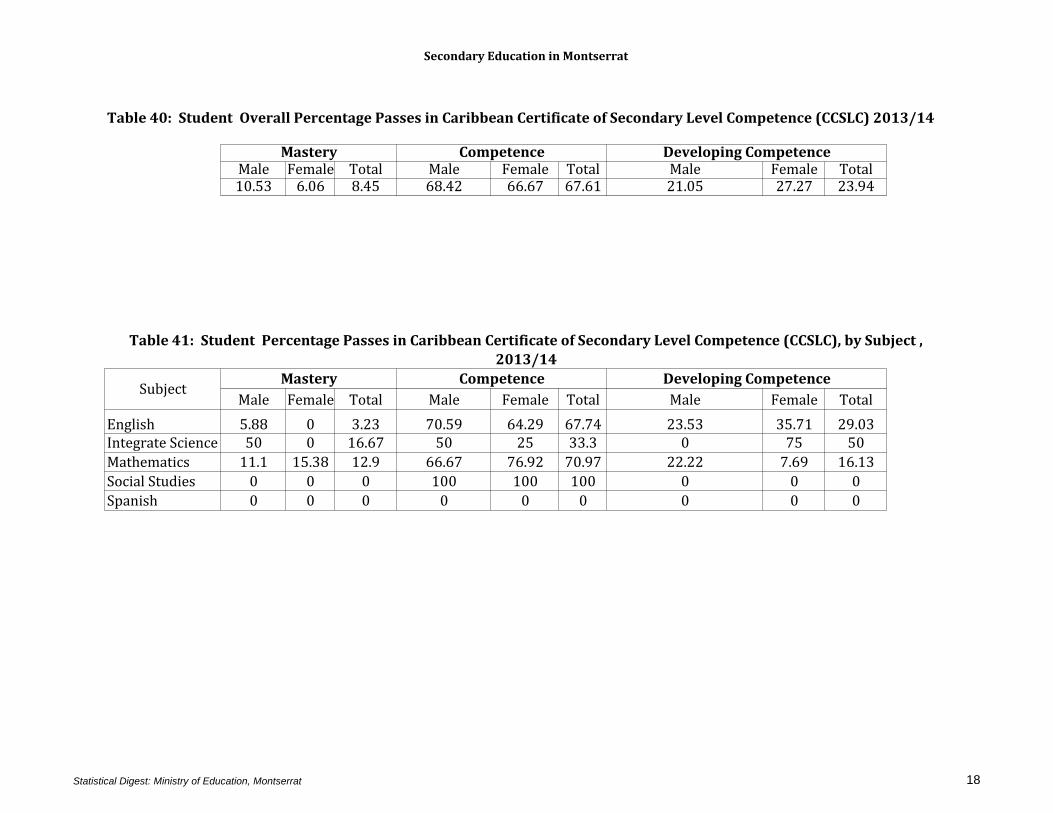
Male Female Total Male Female Total Male Female Total10.53 6.06 8.45 68.42 66.67 67.61 21.05 27.27 23.94
Male Female Total Male Female Total Male Female Total
English 5.88 0 3.23 70.59 64.29 67.74 23.53 35.71 29.03Integrate Science 50 0 16.67 50 25 33.3 0 75 50
Mathematics 11.1 15.38 12.9 66.67 76.92 70.97 22.22 7.69 16.13
Social Studies 0 0 0 100 100 100 0 0 0
Spanish 0 0 0 0 0 0 0 0 0
Table 40: Student Overall Percentage Passes in Caribbean Certificate of Secondary Level Competence (CCSLC) 2013/14
Mastery Competence Developing Competence
SubjectMastery Competence Developing Competence
Table 41: Student Percentage Passes in Caribbean Certificate of Secondary Level Competence (CCSLC), by Subject ,
2013/14
Statistical Digest: Ministry of Education, Montserrat 18
Secondary Education in Montserrat
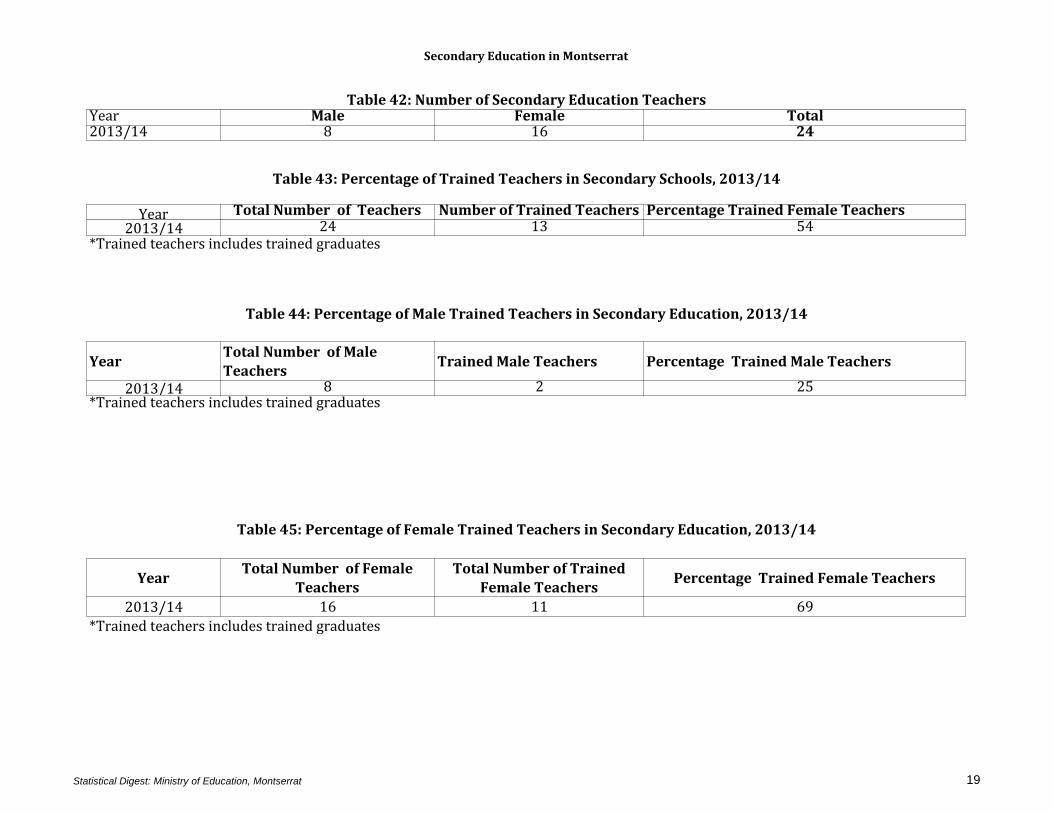
Year Male Female Total2013/14 8 16 24
Year Total Number of Teachers Number of Trained Teachers Percentage Trained Female Teachers2013/14 24 13 54
*Trained teachers includes trained graduates
YearTotal Number of Male
TeachersTrained Male Teachers Percentage Trained Male Teachers
2013/14 8 2 25*Trained teachers includes trained graduates
YearTotal Number of Female
Teachers
Total Number of Trained
Female TeachersPercentage Trained Female Teachers
2013/14 16 11 69
*Trained teachers includes trained graduates
Table 44: Percentage of Male Trained Teachers in Secondary Education, 2013/14
Table 45: Percentage of Female Trained Teachers in Secondary Education, 2013/14
Table 43: Percentage of Trained Teachers in Secondary Schools, 2013/14
Table 42: Number of Secondary Education Teachers
Statistical Digest: Ministry of Education, Montserrat 19
Secondary Schools In Montserrat
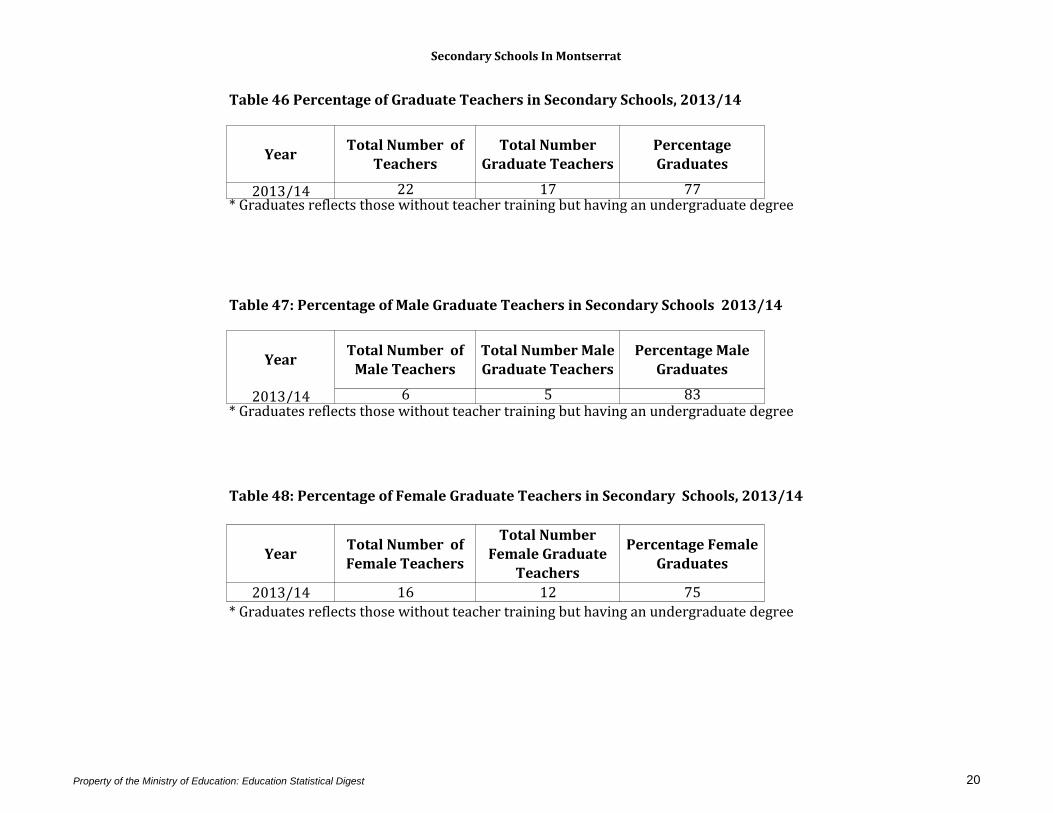
YearTotal Number of
Teachers
Total Number
Graduate Teachers
Percentage
Graduates
2013/14 22 17 77* Graduates reflects those without teacher training but having an undergraduate degree
YearTotal Number of
Male Teachers
Total Number Male
Graduate Teachers
Percentage Male
Graduates
2013/14 6 5 83
YearTotal Number of
Female Teachers
Total Number
Female Graduate
Teachers
Percentage Female
Graduates
2013/14 16 12 75
* Graduates reflects those without teacher training but having an undergraduate degree
* Graduates reflects those without teacher training but having an undergraduate degree
Table 46 Percentage of Graduate Teachers in Secondary Schools, 2013/14
Table 47: Percentage of Male Graduate Teachers in Secondary Schools 2013/14
Table 48: Percentage of Female Graduate Teachers in Secondary Schools, 2013/14
Property of the Ministry of Education: Education Statistical Digest 20
Secondary Schools In Montserrat
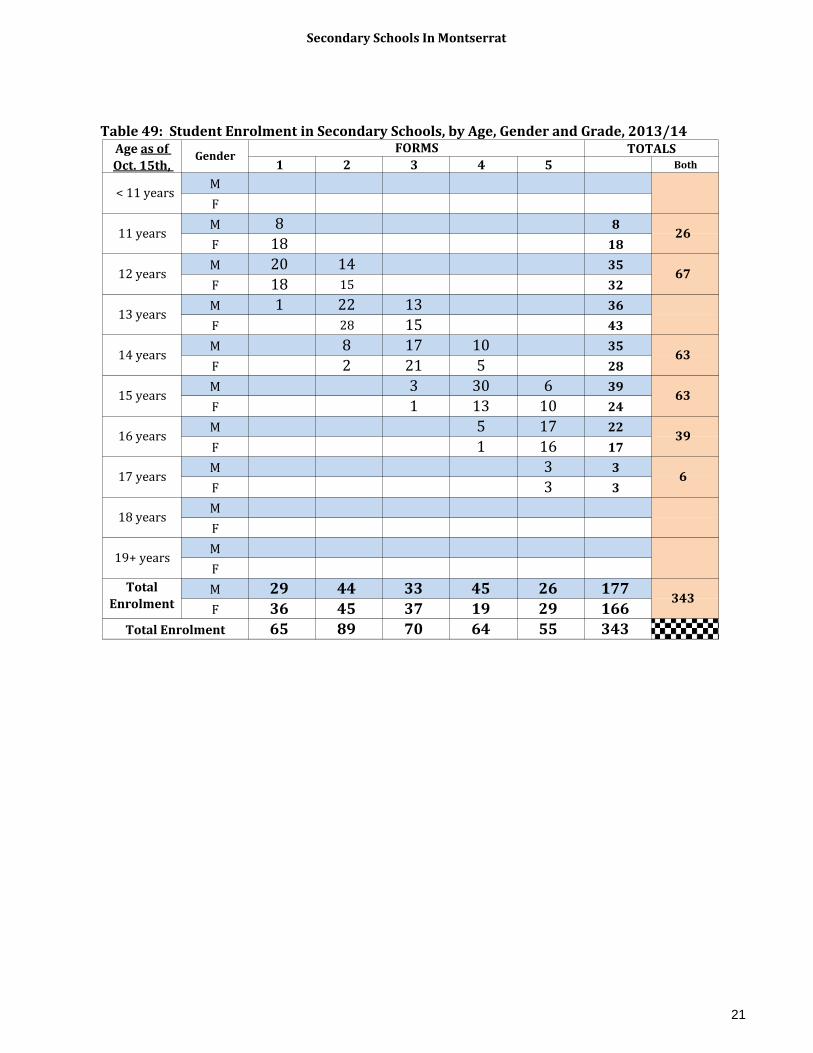
1 2 3 4 5 Both
M
F
M 8 8
F 18 18
M 20 14 35
F 18 15 32
M 1 22 13 36
F 28 15 43
M 8 17 10 35
F 2 21 5 28
M 3 30 6 39
F 1 13 10 24
M 5 17 22
F 1 16 17
M 3 3
F 3 3
M
F
M
F
M 29 44 33 45 26 177
F 36 45 37 19 29 166
65 89 70 64 55 343
Table 49: Student Enrolment in Secondary Schools, by Age, Gender and Grade, 2013/14
13 years
Age as of
Oct. 15th, Gender
FORMS TOTALS
< 11 years
11 years 26
12 years 67
14 years 63
15 years 63
16 years 39
Total
Enrolment 343
Total Enrolment
17 years 6
18 years
19+ years
21
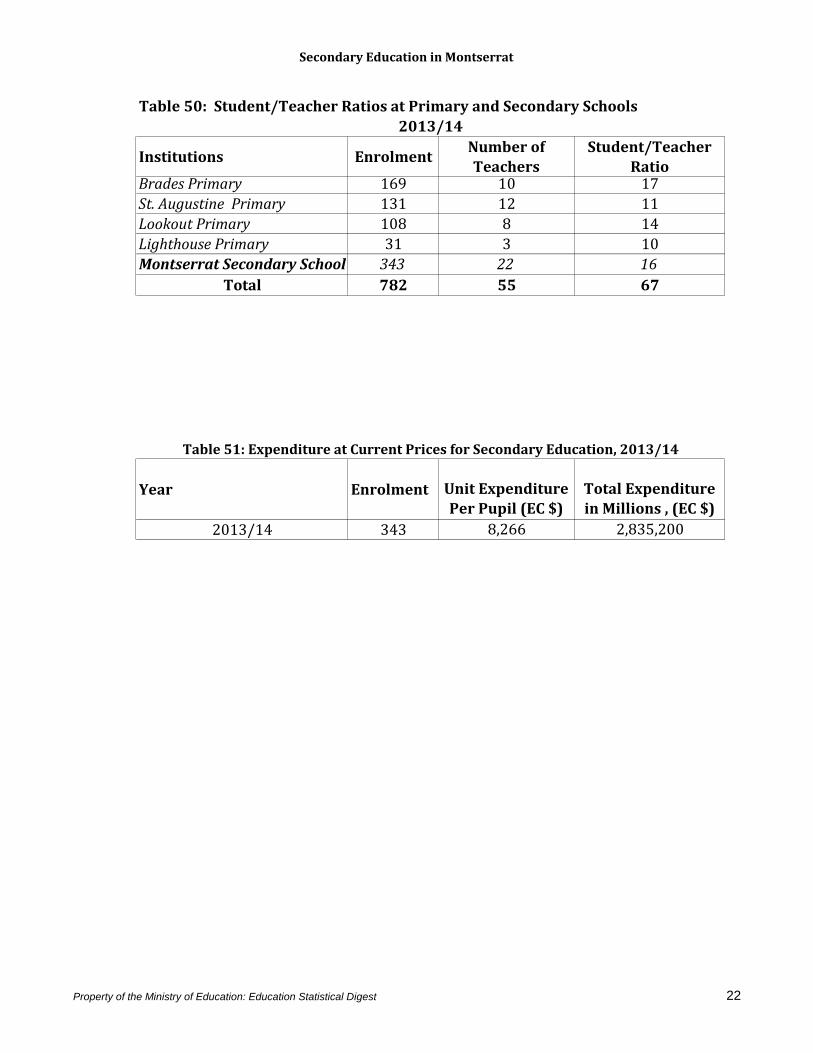
Secondary Education in Montserrat
Institutions EnrolmentNumber of
Teachers
Student/Teacher
RatioBrades Primary 169 10 17
St. Augustine Primary 131 12 11
Lookout Primary 108 8 14
Lighthouse Primary 31 3 10
Montserrat Secondary School 343 22 16
Total 782 55 67
Year Enrolment Unit Expenditure
Per Pupil (EC $)
Total Expenditure
in Millions , (EC $)
2013/14 343 8,266 2,835,200
2013/14
Table 50: Student/Teacher Ratios at Primary and Secondary Schools
Table 51: Expenditure at Current Prices for Secondary Education, 2013/14
Property of the Ministry of Education: Education Statistical Digest 22
Recommended