April 23, 2014 1
United Stationers Inc.
Earnings Presentation
First Quarter 2014
April 23, 2014 2
Forward Looking Statements and
Non-GAAP Measures This presentation contains forward-looking statements, including references to goals, plans, strategies, objectives, projected costs or savings,
anticipated future performance, results or events and other statements that are not strictly historical in nature. These statements are based on
management’s current expectations, forecasts and assumptions. This means they involve a number of risks and uncertainties that could cause
actual results to differ materially from those expressed or implied here. These risks and uncertainties include, but are not limited to the
following: United’s reliance on key customers, and the risks inherent in continuing or increased customer concentration; end-user demand for
products in the office, technology and furniture product categories may continue to decline; prevailing economic conditions and changes affecting
the business products industry and the general economy; United’s ability to effectively manage its operations and to implement growth, cost-
reduction and margin-enhancement initiatives; United’s reliance on supplier allowances and promotional incentives; United’s reliance on
independent resellers for a significant percentage of its net sales and, therefore, the importance of the continued independence, viability and
success of these resellers; continuing or increasing competitive activity and pricing pressures within existing or expanded product categories,
including competition from product manufacturers who sell directly to United’s customers; the impact of supply chain disruptions or changes in key
suppliers’ distribution strategies; United’s ability to maintain its existing information technology systems and the systems and eCommerce
services that it provides to customers, and to successfully procure, develop and implement new systems and services without business disruption
or other unanticipated difficulties or costs; the creditworthiness of United’s customers; United’s ability to manage inventory in order to maximize
sales and supplier allowances while minimizing excess and obsolete inventory; United’s success in effectively identifying, consummating and
integrating acquisitions; the risks and expense associated with United’s obligations to maintain the security of private information provided by
United’s customers; the costs and risks related to compliance with laws, regulations and industry standards affecting United’s business; the
availability of financing sources to meet United’s business needs; United’s reliance on key management personnel, both in day-to-day operations
and in execution of new business initiatives; and the effects of hurricanes, acts of terrorism and other natural or man-made disruptions.
Shareholders, potential investors and other readers are urged to consider these risks and uncertainties in evaluating forward-looking statements
and are cautioned not to place undue reliance on the forward-looking statements. For additional information about risks and uncertainties that
could materially affect United’s results, please see the company’s Securities and Exchange Commission filings. The forward-looking information
in this presentation is made as of this date only, and the company does not undertake to update any forward-looking statement. Investors are
advised to consult any further disclosure by United regarding the matters discussed in this presentation in its filings with the Securities and
Exchange Commission and in other written statements it makes from time to time. It is not possible to anticipate or foresee all risks and
uncertainties, and investors should not consider any list of risks and uncertainties to be exhaustive or complete.
* This is non-GAAP information. A reconciliation of these items to the most comparable GAAP measures is presented on the company’s Website
(www.unitedstationers.com) under the Investor Information section. Except as noted, all references within this presentation to financial results are
presented in accordance with U.S. Generally Accepted Accounting Principles.
Certain prior-period amounts have been reclassified to conform to the current presentation.
April 23, 2014
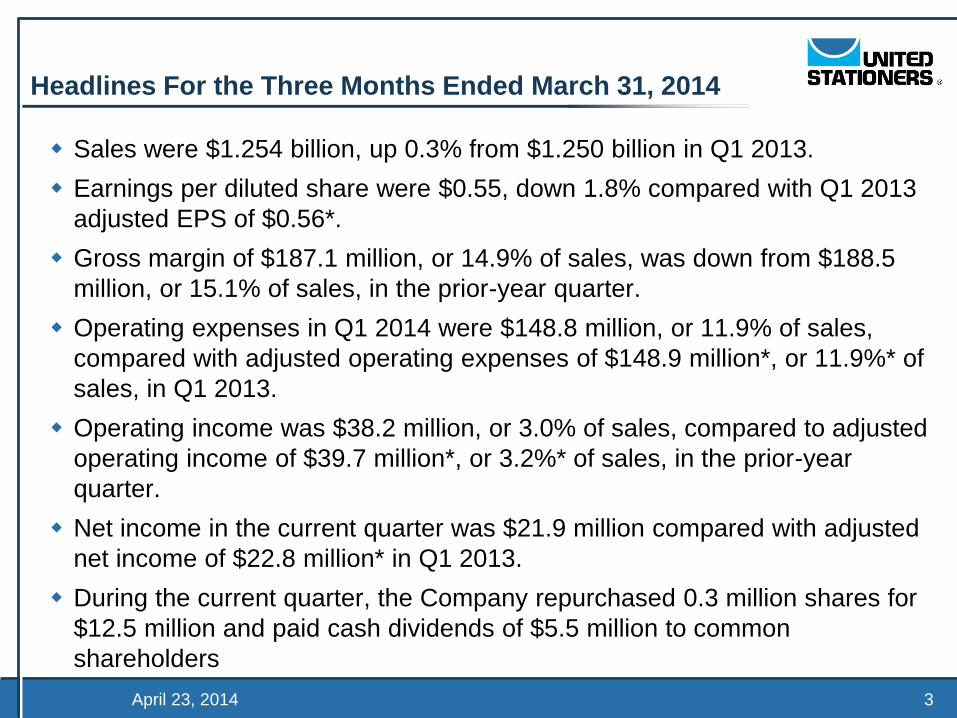
Headlines For the Three Months Ended March 31, 2014
Sales were $1.254 billion, up 0.3% from $1.250 billion in Q1 2013.
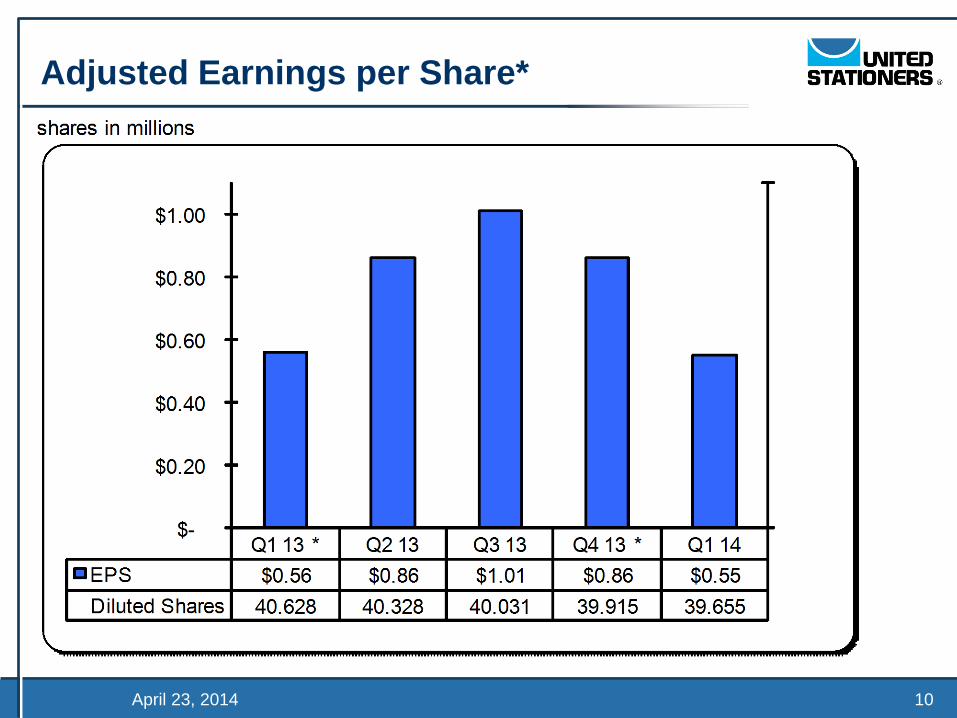
Earnings per diluted share were $0.55, down 1.8% compared with Q1 2013
adjusted EPS of $0.56*.
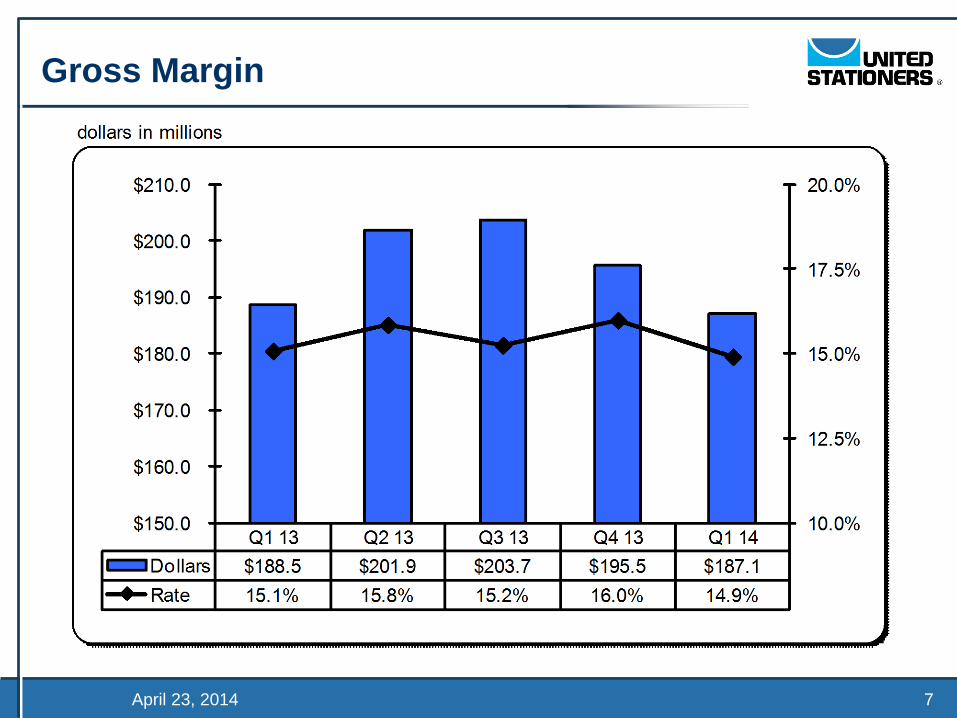
Gross margin of $187.1 million, or 14.9% of sales, was down from $188.5
million, or 15.1% of sales, in the prior-year quarter.
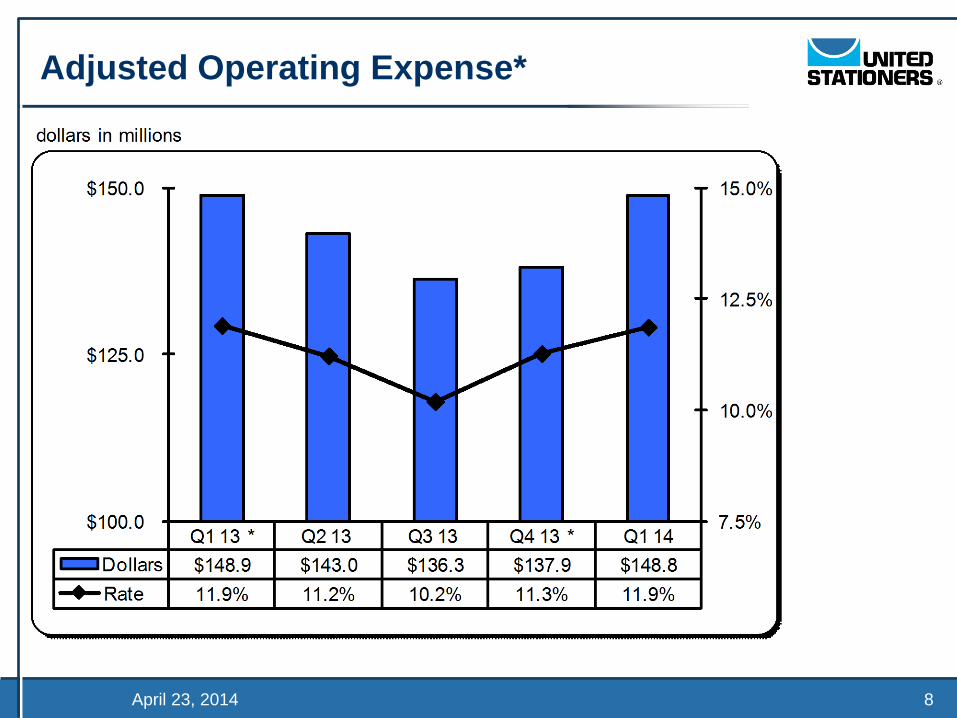
Operating expenses in Q1 2014 were $148.8 million, or 11.9% of sales,
compared with adjusted operating expenses of $148.9 million*, or 11.9%* of
sales, in Q1 2013.
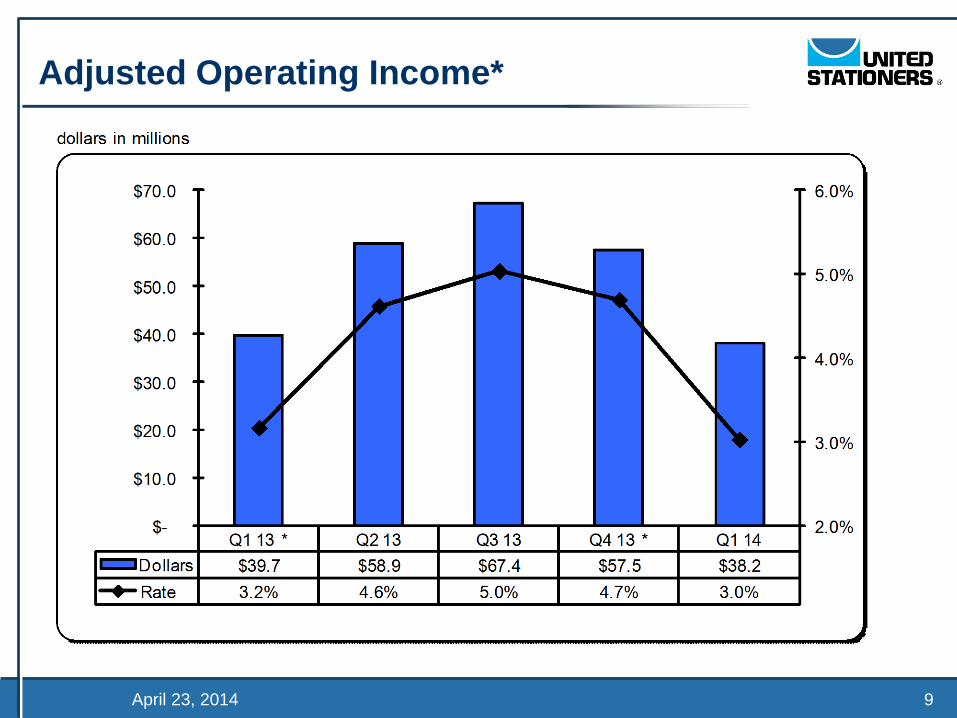
Operating income was $38.2 million, or 3.0% of sales, compared to adjusted
operating income of $39.7 million*, or 3.2%* of sales, in the prior-year
quarter.
Net income in the current quarter was $21.9 million compared with adjusted
net income of $22.8 million* in Q1 2013.
During the current quarter, the Company repurchased 0.3 million shares for
$12.5 million and paid cash dividends of $5.5 million to common
shareholders
3
April 23, 2014 4
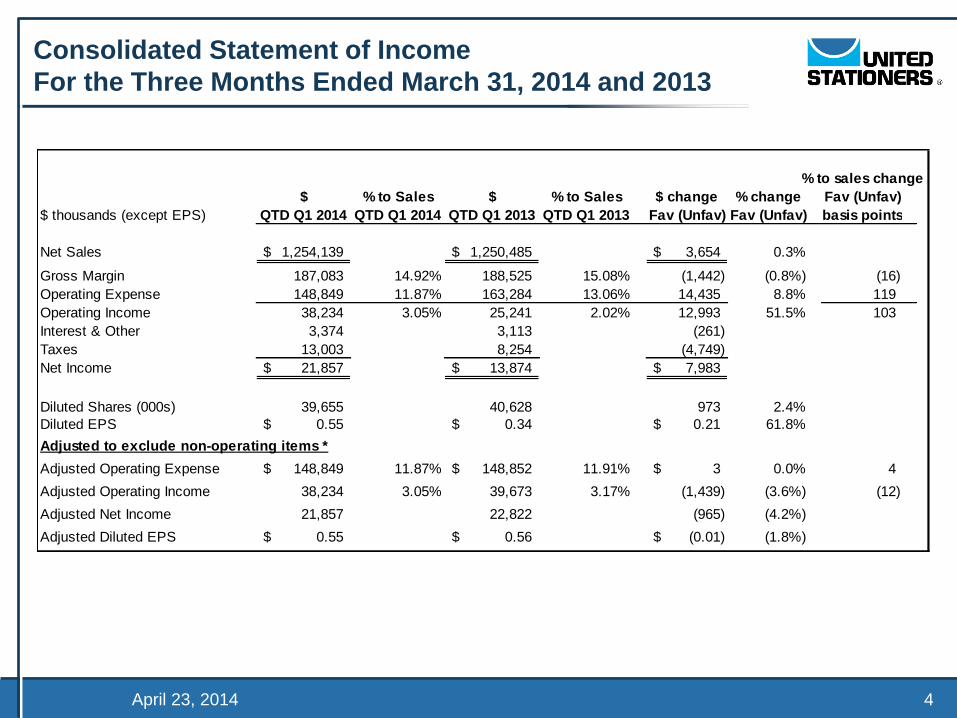
Consolidated Statement of Income
For the Three Months Ended March 31, 2014 and 2013
% to sales change
$ % to Sales $ % to Sales $ change % change Fav (Unfav)
$ thousands (except EPS) QTD Q1 2014 QTD Q1 2014 QTD Q1 2013 QTD Q1 2013 Fav (Unfav) Fav (Unfav) basis points
Net Sales 1,254,139$ 1,250,485$ 3,654$ 0.3%
Gross Margin 187,083 14.92% 188,525 15.08% (1,442) (0.8%) (16)
Operating Expense 148,849 11.87% 163,284 13.06% 14,435 8.8% 119
Operating Income 38,234 3.05% 25,241 2.02% 12,993 51.5% 103
Interest & Other 3,374 3,113 (261)
Taxes 13,003 8,254 (4,749)
Net Income 21,857$ 13,874$ 7,983$
Diluted Shares (000s) 39,655 40,628 973 2.4%
Diluted EPS 0.55$ 0.34$ 0.21$ 61.8%
Adjusted to exclude non-operating items *
Adjusted Operating Expense 148,849$ 11.87% 148,852$ 11.91% 3$ 0.0% 4
Adjusted Operating Income 38,234 3.05% 39,673 3.17% (1,439) (3.6%) (12)
Adjusted Net Income 21,857 22,822 (965) (4.2%)
Adjusted Diluted EPS 0.55$ 0.56$ (0.01)$ (1.8%)
April 23, 2014 5
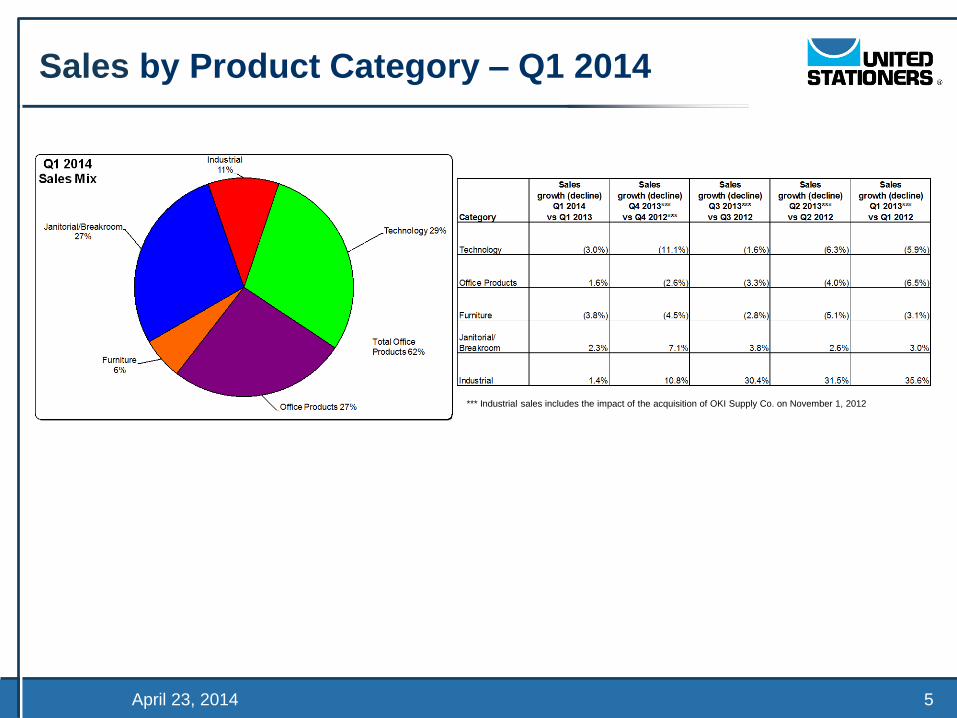
Sales by Product Category – Q1 2014
*** Industrial sales includes the impact of the acquisition of OKI Supply Co. on November 1, 2012
April 23, 2014 6
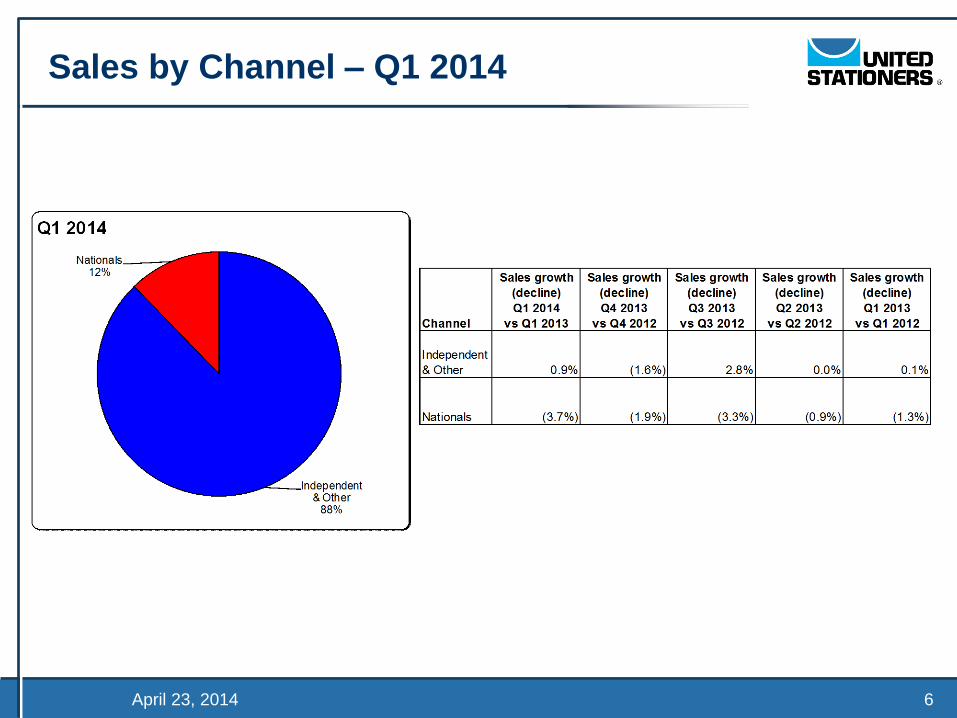
Sales by Channel – Q1 2014
April 23, 2014 7
Gross Margin
April 23, 2014 8
Adjusted Operating Expense*
April 23, 2014 9
Adjusted Operating Income*
April 23, 2014 10
Adjusted Earnings per Share*
April 23, 2014 11
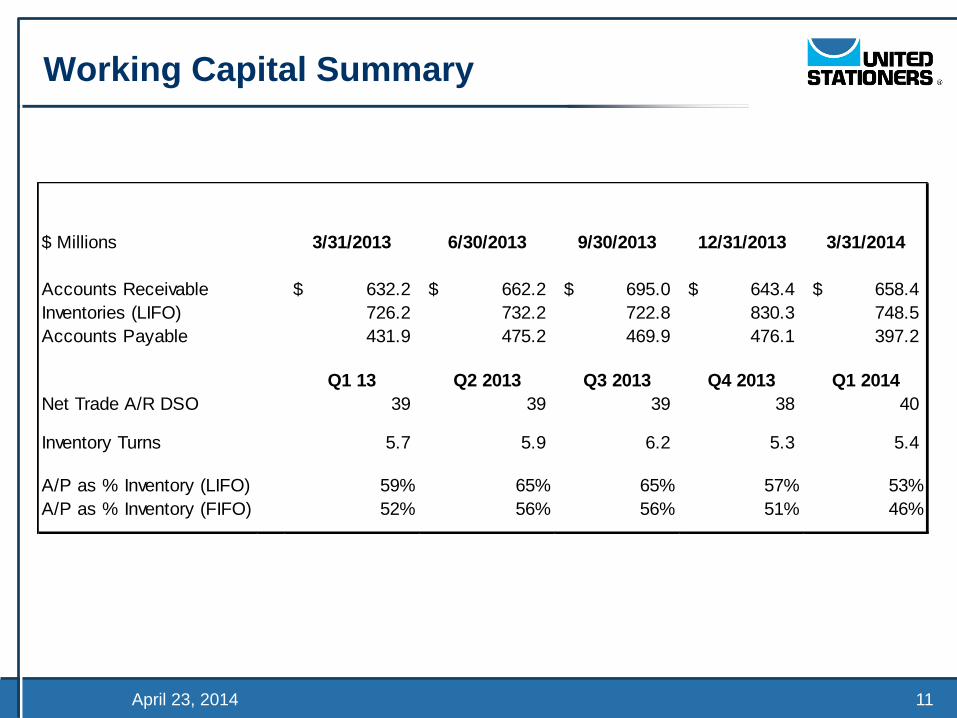
Working Capital Summary
$ Millions 3/31/2013 6/30/2013 9/30/2013 12/31/2013 3/31/2014
Accounts Receivable 632.2$ 662.2$ 695.0$ 643.4$ 658.4$
Inventories (LIFO) 726.2 732.2 722.8 830.3 748.5
Accounts Payable 431.9 475.2 469.9 476.1 397.2
Q1 13 Q2 2013 Q3 2013 Q4 2013 Q1 2014
Net Trade A/R DSO 39 39 39 38 40
Inventory Turns 5.7 5.9 6.2 5.3 5.4
A/P as % Inventory (LIFO) 59% 65% 65% 57% 53%
A/P as % Inventory (FIFO) 52% 56% 56% 51% 46%
April 23, 2014 12
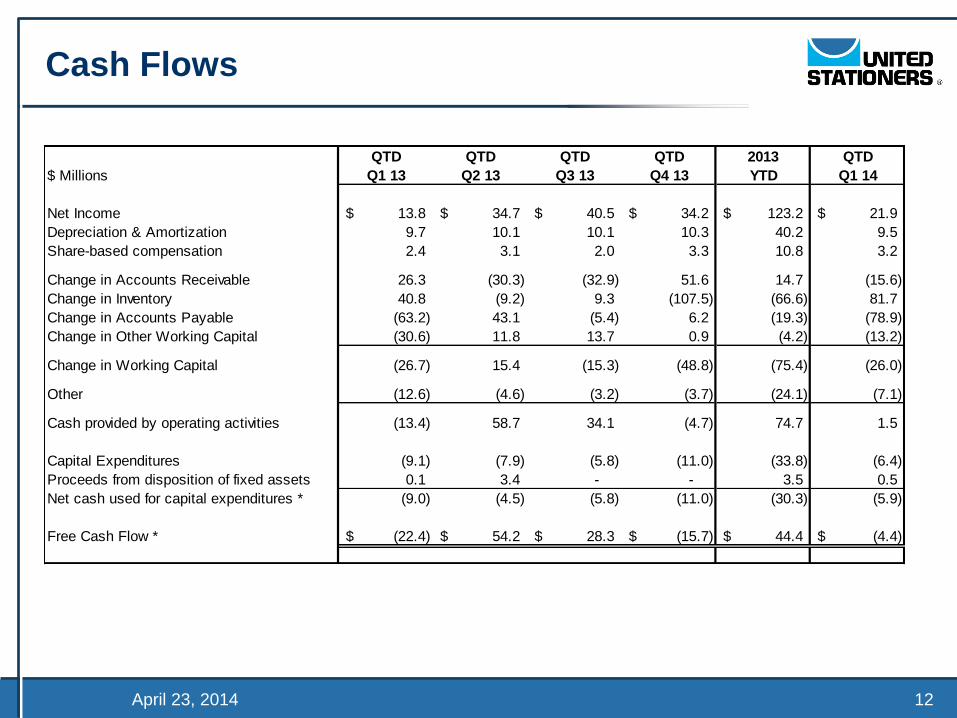
Cash Flows
QTD QTD QTD QTD 2013 QTD
$ Millions Q1 13 Q2 13 Q3 13 Q4 13 YTD Q1 14
Net Income 13.8$ 34.7$ 40.5$ 34.2$ 123.2$ 21.9$
Depreciation & Amortization 9.7 10.1 10.1 10.3 40.2 9.5
Share-based compensation 2.4 3.1 2.0 3.3 10.8 3.2
Change in Accounts Receivable 26.3 (30.3) (32.9) 51.6 14.7 (15.6)
Change in Inventory 40.8 (9.2) 9.3 (107.5) (66.6) 81.7
Change in Accounts Payable (63.2) 43.1 (5.4) 6.2 (19.3) (78.9)
Change in Other Working Capital (30.6) 11.8 13.7 0.9 (4.2) (13.2)
Change in Working Capital (26.7) 15.4 (15.3) (48.8) (75.4) (26.0)
Other (12.6) (4.6) (3.2) (3.7) (24.1) (7.1)
Cash provided by operating activities (13.4) 58.7 34.1 (4.7) 74.7 1.5
Capital Expenditures (9.1) (7.9) (5.8) (11.0) (33.8) (6.4)
Proceeds from disposition of fixed assets 0.1 3.4 - - 3.5 0.5
Net cash used for capital expenditures * (9.0) (4.5) (5.8) (11.0) (30.3) (5.9)
Free Cash Flow * (22.4)$ 54.2$ 28.3$ (15.7)$ 44.4$ (4.4)$
April 23, 2014 13
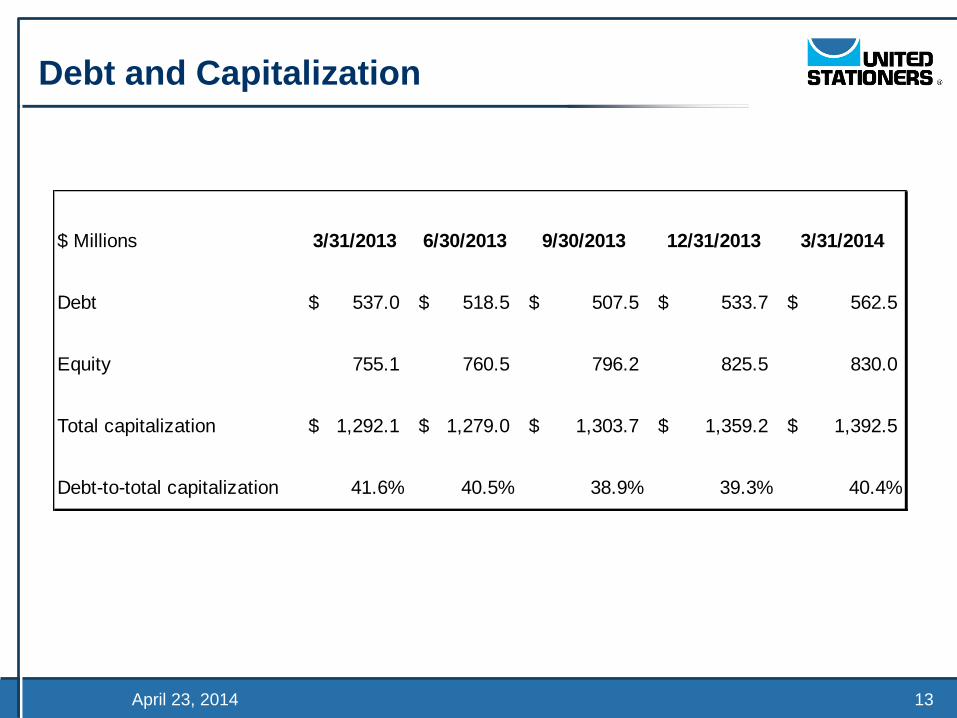
Debt and Capitalization
$ Millions 3/31/2013 6/30/2013 9/30/2013 12/31/2013 3/31/2014
Debt 537.0$ 518.5$ 507.5$ 533.7$ 562.5$
Equity 755.1 760.5 796.2 825.5 830.0
Total capitalization 1,292.1$ 1,279.0$ 1,303.7$ 1,359.2$ 1,392.5$
Debt-to-total capitalization 41.6% 40.5% 38.9% 39.3% 40.4%
Recommended