Embed Size (px)
Citation preview
Event Update | Oil & GasEvent Update | Oil & GasEvent Update | Oil & GasEvent Update | Oil & GasEvent Update | Oil & Gas
Please refer to important disclosures at the end of this report
Source: Company, Angel Research; Note: *Performance for 15 months period
Amit VAmit VAmit VAmit VAmit VoraoraoraoraoraTel: 022 - 4040 3800 Ext: 322
E-mail: [email protected]
March 25, 2010
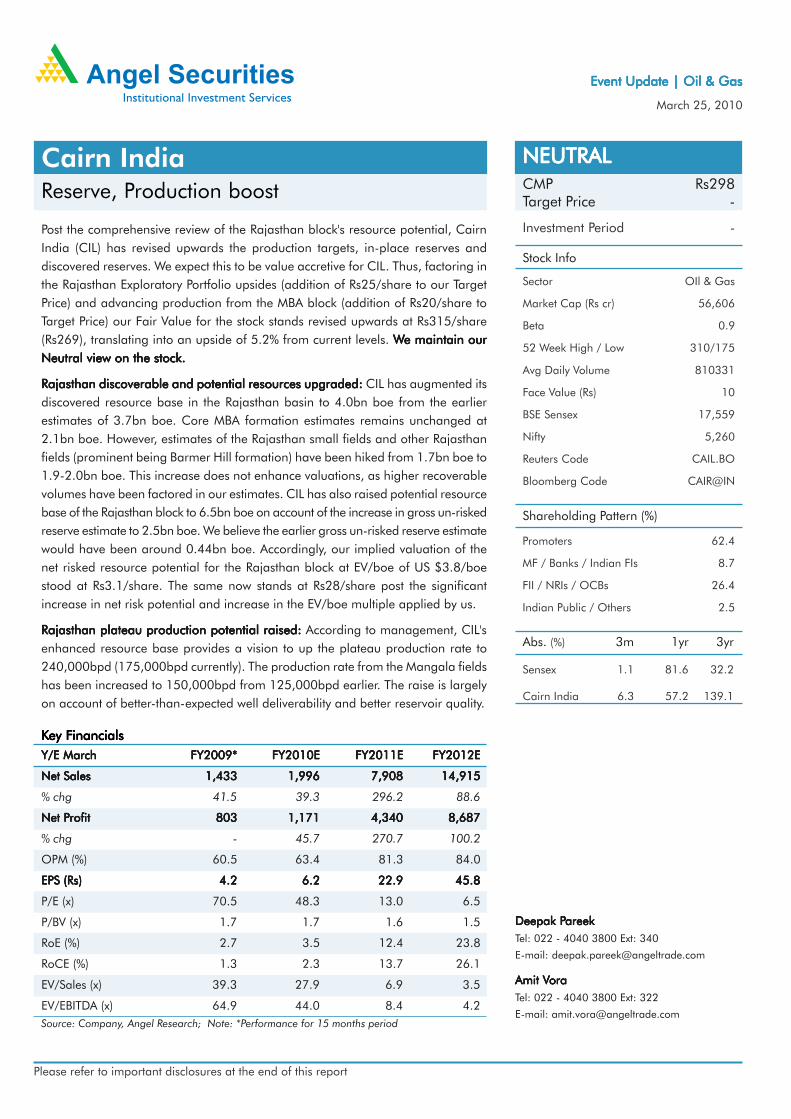
Cairn India NEUTRALNEUTRALNEUTRALNEUTRALNEUTRAL
Reserve, Production boost CMP Rs298Target Price -
Stock Info
Shareholding Pattern (%)
Sector OIl & Gas
Market Cap (Rs cr) 56,606
Beta 0.9
52 Week High / Low 310/175
Avg Daily Volume 810331
Face Value (Rs) 10
BSE Sensex 17,559
Nifty 5,260
Reuters Code CAIL.BO
Bloomberg Code CAIR@IN
Promoters 62.4
MF / Banks / Indian FIs 8.7
FII / NRIs / OCBs 26.4
Indian Public / Others 2.5
Abs. (%) 3m 1yr 3yr
Sensex 1.1 81.6 32.2
Cairn India 6.3 57.2 139.1
Investment Period -
KKKKKey Fey Fey Fey Fey FinancialsinancialsinancialsinancialsinancialsY/E MarchY/E MarchY/E MarchY/E MarchY/E March FY2009*FY2009*FY2009*FY2009*FY2009* FY2010EFY2010EFY2010EFY2010EFY2010E FY2011EFY2011EFY2011EFY2011EFY2011E FY2012EFY2012EFY2012EFY2012EFY2012E
Net SalesNet SalesNet SalesNet SalesNet Sales 1,433 1,433 1,433 1,433 1,433 1,996 1,996 1,996 1,996 1,996 7,908 7,908 7,908 7,908 7,908 14,915 14,915 14,915 14,915 14,915
% chg 41.5 39.3 296.2 88.6
Net PNet PNet PNet PNet Profitrofitrofitrofitrofit 803 803 803 803 803 1,171 1,171 1,171 1,171 1,171 4,340 4,340 4,340 4,340 4,340 8,687 8,687 8,687 8,687 8,687
% chg - 45.7 270.7 100.2
OPM (%) 60.5 63.4 81.3 84.0
EPS (Rs)EPS (Rs)EPS (Rs)EPS (Rs)EPS (Rs) 4.24.24.24.24.2 6.26.26.26.26.2 22.922.922.922.922.9 45.845.845.845.845.8
P/E (x) 70.5 48.3 13.0 6.5
P/BV (x) 1.7 1.7 1.6 1.5
RoE (%) 2.7 3.5 12.4 23.8
RoCE (%) 1.3 2.3 13.7 26.1
EV/Sales (x) 39.3 27.9 6.9 3.5
EV/EBITDA (x) 64.9 44.0 8.4 4.2
Post the comprehensive review of the Rajasthan block's resource potential, CairnIndia (CIL) has revised upwards the production targets, in-place reserves anddiscovered reserves. We expect this to be value accretive for CIL. Thus, factoring inthe Rajasthan Exploratory Portfolio upsides (addition of Rs25/share to our TargetPrice) and advancing production from the MBA block (addition of Rs20/share toTarget Price) our Fair Value for the stock stands revised upwards at Rs315/share(Rs269), translating into an upside of 5.2% from current levels. WWWWWe maintain oure maintain oure maintain oure maintain oure maintain ourNeutral view on the stock.Neutral view on the stock.Neutral view on the stock.Neutral view on the stock.Neutral view on the stock.
Rajasthan discoverable and potential resources upgraded:Rajasthan discoverable and potential resources upgraded:Rajasthan discoverable and potential resources upgraded:Rajasthan discoverable and potential resources upgraded:Rajasthan discoverable and potential resources upgraded: CIL has augmented itsdiscovered resource base in the Rajasthan basin to 4.0bn boe from the earlierestimates of 3.7bn boe. Core MBA formation estimates remains unchanged at2.1bn boe. However, estimates of the Rajasthan small fields and other Rajasthanfields (prominent being Barmer Hill formation) have been hiked from 1.7bn boe to1.9-2.0bn boe. This increase does not enhance valuations, as higher recoverablevolumes have been factored in our estimates. CIL has also raised potential resourcebase of the Rajasthan block to 6.5bn boe on account of the increase in gross un-riskedreserve estimate to 2.5bn boe. We believe the earlier gross un-risked reserve estimatewould have been around 0.44bn boe. Accordingly, our implied valuation of thenet risked resource potential for the Rajasthan block at EV/boe of US $3.8/boestood at Rs3.1/share. The same now stands at Rs28/share post the significantincrease in net risk potential and increase in the EV/boe multiple applied by us.
Rajasthan plateau production potential raised: Rajasthan plateau production potential raised: Rajasthan plateau production potential raised: Rajasthan plateau production potential raised: Rajasthan plateau production potential raised: According to management, CIL'senhanced resource base provides a vision to up the plateau production rate to240,000bpd (175,000bpd currently). The production rate from the Mangala fieldshas been increased to 150,000bpd from 125,000bpd earlier. The raise is largelyon account of better-than-expected well deliverability and better reservoir quality.
Deepak PDeepak PDeepak PDeepak PDeepak PareekareekareekareekareekTel: 022 - 4040 3800 Ext: 340
E-mail: [email protected]
March 25, 2010 2
Cairn India | Event Update
Rajasthan discoverable and potential resources upgraded
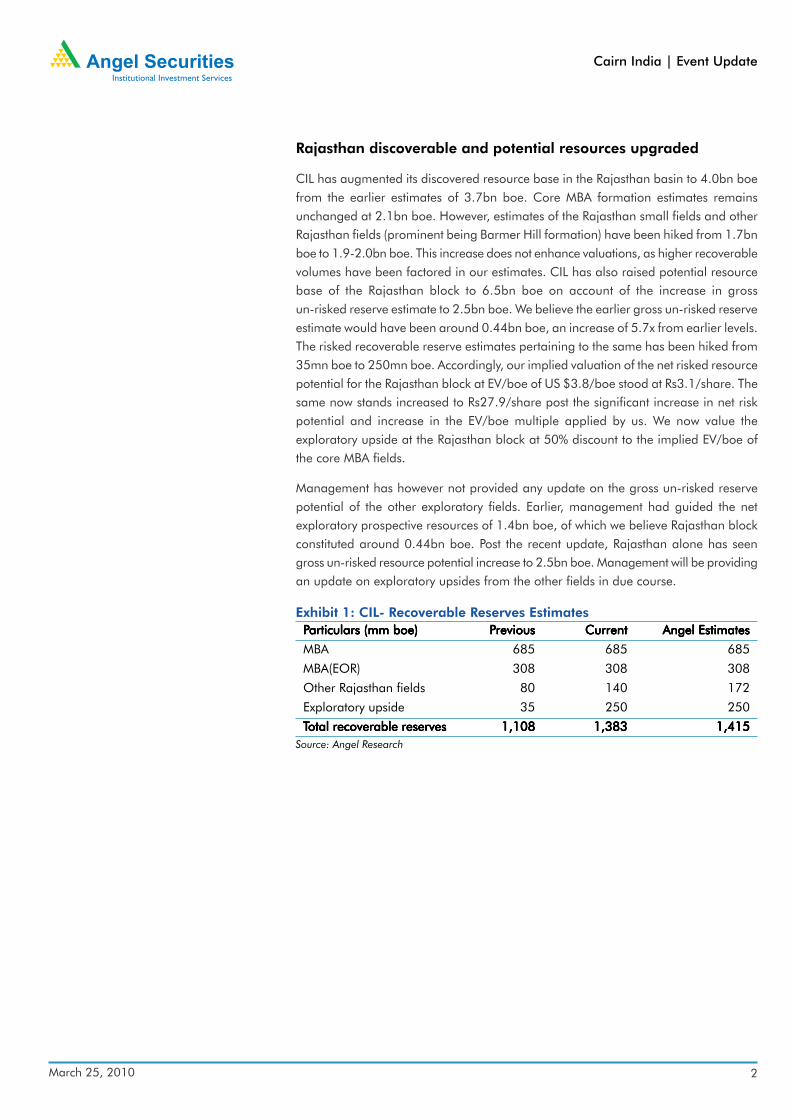
CIL has augmented its discovered resource base in the Rajasthan basin to 4.0bn boefrom the earlier estimates of 3.7bn boe. Core MBA formation estimates remainsunchanged at 2.1bn boe. However, estimates of the Rajasthan small fields and otherRajasthan fields (prominent being Barmer Hill formation) have been hiked from 1.7bnboe to 1.9-2.0bn boe. This increase does not enhance valuations, as higher recoverablevolumes have been factored in our estimates. CIL has also raised potential resourcebase of the Rajasthan block to 6.5bn boe on account of the increase in grossun-risked reserve estimate to 2.5bn boe. We believe the earlier gross un-risked reserveestimate would have been around 0.44bn boe, an increase of 5.7x from earlier levels.The risked recoverable reserve estimates pertaining to the same has been hiked from35mn boe to 250mn boe. Accordingly, our implied valuation of the net risked resourcepotential for the Rajasthan block at EV/boe of US $3.8/boe stood at Rs3.1/share. Thesame now stands increased to Rs27.9/share post the significant increase in net riskpotential and increase in the EV/boe multiple applied by us. We now value theexploratory upside at the Rajasthan block at 50% discount to the implied EV/boe ofthe core MBA fields.
Management has however not provided any update on the gross un-risked reservepotential of the other exploratory fields. Earlier, management had guided the netexploratory prospective resources of 1.4bn boe, of which we believe Rajasthan blockconstituted around 0.44bn boe. Post the recent update, Rajasthan alone has seengross un-risked resource potential increase to 2.5bn boe. Management will be providingan update on exploratory upsides from the other fields in due course.
PPPPParticulars (mm boe)articulars (mm boe)articulars (mm boe)articulars (mm boe)articulars (mm boe) PPPPPreviousreviousreviousreviousrevious CurrentCurrentCurrentCurrentCurrent Angel EstimatesAngel EstimatesAngel EstimatesAngel EstimatesAngel Estimates
MBA 685 685 685
MBA(EOR) 308 308 308
Other Rajasthan fields 80 140 172
Exploratory upside 35 250 250
TTTTTotal recoverable reservesotal recoverable reservesotal recoverable reservesotal recoverable reservesotal recoverable reserves 1,108 1,108 1,108 1,108 1,108 1,383 1,383 1,383 1,383 1,383 1,415 1,415 1,415 1,415 1,415
Exhibit 1: CIL- Recoverable Reserves Estimates
Source: Angel Research

March 25, 2010 3
Cairn India | Event Update
Rajasthan plateau production potential upgraded
According to management, CIL's enhanced resource base provides a vision to up the
plateau production rate to 240,000bpd (175,000bpd currently). The increase in the
plateau would be driven by higher production from the core MBA fields, production
from EOR, Barmer Hill and newer discoveries. The production rate from the Mangala
fields has been increased to 150,000bpd from 125,000bpd earlier. The raise is largely
on account of better-than-expected well deliverability and better reservoir quality. The
production rate at the horizontal wells at Mangala filed has been good at 12,000bpd.
While management has not divulged details of the ramp-up of capacity, production
ramp-up is unlikely to be a constraint for processing capacity. Capacity of the both the
processing terminal as well as the pipeline could be enhanced by minor
de-bottlenecking with minimal capex. As per current developmental plans, the
processing capacity post commissioning of all the trains will stand at 205,000bpd.
Capacity of the processing terminal could be increased by expansion of Train- I to
50,000bpd from 30,000bpd and de-bottlenecking of other trains. Capacity of the
pipeline could easily be enhanced with commissioning of additional boosters.
Con-call Highlights
Rajasthan development update:Rajasthan development update:Rajasthan development update:Rajasthan development update:Rajasthan development update: CIL is currently producing around 20,000bpd from
Train-I of the Mangala field, while Train II and III are likely to get ready by 2QCY2010.
Completion schedule of Train IV has been left unchanged and targeted for completion
in CY2011. The entire pipeline section from MPT to Salaya (600kms) is likely to be
commissioned in 2QCY2010. This also includes the spur facility to the refineries.
Further, infrastructure to Bhogat, Gujarat coast is scheduled to get completed in 2011.
CIL has maintained its capex estimates for CY2010 and CY2011 at US $2.5bn (gross).
Offtake issues getting resolved:Offtake issues getting resolved:Offtake issues getting resolved:Offtake issues getting resolved:Offtake issues getting resolved: CIL has contracted 143,000bpd of crude sales with
MRPL, IOC, RIL (doesn't include RIL's SEZ refinery) and Essar Oil. The contracted volumes
provide the visibility for the offtake of the crude as production ramps up at the Mangala
field as the pipeline infrastructure and additional trains commence operations.
Revising upwards our estimates on higher potential productionvolumes, crude oil prices
We maintain our FY2010E estimates. However, on account of upward revision in the
crude oil prices for FY2011E from US $70/bbl to US $75/bbl, our Earnings estimates
have been revised upwards by 6.7% for FY2011. From FY2012E onwards, we maintain
our long-term crude oil estimate of US $75/bbl.
On the production front, we have revised our estimates for the Mangala field from
125,000bpd to 150,000bpd for the plateau period starting FY2012E. However, as
there is no change in the recoverable reserves estimates, we have factored in
higher-than-forecast decline rate in production from the field. Similarly, from FY2013E
onwards, we have revised our production estimates for the Aishwariya field to
20,000bpd from 15,000bpd. We have also factored in higher-than-forecast decline
in the rate of production post the plateau period. Thus, on account of better well
deliverability, advancement of production from these fields is estimated. We now model
peak plateau production of 210,000bpd from 180,000bpd. This is lower than

March 25, 2010 4
Cairn India | Event Update
240,000bpd of sustainable volumes guided by management for the long term.
However, owing to lack of visibility, we have not factored the same in our estimates.
Due to upgrade in production volumes, our FY2012E EPS stands increased by 8.5%
CIL has filed declaration of commerciality for the Barmer Hill formation. The field
development plan (FDP) of the same is likely to be filed later, in stages. We would
factor the same in our forecast once the FDP gets filed.
Thus, factoring in the Rajasthan Exploratory Portfolio upsides (addition of
Rs25/share to our Target Price) and advancing production from the MBA block (addition
of Rs20/share to Target Price) our Fair Value for the stock stands revised upwards at
Rs315/share (Rs269), translating into an upside of 5.2% from current levels. Hence,Hence,Hence,Hence,Hence,
we maintain our Neutral view on the stock.we maintain our Neutral view on the stock.we maintain our Neutral view on the stock.we maintain our Neutral view on the stock.we maintain our Neutral view on the stock.
PPPPParticulars (Rs cr)articulars (Rs cr)articulars (Rs cr)articulars (Rs cr)articulars (Rs cr) FY2011EFY2011EFY2011EFY2011EFY2011E FY2012EFY2012EFY2012EFY2012EFY2012E
Rajasthan BlockRajasthan BlockRajasthan BlockRajasthan BlockRajasthan Block
RJ-ON-90/1 (MBA block) 36,546 38,740
Value per share 193 204
RJ-ON-90/1 (MBA EOR) 5,372 6,017
Value per share 28 32
RJ-ON-90/1 (Barmer Hill) 2,541 2,713
Value per share 13 14
RJ-ON-90/1 (Southern fields) 508 543
Value per share 3 3
RJ-ON-90/1 (Other fields) 4,223 4,509
Value per share 22 24
Value of Rajasthan Block 49,191 52,522
Value per share 259 277
CB-OS-2 590 413
Value per share 3 2
Ravva 1,860 1,653
Value per share 10 9
Upside potential (KG-DWN-98/2) 302 331
Value per share 2 2
Exploratory porfolio upsides 6,178 6,769
Value per share 33 36
Total Asset Value 58,120 61,687
Less: Corporate expenditure 2,333 2,243
Value per share 12 12
Less: Net debt (92) (232)
Value per share (0) (1)
Equity value 55,879 59,676
Equity shares (mn) 190 190
Equity value per share (Rs)Equity value per share (Rs)Equity value per share (Rs)Equity value per share (Rs)Equity value per share (Rs) 295 295 295 295 295 315 315 315 315 315
Exhibit 2: Valuation Summary
Source: Company, Angel Research

March 25, 2010 5
Cairn India | Event Update
Source: Company, Angel Research
Exhibit 3: Sensitivity with Crude and Exchange Rate
Crude PCrude PCrude PCrude PCrude Prices (US$/bbl)rices (US$/bbl)rices (US$/bbl)rices (US$/bbl)rices (US$/bbl)
60.060.060.060.060.0 65.0 65.0 65.0 65.0 65.0 70.0 70.0 70.0 70.0 70.0 75.0 75.0 75.0 75.0 75.0 80.0 80.0 80.0 80.0 80.0 85.0 85.0 85.0 85.0 85.0 90.0 90.0 90.0 90.0 90.0
42.0 42.0 42.0 42.0 42.0 240 263 282 298 314 335 357
43.0 43.0 43.0 43.0 43.0 246 270 289 306 322 344 359
44.0 44.0 44.0 44.0 44.0 252 277 290 307 330 353 368
45.0 45.0 45.0 45.0 45.0 259 283 297 315 315 315 315 315 338 361 377
46.0 46.0 46.0 46.0 46.0 265 290 304 322 346 363 386
47.0 47.0 47.0 47.0 47.0 271 293 312 330 354 372 396
48.0 48.0 48.0 48.0 48.0 277 299 312 338 363 380 405
Exch
ange
Rat
e(R
s/U
S$)
Source: Company, Angel Research
Exhibit 4: Sensitivity with Crude and WACC
Crude PCrude PCrude PCrude PCrude Prices (US$/bbl)rices (US$/bbl)rices (US$/bbl)rices (US$/bbl)rices (US$/bbl)
60.060.060.060.060.0 65.0 65.0 65.0 65.0 65.0 70.0 70.0 70.0 70.0 70.0 75.0 75.0 75.0 75.0 75.0 80.0 80.0 80.0 80.0 80.0 85.0 85.0 85.0 85.0 85.0 90.0 90.0 90.0 90.0 90.0
9.0 9.0 9.0 9.0 9.0 285 313 327 347 372 398 416
10.010.010.010.010.0 276 302 317 335 360 385 402
11.011.011.011.011.0 267 292 307 325 349 373 389
12.012.012.012.012.0 259 283 297 315315315315315 338 361 377
13.013.013.013.013.0 251 275 289 305 328 351 366
14.014.014.014.014.0 244 267 280 297 319 341 356
15.015.015.015.015.0 237 260 273 289 310 332 346
WA
CC
(%)
Source: Company, Angel Research
Exhibit 5: Sensitivity with Crude and Discount on Crude
Crude PCrude PCrude PCrude PCrude Prices (US$/bbl)rices (US$/bbl)rices (US$/bbl)rices (US$/bbl)rices (US$/bbl)
60.060.060.060.060.0 65.0 65.0 65.0 65.0 65.0 70.0 70.0 70.0 70.0 70.0 75.0 75.0 75.0 75.0 75.0 80.0 80.0 80.0 80.0 80.0 85.0 85.0 85.0 85.0 85.0 90.0 90.0 90.0 90.0 90.0
7.07.07.07.07.0 282 302 322 347 366 391 407
9.09.09.09.09.0 279 295 314 339 357 382 406
11.011.011.011.011.0 272 294 306 331 355 373 397
13.013.013.013.013.0 265 287 305 323 347 364 387
15.015.015.015.015.0 259 283 297 315 315 315 315 315 338 361 377
17.017.017.017.017.0 252 276 295 313 329 352 368
Dis
coun
t (%
)D
isco
unt (
%)
Dis
coun
t (%
)D
isco
unt (
%)
Dis
coun
t (%
)
March 25, 2010 6
Cairn India | Event Update
Source: Company, Angel Research
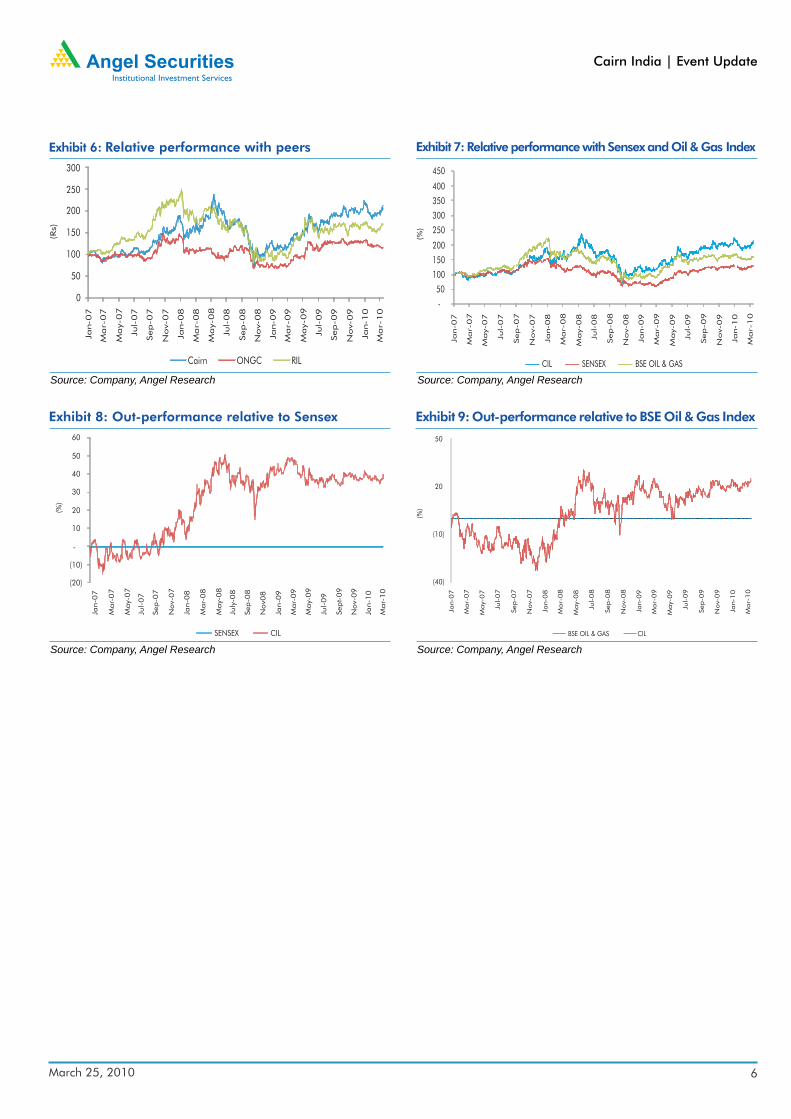
Exhibit 8: Out-performance relative to Sensex
Source: Company, Angel Research
Exhibit 9: Out-performance relative to BSE Oil & Gas Index
Jan-0
7
Mar-
07
May-
07
Jul-
07
Sep
-07
Nov-0
7
Jan-0
8
Mar-
08
May-
08
July
-08
Sep
-08
Nov08
Mar-
09
May-
09
Jul-
09
Sept-
09
Nov-0
9
Jan-1
0
Mar-
10
Jan-0
9
(20)
(10)
-
10
20
30
40
50
60
SENSEX CIL
(%)
BSE OIL & GAS CIL
(40)
(10)
20
50
Jan-0
7
Mar-
07
May-0
7
Jul-
07
Sep-0
7
Nov-
07
Jan-0
8
Mar-
08
May-0
8
Jul-
08
Sep-0
8
Nov-
08
Jan-0
9
Mar-
09
May-0
9
Jul-
09
Sep-0
9
Nov-
09
Jan-1
0
Mar-
10
(%)
Source: Company, Angel Research
Exhibit 6: Relative performance with peers
0
50
100
150
200
250
300
Jan-0
7
Mar-
07
May-0
7
Jul-
07
Sep-0
7
Nov-0
7
Jan-0
8
Mar-
08
May-0
8
Jul-
08
Sep-0
8
Nov-0
8
Jan-0
9
Mar-
09
May-0
9
Jul-
09
Sep-0
9
Nov-0
9
Jan-1
0
Mar-
10
Cairn ONGC RIL
(Rs)
Source: Company, Angel Research
Exhibit 7: Relative performance with Sensex and Oil & Gas Index
CIL SENSEX BSE OIL & GAS
-
50
100
150
200
250
300
350
400
450
Jan-07
Mar-
07
May-07
Jul-
07
Sep-07
Nov-07
Jan-08
Mar-
08
May-08
Jul-
08
Sep-08
Nov-08
Jan-09
Mar-
09
May-09
Jul-
09
Sep-09
Nov-09
Jan-10
Mar-
10
(%)

March 25, 2010 7
Cairn India | Event Update
Profit & Loss Statement (Consolidated) Rs croreY/E MarchY/E MarchY/E MarchY/E MarchY/E March CY2007 CY2007 CY2007 CY2007 CY2007 FY2009* FY2009* FY2009* FY2009* FY2009* FY2010E FY2010E FY2010E FY2010E FY2010E FY2011E FY2011E FY2011E FY2011E FY2011E FY2012E FY2012E FY2012E FY2012E FY2012E
Gross salesGross salesGross salesGross salesGross sales 1,012 1,012 1,012 1,012 1,012 1,433 1,433 1,433 1,433 1,433 1,996 1,996 1,996 1,996 1,996 7,908 7,908 7,908 7,908 7,908 14,915 14,915 14,915 14,915 14,915
Less: Excise duty - - - - -
Net SalesNet SalesNet SalesNet SalesNet Sales 1,012 1,012 1,012 1,012 1,012 1,433 1,433 1,433 1,433 1,433 1,996 1,996 1,996 1,996 1,996 7,908 7,908 7,908 7,908 7,908 14,915 14,915 14,915 14,915 14,915
Other operating income - - - - -
TTTTTotal operating incomeotal operating incomeotal operating incomeotal operating incomeotal operating income 1,012 1,012 1,012 1,012 1,012 1,433 1,433 1,433 1,433 1,433 1,996 1,996 1,996 1,996 1,996 7,908 7,908 7,908 7,908 7,908 14,915 14,915 14,915 14,915 14,915
% chg 41.5 39.3 296.2 88.6
Total Expenditure 572 566 731 1,477 2,383
Operating expenditure 195 213 400 1,145 2,052
Administrative expenditure 388 331 331 331 331
Inc/dec in stock (11) 22 - - -
EBITDEBITDEBITDEBITDEBITDAAAAA 440 440 440 440 440 866 866 866 866 866 1,264 1,264 1,264 1,264 1,264 6,431 6,431 6,431 6,431 6,431 12,532 12,532 12,532 12,532 12,532
% chg 96.7 46.0 408.6 94.9
(% of Net Sales) 43.5 60.5 63.4 81.3 84.0
Depreciation& Amortisation 445 438 401 961 1,689
EBITEBITEBITEBITEBIT (5) (5) (5) (5) (5) 428 428 428 428 428 863 863 863 863 863 5,471 5,471 5,471 5,471 5,471 10,843 10,843 10,843 10,843 10,843
% chg - - 101.6 533.9 98.2
(% of Net Sales) (0.5) 29.9 43.2 69.2 72.7
Interest & other Charges 2 6 76 305 305
Other Income 132 594 550 208 253
(% of PBT) 105.2 58.5 41.1 3.9 2.3
Share in profit of Associates - - - - -
Recurring PBTRecurring PBTRecurring PBTRecurring PBTRecurring PBT 126 126 126 126 126 1,016 1,016 1,016 1,016 1,016 1,337 1,337 1,337 1,337 1,337 5,374 5,374 5,374 5,374 5,374 10,791 10,791 10,791 10,791 10,791
% chg - 707.0 31.5 302.0 100.8
Extraordinary Expense/(Inc.) - 28.3 - - -
PBT (reported)PBT (reported)PBT (reported)PBT (reported)PBT (reported) 126 126 126 126 126 988 988 988 988 988 1,337 1,337 1,337 1,337 1,337 5,374 5,374 5,374 5,374 5,374 10,791 10,791 10,791 10,791 10,791
Tax 150 184 166 1,034 2,105
(% of PBT) 119.5 18.7 12.4 19.2 19.5
PPPPPAAAAAT (reported)T (reported)T (reported)T (reported)T (reported) (25) (25) (25) (25) (25) 803 803 803 803 803 1,171 1,171 1,171 1,171 1,171 4,340 4,340 4,340 4,340 4,340 8,687 8,687 8,687 8,687 8,687
Add: Share of earnings of associate - - - - -
Less: Minority interest (MI) - - - - -
Prior period items - - - - -
PPPPPAAAAAT after MI (reported)T after MI (reported)T after MI (reported)T after MI (reported)T after MI (reported) (25) (25) (25) (25) (25) 803 803 803 803 803 1,171 1,171 1,171 1,171 1,171 4,340 4,340 4,340 4,340 4,340 8,687 8,687 8,687 8,687 8,687
ADJADJADJADJADJ. P. P. P. P. PAAAAATTTTT (25) (25) (25) (25) (25) 832 832 832 832 832 1,171 1,171 1,171 1,171 1,171 4,340 4,340 4,340 4,340 4,340 8,687 8,687 8,687 8,687 8,687
% chg - - 40.8 270.7 100.2
(% of Net Sales) (2.4) 58.1 58.7 54.9 58.2
Basic EPS (Rs)Basic EPS (Rs)Basic EPS (Rs)Basic EPS (Rs)Basic EPS (Rs) (0.1) (0.1) (0.1) (0.1) (0.1) 4.2 4.2 4.2 4.2 4.2 6.2 6.2 6.2 6.2 6.2 22.9 22.9 22.9 22.9 22.9 45.8 45.8 45.8 45.8 45.8
FFFFFully Diluted EPS (Rs)ully Diluted EPS (Rs)ully Diluted EPS (Rs)ully Diluted EPS (Rs)ully Diluted EPS (Rs) (0.1) (0.1) (0.1) (0.1) (0.1) 4.2 4.2 4.2 4.2 4.2 6.2 6.2 6.2 6.2 6.2 22.9 22.9 22.9 22.9 22.9 45.8 45.8 45.8 45.8 45.8
% chg - - 45.7 270.7 100.2
Note: *Performance for 15 months period
March 25, 2010 8
Cairn India | Event Update
Y/E MarchY/E MarchY/E MarchY/E MarchY/E March CY2007 CY2007 CY2007 CY2007 CY2007 FY2009* FY2009* FY2009* FY2009* FY2009* FY2010E FY2010E FY2010E FY2010E FY2010E FY2011E FY2011E FY2011E FY2011E FY2011E FY2012E FY2012E FY2012E FY2012E FY2012E
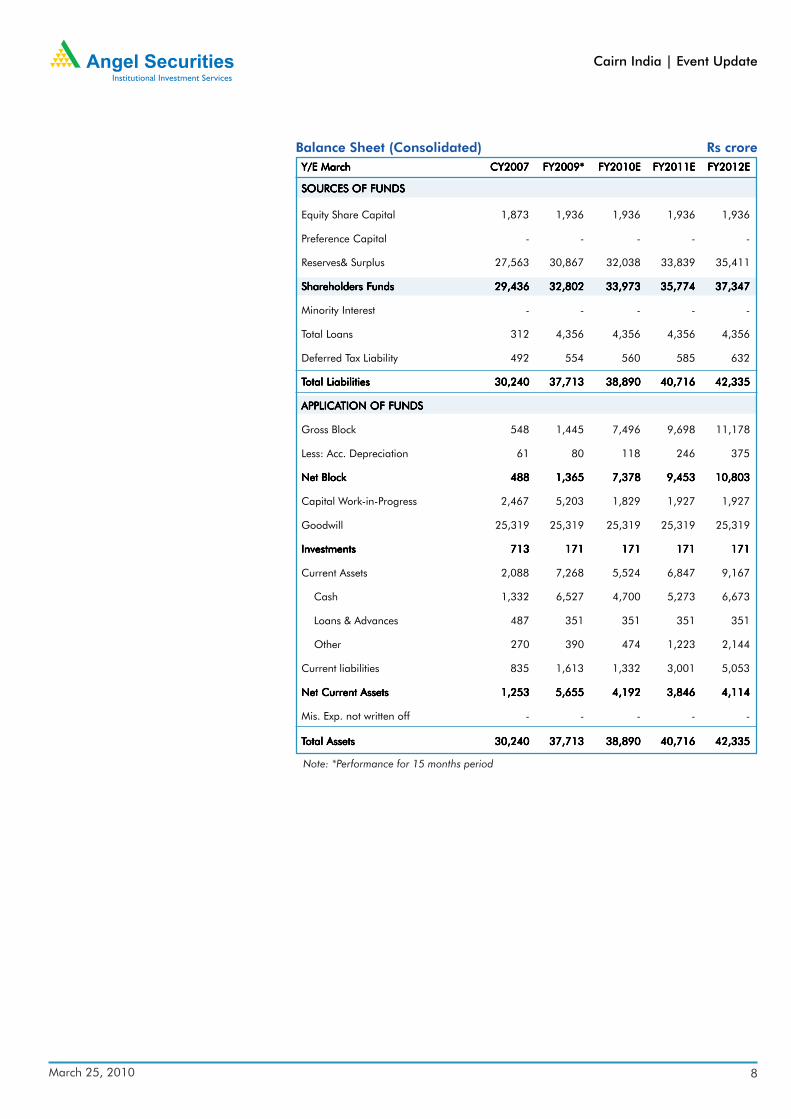
SOURCES OF FUNDSSOURCES OF FUNDSSOURCES OF FUNDSSOURCES OF FUNDSSOURCES OF FUNDS
Equity Share Capital 1,873 1,936 1,936 1,936 1,936
Preference Capital - - - - -
Reserves& Surplus 27,563 30,867 32,038 33,839 35,411
Shareholders FShareholders FShareholders FShareholders FShareholders Fundsundsundsundsunds 29,436 29,436 29,436 29,436 29,436 32,802 32,802 32,802 32,802 32,802 33,973 33,973 33,973 33,973 33,973 35,774 35,774 35,774 35,774 35,774 37,347 37,347 37,347 37,347 37,347
Minority Interest - - - - -
Total Loans 312 4,356 4,356 4,356 4,356
Deferred Tax Liability 492 554 560 585 632
TTTTTotal Liabilitiesotal Liabilitiesotal Liabilitiesotal Liabilitiesotal Liabilities 30,240 30,240 30,240 30,240 30,240 37,713 37,713 37,713 37,713 37,713 38,890 38,890 38,890 38,890 38,890 40,716 40,716 40,716 40,716 40,716 42,335 42,335 42,335 42,335 42,335
APPLICAAPPLICAAPPLICAAPPLICAAPPLICATION OF FUNDSTION OF FUNDSTION OF FUNDSTION OF FUNDSTION OF FUNDS
Gross Block 548 1,445 7,496 9,698 11,178
Less: Acc. Depreciation 61 80 118 246 375
Net BlockNet BlockNet BlockNet BlockNet Block 488 488 488 488 488 1,365 1,365 1,365 1,365 1,365 7,378 7,378 7,378 7,378 7,378 9,453 9,453 9,453 9,453 9,453 10,803 10,803 10,803 10,803 10,803
Capital Work-in-Progress 2,467 5,203 1,829 1,927 1,927
Goodwill 25,319 25,319 25,319 25,319 25,319
InvestmentsInvestmentsInvestmentsInvestmentsInvestments 713 713 713 713 713 171 171 171 171 171 171 171 171 171 171 171 171 171 171 171 171 171 171 171 171
Current Assets 2,088 7,268 5,524 6,847 9,167
Cash 1,332 6,527 4,700 5,273 6,673
Loans & Advances 487 351 351 351 351
Other 270 390 474 1,223 2,144
Current liabilities 835 1,613 1,332 3,001 5,053
Net Current AssetsNet Current AssetsNet Current AssetsNet Current AssetsNet Current Assets 1,253 1,253 1,253 1,253 1,253 5,655 5,655 5,655 5,655 5,655 4,192 4,192 4,192 4,192 4,192 3,846 3,846 3,846 3,846 3,846 4,114 4,114 4,114 4,114 4,114
Mis. Exp. not written off - - - - -
TTTTTotal Assetsotal Assetsotal Assetsotal Assetsotal Assets 30,240 30,240 30,240 30,240 30,240 37,713 37,713 37,713 37,713 37,713 38,890 38,890 38,890 38,890 38,890 40,716 40,716 40,716 40,716 40,716 42,335 42,335 42,335 42,335 42,335
Balance Sheet (Consolidated) Rs crore
Note: *Performance for 15 months period
March 25, 2010 9
Cairn India | Event Update
Y/E MarchY/E MarchY/E MarchY/E MarchY/E March CY2007 CY2007 CY2007 CY2007 CY2007 FY2009* FY2009* FY2009* FY2009* FY2009* FY2010E FY2010E FY2010E FY2010E FY2010E FY2011E FY2011E FY2011E FY2011E FY2011E FY2012E FY2012E FY2012E FY2012E FY2012E
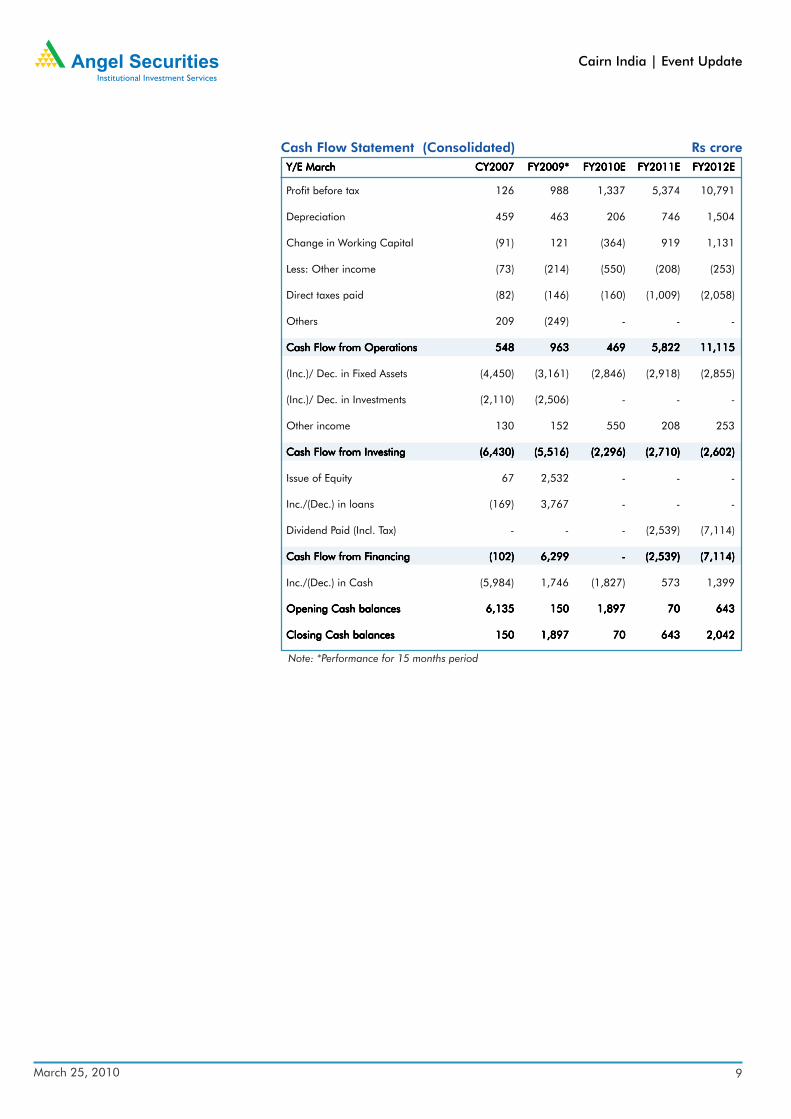
Profit before tax 126 988 1,337 5,374 10,791
Depreciation 459 463 206 746 1,504
Change in Working Capital (91) 121 (364) 919 1,131
Less: Other income (73) (214) (550) (208) (253)
Direct taxes paid (82) (146) (160) (1,009) (2,058)
Others 209 (249) - - -
Cash Flow from OperationsCash Flow from OperationsCash Flow from OperationsCash Flow from OperationsCash Flow from Operations 548 548 548 548 548 963 963 963 963 963 469 469 469 469 469 5,822 5,822 5,822 5,822 5,822 11,115 11,115 11,115 11,115 11,115
(Inc.)/ Dec. in Fixed Assets (4,450) (3,161) (2,846) (2,918) (2,855)
(Inc.)/ Dec. in Investments (2,110) (2,506) - - -
Other income 130 152 550 208 253
Cash Flow from InvestingCash Flow from InvestingCash Flow from InvestingCash Flow from InvestingCash Flow from Investing (6,430) (6,430) (6,430) (6,430) (6,430) (5,516) (5,516) (5,516) (5,516) (5,516) (2,296) (2,296) (2,296) (2,296) (2,296) (2,710) (2,710) (2,710) (2,710) (2,710) (2,602) (2,602) (2,602) (2,602) (2,602)
Issue of Equity 67 2,532 - - -
Inc./(Dec.) in loans (169) 3,767 - - -
Dividend Paid (Incl. Tax) - - - (2,539) (7,114)
Cash Flow from FCash Flow from FCash Flow from FCash Flow from FCash Flow from Financinginancinginancinginancinginancing (102) (102) (102) (102) (102) 6,299 6,299 6,299 6,299 6,299 - - - - - (2,539) (2,539) (2,539) (2,539) (2,539) (7,114) (7,114) (7,114) (7,114) (7,114)
Inc./(Dec.) in Cash (5,984) 1,746 (1,827) 573 1,399
Opening Cash balancesOpening Cash balancesOpening Cash balancesOpening Cash balancesOpening Cash balances 6,135 6,135 6,135 6,135 6,135 150 150 150 150 150 1,897 1,897 1,897 1,897 1,897 70 70 70 70 70 643 643 643 643 643
Closing Cash balancesClosing Cash balancesClosing Cash balancesClosing Cash balancesClosing Cash balances 150 150 150 150 150 1,897 1,897 1,897 1,897 1,897 70 70 70 70 70 643 643 643 643 643 2,042 2,042 2,042 2,042 2,042
Cash Flow Statement (Consolidated) Rs crore
Note: *Performance for 15 months period
March 25, 2010 10
Cairn India | Event Update
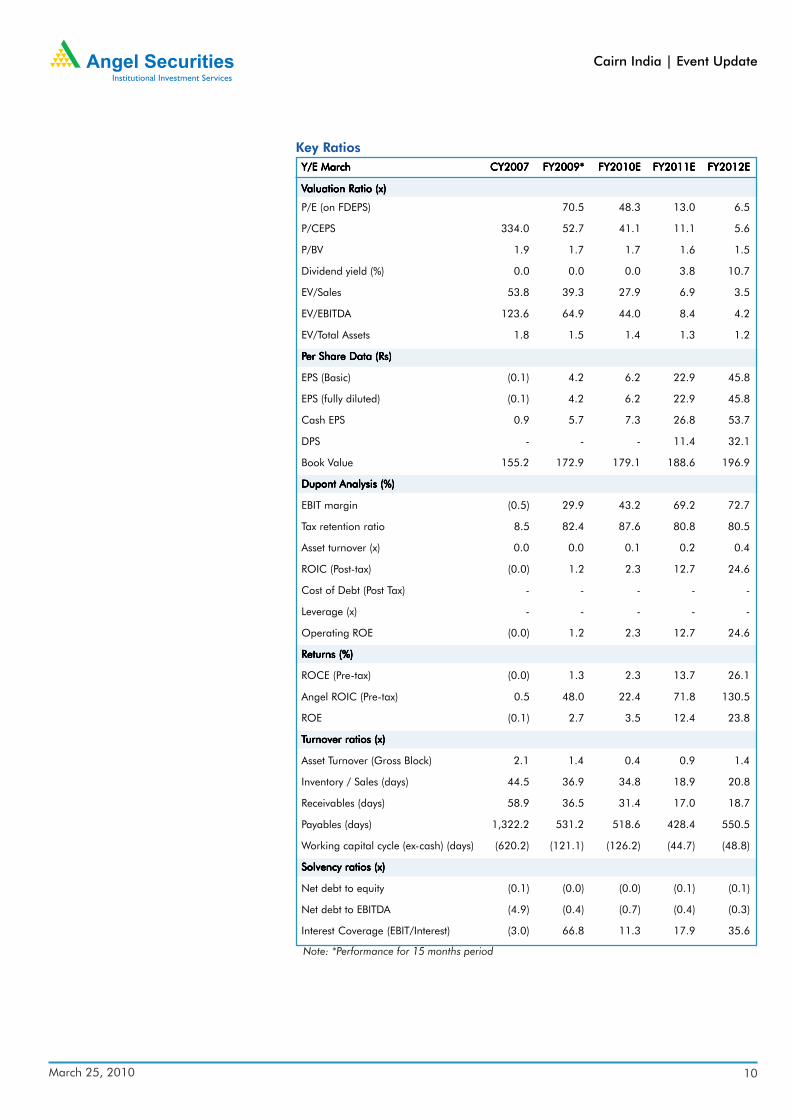
Key RatiosY/E MarchY/E MarchY/E MarchY/E MarchY/E March CY2007 CY2007 CY2007 CY2007 CY2007 FY2009* FY2009* FY2009* FY2009* FY2009* FY2010E FY2010E FY2010E FY2010E FY2010E FY2011E FY2011E FY2011E FY2011E FY2011E FY2012E FY2012E FY2012E FY2012E FY2012E
VVVVValuation Ratio (x)aluation Ratio (x)aluation Ratio (x)aluation Ratio (x)aluation Ratio (x)
P/E (on FDEPS) 70.5 48.3 13.0 6.5
P/CEPS 334.0 52.7 41.1 11.1 5.6
P/BV 1.9 1.7 1.7 1.6 1.5
Dividend yield (%) 0.0 0.0 0.0 3.8 10.7
EV/Sales 53.8 39.3 27.9 6.9 3.5
EV/EBITDA 123.6 64.9 44.0 8.4 4.2
EV/Total Assets 1.8 1.5 1.4 1.3 1.2
PPPPPer Share Data (Rs)er Share Data (Rs)er Share Data (Rs)er Share Data (Rs)er Share Data (Rs)
EPS (Basic) (0.1) 4.2 6.2 22.9 45.8
EPS (fully diluted) (0.1) 4.2 6.2 22.9 45.8
Cash EPS 0.9 5.7 7.3 26.8 53.7
DPS - - - 11.4 32.1
Book Value 155.2 172.9 179.1 188.6 196.9
Dupont Analysis (%)Dupont Analysis (%)Dupont Analysis (%)Dupont Analysis (%)Dupont Analysis (%)
EBIT margin (0.5) 29.9 43.2 69.2 72.7
Tax retention ratio 8.5 82.4 87.6 80.8 80.5
Asset turnover (x) 0.0 0.0 0.1 0.2 0.4
ROIC (Post-tax) (0.0) 1.2 2.3 12.7 24.6
Cost of Debt (Post Tax) - - - - -
Leverage (x) - - - - -
Operating ROE (0.0) 1.2 2.3 12.7 24.6
Returns (%)Returns (%)Returns (%)Returns (%)Returns (%)
ROCE (Pre-tax) (0.0) 1.3 2.3 13.7 26.1
Angel ROIC (Pre-tax) 0.5 48.0 22.4 71.8 130.5
ROE (0.1) 2.7 3.5 12.4 23.8
TTTTTurnover ratios (x)urnover ratios (x)urnover ratios (x)urnover ratios (x)urnover ratios (x)
Asset Turnover (Gross Block) 2.1 1.4 0.4 0.9 1.4
Inventory / Sales (days) 44.5 36.9 34.8 18.9 20.8
Receivables (days) 58.9 36.5 31.4 17.0 18.7
Payables (days) 1,322.2 531.2 518.6 428.4 550.5
Working capital cycle (ex-cash) (days) (620.2) (121.1) (126.2) (44.7) (48.8)
Solvency ratios (x)Solvency ratios (x)Solvency ratios (x)Solvency ratios (x)Solvency ratios (x)
Net debt to equity (0.1) (0.0) (0.0) (0.1) (0.1)
Net debt to EBITDA (4.9) (0.4) (0.7) (0.4) (0.3)
Interest Coverage (EBIT/Interest) (3.0) 66.8 11.3 17.9 35.6
Note: *Performance for 15 months period

March 25, 2010 11
Cairn India | Event Update
Disclosure of Interest StatementDisclosure of Interest StatementDisclosure of Interest StatementDisclosure of Interest StatementDisclosure of Interest Statement Cairn IndiaCairn IndiaCairn IndiaCairn IndiaCairn India
1. Analyst ownership of the stock No
2. Angel and its Group companies ownership of the stock No
3. Angel and its Group companies' Directors ownership of the stock No
4. Broking relationship with company covered No
Note:Note:Note:Note:Note: We have not considered any Exposure below Rs 5 lakh for Angel, its Group companies and Directors.
Disclaimer
This document is not for public distribution and has been furnished to you solely for your information and must not be reproduced orredistributed to any other person. Persons into whose possession this document may come are required to observe these restrictions.
Opinion expressed is our current opinion as of the date appearing on this material only. While we endeavor to update on a reasonablebasis the information discussed in this material, there may be regulatory, compliance, or other reasons that prevent us from doing so.Prospective investors and others are cautioned that any forward-looking statements are not predictions and may be subject to changewithout notice. Our proprietary trading and investment businesses may make investment decisions that are inconsistent with therecommendations expressed herein.
The information in this document has been printed on the basis of publicly available information, internal data and other reliable sourcesbelieved to be true and are for general guidance only. While every effort is made to ensure the accuracy and completeness of informationcontained, the company takes no guarantee and assumes no liability for any errors or omissions of the information. No one can use theinformation as the basis for any claim, demand or cause of action.
Recipients of this material should rely on their own investigations and take their own professional advice. Each recipient of this documentshould make such investigations as it deems necessary to arrive at an independent evaluation of an investment in the securities of companiesreferred to in this document (including the merits and risks involved), and should consult their own advisors to determine the merits andrisks of such an investment. Price and value of the investments referred to in this material may go up or down. Past performance is not aguide for future performance. Certain transactions - futures, options and other derivatives as well as non-investment grade securities -involve substantial risks and are not suitable for all investors. Reports based on technical analysis centers on studying charts of a stock'sprice movement and trading volume, as opposed to focusing on a company's fundamentals and as such, may not match with a report ona company's fundamentals.
We do not undertake to advise you as to any change of our views expressed in this document. While we would endeavor to update theinformation herein on a reasonable basis, Angel Securities, its subsidiaries and associated companies, their directors and employees areunder no obligation to update or keep the information current. Also there may be regulatory, compliance, or other reasons that mayprevent Angel Securities and affiliates from doing so. Prospective investors and others are cautioned that any forward-looking statementsare not predictions and may be subject to change without notice. Angel Securities Limited and affiliates, including the analyst who hasissued this report, may, on the date of this report, and from time to time, have long or short positions in, and buy or sell the securities of thecompanies mentioned herein or engage in any other transaction involving such securities and earn brokerage or compensation or act asadvisor or have other potential conflict of interest with respect to company/ies mentioned herein or inconsistent with any recommendationand related information and opinions.
Angel Securities Limited and affiliates may seek to provide or have engaged in providing corporate finance, investment banking or otheradvisory services in a merger or specific transaction to the companies referred to in this report, as on the date of this report or in the past.
Note: Please refer important `Stock Holding Disclosure' report on Angel web-site (Research Section).
Cairn India
Buy (> 15%) Accumulate (5% to 15%) Neutral (-5 to 5%)Reduce (-5% to -15%) Sell (< -15%)
Ratings (Returns) :
Cairn India
Address: Acme Plaza, ‘A’ Wing, 3rd Floor, M.V. Road, Opp. Sangam Cinema, Andheri (E), Mumbai - 400 059.Tel : (022) 3952 4568 / 4040 3800
Angel Broking Ltd: BSE Sebi Regn No : INB 010996539 / CDSL Regn No: IN - DP - CDSL - 234 - 2004 / PMS Regn Code: PM/INP000001546 Angel Securities Ltd:BSE: INB010994639/INF010994639 NSE: INB230994635/INF230994635 Membership numbers: BSE 028/NSE:09946Angel Capital & Debt Market Ltd: INB 231279838 / NSE FNO: INF 231279838 / NSE Member code -12798 Angel Commodities Broking (P) Ltd: MCX Member ID: 12685 / FMC Regn No: MCX / TCM / CORP / 0037 NCDEX : Member ID 00220 / FMC Regn No: NCDEX / TCM / CORP / 0302
Research Team
Fundamental:
Sarabjit Kour Nangra VP-Research, Pharmaceutical [email protected]
Vaibhav Agrawal VP-Research, Banking [email protected]
Vaishali Jajoo Automobile [email protected]
Shailesh Kanani Infrastructure, Real Estate [email protected]
Anand Shah FMCG , Media [email protected]
Deepak Pareek Oil & Gas [email protected]
Puneet Bambha Capital Goods, Engineering [email protected]
Sushant Dalmia Pharmaceutical [email protected]
Rupesh Sankhe Cement, Power [email protected]
Param Desai Real Estate, Logistics, Shipping [email protected]
Sageraj Bariya Fertiliser, Mid-cap [email protected]
Viraj Nadkarni Retail, Hotels, Mid-cap [email protected]
Paresh Jain Metals & Mining [email protected]
Amit Rane Banking [email protected]
Rahul Jain IT [email protected]
Jai Sharda Mid-cap [email protected]
Sharan Lillaney Mid-cap [email protected]
Amit Vora Research Associate (Oil & Gas) [email protected]
V Srinivasan Research Associate (Cement, Power) [email protected]
Aniruddha Mate Research Associate (Infra, Real Estate) [email protected]
Shreya Gaunekar Research Associate (Automobile) [email protected]
Mihir Salot Research Associate (Logistics, Shipping) [email protected]
Chitrangda Kapur Research Associate (FMCG, Media) [email protected]
Vibha Salvi Research Associate (IT, Telecom) [email protected]
Pooja Jain Research Associate (Metals & Mining) [email protected]
Technicals:
Shardul Kulkarni Sr. Technical Analyst [email protected]
Mileen Vasudeo Technical Analyst [email protected]
Derivatives:
Siddarth Bhamre Head - Derivatives [email protected]
Jaya Agarwal Jr. Derivative Analyst [email protected]
Institutional Sales Team:
Mayuresh Joshi VP - Institutional Sales [email protected]
Abhimanyu Sofat AVP - Institutional Sales [email protected]
Nitesh Jalan Sr. Manager [email protected]
Pranav Modi Sr. Manager [email protected]
Sandeep Jangir Sr. Manager [email protected]
Ganesh Iyer Sr. Manager [email protected]
Jay Harsora Sr. Dealer [email protected]
Meenakshi Chavan Dealer [email protected]
Gaurang Tisani Dealer [email protected]
Production Team:
Bharathi Shetty Research Editor [email protected]
Dharmil Adhyaru Assistant Research Editor [email protected]
Bharat Patil Production [email protected]
Dilip Patel Production [email protected]


![Fluent event collector [update]](https://img.pdfslide.net/doc/110x75/543fc353b1af9f4e0a8b4a5c/fluent-event-collector-update.jpg)