Embed Size (px)
Citation preview
Social Network Analysis (SNA) of
Blue Ocean Strategy (BOS)
Ali Anani
SNA + BOS = New Perspective
Organize and Analyze
This shared presentation on
slideshareinspired me with the idea of this
presentation

Blue Ocean Strategy (BOS)
BOS strategy bases itself
on four dimensions or thinking
blocks
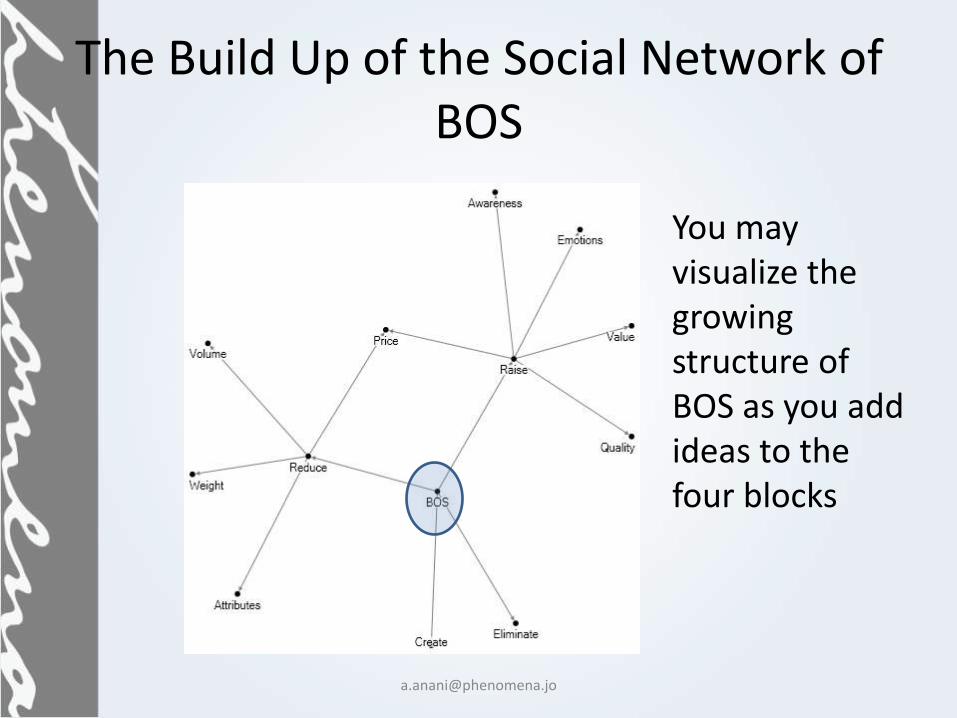
The Build Up of the Social Network of BOS
You may visualize the growing structure of BOS as you add ideas to the four blocks
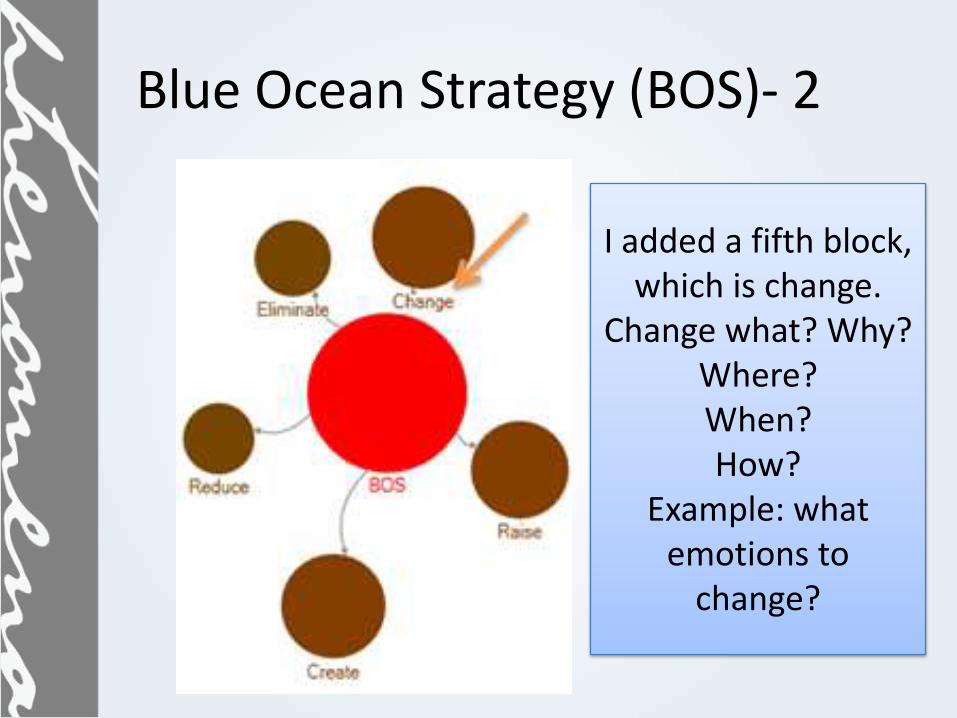
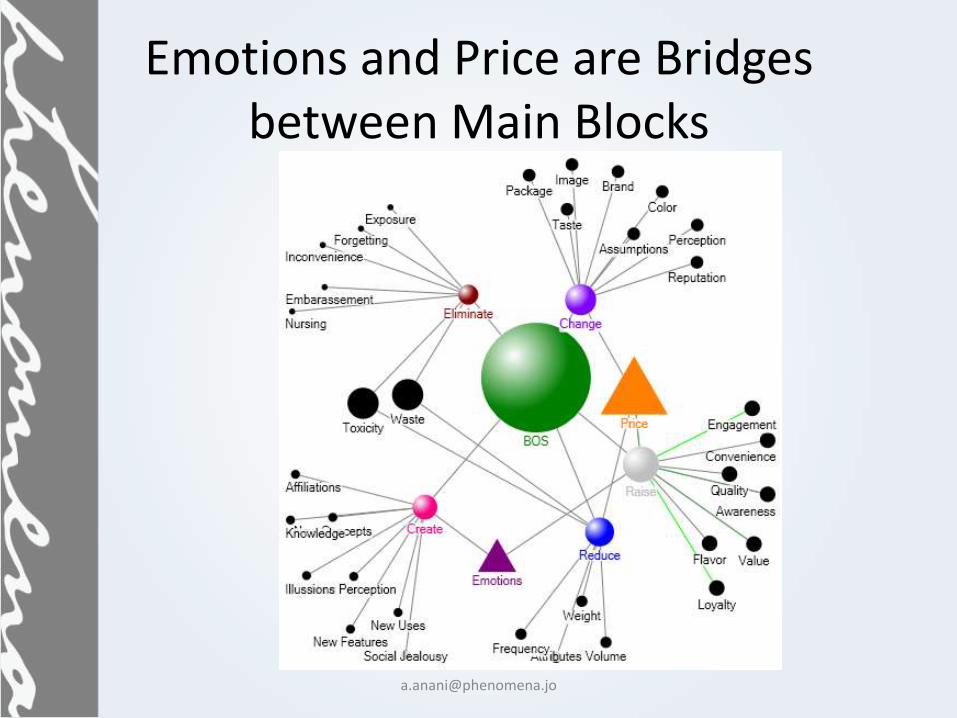
Blue Ocean Strategy (BOS)- 2
I added a fifth block, which is change.
Change what? Why?Where?When?How?
Example: what emotions to
change?
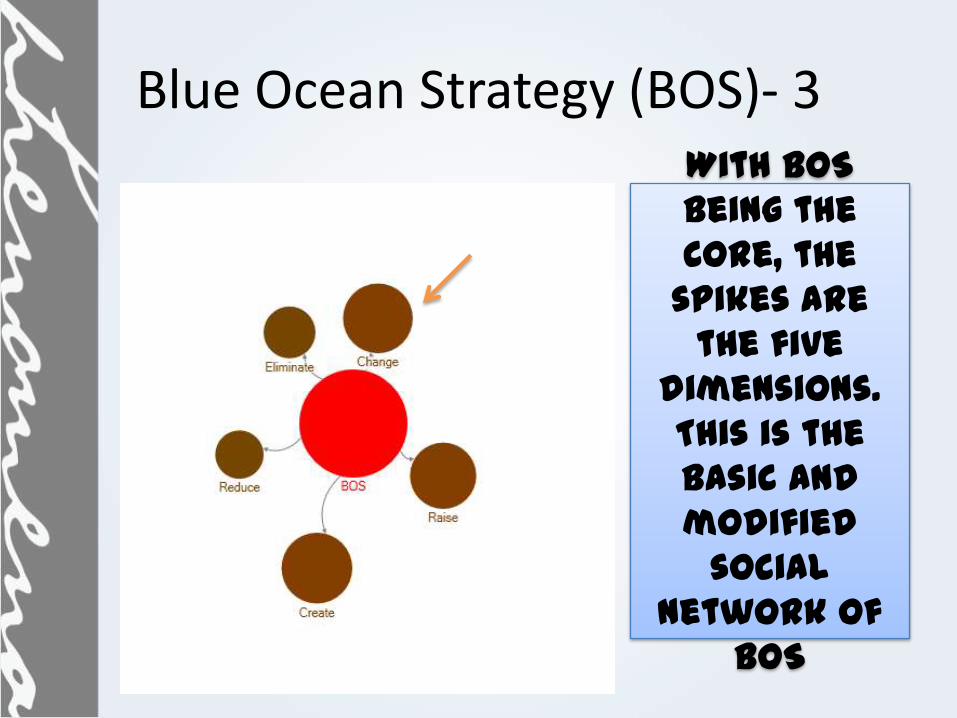
Blue Ocean Strategy (BOS)- 3
With BOS
being the
Core, the
spikes are
the five
dimensions.
This is the
basic and
modified
social
network of
BOS

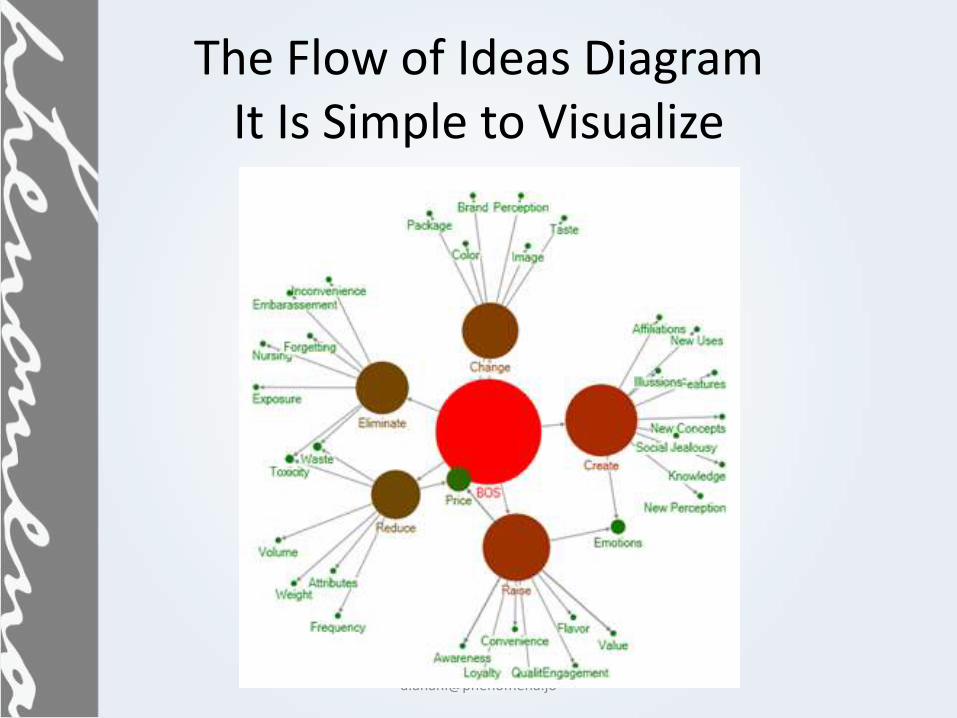
Visualizing before Analyzing
This combination of visual social network
build up of BOS allows for better social network
analysis (SNA) of BOS
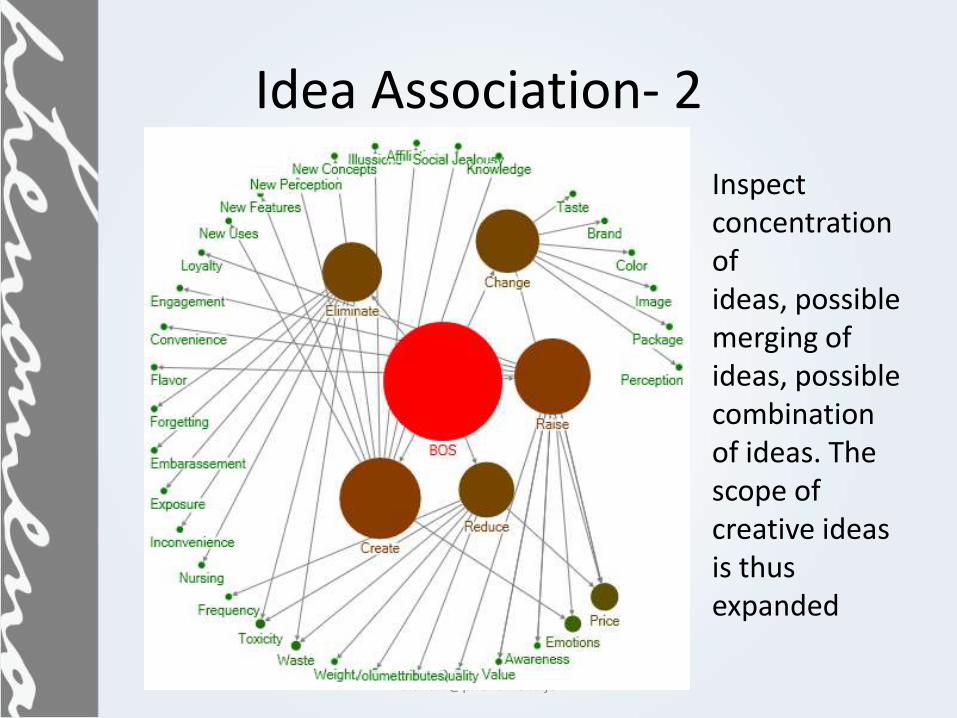
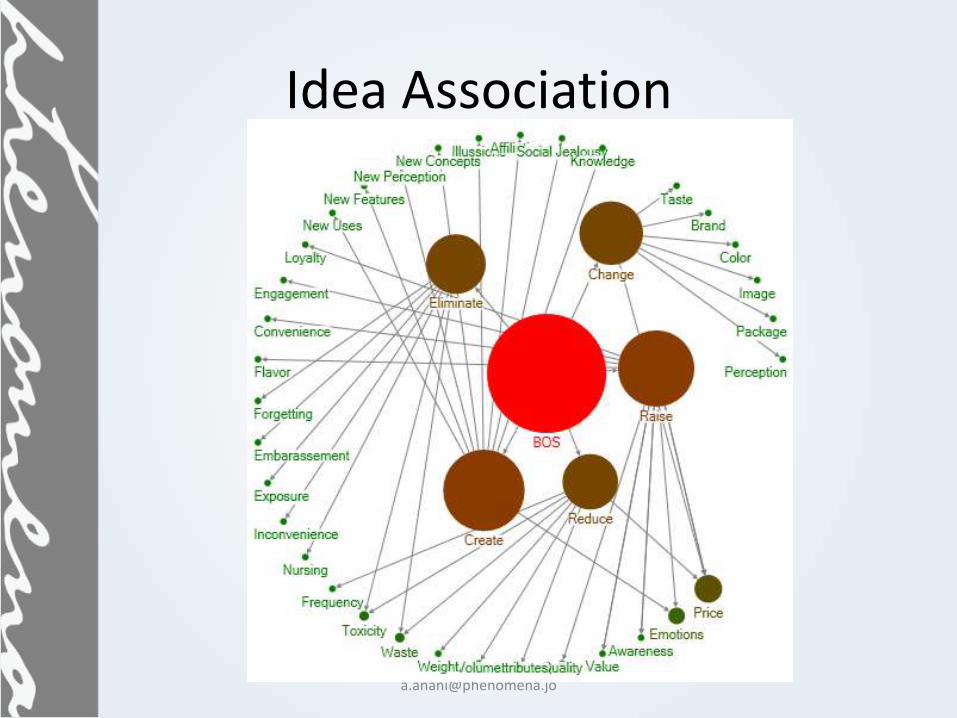
Idea Association- 2
Inspect concentration of ideas, possible merging of ideas, possible combination of ideas. The scope of creative ideas is thus expanded
Seeing The Map
Social Network Analysis (SNA) is a useful teaching tool to show step by step how build up processes
proceed visually
Seeing The Map- 2
This visual inspection made me suggest the addition of a fifth dimension to the Blue Ocean Strategy: that is the
change dimension
Conclusion
The visualization of the building blocks of Blue Ocean Strategy as a social network structure opened many possibilities. The addition of a new block and the visualization of the growth of strategy are just two emerging possibilities

Added in Response to @XibyComment
Adding value while reducing price is visually possible.Just inspect the graph to see what attributes from each block might increase value and/or reduce price. Increasing emotional content or ease of use will even give an illusion of lower price
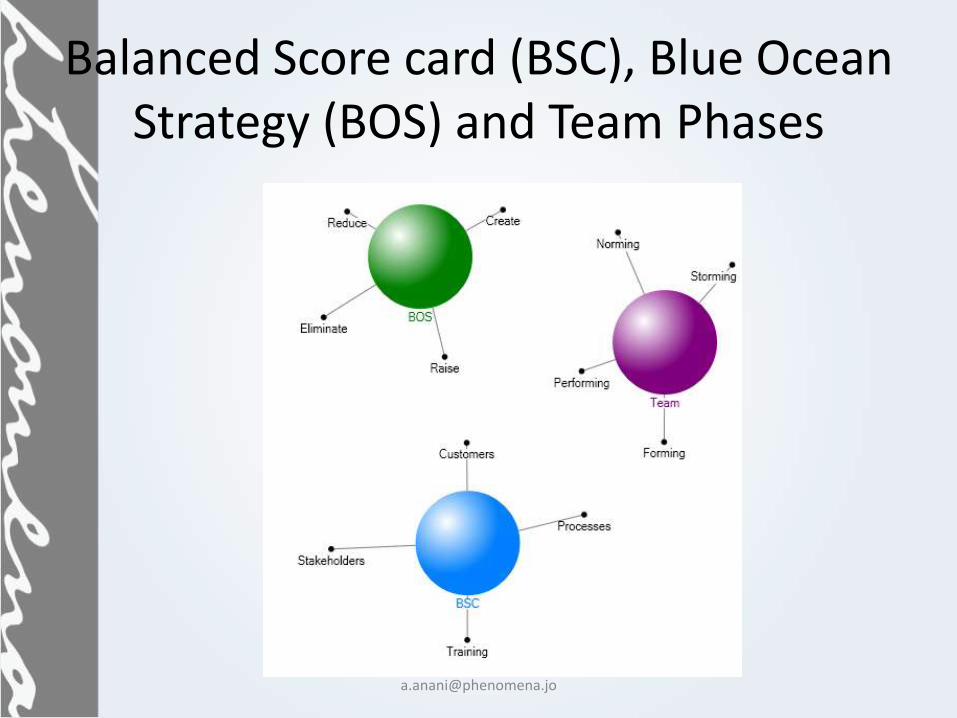
Different Fields into One Perspective
In response to @juao mayacomment, the next slide brings the Balanced Scorecard, Team Building and Blue Ocean Strategy into one perspective using a Social Network Analysis (SNA) framework;Visualizing three different concepts in a shared perspective allows for seeing the forest and the trees simultaneously
An Illustrative Example
Thanks to @Sheereen for her comment spurred me to add the next slide (19) Sheereen wanted an illustrative example to show the interconnection among the three managerial topics (BOS, BSC and Team Phases)

Teaching Rippling Effect
1- Create new use of smart board2- Need to train teachers on the new use3- Change creates conflict and this may lead to storming among the teaching staff4- This in turn may harm the efficiency of the teaching process
The effect is migratory and studying it in a bundle to show its rippling effect is useful

ABIDE
A very interesting concept on teams is the ABIDE modeABIDE is taken from the initials of
Attractor, Boundaries, Identities, Diversity and Environment of teams
See this link, which is a great readinghttp://agilitrix.com/2009/12/coaching-self-organizing-teams/
It is again interesting to compare BOS with ABIDE on the same SNA canvas
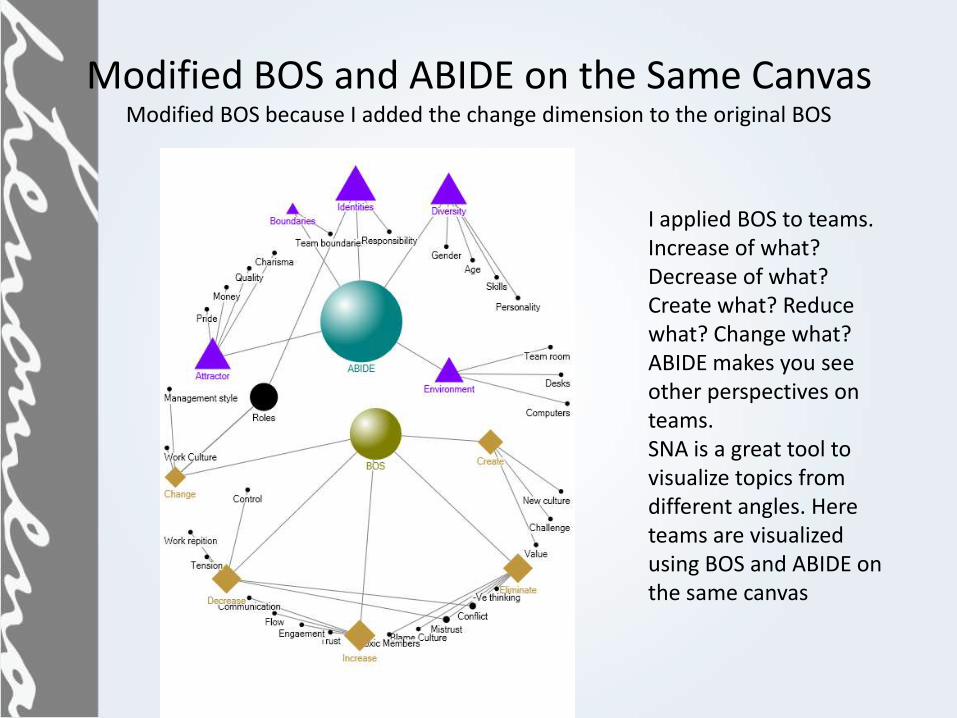
Modified BOS and ABIDE on the Same CanvasModified BOS because I added the change dimension to the original BOS
I applied BOS to teams. Increase of what? Decrease of what? Create what? Reduce what? Change what?ABIDE makes you see other perspectives on teams. SNA is a great tool to visualize topics from different angles. Here teams are visualized using BOS and ABIDE on the same canvas
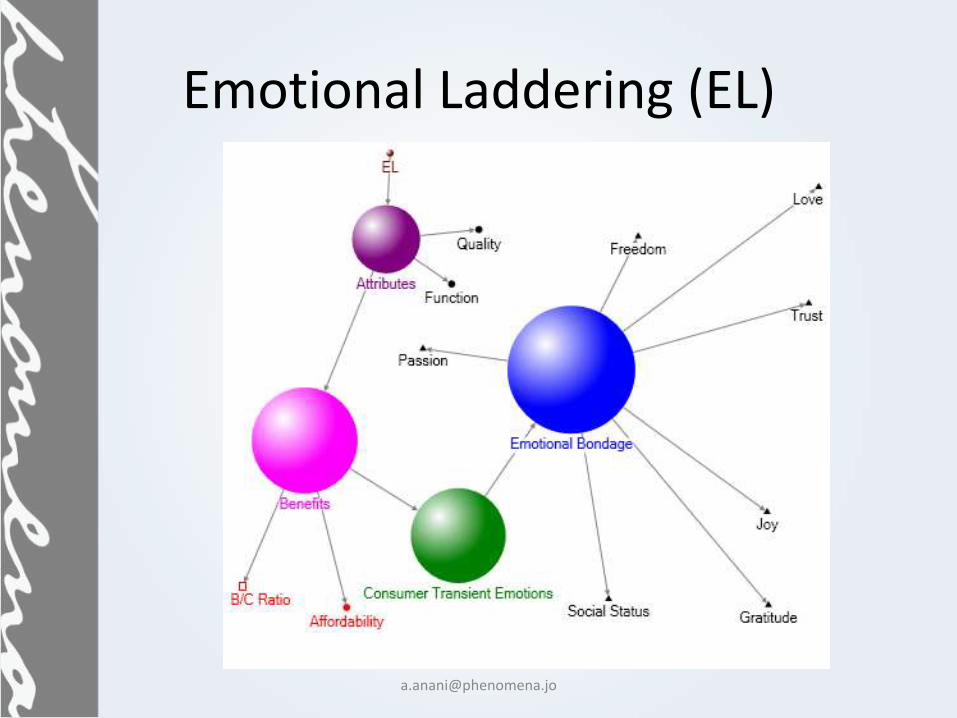
Emotional Laddering (EL) of Branding
Movement from product attributes to consumer
emotionsNext slide (23) shows this
movement
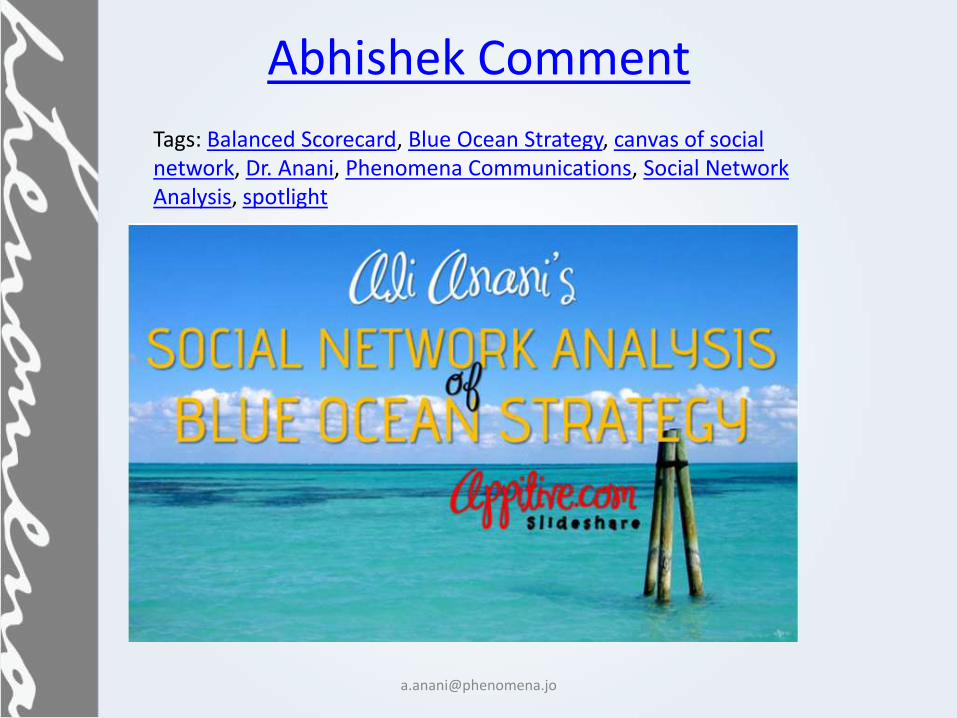
Abhishek Comment
Tags: Balanced Scorecard, Blue Ocean Strategy, canvas of social network, Dr. Anani, Phenomena Communications, Social Network Analysis, spotlight

Abhishek Comment and Embed
Ali Anani is using his scientific background to explain business and social phenomena. In his presentation entitled SNA (Social Network Analysis) of Blue Ocean Strategy (BOS) he provides a new concept to see the tree and forest together. He uses the canvas of social network to study many managerial tools such as teamwork, Balanced Scorecard (BSC), BOS and their interactive feedback. In a likewise manner, he discusses emotional laddering. These are all important managerial tools, and the presentation gives for the first time a pictorial picture of their interactions.Dr. Anani, who is the manager of Phenomena Communications, is known for his creative ideas. This is what attracted him to co-establish Phenomena Communications because it is a fertile land for creative ideas.