Embed Size (px)
Citation preview
ISS-Ethix Climate Solutions
Climate Impact Screening of Nasdaq Helsinki 2017
2
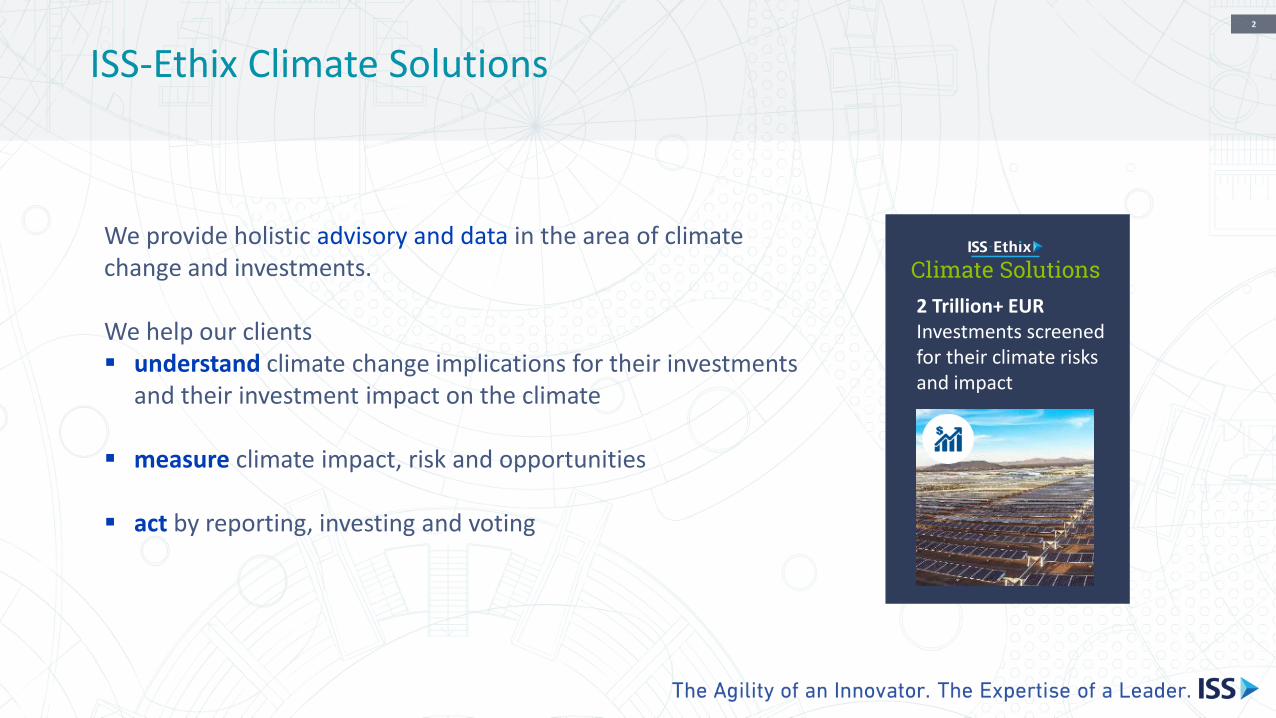
ISS-Ethix Climate Solutions
We provide holistic advisory and data in the area of climate change and investments.
We help our clients ▪ understand climate change implications for their investments
and their investment impact on the climate
▪ measure climate impact, risk and opportunities
▪ act by reporting, investing and voting
2 Trillion+ EURInvestments screened for their climate risks and impact
3
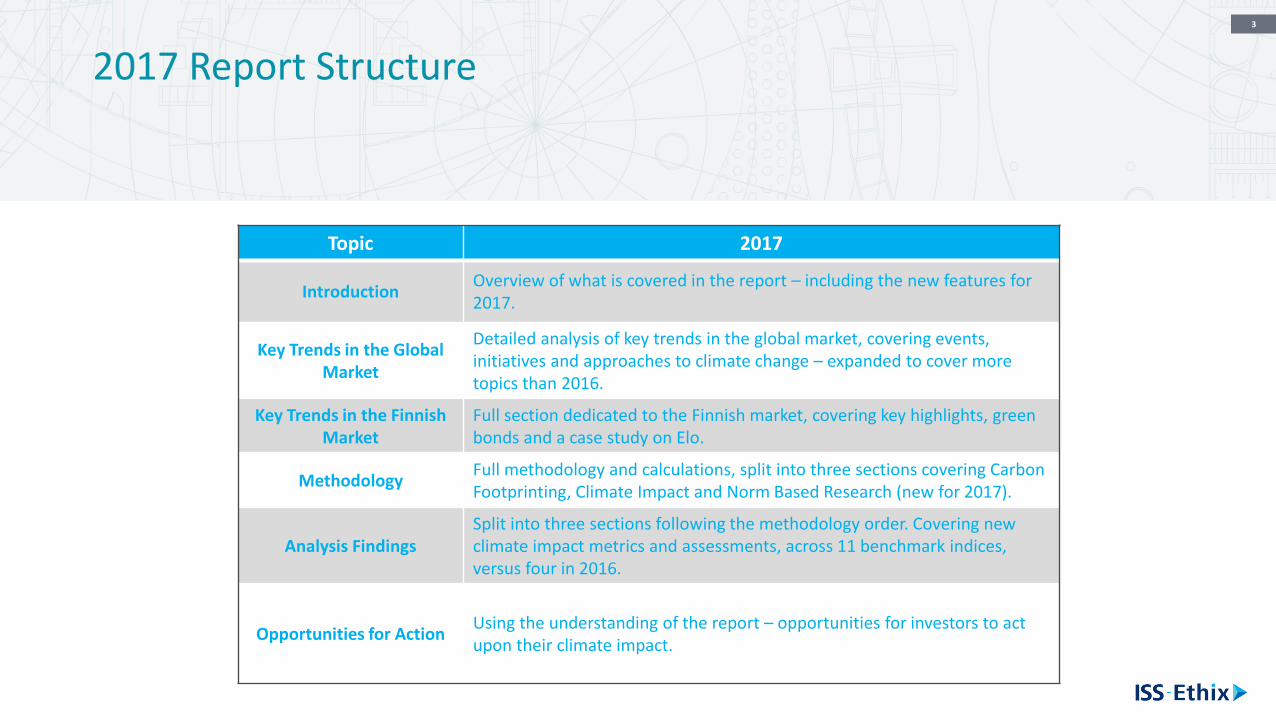
2017 Report Structure
Topic 2017
IntroductionOverview of what is covered in the report – including the new features for 2017.
Key Trends in the Global Market
Detailed analysis of key trends in the global market, covering events, initiatives and approaches to climate change – expanded to cover more topics than 2016.
Key Trends in the Finnish Market
Full section dedicated to the Finnish market, covering key highlights, green bonds and a case study on Elo.
MethodologyFull methodology and calculations, split into three sections covering Carbon Footprinting, Climate Impact and Norm Based Research (new for 2017).
Analysis FindingsSplit into three sections following the methodology order. Covering new climate impact metrics and assessments, across 11 benchmark indices, versus four in 2016.
Opportunities for ActionUsing the understanding of the report – opportunities for investors to act upon their climate impact.
4
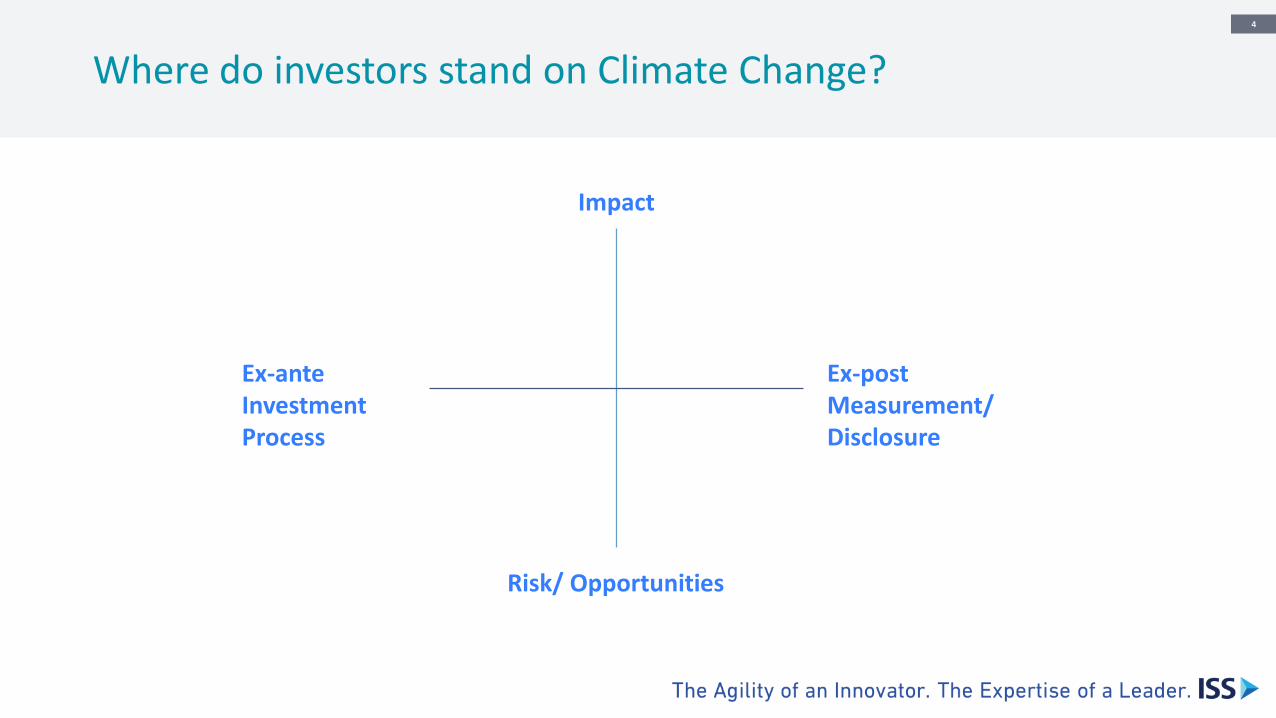
Where do investors stand on Climate Change?
2 Trillion+ EURInvestments screened for their climate risks and impact
Impact
Risk/ Opportunities
Ex-post Measurement/ Disclosure
Ex-ante Investment Process
5
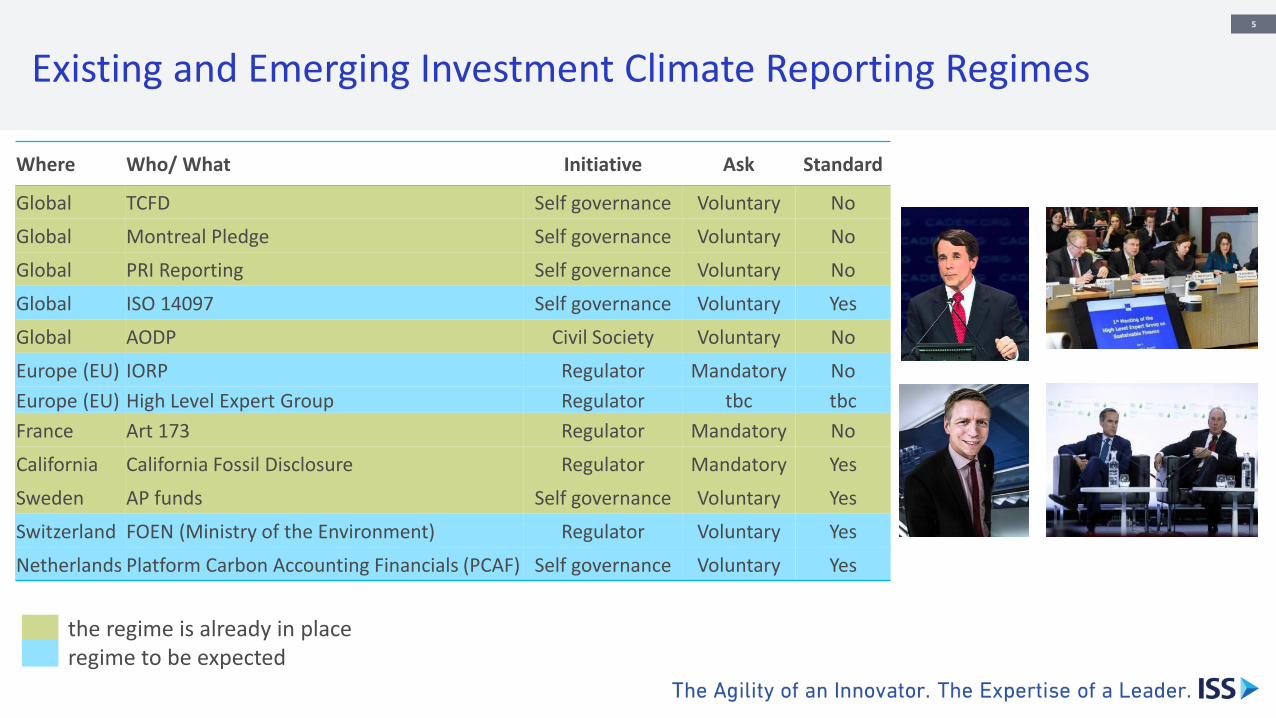
Existing and Emerging Investment Climate Reporting Regimes
Where Who/ What Initiative Ask Standard
Global TCFD Self governance Voluntary No
Global Montreal Pledge Self governance Voluntary No
Global PRI Reporting Self governance Voluntary No
Global ISO 14097 Self governance Voluntary Yes
Global AODP Civil Society Voluntary No
Europe (EU) IORP Regulator Mandatory No
Europe (EU) High Level Expert Group Regulator tbc tbc
France Art 173 Regulator Mandatory No
California California Fossil Disclosure Regulator Mandatory Yes
Sweden AP funds Self governance Voluntary Yes
Switzerland FOEN (Ministry of the Environment) Regulator Voluntary Yes
Netherlands Platform Carbon Accounting Financials (PCAF) Self governance Voluntary Yes
the regime is already in place regime to be expected
6
Carbon footprint analysis of the Nasdaq Helsinki
7
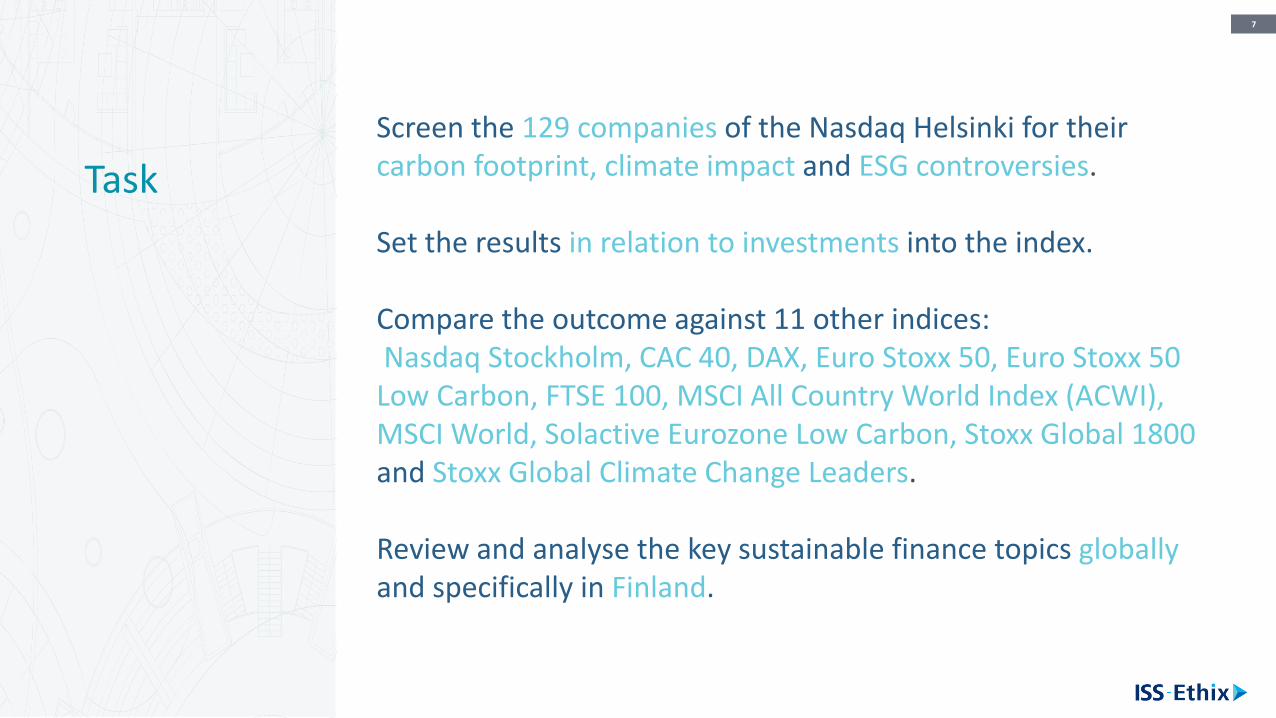
Task
Screen the 129 companies of the Nasdaq Helsinki for their carbon footprint, climate impact and ESG controversies.
Set the results in relation to investments into the index.
Compare the outcome against 11 other indices:Nasdaq Stockholm, CAC 40, DAX, Euro Stoxx 50, Euro Stoxx 50 Low Carbon, FTSE 100, MSCI All Country World Index (ACWI), MSCI World, Solactive Eurozone Low Carbon, Stoxx Global 1800 and Stoxx Global Climate Change Leaders.
Review and analyse the key sustainable finance topics globallyand specifically in Finland.
8
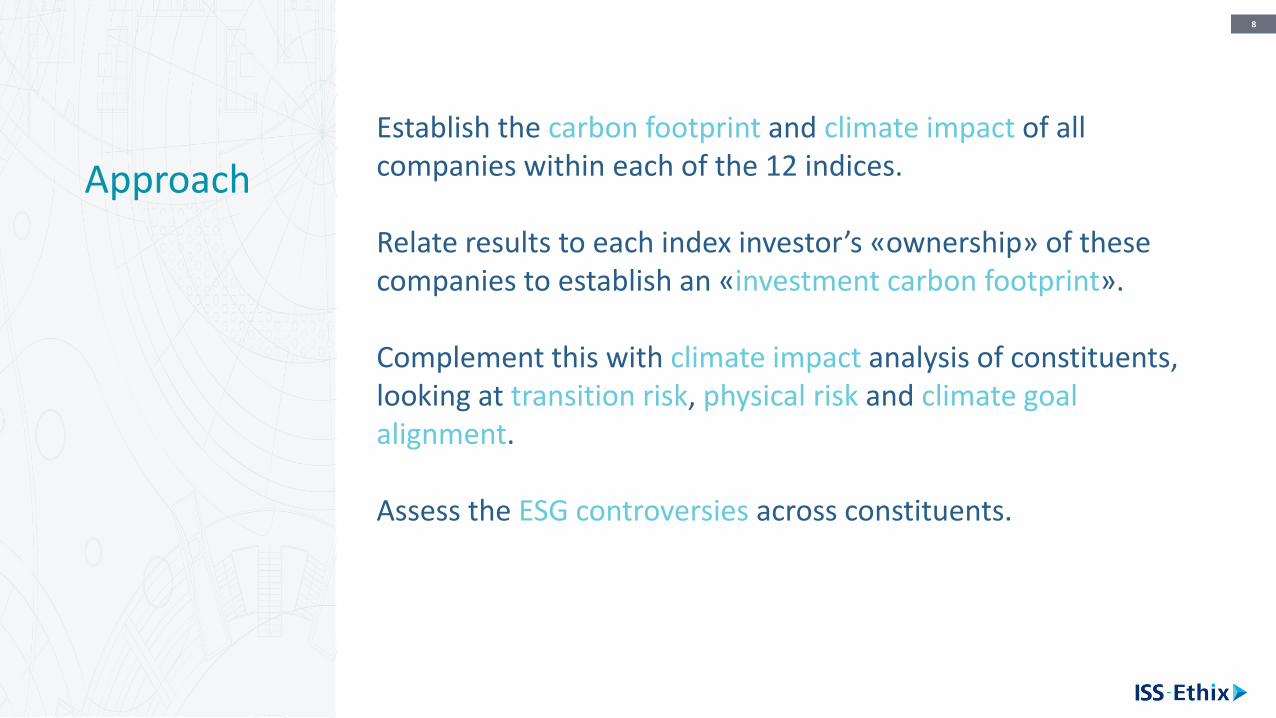
Approach
Establish the carbon footprint and climate impact of all companies within each of the 12 indices.
Relate results to each index investor’s «ownership» of these companies to establish an «investment carbon footprint».
Complement this with climate impact analysis of constituents, looking at transition risk, physical risk and climate goal alignment.
Assess the ESG controversies across constituents.
9
Comparison Nasdaq Helsinki versus Benchmark
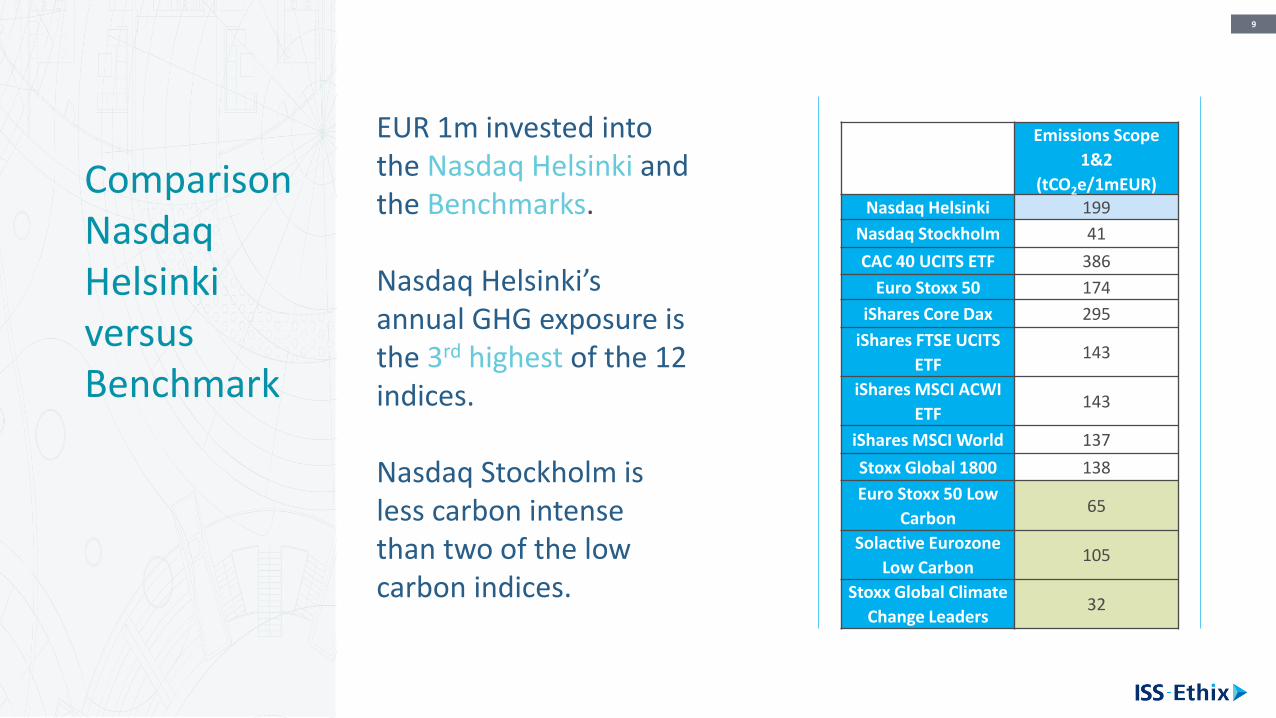
EUR 1m invested into the Nasdaq Helsinki and the Benchmarks.
Nasdaq Helsinki’s annual GHG exposure is the 3rd highest of the 12 indices.
Nasdaq Stockholm is less carbon intense than two of the low carbon indices.
Emissions Scope
1&2
(tCO2e/1mEUR)Nasdaq Helsinki 199
Nasdaq Stockholm 41
CAC 40 UCITS ETF 386
Euro Stoxx 50 174
iShares Core Dax 295
iShares FTSE UCITS
ETF143
iShares MSCI ACWI
ETF143
iShares MSCI World 137
Stoxx Global 1800 138
Euro Stoxx 50 Low
Carbon65
Solactive Eurozone
Low Carbon105
Stoxx Global Climate
Change Leaders32
10
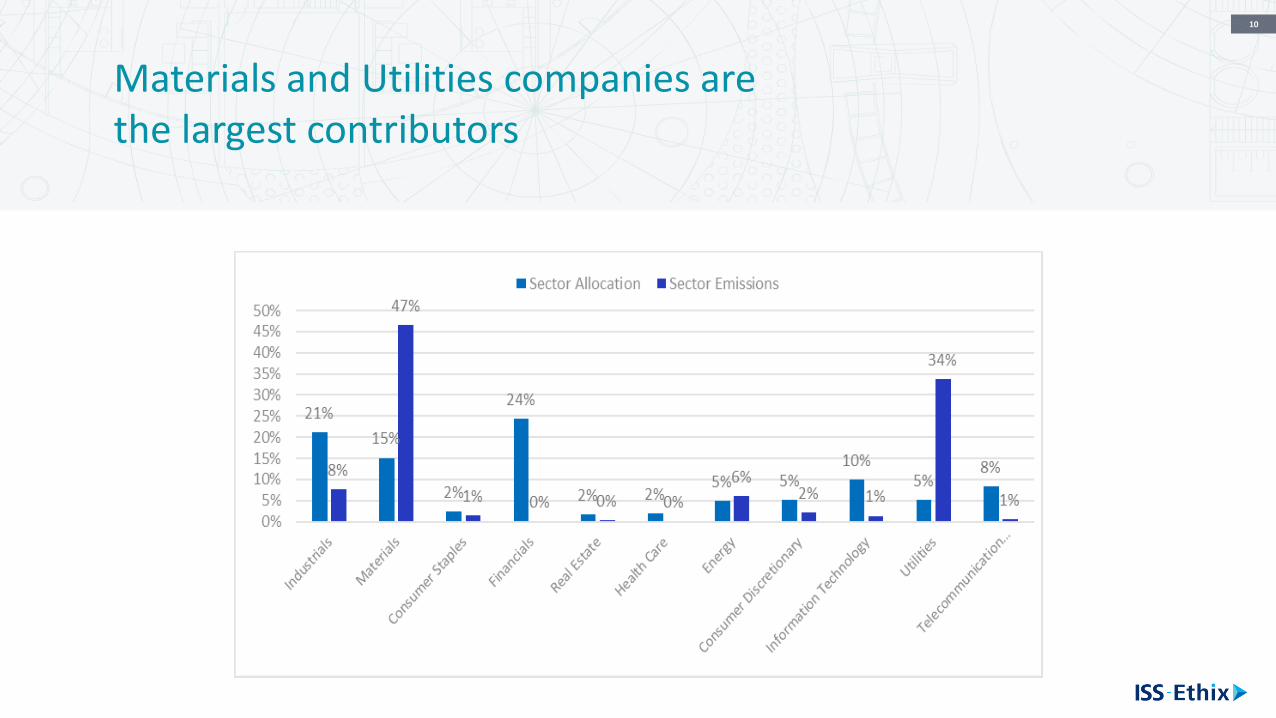
Materials and Utilities companies are the largest contributors
11
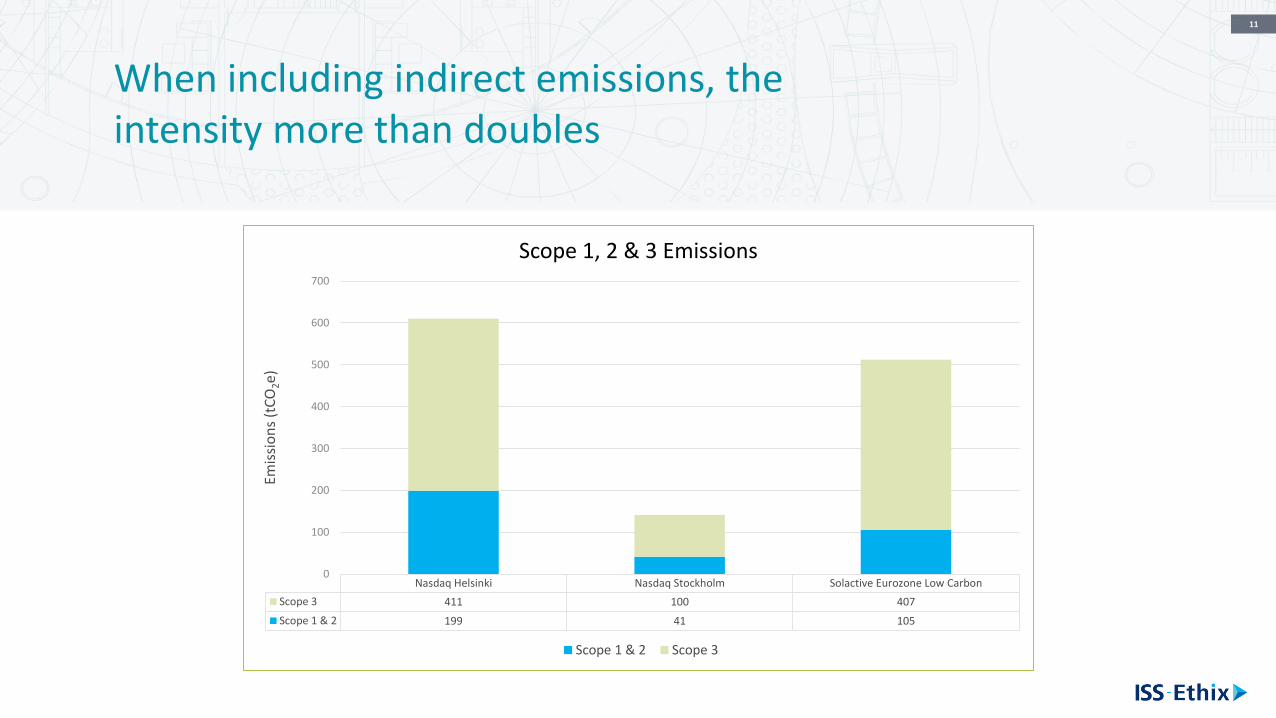
When including indirect emissions, the intensity more than doubles
Nasdaq Helsinki Nasdaq Stockholm Solactive Eurozone Low Carbon
Scope 3 411 100 407
Scope 1 & 2 199 41 105
0
100
200
300
400
500
600
700Em
issi
on
s (t
CO
2e)
Scope 1, 2 & 3 Emissions
Scope 1 & 2 Scope 3
12
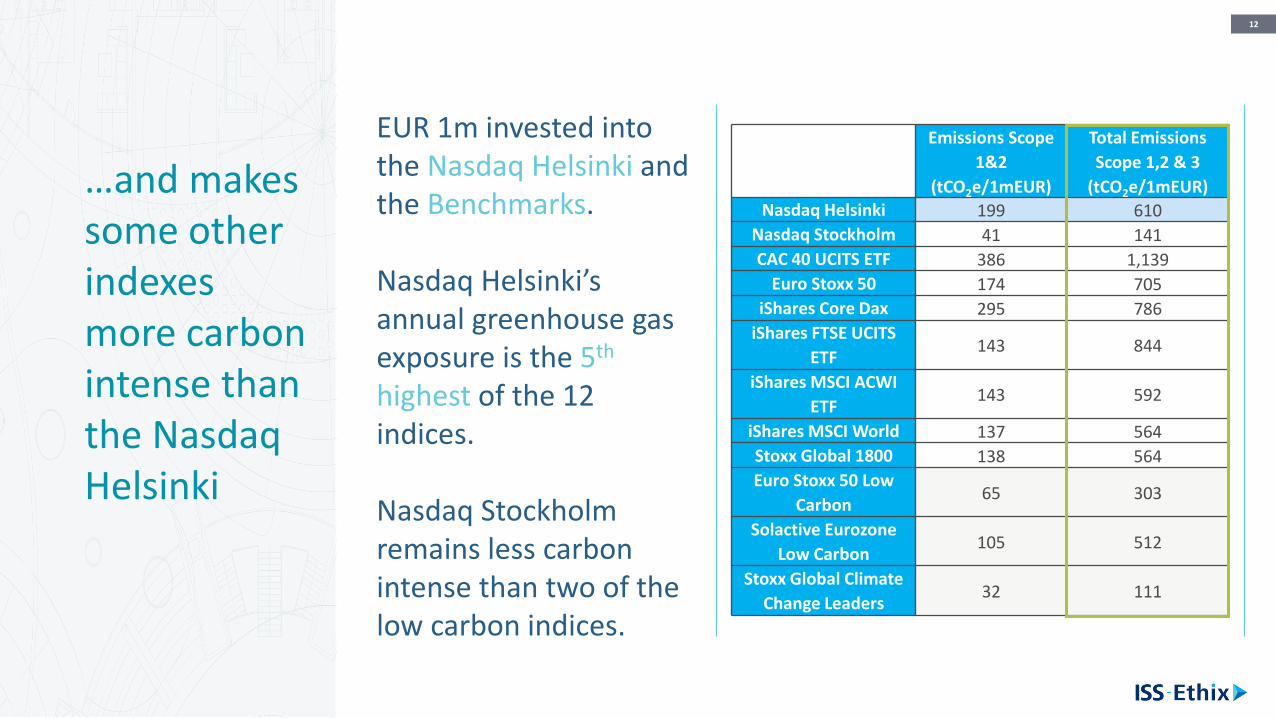
…and makessome otherindexesmore carbonintense thanthe NasdaqHelsinki
EUR 1m invested into the Nasdaq Helsinki and the Benchmarks.
Nasdaq Helsinki’s annual greenhouse gas exposure is the 5th
highest of the 12 indices.
Nasdaq Stockholm remains less carbon intense than two of the low carbon indices.
Emissions Scope
1&2
(tCO2e/1mEUR)
Total Emissions
Scope 1,2 & 3
(tCO2e/1mEUR)Nasdaq Helsinki 199 610
Nasdaq Stockholm 41 141
CAC 40 UCITS ETF 386 1,139
Euro Stoxx 50 174 705
iShares Core Dax 295 786
iShares FTSE UCITS
ETF143 844
iShares MSCI ACWI
ETF143 592
iShares MSCI World 137 564
Stoxx Global 1800 138 564
Euro Stoxx 50 Low
Carbon65 303
Solactive Eurozone
Low Carbon105 512
Stoxx Global Climate
Change Leaders32 111
13
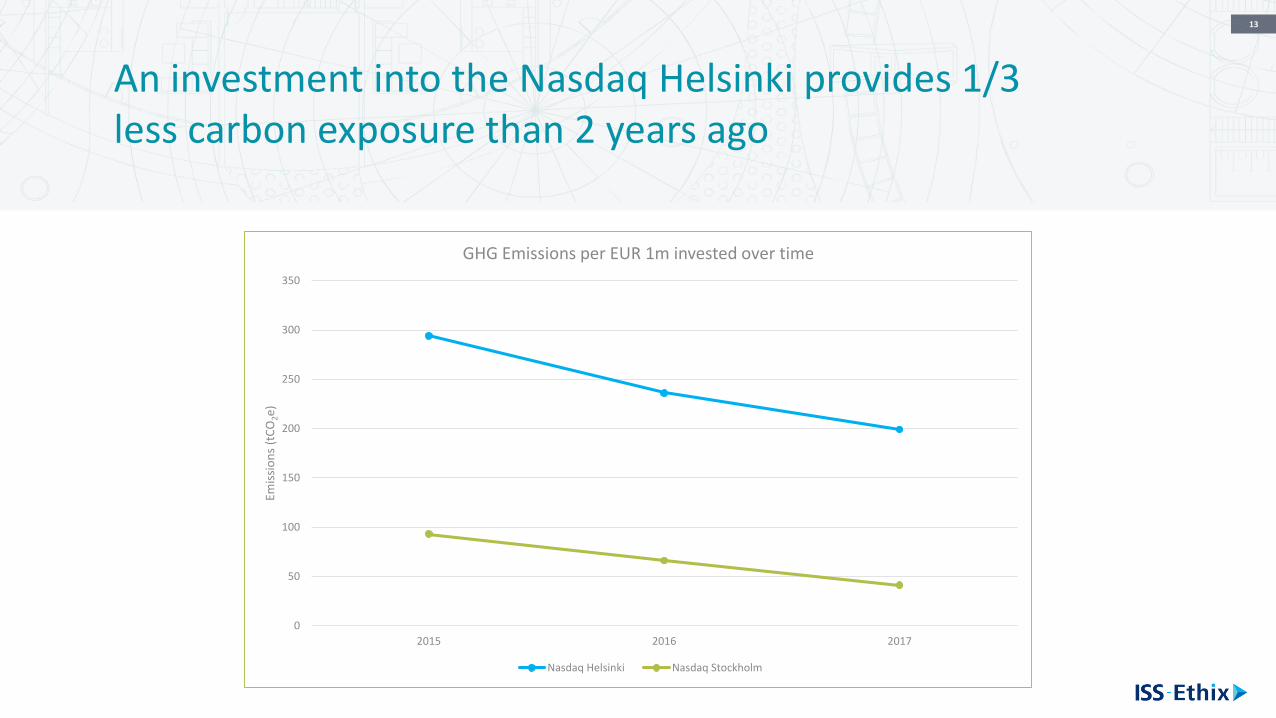
An investment into the Nasdaq Helsinki provides 1/3 less carbon exposure than 2 years ago
0
50
100
150
200
250
300
350
2015 2016 2017
Emis
sio
ns
(tC
O2e)
GHG Emissions per EUR 1m invested over time
Nasdaq Helsinki Nasdaq Stockholm
14
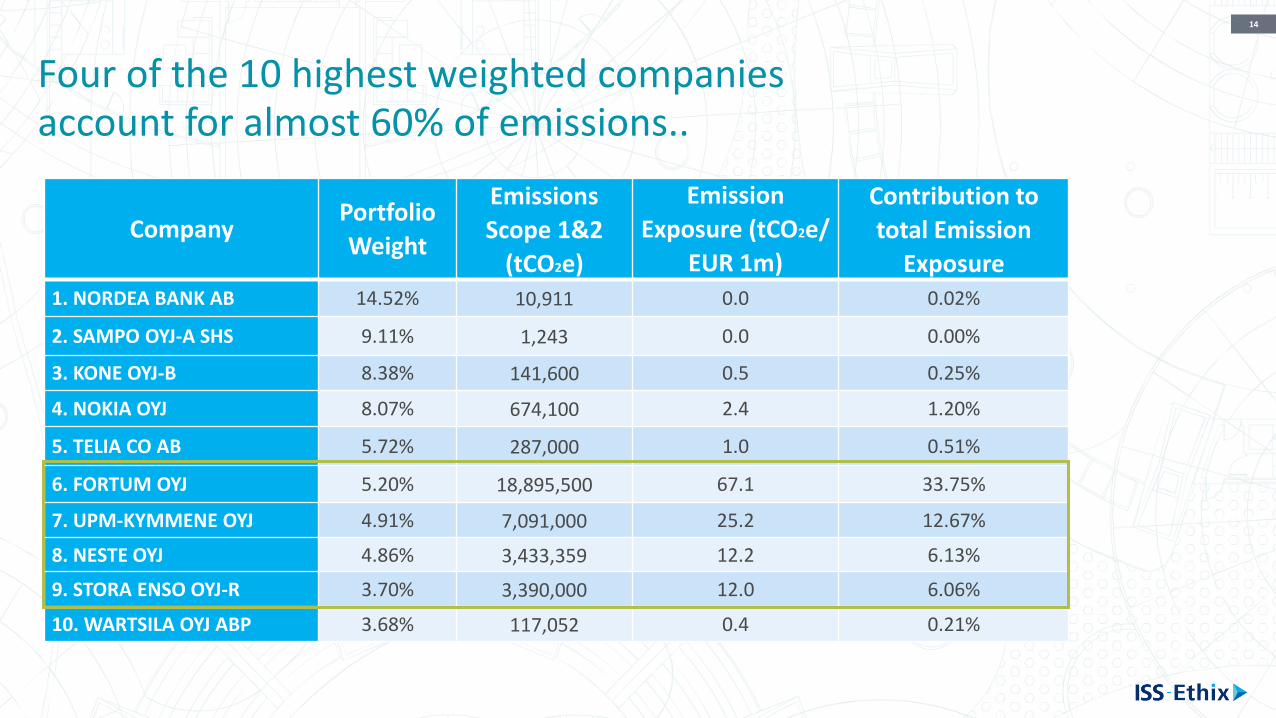
CompanyPortfolio
Weight
Emissions
Scope 1&2
(tCO2e)
Emission
Exposure (tCO2e/
EUR 1m)
Contribution to
total Emission
Exposure1. NORDEA BANK AB 14.52% 10,911 0.0 0.02%
2. SAMPO OYJ-A SHS 9.11% 1,243 0.0 0.00%
3. KONE OYJ-B 8.38% 141,600 0.5 0.25%
4. NOKIA OYJ 8.07% 674,100 2.4 1.20%
5. TELIA CO AB 5.72% 287,000 1.0 0.51%
6. FORTUM OYJ 5.20% 18,895,500 67.1 33.75%
7. UPM-KYMMENE OYJ 4.91% 7,091,000 25.2 12.67%
8. NESTE OYJ 4.86% 3,433,359 12.2 6.13%
9. STORA ENSO OYJ-R 3.70% 3,390,000 12.0 6.06%
10. WARTSILA OYJ ABP 3.68% 117,052 0.4 0.21%
Four of the 10 highest weighted companies account for almost 60% of emissions..
15
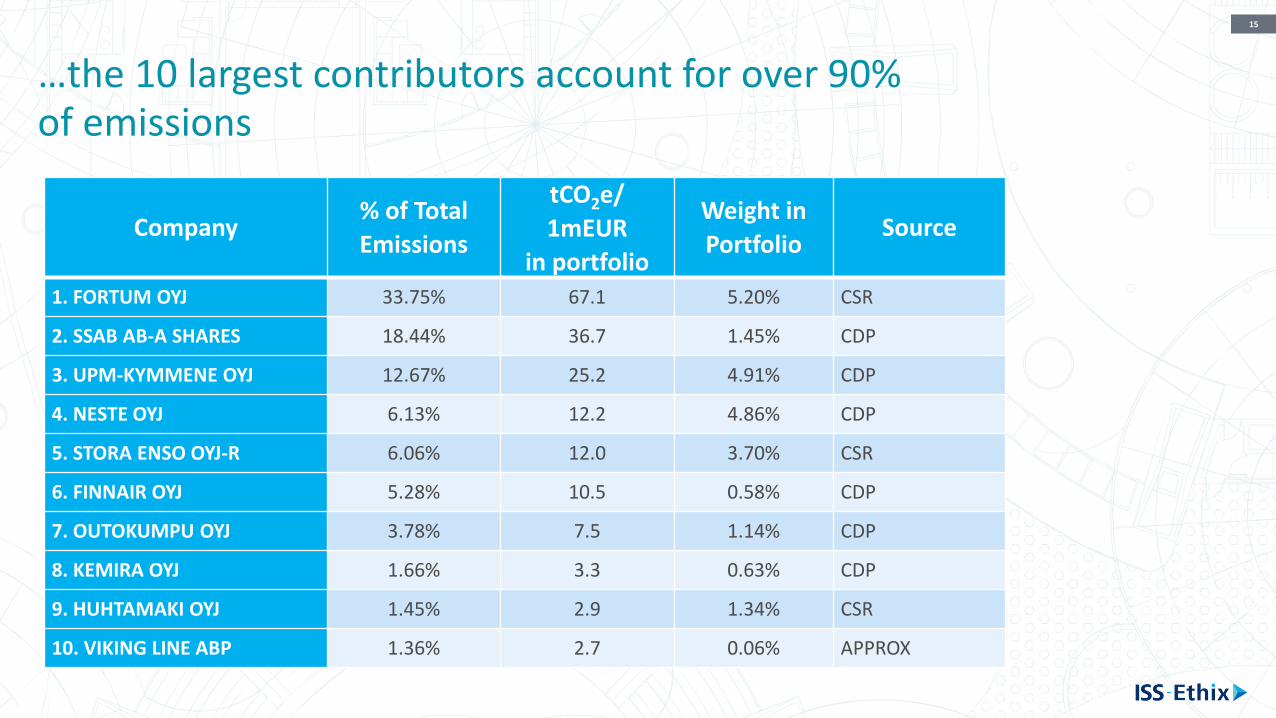
…the 10 largest contributors account for over 90% of emissions
Company% of Total
Emissions
tCO2e/
1mEUR
in portfolio
Weight in
PortfolioSource
1. FORTUM OYJ 33.75% 67.1 5.20% CSR
2. SSAB AB-A SHARES 18.44% 36.7 1.45% CDP
3. UPM-KYMMENE OYJ 12.67% 25.2 4.91% CDP
4. NESTE OYJ 6.13% 12.2 4.86% CDP
5. STORA ENSO OYJ-R 6.06% 12.0 3.70% CSR
6. FINNAIR OYJ 5.28% 10.5 0.58% CDP
7. OUTOKUMPU OYJ 3.78% 7.5 1.14% CDP
8. KEMIRA OYJ 1.66% 3.3 0.63% CDP
9. HUHTAMAKI OYJ 1.45% 2.9 1.34% CSR
10. VIKING LINE ABP 1.36% 2.7 0.06% APPROX
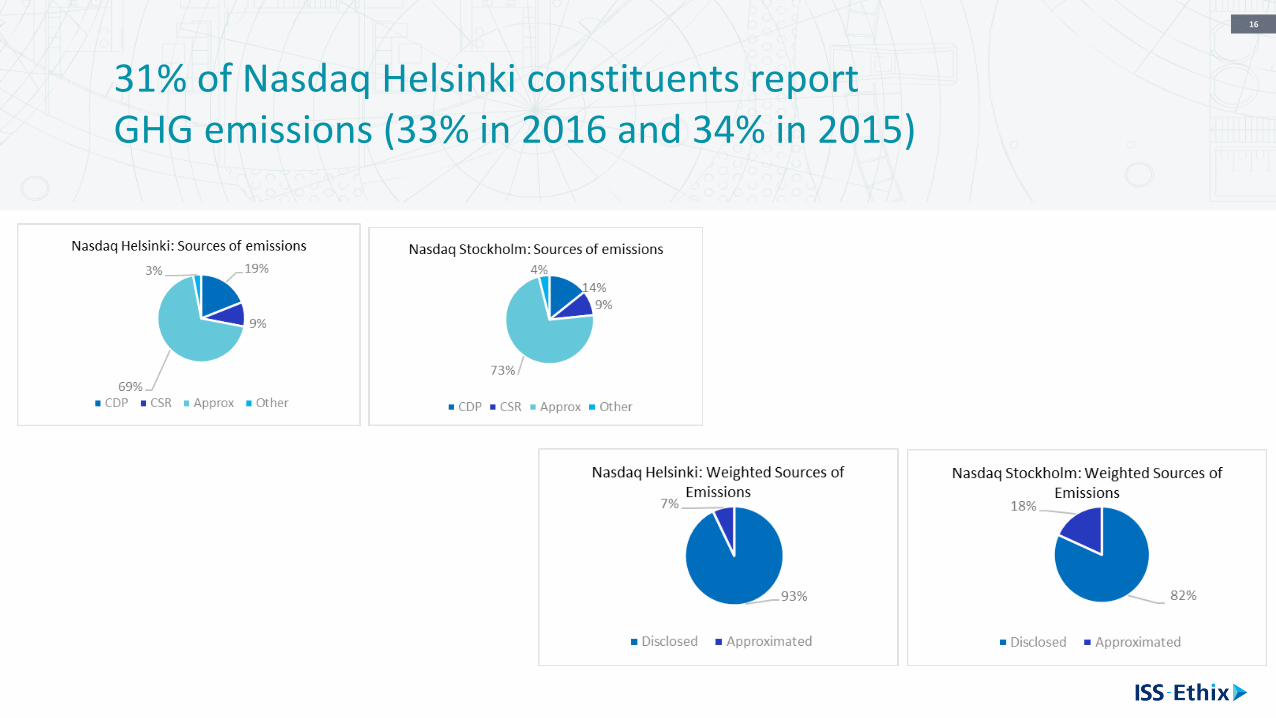
16
31% of Nasdaq Helsinki constituents report GHG emissions (33% in 2016 and 34% in 2015)
17
Climate impact assessment of the Nasdaq Helsinki
18
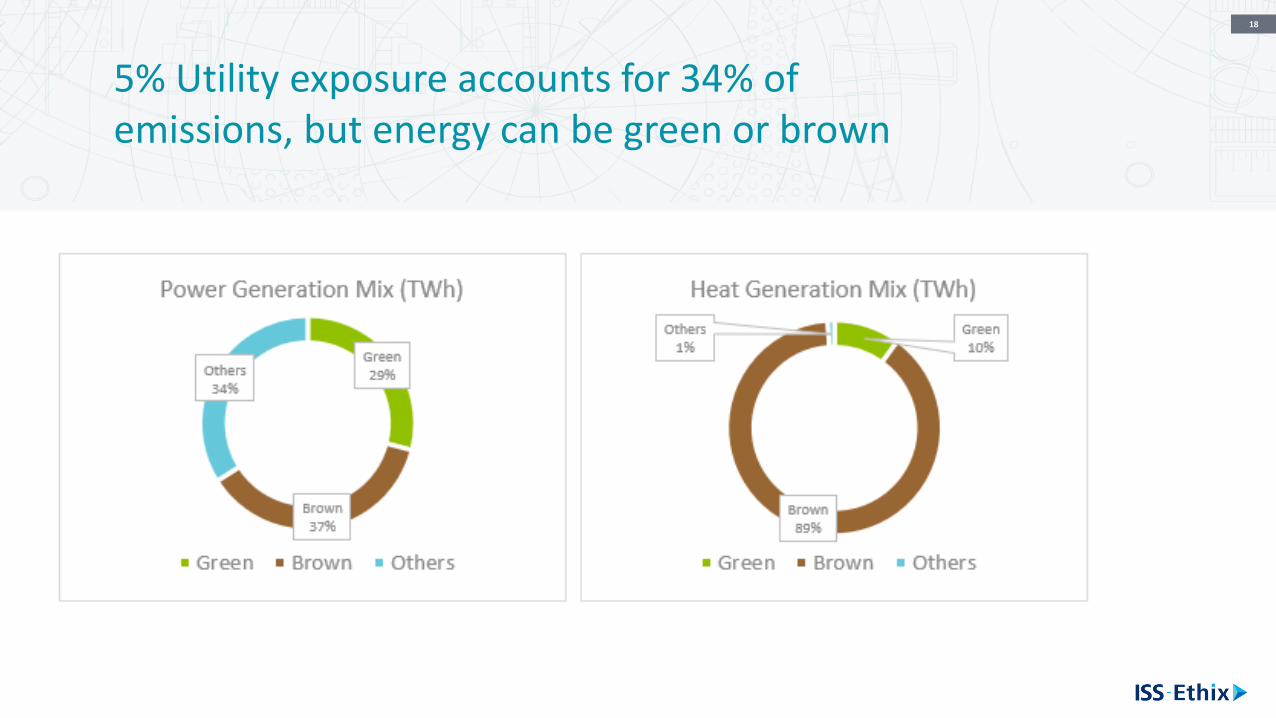
5% Utility exposure accounts for 34% of emissions, but energy can be green or brown
20
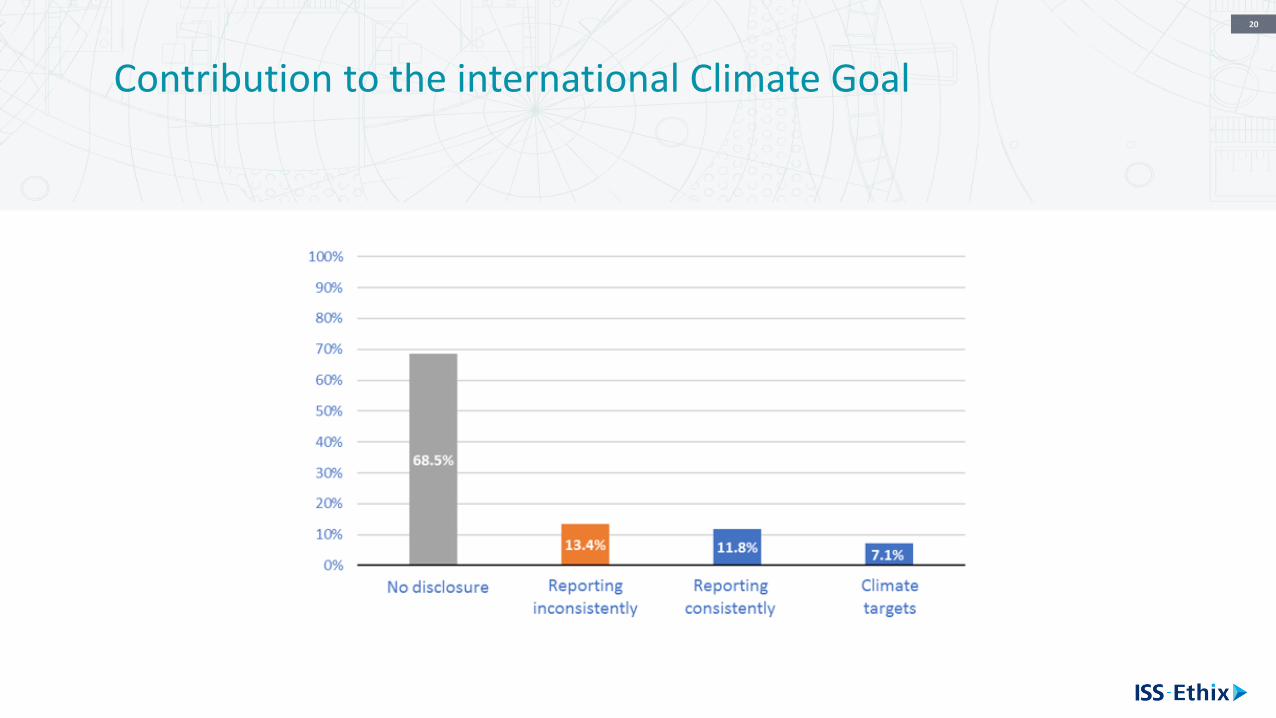
Contribution to the international Climate Goal
21
Norm Based Research
22
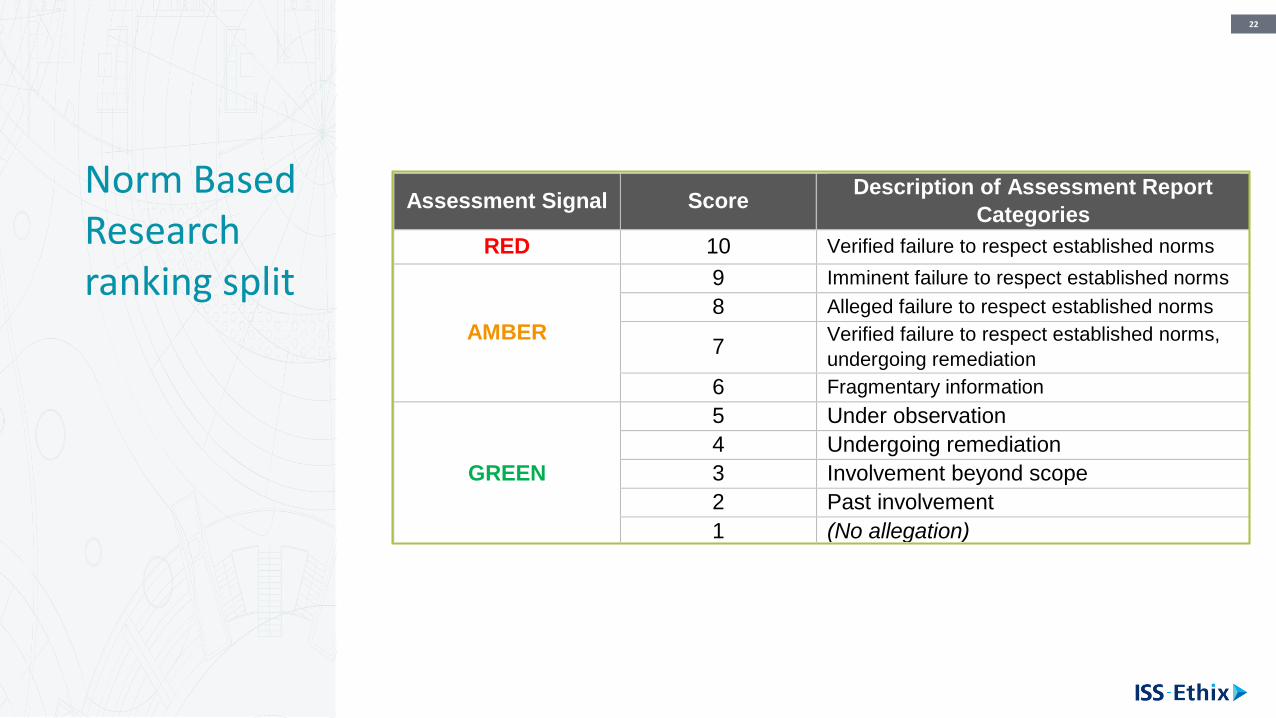
Norm Based Research ranking split
Assessment Signal Score Description of Assessment Report
Categories
RED 10 Verified failure to respect established norms
AMBER
9 Imminent failure to respect established norms
8 Alleged failure to respect established norms
7 Verified failure to respect established norms,
undergoing remediation
6 Fragmentary information
GREEN
5 Under observation
4 Undergoing remediation
3 Involvement beyond scope
2 Past involvement
1 (No allegation)
23
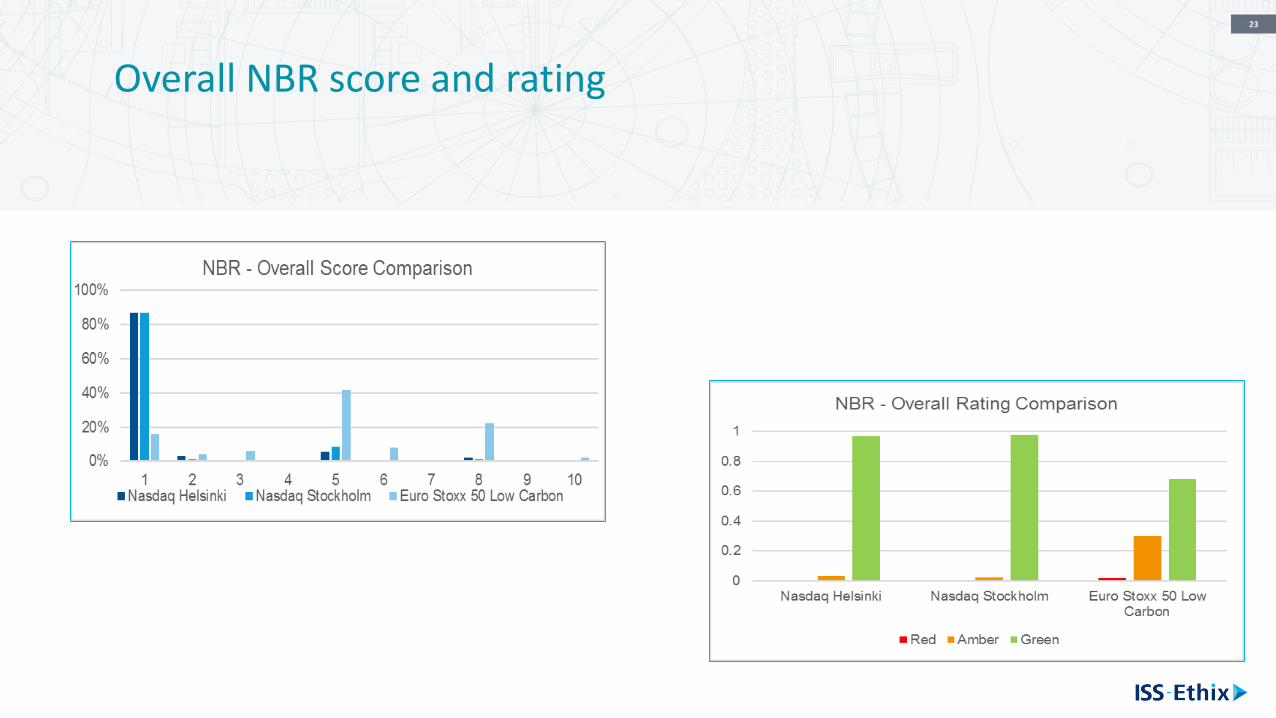
Overall NBR score and rating
24
What’s next
25
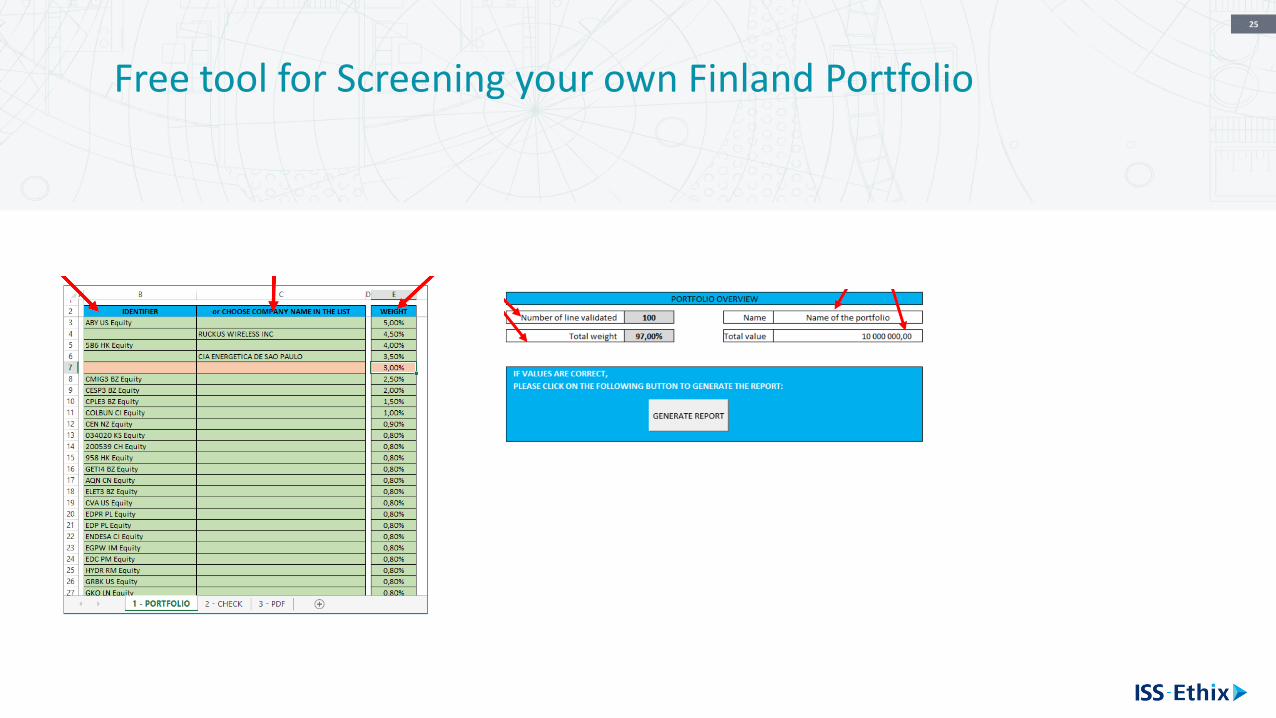
Free tool for Screening your own Finland Portfolio
Be decision confident in support of your investment strategy.
Thank You
Dr. Maximilian [email protected] Director, ISS-Ethix Climate Solutions
Hampus Hå[email protected] Director - Institutional Sales