Aptamer-Based Multiplexed Proteomic Technology forBiomarker DiscoveryLarry Gold1,2*, Deborah Ayers1, Jennifer Bertino1, Christopher Bock1, Ashley Bock1, Edward N. Brody1,
Jeff Carter1, Andrew B. Dalby1, Bruce E. Eaton4, Tim Fitzwater1, Dylan Flather1, Ashley Forbes1, Trudi
Foreman1, Cate Fowler1, Bharat Gawande1, Meredith Goss1, Magda Gunn1, Shashi Gupta1, Dennis
Halladay1, Jim Heil1, Joe Heilig1, Brian Hicke1, Gregory Husar1, Nebojsa Janjic1, Thale Jarvis1, Susan
Jennings1, Evaldas Katilius1, Tracy R. Keeney1, Nancy Kim1, Tad H. Koch4, Stephan Kraemer1, Luke
Kroiss1, Ngan Le1, Daniel Levine3, Wes Lindsey1, Bridget Lollo1, Wes Mayfield1, Mike Mehan1, Robert
Mehler1, Sally K. Nelson1, Michele Nelson1, Dan Nieuwlandt1, Malti Nikrad1, Urs Ochsner1, Rachel M.
Ostroff1, Matt Otis1, Thomas Parker3, Steve Pietrasiewicz1, Daniel I. Resnicow1, John Rohloff1, Glenn
Sanders1, Sarah Sattin1, Daniel Schneider1, Britta Singer1, Martin Stanton1, Alana Sterkel1, Alex
Stewart1, Suzanne Stratford1, Jonathan D. Vaught1, Mike Vrkljan1, Jeffrey J. Walker1*, Mike Watrobka1,
Sheela Waugh1, Allison Weiss1, Sheri K. Wilcox1, Alexey Wolfson1, Steven K. Wolk1, Chi Zhang1, Dom
Zichi1
1 SomaLogic, Boulder, Colorado, United States of America, 2 Department of Molecular, Cellular, and Developmental Biology, University of Colorado, Boulder, Colorado,
United States of America, 3 The Rogosin Institute and the Weill Medical College of Cornell University, New York, New York, United States of America, 4 Department of
Chemistry and Biochemistry, University of Colorado, Boulder, Colorado, United States of America
Abstract
Background: The interrogation of proteomes (‘‘proteomics’’) in a highly multiplexed and efficient manner remains acoveted and challenging goal in biology and medicine.
Methodology/Principal Findings: We present a new aptamer-based proteomic technology for biomarker discovery capableof simultaneously measuring thousands of proteins from small sample volumes (15 mL of serum or plasma). Our currentassay measures 813 proteins with low limits of detection (1 pM median), 7 logs of overall dynamic range (,100 fM–1 mM),and 5% median coefficient of variation. This technology is enabled by a new generation of aptamers that contain chemicallymodified nucleotides, which greatly expand the physicochemical diversity of the large randomized nucleic acid librariesfrom which the aptamers are selected. Proteins in complex matrices such as plasma are measured with a process thattransforms a signature of protein concentrations into a corresponding signature of DNA aptamer concentrations, which isquantified on a DNA microarray. Our assay takes advantage of the dual nature of aptamers as both folded protein-bindingentities with defined shapes and unique nucleotide sequences recognizable by specific hybridization probes. Todemonstrate the utility of our proteomics biomarker discovery technology, we applied it to a clinical study of chronic kidneydisease (CKD). We identified two well known CKD biomarkers as well as an additional 58 potential CKD biomarkers. Theseresults demonstrate the potential utility of our technology to rapidly discover unique protein signatures characteristic ofvarious disease states.
Conclusions/Significance: We describe a versatile and powerful tool that allows large-scale comparison of proteomeprofiles among discrete populations. This unbiased and highly multiplexed search engine will enable the discovery of novelbiomarkers in a manner that is unencumbered by our incomplete knowledge of biology, thereby helping to advance thenext generation of evidence-based medicine.
Citation: Gold L, Ayers D, Bertino J, Bock C, Bock A, et al. (2010) Aptamer-Based Multiplexed Proteomic Technology for Biomarker Discovery. PLoS ONE 5(12):e15004. doi:10.1371/journal.pone.0015004
Editor: Fabrizio Gelain, University of Milan-Bicocca, Italy
Received August 6, 2010; Accepted October 13, 2010; Published December 7, 2010
Copyright: � 2010 Gold et al. This is an open-access article distributed under the terms of the Creative Commons Attribution License, which permitsunrestricted use, distribution, and reproduction in any medium, provided the original author and source are credited.
Funding: This work was funded by SomaLogic. SomaLogic had no role in the original prospective CKD study. SomaLogic, with input from D.L. and T.P., designedthe retrospective CKD study with archived samples, collected and analyzed the data, decided to publish, and prepared the manuscript. The National Institutes ofHealth (NIH) had no role in study design, data collection and analysis, decision to publish, or preparation of the manuscript.
Competing Interests: The authors have read the journal’s policy and have the following conflicts: L Gold, D Ayers, J Bertino, C Bock, E Brody, J Carter, TFitzwater, D Flather, A Forbes, T Foreman, C Fowler, B Gawande, M Goss, M Gunn, S Gupta, D Halladay, N Janjic, T Jarvis, S Jennings, E Katilius, T Keeney, N Kim, SKraemer, N Le, B Lollo, W Mayfield, M Mehan, R Mehler, S Nelson, M Nikrad, U Ochsner, R Ostroff, M Otis, S Pietrasiewicz, D Resnicow, J Rohloff, G Sanders, DSchneider, B Singer, A Stewart, J Vaught, M Vrkljan, J Walker, M Watrobka, S Waugh, A Weiss, S Wilcox, S Wolk, C Zhang, and D Zichi are employed by SomaLogic. BEaton and T Koch are consultants to SomaLogic. A Bock, A Dalby, B Eaton, J Heil, J Heilig, B Hicke, G Husar, L Kroiss, W Lindsey, M Nelson, D Nieuwlandt, S Sattin, MStanton, A Sterkel, S Stratford, and A Wolfson are former employees of SomaLogic. SomaLogic has filed patent applications on aspects of this work. This does notalter the authors’ adherence to all the PLoS ONE policies on sharing data and materials.
* E-mail: [email protected] (LG); [email protected] (JJW)
PLoS ONE | www.plosone.org 1 December 2010 | Volume 5 | Issue 12 | e15004
Introduction
Proteins present in blood are an immediate measure of an
individual’s phenotype and state of wellness. Secreted proteins,
released from diseased cells and surrounding tissues, contain
important biological information with the potential to transform
early diagnostic, prognostic, therapeutic, and even preventative
decisions in medicine.
We will realize the full power of proteomics only when we can
measure and compare the proteomes of many individuals to
identify biomarkers of human health and disease and track the
blood-based proteome of an individual over time. Because the
human proteome contains an estimated 20,000 proteins – plus
splicing and post-translational variants – that span a concentration
range of ,12 logs, identifying and quantifying valid biomarkers is
a great technical challenge. Proteomic measurements demand
extreme sensitivity, specificity, dynamic range, and accurate
quantification.
The desire to profile the changes in protein expression at large
scale is not new. Attempts at high-content proteomics began with
2-D gels and now mostly employ mass spectrometry (MS) and
antibody-based technologies [1,2]. MS can deliver specific
analytical capabilities and the technology has advanced remark-
ably in the past decade. Despite great promise for MS in clinical
proteomics, many challenges remain including issues of sensitivity
(typically nM in current approaches), specificity, reproducibility,
throughput, and cost [2–9].
Antibody-based methods are more sensitive than 2-D gels or
MS and can detect analytes in the sub-nM range due to the high
affinity of antibodies for their targets (typically nM to pM).
However, non-specific binding of antibodies to non-cognate
proteins, other macromolecules, and surfaces requires sandwich-
type assays where the second antibody contributes to enhanced
specificity through an independent binding event. In other words,
technologies such as Enzyme-Linked Immuno-Sorbent Assays
(ELISAs) attain high sensitivity by combining the specificity of two
different antibodies to the same protein, requiring that both bind
to elicit a signal [1]. Although broadly used in single-analyte tests,
it has recently become clear that such assays cannot be
multiplexed above a few tens of simultaneous measurements
[10,11] in large part because cross-reactivity of secondary
antibodies to surface-immobilized proteins (including primary
antibodies) dramatically erodes specificity [1]. This inherent
characteristic compromises the performance of antibody-based
arrays including printed antibodies, sandwich formats, and bead-
based arrays [1,12]. A recently reported proximity ligation assay
that relies on antibody sandwich formation in solution followed by
ligation of antibody-tethered nucleic acids and PCR amplification
has been multiplexed with six analytes [10].
To address these challenges, we set out to develop a proteomics
array technology analogous to the highly successful nucleic acid
hybridization microarray. To create this technology, we developed
a new class of DNA-based aptamers enabled by a versatile
chemistry technology that endows nucleotides with protein-like
functional groups. These modifications greatly expand the
repertoire of targets accessible to aptamers. The resulting
technology provides efficient, large-scale selection of exquisite
protein-binding reagents selected specifically for use in highly-
multiplexed proteomics arrays. Aptamers are a class of nucleic
acid-based molecules discovered twenty years ago [13,14] and
have since been employed in diverse applications including
therapeutics [15], catalysis [16], and now proteomics. Aptamers
are short single-stranded oligonucleotides, which fold into diverse
and intricate molecular structures that bind with high affinity and
specificity to proteins, peptides, and small molecules [17–19].
Aptamers are selected in vitro from enormously large libraries of
randomized sequences by the process of Systematic Evolution of
Ligands by EXponential enrichment (SELEX) [13,14]. A SELEX
library with 40 random sequence positions has 440 (,1024) possible
combinations and a typical selection screens 1014–1015 unique
molecules. This is on the order of 105 times larger than standard
peptide or protein combinatorial molecular libraries [20].
Based on the collective knowledge of the aptamer field that has
developed since its inception [13,14], we hypothesized that
aptamers could make exceptional reagents for high-content
proteomics. There were many examples of high affinity RNA
and DNA aptamers selected against human proteins [19].
However, there were also examples of difficult protein targets for
which standard RNA and DNA SELEX did not yield high affinity
aptamers. With two key innovations, we created a new class of
aptamer, the Slow Off-rate Modified Aptamer (SOMAmer), which
enabled efficient selection of high-affinity aptamers for almost any
protein target and the development of a novel highly-multiplexed
assay for high-performance proteomics. Here we present the
development of these unique reagents in the context of our high-
content, high-performance, low-cost proteomics array, and
demonstrate the potential of the platform to identify biomarkers
from clinically-relevant samples.
Results
SELEX with chemically-modified nucleotidesThe first innovation in developing the SOMAmer was
motivated by the idea that aptamers can be endowed with
protein-like properties by adding functional groups that mimic
amino acid side-chains to expand their chemical diversity [21].
Eaton and colleagues developed the technology to efficiently
synthesize nucleotides modified with diverse functional groups and
to utilize them in SELEX [21,22]. This innovation was used to
select catalysts, including the first RNA-catalyzed carbon-carbon
bond formation [16,23]. Building on this work, we developed
modified deoxyribonucleotides and SELEX methods [24] to select
modified DNA aptamers from libraries that incorporate one of
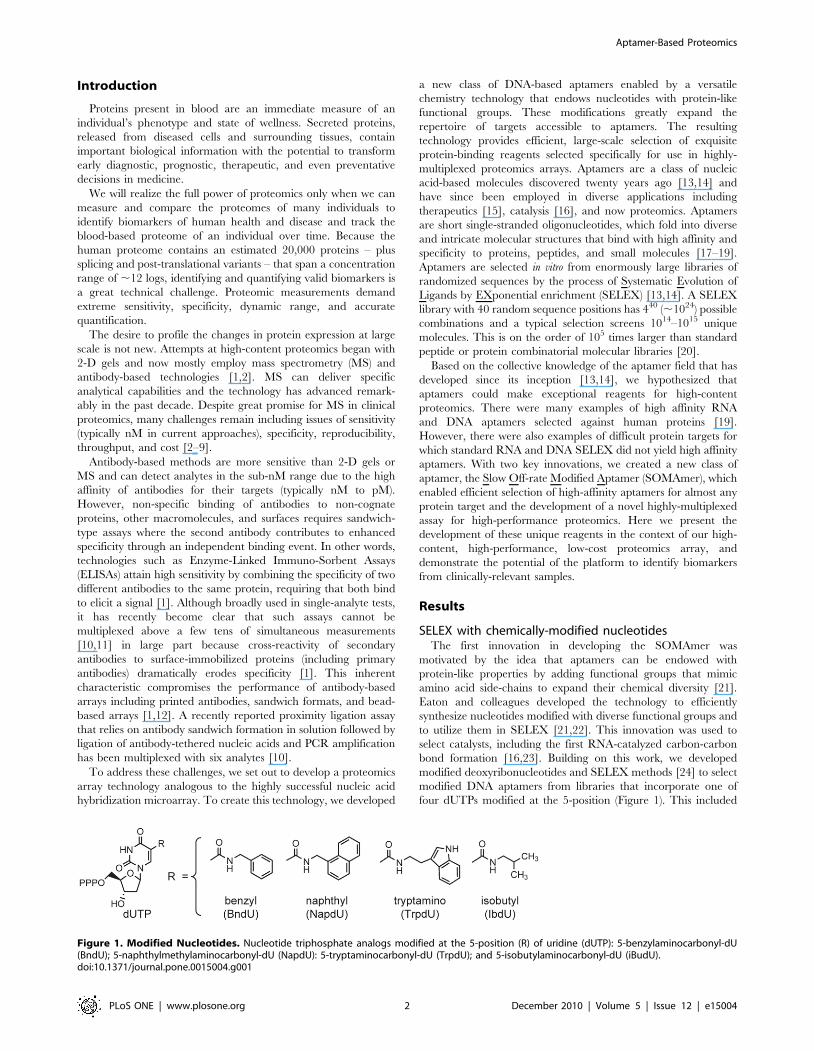
four dUTPs modified at the 5-position (Figure 1). This included
Figure 1. Modified Nucleotides. Nucleotide triphosphate analogs modified at the 5-position (R) of uridine (dUTP): 5-benzylaminocarbonyl-dU(BndU); 5-naphthylmethylaminocarbonyl-dU (NapdU): 5-tryptaminocarbonyl-dU (TrpdU); and 5-isobutylaminocarbonyl-dU (iBudU).doi:10.1371/journal.pone.0015004.g001
Aptamer-Based Proteomics
PLoS ONE | www.plosone.org 2 December 2010 | Volume 5 | Issue 12 | e15004
the synthesis of random libraries with modified nucleotides and the
enzymatic amplification of SELEX pools that contain modified
nucleotides (see Materials and Methods).
To test whether modified nucleotides improve SELEX, we
compared selections with modified and unmodified nucleotides
targeting thirteen ‘‘difficult’’ human proteins that had repeatedly
failed SELEX with unmodified DNA. As a control, we included
GA733-1 protein, which had yielded high-affinity aptamers with
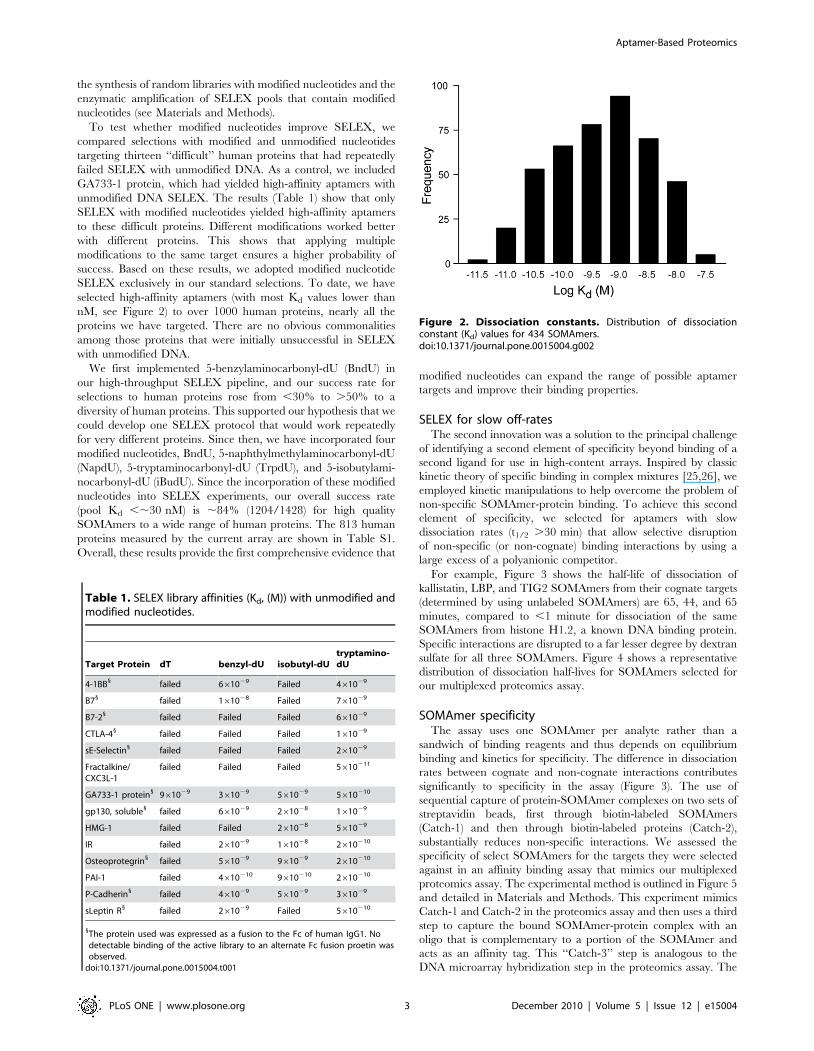
unmodified DNA SELEX. The results (Table 1) show that only
SELEX with modified nucleotides yielded high-affinity aptamers
to these difficult proteins. Different modifications worked better
with different proteins. This shows that applying multiple
modifications to the same target ensures a higher probability of
success. Based on these results, we adopted modified nucleotide
SELEX exclusively in our standard selections. To date, we have
selected high-affinity aptamers (with most Kd values lower than
nM, see Figure 2) to over 1000 human proteins, nearly all the
proteins we have targeted. There are no obvious commonalities
among those proteins that were initially unsuccessful in SELEX
with unmodified DNA.
We first implemented 5-benzylaminocarbonyl-dU (BndU) in
our high-throughput SELEX pipeline, and our success rate for
selections to human proteins rose from ,30% to .50% to a
diversity of human proteins. This supported our hypothesis that we
could develop one SELEX protocol that would work repeatedly
for very different proteins. Since then, we have incorporated four
modified nucleotides, BndU, 5-naphthylmethylaminocarbonyl-dU
(NapdU), 5-tryptaminocarbonyl-dU (TrpdU), and 5-isobutylami-
nocarbonyl-dU (iBudU). Since the incorporation of these modified
nucleotides into SELEX experiments, our overall success rate
(pool Kd ,,30 nM) is ,84% (1204/1428) for high quality
SOMAmers to a wide range of human proteins. The 813 human
proteins measured by the current array are shown in Table S1.
Overall, these results provide the first comprehensive evidence that
modified nucleotides can expand the range of possible aptamer
targets and improve their binding properties.
SELEX for slow off-ratesThe second innovation was a solution to the principal challenge
of identifying a second element of specificity beyond binding of a
second ligand for use in high-content arrays. Inspired by classic
kinetic theory of specific binding in complex mixtures [25,26], we
employed kinetic manipulations to help overcome the problem of
non-specific SOMAmer-protein binding. To achieve this second
element of specificity, we selected for aptamers with slow
dissociation rates (t1/2 .30 min) that allow selective disruption
of non-specific (or non-cognate) binding interactions by using a
large excess of a polyanionic competitor.
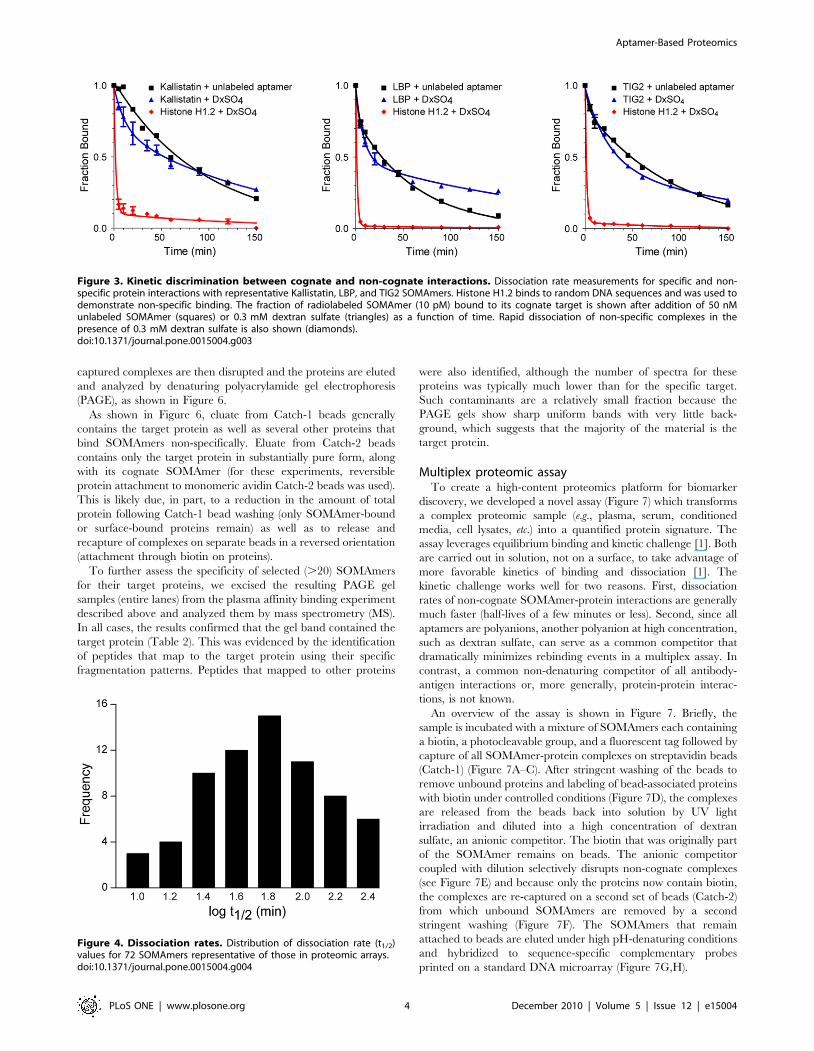
For example, Figure 3 shows the half-life of dissociation of
kallistatin, LBP, and TIG2 SOMAmers from their cognate targets
(determined by using unlabeled SOMAmers) are 65, 44, and 65
minutes, compared to ,1 minute for dissociation of the same
SOMAmers from histone H1.2, a known DNA binding protein.
Specific interactions are disrupted to a far lesser degree by dextran
sulfate for all three SOMAmers. Figure 4 shows a representative
distribution of dissociation half-lives for SOMAmers selected for
our multiplexed proteomics assay.
SOMAmer specificityThe assay uses one SOMAmer per analyte rather than a
sandwich of binding reagents and thus depends on equilibrium
binding and kinetics for specificity. The difference in dissociation
rates between cognate and non-cognate interactions contributes
significantly to specificity in the assay (Figure 3). The use of
sequential capture of protein-SOMAmer complexes on two sets of
streptavidin beads, first through biotin-labeled SOMAmers
(Catch-1) and then through biotin-labeled proteins (Catch-2),
substantially reduces non-specific interactions. We assessed the
specificity of select SOMAmers for the targets they were selected
against in an affinity binding assay that mimics our multiplexed
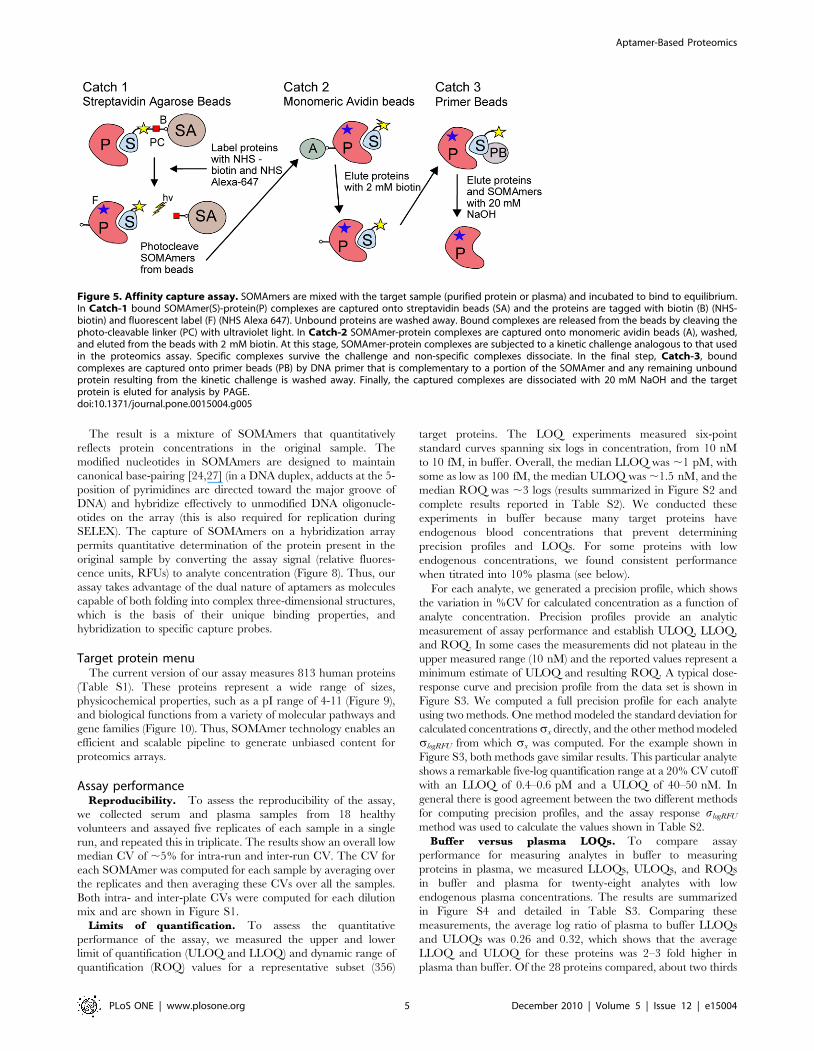
proteomics assay. The experimental method is outlined in Figure 5
and detailed in Materials and Methods. This experiment mimics
Catch-1 and Catch-2 in the proteomics assay and then uses a third
step to capture the bound SOMAmer-protein complex with an
oligo that is complementary to a portion of the SOMAmer and
acts as an affinity tag. This ‘‘Catch-3’’ step is analogous to the
DNA microarray hybridization step in the proteomics assay. The
Figure 2. Dissociation constants. Distribution of dissociationconstant (Kd) values for 434 SOMAmers.doi:10.1371/journal.pone.0015004.g002
Table 1. SELEX library affinities (Kd, (M)) with unmodified andmodified nucleotides.
Target Protein dT benzyl-dU isobutyl-dUtryptamino-dU
4-1BB1 failed 661029 Failed 461029
B71 failed 161028 Failed 761029
B7-21 failed Failed Failed 661029
CTLA-41 failed Failed Failed 161029
sE-Selectin1 failed Failed Failed 261029
Fractalkine/CXC3L-1
failed Failed Failed 5610211
GA733-1 protein1 961029 361029 561029 5610210
gp130, soluble1 failed 661029 261028 161029
HMG-1 failed Failed 261028 561029
IR failed 261029 161028 2610210
Osteoprotegrin1 failed 561029 961029 2610210
PAI-1 failed 4610210 9610210 2610210
P-Cadherin1 failed 461029 561029 361029
sLeptin R1 failed 261029 Failed 5610210
1The protein used was expressed as a fusion to the Fc of human IgG1. Nodetectable binding of the active library to an alternate Fc fusion proetin wasobserved.
doi:10.1371/journal.pone.0015004.t001
Aptamer-Based Proteomics
PLoS ONE | www.plosone.org 3 December 2010 | Volume 5 | Issue 12 | e15004
captured complexes are then disrupted and the proteins are eluted
and analyzed by denaturing polyacrylamide gel electrophoresis
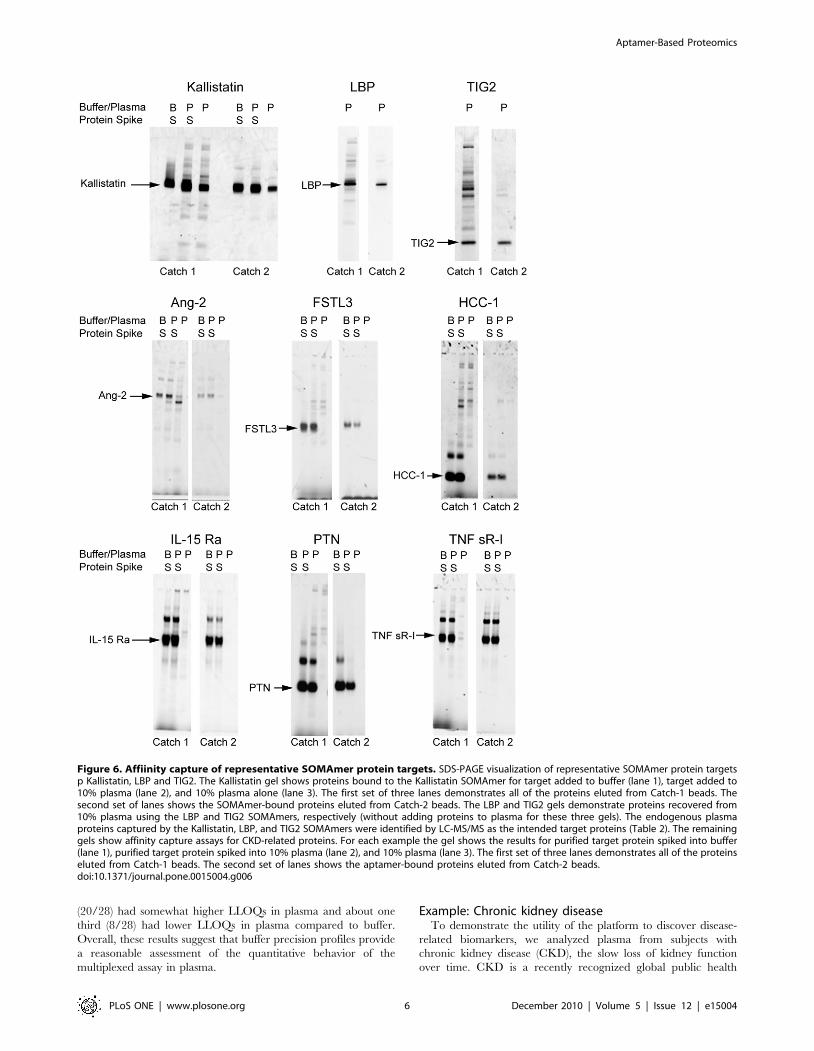
(PAGE), as shown in Figure 6.
As shown in Figure 6, eluate from Catch-1 beads generally
contains the target protein as well as several other proteins that
bind SOMAmers non-specifically. Eluate from Catch-2 beads
contains only the target protein in substantially pure form, along
with its cognate SOMAmer (for these experiments, reversible
protein attachment to monomeric avidin Catch-2 beads was used).
This is likely due, in part, to a reduction in the amount of total
protein following Catch-1 bead washing (only SOMAmer-bound
or surface-bound proteins remain) as well as to release and
recapture of complexes on separate beads in a reversed orientation
(attachment through biotin on proteins).
To further assess the specificity of selected (.20) SOMAmers
for their target proteins, we excised the resulting PAGE gel
samples (entire lanes) from the plasma affinity binding experiment
described above and analyzed them by mass spectrometry (MS).
In all cases, the results confirmed that the gel band contained the
target protein (Table 2). This was evidenced by the identification
of peptides that map to the target protein using their specific
fragmentation patterns. Peptides that mapped to other proteins
were also identified, although the number of spectra for these
proteins was typically much lower than for the specific target.
Such contaminants are a relatively small fraction because the
PAGE gels show sharp uniform bands with very little back-
ground, which suggests that the majority of the material is the
target protein.
Multiplex proteomic assayTo create a high-content proteomics platform for biomarker
discovery, we developed a novel assay (Figure 7) which transforms
a complex proteomic sample (e.g., plasma, serum, conditioned
media, cell lysates, etc.) into a quantified protein signature. The
assay leverages equilibrium binding and kinetic challenge [1]. Both
are carried out in solution, not on a surface, to take advantage of
more favorable kinetics of binding and dissociation [1]. The
kinetic challenge works well for two reasons. First, dissociation
rates of non-cognate SOMAmer-protein interactions are generally
much faster (half-lives of a few minutes or less). Second, since all
aptamers are polyanions, another polyanion at high concentration,
such as dextran sulfate, can serve as a common competitor that
dramatically minimizes rebinding events in a multiplex assay. In
contrast, a common non-denaturing competitor of all antibody-
antigen interactions or, more generally, protein-protein interac-
tions, is not known.
An overview of the assay is shown in Figure 7. Briefly, the
sample is incubated with a mixture of SOMAmers each containing
a biotin, a photocleavable group, and a fluorescent tag followed by
capture of all SOMAmer-protein complexes on streptavidin beads
(Catch-1) (Figure 7A–C). After stringent washing of the beads to
remove unbound proteins and labeling of bead-associated proteins
with biotin under controlled conditions (Figure 7D), the complexes
are released from the beads back into solution by UV light
irradiation and diluted into a high concentration of dextran
sulfate, an anionic competitor. The biotin that was originally part
of the SOMAmer remains on beads. The anionic competitor
coupled with dilution selectively disrupts non-cognate complexes
(see Figure 7E) and because only the proteins now contain biotin,
the complexes are re-captured on a second set of beads (Catch-2)
from which unbound SOMAmers are removed by a second
stringent washing (Figure 7F). The SOMAmers that remain
attached to beads are eluted under high pH-denaturing conditions
and hybridized to sequence-specific complementary probes
printed on a standard DNA microarray (Figure 7G,H).
Figure 3. Kinetic discrimination between cognate and non-cognate interactions. Dissociation rate measurements for specific and non-specific protein interactions with representative Kallistatin, LBP, and TIG2 SOMAmers. Histone H1.2 binds to random DNA sequences and was used todemonstrate non-specific binding. The fraction of radiolabeled SOMAmer (10 pM) bound to its cognate target is shown after addition of 50 nMunlabeled SOMAmer (squares) or 0.3 mM dextran sulfate (triangles) as a function of time. Rapid dissociation of non-specific complexes in thepresence of 0.3 mM dextran sulfate is also shown (diamonds).doi:10.1371/journal.pone.0015004.g003
Figure 4. Dissociation rates. Distribution of dissociation rate (t1/2)values for 72 SOMAmers representative of those in proteomic arrays.doi:10.1371/journal.pone.0015004.g004
Aptamer-Based Proteomics
PLoS ONE | www.plosone.org 4 December 2010 | Volume 5 | Issue 12 | e15004
The result is a mixture of SOMAmers that quantitatively
reflects protein concentrations in the original sample. The
modified nucleotides in SOMAmers are designed to maintain
canonical base-pairing [24,27] (in a DNA duplex, adducts at the 5-
position of pyrimidines are directed toward the major groove of
DNA) and hybridize effectively to unmodified DNA oligonucle-
otides on the array (this is also required for replication during
SELEX). The capture of SOMAmers on a hybridization array
permits quantitative determination of the protein present in the
original sample by converting the assay signal (relative fluores-
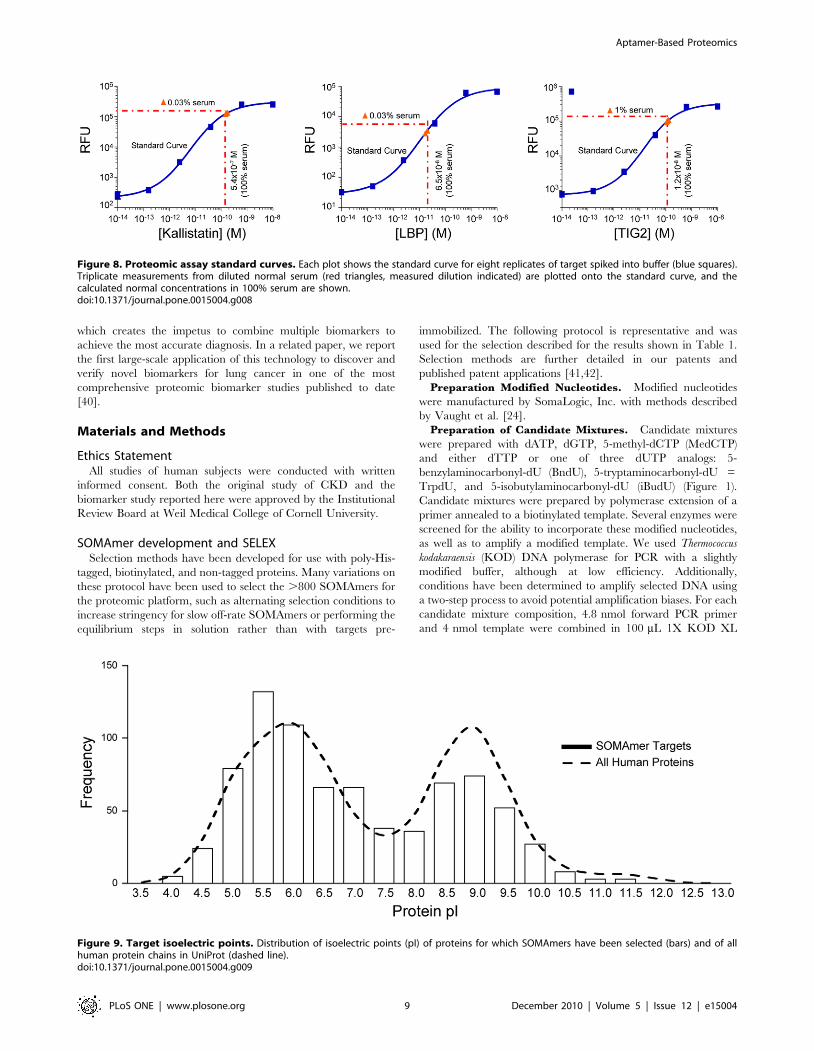
cence units, RFUs) to analyte concentration (Figure 8). Thus, our
assay takes advantage of the dual nature of aptamers as molecules
capable of both folding into complex three-dimensional structures,
which is the basis of their unique binding properties, and
hybridization to specific capture probes.
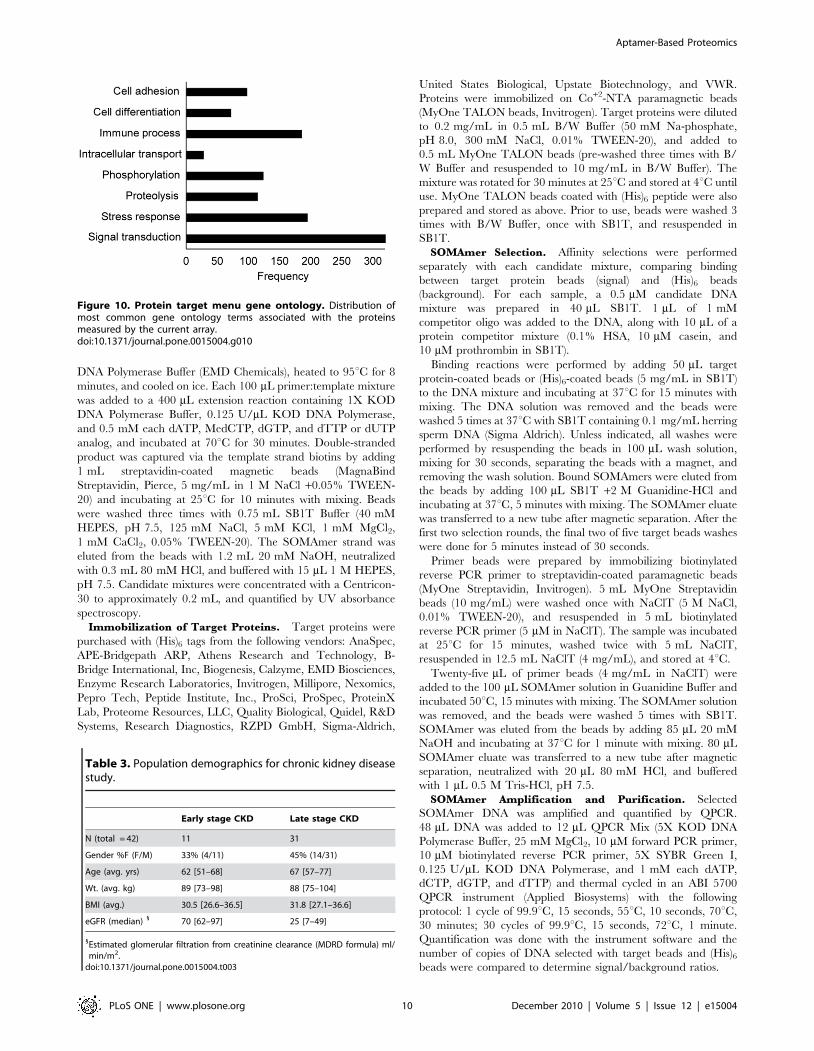
Target protein menuThe current version of our assay measures 813 human proteins
(Table S1). These proteins represent a wide range of sizes,
physicochemical properties, such as a pI range of 4-11 (Figure 9),
and biological functions from a variety of molecular pathways and
gene families (Figure 10). Thus, SOMAmer technology enables an
efficient and scalable pipeline to generate unbiased content for
proteomics arrays.
Assay performanceReproducibility. To assess the reproducibility of the assay,
we collected serum and plasma samples from 18 healthy
volunteers and assayed five replicates of each sample in a single
run, and repeated this in triplicate. The results show an overall low
median CV of ,5% for intra-run and inter-run CV. The CV for
each SOMAmer was computed for each sample by averaging over
the replicates and then averaging these CVs over all the samples.
Both intra- and inter-plate CVs were computed for each dilution
mix and are shown in Figure S1.
Limits of quantification. To assess the quantitative
performance of the assay, we measured the upper and lower
limit of quantification (ULOQ and LLOQ) and dynamic range of
quantification (ROQ) values for a representative subset (356)
target proteins. The LOQ experiments measured six-point
standard curves spanning six logs in concentration, from 10 nM
to 10 fM, in buffer. Overall, the median LLOQ was ,1 pM, with
some as low as 100 fM, the median ULOQ was ,1.5 nM, and the
median ROQ was ,3 logs (results summarized in Figure S2 and
complete results reported in Table S2). We conducted these
experiments in buffer because many target proteins have
endogenous blood concentrations that prevent determining
precision profiles and LOQs. For some proteins with low
endogenous concentrations, we found consistent performance
when titrated into 10% plasma (see below).
For each analyte, we generated a precision profile, which shows
the variation in %CV for calculated concentration as a function of
analyte concentration. Precision profiles provide an analytic
measurement of assay performance and establish ULOQ, LLOQ,
and ROQ. In some cases the measurements did not plateau in the
upper measured range (10 nM) and the reported values represent a
minimum estimate of ULOQ and resulting ROQ. A typical dose-
response curve and precision profile from the data set is shown in
Figure S3. We computed a full precision profile for each analyte
using two methods. One method modeled the standard deviation for
calculated concentrations sx directly, and the other method modeled
slogRFU from which sx was computed. For the example shown in
Figure S3, both methods gave similar results. This particular analyte
shows a remarkable five-log quantification range at a 20% CV cutoff
with an LLOQ of 0.4–0.6 pM and a ULOQ of 40–50 nM. In
general there is good agreement between the two different methods
for computing precision profiles, and the assay response slogRFU
method was used to calculate the values shown in Table S2.
Buffer versus plasma LOQs. To compare assay
performance for measuring analytes in buffer to measuring
proteins in plasma, we measured LLOQs, ULOQs, and ROQs
in buffer and plasma for twenty-eight analytes with low
endogenous plasma concentrations. The results are summarized
in Figure S4 and detailed in Table S3. Comparing these
measurements, the average log ratio of plasma to buffer LLOQs
and ULOQs was 0.26 and 0.32, which shows that the average
LLOQ and ULOQ for these proteins was 2–3 fold higher in
plasma than buffer. Of the 28 proteins compared, about two thirds
Figure 5. Affinity capture assay. SOMAmers are mixed with the target sample (purified protein or plasma) and incubated to bind to equilibrium.In Catch-1 bound SOMAmer(S)-protein(P) complexes are captured onto streptavidin beads (SA) and the proteins are tagged with biotin (B) (NHS-biotin) and fluorescent label (F) (NHS Alexa 647). Unbound proteins are washed away. Bound complexes are released from the beads by cleaving thephoto-cleavable linker (PC) with ultraviolet light. In Catch-2 SOMAmer-protein complexes are captured onto monomeric avidin beads (A), washed,and eluted from the beads with 2 mM biotin. At this stage, SOMAmer-protein complexes are subjected to a kinetic challenge analogous to that usedin the proteomics assay. Specific complexes survive the challenge and non-specific complexes dissociate. In the final step, Catch-3, boundcomplexes are captured onto primer beads (PB) by DNA primer that is complementary to a portion of the SOMAmer and any remaining unboundprotein resulting from the kinetic challenge is washed away. Finally, the captured complexes are dissociated with 20 mM NaOH and the targetprotein is eluted for analysis by PAGE.doi:10.1371/journal.pone.0015004.g005
Aptamer-Based Proteomics
PLoS ONE | www.plosone.org 5 December 2010 | Volume 5 | Issue 12 | e15004
(20/28) had somewhat higher LLOQs in plasma and about one
third (8/28) had lower LLOQs in plasma compared to buffer.
Overall, these results suggest that buffer precision profiles provide
a reasonable assessment of the quantitative behavior of the
multiplexed assay in plasma.
Example: Chronic kidney diseaseTo demonstrate the utility of the platform to discover disease-
related biomarkers, we analyzed plasma from subjects with
chronic kidney disease (CKD), the slow loss of kidney function
over time. CKD is a recently recognized global public health
Figure 6. Affiinity capture of representative SOMAmer protein targets. SDS-PAGE visualization of representative SOMAmer protein targetsp Kallistatin, LBP and TIG2. The Kallistatin gel shows proteins bound to the Kallistatin SOMAmer for target added to buffer (lane 1), target added to10% plasma (lane 2), and 10% plasma alone (lane 3). The first set of three lanes demonstrates all of the proteins eluted from Catch-1 beads. Thesecond set of lanes shows the SOMAmer-bound proteins eluted from Catch-2 beads. The LBP and TIG2 gels demonstrate proteins recovered from10% plasma using the LBP and TIG2 SOMAmers, respectively (without adding proteins to plasma for these three gels). The endogenous plasmaproteins captured by the Kallistatin, LBP, and TIG2 SOMAmers were identified by LC-MS/MS as the intended target proteins (Table 2). The remaininggels show affinity capture assays for CKD-related proteins. For each example the gel shows the results for purified target protein spiked into buffer(lane 1), purified target protein spiked into 10% plasma (lane 2), and 10% plasma (lane 3). The first set of three lanes demonstrates all of the proteinseluted from Catch-1 beads. The second set of lanes shows the aptamer-bound proteins eluted from Catch-2 beads.doi:10.1371/journal.pone.0015004.g006
Aptamer-Based Proteomics
PLoS ONE | www.plosone.org 6 December 2010 | Volume 5 | Issue 12 | e15004
problem that is ‘‘common, harmful, and treatable’’ with an
estimated prevalence of nearly 10% worldwide [28]. Early
intervention in CKD can substantially improve prognosis, which
is otherwise poor [28–31]. To achieve early diagnosis, predictive,
non-invasive CKD biomarkers are needed. CKD biomarkers
could also be useful for monitoring disease progression and
guiding treatment [28–31].
We chose CKD as a test case because kidney physiology
provides filtration of serum molecules based on size (molecular
mass) and charge [32] – thus CKD might lead to an increase in the
concentration of small proteins (MW ,45 kDa). Disease progres-
sion is expected to be accompanied by an overall increase in
plasma concentration of small proteins.
We obtained and analyzed plasma samples from 42 subjects
with CKD. Eleven subjects had early-stage CKD based on
estimated GFR (Table 3) (eGFR, defined as stages 1–2, median
creatinine clearance 70 ml/min/m2, range 62–97 ml/min/m2)
and 31 had late-stage CKD (stages 3–5, median creatinine
clearance 25 ml/min/m2, range 7–49 ml/min/m2) [33]. We
measured 614 human proteins (array size at the time analyses
were conducted) simultaneously for each sample and compared
the results of early- to late-stage CKD (Figure 11).
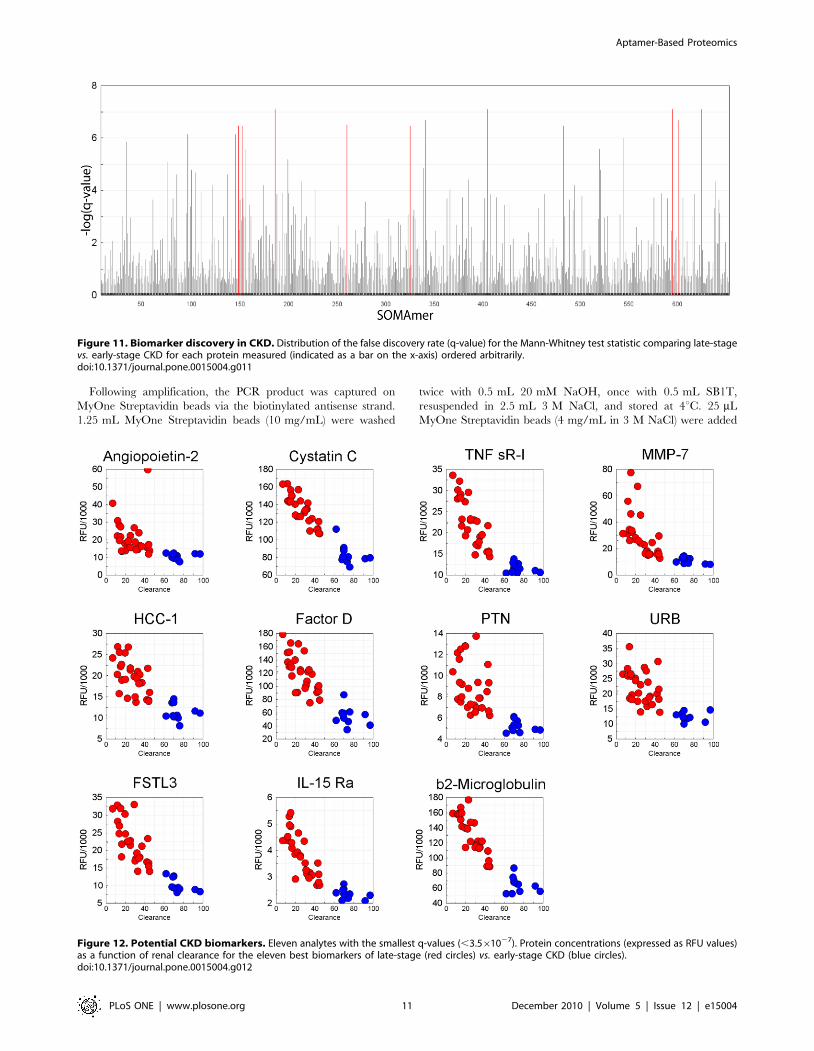
We identified 60 proteins that varied significantly between the
two groups, using the Mann-Whitney test, with a q-value (false
discovery rate-corrected p-value) of 4.261024 (Table S4). Eleven
proteins with the most highly significant variation (q-values
,3.561027) are highlighted in Figure 12 and shown in Table 4.
Nine out of eleven are relatively small proteins (,25 kDa). For all
eleven proteins, there is an inverse correlation between eGFR (a
marker of CKD progression) and protein concentration, suggesting
they could be potential biomarkers of CKD progression (Figure 12).
Two of the eleven proteins, cystatin C and b2-microglobulin, are
important known biomarkers of CKD [29–31] and two additional
proteins, complement factor D and TNF sR-I, have been reported
to have elevated concentrations in CKD [34,35].
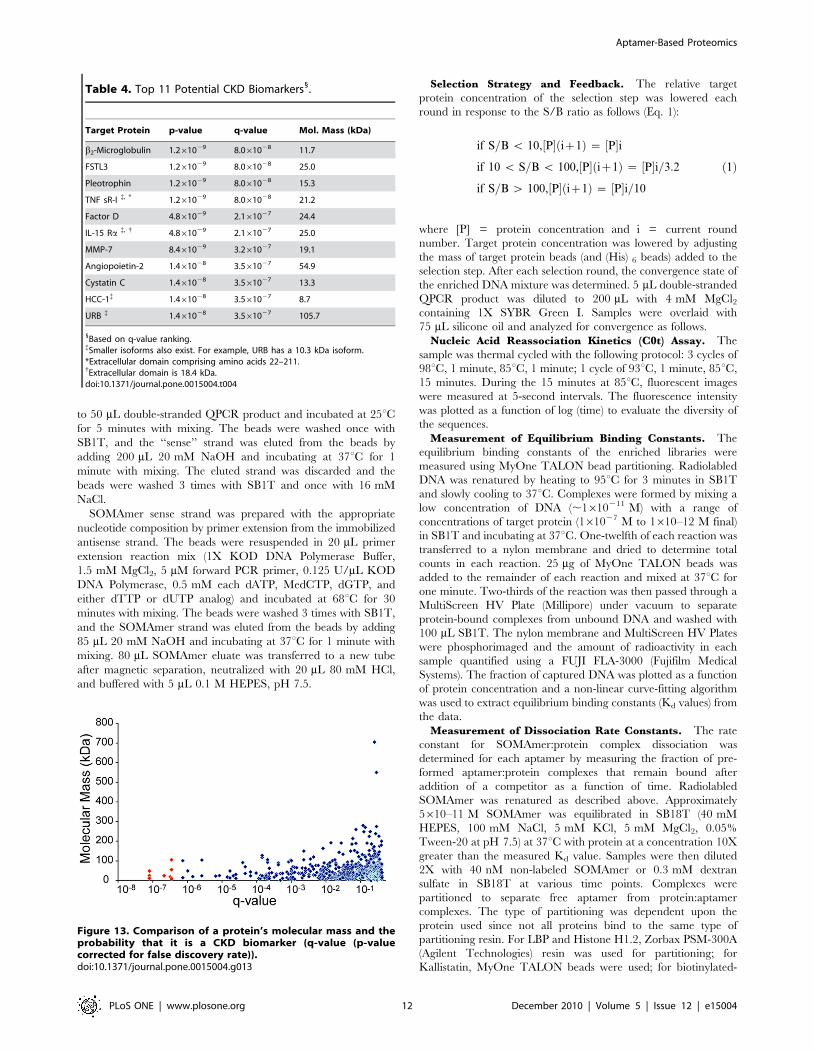
Accumulation in plasma of some small proteins appears to be a
major change in the proteome. However, the concentration of
many low molecular weight proteins did not change appreciably
with disease progression (Figure 13); pI also was uncorrelated with
an increase in plasma concentration as a function eGFR (data not
shown). The surprising fact that the biomarkers are not simply
ranked according to their molecular masses shows that reduced
kidney function is complex. The accumulation of some (but not all)
low molecular weight proteins, sometimes called ‘‘middle mole-
cules’’, in plasma of patients with impaired renal filtration has long
been implicated in the pathology of kidney disease[36]. High-
content proteomic analysis provides a means of unbiased discovery
of such proteins and their relationship to disease progression.
Discussion
We developed a new aptamer-based proteomic technology
capable of measuring thousands of proteins in small volumes of
biological samples with low limits of detection, a broad dynamic
range, and high reproducibility. The current assay measures 813
proteins with 1 pM median LLOQ, 7-log overall dynamic range
(,100 fM–1 mM) with three sample dilutions that span ,2.5 logs,
and 5% median CV. The content of the discovery assay is flexible
and highly scalable, permitting the addition of content as the
target menu grows.
To achieve this performance, we developed a new class of
DNA-based aptamer, the Slow Off-rate Modified Aptamer
(SOMAmer), based on two key innovations: novel chemically-
modified nucleotides that mimic amino acid side chains and new
SELEX strategies to select aptamers with very slow off-rates. With
this technology, our success rate for selecting high-quality
aptamers to target proteins rose from ,30% to .90% today.
To date, we have selected high-quality SOMAmers to .1,000
human proteins.
We demonstrated the utility of our proteomics platform in
biomarker discovery with a study of CKD. We identified 60
proteins that varied significantly between early and late stage
CKD, which could provide a foundation for developing CKD
diagnostics. In a study of more than 500 additional patients at risk
for cardiovascular disease (whose eGFRs were also determined),
we confirmed and extended the biomarkers associated with
reduced filtration in this first CKD study (data not shown). These
results provide further evidence for the validity of these potential
CKD biomarkers, and further validation studies are in progress.
Overall, these results show that our multiplexed proteomics
assay has the requisite reproducibility, sensitivity, and range
for high-content proteomics studies and unbiased biomarker
discovery.
We recognize that there are some limitations to the work
presented here, which only demonstrates the specificity of
SOMAmers for the proteins they were selected against. In order
to further validate and standardize SOMAmer-based measure-
ments, we plan studies with reference standards and other
analytical methods, such as the affinity capture-MS method
presented here. We are also expanding these studies to understand
the specificity of SOMAmers for close homologues and alternate
forms, such as the products of alternative splicing, post-
translational modifications, and proteolytic cleavage. We believe
that SOMAmers will be highly specific, given our previous
experience with highly-specific aptamers including, for example,
the drug Pegaptanib (Macugen) for the treatment age-related
macular degeneration, which binds specifically to VEGF121 but
not VEGF165 [37,38], and an aptamer that distinguishes
theophylline from caffeine, molecules that differ by just one
methyl group [39].
In addition to the work described here, we have conducted
clinical studies with our technology and discovered potential
biomarkers in many areas with unmet medical need including
cancer, cardiovascular conditions, neurological disorders, and
infectious diseases. Frequently, the distributions of biomarker
concentrations among two populations overlap to some degree,
Table 2. Identification by LC-MS/MS of affinity captured proteins.
Protein Accession Protein ID Probability Unique Peptides Unique Spectra Total Spectra %Sequence Coverage
Kallistatin IPI00328609 1 22 31 39 53.6
LBP IPI00032311 1 13 16 22 27.0
TIG2 IPI00019176 0.95 2 2 2 13.5
doi:10.1371/journal.pone.0015004.t002
Aptamer-Based Proteomics
PLoS ONE | www.plosone.org 7 December 2010 | Volume 5 | Issue 12 | e15004
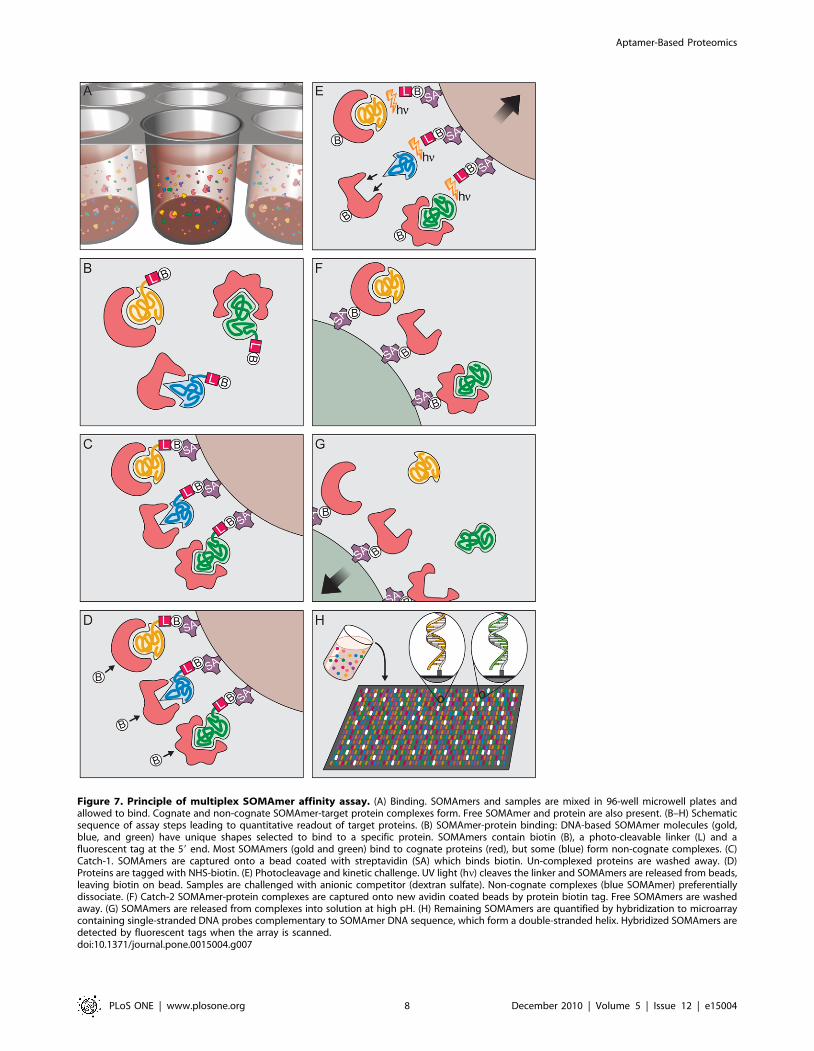
Figure 7. Principle of multiplex SOMAmer affinity assay. (A) Binding. SOMAmers and samples are mixed in 96-well microwell plates andallowed to bind. Cognate and non-cognate SOMAmer-target protein complexes form. Free SOMAmer and protein are also present. (B–H) Schematicsequence of assay steps leading to quantitative readout of target proteins. (B) SOMAmer-protein binding: DNA-based SOMAmer molecules (gold,blue, and green) have unique shapes selected to bind to a specific protein. SOMAmers contain biotin (B), a photo-cleavable linker (L) and afluorescent tag at the 59 end. Most SOMAmers (gold and green) bind to cognate proteins (red), but some (blue) form non-cognate complexes. (C)Catch-1. SOMAmers are captured onto a bead coated with streptavidin (SA) which binds biotin. Un-complexed proteins are washed away. (D)Proteins are tagged with NHS-biotin. (E) Photocleavage and kinetic challenge. UV light (hn) cleaves the linker and SOMAmers are released from beads,leaving biotin on bead. Samples are challenged with anionic competitor (dextran sulfate). Non-cognate complexes (blue SOMAmer) preferentiallydissociate. (F) Catch-2 SOMAmer-protein complexes are captured onto new avidin coated beads by protein biotin tag. Free SOMAmers are washedaway. (G) SOMAmers are released from complexes into solution at high pH. (H) Remaining SOMAmers are quantified by hybridization to microarraycontaining single-stranded DNA probes complementary to SOMAmer DNA sequence, which form a double-stranded helix. Hybridized SOMAmers aredetected by fluorescent tags when the array is scanned.doi:10.1371/journal.pone.0015004.g007
Aptamer-Based Proteomics
PLoS ONE | www.plosone.org 8 December 2010 | Volume 5 | Issue 12 | e15004
which creates the impetus to combine multiple biomarkers to
achieve the most accurate diagnosis. In a related paper, we report
the first large-scale application of this technology to discover and
verify novel biomarkers for lung cancer in one of the most
comprehensive proteomic biomarker studies published to date
[40].
Materials and Methods
Ethics StatementAll studies of human subjects were conducted with written
informed consent. Both the original study of CKD and the
biomarker study reported here were approved by the Institutional
Review Board at Weil Medical College of Cornell University.
SOMAmer development and SELEXSelection methods have been developed for use with poly-His-
tagged, biotinylated, and non-tagged proteins. Many variations on
these protocol have been used to select the .800 SOMAmers for
the proteomic platform, such as alternating selection conditions to
increase stringency for slow off-rate SOMAmers or performing the
equilibrium steps in solution rather than with targets pre-
immobilized. The following protocol is representative and was
used for the selection described for the results shown in Table 1.
Selection methods are further detailed in our patents and
published patent applications [41,42].
Preparation Modified Nucleotides. Modified nucleotides
were manufactured by SomaLogic, Inc. with methods described
by Vaught et al. [24].
Preparation of Candidate Mixtures. Candidate mixtures
were prepared with dATP, dGTP, 5-methyl-dCTP (MedCTP)
and either dTTP or one of three dUTP analogs: 5-
benzylaminocarbonyl-dU (BndU), 5-tryptaminocarbonyl-dU =
TrpdU, and 5-isobutylaminocarbonyl-dU (iBudU) (Figure 1).
Candidate mixtures were prepared by polymerase extension of a
primer annealed to a biotinylated template. Several enzymes were
screened for the ability to incorporate these modified nucleotides,
as well as to amplify a modified template. We used Thermococcus
kodakaraensis (KOD) DNA polymerase for PCR with a slightly
modified buffer, although at low efficiency. Additionally,
conditions have been determined to amplify selected DNA using
a two-step process to avoid potential amplification biases. For each
candidate mixture composition, 4.8 nmol forward PCR primer
and 4 nmol template were combined in 100 mL 1X KOD XL
Figure 8. Proteomic assay standard curves. Each plot shows the standard curve for eight replicates of target spiked into buffer (blue squares).Triplicate measurements from diluted normal serum (red triangles, measured dilution indicated) are plotted onto the standard curve, and thecalculated normal concentrations in 100% serum are shown.doi:10.1371/journal.pone.0015004.g008
Figure 9. Target isoelectric points. Distribution of isoelectric points (pI) of proteins for which SOMAmers have been selected (bars) and of allhuman protein chains in UniProt (dashed line).doi:10.1371/journal.pone.0015004.g009
Aptamer-Based Proteomics
PLoS ONE | www.plosone.org 9 December 2010 | Volume 5 | Issue 12 | e15004
DNA Polymerase Buffer (EMD Chemicals), heated to 95uC for 8
minutes, and cooled on ice. Each 100 mL primer:template mixture
was added to a 400 mL extension reaction containing 1X KOD
DNA Polymerase Buffer, 0.125 U/mL KOD DNA Polymerase,
and 0.5 mM each dATP, MedCTP, dGTP, and dTTP or dUTP
analog, and incubated at 70uC for 30 minutes. Double-stranded
product was captured via the template strand biotins by adding
1 mL streptavidin-coated magnetic beads (MagnaBind
Streptavidin, Pierce, 5 mg/mL in 1 M NaCl +0.05% TWEEN-
20) and incubating at 25uC for 10 minutes with mixing. Beads
were washed three times with 0.75 mL SB1T Buffer (40 mM
HEPES, pH 7.5, 125 mM NaCl, 5 mM KCl, 1 mM MgCl2,
1 mM CaCl2, 0.05% TWEEN-20). The SOMAmer strand was
eluted from the beads with 1.2 mL 20 mM NaOH, neutralized
with 0.3 mL 80 mM HCl, and buffered with 15 mL 1 M HEPES,
pH 7.5. Candidate mixtures were concentrated with a Centricon-
30 to approximately 0.2 mL, and quantified by UV absorbance
spectroscopy.
Immobilization of Target Proteins. Target proteins were
purchased with (His)6 tags from the following vendors: AnaSpec,
APE-Bridgepath ARP, Athens Research and Technology, B-
Bridge International, Inc, Biogenesis, Calzyme, EMD Biosciences,
Enzyme Research Laboratories, Invitrogen, Millipore, Nexomics,
Pepro Tech, Peptide Institute, Inc., ProSci, ProSpec, ProteinX
Lab, Proteome Resources, LLC, Quality Biological, Quidel, R&D
Systems, Research Diagnostics, RZPD GmbH, Sigma-Aldrich,
United States Biological, Upstate Biotechnology, and VWR.
Proteins were immobilized on Co+2-NTA paramagnetic beads
(MyOne TALON beads, Invitrogen). Target proteins were diluted
to 0.2 mg/mL in 0.5 mL B/W Buffer (50 mM Na-phosphate,
pH 8.0, 300 mM NaCl, 0.01% TWEEN-20), and added to
0.5 mL MyOne TALON beads (pre-washed three times with B/
W Buffer and resuspended to 10 mg/mL in B/W Buffer). The
mixture was rotated for 30 minutes at 25uC and stored at 4uC until
use. MyOne TALON beads coated with (His)6 peptide were also
prepared and stored as above. Prior to use, beads were washed 3
times with B/W Buffer, once with SB1T, and resuspended in
SB1T.
SOMAmer Selection. Affinity selections were performed
separately with each candidate mixture, comparing binding
between target protein beads (signal) and (His)6 beads
(background). For each sample, a 0.5 mM candidate DNA
mixture was prepared in 40 mL SB1T. 1 mL of 1 mM
competitor oligo was added to the DNA, along with 10 mL of a
protein competitor mixture (0.1% HSA, 10 mM casein, and
10 mM prothrombin in SB1T).
Binding reactions were performed by adding 50 mL target
protein-coated beads or (His)6-coated beads (5 mg/mL in SB1T)
to the DNA mixture and incubating at 37uC for 15 minutes with
mixing. The DNA solution was removed and the beads were
washed 5 times at 37uC with SB1T containing 0.1 mg/mL herring
sperm DNA (Sigma Aldrich). Unless indicated, all washes were
performed by resuspending the beads in 100 mL wash solution,
mixing for 30 seconds, separating the beads with a magnet, and
removing the wash solution. Bound SOMAmers were eluted from
the beads by adding 100 mL SB1T +2 M Guanidine-HCl and
incubating at 37uC, 5 minutes with mixing. The SOMAmer eluate
was transferred to a new tube after magnetic separation. After the
first two selection rounds, the final two of five target beads washes
were done for 5 minutes instead of 30 seconds.
Primer beads were prepared by immobilizing biotinylated
reverse PCR primer to streptavidin-coated paramagnetic beads
(MyOne Streptavidin, Invitrogen). 5 mL MyOne Streptavidin
beads (10 mg/mL) were washed once with NaClT (5 M NaCl,
0.01% TWEEN-20), and resuspended in 5 mL biotinylated
reverse PCR primer (5 mM in NaClT). The sample was incubated
at 25uC for 15 minutes, washed twice with 5 mL NaClT,
resuspended in 12.5 mL NaClT (4 mg/mL), and stored at 4uC.
Twenty-five mL of primer beads (4 mg/mL in NaClT) were
added to the 100 mL SOMAmer solution in Guanidine Buffer and
incubated 50uC, 15 minutes with mixing. The SOMAmer solution
was removed, and the beads were washed 5 times with SB1T.
SOMAmer was eluted from the beads by adding 85 mL 20 mM
NaOH and incubating at 37uC for 1 minute with mixing. 80 mL
SOMAmer eluate was transferred to a new tube after magnetic
separation, neutralized with 20 mL 80 mM HCl, and buffered
with 1 mL 0.5 M Tris-HCl, pH 7.5.
SOMAmer Amplification and Purification. Selected
SOMAmer DNA was amplified and quantified by QPCR.
48 mL DNA was added to 12 mL QPCR Mix (5X KOD DNA
Polymerase Buffer, 25 mM MgCl2, 10 mM forward PCR primer,
10 mM biotinylated reverse PCR primer, 5X SYBR Green I,
0.125 U/mL KOD DNA Polymerase, and 1 mM each dATP,
dCTP, dGTP, and dTTP) and thermal cycled in an ABI 5700
QPCR instrument (Applied Biosystems) with the following
protocol: 1 cycle of 99.9uC, 15 seconds, 55uC, 10 seconds, 70uC,
30 minutes; 30 cycles of 99.9uC, 15 seconds, 72uC, 1 minute.
Quantification was done with the instrument software and the
number of copies of DNA selected with target beads and (His)6beads were compared to determine signal/background ratios.
Figure 10. Protein target menu gene ontology. Distribution ofmost common gene ontology terms associated with the proteinsmeasured by the current array.doi:10.1371/journal.pone.0015004.g010
Table 3. Population demographics for chronic kidney diseasestudy.
Early stage CKD Late stage CKD
N (total = 42) 11 31
Gender %F (F/M) 33% (4/11) 45% (14/31)
Age (avg. yrs) 62 [51–68] 67 [57–77]
Wt. (avg. kg) 89 [73–98] 88 [75–104]
BMI (avg.) 30.5 [26.6–36.5] 31.8 [27.1–36.6]
eGFR (median) 1 70 [62–97] 25 [7–49]
1Estimated glomerular filtration from creatinine clearance (MDRD formula) ml/min/m2.
doi:10.1371/journal.pone.0015004.t003
Aptamer-Based Proteomics
PLoS ONE | www.plosone.org 10 December 2010 | Volume 5 | Issue 12 | e15004
Following amplification, the PCR product was captured on
MyOne Streptavidin beads via the biotinylated antisense strand.
1.25 mL MyOne Streptavidin beads (10 mg/mL) were washed
twice with 0.5 mL 20 mM NaOH, once with 0.5 mL SB1T,
resuspended in 2.5 mL 3 M NaCl, and stored at 4uC. 25 mL
MyOne Streptavidin beads (4 mg/mL in 3 M NaCl) were added
Figure 11. Biomarker discovery in CKD. Distribution of the false discovery rate (q-value) for the Mann-Whitney test statistic comparing late-stagevs. early-stage CKD for each protein measured (indicated as a bar on the x-axis) ordered arbitrarily.doi:10.1371/journal.pone.0015004.g011
Figure 12. Potential CKD biomarkers. Eleven analytes with the smallest q-values (,3.561027). Protein concentrations (expressed as RFU values)as a function of renal clearance for the eleven best biomarkers of late-stage (red circles) vs. early-stage CKD (blue circles).doi:10.1371/journal.pone.0015004.g012
Aptamer-Based Proteomics
PLoS ONE | www.plosone.org 11 December 2010 | Volume 5 | Issue 12 | e15004
to 50 mL double-stranded QPCR product and incubated at 25uCfor 5 minutes with mixing. The beads were washed once with
SB1T, and the ‘‘sense’’ strand was eluted from the beads by
adding 200 mL 20 mM NaOH and incubating at 37uC for 1
minute with mixing. The eluted strand was discarded and the
beads were washed 3 times with SB1T and once with 16 mM
NaCl.
SOMAmer sense strand was prepared with the appropriate
nucleotide composition by primer extension from the immobilized
antisense strand. The beads were resuspended in 20 mL primer
extension reaction mix (1X KOD DNA Polymerase Buffer,
1.5 mM MgCl2, 5 mM forward PCR primer, 0.125 U/mL KOD
DNA Polymerase, 0.5 mM each dATP, MedCTP, dGTP, and
either dTTP or dUTP analog) and incubated at 68uC for 30
minutes with mixing. The beads were washed 3 times with SB1T,
and the SOMAmer strand was eluted from the beads by adding
85 mL 20 mM NaOH and incubating at 37uC for 1 minute with
mixing. 80 mL SOMAmer eluate was transferred to a new tube
after magnetic separation, neutralized with 20 mL 80 mM HCl,
and buffered with 5 mL 0.1 M HEPES, pH 7.5.
Selection Strategy and Feedback. The relative target
protein concentration of the selection step was lowered each
round in response to the S/B ratio as follows (Eq. 1):
if S=B v 10, P½ � iz1ð Þ~ P½ �i
if 10 v S=B v 100, P½ � iz1ð Þ~ P½ �i=3:2
if S=B w 100, P½ � iz1ð Þ~ P½ �i=10
ð1Þ
where [P] = protein concentration and i = current round
number. Target protein concentration was lowered by adjusting
the mass of target protein beads (and (His) 6 beads) added to the
selection step. After each selection round, the convergence state of
the enriched DNA mixture was determined. 5 mL double-stranded
QPCR product was diluted to 200 mL with 4 mM MgCl2containing 1X SYBR Green I. Samples were overlaid with
75 mL silicone oil and analyzed for convergence as follows.
Nucleic Acid Reassociation Kinetics (C0t) Assay. The
sample was thermal cycled with the following protocol: 3 cycles of
98uC, 1 minute, 85uC, 1 minute; 1 cycle of 93uC, 1 minute, 85uC,
15 minutes. During the 15 minutes at 85uC, fluorescent images
were measured at 5-second intervals. The fluorescence intensity
was plotted as a function of log (time) to evaluate the diversity of
the sequences.
Measurement of Equilibrium Binding Constants. The
equilibrium binding constants of the enriched libraries were
measured using MyOne TALON bead partitioning. Radiolabled
DNA was renatured by heating to 95uC for 3 minutes in SB1T
and slowly cooling to 37uC. Complexes were formed by mixing a
low concentration of DNA (,1610211 M) with a range of
concentrations of target protein (161027 M to 1610–12 M final)
in SB1T and incubating at 37uC. One-twelfth of each reaction was
transferred to a nylon membrane and dried to determine total
counts in each reaction. 25 mg of MyOne TALON beads was
added to the remainder of each reaction and mixed at 37uC for
one minute. Two-thirds of the reaction was then passed through a
MultiScreen HV Plate (Millipore) under vacuum to separate
protein-bound complexes from unbound DNA and washed with
100 mL SB1T. The nylon membrane and MultiScreen HV Plates
were phosphorimaged and the amount of radioactivity in each
sample quantified using a FUJI FLA-3000 (Fujifilm Medical
Systems). The fraction of captured DNA was plotted as a function
of protein concentration and a non-linear curve-fitting algorithm
was used to extract equilibrium binding constants (Kd values) from
the data.
Measurement of Dissociation Rate Constants. The rate
constant for SOMAmer:protein complex dissociation was
determined for each aptamer by measuring the fraction of pre-
formed aptamer:protein complexes that remain bound after
addition of a competitor as a function of time. Radiolabled
SOMAmer was renatured as described above. Approximately
5610–11 M SOMAmer was equilibrated in SB18T (40 mM
HEPES, 100 mM NaCl, 5 mM KCl, 5 mM MgCl2, 0.05%
Tween-20 at pH 7.5) at 37uC with protein at a concentration 10X
greater than the measured Kd value. Samples were then diluted
2X with 40 nM non-labeled SOMAmer or 0.3 mM dextran
sulfate in SB18T at various time points. Complexes were
partitioned to separate free aptamer from protein:aptamer
complexes. The type of partitioning was dependent upon the
protein used since not all proteins bind to the same type of
partitioning resin. For LBP and Histone H1.2, Zorbax PSM-300A
(Agilent Technologies) resin was used for partitioning; for
Kallistatin, MyOne TALON beads were used; for biotinylated-
Table 4. Top 11 Potential CKD Biomarkers1.
Target Protein p-value q-value Mol. Mass (kDa)
b2-Microglobulin 1.261029 8.061028 11.7
FSTL3 1.261029 8.061028 25.0
Pleotrophin 1.261029 8.061028 15.3
TNF sR-I {, * 1.261029 8.061028 21.2
Factor D 4.861029 2.161027 24.4
IL-15 Ra {, { 4.861029 2.161027 25.0
MMP-7 8.461029 3.261027 19.1
Angiopoietin-2 1.461028 3.561027 54.9
Cystatin C 1.461028 3.561027 13.3
HCC-1{ 1.461028 3.561027 8.7
URB { 1.461028 3.561027 105.7
1Based on q-value ranking.{Smaller isoforms also exist. For example, URB has a 10.3 kDa isoform.*Extracellular domain comprising amino acids 22–211.{Extracellular domain is 18.4 kDa.doi:10.1371/journal.pone.0015004.t004
Figure 13. Comparison of a protein’s molecular mass and theprobability that it is a CKD biomarker (q-value (p-valuecorrected for false discovery rate)).doi:10.1371/journal.pone.0015004.g013
Aptamer-Based Proteomics
PLoS ONE | www.plosone.org 12 December 2010 | Volume 5 | Issue 12 | e15004
TIG2, MyOne Streptavidin beads were used. Complexes were
captured on the appropriate resin, and the sample was passed
through a MultiScreen HV Plate under vacuum. The samples
were washed with SB18T. The MultiScreen HV Plates were
phosphorimaged and the amount of radioactivity in each sample
quantified using a FUJI FLA-3000. The fraction of complex
remaining was plotted as a function of time, and the dissociation
rate constant was determined by fitting the data to an analytic
expression for bimolecular dissociation kinetics using non-linear
regression.
Affinity Capture Assay. Not all complexes are able to be
captured in the ‘‘Catch-3’’ step of the affinity capture assay
(Figure 5), and therefore analyzed by PAGE, because the 39 end of
the SOMAmer is sometimes involved in its structure or interaction
with the target. Additional affinity capture examples for the subset
of the CKD-related targets whose complexes can be captured on
‘‘Catch-3’’ beads are shown in Figure 5.
50% plasma samples were prepared by diluting ethylene
diamine tetraacetic acid (EDTA)-plasma 2X in SB18T with
2 mM Z-Block_2 (the modified nucleotide sequence (AC-BnBn)7-
AC). The plasma spike samples were prepared by diluting 500 ng
protein with the 50% plasma in SB17T (SB18T with 1 mM
EDTA) with 4-(2-Aminoethyl) benzenesulfonyl fluoride hydro-
chloride (AEBSF) and ethylene glycol tetraacetic acid (EGTA).
The plasma samples were prepared by diluting the 50% plasma in
SB17T with AEBSF and EGTA. The buffer spike samples were
prepared by diluting 500 ng protein in SB17T with AEBSF and
EGTA. These samples were combined with 10 pmoles of
SOMAmer to give final concentrations of 10% plasma, 2 mM
AEBSF, 0.5 mM EGTA, and 100 nM SOMAmer. Complexes
were formed by incubating at 37uC for 45 minutes. 50 mL of a
20% slurry of Streptavidin agarose beads (ThermoFisher Scien-
tific) was added to each sample and shaken for 10 minutes at room
temperature. The samples were added to a MultiScreen HV Plate
to perform washes under vacuum filtration. Each sample was
washed one time quickly with 200 mL of SB17T, one time for one
minute with 200 mL of 100 mM biotin in SB17T with shaking, one
time with 200 mL of SB17T for one minute with shaking, and one
time with 200 mL of SB17T for nine minutes with shaking.
Proteins in the sample were labeled with both biotin and a
fluorophore by incubating each sample in 100 mL of 1 mM EZ
Link NHS-PEO4-biotin (Pierce), 0.25 mM NHS-Alexa-647 (In-
vitrogen) in SB17T for five minutes with shaking. Each sample was
washed one time with 200 mL of 20 mM glycine in SB17T and
five times with 200 mL of SB17T, shaking each wash for one
minute. The final wash was removed using centrifugation at 1000
relative centrifugal force (RCF) for 30 seconds. The beads were
resuspended with 100 mL of SB17T. SOMAmers (complexed and
free) were released from the beads by exposure under a BlackRay
light source (UVP XX-Series Bench Lamps, 365 nm) for ten
minutes with shaking. The samples were spun out of the plate by
centrifugation at 1000 RCF for 30 seconds. 10 mL of each sample
was removed and reserved as ‘‘Catch-1 eluate’’ for SDS-PAGE
analysis. The remainder of the samples was captured through the
biotinylated proteins by adding 20 mL of a 20% slurry of
monomeric Avidin beads and shaking for ten minutes. The beads
were transferred to a MultiScreen HV Plate and washed four times
with 100 mL of SB17T for one minute with shaking. The final
wash was removed using centrifugation at 1000 RCF for 30
seconds. Proteins were eluted from the beads by incubating each
sample with 100 mL of 2 mM biotin in SB17T for five minutes
with shaking. Each eluate was transferred to 0.4 mg MyOne
Streptavidin beads with a bound biotinylated-primer complemen-
tary to the 39 fixed region of the SOMAmer. The samples were
incubated for five minutes with shaking to anneal the bead-bound
fixed region to the SOMAmer complexes. Each sample was
washed two times with 100 mL of 1XSB17T for one minute each
with shaking and one time with 100 mL of 1XSB19T (5 mM
HEPES, 100 mM NaCl, 5 mM KCl, 5 mM MgCl2, 1 mM
EDTA, 0.05% Tween-20, pH 7.5) for one minute with shaking, all
by magnetic separation. The complexes were eluted by incubating
with 45 mL of 20 mM NaOH for two minutes with shaking. 40 mL
of each eluate was added to 10 mL of 80 mM HCl with 0.05%
Tween-20 in a new plate. 10 mL of each sample was removed and
reserved as ‘‘Catch-2 aptamer-bound eluate’’ for SDS-PAGE
analysis. Gel samples were run on NuPAGE 4–12% Bis Tris
Glycine gels (Invitrogen) under reducing and denaturing condi-
tions according to the manufacturer’s directions. Gels were imaged
on an Alpha Innotech FluorChem Q scanner in the Cy5 channel
to image the proteins.
LC-MS/MS Protein IdentificationTandem mass spectra were collected at NextGen Sciences.
Scaffold (Proteome Software) was used to probabilistically validate
protein identifications derived from MS/MS sequencing results
using the X!Tandem [43] ProteinProphet computer algorithms
[44].
Database searching. All tandem MS/MS samples were
analyzed using Mascot (Matrix Science; version Mascot). Mascot
was set up to search the ipi.HUMAN.v3.53_plusREV database
(147698 entries) assuming the digestion enzyme trypsin. Mascot
was searched with a fragment ion mass tolerance of 0.50 Da and a
parent ion tolerance of 5.0 PPM. Iodoacetamide derivative of
cysteine was specified in Mascot as a fixed modification. S-
carbamoylmethylcysteine cyclization (N-terminus) of the n-
terminus, deamidation of asparagine, oxidation of methionine
and acetylation of the n-terminus were specified in Mascot as
variable modifications.
Criteria for protein identification. Scaffold (version
Scaffold_2_04_01, Proteome Software Inc) was used to validate
MS/MS based peptide and protein identifications. Peptide
identifications were accepted if they could be established at
greater than 50.0% probability as specified by the Peptide Prophet
algorithm [45]. Protein identifications were accepted if they could
be established at greater than 90.0% probability and contained at
least 2 identified peptides. Protein probabilities were assigned by
the Protein Prophet algorithm [44]. Proteins that contained similar
peptides and could not be differentiated based on MS/MS analysis
alone were grouped to satisfy the principles of parsimony.
Proteomic Affinity Assay MethodAll steps of the proteomic affinity assay were performed at room
temperature unless otherwise indicated.
Sample thawing and plating. Aliquots of 100% serum or
EDTA- plasma, stored at 280uC, were thawed by incubating in a
25uC water bath for ten minutes. After thawing the samples were
stored on ice during mixing and prior to sample dilution. Samples
were mixed by gentle vortexing (setting # 4 on Vortex Genie,
Scientific Industries) for 8 seconds. A 20% sample solution was
prepared by transferring 16 mL of thawed sample into 96-well
plates (Hybaid Omnitube 0.3 mL, ThermoFisher Scientific)
containing 64 mL per well of the appropriate sample diluent at
4uC. Sample diluent for serum was 0.8x SB17 with 0.6 mM
MgCl2, 2 mM EGTA, 2 mM Z-Block_2, 0.05% Tween and for
EDTA-plasma was 0.8x SB18 with 0.8 mM MgCl2, 2 mM
EGTA, 2 mM Z-Block_2, 0.05% Tween. This plate was stored
on ice until the next sample dilution steps were initiated.
Aptamer-Based Proteomics
PLoS ONE | www.plosone.org 13 December 2010 | Volume 5 | Issue 12 | e15004
Preparation of 10%, 1% and 0.03% SOMAmer
Solutions. SOMAmers were grouped into three unique mixes.
The placing of a SOMAmer within a mix was empirically
determined by assaying a dilution series of serum or plasma with
each SOMAmer and identifying the sample dilution that gave the
largest linear range of signal. The segregation of SOMAmers and
mixing with different dilutions of sample (10%, 1% or 0.03%)
allow the assay to span a 107-fold range of protein concentration.
The composition of the custom SOMAmer mixes was slightly
different between plasma and serum as expected due to variation
in protein composition of these two media. The custom stock
SOMAmer solutions for 10%, 1% and 0.03% serum and plasma
were prepared and stored at 8x concentration in SB17T.
For each assay run, the three 8x SOMAmer solutions were
diluted separately 1:4 into SB17T to achieve 2x concentration.
Each diluted SOMAmer master mix was heated to 95uC for five
minutes and then to 37uC for 15 minutes. 55 mL of each 2x
SOMAmer mix was manually pipetted into a 96-well plate
resulting in three plates with 10%, 1% or 0.03% SOMAmer
mixes. After mixing with sample, the final individual SOMAmer
concentration ranged from 0.25–4 nM for serum, 0.5 nM for
plasma.
Equilibration. A 2% sample plate was prepared by diluting
the 20% sample 1:10 into SB17T using the Beckman Coulter
Biomek FxP (Beckman Coulter). A 0.06% sample plate was
prepared by diluting the 2% sample plate 1:31 into SB17T. The
three sample dilutions were then transferred to their respective
SOMAmer solutions by adding 55 mL of the sample to 55 mL of
the appropriate 2x SOMAmer mix. The plates were sealed with a
foil seal (Microseal ‘F’ Foil, Bio-Rad) and incubated at 37uC for
3.5 hours.
Preparation of Catch-1 Bead Plates. 133.3 mL of a 7.5%
Streptavidin-agarose bead slurry in SB17T was added to each well
of three pre-washed 0.45 um filter plates. Each well of beads was
washed once with 200 mL SB17T using vacuum filtration to
remove the wash and then resuspended in 200 mL SB17T.
Catch-1 Bead Capture. All subsequent steps were
performed by the Beckman Coulter Biomek FxP robot unless
otherwise noted. After the 3.5 hour equilibration, 100 mL of the
10%, 1% and 0.03% equilibration binding reactions was
transferred to their respective Catch-1 Streptavidin agarose filter
plates and incubated with shaking for ten minutes. Unbound
solution was removed via vacuum filtration. Each set of Catch-1
beads was washed with 190 mL of 100 mM biotin in SB17T and
then 190 mL of SB17T using vacuum filtration to remove the
wash. 190 mL SB17T was added to each well in the Catch-1 plates
and incubated with shaking for ten minutes at 25uC. The wash
was removed via vacuum filtration and the bottom of the filter
plates blotted to remove droplets using the on-deck blot station.
Biotinylation of Proteins. An aliquot of 100 mM NHS-
PEO4-biotin in DMSO was thawed at 37uC for six minutes and
diluted to 1 mM with SB17T at pH 7.25. 100 mL of the NHS-
PEO4-biotin was added to each well of each Catch-1 filter plate
and incubated with shaking for five minutes. Each biotinylation
reaction was quenched by adding 150 mL of 20 mM glycine in
SB17T to the Catch-1 plates with the NHS-PEO4-biotin. Plates
were incubated for one minute with shaking, vacuum filtrated, and
190 mL 20 mM glycine SB17T was added to each well in the
plate. The plates were incubated for one minute, shaking before
removal by vacuum filtration. 190 mL of SB17T was added to
each well and removed by vacuum filtration. The wells of the
Catch-1 plates were subsequently washed three times by adding
190 mL SB17T, incubating for one minute with shaking followed
by vacuum filtration. After the last wash the plates were
centrifuged at 1000 rpm for one minute over a 1 mL deep-well
plate to remove extraneous volume before elution. Centrifugation
was performed off deck.
Kinetic Challenge and Photo-Cleavage. 85 mL of 10 mM
dextran sulfate in SB17T was added to each well of the filter
plates. The filter plates were placed onto a Thermal Shaker
(Eppendorf) under a BlackRay light source and irradiated for ten
minutes with shaking. The photo-cleaved solutions were
sequentially eluted from each Catch-1 plate into a common
deep well plate by centrifugation at 1000 rpm for one minute
each.
Catch-2 Bead Capture. In bulk, MyOne-Streptavidin C1
beads were washed two times for 5 minutes each with equal
volume of 20 mM NaOH and three times with an equal volume of
SB17T. Beads were resuspended in SB17T to a concentration of
10 mg/mL. After resuspension, 50 mL of this solution was
manually pipetted into each well of a 96-well plate and stored at
4uC until Catch-2. During Catch-2, the wash supernatant was
removed via magnetic separation. All of the photo-cleaved eluate
was pipetted onto the MyOne magnetic beads and incubated with
shaking at 25uC for five minutes. The supernatant was removed
from the MyOne beads via magnetic separation and 75 mL of
SB17T was transferred to each well. The plate was mixed for one
minute at 37uC with shaking and then 75 mL of 60% glycerol (in
SB17T) at 37uC was transferred to each well. The plate was mixed
for another minute at 37uC with shaking. The wash was removed
via magnetic separation. These washes were repeated two more
times. After removal of the third glycerol wash from the MyOne
beads, 150 mL of SB17T was added to each well and the plates
incubated at 37uC with shaking for one minute before removal by
magnetic separation. The MyOne beads were washed a final time
using 150 mL SB19T with incubation for one minute, prior to
magnetic separation.
Catch-2 Bead Elution and Neutralization. SOMAmers
were eluted from MyOne beads by incubating each well of beads
with 105 mL of 100 mM CAPSO pH 10, 1 M NaCl, 0.05%
Tween with shaking for five minutes. 90 mL of each eluate was
transferred during magnetic separation to a new 96-well plate
containing 10 mL of 500 mM HCl, 500 mM HEPES, 0.05%
Tween-20, pH 7.5.
Hybridization. 20 mL of each neutralized Catch-2 eluate
was transferred to a new 96-well plate and 5 mL of 10x Agilent
Block (Oligo aCGH/ChIP-on-chip Hybridization Kit, Large
Volume, Agilent Technologies 5188–5380), containing a 10x
spike of hybridization controls (10 Cy3 SOMAmers) was added to
each well. After removing the plate from the robot, 25 mL of 2x
Agilent Hybridization buffer (Oligo aCGH/ChIP-on-chip
Hybridization Kit, Agilent Technologies) was manually pipetted
to the each well of the plate containing the neutralized samples
and blocking buffer. 40 mL of this solution was manually pipetted
into each ‘‘well’’ of the hybridization gasket slide (Hybridization
Gasket Slide - 8 microarrays per slide format, Agilent
Technologies). Custom Agilent microarray slides containing 10
probes per array complementary to 40 nucleotide selected region
of each SOMAmer with a 20x dT linker were placed onto the
gasket slides according to the manufacturer’s protocol. Each
assembly (Hybridization Chamber Kit - SureHyb enabled, Agilent
Technologies) was tightly clamped and loaded into a hybridization
oven for 19 hours at 60uC rotating at 20 rpm.
Post-Hybridization Washing. Approximately 400 mL
Wash Buffer 1 (Oligo aCGH/ChIP-on-chip Wash Buffer 1,
Agilent Technologies) was placed into each of two separate glass
staining dishes. Six of the twelve slide/gasket assemblies were
sequentially disassembled into the first staining dish containing
Aptamer-Based Proteomics
PLoS ONE | www.plosone.org 14 December 2010 | Volume 5 | Issue 12 | e15004
Wash Buffer 1. Once disassembled, the slide was quickly
transferred into a slide rack in a second staining dish containing
Wash Buffer 1. The slides were incubated for five minutes in Wash
Buffer 1 with mixing via magnetic stir bar. The slide rack was then
transferred to the 37uC Wash Buffer 2 (Oligo aCGH/ChIP-on-
chip Wash Buffer 2, Agilent Technologies) and allowed to
incubate for five minutes with stirring. The slide rack was
transferred to a fourth staining dish containing acetonitrile and
incubated for five minutes with stirring.
Microarray Imaging. The microarray slides were imaged
with a microarray scanner (Agilent G2565CA Microarray Scanner
System, Agilent Technologies) in the Cy3-channel at 5 mm
resolution at 100% PMT setting and the XRD option enabled
at 0.05. The resulting tiff images were processed using Agilent
feature extraction software version 10.5.1.1 with the GE1_105_
Dec08 protocol.
Serum and Plasma Reproducibility StudiesFor each plate, five aliquots of plasma or serum from 18
individuals were thawed and plated as described below. Six wells
containing only buffer were run on every plate. Serum and plasma
samples were run on separate plates because they require slightly
different buffers as indicated above. Three plates of each sample
type were run over the course of several days and included using
different lots of buffers and other reagents that might be expected
to change within a large study.
Limits of Quantification (LOQ) ExperimentFor the LOQ experiments, four different sets of protein mixes
were prepared for each of the three SOMAmer mixes, 10%, 1%
or 0.03%, for a total of 12 mixes and 356 proteins. The proteins
for each mix were chosen to avoid combining known protein
binding partners and known protease-substrate pairs. The proteins
were diluted into SB17T containing 2 mM Z-Block_2 so that each
protein was at a final concentration of 20 nM. The protein
solutions were serially diluted 15.8-fold into SB17T for a total of
six points (lowest concentration: 20.3 fM). All of the protein
preparation was maintained on ice. Eight replicate protein
titrations per set were pipetted into 96-well plates.
Precision profiles. The coefficient of variation (CV), the
standard deviation (s) of the calculated concentration divided by
the concentration, is typically determined for computing LOQs. As
analyte concentration approaches zero, the assay CV diverges.
Similarly, for large analyte concentrations near the assay plateau,
small changes in assay signal can give rise to large changes in
calculated concentration, leading again to a divergence in CVs. In
between these two divergences in CVs lies a concentration range for
which the assay measurements have CVs of a desired limit or less.
We set this limit at 20% CV and determined the upper and
lower LOQs as those high and low concentrations equal to 20%
CV. Standard curves were computed by averaging the relative
fluorescent units (RFUs) for eight replicate measurements at each
concentration. A standard four parameter Hill model (Eq. 2) in log
transformed RFU was used to fit the dose-response curves, where
x denotes an analyte concentration.
log RFU~ log RFUplateau{ log RFUbaseline
� � xa
xazKa
z log RFUbaseline
ð2Þ
Two distinct approaches were used to compute precision profiles
from these data. The first approach modeled the standard
deviation for calculated concentrations sx, obtained by averaging
the eight replicates at each concentration, with a quadratic
function from which the precision profile was directly obtained
(Figure S3). The second approach is to model the standard
deviation of the assay response slogRFU with a quadratic function
and then use the dose-response function to compute the variance
in concentration from the response variance. This is not easily
accomplished for the dose-response function used here but
linearizing the function at a concentration x leads to the following
simplification (Eq. 3 and 4).
sx~slog RFU
L log RFU
Lx
� � ð3Þ
L log RFU
Lx
� �~ log RFUplateau{ log RFUbaseline
� � axa{1Ka
xazKað Þ2ð4Þ
Typically, the assay CV in response units (slogRFU/logRFU) is fairly
constant so using a quadratic function to model sRFU as a function
of concentration should suffice.
We produced the full precision profile for each SOMAmer
tested using both numerical approaches outlined above (Figure
S3). Both methods give essentially the same result in this case for
LLOQ and ULOQ. This particular analyte shows a remarkable
five-log quantification range at a 20% CV cutoff with an LLOQ of
0.4–0.6 pM and a ULOQ of 40–50 nM. In general there is good
agreement between the two different methods for computing
precision profiles, and the assay response slogRFU method was used
to calculate the values reported in Table S2.
Chronic Kidney DiseaseCKD serum samples were collected by the Rogosin Institute for
the clinical study entitled ‘‘Quantification of inflammatory and
immune mediators of CKD in patient serum, whole blood and
urine: Correlation with CKD disease stage progression’’. Both the
original study and the biomarker study reported here were
approved by the Institutional Review Board at Weil Medical
College of Cornell University. The clinical study design specified
that samples be collected from 25 healthy controls with no renal
disease and 25 subjects at each stage of CKD (1–5) for a total of
150 subjects. Our biomarker study included serum samples from
42 subjects that were available at the time this study was
conducted. Table 3 summarizes the population demographics.
The groups are well matched by gender, ethnicity, age, weight,
and body mass index. Renal function, measured by the estimated
glomerular filtration rate (eGFR, calculated with the MDRD
formula for creatinine clearance [46]), is substantially different in
the two groups (Table 3).
Clinical Data ProcessingAssay Normalization. Assay normalization was performed to
reduce signal variation potentially introduced during the assay. Each
sample in a study was normalized using a set of SOMAmers that
have the lowest overall relative signal variation across all samples
within a study. For each normalization SOMAmer, its median value
was calculated from all samples in the study, and together these
median values were used to calculate a scaling factor for each
individual sample. The scaling factor was the mean of a series of
values, one for each normalization SOMAmer, calculated as the
sample signal divided by the median signal for the study. When
Aptamer-Based Proteomics
PLoS ONE | www.plosone.org 15 December 2010 | Volume 5 | Issue 12 | e15004
applied to a sample, this procedure brings the signals corresponding
to SOMAmers in the normalization set closer to the median values
across the assay, and reduces the observed variation between
replicate samples for all SOMAmers. Because the assay splits each
clinical sample into three dilutions, assay normalization was
performed separately on the three SOMAmer groups
corresponding to the 10%, 1%, and 0.1% dilutions. Dilution
normalization applies the same constant factor to every signal in that
dilution from any given sample. This factor varied between samples
in the range from 0.8 to 1.2, and was typically within 10% of unity.Between-run Calibration. To compare samples between
assay runs with slightly different conditions, we have applied
calibration to the individual SOMAmers signals. For this we apply
a multiplicative correction factor specific to each SOMAmer, but
invariant with respect to the sample (in contrast to normalization
in which the factor was specific to the sample and did not vary
from SOMAmer to SOMAmer within a sample). To calculate the
calibration constant for each SOMAmer, we measure a set of eight
calibrator samples derived from blood from the same individual in
each sample set. From these calibrator sample measurements, we
can standardize the signals from a sample within one run by
applying the calibration coefficient for each SOMAmer that scales
the median calibrator signal of that aptamer to a reference
standard for that aptamer.
Supporting Information
Figure S1 Reproducibility of measurements in plasmaand serum. The cumulative distribution function (cdf) of intra-
run coefficients of variation (CVs) and inter-run CVs for plasma
and serum are shown for the three dilutions mixes: 10% (red), 1%
(green), and 0.03% (blue).
(TIF)
Figure S2 Precision profile for a2-Antiplasmin. A.Representative dose-response curve calculated with a four-
parameter fit to average concentration (blue circles) of eight
replicate protein measurements (red circles). B. Standard
deviation sx of calculated concentration (blue circles) with
quadratic fit (solid line) and 95% confidence (dashed lines). C.Standard deviation of assay response shown as slogRFU (red circles)
with quadratic fit (solid line) and the 95% confidence (dashed
lines). D. Precision profiles for assay response computed by
modeling sx (blue) and slogRFU (red).
(TIF)
Figure S3 Cumulative probability functions (cdfs) forlimits of quantification computed from precision for 356
analytes measured in buffer. A. Distribution of LLOQs;
median 0.9 pM; inter-quartile range 0.3 pM–3.9 pM; lowest
10 fM. B. Distribution of ULOQs; median 1.5 nM; inter-quartile
range 0.7 nM–4.5 nM. C. Distribution of log ROQ; median
quantification range ,3 logs.
(TIF)
Figure S4 Comparison of LLOQ, ULOQ, and ROQ for28 analytes measured in buffer and plasma. All data were
computed by modeling slogRFU.
(TIF)
Table S1 List of the 813 proteins measured in the current
version of the assay and the subset of 614 proteins measured in the
CKD study.
(DOC)
Table S2 List of limits of quantification for 356 representative
proteins measured in buffer.
(DOC)
Table S3 List of measured limits of quantification for proteins
spiked into buffer and plasma.
(DOC)
Table S4 List of 60 proteins identified that varied between early
and late stage CKD with a q-value of 4.261024.
(DOC)
Acknowledgments
We thank all our colleagues in the genesis and evolution of aptamer science
and developing aptamer-based biotechnology over the past decades. They
contributed immeasurably with countless insights about aptamers and the
nature of biology. We especially thank past and present colleagues at the
University of Colorado, NeXstar Pharmaceuticals, and SomaLogic. We
also thank the following individuals for providing proteins: Fanqing Chen,
Lawrence Berkeley National Labs; Brian Fox, University of Wisconsin;
Michael Gelb, University of Washington; Tsuotmu Ohta, National Cancer
Center of Japan; Yves Pommier and Christoph Rader, National Cancer
Institute of the United States; Dylan Taatjes, University of Colorado.
Author Contributions
All authors contributed extensively to the work presented in this paper.
Provided CKD samples and critically evaluated results: DL TP. Wrote the
manuscript with input from the entire team: NJ JJW SKW DZ.
References
1. Zichi D, Eaton B, Singer B, Gold L (2008) Proteomics and diagnostics: Let’s Get
Specific, again. Curr Opin Chem Biol 12: 78–85.
2. Pan S, Aebersold R, Chen R, Rush J, Goodlett DR, et al. (2009) Mass
spectrometry based targeted protein quantification: methods and applications.
J Proteome Res 8: 787–797.
3. Service RF (2008) Proteomics. Proteomics ponders prime time. Science 321:
1758–1761.
4. Liotta L, Petricoin F (2010) Mass Spectrometry-Based Protein Biomarker
Discovery and Measurement: Sensitivity is the Greatest Hurdle. Clinical
Proteomics 6: 4–5.
5. Silberring J, Ciborowski P (2010) Biomarker discovery and clinical proteomics.
Trends Analyt Chem 29: 128.
6. Mitchell P (2010) Proteomics retrenches. Nat Biotechnol 28: 665–670.
7. Bell AW, Deutsch EW, Au CE, Kearney RE, Beavis R, et al. (2009) A HUPO
test sample study reveals common problems in mass spectrometry-based
proteomics. Nat Methods.
8. Aebersold R (2009) A stress test for mass spectrometry-based proteomics. Nat
Methods 6: 411–412.
9. Addona TA, Abbatiello SE, Schilling B, Skates SJ, Mani DR, et al. (2009) Multi-
site assessment of the precision and reproducibility of multiple reaction monitoring-
based measurements of proteins in plasma. Nat Biotechnol 27: 633–641.
10. Fredriksson S, Dixon W, Ji H, Koong AC, Mindrinos M, et al. (2007)
Multiplexed protein detection by proximity ligation for cancer biomarker
validation. Nat Methods 4: 327–329.
11. Schweitzer B, Roberts S, Grimwade B, Shao W, Wang M, et al. (2002)
Multiplexed protein profiling on microarrays by rolling-circle amplification. Nat
Biotechnol 20: 359–365.
12. Borrebaeck C, Wingren C (2007) High-throughput proteomics using antibody
microarrays: an update. Expert Rev Mol Diagn 7: 673–686.
13. Ellington AD, Szostak JW (1990) In vitro selection of RNA molecules that bind
specific ligands. Nature 346: 818–822.
14. Tuerk C, Gold L (1990) Systematic evolution of ligands by exponential enrich-
ment: RNA ligands to bacteriophage T4 DNA polymerase. Science 249: 505–510.
15. Gragoudas ES, Adamis AP, Cunningham ET, Jr., Feinsod M, Guyer DR (2004)
Pegaptanib for neovascular age-related macular degeneration. N Engl J Med
351: 2805–2816.
Aptamer-Based Proteomics
PLoS ONE | www.plosone.org 16 December 2010 | Volume 5 | Issue 12 | e15004
16. Tarasow TM, Tarasow SL, Eaton BE (1997) RNA-catalysed carbon-carbon
bond formation. Nature 389: 54–57.17. Brody EN, Gold L (2000) Aptamers as therapeutic and diagnostic agents.
J Biotechnol 74: 5–13.
18. Famulok M, Hartig JS, Mayer G (2007) Functional aptamers and aptazymes inbiotechnology, diagnostics, and therapy. Chem Rev 107: 3715–3743.
19. Gold L (1995) Oligonucleotides as Research, Diagnostic, and TherapeuticAgents. J Biol Chem 270: 13581–13584.
20. Binz HK, Amstutz P, Pluckthun A (2005) Engineering novel binding proteins
from nonimmunoglobulin domains. Nat Biotechnol 23: 1257–1268.21. Eaton BE (1997) The joys of in vitro selection: chemically dressing
oligonucleotides to satiate protein targets. Curr Opin Chem Biol 1: 10–16.22. Dewey T, Mundt A, Crouch G, Zyniewski M, Eaton B (1995) New Uridine
Derivatives for Systematic Evolution of RNA Ligands by ExponentialEnrichment. J Am Chem Soc 117: 8474–8475.
23. Gugliotti LA, Feldheim DL, Eaton BE (2004) RNA-mediated metal-metal bond
formation in the synthesis of hexagonal palladium nanoparticles. Science 304:850–852.
24. Vaught JD, Bock C, Carter J, Fitzwater T, Otis M, et al. (2010) Expanding thechemistry of DNA for in vitro selection. J Am Chem Soc 132: 4141–4151.
25. Hopfield JJ (1974) Kinetic proofreading: a new mechanism for reducing errors in
biosynthetic processes requiring high specificity. Proc Natl Acad Sci USA 71:4135–4139.
26. Ninio J (1975) Kinetic amplification of enzyme discrimination. Biochimie 57:587–595.
27. Vaught JD, Dewey T, Eaton BE (2004) T7 RNA polymerase transcription with5-position modified UTP derivatives. J Am Chem Soc 126: 11231–11237.
28. Levey AS, Atkins R, Coresh J, Cohen EP, Collins AJ, et al. (2007) Chronic
kidney disease as a global public health problem: approaches and initiatives - aposition statement from Kidney Disease Improving Global Outcomes. Kidney
Int 72: 247–259.29. Chaudhary K, Phadke G, Nistala R, Weidmeyer CE, McFarlane SI, et al. (2010)
The emerging role of biomarkers in diabetic and hypertensive chronic kidney
disease. Curr Diab Rep 10: 37–42.30. Giannelli SV, Patel KV, Windham BG, Pizzarelli F, Ferrucci L, et al. (2007)
Magnitude of underascertainment of impaired kidney function in older adultswith normal serum creatinine. J Am Geriatr Soc 55: 816–823.
31. Nickolas TL, Barasch J, Devarajan P (2008) Biomarkers in acute and chronickidney disease. Curr Opin Nephrol Hypertens 17: 127–132.
32. Venturoli D, Rippe B (2005) Ficoll and dextran vs. globular proteins as probes
for testing glomerular permselectivity: effects of molecular size, shape, charge,and deformability. Am J Physiol Renal Physiol 288: F605–613.
33. Stevens LA, Coresh J, Greene T, Levey AS (2006) Assessing kidney function–
measured and estimated glomerular filtration rate. N Engl J Med 354:
2473–2483.
34. van Riemsdijk-van Overbeeke IC, Baan CC, Hesse CJ, Loonen EH,
Niesters HG, et al. (2000) TNF-alpha: mRNA, plasma protein levels and
soluble receptors in patients on chronic hemodialysis, on CAPD and with end-
stage renal failure. Clin Nephrol 53: 115–123.
35. Pascual M, Steiger G, Estreicher J, Macon K, Volanakis JE, et al. (1988)
Metabolism of complement factor D in renal failure. Kidney Int 34: 529–536.
36. Vanholder R, Van Laecke S, Glorieux G (2008) The middle-molecule
hypothesis 30 years after: lost and rediscovered in the universe of uremic
toxicity? J Nephrol 21: 146–160.
37. Doggrell SA (2005) Pegaptanib: the first antiangiogenic agent approved for
neovascular macular degeneration. Expert Opin Pharmaco 6: 1421–1423.
38. Ruckman J, Green LS, Beeson J, Waugh S, Gillette WL, et al. (1998) 29-
Fluoropyrimidine RNA-based aptamers to the 165-amino acid form of vascular
endothelial growth factor (VEGF165). Inhibition of receptor binding and
VEGF-induced vascular permeability through interactions requiring the exon 7-
encoded domain. J Biol Chem 273: 20556–20567.
39. Jenison RD, Gill SC, Pardi A, Polisky B (1994) High-resolution molecular
discrimination by RNA. Science 263: 1425–1429.
40. Ostroff RM, Bigbee WL, Franklin W, Gold L, Mehan M, et al. (2010) Unlocking
biomarker discovery: Large scale use of aptamer proteomic technology for early
detection of lung cancer. PLoS ONE 5(11): e15004. doi: 10.1371/journal.-
pone.0015003.
41. Schneider D, Nieuwlandt D, Eaton B, Stanton M, Gupta S, et al. (2009)
Multiplexed Analyses of Test Samples. US2009/0042206. USA.
42. Zichi D, Wilcox SK, Bock C, Schneider DJ, Eaton B, et al. (2009) Method for
Generating Aptamers with Improved Off-Rates. US2009/0004667. USA.
43. Craig R, Beavis RC (2003) A method for reducing the time required to match
protein sequences with tandem mass spectra. Rapid Commun Mass Spectrom
17: 2310–2316.
44. Nesvizhskii AI, Keller A, Kolker E, Aebersold R (2003) A statistical model for
identifying proteins by tandem mass spectrometry. Anal Chem 75: 4646–4658.
45. Keller A, Nesvizhskii AI, Kolker E, Aebersold R (2002) Empirical statistical
model to estimate the accuracy of peptide identifications made by MS/MS and
database search. Anal Chem 74: 5383–5392.
46. Levey AS, Bosch JP, Lewis JB, Greene T, Rogers N, et al. (1999) A more
accurate method to estimate glomerular filtration rate from serum creatinine: a
new prediction equation. Modification of Diet in Renal Disease Study Group.
Ann Intern Med 130: 461–470.
Aptamer-Based Proteomics
PLoS ONE | www.plosone.org 17 December 2010 | Volume 5 | Issue 12 | e15004
Recommended


