
20th Canadian Hydrotechnical Conference le 20è Congrès canadien d’hydrotechnique
Ottawa, Ontario
June 14-17, 2011 / 14 au 17 juin 2011
HY-062-1
Dam Breaching Experiments Using Scale Series
M. Al-Riffai1, I. Nistor1 and T. Bartens2 1Department of Civil Engineering, University of Ottawa, Ottawa, Ontario, Canada 2Leichtweiß-Institute for Hydraulic Engineering and Water Resources, Technische Universität Braunschweig, Braunschweig, Germany
Abstract: Predicting the breach outflow hydrograph due to overtopped embankment dams is important for the development of flood inundation maps. Scaling the breach outflow characteristics from overtopped non-cohesive geometrically distorted dam models in the Hydraulic Laboratory at the University of Ottawa is investigated using the Froude criterion and substantiated by scale series tests. Another objective of this study is to examine the use of void ratio as an alternative scaling criterion for mobile bed models simulating dam breach flows, using a second scale series test. Photographic images of the breach channel captured during the test revealed an upstream-control section forming on the upstream face of the dam model in the shape of an arc, which migrates upstream as the breach channel slope retreats downwards due to erosion. The arc resembles an ogee-crest, defining the locus of Froude-critical points upstream the breach channel entrance. The discharge over the arched crest was approximated using weir equations and compared to the measured breach outflow. It was found that a correction factor for the estimated discharge must be accounted for constriction effects due to undercutting in the breach channel entrance and submergence effects due to side-slope collapses occurring in the downstream section of the breach channel. While the Froude criterion is substantiated for the distorted scale series for horizontal dimensions, scale effects did exist laterally. With respect to the compaction scale-series, scale effects in both the horizontal and lateral dimensions were minor.
1. Introduction
Accurate prediction of the temporal and flow characteristics of dam breach floods for inundation maps is a crucial task for emergency planning and disaster mitigation teams. Yet there are uncertainties in the four mechanisms adopted by current physically-based numerical models simulating breach morphodynamics: flow hydrodynamics, soil erosion, sudden enlargement and collapse mechanisms in the breach channel, and reservoir routing in the downstream valley. The study of the unique nature of dam breach hydraulics due to overtopping has been ongoing for the past 40 years. The study by Walder and O’Connor (1997) states that the applicability of riverine equations for sediment transport may not be feasible in flows with high shear stress exponents as in the case of breach flow. Earlier hydraulically-biased dam breach numerical models ignore some geotechnical phenomena that are important in the widening phase of the breach channel. Current numerical models solve for side-slope failures in the breach channel by assuming fully-saturated and steady state conditions in the soil (e.g. Culmann method in NWS-BREACH by Fread, 1988). The study by Faëh (2007) shows that a user-defined “critical failure angle” for assessing side-slope failures can cause peak flow, QP, variations in numerical simulations of up to 75%. Recently, experimental modellers have proposed new methodologies to simulate the erosion and side-slope collapse mechanisms in dam breach failure analyses. An example is the correlation between the headcut migration and erosion rate of compacted cohesive soils (Wan and Fell, 2004; Hanson, 2006;

HY-062-2
Fujisawa et al. 2008). The study by Mohamed et al. (2002) proposed a methodology for assessing the side-slope failures in non-cohesive embankments after bending and shear cracks leading to the collapse of the overhang material in the breach channel was observed due to undercutting at the breach channel entrance. Preliminary tests at the University of Ottawa’s Hydraulic Laboratory investigated the effects of compaction and saturation conditions on outflow characteristics of overtopped non-cohesive homogeneous dam models (Al-Riffai et al. 2009). While the results indicated that compaction does in fact delay the breaching process, only the initial breaching stages were captured in this analysis since the widening phase was too rapid for the narrow flume used. The compaction tests were thus repeated in a large flume (1.5m wide) to capture the breaching process from its inception until its end and to establish scaling criteria for selecting and justifying the soil’s compaction when constructing the dam models. This study investigates, using scale series tests, the scale effects of two parameters, soil void ratio and model distortion scale, with respect to two of the most important breach outflow characteristics, QP, and time-to-peak, tP. Observations revealed that the crest of the breach channel migrates upstream on the upstream face of the dam model and is approximately arc-shaped. A method for estimating the outflow as a result of the slope retreat of the breach channel and the consequent migration of the “upstream control” section further upstream was developed based on dimensions of this arc and weir equations.
2. Similitude Criteria in Dam Breaching
The similarities that exist between a hydraulic model and prototype are described as geometric, kinematic or dynamic. In physical modeling, various similitude criteria can be used to describe the physical relationships between hydraulic parameters, in dimensionless form: Froude (Fr), Reynolds (Re), Weber (We) and Euler (Eu). Since it is impractical to sometimes satisfy two or more of these scaling criteria, the experimental modeller must then give preference to the dominant criterion for designing the hydraulic model (Hughes, 1993). In free surface flow models, gravity dominates over viscous effects, and hence the Froude criterion is preferred over the Reynolds criterion. However, this approach introduces scale effects and distortions in the scaled results (Chanson, 1999). Identifying new criteria to satisfy certain flow regimes (e.g. scale laws governing surface resistance) or spatial constraints in a hydraulic facility (e.g. distorted/tilted geometries) may also be required. When mobile-bed models are designed, the following three additional scaling criteria are also satisfied: grain Reynolds (Re), Shields parameter () and dimensionless grain size, d (Julién, 2002). Additional criteria can also be incorporated for mobile-bed models such as a non-dimensional length, l, which is the ratio of a characteristic length, , to the grain size, d50 (Ackers, 1987; Hugh, 1993) or the Taylor’s function, q, used for scaling sediment transport (Pugh, 1985). It is nearly impossible to satisfy all mobile-bed modeling criteria, and the physical model design becomes even more challenging for the highly unsteady dam breach flows. In such complex processes, it is more feasible to identify the similitude laws using scale series (Hughes, 1993). In this paper, the scale ratio (subscript r) is defined by the ratio between the prototype and model parameter (subscripts p and m, respectively) and the geometric scale ratio, Lr, applies for all dimensions whereas the horizontal, lateral and vertical geometric ratios are, Xr, Yr and Zr, respectively. During the 1980s, hydraulic modelling of fuse plug embankments was conducted by scaling the gradation of sediments (Pugh, 1985). Schmocker and Hager (2009) investigated scale effects in dike overtopping tests using exact scale series (i.e. Xr = Yr = Zr = Lr) of non-cohesive dikes using 3 scaling ratios (Lr = 1, 0.5, 0.25) where overtopping was over the entire flume width hence representing 2-dimensional flow and consequently the widening phase of the breach was not simulated. In other dam breaching tests, it was observed that during the breach initiation phase, overtopping flow was almost negligible due to the infiltration into the dam body from a narrow stream over the dam crest (Al-Riffai et al. 2009). In order to develop scaling criteria during this phase, surface tension effects must also be included (e.g. Weber criterion). However, this study focuses on breach outflow characteristics after the initiation phase, hence similitude does not consider the time lag, tL, between the moment of overtopping and when a noticeable breach outflow is measured. During the initial stages of erosion, supercritical flow on the downstream face of the dam is fully turbulent where undercutting of the breach channel at the entrance can be observed. It
HY-062-3
can be assumed that scale effects due to viscous forces at this stage and beyond are minor. Scale series experiments were then performed to investigate the scale effects using distorted geometries. Three different horizontal scale ratios were used (Xr = 1, 0.5, 0.33) where the vertical and lateral scales remained constant (i.e. Zr = Yr = 1). Rem in distorted models are greater, hence improving the Re similarity. Another advantage of distorted models is that more accurate depth measurements can be obtained (Chanson, 1999). However, the drawback of using distorted models is misrepresentation of lateral and vertical time-scales by the model (Julién, 2002). By applying dynamic similarity between the prototype and model parameters, the Froude criterion for distorted models can be formulated using an approach similar to Chanson (1999):
[1] 1r r r r r r r r rFr U g Z U g Z U Z
where U is the streamwise velocity and g is the acceleration due to gravity (i.e. gr = 1). The discharge ratio, Qr, can be expressed as follows:
[2] 3 2r r r r r r r r r rQ U Y Z Z Y Z Q Y Z
Using Eq. 1, the time scale ratio can be expressed as follows:
[3] r r r r rt X U X Z
A second scale series experiment was conducted to investigate the possibility of using the compaction effort as an alternative means to scale the sediment density, GS, or grain size, d50, or the combination of both. Three void ratios, e, were used: 0.52, 0.61, 0.75.
3. Experimental Model
There is not much mention in literature on the construction of dam breach models in a laboratory environment. Hence, this section gives some details of an improved construction technique for controlling the compaction of the embankment material.
3.1 Construction Techniques and Experimental Method
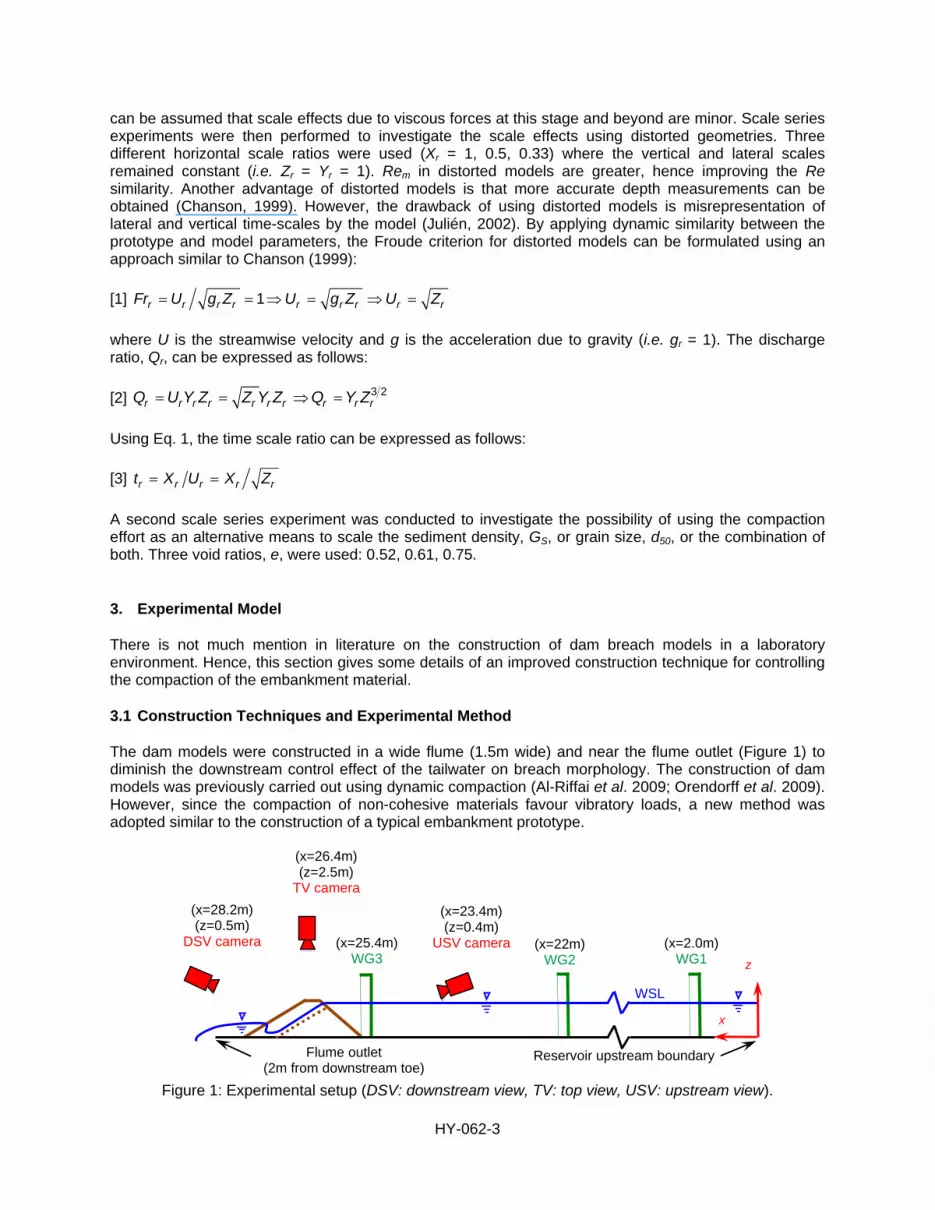
The dam models were constructed in a wide flume (1.5m wide) and near the flume outlet (Figure 1) to diminish the downstream control effect of the tailwater on breach morphology. The construction of dam models was previously carried out using dynamic compaction (Al-Riffai et al. 2009; Orendorff et al. 2009). However, since the compaction of non-cohesive materials favour vibratory loads, a new method was adopted similar to the construction of a typical embankment prototype.
Figure 1: Experimental setup (DSV: downstream view, TV: top view, USV: upstream view).
(x=2.0m) WG1
(x=23.4m) (z=0.4m)
USV camera
WSL
z
x
(x=22m) WG2
(x=26.4m) (z=2.5m)
TV camera
(x=25.4m) WG3
(x=28.2m) (z=0.5m)
DSV camera
Reservoir upstream boundaryFlume outlet (2m from downstream toe)

HY-062-4
The 30 cm high dam models were constructed in 6 x 5cm vertical layers (Figure 2). A compactor was constructed using a rotary motor mounted on a frame welded onto a steel plate (0.7m length x 1.5m width) spanning the width of the flume. Previous in situ compaction tests were carried out in the wide-flume to determine the optimum moisture content for the compaction effort applied (Figure 3). The lift height before compaction was determined based on trial and error such that the final layer height (i.e. 5cm) was consistent for each test. The in situ compaction tests were carried out for the first two layers of the dam model at various water contents for two of the compaction efforts applied where the maximum dry unit weight, d, of the two layers was measured at 16.8kN/m3 and 17.8kN/m3 (e = 0.61 and 0.52, respectively) using sand cone tests for high and low compaction energies, respectively. Two in situ compaction tests were also carried out using full-scale models (i.e. 30cm high) to gauge the variation in d in comparison to constructing only two layers for the in situ compaction tests. The sand cone tests results indicate that d variations throughout the soil layers were negligible (< 3%). Since moisture was lost after compaction, the soil was prepared by mixing the sand at the water content that yields optimum density conditions. The compaction effort at higher densities was achieved by vibrating the soil mixture under the vibratory plate for 20s, and a maximum static load of 4kPa was then applied using a hydraulic jack. The static load was maintained while resuming vibration, until no further change in the static load was observed on the pressure gauge connected to the hydraulic jack. The lower compaction was achieved by compacting the mixed soil under the weight of the vibrating plate alone, without applying a static load. Hence, the high compaction simulates the maximum number of passes using a vibratory compactor in the field, while the lower compaction represents a lower number of passes. It was not possible to achieve an even lower compaction using this technique since most of the compaction already takes place under the soil’s own bulk weight. It was also not possible to achieve any higher compaction than d = 17.8kN/m3 since the static load applied was restricted to the weight of the frame to which the hydraulic jack was connected. A third and even lower d = 15.4kN/m3 (e = 0.75) was used by constructing the models with loose dry sand. Figure 2 and Table 1 summarise the dimensions of the models and the parameters that were varied for the breaching tests. The sand that was used for the breaching tests was poorly-graded sand (SP soil, United Soil Classification System, USCS) with a coefficient of curvature, CC, and coefficient of uniformity, CU, of 1.14 and 2.88, respectively. Results from sieve analyses indicated that D10, D30, D50, D60 and D90 values were 95m, 171m, 232m, 273m, and 556m, respectively, with 3% fines. The measured specific gravity, GS, of the soil was 2.75 and the angle of internal friction, ', was 36.2°.
Figure 2: Side view of embankment model during reservoir impoundment (prior to breaching).
Table 1: Test matrix
# Dimensions [cm]
Test description Parameters varied CL* zD* SUS* / SDS* CW*
Test case D 3 150 30 2.5 / 3 10 Variation of compaction e = 0.52, 0.61, 0.75
Test case E 2 150 30 2.5Xr / 3Xr 10Xr Variation of distortion scale Xr = 0.50, 0.33
* CL = crest length, zD = crest height, SUS&SDS = upstream slope & downstream slope, CW = crest width
1V:(3Xr)H
Silica sand (6mm thick) Gravel (9mm thick)
Qin= 0.49 [l/s]
100Xr [mm]
1V:(2.5Xr)H
= 280 [mm]
zD = 300 [mm]
Datum (impervious channel bottom)
Under-toe drain

HY-062-5
250 5 10 15 20
18.0
15.0
16.0
17.0
15.5
16.5
17.5
Water content, w [%]
Dry
uni
t wei
ght,
d [k
N/m
3 ]
Zero Air
594 kJ/m3
285 kJ/m3
142 kJ/m3
71 kJ/m3
(SPT)
High
Low
Voids Curve
Figure 3: Dry unit weight versus water content for various energies applied using Standard Proctor (594 kJ/m3) and in-situ (e = 0.52 and e = 61 for high and low compaction, respectively) compaction equipment.
Seepage through the dam body was controlled by the use of a drainage layer at the downstream toe (Figure 2). Monitoring of breach morphology was made possible by drawing gridlines on the crest as well as on the upstream and downstream slopes of the dam models. A V-notch, 4cm wide and 2cm deep, was carved on the dam crest centreline in order to ensure that breaching occurred away from the flume sidewalls. Impoundment of the reservoir took place slowly (<3mm/minute) until the water surface elevation, , reached the invert of the V-notch (28cm). The experiment was then halted to give sufficient time for steady-state seepage through the dam body to take place ( = 28cm). Measurement of the water surface elevation in the reservoir was sampled (30Hz) at three locations using WG-50 capacitance wave gauges (Figure 1). Inflow to the reservoir remained constant throughout the duration of the experiment. For the distorted scale series, the upstream boundary of the reservoir was moved upstream to diminish the effect of submergence conditions on the breaching process.
3.2 Data Extraction and Video Analysis
Investigation of the breaching mechanisms and their progression took place by mapping the bathymetry of the breach channel entrance. Images at 10s intervals taken from high-definition cameras from upstream, downstream and top-view locations were imported into ArcGIS. A photogrammetric technique consisted of georeferencing the upstream and downstream faces as well as the crest of the dam model into x-y coordinates using the gridlines appearing on the images captured before the water impoundment began. All images including those captured after impoundment were then transformed such that all the three planes lying on the dam surface now appear on one plane (Figure 4 and 5).
Figure 4: Transforming x-y coordinates on three surfaces of the dam model onto one plane.
3 Planes 1 Plane
Upstream 3 y-axes
x-axis
Downstream x-axis
y-axis
Upstream toe
Dam crest
Downstream toe

HY-062-6
Figure 5: Photogrammetric technique showing top view image (left) georeferenced (right) transformed.
Figure 6 shows the cross-section and top view of the eroded breach channel in an embankment dam due to overtopping flow, idealized by an upstream control point at the center of the breach channel; where zD is the maximum crest elevation, zC is the elevation of the inflection point, is the angle of the upstream slope, yC is the critical flow depth, 1 is the upstream water surface elevation, r is the arc radius of the migrating crest and x is the inclined distance from the upstream apex of the dam crest to the water surface level. Mapping of the external surfaces of the dam prior to its erosion allowed the extraction of dimensions for the top breach width, BTW, breach entrance width, BEW, as well as the arc length, Larc, and chord height, xa of the migrating crest on the upstream face of the dam model. Figure 6 also shows the crest of the breach channel in more detail; where ds is a segment lying on the arched crest with coordinates (xs, ys) and rotated by an angle, d.
Figure 6: Breach outflow in embankment dam model due to overtopping showing side view (top left), top-view (bottom left) and detailed top-view of arched crest (right).
By applying the energy equation in a rapidly varying flow regime and neglecting the headloss between a point upstream and the breach channel entrance, the critical depth over the inflection point is given by the following expression:
[4] 12
3C Cy z

HY-062-7
The elevation of the inflection point shown in Figure 6 can be expressed as:
[5] C D S az z x x r x Sin
By substituting Ur and Zr in Eq. 1 by the critical velocity, vc, and critical flow depth, yc, the discharge, dQ, through the arc segment, ds, of length rd can be expressed as:
[6]
32
C C CdQ v y ds gy rd
Substituting Eq. 4 and 5 into Eq. 6, and substituting xS with r(sin) the discharge, dQ, is expressed as:
[7] 33 222
13 sin sinD adQ r g z x r r x d By assuming symmetry about the longitudinal axis (i.e. x-axis) of the breach channel and integrating dQ between angles 1and 2, an estimate of the total discharge can be obtained:
[8] 3
23 2 22213
arcsin1
2 sin 1 sine D ar xar
Q r g z x r x d
The estimated discharge, Qe, based on the above dimensions was computed at different time intervals using numerical integration where as the measured discharge, Q, was obtained by converting wave gauge data into volume-time relationships and then numerically differentiating the volume under the water surface level with respect to time.
4. Observations and Results
At the initial stages of breaching, convective accelerations due to the constricting flow field near the V-notch, resulted in high shear forces and erosion at the breach channel entrance sides. The supercritical flow immediately downstream the dam crest caused downward erosion in the region while sediment deposition was at the downstream toe. The coupling of the above-mentioned mechanisms led to a severely undercut breach channel entrance, similar to observations by other researchers (Mohamed et al. 2002). During this stage, no significant outflow was measured, nevertheless this undercutting mechanism influenced the formation and evolution of the breach channel in later stages. The dam failure process then comprised of side-slope collapses within the breach channel which began near the downstream toe, and were then followed by successions in the upstream direction, towards the dam crest. For the loosest soil conditions (e = 0.75), the side-slope collapses were much more frequent and continuous creating high submergence conditions downstream as larger quantities of soil were impeding the flow through the breached dam. For the densest soil conditions (e = 0.52), side-slope collapses were less frequent since the size of the overhang material due to undercutting was larger, whereas downcutting dominated the evolution of the breach channel during later breaching stages. In dam models with higher geometric distortion scales, side-slope collapses were less frequent due to the higher inclination angles in the failure plane with respect to the horizontal. Figure 7 below shows the measured breach outflow hydrographs, indicating an increase in QP and decrease in tP as well as total breach time, TB, for looser soil conditions as expected (Qp = 65.5 l/s, 66.9 l/s and 76.2 l/s; tP = 125s 108s and 94s; TB = 1007s, 801s and 654s for e = 0.52, 0.61 and 0.75, respectively). It is clear from the outflow hydrographs that for the distorted scales tests, QP and tP are in very good agreement with Eq. 2 and Eq. 3, respectively (QP = 66.0 l/s and 65.8 l/s; tP = 53s and 37s; TB = 367s and 195s, for Xr = 0.50 and 0.33, respectively). The estimated discharge computed from Eq. 8 was compared to the measured discharge using a correction factor, = Q/Qe.

HY-062-8
Figure 7. Measured breach outflow hydrographs (left) and temporal variation of correction factor (right) for both scale series experiments.
Figure 7 also shows that the discharge calculated using Eq. 8 is always overestimated with respect to the compaction scale series. The general trend indicates that during the initial breaching stages, is low and increases gradually with time where as the estimate for discharge becomes optimum near 0.75tP. The trend later shows decreasing again with time. This trend occurs due to flow resistance changing throughout the duration of the experiment. Flow resistance is initially high due to undercutting of the breach channel, while subsequent side-slope failures in the breach channel cause the flow in the breach channel to become partially submerged. It is evident that for higher compactions, estimates of the discharge at 0.75tP are more accurate, due to lower degrees in undercutting. For the distorted scale series experiments, discharge became underestimated after 0.39tP for Xr = 0.50 and much sooner (0.21tP) for Xr = 0.33. This is due to the sensitivity in estimating the discharge since measurement of the arc dimensions is more subjective. Approximating the rapidly developing and migrating breach channel crest as an arc was less apparent even before the later breaching stages, especially for larger distortion scales (e.g. Xr = 0.33) where measurements can be more prone to errors due to light refraction in deeper water. The analysis could not also be extended for the entire breaching process since the breach channel crest began to disappear after time-to-peak was reached. A plot of the peak discharge in dimensionless form, QP*, (from Walder and O’Connor, 1997) is shown in Figure 8, where h is the change in reservoir level before and after breaching. It is clear that scale effects exist in the compaction scale series while they are much less for the distorted scale series. Figure 8 also shows that time scales are to a large extent conserved, where as scale effects are less in the case of compaction than in the case of distorted scale series.
Figure 8: Non-dimensional breach parameters (Q*P - left and t*P - right) vs. scale series parameters (void ratio, e, and horizontal length scale, Xr).

HY-062-9
The widening process in the breach channel was also investigated since it has a large influence on the breach outflow. The temporal variation of the breach entrance width and arc length in dimensionless form (i.e. normalized by BEWmax) in Figure 9 generally shows a linear increase until time-to-peak (0.25TB) and about 0.12TB, respectively. For the distorted scale series, there is a deviation from that trend since lateral time scales tend to be distorted, as mentioned in section 2.
Figure 9: Temporal variation of dimensionless breach geometries: (left) entrance width (right) crest length.
5. Conclusions
The study presented examines the effect of scaling compaction and distorted geometries in non-cohesive overtopped dam breach models on the two most critical breach outflow characteristics, peak flow, QP, and time-to-peak, tP, using scale series tests. It was discovered that when using compaction scale series, minor scale effects in outflow characteristics were observed mainly due to the reduction in soil erodibility and differences in the morphological evolution of the breach channel for lower void ratios. For distorted geometric scale series, some minor scale effects in the temporal characteristics of the outflow and larger scale effects for the breach dimensions in the lateral time scales were observed. The study indicates that scaling of QP and tP for distorted geometric scale series can be made possible using the Froude criterion, which is often used in rigid bed models. By mapping the locus of Froude-critical points on the arc representing the breach channel crest which migrates upstream on the upstream face of the dam model, allowed for the extraction of the breach channel entrance dimensions and estimation of the outflow discharge, Qe, using the proposed weir equations. The estimated discharge from the weir equations was generally higher due to flow resistance due to undercutting during the initial breaching stages and submergence conditions from side-slope failures occurring in later breaching stages. Previous tests have shown that side-slope collapses occur above the water line, which implies that the breaching process is dominated by erosion (Al-Riffai et al. 2009). Nonetheless, side-slope collapses do play a role in the breach outflow. Many analytical and physically-based numerical models approximate the breach outflow based on broad-crested weir equations. Hence, it is important to accurately model the lateral enlargement of the breach channel, specifically the side-slope failure mechanism, which is governed by geotechnical processes related to compaction and degree of saturation (Al-Riffai et al. 2010). The photogrammetric technique used for estimating discharge favoured the compaction scale series as a result of the higher subjectivity in determining the dimensions of the arched crest of the breach channel for the distorted scale series. Although scale series may provide a great understanding of similitude criteria for complex mobile bed processes such as in dam breach flows, their capacity must be challenged with respect to embankment dam prototypes. This study also provides a basis for exploring non-conventional means of using soil compaction in designing non-cohesive mobile bed models as opposed to using lightweight sediments which can be considered impractical for the hydraulic modeller. Current tests by the authors include the investigation of scaling criteria using exact scale series.

HY-062-10
6. Acknowledgements
This research was conducted with support from the National Science and Engineering Research Council (NSERC) Discovery Grant. The authors would like to recognize advice provided by Dr. Julio Infante Sedano from the Department of Civil Engineering at the University of Ottawa with respect to some geotechnical aspects of this research. The authors would also like to acknowledge the help from undergraduate student Mathieu Toupin from the University of Ottawa, Canada, in some experimental work and data analysis.
7. References
Ackers, P. 1987. Scale models, Proceedings of the 22nd IAHR Congress, Lausanne, Switzerland. Al-Riffai, M., Orendorff, B., Nistor, I., Rennie, C.D. and St-Germain, P. 2009. Influence of compaction and
toe-drains on the formation of breach channels of overtopped earth embankments: An experimental study, Proceedings of the 33rd IAHR Congress, Vancouver, BC, Canada.
Al-Riffai, M. and Nistor, I. 2010. Impact and analysis of geotechnical processes on earthfill dam breaching, Natural Hazards, 55(1): 15-27.
Chanson, H. 1999. The Hydraulics of Open Channel Flow: An Introduction, Arnold, London, U.K. Faëh, R. 2007. Numerical modeling of breach erosion of river embankments, Journal of Hydraulic
Engineering, ASCE. 133(9): 1000-1009. Fread, D.L. 1988. BREACH: An Erosion Model for Earthen Dam Failures (Rev. 1, 1991), National Weather
Service, Office of Hydrology, Silver Spring, MD. Fujisawa, K., Akira, K. and Kiyohito, Y. 2008. Erosion rates of compacted soils for embankments, Journal of
Geotechnical and Geoenvironmental Engineering, ASCE, 64(2): 203-210. Hanson, G.J. and Hunt, S. 2006. Determining the erodibility of compacted soils for embankment dams,
Proceedings of the 2006 U.S. Society on Dams Annual Meeting and Conference, San Antonio, TX, U.S.A.
Hughes, S.A. 1993. Physical models and laboratory techniques in coastal engineering, World Scientific, Singapore.
Julién, P.Y. 2002. River Mechanics, Cambridge University Press, Cambridge, U.K. Mohamed, M.A.A., Samuels, P.G., Morris, M.W. and Ghataora, G.S. 2002. Improving the accuracy of
prediction of breach formation through embankment dams and flood embankments, Proceedings of an International Conference on Fluvial Hydraulics, Louvain-La-Neuve, Belgium.
Orendorff, B., Al-Riffai, M., Rennie, C.D., Nistor, I. and St-Germain, P. 2009. The effects of initial breach geometry on dam breach morphology, Proceedings of the 33rd IAHR Congress, Vancouver, BC, Canada.
Pugh, C.A. 1985. Hydraulic model studies of fuse plug embankments, REC-ERC-85-7, U.S. Bureau of Reclamation, Denver, CO, U.S.A.
Schmocker, L. and Hager, W.H. 2009. Modelling dike breaching due to overtopping, Journal of Hydraulic Research, IAHR, 47(5): 585-597.
Walder, J.S. and O’Connor, J.E. 1997. Methods for predicting peak discharge of floods caused by failure of natural and constructed earthen dams, Water Resources Research, 33(10): 2337-2348.
Wan, C.F. and Fell, R. 2004. Investigation of rate of erosion of soils in embankment dams, Journal of Geotechnical and Geoenvironmental Engineering, ASCE, 130(4): 373-380.
Recommended


