INTERNATIONAL JOURNAL OF ENERGY RESEARCHInt. J. Energy Res. 2005; 29:455–470Published online in Wiley InterScience (www.interscience.wiley.com). DOI: 10.1002/er.1074
Performance evaluation of a triple-effect evaporator withforward feed using exergy analysis
Firuz Balkan1, Neslihan Colak2,z and Arif Hepbasli3,n,y
1Chemical Engineering Department, Ege Universtity, 35100 Bornova, Izmir, Turkey2Solar Energy Institute, Ege Universtity, 35100 Izmir, Turkey
3Mechanical Engineering Department, Ege University, 35100 Bornova, Izmir, Turkey
SUMMARY
The present study evaluates the performance of a triple-effect evaporator with forward feed (TEEFF)system by using exergy analysis based on actual operational data. The orange juice with a capacity of about1.222 kg s�1 is concentrated from a dry matter (DM) content of 12 to 65% in this TEEFF, which is situatedin an orange juice concentrate line installed in a factory, located in Denizli, Turkey. A Visual Basic 6.0program was also developed to show how the exergetic performance characteristics of the system vary withthe feed flow rates ranging from 1.222 to 1.667 kg s�1. The total exergy efficiency of the TEEEFF is foundto be on average 0.85. The largest exergy destruction occurs in the first-effect of the TEEFF system with48.2% of total, followed by the third and second effects with 32.04 and 19.76% of that. Evaporatorperformance is also rated on the basis of steam economy, which is obtained to be in the range of 2.05–2.14under the operation conditions. It is expected that the analysis presented here should provide a designerwith a better, quantitative grasp of the inefficiencies and their relative magnitudes in the design, simulationand operation of multiple-effect evaporators. Copyright # 2005 John Wiley & Sons, Ltd.
KEY WORDS: evaporator; exergy analysis; exergy efficiency; orange juice concentrate; performanceevaluation; triple-effect evaporator
1. INTRODUCTION
The fruit juice processing industry is one of the world’s major agro–based businesses. Orangejuice concentrate produced by evaporation is the dominant fruit juice concentrate tradedworldwide (Chen and Hernandez, 1997). The modern development of fruit juice processingindustries has evolved with the production of fruit juice and essence concentrates as valuablesemi finished products. For purposes like reducing transportation, packaging and storage costsor reaching several technological results, i.e. obtaining microbiological stability, water contentof raw material and semi-finished products should be reduced. Water content of fruit juices canbe reduced by evaporation, reverse osmosis or freeze-drying. The most widespread method is
Received 14 April 2004Accepted 15 August 2004Copyright # 2005 John Wiley & Sons, Ltd.
yE-mail: [email protected] leave: Food Engineering Department, Faculty of Engineering, Pamukkale University, 20020 Camlik, Denizli,Turkey.
nCorrespondence to: Arif Hepbasli, Mechanical Engineering Department, Faculty of Engineering, Ege University,35100 Bornova, Izmir, Turkey.
evaporation method. Over 90% of concentrated orange juice produced in the world is producedby evaporation method.
Because of increasing energy costs along with energy crisis in recent years, scientists andengineers working in industrial organizations are orientated to research on more efficient use ofenergy. Energy conservation is a key goal of the world economy and will continue to be one inthe future. The most effective way to reduce energy demand is to use energy more efficiently. Inthis regard, exergy analysis, based on the second law of thermodynamics, successfully identifiesthe magnitudes and locations of energy degradations, inefficient uses of natural resources andthe pollution of the environment by means of waste energy (Kotas, 1985; Tekin andBayramoglu, 1998). Exergy analysis has been applied successfully in various areas ofengineering applications (Szargut et al., 1988). The minimization of exergy losses, orequivalently the entropy generation, has a broader objective than the minimization of energylosses within a plant (Wogler and Weissman, 1988; Munsch et al., 1993).
Excluding the zeroth and third laws of thermodynamics, thermodynamics can be defined froma broad perspective as the science of energy and exergy, including a number of concepts such astemperature, pressure, enthalpy, heat, work, energy and entropy. The first law ofthermodynamics embodies energy analysis, which identifies only external energy wastes andlosses (Rosen and Dincer, 2003).
Some key features of exergy are identified to highlight its importance in a wide range ofapplications (Syahrul et al., 2002). Exergy is a powerful and effective tool for (a) designing andanalysing energy systems by combining the conservation of mass and energy principles with thesecond law of thermodynamics, (b) furthering the goal of more efficient energy resource use byassessing meaningful efficiencies and enabling the locations, types and true magnitudes of wastesand losses to be determined, (c) revealing whether or not, and by how much, it is possible todesign more efficient energy systems by reducing the inefficiencies in existing systems, (d)addressing the impact on the environment of energy resource utilization, and (e) helping toachieve sustainable development.
Actual in-plant evaporator performance data are relatively scarce. There are at least tworeasons for this. First of all, companies are reluctant to publish data that could possibly help arival and secondly, the data are often difficult and time-consuming to obtain. The methods usedto evaluate the performance of evaporators may be divided into two groups, namely themeasurement and analytical techniques (Rumsey, 1986). The investigation conducted here maybe regarded as one of the limited studies on the application of the exergy method to a TEEFFfor evaluating its performance. The main objective of the present study is to perform an exergyanalysis of a TEEFF in an orange juice concentrate line using actual data obtained from a plantlocated in Denizli, Turkey. In this regard, first, the theory used for the exergy analysis isreviewed. A flow diagram of the orange juice concentrate operation line studied is thendescribed. Finally, the theory is used to analyse the whole TEEFF and its individualcomponents, while the results obtained are discussed.
2. EXERGY ANALYSIS
2.1. Description of the system
Figure 1 illustrates a flow diagram of the orange juice concentrate operation line studied. Thisline begins with the washing process and ends up with the concentrated orange juice. It also
Copyright # 2005 John Wiley & Sons, Ltd. Int. J. Energy Res. 2005; 29:455–470
F. BALKAN, N. COLAK AND A. HEPBASLI456
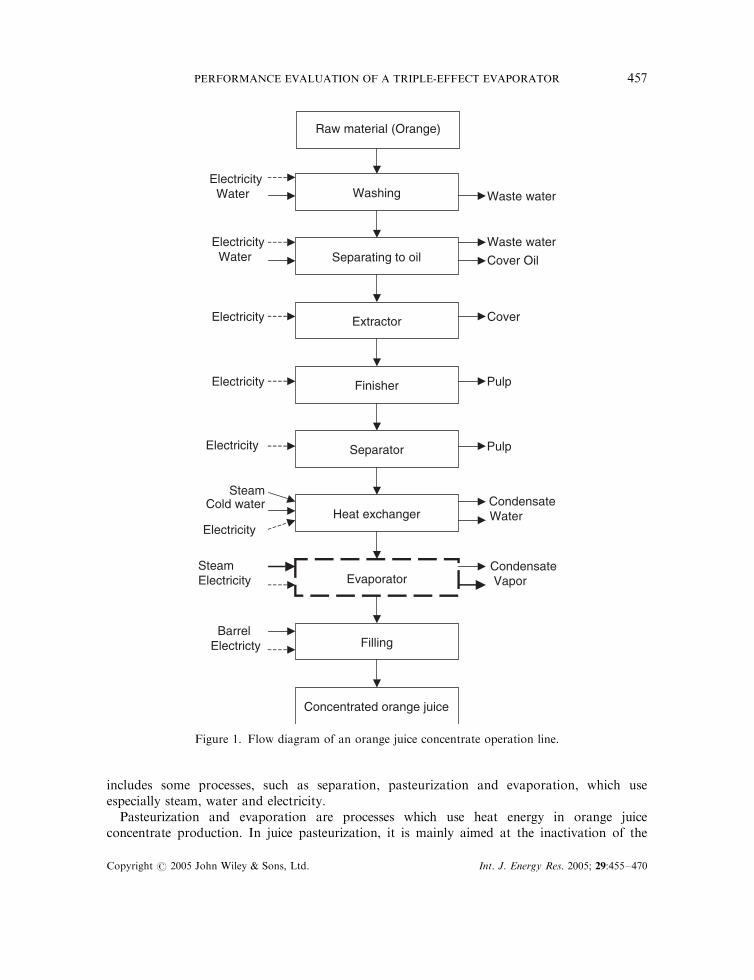
includes some processes, such as separation, pasteurization and evaporation, which useespecially steam, water and electricity.
Pasteurization and evaporation are processes which use heat energy in orange juiceconcentrate production. In juice pasteurization, it is mainly aimed at the inactivation of the
Raw material (Orange)
Washing
Separating to oil
Extractor
Finisher
Separator
Heat exchanger
Evaporator
Filling
Concentrated orange juice
ElectricityWater Waste water
Electricity Water
Waste water
Electricity
Cover Oil
Cover
Electricity
Electricity
Pulp
Pulp
Steam Cold water
Electricity
CondensateWater
SteamElectricity
Condensate Vapor
Barrel Electricty
Figure 1. Flow diagram of an orange juice concentrate operation line.
Copyright # 2005 John Wiley & Sons, Ltd. Int. J. Energy Res. 2005; 29:455–470
PERFORMANCE EVALUATION OF A TRIPLE-EFFECT EVAPORATOR 457
enzymes in the orange juice, especially pectin methyl esterase, besides reducing the number ofmicroorganisms. These enzymes should be inactivated quickly, as they cause jell form in orangejuice.
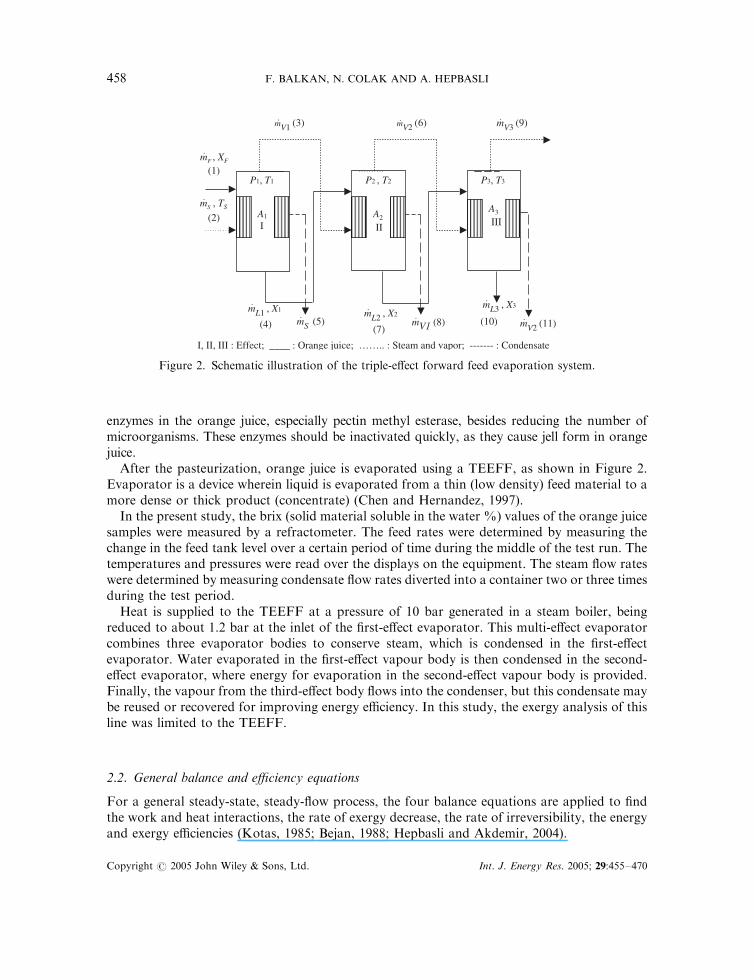
After the pasteurization, orange juice is evaporated using a TEEFF, as shown in Figure 2.Evaporator is a device wherein liquid is evaporated from a thin (low density) feed material to amore dense or thick product (concentrate) (Chen and Hernandez, 1997).
In the present study, the brix (solid material soluble in the water %) values of the orange juicesamples were measured by a refractometer. The feed rates were determined by measuring thechange in the feed tank level over a certain period of time during the middle of the test run. Thetemperatures and pressures were read over the displays on the equipment. The steam flow rateswere determined by measuring condensate flow rates diverted into a container two or three timesduring the test period.
Heat is supplied to the TEEFF at a pressure of 10 bar generated in a steam boiler, beingreduced to about 1.2 bar at the inlet of the first-effect evaporator. This multi-effect evaporatorcombines three evaporator bodies to conserve steam, which is condensed in the first-effectevaporator. Water evaporated in the first-effect vapour body is then condensed in the second-effect evaporator, where energy for evaporation in the second-effect vapour body is provided.Finally, the vapour from the third-effect body flows into the condenser, but this condensate maybe reused or recovered for improving energy efficiency. In this study, the exergy analysis of thisline was limited to the TEEFF.
2.2. General balance and efficiency equations
For a general steady-state, steady-flow process, the four balance equations are applied to findthe work and heat interactions, the rate of exergy decrease, the rate of irreversibility, the energyand exergy efficiencies (Kotas, 1985; Bejan, 1988; Hepbasli and Akdemir, 2004).
I, II, III : Effect; ____ : Orange juice; …….. : Steam and vapor; ------- : Condensate
mF , XF
(1)
(4) (7) (10)
A1
I
P1, T1 P2 , T2 P3, T3
mV2 (6)
A2
II
A3
III (2)
mV1 (3) .
.
mS , TS .
mL1 , X1 .
mS (5) . mL2 , X2
.
mV1 (8).
mL3 , X3.
mV2 (11).
. mV3 (9) .
Figure 2. Schematic illustration of the triple-effect forward feed evaporation system.
Copyright # 2005 John Wiley & Sons, Ltd. Int. J. Energy Res. 2005; 29:455–470
F. BALKAN, N. COLAK AND A. HEPBASLI458
The mass balance equation can be expressed in the rate form asX’mmin ¼
X’mmout ð1Þ
where, ’mm is the mass flow rate, and the subscript in stands for inlet and out for outlet.The general energy balance can be expressed asX
’EEin ¼X
’EEout and ’QQþX
’mminhin ¼ ’WW þX
’mmouthout ð2Þ
where ’EEin is the rate of net energy transfer in, ’EEout is the rate of net energy transfer out by heat,work and mass, ’QQ ¼ ’QQnet;in ¼ ’QQin � ’QQout is the rate of net heat input, ’WW ¼ ’WWnet;out ¼’WWout � ’WW in is the rate of net work output and h is the enthalpy per unit mass.The general exergy balance can be expressed in the rate form asX
’EExin �X
’EExout ¼X
’EExdest and
X1�
T0
Tk
� �’QQk � ’WW þ
X’mmincin �
X’mmoutcout ¼ ’EExdest ð3Þ
c ¼ ðh� h0Þ � T0ðs� s0Þ ð4Þ
where ’QQk is the heat transfer rate through the boundary at temperature Tk at location k, ’WW isthe work rate, c is the flow exergy, s is the specific entropy and the subscript zero indicatesproperties at the dead state of P0 and T0:
The exergy of an incompressible substance may be written as follows (Bejan, 1988):
cic ¼ C T � T0 � T0 lnT
T0
� �ð5Þ
where C is the specific heat.The exergy destroyed or the irreversibility may be expressed as follows:
’II ¼ ’EExdest ¼ T0’SSgen ð6Þ
where ’SSgen is the rate of entropy.Different ways of formulating exergetic efficiency proposed in the literature have been given in
detail elsewhere (Cornelissen, 1997; Wall, 2003). The exergy efficiency expresses all exergy inputas used exergy, and all exergy output as utilized exergy. Therefore, the exergy efficiency Z1becomes
Z1 ¼’EExout’EExin
ð7Þ
Often, there is a part of the output exergy that is unused, i.e. an exergy wasted, ’EExwaste; to theenvironment. In this case, exergy efficiency may be written as follows (Wall, 2003):
Z2 ¼’EExout � ’EExwaste
’EExin¼ Z1 �
’EExwaste’EExin
ð8Þ
The evaporator studied is a kind of heat exchanger. In this regard, the exergy efficiency of aheat exchanger may be measured by the increase in the exergy of the cold streams divided by thedecrease in the exergy of the hot streams. Applying this definition to a heat exchanger
Z3 ¼’EExcold;out � ’EExcold;in’EExhot;in � ’EExhot;out
ð9Þ
Copyright # 2005 John Wiley & Sons, Ltd. Int. J. Energy Res. 2005; 29:455–470
PERFORMANCE EVALUATION OF A TRIPLE-EFFECT EVAPORATOR 459
Van Gool (1997) has also proposed that maximum improvement in the exergy efficiency for aprocess or system is obviously achieved when the exergy loss or irreversibility ð ’EExin � ’EExoutÞis minimized. Consequently, he suggested that it is useful to employ the concept of anexergetic ‘improvement potential’ when analysing different processes or sectors of the economy.This improvement potential in the rate form, denoted IP, is given by (Hammond andStapleton, 2001)
IP ¼ ð1� ZÞð ’EExin � ’EExoutÞ ð10Þ
The steam economy, SE, gives the total amount of vapour generated per unit energy inputor steam equivalent and may be determined for a multiple-effect evaporator as follows(Hartel, 1992).
SE ¼Vapor ðkg s�1Þ
Steam ðkg s�1Þ¼
P’mmVi
’mmSð11aÞ
with
X’mmVi ¼ ’mmF 1�
XF
Xtl;n
� �ð11bÞ
where i=1,2,3,. . .,n identify effects, ’mmF is the feed rate in kg s�1, XF the weight fraction of thesolute in the feed and Xtl,n the weight fraction of the solute in the thick liquor.
2.3. Determination of thermal properties of orange juice
2.3.1. Determination of specific heats. Specific heat of food materials has been determinedexperimentally by several methods, including the method of mixtures, method of guard plateand using a differential scanning calorimeter (Choi and Okos, 1986; Singh, 1992).
Choi and Okos (1986) have suggested the following model for the specific heat for liquidfoods:
C ¼X
CiXi ð12Þ
with the specific heat of pure components given as
C ¼ CwXw þ CpXp þ CfXf þ CcXc þ CfiXfi þ CaXa ð13Þ
Cw ¼ 4:1762� 9:0864� 10�5T þ 5:4731� 10�6T2 for water ð13aÞ
Cp ¼ 2:0082þ 1:2089� 10�3T � 1:3129� 10�6T2 for protein ð13bÞ
Cf ¼ 1:9842þ 1:4733� 10�3T � 4:8008� 10�6T2 for fat ð13cÞ
Cc ¼ 1:5488þ 1:9625� 10�3T � 5:9399� 10�6T2 for carbohydrate ð13dÞ
Cfi ¼ 1:8459þ 1:8306� 10�3T � 4:6509� 10�6T2 for fibre ð13eÞ
Ca ¼ 1:0926þ 1:8896� 10�3T � 3:6817� 10�6T2 for ash ð13fÞ
where T is the temperature of food, the units of the specific heats and temperatures arekJ kg�1K�1 and 8C, respectively.
Copyright # 2005 John Wiley & Sons, Ltd. Int. J. Energy Res. 2005; 29:455–470
F. BALKAN, N. COLAK AND A. HEPBASLI460
2.3.2. Determination of enthalpies. The enthalpy of orange juice can be written in terms ofspecific heat as (Rahman, 1995)
h ¼X
hiXi ¼XZ T2
T1
CiXi dT ð14aÞ
where h is the enthalpy of the individual food components and Xi is the mass fraction of foodcomponents. Assuming a constant C over the temperature range, Equation (14a) reduces to
h ¼ SCiXiðT2 � T1Þ ð14bÞ
where T1 is the reference temperature, which is taken to be 08C in this study and T2 is thetemperature of food item in 8C.
The boiling temperature rise, DTb; for the orange juice solution is estimated by
DTb ¼ Tb;L � Tb;w ¼ 0:33 expð4XsÞ ð15Þ
where Tb,L is the boiling temperature of the liquid in 8C, Tb,w is the boiling point of water in 8Cand Xs is the weight fraction of soluble solids (Chen and Hernandez, 1997).
2.3.3. Determination of entropies. The specific entropies of orange juice are given by
s2 � s1 ¼ C lnðT2=T1Þ ð16Þ
where T1 is the reference temperature, which is taken to be 08C in this study and T2 is thetemperature of the food item in 8C.
2.4. Performing exergy analysis
The following balance equations for the components of the TEEFF studied are obtained byusing Equations (1)–(5). The irreversibility of each of the components is calculated from exergyconsiderations, while it may also be found using entropy balance equations, as described indetail elsewhere (Hepbasli and Akdemir, 2004). The comprehensive energy analysis of theTEEFF may be obtained from (Colak, 2002).
The mass, energy and exergy balance equations for the first-, second- and third-effectevaporator may be written as follows, where F, L and V are used for feed, liquid and vapourflow rates, respectively.
(a) First effect:
Total mass balance : ’mmF ¼ ’mmV1 þ ’mmL1 ð17aÞ
Solid mass balance : ’mmFXF ¼ ’mmL1X1 ð17bÞ
Steam side energy balance : ’mmShS ¼ ’QQ1 þ ’mmShC ð17cÞ
Product side energy balance : ’mmFhF þ ’QQ1 ¼ ’mmV1hV1 þ ’mmL1hL1 ð17dÞ
Heat transfer rate: ’QQ1 ¼ U1A1ðTS � T1Þ ð17eÞ
Total energy balance : ’mmFCFTF þ ’mmShS ¼ ’mmV1hV1 þ ’mmL1CL1T1 þ ’mmShC0 ð17fÞ
Exergy balance : ’EExdest1 ¼ ð ’EExVC � ’EExCOÞ þ ð ’EExF � ’EExL1Þ � ’EExV1 ð17gÞ
Copyright # 2005 John Wiley & Sons, Ltd. Int. J. Energy Res. 2005; 29:455–470
PERFORMANCE EVALUATION OF A TRIPLE-EFFECT EVAPORATOR 461
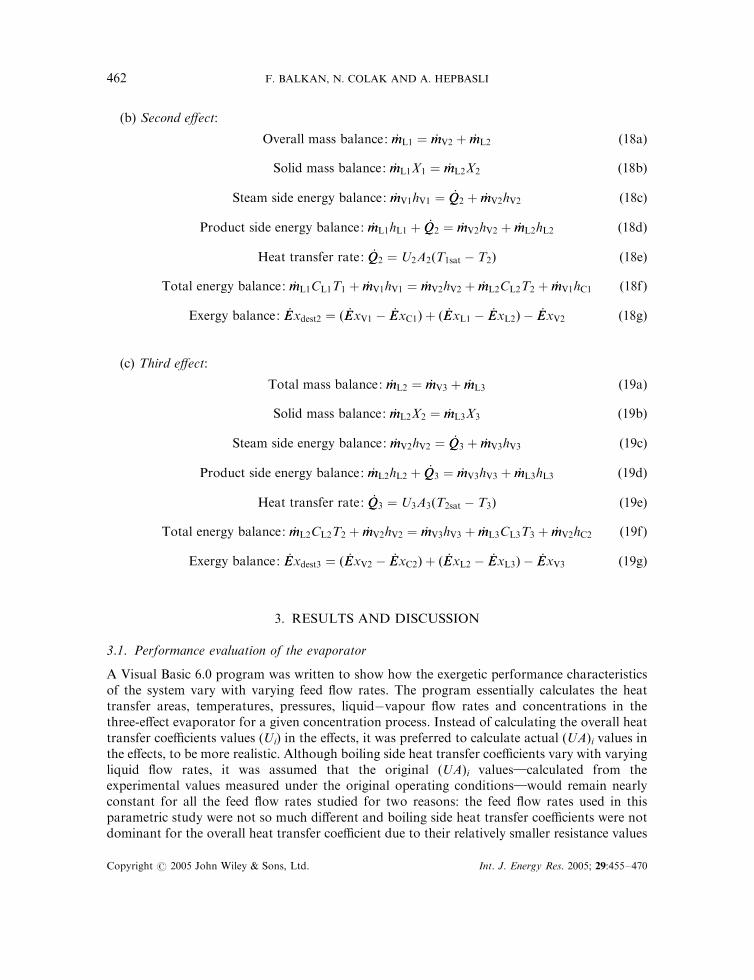
(b) Second effect:
Overall mass balance : ’mmL1 ¼ ’mmV2 þ ’mmL2 ð18aÞ
Solid mass balance: ’mmL1X1 ¼ ’mmL2X2 ð18bÞ
Steam side energy balance : ’mmV1hV1 ¼ ’QQ2 þ ’mmV2hV2 ð18cÞ
Product side energy balance : ’mmL1hL1 þ ’QQ2 ¼ ’mmV2hV2 þ ’mmL2hL2 ð18dÞ
Heat transfer rate: ’QQ2 ¼ U2A2ðT1sat � T2Þ ð18eÞ
Total energy balance : ’mmL1CL1T1 þ ’mmV1hV1 ¼ ’mmV2hV2 þ ’mmL2CL2T2 þ ’mmV1hC1 ð18fÞ
Exergy balance : ’EExdest2 ¼ ð ’EExV1 � ’EExC1Þ þ ð ’EExL1 � ’EExL2Þ � ’EExV2 ð18gÞ
(c) Third effect:
Total mass balance : ’mmL2 ¼ ’mmV3 þ ’mmL3 ð19aÞ
Solid mass balance: ’mmL2X2 ¼ ’mmL3X3 ð19bÞ
Steam side energy balance : ’mmV2hV2 ¼ ’QQ3 þ ’mmV3hV3 ð19cÞ
Product side energy balance : ’mmL2hL2 þ ’QQ3 ¼ ’mmV3hV3 þ ’mmL3hL3 ð19dÞ
Heat transfer rate: ’QQ3 ¼ U3A3ðT2sat � T3Þ ð19eÞ
Total energy balance : ’mmL2CL2T2 þ ’mmV2hV2 ¼ ’mmV3hV3 þ ’mmL3CL3T3 þ ’mmV2hC2 ð19fÞ
Exergy balance : ’EExdest3 ¼ ð ’EExV2 � ’EExC2Þ þ ð ’EExL2 � ’EExL3Þ � ’EExV3 ð19gÞ
3. RESULTS AND DISCUSSION
3.1. Performance evaluation of the evaporator
A Visual Basic 6.0 program was written to show how the exergetic performance characteristicsof the system vary with varying feed flow rates. The program essentially calculates the heattransfer areas, temperatures, pressures, liquid�vapour flow rates and concentrations in thethree-effect evaporator for a given concentration process. Instead of calculating the overall heattransfer coefficients values (Ui) in the effects, it was preferred to calculate actual (UA)i values inthe effects, to be more realistic. Although boiling side heat transfer coefficients vary with varyingliquid flow rates, it was assumed that the original (UA)i values}calculated from theexperimental values measured under the original operating conditions}would remain nearlyconstant for all the feed flow rates studied for two reasons: the feed flow rates used in thisparametric study were not so much different and boiling side heat transfer coefficients were notdominant for the overall heat transfer coefficient due to their relatively smaller resistance values
Copyright # 2005 John Wiley & Sons, Ltd. Int. J. Energy Res. 2005; 29:455–470
F. BALKAN, N. COLAK AND A. HEPBASLI462
when compared to the conductive resistance of the stainless-steel tubes and fouling factors,especially of juices.
Firstly, with the help of the measurements taken from the existing line operating in theoriginal conditions, Q1 was calculated from Equation (17c) and actual U1A1 from Equation(17e). Similarly, Q2 and actual U2A2 from Equations (18c) and (18e); Q3 and actual U3A3 fromEquations (19c) and (19e), respectively. The new steam temperature and flow rate required for anew feed flow rate to the existing system, with fixed concentration and vacuum in the thirdeffect, were determined by an iterative technique. The effect-to-effect calculations are startedwith a reasonable initial estimate of steam temperature. The calculated (UA)i values arecompared with the original ones. Iterations continue until a satisfactory tolerance is reached.
The polynomial relations for the variations of specific heat and enthalpy of orange juices withtemperature and concentration were obtained with the help of a regression program using thenumerical values of specific heats and enthalpies of orange juices at some temperatures andconcentrations from Mannaperuma and Singh (1989).
The entropies of juices were calculated from Equation (16). The vapours rising from theeffects are slightly superheated due to boiling point rises DTb, therefore their enthalpies werecalculated from hsuperheated=hsaturated+Cpv (DTb), where hsaturated were calculated from thepolynomial obtained from saturated water table. The polynomial regression relations developedwere also used for the condensate enthalpies and entropies.
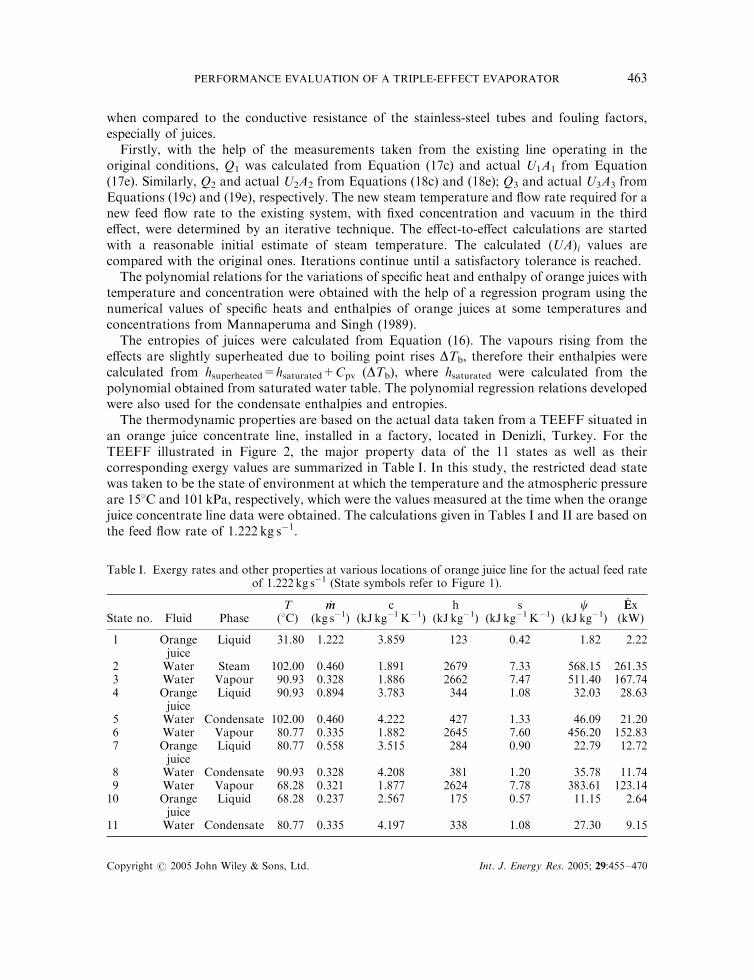
The thermodynamic properties are based on the actual data taken from a TEEFF situated inan orange juice concentrate line, installed in a factory, located in Denizli, Turkey. For theTEEFF illustrated in Figure 2, the major property data of the 11 states as well as theircorresponding exergy values are summarized in Table I. In this study, the restricted dead statewas taken to be the state of environment at which the temperature and the atmospheric pressureare 158C and 101 kPa, respectively, which were the values measured at the time when the orangejuice concentrate line data were obtained. The calculations given in Tables I and II are based onthe feed flow rate of 1.222 kg s�1.
Table I. Exergy rates and other properties at various locations of orange juice line for the actual feed rateof 1.222 kg s�1 (State symbols refer to Figure 1).
T ’mm c h s c ’EExState no. Fluid Phase (8C) (kg s�1) (kJ kg�1K�1) (kJ kg�1) (kJ kg�1K�1) (kJ kg�1) (kW)
1 Orangejuice
Liquid 31.80 1.222 3.859 123 0.42 1.82 2.22
2 Water Steam 102.00 0.460 1.891 2679 7.33 568.15 261.353 Water Vapour 90.93 0.328 1.886 2662 7.47 511.40 167.744 Orange
juiceLiquid 90.93 0.894 3.783 344 1.08 32.03 28.63
5 Water Condensate 102.00 0.460 4.222 427 1.33 46.09 21.206 Water Vapour 80.77 0.335 1.882 2645 7.60 456.20 152.837 Orange
juiceLiquid 80.77 0.558 3.515 284 0.90 22.79 12.72
8 Water Condensate 90.93 0.328 4.208 381 1.20 35.78 11.749 Water Vapour 68.28 0.321 1.877 2624 7.78 383.61 123.1410 Orange
juiceLiquid 68.28 0.237 2.567 175 0.57 11.15 2.64
11 Water Condensate 80.77 0.335 4.197 338 1.08 27.30 9.15
Copyright # 2005 John Wiley & Sons, Ltd. Int. J. Energy Res. 2005; 29:455–470
PERFORMANCE EVALUATION OF A TRIPLE-EFFECT EVAPORATOR 463
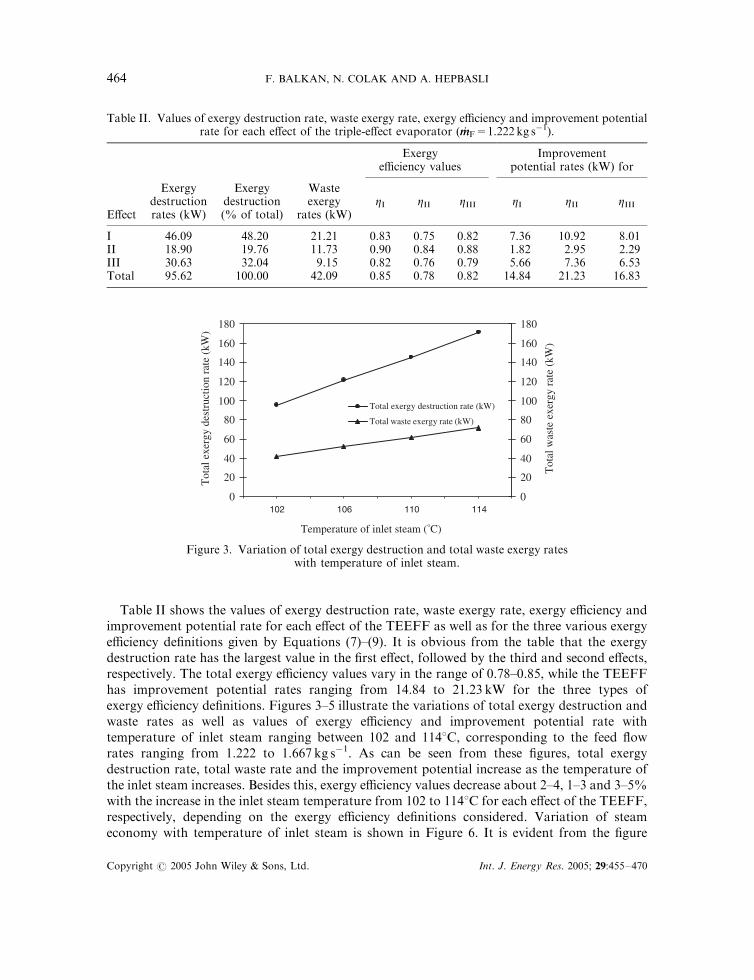
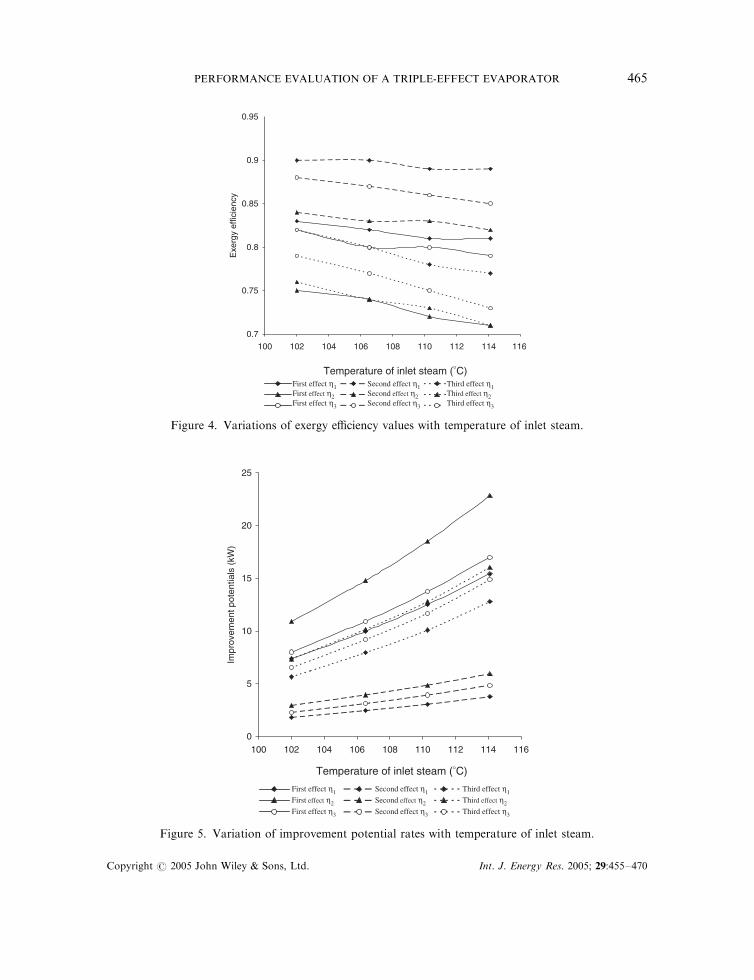
Table II shows the values of exergy destruction rate, waste exergy rate, exergy efficiency andimprovement potential rate for each effect of the TEEFF as well as for the three various exergyefficiency definitions given by Equations (7)–(9). It is obvious from the table that the exergydestruction rate has the largest value in the first effect, followed by the third and second effects,respectively. The total exergy efficiency values vary in the range of 0.78–0.85, while the TEEFFhas improvement potential rates ranging from 14.84 to 21.23 kW for the three types ofexergy efficiency definitions. Figures 3–5 illustrate the variations of total exergy destruction andwaste rates as well as values of exergy efficiency and improvement potential rate withtemperature of inlet steam ranging between 102 and 1148C, corresponding to the feed flowrates ranging from 1.222 to 1.667 kg s�1. As can be seen from these figures, total exergydestruction rate, total waste rate and the improvement potential increase as the temperature ofthe inlet steam increases. Besides this, exergy efficiency values decrease about 2–4, 1–3 and 3–5%with the increase in the inlet steam temperature from 102 to 1148C for each effect of the TEEFF,respectively, depending on the exergy efficiency definitions considered. Variation of steameconomy with temperature of inlet steam is shown in Figure 6. It is evident from the figure
Table II. Values of exergy destruction rate, waste exergy rate, exergy efficiency and improvement potentialrate for each effect of the triple-effect evaporator ( ’mmF=1.222 kg s�1).
Exergyefficiency values
Improvementpotential rates (kW) for
Effect
Exergydestructionrates (kW)
Exergydestruction(% of total)
Wasteexergy
rates (kW)ZI ZII ZIII ZI ZII ZIII
I 46.09 48.20 21.21 0.83 0.75 0.82 7.36 10.92 8.01II 18.90 19.76 11.73 0.90 0.84 0.88 1.82 2.95 2.29III 30.63 32.04 9.15 0.82 0.76 0.79 5.66 7.36 6.53Total 95.62 100.00 42.09 0.85 0.78 0.82 14.84 21.23 16.83
0
20
40
60
80
100
120
140
160
180
102 106 110 114
Temperature of inlet steam (°C)
Tot
al e
xerg
y de
stru
ctio
n ra
te (
kW)
0
20
40
60
80
100
120
140
160
180
Tot
al w
aste
exe
rgy
rate
(kW
)
Total exergy destruction rate (kW)
Total waste exergy rate (kW)
Figure 3. Variation of total exergy destruction and total waste exergy rateswith temperature of inlet steam.
Copyright # 2005 John Wiley & Sons, Ltd. Int. J. Energy Res. 2005; 29:455–470
F. BALKAN, N. COLAK AND A. HEPBASLI464
0.7
0.75
0.8
0.85
0.9
0.95
100 102 104 106 108 110 112 114 116
Temperature of inlet steam (°C)
Exe
rgy
effic
ienc
y
Third effect η1Third effect η2Third effect η3
Second effect η1Second effect η2Second effect η3
First effect η1First effect η2 First effect η3
Figure 4. Variations of exergy efficiency values with temperature of inlet steam.
0
5
10
15
20
25
100 102 104 106 108 110 112 114 116
Temperature of inlet steam (°C)
Impr
ovem
ent p
oten
tials
(kW
)
Third effect η1
Third effect η2
Third effect η3
Second effect η1
Second effect η2
Second effect η3
First effect η1
First effect η2
First effect η3
Figure 5. Variation of improvement potential rates with temperature of inlet steam.
Copyright # 2005 John Wiley & Sons, Ltd. Int. J. Energy Res. 2005; 29:455–470
PERFORMANCE EVALUATION OF A TRIPLE-EFFECT EVAPORATOR 465
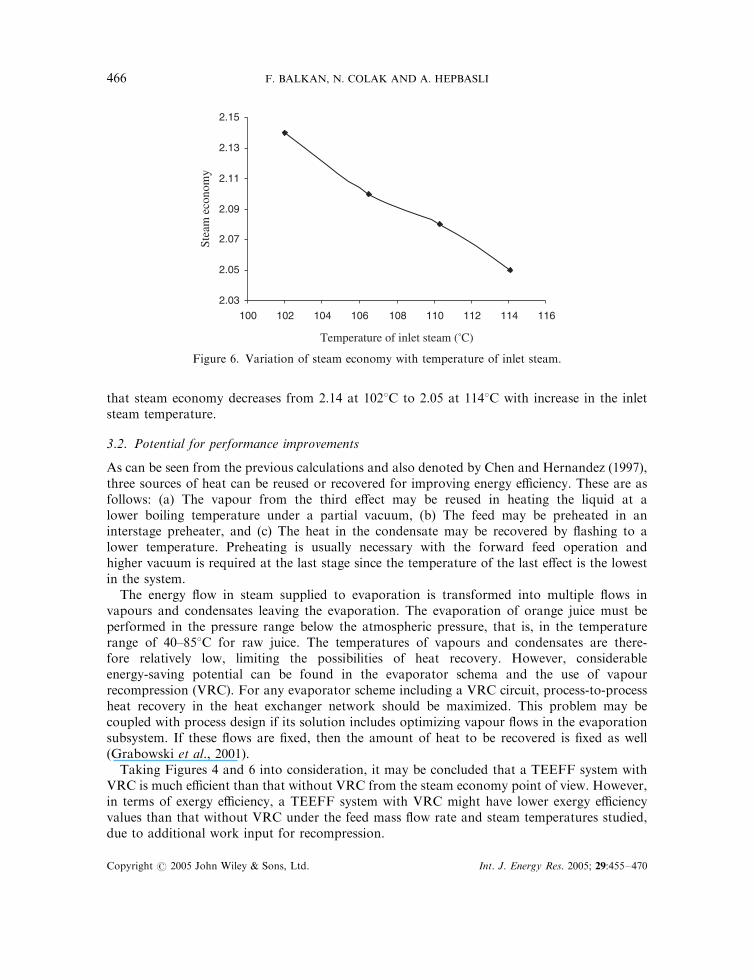
that steam economy decreases from 2.14 at 1028C to 2.05 at 1148C with increase in the inletsteam temperature.
3.2. Potential for performance improvements
As can be seen from the previous calculations and also denoted by Chen and Hernandez (1997),three sources of heat can be reused or recovered for improving energy efficiency. These are asfollows: (a) The vapour from the third effect may be reused in heating the liquid at alower boiling temperature under a partial vacuum, (b) The feed may be preheated in aninterstage preheater, and (c) The heat in the condensate may be recovered by flashing to alower temperature. Preheating is usually necessary with the forward feed operation andhigher vacuum is required at the last stage since the temperature of the last effect is the lowestin the system.
The energy flow in steam supplied to evaporation is transformed into multiple flows invapours and condensates leaving the evaporation. The evaporation of orange juice must beperformed in the pressure range below the atmospheric pressure, that is, in the temperaturerange of 40–858C for raw juice. The temperatures of vapours and condensates are there-fore relatively low, limiting the possibilities of heat recovery. However, considerableenergy-saving potential can be found in the evaporator schema and the use of vapourrecompression (VRC). For any evaporator scheme including a VRC circuit, process-to-processheat recovery in the heat exchanger network should be maximized. This problem may becoupled with process design if its solution includes optimizing vapour flows in the evaporationsubsystem. If these flows are fixed, then the amount of heat to be recovered is fixed as well(Grabowski et al., 2001).
Taking Figures 4 and 6 into consideration, it may be concluded that a TEEFF system withVRC is much efficient than that without VRC from the steam economy point of view. However,in terms of exergy efficiency, a TEEFF system with VRC might have lower exergy efficiencyvalues than that without VRC under the feed mass flow rate and steam temperatures studied,due to additional work input for recompression.
2.03
2.05
2.07
2.09
2.11
2.13
2.15
100 102 104 106 108 110 112 114 116
Temperature of inlet steam (°C)
Stea
m e
cono
my
Figure 6. Variation of steam economy with temperature of inlet steam.
Copyright # 2005 John Wiley & Sons, Ltd. Int. J. Energy Res. 2005; 29:455–470
F. BALKAN, N. COLAK AND A. HEPBASLI466
4. CONCLUSIONS
The performance of a TEEFF, along with its each effect, was evaluated by using exergyanalysis, because the energy analysis alone, which is based on the first law of thermodynamics,is insufficient and is not interested in how much and where the energy is degraded. In thisregard, the exergy analysis, which is based on the second law of thermodynamics, is used tosuccessfully identify the magnitudes and locations of energy degradations. In this study, thedata used were obtained from the measurements made in a TEEFF of an orange juiceconcentrate line installed in a factory, located in Denizli, Turkey. The expressions for anenergy and exergy analysis of a TEEFF were derived using mass, energy and exergy balanceequations. The exergy efficiency values were also calculated using three various exergydefinitions available in the literature. The main conclusions that may be drawn from the presentstudy are listed below.
(a) Exergy efficiency values of the multi-effect evaporator system were found to vary from 75to 90% for the three exergy efficiency definitions considered.
(b) Evaporator performance may also be rated on the basis of steam economy. Steameconomy value was obtained to be 2.14 under the actual operational conditions ofthe TEEFF at a steam inlet temperature of 1028C. Considering the steameconomies reported to range from 2.4 to 2.8, the TEEFF system has a lowersteam economy.
(c) Multi-effect evaporation is one of the ways of re-using vapour formed from the boilingproduct. However, thermal vapour compression and mechanical vapour recompressionare other ways. Application of one of these techniques will considerably decrease theenergy consumption while decreasing exergy efficiency values. Therefore, a TEEFFsystem with VRC seems to be not attractive in terms of exergy efficiency.
(d) ’SSgen should be reduced in order to reduce exergy destructions. For this, the heat transferin the effects should take place with smaller DT ’s, namely; the boiling temperatures inthe effects should be increased within the microorganism stability limits. In case ofworking with the elevated temperatures, the vacuum required will decrease (a reductionin the operating cost), but the heat exchange areas will increase (an increase in the capitalcost). So, a thermoeconomic analysis is required to make this process optimumeconomically and thermodynamically.
(e) The analysis should provide a designer with a better, quantitative grasp of theinefficiencies and their relative magnitudes. Furthermore, the results can draw anengineer’s attention towards the components where the most availability is beingdestroyed and quantify the extent to which modification of one component affects,favourably or unfavourably, the performance of other components of the system.
NOMENCLATURE
A = heat transfer area (m2)C = specific heat (kJ kg�1 K�1)’EE = rate of net energy transfer (kJ s�1 or kW)’EEx = exergy rate (kJ s�1 or kW)
Copyright # 2005 John Wiley & Sons, Ltd. Int. J. Energy Res. 2005; 29:455–470
PERFORMANCE EVALUATION OF A TRIPLE-EFFECT EVAPORATOR 467
h = specific enthalpy (kJ kg�1)’II = rate of irreversibility (exergy destroyed) (kJ s�1)IP = rate of improvement potential (kJ s�1 or kW)’mm = mass flow rate (kg s�1)n = number of effects (dimensionless)P = Pressure (kPa)’QQ = heat transfer rate (kJ s�1 or kW)’SS = rate of entropy (kJ s�1 K�1)SE = steam economy (dimensionless)s = specific entropy (kJ kg�1 K�1)T = temperature (8C)U = overall heat transfer coefficient (W m�2 K�1)’WW = work rate (kJ s�1 or kW)X = weight fraction of dry matter (dimensionless)
Greek symbols
D = differenceZ = exergy efficiency (dimensionless)c = flow exergy (kJ kg�1)
Subscripts
0 = restricted dead state1 = first effect2 = second effect3 = third effecta = ashb = boiling pointc = carbohydrateC = condensatedest= destroyed, destructionex = exergetic, exergyf = fatF = feedfi = fibregen = generationic = incompressible substancein = inletk = locationL = liquidout = outletp = proteinS = steams = solid, solubletl = thick liquor
Copyright # 2005 John Wiley & Sons, Ltd. Int. J. Energy Res. 2005; 29:455–470
F. BALKAN, N. COLAK AND A. HEPBASLI468
V = vapourw = water
Superscript
’ = rate (per unit time)
ACKNOWLEDGEMENTS
The authors wish to acknowledge the actual data provided for this work by Konfrut Inc., Denizli, Turkeyand thank Mr Safak CAGLAYAN, general manager of Konfurt Inc., for his support during the plantstudies. In addition, the valuable comments of the reviewers are gratefully acknowledged.
REFERENCES
Bejan A. 1988. Advanced Engineering Thermodynamics. Wiley: New York.Cengel Y, Boles MA. 2001. Thermodynamics: An Engineering Approach. McGraw- Hill: New York.Chen CS, Hernandez E. 1997. In Handbook of Food Engineering Practice, Valentas KJ, Rotstein E, Singh RP (eds).
CRC Press: USA, 211–252.Choi Y, Okos MR. 1986. Effects of temperature and composition on the thermal properties of foods. In Food
Engineering and Process Applications: Transport Phenomenon, Maguer L, Jelen P (eds), vol. 1. Elsevier: New York,93–101.
Colak N. 2002. Determination of heat and electrical energy required for producing orange juice concentrate under thepractical and theoretical conditions. M.Sc. Thesis, Graduate School of Natural and Applied Sciences, FoodEngineering Science Branch, Pamukkale University, Turkey (in Turkish).
Cornelissen RL. 1997. Thermodynamics and sustainable development: the use of exergy analysis and the reduction ofirreversibility. Ph.D. Thesis, University of Twente, The Netherlands.
Grabowski M, Klemes J, Urbaniec K, Vaccari G, Zhu XX. 2001. Minimum energy consumption in sugar production bycooling crystallization of concentrated raw juice. Applied Thermal Engineering 21:1319–1329.
Hartel RW. 1992. In Handbook of Food Engineering, Heldman DR, Lund DB (eds). Marcel Dekker Inc.: New York,341–392.
Hammond GP, Stapleton AJ. 2001. Exergy analysis of the United Kingdom energy system. Proceedings of the Institutionof Mechanical Engineers 215(2):141–162.
Hepbasli A, Akdemir O. 2004. Energy and exergy analysis of a ground source (geothermal) heat pump system. EnergyConversion and Management 45:737–753.
Holman JP. 2001. Experimental Methods for Engineers (7th edn). McGraw-Hill: New York, 48–143.Kotas TJ. 1985. The Exergy Method of Thermal Plant Analysis. Anchor Brendon Ltd.: Tiptree, Essex, 1985.Krakow KI. 1991. Exergy analysis: dead-state dentition. ASHRAE Transactions 97(1):328–336.Mannaperuma JD, Singh RP. 1989. A computer aided method for the prediction of properties and freezing/thawing
times of foods. Journal of Food Engineering 9: 275.Munsch M, Mohr T, Futtere E. 1993. Analysis of exergy and evaluation of process plants with a flowsheeting system.
International Journal of Chemical Engineering 33:197–205.Rahman S. 1995. Food Properties Handbook. CRC Press: US, 225–271.Rosen MA, Dincer I. 2001. Exergy as the confluence of energy, environment and sustainable development. Exergy, an
International Journal 1(1):3–13.Rosen MA, Dincer I. 2003. Exergy-cost-energy-mass analysis of thermal systems and processes. Energy Conservation and
Management 44:1633–1651.Rumsey TR. 1986. Energy use in evaporation of liquid foods. In Energy in Food Processing, Singh RP (ed.), vol. 1.
Energy in World Agriculture. Elsevier Science Publishers BV: The Netherlands, 191–202.Singh RP. 1992. In Handbook of Food Engineering, Heldman DR, Lund DB (eds). Marcel Dekker Inc.: New York,
247–276.Syahrul S, Hamdullahpur F, Dincer I. 2002. Exergy analysis of fluid bed drying of moist particles. Exergy, an
International Journal 2:87–98.
Copyright # 2005 John Wiley & Sons, Ltd. Int. J. Energy Res. 2005; 29:455–470
PERFORMANCE EVALUATION OF A TRIPLE-EFFECT EVAPORATOR 469
Szargut J, Morris DR, Stewart FR. 1988. Exergy Analysis of Thermal, Chemical and Metallurgical Processes. New York.Tekin T, Bayramoglu M. 1998. Exergy loss minimization analysis of sugar production process from sugar beet.
Transactions of the IchemE 76:149–154.Van Gool W. 1997. Energy policy: fairly tales and factualities. In Innovation and Technology}Strategies and Policies,
Soares ODD, Martins da Cruz A, Costa Pereira G, Soares IMRT, Reis AJPS (eds). Kluwer: Dordrecht, 93–105.Wall G. 2003. Exergy tools. Proceedings of the Institution of Mechanical Engineers. Wilson Applied Science &
Technology Abstracts Plus Text, 125–136.Wogler TC, Weissman W. 1988. Thermodynamic availability analysis for maximizing system efficiency. Chemical
Engineering Progress 85:57–63.
Copyright # 2005 John Wiley & Sons, Ltd. Int. J. Energy Res. 2005; 29:455–470
F. BALKAN, N. COLAK AND A. HEPBASLI470
Recommended