Embed Size (px)
Citation preview

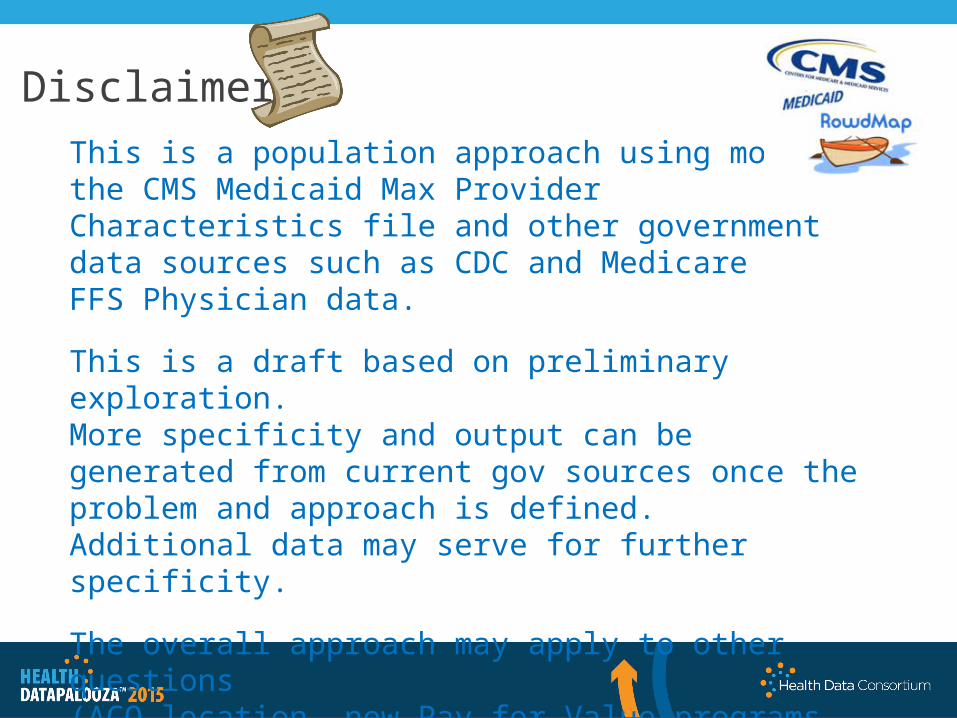
Disclaimers
This is a population approach using most the CMS Medicaid Max Provider Characteristics file and other government data sources such as CDC and Medicare FFS Physician data.
This is a draft based on preliminary exploration. More specificity and output can be generated from current gov sources once the problem and approach is defined. Additional data may serve for further specificity.
The overall approach may apply to other questions (ACO location, new Pay-for-Value programs geographic risk and over/under coding assessment, etc.).
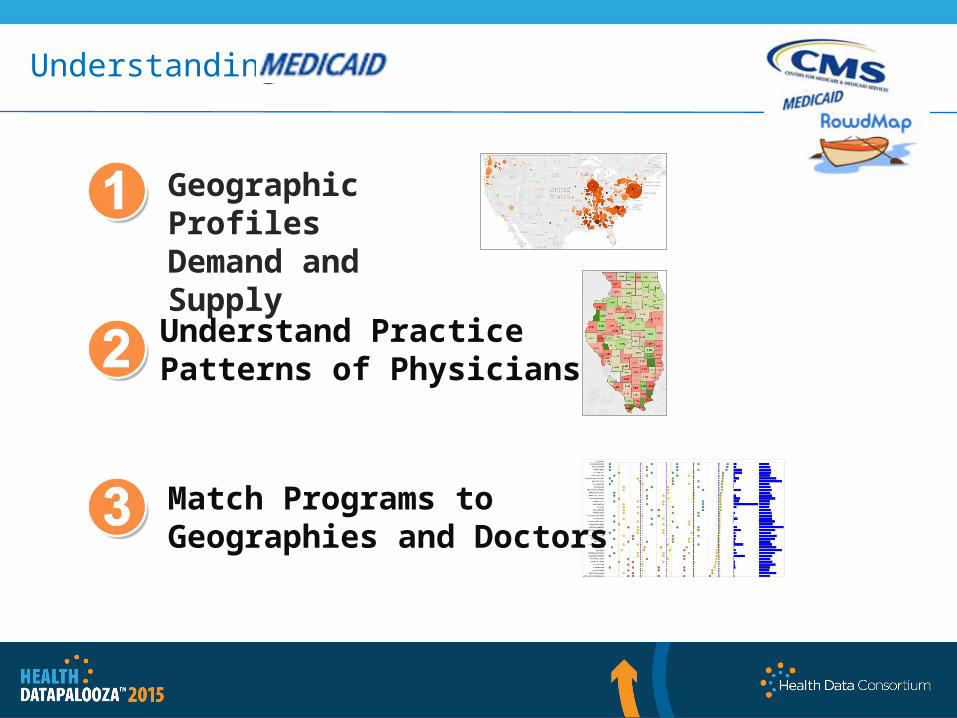
Understanding
Geographic Profiles Demand and Supply
Understand Practice Patterns of Physicians
Match Programs toGeographies and Doctors

Diabetes Prevalence – Cook County, IL
Tactics: People use this data to allocate providers and care management resources around condition-specific population needs by zip.
Locate retail clinics, RVs and health fairs based on chronic needs.
Income
Obesity
Depression
Geographic Profiles
Lots of diabetics but few PCPs
Lots of diabetics and lots of PCPs
What type of populations?
PCP Density –Cook County, IL
Chronic Prevalence
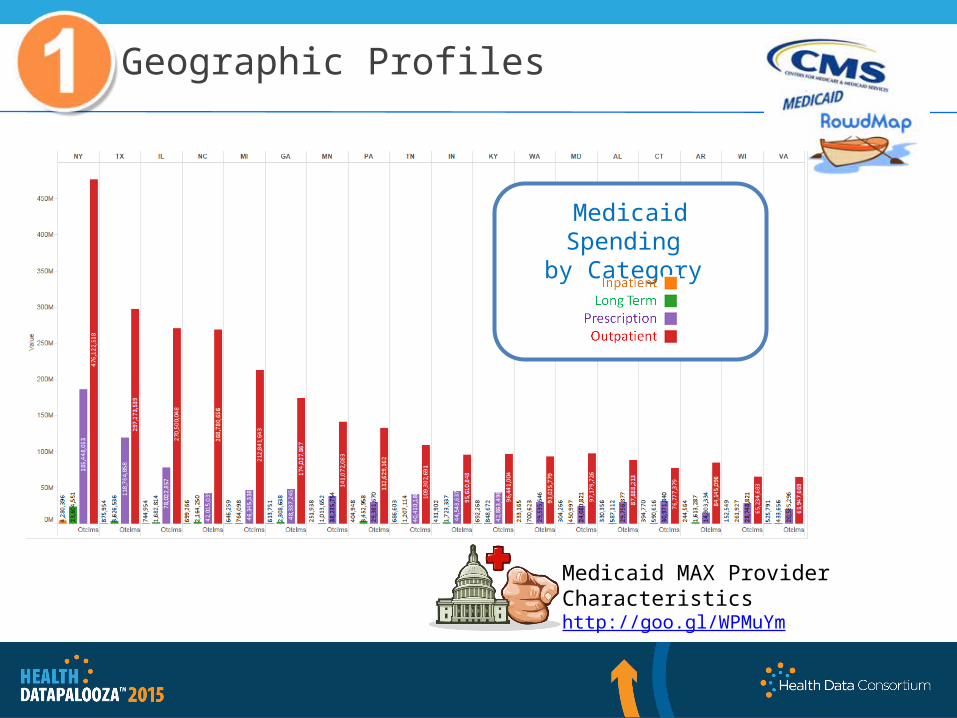
Medicaid Spending by Category
Medicaid MAX Provider Characteristicshttp://goo.gl/WPMuYm
Geographic Profiles
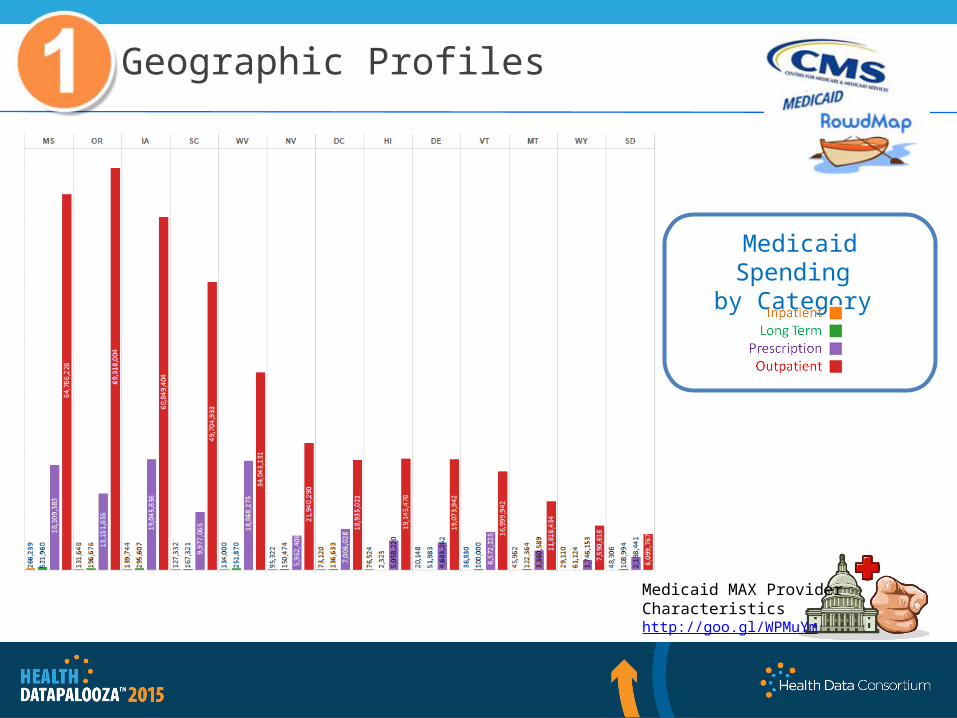
Medicaid MAX Provider Characteristicshttp://goo.gl/WPMuYm
Medicaid Spending by Category
Geographic Profiles

Medicaid Provider Supply
Medicaid Utilization
Size of Circle: Number of Claims
Medicaid MAX Provider Characteristicshttp://goo.gl/WPMuYm
Geographic Profiles
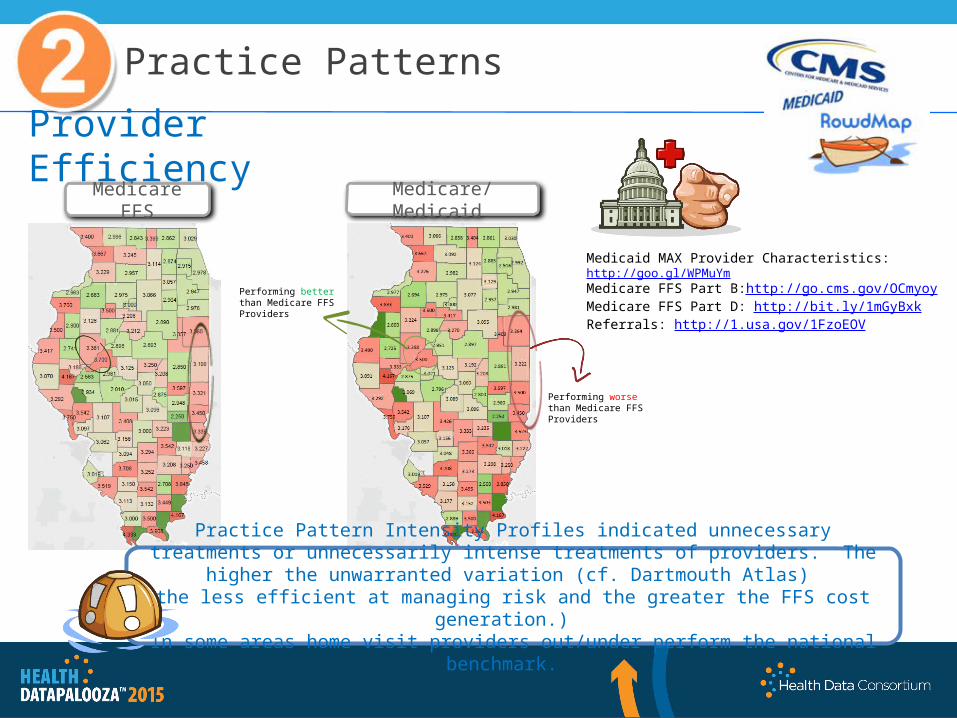
Provider Efficiency Medicare FFS Medicare/Medicaid
Performing worse than Medicare FFS Providers
Performing better than Medicare FFS Providers
Practice Pattern Intensity Profiles indicated unnecessary treatments or unnecessarily intense treatments of providers. The higher the unwarranted variation (cf. Dartmouth Atlas)
the less efficient at managing risk and the greater the FFS cost generation.) In some areas home visit providers out/under perform the national benchmark.
Medicaid MAX Provider Characteristics: http://goo.gl/WPMuYmMedicare FFS Part B:http://go.cms.gov/OCmyoy Medicare FFS Part D: http://bit.ly/1mGyBxkReferrals: http://1.usa.gov/1FzoEOV
Practice Patterns
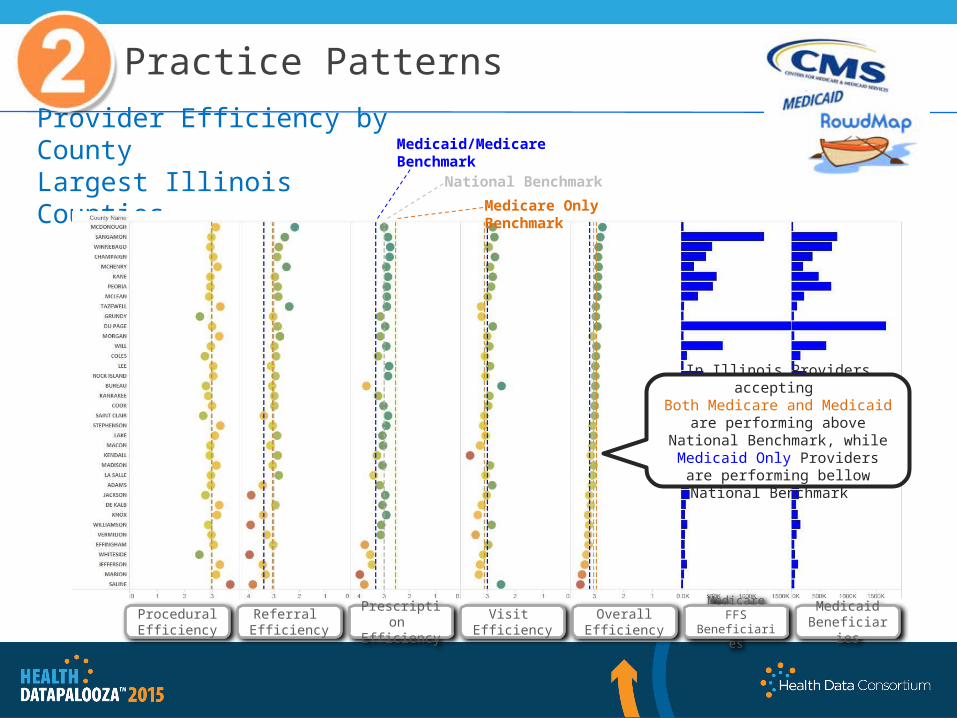
Provider Efficiency by CountyLargest Illinois Counties
Medicare Only Benchmark
National Benchmark
Medicaid/Medicare Benchmark
In Illinois Providers accepting Both Medicare and Medicaid are
performing above National Benchmark, while Medicaid Only Providers are performing bellow
National Benchmark
Procedural Efficiency
Referral Efficiency
Prescription Efficiency
Visit Efficiency
Overall Efficiency
Medicare FFS Beneficiaries
Medicaid Beneficiaries
Practice Patterns

Match Programs
Individual Provider Scores Largest (by Medicaid Panel) in Cook County, IL
Low Unnecessary Spend / No Value Care
HighUnnecessary Spend / No Value Care
Procedural Efficiency
Referral Efficiency
Prescription Efficiency
Visit Efficiency
Overall Efficiency
Medicare FFS Beneficiaries
Medicaid Beneficiaries
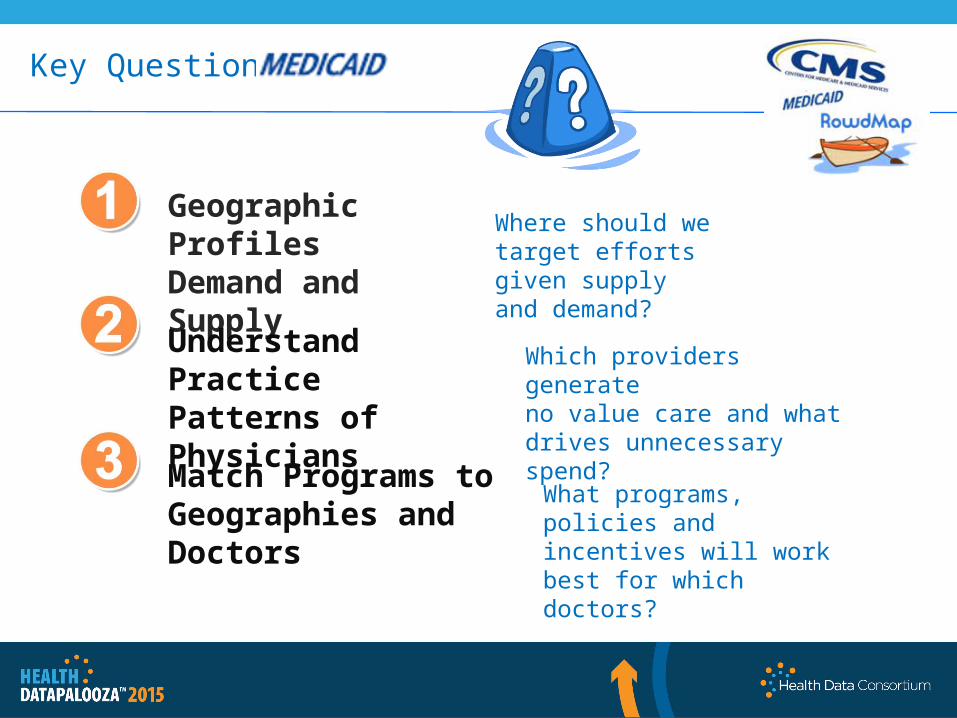
Key Questions
Geographic Profiles Demand and Supply
Understand Practice Patterns of Physicians
Match Programs toGeographies and Doctors
Where should we target efforts given supply and demand?
Which providers generate no value care and what drives unnecessary spend?
What programs, policies and incentives will work best for which doctors?