Embed Size (px)
Citation preview

Pneumonia Phenotypes Pneumonia Phenotypes – the Alphabet Soup– the Alphabet Soup
Charles Feldman
Professor of Pulmonology and Chief PhysicianCharlotte Maxeke Johannesburg Academic Hospital
University of the Witwatersrand
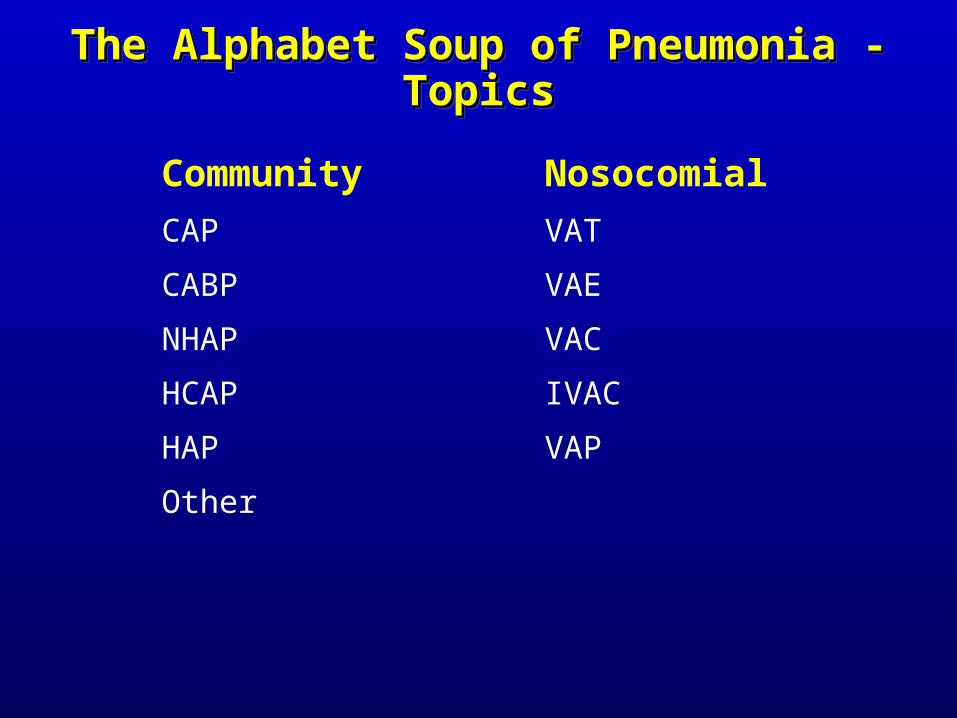
The Alphabet Soup of Pneumonia - TopicsThe Alphabet Soup of Pneumonia - TopicsThe Alphabet Soup of Pneumonia - TopicsThe Alphabet Soup of Pneumonia - Topics
Community Nosocomial
CAP VAT
CABP VAE
NHAP VAC
HCAP IVAC
HAP VAP
Other

Pneumonia occurring >48 hours after endotracheal intubation
Risk factors for MDR bacteria causing VAP
Presence of HCAP or HAP risk factors for MDR
VAP
Pneumonia occurring > 48 hours after hospital admission
Risk factors for MDR bacteria causing HAP
Antibiotic therapy within 90 days of infection
Current hospitalization of ≥5 days
High frequency of antibiotic resistance in community or specific hospital unit
Immunosuppressive disease of therapy
Presence of HCAP risk factors for MDR
HAP
Anand N et al. Semin Respir Crit Care Med 2009; 30: 3-9
The Alphabet Soup of PneumoniaThe Alphabet Soup of PneumoniaThe Alphabet Soup of PneumoniaThe Alphabet Soup of Pneumonia
Pneumonia occurring ≤ 48 hours of hospital admission in patients who do not meet the criteria for HCAP
CAP
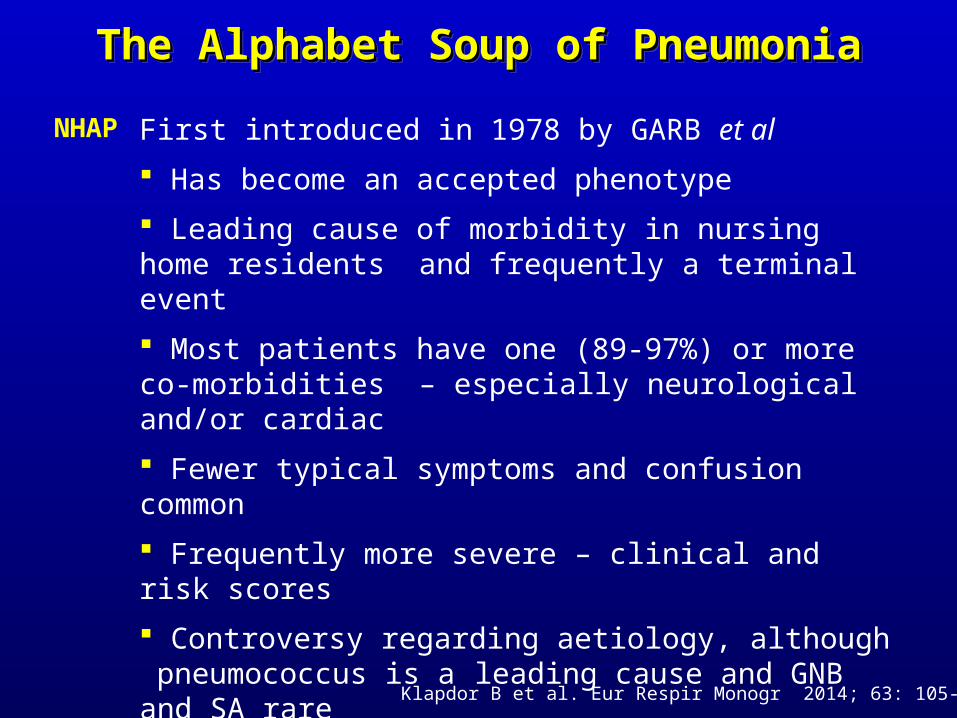
First introduced in 1978 by GARB et al
Has become an accepted phenotype
Leading cause of morbidity in nursing home residents and frequently a terminal event
Most patients have one (89-97%) or more co-morbidities – especially neurological and/or cardiac
Fewer typical symptoms and confusion common
Frequently more severe – clinical and risk scores
Controversy regarding aetiology, although pneumococcus is a leading cause and GNB and SA rare
Mortality is higher
NHAP
Klapdor B et al. Eur Respir Monogr 2014; 63: 105-116
The Alphabet Soup of PneumoniaThe Alphabet Soup of PneumoniaThe Alphabet Soup of PneumoniaThe Alphabet Soup of Pneumonia
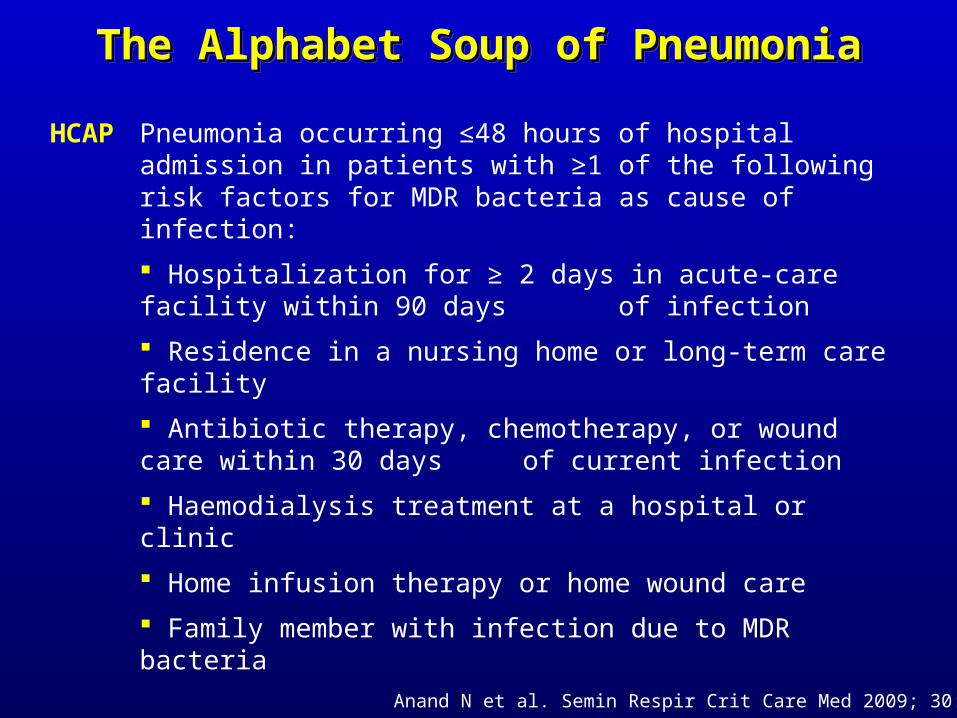
Pneumonia occurring ≤48 hours of hospital admission in patients with ≥1 of the following risk factors for MDR bacteria as cause of infection:
Hospitalization for ≥ 2 days in acute-care facility within 90 days of infection
Residence in a nursing home or long-term care facility
Antibiotic therapy, chemotherapy, or wound care within 30 days of current infection
Haemodialysis treatment at a hospital or clinic
Home infusion therapy or home wound care
Family member with infection due to MDR bacteria
HCAP
The Alphabet Soup of PneumoniaThe Alphabet Soup of PneumoniaThe Alphabet Soup of PneumoniaThe Alphabet Soup of Pneumonia
Anand N et al. Semin Respir Crit Care Med 2009; 30: 3-9
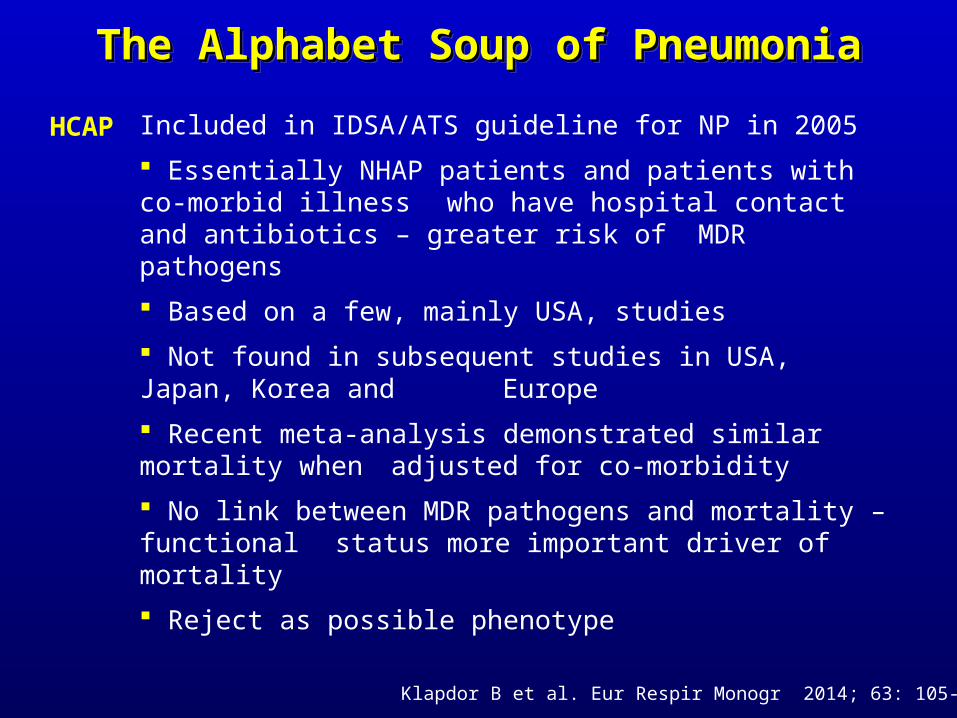
Included in IDSA/ATS guideline for NP in 2005
Essentially NHAP patients and patients with co-morbid illness who have hospital contact and antibiotics – greater risk of
MDR pathogens
Based on a few, mainly USA, studies
Not found in subsequent studies in USA, Japan, Korea and Europe
Recent meta-analysis demonstrated similar mortality when adjusted for co-morbidity
No link between MDR pathogens and mortality – functional status more important driver of mortality
Reject as possible phenotype
HCAP
The Alphabet Soup of PneumoniaThe Alphabet Soup of PneumoniaThe Alphabet Soup of PneumoniaThe Alphabet Soup of Pneumonia
Klapdor B et al. Eur Respir Monogr 2014; 63: 105-116
0 5 10 15 20 25
Patient mortality
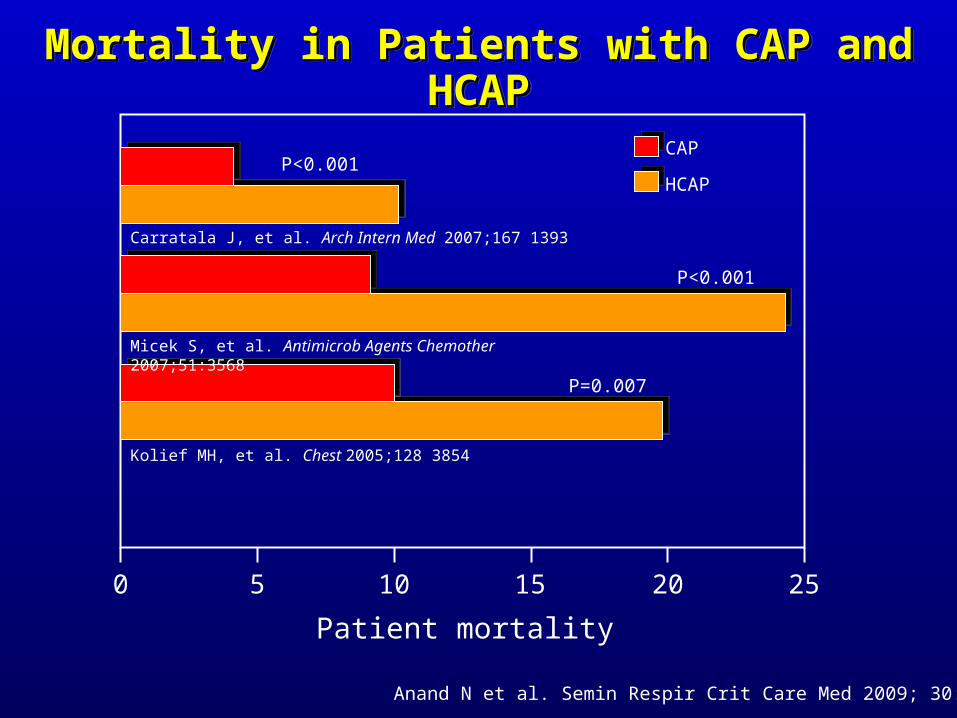
Kolief MH, et al. Chest 2005;128 3854
Micek S, et al. Antimicrob Agents Chemother 2007;51:3568
Carratala J, et al. Arch Intern Med 2007;167 1393
P=0.007
P<0.001
P<0.001CAP
HCAP
Mortality in Patients with CAP and HCAPMortality in Patients with CAP and HCAPMortality in Patients with CAP and HCAPMortality in Patients with CAP and HCAP
Anand N et al. Semin Respir Crit Care Med 2009; 30: 3-9
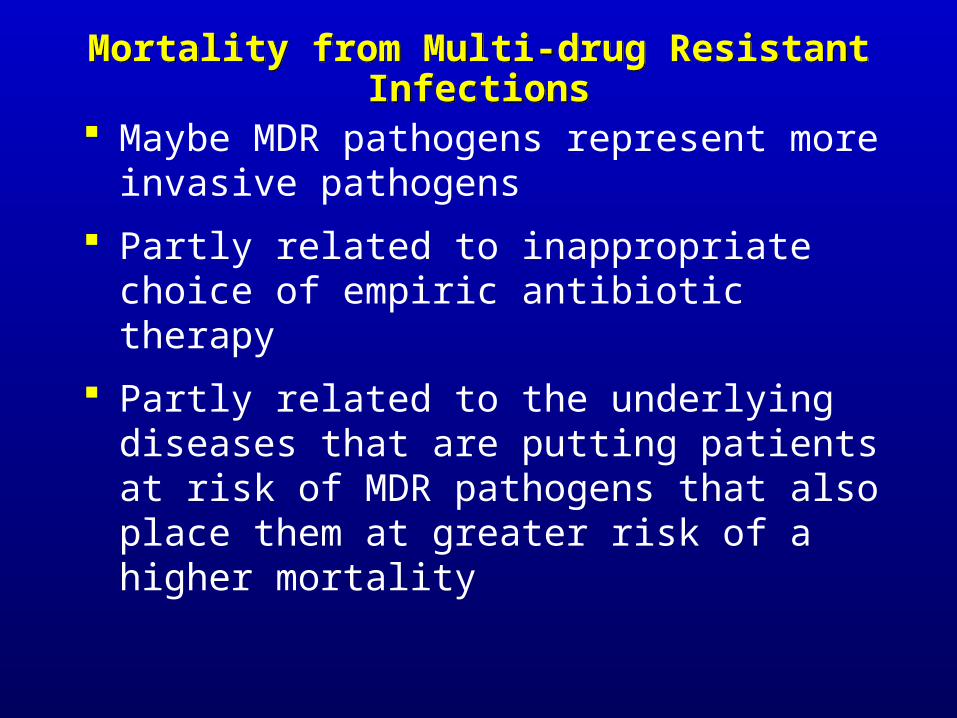
Mortality from Multi-drug Resistant InfectionsMortality from Multi-drug Resistant Infections
Maybe MDR pathogens represent more invasive pathogens
Partly related to inappropriate choice of empiric antibiotic therapy
Partly related to the underlying diseases that are putting patients at risk of MDR pathogens that also place them at greater risk of a higher mortality
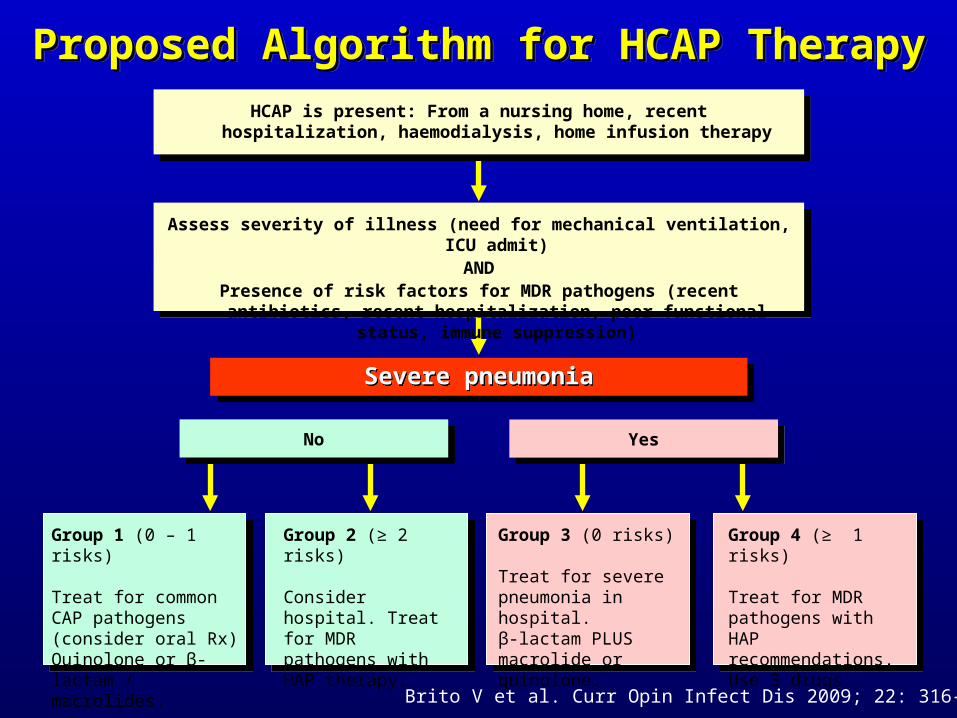
Proposed Algorithm for HCAP TherapyProposed Algorithm for HCAP TherapyProposed Algorithm for HCAP TherapyProposed Algorithm for HCAP Therapy
Severe pneumoniaSevere pneumonia
Assess severity of illness (need for mechanical ventilation, ICU admit)AND
Presence of risk factors for MDR pathogens (recent antibiotics, recent hospitalization, poor functional status, immune suppression)
HCAP is present: From a nursing home, recent hospitalization, haemodialysis, home infusion therapy
No Yes
Group 1 (0 – 1 risks)
Treat for common CAP pathogens (consider oral Rx) Quinolone or β-lactam / macrolides.
Group 2 (≥ 2 risks)
Consider hospital. Treat for MDR pathogens with HAP therapy.
Group 3 (0 risks)
Treat for severe pneumonia in hospital. β-lactam PLUS macrolide or quinolone.
Group 4 (≥ 1 risks)
Treat for MDR pathogens with HAP recommendations. Use 3 drugs.
Brito V et al. Curr Opin Infect Dis 2009; 22: 316-325

Isolated Pathogens in CAP and HCAP PatientsIsolated Pathogens in CAP and HCAP Patients
Gram-positive pathogens
MRSA
MSSA
Streptococcus pneumoniae
Gram-negative pathogens
Pseudomonas aeruginosa
Escherichia coli
Haemophilus influenzae
Klebsiella pneumoniae
Enterobacter species
Acinetobacter baumannii
Stenotrophomonas maltophilia
Others
Atypical pathogens
Mycoplasma pneumoniae
Legionella pneumophila
Fungal pathogens
9 (5.2)
15 (8.7)
55 (32.0)
23 (13.4)
2 (1.2)
4 (2.3)
26 (15.1)
4 (2.3)
1 (0.6)
2 (1.2)
10 (5.8)
26 (15.1)
1 (0.6)
1 (0.6
CAP(n=172)
CAP(n=172)
HCAP(n=167)HCAP
(n=167)
18 (10.8)
11 (6.6)
22 (13.2)
35 (21.0)
5 (3.0)
2 (1.2)
45 (26.9)
9 (5.4)
4 (2.4)
2 (1.2)
12 (7.2)
5 (3.0)
0 (0)
1 (0.6)
P-valueP-value
0.059
-
<0.001
0.064
-
-
0.007
-
-
-
-
<0.001
-
-
Park SC et al. Respiratory Medicine 2012; 106: 1131-1319
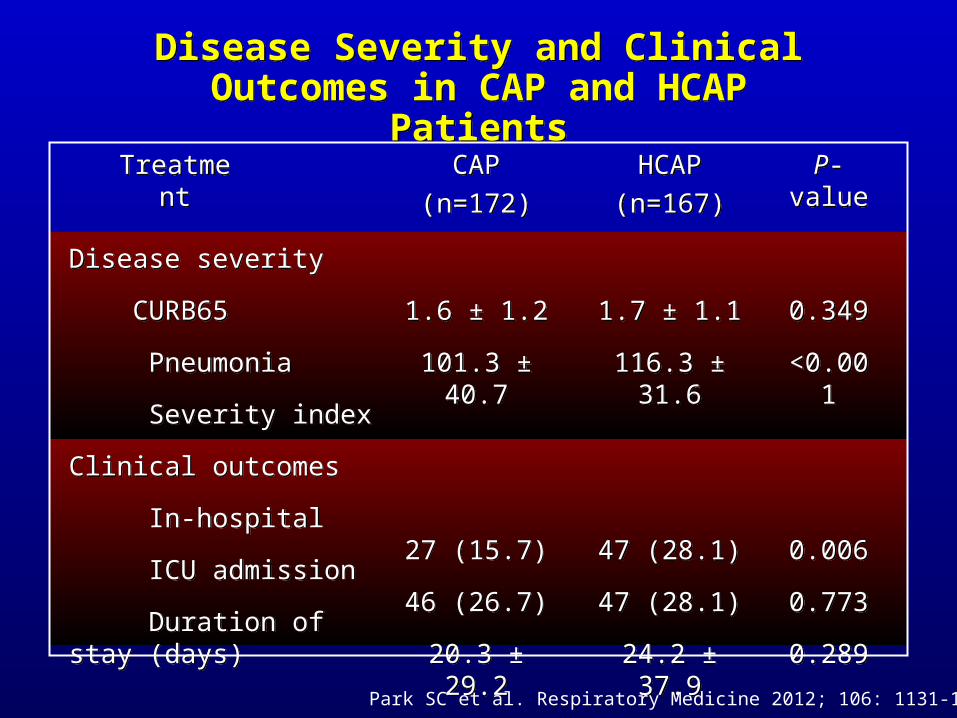
Disease Severity and Clinical Outcomes in CAP and HCAP Patients
Disease Severity and Clinical Outcomes in CAP and HCAP Patients
Disease severity
CURB65
Pneumonia
Severity index
Clinical outcomes
In-hospital
ICU admission
Duration of stay (days)
Disease severity
CURB65
Pneumonia
Severity index
Clinical outcomes
In-hospital
ICU admission
Duration of stay (days)
1.6 ± 1.2
101.3 ± 40.7
27 (15.7)
46 (26.7)
20.3 ± 29.2
1.6 ± 1.2
101.3 ± 40.7
27 (15.7)
46 (26.7)
20.3 ± 29.2
1.7 ± 1.1
116.3 ± 31.6
47 (28.1)
47 (28.1)
24.2 ± 37.9
1.7 ± 1.1
116.3 ± 31.6
47 (28.1)
47 (28.1)
24.2 ± 37.9
0.349
<0.001
0.006
0.773
0.289
0.349
<0.001
0.006
0.773
0.289
CAP
(n=172)
CAP
(n=172)
HCAP
(n=167)
HCAP
(n=167)
P-valueP-valueTreatmentTreatment
Park SC et al. Respiratory Medicine 2012; 106: 1131-1319
0
20
40
60
80P
aie
nts
with
PD
R p
ath
oge
ns (
%)
0
n=165
1
n=77
2
n=93
4
n=4
Number of HCAP risk factors
P > 0.01 for trend
0
20
40
60
80
0 - 2
n=185
Total score
P > 0.01 for trend
3 - 5
n=95
≥ 6
n=59
Risk of PDR Pathogens in HCAPRisk of PDR Pathogens in HCAPRisk of PDR Pathogens in HCAPRisk of PDR Pathogens in HCAP
Park SC et al. Respiratory Medicine 2012; 106: 1131-1319
100
80
60
40
20
0
0 20 40
100-Specifity
80 100
Sen
sitiv
ityNew scoring
system
Current HCAP criteria
Park SC et al. Respiratory Medicine 2012; 106: 1131-1319
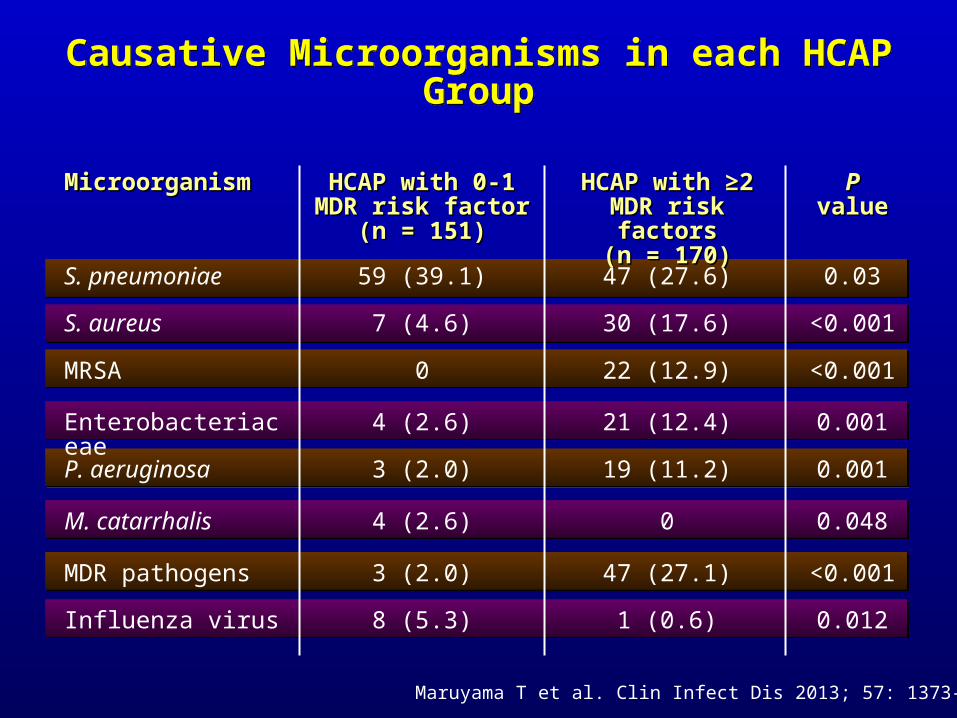
Causative Microorganisms in each HCAP GroupCausative Microorganisms in each HCAP Group
MicroorganismMicroorganism HCAP with ≥2 MDR HCAP with ≥2 MDR risk factorsrisk factors
(n = 170)(n = 170)
HCAP with 0-1 HCAP with 0-1 MDR risk factorMDR risk factor
(n = 151)(n = 151)
PP value value
S. pneumoniae 59 (39.1) 47 (27.6) 0.03
S. aureus 7 (4.6) 30 (17.6) <0.001
MRSA 0 22 (12.9) <0.001
Enterobacteriaceae 4 (2.6) 21 (12.4) 0.001
P. aeruginosa 3 (2.0) 19 (11.2) 0.001
M. catarrhalis 4 (2.6) 0 0.048
MDR pathogens 3 (2.0) 47 (27.1) <0.001
Influenza virus 8 (5.3) 1 (0.6) 0.012
Maruyama T et al. Clin Infect Dis 2013; 57: 1373-1383
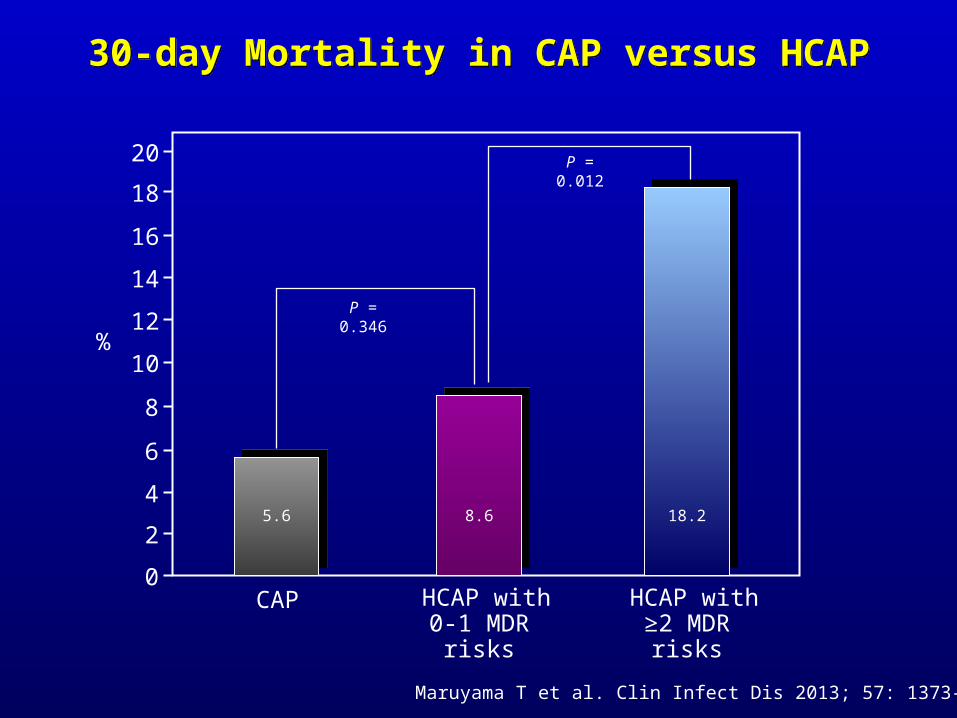
20
18
16
14
12
10
8
6
4
2
0
%
CAP
5.6
HCAP with 0-1 MDR risks
8.6
HCAP with ≥2 MDR risks
18.2
P = 0.346
P = 0.012
Maruyama T et al. Clin Infect Dis 2013; 57: 1373-1383
30-day Mortality in CAP versus HCAP30-day Mortality in CAP versus HCAP

Definitions of CAP and HCAP Guideline Definitions of CAP and HCAP Guideline Concordant Therapy (not ICU patients)Concordant Therapy (not ICU patients)Definitions of CAP and HCAP Guideline Definitions of CAP and HCAP Guideline Concordant Therapy (not ICU patients)Concordant Therapy (not ICU patients)
β-lactam + macrolide Respiratory fluoroquinolone
CG-CAP therapyCG-CAP therapy CG-HCAP therapyCG-HCAP therapy
Antipseudomonal β-lactam + antipseudomonal fluoroquinolone + vancomycin or linezolid
Antipseudomonal β-lactam + aminoglycoside plus vancomycin or linezolid
Attridge RT et al. Eur Respir J 2011; 38: 878-887
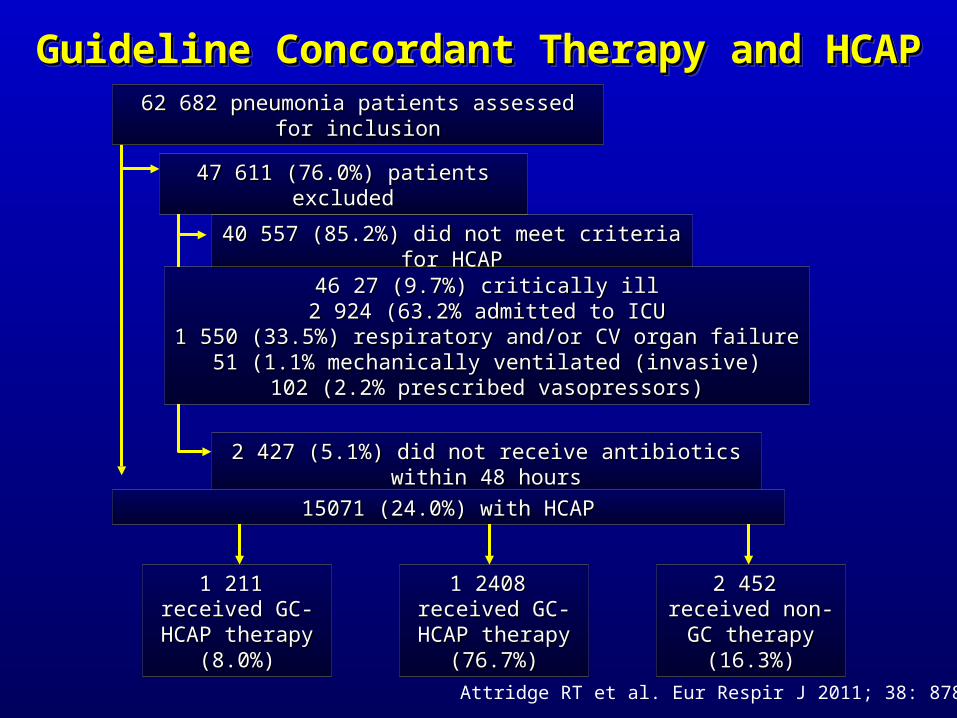
62 682 pneumonia patients assessed for inclusion62 682 pneumonia patients assessed for inclusion
47 611 (76.0%) patients excluded47 611 (76.0%) patients excluded
40 557 (85.2%) did not meet criteria for HCAP40 557 (85.2%) did not meet criteria for HCAP
46 27 (9.7%) critically ill46 27 (9.7%) critically ill2 924 (63.2% admitted to ICU2 924 (63.2% admitted to ICU
1 550 (33.5%) respiratory and/or CV organ failure1 550 (33.5%) respiratory and/or CV organ failure51 (1.1% mechanically ventilated (invasive)51 (1.1% mechanically ventilated (invasive)
102 (2.2% prescribed vasopressors)102 (2.2% prescribed vasopressors)
2 427 (5.1%) did not receive antibiotics within 48 hours2 427 (5.1%) did not receive antibiotics within 48 hours
15071 (24.0%) with HCAP15071 (24.0%) with HCAP
1 2408 received 1 2408 received GC-HCAP GC-HCAP
therapy (76.7%)therapy (76.7%)
1 211 received 1 211 received GC-HCAP GC-HCAP
therapy (8.0%)therapy (8.0%)
2 452 received 2 452 received non-GC therapy non-GC therapy
(16.3%)(16.3%)
Attridge RT et al. Eur Respir J 2011; 38: 878-887
Guideline Concordant Therapy and HCAPGuideline Concordant Therapy and HCAPGuideline Concordant Therapy and HCAPGuideline Concordant Therapy and HCAP
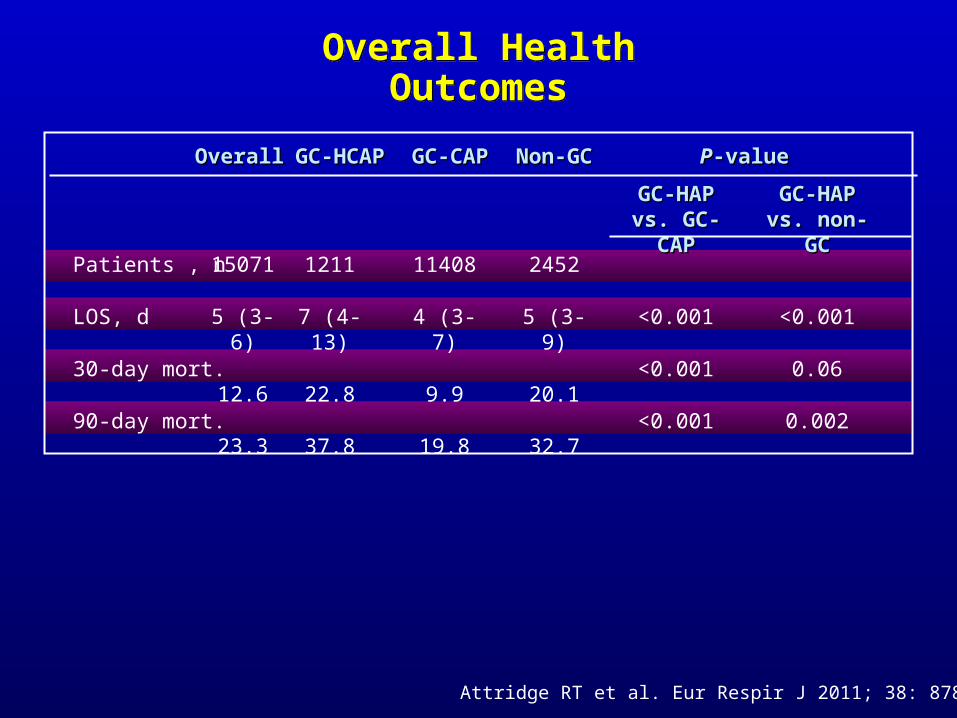
Overall Health OutcomesOverall Health Outcomes
OverallOverall
Patients , n
LOS, d
30-day mort.
90-day mort.
GC-CAPGC-CAPGC-HCAPGC-HCAP Non-GCNon-GC PP-value-value
1211
7 (4-13)
22.8
37.8
GC-HAP vs. GC-HAP vs. GC-CAPGC-CAP
GC-HAP vs. GC-HAP vs. non-GCnon-GC
11408
4 (3-7)
9.9
19.8
2452
5 (3-9)
20.1
32.7
<0.001
<0.001
<0.001
<0.001
0.06
0.002
Attridge RT et al. Eur Respir J 2011; 38: 878-887
15071
5 (3-6)
12.6
23.3
4040
3535
3030
2525
2020
1515
1010
55
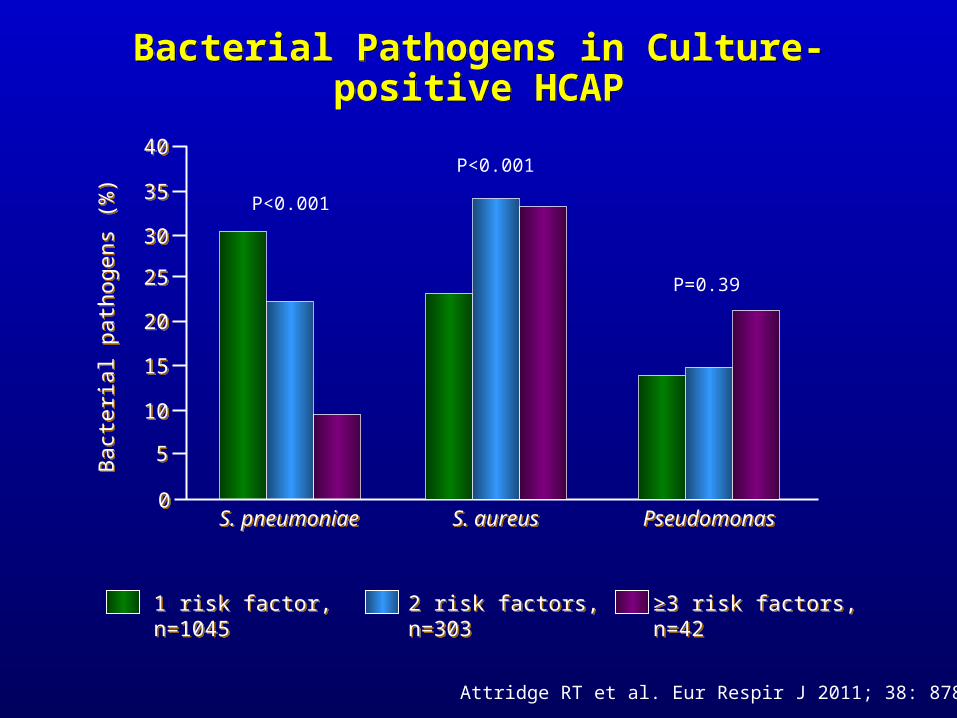
00
Bac
teria
l pat
hoge
ns (
%)
Bac
teria
l pat
hoge
ns (
%)
S. pneumoniaeS. pneumoniae S. aureusS. aureus PseudomonasPseudomonas
1 risk factor, n=10451 risk factor, n=1045 2 risk factors, n=3032 risk factors, n=303 ≥3 risk factors, n=42≥3 risk factors, n=42
Bacterial Pathogens in Culture-positive HCAPBacterial Pathogens in Culture-positive HCAP
Attridge RT et al. Eur Respir J 2011; 38: 878-887
P<0.001
P<0.001
P=0.39
3535
3030
2020
2525
1515
1010
55
00
Mor
talit
y (%
)M
orta
lity
(%)
30-day30-day 90-day90-day
1 risk factor, n=116731 risk factor, n=11673
2 risk factors, n=30792 risk factors, n=3079
≥3 risk factors, n=319≥3 risk factors, n=319
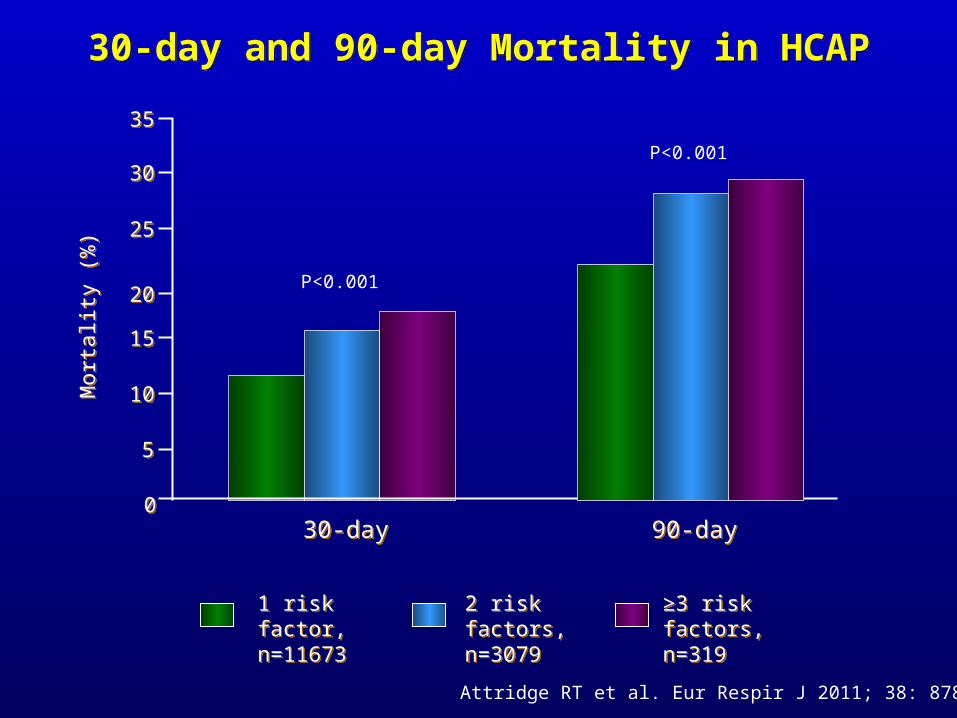
30-day and 90-day Mortality in HCAP30-day and 90-day Mortality in HCAP
Attridge RT et al. Eur Respir J 2011; 38: 878-887
P<0.001
P<0.001
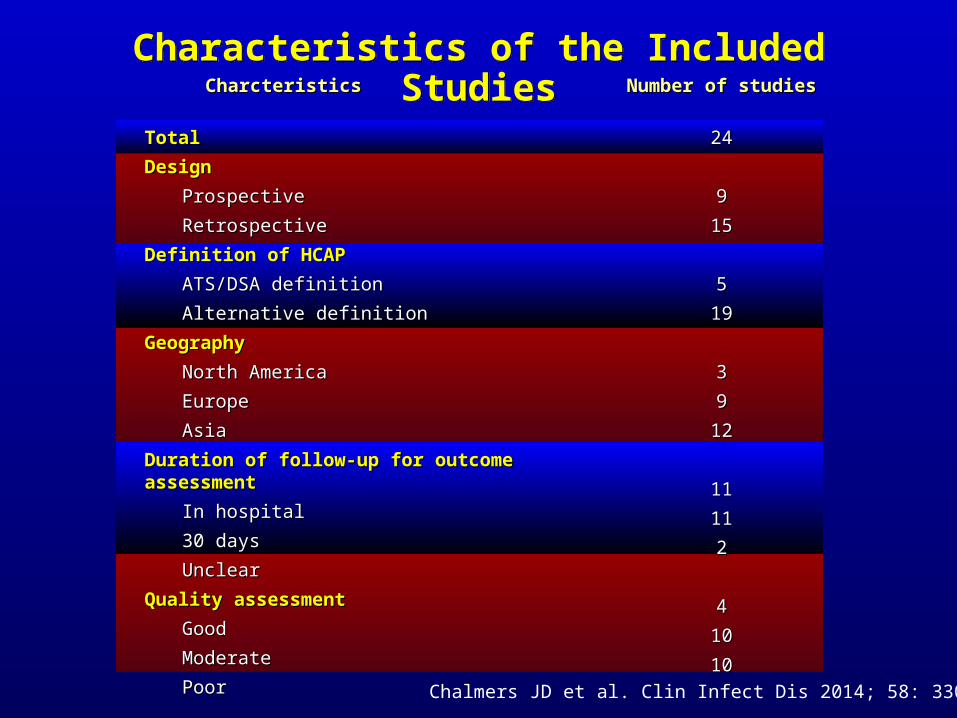
Characteristics of the Included StudiesCharacteristics of the Included StudiesCharcteristicsCharcteristics
TotalTotal
DesignDesign
ProspectiveProspective
RetrospectiveRetrospective
Definition of HCAPDefinition of HCAP
ATATS/DSA definitionS/DSA definition
Alternative definitionAlternative definition
GeographyGeography
North AmericaNorth America
EuropeEurope
AsiaAsia
Duration of follow-up for outcome assessmentDuration of follow-up for outcome assessment
In hospitalIn hospital
30 days30 days
UnclearUnclear
Quality assessmentQuality assessment
GoodGood
ModerateModerate
PoorPoor
Number of studiesNumber of studies
2424
99
1515
55
1919
33
99
1212
1111
1111
22
44
1010
1010
Chalmers JD et al. Clin Infect Dis 2014; 58: 330-339
COMMUNITY-ACQUIRED
CABP
CAP in the elderly
CAP in the younger patient
CAP in COPD patients
Aspiration pneumonia
Other Considerations
The Alphabet Soup of PneumoniaThe Alphabet Soup of PneumoniaThe Alphabet Soup of PneumoniaThe Alphabet Soup of Pneumonia

In the ER, CAP should be suspected on the grounds of typical clinical symptoms/signs and confirmed with chest radiograph
In elderly and patients with altered mental state, CAP should be considered even without typical symptoms
Once diagnosed assessment should be made of severity – e.g. PSI, CURB-65, CRB-65
According to risk, site of care should be identified
Assess risk of MDR pathogens Antibiotic therapy based on severity and MDR
risk
Approach to CAP ManagementApproach to CAP ManagementApproach to CAP ManagementApproach to CAP Management
Klapdor B et al. Eur Respir Monogr 2014; 63: 105-116
HOSPITAL-ACQUIRED PNEUMONIA
VENTILATOR-ASSOCIATED
VA Tracheobronchitis (VAT)
VA Event (VAE)
VA Condition (VAC)
Infection-related VAC (IVAC)
VAP
Other Considerations
The Alphabet Soup of PneumoniaThe Alphabet Soup of PneumoniaThe Alphabet Soup of PneumoniaThe Alphabet Soup of Pneumonia
Klapdor B et al. Eur Respir Monogr 2014; 63: 105-116
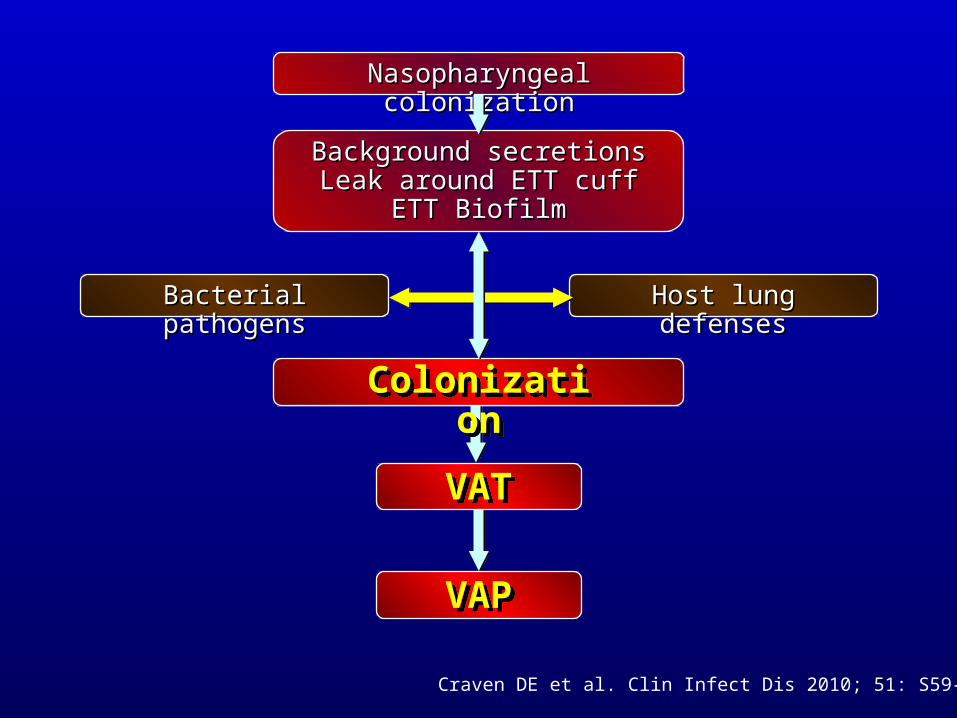
Nasopharyngeal colonizationNasopharyngeal colonization
Background secretionsBackground secretionsLeak around ETT cuffLeak around ETT cuff
ETT BiofilmETT Biofilm
Host lung defensesHost lung defensesBacterial pathogensBacterial pathogens
ColonizationColonization
VATVAT
VAPVAP
Craven DE et al. Clin Infect Dis 2010; 51: S59-S66
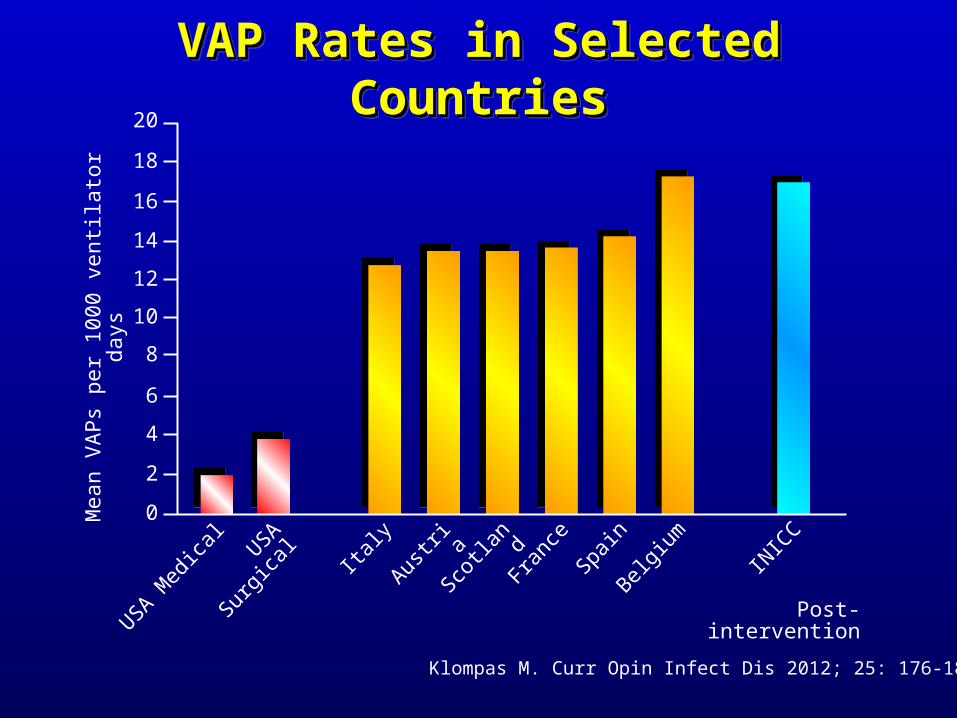
VAP Rates in Selected CountriesVAP Rates in Selected CountriesVAP Rates in Selected CountriesVAP Rates in Selected Countries
20
18
16
14
12
10
Mea
n V
AP
s pe
r 10
00 v
entil
ator
day
s
6
4
2
0
8
USA Med
ical
USA Sur
gica
l
Italy
Austri
aSco
tland
Franc
eSpa
inBel
gium
INIC
C
Post-intervention
Klompas M. Curr Opin Infect Dis 2012; 25: 176-182
10.0
9.0
8.0
7.0
6.0
5.0
4.0
3.0
2.0
1.0
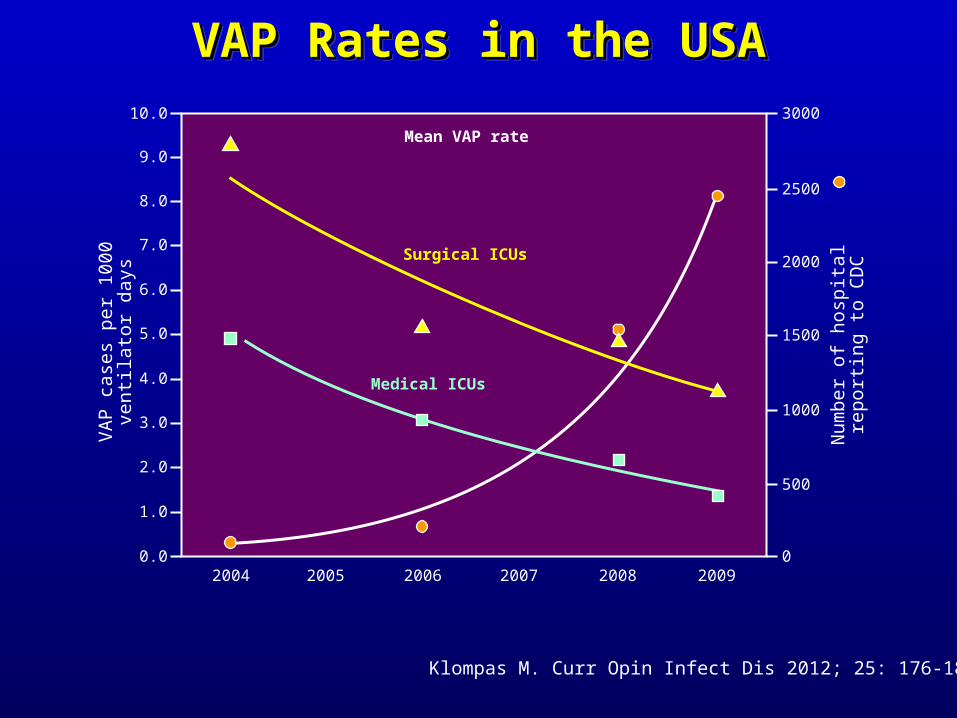
0.02004 2005 2006 2007 2008 2009
1500
2000
1000
2500
3000
500
0
VA
P c
ases
per
100
0 ve
ntila
tor
days
Num
ber
of
hosp
ital r
epor
ting
to C
DC
Surgical ICUs
Medical ICUs
Mean VAP rate
Klompas M. Curr Opin Infect Dis 2012; 25: 176-182
VAP Rates in the USAVAP Rates in the USAVAP Rates in the USAVAP Rates in the USA
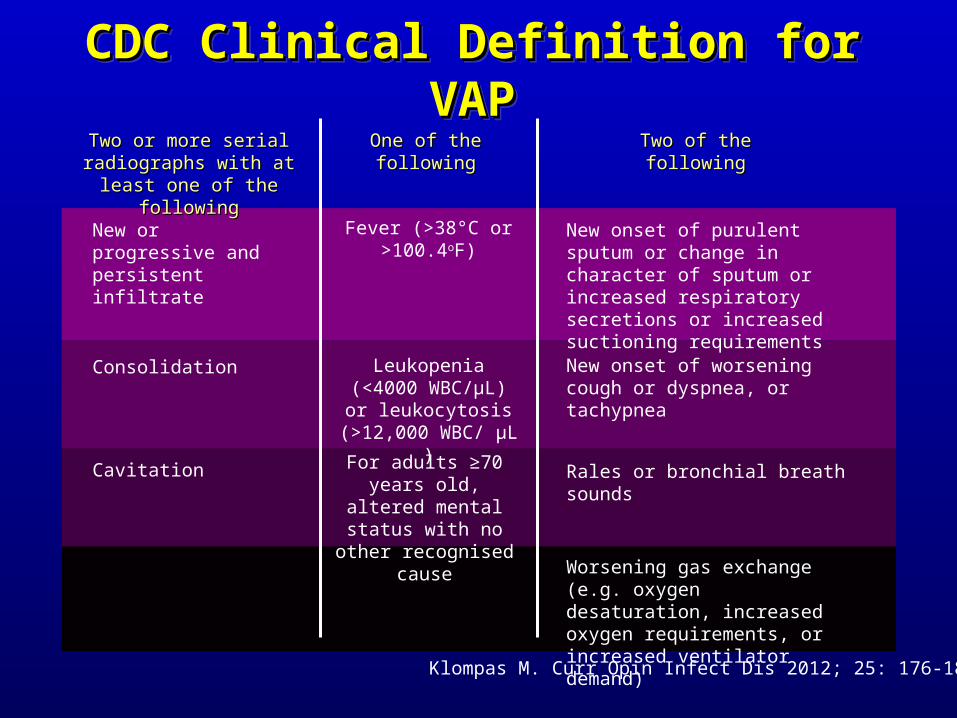
New onset of purulent sputum or change in character of sputum or increased respiratory secretions or increased suctioning requirements
Two of the Two of the followingfollowing
New or progressive and persistent infiltrate
One of the One of the followingfollowing
Two or more serial Two or more serial radiographs with at least radiographs with at least
one of the followingone of the following
New onset of worsening cough or dyspnea, or tachypnea
Leukopenia (<4000 WBC/µL) or
leukocytosis (>12,000 WBC/ µL )
Consolidation
Rales or bronchial breath soundsFor adults ≥70 years old, altered mental status with no other recognised cause
Cavitation
Worsening gas exchange (e.g. oxygen desaturation, increased oxygen requirements, or increased ventilator demand)
Klompas M. Curr Opin Infect Dis 2012; 25: 176-182
CDC Clinical Definition for VAPCDC Clinical Definition for VAPCDC Clinical Definition for VAPCDC Clinical Definition for VAP
Fever (>38°C or >100.4oF)
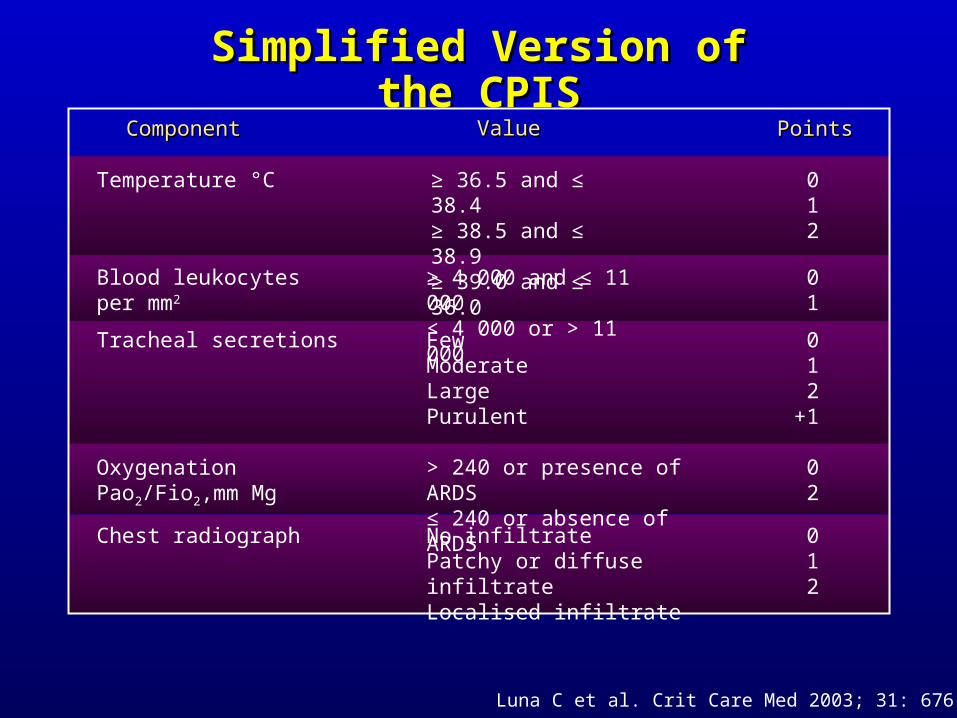
Simplified Version of the CPISSimplified Version of the CPIS
ValueValueComponentComponent
Temperature °C
PointsPoints
≥ 36.5 and ≤ 38.4≥ 38.5 and ≤ 38.9≥ 39.0 and ≤ 36.0
≥ 4 000 and ≤ 11 000< 4 000 or > 11 000
Blood leukocytes per mm2
012
01
FewModerateLargePurulent
Tracheal secretions 012
+1
> 240 or presence of ARDS≤ 240 or absence of ARDS
Oxygenation Pao2/Fio2,mm Mg
02
No infiltratePatchy or diffuse infiltrateLocalised infiltrate
Chest radiograph 012
Luna C et al. Crit Care Med 2003; 31: 676-682
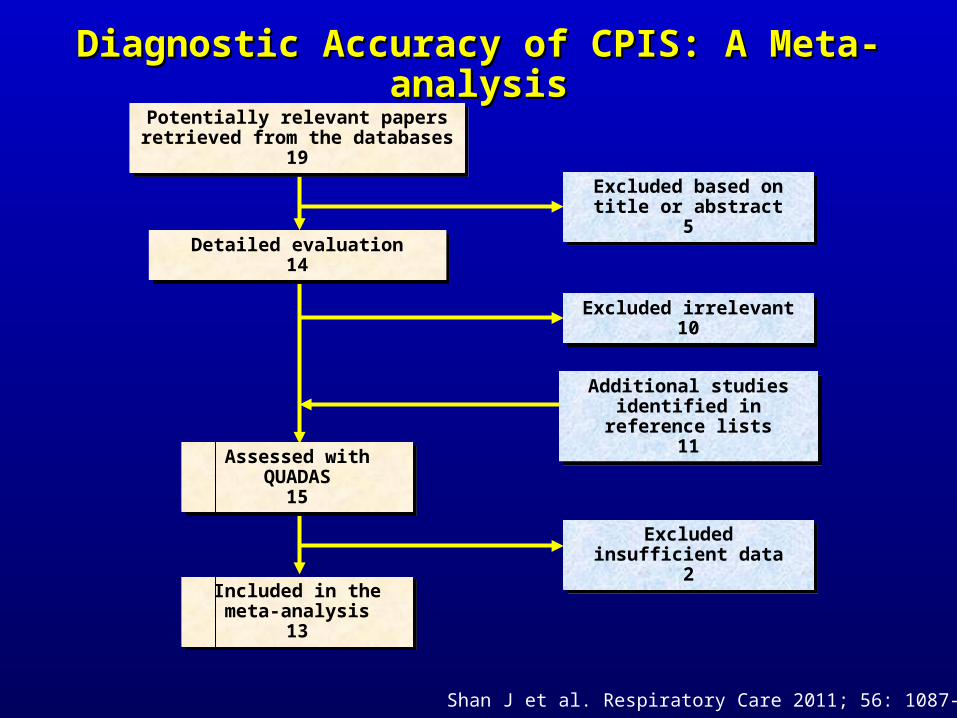
Diagnostic Accuracy of CPIS: A Meta-analysisDiagnostic Accuracy of CPIS: A Meta-analysis
Detailed evaluation14
Detailed evaluation14
Assessed with QUADAS
15
Assessed with QUADAS
15
Included in the meta-analysis
13
Included in the meta-analysis
13
Potentially relevant papers retrieved from the databases
19
Potentially relevant papers retrieved from the databases
19
Excluded based on title or abstract
5
Excluded based on title or abstract
5
Excluded irrelevant10
Excluded irrelevant10
Additional studies identified in reference lists
11
Additional studies identified in reference lists
11
Excluded insufficient data
2
Excluded insufficient data
2
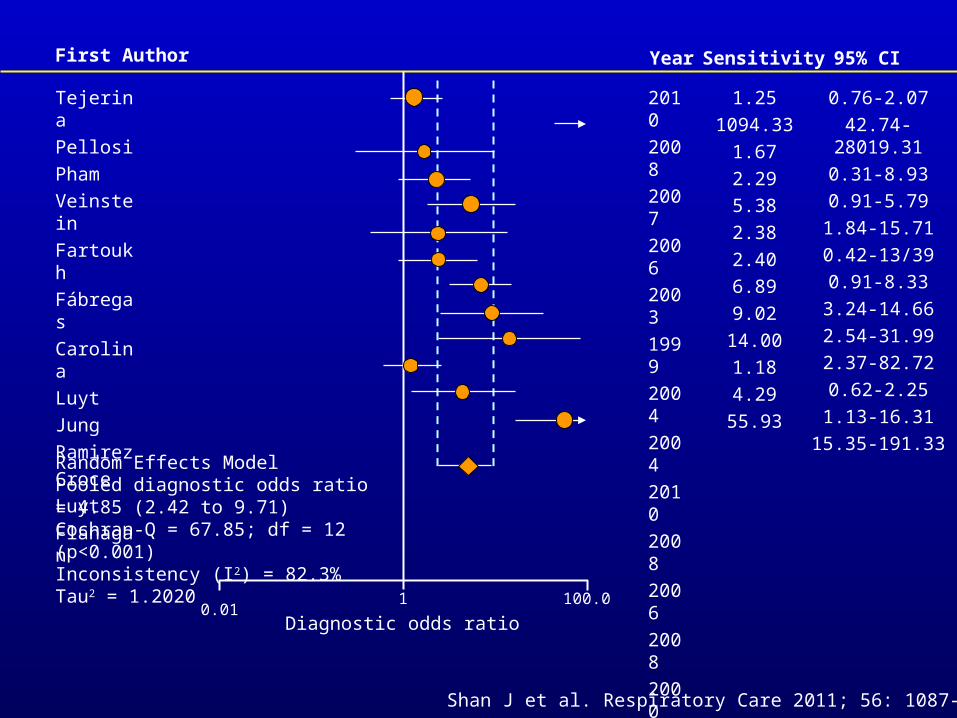
Shan J et al. Respiratory Care 2011; 56: 1087-1094
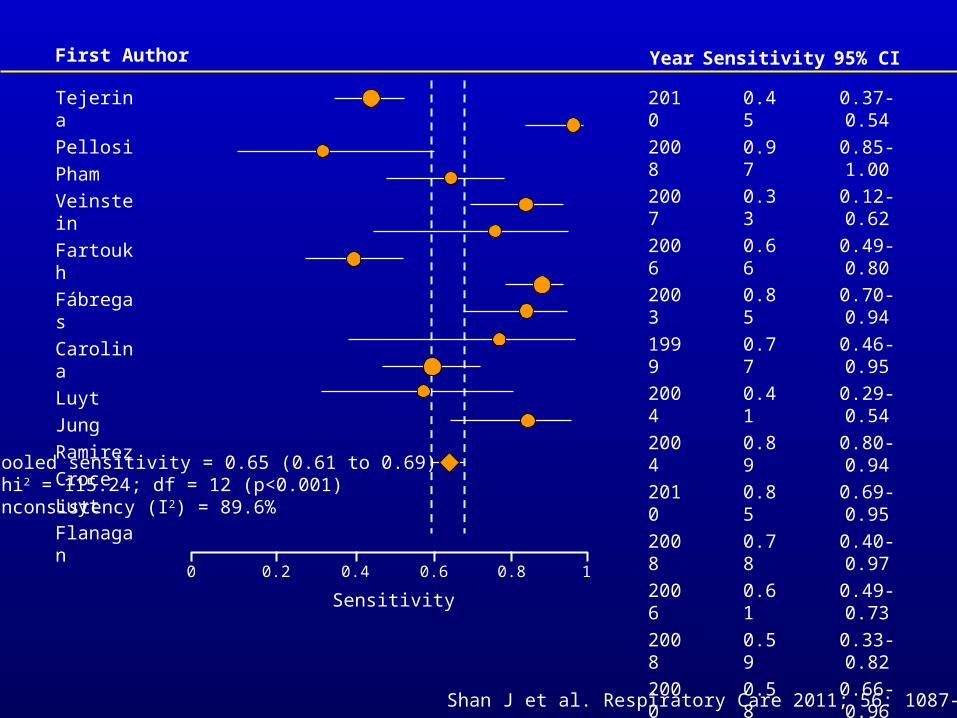
Tejerina
Pellosi
Pham
Veinstein
Fartoukh
Fábregas
Carolina
Luyt
Jung
Ramirez
Croce
Luyt
Flanagan
2010
2008
2007
2006
2003
1999
2004
2004
2010
2008
2006
2008
2000
0.45
0.97
0.33
0.66
0.85
0.77
0.41
0.89
0.85
0.78
0.61
0.59
0.58
0.37-0.54
0.85-1.00
0.12-0.62
0.49-0.80
0.70-0.94
0.46-0.95
0.29-0.54
0.80-0.94
0.69-0.95
0.40-0.97
0.49-0.73
0.33-0.82
0.66-0.96
95% CISensitivityYearFirst Author
Pooled sensitivity = 0.65 (0.61 to 0.69)Chi2 = 115.24; df = 12 (p<0.001)Inconsistency (I2) = 89.6%
0 0.2 0.4 0.6 0.8 1
Sensitivity
Shan J et al. Respiratory Care 2011; 56: 1087-1094
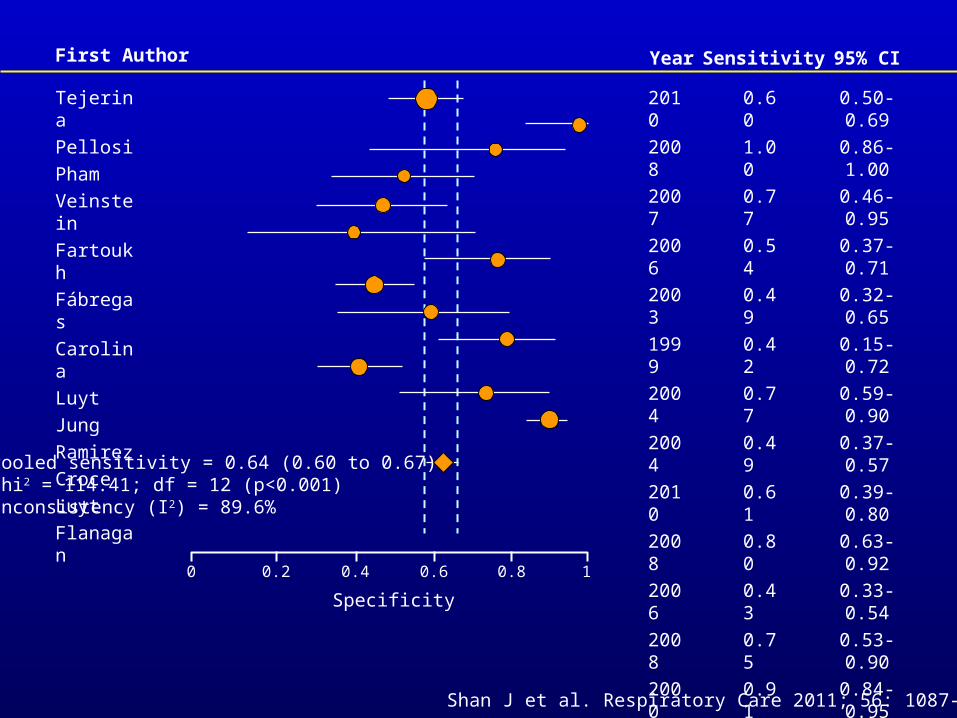
Tejerina
Pellosi
Pham
Veinstein
Fartoukh
Fábregas
Carolina
Luyt
Jung
Ramirez
Croce
Luyt
Flanagan
2010
2008
2007
2006
2003
1999
2004
2004
2010
2008
2006
2008
2000
0.60
1.00
0.77
0.54
0.49
0.42
0.77
0.49
0.61
0.80
0.43
0.75
0.91
0.50-0.69
0.86-1.00
0.46-0.95
0.37-0.71
0.32-0.65
0.15-0.72
0.59-0.90
0.37-0.57
0.39-0.80
0.63-0.92
0.33-0.54
0.53-0.90
0.84-0.95
95% CISensitivityYearFirst Author
Pooled sensitivity = 0.64 (0.60 to 0.67)Chi2 = 114.41; df = 12 (p<0.001)Inconsistency (I2) = 89.6%
0 0.2 0.4 0.6 0.8 1
Specificity
Shan J et al. Respiratory Care 2011; 56: 1087-1094
Tejerina
Pellosi
Pham
Veinstein
Fartoukh
Fábregas
Carolina
Luyt
Jung
Ramirez
Croce
Luyt
Flanagan
2010
2008
2007
2006
2003
1999
2004
2004
2010
2008
2006
2008
2000
1.25
1094.33
1.67
2.29
5.38
2.38
2.40
6.89
9.02
14.00
1.18
4.29
55.93
0.76-2.07
42.74-28019.31
0.31-8.93
0.91-5.79
1.84-15.71
0.42-13/39
0.91-8.33
3.24-14.66
2.54-31.99
2.37-82.72
0.62-2.25
1.13-16.31
15.35-191.33
95% CISensitivityYearFirst Author
Random Effects ModelPooled diagnostic odds ratio = 4.85 (2.42 to 9.71)Cochran-Q = 67.85; df = 12 (p<0.001)Inconsistency (I2) = 82.3%Tau2 = 1.2020
0.011 100.0
Diagnostic odds ratio
Shan J et al. Respiratory Care 2011; 56: 1087-1094
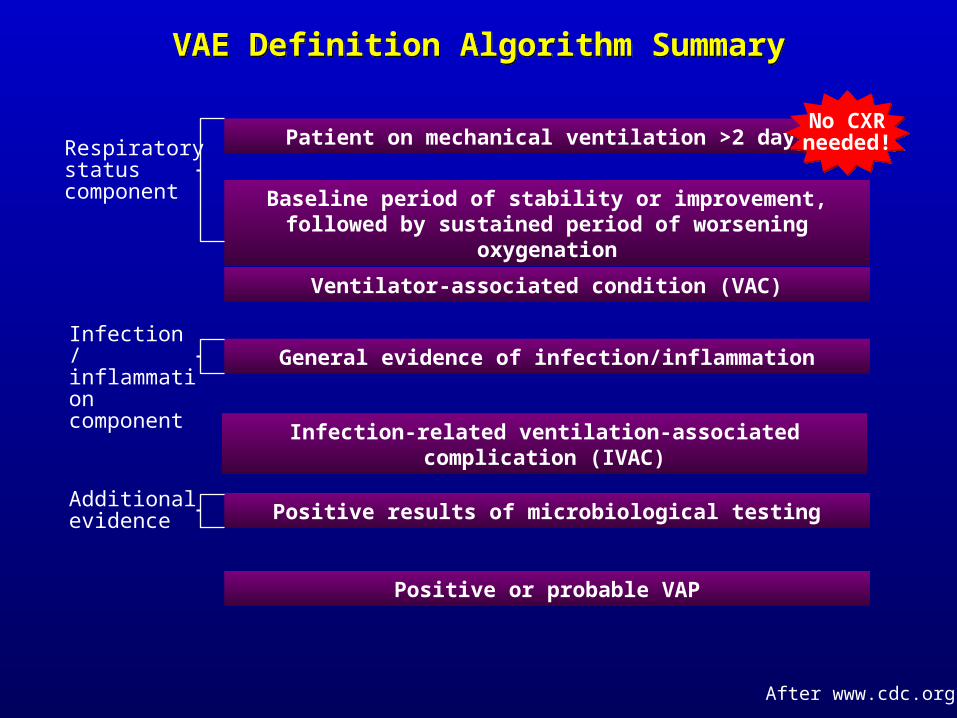
VAE Definition Algorithm SummaryVAE Definition Algorithm Summary
Respiratory status component
Patient on mechanical ventilation >2 days
Baseline period of stability or improvement, followed by sustained period of worsening oxygenation
Ventilator-associated condition (VAC)
General evidence of infection/inflammation
Infection-related ventilation-associated complication (IVAC)
Positive or probable VAP
Positive results of microbiological testing
Infection / inflammation component
Additional evidence
No CXR needed!
After www.cdc.org

Did not meet Did not meet criteriacriterian=39n=39
Did not meet Did not meet criteriacriterian=52n=52
Did not meet Did not meet criteriacriterian=76n=76
EnrolledEnrolledn=10n=10
EnrolledEnrolledn=39n=39
EnrolledEnrolledn=43n=43
SurvivorsSurvivorsn=2n=2
NonsurvivorsNonsurvivorsn=10n=10
SurvivorsSurvivorsn=9n=9
NonsurvivorsNonsurvivorsn=6n=6
SurvivorsSurvivorsn=3n=3
Nonsurvivors2nNonsurvivors2n=2=2
SepsisSepsisn=259n=259
Respiratory ICURespiratory ICUn=82n=82
Surgical ICUSurgical ICUn=91n=91
Emergency ICUEmergency ICUn=86n=86
VAPVAPn=12n=12
Non-VAPNon-VAPn=31n=31
VAPVAPn=15n=15
Non-VAPNon-VAPn=24n=24
VAPVAPn=5n=5
Non-VAPNon-VAPn=5n=5
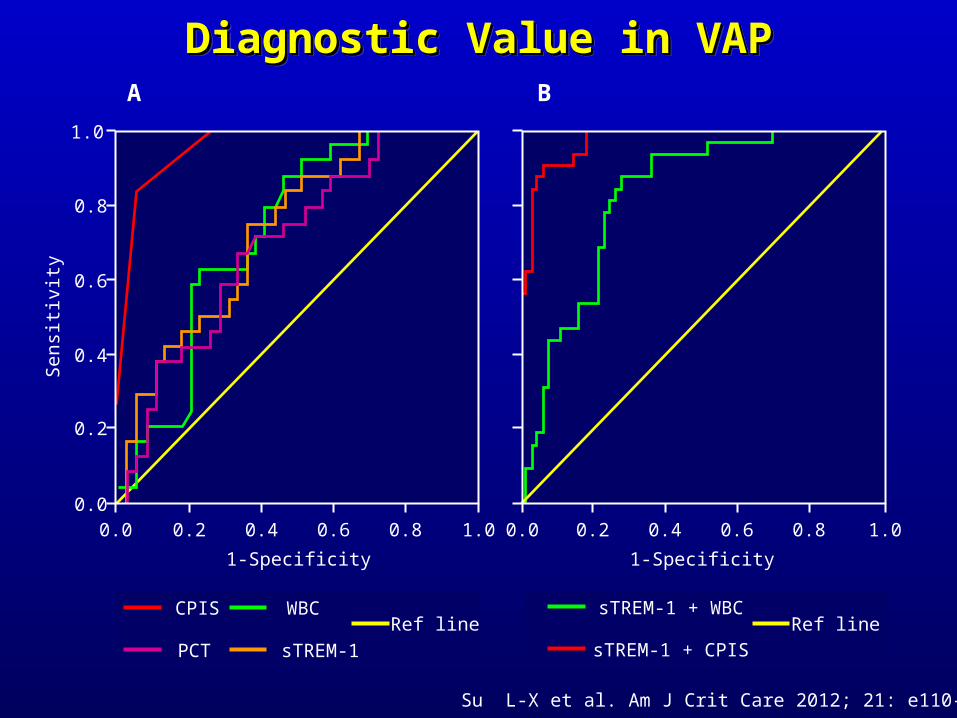
Diagnosing VAP in Critically Ill PatientsDiagnosing VAP in Critically Ill Patients
Su L-X et al. Am J Crit Care 2012; 21: e110-e119
1.0
0.8
0.4
0.2
0.00.2 0.4 0.6 0.8 1.00.0
Sen
sitiv
ity 0.6
1-Specificity
0.2 0.4 0.6 0.8 1.00.0
1-Specificity
CPIS WBC
sTREM-1PCT
Ref linesTREM-1 + CPIS
sTREM-1 + WBCRef line
A B
Diagnostic Value in VAPDiagnostic Value in VAPDiagnostic Value in VAPDiagnostic Value in VAP
Su L-X et al. Am J Crit Care 2012; 21: e110-e119
1.0
0.8S
ensi
tivity
0.2 0.4 0.6 0.8 1.0
1-Specificity
0.6
0.4
0.2
0.00.0
PCT + CPIS
CPISPCT
Ref line
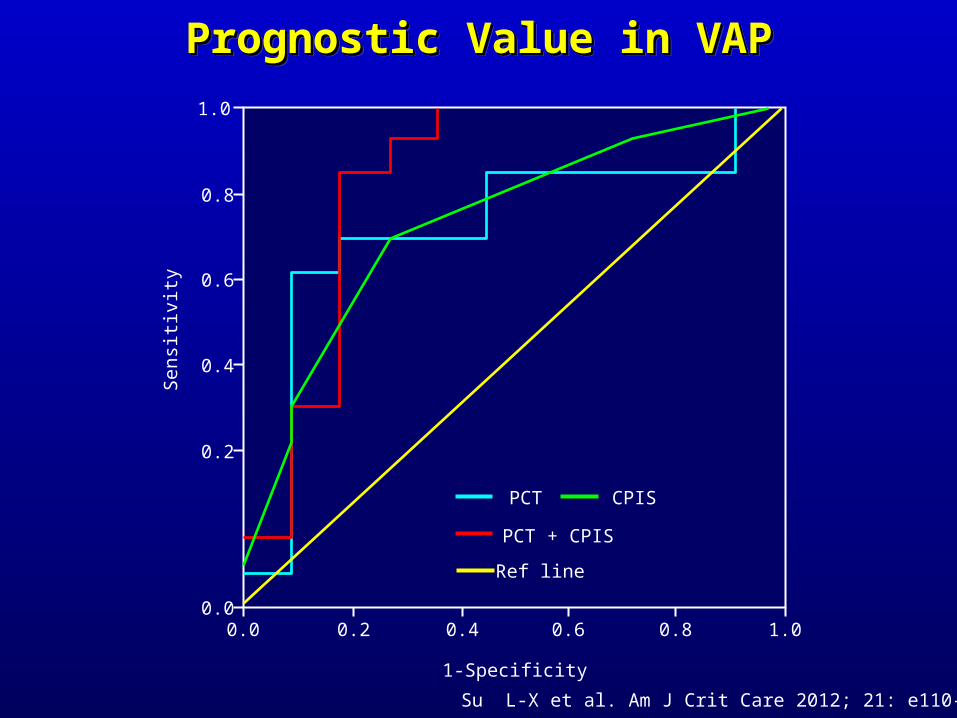
Prognostic Value in VAPPrognostic Value in VAPPrognostic Value in VAPPrognostic Value in VAP
Su L-X et al. Am J Crit Care 2012; 21: e110-e119
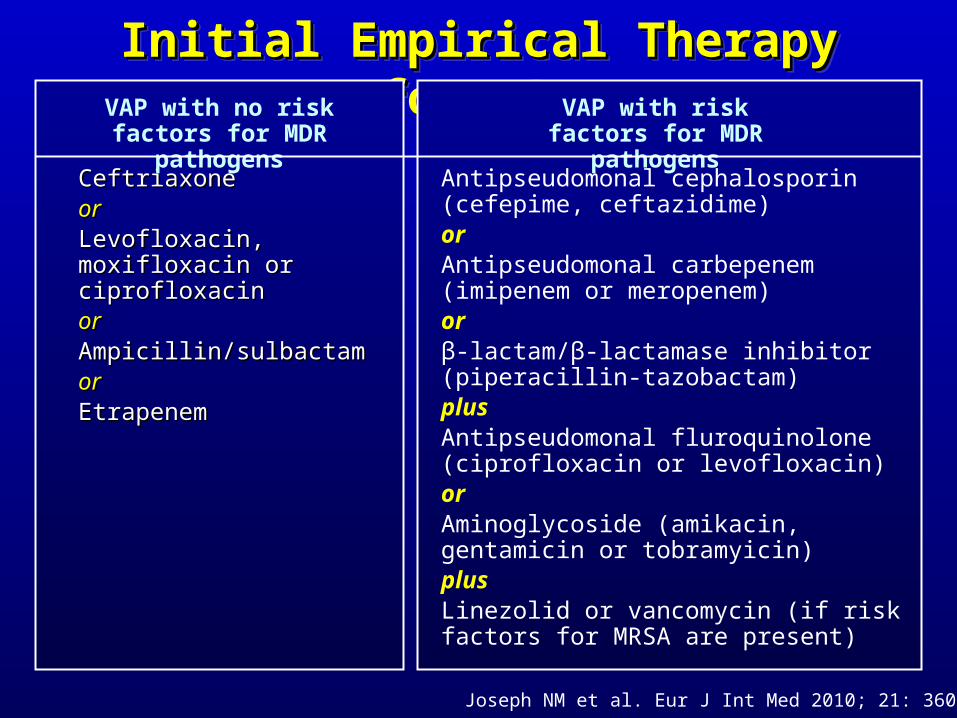
Initial Empirical Therapy for VAPInitial Empirical Therapy for VAPInitial Empirical Therapy for VAPInitial Empirical Therapy for VAP
CeftriaxoneCeftriaxoneororLevofloxacin, moxifloxacin or Levofloxacin, moxifloxacin or ciprofloxacinciprofloxacinororAmpicillin/sulbactamAmpicillin/sulbactamororEtrapenemEtrapenem
Antipseudomonal cephalosporin (cefepime, ceftazidime)orAntipseudomonal carbepenem (imipenem or meropenem)orβ-lactam/β-lactamase inhibitor (piperacillin-tazobactam)plusAntipseudomonal fluroquinolone (ciprofloxacin or levofloxacin)orAminoglycoside (amikacin, gentamicin or tobramyicin)plusLinezolid or vancomycin (if risk factors for MRSA are present)
VAP with no risk factors for MDR pathogens
VAP with risk factors for MDR pathogens
Joseph NM et al. Eur J Int Med 2010; 21: 360-368
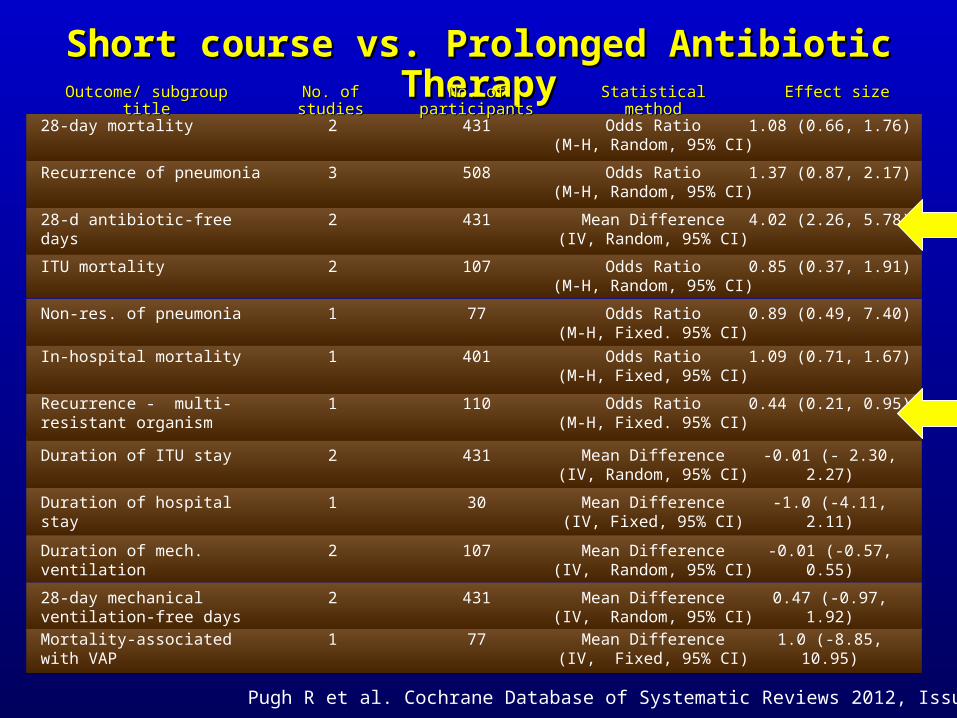
Short course vs. Prolonged Antibiotic TherapyShort course vs. Prolonged Antibiotic TherapyNo. of studiesNo. of studies No. of participantsNo. of participants Statistical methodStatistical method Effect sizeEffect sizeOutcome/ subgroup titleOutcome/ subgroup title
28-day mortality 2 431 Odds Ratio(M-H, Random, 95% CI)
1.08 (0.66, 1.76)
Recurrence of pneumonia 3 508 Odds Ratio(M-H, Random, 95% CI)
1.37 (0.87, 2.17)
28-d antibiotic-free days 2 431 Mean Difference(IV, Random, 95% CI)
4.02 (2.26, 5.78)
ITU mortality 2 107 Odds Ratio(M-H, Random, 95% CI)
0.85 (0.37, 1.91)
Non-res. of pneumonia 1 77 Odds Ratio(M-H, Fixed. 95% CI)
0.89 (0.49, 7.40)
In-hospital mortality 1 401 Odds Ratio(M-H, Fixed, 95% CI)
1.09 (0.71, 1.67)
Recurrence - multi-resistant organism
1 110 Odds Ratio(M-H, Fixed. 95% CI)
0.44 (0.21, 0.95)
Duration of ITU stay 2 431 Mean Difference(IV, Random, 95% CI)
-0.01 (- 2.30, 2.27)
Duration of hospital stay 1 30 Mean Difference(IV, Fixed, 95% CI)
-1.0 (-4.11, 2.11)
Duration of mech. ventilation 2 107 Mean Difference(IV, Random, 95% CI)
-0.01 (-0.57, 0.55)
28-day mechanical ventilation-free days
2 431 Mean Difference(IV, Random, 95% CI)
0.47 (-0.97, 1.92)
Mortality-associated with VAP 1 77 Mean Difference(IV, Fixed, 95% CI)
1.0 (-8.85, 10.95)
Pugh R et al. Cochrane Database of Systematic Reviews 2012, Issue 2

Pharmacologic-based Strategies for Prevention of VAPPharmacologic-based Strategies for Prevention of VAPPharmacologic-based Strategies for Prevention of VAPPharmacologic-based Strategies for Prevention of VAP
Topical iseganan
Orodigestive decontamination(topical/topical + IV antibiotics)
Oral chlororohexidine
Aerosolized antibiotics
IV antibiotics
Specific stress ulcer prophylaxis regimen
Short-course antibiotic therapy(when clinically applicable)
Routine antibiotic cycling/rotation/heterogeneity
Restricted (conservative) blood transfusion
Vaccines (influenza, pneumococcal)
StrategyStrategy
No
No
Yes
Nil
Nil
No
Yes
No
Yes
Yes
RecommendationRecommendation
1
1
1
1
1
1
1
2
2
1
Evidence levelEvidence level
Kollef MH. Surgical Infections 2011; 12: 211-220
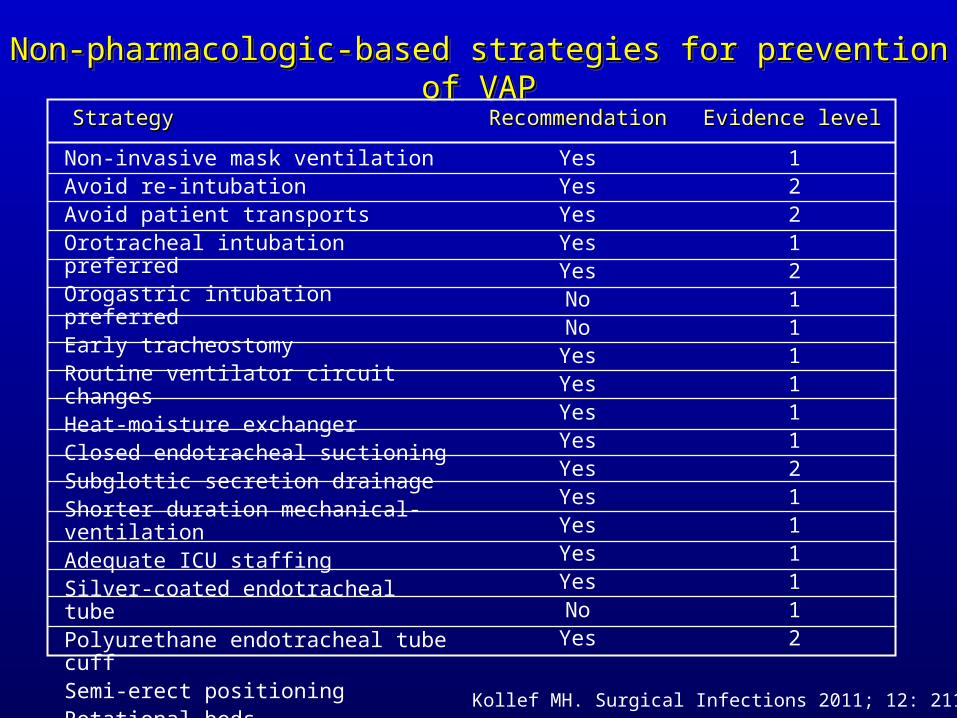
Non-pharmacologic-based strategies for prevention of VAPNon-pharmacologic-based strategies for prevention of VAPNon-pharmacologic-based strategies for prevention of VAPNon-pharmacologic-based strategies for prevention of VAP
StrategyStrategy RecommendationRecommendation Evidence levelEvidence level
Non-invasive mask ventilationAvoid re-intubationAvoid patient transportsOrotracheal intubation preferredOrogastric intubation preferredEarly tracheostomyRoutine ventilator circuit changesHeat-moisture exchangerClosed endotracheal suctioningSubglottic secretion drainageShorter duration mechanical-ventilationAdequate ICU staffingSilver-coated endotracheal tubePolyurethane endotracheal tube cuffSemi-erect positioningRotational bedsChest physiotherapyUse of protocols/bundles
YesYesYesYesYesNoNoYesYesYesYesYesYesYesYesYesNoYes
122121111112111112
Kollef MH. Surgical Infections 2011; 12: 211-220