Embed Size (px)
Citation preview
How are Rural Hospitals
Using Hospitalists?
Michelle Casey, MS
Peiyin Hung, MSPH
Ira Moscovice, PhD
AcademyHealth | June 2013
Supported by the Office of Rural Health Policy,
Health Resources and Services Administration,
PHS Grant No. U1CRH03717

Background and Objectives
• Paucity of research with rural context– Unclear whether prior research findings are
generalizable to smaller rural facilities
– Hospitalists may be part-time with additional
responsibilities
• Study objectives were to examine:
– How hospitalists are being used in rural hospitals
– Which rural hospitals are using hospitalists
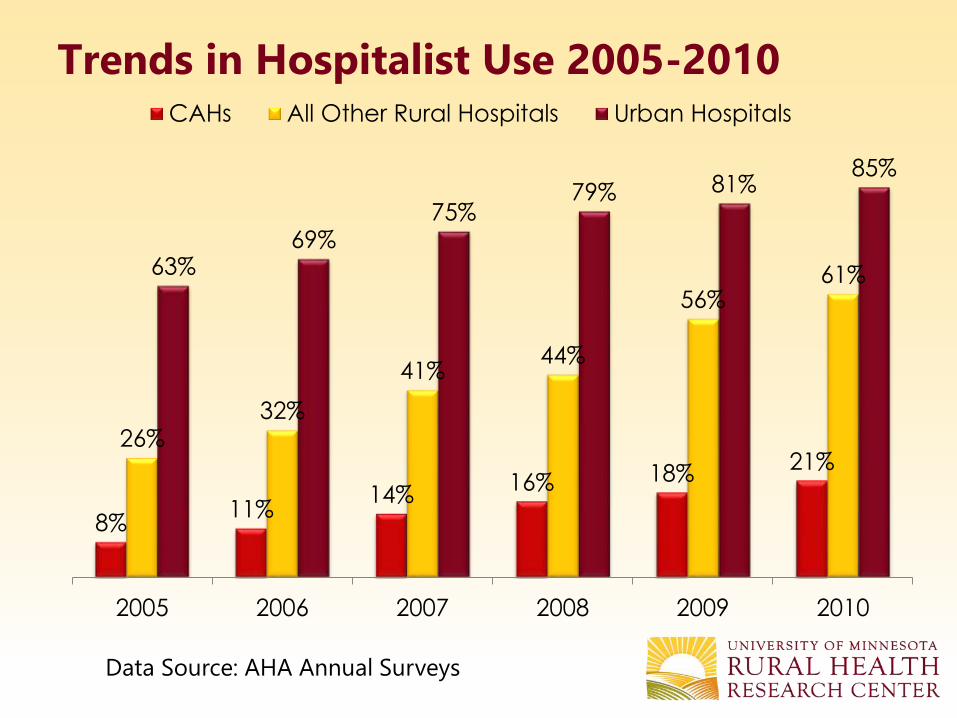
Trends in Hospitalist Use 2005-2010
8%11%
14%16% 18%
21%26%
32%
41%44%
56%61%63%
69%75%
79% 81%85%
2005 2006 2007 2008 2009 2010
CAHs All Other Rural Hospitals Urban Hospitals
Data Source: AHA Annual Surveys
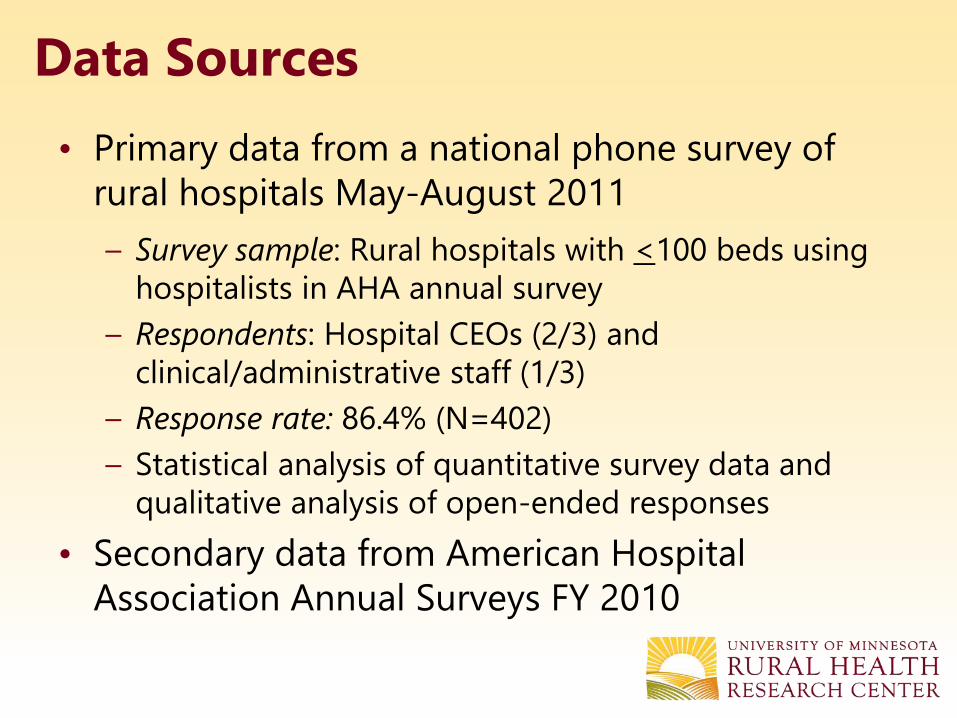
Data Sources
• Primary data from a national phone survey of
rural hospitals May-August 2011
– Survey sample: Rural hospitals with <100 beds using
hospitalists in AHA annual survey
– Respondents: Hospital CEOs (2/3) and
clinical/administrative staff (1/3)
– Response rate: 86.4% (N=402)
– Statistical analysis of quantitative survey data and
qualitative analysis of open-ended responses
• Secondary data from American Hospital
Association Annual Surveys FY 2010

Primary Reasons for Using Hospitalists
Requests from
physicians,
26.6%
Improve care
quality /
continuity,
19.3%
Cover
unassigned
patients, 6.9%
Alleviate physician
shortage, 6.6%
Cover call/reduce
workload for
physicians, 16.4%
Allow physicians
to focus on clinical
practice, 10.3%
Recruit & retain
physicians, 8.6%
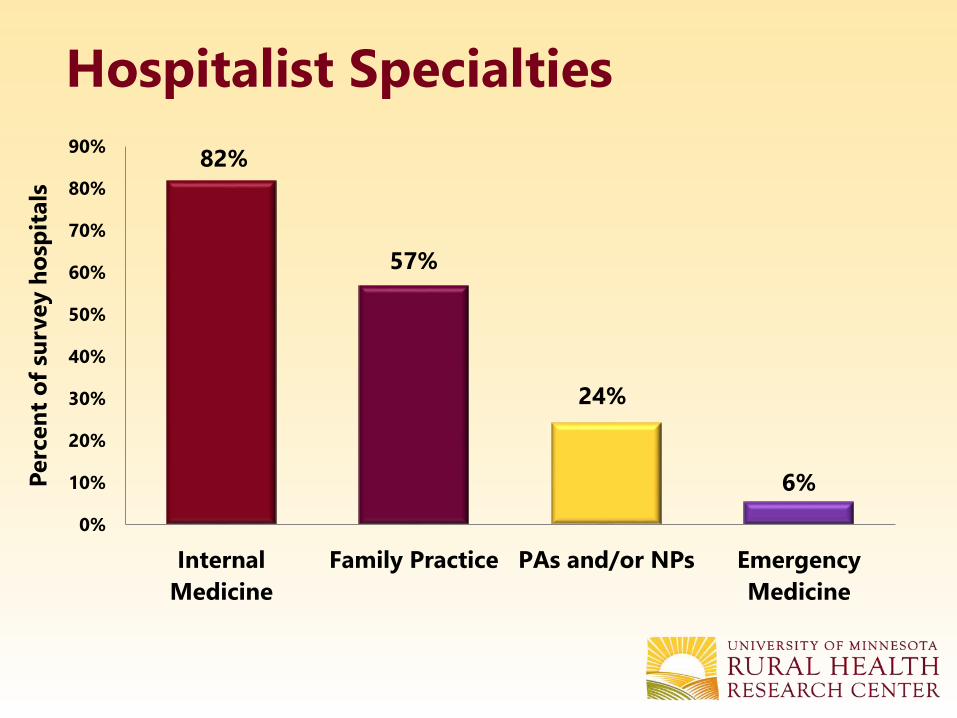
Hospitalist Specialties
82%
57%
24%
6%
0%
10%
20%
30%
40%
50%
60%
70%
80%
90%
Internal
Medicine
Family Practice PAs and/or NPs Emergency
Medicine
Perc
en
t o
f su
rvey h
osp
itals

Additional Care Provided by Hospitalists
Care Settings by Hospitalists Percent of
hospitals
Hospital Outpatient Department 30%
Primary care in clinic or physician office 30%
Emergency Department 17%
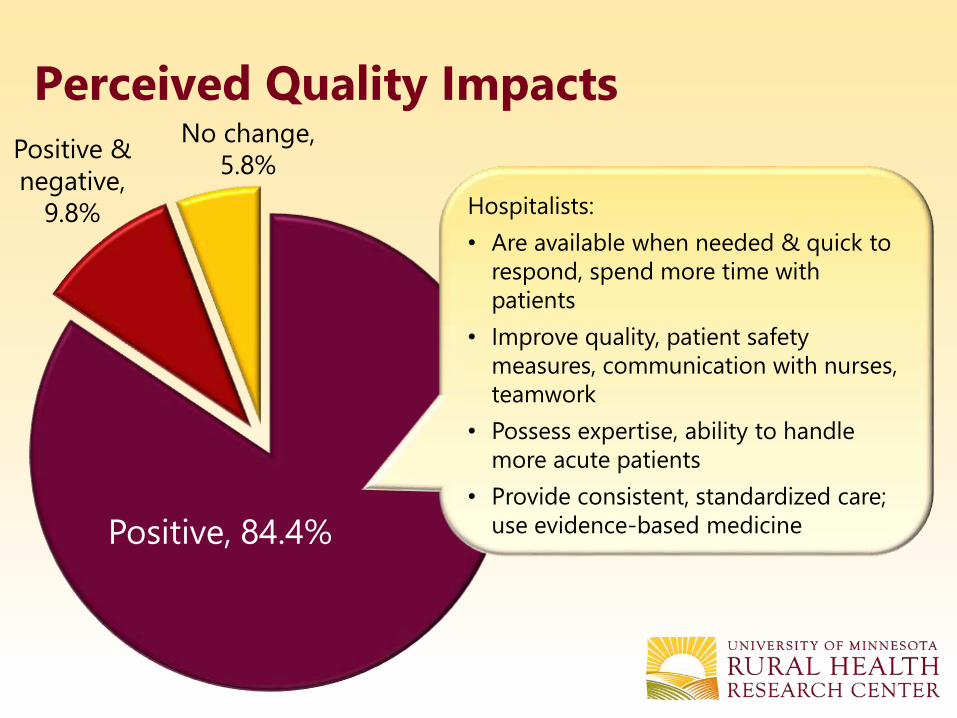
Perceived Quality Impacts
Positive, 84.4%
Positive &
negative,
9.8% Hospitalists:
• Are available when needed & quick to
respond, spend more time with
patients
• Improve quality, patient safety
measures, communication with nurses,
teamwork
• Possess expertise, ability to handle
more acute patients
• Provide consistent, standardized care;
use evidence-based medicine
No change,
5.8%
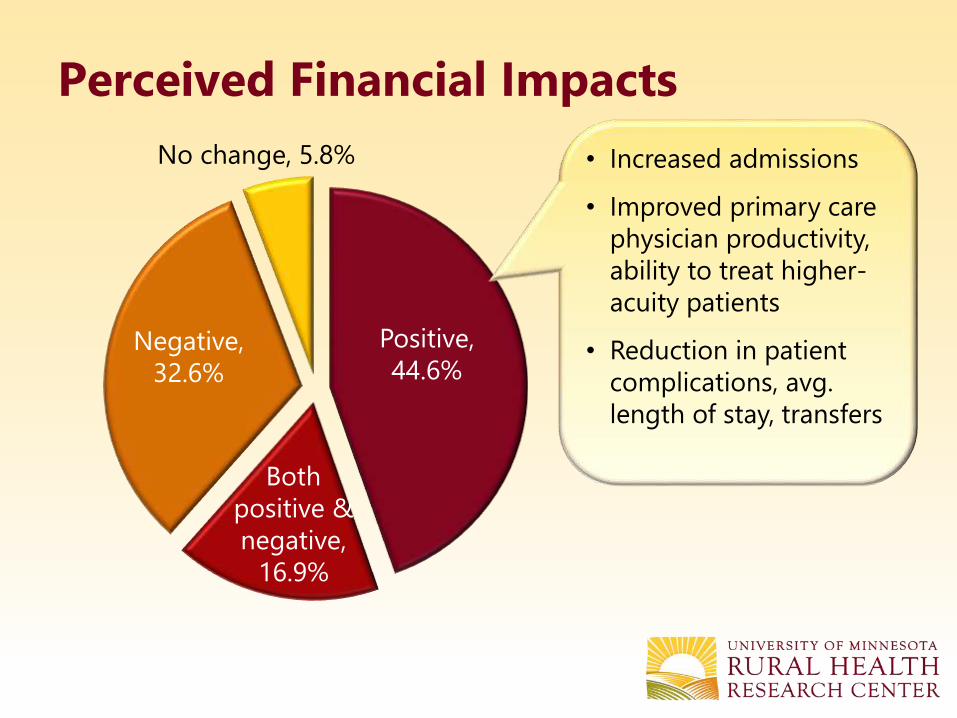
Perceived Financial Impacts
No change, 5.8%
Positive,
44.6%
Both
positive &
negative,
16.9%
Negative,
32.6%
• Increased admissions
• Improved primary care
physician productivity,
ability to treat higher-
acuity patients
• Reduction in patient
complications, avg.
length of stay, transfers
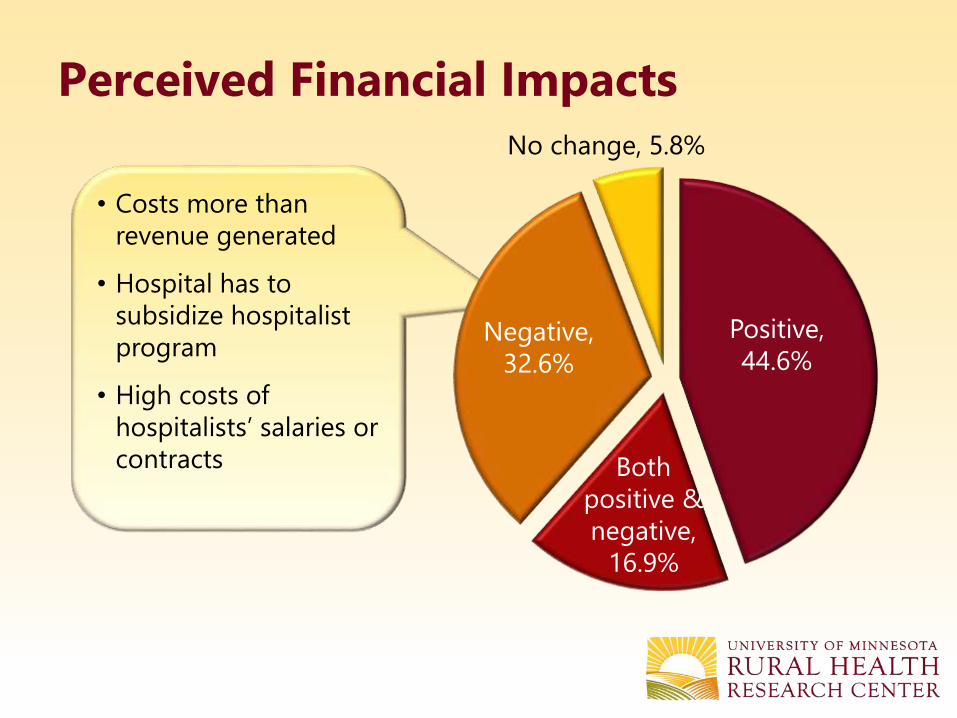
• Costs more than
revenue generated
• Hospital has to
subsidize hospitalist
program
• High costs of
hospitalists’ salaries or
contracts
Perceived Financial Impacts
No change, 5.8%
Positive,
44.6%
Both
positive &
negative,
16.9%
Negative,
32.6%
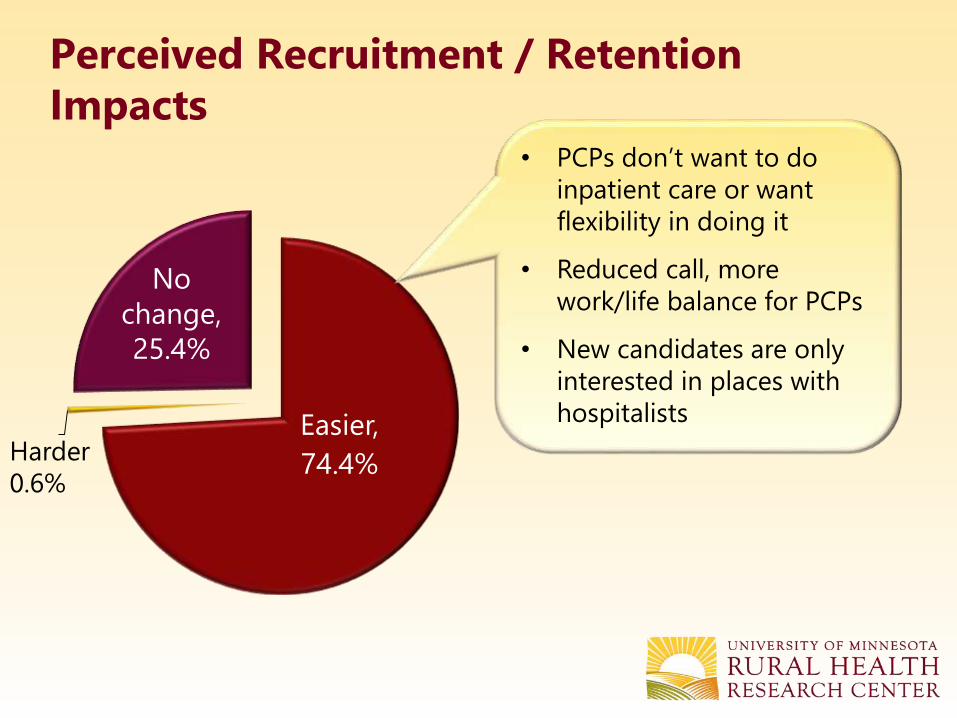
Perceived Recruitment / Retention
Impacts
Easier,
74.4%
No
change,
25.4%
• PCPs don’t want to do
inpatient care or want
flexibility in doing it
• Reduced call, more
work/life balance for PCPs
• New candidates are only
interested in places with
hospitalists
Harder
0.6%
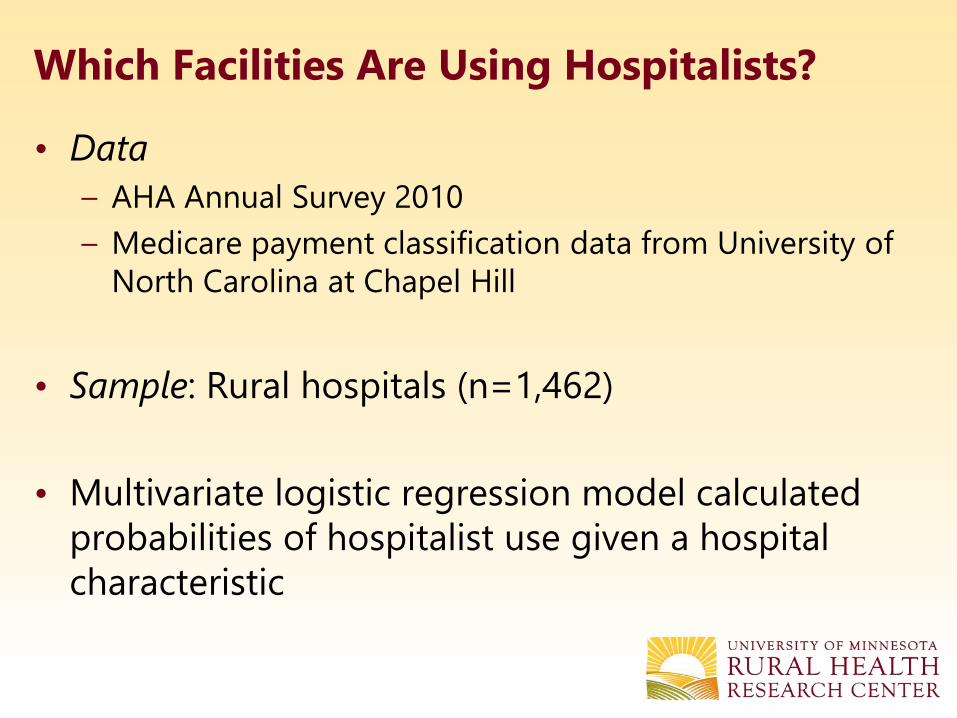
Which Facilities Are Using Hospitalists?
• Data
– AHA Annual Survey 2010
– Medicare payment classification data from University of
North Carolina at Chapel Hill
• Sample: Rural hospitals (n=1,462)
• Multivariate logistic regression model calculated
probabilities of hospitalist use given a hospital
characteristic
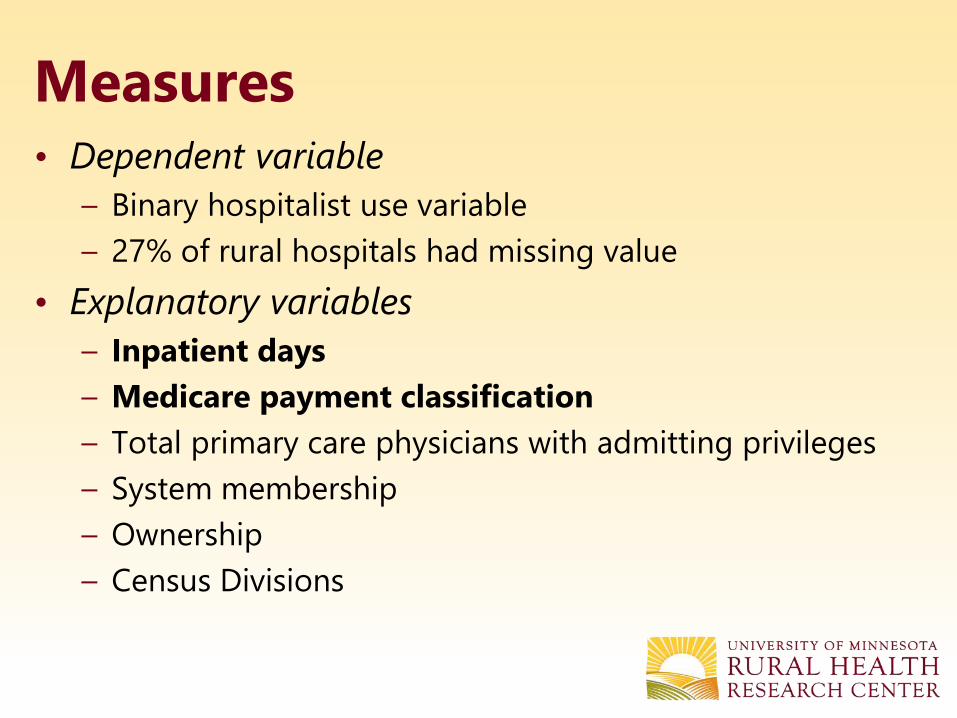
Measures• Dependent variable
– Binary hospitalist use variable
– 27% of rural hospitals had missing value
• Explanatory variables
– Inpatient days
– Medicare payment classification
– Total primary care physicians with admitting privileges
– System membership
– Ownership
– Census Divisions
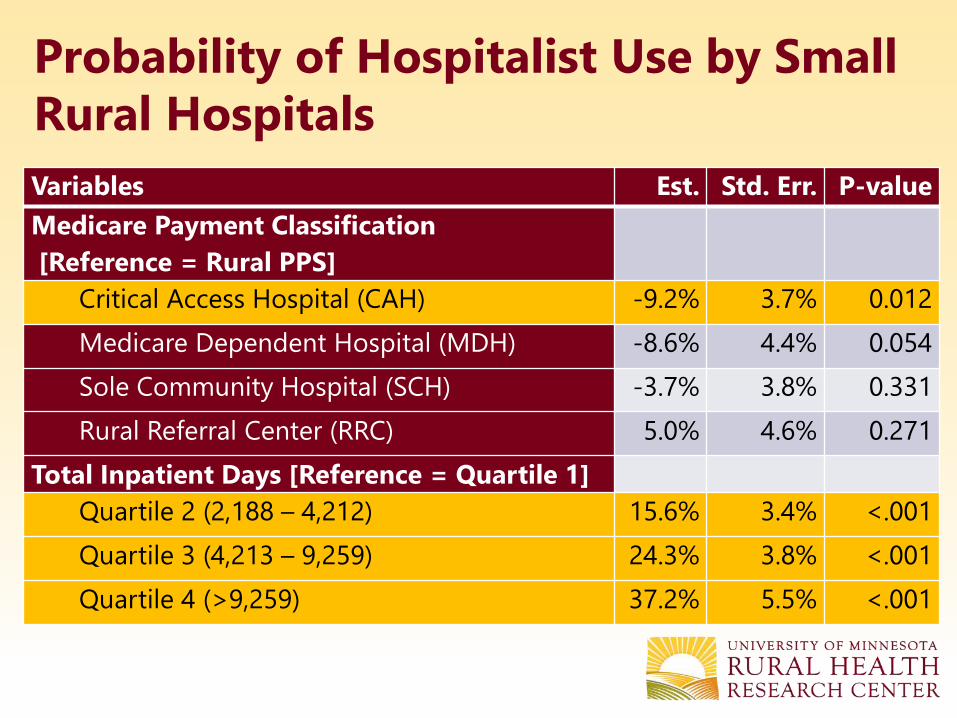
Probability of Hospitalist Use by Small
Rural Hospitals
Variables Est. Std. Err. P-value
Medicare Payment Classification
[Reference = Rural PPS]
Critical Access Hospital (CAH) -9.2% 3.7% 0.012
Medicare Dependent Hospital (MDH) -8.6% 4.4% 0.054
Sole Community Hospital (SCH) -3.7% 3.8% 0.331
Rural Referral Center (RRC) 5.0% 4.6% 0.271
Total Inpatient Days [Reference = Quartile 1]
Quartile 2 (2,188 – 4,212) 15.6% 3.4% <.001
Quartile 3 (4,213 – 9,259) 24.3% 3.8% <.001
Quartile 4 (>9,259) 37.2% 5.5% <.001
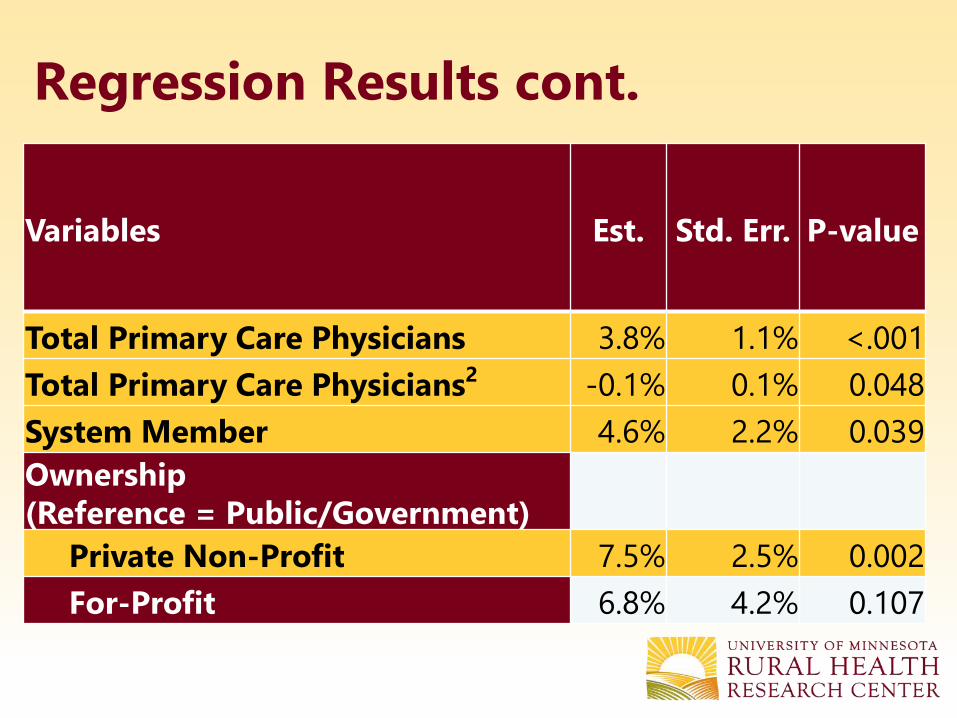
Regression Results cont.
Variables Est. Std. Err. P-value
Total Primary Care Physicians 3.8% 1.1% <.001
Total Primary Care Physicians2 -0.1% 0.1% 0.048
System Member 4.6% 2.2% 0.039
Ownership
(Reference = Public/Government)
Private Non-Profit 7.5% 2.5% 0.002
For-Profit 6.8% 4.2% 0.107
Conclusions
• Hospitalist use by rural hospitals increased
threefold, 2005-2010
• In rural hospitals, hospitalists:
– Are family physicians and non-physician
providers as well as internists
– Frequently play multiple roles – also providing
outpatient, emergency, and/or primary care
• Hospitalists can help address workforce
shortages in rural areas
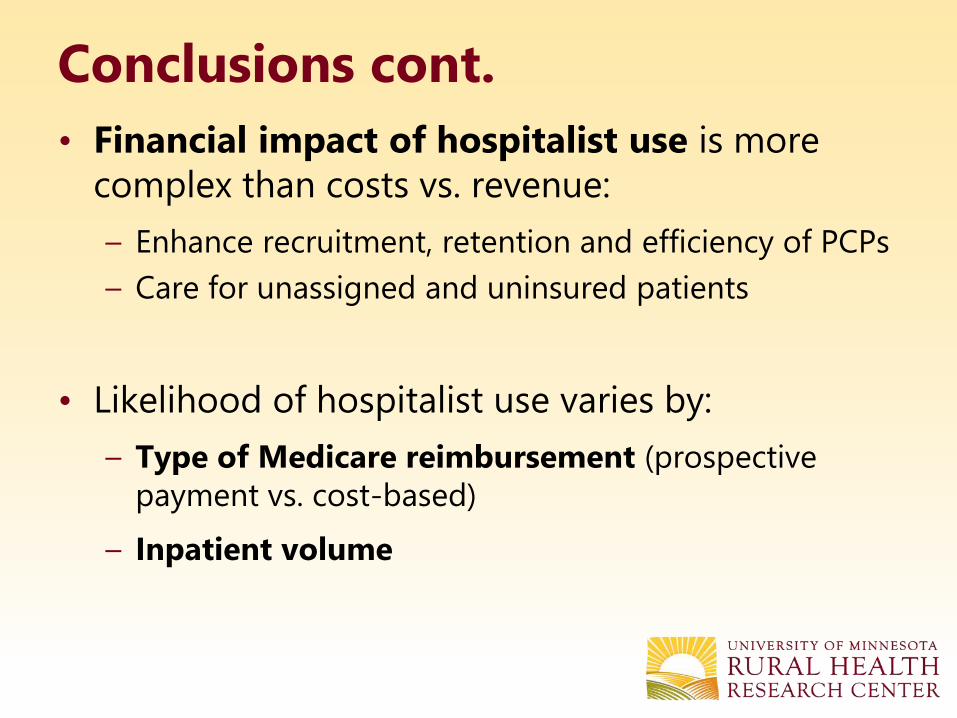
Conclusions cont.
• Financial impact of hospitalist use is more
complex than costs vs. revenue:
– Enhance recruitment, retention and efficiency of PCPs
– Care for unassigned and uninsured patients
• Likelihood of hospitalist use varies by:
– Type of Medicare reimbursement (prospective
payment vs. cost-based)
– Inpatient volume

Peiyin Hung
612-623-8317
http://www.hsr.umn.edu/rhrc/

Medicare Payment
Classification• Critical Access Hospitals
– 25 or fewer beds
– 101% of reasonable costs for inpatient, outpatient and swing bed
care.
• Sole Community Hospitals
– located either 35 miles from similar hospitals
– receive the higher of the federal PPS rate or an updated hospital-
specific rate based on historical costs.
• Medicare Dependent Hospitals
– fewer than 100 beds and more than 60% of inpatient discharges or
days covered by Medicare
– received the PPS rate plus 75% of the difference between the PPS
rate and an updated rate based on their historical costs.
• Rural Referral Centers
– have a combination of high case mix intensity and specialist supply
– more than 275 beds
– reimbursed using urban PPS rates.
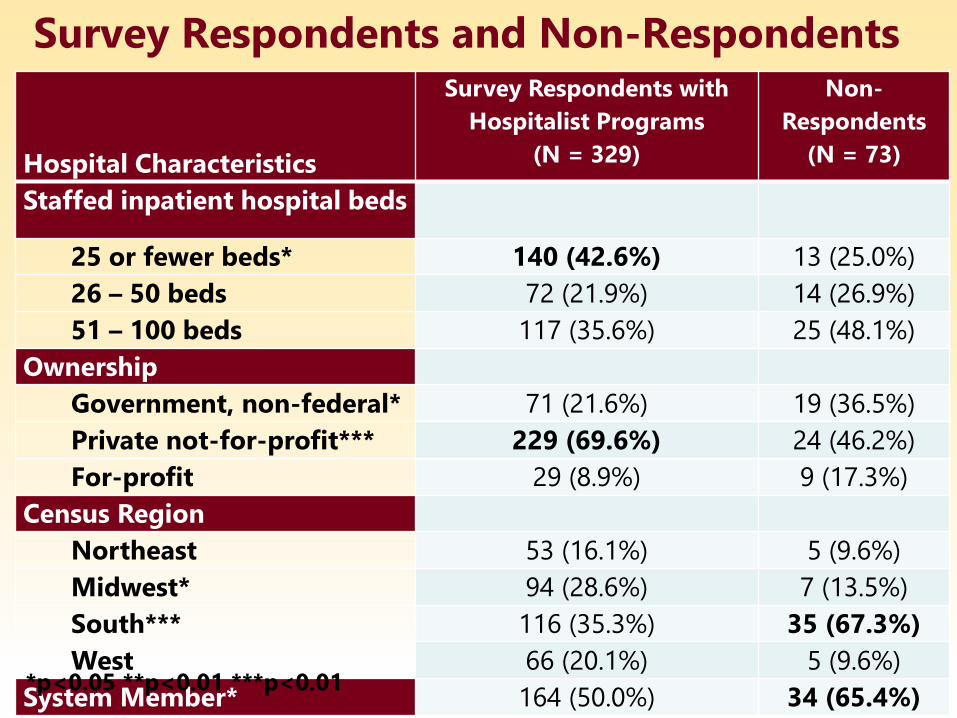
Survey Respondents and Non-Respondents
Hospital Characteristics
Survey Respondents with
Hospitalist Programs
(N = 329)
Non-
Respondents
(N = 73)
Staffed inpatient hospital beds
25 or fewer beds* 140 (42.6%) 13 (25.0%)
26 – 50 beds 72 (21.9%) 14 (26.9%)
51 – 100 beds 117 (35.6%) 25 (48.1%)
Ownership
Government, non-federal* 71 (21.6%) 19 (36.5%)
Private not-for-profit*** 229 (69.6%) 24 (46.2%)
For-profit 29 (8.9%) 9 (17.3%)
Census Region
Northeast 53 (16.1%) 5 (9.6%)
Midwest* 94 (28.6%) 7 (13.5%)
South*** 116 (35.3%) 35 (67.3%)
West 66 (20.1%) 5 (9.6%)
System Member* 164 (50.0%) 34 (65.4%)*p<0.05 **p<0.01 ***p<0.01