Embed Size (px)
Citation preview
Elmos Geschäftsbericht 2014 | 3 Annual Report 2014
We bring magicto your life
4
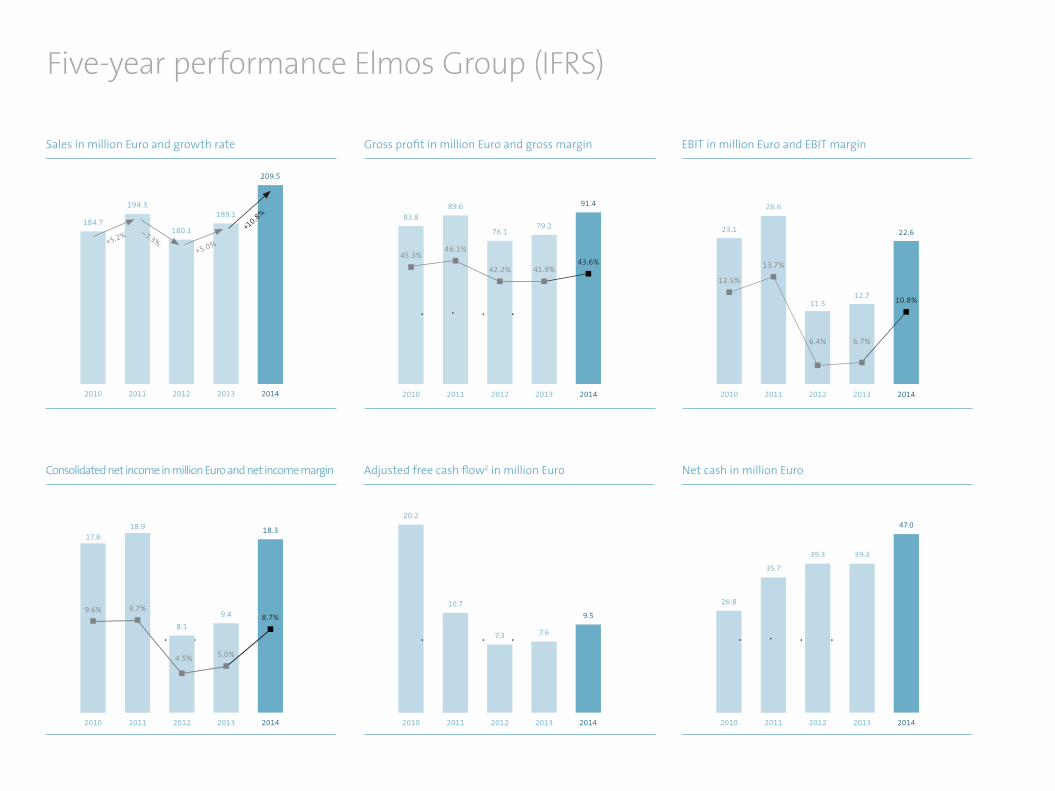
Five-year performance Elmos Group (IFRS)
Gross profit in million Euro and gross margin
83.889.6
76.179.2
91.4
45.3%46.1%
42.2% 41.9%43.6%
2010 2011 2012 2013 2014
Sales in million Euro and growth rate
+5.2% –7.3%+5.0%
+10.8%184.7
194.3
180.1
189.1
209.5
2010 2011 2012 2013 2014
Adjusted free cash flow2 in million Euro
2010 2011 2012 2013 2014
20.2
10.7
7.3 7.6
9.5
Net cash in million Euro
2010 2011 2012 2013 2014
26.8
35.7
39.3 39.3
47.0
Consolidated net income in million Euro and net income margin
2010 2011 2012 2013 2014
18.9
9.4
18.3
8.1
9.6%
EBIT in million Euro and EBIT margin
2010 2011 2012 2013 2014
12.5%
13.7%
6.4% 6.7%
10.8%
23.1
26.6
11.512.7
22.6
9.7%
5.0%4.5%
8.7%
17.8
Elmos Geschäftsbericht 2014 | 5
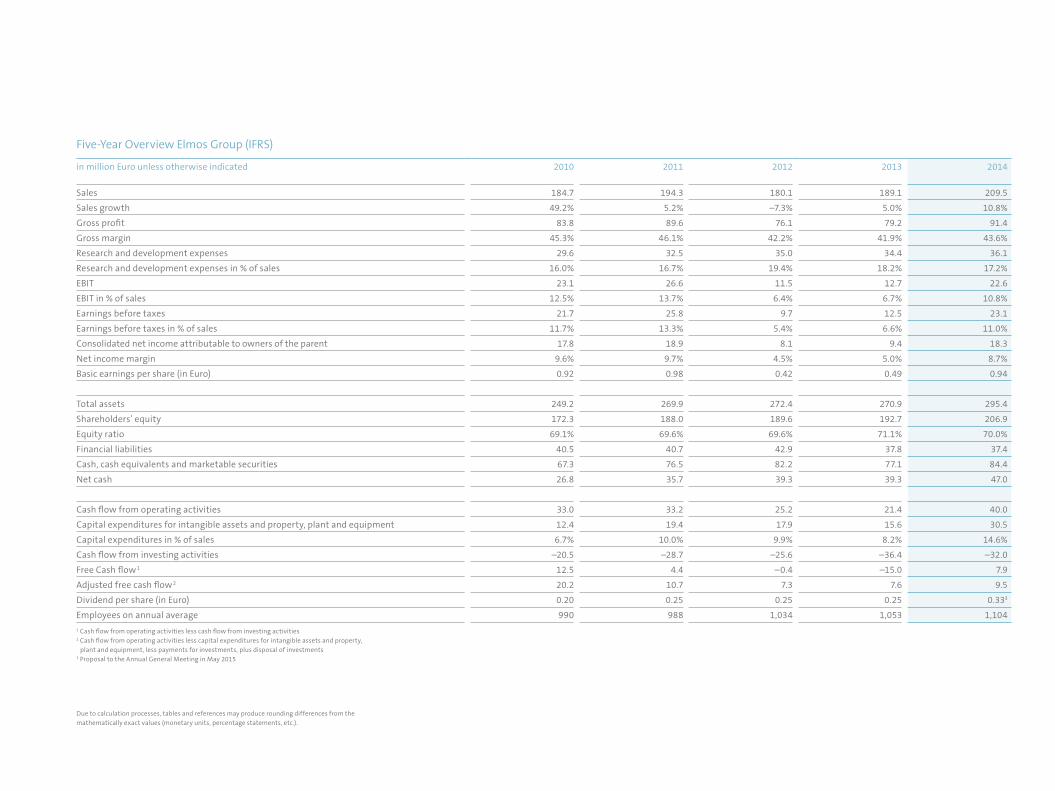
Due to calculation processes, tables and references may produce rounding differences from the mathematically exact values (monetary units, percentage statements, etc.).
1 Cash flow from operating activities less cash flow from investing activities 2 Cash flow from operating activities less capital expenditures for intangible assets and property, plant and equipment, less payments for investments, plus disposal of investments 3 Proposal to the Annual General Meeting in May 2015
in million Euro unless otherwise indicated 2010 2011 2012 2013 2014
Sales 184.7 194.3 180.1 189.1 209.5
Sales growth 49.2% 5.2% –7.3% 5.0% 10.8%
Gross profit 83.8 89.6 76.1 79.2 91.4
Gross margin 45.3% 46.1% 42.2% 41.9% 43.6%
Research and development expenses 29.6 32.5 35.0 34.4 36.1
Research and development expenses in % of sales 16.0% 16.7% 19.4% 18.2% 17.2%
EBIT 23.1 26.6 11.5 12.7 22.6
EBIT in % of sales 12.5% 13.7% 6.4% 6.7% 10.8%
Earnings before taxes 21.7 25.8 9.7 12.5 23.1
Earnings before taxes in % of sales 11.7% 13.3% 5.4% 6.6% 11.0%
Consolidated net income attributable to owners of the parent 17.8 18.9 8.1 9.4 18.3
Net income margin 9.6% 9.7% 4.5% 5.0% 8.7%
Basic earnings per share (in Euro) 0.92 0.98 0.42 0.49 0.94
Total assets 249.2 269.9 272.4 270.9 295.4
Shareholders’ equity 172.3 188.0 189.6 192.7 206.9
Equity ratio 69.1% 69.6% 69.6% 71.1% 70.0%
Financial liabilities 40.5 40.7 42.9 37.8 37.4
Cash, cash equivalents and marketable securities 67.3 76.5 82.2 77.1 84.4
Net cash 26.8 35.7 39.3 39.3 47.0
Cash flow from operating activities 33.0 33.2 25.2 21.4 40.0
Capital expenditures for intangible assets and property, plant and equipment 12.4 19.4 17.9 15.6 30.5
Capital expenditures in % of sales 6.7% 10.0% 9.9% 8.2% 14.6%
Cash flow from investing activities –20.5 –28.7 –25.6 –36.4 –32.0
Free Cash flow 1 12.5 4.4 –0.4 –15.0 7.9
Adjusted free cash flow 2 20.2 10.7 7.3 7.6 9.5
Dividend per share (in Euro) 0.20 0.25 0.25 0.25 0.333
Employees on annual average 990 988 1,034 1,053 1,104
Five-Year Overview Elmos Group (IFRS)
6
to your life
Fact Sheet
Full Year 2014
Information for our shareholders
Management Board 06
Supervisory Board 12
Corporate governance 16
Sustainability 22
The Elmos share 26
Significant events 2014 32
Combined management report
Basic information on the Group 36
Business report 46
Subsequent events 57
Opportunities and risks 58
Outlook 66
Legal information 70
Consolidated Financial Statements
Financial statements 74
Notes to financial statements 78
Responsibility statement 132
Auditor’s report 133
Appendix
Glossary 134
Informative material/Financial calendar 136
Contact/Imprint 137
Elmos Geschäftsbericht 2014 | 7
Elmos products are rather inconspicuous, tiny, and black. However, our everyday lives cannot be imagined anymore without their functions. They are small but impressive, be it in the car, at work, or at home.
Elmos products are the magicians in the background when the feel-good temperature in your car is adjusted automatically, the vehicle recognizes the size of a parking space, and when the airbag ignites at exactly the right time.
In short: The Elmos solutions make our everyday lives easier, better, and safer. Every day, almost anywhere on this planet.
The images in this Annual Report are taken from our new Elmos corporate video. In this video we have tried to capture the magic that surrounds even the creation of our products. Have we sparked your interest? www.elmos.com
8
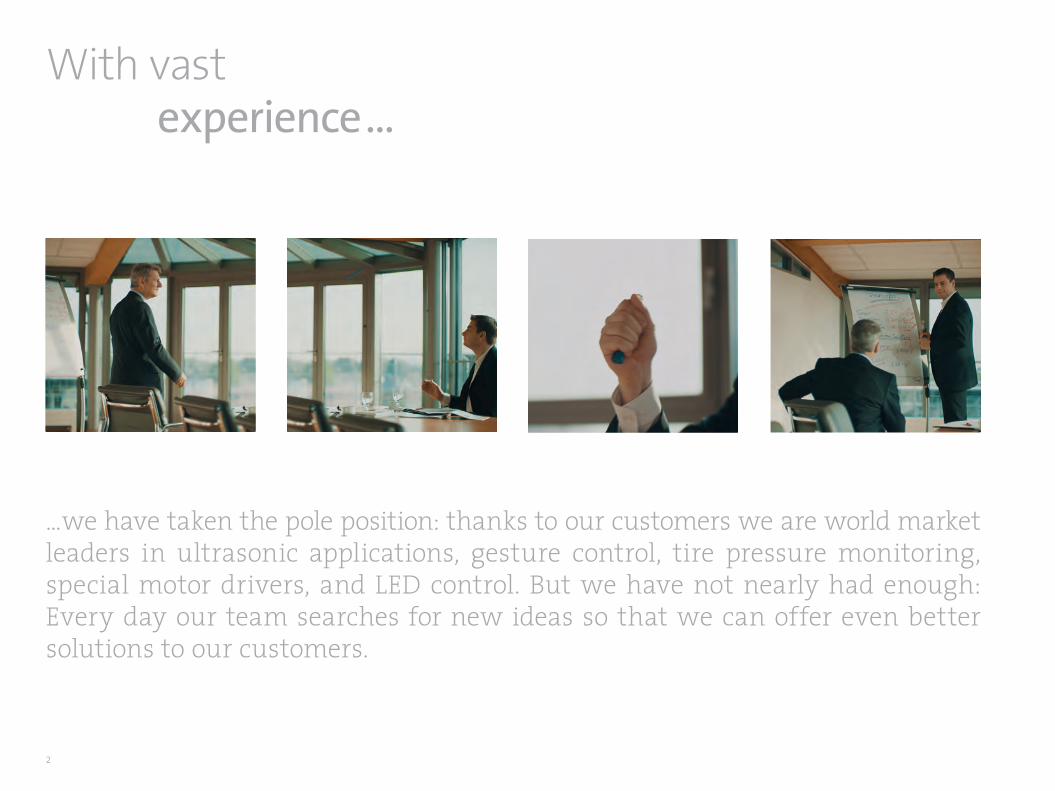
...we have taken the pole position: thanks to our customers we are world market leaders in ultrasonic applications, gesture control, tire pressure monitoring, special motor drivers, and LED control. But we have not nearly had enough: Every day our team searches for new ideas so that we can offer even better solutions to our customers.
With vastexperience...
2
Elmos Annual Report 2014 | 3
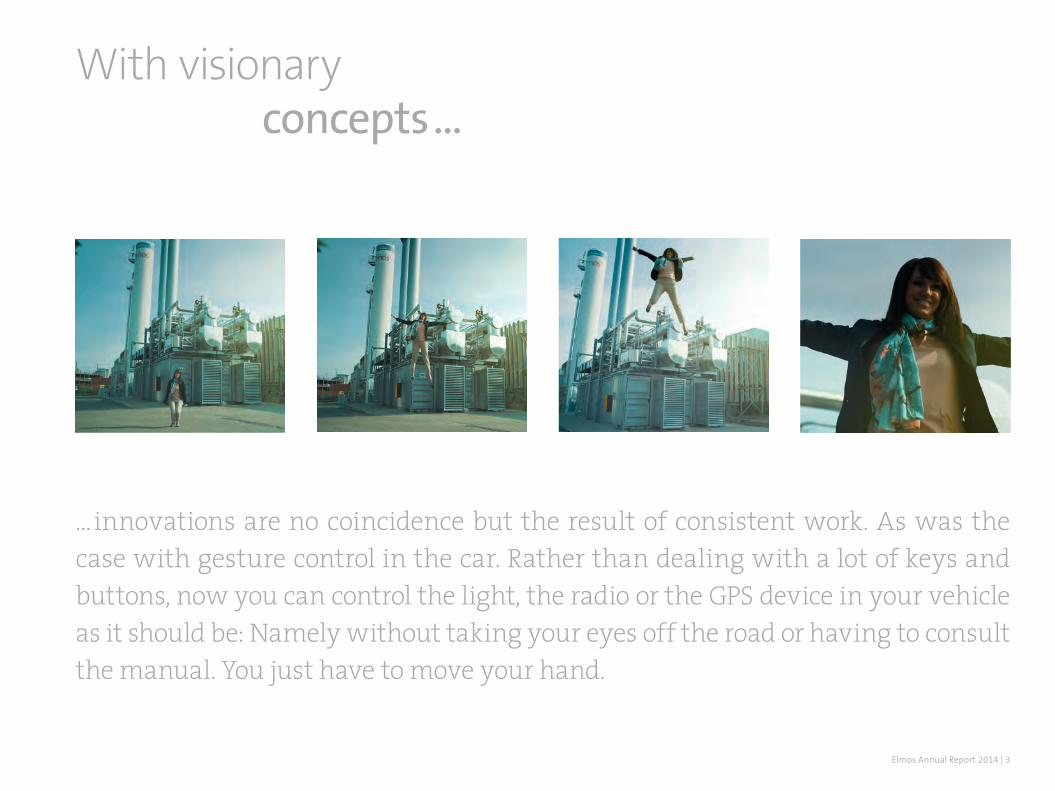
... innovations are no coincidence but the result of consistent work. As was the case with gesture control in the car. Rather than dealing with a lot of keys and buttons, now you can control the light, the radio or the GPS device in your vehicle as it should be: Namely without taking your eyes off the road or having to consult the manual. You just have to move your hand.
With visionaryconcepts...
4
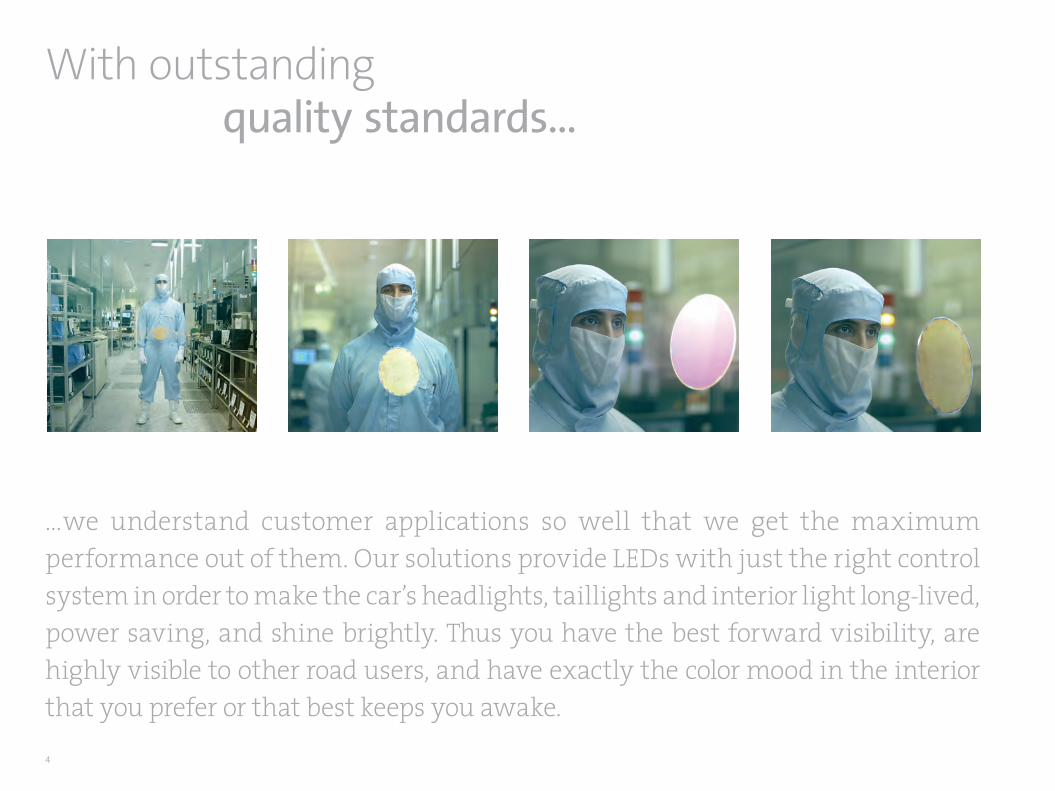
With outstandingquality standards...
...we understand customer applications so well that we get the maximum performance out of them. Our solutions provide LEDs with just the right control system in order to make the car’s headlights, taillights and interior light long-lived, power saving, and shine brightly. Thus you have the best forward visibility, are highly visible to other road users, and have exactly the color mood in the interior that you prefer or that best keeps you awake.

Elmos Annual Report 2014 | 5
With innovativeideas...
...we keep opening up new fields of application: We can for instance offer solutions for park assist systems, level indicators, flow measurements, or medical applica-tions based on our expertise in ultrasonics. Because our claim always applies, whether we deal with cars, industrial solutions, or medical applications: We want set standards with our innovations.

6
Elmos Annual Report 2014 | 7
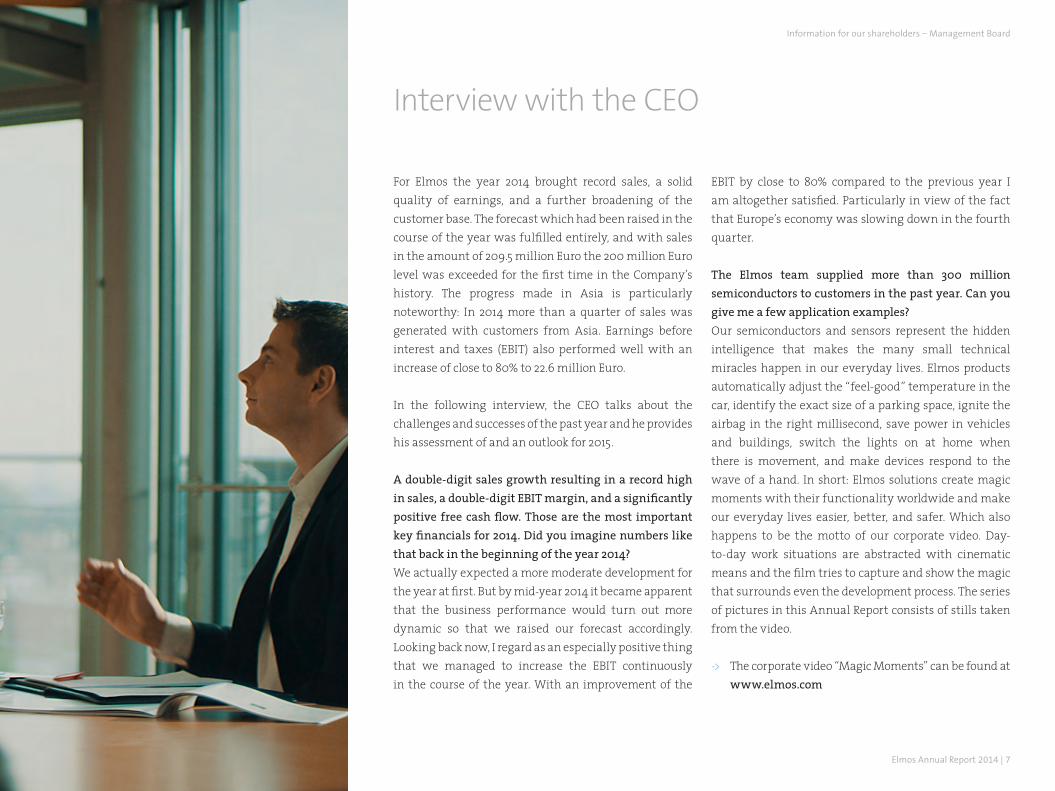
For Elmos the year 2014 brought record sales, a solid quality of earnings, and a further broadening of the customer base. The forecast which had been raised in the course of the year was fulfilled entirely, and with sales in the amount of 209.5 million Euro the 200 million Euro level was exceeded for the first time in the Company’s history. The progress made in Asia is particularly noteworthy: In 2014 more than a quarter of sales was generated with customers from Asia. Earnings before interest and taxes (EBIT) also performed well with an increase of close to 80% to 22.6 million Euro.
In the following interview, the CEO talks about the challenges and successes of the past year and he provides his assessment of and an outlook for 2015.
A double-digit sales growth resulting in a record high in sales, a double-digit EBIT margin, and a significantly positive free cash flow. Those are the most important key financials for 2014. Did you imagine numbers like that back in the beginning of the year 2014?We actually expected a more moderate development for the year at first. But by mid-year 2014 it became apparent that the business performance would turn out more dynamic so that we raised our forecast accordingly. Looking back now, I regard as an especially positive thing that we managed to increase the EBIT continuously in the course of the year. With an improvement of the
EBIT by close to 80% compared to the previous year I am altogether satisfied. Particularly in view of the fact that Europe’s economy was slowing down in the fourth quarter.
The Elmos team supplied more than 300 million semiconductors to customers in the past year. Can you give me a few application examples?Our semiconductors and sensors represent the hidden intelligence that makes the many small technical miracles happen in our everyday lives. Elmos products automatically adjust the “feel-good” temperature in the car, identify the exact size of a parking space, ignite the airbag in the right millisecond, save power in vehicles and buildings, switch the lights on at home when there is movement, and make devices respond to the wave of a hand. In short: Elmos solutions create magic moments with their functionality worldwide and make our everyday lives easier, better, and safer. Which also happens to be the motto of our corporate video. Day-to-day work situations are abstracted with cinematic means and the film tries to capture and show the magic that surrounds even the development process. The series of pictures in this Annual Report consists of stills taken from the video.
-> The corporate video “Magic Moments” can be found at www.elmos.com
Interview with the CEO
Information for our shareholders – Management Board
8
What happened in 2014 with regard to the markets?That we managed to broaden our customer base, and not only in Asia but in Europe and the U.S. as well, was a positive development once again. Elmos products have an excellent reputation in the industry and our team works constantly at raising the bar even higher. Regarding products that have made us world market leaders, such as ultrasonic park-assist systems or tire pressure monitoring sensors, we were successful in strengthening our positions, developing follow-up generations or even introducing them to the market, and convincing new customers of our solutions. In new areas, e.g. LED vehicle lighting, we have done everything in our power to gain a leading position as well. And we managed to do that over 2014 in the case of gesture control in the car, supplying an ever increasing number of sensors for this field of application. They are based on the HALIOS® technology and are therefore largely independent of ambient lighting. It doesn’t matter if the sun or the moon shines on the dashboard, or nothing at all, our sensor responds with 100% reliability.
If you look at the numbers, the strong growth in the Asian share in sales is particularly striking. And while growth in the U.S. has been strong, the market’s share in sales is rather low in absolute terms. How do you assess this situation and its development?Asia is clearly one of the growth drivers of the global automotive market. The above-average growth rates with Asian customers show that our solutions are
successful in this market as well. Its share in sales now comes to 27% while it was only 13% in 2010. In mid-2014 we took the next logical step after some major successes with customers and opened our own office in Tokyo for better customer support on location. Your assessment of the U.S. share in sales is correct. Market development in the U.S. isn’t where it should be. Our potential there is enormous. I am confident that we will make a far better job at seizing these opportunities with our new team which has been in place since mid-2014.
What were the main challenges to business operations in 2014?Elmos prepares its production for the future. In December 2014 we fed the final 6-inch wafer into semiconductor manufacturing, thus entering the finish line in the challenging conversion from 6 to 8-inch wafers in the year 2014. 8-inch production helps us increase our competitiveness and profitability. Over the past few years we have set up an efficient production network. By the combination of our own in-house manufacturing and international partners, we can service our customers with innovative solutions and high reliability. We have also enhanced our know-how in exciting sub-areas. By increasing the shares held in the design companies DMOS and MAZ we have secured the successful cooperation for the long term. Furthermore, our share in application specific semiconductors (ASSPs) has been growing as expected. We managed to win a large number of new customer projects for ASSPs and
turned over new products from development to series production successfully.
What are the exciting topics for Elmos from the market perspective in 2015?Elmos operates in an incredibly dynamic market. Electronics has been entering our everyday lives increasingly and hardly an application remains unaffected by this development. Trends for more safety, comfort and power efficiency persist and determine the electronic equipment of cars. One major issue of today is autonomous driving of course. Elmos chips can be the “eyes and ears” of driver assistance systems in some areas. Vehicle-based mobility will continue to see radical changes in the decades ahead. But trends such as LED lighting, Industry 4.0, or home automation will also co-determine the future of Elmos and give stimulation.
The auto industry recorded growth for the past year on a global scale. Even though 2014 gave “no cause for celebration“, as VDA President Wissmann puts it, growth continued to be strong particularly in Asia. What market and general conditions do you expect for 2015?For Europe we are expecting a more moderate market development, not least because of the general crises – as for instance the economic problems in the euro area, especially in Greece, or the crises of a political nature in Ukraine and the Middle East. China too will probably reach lower growth rates than back in 2014. Some experts assume that probably the U.S. alone will show
Elmos Annual Report 2014
Elmos Annual Report 2014 | 9
dynamic growth. Aside from these macroeconomic conditions you always have to deal with anyway, the trend for more microelectronics is intact and we are well-positioned with our products.
In view of these considerations, how does your forecast look for financials of the year 2015?For the current fiscal year 2015 Elmos expects growth in the mid single-digit percentage range. We also assume that we will manage to expand our strength of operations despite the highly competitive business environment and thus achieve a slightly better EBIT margin in 2015 compared to 2014. Elmos will spend less than 15% of sales for capital expenditures once more and reach a positive adjusted free cash flow again.
For Elmos investors, 2014 was a pleasant year. Apart from stock price gains, the dividend is an important aspect in this. What can investors expect to happen in 2015?After an already pleasant stock price performance over the year 2013, our share was even slightly ahead of its prior-year increase in the past year, gaining more than 50%. In 2014 we paid a dividend of 0.25 Euro per share. This equals a dividend return of about 1.7% based on the dividend payment 2014 closing date. Considering the increased results and the optimistic outlook, Supervisory Board and Management Board will propose to the Annual General Meeting of shareholders the payment of a dividend raised to 0.33 Euro. Therefore, in times of a negative interest return on savings, even
regarding the dividend alone makes the Elmos share an interesting option. In 2014 we answered the questions of investors all across Europe at numerous road shows and conferences and presented the Elmos story. Investors understand in increasing numbers that automotive electronics provides a vital general framework and offers very good prospects. We want to give you a closer understanding of the Company with this Annual Report and the easy-to-handle fact sheet as well. You are given an overview of the products, key markets, financial data, strategy, and many things more.
Let me summarize what lies ahead in 2015: Elmos will grow and become more profitable despite more difficult general conditions. You want to expand your customer base and occupy new growth areas. What makes you feel confident that you will achieve these goals?I know I can count on my team. By that I don’t just mean the management but all employees in Germany and abroad. In 2014 we showed a strong team effort in every area already. On behalf of the entire Management Board and the Supervisory Board I would therefore like to express our gratitude for the work of the past year. Yet I am convinced we can even do better in 2015. That requires no magic but above all know-how, drive, creativity, and hard work. And that is precisely what Elmos stands for.
Information for our shareholders – Management Board

10
Elmos Annual Report 2014 | 11
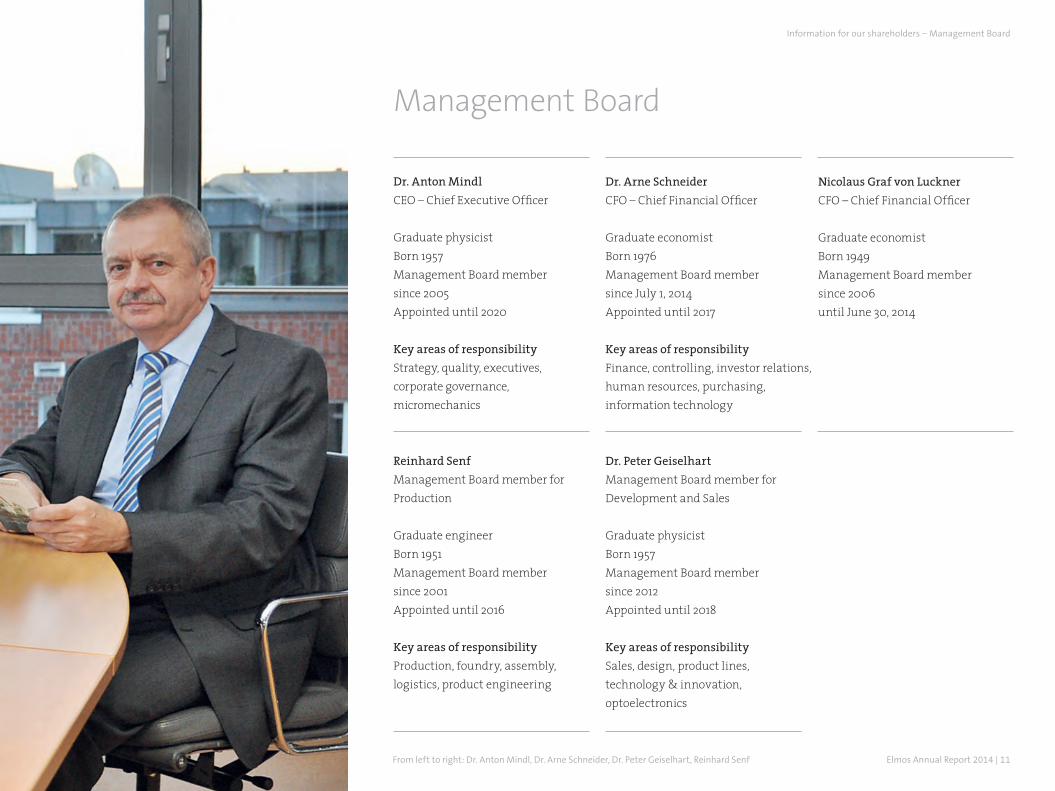
Management Board
Dr. Anton MindlCEO – Chief Executive Officer
Graduate physicistBorn 1957Management Board member since 2005Appointed until 2020
Key areas of responsibilityStrategy, quality, executives,corporate governance,micromechanics
Reinhard SenfManagement Board member for Production
Graduate engineerBorn 1951 Management Board member since 2001 Appointed until 2016
Key areas of responsibilityProduction, foundry, assembly, logistics, product engineering
Dr. Arne SchneiderCFO – Chief Financial Officer
Graduate economistBorn 1976 Management Board member since July 1, 2014 Appointed until 2017
Key areas of responsibilityFinance, controlling, investor relations, human resources, purchasing, information technology
Dr. Peter GeiselhartManagement Board member for Development and Sales
Graduate physicistBorn 1957 Management Board member since 2012 Appointed until 2018
Key areas of responsibilitySales, design, product lines,technology & innovation,optoelectronics
Nicolaus Graf von LucknerCFO – Chief Financial Officer
Graduate economistBorn 1949 Management Board member since 2006 until June 30, 2014
From left to right: Dr. Anton Mindl, Dr. Arne Schneider, Dr. Peter Geiselhart, Reinhard Senf
Information for our shareholders – Management Board

12
Elmos Annual Report 2014 | 13
Dear shareholders,
the Supervisory Board diligently attended to its duties and responsibilities imposed by law and the Articles of Incorporation in fiscal year 2014. The Board advised the Management Board in running the Company and supervised management activity. In oral and written reports, the Management Board supplied the Supervisory Board regularly and timely with comprehensive information on the Company’s situation. The Supervisory Board was directly involved in all decisions of substantial importance. The Management Board consulted the Supervisory Board on the Company’s strategic orientation and analyzed any divergences from the business plan individually. The Management Board’s reports on all business transactions of relevance to the Company were examined and discussed at length in the Supervisory Board meetings. Insofar as stipulated by law or the Articles of Incorporation, the Supervisory Board gave its opinion on the Management Board’s reports and resolutions following diligent examination and exhaustive discussion. Outside the framework of Supervisory Board meetings, the chairman and other members of the Supervisory Board were also informed about material business transactions by the CEO. Conflicting interests of Management Board or Supervisory Board members subject to mandatory disclosure to the Supervisory Board or the General Meeting did not occur.
There were four meetings altogether in fiscal year 2014, namely on March 6, 2014, May 13, 2014, September 3, 2014, and December 12, 2014. In a meeting held on March 4, 2015, the Supervisory Board concerned itself primarily with the 2014 financial statements and consolidated financial statements; the auditor was present for a part of this session. During the sessions, the Supervisory Board informed itself in detail about the development of the fiscal year ended December 31, 2014, the Company’s situation, and current business policy decisions on the basis of written and oral reports given by the Management Board. Based on these comprehensive explanations, the Supervisory Board passed the required resolutions. If necessary, resolutions were jointly passed by Supervisory Board and Management Board. The Supervisory Board regularly discussed the current performance of the Company with respect to sales, earnings and liquidity in its sessions as well as future prospects. In the individual meetings, the situation and structure of the subsidiaries as well as the Group’s strategic development beyond the year under review were dealt with in detail.
Individual key issues of the Supervisory Board meetings were the sales and customer structure, the present state of new design wins, and sales planning for the next five years. Other topics of debate on the Supervisory Board were the strategic development of the locations in Asia and the opening of the new office in Japan as well as the increase of the investment in the companies DMOS and MAZ. Also discussed were the conversion of production
Supervisory Board Report
Information for our shareholders – Supervisory Board Report
14
from 6 to 8-inch wafers and the capital expenditures connected to that. The Supervisory Board also concerned itself closely with the development of the subsidiary SMI. Another issue was the contract extension with the CEO until the year 2020.
As in the previous fiscal years, the Supervisory Board also dealt with the risk management system and its focal issues. The Management Board reported to the Supervisory Board on the present state of the compliance program and presented the catalog of compliance measures for the next two years. The Supervisory Board concerned itself with the recommendations and suggestions of the German Corporate Governance Code and prepared the declaration of compliance together with the Management Board. Furthermore, the Supervisory Board discussed the agenda of the upcoming Annual General Meeting to be held on May 8, 2015 in Dortmund. It also debated the appointment of the auditor and supervised auditor independence. Moreover, the Supervisory Board examined the efficiency of its own work and evaluated it.
All meetings of the Supervisory Board were attended by all of its members.
The Supervisory Board does not set up committees.
AUDIT OF SEPARATE FINANCIAL STATEMENTS AND CONSOLIDATED FINANCIAL STATEMENTS Consulting the certified accountants of Warth & Klein Grant Thornton AG, Wirtschaftsprüfungsgesellschaft, Düsseldorf, the Supervisory Board concerned itself in its meeting of March 4, 2015 with the audit of the separate financial statements and consolidated financial statements for the fiscal year ended December 31, 2014. According to the resolution of the Annual General Meeting of May 13, 2014 and the ensuing commission given by the Supervisory Board to the auditor, the separate financial statements prepared in accordance with HGB provisions (German Commercial Code) for the fiscal year ended December 31, 2014 and the joint group management report and management report of Elmos Semiconductor AG were audited by Warth & Klein Grant Thornton AG, Wirtschaftsprüfungsgesell-schaft, Düsseldorf. The auditor issued an unqualified audit opinion. The consolidated financial statements of Elmos Semiconductor AG were prepared in accordance with the International Financial Reporting Standards (IFRS) as applicable in the EU and completed with the statements required under Section 315 a (1) HGB. The consolidated financial statements according to IFRS and the combined management report also received an unqualified audit opinion. The financial statement documents, the Annual Report and the audit reports were submitted to all Supervisory Board members in due time. In the Supervisory Board meeting held on March 4,
2015, the statements and reports were also explained by the Management Board. The certified accountants also reported on the results of their audit in this session. After its own examination of the financial statements of Elmos Semiconductor AG, the consolidated financial statements and the combined management report as well as the Management Board’s proposal for the appropriation of profits, the Supervisory Board approved the auditor’s findings based on the audit and approved the financial statements of Elmos Semiconductor AG and the consolidated financial statements of the Elmos Group. The financial statements are thus adopted.
Supervisory Board and Management Board propose to the Annual General Meeting the resolution to pay a dividend of 0.33 Euro per share for fiscal year 2014 out of the retained earnings of 75.7 million Euro (according to HGB) and to carry forward the remaining amount to new accounts.
CORPORATE GOvERNANCE Management Board and Supervisory Board cooperate closely to the Company’s benefit and are committed to the sustainable increase of shareholder value. The Supervisory Board informs itself regularly about the new standards of corporate governance. In September 2014, Management Board and Supervisory Board jointly released an updated declaration pursuant to Section 161 AktG (Stock Corporation Act) on compliance with the
Elmos Annual Report 2014
Elmos Annual Report 2014 | 15
recommendations of the German Corporate Governance Code in the version of May 13, 2013. It can be found in this Annual Report on page 17. This declaration of compliance and all previous ones have been made permanently accessible to the shareholders on the Company’s website. The joint Corporate Governance Report prepared by Management Board and Supervisory Board is also part of this Annual Report, starting on page 16.
COMPOSITION OF SUPERvISORY BOARD AND MANAGEMENT BOARD There were no changes on the Supervisory Board in fiscal year 2014. The next elections to the Supervisory Board will be held in 2016 according to schedule.
There was one change on the Management Board in fiscal year 2014: Nicolaus Graf von Luckner left the Management Board of Elmos Semiconductor AG effective June 30, 2014 as he had reached retirement age. Dr. Arne Schneider was appointed new Management Board member as of July 1, 2014.
More information about the members of the Manage-ment Board can be found on page 11 of this Annual Report. Information on the members of the Supervisory Board is listed on the right.
The Supervisory Board thanks all employees and all members of the Management Board for their work and their contribution to the success achieved in fiscal year 2014.
Dortmund, March 4, 2015
On behalf of the Supervisory BoardProf. Dr. Günter ZimmerChairman of the Supervisory Board
Prof. Dr. Günter Zimmer, chairman Graduate physicist | Duisburg
Dr. Burkhard Dreher, vice chairman Graduate economist | Dortmund Dr. Klaus EggerGraduate engineer | Steyr-Gleink, Austria
Thomas Lehner1
Graduate engineer | Dortmund
Sven-Olaf Schellenberg1
Graduate physicist | Dortmund
Dr. Klaus WeyerGraduate physicist | Penzberg1 Employees‘ representative
Supervisory Board
Information for our shareholders – Supervisory Board Report
16
Corporate Governance Reportand statement on corporate governance
In the following chapter, the Management Board – also on behalf of the Supervisory Board – reports on corporate governance at Elmos Semiconductor AG pur-suant to No. 3.10 of the German Corporate Governance Code. This chapter also includes the statement on corporate governance in accordance with Section 289a HGB (German Commercial Code) and the remuneration report.
IMPLEMENTATION OF THE GERMAN CORPORATE GOvERNANCE CODEFor the Management Board and the Supervisory Board of Elmos Semiconductor AG, corporate governance means the implementation of responsible and sustainable com-pany management with the necessary transparency across all areas of the Group. Management Board and Supervisory Board have again concerned themselves intensively in fiscal year 2014 with the provisions of the German Corporate Governance Code. In 2014 the Government Commission made no amendments to the Code. The clarification with respect to the model tables as announced on September 30, 2014 was not implemented as for one the declaration of compliance was already released by that time and as Elmos does not fill out the model tables (deviation from GCGC No. 4.2.5 sentences 3 and 4).
In September 2014, the Boards jointly released the decla-ration of compliance in accordance with Section 161 AktG
once again. Apart from the reported deviations, all recommendations of the German Corporate Governance Code are complied with. All previously released decla-rations of compliance have been made permanently accessible on the Elmos website.
COMPLIANCE One of the essential tasks of the Management Board is the control and monitoring of compliance in the Group. Compliance stands for the observance of applicable law as well as of all rules and guidelines that exist within the Company. The compliance program at Elmos provides the organizational foundations for this. Its purpose is to strengthen the reputation of Elmos as a reliable business partner in a sustainable manner, prevent risks, and thus contribute to the Company’s overall success.
The essential principles applied by Elmos were put down in a Code of Conduct in 2011, revised and enhanced in 2013. The Code primarily includes guidance on the interaction with business partners and colleagues, dealing with information and data, and avoiding conflicting interests, and it also addresses the issues workplace safety and environmental protection. In 2011 the Management Board appointed a Compliance Officer, who is the person to address in all matters of compliance in addition to the respective superior. The Compliance Officer is in charge of the investigation of compliance cases. The Compliance Officer reports directly to the CFO.
Since 2011 the Code of Conduct has been a component of all new employment contracts. However, it applies for all employees of Elmos Semiconductor AG: All employees were given copies of the Code of Conduct along with the request to adhere to the rules defined therein. Training courses have been held for particularly sensitive areas; the employees were also informed about amendments to the Code on the occasion of works meetings. The Code of Conduct is permanently accessible on the Company’s website.
Aside from our general Elmos Code of Conduct there is also a version for our business partners in which we inform them about the Elmos guidelines.
Within the framework of routinely revising the com-pliance system and monitoring its effectiveness, the introduction of new measures was decided in the year under report whose implementation is scheduled for 2015/2016. The measures are intended to contribute to creating more clarity in the reporting lines, improving documentation, and conducting regular training courses also in the form of web-based training. Reports on the advancement and the present state of the bundle of measures are given regularly to the Supervisory Board.
Employees and other persons with access to insider information find entry in an insider list and are
Elmos Annual Report 2014
Elmos Annual Report 2014 | 17
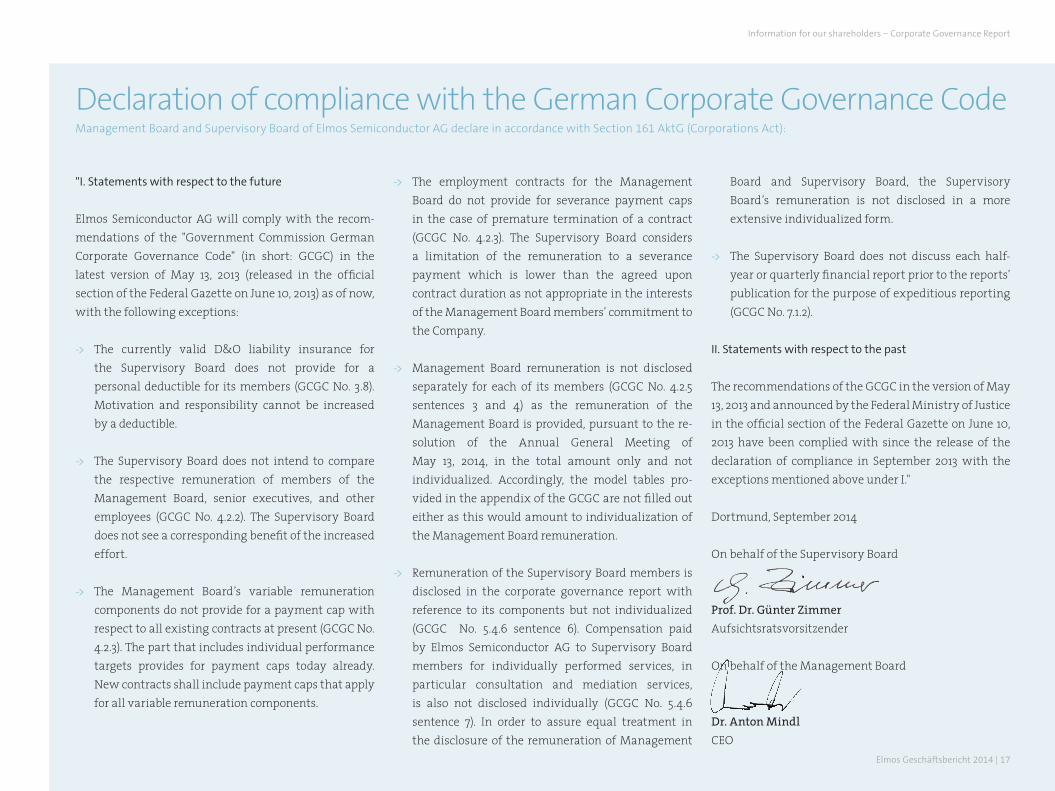
Declaration of compliance with the German Corporate Governance CodeManagement Board and Supervisory Board of Elmos Semiconductor AG declare in accordance with Section 161 AktG (Corporations Act):
"I. Statements with respect to the future
Elmos Semiconductor AG will comply with the recom-mendations of the "Government Commission German Corporate Governance Code" (in short: GCGC) in the latest version of May 13, 2013 (released in the official section of the Federal Gazette on June 10, 2013) as of now, with the following exceptions:
-> The currently valid D&O liability insurance for the Supervisory Board does not provide for a personal deductible for its members (GCGC No. 3.8). Motivation and responsibility cannot be increased by a deductible.
-> The Supervisory Board does not intend to compare the respective remuneration of members of the Management Board, senior executives, and other employees (GCGC No. 4.2.2). The Supervisory Board does not see a corresponding benefit of the increased effort.
-> The Management Board’s variable remuneration components do not provide for a payment cap with respect to all existing contracts at present (GCGC No. 4.2.3). The part that includes individual performance targets provides for payment caps today already. New contracts shall include payment caps that apply for all variable remuneration components.
-> The employment contracts for the Management Board do not provide for severance payment caps in the case of premature termination of a contract (GCGC No. 4.2.3). The Supervisory Board considers a limitation of the remuneration to a severance payment which is lower than the agreed upon contract duration as not appropriate in the interests of the Management Board members’ commitment to the Company.
-> Management Board remuneration is not disclosed separately for each of its members (GCGC No. 4.2.5 sentences 3 and 4) as the remuneration of the Management Board is provided, pursuant to the re- solution of the Annual General Meeting of May 13, 2014, in the total amount only and not individualized. Accordingly, the model tables pro-vided in the appendix of the GCGC are not filled out either as this would amount to individualization of the Management Board remuneration.
-> Remuneration of the Supervisory Board members is disclosed in the corporate governance report with reference to its components but not individualized (GCGC No. 5.4.6 sentence 6). Compensation paid by Elmos Semiconductor AG to Supervisory Board members for individually performed services, in particular consultation and mediation services, is also not disclosed individually (GCGC No. 5.4.6 sentence 7). In order to assure equal treatment in the disclosure of the remuneration of Management
Board and Supervisory Board, the Supervisory Board’s remuneration is not disclosed in a more extensive individualized form.
-> The Supervisory Board does not discuss each half-year or quarterly financial report prior to the reports’ publication for the purpose of expeditious reporting (GCGC No. 7.1.2).
II. Statements with respect to the past
The recommendations of the GCGC in the version of May 13, 2013 and announced by the Federal Ministry of Justice in the official section of the Federal Gazette on June 10, 2013 have been complied with since the release of the declaration of compliance in September 2013 with the exceptions mentioned above under I."
Dortmund, September 2014
On behalf of the Supervisory Board
Prof. Dr. Günter Zimmer Aufsichtsratsvorsitzender On behalf of the Management Board
Dr. Anton MindlCEO
Elmos Geschäftsbericht 2014 | 17
Information for our shareholders – Corporate Governance Report
18
informed about the applicable statutory provisions. They are regularly referred to trade restrictions due to their insider status.
WORKING METHODS OF MANAGEMENT BOARD AND SUPERvISORY BOARD Management Board and Supervisory Board share the commitment to responsible corporate governance. Their highest goal is to safeguard the Company’s existence and to increase the shareholder value. The Management Board currently has four members. The individual members of the Management Board are responsible for their respective key areas (overview on page 11); together they assume responsibility for the entire management in accordance with the applicable law, the Articles of Incorporation, the Board’s rules of procedure, and the resolutions of the General Meeting of shareholders. The Management Board represents the Company to the outside world. The Board is responsible for the management of the Group, the definition and monitoring of the Group’s strategic orientation and corporate targets, and the Group’s financing. The Management Board usually meets in full session once a week. The Management Board gives regular, extensive and timely reports to the Supervisory Board on all developments and events of relevance to the Company.
The Supervisory Board supervises the Management Board, appoints its members, and advises them with respect to the Company’s management. Upon the nomi-
nation of candidates for the Management Board, the Supervisory Board examines the eligibility of women and men equally. Finding the right person for the position according to his or her qualification for the benefit of the Company remains the top priority.
Nicolaus Graf von Luckner, CFO, left the Management Board effective June 30, 2014 as he had reached retire-ment age. His successor is Dr. Arne Schneider.
Management Board and Supervisory Board work together closely based on mutual trust. The Management Board always involves the Supervisory Board in essential decisions. The rules of procedure of the two Boards define this cooperation, among other issues. A detailed summary of the Supervisory Board’s work can be found in the Supervisory Board Report starting on page 12. The chairman gives a report to the shareholders on the Supervisory Board’s work over the past fiscal year at each Annual General Meeting.
The Supervisory Board of Elmos Semiconductor AG has six members, elected for five years in accordance with the Articles of Incorporation. Pursuant to the provisions of the German One-Third Participation Act (Drittelbeteiligungsgesetz), the Supervisory Board consists of four shareholders’ representatives and two employees’ representatives. The representatives of the shareholders are elected by the Annual General Meeting, the employees’ representatives are elected by the staff.
The most recent elections were held in 2011 so that the acting Supervisory Board is elected until the 2016 Annual General Meeting. The Supervisory Board does not set up committees.
GOALS OF THE SUPERvISORY BOARD WITH RESPECT TO ITS COMPOSITIONBased on the requirements defined by the German Corporate Governance Code, the Supervisory Board has established goals and principles with respect to the Board’s composition. Among them are international experience, technical and entrepreneurial expertise, strategic vision, knowledge of the Company, industry specific know-how, and experience with accounting and internal control processes. Diversity and the avoidance of conflicting interests are other goals. The Supervisory Board has also set itself the target that at least one woman shall be represented on the Supervisory Board in the future. Moreover, it has defined an age limit for the Board’s members at the time of election. Of the four shareholders’ representatives on the Supervisory Board, at least one member shall be independent within the meaning of No. 5.4.2 of the German Corporate Governance Code.
The goals and principles as described above – with the exception of the intended participation of women – are fully realized already with the present composition of the Supervisory Board of Elmos Semiconductor AG and will also be considered for future nominations. The
Elmos Annual Report 2014
Elmos Annual Report 2014 | 19
election proposals made by the Supervisory Board for the election of Supervisory Board members will primarily remain oriented toward the Company’s benefit while considering all above-mentioned goals.
The composition of the Supervisory Board is described on page 15 of this Annual Report.
SHAREHOLDERS AND GENERAL MEETINGShareholders make use of their rights at the Annual General Meeting. Prior to the meeting, they receive the agenda, information regarding participation, and upon request the Annual Report.
All the relevant documents relating to the upcoming and past Annual General Meetings as well as further information on participation in and voting at the General Meeting are available on our website – also in English – and can be requested in print from the Company.
Shareholders who cannot attend the General Meeting in person have the option to assign their voting rights to proxies nominated by Elmos. The proxy can be contacted throughout the entire length of the General Meeting. Furthermore, the Annual General Meeting is webcast in its entirety on our website. After the General Meeting, shareholder presence and voting results will be announced on the Internet. The next Annual General Meeting will be held on May 8, 2015 in Dortmund.
Dates of importance to the shareholders are compiled annually in a financial calendar which is published on the Internet and in the Annual Report. All quarterly and annual financial reports are available on the website. The CEO and the CFO regularly provide information on the current position of the Company to analysts and investors within the framework of road shows and conferences. The investor relations team of Elmos Semiconductor AG is also available for any questions the shareholders may have.
ANTICIPATORY RISK MANAGEMENT Efficient risk management contributes to the success of sound corporate governance. Risk management of this grade does its part in detecting risks at an early stage, assessing them, and initiating adequate countermeasures. All company divisions are involved in the risk management system implemented at Elmos. Parameters for risk assessment are the probability of occurrence and the estimated amount of loss. This risk assessment is regularly updated, even at shorter notice if necessary. We give account of the principles of the risk management system as well as of current corporate risks in the combined management report under “Opportunities and risks”.
AUDIT CONDUCTED BY WARTH & KLEIN GRANT THORNTON Before submitting the proposal for the appointment of the auditor, the Supervisory Board once again obtained a declaration from the auditor on relationships between the auditor, its boards, and its audit manager with the Company or the Company’s Board members for fiscal year 2014. This declaration furnished no doubts about auditor independence. Compliant with No. 7.2.3 of the German Corporate Governance Code, the Supervisory Board arranged for the auditor to give account without delay of any material findings and incidents to occur during the performance of the audit. The Supervisory Board also determined that the auditor inform the Supervisory Board or make note in the audit report if the auditor establishes differences from the declaration of compliance as issued by the Management Board and the Supervisory Board. No inconsistencies of this kind were established.
STOCK OPTION PLANS Elmos has issued stock option plans for employees, executives and Management Board members. The stock price is a central criterion for our shareholders to determine the return on an investment in the Company. The link to the stock price is therefore the beneficiaries’ incentive within the scope of the stock option plan. The performance hurdle and the absolute performance target are 20% so that options can only be exercised if the shareholder value has been increased considerably.
Information for our shareholders – Corporate Governance Report
20
Moreover, the pecuniary advantage the beneficiaries can achieve by exercising their options is limited to a fourfold of the exercise price defined upon the issue of options. The plans are explained in detail in the notes to the consolidated financial statements; therefore please refer to note 23 for further information.
REMUNERATION REPORT Total remuneration of the Management Board The Supervisory Board decides and routinely reviews the remuneration system and the essential contract terms and conditions for the Management Board members. Total Management Board remuneration comprises a fixed monthly salary, a management bonus and stock-based payment as well as fringe benefits and pension benefits. The Company does not provide an individualized disclosure of the remuneration with respect to privacy protection. Management Board and Supervisory Board agree that such a disclosure would not contribute to greater transparency in the form of additional information relevant to the capital market. By resolution of the Annual General Meeting of May 13, 2014, the Company is exempt from its legal obligation for individualized disclosure of Management Board remuneration for the period of five years.
Management Board remuneration comprises fixed components and variable incentive components. In fiscal year 2014, the members of the Management Board received a total fixed remuneration of 1,512 thousand Euro
(2013: 1,625 thousand Euro) and variable remuneration of 775 thousand Euro (2013: 689 thousand Euro). The variable incentive components are linked to the Group’s current earnings before taxes on the one hand and to personal, individualized targets, agreed on annually with the Supervisory Board, on the other hand.
Within the framework of a share matching plan, 3,488 stock claims at a time value of 86 thousand Euro were issued to the members of the Management Board (2013: no stock claims). There are indirect pension commitments of a pension fund to members of the Management Board of Elmos. The pension fund has taken out corresponding reinsurance policies for the completely congruent coverage of its plan contributions. In 2014 payments for these reinsurance policies amounted to 451 thousand Euro (2013: 517 thousand Euro), included in the fixed components of the remuneration.
Remuneration of former Management Board members or their surviving dependents amounted to 167 thousand Euro in fiscal year 2014 (2013: 410 thousand Euro). In addition, insurance premiums of 111 thousand Euro were paid for this group of beneficiaries (2013: 255 thousand Euro). Facing these amounts are reimbursements from reinsurance policies in the amount of 123 thousand Euro (2013: 79 thousand Euro). Pension provisions for former Management Board members or their surviving dependents came to 1,610 thousand Euro as of December 31, 2014 (2013: 2,891 thousand Euro). After setting off
pension provisions against the time value of pension plan reinsurance, 192 thousand Euro (2013: 450 thousand Euro) remain as pension provisions and similar obligations altogether recognized for the Group.
Apart from pension commitments and compensation agreements in case of a change of control or as a consequence of a non-competition clause, no additional benefits have been promised to any Management Board member in case of the termination of occupation. Nor did any member of the Management Board receive benefits or corresponding commitments from third parties with regard to his position on the Management Board in the past fiscal year.
Total remuneration of the Supervisory Board The Supervisory Board’s remuneration is defined by Section 9 of the Articles of Incorporation. The Supervisory Board members receive fixed and incentive payments in addition to the reimbursement of their expenses. The incentive remuneration is linked to the dividend and thus oriented toward the Company’s long-term and sustained success. 25 percent of the fixed remuneration and 50 percent of the variable remuneration are paid in shares of the Company. A holding period of three calendar years applies to shares received as remuneration as of the shares’ respective grant date. The Supervisory Board members are not granted Elmos stock options for their positions on the Board.
Elmos Annual Report 2014
Elmos Annual Report 2014 | 21
Compliant with the recommendation of the German Corporate Governance Code for Supervisory Board remuneration in consideration of chairmanship and vice chairmanship, the chairman receives twice the amount of the regular fixed and variable payments and the vice chairman receives one and a half times of said amount. The Supervisory Board members’ remuneration is disclosed in summarized form, yet not individualized. This also applies for payments made to Supervisory Board members for individually performed services, particularly consulting and mediation services.
The fixed remuneration paid to members of the Supervisory Board in fiscal year 2014 amounted to the total of 82 thousand Euro (2013: 83 thousand Euro). This amount includes expenses and disbursements. Payments of variable remuneration amounted to 158 thousand Euro (2013: 158 thousand Euro). The Company paid 22 thousand Euro (2013: 10 thousand Euro) to members of the Supervisory Board for consulting and other services.
DIRECTORS’ DEALINGS Persons who hold executive positions with an issuer of stock and persons closely related to such a person are obligated by law to disclose the purchase and sale of Elmos stock in accordance with Section 15a WpHG (Securities Trading Act). All such directors’ dealings are announced immediately upon notification Europe-wide and made public on the Company’s website. For detailed
information about directors’ dealings, please refer to the notes to the consolidated financial statements (note 38) in this Annual Report.
HOLDINGS OF STOCK AND STOCK OPTIONS The disclosures of the Company’s stock and stock options held by members of Management Board and Supervisory Board are explained in detail in the notes to the consolidated financial statements; please refer to note 35 for this information. In accordance with No. 6.3 GCGC, the members of the Supervisory Board had combined direct or indirect holdings of approx. 34.6% of the stock issued by the Company and the members of the Management Board had combined direct or indirect holdings of 1.2% (as of December 31, 2014).
Information for our shareholders – Corporate Governance Report
22
Elmos Annual Report 2014 | 23
Sustainability
Sustainability is part of our corporate strategy. We perceive added value in a comprehensive way and orient the success of our business activities not only toward financial key figures but we also want to connect that success to social acceptance.
ENvIRONMENTEnvironmental protection is one of our guiding corporate principles. Acting responsibly today means securing the future. The following principles determine our conduct:
Legal compliance: Laws and provisions on environmental protection and other standards the Company has committed to are strictly complied with.
Minimization of environmental hazards: Environmental issues concern many processes and patterns of behavior in the Company. In this regard, we aim for an economical and efficient use of resources, the application of economically sound state-of-the-art technologies, and precaution against accidents and the interruption of business operations.
Sense of responsibility among the staff: Each employee pays attention to environmentally responsible conduct. The active promotion of a sense of responsibility by employee training is a constant management task.
Eco management: Elmos has implemented an eco management system with a structure of clearly defined responsibilities and tasks.
Continuous improvement: The goal of the eco protection management system is a systematic and continuous improvement of our Company’s environmental pro-tection performance.
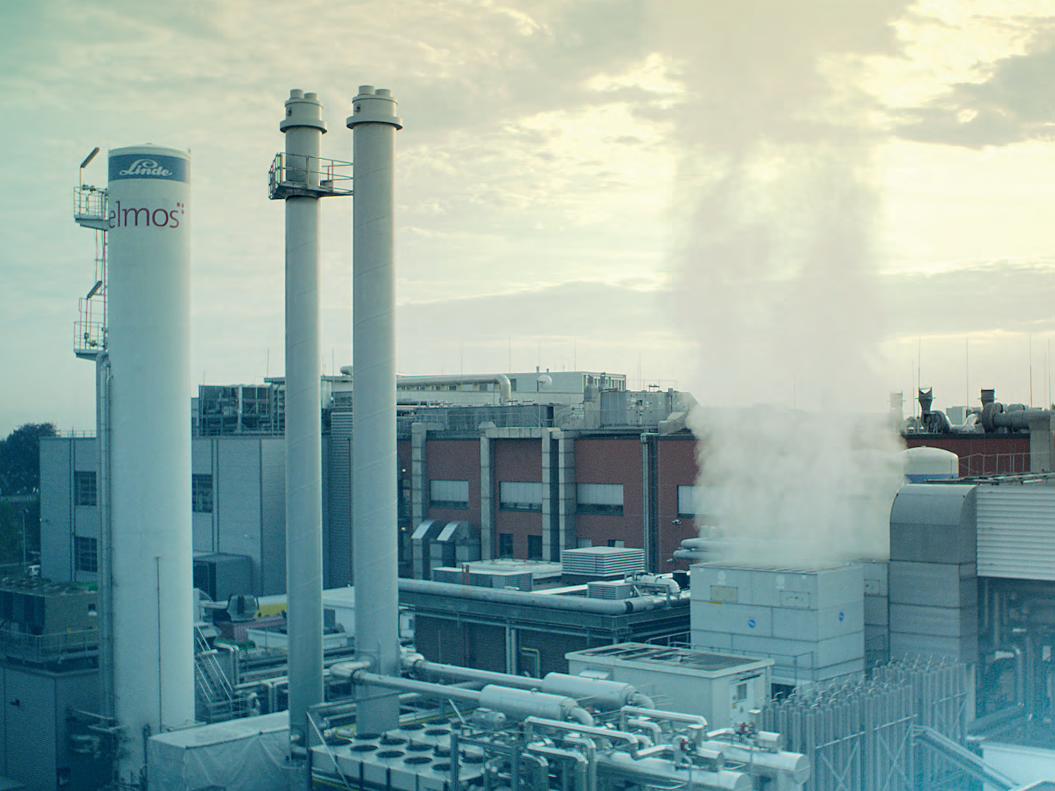
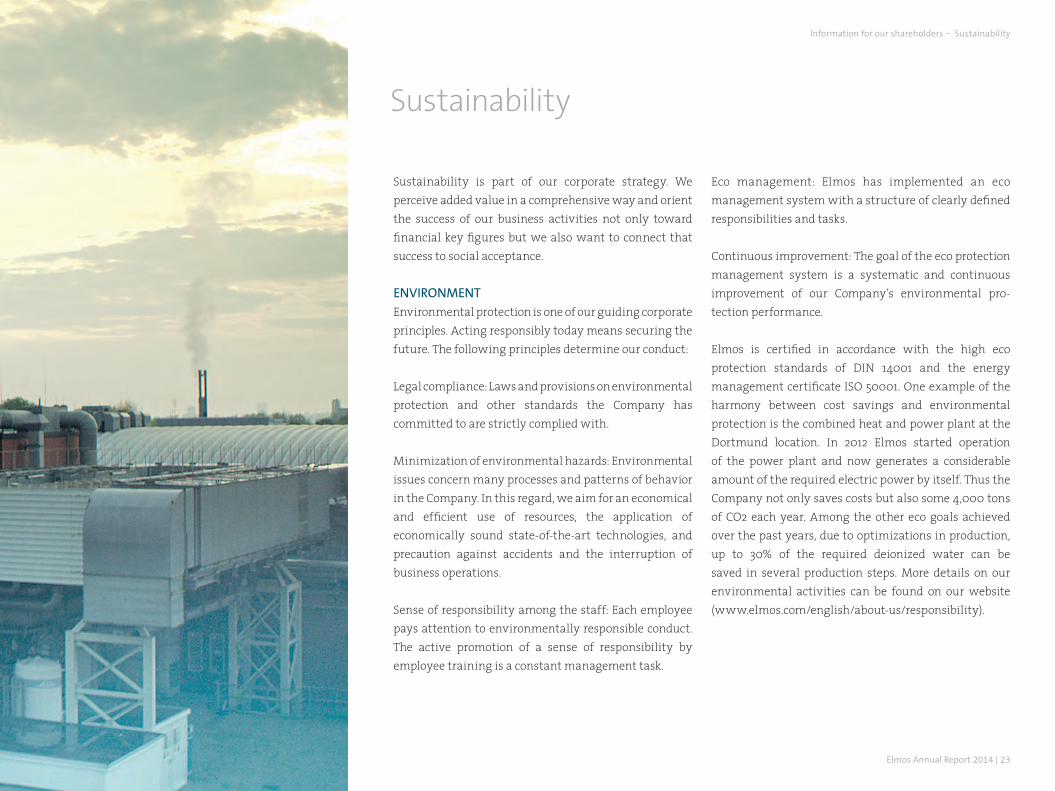
Elmos is certified in accordance with the high eco protection standards of DIN 14001 and the energy management certificate ISO 50001. One example of the harmony between cost savings and environmental protection is the combined heat and power plant at the Dortmund location. In 2012 Elmos started operation of the power plant and now generates a considerable amount of the required electric power by itself. Thus the Company not only saves costs but also some 4,000 tons of CO2 each year. Among the other eco goals achieved over the past years, due to optimizations in production, up to 30% of the required deionized water can be saved in several production steps. More details on our environmental activities can be found on our website (www.elmos.com/english/about-us/responsibility).
Information for our shareholders – Sustainability
24
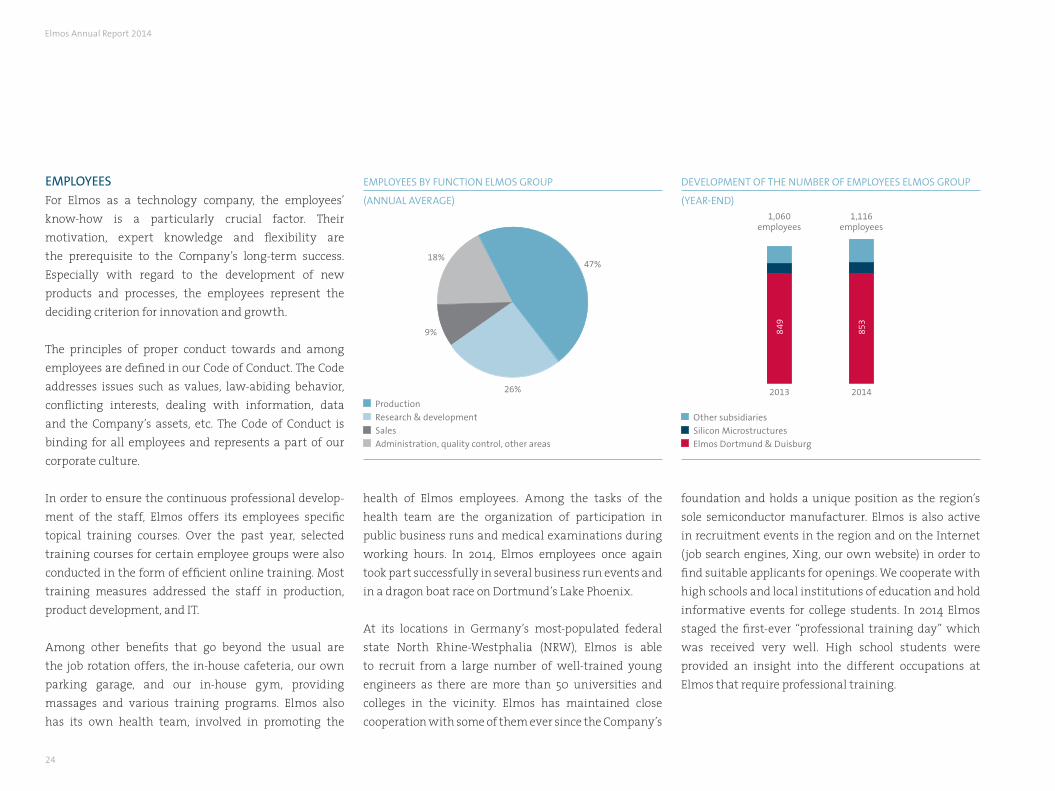
EMPLOYEESFor Elmos as a technology company, the employees’ know-how is a particularly crucial factor. Their motivation, expert knowledge and flexibility are the prerequisite to the Company’s long-term success. Especially with regard to the development of new products and processes, the employees represent the deciding criterion for innovation and growth.
The principles of proper conduct towards and among employees are defined in our Code of Conduct. The Code addresses issues such as values, law-abiding behavior, conflicting interests, dealing with information, data and the Company’s assets, etc. The Code of Conduct is binding for all employees and represents a part of our corporate culture.
In order to ensure the continuous professional develop-ment of the staff, Elmos offers its employees specific topical training courses. Over the past year, selected training courses for certain employee groups were also conducted in the form of efficient online training. Most training measures addressed the staff in production, product development, and IT.
Among other benefits that go beyond the usual are the job rotation offers, the in-house cafeteria, our own parking garage, and our in-house gym, providing massages and various training programs. Elmos also has its own health team, involved in promoting the
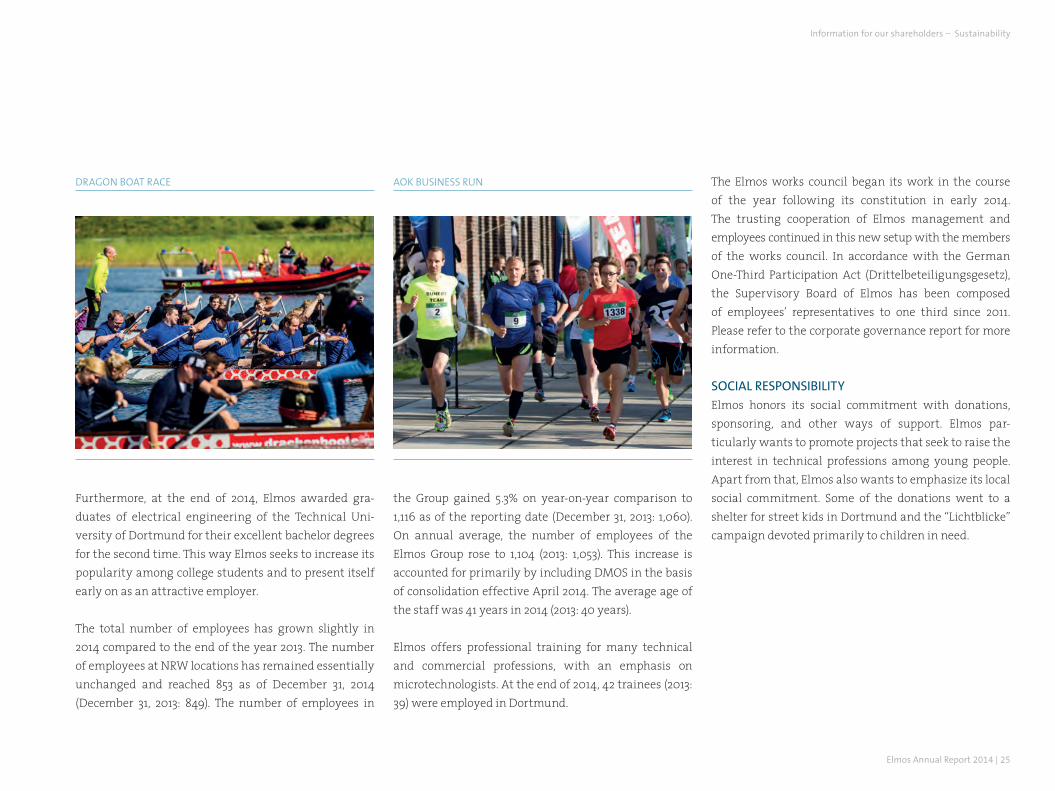
health of Elmos employees. Among the tasks of the health team are the organization of participation in public business runs and medical examinations during working hours. In 2014, Elmos employees once again took part successfully in several business run events and in a dragon boat race on Dortmund’s Lake Phoenix.
At its locations in Germany’s most-populated federal state North Rhine-Westphalia (NRW), Elmos is able to recruit from a large number of well-trained young engineers as there are more than 50 universities and colleges in the vicinity. Elmos has maintained close cooperation with some of them ever since the Company’s
foundation and holds a unique position as the region’s sole semiconductor manufacturer. Elmos is also active in recruitment events in the region and on the Internet (job search engines, Xing, our own website) in order to find suitable applicants for openings. We cooperate with high schools and local institutions of education and hold informative events for college students. In 2014 Elmos staged the first-ever “professional training day” which was received very well. High school students were provided an insight into the different occupations at Elmos that require professional training.
Production
Research & development
Sales
Administration, quality control, other areas
Other subsidiaries
Silicon Microstructures
Elmos Dortmund & Duisburg
EMPLOYEES BY FUNCTION ELMOS GROUP
(ANNUAL AvERAGE)
DEvELOPMENT OF THE NUMBER OF EMPLOYEES ELMOS GROUP
(YEAR-END)
1,060employees
2013
849
1,116employees
2014
853
26%
47%
9%
18%
Elmos Annual Report 2014
Elmos Annual Report 2014 | 25
Furthermore, at the end of 2014, Elmos awarded gra-duates of electrical engineering of the Technical Uni-versity of Dortmund for their excellent bachelor degrees for the second time. This way Elmos seeks to increase its popularity among college students and to present itself early on as an attractive employer.
The total number of employees has grown slightly in 2014 compared to the end of the year 2013. The number of employees at NRW locations has remained essentially unchanged and reached 853 as of December 31, 2014 (December 31, 2013: 849). The number of employees in
DRAGON BOAT RACE AOK BUSINESS RUN
the Group gained 5.3% on year-on-year comparison to 1,116 as of the reporting date (December 31, 2013: 1,060). On annual average, the number of employees of the Elmos Group rose to 1,104 (2013: 1,053). This increase is accounted for primarily by including DMOS in the basis of consolidation effective April 2014. The average age of the staff was 41 years in 2014 (2013: 40 years).
Elmos offers professional training for many technical and commercial professions, with an emphasis on microtechnologists. At the end of 2014, 42 trainees (2013: 39) were employed in Dortmund.
The Elmos works council began its work in the course of the year following its constitution in early 2014. The trusting cooperation of Elmos management and employees continued in this new setup with the members of the works council. In accordance with the German One-Third Participation Act (Drittelbeteiligungsgesetz), the Supervisory Board of Elmos has been composed of employees’ representatives to one third since 2011. Please refer to the corporate governance report for more information.
SOCIAL RESPONSIBILITYElmos honors its social commitment with donations, sponsoring, and other ways of support. Elmos par-ticularly wants to promote projects that seek to raise the interest in technical professions among young people. Apart from that, Elmos also wants to emphasize its local social commitment. Some of the donations went to a shelter for street kids in Dortmund and the “Lichtblicke” campaign devoted primarily to children in need.
Information for our shareholders – Sustainability

26
Elmos Annual Report 2014 | 27
The Elmos share
GENERAL DEvELOPMENT IN THE STOCK MARKETS The international stock markets were subject to turbulences in 2014 and determined by high volatility. Globally expansive monetary policies and various geopolitical crises played a special part in this. The Ukraine conflict and the sanctions imposed on Russia kept the stock markets busy throughout the year and beyond. The DAX recorded many highs and lows in the year 2014 and reached the all-time high of 10,000 points by mid-2014 for the first time.
Following a significant increase in 2013, the general stock indices managed to record positive performances in 2014, too, even though they turned out much weaker by comparison. DAX, Prime All Share, and CDAX gained 2.7%, 2.7%, and 3.1% respectively. The industry indices of relevance to Elmos performed much better than that. The tech industry as a whole showed a highly positive development. TecDAX, DAXsector Technology, DAXSector All Technology, Technology All Share, and DAXSubsector Semiconductors all achieved gains in 2014 between some 15 and 20 percent. Only DAXSector Automobile recorded not as steep an increase with a 6.9% gain.
ELMOS STOCK PRICE PERFORMANCE ELMOS COMPARED TO INDICES
Period ended December 31, 2014 Since 1/1/2013
Since 1/1/2014
Elmos (Xetra) 126.6% 51.4%
Industry indices
TecDAX 65.6% 17.5%
DAXSector Technology1 45.0% 15.5%
DAXSector All Technology1 60.1% 14.7%
Technology All Share1 61.0% 15.2%
DAXSubsectorSemiconductors1 50.9% 19.9%
DAXSector Automobile 52.6% 6.9%
General market indices
DAX 28.8% 2.7%
Prime All Share1 31.5% 2.7%
CDAX1 30.7% 3.1%
1 Elmos is part of this index.
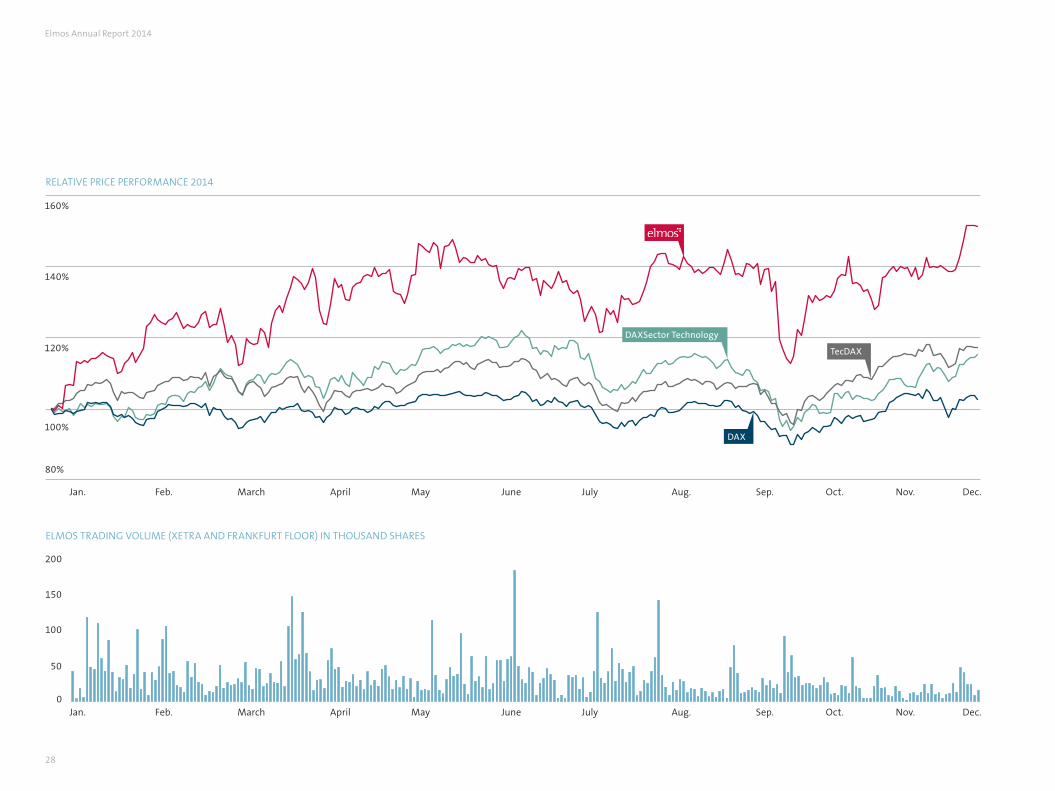
After an already very positive performance in 2013, the Elmos share showed a highly satisfactory development in the year 2014 as well. The Elmos stock presents a considerably higher increase than the indices of relevance. With a gain of 51.4% in 2014, the Elmos share even slightly exceeded the prior-year performance of 49.7%. The positive development over the first half-year 2014 (+37.1%) was continued – following sideways motion in the third quarter – by the end of the year. The Elmos share closed at year-end at 16.20 Euro.
The stock reached its 52-week low of 10.65 Euro on January 2, 2014 and its 52-week high on December 22, 2014 at 16.25 Euro (all prices Xetra). On year-on-year com-
Information for our shareholders – The Elmos share
28
RELATIvE PRICE PERFORMANCE 2014
ELMOS TRADING vOLUME (XETRA AND FRANKFURT FLOOR) IN THOUSAND SHARES
0
50
100
150
200
Jan. Feb. March April May June July Aug. Sep. Oct. Nov. Dec.
100%
80%
120%
140%
160%
TecDAX
DAX
DAXSector Technology
Jan. Feb. March April May June July Aug. Sep. Oct. Nov. Dec.
Elmos Annual Report 2014
Elmos Annual Report 2014 | 29
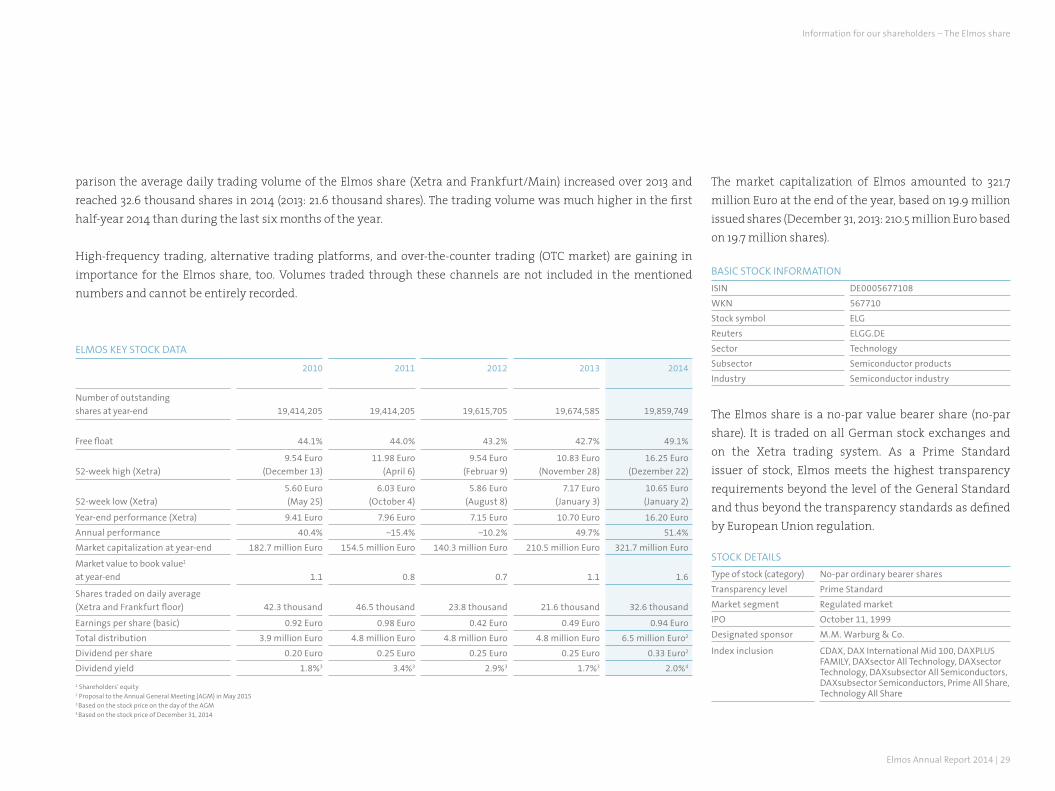
parison the average daily trading volume of the Elmos share (Xetra and Frankfurt/Main) increased over 2013 and reached 32.6 thousand shares in 2014 (2013: 21.6 thousand shares). The trading volume was much higher in the first half-year 2014 than during the last six months of the year.
High-frequency trading, alternative trading platforms, and over-the-counter trading (OTC market) are gaining in importance for the Elmos share, too. Volumes traded through these channels are not included in the mentioned numbers and cannot be entirely recorded.
ELMOS KEY STOCK DATA
2010
2011 2012 2013 2014
Number of outstanding
shares at year-end 19,414,205 19,414,205 19,615,705 19,674,585 19,859,749
Free float 44.1% 44.0% 43.2% 42.7% 49.1%
52-week high (Xetra)
9.54 Euro
(December 13)
11.98 Euro
(April 6)
9.54 Euro
(Februar 9)
10.83 Euro
(November 28)
16.25 Euro
(Dezember 22)
52-week low (Xetra)
5.60 Euro
(May 25)
6.03 Euro
(October 4)
5.86 Euro
(August 8)
7.17 Euro
(January 3)
10.65 Euro
(January 2)
Year-end performance (Xetra) 9.41 Euro 7.96 Euro 7.15 Euro 10.70 Euro 16.20 Euro
Annual performance 40.4% −15.4% −10.2% 49.7% 51.4%
Market capitalization at year-end 182.7 million Euro 154.5 million Euro 140.3 million Euro 210.5 million Euro 321.7 million Euro
Market value to book value1
at year-end 1.1 0.8 0.7 1.1 1.6
Shares traded on daily average
(Xetra and Frankfurt floor) 42.3 thousand 46.5 thousand 23.8 thousand 21.6 thousand 32.6 thousand
Earnings per share (basic) 0.92 Euro 0.98 Euro 0.42 Euro 0.49 Euro 0.94 Euro
Total distribution 3.9 million Euro 4.8 million Euro 4.8 million Euro 4.8 million Euro 6.5 million Euro2
Dividend per share 0.20 Euro 0.25 Euro 0.25 Euro 0.25 Euro 0.33 Euro2
Dividend yield 1.8%3 3.4%3 2.9%3 1.7%3 2.0%4
1 Shareholders’ equity 2 Proposal to the Annual General Meeting (AGM) in May 20153 Based on the stock price on the day of the AGM 4 Based on the stock price of December 31, 2014
The market capitalization of Elmos amounted to 321.7 million Euro at the end of the year, based on 19.9 million issued shares (December 31, 2013: 210.5 million Euro based on 19.7 million shares).
BASIC STOCK INFORMATION
ISIN DE0005677108
WKN 567710
Stock symbol ELG
Reuters ELGG.DE
Sector Technology
Subsector Semiconductor products
Industry Semiconductor industry
The Elmos share is a no-par value bearer share (no-par share). It is traded on all German stock exchanges and on the Xetra trading system. As a Prime Standard issuer of stock, Elmos meets the highest transparency requirements beyond the level of the General Standard and thus beyond the transparency standards as defined by European Union regulation.
STOCK DETAILS
Type of stock (category) No-par ordinary bearer shares
Transparency level Prime Standard
Market segment Regulated market
IPO October 11, 1999
Designated sponsor M.M. Warburg & Co.
Index inclusion CDAX, DAX International Mid 100, DAXPLUS FAMILY, DAXsector All Technology, DAXsector Technology, DAXsubsector All Semiconductors, DAXsubsector Semiconductors, Prime All Share, Technology All Share
Jan. Feb. March April May June July Aug. Sep. Oct. Nov. Dec.
Information for our shareholders – The Elmos share
30
situation and, in particular, to consider our prospects. Elmos pursues the goal to inform comprehensively and quickly and to be conveniently accessible at any time – for private and institutional investors and for analysts alike. Aiming for both comprehensive and timely information provided equally to all target groups, we have compiled a large body of corporate information on our website. Interested investors may inform themselves in detail about the Company and its products and technologies at www.elmos.com on the Internet. Apart from information about corporate governance, the “Investor/Press relations” section also offers financial reports, a financial calendar, the Company’s Articles
SHARE CAPITAL AND SHAREHOLDER STRUCTURE The share capital of Elmos Semiconductor AG is divided into 19,859,749 no-par value shares with a proportionate amount of 1.00 Euro of the share capital allotted to each share.
By servicing stock options with treasury shares, the number of treasury shares was reduced in the course of the year 2014, among other reasons. At the end of the year 2014 Elmos held 280,825 treasury shares, equivalent to 1.4% of the share capital (December 31, 2013: 327,697 treasury shares).
In the year 2014 stock options from the tranches issued in 2009 and 2010 were exercised. This led to an increase in share capital by 185,164 Euro (2013: 58,880 Euro). The 38,940 stock options still outstanding from the 2009 tranche can still be exercised until June 2015, the 123,744 stock options still outstanding from the 2010 tranche can be exercised until 2017. Moreover, the exercise timeframe for another tranche of stock options (tranche 2011) will open in the year 2015.
All voting rights announcements, disclosures of the total number of voting rights, and directors’ dealings notifications were made public Europe-wide according to statutory regulations and are also available at www.elmos.com.
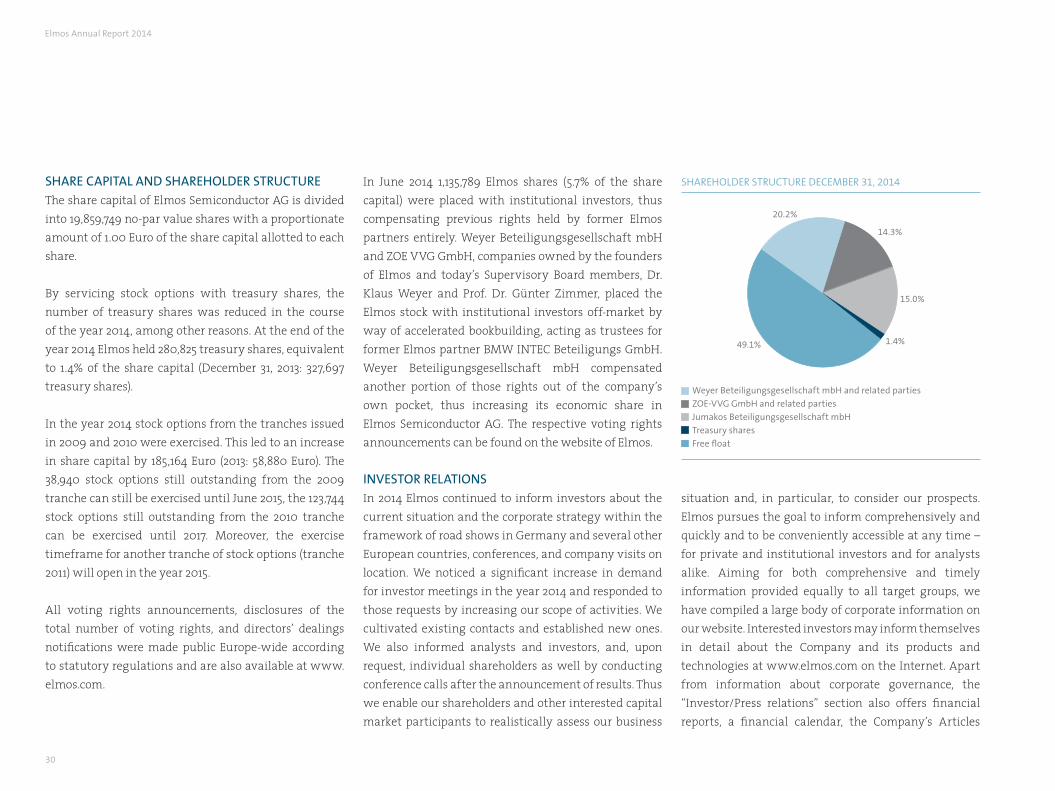
In June 2014 1,135,789 Elmos shares (5.7% of the share capital) were placed with institutional investors, thus compensating previous rights held by former Elmos partners entirely. Weyer Beteiligungsgesellschaft mbH and ZOE VVG GmbH, companies owned by the founders of Elmos and today’s Supervisory Board members, Dr. Klaus Weyer and Prof. Dr. Günter Zimmer, placed the Elmos stock with institutional investors off-market by way of accelerated bookbuilding, acting as trustees for former Elmos partner BMW INTEC Beteiligungs GmbH. Weyer Beteiligungsgesellschaft mbH compensated another portion of those rights out of the company’s own pocket, thus increasing its economic share in Elmos Semiconductor AG. The respective voting rights announcements can be found on the website of Elmos.
INvESTOR RELATIONS In 2014 Elmos continued to inform investors about the current situation and the corporate strategy within the framework of road shows in Germany and several other European countries, conferences, and company visits on location. We noticed a significant increase in demand for investor meetings in the year 2014 and responded to those requests by increasing our scope of activities. We cultivated existing contacts and established new ones. We also informed analysts and investors, and, upon request, individual shareholders as well by conducting conference calls after the announcement of results. Thus we enable our shareholders and other interested capital market participants to realistically assess our business
SHAREHOLDER STRUCTURE DECEMBER 31, 2014
Weyer Beteiligungsgesellschaft mbH and related parties
ZOE-vvG GmbH and related parties
Jumakos Beteiligungsgesellschaft mbH
Treasury shares
Free float
20.2%
49.1%
15.0%
14.3%
1.4%
Elmos Annual Report 2014
Elmos Annual Report 2014 | 31
of Incorporation, information on the Annual General Meeting, press releases, directors’ dealings, and the recordings of our conference calls on the occasion of quarterly and annual financial statements. Elmos is also happy to send out information such as annual or quarterly financial reports by mail or e-mail. We maintain an e-mail distribution list to inform interested investors routinely about corporate news, and we are also active in social networks (Twitter, YouTube, Xing, and SlideShare).
DIvIDEND
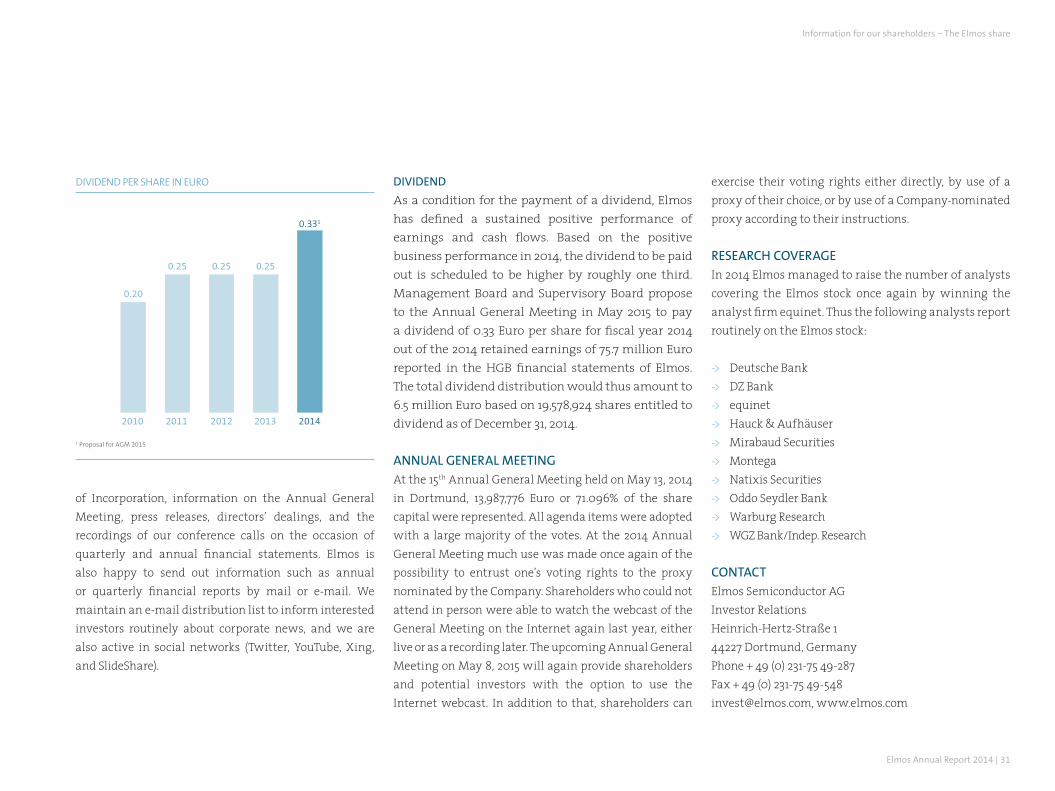
As a condition for the payment of a dividend, Elmos has defined a sustained positive performance of earnings and cash flows. Based on the positive business performance in 2014, the dividend to be paid out is scheduled to be higher by roughly one third. Management Board and Supervisory Board propose to the Annual General Meeting in May 2015 to pay a dividend of 0.33 Euro per share for fiscal year 2014 out of the 2014 retained earnings of 75.7 million Euro reported in the HGB financial statements of Elmos. The total dividend distribution would thus amount to 6.5 million Euro based on 19,578,924 shares entitled to dividend as of December 31, 2014.
ANNUAL GENERAL MEETING At the 15th Annual General Meeting held on May 13, 2014 in Dortmund, 13,987,776 Euro or 71.096% of the share capital were represented. All agenda items were adopted with a large majority of the votes. At the 2014 Annual General Meeting much use was made once again of the possibility to entrust one’s voting rights to the proxy nominated by the Company. Shareholders who could not attend in person were able to watch the webcast of the General Meeting on the Internet again last year, either live or as a recording later. The upcoming Annual General Meeting on May 8, 2015 will again provide shareholders and potential investors with the option to use the Internet webcast. In addition to that, shareholders can
exercise their voting rights either directly, by use of a proxy of their choice, or by use of a Company-nominated proxy according to their instructions.
RESEARCH COvERAGE In 2014 Elmos managed to raise the number of analysts covering the Elmos stock once again by winning the analyst firm equinet. Thus the following analysts report routinely on the Elmos stock:
-> Deutsche Bank -> DZ Bank -> equinet -> Hauck & Aufhäuser -> Mirabaud Securities-> Montega-> Natixis Securities-> Oddo Seydler Bank-> Warburg Research-> WGZ Bank/Indep. Research
CONTACTElmos Semiconductor AGInvestor RelationsHeinrich-Hertz-Straße 144227 Dortmund, GermanyPhone + 49 (0) 231-75 49-287Fax + 49 (0) 231-75 [email protected], www.elmos.com
DIvIDEND PER SHARE IN EURO
2010
0.331
0.250.250.25
0.20
2011 2012 2013 2014
1 Proposal for AGM 2015
Information for our shareholders – The Elmos share

32
11 2
5 6
Elmos Annual Report 2014 | 33
Significant events 2014
1 | February – New MEMS low-pressure sensor Elmos subsidiary SMI (Silicon Microstructures, Inc.) introduced the new MEMS low-pressure sensor. The sensor was developed for respirators and spirometers (lung capacity measuring device), among other applications.
2 | March – electronica ChinaElmos established new customer contacts at the trade fair electronica China in Shanghai. New semiconductors for driving motors and a large number of sensor solutions were presented. The focus of motor system solutions was on BLDC motors while the sensors on display emphasized signal processor ICs.
3 | April – Know-how secured for the long termElmos increased its shares in Dresden-based company DMOS from previously 20% to 74.8% in April 2014, resulting in the subsidiary’s full consolidation as of that time. This underlines the excellent work done at DMOS and commits its know-how to Elmos.
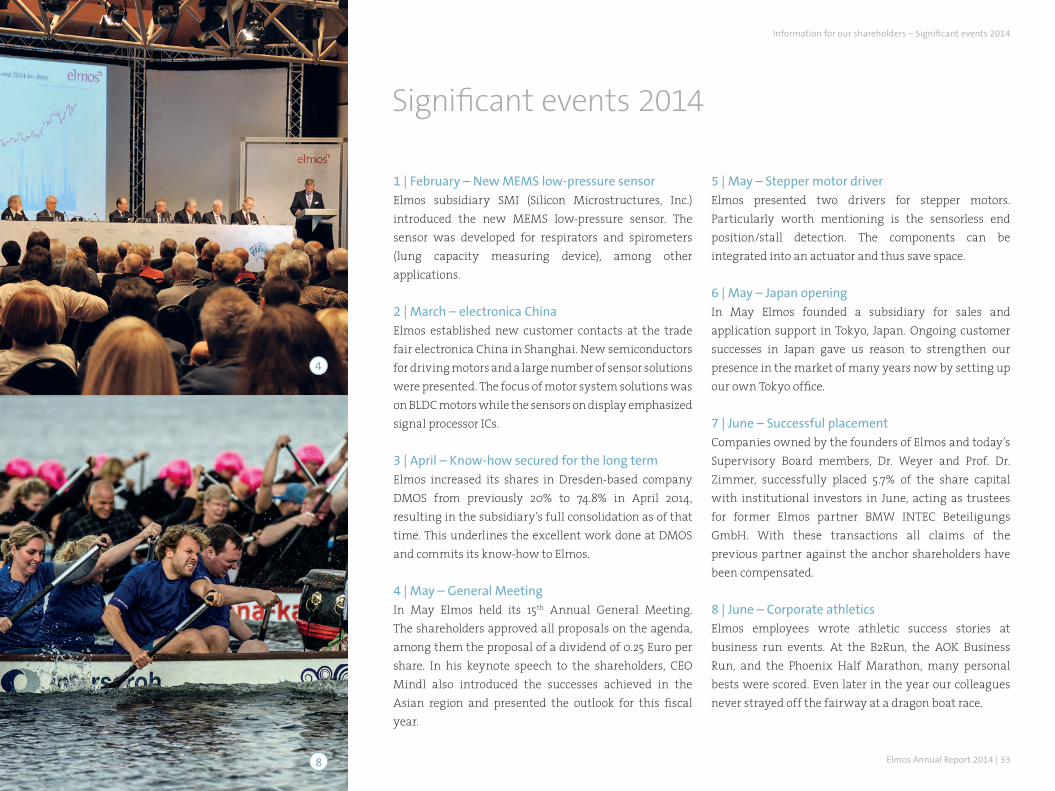
4 | May – General MeetingIn May Elmos held its 15th Annual General Meeting. The shareholders approved all proposals on the agenda, among them the proposal of a dividend of 0.25 Euro per share. In his keynote speech to the shareholders, CEO Mindl also introduced the successes achieved in the Asian region and presented the outlook for this fiscal year.
5 | May – Stepper motor driverElmos presented two drivers for stepper motors. Particularly worth mentioning is the sensorless end position/stall detection. The components can be integrated into an actuator and thus save space.
6 | May – Japan openingIn May Elmos founded a subsidiary for sales and application support in Tokyo, Japan. Ongoing customer successes in Japan gave us reason to strengthen our presence in the market of many years now by setting up our own Tokyo office.
7 | June – Successful placement Companies owned by the founders of Elmos and today’s Supervisory Board members, Dr. Weyer and Prof. Dr. Zimmer, successfully placed 5.7% of the share capital with institutional investors in June, acting as trustees for former Elmos partner BMW INTEC Beteiligungs GmbH. With these transactions all claims of the previous partner against the anchor shareholders have been compensated.
8 | June – Corporate athletics Elmos employees wrote athletic success stories at business run events. At the B2Run, the AOK Business Run, and the Phoenix Half Marathon, many personal bests were scored. Even later in the year our colleagues never strayed off the fairway at a dragon boat race.
4
8
Information for our shareholders – Significant events 2014
34
9 10
13 14
Elmos Annual Report 2014 | 35
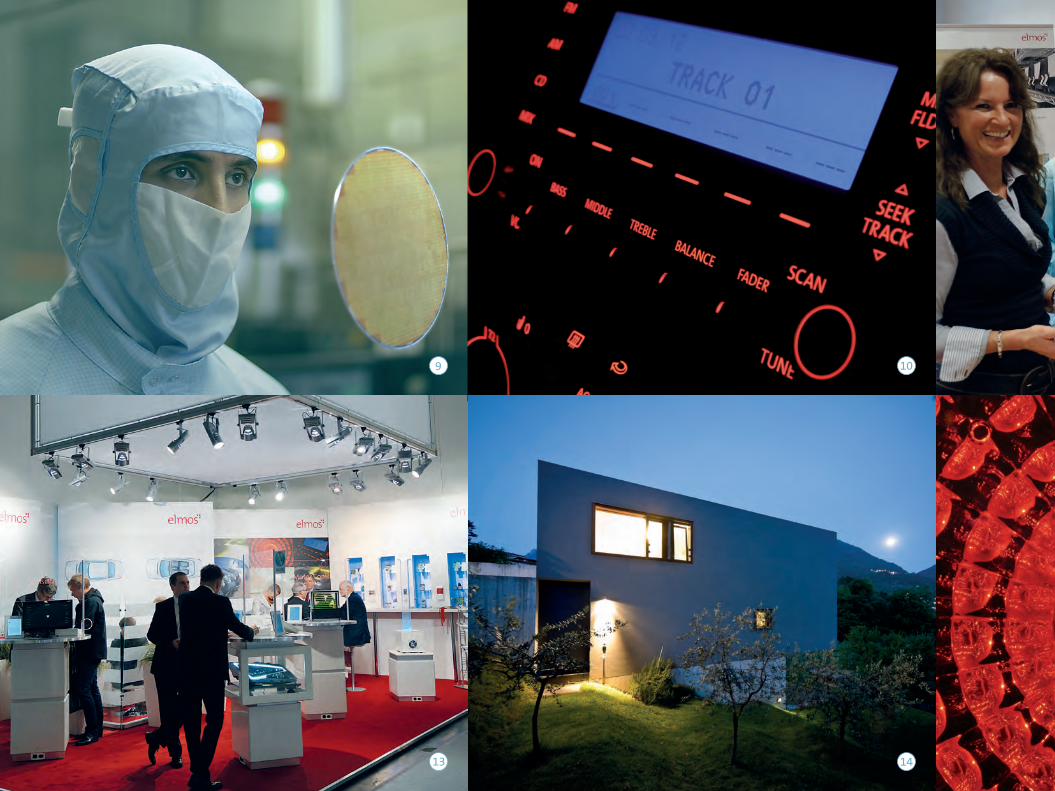
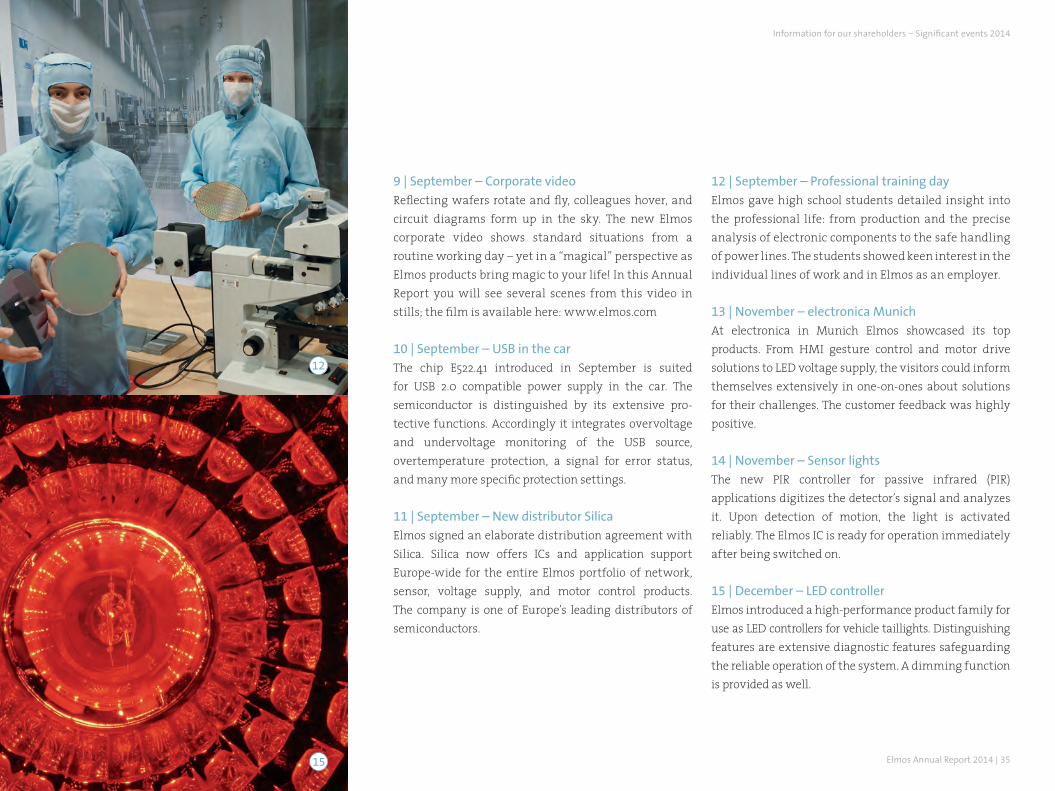
9 | September – Corporate video Reflecting wafers rotate and fly, colleagues hover, and circuit diagrams form up in the sky. The new Elmos corporate video shows standard situations from a routine working day – yet in a “magical” perspective as Elmos products bring magic to your life! In this Annual Report you will see several scenes from this video in stills; the film is available here: www.elmos.com
10 | September – USB in the carThe chip E522.41 introduced in September is suited for USB 2.0 compatible power supply in the car. The semiconductor is distinguished by its extensive pro-tective functions. Accordingly it integrates overvoltage and undervoltage monitoring of the USB source, overtemperature protection, a signal for error status, and many more specific protection settings.
11 | September – New distributor SilicaElmos signed an elaborate distribution agreement with Silica. Silica now offers ICs and application support Europe-wide for the entire Elmos portfolio of network, sensor, voltage supply, and motor control products. The company is one of Europe’s leading distributors of semiconductors.
12 | September – Professional training dayElmos gave high school students detailed insight into the professional life: from production and the precise analysis of electronic components to the safe handling of power lines. The students showed keen interest in the individual lines of work and in Elmos as an employer.
13 | November – electronica MunichAt electronica in Munich Elmos showcased its top products. From HMI gesture control and motor drive solutions to LED voltage supply, the visitors could inform themselves extensively in one-on-ones about solutions for their challenges. The customer feedback was highly positive.
14 | November – Sensor lightsThe new PIR controller for passive infrared (PIR) applications digitizes the detector’s signal and analyzes it. Upon detection of motion, the light is activated reliably. The Elmos IC is ready for operation immediately after being switched on.
15 | December – LED controllerElmos introduced a high-performance product family for use as LED controllers for vehicle taillights. Distinguishing features are extensive diagnostic features safeguarding the reliable operation of the system. A dimming function is provided as well.
12
15
Information for our shareholders – Significant events 2014

36
Elmos Annual Report 2014 | 37
Combined management report
Basic information on the Group
In this combined management report we analyze the course of business in the year under report and the situation of the Elmos Group and Elmos Semiconductor AG. Based on a description of the basics of our business and its framework as well as our strategy, we present our financial control system and explain assets and liabilities and our profit and financial position in detail. We discuss the material opportunities and risks and finally provide an outlook for the expected development. The information about Elmos Semiconductor AG is included in the business report in a separate section providing disclosures according to HGB.
THE GROUP’S BUSINESS MODEL Elmos Semiconductor AG was founded in the year 1984 in Dortmund where the Company has its headquarters. At about 90%, the majority of sales is generated with microelectronic circuits – so-called semiconductors. The smaller share in sales is generated with micro-electro-mechanical systems (MEMS).
Extensive product portfolio The core competence of Elmos is the development, manufacturing and distribution of mixed-signal semiconductors which often represent the brain of an electronic system. Among other tasks, our components
analyze sensor data and convert such analog data into digital values. Thus sensor data can be exactly analyzed and recorded. With respect to an automobile this means that a mixed-signal chip makes perfect sense wherever data are analyzed and circuits are connected.
The mixed-signal technology Elmos offers is distin-guished by manufacturing high-voltage components, sophisticated analog functions, and complex digital circuits in one compact process. This combination of rather entirely different requirements in one process is the centerpiece of the mixed-signal technology as provided by Elmos.
Combined management report – Basic information on the Group
38
MEMS complete the product portfolio. At Elmos they come primarily in the form of high-precision micro-systems, for the most part pressure sensors embedded in silicon, developed, manufactured and distributed by the subsidiary Silicon Microstructures (SMI) in Milpitas/U.S.A.
System solutions specialistElmos considers itself a system solutions specialist. This means that we improve the customer’s entire electronic system. The use of Elmos semiconductors can reduce system complexity, resulting in advantages for the customer with respect to production, costs, or reliability, among other aspects.
Elmos products are used in different industry sectors. Elmos generated about 85% of sales with electronics for the auto industry in 2014 (2013: about 85%). The share of the industrial and consumer goods business in group sales amounted to about 15% in 2014 (2013: about 15%).
For electronics in the automobile, Elmos supplies a very broad range of sensor readout ICs and sensor elements (e.g. ultrasonic parking assist ICs and pressure sensors), motor control semiconductors (e.g. water pump control and fan control systems), and embedded solutions (e.g. network components and LED voltage supply systems). The share of electronics in the automobile is constantly increasing: Comfort applications and driver assistance
systems such as parking assist systems, tire pressure monitoring systems, air conditioning or power door locks are taken for granted today as features of contemporary vehicles. Safety and comfort electronics in particular have made quantum leaps over the past few years.
One characteristic of semiconductors for the automotive market is the long product life cycle. New automotive projects usually require development periods of several years before being series-produced for about three to eight years.
Since its formation Elmos has achieved a leading posi-tion as semiconductor manufacturer in the market for automotive electronics. Elmos chips are used by virtually all carmakers worldwide. Immediate com-petitors in certain sub-segments are ams, Melexis, ON Semiconductor, and ZMDI. When it comes to high volumes, Elmos also competes with major semiconductor manufacturers such as Infineon Technologies, NXP Semiconductors, and STMicroelectronics.
For the sector of industrial and consumer goods, Elmos supplies semiconductors e.g. for applications in house-hold appliances, photo cameras, medical technology, installation and facility technology, and machine control systems. Many of the competencies achieved in automotive applications can be transferred to industrial and consumer goods products in similar form. However,
partly different general conditions and life cycles apply for these sectors.
ORGANIZATIONAL STRUCTURE The organization of Elmos is oriented toward the target markets, the customers’ needs for innovation, quality, flexibility and delivery reliability as well as internal requirements. The close customer-supplier relationship reflects in the structure of the Elmos Group. Elmos has its headquarters in Dortmund. Various branches, subsidiaries and partner companies at several locations essentially in Europe, the U.S.A. and Asia provide sales and application support close to the customers on location. The main production site for semiconductors is located in Dortmund, the main MEMS production site is in Milpitas/California, U.S.A.
In May 2014 hat Elmos established a subsidiary for sales and application support in Tokyo, Japan. Further successes with customers in Japan gave the Company reason to strengthen its market presence of many years in Tokyo with an office on location.
Elmos also increased its shares held in the Dresden-based company DMOS from previously 20% to 74.8% in April 2014 so that the subsidiary has been fully consolidated as of that time. This underlines the excellent development work DMOS has done over the years and commits the company’s know-how to the Elmos Group.
Elmos Annual Report 2014
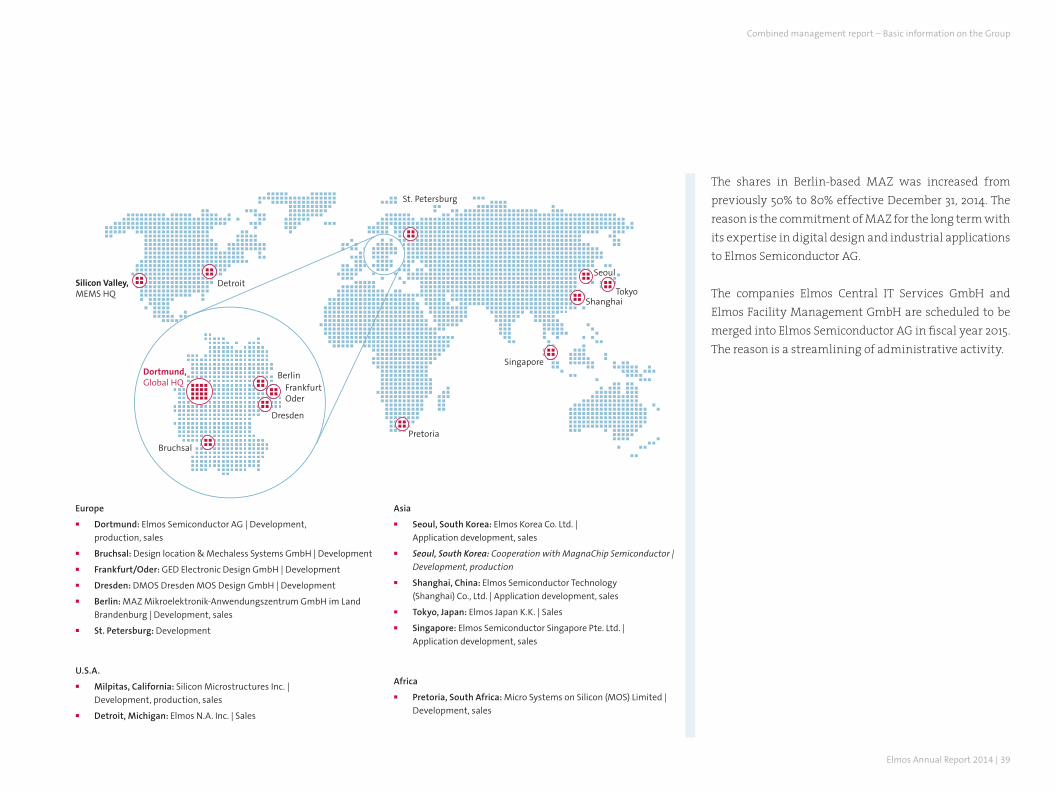
Elmos Annual Report 2014 | 39
Pretoria
DetroitSilicon Valley,MEMS HQ
St. Petersburg
Singapore
ShanghaiTokyo
Seoul
Bruchsal
Dortmund,Global HQ
BerlinFrankfurtOder
Dresden
Europe
Dortmund: Elmos Semiconductor AG | Development,
production, sales
Bruchsal: Design location & Mechaless Systems GmbH | Development
Frankfurt/Oder: GED Electronic Design GmbH | Development
Dresden: DMOS Dresden MOS Design GmbH | Development
Berlin: MAZ Mikroelektronik-Anwendungszentrum GmbH im Land
Brandenburg | Development, sales
St. Petersburg: Development
U.S.A.
Milpitas, California: Silicon Microstructures Inc. |
Development, production, sales
Detroit, Michigan: Elmos N.A. Inc. | Sales
The shares in Berlin-based MAZ was increased from previously 50% to 80% effective December 31, 2014. The reason is the commitment of MAZ for the long term with its expertise in digital design and industrial applications to Elmos Semiconductor AG.
The companies Elmos Central IT Services GmbH and Elmos Facility Management GmbH are scheduled to be merged into Elmos Semiconductor AG in fi scal year 2015. The reason is a streamlining of administrative activity.
Combined management report – Basic information on the Group
Asia
Seoul, South Korea: Elmos Korea Co. Ltd. |
Application development, sales
Seoul, South Korea: Cooperation with MagnaChip Semiconductor |
Development, production
Shanghai, China: Elmos Semiconductor Technology
(Shanghai) Co., Ltd. | Application development, sales
Tokyo, Japan: Elmos Japan K.K. | Sales
Singapore: Elmos Semiconductor Singapore Pte. Ltd. |
Application development, sales
Africa
Pretoria, South Africa: Micro Systems on Silicon (MOS) Limited |
Development, sales
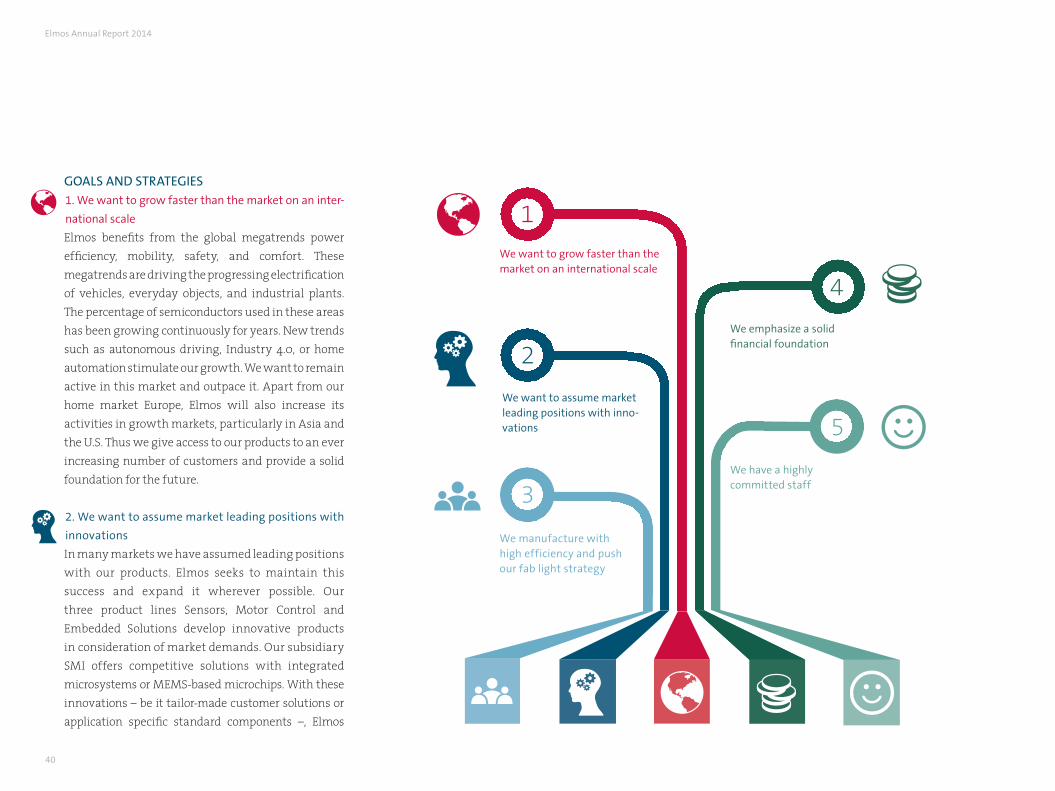
40
GOALS AND STRATEGIES 1. We want to grow faster than the market on an inter-
national scale
Elmos benefits from the global megatrends power efficiency, mobility, safety, and comfort. These megatrends are driving the progressing electrification of vehicles, everyday objects, and industrial plants. The percentage of semiconductors used in these areas has been growing continuously for years. New trends such as autonomous driving, Industry 4.0, or home automation stimulate our growth. We want to remain active in this market and outpace it. Apart from our home market Europe, Elmos will also increase its activities in growth markets, particularly in Asia and the U.S. Thus we give access to our products to an ever increasing number of customers and provide a solid foundation for the future.
2. We want to assume market leading positions with
innovations
In many markets we have assumed leading positions with our products. Elmos seeks to maintain this success and expand it wherever possible. Our three product lines Sensors, Motor Control and Embedded Solutions develop innovative products in consideration of market demands. Our subsidiary SMI offers competitive solutions with integrated microsystems or MEMS-based microchips. With these innovations – be it tailor-made customer solutions or application specific standard components –, Elmos
1
2
3
4
5
We want to grow faster than the market on an international scale
We want to assume market leading positions with inno-vations
We manufacture with high efficiency and push our fab light strategy
We emphasize a solid financial foundation
We have a highly committed staff
Elmos Annual Report 2014
Elmos Annual Report 2014 | 41
wants to be successful also by way of close cooperation with the customers. Some 25% of sales are generated with application specific components (ASSPs) already (2013: roughly 20%). A majority of products in development belongs to the growth segment of ASSPs. We focus on our strengths and will keep convincing customers in application fields with specialized and in part protected solutions. The development of new products is based on our significant research and development effort.
3. We manufacture with high efficiency and push
our fab light strategy
At the production sites we operate ourselves, we work daily at increasing efficiency by optimizing all areas and production steps. With respect to our in-house manufacturing we benefit from our extensive technology portfolio and our know-how. In addition to our in-house manufacturing lines we run at full capacity in the ideal case of the fab light strategy, we cooperate with several partners worldwide for a part of our value added chain. With this network we can act in a more flexible way in response to changing requirements and offer an even broader portfolio to the customers. We will continue and expand our cooperation with partners over the next years.
4. We emphasize a solid financial foundation
Elmos has a solid financial foundation. We want to safeguard this financial strength and flexibility of Elmos by generating further profitable growth. The goal is to achieve a sustained positive free cash flow (adjusted) with solid business results and moderate capital expenditures. It is also the management’s aim that shareholders will keep participating in the Company’s success by the payment of an adequate dividend.
5. We have a highly committed staff
Highly committed employees are particularly important for the successful advancement of our business. Elmos counts on a corporate culture oriented towards performance and personal development combined with distinct social responsibility. We promote personal and cultural diversity in the Company and place special emphasis on an appealing work environment, flexible working conditions, and good opportunities for further professional training. We offer attractive career advancement opportunities and want to keep recruiting promising young professionals for our Company’s successful and sustained development. We expect impeccable conduct from our employees towards the Company, their colleagues, and third parties.
CONTROL SYSTEM Control factors The Elmos control system is based on four essential ele-ments:
-> EBIT-> Sales-> Capital expenditures -> Free cash flow (adjusted)
Each indicator is considered and analyzed both individually and in connection to the other ones. The EBIT is especially worth pointing out. As the result before interest and income tax, the EBIT reflects the quality of earnings of the business segments. This is one central control factor at Group level as well as for the separate segments. Each operational decision or performance is measured for the short and long term at how sustainable its contribution to earnings is. Within the framework of the annual budgeting process, targets are defined for this indicator of the Company’s success.
As a growth-oriented company, Elmos attaches great importance to the profitable growth of sales. All activities toward sales increase are also judged by their potential to increase the EBIT in the long term. Sales are among others positively affected by the following factors: success with new customers and new products, expansion to new regions, and the consistent
Combined management report – Basic information on the Group
42
advancement of marketable products in respect of their competitiveness. Semiconductor manufacturing comes at a high fixed cost burden. Therefore sales as an essential lever for determining capacity utilization become especially important.
Capital expenditures management evaluates planned and realized capex projects with respect to their contribution to the achievement of the Group’s return targets. Only those projects are launched that give rise to expectations of a positive contribution to the increase of the Company’s business performance. Clear budget definitions build the frame for the level of capital expenditures; the specific demand is derived from medium-term sales planning and the resulting demands on manufacturing capacity. Within the framework of annual budget meetings, the responsible executives bring the budgeted level of capital expenditures and individual projects in line with Group-wide financial planning. Extra-budgetary capital expenditures are made only after an additional detailed check is con-ducted, applying established methods for cost-efficiency analysis.
For increasing shareholder value, the Group focuses on generating a positive free cash flow (adjusted). A sustained positive free cash flow safeguards the Group’s financial strength and independence. The essential starting points for improving the free cash flow are the positive performances of sales and earnings at relatively moderate capital expenditures. By the consistent management of the net working capital, the performance of the free cash flow is positively affected as well. The adjusted free cash flow is cash flow from operating activities less capital expenditures for intangible assets and property, plant and equipment, less payments for investments, plus disposal of investments.
Identical control factors are applied for the two reporting segments (Semiconductor and MEMS).
PERFORMANCE OF MATERIAL CONTROL FACTORS
in million Euro 2013 2014 Change
Sales 189.1 209.5 10.8%
EBIT 12.7 22.6 77.9%
EBIT margin (in percent) 6.7% 10.8%
Capital expenditures 15.6 30.5 95.8%
In percent of sales 8.2% 14.6%
Free cash flow (adjusted) 7.6 9.5 25.0%
Reporting of the control system Depending on the indicator, the Management Board is informed at least monthly in detail about the performance of business operations in the form of standardized reports. This reporting system is enhanced by ad hoc analyses in writing or oral reports if necessary. The actual data generated by the Group-wide reporting system are compared with the budget data each month. Deviations from the budget figures are analyzed, annotated, and adequate countermeasures are defined. Developments with a material impact on the Group’s earnings are reported to the Management Board without delay. Special emphasis is also placed on the analysis of leading indicators that are capable of providing an indication of the future business development. In this context, the analysis focuses on the development of orders, the order backlog, stock and consignment stock both in-house and at customers, and production effectiveness and efficiency. Furthermore, in regular intervals a comparative analysis addresses the development of relevant market data and competitors.
Elmos Annual Report 2014
Elmos Annual Report 2014 | 43
Regular updates of Group budgetingGroup budgeting is prepared annually within the scope of the Group-wide budgeting process in consideration of the current business situation. Based on central targets defined by the Management Board, the individual divisions and subsidiaries prepare detailed planning for the business fields they are responsible for. Derived from that, management with support from the specialist departments determine the budgets for sales, EBIT, capital expenditures, and the free cash flow (adjusted). Medium-term project planning and the corresponding capacity and production planning are also considered for the preparation of the annual Group budgeting.
The annual budget is revised in regular intervals in view of the actual business performance and updated sales and cost projections as well as apparent opportunities and risks within the scope of forecasts in order to determine the expected Group result for the fiscal year. On this basis, the expected cash flow development for the fiscal year is updated as well. Thus financial risks can be identified at an early stage and measures can be taken if necessary. In addition to that, the analysis of foreign currency sales and cost is one of the tools for the potential launch of currency hedging measures.
RESEARCH AND DEvELOPMENT The development activity of Elmos centers on the market-oriented expansion of the product portfolio along the three product lines Sensors, Motor Control, and Embedded Solutions. The majority of the product development cost Elmos incurs is pre-financed by the Company and must be amortized through the current series production business. This applies in particular to the development of application specific standard products (ASSPs), a mainstay of development for a few years now and about to represent a larger share in total sales of Elmos in the future.
Product developments are strictly aligned with market demands. Elmos prioritizes different product ideas and takes into account volumes, information on the competition, and feasibility, among other factors. Only those projects are realized that meet the Company’s targets for market expectations, margin potential, and strategic orientation. The outcome of these product developments is a number of new semiconductors and sensors. Elmos continued to present innovations in 2014; among the products introduced are the following:
Product line Sensors-> Elmos has presented its family of signal readout
processors (SSPs). The Elmos SSPs (E520.18, E520.33, E520.44) are suited for a large number of automotive and industrial applications, especially for the analysis of pressure, torque, resistance, and many more fields of use.
-> Elmos subsidiary SMI (Silicon Microstructures, Inc.) has introduced the new MEMS low-pressure sensor SM9541. The sensor was developed for respirators and spirometers (lung volume measuring device) among other applications.
-> With the E931.98 Elmos has presented a PIR controller for passive infrared (PIR) applications compatible with conventional PIR detectors. The E931.98 is operational immediately after being switched on.
Product line Motor Control-> With semiconductor E523.52 Elmos has introduced
a fully integrated motor controller for brushless DC (BLDC) motors. The IC can be operated under up to 72V supply voltage.
Combined management report – Basic information on the Group
44
-> Elmos has presented a triple half-bridge driver for operation with BLDC and DC motors with the IC E523.01. The component can also be used in start-stop systems in vehicles due to its almost complete functionality from 5V through 28V.
-> The new components E523.30/37 feature high-performance sensorless end position/stall detec-tion. The two motor drivers are suited for bipolar stepper motors.
Product line Embedded Solutions-> With the ICs E522.80/81/82/83, Elmos has presented
a high-performance product family for use as LED controllers in car taillights.
-> For ambient lighting in the car’s interior, the com-ponent E521.31 was developed. It enables a simple and variable setup of an RGB LED system with LIN bus. The IC facilitates the control of one RGB LED and one white LED.
-> Elmos has introduced an IC for USB 2.0 compatible power supply with extensive protection functio-nality for automotive use with the E522.41.
In the course of the year 2014 the advancement of the 0.18µm technology was pursued in cooperation with partners. This technology sets the course for our continued ability to offer competitive technologies for product development in the future.
In 2014 research and development expenses amounted to 36.1 million Euro or 17.2% of sales (2013: 34.4 million Euro or 18.2% of sales). With respect to the Company’s budgeted sales level, research and development expenses will be held at a similar level in absolute terms in 2015.
PRODUCTION Elmos operates semiconductor manufacturing sites in Germany using various CMOS technologies. Due to the sound order situation and the ongoing conversion of production, capacity utilization was high throughout the year 2014. The Dortmund manufacturing site was converted successively from 6-inch to 8-inch wafers over the past years. The situation of the conversion affecting production efficiency and thus manufacturing profitability improved in the course of the year 2014. In December 2014 the final 6-inch wafer charge was fed into the manufacturing line. Following the
discontinuation of the 6-inch wafer line, machines will be either converted to the larger 8-inch wafer diameter, sold, scrapped, or used for spare parts depending on demand and feasibility.
In addition to the German semiconductor manufacturing sites, Elmos owns another production site at its sub-sidiary SMI in Milpitas/California, U.S.A., where pri-marily MEMS pressure sensors are manufactured in 6-inch production.
The Company’s in-house capacity is completed by cooperation agreements with contract manufacturers (foundries). These foundries make additional capacity available, thus enabling Elmos to respond flexibly even to heavily fluctuating demand. In 2014 Elmos continued to obtain processed wafers from foundries with a global reputation. Roughly 15% of processed wafers were obtained that way in 2014 altogether. That share will probably increase in the medium run in line with the fab light strategy.
Apart from wafer production, the Dortmund location also accommodates the test area where whole wafers and packaged components are subjected to electric tests.
Elmos Annual Report 2014
Elmos Annual Report 2014 | 45
QUALITY Within the framework of continuous improvement processes, Elmos puts its first-time-right and zero-error strategy consistently into practice. Elmos thus achieves an outstanding quality level with its products as well as in its business, manufacturing and service processes. Due to anticipatory quality planning and monitoring of customer requirements as early as in the development stages, quality is produced with full competitiveness and a minimum number of rejects. The final test also contributes to the outstanding quality level.
Routine inspections of the processes and tools put to use, the closest possible attention to the series products from acquisition and development to manufacturing and delivery, constant analyses, and cutting-edge statistical processes make this high quality level possible. By means of a sophisticated traceability system, Elmos is able to detect the reasons for the slightest deviations from the desired state early on and to minimize their effects in an effective and sustained manner in order to provide efficient customer support. In-house and external laboratories analyze and scrutinize not only potential defect mechanisms in semiconductor manufacturing but sensor and packaging specific features as well, thus closing the loop system for the continuous improvement of the Elmos manufacturing processes.
The Elmos quality management system is audited annually at the certified locations for compliance with the requirements of DIN ISO 9001 and ISO/TS 16949 in monitoring audits or repeat audits by our certifier. Moreover, Elmos has been developing its semiconductors since 2012 in accordance with ISO 26262 “Functional Safety” with the aim of preventing risks of injury caused by malfunctions of electronic systems significantly and in advance.
Combined management report – Basic information on the Group
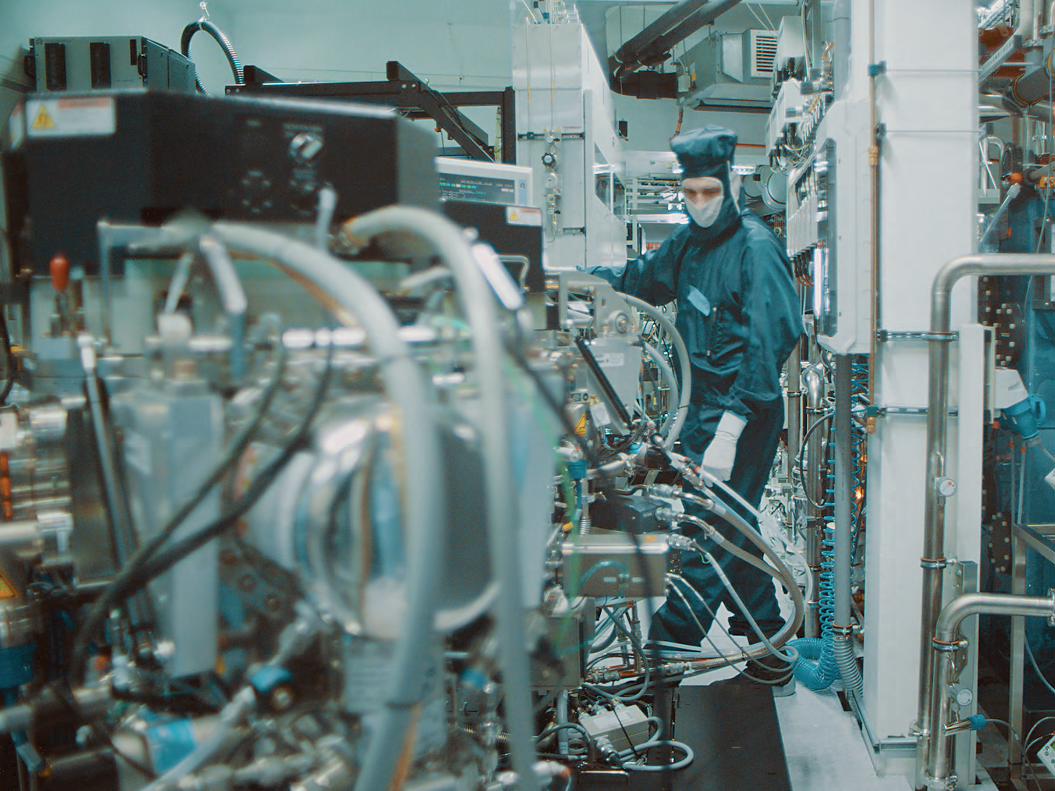
46
Elmos Annual Report 2014 | 47
Business report
MACROECONOMIC AND INDUSTRY SPECIFIC FRAME- WORK Automotive industryIn the year 2014 all material auto markets managed to record growth while growth rates varied greatly. “The two major markets China and the U.S.A. dominated everything in the year 2014. Compared to the previous year sales in these markets increased by close to 3 million new cars. China alone accounted for a sales growth of more than 2 million passenger cars,” says Matthias Wissmann, President of the German Association of the Automotive Industry (VDA).
In Western Europe new passenger car registrations of 12.1 million units for the full year 2014 were almost 5% above prior-year level after the market had been declining for the preceding four years. With respect to the largest markets, Spain showed the highest increase (+18.1%), followed by Great Britain (+9.3%), Italy (+4.2%), and Germany (+2.9%). France however remained stable (+0.3%).
The U.S. market upped the speed by the end of the year considerably. With about 1.5 million light vehicles (passenger cars and light trucks), December sales climbed close to 11%. Thus the market grew by 6% to more than 16.4 million units in the full year 2014, reaching a pre-crisis level again. Since the year 2009 (10.4 million light vehicles), the U.S. market has recovered continuously – by altogether 58%.
China’s passenger car market performed very dynamic-ally: In the full year 2014 the prior-year volume was exceeded by almost 13% – new car sales amounted to 18.4 million units.
In Japan new passenger car registrations over the full year gained 3% on the prior-year period. The raised sales tax has diminished the buying power in this market since April 2014.
General semiconductor market The general semiconductor market showed a positive performance in 2014. On a global scale the market gained 7.9% to 339.9 billion U.S. dollars, according to Gartner Dataquest. Based on the market researchers’ information, demand for so-called application specific standard products (ASSPs) the likes of smartphone chips as well as DRAM and NAND Flash for tablets and ultrabooks continues to be high.
Automotive semiconductor marketUsually the automotive semiconductor market grows even at steady car production volumes. This is accounted for by the steadily increasing share of electronic systems in the automobile. According to an IHS survey, the global market for automotive semiconductors grew by 10% to 29 billion U.S. dollars in 2014.
With respect to MEMS sensor components, the growth was 7% in consumer electronics in 2014 compared to
Combined management report – Business report
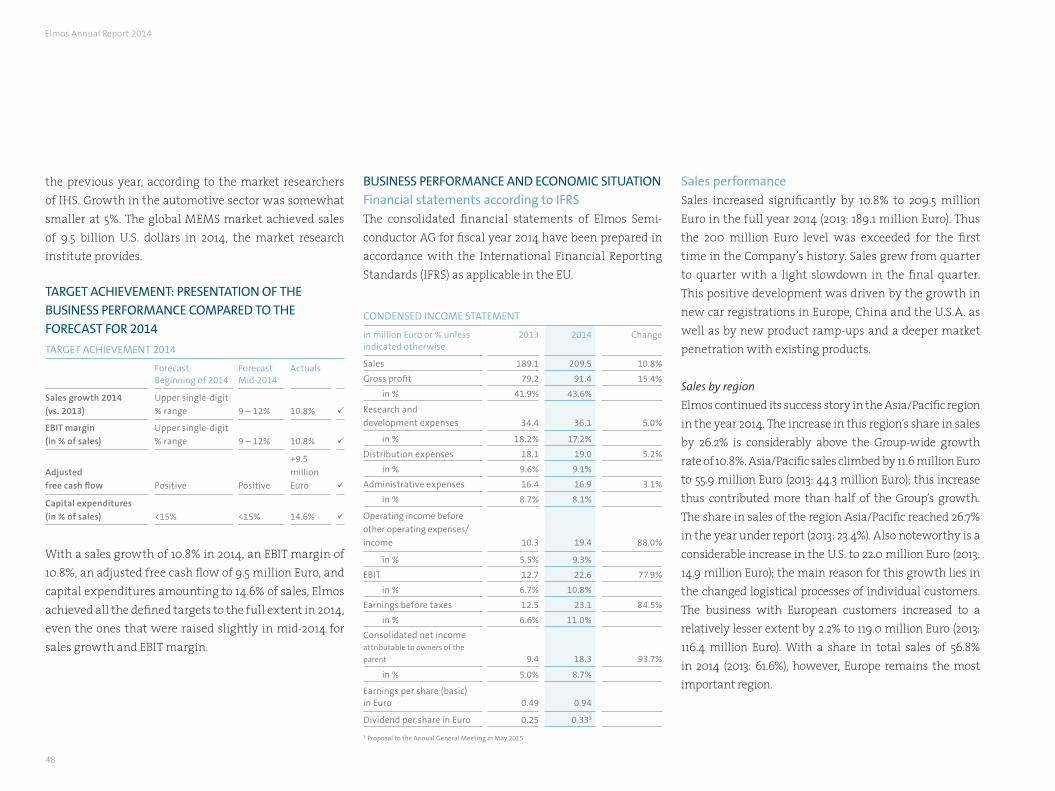
48
Sales performance Sales increased significantly by 10.8% to 209.5 million Euro in the full year 2014 (2013: 189.1 million Euro). Thus the 200 million Euro level was exceeded for the first time in the Company’s history. Sales grew from quarter to quarter with a light slowdown in the final quarter. This positive development was driven by the growth in new car registrations in Europe, China and the U.S.A. as well as by new product ramp-ups and a deeper market penetration with existing products.
Sales by region
Elmos continued its success story in the Asia/Pacific region in the year 2014. The increase in this region’s share in sales by 26.2% is considerably above the Group-wide growth rate of 10.8%. Asia/Pacific sales climbed by 11.6 million Euro to 55.9 million Euro (2013: 44.3 million Euro); this increase thus contributed more than half of the Group’s growth. The share in sales of the region Asia/Pacific reached 26.7% in the year under report (2013: 23.4%). Also noteworthy is a considerable increase in the U.S. to 22.0 million Euro (2013: 14.9 million Euro); the main reason for this growth lies in the changed logistical processes of individual customers. The business with European customers increased to a relatively lesser extent by 2.2% to 119.0 million Euro (2013: 116.4 million Euro). With a share in total sales of 56.8% in 2014 (2013: 61.6%), however, Europe remains the most important region.
the previous year, according to the market researchers of IHS. Growth in the automotive sector was somewhat smaller at 5%. The global MEMS market achieved sales of 9.5 billion U.S. dollars in 2014, the market research institute provides.
TARGET ACHIEvEMENT: PRESENTATION OF THE BUSINESS PERFORMANCE COMPARED TO THE FORECAST FOR 2014
TARGET ACHIEvEMENT 2014
Forecast Beginning of 2014
Forecast Mid-2014
Actuals
Sales growth 2014
(vs. 2013)
Upper single-digit
% range 9 – 12% 10.8%
EBIT margin
(in % of sales)
Upper single-digit
% range 9 – 12% 10.8%
Adjusted
free cash flow Positive Positive
+9.5
million
Euro
Capital expenditures
(in % of sales) <15% <15% 14.6%
With a sales growth of 10.8% in 2014, an EBIT margin of 10.8%, an adjusted free cash flow of 9.5 million Euro, and capital expenditures amounting to 14.6% of sales, Elmos achieved all the defined targets to the full extent in 2014, even the ones that were raised slightly in mid-2014 for sales growth and EBIT margin.
BUSINESS PERFORMANCE AND ECONOMIC SITUATIONFinancial statements according to IFRSThe consolidated financial statements of Elmos Semi-conductor AG for fiscal year 2014 have been prepared in accordance with the International Financial Reporting Standards (IFRS) as applicable in the EU.
CONDENSED INCOME STATEMENT
in million Euro or % unless indicated otherwise
2013 2014 Change
Sales 189.1 209.5 10.8%
Gross profit 79.2 91.4 15.4%
in % 41.9% 43.6%
Research and
development expenses 34.4 36.1 5.0%
in % 18.2% 17.2%
Distribution expenses 18.1 19.0 5.2%
in % 9.6% 9.1%
Administrative expenses 16.4 16.9 3.1%
in % 8.7% 8.1%
Operating income before
other operating expenses/
income 10.3 19.4 88.0%
in % 5.5% 9.3%
EBIT 12.7 22.6 77.9%
in % 6.7% 10.8%
Earnings before taxes 12.5 23.1 84.5%
in % 6.6% 11.0%
Consolidated net income attributable to owners of the
parent 9.4 18.3 93.7%
in % 5.0% 8.7%
Earnings per share (basic) in Euro 0.49 0.94
Dividend per share in Euro 0.25 0.331
1 Proposal to the Annual General Meeting in May 2015
Elmos Annual Report 2014
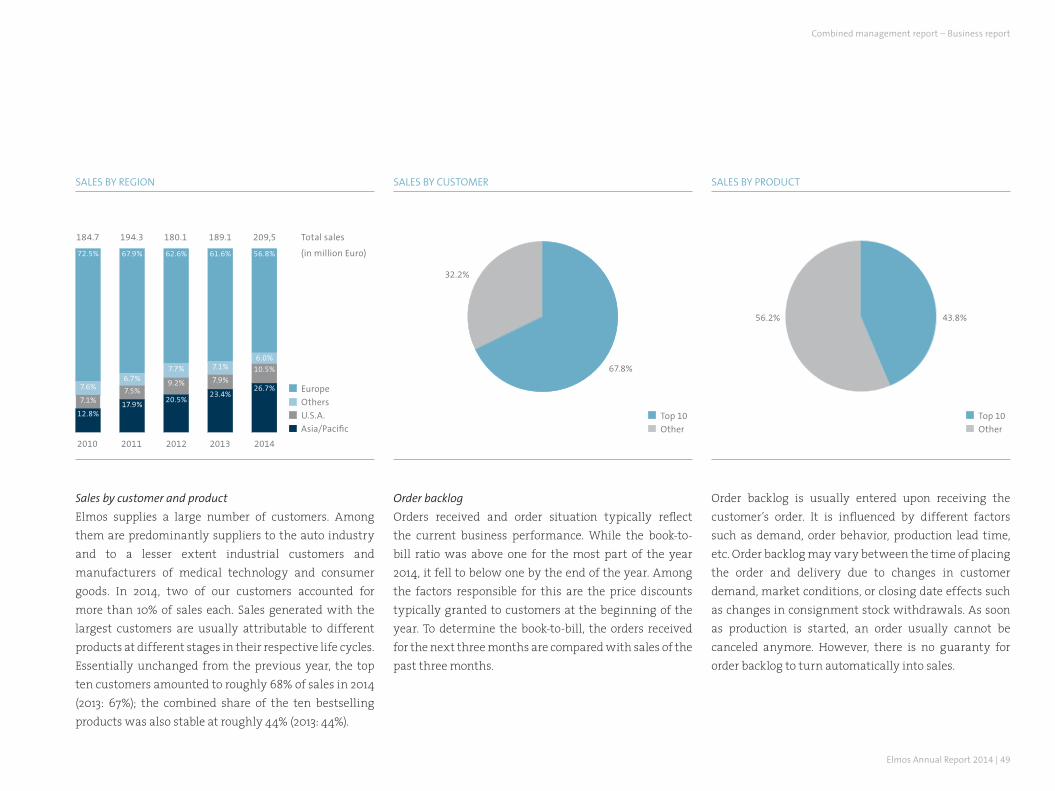
Elmos Annual Report 2014 | 49
Sales by customer and product
Elmos supplies a large number of customers. Among them are predominantly suppliers to the auto industry and to a lesser extent industrial customers and manufacturers of medical technology and consumer goods. In 2014, two of our customers accounted for more than 10% of sales each. Sales generated with the largest customers are usually attributable to different products at different stages in their respective life cycles. Essentially unchanged from the previous year, the top ten customers amounted to roughly 68% of sales in 2014 (2013: 67%); the combined share of the ten bestselling products was also stable at roughly 44% (2013: 44%).
Order backlog
Orders received and order situation typically reflect the current business performance. While the book-to-bill ratio was above one for the most part of the year 2014, it fell to below one by the end of the year. Among the factors responsible for this are the price discounts typically granted to customers at the beginning of the year. To determine the book-to-bill, the orders received for the next three months are compared with sales of the past three months.
Top 10
Other
Europe
Others
U.S.A.
Asia/PacificTop 10
Other
SALES BY REGION SALES BY CUSTOMER SALES BY PRODUCT
Order backlog is usually entered upon receiving the customer’s order. It is influenced by different factors such as demand, order behavior, production lead time, etc. Order backlog may vary between the time of placing the order and delivery due to changes in customer demand, market conditions, or closing date effects such as changes in consignment stock withdrawals. As soon as production is started, an order usually cannot be canceled anymore. However, there is no guaranty for order backlog to turn automatically into sales.
32.2%
67.8%
43.8%56.2%
2010
12.8%
7.1%
7.6%
72.5% 67.9% 62.6% 61.6% 56.8%
6.7%7.7% 7.1%
6.0%
7.5%9.2% 7.9%
10.5%
17.9%20.5%
23.4%26.7%
184.7
2011
194.3
2012
180.1
2013
189.1
2014
209,5 Total sales
(in million Euro)
Combined management report – Business report
50
New projects (design wins)
The competition for new projects continued to be intense as it has been over the past years. The year 2014 was successful indeed in respect of the number and volume of acquired new projects. As in the past years the number of ASSPs clearly dominated design wins, proof of the fact that Elmos solutions are attractive in the market. The number of partners won as new customers in 2014 is pleasant as well. The design wins cover a broad range of application fields addressed by Elmos with its three main product lines (Sensors, Motor Control, and Embedded Solutions).
Profit situationGross profit
The cost of sales was 118.1 million Euro in the year 2014 (2013: 109.9 million Euro), a disproportionately low increase compared to sales. The gross profit rose from 79.2 million Euro in 2013 to 91.4 million Euro in 2014; this is equivalent to an improvement of the gross margin from 41.9% in 2013 to 43.6% in the year under report. This increase also happened due to the successively improved manufacturing efficiency as a result of the conversion of production from 6 to 8-inch wafers at the Dortmund location. The last 6-inch wafers were fed into production at the end of 2014; 6-inch manufacturing will be completed in the first months of 2015 so that during the remainder of 2015 8-inch wafers will be processed exclusively.
Operating income before other operating expenses/income
and EBIT (earnings before interest and taxes)
Research and development expenses climbed 5.0% in fiscal year 2014 to 36.1 million Euro (2013: 34.4 million Euro). The loss incurred in the third quarter by the disposal of intangible assets in the amount of 1.8 million Euro not considered, R&D expenses would have remained almost stable. There were no material structural changes relating to R&D expenses. As a result of increased sales, R&D expenses dropped from 18.2% of sales in 2013 to 17.2% in the year under report.
The increase in distribution expenses by 5.2% was also disproportionately low compared to sales, amounting to 19.0 million Euro (2013: 18.1 million Euro). Thus the ratio in relation to sales fell from 9.6% in 2013 to 9.1% in 2014. General administrative expenses showed the same tendency and came to 16.9 million Euro or 8.1% of sales (2013: 16.4 million Euro or 8.7%). On the whole, operating expenses went down considerably compared to 2013 from 36.4% to 34.4% of sales.
As a consequence of the increased gross profit and disproportionately low increase of operating expenses in relation to sales, the operating income before other operating expenses/income went up from 10.3 million Euro in 2013 to 19.4 million Euro in 2014. The operating income margin thus came to 9.3% of sales (2013: 5.5%). While exchange rate gains in the
amount of 2.4 million Euro turned out much higher than in the corresponding prior-year period (2013: exchange rate losses of 0.2 million Euro), essentially due to income from currency hedging transactions recognized through profit or loss, other operating income/expenses were much lower than in 2013 with a net income of 0.7 million Euro (2013: net income of 2.5 million Euro). Earnings before interest and taxes (EBIT) were raised constantly in the course of the year. With respect to the full year, Elmos generated an EBIT in the amount of 22.6 million Euro or an EBIT margin of 10.8% (2013: 12.7 million Euro or 6.7%).
Earnings before taxes, consolidated net income, earnings per
share
In contrast to the previous year, net finance income in the amount of 0.5 million Euro was achieved in 2014 (2013: net finance expenses of 0.2 million Euro). Due to a negative contribution of the accounting treatment of deferred tax connected to tax-deductible losses in the previous year, the tax rate in 2014 was lower by comparison. After non-controlling interests, the consolidated net income attributable to owners of the parent was 18.3 million Euro (2013: 9.4 million Euro). This equals basic earnings per share of 0.94 Euro (fully diluted: 0.92 Euro) as compared to 0.49 Euro per share in 2013 (fully diluted: 0.48 Euro).
Elmos Annual Report 2014
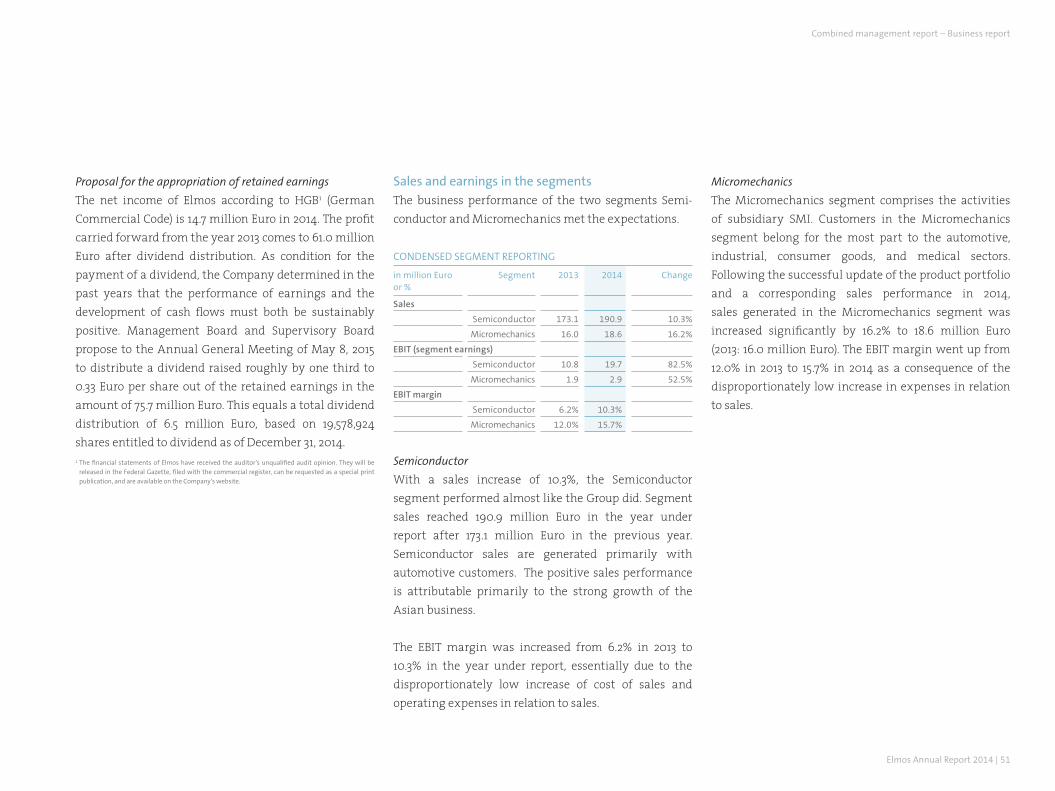
Elmos Annual Report 2014 | 51
Proposal for the appropriation of retained earnings
The net income of Elmos according to HGB1 (German Commercial Code) is 14.7 million Euro in 2014. The profit carried forward from the year 2013 comes to 61.0 million Euro after dividend distribution. As condition for the payment of a dividend, the Company determined in the past years that the performance of earnings and the development of cash flows must both be sustainably positive. Management Board and Supervisory Board propose to the Annual General Meeting of May 8, 2015 to distribute a dividend raised roughly by one third to 0.33 Euro per share out of the retained earnings in the amount of 75.7 million Euro. This equals a total dividend distribution of 6.5 million Euro, based on 19,578,924 shares entitled to dividend as of December 31, 2014. 1 The financial statements of Elmos have received the auditor’s unqualified audit opinion. They will be
released in the Federal Gazette, filed with the commercial register, can be requested as a special print publication, and are available on the Company’s website.
Sales and earnings in the segmentsThe business performance of the two segments Semi-conductor and Micromechanics met the expectations. CONDENSED SEGMENT REPORTING
in million Euro or %
Segment 2013 2014 Change
Sales
Semiconductor 173.1 190.9 10.3%
Micromechanics 16.0 18.6 16.2%
EBIT (segment earnings)
Semiconductor 10.8 19.7 82.5%
Micromechanics 1.9 2.9 52.5%
EBIT margin
Semiconductor 6.2% 10.3%
Micromechanics 12.0% 15.7%
Semiconductor
With a sales increase of 10.3%, the Semiconductor segment performed almost like the Group did. Segment sales reached 190.9 million Euro in the year under report after 173.1 million Euro in the previous year. Semiconductor sales are generated primarily with automotive customers. The positive sales performance is attributable primarily to the strong growth of the Asian business.
The EBIT margin was increased from 6.2% in 2013 to 10.3% in the year under report, essentially due to the disproportionately low increase of cost of sales and operating expenses in relation to sales.
Micromechanics
The Micromechanics segment comprises the activities of subsidiary SMI. Customers in the Micromechanics segment belong for the most part to the automotive, industrial, consumer goods, and medical sectors. Following the successful update of the product portfolio and a corresponding sales performance in 2014, sales generated in the Micromechanics segment was increased significantly by 16.2% to 18.6 million Euro (2013: 16.0 million Euro). The EBIT margin went up from 12.0% in 2013 to 15.7% in 2014 as a consequence of the disproportionately low increase in expenses in relation to sales.
Combined management report – Business report
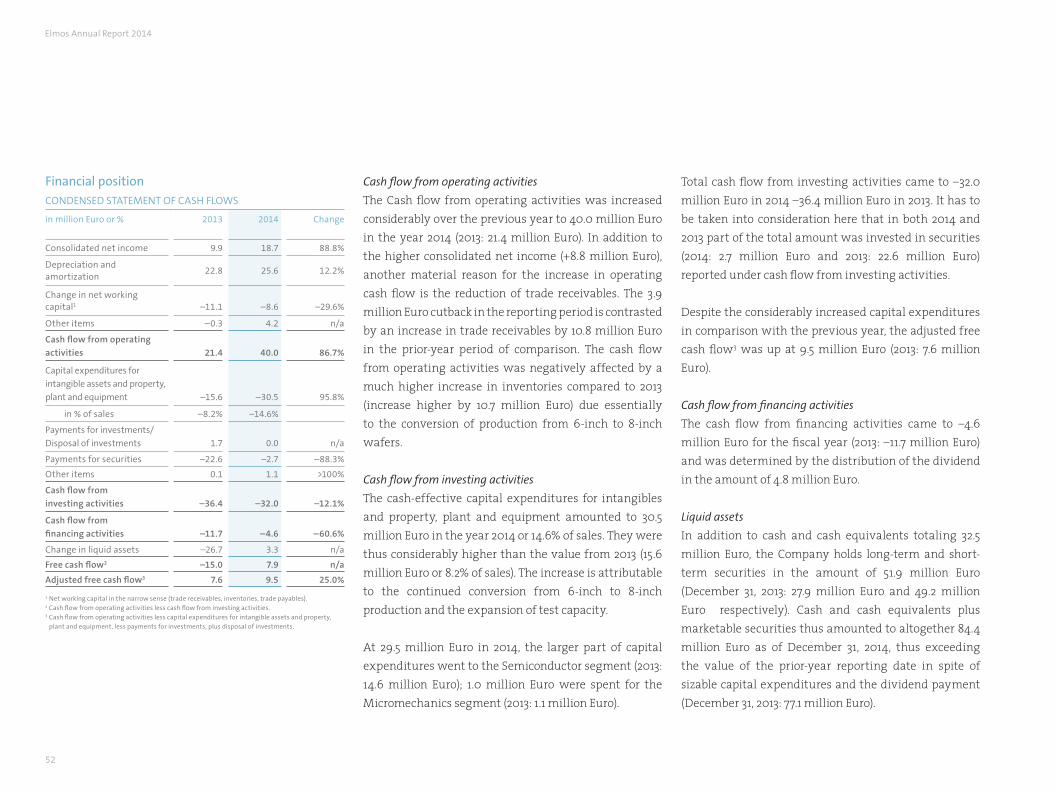
52
Cash flow from operating activities
The Cash flow from operating activities was increased considerably over the previous year to 40.0 million Euro in the year 2014 (2013: 21.4 million Euro). In addition to the higher consolidated net income (+8.8 million Euro), another material reason for the increase in operating cash flow is the reduction of trade receivables. The 3.9 million Euro cutback in the reporting period is contrasted by an increase in trade receivables by 10.8 million Euro in the prior-year period of comparison. The cash flow from operating activities was negatively affected by a much higher increase in inventories compared to 2013 (increase higher by 10.7 million Euro) due essentially to the conversion of production from 6-inch to 8-inch wafers.
Cash flow from investing activities
The cash-effective capital expenditures for intangibles and property, plant and equipment amounted to 30.5 million Euro in the year 2014 or 14.6% of sales. They were thus considerably higher than the value from 2013 (15.6 million Euro or 8.2% of sales). The increase is attributable to the continued conversion from 6-inch to 8-inch production and the expansion of test capacity.
At 29.5 million Euro in 2014, the larger part of capital expenditures went to the Semiconductor segment (2013: 14.6 million Euro); 1.0 million Euro were spent for the Micromechanics segment (2013: 1.1 million Euro).
Total cash flow from investing activities came to –32.0 million Euro in 2014 –36.4 million Euro in 2013. It has to be taken into consideration here that in both 2014 and 2013 part of the total amount was invested in securities (2014: 2.7 million Euro and 2013: 22.6 million Euro) reported under cash flow from investing activities.
Despite the considerably increased capital expenditures in comparison with the previous year, the adjusted free cash flow3 was up at 9.5 million Euro (2013: 7.6 million Euro).
Cash flow from financing activities
The cash flow from financing activities came to –4.6 million Euro for the fiscal year (2013: –11.7 million Euro) and was determined by the distribution of the dividend in the amount of 4.8 million Euro.
Liquid assets
In addition to cash and cash equivalents totaling 32.5 million Euro, the Company holds long-term and short-term securities in the amount of 51.9 million Euro (December 31, 2013: 27.9 million Euro and 49.2 million Euro respectively). Cash and cash equivalents plus marketable securities thus amounted to altogether 84.4 million Euro as of December 31, 2014, thus exceeding the value of the prior-year reporting date in spite of sizable capital expenditures and the dividend payment (December 31, 2013: 77.1 million Euro).
Financial position CONDENSED STATEMENT OF CASH FLOWS
in million Euro or % 2013 2014 Change
Consolidated net income 9.9 18.7 88.8%
Depreciation and amortization
22.8 25.6 12.2%
Change in net working capital1 –11.1 –8.6 –29.6%
Other items –0.3 4.2 n/a
Cash flow from operating
activities 21.4 40.0 86.7%
Capital expenditures for
intangible assets and property,
plant and equipment –15.6 –30.5 95.8%
in % of sales –8.2% –14.6%
Payments for investments/
Disposal of investments 1.7 0.0 n/a
Payments for securities –22.6 –2.7 –88.3%
Other items 0.1 1.1 >100%
Cash flow from
investing activities –36.4 –32.0 –12.1%
Cash flow from
financing activities –11.7 –4.6 –60.6%
Change in liquid assets –26.7 3.3 n/a
Free cash flow2 –15.0 7.9 n/a
Adjusted free cash flow3 7.6 9.5 25.0%
1 Net working capital in the narrow sense (trade receivables, inventories, trade payables).2 Cash flow from operating activities less cash flow from investing activities.3 Cash flow from operating activities less capital expenditures for intangible assets and property,
plant and equipment, less payments for investments, plus disposal of investments.
Elmos Annual Report 2014
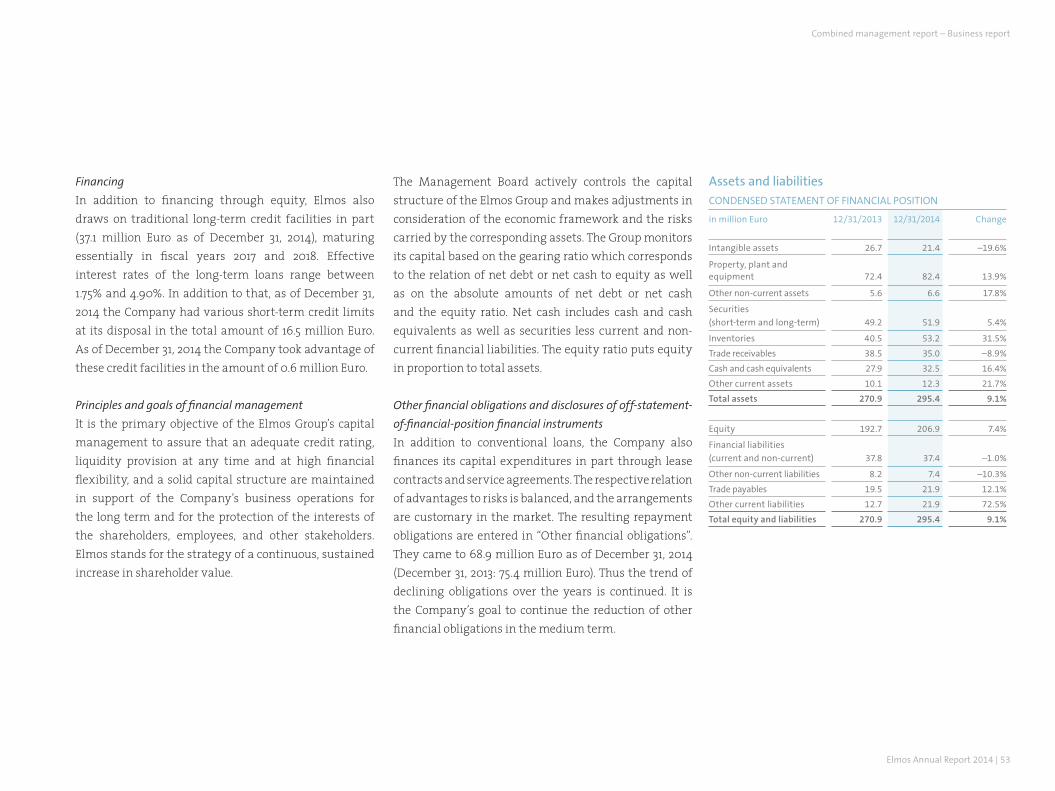
Elmos Annual Report 2014 | 53
Financing
In addition to financing through equity, Elmos also draws on traditional long-term credit facilities in part (37.1 million Euro as of December 31, 2014), maturing essentially in fiscal years 2017 and 2018. Effective interest rates of the long-term loans range between 1.75% and 4.90%. In addition to that, as of December 31, 2014 the Company had various short-term credit limits at its disposal in the total amount of 16.5 million Euro. As of December 31, 2014 the Company took advantage of these credit facilities in the amount of 0.6 million Euro.
Principles and goals of financial management
It is the primary objective of the Elmos Group’s capital management to assure that an adequate credit rating, liquidity provision at any time and at high financial flexibility, and a solid capital structure are maintained in support of the Company’s business operations for the long term and for the protection of the interests of the shareholders, employees, and other stakeholders. Elmos stands for the strategy of a continuous, sustained increase in shareholder value.
The Management Board actively controls the capital structure of the Elmos Group and makes adjustments in consideration of the economic framework and the risks carried by the corresponding assets. The Group monitors its capital based on the gearing ratio which corresponds to the relation of net debt or net cash to equity as well as on the absolute amounts of net debt or net cash and the equity ratio. Net cash includes cash and cash equivalents as well as securities less current and non-current financial liabilities. The equity ratio puts equity in proportion to total assets.
Other financial obligations and disclosures of off-statement-
of-financial-position financial instruments
In addition to conventional loans, the Company also finances its capital expenditures in part through lease contracts and service agreements. The respective relation of advantages to risks is balanced, and the arrangements are customary in the market. The resulting repayment obligations are entered in “Other financial obligations”. They came to 68.9 million Euro as of December 31, 2014 (December 31, 2013: 75.4 million Euro). Thus the trend of declining obligations over the years is continued. It is the Company’s goal to continue the reduction of other financial obligations in the medium term.
Assets and liabilitiesCONDENSED STATEMENT OF FINANCIAL POSITION
in million Euro 12/31/2013 12/31/2014 Change
Intangible assets 26.7 21.4 –19.6%
Property, plant and equipment 72.4 82.4 13.9%
Other non-current assets 5.6 6.6 17.8%
Securities
(short-term and long-term) 49.2 51.9 5.4%
Inventories 40.5 53.2 31.5%
Trade receivables 38.5 35.0 –8.9%
Cash and cash equivalents 27.9 32.5 16.4%
Other current assets 10.1 12.3 21.7%
Total assets 270.9 295.4 9.1%
Equity 192.7 206.9 7.4%
Financial liabilities
(current and non-current) 37.8 37.4 –1.0%
Other non-current liabilities 8.2 7.4 –10.3%
Trade payables 19.5 21.9 12.1%
Other current liabilities 12.7 21.9 72.5%
Total equity and liabilities 270.9 295.4 9.1%
Combined management report – Business report
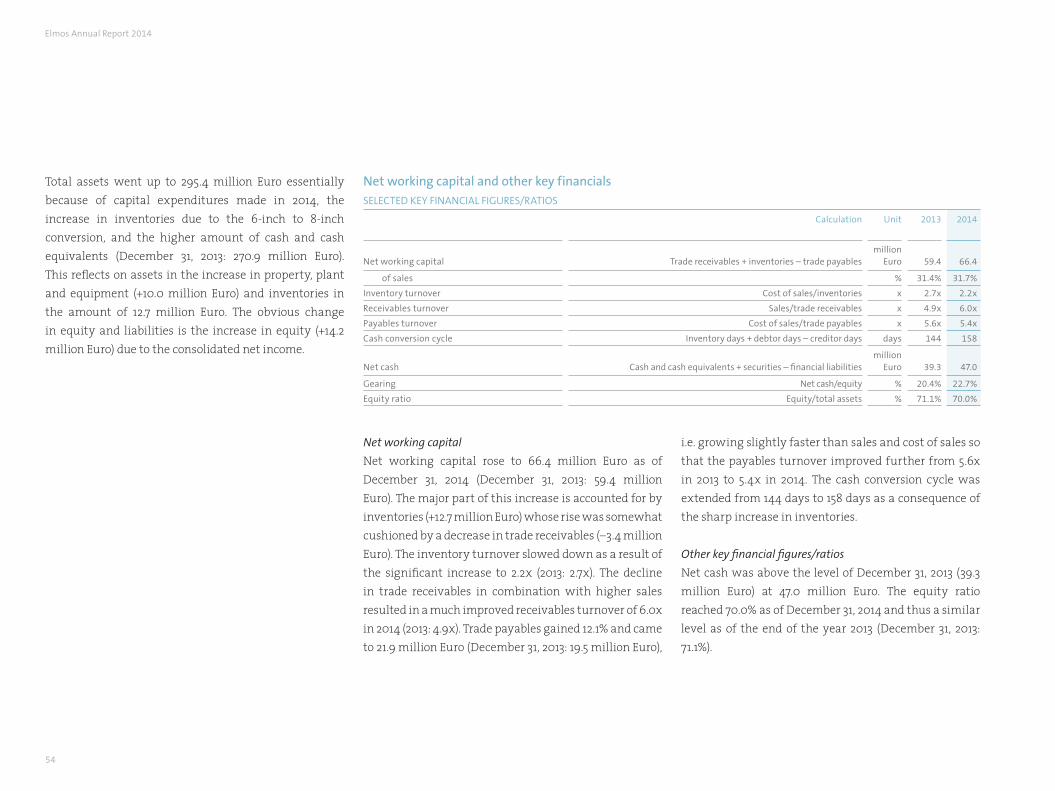
54
Total assets went up to 295.4 million Euro essentially because of capital expenditures made in 2014, the increase in inventories due to the 6-inch to 8-inch conversion, and the higher amount of cash and cash equivalents (December 31, 2013: 270.9 million Euro). This reflects on assets in the increase in property, plant and equipment (+10.0 million Euro) and inventories in the amount of 12.7 million Euro. The obvious change in equity and liabilities is the increase in equity (+14.2 million Euro) due to the consolidated net income.
Net working capital and other key financials SELECTED KEY FINANCIAL FIGURES/RATIOS
Calculation Unit 2013 2014
Net working capital Trade receivables + inventories – trade payablesmillion
Euro 59.4 66.4
of sales % 31.4% 31.7%
Inventory turnover Cost of sales/inventories x 2.7x 2.2x
Receivables turnover Sales/trade receivables x 4.9x 6.0x
Payables turnover Cost of sales/trade payables x 5.6x 5.4x
Cash conversion cycle Inventory days + debtor days – creditor days days 144 158
Net cash Cash and cash equivalents + securities – financial liabilitiesmillion
Euro 39.3 47.0
Gearing Net cash/equity % 20.4% 22.7%
Equity ratio Equity/total assets % 71.1% 70.0%
i.e. growing slightly faster than sales and cost of sales so that the payables turnover improved further from 5.6x in 2013 to 5.4x in 2014. The cash conversion cycle was extended from 144 days to 158 days as a consequence of the sharp increase in inventories.
Other key financial figures/ratios
Net cash was above the level of December 31, 2013 (39.3 million Euro) at 47.0 million Euro. The equity ratio reached 70.0% as of December 31, 2014 and thus a similar level as of the end of the year 2013 (December 31, 2013: 71.1%).
Net working capital
Net working capital rose to 66.4 million Euro as of December 31, 2014 (December 31, 2013: 59.4 million Euro). The major part of this increase is accounted for by inventories (+12.7 million Euro) whose rise was somewhat cushioned by a decrease in trade receivables (–3.4 million Euro). The inventory turnover slowed down as a result of the significant increase to 2.2x (2013: 2.7x). The decline in trade receivables in combination with higher sales resulted in a much improved receivables turnover of 6.0x in 2014 (2013: 4.9x). Trade payables gained 12.1% and came to 21.9 million Euro (December 31, 2013: 19.5 million Euro),
Elmos Annual Report 2014
Elmos Annual Report 2014 | 55
OvERALL STATEMENT ON THE ECONOMIC SITUATION Owing to a pleasant performance in sales and earnings, Elmos managed to extend its financial strength fur-ther in 2014. The adjusted free cash flow was clearly positive once more, thus making it possible to further strengthening the net cash position despite sizable capital expenditures and the dividend payment and thus consolidating the solid financial position. Elmos also improved structures, increased efficiency, expanded the customer base, invested in new products, and optimized product lines and the portfolio.
All this as well as the solid financial foundation strengthen the competitive position and provide a good starting point for the Company’s future development.
ELMOS SEMICONDUCTOR AG (ANNOTATIONS BASED ON HGB)Elmos Semiconductor AG is the parent company of the Elmos Group. The Management Board of Elmos Semi- conductor AG is responsible for managing the Com-pany and the Group. Elmos Semiconductor AG is a semiconductor manufacturer of chips for sensors, motor control systems, and embedded solutions primarily for the automotive industry. Elmos Semiconductor AG is also influenced by its directly and indirectly held subsidiaries and investments. Apart from responsibility for business operations, the Group’s parent is also responsible for the Group’s strategic orientation and thus determines the corporate strategy within the framework of higher-level group functions and represented by the members of the Management Board.
In contrast to the consolidated financial statements, Elmos Semiconductor AG does not prepare its separate financial statements according to International Finan-cial Reporting Standards (IFRS) but pursuant to the provisions of the German Commercial Code (HGB). The complete financial statements are released separately.
Business performance 2014The business performance and economic situation of Elmos Semiconductor AG essentially determine the business performance and the success of the Group. We give detailed account of this in the chapters “Basic information on the Group” and “Business report”.
Business outlook 2015 and material opportunities and risks The expectations for Elmos Semiconductor AG reflect in the outlook for the Group due to the Company’s multiple ties with the Group companies and its relevance for the Group. The expected performance of Elmos Semiconductor AG in fiscal year 2015 also depends essentially on the performance of the Group and its situation with respect to opportunities and risks. This is the subject of the “Report on opportunities and risks” and the Group’s “Outlook”. Insofar the statements made therein on the Group’s expected performance and its risk position also apply to the expected performance and risk position of Elmos Semiconductor AG. The description of the internal control system pursuant to Section 289 (5) HGB concerning Elmos Semiconductor AG follows in the chapter “Opportunities and Risks “.
As the Group’s parent, Elmos Semiconductor AG receives income especially from its subsidiaries. The income from investments is composed of transfers of profit or loss from domestic subsidiaries and distributions from foreign subsidiaries. Accordingly the positive business performance expected for the Group in 2015 can be assumed to influence the business result of Elmos Semiconductor AG as well. On the whole we expect 2015 retained earnings of Elmos Semiconductor AG in an amount which makes it possible to have our shareholders participate adequately in the performance of earnings of the Group.
Combined management report – Business report
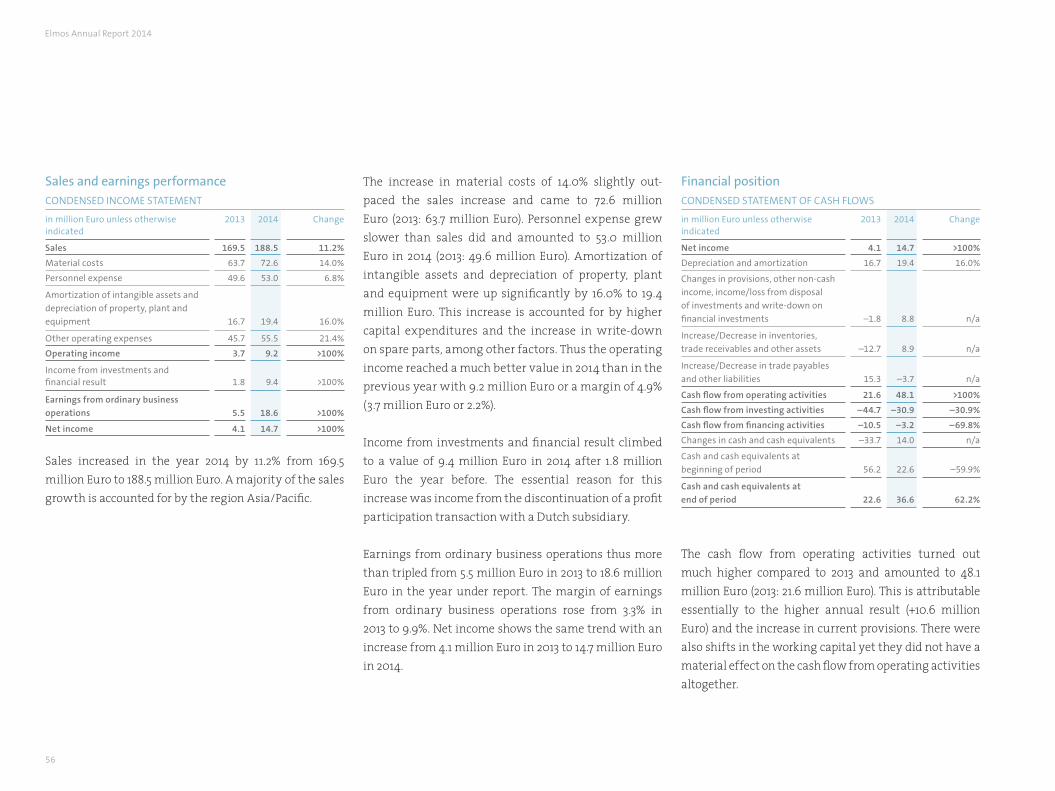
56
Sales and earnings performance CONDENSED INCOME STATEMENT
in million Euro unless otherwise indicated
2013 2014 Change
Sales 169.5 188.5 11.2%
Material costs 63.7 72.6 14.0%
Personnel expense 49.6 53.0 6.8%
Amortization of intangible assets and
depreciation of property, plant and
equipment 16.7 19.4 16.0%
Other operating expenses 45.7 55.5 21.4%
Operating income 3.7 9.2 >100%
Income from investments and financial result 1.8 9.4 >100%
Earnings from ordinary business
operations 5.5 18.6 >100%
Net income 4.1 14.7 >100%
Sales increased in the year 2014 by 11.2% from 169.5 million Euro to 188.5 million Euro. A majority of the sales growth is accounted for by the region Asia/Pacific.
The increase in material costs of 14.0% slightly out-paced the sales increase and came to 72.6 million Euro (2013: 63.7 million Euro). Personnel expense grew slower than sales did and amounted to 53.0 million Euro in 2014 (2013: 49.6 million Euro). Amortization of intangible assets and depreciation of property, plant and equipment were up significantly by 16.0% to 19.4 million Euro. This increase is accounted for by higher capital expenditures and the increase in write-down on spare parts, among other factors. Thus the operating income reached a much better value in 2014 than in the previous year with 9.2 million Euro or a margin of 4.9% (3.7 million Euro or 2.2%).
Income from investments and financial result climbed to a value of 9.4 million Euro in 2014 after 1.8 million Euro the year before. The essential reason for this increase was income from the discontinuation of a profit participation transaction with a Dutch subsidiary.
Earnings from ordinary business operations thus more than tripled from 5.5 million Euro in 2013 to 18.6 million Euro in the year under report. The margin of earnings from ordinary business operations rose from 3.3% in 2013 to 9.9%. Net income shows the same trend with an increase from 4.1 million Euro in 2013 to 14.7 million Euro in 2014.
Financial positionCONDENSED STATEMENT OF CASH FLOWS
in million Euro unless otherwise indicated
2013 2014 Change
Net income 4.1 14.7 >100%
Depreciation and amortization 16.7 19.4 16.0%
Changes in provisions, other non-cash
income, income/loss from disposal
of investments and write-down on
financial investments –1.8 8.8 n/a
Increase/Decrease in inventories,
trade receivables and other assets –12.7 8.9 n/a
Increase/Decrease in trade payables
and other liabilities 15.3 –3.7 n/a
Cash flow from operating activities 21.6 48.1 >100%
Cash flow from investing activities –44.7 –30.9 –30.9%
Cash flow from financing activities –10.5 –3.2 –69.8%
Changes in cash and cash equivalents –33.7 14.0 n/a
Cash and cash equivalents at
beginning of period 56.2 22.6 –59.9%
Cash and cash equivalents at
end of period 22.6 36.6 62.2%
The cash flow from operating activities turned out much higher compared to 2013 and amounted to 48.1 million Euro (2013: 21.6 million Euro). This is attributable essentially to the higher annual result (+10.6 million Euro) and the increase in current provisions. There were also shifts in the working capital yet they did not have a material effect on the cash flow from operating activities altogether.
Elmos Annual Report 2014
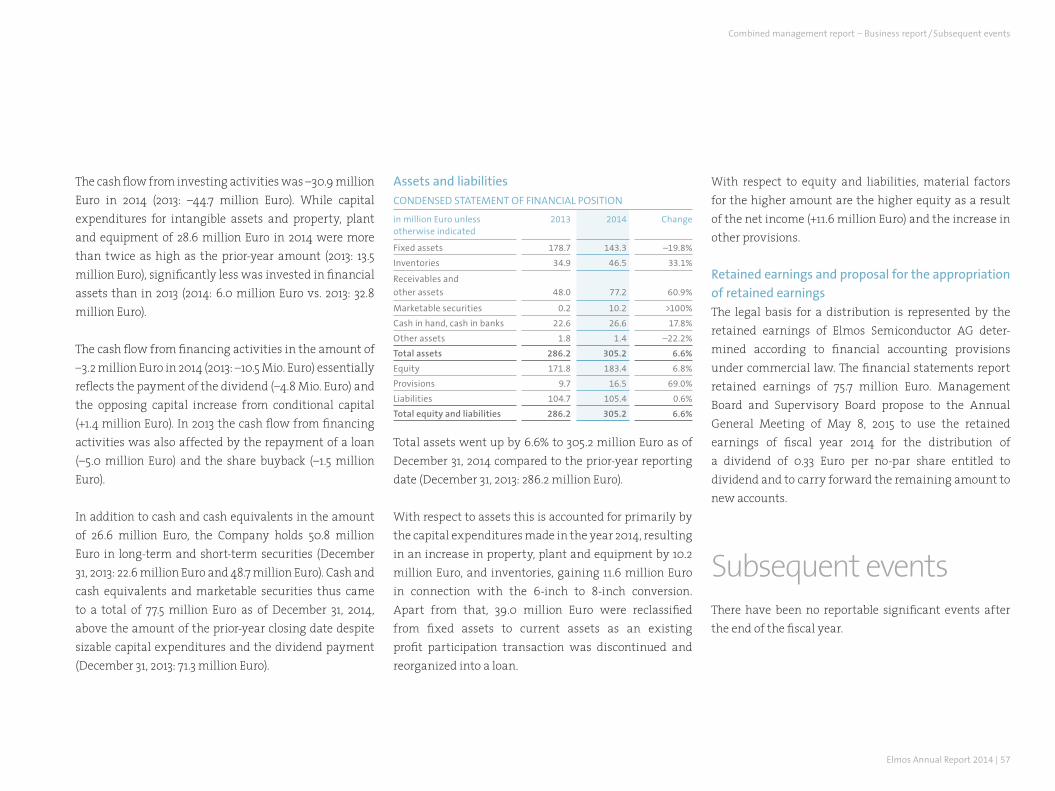
Elmos Annual Report 2014 | 57
The cash flow from investing activities was –30.9 million Euro in 2014 (2013: –44.7 million Euro). While capital expenditures for intangible assets and property, plant and equipment of 28.6 million Euro in 2014 were more than twice as high as the prior-year amount (2013: 13.5 million Euro), significantly less was invested in financial assets than in 2013 (2014: 6.0 million Euro vs. 2013: 32.8 million Euro).
The cash flow from financing activities in the amount of –3.2 million Euro in 2014 (2013: –10.5 Mio. Euro) essentially reflects the payment of the dividend (–4.8 Mio. Euro) and the opposing capital increase from conditional capital (+1.4 million Euro). In 2013 the cash flow from financing activities was also affected by the repayment of a loan (–5.0 million Euro) and the share buyback (–1.5 million Euro).
In addition to cash and cash equivalents in the amount of 26.6 million Euro, the Company holds 50.8 million Euro in long-term and short-term securities (December 31, 2013: 22.6 million Euro and 48.7 million Euro). Cash and cash equivalents and marketable securities thus came to a total of 77.5 million Euro as of December 31, 2014, above the amount of the prior-year closing date despite sizable capital expenditures and the dividend payment (December 31, 2013: 71.3 million Euro).
Assets and liabilities CONDENSED STATEMENT OF FINANCIAL POSITION
in million Euro unless otherwise indicated
2013 2014 Change
Fixed assets 178.7 143.3 –19.8%
Inventories 34.9 46.5 33.1%
Receivables and
other assets 48.0 77.2 60.9%
Marketable securities 0.2 10.2 >100%
Cash in hand, cash in banks 22.6 26.6 17.8%
Other assets 1.8 1.4 –22.2%
Total assets 286.2 305.2 6.6%
Equity 171.8 183.4 6.8%
Provisions 9.7 16.5 69.0%
Liabilities 104.7 105.4 0.6%
Total equity and liabilities 286.2 305.2 6.6%
Total assets went up by 6.6% to 305.2 million Euro as of December 31, 2014 compared to the prior-year reporting date (December 31, 2013: 286.2 million Euro).
With respect to assets this is accounted for primarily by the capital expenditures made in the year 2014, resulting in an increase in property, plant and equipment by 10.2 million Euro, and inventories, gaining 11.6 million Euro in connection with the 6-inch to 8-inch conversion. Apart from that, 39.0 million Euro were reclassified from fixed assets to current assets as an existing profit participation transaction was discontinued and reorganized into a loan.
With respect to equity and liabilities, material factors for the higher amount are the higher equity as a result of the net income (+11.6 million Euro) and the increase in other provisions.
Retained earnings and proposal for the appropriation of retained earnings The legal basis for a distribution is represented by the retained earnings of Elmos Semiconductor AG deter-mined according to financial accounting provisions under commercial law. The financial statements report retained earnings of 75.7 million Euro. Management Board and Supervisory Board propose to the Annual General Meeting of May 8, 2015 to use the retained earnings of fiscal year 2014 for the distribution of a dividend of 0.33 Euro per no-par share entitled to dividend and to carry forward the remaining amount to new accounts.
Subsequent eventsThere have been no reportable significant events after the end of the fiscal year.
Combined management report – Business report /Subsequent events

58
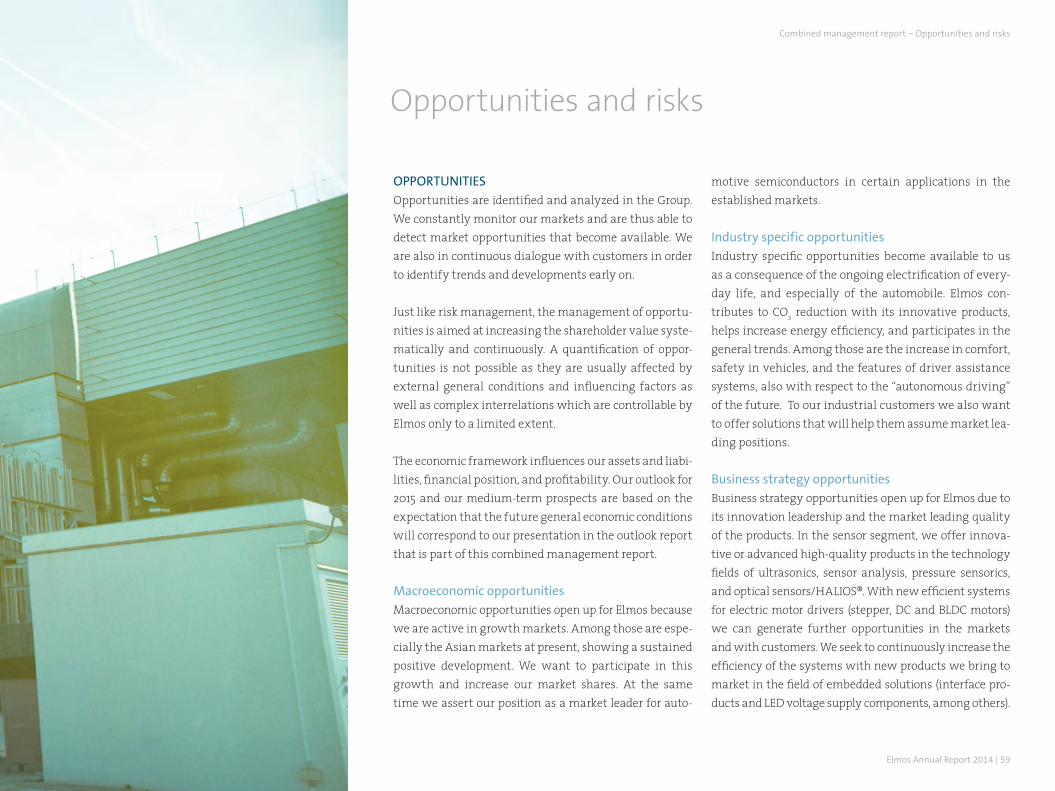
Elmos Annual Report 2014 | 59
Opportunities and risks
OPPORTUNITIESOpportunities are identified and analyzed in the Group. We constantly monitor our markets and are thus able to detect market opportunities that become available. We are also in continuous dialogue with customers in order to identify trends and developments early on.
Just like risk management, the management of opportu-nities is aimed at increasing the shareholder value syste-matically and continuously. A quantification of oppor-tunities is not possible as they are usually affected by external general conditions and influencing factors as well as complex interrelations which are controllable by Elmos only to a limited extent.
The economic framework influences our assets and liabi-lities, financial position, and profitability. Our outlook for 2015 and our medium-term prospects are based on the expectation that the future general economic conditions will correspond to our presentation in the outlook report that is part of this combined management report.
Macroeconomic opportunities Macroeconomic opportunities open up for Elmos because we are active in growth markets. Among those are espe-cially the Asian markets at present, showing a sustained positive development. We want to participate in this growth and increase our market shares. At the same time we assert our position as a market leader for auto-
motive semiconductors in certain applications in the established markets.
Industry specific opportunities Industry specific opportunities become available to us as a consequence of the ongoing electrification of every-day life, and especially of the automobile. Elmos con-tributes to CO2 reduction with its innovative products, helps increase energy efficiency, and participates in the general trends. Among those are the increase in comfort, safety in vehicles, and the features of driver assistance systems, also with respect to the “autonomous driving” of the future. To our industrial customers we also want to offer solutions that will help them assume market lea-ding positions.
Business strategy opportunities Business strategy opportunities open up for Elmos due to its innovation leadership and the market leading quality of the products. In the sensor segment, we offer innova-tive or advanced high-quality products in the technology fields of ultrasonics, sensor analysis, pressure sensorics, and optical sensors/HALIOS®. With new efficient systems for electric motor drivers (stepper, DC and BLDC motors) we can generate further opportunities in the markets and with customers. We seek to continuously increase the efficiency of the systems with new products we bring to market in the field of embedded solutions (interface pro-ducts and LED voltage supply components, among others).
Combined management report – Opportunities and risks
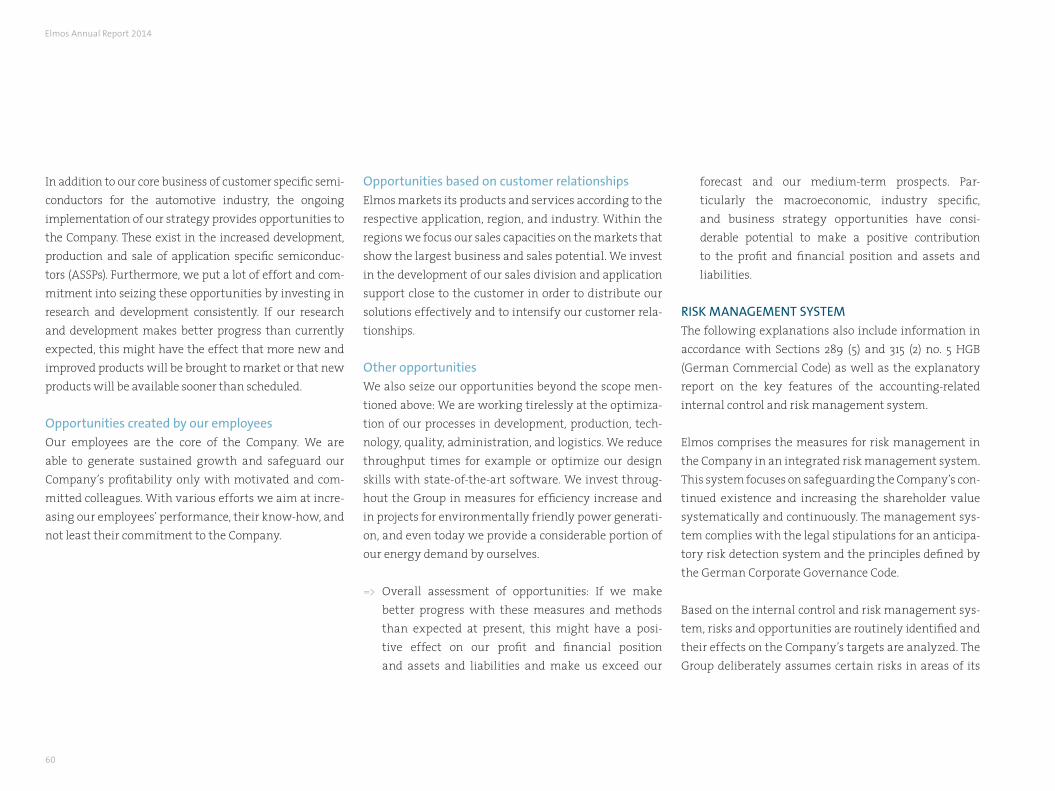
60
In addition to our core business of customer specific semi-conductors for the automotive industry, the ongoing implementation of our strategy provides opportunities to the Company. These exist in the increased development, production and sale of application specific semiconduc-tors (ASSPs). Furthermore, we put a lot of effort and com-mitment into seizing these opportunities by investing in research and development consistently. If our research and development makes better progress than currently expected, this might have the effect that more new and improved products will be brought to market or that new products will be available sooner than scheduled.
Opportunities created by our employees Our employees are the core of the Company. We are able to generate sustained growth and safeguard our Company’s profitability only with motivated and com-mitted colleagues. With various efforts we aim at incre-asing our employees’ performance, their know-how, and not least their commitment to the Company.
Opportunities based on customer relationships Elmos markets its products and services according to the respective application, region, and industry. Within the regions we focus our sales capacities on the markets that show the largest business and sales potential. We invest in the development of our sales division and application support close to the customer in order to distribute our solutions effectively and to intensify our customer rela-tionships.
Other opportunities We also seize our opportunities beyond the scope men-tioned above: We are working tirelessly at the optimiza-tion of our processes in development, production, tech-nology, quality, administration, and logistics. We reduce throughput times for example or optimize our design skills with state-of-the-art software. We invest throug-hout the Group in measures for efficiency increase and in projects for environmentally friendly power generati-on, and even today we provide a considerable portion of our energy demand by ourselves.
=> Overall assessment of opportunities: If we make better progress with these measures and methods than expected at present, this might have a posi-tive effect on our profit and financial position and assets and liabilities and make us exceed our
forecast and our medium-term prospects. Par-ticularly the macroeconomic, industry specific, and business strategy opportunities have consi-derable potential to make a positive contribution to the profit and financial position and assets and liabilities.
RISK MANAGEMENT SYSTEM The following explanations also include information in accordance with Sections 289 (5) and 315 (2) no. 5 HGB (German Commercial Code) as well as the explanatory report on the key features of the accounting-related internal control and risk management system.
Elmos comprises the measures for risk management in the Company in an integrated risk management system. This system focuses on safeguarding the Company’s con-tinued existence and increasing the shareholder value systematically and continuously. The management sys-tem complies with the legal stipulations for an anticipa-tory risk detection system and the principles defined by the German Corporate Governance Code.
Based on the internal control and risk management sys-tem, risks and opportunities are routinely identified and their effects on the Company’s targets are analyzed. The Group deliberately assumes certain risks in areas of its
Elmos Annual Report 2014
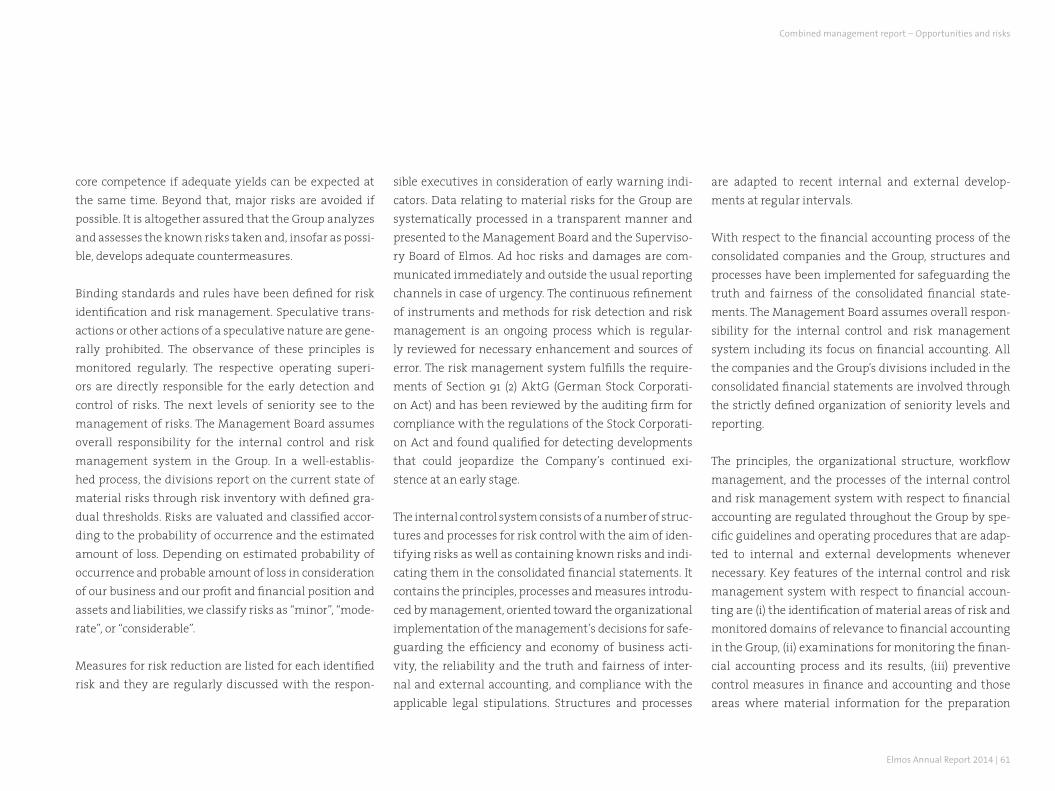
Elmos Annual Report 2014 | 61
core competence if adequate yields can be expected at the same time. Beyond that, major risks are avoided if possible. It is altogether assured that the Group analyzes and assesses the known risks taken and, insofar as possi-ble, develops adequate countermeasures.
Binding standards and rules have been defined for risk identification and risk management. Speculative trans-actions or other actions of a speculative nature are gene-rally prohibited. The observance of these principles is monitored regularly. The respective operating superi-ors are directly responsible for the early detection and control of risks. The next levels of seniority see to the management of risks. The Management Board assumes overall responsibility for the internal control and risk management system in the Group. In a well-establis-hed process, the divisions report on the current state of material risks through risk inventory with defined gra-dual thresholds. Risks are valuated and classified accor-ding to the probability of occurrence and the estimated amount of loss. Depending on estimated probability of occurrence and probable amount of loss in consideration of our business and our profit and financial position and assets and liabilities, we classify risks as “minor”, “mode-rate”, or “considerable”.
Measures for risk reduction are listed for each identified risk and they are regularly discussed with the respon-
sible executives in consideration of early warning indi-cators. Data relating to material risks for the Group are systematically processed in a transparent manner and presented to the Management Board and the Superviso-ry Board of Elmos. Ad hoc risks and damages are com-municated immediately and outside the usual reporting channels in case of urgency. The continuous refinement of instruments and methods for risk detection and risk management is an ongoing process which is regular-ly reviewed for necessary enhancement and sources of error. The risk management system fulfills the require-ments of Section 91 (2) AktG (German Stock Corporati-on Act) and has been reviewed by the auditing firm for compliance with the regulations of the Stock Corporati-on Act and found qualified for detecting developments that could jeopardize the Company’s continued exi-stence at an early stage.
The internal control system consists of a number of struc-tures and processes for risk control with the aim of iden-tifying risks as well as containing known risks and indi-cating them in the consolidated financial statements. It contains the principles, processes and measures introdu-ced by management, oriented toward the organizational implementation of the management’s decisions for safe-guarding the efficiency and economy of business acti-vity, the reliability and the truth and fairness of inter-nal and external accounting, and compliance with the applicable legal stipulations. Structures and processes
are adapted to recent internal and external develop-ments at regular intervals.
With respect to the financial accounting process of the consolidated companies and the Group, structures and processes have been implemented for safeguarding the truth and fairness of the consolidated financial state-ments. The Management Board assumes overall respon-sibility for the internal control and risk management system including its focus on financial accounting. All the companies and the Group’s divisions included in the consolidated financial statements are involved through the strictly defined organization of seniority levels and reporting.
The principles, the organizational structure, workflow management, and the processes of the internal control and risk management system with respect to financial accounting are regulated throughout the Group by spe-cific guidelines and operating procedures that are adap-ted to internal and external developments whenever necessary. Key features of the internal control and risk management system with respect to financial accoun-ting are (i) the identification of material areas of risk and monitored domains of relevance to financial accounting in the Group, (ii) examinations for monitoring the finan-cial accounting process and its results, (iii) preventive control measures in finance and accounting and those areas where material information for the preparation
Combined management report – Opportunities and risks
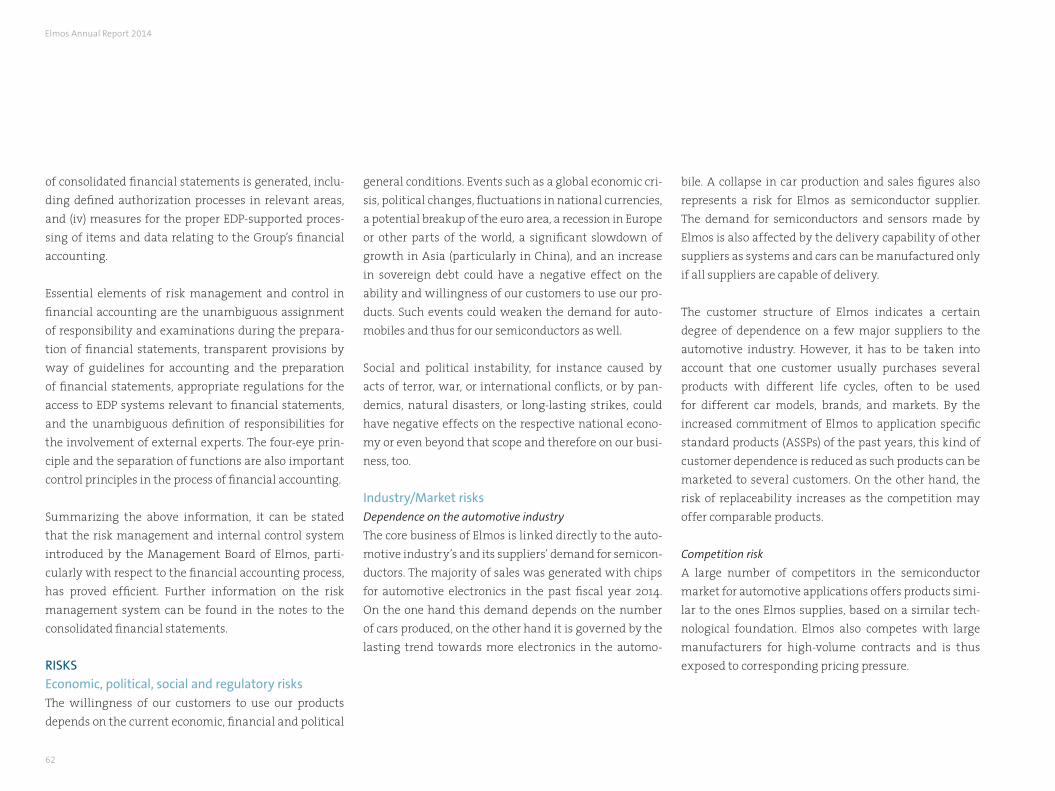
62
of consolidated financial statements is generated, inclu-ding defined authorization processes in relevant areas, and (iv) measures for the proper EDP-supported proces-sing of items and data relating to the Group’s financial accounting.
Essential elements of risk management and control in financial accounting are the unambiguous assignment of responsibility and examinations during the prepara-tion of financial statements, transparent provisions by way of guidelines for accounting and the preparation of financial statements, appropriate regulations for the access to EDP systems relevant to financial statements, and the unambiguous definition of responsibilities for the involvement of external experts. The four-eye prin-ciple and the separation of functions are also important control principles in the process of financial accounting.
Summarizing the above information, it can be stated that the risk management and internal control system introduced by the Management Board of Elmos, parti-cularly with respect to the financial accounting process, has proved efficient. Further information on the risk management system can be found in the notes to the consolidated financial statements.
RISKSEconomic, political, social and regulatory risks The willingness of our customers to use our products depends on the current economic, financial and political
general conditions. Events such as a global economic cri-sis, political changes, fluctuations in national currencies, a potential breakup of the euro area, a recession in Europe or other parts of the world, a significant slowdown of growth in Asia (particularly in China), and an increase in sovereign debt could have a negative effect on the ability and willingness of our customers to use our pro-ducts. Such events could weaken the demand for auto-mobiles and thus for our semiconductors as well.
Social and political instability, for instance caused by acts of terror, war, or international conflicts, or by pan-demics, natural disasters, or long-lasting strikes, could have negative effects on the respective national econo-my or even beyond that scope and therefore on our busi-ness, too.
Industry/Market risks Dependence on the automotive industry
The core business of Elmos is linked directly to the auto-motive industry’s and its suppliers’ demand for semicon-ductors. The majority of sales was generated with chips for automotive electronics in the past fiscal year 2014. On the one hand this demand depends on the number of cars produced, on the other hand it is governed by the lasting trend towards more electronics in the automo-
bile. A collapse in car production and sales figures also represents a risk for Elmos as semiconductor supplier. The demand for semiconductors and sensors made by Elmos is also affected by the delivery capability of other suppliers as systems and cars can be manufactured only if all suppliers are capable of delivery.
The customer structure of Elmos indicates a certain degree of dependence on a few major suppliers to the automotive industry. However, it has to be taken into account that one customer usually purchases several products with different life cycles, often to be used for different car models, brands, and markets. By the increased commitment of Elmos to application specific standard products (ASSPs) of the past years, this kind of customer dependence is reduced as such products can be marketed to several customers. On the other hand, the risk of replaceability increases as the competition may offer comparable products.
Competition risk
A large number of competitors in the semiconductor market for automotive applications offers products simi-lar to the ones Elmos supplies, based on a similar tech-nological foundation. Elmos also competes with large manufacturers for high-volume contracts and is thus exposed to corresponding pricing pressure.
Elmos Annual Report 2014
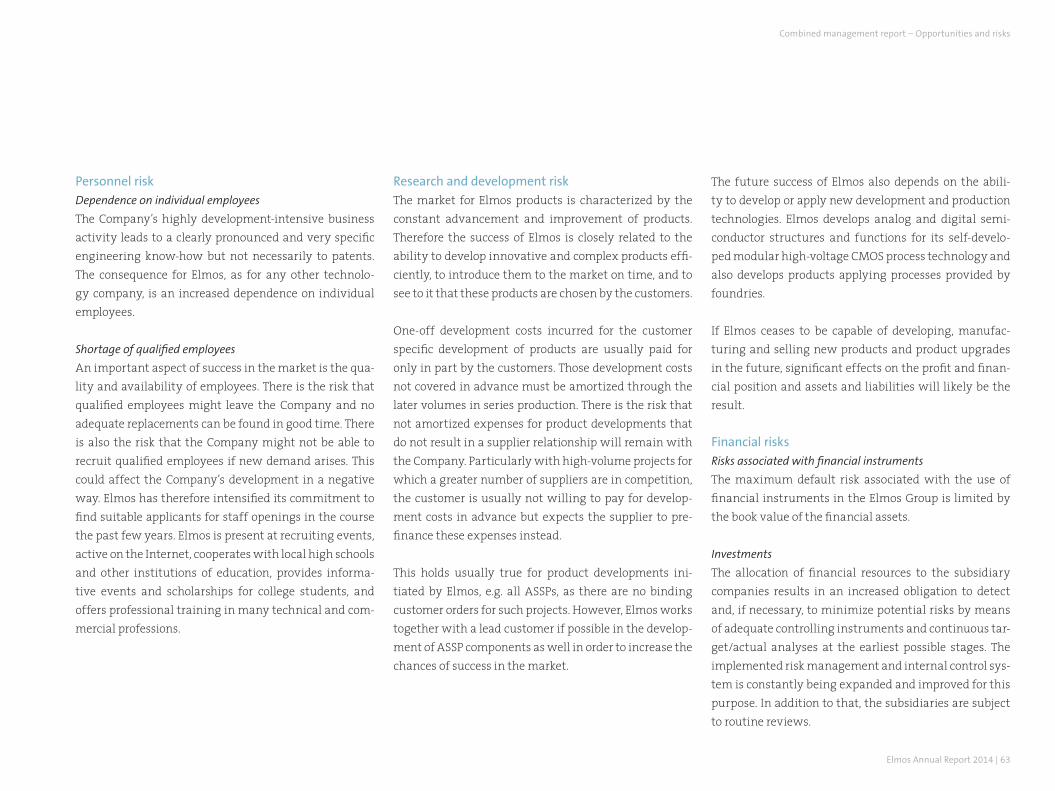
Elmos Annual Report 2014 | 63
Personnel riskDependence on individual employees
The Company’s highly development-intensive business activity leads to a clearly pronounced and very specific engineering know-how but not necessarily to patents. The consequence for Elmos, as for any other technolo-gy company, is an increased dependence on individual employees.
Shortage of qualified employees
An important aspect of success in the market is the qua-lity and availability of employees. There is the risk that qualified employees might leave the Company and no adequate replacements can be found in good time. There is also the risk that the Company might not be able to recruit qualified employees if new demand arises. This could affect the Company’s development in a negative way. Elmos has therefore intensified its commitment to find suitable applicants for staff openings in the course the past few years. Elmos is present at recruiting events, active on the Internet, cooperates with local high schools and other institutions of education, provides informa-tive events and scholarships for college students, and offers professional training in many technical and com-mercial professions.
Research and development risk The market for Elmos products is characterized by the constant advancement and improvement of products. Therefore the success of Elmos is closely related to the ability to develop innovative and complex products effi-ciently, to introduce them to the market on time, and to see to it that these products are chosen by the customers.
One-off development costs incurred for the customer specific development of products are usually paid for only in part by the customers. Those development costs not covered in advance must be amortized through the later volumes in series production. There is the risk that not amortized expenses for product developments that do not result in a supplier relationship will remain with the Company. Particularly with high-volume projects for which a greater number of suppliers are in competition, the customer is usually not willing to pay for develop-ment costs in advance but expects the supplier to pre-finance these expenses instead.
This holds usually true for product developments ini-tiated by Elmos, e.g. all ASSPs, as there are no binding customer orders for such projects. However, Elmos works together with a lead customer if possible in the develop-ment of ASSP components as well in order to increase the chances of success in the market.
The future success of Elmos also depends on the abili-ty to develop or apply new development and production technologies. Elmos develops analog and digital semi-conductor structures and functions for its self-develo-ped modular high-voltage CMOS process technology and also develops products applying processes provided by foundries.
If Elmos ceases to be capable of developing, manufac-turing and selling new products and product upgrades in the future, significant effects on the profit and finan-cial position and assets and liabilities will likely be the result.
Financial risks Risks associated with financial instruments
The maximum default risk associated with the use of financial instruments in the Elmos Group is limited by the book value of the financial assets.
Investments
The allocation of financial resources to the subsidiary companies results in an increased obligation to detect and, if necessary, to minimize potential risks by means of adequate controlling instruments and continuous tar-get/actual analyses at the earliest possible stages. The implemented risk management and internal control sys-tem is constantly being expanded and improved for this purpose. In addition to that, the subsidiaries are subject to routine reviews.
Combined management report – Opportunities and risks
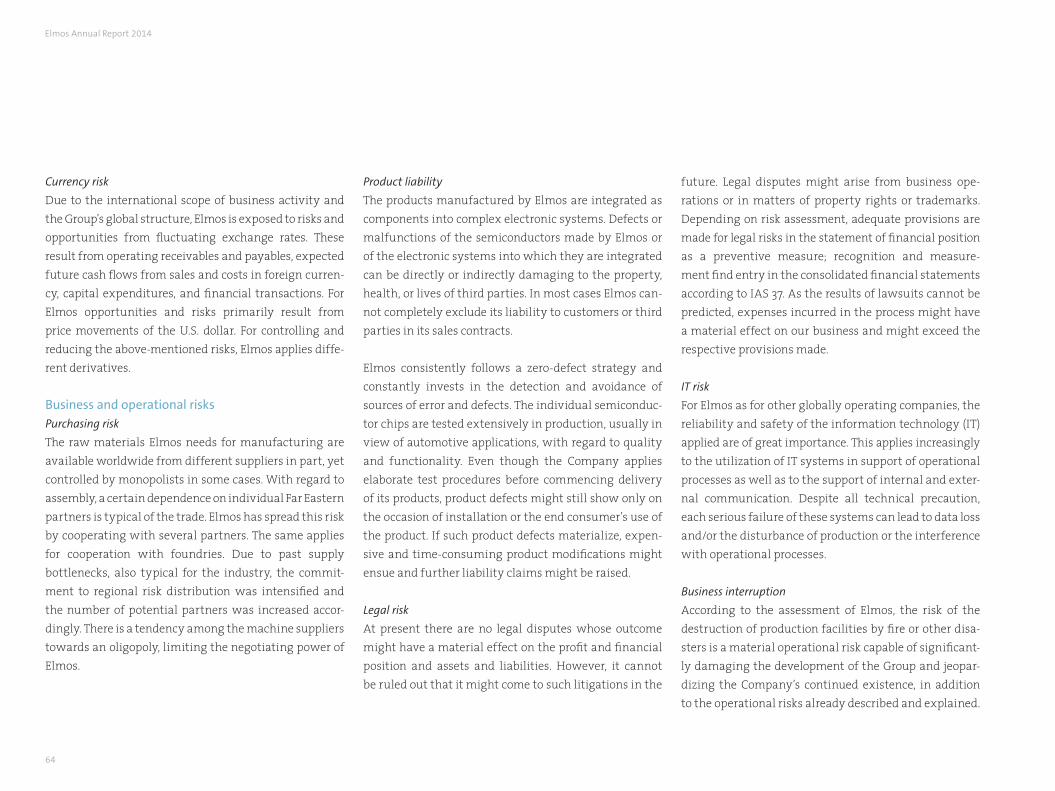
64
Currency risk
Due to the international scope of business activity and the Group’s global structure, Elmos is exposed to risks and opportunities from fluctuating exchange rates. These result from operating receivables and payables, expected future cash flows from sales and costs in foreign curren-cy, capital expenditures, and financial transactions. For Elmos opportunities and risks primarily result from price movements of the U.S. dollar. For controlling and reducing the above-mentioned risks, Elmos applies diffe-rent derivatives.
Business and operational risks Purchasing risk
The raw materials Elmos needs for manufacturing are available worldwide from different suppliers in part, yet controlled by monopolists in some cases. With regard to assembly, a certain dependence on individual Far Eastern partners is typical of the trade. Elmos has spread this risk by cooperating with several partners. The same applies for cooperation with foundries. Due to past supply bottlenecks, also typical for the industry, the commit-ment to regional risk distribution was intensified and the number of potential partners was increased accor-dingly. There is a tendency among the machine suppliers towards an oligopoly, limiting the negotiating power of Elmos.
Product liability
The products manufactured by Elmos are integrated as components into complex electronic systems. Defects or malfunctions of the semiconductors made by Elmos or of the electronic systems into which they are integrated can be directly or indirectly damaging to the property, health, or lives of third parties. In most cases Elmos can-not completely exclude its liability to customers or third parties in its sales contracts.
Elmos consistently follows a zero-defect strategy and constantly invests in the detection and avoidance of sources of error and defects. The individual semiconduc-tor chips are tested extensively in production, usually in view of automotive applications, with regard to quality and functionality. Even though the Company applies elaborate test procedures before commencing delivery of its products, product defects might still show only on the occasion of installation or the end consumer’s use of the product. If such product defects materialize, expen-sive and time-consuming product modifications might ensue and further liability claims might be raised.
Legal risk
At present there are no legal disputes whose outcome might have a material effect on the profit and financial position and assets and liabilities. However, it cannot be ruled out that it might come to such litigations in the
future. Legal disputes might arise from business ope-rations or in matters of property rights or trademarks. Depending on risk assessment, adequate provisions are made for legal risks in the statement of financial position as a preventive measure; recognition and measure-ment find entry in the consolidated financial statements according to IAS 37. As the results of lawsuits cannot be predicted, expenses incurred in the process might have a material effect on our business and might exceed the respective provisions made.
IT risk
For Elmos as for other globally operating companies, the reliability and safety of the information technology (IT) applied are of great importance. This applies increasingly to the utilization of IT systems in support of operational processes as well as to the support of internal and exter-nal communication. Despite all technical precaution, each serious failure of these systems can lead to data loss and/or the disturbance of production or the interference with operational processes.
Business interruption
According to the assessment of Elmos, the risk of the destruction of production facilities by fire or other disa-sters is a material operational risk capable of significant-ly damaging the development of the Group and jeopar-dizing the Company’s continued existence, in addition to the operational risks already described and explained.
Elmos Annual Report 2014
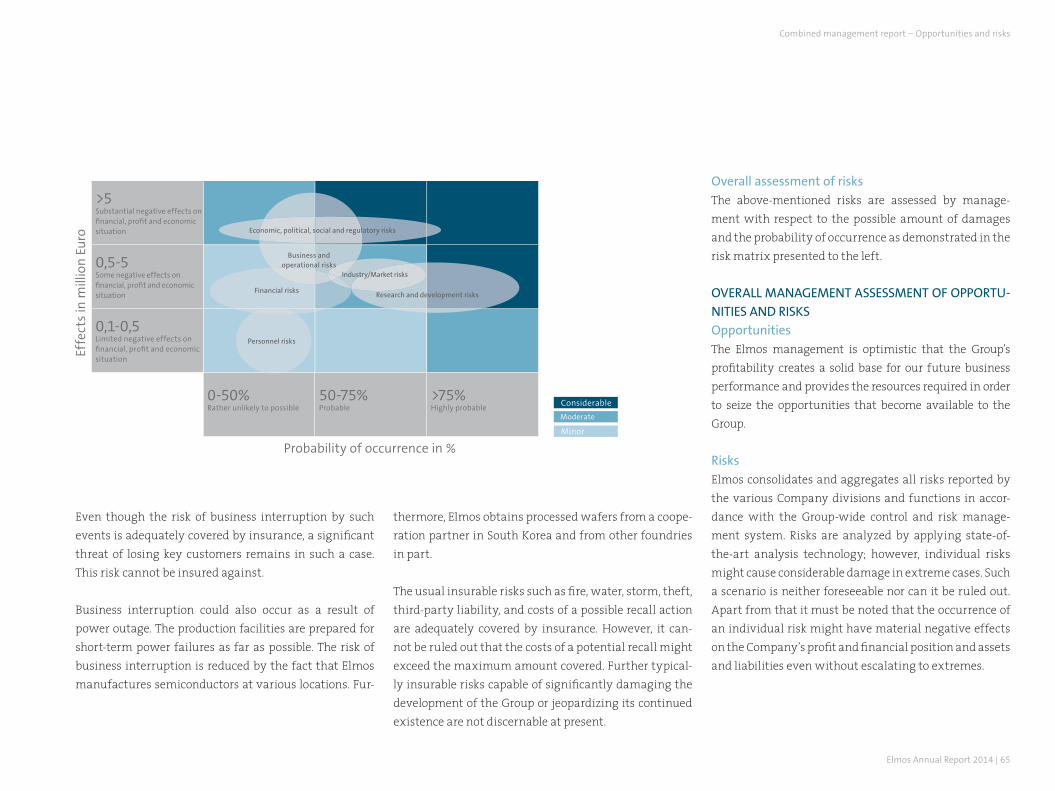
Elmos Annual Report 2014 | 65
Even though the risk of business interruption by such events is adequately covered by insurance, a signifi cant threat of losing key customers remains in such a case. This risk cannot be insured against.
Business interruption could also occur as a result of power outage. The production facilities are prepared for short-term power failures as far as possible. The risk of business interruption is reduced by the fact that Elmos manufactures semiconductors at various locations. Fur-
thermore, Elmos obtains processed wafers from a coope-ration partner in South Korea and from other foundries in part.
The usual insurable risks such as fi re, water, storm, theft, third-party liability, and costs of a possible recall action are adequately covered by insurance. However, it can-not be ruled out that the costs of a potential recall might exceed the maximum amount covered. Further typical-ly insurable risks capable of signifi cantly damaging the development of the Group or jeopardizing its continued existence are not discernable at present.
Overall assessment of risksThe above-mentioned risks are assessed by manage-ment with respect to the possible amount of damages and the probability of occurrence as demonstrated in the risk matrix presented to the left.
OvERALL MANAGEMENT ASSESSMENT OF OPPORTU-NITIES AND RISKSOpportunitiesThe Elmos management is optimistic that the Group’s profi tability creates a solid base for our future business performance and provides the resources required in order to seize the opportunities that become available to the Group.
RisksElmos consolidates and aggregates all risks reported by the various Company divisions and functions in accor-dance with the Group-wide control and risk manage-ment system. Risks are analyzed by applying state-of-the-art analysis technology; however, individual risks might cause considerable damage in extreme cases. Such a scenario is neither foreseeable nor can it be ruled out. Apart from that it must be noted that the occurrence of an individual risk might have material negative effects on the Company’s profi t and fi nancial position and assets and liabilities even without escalating to extremes.
>5Substantial negative effects on fi nancial, profi t and economic situation
0,5-5Some negative effects on fi nancial, profi t and economic situation
0,1-0,5Limited negative effects on fi nancial, profi t and economic situation
0-50%Rather unlikely to possible
50-75%Probable
>75%Highly probable
Considerable
Moderate
Minor
Financial risks
Personnel risks
Research and development risks
Business and operational risks
Economic, political, social and regulatory risks
Effe
cts
in m
illio
n E
uro
Probability of occurrence in %
Industry/Market risks
Combined management report – Opportunities and risks
66
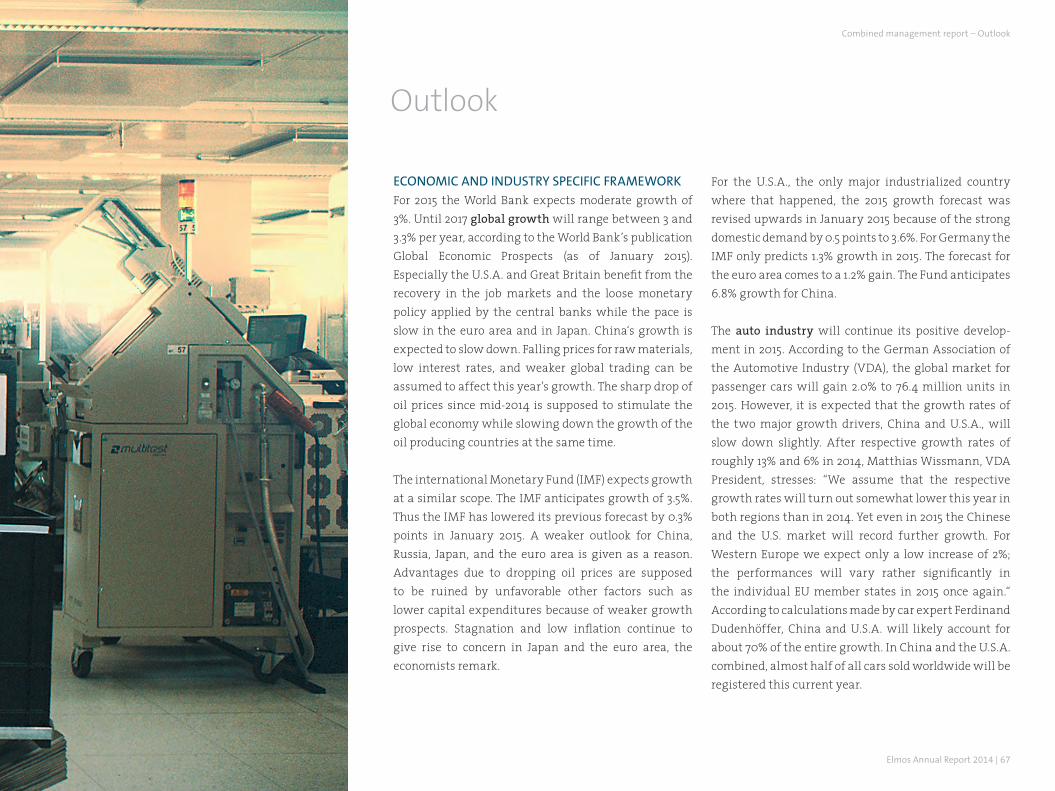
Elmos Annual Report 2014 | 67
Outlook
ECONOMIC AND INDUSTRY SPECIFIC FRAMEWORKFor 2015 the World Bank expects moderate growth of 3%. Until 2017 global growth will range between 3 and 3.3% per year, according to the World Bank’s publication Global Economic Prospects (as of January 2015). Especially the U.S.A. and Great Britain benefit from the recovery in the job markets and the loose monetary policy applied by the central banks while the pace is slow in the euro area and in Japan. China‘s growth is expected to slow down. Falling prices for raw materials, low interest rates, and weaker global trading can be assumed to affect this year’s growth. The sharp drop of oil prices since mid-2014 is supposed to stimulate the global economy while slowing down the growth of the oil producing countries at the same time.
The international Monetary Fund (IMF) expects growth at a similar scope. The IMF anticipates growth of 3.5%. Thus the IMF has lowered its previous forecast by 0.3% points in January 2015. A weaker outlook for China, Russia, Japan, and the euro area is given as a reason. Advantages due to dropping oil prices are supposed to be ruined by unfavorable other factors such as lower capital expenditures because of weaker growth prospects. Stagnation and low inflation continue to give rise to concern in Japan and the euro area, the economists remark.
For the U.S.A., the only major industrialized country where that happened, the 2015 growth forecast was revised upwards in January 2015 because of the strong domestic demand by 0.5 points to 3.6%. For Germany the IMF only predicts 1.3% growth in 2015. The forecast for the euro area comes to a 1.2% gain. The Fund anticipates 6.8% growth for China.
The auto industry will continue its positive develop-ment in 2015. According to the German Association of the Automotive Industry (VDA), the global market for passenger cars will gain 2.0% to 76.4 million units in 2015. However, it is expected that the growth rates of the two major growth drivers, China and U.S.A., will slow down slightly. After respective growth rates of roughly 13% and 6% in 2014, Matthias Wissmann, VDA President, stresses: “We assume that the respective growth rates will turn out somewhat lower this year in both regions than in 2014. Yet even in 2015 the Chinese and the U.S. market will record further growth. For Western Europe we expect only a low increase of 2%; the performances will vary rather significantly in the individual EU member states in 2015 once again.“ According to calculations made by car expert Ferdinand Dudenhöffer, China and U.S.A. will likely account for about 70% of the entire growth. In China and the U.S.A. combined, almost half of all cars sold worldwide will be registered this current year.
Combined management report – Outlook
68
Worldwide semiconductor sales will amount to 358 billion U.S. dollars in the current year, 5.4% more than in 2014, according to a forecast by Gartner analysts. The reasons they name are the growth in smartphones as well as the demand for DRAM and NAND Flash for ultra mobiles and SSDs. The Internet of Things is also slowly gaining in relevance to the semiconductor market.
The automotive semiconductor market continues its course for growth. The market researchers of Strategy Analytics predict for the period from 2013 through 2018 that the average global value of semiconductors will climb from 327 U.S. dollars per vehicle in 2013 to 369 U.S. dollars per vehicle in 2018. This equals an average annual growth rate of 2.4%.
According to IHS, global MEMS sales will rise by 6.6% to more than 10 billion U.S. dollars in 2015.
STRATEGYWe want to achieve profitable growth throughout our entire product portfolio. As in the previous years, emphasis is placed on the long-term increase in sales, EBIT, and free cash flow (adjusted). Customer relationships of many years solidly based on trust are meant to remain the foundation of our business development. Partnerships with new customers are intended to open new opportunities.
We will continue our strategy for long-term profitable growth in 2015:-> We want to seize our opportunities on an inter-
national scope and grow faster than the market. The foundation for this plan are new products that stimulate our business in the context of the global megatrends. We will introduce these products in our home market Europe and increasingly in Asia and the U.S.A. as well.
-> Based on the three product lines, Elmos will present innovative solutions to the market. The goal is to take the leading position in the market if possible. The focus is increasingly on application specific components (ASSPs) which will account for a growing share in sales. We will push the development of new products with great commitment.
-> We will focus on analyzing optimization potential in production and in our processes and implement improvements. We will also continuously extend our fab light strategy together with our partners.
-> Elmos seeks to strengthen its financial basis even further. Sales, EBIT, free cash flow (adjusted), and capital expenditures are therefore of the highest importance as Group-wide key indicators. The focus is also on the participation of the shareholders in the Company’s success.
-> We want our employees to develop themselves professionally and personally and to have input in a corporate culture oriented towards performance and development. We also want to recruit new young professionals so that we will remain capable of applying our know-how in all areas and enhancing it.
OPERATIONAL TARGETS 2015Targets for sales and earnings Based on currently available information, the Management Board presents the following outlook for the full year 2015. The market development in Europe is moderate and not stable yet. It will affect our sales positively only to a limited extent. As our position in the Asian market is getting stronger, it helps us benefit from the market’s economic growth. Our business in the U.S.A. will grow especially with our MEMS products.
Based on internal and external assessments of the market, Elmos expects the following results for sales and EBIT margin.
Elmos expects another increase in sales for 2015. Management assumes growth in the mid single-digit percentage range for the current fiscal year 2015. We also assume we will be able to expand the strength of business operations despite the highly competitive environment and thus achieve a slightly better EBIT margin in 2015 compared to 2014.
Elmos Annual Report 2014
Elmos Annual Report 2014 | 69
Both segments will make positive contributions to the increase in sales and EBIT.
Targets for capital expendituresCapital expenditures for intangible assets and property, plant and equipment are budgeted at a maximum of 15% of sales in 2015. Further new machines and systems are scheduled for introduction and operation over the full year for an increase in capacity and efficiency. Capital expenditures will also be made for production at the subsidiary SMI.
Targets for liquidity and financeWe expect Elmos to generate a positive adjusted free cash flow in 2015 once again.
Dividend targets Free liquidity is scheduled to be utilized in part for the payment of a dividend. Supervisory Board and Management Board will propose to the Annual General Meeting in May 2015 the payment of a dividend increased by roughly one third. Following a dividend of 0.25 Euro per share for 2013, the dividend for 2014 is intended to be 0.33 Euro per share. This dividend increase reflects the positive business performance in 2014.
Underlying assumptions of our forecastsUnder the condition of a stable general economic framework, it is expected that Elmos will participate in a positive development of the automotive semiconductor market in 2015. Electrification will continue in this market. Such a positive development for Elmos is based on the success of our current and future customers and on our ability to sell our products to them. The international competition among suppliers to the auto industry is subject to ever increasing intensification. Effects from resulting market shifts or portfolio changes at our customers can hardly be predicted.
Growth for Elmos would have the result that, depending on the amount of growth, we could realize the efficiency gains required in the semiconductor industry and the automotive supplier business on the one hand and benefit from the economies of scale on the other hand, leading to a positive development of the margins. At the same time it holds true that our customers demand annual price cuts and are usually granted them because of the competition. Such expectations can be affected by market turbulence.
Our forecasts consider all events with a potential material effect on the business performance of the Elmos Group known at the time of the preparation of this report. The outlook is based among other factors on the assumptions for the economic development as described as well as the remarks in the report on opportunities and risks.
The forecast is based on an exchange rate of 1.20 USD/EUR.
Combined management report – Outlook

70
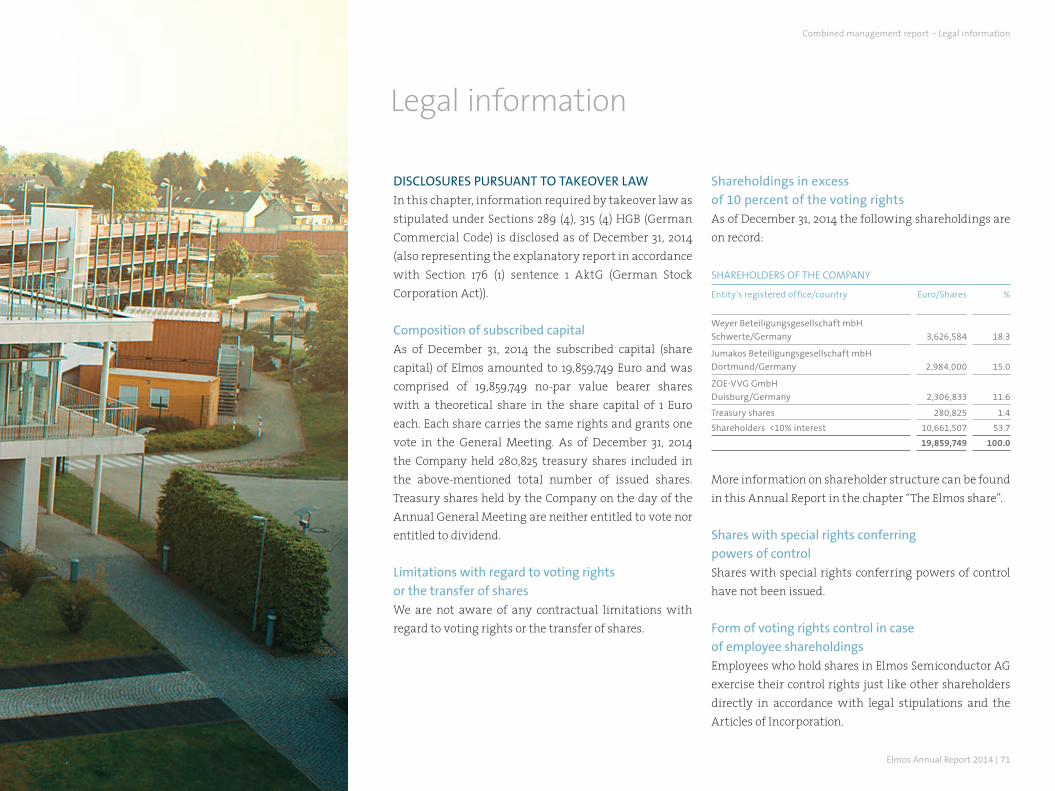
Elmos Annual Report 2014 | 71
Legal information
DISCLOSURES PURSUANT TO TAKEOvER LAW In this chapter, information required by takeover law as stipulated under Sections 289 (4), 315 (4) HGB (German Commercial Code) is disclosed as of December 31, 2014 (also representing the explanatory report in accordance with Section 176 (1) sentence 1 AktG (German Stock Corporation Act)).
Composition of subscribed capital As of December 31, 2014 the subscribed capital (share capital) of Elmos amounted to 19,859,749 Euro and was comprised of 19,859,749 no-par value bearer shares with a theoretical share in the share capital of 1 Euro each. Each share carries the same rights and grants one vote in the General Meeting. As of December 31, 2014 the Company held 280,825 treasury shares included in the above-mentioned total number of issued shares. Treasury shares held by the Company on the day of the Annual General Meeting are neither entitled to vote nor entitled to dividend.
Limitations with regard to voting rights or the transfer of shares We are not aware of any contractual limitations with regard to voting rights or the transfer of shares.
Shareholdings in excess of 10 percent of the voting rights As of December 31, 2014 the following shareholdings are on record:
SHAREHOLDERS OF THE COMPANY
Entity’s registered office/country Euro/Shares %
Weyer Beteiligungsgesellschaft mbH
Schwerte/Germany 3,626,584 18.3
Jumakos Beteiligungsgesellschaft mbH
Dortmund/Germany 2,984,000 15.0
ZOE-vvG GmbH
Duisburg/Germany 2,306,833 11.6
Treasury shares 280,825 1.4
Shareholders <10% interest 10,661,507 53.7
19,859,749 100.0
More information on shareholder structure can be found in this Annual Report in the chapter “The Elmos share”.
Shares with special rights conferring powers of control Shares with special rights conferring powers of control have not been issued.
Form of voting rights control in case of employee shareholdings Employees who hold shares in Elmos Semiconductor AG exercise their control rights just like other shareholders directly in accordance with legal stipulations and the Articles of Incorporation.
Combined management report – Legal information
72
Legal stipulations and provisions of the articles of incorporation for the appointment and dismissal of management board members and for amendments to the articles We refer to the respective legal stipulations for the appointment and dismissal of management board members (Sections 84, 85 AktG) and for amendments to the articles of incorporation (Sections 133, 179 AktG). The Company’s Articles of Incorporation do not provide for supplementary provisions.
The management board’s authorization to issue and repurchase shares The Management Board is authorized to increase the Company's share capital up to and including May 16, 2016, subject to the Supervisory Board’s approval, by up to 9,707,100 Euro through the singular or repeated issue of new no-par value bearer shares against contributions in cash or in kind (authorized capital 2011/I). If the capital is increased against contributions in cash, subscription rights shall be granted to the shareholders. The shares may be taken over by banks under the obligation to offer them to the shareholders for subscription. However, the Management Board is authorized, subject to the Supervisory Board’s approval, to exclude the shareholders’ subscription rights. The total of the shares issued according to this authorization against contributions in cash or in kind under exclusion of the shareholders’ subscription rights must not exceed a proportionate amount of the share capital of 4,853,551
Euro. The Management Board is further authorized, subject to the Supervisory Board’s approval, to determine all other rights attached to the shares as well as the particulars of the issue.
The share capital is conditionally increased by up to 154,500 Euro (conditional capital 2009). The conditional capital increase serves the redemption of stock options issued to employees, executives and Management Board members of the Company as well as to employees and executives of affiliated companies up to and including May 5, 2014 on the basis of the authorization given by the Annual General Meeting (AGM) of May 6, 2009 (stock option plan 2009). The conditional capital increase is realized only insofar as options are issued within the scope of the Company’s stock option plan 2009 in observance of the resolution of the AGM of May 6, 2009 and as these options are exercised by their owners within the exercise period insofar as no cash compensation is granted or treasury shares are utilized for payment. The new shares are entitled to dividend from the beginning of the fiscal year in which they come into being by the exercise of options.
The share capital is conditionally increased by up to 1,144,956 Euro (conditional capital 2010/I). The conditional capital increase serves the redemption of stock options issued to employees, executives and Management Board members of the Company as well as to employees and executives of affiliated companies
up to and including May 3, 2015 on the basis of the authorization given by the Annual General Meeting (AGM) of May 4, 2010 (stock option plan 2010). The conditional capital increase is realized only insofar as options are issued within the scope of the Company’s stock option plan 2010 in observance of the resolution of the AGM of May 4, 2010 and as these options are exercised by their owners within the exercise period insofar as no cash compensation is granted or treasury shares are utilized for payment. The new shares are entitled to dividend from the beginning of the fiscal year in which they come into being by the exercise of options.
The share capital is conditionally increased by up to 7,800,000 Euro (conditional capital 2010/II). The conditional capital increase is realized only insofar as the owners of convertible bonds or option bonds, profit participation rights or profit participating bonds (or a combination of these instruments) issued by Elmos or a group company of Elmos within the meaning of Section 18 AktG (Stock Corporation Act) up to and including May 3, 2015 based on the authorization given by the Annual General Meeting (AGM) of May 4, 2010 under agenda item 10 b) make use of their conversion privileges or options or, if they are committed to conversion, realize this commitment to conversion, insofar as no cash compensation is granted or treasury shares are utilized for payment. The new shares are issued at the conversion or option price to be determined in accordance with the aforementioned authorization. The new shares are
Elmos Annual Report 2014
Elmos Annual Report 2014 | 73
entitled to dividend from the beginning of the fiscal year in which they come into being by the exercise of conversion privileges or options or the fulfillment of conversion commitments.
Based on the resolution of the Annual General Meeting of May 17, 2011, the Management Board is authorized, subject to the Supervisory Board’s approval, to purchase the Company’s shares up to and including May 16, 2016. This authorization is limited to the purchase of shares representing a total of 10% of the current share capital. The authorization may be exercised fully or in several parts, once or several times, and for one or several purposes within the scope of the aforementioned limitation.
AUTHORIZATIONS OF THE MANAGEMENT BOARD
Authorized capital I
Conditional capital
Repurchase of the Company’s shares
9,707,100 Eurountil May 16, 2016
2009: 154,500 EuroStock option plan 2009until May 5, 2014
2010/I: 1,144,956 EuroStock option plan 2010until May 3, 2015
2010/II: 7,800,000 EuroOption bonds or convertible bonds until May 3, 2015
up to 10% of the share capital until May 16, 2016
Material agreements on the condition of a change of control as a result of a takeover bid There are no material agreements on the condition of a change of control as a result of a takeover bid.
Compensation agreements in case of a takeover bidIn case of a change of control, the members of the Management Board are entitled to terminate their respective employment contracts within three months from the occurrence of a change of control with six-month notice to the end of the month and to resign from their duties as of the termination of their employment contracts. In case of the exercise of this right of termination, each Management Board member is entitled to compensation in the amount of the remuneration for two years, limited by the amount of the remuneration to be paid for the remaining term of the respective employment contract. Applicable is the remuneration amount paid during the last fiscal year prior to the occurrence of the change of control. The Company is also committed to compensation payments for the post-termination effects of non-competition clauses. In some cases provisions also govern the exercise of options and retirement provision in case of a change of control.
REMUNERATION REPORT Total remuneration of the members of Management Board and Supervisory Board comprises a number of remuneration components. The details are explained in the remuneration report included in this Annual Report’s corporate governance report. The remuneration report, reviewed by the auditor, is part of the combined management report.
STATEMENT ON CORPORATE GOvERNANCE The statement on corporate governance pursuant to Section 289a HGB is part of the combined management report and can be found in the chapter “Corporate Governance”.
Combined management report – Legal information
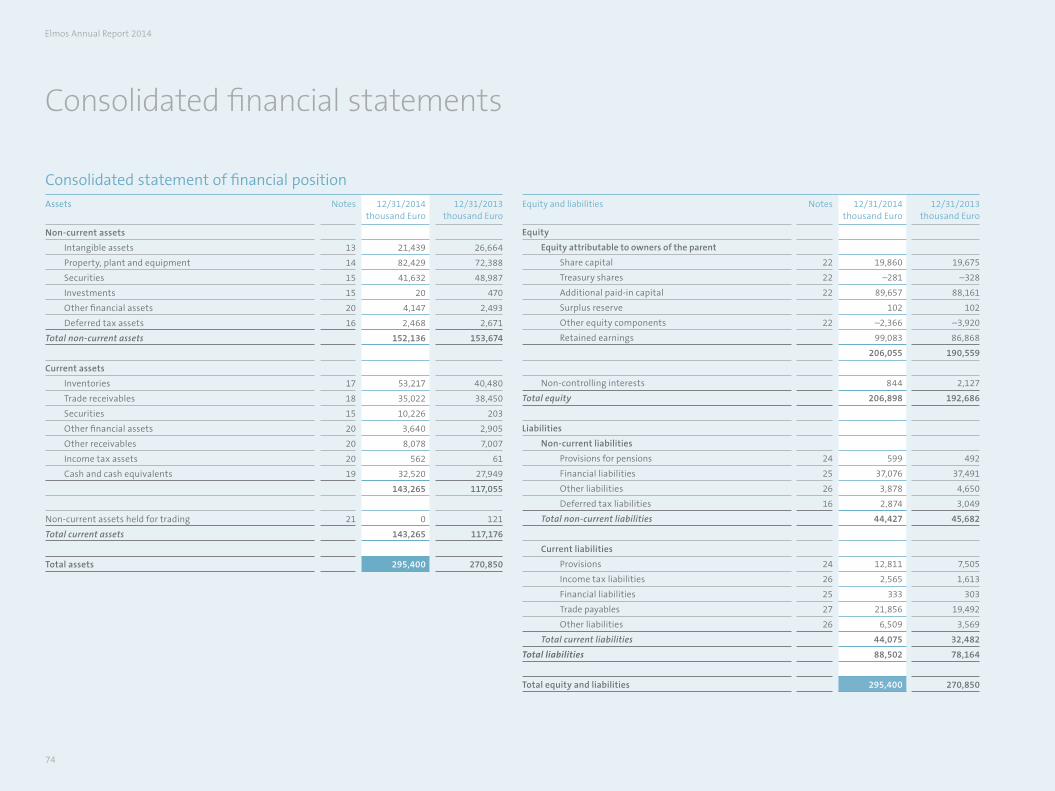
74
Consolidated financial statements
Consolidated statement of financial positionAssets Notes 12/31/2014
thousand Euro12/31/2013
thousand Euro
Non-current assets
Intangible assets 13 21,439 26,664
Property, plant and equipment 14 82,429 72,388
Securities 15 41,632 48,987
Investments 15 20 470
Other financial assets 20 4,147 2,493
Deferred tax assets 16 2,468 2,671
Total non-current assets 152,136 153,674
Current assets
Inventories 17 53,217 40,480
Trade receivables 18 35,022 38,450
Securities 15 10,226 203
Other financial assets 20 3,640 2,905
Other receivables 20 8,078 7,007
Income tax assets 20 562 61
Cash and cash equivalents 19 32,520 27,949
143,265 117,055
Non-current assets held for trading 21 0 121
Total current assets 143,265 117,176
Total assets 295,400 270,850
Equity and liabilities Notes 12/31/2014thousand Euro
12/31/2013thousand Euro
Equity
Equity attributable to owners of the parent
Share capital 22 19,860 19,675
Treasury shares 22 –281 –328
Additional paid-in capital 22 89,657 88,161
Surplus reserve 102 102
Other equity components 22 –2,366 –3,920
Retained earnings 99,083 86,868
206,055 190,559
Non-controlling interests 844 2,127
Total equity 206,898 192,686
Liabilities
Non-current liabilities
Provisions for pensions 24 599 492
Financial liabilities 25 37,076 37,491
Other liabilities 26 3,878 4,650
Deferred tax liabilities 16 2,874 3,049
Total non-current liabilities 44,427 45,682
Current liabilities
Provisions 24 12,811 7,505
Income tax liabilities 26 2,565 1,613
Financial liabilities 25 333 303
Trade payables 27 21,856 19,492
Other liabilities 26 6,509 3,569
Total current liabilities 44,075 32,482
Total liabilities 88,502 78,164
Total equity and liabilities 295,400 270,850
Elmos Annual Report 2014
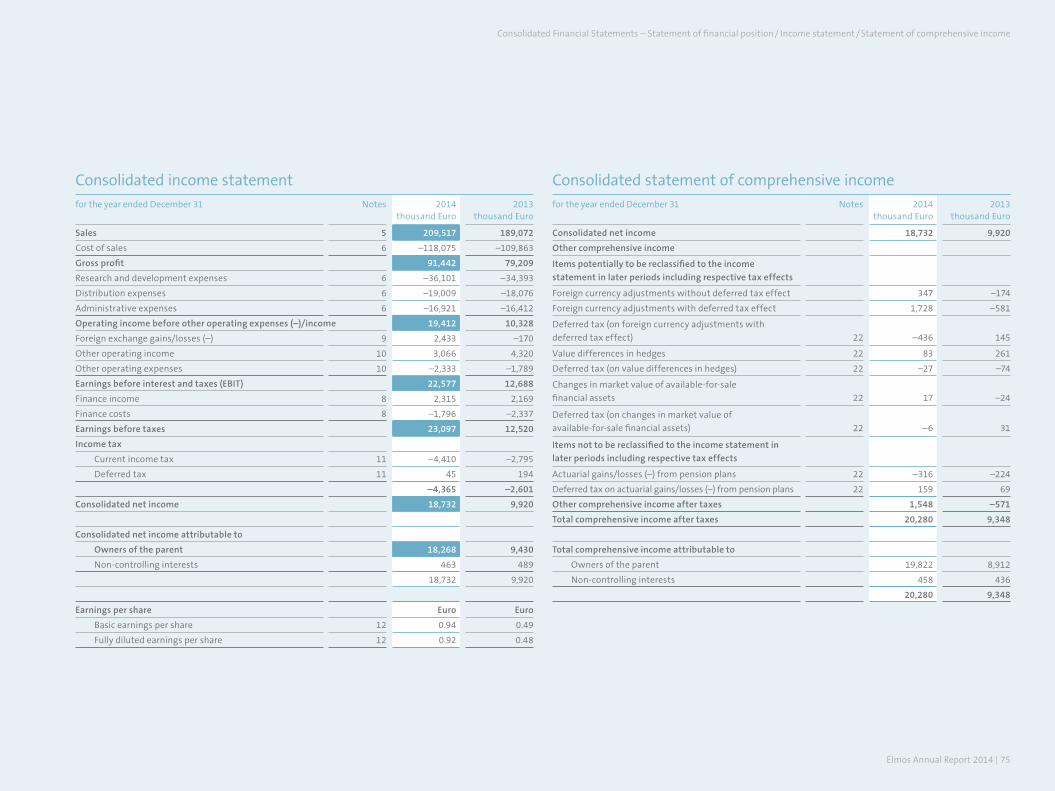
Elmos Annual Report 2014 | 75
Consolidated Financial Statements – Statement of financial position/ Income statement /Statement of comprehensive income
Consolidated income statementfor the year ended December 31 Notes 2014
thousand Euro2013
thousand Euro
Sales 5 209,517 189,072
Cost of sales 6 –118,075 –109,863
Gross profit 91,442 79,209
Research and development expenses 6 –36,101 –34,393
Distribution expenses 6 –19,009 –18,076
Administrative expenses 6 –16,921 –16,412
Operating income before other operating expenses (–)/income 19,412 10,328
Foreign exchange gains/losses (–) 9 2,433 –170
Other operating income 10 3,066 4,320
Other operating expenses 10 –2,333 –1,789
Earnings before interest and taxes (EBIT) 22,577 12,688
Finance income 8 2,315 2,169
Finance costs 8 –1,796 –2,337
Earnings before taxes 23,097 12,520
Income tax
Current income tax 11 –4,410 –2,795
Deferred tax 11 45 194
–4,365 –2,601
Consolidated net income 18,732 9,920
Consolidated net income attributable to
Owners of the parent 18,268 9,430
Non-controlling interests 463 489
18,732 9,920
Earnings per share Euro Euro
Basic earnings per share 12 0.94 0.49
Fully diluted earnings per share 12 0.92 0.48
Consolidated statement of comprehensive incomefor the year ended December 31 Notes 2014
thousand Euro2013
thousand Euro
Consolidated net income 18,732 9,920
Other comprehensive income
Items potentially to be reclassified to the income
statement in later periods including respective tax effects
Foreign currency adjustments without deferred tax effect 347 –174
Foreign currency adjustments with deferred tax effect 1,728 –581
Deferred tax (on foreign currency adjustments with
deferred tax effect) 22 –436 145
value differences in hedges 22 83 261
Deferred tax (on value differences in hedges) 22 –27 –74
Changes in market value of available-for-sale
financial assets 22 17 –24
Deferred tax (on changes in market value of
available-for-sale financial assets) 22 –6 31
Items not to be reclassified to the income statement in
later periods including respective tax effects
Actuarial gains/losses (–) from pension plans 22 –316 –224
Deferred tax on actuarial gains/losses (–) from pension plans 22 159 69
Other comprehensive income after taxes 1,548 –571
Total comprehensive income after taxes 20,280 9,348
Total comprehensive income attributable to
Owners of the parent 19,822 8,912
Non-controlling interests 458 436
20,280 9,348

76
Consolidated statement of cash flows for the year ended December 31 Notes 2014
thousand Euro2013
thousand Euro
Cash flow from operating activities
Consolidated net income 18,732 9,920
Depreciation and amortization 7 25,623 22,838
Losses from disposal of assets 1,869 0
Financial result 8 –519 168
Other non-cash income (–)/expense –623 –8
Current income tax 11 4,410 2,795
Expenses for stock options/stock awards/share matching 340 403
Changes in pension provisions 24 –209 –489
Changes in net working capital
Trade receivables 18 3,882 –10,806
Inventories 17 –12,737 –2,023
Other assets 20 –1,655 –1,157
Trade payables 27 294 1,737
Other provisions and other liabilities 4,361 234
Income tax payments –4,280 –2,241
Interest paid 8 –1,796 –2,119
Interest received 8 2,272 2,149
Cash flow from operating activities 39,964 21,401
Consolidated statement of cash flows for the year ended December 31 Notes 2014
thousand Euro2013
thousand Euro
Cash flow from investing activities
Capital expenditures for intangible assets 13 –1,853 –1,775
Capital expenditures for property, plant and equipment 14 –28,659 –13,806
Disposal of/Capital expenditures for (–) non-current
assets held for trading 21 2 –121
Payments-in from acquisition of shares in subsidiaries 33 547 0
Disposal of non-current assets 1,145 184
Payments for securities 15 –2,651 –22,633
Disposal of investments 15 0 1,739
Payments for other non-current financial assets 20 –551 0
Cash flow from investing activities −32,020 –36,412
Cash flow from financing activities
Repayment (–) of non-current liabilities –415 –80
Borrowing/Repayment (–) of current liabilities to banks 29 –4,986
Share-based payment/Issue of treasury shares 336 457
Purchase of treasury shares 22 0 –1,525
Capital increase from conditional capital 22 1,082 220
Dividend distribution –4,844 –4,814
Distribution to non-controlling shareholders –667 –400
Increase of majority interest 33 0 –570
Other changes –142 –23
Cash flow from financing activities −4,621 –11,721
Increase/Decrease (–) in cash and cash equivalents 3,323 –26,732
Effects of exchange rate changes on cash and cash
equivalents 1,247 –895
Cash and cash equivalents at beginning of reporting period 19 27,949 55,576
Cash and cash equivalents at end of reporting period 19 32,520 27,949
Elmos Annual Report 2014

Elmos Annual Report 2014 | 77
Consolidated statement of changes in equity
Equity attributable to owners of the parent Non-controlling
interests
Group
Other equity components
Notes Shares
thousand
Share capital
thousand Euro
Treasury shares
thousand Euro
Additionalpaid-incapital
thousand Euro
Surplus reserve
thousand Euro
Provision for available-for-sale
financial assets
thousand Euro
Hedges
thousand Euro
Foreign currency translation
thousand Euro
Unrealized actuarial gains/
losses
thousand Euro
Retained earnings
thousand Euro
Total
thousand Euro
Total
thousand Euro
Total
thousand Euro
January 1, 2013 before adjustments 19,616 19,616 –240 88,599 102 71 –1,306 –1,634 0 82,255 187,463 2,587 190,050
Effects of first-time application of IAS 19R –533 72 –461 –461
January 1, 2013 after adjustments 19,616 19,616 –240 88,599 102 71 –1,306 –1,634 –533 82,327 187,002 2,587 189,589
Consolidated net income 9,430 9,430 489 9,920
Other comprehensive income for the period 22 7 187 –557 –155 –518 –53 –571
Total comprehensive income 7 187 –557 –155 9,430 8,912 436 9,348
Share-based payment/Issue of treasury shares 22 101 356 457 457
Capital increase from conditional capital 22 59 59 161 220 220
Transaction costs 22 –22 –22 –22
Purchase of treasury shares 22 –189 –1,336 –1,525 –1,525
Dividend distribution –4,814 –4,814 –4,814
Distribution to non-controlling shareholders 0 –400 –400
Expenses for stock options and stock awards 23 403 403 403
Increase of majority interest –85 –85 –485 –570
Other changes 11 11 –11 0
December 31, 2013 19,675 19,675 –328 88,161 102 78 –1,119 –2,191 –688 86,868 190,559 2,127 192,686
January 1, 2014 19,675 19,675 –328 88,161 102 78 –1,119 –2,191 –688 86,868 190,559 2,127 192,686
Consolidated net income 18,268 18,268 463 18,732
Other comprehensive income for the period 22 11 56 1,644 –157 1,554 –5 1,548
Total comprehensive income 11 56 1,644 –157 18,268 19,822 458 20,280
Share-based payment/Issue of treasury shares 22 47 289 336 336
Capital increase from conditional capital 22 185 185 897 1,082 1,082
Transaction costs 22 –30 –30 –30
Adjustment of put option of non-controlling shareholder 392 392 392
Increase of majority interest –1,415 –1,415 –1,585 –3,000
Changes in basis of consolidation 483 483
Dividend distribution –4,844 –4,844 –4,844
Distribution to non-controlling shareholders 0 –667 –667
Expenses for stock options/stock awards/share matching 340 340 340
Other changes –187 –187 28 –160
December 31, 2014 19,860 19,860 –281 89,657 102 89 –1,063 –547 –845 99,083 206,055 844 206,898
Consolidated Financial Statements – Statement of cash flows/Statement of changes in equity
78
Notes to the consolidated financial statements
General information
Elmos Semiconductor AG (“the Company” or “Elmos”) has its registered office in Dortmund
(Germany) and is entered in the register of companies kept at the District Court (Amtsgericht)
Dortmund, section B, under no. 13698. The Articles of Incorporation are in effect in the version of
March 26, 1999, last amended by resolution of the Annual General Meeting of May 13, 2014 and
edited by resolution of the Supervisory Board of December 23, 2014.
The Company’s business is the development, manufacture and distribution of microelectronic
components and system parts (application specific integrated circuits or, in short: ASICs) and
technological devices with similar functions. The Company may conduct all transactions
suitable for serving the object of the business directly or indirectly. The Company is authorized to
establish branches, acquire or lease businesses of the same or a similar kind or invest in them, and
conduct all business transactions that are beneficial to the Articles of Association. The Company
is authorized to conduct business in Germany as well as abroad.
In addition to its domestic branches, the Company maintains sales companies and locations in
Europe, Asia, South Africa and the U.S.A. and cooperates with other German and international
companies in the development and manufacture of semiconductor chips.
The Company is a listed stock corporation. The Company's shares are traded in the Prime Standard
in Frankfurt/Main.
The address of the Company’s registered office is:
44227 Dortmund, Germany, Heinrich-Hertz-Straße 1.
aCCoUntinG PoliCieS
1 – Principles of financial accounting
General information
The consolidated financial statements have been prepared in Euro. Values stated in “thousand
Euro” have been rounded up or down to thousand Euro according to financial rounding.
The consolidated financial statements of Elmos have been prepared in accordance with the
International Financial Reporting Standards (IFRS) as applicable in the European Union (EU) and
the supplementary applicable regulations of German commercial law as stipulated by Section
315a (1) HGB (Commercial Code). All of the IFRS released by the International Accounting Standards
Board (IASB) in effect at the time of the preparation of the consolidated financial statements and
applied by Elmos were endorsed by the European Commission for adoption in the EU.
The consolidated statement of financial position, the consolidated income statement, and
the consolidated statement of comprehensive income have been prepared according to IAS 1
Presentation of Financial Statements. Individual items have been summarized to improve clarity;
those items are explained in the notes.
The consolidated financial statements have been released for publication by the Management
Board in March 2015.
Estimates and assumptions
The most important forward-looking assumptions as well as other material sources of estimate
uncertainty identified as of the end of the reporting period on the basis of which there is
a considerable risk that a material adjustment of the book values of assets and liabilities will
become necessary within the next fiscal year are explained in the following. Beyond the scope
of the areas described below, assumptions and estimates are also necessary for valuation
allowances for bad debt as well as for contingent liabilities and other provisions. In accordance
with IAS 8 Accounting Policies, Changes in Accounting Estimates and Errors, changes in estimates
are recognized in profit or loss as of the time new information becomes available. Changes in
Elmos Annual Report 2014
Elmos Annual Report 2014 | 79
estimates did not result in material consequences in the reporting period nor are such effects
expected for future reporting periods.
Impairment of goodwill
The Group reviews goodwill for impairment at least once a year. This requires an estimate of
the values in use of the cash-generating units goodwill is allocated to. For an assessment of the
value in use, the Company’s management has to estimate the respective cash-generating unit’s
probable future cash flows and also choose an adequate discount rate in order to determine the
net present value of these cash flows.
With respect to the assumptions on the basis of which the value in use is determined, uncertainties
of estimates especially relate to gross margins and discount rates. Gross margins have been
estimated on the basis of historical values of the past years in consideration of expected changes
in demand and increases in efficiency. Discount rates reflect current market assessments and
have been estimated on the basis of customary weighted average cost of capital.
The book value of goodwill was 3,648 thousand Euro as of December 31, 2014 (2013: 3,623 thousand
Euro). More details can be found under notes 3 and 13.
Deferred tax assets
Deferred tax assets are recognized for all unutilized tax loss carry-forward to the extent it appears
probable that taxable income will be available so that loss carry-forward can in fact be utilized.
For the determination of the amount of deferred tax assets, a material discretionary decision
made by the Company’s management is required, based on the expected time of occurrence and
the amount of taxable future income as well as future tax planning strategies. More details can
be found under note 16.
Pension commitments
Expenses for defined benefit pension plans are determined according to actuarial calculations.
The actuarial evaluation is made on the basis of assumptions with regard to discount rates,
expected returns on pension plan assets, future raises of wages and salaries, mortality, and
increased future retirement pensions. Due to the long-term orientation of those plans, such
estimates are subject to material uncertainty. Provisions for pensions amounted to 599 thousand
Euro as of December 31, 2014 (2013: 492 thousand Euro). More details can be found under note 24.
Development expenses
Development expenses are capitalized in accordance with the accounting policies and valuation
methods described under note 3. According to best possible estimation, the book value of
development expenses (including projects in development) to be capitalized amounted to 3,886
thousand Euro as of December 31, 2014 (2013: 4,947 thousand Euro). More details can be found
under note 13.
New and amended standards and interpretations
The accounting policies applied generally correspond to the policies applied in the previous
year. Exceptions are the following new and amended standards, subject to first-time mandatory
application for fiscal year 2014.
IFRS 10 – Consolidated Financial Statements
IFRS 10 was released in May 2011 and is subject to mandatory application for fiscal years
beginning on or after January 1, 2014. The new standard supersedes the provisions of previous
IAS 27 Consolidated and Separate Financial Statements on group accounting and interpretation
SIC 12 Consolidation – Special Purpose Entities. IFRS 10 establishes a consistent concept of control
to be applied to all entities including special purpose entities. Moreover, revised transitional
directives on IFRS 10-12 were released in June 2012 intended to make the new standard’s first-
Consolidated financial statements – Notes
80
time application easier. Compared to the previous legal situation, the changes introduced with
IFRS 10 require considerable discretionary management decisions in assessing which entities are
controlled in the group and whether those entities must therefore be included in consolidated
financial statements by way of full consolidation. First-time application of this standard in 2014
did not change the basis of consolidation of the Elmos Group.
IFRS 11 – Joint Arrangements
IFRS 11 was released in May 2011 and is subject to mandatory application for fiscal years
beginning on or after January 1, 2014. The standard supersedes IAS 31 Interests in Joint Ventures
and interpretation SIC 13 Jointly Controlled Entities – Non-Monetary Contributions by Venturers.
With IFRS 11, the previous right to choose the application of the proportionate consolidation
method for joint ventures has been eliminated. Such entities are henceforth to be included in
consolidated financial statements by using the equity method of accounting exclusively. The first-
time application of the new standard did not result in any changes. As of January 1, 2014 Elmos
did not include any entities in the consolidated financial statements by way of proportionate
consolidation (please also refer to note 33).
IFRS 12 – Disclosure of Interests in Other Entities
IFRS 12 was released in May 2011 and is subject to mandatory application for fiscal years beginning
on or after January 1, 2014. The standard governs consistent mandatory disclosures for group
accounting and consolidates disclosures for subsidiaries, formerly stipulated in IAS 27, disclosures
for joint arrangements and associates, previously regulated in IAS 31 and IAS 28 respectively, and
for structured entities. As the new standard establishes new requirements for the disclosure of
information in addition to previously effective mandatory disclosures, the Group's information
supplied on this group of entities has become more extensive.
The amendments to IFRS 10 – Consolidated Financial Statements, IFRS 12 – Disclosure of Interests
in Other Entities: Transition Guidance, and IAS 27 – Separate Financial Statements: Investment
Entities as well as the revised version of IAS 27 – Separate Financial Statements, all subject to
mandatory application for fiscal years beginning on or after January 1, 2014, had no effects on the
presentation of the Group’s financial, profit and economic situation.
IAS 28 – Investments in Associates and Joint Ventures (amended 2011)
The amended standard IAS 28 was issued in May 2011 and is subject to mandatory application
for fiscal years beginning on or after January 1, 2014. With the adoption of IFRS 11 and IFRS 12, the
scope of IAS 28 was expanded – in addition to associates – to application of the equity method
to joint ventures as well. For the effects we refer to our comment on IFRS 11 Joint Arrangements.
Amendment to IAS 32 – Offsetting Financial Assets and Financial Liabilities
The amendment to IAS 32 was released in December 2011 and is subject to mandatory application
for fiscal years beginning on or after January 1, 2014. The revision is intended to eliminate
existing inconsistencies by introducing enhanced guidance. However, the essential provisions
for offsetting financial instruments have been retained. The amendment did not affect the
accounting policies applied by the Group.
Amendment to IAS 36 – Recoverable Amount Disclosures for Non-Financial Assets
With the amended standard issued in May 2013, the mandatory disclosure is now limited, in line
with the original intention of the IASB, to cases where impairment or a reversal of impairment
loss was recorded in the current reporting period. In addition to that, mandatory disclosures are
defined in case that impairment or a reversal of impairment loss was recorded with respect to
an individual asset or cash-generating unit and the recoverable amount was determined at fair
value less cost to sell. The amendments are subject to retrospective application for fiscal years
beginning on or after January 1, 2014. As the recoverable amount is determined on the basis of
value in use in the Group, no additional disclosures resulted from this amendment for the notes.
Elmos Annual Report 2014
Elmos Annual Report 2014 | 81
Amendment to IAS 39 – Novation of Derivatives and Continuation of Hedge Accounting
In June 2013 the IASB released amendments to IAS 39 Financial Instruments. The revision makes
sure that a change of the contracting party of a hedging instrument to a central counterparty
as a consequence of legal or regulatory requirements does not bring about a termination of a
hedging relationship under certain conditions. The amendments are subject to retrospective
application for fiscal years beginning on or after January 1, 2014. This amendment did not have
any consequences for the Group.
Standards and interpretations voluntarily applicable in advance (EU Endorsement)
The IASB has released the following standards and interpretations which have already been
incorporated into EU law within the framework of the comitology procedure yet were not
subject to mandatory adoption application in fiscal year 2014 yet. The Group does not apply these
standards and interpretations in advance.
IFRIC 21 – Levies
With IFRIC 21 Levies, in May 2013 the IASB issued an interpretation of IAS 37 Provisions, Contingent
Liabilities and Contingent Assets. This interpretation governs the accounting treatment of
public levies that are not income taxes in accordance with IAS 12 and particularly clarifies the
circumstances under which an obligation to pay such levies must be recognized as a liability. The
interpretation is subject to application for fiscal years beginning on or after June 17, 2014; early
adoption is permitted. At present the Group expects the interpretation not to have a material
effect on the presentation of the consolidated financial statements.
Improvements to IFRS 2010-2012
The Improvements to IFRS 2010-2012 represent a collection of amendments released in December
2013, carrying amendments to several IFRS. It contains the following individual amendments:
-> IFRS 2: Specification of the definition of vesting conditions;
-> IFRS 3 and consequential amendment to IFRS 9: Clarification that an entity has to apply
IAS 32 if it classifies a contingent consideration within the scope of a business combination
as financial liability or equity. IFRS 9 is intended to be amended accordingly to assure that
contingent consideration cannot be recognized at amortized cost;
-> IFRS 8: Extension of mandatory disclosures by a description of combined business segments
and the economic indicators thus analyzed and clarification that a reconciliation of the total
amount of the assets of reportable segments to the assets of the entity must be presented
in the financial statements only if the chief operating decision maker is regularly informed
about the measurement of the assets of the business segments;
-> IFRS 13: Clarification of the option to measure current receivables and liabilities without
discounting despite consequential amendments to IFRS 9 and IAS 39;
-> IAS 16 / IAS 38: Calculation (or reconciliation) of accumulated depreciation/amortization in
applying the revaluation method;
-> IAS 24: Treatment of cases where key management functions are assumed by legal entities.
This collection of amendments is subject to mandatory application for fiscal years beginning on
or after February 1, 2015; early adoption is permitted. At present the Group cannot assess with
finality what effects first-time application of the collection of amendments will have.
Consolidated financial statements – Notes
82
Improvements to IFRS 2011-2013
The Improvements to IFRS 2011-2013 represent a collection of amendments released in December
2013, carrying amendments to several IFRS. It contains the following individual amendments:
-> IFRS 1: Clarification that a first-time IFRS adopter may choose to apply new, non-mandatory
IFRS if early adoption is permitted;
-> IFRS 3: Clarification that all kinds of joint agreements within the meaning of IFRS 11 Joint
Agreements are excluded from the scope of IFRS 3,
-> IFRS 13: Clarification that the portfolio exception of Paragraph 52 of IFRS 13 is applicable to all
agreements within the scope of IAS 39 Financial Instruments: Recognition and Measurement
or IFRS 9 Financial Instruments, regardless of whether or not such agreements meet the
definitions of financial assets or financial liabilities in accordance with IAS 32 Financial
Instruments: Presentation.
-> IAS 40: Clarification that IAS 40 and IFRS 3 are not mutually exclusive. The assessment if the
acquisition of investment property represents the acquisition of an asset or rather a group of
assets or a business combination in accordance with IFRS 3 Business Combinations must be
made on the basis of the provisions of IFRS 3.
This collection of amendments is subject to mandatory application for fiscal years beginning
on or after July 1, 2014; early adoption is permitted. At present the Group assumes that first-time
application of the collection of amendments will have no effects.
Amendment to IAS 19 – Employee Benefits: Employee Contributions
In November 2013 the IASB released narrow-scope amendments to IAS 19 Employee Benefits:
Employee Contributions. The amendments are applicable to the recognition of contributions
made by employees or third parties to defined benefit pension plans. It is permitted to recognize
employee or third-party contributions as a reduction of current service cost in the period in
which the corresponding service was provided if contributions are independent of the number of
years of service. The amendments to IAS 19 are subject to application for fiscal years beginning on
or after February 1, 2015; early adoption is permitted. These amendments will have no effect on
the consolidated financial statements.
Standards and interpretations not yet applicable in the EU (no EU endorsement yet)
The IASB has released the following standards and interpretations that were not subject to
mandatory application in fiscal year 2014 yet. These standards and interpretations have so far not
been endorsed by the EU and are therefore not adopted by the Group.
Amendments to IAS 16 – Property, Plant and Equipment and IAS 38 – Intangible Assets: Clarification of
Acceptable Methods of Depreciation and Amortization
In May 2014 the IASB released amendments to IAS 16 Property, Plant and Equipment and IAS
38 Intangible Assets. With these amendments the IASB makes further guidance available for
determining acceptable methods of depreciation and amortization. Accordingly sales-based
methods of depreciation and amortization are not appropriate for property, plant and equipment
and appropriate only in certain exceptional cases for intangible assets. The amendments are
subject to mandatory application for fiscal years beginning on or after January 1, 2016; early
adoption is permitted. Endorsement of the amendments by the EU is still pending. As the Group
does not apply any sales-based methods of depreciation and amortization, Group management
assumes the application of the amended standards will have no effects provided they will be
endorsed by the EU as released.
Elmos Annual Report 2014
Elmos Annual Report 2014 | 83
Amendments to IAS 16 – Property, Plant and Equipment and IAS 41 – Agriculture: Bearer Plants
In June 2014 the IASB released amendments to IAS 16 Property, Plant and Equipment and IAS 41
Agriculture: Bearer Plants. With these amendments bearer plants used only for the production of
agricultural produce have been included in the scope of IAS 16 so that they have to be accounted
for as items of property, plant and equipment. In order to exclude bearer plants from the scope
of IAS 41 and include them in the scope of IAS 16, thus enabling entities to account for them at
amortized cost or according to the revaluation model, the definition of a bearer plant is included in
both standards. The amendments are subject to mandatory application for fiscal years beginning
on or after January 1, 2016; early adoption is permitted. Endorsement of the amendments by the
EU is still pending. As the Group’ business model is not based on bearer plants, the amendments
are not expected to have any effects on the consolidated financial statements.
Amendment to IAS 27 – Separate Financial Statements: Equity Method in Separate Financial Statements
In August 2014 the IASB released amendments to IAS 27 Separate Financial Statements. With
these amendments the equity method is permitted again as an option for the accounting
treatment for investments in subsidiaries, joint ventures and associated companies in the
investor’s separate financial statements. The amendments are subject to mandatory application
for fiscal years beginning on or after January 1, 2016; early adoption is permitted. Endorsement
of the amendments by the EU is still pending. As the option for accounting treatment concerns
separate financial statements, the amendments will have no effects on the consolidated financial
statements.
Amendments to IAS 28 – Investments in Associates and Joint Ventures and IFRS 10 – Consolidated
Financial Statements: Sale or Contribution of Assets between an Investor and its Associate or Joint
Venture
In September 2014 the IASB released amendments to IFRS 10 Consolidated Financial Statements
and IAS 28 Investments in Associates and Joint Ventures. The amendments address a known
inconsistency between the two standards in the accounting treatment of a sale of an investor’s
assets to rather the contribution to the investor’s associate or joint venture. Insofar the transaction
involves a business within the meaning of IFRS 3, the investor has to account for the full gain or
loss; if the transaction involves only the sale of assets that do not constitute a business, only part
of the gain or loss has to be accounted for. The amendments are subject to mandatory application
for fiscal years beginning on or after January 1, 2016; early adoption is permitted. Endorsement
of the amendments by the EU is still pending. The Group cannot assess conclusively yet which
effects the first-time application of the amended standards might have provided they will be
endorsed by the EU as released.
IFRS 9 – Financial Instruments
IFRS 9 Financial Instruments contains requirements for measurement, recognition and
derecognition as well as for the accounting treatment of hedges. The IASB released the final
version of the standard within the framework of the completion of the various stages of its
elaborate project on financial instruments on July 24, 2014. Thus the accounting treatment of
financial instruments previously governed by IAS 39 Financial Instruments: Recognition and
Measurement has now been superseded entirely by accounting treatment according to IFRS. This
new release of IFRS 9 supersedes all previous versions. The key requirements of the finalized IFRS
9 can be summarized as follows:
-> The requirements of IFRS 9 with respect to scope and recognition and derecognition are
largely unchanged compared to the predecessor standard IAS 39.
-> However, compared to IAS 39 the provisions of IFRS 9 do provide for a new classification
model for financial assets.
-> Subsequent measurement of financial assets is now aligned with three categories, providing
different principles of valuation and different recognition of changes in value. The
categorization depends both on the contractual cash flows of the instrument as well as on
the business model according to which the instrument is held. The categories are therefore
mandatory as a general rule. However, a few options are available to entities beyond that.
Consolidated financial statements – Notes
84
-> Existing provisions for financial liabilities have for the most part been adopted by IFRS 9.
The only new material provision concerns financial liabilities under the fair value option.
For those fluctuations in fair value due to changes in their own contingency risk have to be
recognized in other income.
-> IFRS 9 now provides for three levels that determine the amount of losses and collected
interest to be recognized. Upon addition expected losses in the amount of the cash value of an
expected 12-month credit loss have to be recognized (level 1). If there is a significant increase
in contingency loss, provision for risk has to be increased up to the amount of the losses
expected for the entire remaining term (level 2). Upon objective indication of impairment,
the collection of interest has to be made on the basis of the net book value (book value less
provision for risk) (level 3).
-> Apart from extensive transitional provisions, IFRS 9 is also linked to comprehensive disclosure
provisions both in the transition period and in ongoing application. New requirements
compared to IFRS 7 Financial Instruments: Disclosures primarily result from new impairment
regulation.
The final IFRS 9 standard is subject to mandatory application for fiscal years beginning on or after
January 1, 2018; early adoption is permitted. Endorsement of the amendments by the EU is still
pending. The Group assumes that future application of IFRS 9 might affect the reporting of the
Group’s financial assets and financial liabilities. However, a reliable assessment of the effects of
the application of IFRS 9 can only be made once a detailed analysis has been conducted.
Amendments to IFRS 11 – Joint Arrangements: Accounting for Acquisitions of Interests in Joint
Operations
In May 2014 the IASB released amendments to IFRS 11 Joint Arrangements. They clarify that the
initial acquisition as well as the subsequent acquisition of interests in joint operations that
constitute a business have to be accounted for in application of the provisions for the accounting
treatment of business combinations under IFRS 3 unless these provisions contradict the
provisions under IFRS 11. The disclosure requirements under IFRS 3 must be fulfilled as well. The
amendments are subject to mandatory application for fiscal years beginning on or after January
1, 2016; early adoption is permitted. Endorsement of the amendments by the EU is still pending.
Group management currently assumes that the application of the amended standard will have
no effects provided they will be endorsed by the EU as released.
IFRS 14 – Regulatory Deferral Accounts
In January 2014 the IASB released the new standard IFRS 14 Regulatory Deferral Accounts. This
standard aims at allowing entities that are first-time IFRS adopters and have so far recognized
regulatory deferral accounts according to their previous financial reporting provisions to
continue to do so after adopting IFRS. As the Group is not a first-time IFRS adopter, this standard
has no relevance to the Group.
IFRS 15 – Revenue from Contracts with Customers
In May 2014 the IASB released the new standard IFRS 15 Revenue from Contracts with Customers.
The new standard for the recognition of revenue aims at harmonizing the large number
of provisions previously contained in various standards and interpretations. At the same
time consistent basic principles are determined, applicable for all industries and all kinds of
sales transactions. The questions to what amount and at what time or over what time period
revenue has to be recognized are to be answered with the help of a 5-stage model. Apart from
that, the standard includes a number of other provisions on questions of detail as well as an
extension of the disclosures required for the notes. The new standard is subject to mandatory
application for fiscal years beginning on or after January 1, 2017. Generally adoption has to take
place retrospectively; however, various options for simplification are granted. Early adoption is
Elmos Annual Report 2014
Elmos Annual Report 2014 | 85
permitted. Endorsement of the standard by the EU is still pending. Group management currently
assesses the potential effects of the first-time application of the standard provided it will be
endorsed by the EU as released.
Amendments to IFRS 10, IFRS 12 and IAS 28: Investment Entities: Applying the Consolidation Exception
In the collection of amendments on the new consolidation exception for investment entities now
released, the following clarifications are framed
-> Exception to the preparation of consolidated financial statements: The amendments clarify
that an entity may apply the consolidation exception even if its parent accounts for its
subsidiaries at fair value in accordance with IFRS 10.
-> A subsidiary that renders services linked to the investment activity of the parent does not
have to be consolidated if the subsidiary is also an investment entity.
-> Upon application of the equity method to an associate or a joint venture that is an investment
entity, an investor that is not an investment entity may maintain the measurement at fair
value applied by the holding company to its investments in subsidiaries.
-> Required disclosures: An investment entity that measures all its subsidiaries at fair value has
to provide the disclosures with respect to investment entities as stipulated by IFRS 12.
The amendments are subject to mandatory application for fiscal years beginning on or after
January 1, 2016; early adoption is permitted. Endorsement of the amendments by the EU is still
pending. The amendments will have no effects on the consolidated financial statements of Elmos
Semiconductor AG.
Amendment to IAS 1 – Presentation of Financial Statements: Disclosure Initiative
In December 2014 the IASB released amendments to IAS 1 aimed at eliminating obstacles
perceived by reporting entities with respect to the exercise of judgments regarding the
presentation of financial statements. The amendments to IAS 1 contain the following changes or
clarifications:
-> Materiality: The amendments clarify that (1) information should not be obscured by
aggregation, (2) considerations of materiality have to be applied to all components of the
financial statements, and (3) materiality has to be considered even if a standard stipulates a
certain disclosure.
-> Presentation of assets and liabilities and presentation in the income statement or in other
comprehensive income: The IASB clarifies that (1) the list of line items for the statements can
be aggregated and disaggregated for considerations of relevance and provides additional
guidance with respect to subtotals in the statements; the IASB clarifies that (2) the share
of an entity in other comprehensive income of associates or joint ventures accounted for at
equity should be disclosed in aggregate as single line items on the basis of whether or not it
will later be reclassified to profit or loss in the income statement.
-> Disclosures: Additional examples for the potential sequences of disclosures are included in
order to clarify that comprehensibility and comparability should be considered in determining
the order of the notes and that notes do not have to be made in the order shown at present in
IAS 1.114. The IASB has also eliminated provisions and examples with respect to identifying
the significant accounting policies and valuation methods regarded as potentially not that
helpful.
Consolidated financial statements – Notes
86
The amendments are subject to mandatory application for fiscal years beginning on or after
January 1, 2016; early adoption is permitted. Endorsement of the amendments by the EU is still
pending. Group management currently assesses the potential effects of the first-time application
of the amended standard provided it will be endorsed by the EU as released.
Improvements to IFRS 2012-2014
The Improvements to IFRS 2012-2014 represent an annual collection of amendments released in
September 2014, carrying amendments to four standards:
-> IFRS 5: Inclusion of specific guidance for cases in which an entity reclassifies an asset from
“held for sale” to “held for distribution” or vice versa and cases in which held-for-distribution
accounting is discontinued.
-> IFRS 7: Inclusion of additional guidance to clarify whether a servicing contract is continuing
involvement in a transferred asset; clarification of the applicability of the amendments to
IFRS 7 on offsetting disclosures to condensed interim financial statements.
-> IAS 19: Clarification that high-quality corporate bonds used for determining the discount rate
for post-employment benefits should be denominated in the same currency as the benefits to
be paid so that the depth of the market for high-quality corporate bonds should be assessed
at currency level.
-> IAS 34: Clarification of the meaning of the phrase “elsewhere in the interim report” and
inclusion of a requirement for a cross-reference to that other place unless it is within the
main part of the report.
The amendments are subject to mandatory application for fiscal years beginning on or after
January 1, 2016, providing for prospective or retrospective application depending on the respective
amendment. Early adoption is permitted. Endorsement of the collection of amendments by the
EU is still pending. Group management currently assumes that the application of this collection
of amendments will have no effects provided it will be endorsed by the EU as released.
2 – Principles of consolidation
Basis of consolidation and consolidation methods
In addition to Elmos Semiconductor AG, the consolidated financial statements prepared for fiscal
year 2014 include all entities whose voting rights Elmos has the direct or indirect majority of,
or based on other rights in cases of control over the entity as defined by IFRS 10 Consolidated
Financial Statements. Capital consolidation is based on the purchase method: The investments’
acquisition values are set off against the proportionate balance of assets and liabilities acquired
at their respective time values. As of the acquisition date, identifiable assets and liabilities are
fully accounted for at their respective fair values. The balance of a remaining asset difference is
stated as goodwill.
The separate financial statements of the entities included in the Elmos consolidated financial
statements are stated in correspondence to the reporting date of the consolidated financial
statements.
All material receivables and liabilities as well as transactions between the consolidated entities
have been eliminated in the consolidated financial statements.
A list of the subsidiaries included in the consolidated financial statements can be found under
note 33.
Foreign currency translation and foreign currency transactions
The functional currency of Elmos Semiconductor AG and its European subsidiaries is the Euro.
The consolidated financial statements have been prepared in Euro.
Elmos Annual Report 2014
Elmos Annual Report 2014 | 87
Assets and liabilities denominated in foreign currencies are generally translated at the closing
exchange rate as of the reporting date.
With regard to subsidiaries whose functional currency is the national currency of the respective
country in which the subsidiary keeps its registered office, assets and liabilities stated in foreign
currency in the statements of financial position of the economically independent international
subsidiaries are translated into Euro at the closing exchange rates as of the respective reporting
dates. Income and expense items are translated at average exchange rates over the underlying
period. Differences resulting from the valuation of equity at historical rates and closing rates as
of the end of the reporting period are recognized outside profit or loss as changes in equity under
other equity components.
The Company occasionally enters into forward exchange contracts and option transactions to
hedge foreign currency transactions for periods consistent with committed exposures. These
hedging activities reduce the impact of foreign exchange rate fluctuations on the Company’s
profitability. The Company is not involved in speculative transactions. For the realized and
unrealized exchange rate gains and losses from currency hedges during fiscal year 2014, please
refer to note 30.
Statement of cash flows
The cash flow statement shows how cash and cash equivalents have changed in the course of the
fiscal year by inflows and outflows of funds. The effects of acquisitions and divestitures as well
as other changes of the basis of consolidation have been taken into consideration. In accordance
with IAS 7, the statement distinguishes between cash flows from operating activities, investing
activities, and financing activities. Finance expenses and finance income recognized in the
consolidated income statement essentially correspond to the amounts paid.
3 – accounting and valuation principles
Sales
The Company generates sales by selling ASICs, ASSPs, and micromechanical sensor elements,
as well as by their development. Sales are stated net of sales tax and after deduction of any
discounts given.
Sales are realized either at the time that products are shipped to the customer or at the time
the risk of loss passes to the customer. Within the framework of consignment warehousing
agreements, sales are realized either at the time of acceptance by the customer or at the time the
consignment warehouse is stocked up, depending on the time of the passing of risk. Sales from
development activities are realized upon reaching predefined so-called milestones, depending on
the degree of the project’s completion.
Goodwill
Goodwill from business acquisitions is not amortized but reviewed for recoverability at least
once a year. In addition, an impairment test is made if special events or market developments
indicate that the fair value of a reporting unit might have fallen below its book value. As of the
acquisition date, the acquired goodwill is allocated to the cash-generating unit (CGU) expected to
benefit from the business combination’s synergy effects.
Impairment is identified by determining the recoverable amount of the CGU the goodwill is
allocated to. If the recoverable amount of the CGU is below its book value, the impairment of
goodwill needs to be recognized. The recoverable amount is the higher of the two amounts of fair
value less cost to sell and value in use.
Consolidated financial statements – Notes
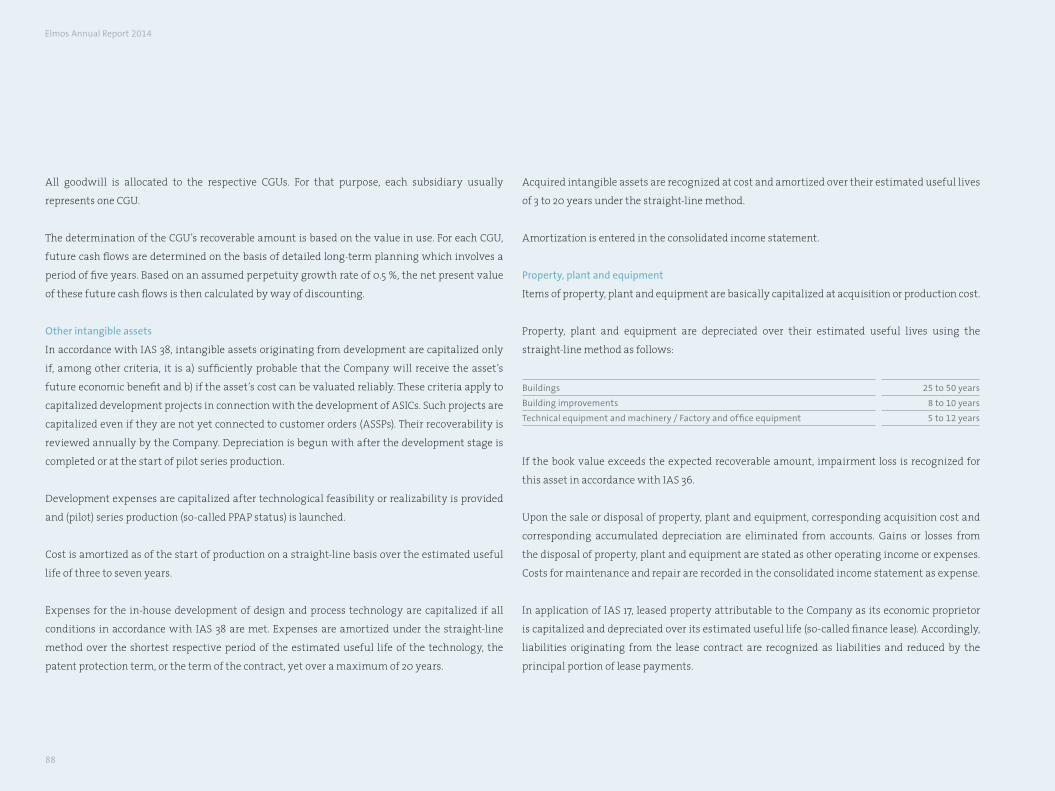
88
All goodwill is allocated to the respective CGUs. For that purpose, each subsidiary usually
represents one CGU.
The determination of the CGU’s recoverable amount is based on the value in use. For each CGU,
future cash flows are determined on the basis of detailed long-term planning which involves a
period of five years. Based on an assumed perpetuity growth rate of 0.5 %, the net present value
of these future cash flows is then calculated by way of discounting.
Other intangible assets
In accordance with IAS 38, intangible assets originating from development are capitalized only
if, among other criteria, it is a) sufficiently probable that the Company will receive the asset’s
future economic benefit and b) if the asset’s cost can be valuated reliably. These criteria apply to
capitalized development projects in connection with the development of ASICs. Such projects are
capitalized even if they are not yet connected to customer orders (ASSPs). Their recoverability is
reviewed annually by the Company. Depreciation is begun with after the development stage is
completed or at the start of pilot series production.
Development expenses are capitalized after technological feasibility or realizability is provided
and (pilot) series production (so-called PPAP status) is launched.
Cost is amortized as of the start of production on a straight-line basis over the estimated useful
life of three to seven years.
Expenses for the in-house development of design and process technology are capitalized if all
conditions in accordance with IAS 38 are met. Expenses are amortized under the straight-line
method over the shortest respective period of the estimated useful life of the technology, the
patent protection term, or the term of the contract, yet over a maximum of 20 years.
Acquired intangible assets are recognized at cost and amortized over their estimated useful lives
of 3 to 20 years under the straight-line method.
Amortization is entered in the consolidated income statement.
Property, plant and equipment
Items of property, plant and equipment are basically capitalized at acquisition or production cost.
Property, plant and equipment are depreciated over their estimated useful lives using the
straight-line method as follows:
Buildings 25 to 50 years
Building improvements 8 to 10 years
Technical equipment and machinery / Factory and office equipment 5 to 12 years
If the book value exceeds the expected recoverable amount, impairment loss is recognized for
this asset in accordance with IAS 36.
Upon the sale or disposal of property, plant and equipment, corresponding acquisition cost and
corresponding accumulated depreciation are eliminated from accounts. Gains or losses from
the disposal of property, plant and equipment are stated as other operating income or expenses.
Costs for maintenance and repair are recorded in the consolidated income statement as expense.
In application of IAS 17, leased property attributable to the Company as its economic proprietor
is capitalized and depreciated over its estimated useful life (so-called finance lease). Accordingly,
liabilities originating from the lease contract are recognized as liabilities and reduced by the
principal portion of lease payments.
Elmos Annual Report 2014
Elmos Annual Report 2014 | 89
Other lease agreements the Company has entered into are considered operating leases. Lease
payments made are recognized in the consolidated income statement using the straight-line
method over the contract terms.
Investments
Investments represent interests in entities over which Elmos has neither control nor significant
influence. Investments for which there is a quoted market price are classified as “available for
sale” and measured at that price. Investments for which there is no active market are classified as
“available for sale” and measured at amortized cost. Insofar as there is no active market for those
entities, it is assumed that the book value equals the market value.
Financial instruments
According to IAS 39, a financial instrument is a contract that leads to the origination of a financial
asset for one entity and to the origination of a financial liability or an equity instrument for
another entity at the same time.
Financial instruments are recognized according to IAS 39.14 as of the time the Company becomes
the financial instrument’s contracting party. Regular purchase and sale transactions are entered
as of settlement date. Financial instruments are classified in accordance with IAS 39 in the
following categories:
-> Financial assets held for trading
-> Financial assets held to final maturity
-> Loans and receivables granted by the Company
-> Available-for-sale financial assets
-> Financial liabilities measured at amortized cost, and
-> Financial liabilities measured at fair value through profit or loss.
The financial instruments accounted for include liquid assets, securities, trade receivables, trade
payables, forward loans including corresponding interest swap transactions (cash flow hedges),
forward exchange contracts, and other outside financing.
Financial assets
Financial assets with determined or determinable payments and fixed terms which the Company
is willing and able to hold to final maturity are classified as held-to-maturity financial assets,
with the exception of loans and receivables granted by the Company. Financial assets acquired
primarily to gain profits from short-term price fluctuations are classified as financial assets held
for trading. All other financial assets except for loans and receivables granted by the Company
are classified as available-for-sale financial assets.
Held-to-maturity financial assets are accounted for under non-current assets unless they mature
within twelve months of the reporting date. Financial assets held for trading are regarded as
current assets. Available-for-sale financial assets are regarded as non-current or current assets,
depending on their remaining term to maturity. If they are intended to be sold within twelve
months of the reporting date, they are categorized as current assets.
Upon their first-time recognition, financial assets are measured at fair value corresponding to the
time value attributable to the consideration received. With respect to financial assets classified
at fair value outside profit or loss, transaction costs directly attributable to the asset’s acquisition
are also taken into account. Subsequent measurement of financial assets depends on their
classification:
Consolidated financial statements – Notes
90
Available-for-sale financial assets and financial assets held for trading are subsequently
measured at fair value without deduction of any transaction costs incurred and under disclosure
of their listed market prices as of the reporting date.
Gains and losses from the measurement of available-for-sale financial assets at fair value are
recognized directly under other equity components until the financial asset is sold, collected,
or otherwise disposed of, or until the financial asset’s impairment is determined so that the
accumulated gains or losses previously recognized in equity are included in income/loss for the
period at that point in time.
Changes in fair value of financial assets held for trading are recognized in the financial result
insofar as there is a direct connection to the Company’s financing or its financial investments.
Held-to-maturity financial assets are measured at amortized cost using the effective interest
method.
Financial liabilities
Financial liabilities generally constitute a claim for return in cash or in the shape of another
financial asset. This category particularly includes trade payables, financial liabilities, and other
liabilities.
After their first-time recognition, financial liabilities are measured at amortized cost using
the effective interest method. Financial liabilities measured at fair value through profit or loss
include financial liabilities held for trading. Derivatives are classified as held for trading unless
they are designated as hedging instruments and are effective as such. Gains or losses from
financial liabilities held for trading or from liabilities for which the fair value option has been
exercised are recognized in profit or loss.
Upon their first-time recognition, financial instruments are classified either as assets, liabilities,
or equity, depending on the contractual agreement’s economic matter.
Interest, dividends, and gains and losses in connection with financial instruments classified as
financial liabilities are recognized as expenses or income in the consolidated income statement
for the period in which they incur. Dividend payments to owners of financial instruments
classified as equity are deducted directly from equity.
The Company has so far made no use of the option to designate financial assets and financial
liabilities as financial assets and liabilities at fair value through profit or loss upon their first-time
recognition.
Upon their first-time recognition, put options written on non-controlling interests are recorded
as financial liabilities at the cash value of their repurchase amounts in accordance with IAS 32.23.
Such financial liabilities are measured in accordance with IAS 39 and any changes resulting from
subsequent measurement are recognized in profit or loss.
Financial guarantee contracts issued by the Group are contracts that commit to payments
in compensation of a loss incurred by the guarantee holder because a specific debtor has not
fulfilled his payment obligations on the due date according to the terms and conditions of a debt
Elmos Annual Report 2014
Elmos Annual Report 2014 | 91
instrument. Upon first-time recognition, financial guarantee contracts are recognized as liabilities
at fair value less transaction costs directly linked to the contract’s issuance. Subsequently the
liability is measured at the best possible estimate of expenses required for the fulfillment of the
obligation as of the reporting date or the higher stated amount less accumulated amortization.
Derivative financial instruments
Elmos makes use of derivative financial instruments exclusively for hedging interest rate risks.
On concluding hedges, certain derivatives are assigned to certain hedged items. The conditions
stipulated by IAS 39 for the qualification of transactions as hedges are met at all times.
Insofar as derivative financial instruments utilized are effective hedges within the framework
of a hedging relationship in accordance with IAS 39 (cash flow hedges), changes in fair value do
not have an effect on the income for the period during the term of the derivative. Changes in fair
value are recognized in equity outside profit or loss. The amortized value in equity is considered
in income for the period as profit or loss upon maturity of the hedged cash flow.
The fair value generally corresponds to the market or stock market price. If there is no active
market, the fair value is determined on the basis of established valuation models.
The hedging strategy pursued by the Elmos Group is to exclusively enter into effective derivatives
for hedging interest rate risks. The conditions defined by IAS 39 as required for the accounting
treatment as hedging transactions were met upon conclusion of the hedging instruments as well
as at the reporting date.
Elmos also makes use of derivative financial instruments such as foreign exchange option and
forward exchange transactions in order to hedge against currency risk.
According to IAS 39, such derivative financial instruments are to be assigned to the category “at
fair value through profit or loss” and to be accounted for at fair value, regardless of the purpose
or intention for which they have been concluded. Changes in fair value of derivative financial
instruments are recognized in profit or loss.
Inventories
Inventories are measured at acquisition or production cost or at the lower net recoverable value
as of the reporting date. In addition to directly attributable cost, production cost also includes
manufacturing cost and overhead as well as amortization. Overhead costs are recognized as fixed
amounts on the basis of the production facilities’ usual utilization. Costs of unused production
capacity (idle capacity costs) are disclosed in the consolidated income statement under cost of
sales. Inventory allowances are made insofar as acquisition or production cost exceeds the
expected recoverable net sales proceeds.
Trade receivables
Trade receivables as well as other receivables are generally recognized at face value in
consideration of adequate allowances.
The valuation allowance for bad debt comprises to a considerable degree estimates and
assessments of individual receivables based on the respective customer’s creditworthiness,
current economic developments, and the analysis of historical bad debt loss on portfolio basis.
Cash and cash equivalents (liquid assets)
Liquid assets comprise cash on hand, checks, and cash in banks.
Consolidated financial statements – Notes
92
Non-current available-for-sale assets
An asset is to be classified as available for sale if the corresponding book value is realized
primarily by a sale transaction and not by continued use.
Provisions
Provisions are made for legal or factual obligations with historical origins if it is probable that the
sufficiently reliable fulfillment of the obligation will lead to an outflow of the Group’s resources
and if a reliable estimate of the amount of the obligation can be made.
Recurring net pension expenses according to IAS 19 are made up of different components,
reflecting different aspects of the Company’s financial agreements as well as the expense for
the benefits received by the employees. These components are determined by using the actuarial
cost method on the basis of actuarial assumptions as stated under note 24.
The accounting principles provide that:
-> All benefit improvements the Company is committed to as of the current valuation date are
reflected in the planned benefit obligation, and
-> actuarial gains and losses are directly recognized outside profit or loss in other comprehensive
income.
Adequate provisions for warranty are made in individual cases upon risk assessment with respect
to sales-oriented and legal consequences.
Income tax
Current tax assets and tax liabilities for the current period and previous periods are measured
at the amounts expected for tax refunds to be received from the tax authorities or tax payments
to be made to the tax authorities. The calculation of these amounts is based on the tax rates and
tax laws in effect as of the reporting date in those countries where the Group has operations and
generates taxable income.
Deferred taxes are determined using the liability method. Deferred income taxes reflect the
net tax expense/income of temporary differences between the carrying amounts of assets and
liabilities in the statement of financial position and their respective tax values. The calculation of
deferred tax assets and liabilities is carried out on the basis of the tax rates expected as applicable
for the period in which an asset is realized or a debt is repaid. The measurement of deferred tax
assets and liabilities considers the tax effects resulting from the way an entity expects to realize
its assets’ carrying amounts or repay its debts as of the reporting date.
Deferred tax assets and liabilities are recognized regardless of the point in time at which the
temporary accounting differences are expected to reverse. Deferred tax assets and liabilities are
not discounted and they are included in the statement of financial position as non-current assets
or non-current liabilities.
A deferred tax asset is recognized for all deductible temporary differences to the extent it is
probable that taxable income will be available against which the temporary difference can be
offset. As of each reporting date, the Company assesses deferred tax assets not accounted for
anew. The Company recognizes a deferred tax asset previously unaccounted for to the extent it
has become probable that future taxable income will allow the deferred tax asset’s realization.
Elmos Annual Report 2014
Elmos Annual Report 2014 | 93
In the opposite case, the deferred tax asset’s book value is reduced to the extent it appears no
longer probable that there will be sufficient taxable income in order to make use of the benefit of
the deferred tax asset – either in its entirety or in part.
Current taxes and deferred taxes are charged or credited directly to equity if the tax relates to
items credited or charged directly to equity in the same period or in another period.
No deferred tax liabilities incur to the extent that non-distributed profits of foreign investments
are to remain invested in that entity for an incalculable period of time. Deferred tax liabilities
are recognized for all taxable temporary differences insofar as the deferred tax liability does not
result from goodwill which does not allow for amortization for tax purposes.
Deferred tax assets also include tax relief claims resulting from the expected utilization of loss
carry-forwards and tax credits in the following years insofar as their realization appears assured
with sufficient reliability.
Deferred tax is determined on the basis of the tax rates in effect at or expected for the time of
realization according to the respective countries’ current legal situation.
Sales tax
Income, expenses, and assets are recognized net of sales tax. Exceptions are the following cases:
-> If the sales tax incurred upon the acquisition of assets or the claiming of services cannot be
reclaimed from the tax authorities by way of refund, the sales tax is recognized as part of the
asset’s production cost or as part of the expenses.
-> Receivables and liabilities are recognized including sales tax.
The sales tax amount to be refunded by or paid to the tax authorities is recognized in the
statement of financial position under receivables or liabilities respectively.
Government grants
Subsidies or government grants are accounted for if it is sufficiently assured that the grants are
given and that the Company fulfills the corresponding conditions. Grants linked to expenses
are recognized on schedule as income over the period that is required to offset them against the
corresponding expenses they are meant to compensate. Grants for an asset are recognized in the
statement of financial position as reduction of acquisition cost. More details can be found under
note 31.
Borrowing costs
Borrowing costs directly attributable to an asset’s acquisition, construction, or manufacture and
for which a considerable period of time is required to put it into the intended state for use or
sale are capitalized as part of the respective asset’s acquisition or production cost with respect
to all qualified assets the construction or manufacture of which has been started on or after
January 1, 2009. All other borrowing costs are stated as expense in the period in which they
incur. Borrowing costs are interest expense and other costs an entity incurs in connection with
borrowing outside capital. The Group continues to recognize borrowing costs connected to
projects started before January 1, 2009 as expenses.
Consolidated financial statements – Notes
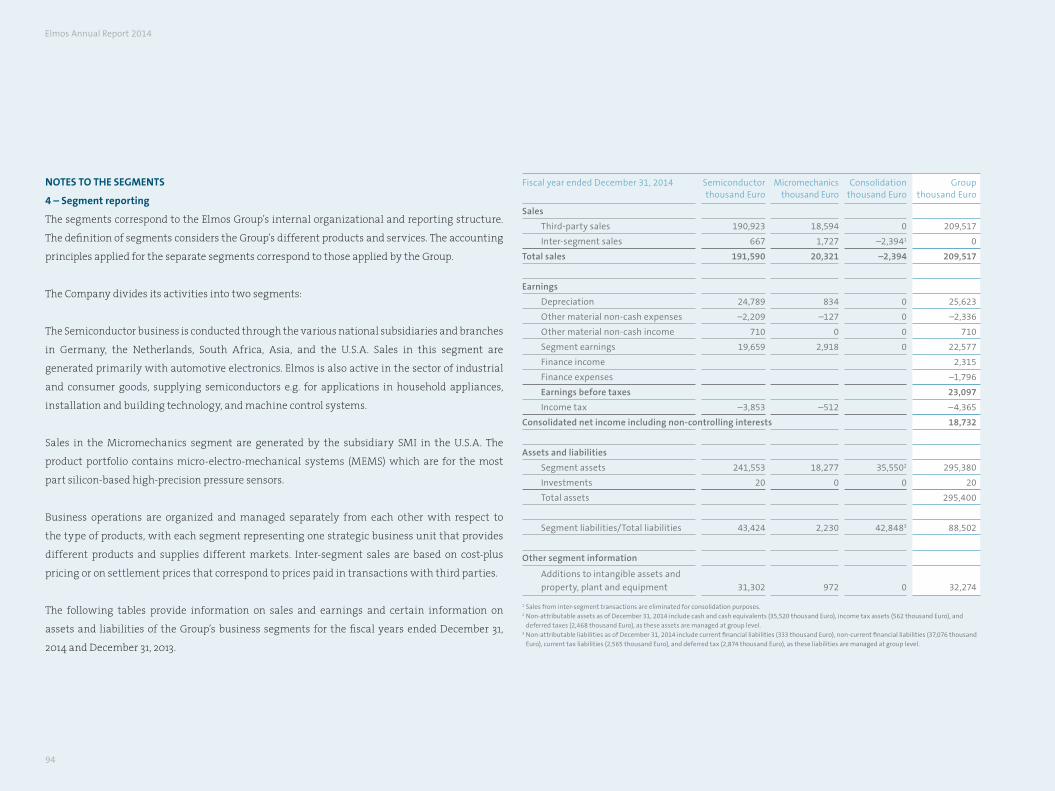
94
noteS to tHe SeGmentS
4 – Segment reporting
The segments correspond to the Elmos Group’s internal organizational and reporting structure.
The definition of segments considers the Group’s different products and services. The accounting
principles applied for the separate segments correspond to those applied by the Group.
The Company divides its activities into two segments:
The Semiconductor business is conducted through the various national subsidiaries and branches
in Germany, the Netherlands, South Africa, Asia, and the U.S.A. Sales in this segment are
generated primarily with automotive electronics. Elmos is also active in the sector of industrial
and consumer goods, supplying semiconductors e.g. for applications in household appliances,
installation and building technology, and machine control systems.
Sales in the Micromechanics segment are generated by the subsidiary SMI in the U.S.A. The
product portfolio contains micro-electro-mechanical systems (MEMS) which are for the most
part silicon-based high-precision pressure sensors.
Business operations are organized and managed separately from each other with respect to
the type of products, with each segment representing one strategic business unit that provides
different products and supplies different markets. Inter-segment sales are based on cost-plus
pricing or on settlement prices that correspond to prices paid in transactions with third parties.
The following tables provide information on sales and earnings and certain information on
assets and liabilities of the Group’s business segments for the fiscal years ended December 31,
2014 and December 31, 2013.
Fiscal year ended December 31, 2014 Semiconductor thousand Euro
Micromechanicsthousand Euro
Consolidation thousand Euro
Groupthousand Euro
Sales
Third-party sales 190,923 18,594 0 209,517
Inter-segment sales 667 1,727 –2,3941 0
Total sales 191,590 20,321 –2,394 209,517
Earnings
Depreciation 24,789 834 0 25,623
Other material non-cash expenses –2,209 –127 0 –2,336
Other material non-cash income 710 0 0 710
Segment earnings 19,659 2,918 0 22,577
Finance income 2,315
Finance expenses –1,796
Earnings before taxes 23,097
Income tax –3,853 –512 –4,365
Consolidated net income including non-controlling interests 18,732
Assets and liabilities
Segment assets 241,553 18,277 35,5502 295,380
Investments 20 0 0 20
Total assets 295,400
Segment liabilities/Total liabilities 43,424 2,230 42,8483 88,502
Other segment information
Additions to intangible assets and
property, plant and equipment 31,302 972 0 32,274
1 Sales from inter-segment transactions are eliminated for consolidation purposes.2 Non-attributable assets as of December 31, 2014 include cash and cash equivalents (35,520 thousand Euro), income tax assets (562 thousand Euro), and
deferred taxes (2,468 thousand Euro), as these assets are managed at group level.3 Non-attributable liabilities as of December 31, 2014 include current financial liabilities (333 thousand Euro), non-current financial liabilities (37,076 thousand
Euro), current tax liabilities (2,565 thousand Euro), and deferred tax (2,874 thousand Euro), as these liabilities are managed at group level.
Elmos Annual Report 2014
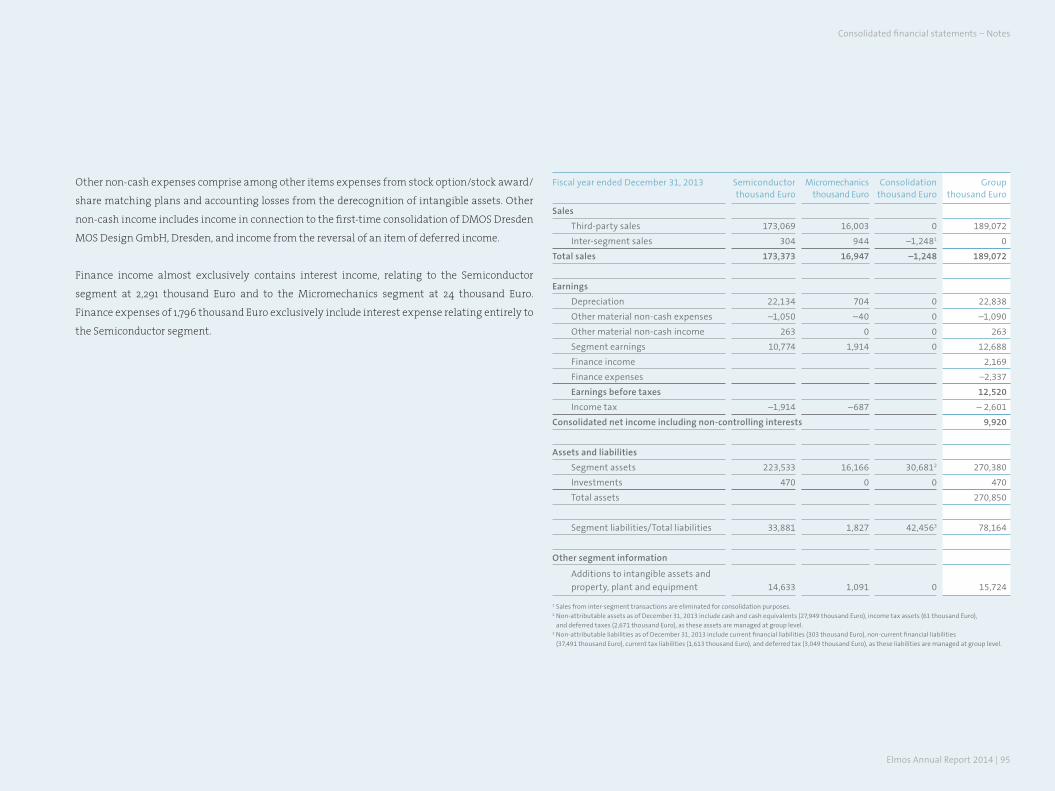
Elmos Annual Report 2014 | 95
Other non-cash expenses comprise among other items expenses from stock option/stock award/
share matching plans and accounting losses from the derecognition of intangible assets. Other
non-cash income includes income in connection to the first-time consolidation of DMOS Dresden
MOS Design GmbH, Dresden, and income from the reversal of an item of deferred income.
Finance income almost exclusively contains interest income, relating to the Semiconductor
segment at 2,291 thousand Euro and to the Micromechanics segment at 24 thousand Euro.
Finance expenses of 1,796 thousand Euro exclusively include interest expense relating entirely to
the Semiconductor segment.
Fiscal year ended December 31, 2013 Semiconductor thousand Euro
Micromechanicsthousand Euro
Consolidationthousand Euro
Groupthousand Euro
Sales
Third-party sales 173,069 16,003 0 189,072
Inter-segment sales 304 944 –1,2481 0
Total sales 173,373 16,947 –1,248 189,072
Earnings
Depreciation 22,134 704 0 22,838
Other material non-cash expenses –1,050 –40 0 –1,090
Other material non-cash income 263 0 0 263
Segment earnings 10,774 1,914 0 12,688
Finance income 2,169
Finance expenses –2,337
Earnings before taxes 12,520
Income tax –1,914 –687 – 2,601
Consolidated net income including non-controlling interests 9,920
Assets and liabilities
Segment assets 223,533 16,166 30,6812 270,380
Investments 470 0 0 470
Total assets 270,850
Segment liabilities/Total liabilities 33,881 1,827 42,4563 78,164
Other segment information
Additions to intangible assets and
property, plant and equipment 14,633 1,091 0 15,724
1 Sales from inter-segment transactions are eliminated for consolidation purposes.2 Non-attributable assets as of December 31, 2013 include cash and cash equivalents (27,949 thousand Euro), income tax assets (61 thousand Euro), and deferred taxes (2,671 thousand Euro), as these assets are managed at group level.3 Non-attributable liabilities as of December 31, 2013 include current financial liabilities (303 thousand Euro), non-current financial liabilities (37,491 thousand Euro), current tax liabilities (1,613 thousand Euro), and deferred tax (3,049 thousand Euro), as these liabilities are managed at group level.
Consolidated financial statements – Notes
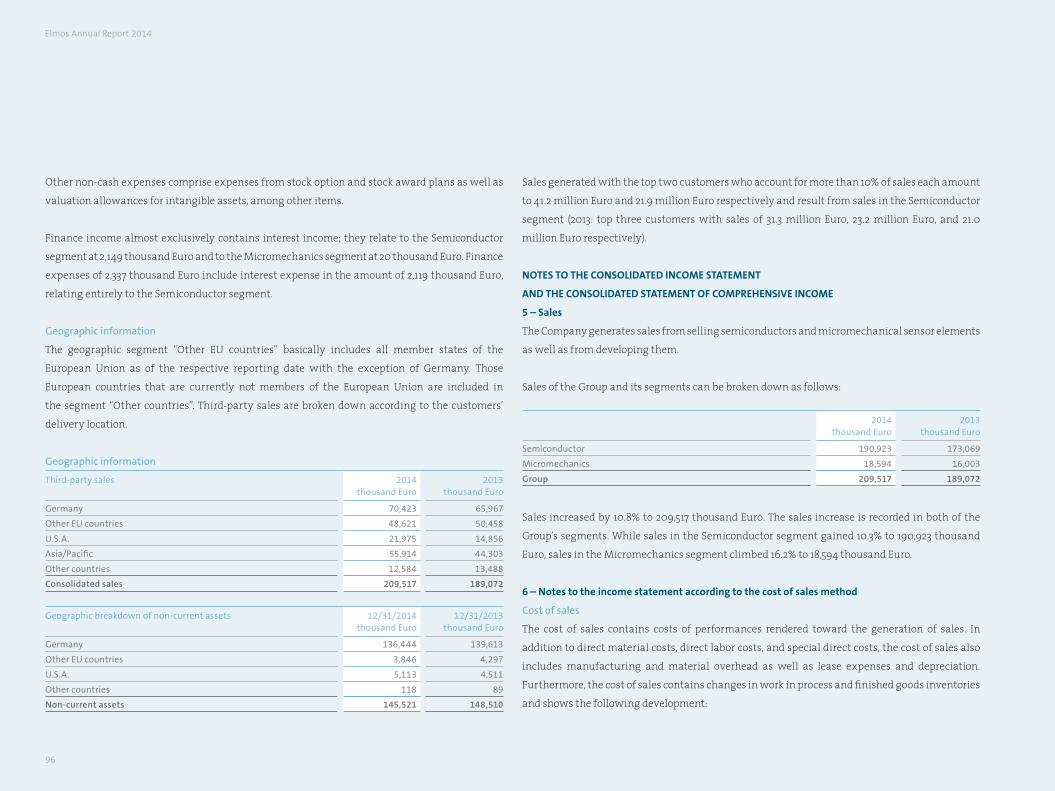
96
Other non-cash expenses comprise expenses from stock option and stock award plans as well as
valuation allowances for intangible assets, among other items.
Finance income almost exclusively contains interest income; they relate to the Semiconductor
segment at 2,149 thousand Euro and to the Micromechanics segment at 20 thousand Euro. Finance
expenses of 2,337 thousand Euro include interest expense in the amount of 2,119 thousand Euro,
relating entirely to the Semiconductor segment.
Geographic information
The geographic segment “Other EU countries” basically includes all member states of the
European Union as of the respective reporting date with the exception of Germany. Those
European countries that are currently not members of the European Union are included in
the segment “Other countries”. Third-party sales are broken down according to the customers’
delivery location.
Geographic information
Third-party sales 2014thousand Euro
2013thousand Euro
Germany 70,423 65,967
Other EU countries 48,621 50,458
U.S.A. 21,975 14,856
Asia/Pacific 55,914 44,303
Other countries 12,584 13,488
Consolidated sales 209,517 189,072
Geographic breakdown of non-current assets 12/31/2014thousand Euro
12/31/2013thousand Euro
Germany 136,444 139,613
Other EU countries 3,846 4,297
U.S.A. 5,113 4,511
Other countries 118 89
Non-current assets 145,521 148,510
Sales generated with the top two customers who account for more than 10% of sales each amount
to 41.2 million Euro and 21.9 million Euro respectively and result from sales in the Semiconductor
segment (2013: top three customers with sales of 31.3 million Euro, 23.2 million Euro, and 21.0
million Euro respectively).
noteS to tHe ConSoliDateD inCome Statement
anD tHe ConSoliDateD Statement of ComPreHenSiVe inCome
5 – Sales
The Company generates sales from selling semiconductors and micromechanical sensor elements
as well as from developing them.
Sales of the Group and its segments can be broken down as follows:
2014thousand Euro
2013thousand Euro
Semiconductor 190,923 173,069
Micromechanics 18,594 16,003
Group 209,517 189,072
Sales increased by 10.8% to 209,517 thousand Euro. The sales increase is recorded in both of the
Group’s segments. While sales in the Semiconductor segment gained 10.3% to 190,923 thousand
Euro, sales in the Micromechanics segment climbed 16.2% to 18,594 thousand Euro.
6 – notes to the income statement according to the cost of sales method
Cost of sales
The cost of sales contains costs of performances rendered toward the generation of sales. In
addition to direct material costs, direct labor costs, and special direct costs, the cost of sales also
includes manufacturing and material overhead as well as lease expenses and depreciation.
Furthermore, the cost of sales contains changes in work in process and finished goods inventories
and shows the following development:
Elmos Annual Report 2014
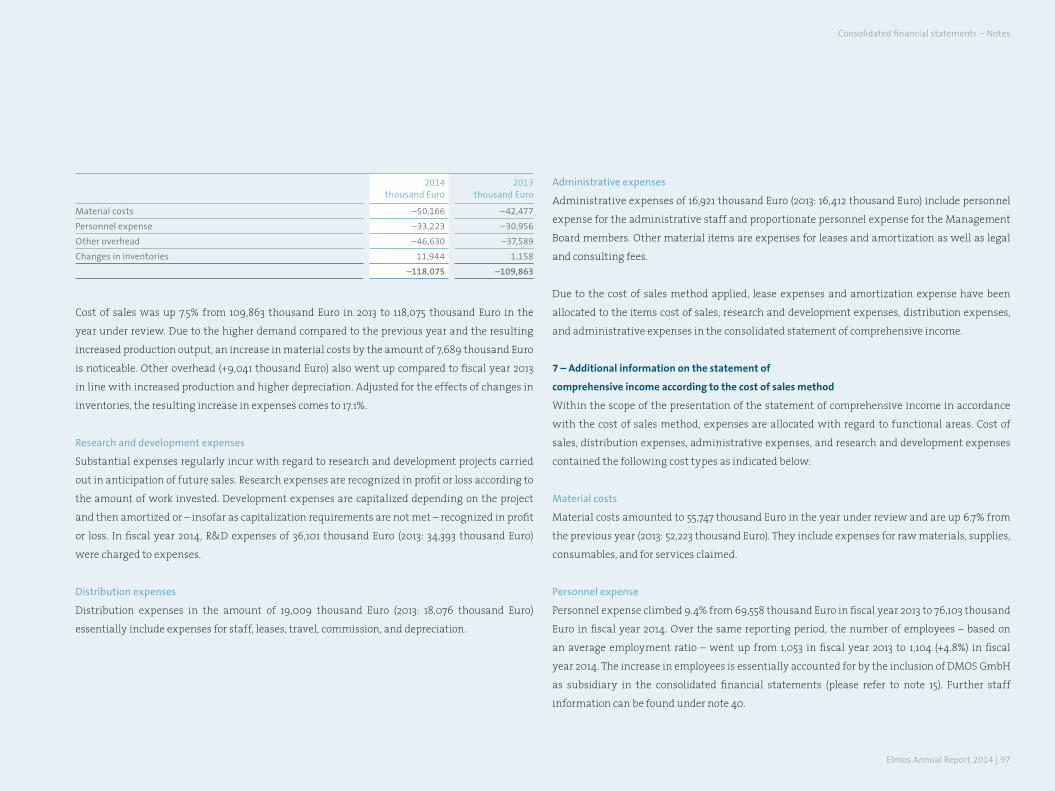
Elmos Annual Report 2014 | 97
2014thousand Euro
2013thousand Euro
Material costs –50,166 –42,477
Personnel expense –33,223 –30,956
Other overhead –46,630 –37,589
Changes in inventories 11,944 1,158
–118,075 –109,863
Cost of sales was up 7.5% from 109,863 thousand Euro in 2013 to 118,075 thousand Euro in the
year under review. Due to the higher demand compared to the previous year and the resulting
increased production output, an increase in material costs by the amount of 7,689 thousand Euro
is noticeable. Other overhead (+9,041 thousand Euro) also went up compared to fiscal year 2013
in line with increased production and higher depreciation. Adjusted for the effects of changes in
inventories, the resulting increase in expenses comes to 17.1%.
Research and development expenses
Substantial expenses regularly incur with regard to research and development projects carried
out in anticipation of future sales. Research expenses are recognized in profit or loss according to
the amount of work invested. Development expenses are capitalized depending on the project
and then amortized or – insofar as capitalization requirements are not met – recognized in profit
or loss. In fiscal year 2014, R&D expenses of 36,101 thousand Euro (2013: 34,393 thousand Euro)
were charged to expenses.
Distribution expenses
Distribution expenses in the amount of 19,009 thousand Euro (2013: 18,076 thousand Euro)
essentially include expenses for staff, leases, travel, commission, and depreciation.
Administrative expenses
Administrative expenses of 16,921 thousand Euro (2013: 16,412 thousand Euro) include personnel
expense for the administrative staff and proportionate personnel expense for the Management
Board members. Other material items are expenses for leases and amortization as well as legal
and consulting fees.
Due to the cost of sales method applied, lease expenses and amortization expense have been
allocated to the items cost of sales, research and development expenses, distribution expenses,
and administrative expenses in the consolidated statement of comprehensive income.
7 – additional information on the statement of
comprehensive income according to the cost of sales method
Within the scope of the presentation of the statement of comprehensive income in accordance
with the cost of sales method, expenses are allocated with regard to functional areas. Cost of
sales, distribution expenses, administrative expenses, and research and development expenses
contained the following cost types as indicated below:
Material costs
Material costs amounted to 55,747 thousand Euro in the year under review and are up 6.7% from
the previous year (2013: 52,223 thousand Euro). They include expenses for raw materials, supplies,
consumables, and for services claimed.
Personnel expense
Personnel expense climbed 9.4% from 69,558 thousand Euro in fiscal year 2013 to 76,103 thousand
Euro in fiscal year 2014. Over the same reporting period, the number of employees – based on
an average employment ratio – went up from 1,053 in fiscal year 2013 to 1,104 (+4.8%) in fiscal
year 2014. The increase in employees is essentially accounted for by the inclusion of DMOS GmbH
as subsidiary in the consolidated financial statements (please refer to note 15). Further staff
information can be found under note 40.
Consolidated financial statements – Notes
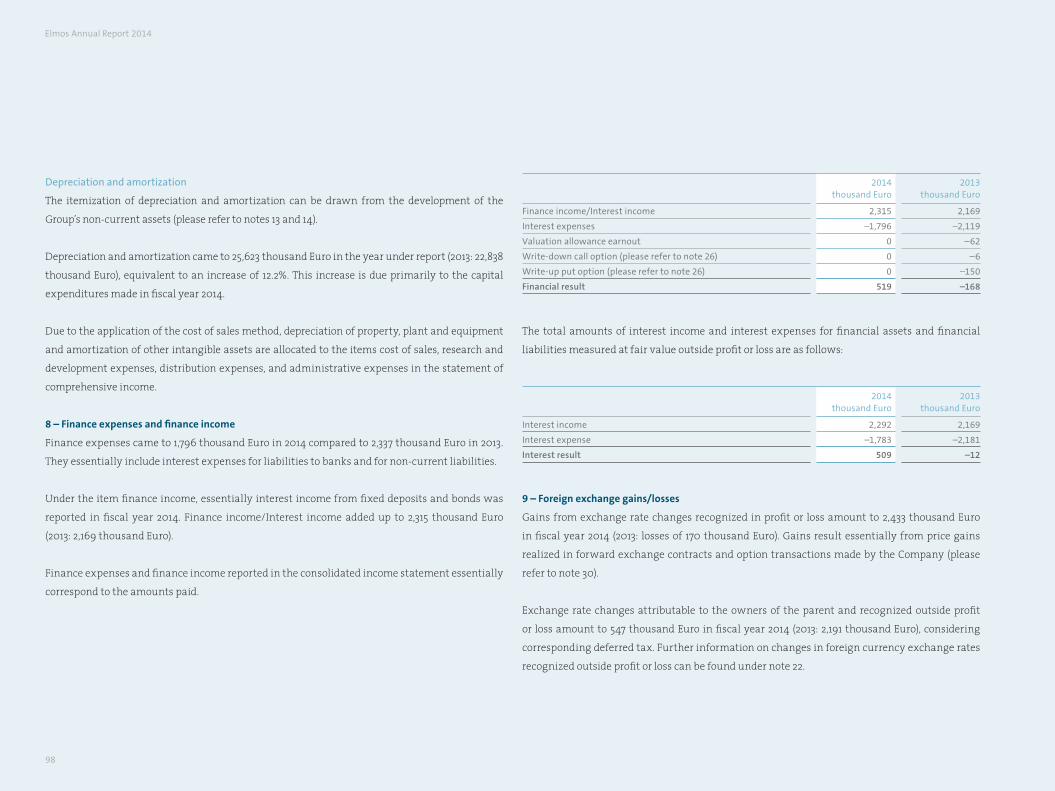
98
Depreciation and amortization
The itemization of depreciation and amortization can be drawn from the development of the
Group’s non-current assets (please refer to notes 13 and 14).
Depreciation and amortization came to 25,623 thousand Euro in the year under report (2013: 22,838
thousand Euro), equivalent to an increase of 12.2%. This increase is due primarily to the capital
expenditures made in fiscal year 2014.
Due to the application of the cost of sales method, depreciation of property, plant and equipment
and amortization of other intangible assets are allocated to the items cost of sales, research and
development expenses, distribution expenses, and administrative expenses in the statement of
comprehensive income.
8 – finance expenses and finance income
Finance expenses came to 1,796 thousand Euro in 2014 compared to 2,337 thousand Euro in 2013.
They essentially include interest expenses for liabilities to banks and for non-current liabilities.
Under the item finance income, essentially interest income from fixed deposits and bonds was
reported in fiscal year 2014. Finance income/Interest income added up to 2,315 thousand Euro
(2013: 2,169 thousand Euro).
Finance expenses and finance income reported in the consolidated income statement essentially
correspond to the amounts paid.
2014thousand Euro
2013thousand Euro
Finance income/Interest income 2,315 2,169
Interest expenses –1,796 –2,119
valuation allowance earnout 0 –62
Write-down call option (please refer to note 26) 0 –6
Write-up put option (please refer to note 26) 0 –150
Financial result 519 –168
The total amounts of interest income and interest expenses for financial assets and financial
liabilities measured at fair value outside profit or loss are as follows:
2014thousand Euro
2013thousand Euro
Interest income 2,292 2,169
Interest expense –1,783 –2,181
Interest result 509 –12
9 – foreign exchange gains/losses
Gains from exchange rate changes recognized in profit or loss amount to 2,433 thousand Euro
in fiscal year 2014 (2013: losses of 170 thousand Euro). Gains result essentially from price gains
realized in forward exchange contracts and option transactions made by the Company (please
refer to note 30).
Exchange rate changes attributable to the owners of the parent and recognized outside profit
or loss amount to 547 thousand Euro in fiscal year 2014 (2013: 2,191 thousand Euro), considering
corresponding deferred tax. Further information on changes in foreign currency exchange rates
recognized outside profit or loss can be found under note 22.
Elmos Annual Report 2014
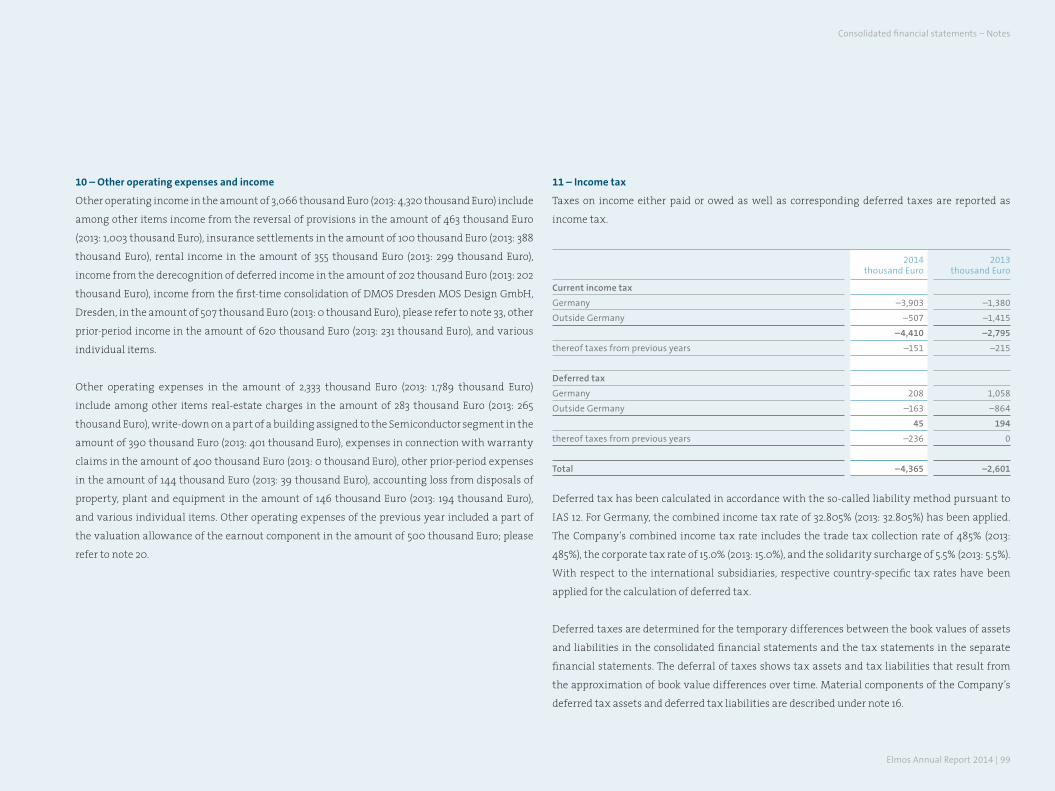
Elmos Annual Report 2014 | 99
10 – other operating expenses and income
Other operating income in the amount of 3,066 thousand Euro (2013: 4,320 thousand Euro) include
among other items income from the reversal of provisions in the amount of 463 thousand Euro
(2013: 1,003 thousand Euro), insurance settlements in the amount of 100 thousand Euro (2013: 388
thousand Euro), rental income in the amount of 355 thousand Euro (2013: 299 thousand Euro),
income from the derecognition of deferred income in the amount of 202 thousand Euro (2013: 202
thousand Euro), income from the first-time consolidation of DMOS Dresden MOS Design GmbH,
Dresden, in the amount of 507 thousand Euro (2013: 0 thousand Euro), please refer to note 33, other
prior-period income in the amount of 620 thousand Euro (2013: 231 thousand Euro), and various
individual items.
Other operating expenses in the amount of 2,333 thousand Euro (2013: 1,789 thousand Euro)
include among other items real-estate charges in the amount of 283 thousand Euro (2013: 265
thousand Euro), write-down on a part of a building assigned to the Semiconductor segment in the
amount of 390 thousand Euro (2013: 401 thousand Euro), expenses in connection with warranty
claims in the amount of 400 thousand Euro (2013: 0 thousand Euro), other prior-period expenses
in the amount of 144 thousand Euro (2013: 39 thousand Euro), accounting loss from disposals of
property, plant and equipment in the amount of 146 thousand Euro (2013: 194 thousand Euro),
and various individual items. Other operating expenses of the previous year included a part of
the valuation allowance of the earnout component in the amount of 500 thousand Euro; please
refer to note 20.
11 – income tax
Taxes on income either paid or owed as well as corresponding deferred taxes are reported as
income tax.
2014thousand Euro
2013thousand Euro
Current income tax
Germany –3,903 –1,380
Outside Germany –507 –1,415
–4,410 –2,795
thereof taxes from previous years –151 –215
Deferred tax
Germany 208 1,058
Outside Germany –163 –864
45 194
thereof taxes from previous years –236 0
Total –4,365 –2,601
Deferred tax has been calculated in accordance with the so-called liability method pursuant to
IAS 12. For Germany, the combined income tax rate of 32.805% (2013: 32.805%) has been applied.
The Company’s combined income tax rate includes the trade tax collection rate of 485% (2013:
485%), the corporate tax rate of 15.0% (2013: 15.0%), and the solidarity surcharge of 5.5% (2013: 5.5%).
With respect to the international subsidiaries, respective country-specific tax rates have been
applied for the calculation of deferred tax.
Deferred taxes are determined for the temporary differences between the book values of assets
and liabilities in the consolidated financial statements and the tax statements in the separate
financial statements. The deferral of taxes shows tax assets and tax liabilities that result from
the approximation of book value differences over time. Material components of the Company’s
deferred tax assets and deferred tax liabilities are described under note 16.
Consolidated financial statements – Notes
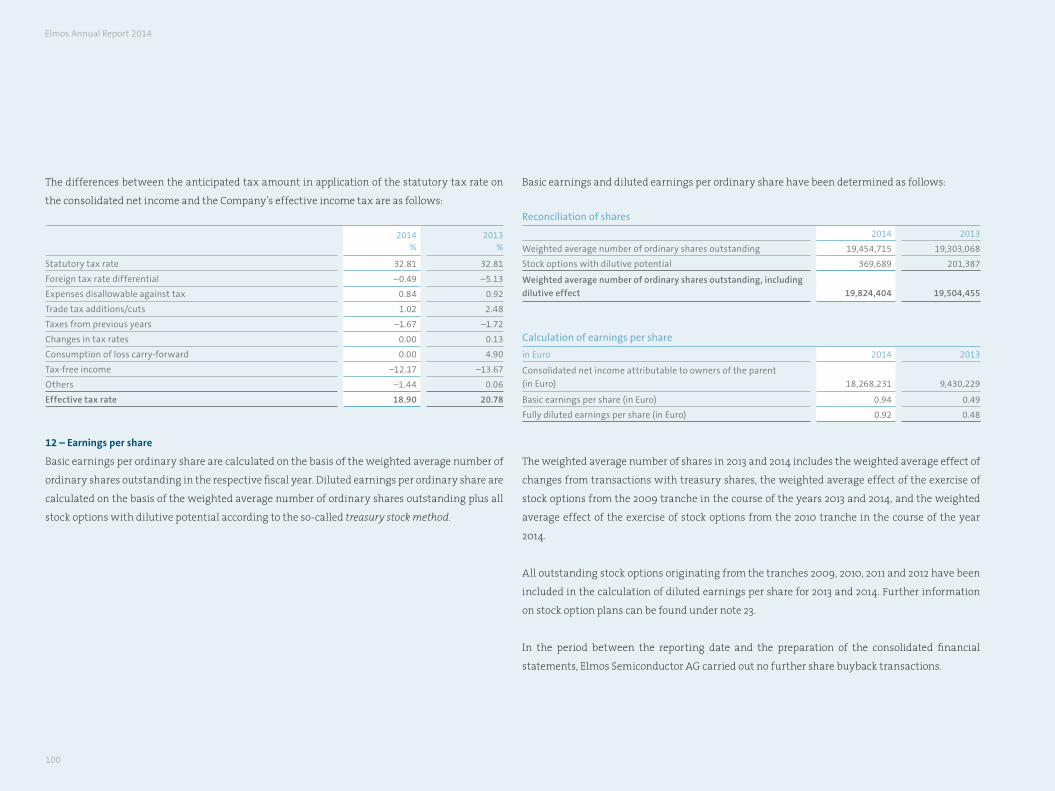
100
The differences between the anticipated tax amount in application of the statutory tax rate on
the consolidated net income and the Company’s effective income tax are as follows:
2014%
2013%
Statutory tax rate 32.81 32.81
Foreign tax rate differential –0.49 –5.13
Expenses disallowable against tax 0.84 0.92
Trade tax additions/cuts 1.02 2.48
Taxes from previous years –1.67 –1.72
Changes in tax rates 0.00 0.13
Consumption of loss carry-forward 0.00 4.90
Tax-free income –12.17 –13.67
Others –1.44 0.06
Effective tax rate 18.90 20.78
12 – earnings per share
Basic earnings per ordinary share are calculated on the basis of the weighted average number of
ordinary shares outstanding in the respective fiscal year. Diluted earnings per ordinary share are
calculated on the basis of the weighted average number of ordinary shares outstanding plus all
stock options with dilutive potential according to the so-called treasury stock method.
Basic earnings and diluted earnings per ordinary share have been determined as follows:
Reconciliation of shares
2014 2013
Weighted average number of ordinary shares outstanding 19,454,715 19,303,068
Stock options with dilutive potential 369,689 201,387
Weighted average number of ordinary shares outstanding, including
dilutive effect 19,824,404 19,504,455
Calculation of earnings per share
in Euro 2014 2013
Consolidated net income attributable to owners of the parent
(in Euro) 18,268,231 9,430,229
Basic earnings per share (in Euro) 0.94 0.49
Fully diluted earnings per share (in Euro) 0.92 0.48
The weighted average number of shares in 2013 and 2014 includes the weighted average effect of
changes from transactions with treasury shares, the weighted average effect of the exercise of
stock options from the 2009 tranche in the course of the years 2013 and 2014, and the weighted
average effect of the exercise of stock options from the 2010 tranche in the course of the year
2014.
All outstanding stock options originating from the tranches 2009, 2010, 2011 and 2012 have been
included in the calculation of diluted earnings per share for 2013 and 2014. Further information
on stock option plans can be found under note 23.
In the period between the reporting date and the preparation of the consolidated financial
statements, Elmos Semiconductor AG carried out no further share buyback transactions.
Elmos Annual Report 2014
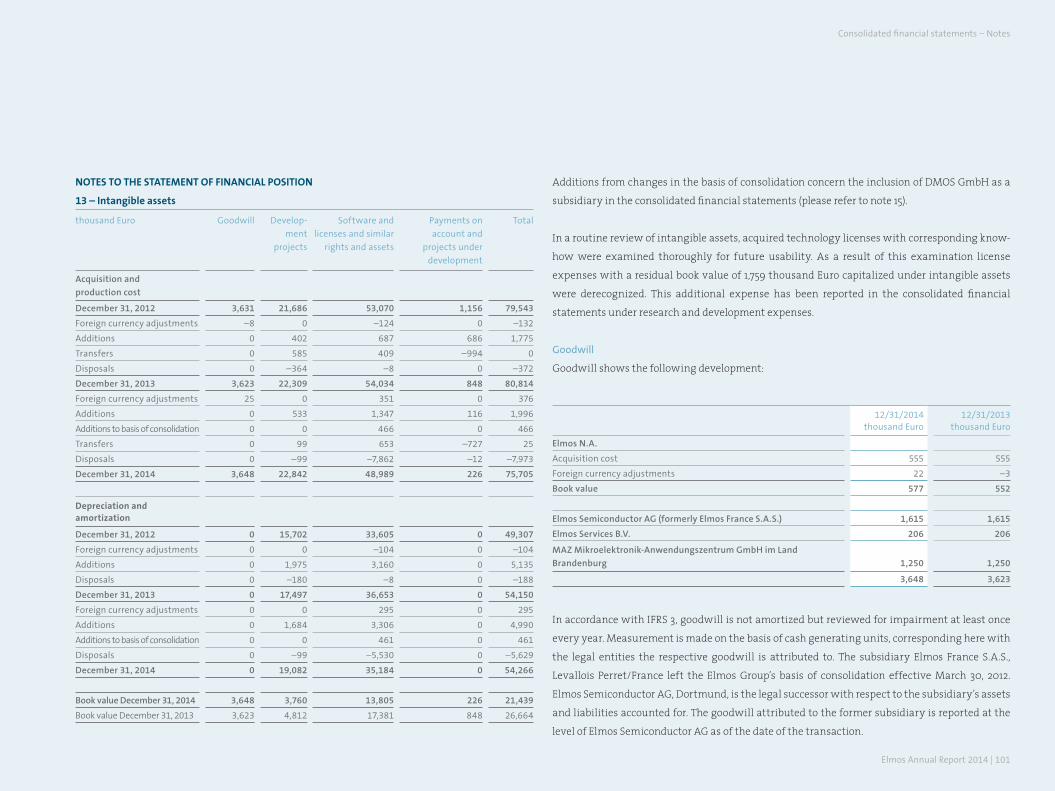
Elmos Annual Report 2014 | 101
noteS to tHe Statement of finanCial PoSition
13 – intangible assets
thousand Euro Goodwill
Develop-
ment
projects
Software and
licenses and similar
rights and assets
Payments on
account and
projects under
development
Total
Acquisition and
production cost
December 31, 2012 3,631 21,686 53,070 1,156 79,543
Foreign currency adjustments –8 0 –124 0 –132
Additions 0 402 687 686 1,775
Transfers 0 585 409 –994 0
Disposals 0 –364 –8 0 –372
December 31, 2013 3,623 22,309 54,034 848 80,814
Foreign currency adjustments 25 0 351 0 376
Additions 0 533 1,347 116 1,996
Additions to basis of consolidation 0 0 466 0 466
Transfers 0 99 653 –727 25
Disposals 0 –99 –7,862 –12 –7,973
December 31, 2014 3,648 22,842 48,989 226 75,705
Depreciation and amortization
December 31, 2012 0 15,702 33,605 0 49,307
Foreign currency adjustments 0 0 –104 0 –104
Additions 0 1,975 3,160 0 5,135
Disposals 0 –180 –8 0 –188
December 31, 2013 0 17,497 36,653 0 54,150
Foreign currency adjustments 0 0 295 0 295
Additions 0 1,684 3,306 0 4,990
Additions to basis of consolidation 0 0 461 0 461
Disposals 0 –99 –5,530 0 –5,629
December 31, 2014 0 19,082 35,184 0 54,266
Book value December 31, 2014 3,648 3,760 13,805 226 21,439
Book value December 31, 2013 3,623 4,812 17,381 848 26,664
Additions from changes in the basis of consolidation concern the inclusion of DMOS GmbH as a
subsidiary in the consolidated financial statements (please refer to note 15).
In a routine review of intangible assets, acquired technology licenses with corresponding know-
how were examined thoroughly for future usability. As a result of this examination license
expenses with a residual book value of 1,759 thousand Euro capitalized under intangible assets
were derecognized. This additional expense has been reported in the consolidated financial
statements under research and development expenses.
Goodwill
Goodwill shows the following development:
12/31/2014thousand Euro
12/31/2013thousand Euro
Elmos N.A.
Acquisition cost 555 555
Foreign currency adjustments 22 –3
Book value 577 552
Elmos Semiconductor AG (formerly Elmos France S.A.S.) 1,615 1,615
Elmos Services B.V. 206 206
MAZ Mikroelektronik-Anwendungszentrum GmbH im Land
Brandenburg 1,250 1,250
3,648 3,623
In accordance with IFRS 3, goodwill is not amortized but reviewed for impairment at least once
every year. Measurement is made on the basis of cash generating units, corresponding here with
the legal entities the respective goodwill is attributed to. The subsidiary Elmos France S.A.S.,
Levallois Perret/France left the Elmos Group’s basis of consolidation effective March 30, 2012.
Elmos Semiconductor AG, Dortmund, is the legal successor with respect to the subsidiary’s assets
and liabilities accounted for. The goodwill attributed to the former subsidiary is reported at the
level of Elmos Semiconductor AG as of the date of the transaction.
Consolidated financial statements – Notes
102
For the purpose of the impairment tests to be conducted annually in accordance with IAS 36,
the Group determines the recoverable amount on the basis of value in use. The forecasts are
based on free cash flows. They in turn are based on detailed planning adopted by management
and consider the Company's own empirical data as well as external general economic data. The
forecasts are based both on historical values and the general market performance expected
for the future. Determining the value in use implies estimation uncertainty with respect to
individual sales and cost planning as approved by management. Material parameters are
established in the context of bottom-up planning by the subsidiaries and business divisions.
Methodically, the detailed planning phase comprises a five-year planning period from 2015 to
2019. For the value added from 2020 it is enhanced by the perpetual annuity which is based on an
annual growth rate of 0.5%.
Further basic assumptions for the calculation of value in use
Gross margins – Gross margins are generally determined on the basis of the average values
generated in the previous fiscal years before the beginning of the planning period. These margins
are increased in the individual case by the expected efficiency increases in the course of the
detailed planning period. For the individual cash generating units, gross margins with different
bandwidths are taken as a basis. The budgeted annual performance of the gross margins was
established individually for each cash generating unit, ranging from constant gross margins to
double-digit percentage growth rates in the detailed planning period.
Development of prices for raw materials – Raw material price developments of the past are
regarded as indicative of future price developments. Forecast data are used only if they are
accessible to the public.
Assumptions on market shares – These assumptions are relevant insofar as the Company’s
management assesses – as in establishing assumptions on growth rates – how the positions
of the individual entities might change in relation to their competitors during the budgeting
period. Management anticipates steady market shares in probably growing markets.
Discount rates – The pre-tax interest rates applied were determined according to the capital
asset pricing model (CAPM) and come to 15.65% for Elmos N.A., 14.21% for Elmos Semiconductor
AG, 12.49% for Elmos Services B.V., and 13.08% for MAZ Mikroelektronik-Anwendungszentrum
GmbH im Land Brandenburg, before deduction of respective growth rates. These interest rates
correspond to the weighted average cost of capital. This so-called WACC is based on a risk-
free interest rate (2.0% or 3.25% for Elmos N.A.) plus an average market risk premium (6.00%),
multiplied by an entity specific equity beta based on a so-called levered beta of 1.26. All values
stated are derived from market data.
In 2014 impairment tests were conducted that did not result in impairment. It was established
that the recoverable amounts of the respective units exceeded the respective book values.
Elmos has conducted sensitivity analyses, examining the effects of the simultaneous reduction
of the budgeted earnings before interest and taxes (EBIT) in all planning periods beginning in 2015
by 10% compared to the adopted corporate budgets, a weighted average cost of capital increased
by another 1.0 percentage point, and a reduction of the growth rate for perpetual annuity to 0.0%
with respect to the recoverability of goodwill in the business divisions. The sensitivity analyses
have shown that from today's viewpoint there would be no need for impairment of the goodwill
of any of the entities even under these changed assumptions.
Elmos Annual Report 2014
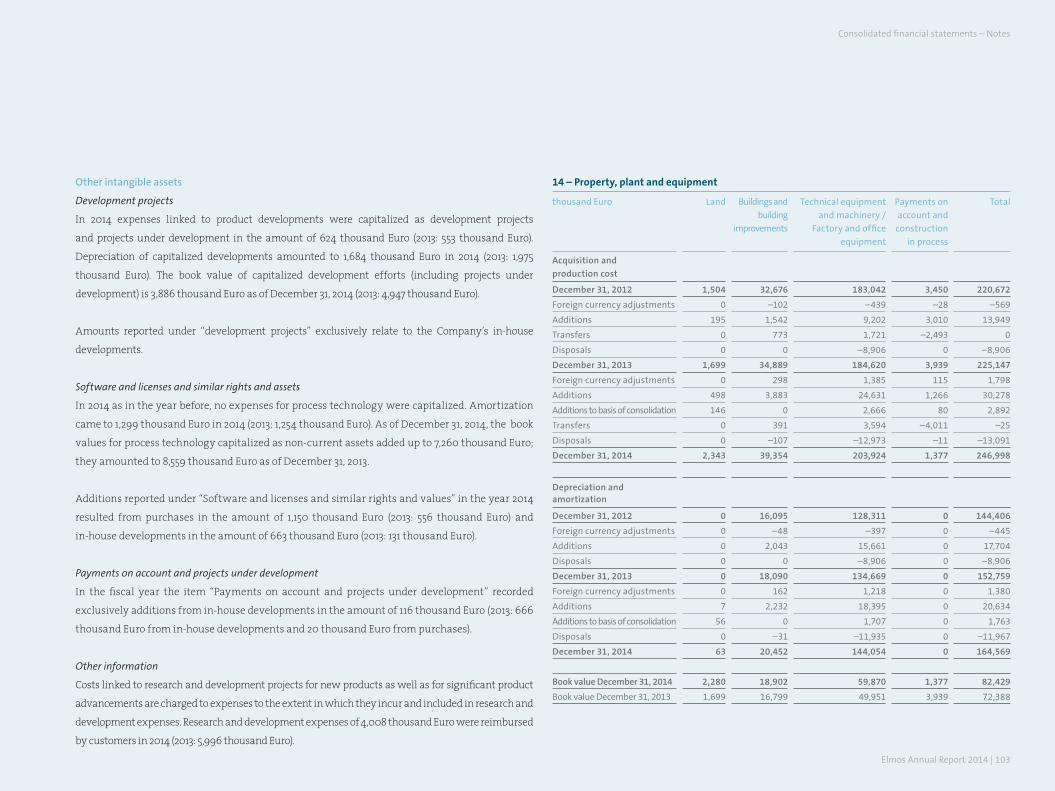
Elmos Annual Report 2014 | 103
Other intangible assets
Development projects
In 2014 expenses linked to product developments were capitalized as development projects
and projects under development in the amount of 624 thousand Euro (2013: 553 thousand Euro).
Depreciation of capitalized developments amounted to 1,684 thousand Euro in 2014 (2013: 1,975
thousand Euro). The book value of capitalized development efforts (including projects under
development) is 3,886 thousand Euro as of December 31, 2014 (2013: 4,947 thousand Euro).
Amounts reported under “development projects” exclusively relate to the Company’s in-house
developments.
Software and licenses and similar rights and assets
In 2014 as in the year before, no expenses for process technology were capitalized. Amortization
came to 1,299 thousand Euro in 2014 (2013: 1,254 thousand Euro). As of December 31, 2014, the book
values for process technology capitalized as non-current assets added up to 7,260 thousand Euro;
they amounted to 8,559 thousand Euro as of December 31, 2013.
Additions reported under “Software and licenses and similar rights and values” in the year 2014
resulted from purchases in the amount of 1,150 thousand Euro (2013: 556 thousand Euro) and
in-house developments in the amount of 663 thousand Euro (2013: 131 thousand Euro).
Payments on account and projects under development
In the fiscal year the item “Payments on account and projects under development” recorded
exclusively additions from in-house developments in the amount of 116 thousand Euro (2013: 666
thousand Euro from in-house developments and 20 thousand Euro from purchases).
Other information
Costs linked to research and development projects for new products as well as for significant product
advancements are charged to expenses to the extent in which they incur and included in research and
development expenses. Research and development expenses of 4,008 thousand Euro were reimbursed
by customers in 2014 (2013: 5,996 thousand Euro).
14 – Property, plant and equipment
thousand Euro Land Buildings and
building
improvements
Technical equipment
and machinery /
Factory and office
equipment
Payments on
account and
construction
in process
Total
Acquisition and
production cost
December 31, 2012 1,504 32,676 183,042 3,450 220,672
Foreign currency adjustments 0 –102 –439 –28 –569
Additions 195 1,542 9,202 3,010 13,949
Transfers 0 773 1,721 –2,493 0
Disposals 0 0 –8,906 0 –8,906
December 31, 2013 1,699 34,889 184,620 3,939 225,147
Foreign currency adjustments 0 298 1,385 115 1,798
Additions 498 3,883 24,631 1,266 30,278
Additions to basis of consolidation 146 0 2,666 80 2,892
Transfers 0 391 3,594 –4,011 –25
Disposals 0 –107 –12,973 –11 –13,091
December 31, 2014 2,343 39,354 203,924 1,377 246,998
Depreciation and amortization
December 31, 2012 0 16,095 128,311 0 144,406
Foreign currency adjustments 0 –48 –397 0 –445
Additions 0 2,043 15,661 0 17,704
Disposals 0 0 –8,906 0 –8,906
December 31, 2013 0 18,090 134,669 0 152,759
Foreign currency adjustments 0 162 1,218 0 1,380
Additions 7 2,232 18,395 0 20,634
Additions to basis of consolidation 56 0 1,707 0 1,763
Disposals 0 –31 –11,935 0 –11,967
December 31, 2014 63 20,452 144,054 0 164,569
Book value December 31, 2014 2,280 18,902 59,870 1,377 82,429
Book value December 31, 2013 1,699 16,799 49,951 3,939 72,388
Consolidated financial statements – Notes
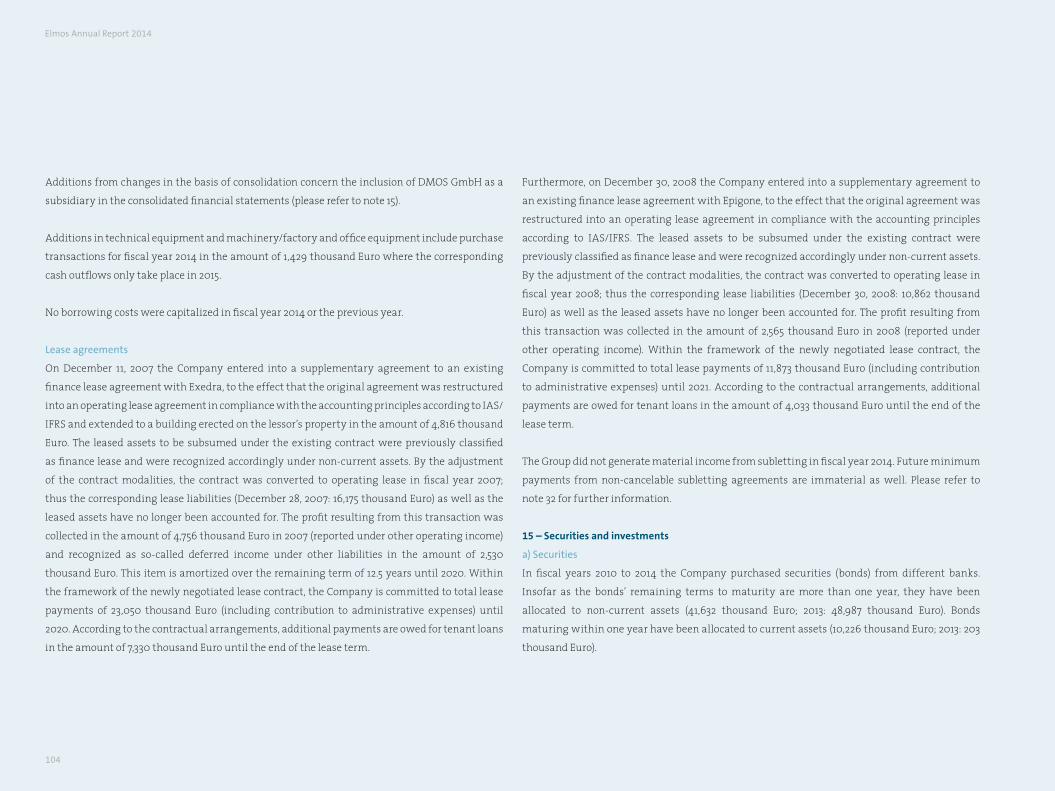
104
Furthermore, on December 30, 2008 the Company entered into a supplementary agreement to
an existing finance lease agreement with Epigone, to the effect that the original agreement was
restructured into an operating lease agreement in compliance with the accounting principles
according to IAS/IFRS. The leased assets to be subsumed under the existing contract were
previously classified as finance lease and were recognized accordingly under non-current assets.
By the adjustment of the contract modalities, the contract was converted to operating lease in
fiscal year 2008; thus the corresponding lease liabilities (December 30, 2008: 10,862 thousand
Euro) as well as the leased assets have no longer been accounted for. The profit resulting from
this transaction was collected in the amount of 2,565 thousand Euro in 2008 (reported under
other operating income). Within the framework of the newly negotiated lease contract, the
Company is committed to total lease payments of 11,873 thousand Euro (including contribution
to administrative expenses) until 2021. According to the contractual arrangements, additional
payments are owed for tenant loans in the amount of 4,033 thousand Euro until the end of the
lease term.
The Group did not generate material income from subletting in fiscal year 2014. Future minimum
payments from non-cancelable subletting agreements are immaterial as well. Please refer to
note 32 for further information.
15 – Securities and investments
a) Securities
In fiscal years 2010 to 2014 the Company purchased securities (bonds) from different banks.
Insofar as the bonds’ remaining terms to maturity are more than one year, they have been
allocated to non-current assets (41,632 thousand Euro; 2013: 48,987 thousand Euro). Bonds
maturing within one year have been allocated to current assets (10,226 thousand Euro; 2013: 203
thousand Euro).
Additions from changes in the basis of consolidation concern the inclusion of DMOS GmbH as a
subsidiary in the consolidated financial statements (please refer to note 15).
Additions in technical equipment and machinery/factory and office equipment include purchase
transactions for fiscal year 2014 in the amount of 1,429 thousand Euro where the corresponding
cash outflows only take place in 2015.
No borrowing costs were capitalized in fiscal year 2014 or the previous year.
Lease agreements
On December 11, 2007 the Company entered into a supplementary agreement to an existing
finance lease agreement with Exedra, to the effect that the original agreement was restructured
into an operating lease agreement in compliance with the accounting principles according to IAS/
IFRS and extended to a building erected on the lessor’s property in the amount of 4,816 thousand
Euro. The leased assets to be subsumed under the existing contract were previously classified
as finance lease and were recognized accordingly under non-current assets. By the adjustment
of the contract modalities, the contract was converted to operating lease in fiscal year 2007;
thus the corresponding lease liabilities (December 28, 2007: 16,175 thousand Euro) as well as the
leased assets have no longer been accounted for. The profit resulting from this transaction was
collected in the amount of 4,756 thousand Euro in 2007 (reported under other operating income)
and recognized as so-called deferred income under other liabilities in the amount of 2,530
thousand Euro. This item is amortized over the remaining term of 12.5 years until 2020. Within
the framework of the newly negotiated lease contract, the Company is committed to total lease
payments of 23,050 thousand Euro (including contribution to administrative expenses) until
2020. According to the contractual arrangements, additional payments are owed for tenant loans
in the amount of 7,330 thousand Euro until the end of the lease term.
Elmos Annual Report 2014
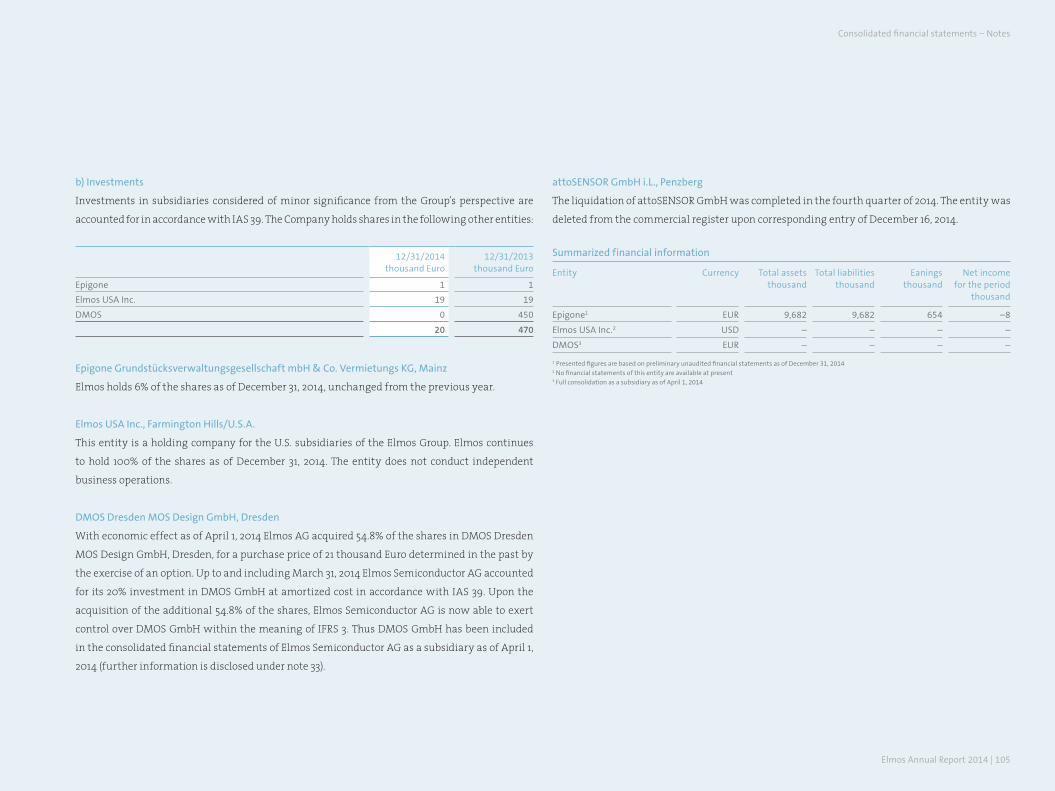
Elmos Annual Report 2014 | 105
b) Investments
Investments in subsidiaries considered of minor significance from the Group’s perspective are
accounted for in accordance with IAS 39. The Company holds shares in the following other entities:
12/31/2014thousand Euro
12/31/2013thousand Euro
Epigone 1 1
Elmos USA Inc. 19 19
DMOS 0 450
20 470
Epigone Grundstücksverwaltungsgesellschaft mbH & Co. vermietungs KG, Mainz
Elmos holds 6% of the shares as of December 31, 2014, unchanged from the previous year.
Elmos USA Inc., Farmington Hills/U.S.A.
This entity is a holding company for the U.S. subsidiaries of the Elmos Group. Elmos continues
to hold 100% of the shares as of December 31, 2014. The entity does not conduct independent
business operations.
DMOS Dresden MOS Design GmbH, Dresden
With economic effect as of April 1, 2014 Elmos AG acquired 54.8% of the shares in DMOS Dresden
MOS Design GmbH, Dresden, for a purchase price of 21 thousand Euro determined in the past by
the exercise of an option. Up to and including March 31, 2014 Elmos Semiconductor AG accounted
for its 20% investment in DMOS GmbH at amortized cost in accordance with IAS 39. Upon the
acquisition of the additional 54.8% of the shares, Elmos Semiconductor AG is now able to exert
control over DMOS GmbH within the meaning of IFRS 3. Thus DMOS GmbH has been included
in the consolidated financial statements of Elmos Semiconductor AG as a subsidiary as of April 1,
2014 (further information is disclosed under note 33).
attoSENSOR GmbH i.L., Penzberg
The liquidation of attoSENSOR GmbH was completed in the fourth quarter of 2014. The entity was
deleted from the commercial register upon corresponding entry of December 16, 2014.
Summarized financial information
Entity Currency Total assets thousand
Total liabilities thousand
Eanings thousand
Net income for the period
thousand
Epigone1 EUR 9,682 9,682 654 –8
Elmos USA Inc.2 USD – – – –
DMOS3 EUR – – – –
1 Presented figures are based on preliminary unaudited financial statements as of December 31, 20142 No financial statements of this entity are available at present3 Full consolidation as a subsidiary as of April 1, 2014
Consolidated financial statements – Notes
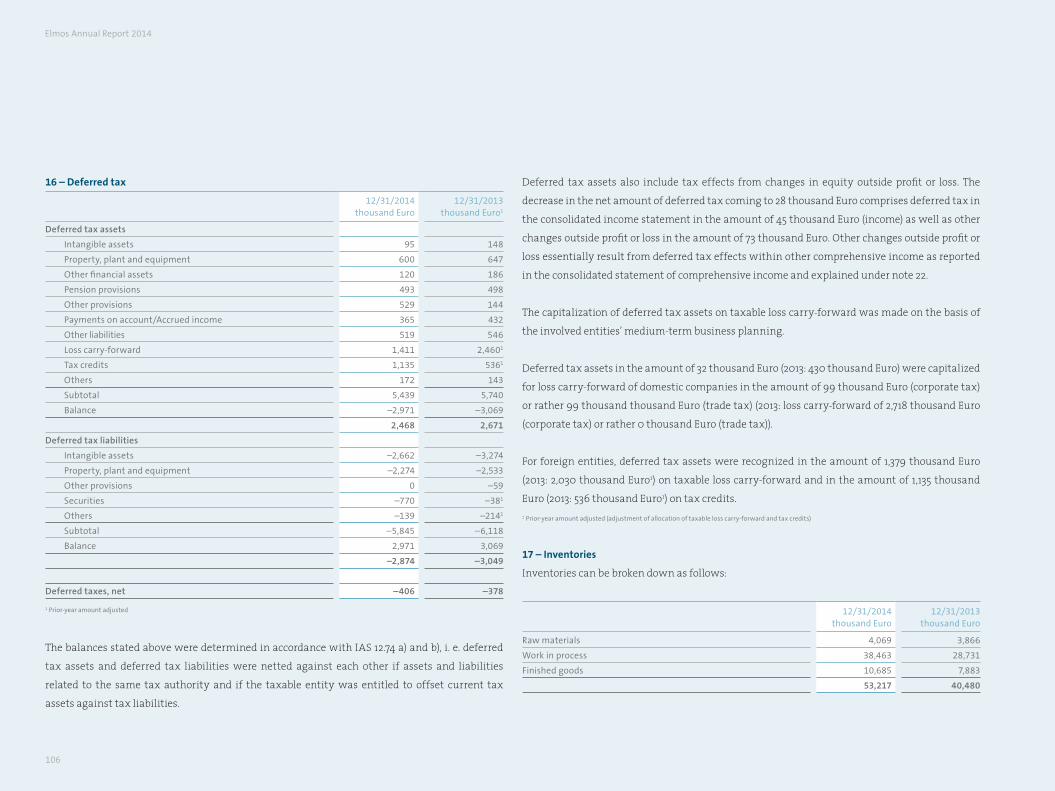
106
16 – Deferred tax
12/31/2014thousand Euro
12/31/2013thousand Euro1
Deferred tax assets
Intangible assets 95 148
Property, plant and equipment 600 647
Other financial assets 120 186
Pension provisions 493 498
Other provisions 529 144
Payments on account/Accrued income 365 432
Other liabilities 519 546
Loss carry-forward 1,411 2,4601
Tax credits 1,135 5361
Others 172 143
Subtotal 5,439 5,740
Balance –2,971 –3,069
2,468 2,671
Deferred tax liabilities
Intangible assets –2,662 –3,274
Property, plant and equipment –2,274 –2,533
Other provisions 0 –59
Securities –770 –381
Others –139 –2141
Subtotal –5,845 –6,118
Balance 2,971 3,069
–2,874 –3,049
Deferred taxes, net –406 –378
1 Prior-year amount adjusted
The balances stated above were determined in accordance with IAS 12.74 a) and b), i. e. deferred
tax assets and deferred tax liabilities were netted against each other if assets and liabilities
related to the same tax authority and if the taxable entity was entitled to offset current tax
assets against tax liabilities.
Deferred tax assets also include tax effects from changes in equity outside profit or loss. The
decrease in the net amount of deferred tax coming to 28 thousand Euro comprises deferred tax in
the consolidated income statement in the amount of 45 thousand Euro (income) as well as other
changes outside profit or loss in the amount of 73 thousand Euro. Other changes outside profit or
loss essentially result from deferred tax effects within other comprehensive income as reported
in the consolidated statement of comprehensive income and explained under note 22.
The capitalization of deferred tax assets on taxable loss carry-forward was made on the basis of
the involved entities’ medium-term business planning.
Deferred tax assets in the amount of 32 thousand Euro (2013: 430 thousand Euro) were capitalized
for loss carry-forward of domestic companies in the amount of 99 thousand Euro (corporate tax)
or rather 99 thousand thousand Euro (trade tax) (2013: loss carry-forward of 2,718 thousand Euro
(corporate tax) or rather 0 thousand Euro (trade tax)).
For foreign entities, deferred tax assets were recognized in the amount of 1,379 thousand Euro
(2013: 2,030 thousand Euro1) on taxable loss carry-forward and in the amount of 1,135 thousand
Euro (2013: 536 thousand Euro1) on tax credits.1 Prior-year amount adjusted (adjustment of allocation of taxable loss carry-forward and tax credits)
17 – inventories
Inventories can be broken down as follows:
12/31/2014thousand Euro
12/31/2013thousand Euro
Raw materials 4,069 3,866
Work in process 38,463 28,731
Finished goods 10,685 7,883
53,217 40,480
Elmos Annual Report 2014
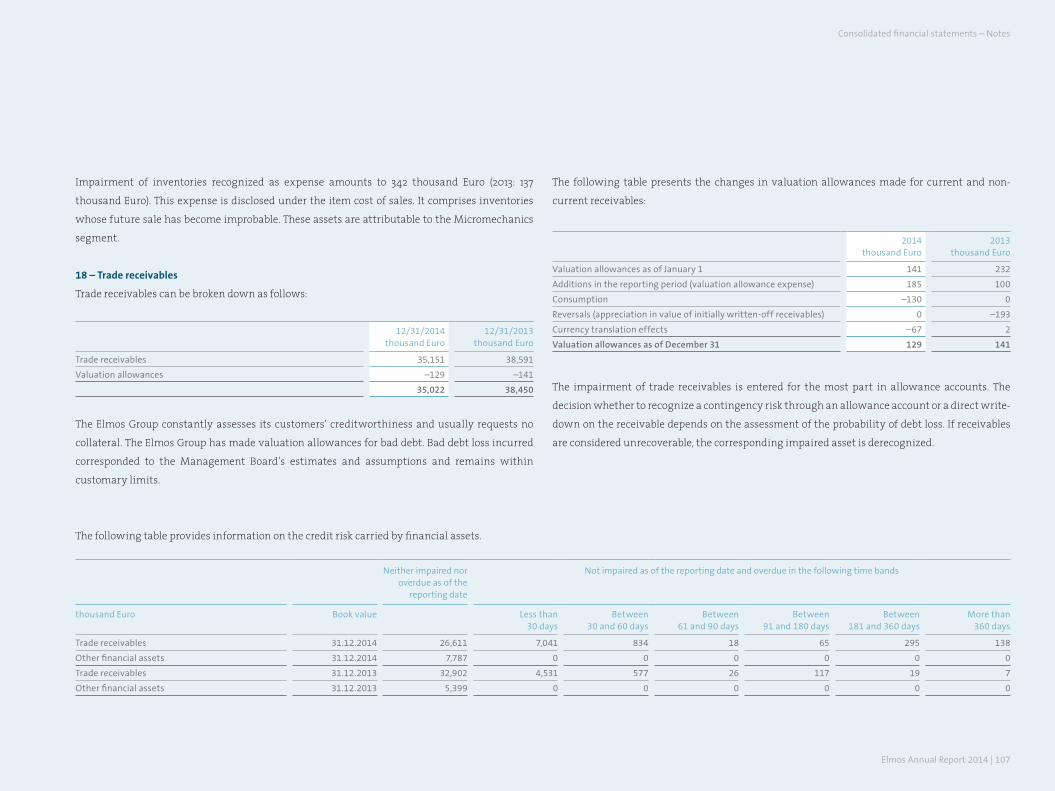
Elmos Annual Report 2014 | 107
Impairment of inventories recognized as expense amounts to 342 thousand Euro (2013: 137
thousand Euro). This expense is disclosed under the item cost of sales. It comprises inventories
whose future sale has become improbable. These assets are attributable to the Micromechanics
segment.
18 – trade receivables
Trade receivables can be broken down as follows:
12/31/2014thousand Euro
12/31/2013thousand Euro
Trade receivables 35,151 38,591
valuation allowances –129 –141
35,022 38,450
The Elmos Group constantly assesses its customers’ creditworthiness and usually requests no
collateral. The Elmos Group has made valuation allowances for bad debt. Bad debt loss incurred
corresponded to the Management Board’s estimates and assumptions and remains within
customary limits.
The following table presents the changes in valuation allowances made for current and non-
current receivables:
2014thousand Euro
2013thousand Euro
valuation allowances as of January 1 141 232
Additions in the reporting period (valuation allowance expense) 185 100
Consumption –130 0
Reversals (appreciation in value of initially written-off receivables) 0 –193
Currency translation effects –67 2
Valuation allowances as of December 31 129 141
The impairment of trade receivables is entered for the most part in allowance accounts. The
decision whether to recognize a contingency risk through an allowance account or a direct write-
down on the receivable depends on the assessment of the probability of debt loss. If receivables
are considered unrecoverable, the corresponding impaired asset is derecognized.
The following table provides information on the credit risk carried by financial assets.
Neither impaired nor overdue as of the
reporting date
Not impaired as of the reporting date and overdue in the following time bands
thousand Euro Book value Less than 30 days
Between 30 and 60 days
Between 61 and 90 days
Between 91 and 180 days
Between 181 and 360 days
More than 360 days
Trade receivables 31.12.2014 26,611 7,041 834 18 65 295 138
Other financial assets 31.12.2014 7,787 0 0 0 0 0 0
Trade receivables 31.12.2013 32,902 4,531 577 26 117 19 7
Other financial assets 31.12.2013 5,399 0 0 0 0 0 0
Consolidated financial statements – Notes
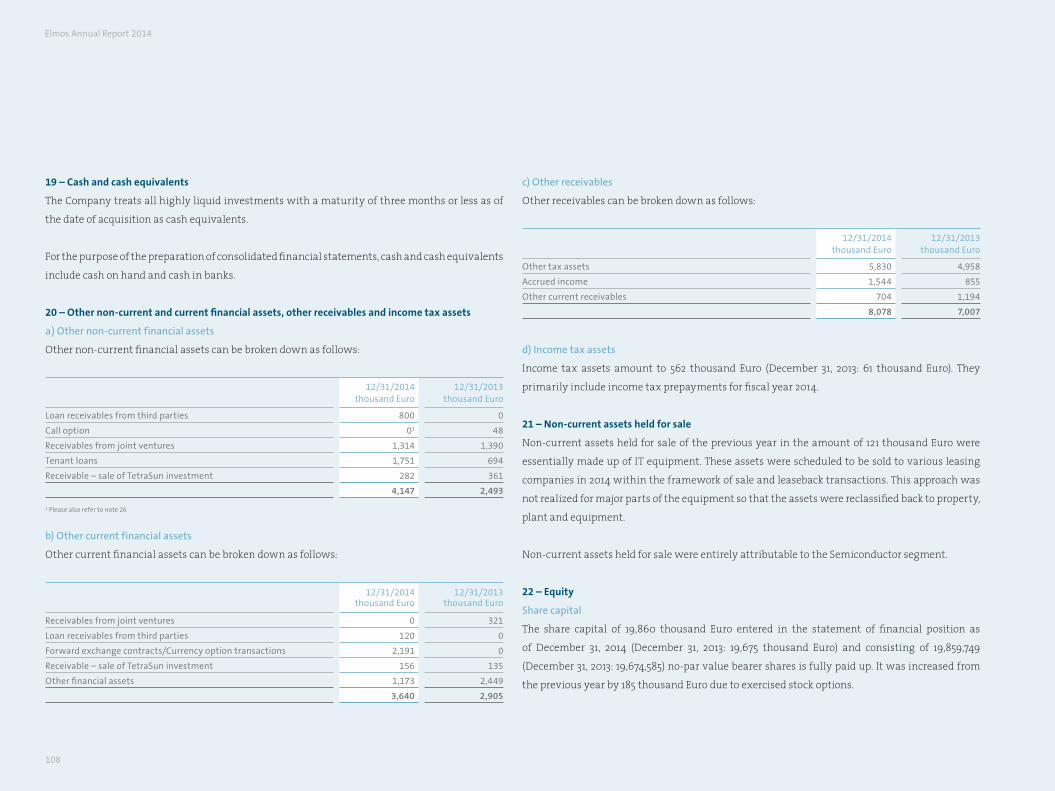
108
19 – Cash and cash equivalents
The Company treats all highly liquid investments with a maturity of three months or less as of
the date of acquisition as cash equivalents.
For the purpose of the preparation of consolidated financial statements, cash and cash equivalents
include cash on hand and cash in banks.
20 – other non-current and current financial assets, other receivables and income tax assets
a) Other non-current financial assets
Other non-current financial assets can be broken down as follows:
12/31/2014thousand Euro
12/31/2013thousand Euro
Loan receivables from third parties 800 0
Call option 01 48
Receivables from joint ventures 1,314 1,390
Tenant loans 1,751 694
Receivable – sale of TetraSun investment 282 361
4,147 2,493
1 Please also refer to note 26
b) Other current financial assets
Other current financial assets can be broken down as follows:
12/31/2014thousand Euro
12/31/2013thousand Euro
Receivables from joint ventures 0 321
Loan receivables from third parties 120 0
Forward exchange contracts/Currency option transactions 2,191 0
Receivable – sale of TetraSun investment 156 135
Other financial assets 1,173 2,449
3,640 2,905
c) Other receivables
Other receivables can be broken down as follows:
12/31/2014thousand Euro
12/31/2013thousand Euro
Other tax assets 5,830 4,958
Accrued income 1,544 855
Other current receivables 704 1,194
8,078 7,007
d) Income tax assets
Income tax assets amount to 562 thousand Euro (December 31, 2013: 61 thousand Euro). They
primarily include income tax prepayments for fiscal year 2014.
21 – non-current assets held for sale
Non-current assets held for sale of the previous year in the amount of 121 thousand Euro were
essentially made up of IT equipment. These assets were scheduled to be sold to various leasing
companies in 2014 within the framework of sale and leaseback transactions. This approach was
not realized for major parts of the equipment so that the assets were reclassified back to property,
plant and equipment.
Non-current assets held for sale were entirely attributable to the Semiconductor segment.
22 – equity
Share capital
The share capital of 19,860 thousand Euro entered in the statement of financial position as
of December 31, 2014 (December 31, 2013: 19,675 thousand Euro) and consisting of 19,859,749
(December 31, 2013: 19,674,585) no-par value bearer shares is fully paid up. It was increased from
the previous year by 185 thousand Euro due to exercised stock options.
Elmos Annual Report 2014
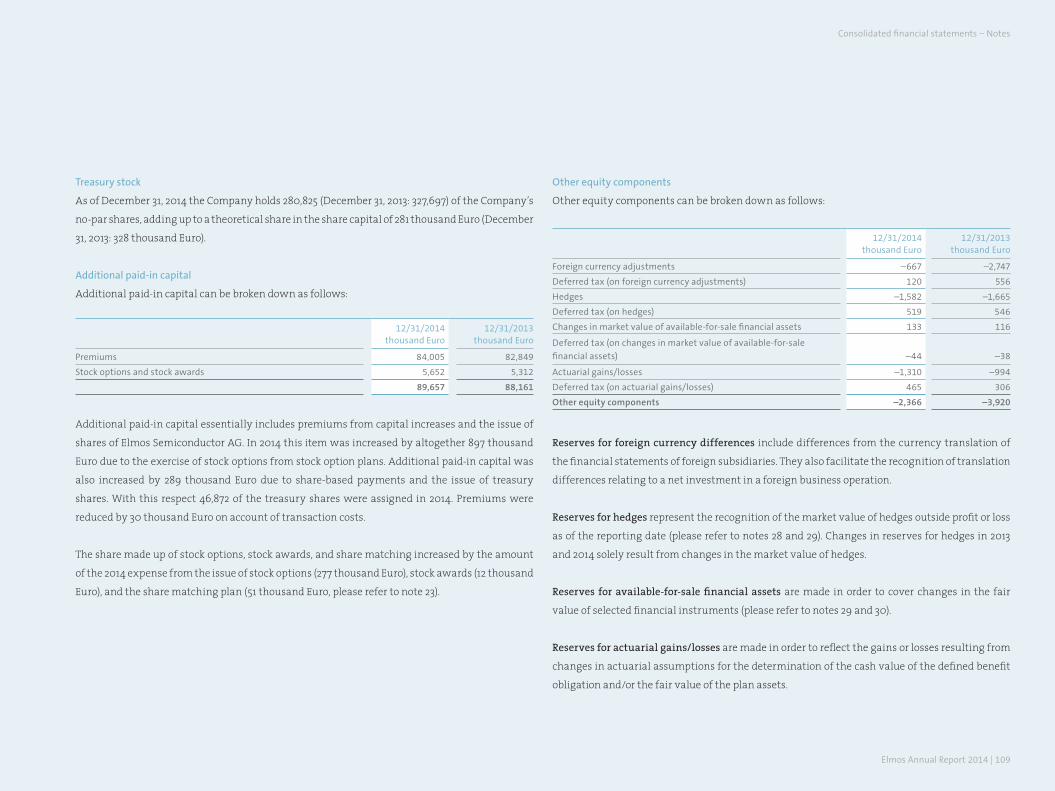
Elmos Annual Report 2014 | 109
Treasury stock
As of December 31, 2014 the Company holds 280,825 (December 31, 2013: 327,697) of the Company’s
no-par shares, adding up to a theoretical share in the share capital of 281 thousand Euro (December
31, 2013: 328 thousand Euro).
Additional paid-in capital
Additional paid-in capital can be broken down as follows:
12/31/2014thousand Euro
12/31/2013thousand Euro
Premiums 84,005 82,849
Stock options and stock awards 5,652 5,312
89,657 88,161
Additional paid-in capital essentially includes premiums from capital increases and the issue of
shares of Elmos Semiconductor AG. In 2014 this item was increased by altogether 897 thousand
Euro due to the exercise of stock options from stock option plans. Additional paid-in capital was
also increased by 289 thousand Euro due to share-based payments and the issue of treasury
shares. With this respect 46,872 of the treasury shares were assigned in 2014. Premiums were
reduced by 30 thousand Euro on account of transaction costs.
The share made up of stock options, stock awards, and share matching increased by the amount
of the 2014 expense from the issue of stock options (277 thousand Euro), stock awards (12 thousand
Euro), and the share matching plan (51 thousand Euro, please refer to note 23).
Other equity components
Other equity components can be broken down as follows:
12/31/2014thousand Euro
12/31/2013thousand Euro
Foreign currency adjustments –667 –2,747
Deferred tax (on foreign currency adjustments) 120 556
Hedges –1,582 –1,665
Deferred tax (on hedges) 519 546
Changes in market value of available-for-sale financial assets 133 116
Deferred tax (on changes in market value of available-for-sale
financial assets) –44 –38
Actuarial gains/losses –1,310 –994
Deferred tax (on actuarial gains/losses) 465 306
Other equity components –2,366 –3,920
Reserves for foreign currency differences include differences from the currency translation of
the financial statements of foreign subsidiaries. They also facilitate the recognition of translation
differences relating to a net investment in a foreign business operation.
Reserves for hedges represent the recognition of the market value of hedges outside profit or loss
as of the reporting date (please refer to notes 28 and 29). Changes in reserves for hedges in 2013
and 2014 solely result from changes in the market value of hedges.
Reserves for available-for-sale financial assets are made in order to cover changes in the fair
value of selected financial instruments (please refer to notes 29 and 30).
Reserves for actuarial gains/losses are made in order to reflect the gains or losses resulting from
changes in actuarial assumptions for the determination of the cash value of the defined benefit
obligation and/or the fair value of the plan assets.
Consolidated financial statements – Notes
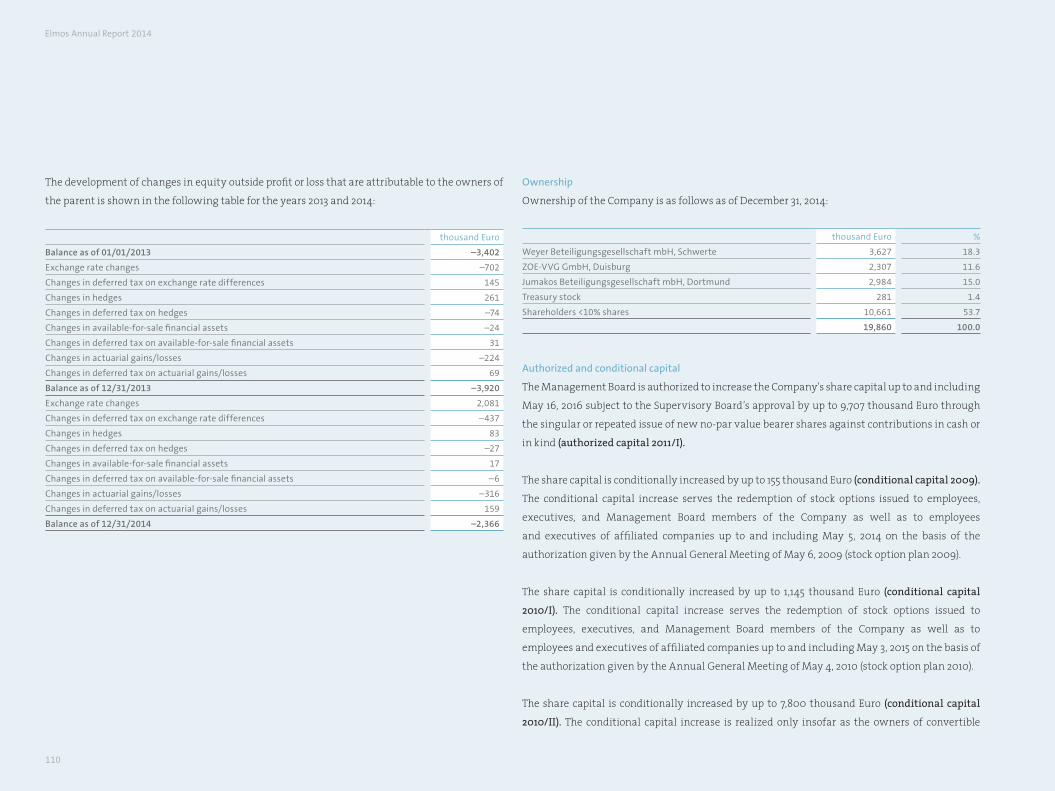
110
The development of changes in equity outside profit or loss that are attributable to the owners of
the parent is shown in the following table for the years 2013 and 2014:
thousand Euro
Balance as of 01/01/2013 –3,402
Exchange rate changes –702
Changes in deferred tax on exchange rate differences 145
Changes in hedges 261
Changes in deferred tax on hedges –74
Changes in available-for-sale financial assets –24
Changes in deferred tax on available-for-sale financial assets 31
Changes in actuarial gains/losses –224
Changes in deferred tax on actuarial gains/losses 69
Balance as of 12/31/2013 –3,920
Exchange rate changes 2,081
Changes in deferred tax on exchange rate differences –437
Changes in hedges 83
Changes in deferred tax on hedges –27
Changes in available-for-sale financial assets 17
Changes in deferred tax on available-for-sale financial assets –6
Changes in actuarial gains/losses –316
Changes in deferred tax on actuarial gains/losses 159
Balance as of 12/31/2014 –2,366
Ownership
Ownership of the Company is as follows as of December 31, 2014:
thousand Euro %
Weyer Beteiligungsgesellschaft mbH, Schwerte 3,627 18.3
ZOE-vvG GmbH, Duisburg 2,307 11.6
Jumakos Beteiligungsgesellschaft mbH, Dortmund 2,984 15.0
Treasury stock 281 1.4
Shareholders <10% shares 10,661 53.7
19,860 100.0
Authorized and conditional capital
The Management Board is authorized to increase the Company's share capital up to and including
May 16, 2016 subject to the Supervisory Board’s approval by up to 9,707 thousand Euro through
the singular or repeated issue of new no-par value bearer shares against contributions in cash or
in kind (authorized capital 2011/I).
The share capital is conditionally increased by up to 155 thousand Euro (conditional capital 2009).
The conditional capital increase serves the redemption of stock options issued to employees,
executives, and Management Board members of the Company as well as to employees
and executives of affiliated companies up to and including May 5, 2014 on the basis of the
authorization given by the Annual General Meeting of May 6, 2009 (stock option plan 2009).
The share capital is conditionally increased by up to 1,145 thousand Euro (conditional capital
2010/I). The conditional capital increase serves the redemption of stock options issued to
employees, executives, and Management Board members of the Company as well as to
employees and executives of affiliated companies up to and including May 3, 2015 on the basis of
the authorization given by the Annual General Meeting of May 4, 2010 (stock option plan 2010).
The share capital is conditionally increased by up to 7,800 thousand Euro (conditional capital
2010/II). The conditional capital increase is realized only insofar as the owners of convertible
Elmos Annual Report 2014
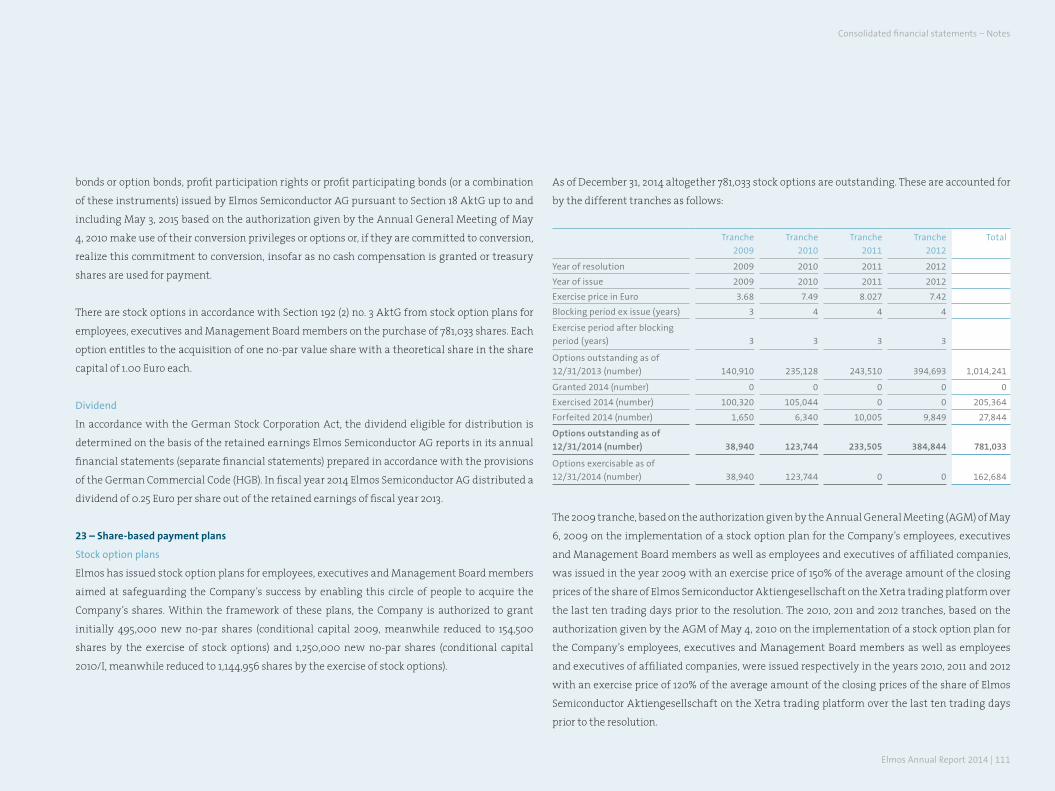
Elmos Annual Report 2014 | 111
bonds or option bonds, profit participation rights or profit participating bonds (or a combination
of these instruments) issued by Elmos Semiconductor AG pursuant to Section 18 AktG up to and
including May 3, 2015 based on the authorization given by the Annual General Meeting of May
4, 2010 make use of their conversion privileges or options or, if they are committed to conversion,
realize this commitment to conversion, insofar as no cash compensation is granted or treasury
shares are used for payment.
There are stock options in accordance with Section 192 (2) no. 3 AktG from stock option plans for
employees, executives and Management Board members on the purchase of 781,033 shares. Each
option entitles to the acquisition of one no-par value share with a theoretical share in the share
capital of 1.00 Euro each.
Dividend
In accordance with the German Stock Corporation Act, the dividend eligible for distribution is
determined on the basis of the retained earnings Elmos Semiconductor AG reports in its annual
financial statements (separate financial statements) prepared in accordance with the provisions
of the German Commercial Code (HGB). In fiscal year 2014 Elmos Semiconductor AG distributed a
dividend of 0.25 Euro per share out of the retained earnings of fiscal year 2013.
23 – Share-based payment plans
Stock option plans
Elmos has issued stock option plans for employees, executives and Management Board members
aimed at safeguarding the Company’s success by enabling this circle of people to acquire the
Company’s shares. Within the framework of these plans, the Company is authorized to grant
initially 495,000 new no-par shares (conditional capital 2009, meanwhile reduced to 154,500
shares by the exercise of stock options) and 1,250,000 new no-par shares (conditional capital
2010/I, meanwhile reduced to 1,144,956 shares by the exercise of stock options).
As of December 31, 2014 altogether 781,033 stock options are outstanding. These are accounted for
by the different tranches as follows:
Tranche
2009
Tranche
2010
Tranche
2011
Tranche
2012
Total
Year of resolution 2009 2010 2011 2012
Year of issue 2009 2010 2011 2012
Exercise price in Euro 3.68 7.49 8.027 7.42
Blocking period ex issue (years) 3 4 4 4
Exercise period after blocking
period (years) 3 3 3 3
Options outstanding as of
12/31/2013 (number) 140,910 235,128 243,510 394,693 1,014,241
Granted 2014 (number) 0 0 0 0 0
Exercised 2014 (number) 100,320 105,044 0 0 205,364
Forfeited 2014 (number) 1,650 6,340 10,005 9,849 27,844
Options outstanding as of
12/31/2014 (number) 38,940 123,744 233,505 384,844 781,033
Options exercisable as of
12/31/2014 (number) 38,940 123,744 0 0 162,684
The 2009 tranche, based on the authorization given by the Annual General Meeting (AGM) of May
6, 2009 on the implementation of a stock option plan for the Company’s employees, executives
and Management Board members as well as employees and executives of affiliated companies,
was issued in the year 2009 with an exercise price of 150% of the average amount of the closing
prices of the share of Elmos Semiconductor Aktiengesellschaft on the Xetra trading platform over
the last ten trading days prior to the resolution. The 2010, 2011 and 2012 tranches, based on the
authorization given by the AGM of May 4, 2010 on the implementation of a stock option plan for
the Company’s employees, executives and Management Board members as well as employees
and executives of affiliated companies, were issued respectively in the years 2010, 2011 and 2012
with an exercise price of 120% of the average amount of the closing prices of the share of Elmos
Semiconductor Aktiengesellschaft on the Xetra trading platform over the last ten trading days
prior to the resolution.
Consolidated financial statements – Notes
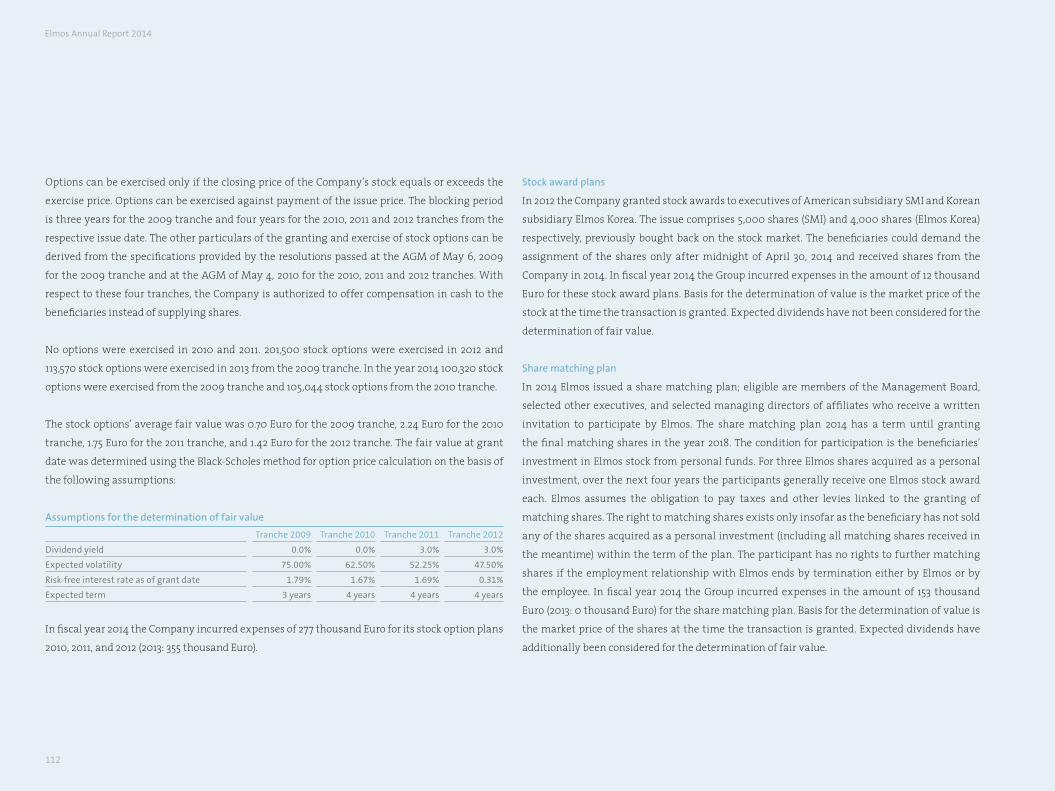
112
Options can be exercised only if the closing price of the Company’s stock equals or exceeds the
exercise price. Options can be exercised against payment of the issue price. The blocking period
is three years for the 2009 tranche and four years for the 2010, 2011 and 2012 tranches from the
respective issue date. The other particulars of the granting and exercise of stock options can be
derived from the specifications provided by the resolutions passed at the AGM of May 6, 2009
for the 2009 tranche and at the AGM of May 4, 2010 for the 2010, 2011 and 2012 tranches. With
respect to these four tranches, the Company is authorized to offer compensation in cash to the
beneficiaries instead of supplying shares.
No options were exercised in 2010 and 2011. 201,500 stock options were exercised in 2012 and
113,570 stock options were exercised in 2013 from the 2009 tranche. In the year 2014 100,320 stock
options were exercised from the 2009 tranche and 105,044 stock options from the 2010 tranche.
The stock options’ average fair value was 0.70 Euro for the 2009 tranche, 2.24 Euro for the 2010
tranche, 1.75 Euro for the 2011 tranche, and 1.42 Euro for the 2012 tranche. The fair value at grant
date was determined using the Black-Scholes method for option price calculation on the basis of
the following assumptions:
Assumptions for the determination of fair value
Tranche 2009 Tranche 2010 Tranche 2011 Tranche 2012
Dividend yield 0.0% 0.0% 3.0% 3.0%
Expected volatility 75.00% 62.50% 52.25% 47.50%
Risk-free interest rate as of grant date 1.79% 1.67% 1.69% 0.31%
Expected term 3 years 4 years 4 years 4 years
In fiscal year 2014 the Company incurred expenses of 277 thousand Euro for its stock option plans
2010, 2011, and 2012 (2013: 355 thousand Euro).
Stock award plans
In 2012 the Company granted stock awards to executives of American subsidiary SMI and Korean
subsidiary Elmos Korea. The issue comprises 5,000 shares (SMI) and 4,000 shares (Elmos Korea)
respectively, previously bought back on the stock market. The beneficiaries could demand the
assignment of the shares only after midnight of April 30, 2014 and received shares from the
Company in 2014. In fiscal year 2014 the Group incurred expenses in the amount of 12 thousand
Euro for these stock award plans. Basis for the determination of value is the market price of the
stock at the time the transaction is granted. Expected dividends have not been considered for the
determination of fair value.
Share matching plan
In 2014 Elmos issued a share matching plan; eligible are members of the Management Board,
selected other executives, and selected managing directors of affiliates who receive a written
invitation to participate by Elmos. The share matching plan 2014 has a term until granting
the final matching shares in the year 2018. The condition for participation is the beneficiaries’
investment in Elmos stock from personal funds. For three Elmos shares acquired as a personal
investment, over the next four years the participants generally receive one Elmos stock award
each. Elmos assumes the obligation to pay taxes and other levies linked to the granting of
matching shares. The right to matching shares exists only insofar as the beneficiary has not sold
any of the shares acquired as a personal investment (including all matching shares received in
the meantime) within the term of the plan. The participant has no rights to further matching
shares if the employment relationship with Elmos ends by termination either by Elmos or by
the employee. In fiscal year 2014 the Group incurred expenses in the amount of 153 thousand
Euro (2013: 0 thousand Euro) for the share matching plan. Basis for the determination of value is
the market price of the shares at the time the transaction is granted. Expected dividends have
additionally been considered for the determination of fair value.
Elmos Annual Report 2014
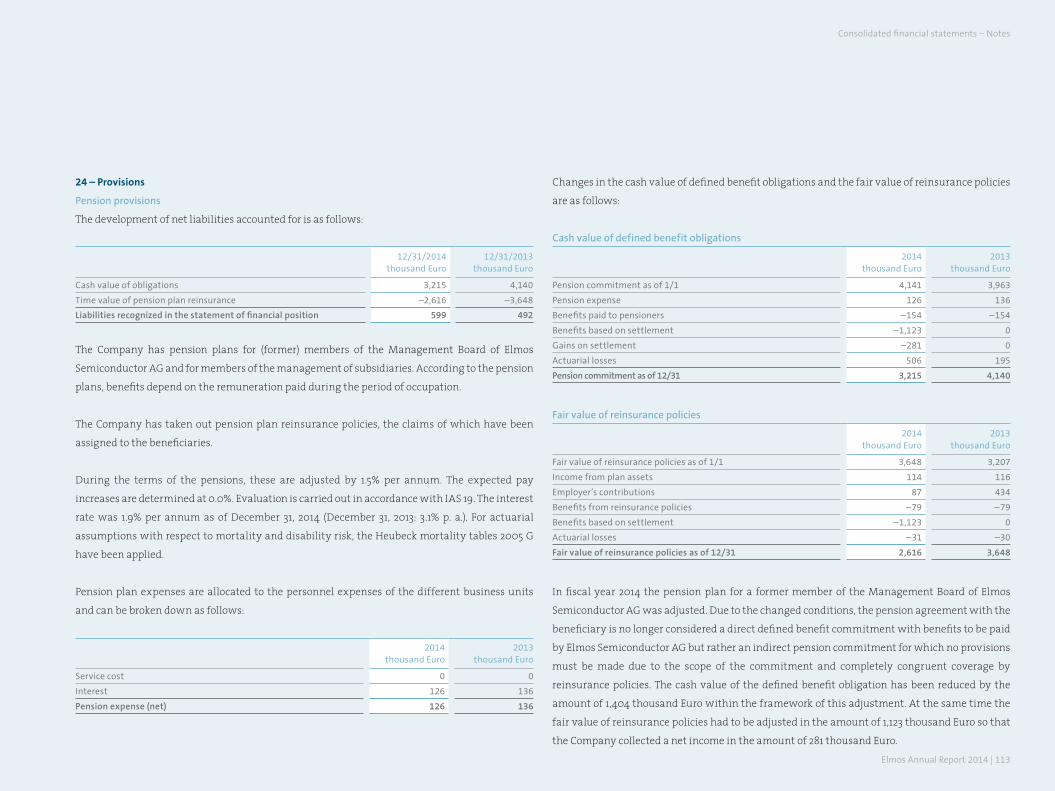
Elmos Annual Report 2014 | 113
24 – Provisions
Pension provisions
The development of net liabilities accounted for is as follows:
12/31/2014thousand Euro
12/31/2013thousand Euro
Cash value of obligations 3,215 4,140
Time value of pension plan reinsurance –2,616 –3,648
Liabilities recognized in the statement of financial position 599 492
The Company has pension plans for (former) members of the Management Board of Elmos
Semiconductor AG and for members of the management of subsidiaries. According to the pension
plans, benefits depend on the remuneration paid during the period of occupation.
The Company has taken out pension plan reinsurance policies, the claims of which have been
assigned to the beneficiaries.
During the terms of the pensions, these are adjusted by 1.5% per annum. The expected pay
increases are determined at 0.0%. Evaluation is carried out in accordance with IAS 19. The interest
rate was 1.9% per annum as of December 31, 2014 (December 31, 2013: 3.1% p. a.). For actuarial
assumptions with respect to mortality and disability risk, the Heubeck mortality tables 2005 G
have been applied.
Pension plan expenses are allocated to the personnel expenses of the different business units
and can be broken down as follows:
2014thousand Euro
2013thousand Euro
Service cost 0 0
Interest 126 136
Pension expense (net) 126 136
Changes in the cash value of defined benefit obligations and the fair value of reinsurance policies
are as follows:
Cash value of defined benefit obligations
2014thousand Euro
2013thousand Euro
Pension commitment as of 1/1 4,141 3,963
Pension expense 126 136
Benefits paid to pensioners –154 –154
Benefits based on settlement –1,123 0
Gains on settlement –281 0
Actuarial losses 506 195
Pension commitment as of 12/31 3,215 4,140
Fair value of reinsurance policies
2014thousand Euro
2013thousand Euro
Fair value of reinsurance policies as of 1/1 3,648 3,207
Income from plan assets 114 116
Employer’s contributions 87 434
Benefits from reinsurance policies –79 –79
Benefits based on settlement –1,123 0
Actuarial losses –31 –30
Fair value of reinsurance policies as of 12/31 2,616 3,648
In fiscal year 2014 the pension plan for a former member of the Management Board of Elmos
Semiconductor AG was adjusted. Due to the changed conditions, the pension agreement with the
beneficiary is no longer considered a direct defined benefit commitment with benefits to be paid
by Elmos Semiconductor AG but rather an indirect pension commitment for which no provisions
must be made due to the scope of the commitment and completely congruent coverage by
reinsurance policies. The cash value of the defined benefit obligation has been reduced by the
amount of 1,404 thousand Euro within the framework of this adjustment. At the same time the
fair value of reinsurance policies had to be adjusted in the amount of 1,123 thousand Euro so that
the Company collected a net income in the amount of 281 thousand Euro.
Consolidated financial statements – Notes
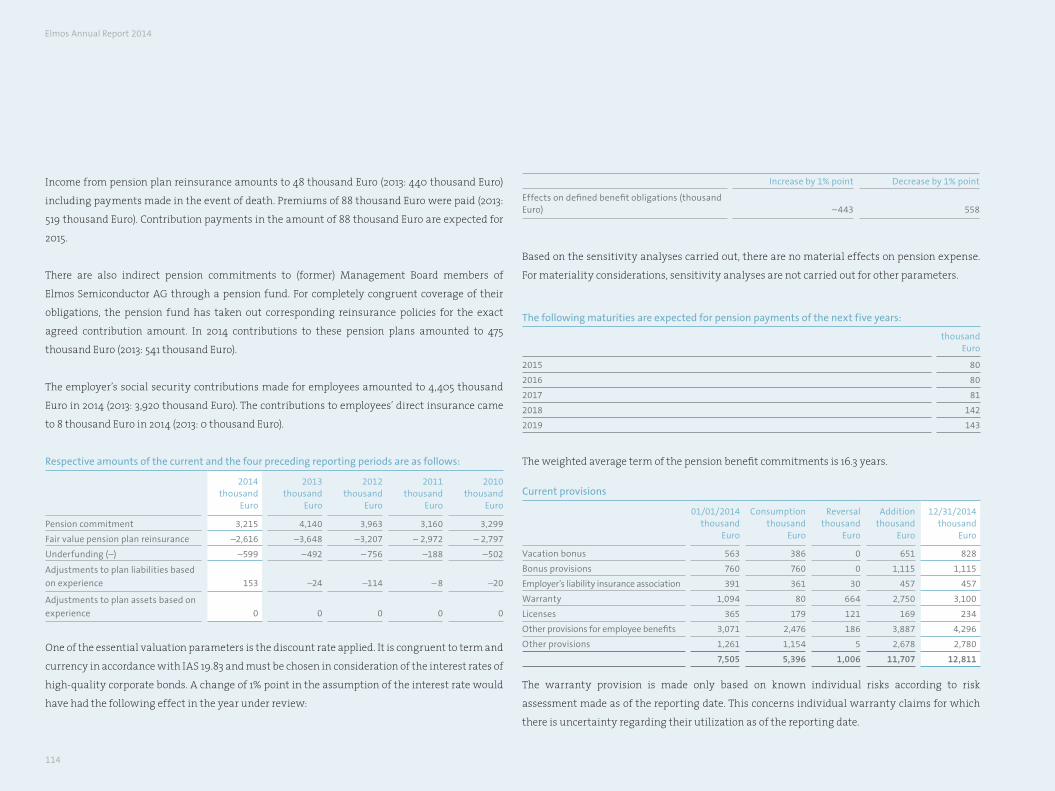
114
Income from pension plan reinsurance amounts to 48 thousand Euro (2013: 440 thousand Euro)
including payments made in the event of death. Premiums of 88 thousand Euro were paid (2013:
519 thousand Euro). Contribution payments in the amount of 88 thousand Euro are expected for
2015.
There are also indirect pension commitments to (former) Management Board members of
Elmos Semiconductor AG through a pension fund. For completely congruent coverage of their
obligations, the pension fund has taken out corresponding reinsurance policies for the exact
agreed contribution amount. In 2014 contributions to these pension plans amounted to 475
thousand Euro (2013: 541 thousand Euro).
The employer’s social security contributions made for employees amounted to 4,405 thousand
Euro in 2014 (2013: 3,920 thousand Euro). The contributions to employees’ direct insurance came
to 8 thousand Euro in 2014 (2013: 0 thousand Euro).
Respective amounts of the current and the four preceding reporting periods are as follows:
2014thousand
Euro
2013thousand
Euro
2012thousand
Euro
2011thousand
Euro
2010thousand
Euro
Pension commitment 3,215 4,140 3,963 3,160 3,299
Fair value pension plan reinsurance –2,616 –3,648 –3,207 – 2,972 – 2,797
Underfunding (–) –599 –492 – 756 –188 –502
Adjustments to plan liabilities based
on experience 153 –24 –114 – 8 –20
Adjustments to plan assets based on
experience 0 0 0 0 0
One of the essential valuation parameters is the discount rate applied. It is congruent to term and
currency in accordance with IAS 19.83 and must be chosen in consideration of the interest rates of
high-quality corporate bonds. A change of 1% point in the assumption of the interest rate would
have had the following effect in the year under review:
Increase by 1% point Decrease by 1% point
Effects on defined benefit obligations (thousand Euro) –443 558
Based on the sensitivity analyses carried out, there are no material effects on pension expense.
For materiality considerations, sensitivity analyses are not carried out for other parameters.
The following maturities are expected for pension payments of the next five years:
thousand Euro
2015 80
2016 80
2017 81
2018 142
2019 143
The weighted average term of the pension benefit commitments is 16.3 years.
Current provisions
01/01/2014thousand
Euro
Consumption thousand
Euro
Reversal thousand
Euro
Addition thousand
Euro
12/31/2014thousand
Euro
vacation bonus 563 386 0 651 828
Bonus provisions 760 760 0 1,115 1,115
Employer’s liability insurance association 391 361 30 457 457
Warranty 1,094 80 664 2,750 3,100
Licenses 365 179 121 169 234
Other provisions for employee benefits 3,071 2,476 186 3,887 4,296
Other provisions 1,261 1,154 5 2,678 2,780
7,505 5,396 1,006 11,707 12,811
The warranty provision is made only based on known individual risks according to risk
assessment made as of the reporting date. This concerns individual warranty claims for which
there is uncertainty regarding their utilization as of the reporting date.
Elmos Annual Report 2014
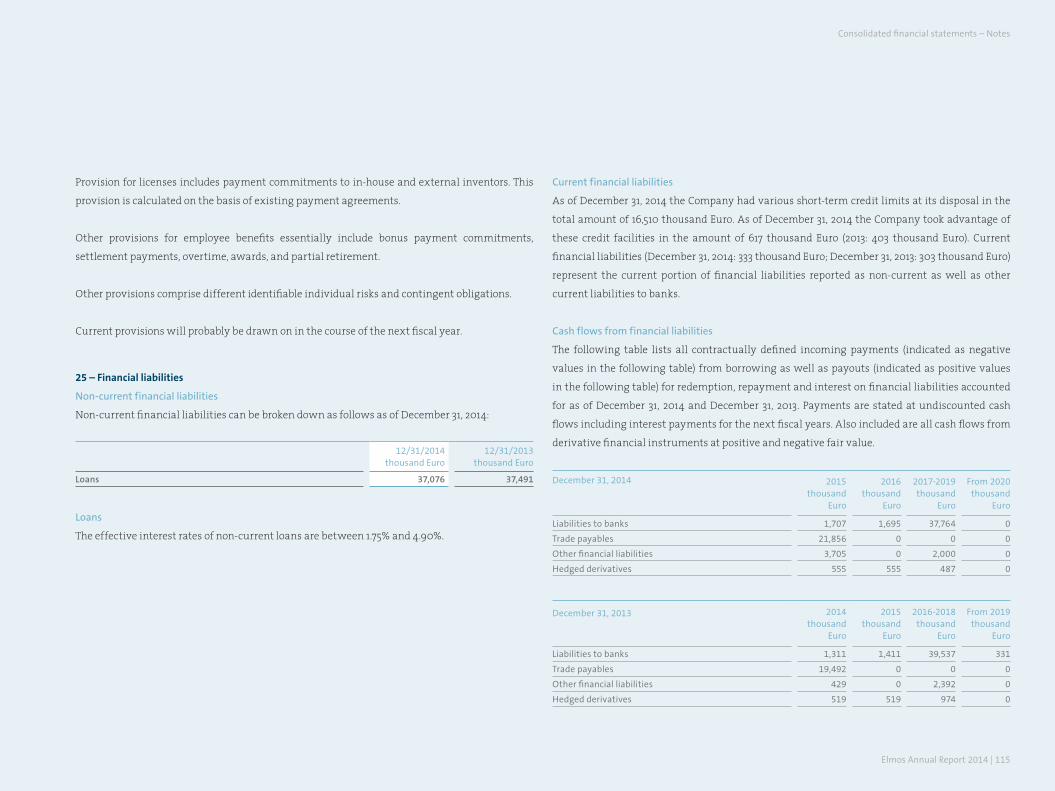
Elmos Annual Report 2014 | 115
Provision for licenses includes payment commitments to in-house and external inventors. This
provision is calculated on the basis of existing payment agreements.
Other provisions for employee benefits essentially include bonus payment commitments,
settlement payments, overtime, awards, and partial retirement.
Other provisions comprise different identifiable individual risks and contingent obligations.
Current provisions will probably be drawn on in the course of the next fiscal year.
25 – financial liabilities
Non-current financial liabilities
Non-current financial liabilities can be broken down as follows as of December 31, 2014:
12/31/2014thousand Euro
12/31/2013thousand Euro
Loans 37,076 37,491
Loans
The effective interest rates of non-current loans are between 1.75% and 4.90%.
Current financial liabilities
As of December 31, 2014 the Company had various short-term credit limits at its disposal in the
total amount of 16,510 thousand Euro. As of December 31, 2014 the Company took advantage of
these credit facilities in the amount of 617 thousand Euro (2013: 403 thousand Euro). Current
financial liabilities (December 31, 2014: 333 thousand Euro; December 31, 2013: 303 thousand Euro)
represent the current portion of financial liabilities reported as non-current as well as other
current liabilities to banks.
Cash flows from financial liabilities
The following table lists all contractually defined incoming payments (indicated as negative
values in the following table) from borrowing as well as payouts (indicated as positive values
in the following table) for redemption, repayment and interest on financial liabilities accounted
for as of December 31, 2014 and December 31, 2013. Payments are stated at undiscounted cash
flows including interest payments for the next fiscal years. Also included are all cash flows from
derivative financial instruments at positive and negative fair value.
December 31, 2014 2015thousand
Euro
2016thousand
Euro
2017-2019thousand
Euro
From 2020 thousand
Euro
Liabilities to banks 1,707 1,695 37,764 0
Trade payables 21,856 0 0 0
Other financial liabilities 3,705 0 2,000 0
Hedged derivatives 555 555 487 0
December 31, 2013 2014thousand
Euro
2015thousand
Euro
2016-2018thousand
Euro
From 2019thousand
Euro
Liabilities to banks 1,311 1,411 39,537 331
Trade payables 19,492 0 0 0
Other financial liabilities 429 0 2,392 0
Hedged derivatives 519 519 974 0
Consolidated financial statements – Notes
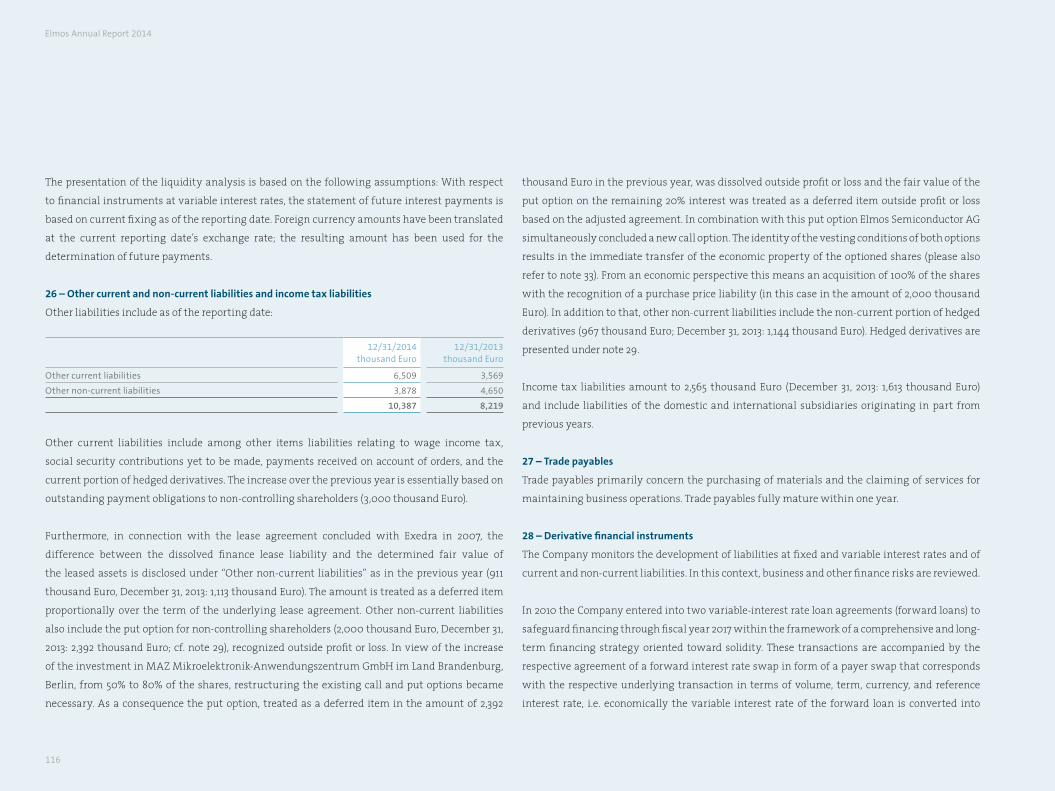
116
The presentation of the liquidity analysis is based on the following assumptions: With respect
to financial instruments at variable interest rates, the statement of future interest payments is
based on current fixing as of the reporting date. Foreign currency amounts have been translated
at the current reporting date’s exchange rate; the resulting amount has been used for the
determination of future payments.
26 – other current and non-current liabilities and income tax liabilities
Other liabilities include as of the reporting date:
12/31/2014thousand Euro
12/31/2013thousand Euro
Other current liabilities 6,509 3,569
Other non-current liabilities 3,878 4,650
10,387 8,219
Other current liabilities include among other items liabilities relating to wage income tax,
social security contributions yet to be made, payments received on account of orders, and the
current portion of hedged derivatives. The increase over the previous year is essentially based on
outstanding payment obligations to non-controlling shareholders (3,000 thousand Euro).
Furthermore, in connection with the lease agreement concluded with Exedra in 2007, the
difference between the dissolved finance lease liability and the determined fair value of
the leased assets is disclosed under “Other non-current liabilities” as in the previous year (911
thousand Euro, December 31, 2013: 1,113 thousand Euro). The amount is treated as a deferred item
proportionally over the term of the underlying lease agreement. Other non-current liabilities
also include the put option for non-controlling shareholders (2,000 thousand Euro, December 31,
2013: 2,392 thousand Euro; cf. note 29), recognized outside profit or loss. In view of the increase
of the investment in MAZ Mikroelektronik-Anwendungszentrum GmbH im Land Brandenburg,
Berlin, from 50% to 80% of the shares, restructuring the existing call and put options became
necessary. As a consequence the put option, treated as a deferred item in the amount of 2,392
thousand Euro in the previous year, was dissolved outside profit or loss and the fair value of the
put option on the remaining 20% interest was treated as a deferred item outside profit or loss
based on the adjusted agreement. In combination with this put option Elmos Semiconductor AG
simultaneously concluded a new call option. The identity of the vesting conditions of both options
results in the immediate transfer of the economic property of the optioned shares (please also
refer to note 33). From an economic perspective this means an acquisition of 100% of the shares
with the recognition of a purchase price liability (in this case in the amount of 2,000 thousand
Euro). In addition to that, other non-current liabilities include the non-current portion of hedged
derivatives (967 thousand Euro; December 31, 2013: 1,144 thousand Euro). Hedged derivatives are
presented under note 29.
Income tax liabilities amount to 2,565 thousand Euro (December 31, 2013: 1,613 thousand Euro)
and include liabilities of the domestic and international subsidiaries originating in part from
previous years.
27 – trade payables
Trade payables primarily concern the purchasing of materials and the claiming of services for
maintaining business operations. Trade payables fully mature within one year.
28 – Derivative financial instruments
The Company monitors the development of liabilities at fixed and variable interest rates and of
current and non-current liabilities. In this context, business and other finance risks are reviewed.
In 2010 the Company entered into two variable-interest rate loan agreements (forward loans) to
safeguard financing through fiscal year 2017 within the framework of a comprehensive and long-
term financing strategy oriented toward solidity. These transactions are accompanied by the
respective agreement of a forward interest rate swap in form of a payer swap that corresponds
with the respective underlying transaction in terms of volume, term, currency, and reference
interest rate, i.e. economically the variable interest rate of the forward loan is converted into
Elmos Annual Report 2014
Elmos Annual Report 2014 | 117
a fixed interest rate. The agreed forward loan agreements in the amounts of 15 million Euro
(term: August 1, 2013 to September 30, 2017) and 2.5 million Euro (term: November 20, 2012 to
November 20, 2017) form a hedging relationship with the respective forward interest rate swap in
accordance with IAS 39, with the forward loan being declared as hedged item and the respective
corresponding forward interest rate swap being declared as hedge. The reverse cash flows of
forward loans and corresponding forward interest rate swaps are expected to balance each other
completely over the respective terms. Due to the correspondence of the material parameters and
terms and conditions of hedged item and hedge, the hedge is generally suited to provide effective
protection for the hedged item. The hedge as forward interest rate swap is suited to adequately
cover the risk of interest rate changes which affects the performance of the hedged item. The
effectiveness of the hedging connection is regarded as highly effective for the beginning, the
future, and the term of the hedging relationship. As the material terms and conditions and the
parameters of hedged item and hedge are matching (critical term match) and as the transaction
as a whole can also be referred to as a perfect micro hedge, the conditions for an assessment as
“highly effective” are entirely given. The assessment of effectiveness based on a comparison
of the critical terms will be conducted as of the following reporting dates as well. A review
conducted as of December 31, 2014 did result in no changes to the assessment as “highly effective”.
The interest rate swap is recognized at its dirty fair value (market value including accrued interest)
in the statement of financial position (please refer to note 29). The cash flow hedge provision or
the cash flow hedge market value corresponds to the clean price. Changes in the clean price of the
hedge are adjusted outside profit or loss if changes in the hedged item are outside profit or loss or
not yet to be accounted for. The equity item is dissolved if the hedged item must be recognized in
profit or loss. Deferred tax outside profit or loss is considered for the market value of the cash flow
hedge recognized in the statement of financial position.
Within the framework of the comprehensive approach described above, the Company also
concluded two fixed-interest rate forward loans in 2010 with terms until 2017 (face value 7.5
million Euro) and 2018 (face value 10 million Euro) for which there are no corresponding hedges.
The loan with a term until November 20, 2017 (7.5 million Euro) represents follow-up financing of
a loan expired as of November 20, 2012 (10 million Euro). The loan with a term until June 30, 2018
(10 million Euro) represents follow-up financing of a loan expired as of June 30, 2013. Both loans
have been reported under the Group’s financial liabilities since the beginning of the respective
terms.
The measurement of the interest rate swaps follows corresponding evaluation procedures or is
based on evaluations provided by the banks involved. The market value of interest rate swaps
accounted for is determined by applying the interest rates and credit ratings of the contracting
parties as of the reporting date on the basis of a discounted cash flow model.
The Company concluded various currency-related hedges in 2014. Those are forward exchange
rate contracts for the currency USD. With respect to the transactions expired by the end of the
year, the effects on the financial position as of December 31, 2014 are limited to the exchange
rate gains generated in the amount of 580 thousand Euro and exchange rate losses incurred
at 52 thousand Euro, reported in the consolidated income statement under the item exchange
rate gains/losses. The forward contracts that reach beyond the reporting date December 31, 2014
result in a positive market value of 2,190 thousand Euro reported in the consolidated income
statement under the item exchange rate gains/losses (please also refer to note 29). The market
value of forward exchange rate contracts is measured in application of the exchange rates as of
the reporting date based on market assessments of the corresponding banks.
Moreover, the Company concluded structured term deposit transactions providing for repayment
of the investment amount in a foreign currency (essentially USD) if a predefined USD/EUR
Consolidated financial statements – Notes
118
reference exchange rate is exceeded upon the date of maturity of the transaction. The effects on
the financial position as of December 31, 2014 of the transactions expired by the end of the year
are limited to the collected interest income, the exchange rate gains generated in the amount
of 0 thousand Euro and exchange rate losses incurred at 66 thousand Euro, reported in the
consolidated income statement under the item exchange rate gains/losses.
29 – additional information on financial instruments
Book values, measurement and fair value according to measurement categories
With respect to the classification of financial instruments, the Company follows the measurement
categories defined by IAS 39 as the spreading of risks within these measurement categories is
similar.
The book values of financial instruments such as trade receivables and trade payables essentially
correspond to the market value due to the short-term maturities of these financial instruments.
The book values of short-term and long-term securities classified as available for sale correspond
to the market value. Measurement was made on the basis of market values provided by the
involved banks as of the reporting date. Securities classified as loans and receivables were
measured at amortized cost.
The (forward) interest rate swaps reported under the item hedged derivatives (please refer to
note 28) were recognized at (negative) market value under other financial liabilities outside profit
or loss according to their respective maturities. The determination of the market values as of
December 31, 2014 was based on a discounted cash flow (DCF) model in consideration of current
interest yield curves as of the reporting date.
The market value of forward exchange contracts/currency option transactions (please refer to
note 30) was determined on the basis of the currency exchange rates provided by the involved
banks as of the reporting date.
The market value of liabilities to banks was established on the basis of market prices determined
for the same or comparable issues and of the interest rates currently offered to the Company.
With respect to other financial liabilities accounted for at fair value, the market value of the put
option for non-controlling shareholders was determined on the basis of a DCF model according
to the terms and conditions of the contract agreed on with the shareholder (please also refer to
note 26).
The following tables indicate book values and fair values of each category of financial assets and
liabilities.
Elmos Annual Report 2014
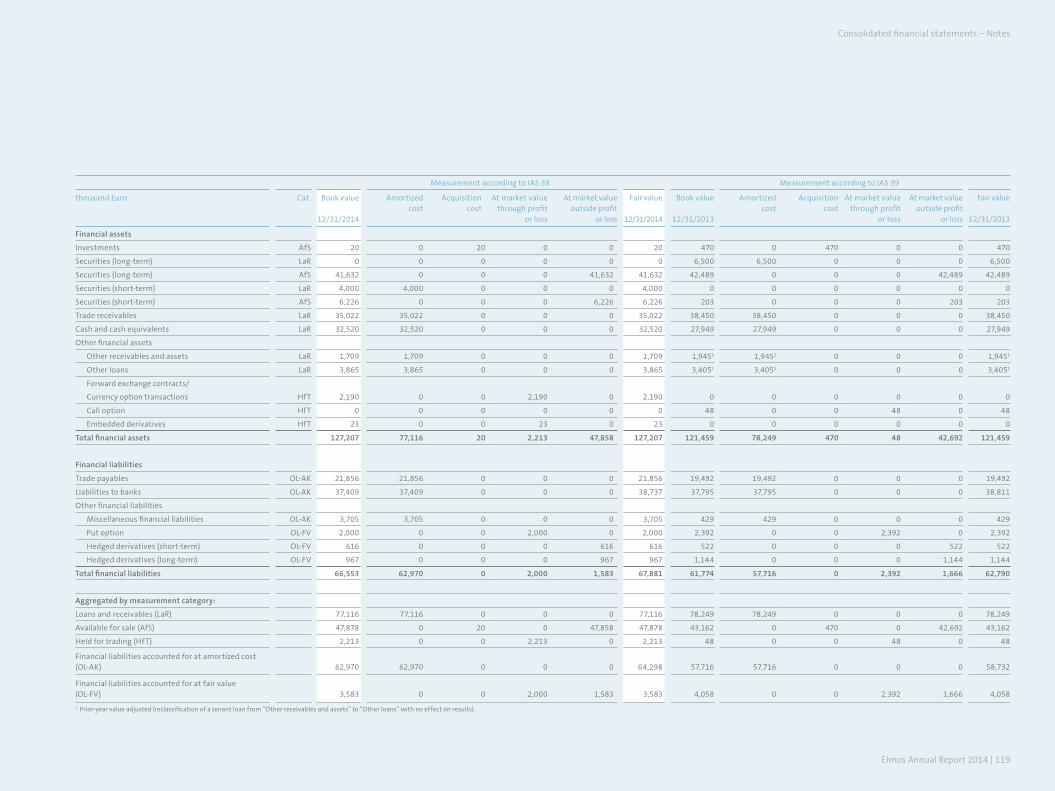
Elmos Annual Report 2014 | 119
Measurement according to IAS 39 Measurement according to IAS 39
thousand Euro Cat. Book value
12/31/2014
Amortized cost
Acquisition cost
At market value through profit
or loss
At market value outside profit
or loss
Fair value
12/31/2014
Book value
12/31/2013
Amortized cost
Acquisition cost
At market value through profit
or loss
At market value outside profit
or loss
Fair value
12/31/2013
Financial assets
Investments AfS 20 0 20 0 0 20 470 0 470 0 0 470
Securities (long-term) LaR 0 0 0 0 0 0 6,500 6,500 0 0 0 6,500
Securities (long-term) AfS 41,632 0 0 0 41,632 41,632 42,489 0 0 0 42,489 42,489
Securities (short-term) LaR 4,000 4,000 0 0 0 4,000 0 0 0 0 0 0
Securities (short-term) AfS 6,226 0 0 0 6,226 6,226 203 0 0 0 203 203
Trade receivables LaR 35,022 35,022 0 0 0 35,022 38,450 38,450 0 0 0 38,450
Cash and cash equivalents LaR 32,520 32,520 0 0 0 32,520 27,949 27,949 0 0 0 27,949
Other financial assets
Other receivables and assets LaR 1,709 1,709 0 0 0 1,709 1,9451 1,9451 0 0 0 1,9451
Other loans LaR 3,865 3,865 0 0 0 3,865 3,4051 3,4051 0 0 0 3,4051
Forward exchange contracts/
Currency option transactions HfT 2,190 0 0 2,190 0 2,190 0 0 0 0 0 0
Call option HfT 0 0 0 0 0 0 48 0 0 48 0 48
Embedded derivatives HfT 23 0 0 23 0 23 0 0 0 0 0 0
Total financial assets 127,207 77,116 20 2,213 47,858 127,207 121,459 78,249 470 48 42,692 121,459
Financial liabilities
Trade payables OL-AK 21,856 21,856 0 0 0 21,856 19,492 19,492 0 0 0 19,492
Liabilities to banks OL-AK 37,409 37,409 0 0 0 38,737 37,795 37,795 0 0 0 38,811
Other financial liabilities
Miscellaneous financial liabilities OL-AK 3,705 3,705 0 0 0 3,705 429 429 0 0 0 429
Put option OL-Fv 2,000 0 0 2,000 0 2,000 2,392 0 0 2,392 0 2,392
Hedged derivatives (short-term) OL-Fv 616 0 0 0 616 616 522 0 0 0 522 522
Hedged derivatives (long-term) OL-Fv 967 0 0 0 967 967 1,144 0 0 0 1,144 1,144
Total financial liabilities 66,553 62,970 0 2,000 1,583 67,881 61,774 57,716 0 2,392 1,666 62,790
Aggregated by measurement category:
Loans and receivables (LaR) 77,116 77,116 0 0 0 77,116 78,249 78,249 0 0 0 78,249
Available for sale (AfS) 47,878 0 20 0 47,858 47,878 43,162 0 470 0 42,692 43,162
Held for trading (HfT) 2,213 0 0 2,213 0 2,213 48 0 0 48 0 48
Financial liabilities accounted for at amortized cost (OL-AK) 62,970 62,970 0 0 0 64,298 57,716 57,716 0 0 0 58,732
Financial liabilities accounted for at fair value (OL-Fv) 3,583 0 0 2,000 1,583 3,583 4,058 0 0 2,392 1,666 4,058
1 Prior-year value adjusted (reclassification of a tenant loan from “Other receivables and assets” to “Other loans” with no effect on results).
Consolidated financial statements – Notes
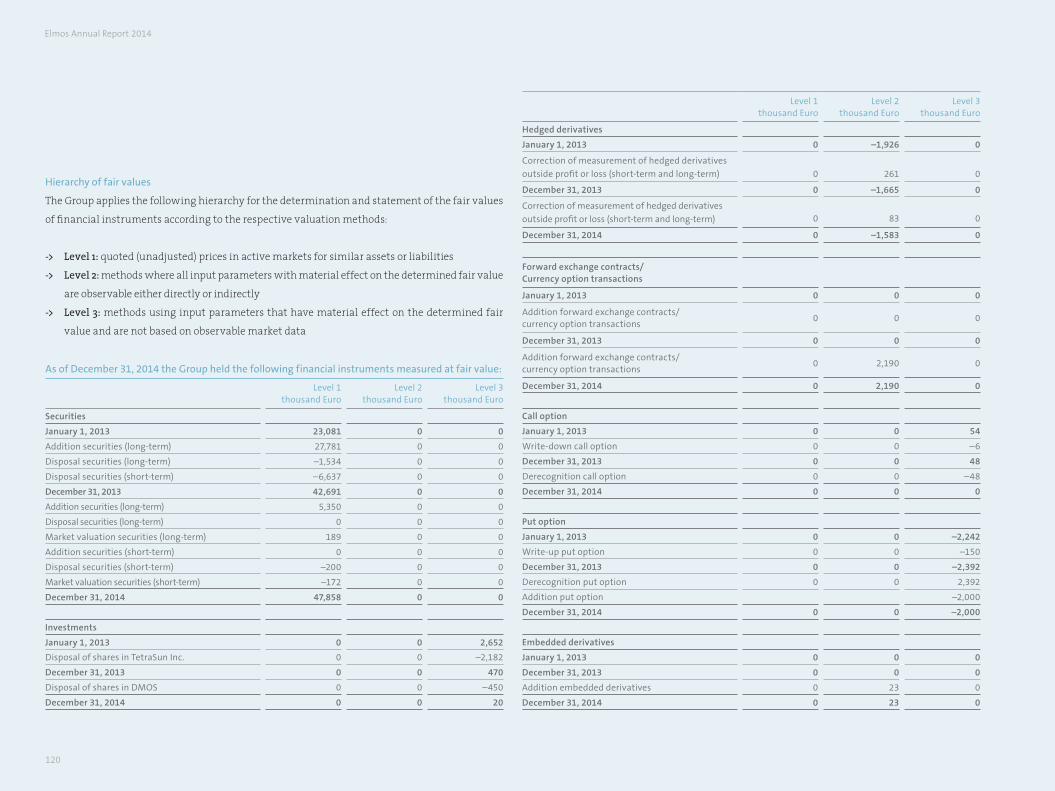
120
Hierarchy of fair values
The Group applies the following hierarchy for the determination and statement of the fair values
of financial instruments according to the respective valuation methods:
-> Level 1: quoted (unadjusted) prices in active markets for similar assets or liabilities
-> Level 2: methods where all input parameters with material effect on the determined fair value
are observable either directly or indirectly
-> Level 3: methods using input parameters that have material effect on the determined fair
value and are not based on observable market data
As of December 31, 2014 the Group held the following financial instruments measured at fair value:
Level 1thousand Euro
Level 2 thousand Euro
Level 3 thousand Euro
Securities
January 1, 2013 23,081 0 0
Addition securities (long-term) 27,781 0 0
Disposal securities (long-term) –1,534 0 0
Disposal securities (short-term) –6,637 0 0
December 31, 2013 42,691 0 0
Addition securities (long-term) 5,350 0 0
Disposal securities (long-term) 0 0 0
Market valuation securities (long-term) 189 0 0
Addition securities (short-term) 0 0 0
Disposal securities (short-term) –200 0 0
Market valuation securities (short-term) –172 0 0
December 31, 2014 47,858 0 0
Investments
January 1, 2013 0 0 2,652
Disposal of shares in TetraSun Inc. 0 0 –2,182
December 31, 2013 0 0 470
Disposal of shares in DMOS 0 0 –450
December 31, 2014 0 0 20
Level 1thousand Euro
Level 2 thousand Euro
Level 3 thousand Euro
Hedged derivatives
January 1, 2013 0 –1,926 0
Correction of measurement of hedged derivatives
outside profit or loss (short-term and long-term) 0 261 0
December 31, 2013 0 –1,665 0
Correction of measurement of hedged derivatives
outside profit or loss (short-term and long-term) 0 83 0
December 31, 2014 0 –1,583 0
Forward exchange contracts/Currency option transactions
January 1, 2013 0 0 0
Addition forward exchange contracts/currency option transactions
0 0 0
December 31, 2013 0 0 0
Addition forward exchange contracts/currency option transactions
0 2,190 0
December 31, 2014 0 2,190 0
Call option
January 1, 2013 0 0 54
Write-down call option 0 0 –6
December 31, 2013 0 0 48
Derecognition call option 0 0 –48
December 31, 2014 0 0 0
Put option
January 1, 2013 0 0 –2,242
Write-up put option 0 0 –150
December 31, 2013 0 0 –2,392
Derecognition put option 0 0 2,392
Addition put option –2,000
December 31, 2014 0 0 –2,000
Embedded derivatives
January 1, 2013 0 0 0
December 31, 2013 0 0 0
Addition embedded derivatives 0 23 0
December 31, 2014 0 23 0
Elmos Annual Report 2014
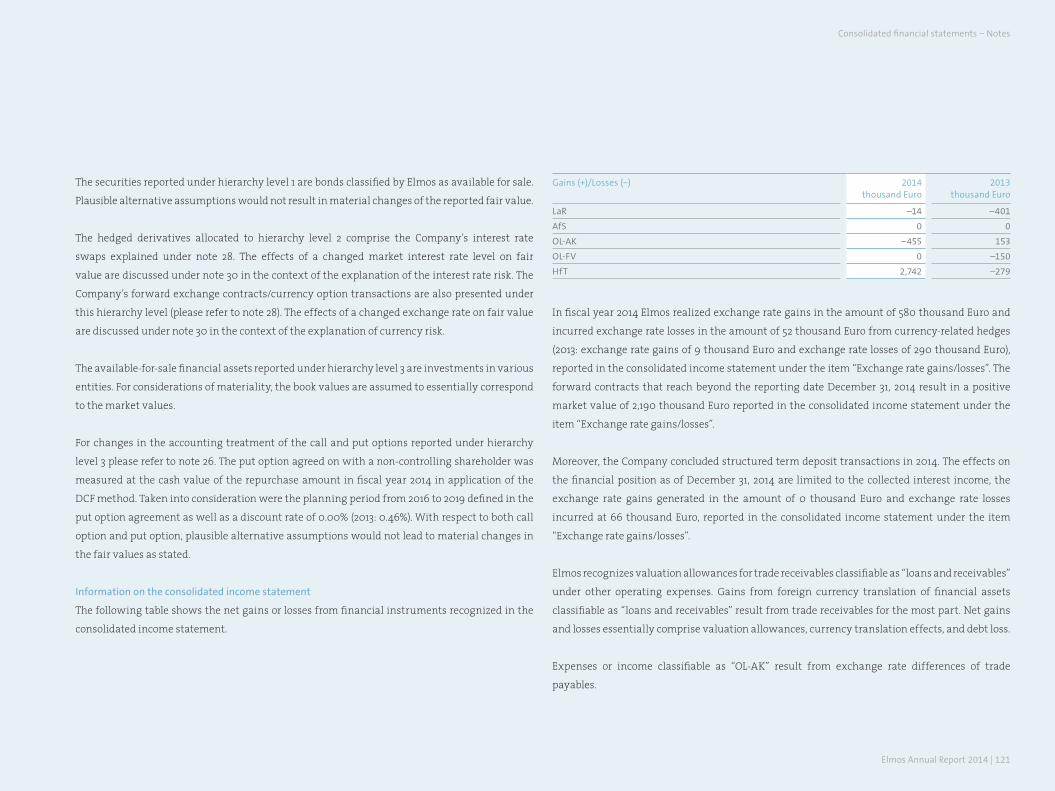
Elmos Annual Report 2014 | 121
The securities reported under hierarchy level 1 are bonds classified by Elmos as available for sale.
Plausible alternative assumptions would not result in material changes of the reported fair value.
The hedged derivatives allocated to hierarchy level 2 comprise the Company’s interest rate
swaps explained under note 28. The effects of a changed market interest rate level on fair
value are discussed under note 30 in the context of the explanation of the interest rate risk. The
Company’s forward exchange contracts/currency option transactions are also presented under
this hierarchy level (please refer to note 28). The effects of a changed exchange rate on fair value
are discussed under note 30 in the context of the explanation of currency risk.
The available-for-sale financial assets reported under hierarchy level 3 are investments in various
entities. For considerations of materiality, the book values are assumed to essentially correspond
to the market values.
For changes in the accounting treatment of the call and put options reported under hierarchy
level 3 please refer to note 26. The put option agreed on with a non-controlling shareholder was
measured at the cash value of the repurchase amount in fiscal year 2014 in application of the
DCF method. Taken into consideration were the planning period from 2016 to 2019 defined in the
put option agreement as well as a discount rate of 0.00% (2013: 0.46%). With respect to both call
option and put option, plausible alternative assumptions would not lead to material changes in
the fair values as stated.
Information on the consolidated income statement
The following table shows the net gains or losses from financial instruments recognized in the
consolidated income statement.
Gains (+)/Losses (−) 2014thousand Euro
2013thousand Euro
LaR –14 –401
AfS 0 0
OL-AK –455 153
OL-Fv 0 –150
HfT 2,742 –279
In fiscal year 2014 Elmos realized exchange rate gains in the amount of 580 thousand Euro and
incurred exchange rate losses in the amount of 52 thousand Euro from currency-related hedges
(2013: exchange rate gains of 9 thousand Euro and exchange rate losses of 290 thousand Euro),
reported in the consolidated income statement under the item “Exchange rate gains/losses”. The
forward contracts that reach beyond the reporting date December 31, 2014 result in a positive
market value of 2,190 thousand Euro reported in the consolidated income statement under the
item “Exchange rate gains/losses”.
Moreover, the Company concluded structured term deposit transactions in 2014. The effects on
the financial position as of December 31, 2014 are limited to the collected interest income, the
exchange rate gains generated in the amount of 0 thousand Euro and exchange rate losses
incurred at 66 thousand Euro, reported in the consolidated income statement under the item
“Exchange rate gains/losses”.
Elmos recognizes valuation allowances for trade receivables classifiable as “loans and receivables”
under other operating expenses. Gains from foreign currency translation of financial assets
classifiable as “loans and receivables” result from trade receivables for the most part. Net gains
and losses essentially comprise valuation allowances, currency translation effects, and debt loss.
Expenses or income classifiable as “OL-AK” result from exchange rate differences of trade
payables.
Consolidated financial statements – Notes
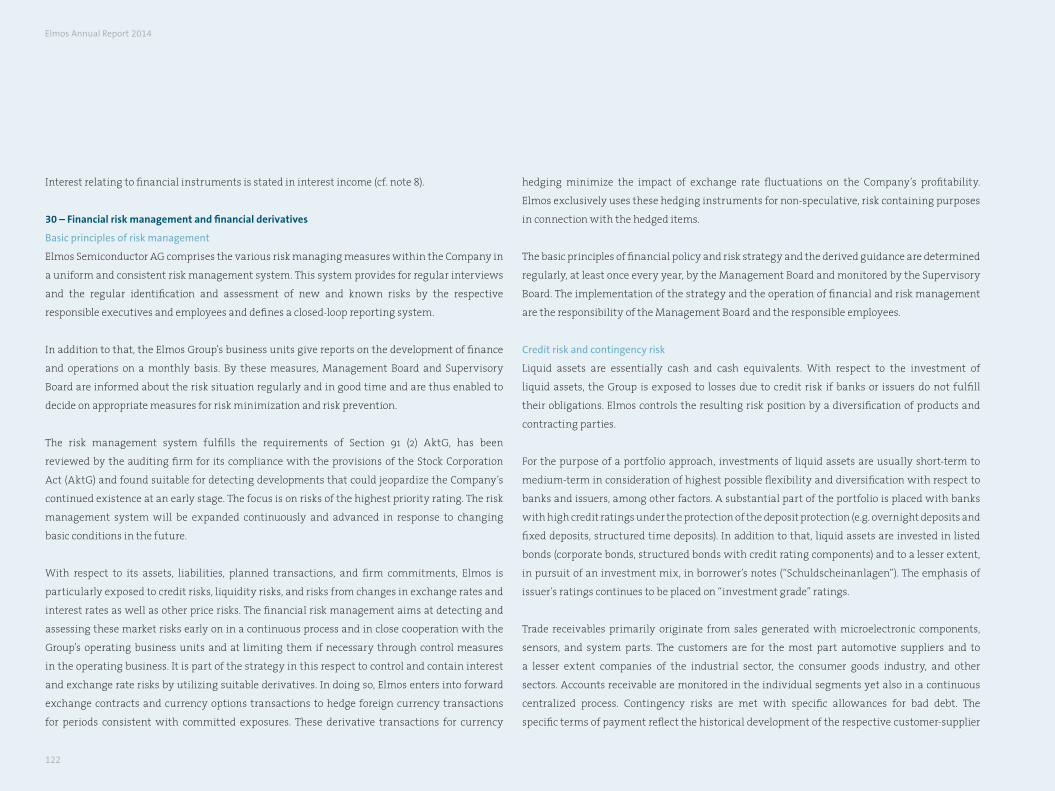
122
hedging minimize the impact of exchange rate fluctuations on the Company’s profitability.
Elmos exclusively uses these hedging instruments for non-speculative, risk containing purposes
in connection with the hedged items.
The basic principles of financial policy and risk strategy and the derived guidance are determined
regularly, at least once every year, by the Management Board and monitored by the Supervisory
Board. The implementation of the strategy and the operation of financial and risk management
are the responsibility of the Management Board and the responsible employees.
Credit risk and contingency risk
Liquid assets are essentially cash and cash equivalents. With respect to the investment of
liquid assets, the Group is exposed to losses due to credit risk if banks or issuers do not fulfill
their obligations. Elmos controls the resulting risk position by a diversification of products and
contracting parties.
For the purpose of a portfolio approach, investments of liquid assets are usually short-term to
medium-term in consideration of highest possible flexibility and diversification with respect to
banks and issuers, among other factors. A substantial part of the portfolio is placed with banks
with high credit ratings under the protection of the deposit protection (e.g. overnight deposits and
fixed deposits, structured time deposits). In addition to that, liquid assets are invested in listed
bonds (corporate bonds, structured bonds with credit rating components) and to a lesser extent,
in pursuit of an investment mix, in borrower’s notes (“Schuldscheinanlagen”). The emphasis of
issuer’s ratings continues to be placed on “investment grade” ratings.
Trade receivables primarily originate from sales generated with microelectronic components,
sensors, and system parts. The customers are for the most part automotive suppliers and to
a lesser extent companies of the industrial sector, the consumer goods industry, and other
sectors. Accounts receivable are monitored in the individual segments yet also in a continuous
centralized process. Contingency risks are met with specific allowances for bad debt. The
specific terms of payment reflect the historical development of the respective customer-supplier
Interest relating to financial instruments is stated in interest income (cf. note 8).
30 – financial risk management and financial derivatives
Basic principles of risk management
Elmos Semiconductor AG comprises the various risk managing measures within the Company in
a uniform and consistent risk management system. This system provides for regular interviews
and the regular identification and assessment of new and known risks by the respective
responsible executives and employees and defines a closed-loop reporting system.
In addition to that, the Elmos Group’s business units give reports on the development of finance
and operations on a monthly basis. By these measures, Management Board and Supervisory
Board are informed about the risk situation regularly and in good time and are thus enabled to
decide on appropriate measures for risk minimization and risk prevention.
The risk management system fulfills the requirements of Section 91 (2) AktG, has been
reviewed by the auditing firm for its compliance with the provisions of the Stock Corporation
Act (AktG) and found suitable for detecting developments that could jeopardize the Company’s
continued existence at an early stage. The focus is on risks of the highest priority rating. The risk
management system will be expanded continuously and advanced in response to changing
basic conditions in the future.
With respect to its assets, liabilities, planned transactions, and firm commitments, Elmos is
particularly exposed to credit risks, liquidity risks, and risks from changes in exchange rates and
interest rates as well as other price risks. The financial risk management aims at detecting and
assessing these market risks early on in a continuous process and in close cooperation with the
Group’s operating business units and at limiting them if necessary through control measures
in the operating business. It is part of the strategy in this respect to control and contain interest
and exchange rate risks by utilizing suitable derivatives. In doing so, Elmos enters into forward
exchange contracts and currency options transactions to hedge foreign currency transactions
for periods consistent with committed exposures. These derivative transactions for currency
Elmos Annual Report 2014
Elmos Annual Report 2014 | 123
relationship; observation of the terms is monitored continuously. With respect to new customers,
creditworthiness information is gathered in advance and credit limits are determined if
necessary. Business transactions with major customers are subject to special contingency risk
supervision. Elmos pursues a stringent credit policy altogether. The maximum contingency
risk is reflected by the book values of the financial assets reported in the statement of financial
position.
Against the backdrop of continued global uncertainties, outstanding receivables are monitored
and reminded with scrutiny as part of a continuous operational process.
Liquidity risk and financing risk
The liquidity risk of Elmos addresses the contingency that the Company might not be able to
fulfill its financial obligations, e.g. the payment of finance debt, the payment of trade payables,
and the payment obligations arising from lease agreements. A liquidity reserve in the form of
cash and cash equivalents, investments of high fungibility and convertibility into cash, and
sufficiently available free credit limits is provided so that this risk will not materialize and the
liquidity and financial flexibility of Elmos are assured at any time. In addition to that, the Group’s
liquidity is constantly monitored within the framework of short-term and long-term liquidity
planning. Apart from their respective internal financing power, liquidity of the domestic and
international subsidiaries is provided through the Group’s credit limits and loans as well as by
banks. The cash flows from financial liabilities are presented under note 25. Further information
about safeguarding medium-term financing can be found under note 28.
Financial market risk
Due to its international business activity, Elmos is exposed to market price risks as a result of
changes in exchange rates, interest rates, and prices for raw materials (e.g. gold). There are also
market price risks within the scope of guaranteeing electric power and natural gas supplies for
the medium term. These market price risks could have a negative effect on the Group’s financial,
profit and economic situation.
a) Exchange rate risk
Business operations as well as financial results and cash flows are partly exposed to risks from
exchange rate fluctuations due to the Company’s international orientation. These fluctuations
occur principally between the euro and the U.S. dollar (USD).
Exchange rate risks result from operating activities (sales, purchasing) and investments. Due
to increased purchasing of services in USD, especially assembly and foundry services from
Southeast Asia, typically billed in USD in the global market, the Group’s currency exposure has
expanded. Generally Elmos still aims for natural hedging, i.e. a balance of USD cash inflow and
outflow, and takes measures throughout the Group for containing the exposure. The excess
volume not covered by natural hedging is controlled actively by concluding derivative financial
instruments for currency hedging, among other measures. In doing so, Elmos pursues a rolling
approach in order to apply hedges not only for the current year but for periods beyond that as
well. Foreign currency risks that do not affect the Group’s cash flows (i.e. risks resulting from the
translation of foreign subsidiaries’ assets and liabilities into the Group’s reporting currency) are
generally not hedged.
Elmos was exposed to currency risks as of the reporting date. In fiscal year 2014, Elmos realized
exchange rate gains in the amount of 580 thousand Euro (2013: 9 thousand Euro) and incurred
exchange rate losses in the amount of 52 thousand Euro (2013: 290 thousand Euro) from currency-
related hedges relating to the U.S. dollar. In addition to that, from the measurement of USD
hedges still open by the reporting date, Elmos recorded the amount of 2,190 thousand Euro (2013:
0 thousand Euro) in the consolidated income statement. Furthermore, exchange rate gains in the
amount of 0 thousand Euro (2013: 2 thousand Euro) and exchange rate losses in the amount of 66
thousand Euro (2013: 0 thousand Euro) resulted in 2014 from structured term deposits where the
repayment of the investment amount in foreign currency (essentially USD) is called for insofar as
a previously fixed reference exchange rate between EUR and the foreign currency is exceeded as
of the due date of the transaction. With respect to these investments, exchange rate losses were
compensated by interest advantages
Consolidated financial statements – Notes
124
Had the euro been revalued (devalued) against the U.S. dollar by 10% as of December 31, 2014 with
respect to the monetary financial instruments, the operating income (before taxes) would have
been 1,998 thousand Euro lower (2,424 thousand Euro higher) (2013: 109 thousand Euro higher (133
thousand Euro lower)). The Group’s equity effect would have been the same amount via the result
effect in consideration of income tax incurred.
b) Interest rate risk
The risk of interest rate changes of Elmos as of the reporting date results from the forward
interest rate swaps concluded in fiscal year 2010 with respect to the correspondingly concluded
forward loans (please refer to note 28), among other factors. Had the market interest rate level
been higher (lower) by 100 basis points, equity would have been higher by 493 thousand Euro
(decrease in equity by 501 thousand Euro) due to group accounting outside profit or loss (2013:
increase (decrease) in equity by 650 (679) thousand Euro). Deferred tax on this amount would also
have to be considered.
There is also the risk of interest rate changes with respect to the securities classified as available
for sale. Had the market interest rate level been higher (lower) by 100 basis points, equity would
have been lower by 1,265 thousand Euro (increase in equity by 1,236 thousand Euro) (2013: decrease
(increase) in equity by 1,395 (1,410) thousand Euro).
With respect to the put option, a 100 basis points higher (lower) market interest rate level would
result in an increase (decrease) in equity of 59 (0) thousand Euro (2013: increase (decrease) in
earnings before taxes by 93 (44) thousand Euro). The effect on other non-current liabilities would
come to a corresponding amount.
For the forward loans described under note 28, there is no risk from loan commitments as of
December 31, 2014 – corresponding with the previous year – as all loan commitments have been
utilized and there are no new loan commitments.
Elmos is exposed to interest rate risks primarily in the euro area. The Management Board
regularly determines the target mix of fixed and variable-interest liabilities, and the financing
structure is derived and implemented on that basis. For long-term financing projects, fixed
interest rates are usually agreed on for securing the basis of calculation. Interest derivatives are
also put to use if necessary.
Further information about securing long-term financing can be found under note 28.
c) Other price risks
Elmos has secured the supply with electricity and natural gas since fiscal year 2014 for the
medium term by concluding a fixed price in advance. A 10% higher (lower) electricity rate would
result in an increase (decrease) in earnings by 142 thousand Euro (141 thousand Euro). A 10%
higher (lower) gas price would result in an increase (decrease) in earnings by 317 thousand Euro
(317 thousand Euro). The Group’s equity effect with respect to electricity and natural gas would
have been the same amount via the result effect in consideration of income tax incurred. In the
previous year the Company was not exposed to other material price risks.
Capital management
It is the primary objective of the Elmos Group’s capital management to assure that a high
credit rating, liquidity at any time and at high financial flexibility, and a solid capital structure
are maintained in support of the Company’s business operations for the long term and for the
protection of the interests of the shareholders, employees, and all other addressees of the annual
report. Elmos stands for the strategy of a continuous, sustained increase in shareholder value.
Elmos Annual Report 2014
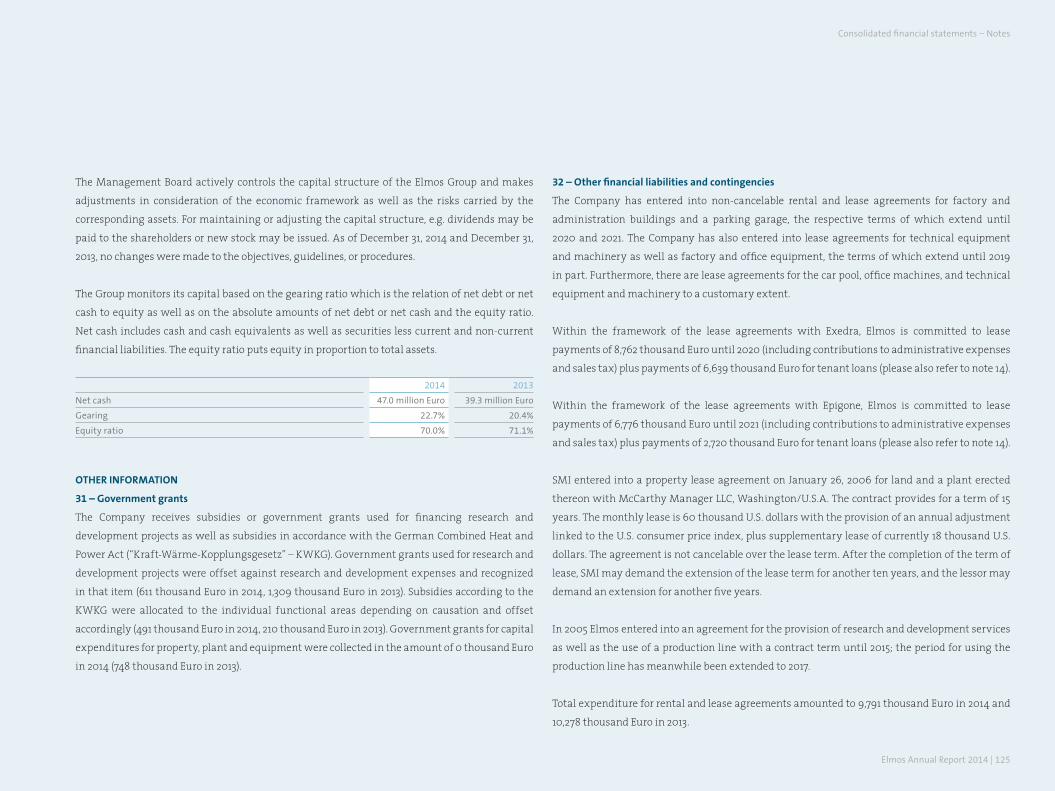
Elmos Annual Report 2014 | 125
The Management Board actively controls the capital structure of the Elmos Group and makes
adjustments in consideration of the economic framework as well as the risks carried by the
corresponding assets. For maintaining or adjusting the capital structure, e.g. dividends may be
paid to the shareholders or new stock may be issued. As of December 31, 2014 and December 31,
2013, no changes were made to the objectives, guidelines, or procedures.
The Group monitors its capital based on the gearing ratio which is the relation of net debt or net
cash to equity as well as on the absolute amounts of net debt or net cash and the equity ratio.
Net cash includes cash and cash equivalents as well as securities less current and non-current
financial liabilities. The equity ratio puts equity in proportion to total assets.
2014 2013
Net cash 47.0 million Euro 39.3 million Euro
Gearing 22.7% 20.4%
Equity ratio 70.0% 71.1%
otHer information
31 – Government grants
The Company receives subsidies or government grants used for financing research and
development projects as well as subsidies in accordance with the German Combined Heat and
Power Act (“Kraft-Wärme-Kopplungsgesetz” – KWKG). Government grants used for research and
development projects were offset against research and development expenses and recognized
in that item (611 thousand Euro in 2014, 1,309 thousand Euro in 2013). Subsidies according to the
KWKG were allocated to the individual functional areas depending on causation and offset
accordingly (491 thousand Euro in 2014, 210 thousand Euro in 2013). Government grants for capital
expenditures for property, plant and equipment were collected in the amount of 0 thousand Euro
in 2014 (748 thousand Euro in 2013).
32 – other financial liabilities and contingencies
The Company has entered into non-cancelable rental and lease agreements for factory and
administration buildings and a parking garage, the respective terms of which extend until
2020 and 2021. The Company has also entered into lease agreements for technical equipment
and machinery as well as factory and office equipment, the terms of which extend until 2019
in part. Furthermore, there are lease agreements for the car pool, office machines, and technical
equipment and machinery to a customary extent.
Within the framework of the lease agreements with Exedra, Elmos is committed to lease
payments of 8,762 thousand Euro until 2020 (including contributions to administrative expenses
and sales tax) plus payments of 6,639 thousand Euro for tenant loans (please also refer to note 14).
Within the framework of the lease agreements with Epigone, Elmos is committed to lease
payments of 6,776 thousand Euro until 2021 (including contributions to administrative expenses
and sales tax) plus payments of 2,720 thousand Euro for tenant loans (please also refer to note 14).
SMI entered into a property lease agreement on January 26, 2006 for land and a plant erected
thereon with McCarthy Manager LLC, Washington/U.S.A. The contract provides for a term of 15
years. The monthly lease is 60 thousand U.S. dollars with the provision of an annual adjustment
linked to the U.S. consumer price index, plus supplementary lease of currently 18 thousand U.S.
dollars. The agreement is not cancelable over the lease term. After the completion of the term of
lease, SMI may demand the extension of the lease term for another ten years, and the lessor may
demand an extension for another five years.
In 2005 Elmos entered into an agreement for the provision of research and development services
as well as the use of a production line with a contract term until 2015; the period for using the
production line has meanwhile been extended to 2017.
Total expenditure for rental and lease agreements amounted to 9,791 thousand Euro in 2014 and
10,278 thousand Euro in 2013.
Consolidated financial statements – Notes
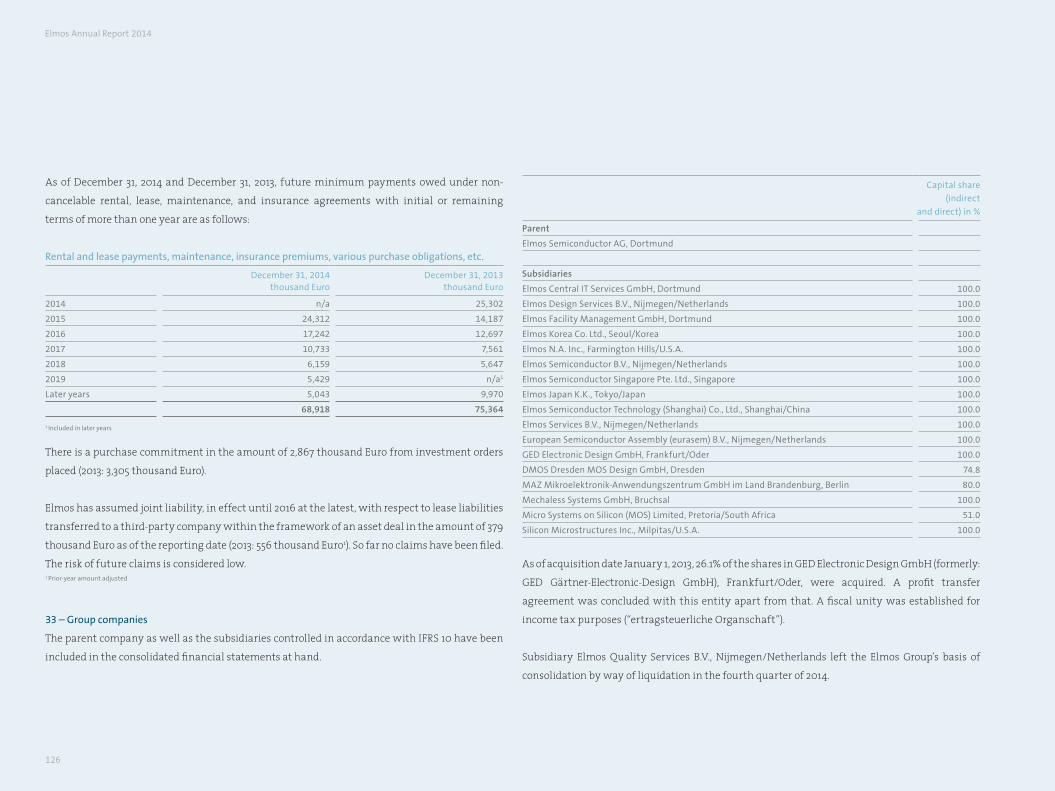
126
As of December 31, 2014 and December 31, 2013, future minimum payments owed under non-
cancelable rental, lease, maintenance, and insurance agreements with initial or remaining
terms of more than one year are as follows:
Rental and lease payments, maintenance, insurance premiums, various purchase obligations, etc.
December 31, 2014thousand Euro
December 31, 2013thousand Euro
2014 n/a 25,302
2015 24,312 14,187
2016 17,242 12,697
2017 10,733 7,561
2018 6,159 5,647
2019 5,429 n/a1
Later years 5,043 9,970
68,918 75,364
1 Included in later years
There is a purchase commitment in the amount of 2,867 thousand Euro from investment orders
placed (2013: 3,305 thousand Euro).
Elmos has assumed joint liability, in effect until 2016 at the latest, with respect to lease liabilities
transferred to a third-party company within the framework of an asset deal in the amount of 379
thousand Euro as of the reporting date (2013: 556 thousand Euro1). So far no claims have been filed.
The risk of future claims is considered low. 1 Prior-year amount adjusted
33 – Group companies
The parent company as well as the subsidiaries controlled in accordance with IFRS 10 have been
included in the consolidated financial statements at hand.
Capital share
(indirect
and direct) in %
Parent
Elmos Semiconductor AG, Dortmund
Subsidiaries
Elmos Central IT Services GmbH, Dortmund 100.0
Elmos Design Services B.v., Nijmegen/Netherlands 100.0
Elmos Facility Management GmbH, Dortmund 100.0
Elmos Korea Co. Ltd., Seoul/Korea 100.0
Elmos N.A. Inc., Farmington Hills/U.S.A. 100.0
Elmos Semiconductor B.v., Nijmegen/Netherlands 100.0
Elmos Semiconductor Singapore Pte. Ltd., Singapore 100.0
Elmos Japan K.K., Tokyo/Japan 100.0
Elmos Semiconductor Technology (Shanghai) Co., Ltd., Shanghai/China 100.0
Elmos Services B.v., Nijmegen/Netherlands 100.0
European Semiconductor Assembly (eurasem) B.v., Nijmegen/Netherlands 100.0
GED Electronic Design GmbH, Frankfurt/Oder 100.0
DMOS Dresden MOS Design GmbH, Dresden 74.8
MAZ Mikroelektronik-Anwendungszentrum GmbH im Land Brandenburg, Berlin 80.0
Mechaless Systems GmbH, Bruchsal 100.0
Micro Systems on Silicon (MOS) Limited, Pretoria/South Africa 51.0
Silicon Microstructures Inc., Milpitas/U.S.A. 100.0
As of acquisition date January 1, 2013, 26.1% of the shares in GED Electronic Design GmbH (formerly:
GED Gärtner-Electronic-Design GmbH), Frankfurt/Oder, were acquired. A profit transfer
agreement was concluded with this entity apart from that. A fiscal unity was established for
income tax purposes (“ertragsteuerliche Organschaft”).
Subsidiary Elmos Quality Services B.V., Nijmegen/Netherlands left the Elmos Group’s basis of
consolidation by way of liquidation in the fourth quarter of 2014.
Elmos Annual Report 2014
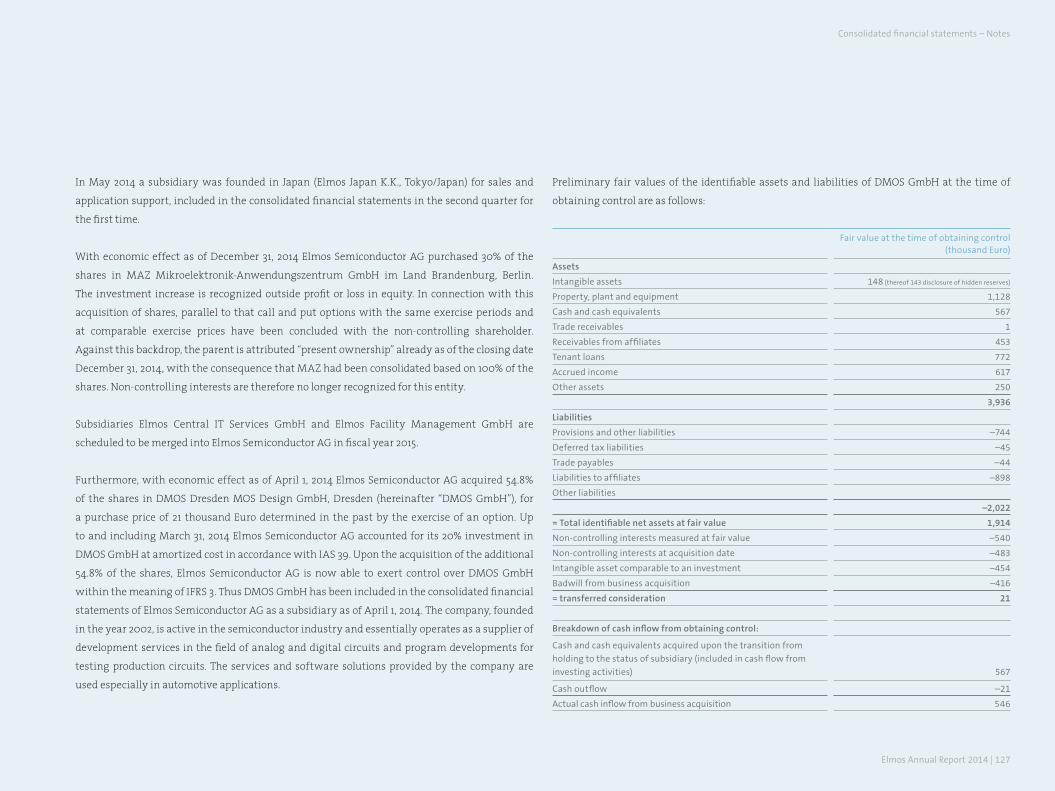
Elmos Annual Report 2014 | 127
In May 2014 a subsidiary was founded in Japan (Elmos Japan K.K., Tokyo/Japan) for sales and
application support, included in the consolidated financial statements in the second quarter for
the first time.
With economic effect as of December 31, 2014 Elmos Semiconductor AG purchased 30% of the
shares in MAZ Mikroelektronik-Anwendungszentrum GmbH im Land Brandenburg, Berlin.
The investment increase is recognized outside profit or loss in equity. In connection with this
acquisition of shares, parallel to that call and put options with the same exercise periods and
at comparable exercise prices have been concluded with the non-controlling shareholder.
Against this backdrop, the parent is attributed “present ownership” already as of the closing date
December 31, 2014, with the consequence that MAZ had been consolidated based on 100% of the
shares. Non-controlling interests are therefore no longer recognized for this entity.
Subsidiaries Elmos Central IT Services GmbH and Elmos Facility Management GmbH are
scheduled to be merged into Elmos Semiconductor AG in fiscal year 2015.
Furthermore, with economic effect as of April 1, 2014 Elmos Semiconductor AG acquired 54.8%
of the shares in DMOS Dresden MOS Design GmbH, Dresden (hereinafter “DMOS GmbH”), for
a purchase price of 21 thousand Euro determined in the past by the exercise of an option. Up
to and including March 31, 2014 Elmos Semiconductor AG accounted for its 20% investment in
DMOS GmbH at amortized cost in accordance with IAS 39. Upon the acquisition of the additional
54.8% of the shares, Elmos Semiconductor AG is now able to exert control over DMOS GmbH
within the meaning of IFRS 3. Thus DMOS GmbH has been included in the consolidated financial
statements of Elmos Semiconductor AG as a subsidiary as of April 1, 2014. The company, founded
in the year 2002, is active in the semiconductor industry and essentially operates as a supplier of
development services in the field of analog and digital circuits and program developments for
testing production circuits. The services and software solutions provided by the company are
used especially in automotive applications.
Preliminary fair values of the identifiable assets and liabilities of DMOS GmbH at the time of
obtaining control are as follows:
Fair value at the time of obtaining control (thousand Euro)
Assets
Intangible assets 148 (thereof 143 disclosure of hidden reserves)
Property, plant and equipment 1,128
Cash and cash equivalents 567
Trade receivables 1
Receivables from affiliates 453
Tenant loans 772
Accrued income 617
Other assets 250
3,936
Liabilities
Provisions and other liabilities –744
Deferred tax liabilities –45
Trade payables –44
Liabilities to affiliates –898
Other liabilities
–2,022
= Total identifiable net assets at fair value 1,914
Non-controlling interests measured at fair value –540
Non-controlling interests at acquisition date –483
Intangible asset comparable to an investment –454
Badwill from business acquisition –416
= transferred consideration 21
Breakdown of cash inflow from obtaining control:
Cash and cash equivalents acquired upon the transition from
holding to the status of subsidiary (included in cash flow from
investing activities) 567
Cash outflow –21
Actual cash inflow from business acquisition 546
Consolidated financial statements – Notes
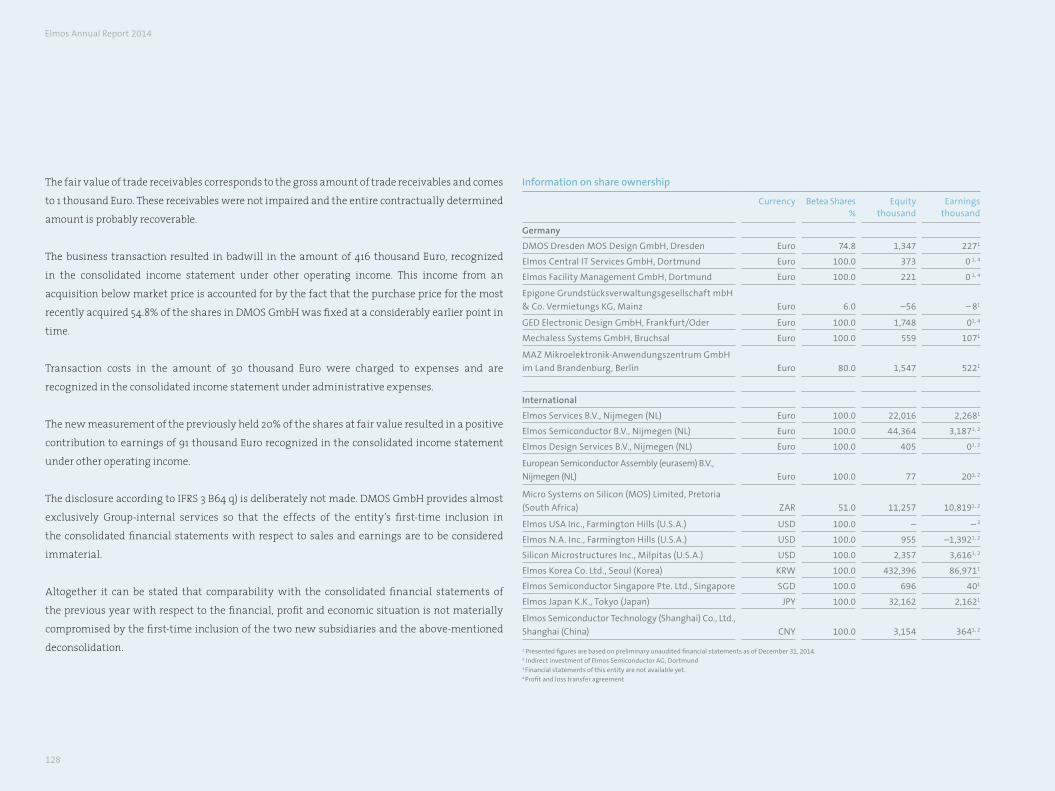
128
The fair value of trade receivables corresponds to the gross amount of trade receivables and comes
to 1 thousand Euro. These receivables were not impaired and the entire contractually determined
amount is probably recoverable.
The business transaction resulted in badwill in the amount of 416 thousand Euro, recognized
in the consolidated income statement under other operating income. This income from an
acquisition below market price is accounted for by the fact that the purchase price for the most
recently acquired 54.8% of the shares in DMOS GmbH was fixed at a considerably earlier point in
time.
Transaction costs in the amount of 30 thousand Euro were charged to expenses and are
recognized in the consolidated income statement under administrative expenses.
The new measurement of the previously held 20% of the shares at fair value resulted in a positive
contribution to earnings of 91 thousand Euro recognized in the consolidated income statement
under other operating income.
The disclosure according to IFRS 3 B64 q) is deliberately not made. DMOS GmbH provides almost
exclusively Group-internal services so that the effects of the entity’s first-time inclusion in
the consolidated financial statements with respect to sales and earnings are to be considered
immaterial.
Altogether it can be stated that comparability with the consolidated financial statements of
the previous year with respect to the financial, profit and economic situation is not materially
compromised by the first-time inclusion of the two new subsidiaries and the above-mentioned
deconsolidation.
Information on share ownership
Currency Betea Shares %
Equitythousand
Earningsthousand
Germany
DMOS Dresden MOS Design GmbH, Dresden Euro 74.8 1,347 2271
Elmos Central IT Services GmbH, Dortmund Euro 100.0 373 0 1, 4
Elmos Facility Management GmbH, Dortmund Euro 100.0 221 0 1, 4
Epigone Grundstücksverwaltungsgesellschaft mbH
& Co. vermietungs KG, Mainz Euro 6.0 –56 – 81
GED Electronic Design GmbH, Frankfurt/Oder Euro 100.0 1,748 01, 4
Mechaless Systems GmbH, Bruchsal Euro 100.0 559 1071
MAZ Mikroelektronik-Anwendungszentrum GmbH
im Land Brandenburg, Berlin Euro 80.0 1,547 5221
International
Elmos Services B.v., Nijmegen (NL) Euro 100.0 22,016 2,2681
Elmos Semiconductor B.v., Nijmegen (NL) Euro 100.0 44,364 3,1871, 2
Elmos Design Services B.v., Nijmegen (NL) Euro 100.0 405 01, 2
European Semiconductor Assembly (eurasem) B.v.,
Nijmegen (NL) Euro 100.0 77 201, 2
Micro Systems on Silicon (MOS) Limited, Pretoria
(South Africa) ZAR 51.0 11,257 10,8191, 2
Elmos USA Inc., Farmington Hills (U.S.A.) USD 100.0 – – 3
Elmos N.A. Inc., Farmington Hills (U.S.A.) USD 100.0 955 –1,3921, 2
Silicon Microstructures Inc., Milpitas (U.S.A.) USD 100.0 2,357 3,6161, 2
Elmos Korea Co. Ltd., Seoul (Korea) KRW 100.0 432,396 86,9711
Elmos Semiconductor Singapore Pte. Ltd., Singapore SGD 100.0 696 401
Elmos Japan K.K., Tokyo (Japan) JPY 100.0 32,162 2,1621
Elmos Semiconductor Technology (Shanghai) Co., Ltd.,
Shanghai (China) CNY 100.0 3,154 3641, 2
1 Presented figures are based on preliminary unaudited financial statements as of December 31, 2014.2 Indirect investment of Elmos Semiconductor AG, Dortmund3 Financial statements of this entity are not available yet.4 Profit and loss transfer agreement
Elmos Annual Report 2014
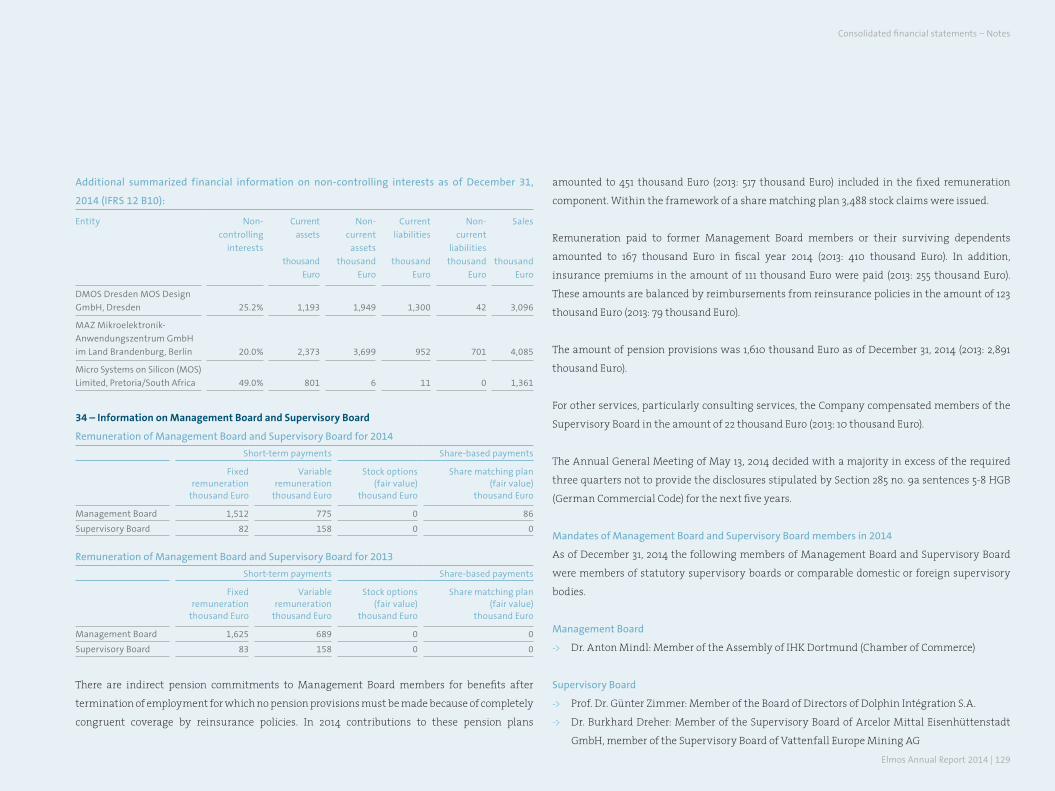
Elmos Annual Report 2014 | 129
Additional summarized financial information on non-controlling interests as of December 31,
2014 (IFRS 12 B10):
Entity Non-
controlling
interests
Current
assets
thousand
Euro
Non-
current
assets
thousand
Euro
Current
liabilities
thousand
Euro
Non-
current
liabilities
thousand
Euro
Sales
thousand
Euro
DMOS Dresden MOS Design
GmbH, Dresden 25.2% 1,193 1,949 1,300 42 3,096
MAZ Mikroelektronik-
Anwendungszentrum GmbH
im Land Brandenburg, Berlin 20.0% 2,373 3,699 952 701 4,085
Micro Systems on Silicon (MOS)
Limited, Pretoria/South Africa 49.0% 801 6 11 0 1,361
34 – information on management Board and Supervisory Board
Remuneration of Management Board and Supervisory Board for 2014
Short-term payments Share-based payments
Fixed remuneration
thousand Euro
variable remuneration
thousand Euro
Stock options (fair value)
thousand Euro
Share matching plan (fair value)
thousand Euro
Management Board 1,512 775 0 86
Supervisory Board 82 158 0 0
Remuneration of Management Board and Supervisory Board for 2013
Short-term payments Share-based payments
Fixed remuneration
thousand Euro
variable remuneration
thousand Euro
Stock options (fair value)
thousand Euro
Share matching plan (fair value)
thousand Euro
Management Board 1,625 689 0 0
Supervisory Board 83 158 0 0
There are indirect pension commitments to Management Board members for benefits after
termination of employment for which no pension provisions must be made because of completely
congruent coverage by reinsurance policies. In 2014 contributions to these pension plans
amounted to 451 thousand Euro (2013: 517 thousand Euro) included in the fixed remuneration
component. Within the framework of a share matching plan 3,488 stock claims were issued.
Remuneration paid to former Management Board members or their surviving dependents
amounted to 167 thousand Euro in fiscal year 2014 (2013: 410 thousand Euro). In addition,
insurance premiums in the amount of 111 thousand Euro were paid (2013: 255 thousand Euro).
These amounts are balanced by reimbursements from reinsurance policies in the amount of 123
thousand Euro (2013: 79 thousand Euro).
The amount of pension provisions was 1,610 thousand Euro as of December 31, 2014 (2013: 2,891
thousand Euro).
For other services, particularly consulting services, the Company compensated members of the
Supervisory Board in the amount of 22 thousand Euro (2013: 10 thousand Euro).
The Annual General Meeting of May 13, 2014 decided with a majority in excess of the required
three quarters not to provide the disclosures stipulated by Section 285 no. 9a sentences 5-8 HGB
(German Commercial Code) for the next five years.
Mandates of Management Board and Supervisory Board members in 2014
As of December 31, 2014 the following members of Management Board and Supervisory Board
were members of statutory supervisory boards or comparable domestic or foreign supervisory
bodies.
Management Board
-> Dr. Anton Mindl: Member of the Assembly of IHK Dortmund (Chamber of Commerce)
Supervisory Board
-> Prof. Dr. Günter Zimmer: Member of the Board of Directors of Dolphin Intégration S.A.
-> Dr. Burkhard Dreher: Member of the Supervisory Board of Arcelor Mittal Eisenhüttenstadt
GmbH, member of the Supervisory Board of Vattenfall Europe Mining AG
Consolidated financial statements – Notes
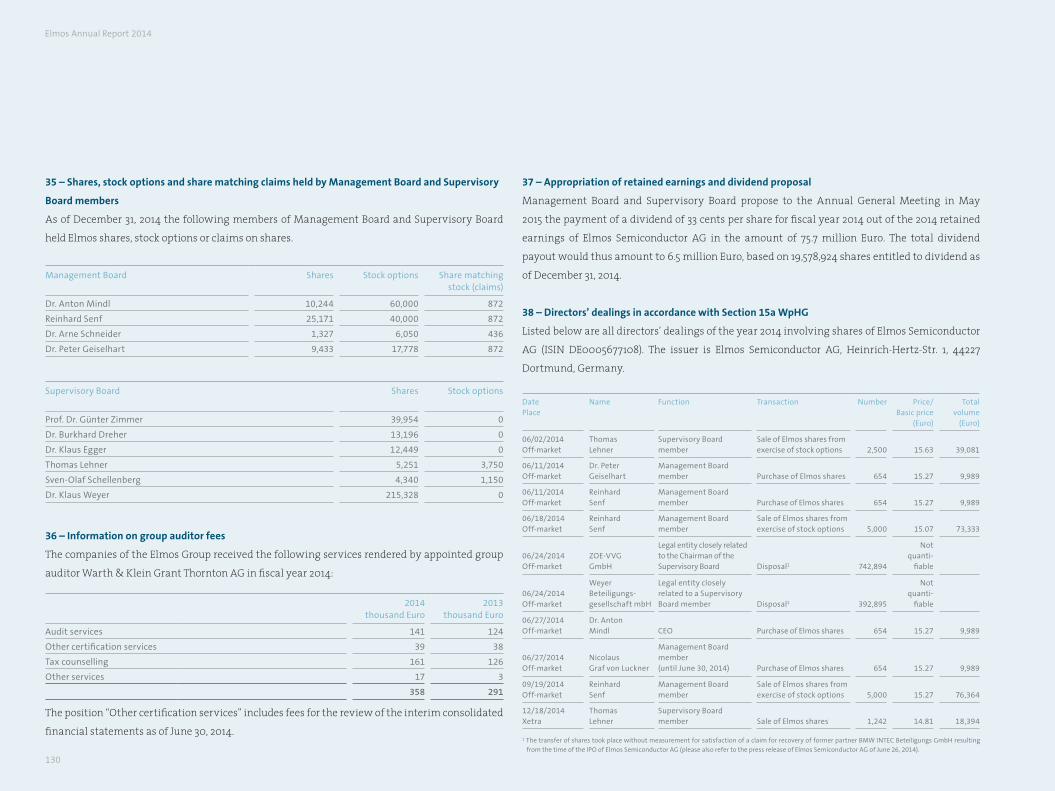
130
35 – Shares, stock options and share matching claims held by management Board and Supervisory
Board members
As of December 31, 2014 the following members of Management Board and Supervisory Board
held Elmos shares, stock options or claims on shares.
Management Board Shares Stock options Share matching stock (claims)
Dr. Anton Mindl 10,244 60,000 872
Reinhard Senf 25,171 40,000 872
Dr. Arne Schneider 1,327 6,050 436
Dr. Peter Geiselhart 9,433 17,778 872
Supervisory Board Shares Stock options
Prof. Dr. Günter Zimmer 39,954 0
Dr. Burkhard Dreher 13,196 0
Dr. Klaus Egger 12,449 0
Thomas Lehner 5,251 3,750
Sven-Olaf Schellenberg 4,340 1,150
Dr. Klaus Weyer 215,328 0
36 – information on group auditor fees
The companies of the Elmos Group received the following services rendered by appointed group
auditor Warth & Klein Grant Thornton AG in fiscal year 2014:
2014thousand Euro
2013thousand Euro
Audit services 141 124
Other certification services 39 38
Tax counselling 161 126
Other services 17 3
358 291
The position “Other certification services” includes fees for the review of the interim consolidated
financial statements as of June 30, 2014.
37 – appropriation of retained earnings and dividend proposal
Management Board and Supervisory Board propose to the Annual General Meeting in May
2015 the payment of a dividend of 33 cents per share for fiscal year 2014 out of the 2014 retained
earnings of Elmos Semiconductor AG in the amount of 75.7 million Euro. The total dividend
payout would thus amount to 6.5 million Euro, based on 19,578,924 shares entitled to dividend as
of December 31, 2014.
38 – Directors’ dealings in accordance with Section 15a WpHG
Listed below are all directors’ dealings of the year 2014 involving shares of Elmos Semiconductor
AG (ISIN DE0005677108). The issuer is Elmos Semiconductor AG, Heinrich-Hertz-Str. 1, 44227
Dortmund, Germany. Date Place
Name Function Transaction Number Price/Basic price
(Euro)
Total volume
(Euro)
06/02/2014Off-market
Thomas Lehner
Supervisory Board member
Sale of Elmos shares from exercise of stock options 2,500 15.63 39,081
06/11/2014 Off-market
Dr. Peter Geiselhart
Management Board member Purchase of Elmos shares 654 15.27 9,989
06/11/2014 Off-market
Reinhard Senf
Management Board member Purchase of Elmos shares 654 15.27 9,989
06/18/2014 Off-market
Reinhard Senf
Management Board member
Sale of Elmos shares from exercise of stock options 5,000 15.07 73,333
06/24/2014 Off-market
ZOE-vvG GmbH
Legal entity closely related to the Chairman of the Supervisory Board Disposal1 742,894
Not quanti-
fiable
06/24/2014 Off-market
Weyer Beteiligungs-gesellschaft mbH
Legal entity closely related to a Supervisory Board member Disposal1 392,895
Not quanti-
fiable
06/27/2014 Off-market
Dr. Anton Mindl CEO Purchase of Elmos shares 654 15.27 9,989
06/27/2014 Off-market
Nicolaus Graf von Luckner
Management Board member (until June 30, 2014) Purchase of Elmos shares 654 15.27 9,989
09/19/2014 Off-market
Reinhard Senf
Management Board member
Sale of Elmos shares from exercise of stock options 5,000 15.27 76,364
12/18/2014Xetra
Thomas Lehner
Supervisory Board member Sale of Elmos shares 1,242 14.81 18,394
1 The transfer of shares took place without measurement for satisfaction of a claim for recovery of former partner BMW INTEC Beteiligungs GmbH resulting from the time of the IPO of Elmos Semiconductor AG (please also refer to the press release of Elmos Semiconductor AG of June 26, 2014).
Elmos Annual Report 2014
Elmos Annual Report 2014 | 131
39 – related party disclosures
Pursuant to IAS 24 Related Party Disclosures, individuals or companies in control of or controlled by
the Elmos Group must be disclosed unless they are already included in the consolidated financial
statements of the Elmos Group as a consolidated company. Control is assumed if a shareholder
holds more than half of the voting rights in Elmos Semiconductor AG or if the shareholder is in
a position, by virtue of the Articles of Incorporation or contractual agreement, to control the
financial and business policies of the Elmos Group’s management.
Mandatory disclosure pursuant to IAS 24 also includes transactions with associated companies
and individuals who have significant influence over the Elmos Group’s financial and business
policies, including close relatives or interconnected companies. Significant influence on the Elmos
Group’s financial and business policies may be based on an interest in Elmos Semiconductor AG of
20% or more, a position on the Management Board or Supervisory Board of Elmos Semiconductor
AG, or another key function in management.
The Elmos Group maintains relationships with closely related companies and persons in the context
of usual business activity. These supply and performance relationships are transacted at market prices.
Until March 31, 2014 Elmos Semiconductor AG received performances by DMOS in the amount
of 1,207 thousand Euro (2013: 4,555 thousand Euro). With economic effect as of April 1, 2014 Elmos
acquired additional 54.8% of the shares in DMOS by exercising an option, thus increasing its
previous investment from 20% to 74.8%. Accordingly the entity has since been included in the
consolidated financial statements of Elmos as an affiliate.
Apart from the remuneration of Management Board and Supervisory Board, representing the key
management personnel of the Elmos Group, disclosed under note 34 (“Information on Management
Board and Supervisory Board”) there are no material relationships with related individuals.
Beyond that, companies of the Elmos Group did not engage in any material reportable transactions
with members of the Management Board or the Supervisory Board of Elmos Semiconductor AG,
other key executives in management, or with companies whose managing or supervising bodies
these individuals are represented in. This also applies for close relatives of said group of people.
40 – number of employees
In fiscal year 2014 the average number of employees in the Group was 1,104 (2013: 1,053).
The average number of employees can be broken down as follows:
Group 2014Number
2013Number
Production 517 510
Sales 102 105
Administration 165 159
Quality control 37 38
Research & development 283 241
Total 1,104 1,053
41 – Significant events after the end of the fiscal year
There have been no reportable events or transactions of special significance after the end of the
fiscal year.
42 – Declaration of compliance in accordance with Section 161 aktG
In September 2014 Management Board and Supervisory Board of Elmos Semiconductor AG
released the declaration pursuant to Section 161 AktG (Stock Corporation Act) and made it
permanently accessible to the shareholders on the Company’s website.
Dortmund, March 4, 2015
Dr. Anton Mindl Dr. Arne Schneider Reinhard Senf Dr. Peter Geiselhart
Consolidated financial statements – Notes
132
Responsibility statement
To the best of our knowledge, and in accordance with the applicable reporting principles, the consolidated financial statements give a true and fair view of the assets, liabilities, financial position and profit or loss of the Group, and the group management report, combined with the management report of Elmos Semiconductor AG, includes a fair review of the development and performance of the business and the position of the Group, together with a description of the principal opportunities and risks associated with the expected development of the Group.
Dortmund, March 4, 2015
Elmos Annual Report 2014
Dr. Anton Mindl Dr. Arne Schneider Reinhard Senf Dr. Peter Geiselhart
Elmos Annual Report 2014 | 133
We have issued the following audit opinion on the consolidated financial statements and the combined management report, the audited version of which includes the complete and identical remuneration report as contained here as part of the corporate governance report:
“We have audited the consolidated financial statements prepared by Elmos Semiconductor AG, Dortmund, comprising the statement of financial position, income statement, statement of comprehensive income, statement of changes in equity, statement of cash flows, and the notes to the consolidated financial statements, together with the group management report, combined with the management report of Elmos Semiconductor AG, for the fiscal year ended December 31, 2014. The preparation of the consolidated financial statements and the combined management report in accordance with IFRS as applicable in the EU, and the additional requirements of German commercial law pursuant to Sec. 315a (1) HGB (German Commercial Code) is the responsibility of the Company’s management. Our responsibility is to express an opinion on the consolidated financial statements and on the combined management report based on our audit.
We conducted our audit of the consolidated financial statements in accordance with Section 317 HGB and the generally accepted German standards for the audit of financial statements promulgated by the Institut der Wirtschaftsprüfer (IDW – Institute of Public Auditors in Germany). Under those standards we are required to plan and perform the audit such that misstatements and violations materially affecting the presentation of the net assets, financial position and results of operations in the consolidated financial statements in accordance with the applicable financial reporting framework and in the combined management report are detected with reasonable assurance. Knowledge of the business activities and the economic and legal environment of the Group and expectations as to possible misstatements are taken into account in the determination
of audit procedures. The effectiveness of the accounting-related internal control system and the evidence supporting the disclosures in the consolidated financial statements and the combined management report are examined primarily on a test basis within the framework of the audit. The audit includes assessing the annual financial statements of those entities included in the consolidated financial statements, the definition of the basis of consolidation, the accounting and consolidation principles used and the significant estimates made by management, as well as evaluating the overall presentation of the consolidated financial statements and the combined management report. We believe that our audit provides a reasonable basis for our opinion.
Our audit has not led to any reservations.
In our opinion, based on the findings of our audit, the consolidated financial statements of Elmos Semiconductor AG, Dortmund, for the fiscal year ended December 31, 2014 comply with the IFRS as applicable in the EU and the additional requirements of German commercial law pursuant to Sec. 315a (1) HGB and give a true and fair view of the net assets, financial position and results of operations of the Group in accordance with these requirements. The combined management report is consistent with the consolidated financial statements and as a whole provides a fair view of the Group’s position and presents the opportunities and risks of future development correctly.”
Düsseldorf, March 4, 2015
Warth & Klein Grant Thornton AGWirtschaftsprüfungsgesellschaft
Dr. Thomas Senger Ulrich DierschWirtschaftsprüfer Wirtschaftsprüfer
Auditor’s report
Notes – Responsibility statement /Auditor’s report
134
Glossary
ASIC An application specific integrated circuit (ASIC) is a circuit developed individually for a specific application and a specific customer, as opposed to standard components that are not configured in a customer specific way, for example voltage regulators, memory chips, and processors.
ASSP An application specific standard product (ASSP) is an integrated circuit developed individually for a specific application. It can be marketed to several customers as an application standard.
Backend manufacturing Backend manufacturing des-cribes the part of the semiconductor manufacturing process that is carried out after the wafer has left the clean room. The inspection of the chips on the wafer, assembly (fitting the IC into the package), burn-in (pre-aging by applying heat and voltage), the functional testing of the assembled components, and packing (tape&reel) are all part of this process.
BUS A communication system that allows the exchange of information between several participants on an electronic or optical basis. Among the standards used in the automobile are the following: LIN, CAN, MOST, and FlexRayTM.
Chip An electronic circuit that contains electric func-tions realized in semiconductor material.
Clean room A sealed-off part of a building where humidity, temperature and dust particle contamination are monitored and maintained precisely.
CMOS Complementary metal oxide semiconductor (CMOS) is the basic technology for manufacturing microchips with a high integration rate and low energy consumption.
Design win or design in A design win is a new contract for a project acquired from a customer. Such a contract covers product development (in case of an ASIC) or the use of an existing component (in case of an ASSP, so-called design in), usually by specifying planned unit numbers and prices. Binding orders are placed at a later point in time.
Distributor Distributors are business partners respon-sible for pushing the marketing and distribution primarily of standard products.
Electronic circuit A combination of different electrical components, each assuming a specific function within an electrical system.
FlexRay™ The high-speed bus system FlexRay™ is a stan-dard for time-critical applications e.g. in car networks. Among other fields of use, FlexRay™ facilitates real-time communication in active chassis control systems.
Foundry A semiconductor manufacturer whose primary business objective is the production and sale of processed silicon wafers. Development and distribution of the wafer-based products are provided by the foundry’s customers.
Frontend manufacturing The production of electronic circuits on silicon wafers by means of physical and chemical processing methods under clean room conditions.
HALIOS® HALIOS® (High Ambient Light Independent Optical System) technology is distinguished by its detection of three-dimensional motion. Optical outside influences such as strong incidence of light or dust do not affect the performance. The electronic compensation of external light influence is the technically deciding function.
HMI The acronym HMI stands for Human-Machine Interface. It describes the different ways a person can operate a machine. This can happen for instance by way of switches, voice command, or gesture control.
Elmos Annual Report 2014
Elmos Geschäftsbericht 2014 | 3 Elmos Annual Report 2014 | 135
Appendix – Glossary
Integrated circuit, IC An electronic circuit consisting of different miniaturized electronic components (e.g. resistors, capacitors, transistors) embedded in semi-conductor material.
IO-Link is a communication standard for connecting sensors and actuators to an industrial automation system.
Layout Describes the information gained from circuit development that is required for manufacturing integrated circuits with simple geometric shapes.
MEMS Micro-electro-mechanical systems are in particular sensors based on semiconductor techno-logies. Among other values, they can detect pressure, acceleration, or tilt.
Microprocessor/Microcontroller An integrated, complex electronic unit programmed to control and operate an electronic system. Microprocessors are the central brains of an electronic system such as a computer.
Microsystem A microsystem is the combination of sensorics and readout electronics in a special package. Among other advantages, a microsystem requires very little constructed space due to its high integration level.
Mixed-signal A combination of analog and digital signals simultaneously generated, controlled, or modified on one and the same chip.
MOS Metal-oxide semiconductor (MOS) describes the setup of the central control device for the field effect in a particular category of semiconductor transistors.
OEM An original equipment manufacturer (OEM) distributes (partial) systems to a reseller. In the automotive industry, the car manufacturers are referred to as OEMs.
PIR sensor The PIR sensor (for passive infrared) is the most commonly used type of motion detector. It shows the optimal response to angle changes, i.e. if a person walks by the sensor.
Pressure sensor The pressure sensor can detect low or high pressure, depending on the application, and transmit the data to readout electronics. Pressure sensors find use for instance in medical applications (e.g. respirators, blood pressure meters) or automotive applications (e.g. tire pressure monitoring).
Semiconductor A solid material (e.g. silicon or germanium) whose electrical conductivity can be changed toward positive and/or negative currents by deliberate doping (mostly with phosphor or boron).
Sensor An electronic unit that measures or detects a real physical quantity, e.g. motion, pressure, heat, or light, and converts it subsequently into an analog or digital electric signal.
Silicon The most common semiconductor material, used for approx. 95% of all chips produced.
Structure width The term structure width is used for integrated circuits and identifies the technical feasibility of the width of current circuits and electrical components. Structure width is indicated in micrometers (µm) or nanometers (nm).
TPMS A tire pressure monitoring system (TPMS) monitors the pressure in the car tire and notifies the driver if the pressure is too low.
Wafer The basic material in chip production. A wafer is a disc sawn out of a single silicon crystal and polished. Typical diameters are 150mm (6-inch), 200mm (8-inch), and 300 mm (12-inch). In series production wafers are processed in so-called charges of 25 wafers each.
4
carbon neutralnatureOffice.com | DE-162-066342
print production
136
Elmos Annual Report 2014
Informative material
If you want to know more about Elmos, we would be happy to send you the following documents by mail.
-> Annual Report-> Interim Financial Reports/Quarterly Reports-> Eco Report-> Code of Conduct-> Product Catalog
All these documents can also be found on our website at www.elmos.com. If you want to subscribe to our publications, please send an e-mail to [email protected].
This Annual Report is also available in German. Both versions were printed in a carbon-neutral process.
Of course you can visit our Twitter, YouTube, Xing, Slideshare and Google+ profiles through our website (www.elmos.com) as well.
-> YouTube: www.youtube.com/user/ELMOS1984-> Twitter: www.twitter.com/elmos_ag-> Xing: www.xing.com/companies/elmossemiconductorag-> SlideShare: de.slideshare.net/ELMOS_AG-> Google+: https://plus.google.com/+Elmos-Semiconductor/posts
Financial calendar 2015
Results 2014, annual press and analysts’ conference March 18, 2015
Quarterly results Q1/20151 May 5, 2015
Annual General Meeting in Dortmund May 8, 2015
Quarterly results Q2/20151 August 5, 2015
Quarterly results Q3/20151 November 4, 2015
1 The German Securities Trading Act (“Wertpapierhandelsgesetz”) obliges issuers to announce immediately any information which may have a substantial price impact, irrespective of the communicated schedules. Therefore we cannot exclude that we have to announce key figures of quarterly and fiscal year results ahead of the dates mentioned above. As we can never rule out changes of dates, we recommend checking them on the website (www.elmos.com).
Elmos Geschäftsbericht 2014 | 5 Elmos Annual Report 2014 | 137
Appendix – Informative material/Financial calendar 2015/Contact / Imprint
Contact
Janina Rosenbaum | Investor RelationsPhone: + 49 (0) 231-75 49-287Fax: + 49 (0) 231-75 [email protected]
Elmos Semiconductor AGHeinrich-Hertz-Straße 144227 Dortmund | GermanyPhone: + 49 (0) 231-75 49-0Fax: + 49 (0) 231-75 [email protected] | www.elmos.com
Imprint
Publisher and Editors
Elmos Semiconductor AG, Dortmund
Design
Elmos Semiconductor AG, Dortmund, Investor Relations
Photography
eitelsonnenschein: title, 3-6, 22, 26, 34, 36, 46, 58, 66, 70Elmos Semiconductor AG: 10, 12, 25, 32, 34iStockphoto: 32, 34
English translation
Marc Donay, Cologne
Medienhaus Lonnemann, Selm
Forward-looking statements
This report contains statements directed to the future that are based on assumptions and estimates made by the management of Elmos. Even though we assume the underlying expectations of our statements to be realistic, we cannot guarantee these expectations will prove right. The assumptions may carry risks and uncertainties, and as a result actual events may differ materially from the current statements made with respect to the future. Among the factors that could cause material differences are changes in general economic and business conditions, changes in exchange and interest rates, the introduction of competing products, lack of acceptance of new products, and changes in business strategy. Elmos neither intends nor assumes any obligation to update its statements with respect to future events.
This English translation is for convenience purposes only.
Elmos Geschäftsbericht 2014 | 137

6
Elmos Semiconductor AG
Heinrich-Hertz-Straße 1
44227 Dortmund | Germany
Phone + 49 (0) 231 - 75 49 - 0
Fax + 49 (0) 231 - 75 49 - 149
[email protected] | www.elmos.com