Embed Size (px)
Citation preview
—3—
Products on the cutting edge Annual report 2015
—4—
Elmos Annual Report 2015
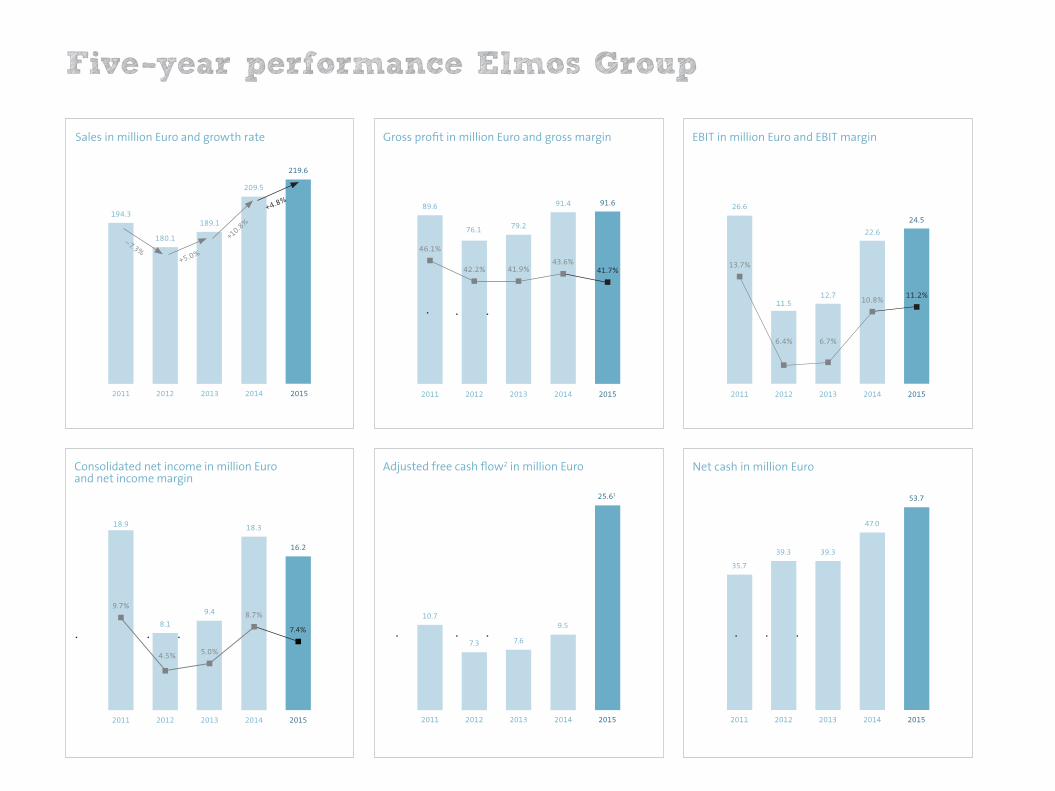
Five year performance Elmos Group
Gross profit in million Euro and gross margin
Adjusted free cash flow2 in million Euro
2011 2012 2013 2014 2015
10.7
7.3 7.6
9.5
25.61
Net cash in million Euro
2011 2012 2013 2014 2015
35.7
39.3 39.3
47.0
53.7
Consolidated net income in million Euro and net income margin
EBIT in million Euro and EBIT margin
2011 2012 2013 2014 2015
13.7%
6.4% 6.7%
10.8%11.2%
26.6
11.512.7
22.6
24.5
Sales in million Euro and growth rate
–7.3%+5.0%
+10.8%194.3
180.1
189.1
209.5
219.6
2011 2012 2013 2014 2015
+4.8% 91.489.6
76.1 79.2
91.6
43.6%
46.1%
42.2% 41.9% 41.7%
20142011 2012 2013 2015
7.4%
8.7%
20142011 2012 2013 2015
18.9
9.4
16.2
18.3
8.1
9.7%
5.0%4.5%
—5—
Due to calculation processes, tables and references may produce rounding differences from the mathematically exact values (monetary units, percentage statements, etc.).
1 Adjusted for the repurchase of land and building from prematurely terminated lease agreements in the amount of approx. 14 million Euro2 Cash flow from operating activities less capital expenditures for intangible assets and property, plant and equipment, less payments for investments, plus disposal of investments 3 Proposal to the Annual General Meeting in May 2016
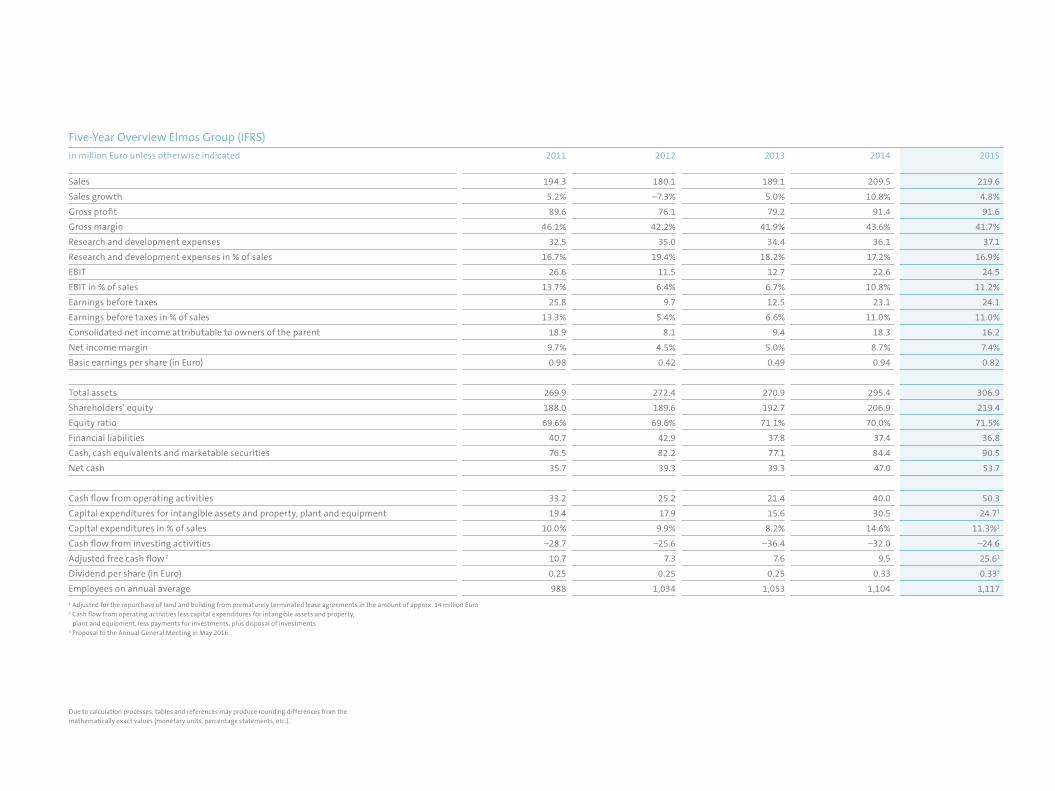
in million Euro unless otherwise indicated 2011 2012 2013 2014 2015
Sales 194.3 180.1 189.1 209.5 219.6
Sales growth 5.2% –7.3% 5.0% 10.8% 4.8%
Gross profit 89.6 76.1 79.2 91.4 91.6
Gross margin 46.1% 42.2% 41.9% 43.6% 41.7%
Research and development expenses 32.5 35.0 34.4 36.1 37.1
Research and development expenses in % of sales 16.7% 19.4% 18.2% 17.2% 16.9%
EBIT 26.6 11.5 12.7 22.6 24.5
EBIT in % of sales 13.7% 6.4% 6.7% 10.8% 11.2%
Earnings before taxes 25.8 9.7 12.5 23.1 24.1
Earnings before taxes in % of sales 13.3% 5.4% 6.6% 11.0% 11.0%
Consolidated net income attributable to owners of the parent 18.9 8.1 9.4 18.3 16.2
Net income margin 9.7% 4.5% 5.0% 8.7% 7.4%
Basic earnings per share (in Euro) 0.98 0.42 0.49 0.94 0.82
Total assets 269.9 272.4 270.9 295.4 306.9
Shareholders’ equity 188.0 189.6 192.7 206.9 219.4
Equity ratio 69.6% 69.6% 71.1% 70.0% 71.5%
Financial liabilities 40.7 42.9 37.8 37.4 36.8
Cash, cash equivalents and marketable securities 76.5 82.2 77.1 84.4 90.5
Net cash 35.7 39.3 39.3 47.0 53.7
Cash flow from operating activities 33.2 25.2 21.4 40.0 50.3
Capital expenditures for intangible assets and property, plant and equipment 19.4 17.9 15.6 30.5 24.71
Capital expenditures in % of sales 10.0% 9.9% 8.2% 14.6% 11.3%1
Cash flow from investing activities –28.7 –25.6 –36.4 –32.0 –24.6
Adjusted free cash flow 2 10.7 7.3 7.6 9.5 25.61
Dividend per share (in Euro) 0.25 0.25 0.25 0.33 0.333
Employees on annual average 988 1,034 1,053 1,104 1,117
Five-Year Overview Elmos Group (IFRS)

—6—
Elmos Annual Report 2015
Information for our shareholders
Management Board 14
Supervisory Board 22
Corporate governance 26
Sustainability 32
The Elmos share 34
Significant events 2015 38
Combined management report
Basic information on the Group 42
Business report 50
Subsequent events 61
Opportunities and risks 62
Outlook 70
Legal information 73
Consolidated Financial Statements
Financial statements 76
Notes to financial statements 80
Auditor’s report 130
Responsibility statement 131
Appendix
Glossary 132
Informative material/Financial calendar 2016 136
Contact/Imprint 137

—7—
Elmos solutions
make everyday
life easier safer
and better.

—8—
Elmos Annual Report 2015

—3—
We know
when
things are
changing.

—4—
Elmos Annual Report 2015
Business line 1Sensors
Parking made easy
Beep, beep, beep – today a new car almost always parks
with that characteristic sound. Elmos has already
supplied more than 500,000,000 ICs for ultrasonic
parking assist systems and thus has certainly made
parking easier for you, too. Think of Elmos whenever
you park your car without having to crane your neck.
Please keep your distance
Stop-and-go traffic is quite the norm in the cities
and on many highways today. Our distance control
systems detect the space between your car and the
one ahead of you and make your vehicle stop and start
moving automatically. And if you lose your nerve in
the next traffic jam, rest assured that our chips will
always keep their cool.
—5—
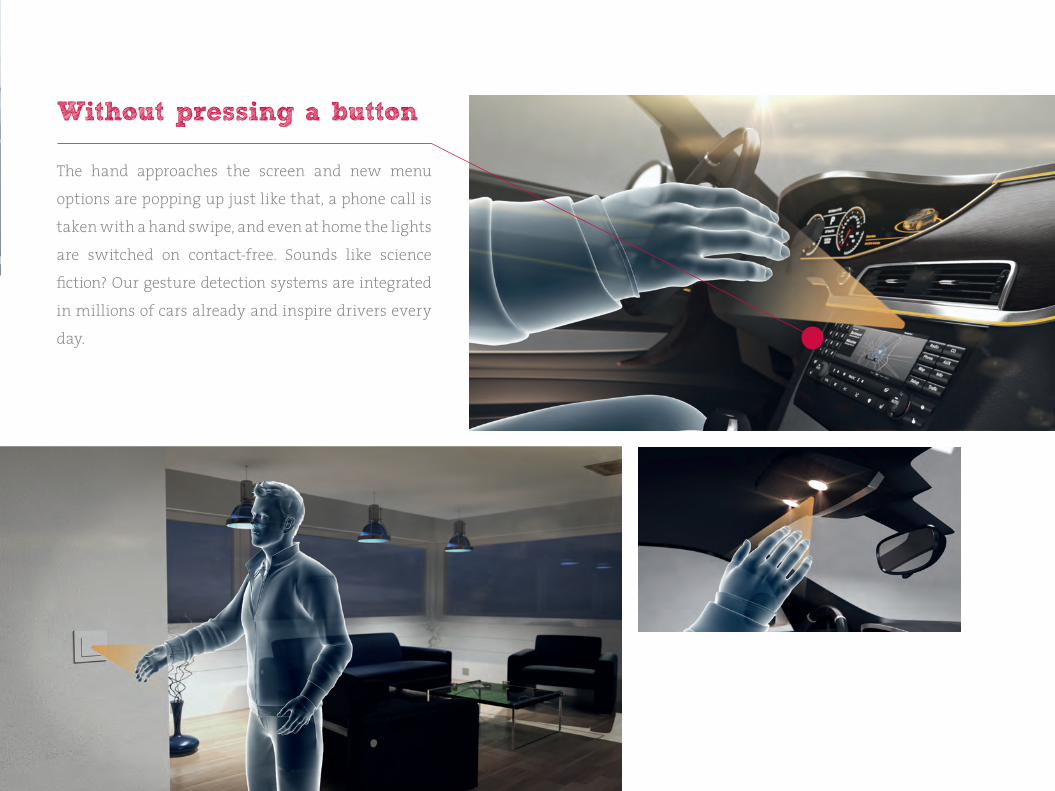
Without pressing a button
The hand approaches the screen and new menu
options are popping up just like that, a phone call is
taken with a hand swipe, and even at home the lights
are switched on contact-free. Sounds like science
fiction? Our gesture detection systems are integrated
in millions of cars already and inspire drivers every
day.

—6—
Elmos Annual Report 2015

—7—
We know how
the motor is
supposed to
turn.
—8—
Elmos Annual Report 2015
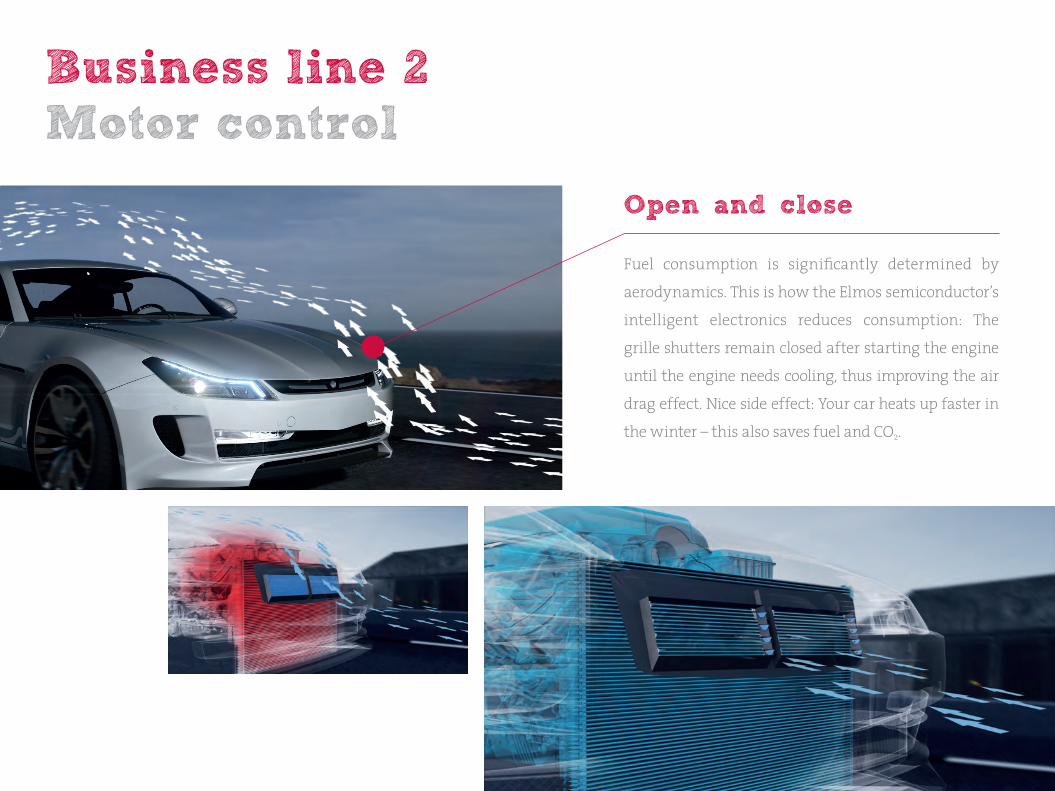
Business line 2Motor control
Open and close
Fuel consumption is significantly determined by
aerodynamics. This is how the Elmos semiconductor’s
intelligent electronics reduces consumption: The
grille shutters remain closed after starting the engine
until the engine needs cooling, thus improving the air
drag effect. Nice side effect: Your car heats up faster in
the winter – this also saves fuel and CO2.
—9—
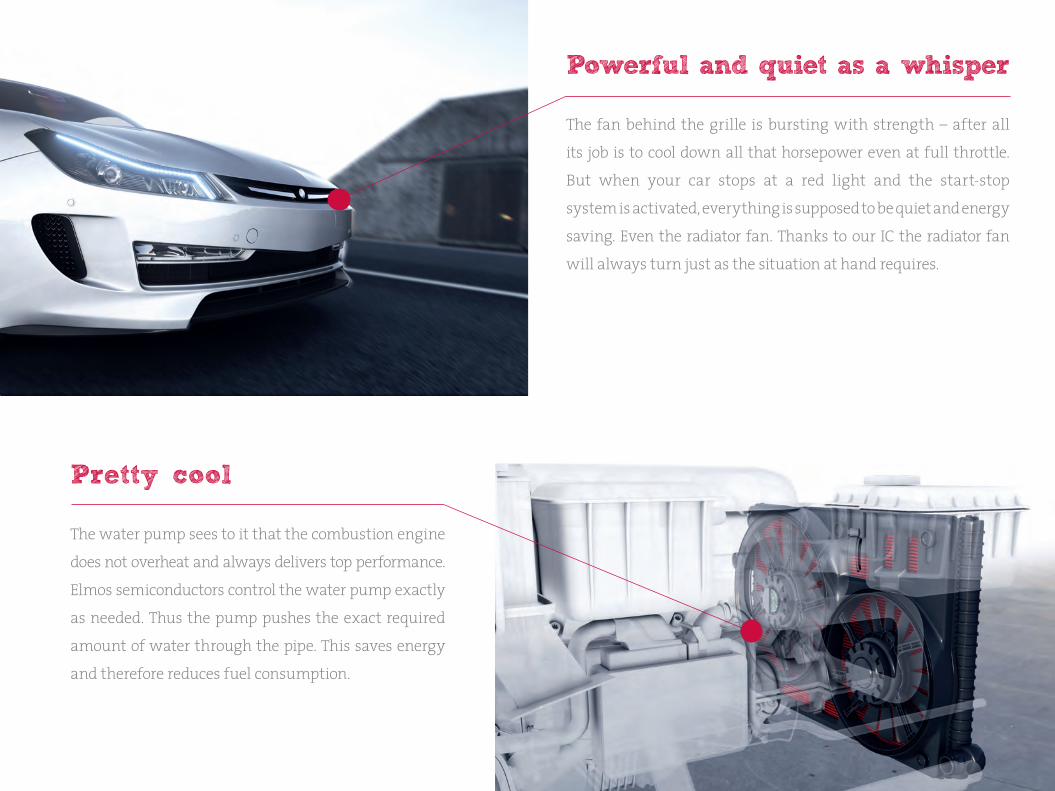
Pretty cool:
The water pump sees to it that the combustion engine
does not overheat and always delivers top performance.
Elmos semiconductors control the water pump exactly
as needed. Thus the pump pushes the exact required
amount of water through the pipe. This saves energy
and therefore reduces fuel consumption.
Powerful and quiet as a whisper
The fan behind the grille is bursting with strength – after all
its job is to cool down all that horsepower even at full throttle.
But when your car stops at a red light and the start-stop
system is activated, everything is supposed to be quiet and energy
saving. Even the radiator fan. Thanks to our IC the radiator fan
will always turn just as the situation at hand requires.

—10—
Elmos Annual Report 2015

—11—
We know how
cars light
the way and
become safer.
—12—
Elmos Annual Report 2015
Business line 3Embedded solutions
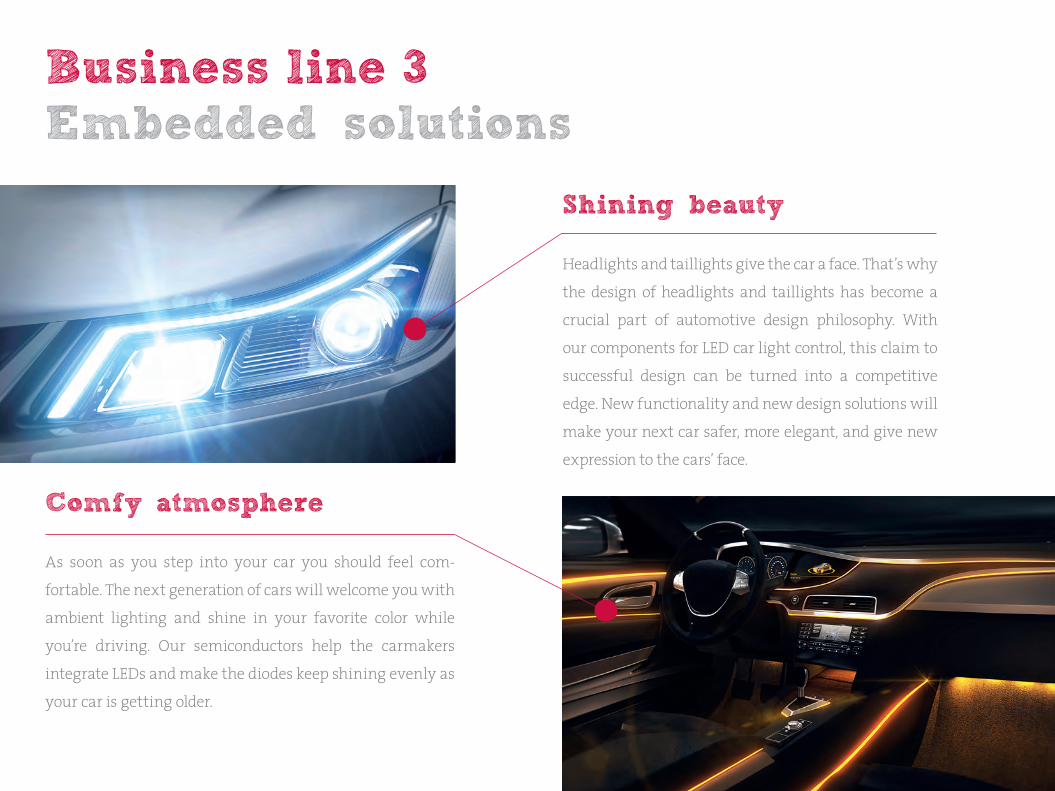
Shining beauty
Headlights and taillights give the car a face. That’s why
the design of headlights and taillights has become a
crucial part of automotive design philosophy. With
our components for LED car light control, this claim to
successful design can be turned into a competitive
edge. New functionality and new design solutions will
make your next car safer, more elegant, and give new
expression to the cars’ face.
Comfy atmosphere:
As soon as you step into your car you should feel com-
fortable. The next generation of cars will welcome you with
ambient lighting and shine in your favorite color while
you’re driving. Our semiconductors help the carmakers
integrate LEDs and make the diodes keep shining evenly as
your car is getting older.
—13—
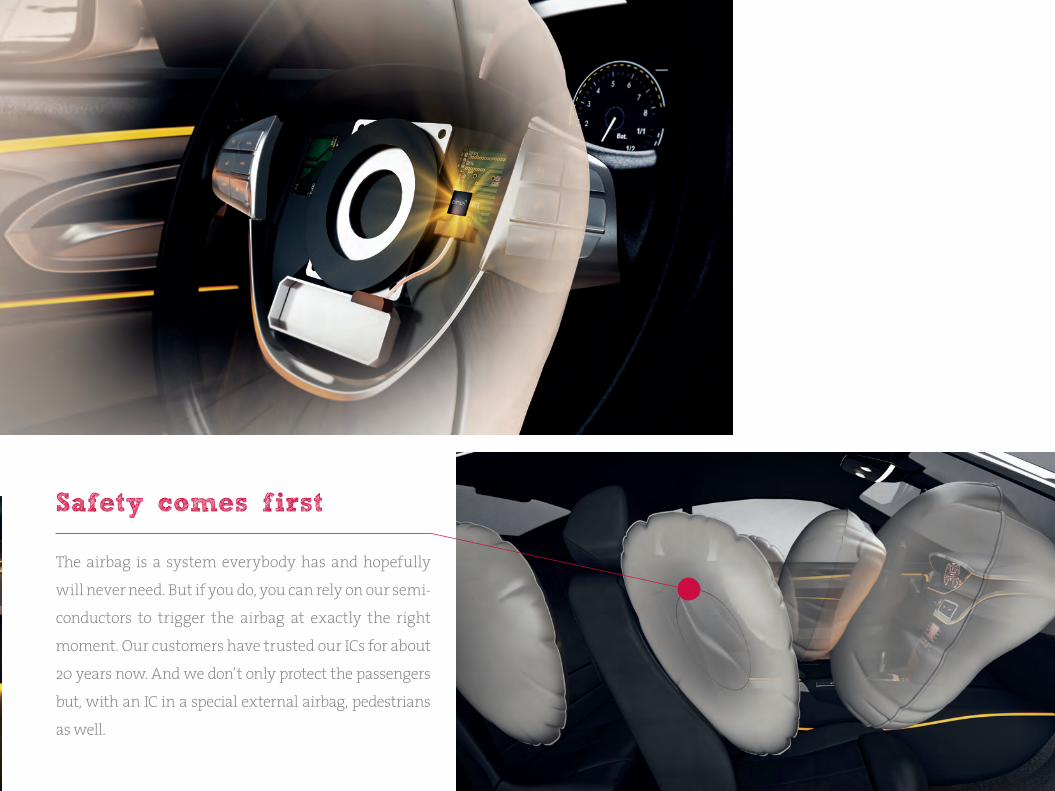
Safety comes first
The airbag is a system everybody has and hopefully
will never need. But if you do, you can rely on our semi-
conductors to trigger the airbag at exactly the right
moment. Our customers have trusted our ICs for about
20 years now. And we don’t only protect the passengers
but, with an IC in a special external airbag, pedestrians
as well.
—14—
Elmos Annual Report 2015
Structural improvements even in a challenging environment
Interview with the CEO
—15—
Information for our shareholders – Management Board
Dr. Mindl, what comes first to your mind when you look back on 2015?First of all I think of all our newly acquired customer orders. In this respect the year 2015 showed itself at its best near the finish line: A year-end rally helped us exceed our already ambitious acquisition targets. Just as satisfying is the fact that we won more than 20 new customers globally. We will not forget, though, that the real work has just begun. We have to master all project steps successfully and to transfer the projects to series production on schedule. As is customary in our industry, the successful acquisition will not have an immediate effect in numbers. It will take two to five years for its positive effects to show.
Can you name a few projects that have a lot of promise in your opinion?Our semiconductors for the control and voltage supply of LEDs are very well received by our customers. Headlights and taillights as well a car’s interior lighting will change completely in the future. Exterior lighting can be upgraded by new LED design and corresponding control with additional functionalities. Dynamic light and color effects will find entry in the interior, pointing the driver optically to events or dangerous situations for instance. The first cars equipped with a preliminary stage of this technology are just leaving the assembly lines. Yet our chips for LEDs aren’t only used in vehicles
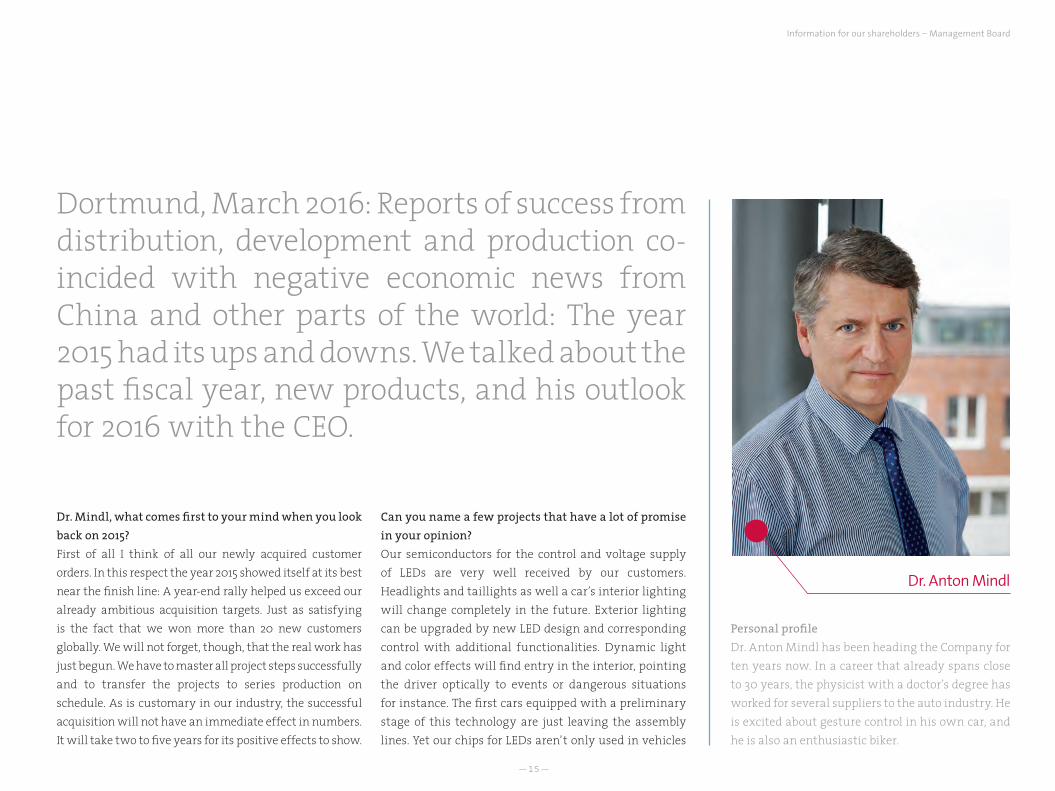
Personal profileDr. Anton Mindl has been heading the Company for ten years now. In a career that already spans close to 30 years, the physicist with a doctor’s degree has worked for several suppliers to the auto industry. He is excited about gesture control in his own car, and he is also an enthusiastic biker.
Dortmund, March 2016: Reports of success from distribution, development and production co- incided with negative economic news from China and other parts of the world: The year 2015 had its ups and downs. We talked about the past fiscal year, new products, and his outlook for 2016 with the CEO.
Dr. Anton Mindl
—16—
Elmos Annual Report 2015
but also in future motorbikes for example. Thus we cover the complete range of technological and pricing requirements. The market is very promising, this is about large numbers of units.
What other projects will make significant contributions to sales in the future?We also have interesting products for motor and sensor applications in the pipeline. Our ICs will control air ventilation in industrial applications and see to it that the car engine is cooled efficiently and in a resource-friendly way. And we also keep winning new customers for our existing applications due to our know-how, our ultrasonic readout ICs being a case in point. We combine many years of experience with a thorough and deep understanding of the system. This results in products that give our customers a competitive edge. As is also the case with gesture control in cars, first introduced to the market by us a few years ago. Our next product generation is already on their marks and set to conquer further platforms one by one.
What do you consider the main reason for the success in the acquisition of projects?Our three business lines Sensors, Motor Control, and Embedded Solutions provide the right structures to identify trends in the market, define and develop the right products, and offer perfect support in their implementation. The system know-how we have acquired is appreciated by our customers. In this Annual Report we present each of the three business lines with a small selection of key products.
Let’s come to financials now: Dr. Mindl, please complete this sentence: From an economic perspective, the year 2015 was……determined by a challenging political and global economic framework, high exchange rate volatility, but a still satisfying outcome for sales and earnings in the end.
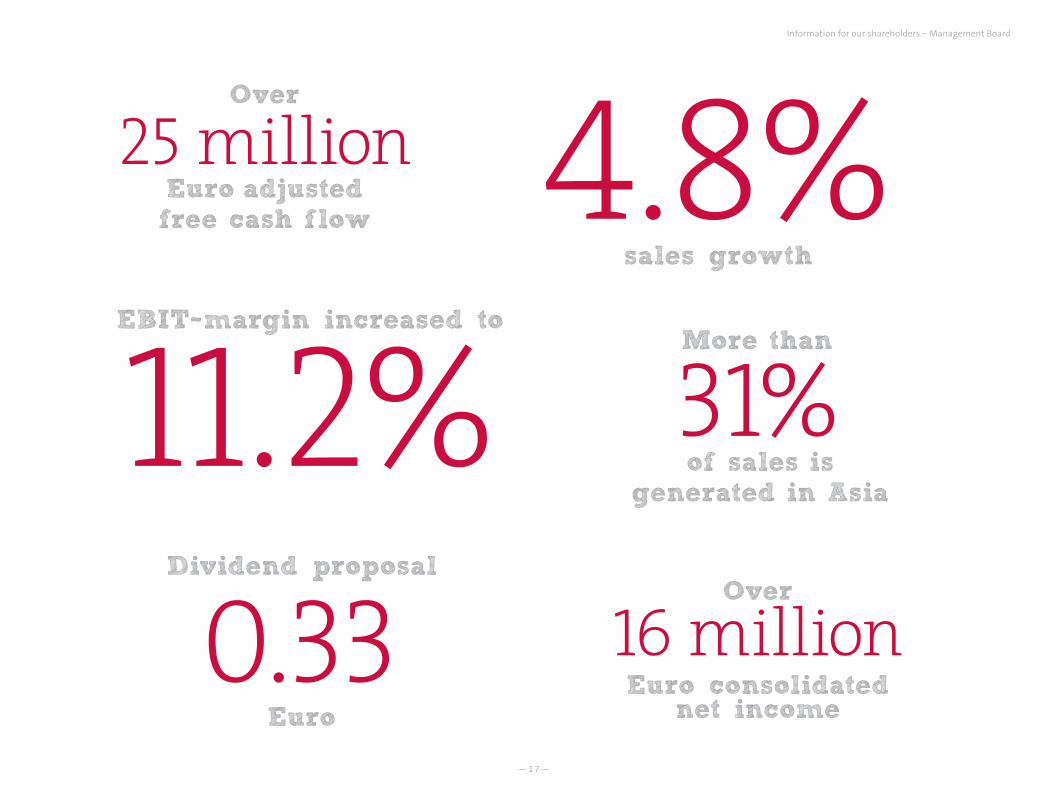
A sales increase of 4.8% to 219.6 million Euro, an EBIT growth of 8.7% to 24.5 million Euro, equivalent to an EBIT margin of 11.2%, and consolidated net income of 16.2 million Euro – that looks pretty good at first sight. Why are you still not completely satisfied?At the beginning of 2015 we anticipated a higher sales growth but due to uncertainty in the markets, particularly in China, our customers had fewer products delivered to them than we had expected. On the cost side,
the weak euro also “dragged us down”. But the adjusted free cash flow “made good” with us. We managed to more than double it compared to the previous year with 25.6 million Euro in 2015. This is an indication of the cash strength inherent in our business model.
You have mentioned China already, what an impact do the developments have on Elmos?Even though the Chinese auto market turned out the weakest growth for three years in 2015 as reported by the Chinese Association of Automobile Manufacturers, we achieved disproportionate growth there. Altogether we generated about 68.9 million Euro or 31.4% of sales with customers in Asia in 2015. The region’s share in sales has thus climbed by another 12.9 million Euro or 4.7% points compared to 2014. This roughly equals 23% growth over the previous year and was highly disproportionate. There has always been turbulence in the markets but for the medium and long term we keep regarding China and the whole Asian market as positive for Elmos.
What were the developments in business operations you were satisfied with in 2015?In 2015 we successfully completed an in-house megaproject: Production has mastered the conversion to 8-inch wafers, capacity has been increased, and throughput times have been reduced. Of course we keep working on our competitiveness in 2016: not only
—17—
4.8%sales growth
25 millionEuro adjusted free cash flow
Over
31% of sales is
generated in Asia
More than
16 million Over
Euro consolidated net income
0.33 Dividend proposal
Euro
11.2%EBIT margin increased to
Information for our shareholders – Management Board
—18—
Elmos Annual Report 2015
Growth drivers
Driver assistance
Autonomous driving
Active and passive safety
Predicative safety
More information systems
The net worked car
LessCO2
Electromobility
—19—
throughout our own business units but also side by side with our partners who have become increasingly important in the course of our fab lite strategy. The successes achieved over the past year have altogether confirmed my conviction that we can achieve a gross margin of about 50% and an EBIT margin of about 15% in the medium term based on our structure.
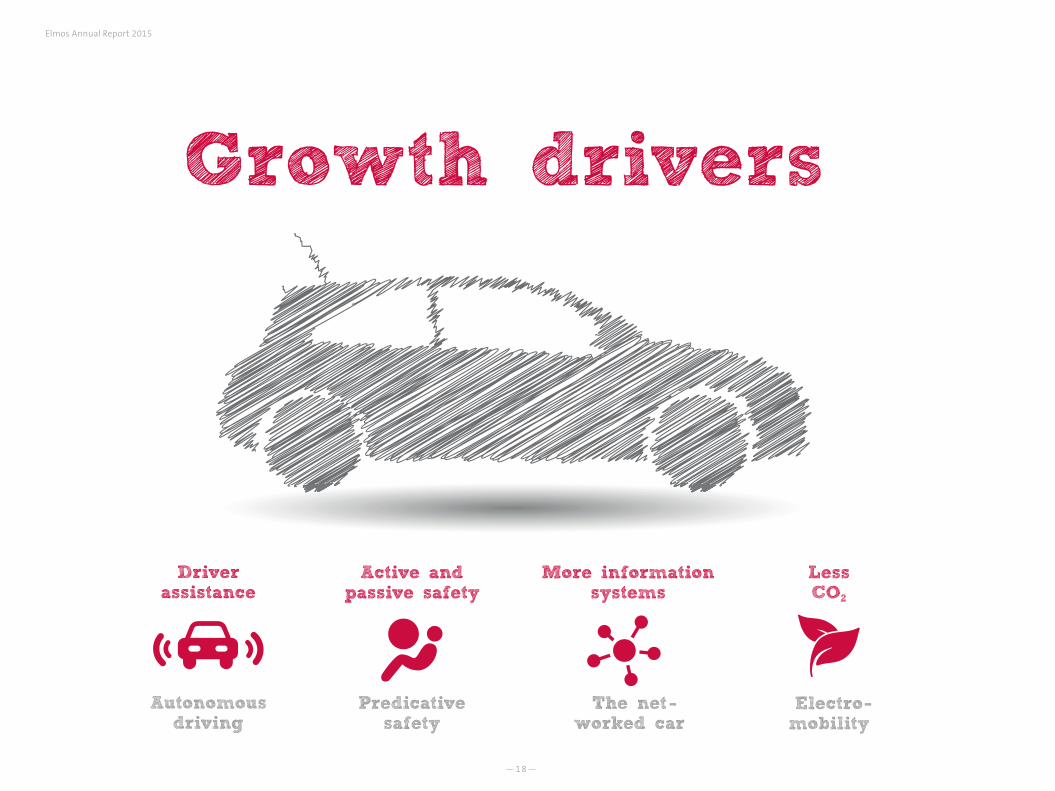
What are the growth drivers that make you feel optimistic?The megatrends such as driver assistance up to autonomous driving, less emission, and electromobility are all growth drivers for Elmos. We also expect large potential from an increased need for safety and the corresponding passive, active and predicative systems. All megatrends have measuring, control and regulating functions in common. But communication between the individual systems is a key task for automotive electronics today and tomorrow. And that is exactly where the strengths of Elmos chips and sensors are.
What are the factors that will determine the business performance in 2016?From a global economic perspective, we will take many of the 2015 topics with us to the new fiscal year. The economy, particularly in China but also in the U.S.A., the political developments in the Middle East and in Russia, and the volatile stock markets will keep having an effect on the world economy and thus on the consumers‘ spending behavior in 2016. According to forecasts of market research institutes, 2016 will become rather difficult for the global car market. The German Association of the Automotive Industry (VDA; German: Verband der Automobilindustrie) expects very little growth of only 2% in worldwide car registrations.
Taking these aspects into consideration, what does the forecast for 2016 look like?In 2016 sales will be affected by the already mentioned slow growth in new car registrations and the Company’s earnings will be affected by the strong U.S. dollar. Elmos therefore anticipates a sales increase between 2% and 6% for 2016 over the previous year. The EBIT margin is expected to come to roughly 10%. The capex ratio is scheduled to amount to less than 12% of sales. We are thus scaling the capex ratio target down compared to the
targets of the past few years. Elmos will also generate a positive adjusted free cash flow once more. We raised the dividend in 2015 by roughly one third to 0.33 Euro and we want to propose the same dividend amount to the Annual General Meeting in May 2016 and have our investors participate in the Company’s success again.
A summary might read like this: The environment continues to be challenging, the Asian markets are losing momentum, and many crises are unsolved. Why does Elmos still manage to have an optimistic outlook?There is a simple answer to this: A major Elmos strength is its team performance. The very best plans and strategies will not help if you can’t rely on your team. Staff and management work for solutions, with a vision and with expert know-how. I am proud of the performance of our employees and on behalf of the Supervisory Board and the Management Board, I would like to thank them for their great work in all divisions. This is also the reason why I am optimistic in my outlook for the future despite the insecure global economic situation: Elmos has the capability of achieving structural improvements even in challenging times.
Information for our shareholders – Management Board
—20—
Elmos Annual Report 2015
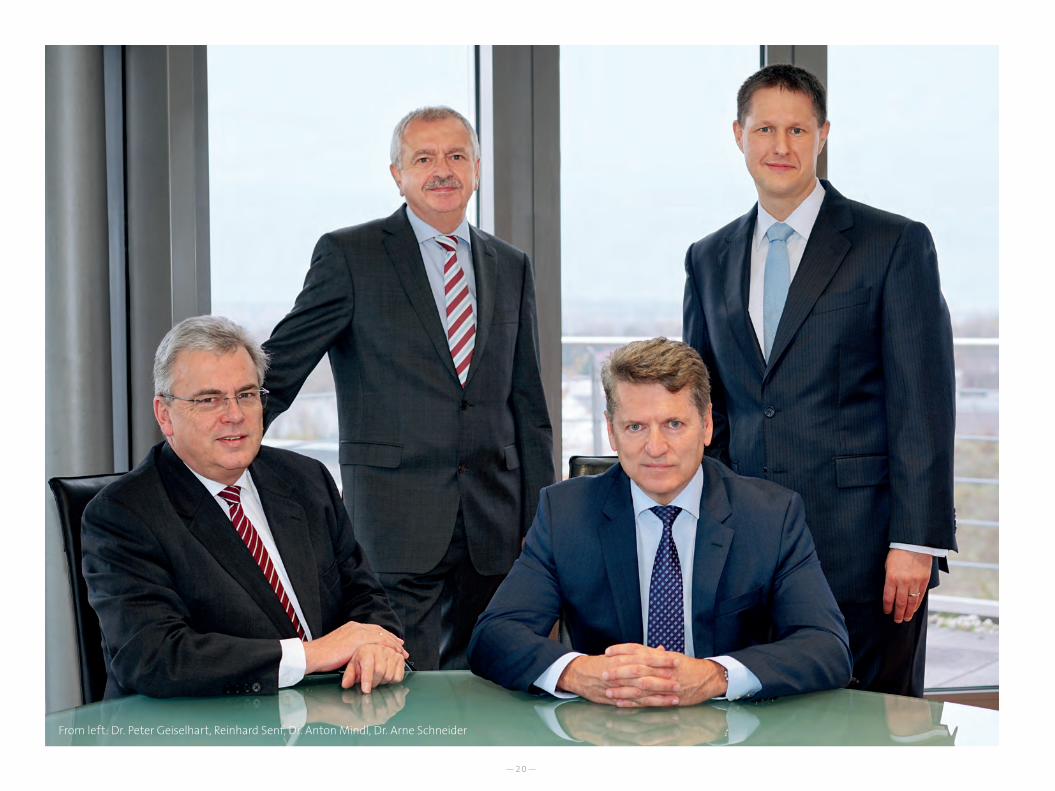
From left: Dr. Peter Geiselhart, Reinhard Senf, Dr. Anton Mindl, Dr. Arne Schneider
—21—
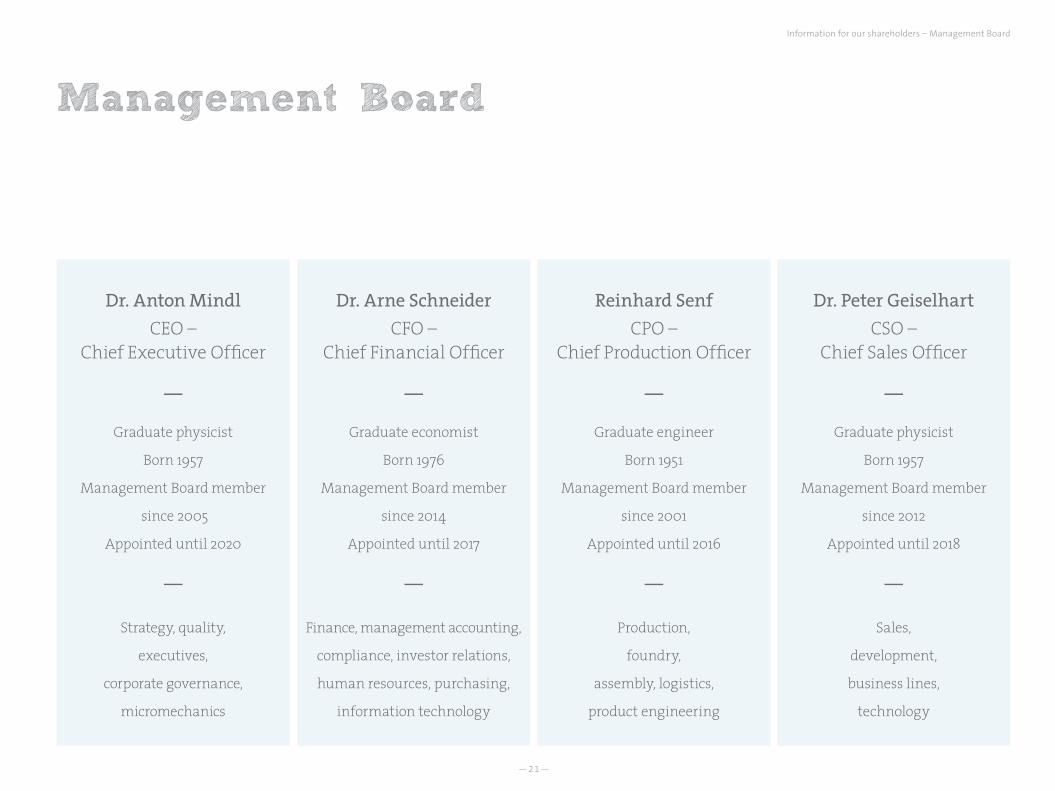
Dr. Anton MindlCEO –
Chief Executive Officer
—
Graduate physicist
Born 1957
Management Board member
since 2005
Appointed until 2020
—
Strategy, quality,
executives,
corporate governance,
micromechanics
Dr. Arne SchneiderCFO –
Chief Financial Officer
—
Graduate economist
Born 1976
Management Board member
since 2014
Appointed until 2017
—
Finance, management accounting,
compliance, investor relations,
human resources, purchasing,
information technology
Reinhard SenfCPO –
Chief Production Officer
—
Graduate engineer
Born 1951
Management Board member
since 2001
Appointed until 2016
—
Production,
foundry,
assembly, logistics,
product engineering
Dr. Peter GeiselhartCSO –
Chief Sales Officer
—
Graduate physicist
Born 1957
Management Board member
since 2012
Appointed until 2018
—
Sales,
development,
business lines,
technology
Management Board
Information for our shareholders – Management Board
—22—
Elmos Annual Report 2015
Dear shareholders,
the Supervisory Board diligently attended to its duties and responsibilities imposed by law and the Articles of Incorporation in fiscal year 2015. The Board advised the Management Board in running the Company and supervised management activity. In oral and written reports, the Supervisory Board was supplied extensively and timely with comprehensive information on the Company’s situation by the Management Board. The Supervisory Board was directly involved in all decisions of substantial importance. The Management Board consulted the Supervisory Board on the Company’s strategic orientation and analyzed any divergences from the business plan individually. The Management Board’s reports on all business transactions of relevance to the Company were examined and discussed at length in the Supervisory Board meetings. Insofar as stipulated by law or the Articles of Incorporation, the Supervisory Board gave its opinion on the Management Board’s reports and resolutions following diligent examination and exhaustive discussion. Outside the framework of Supervisory Board meetings, the chairman and other members of the Supervisory Board were also informed about material business transactions by the CEO. Conflicting interests of Management Board or Supervisory Board members subject to mandatory disclosure to the Supervisory Board or rather the General Meeting did not occur.
There were four meetings altogether in fiscal year 2015, namely on March 4, 2015, May 8, 2015, September 2, 2015,
and December 18, 2015. In a meeting held on March 2, 2016, the Supervisory Board concerned itself primarily with the 2015 financial statements and consolidated financial statements; the auditor was present for a part of this session. During the sessions, the Supervisory Board informed itself in detail about the current developments of the fiscal year ended December 31, 2015, the Company’s situation, and recent business policy decisions on the basis of written and oral reports given by the Management Board. Based on these comprehensive explanations, the Supervisory Board passed the required resolutions. If necessary, resolutions were jointly passed by Supervisory Board and Management Board. The Supervisory Board regularly discussed the current performance of the Company with respect to sales, earnings and liquidity in its sessions as well as future prospects. In the individual meetings, the situation and structure of the subsidiaries as well as the Group’s strategic development beyond the year under review were dealt with in detail. The budget for the next fiscal year and planned capital expenditures were discussed in depth.
Key issues of the Supervisory Board meetings were the present state of new design wins from customers and the updated sales planning for the next five years. In addition to that, the Supervisory Board concerned itself with current and potential cooperation or acquisition projects. The subject of further debate were the implications of the performance of the U.S. dollar against the euro and the corresponding effects on business processes. Staff development in the Company was discussed as
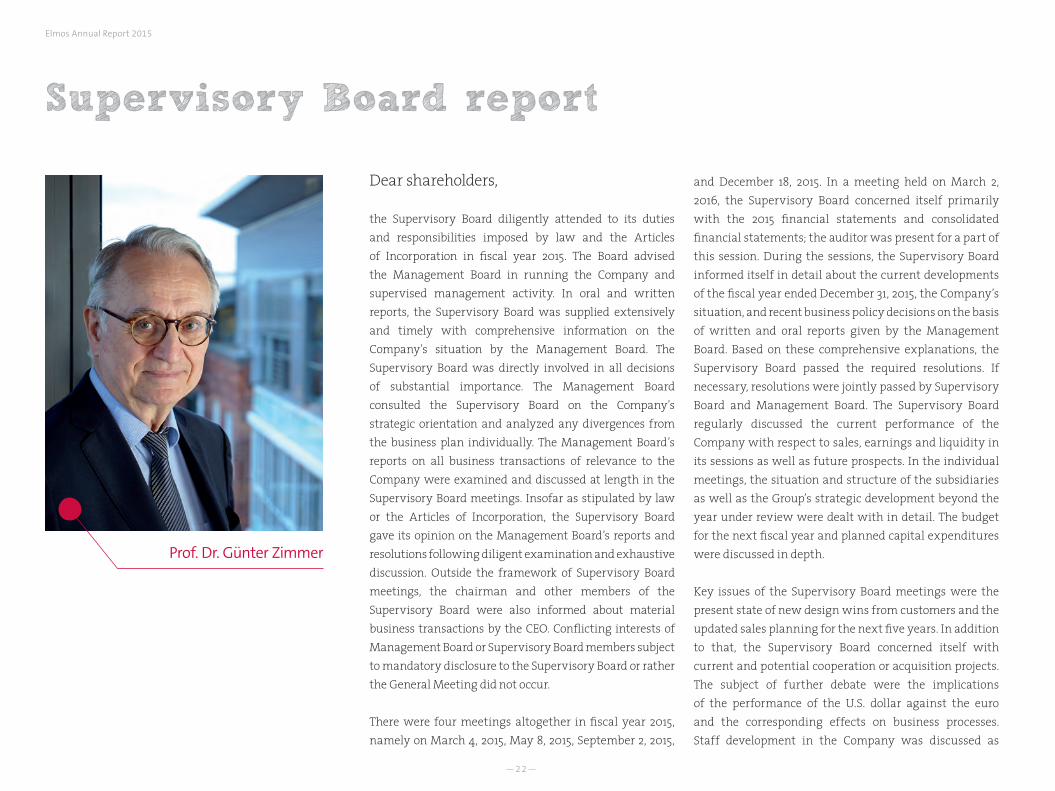
Prof. Dr. Günter Zimmer
Supervisory Board report

—23—
well. According to the “Act on the Equal Participation of Women and Men in Leadership Positions in the Private Sector and the Public Sector”, which came into force recently, the Supervisory Board determined quotas for the memberships of Supervisory Board and Management Board. The corporate governance report provides further information on those quotas. Moreover, the extension of the contract of employment with Reinhard Senf, member of the Management Board for production, was resolved until the end of the year 2016 and his succession was debated.
As in the previous fiscal years, the Supervisory Board informed itself with the risk management system and its focal issues. The Management Board also reported to the Supervisory Board on the present state of the compliance program and presented measures already taken as well as planned further measures for the future. The Supervisory Board dealt with the recommendations and suggestions of the German Corporate Governance Code in depth and prepared the declaration of compliance together with the Management Board. Furthermore, the Supervisory Board discussed the agenda of the upcoming Annual General Meeting to be held on May 11, 2016 in Dortmund and, in this context, the candidates for the elections to the Supervisory Board in May 2016. The Supervisory Board also debated the appointment of the auditor and supervised auditor independence. Moreover, the Supervisory Board examined the efficiency of its own work and evaluated it.
In fiscal year 2015 all meetings of the Supervisory Board were attended by all of its members.
The Supervisory Board does not set up committees.
AUDIT OF SEPARATE FINANCIAL STATEMENTS AND CONSOLIDATED FINANCIAL STATEMENTS Consulting the certified accountants of Warth & Klein Grant Thornton AG, Wirtschaftsprüfungsgesellschaft, Düsseldorf, the Supervisory Board concerned itself in its meeting of March 2, 2016 with the audit of the separate financial statements and consolidated financial statements for the fiscal year ended December 31, 2015. According to the resolution of the Annual General Meeting of May 8, 2015 and the ensuing commission given by the Supervisory Board to the auditor, the separate financial statements prepared in accordance with HGB provisions (Commercial Code) for the fiscal year ended December 31, 2015 and the management report of Elmos Semiconductor AG which is combined with the group management report were audited by Warth & Klein Grant Thornton AG, Wirtschaftsprüfungsgesellschaft, Düsseldorf. The auditor issued an unqualified audit opinion. The consolidated financial statements of Elmos Semiconductor AG were prepared in accordance with the International Financial Reporting Standards (IFRS) as applicable in the EU and completed with the statements required under Section 315 a (1) HGB. The consolidated financial statements according to IFRS and the joint management report also received an unqualified audit opinion. The financial statement documents, the Annual Report and the audit
reports were submitted to all Supervisory Board members in due time. In the Supervisory Board meeting held on March 2, 2016, the statements and reports were also explained orally by the Management Board. The certified accountants also reported on the results of their audit in this session. After its own examination of the financial statements of Elmos Semiconductor AG, the consolidated financial statements and the joint management report as well as the Management Board’s proposal for the appropriation of profits, the Supervisory Board approved the auditor’s findings based on the audit and approved the financial statements of Elmos Semiconductor AG and the consolidated financial statements of the Elmos Group. The financial statements are thus adopted.
Supervisory Board and Management Board propose to the Annual General Meeting the resolution to pay a dividend of 0.33 Euro per share for fiscal year 2015 out of the retained earnings of 76.9 million Euro (according to HGB) and to carry forward the remaining amount to new accounts.
CORPORATE GOVERNANCE Management Board and Supervisory Board work closely together for the Company’s benefit and are committed to the sustained increase of shareholder value. The Supervisory Board informs itself regularly about the new standards of corporate governance. In September 2015, Management Board and Supervisory Board jointly released an updated declaration pursuant to Section 161 AktG (Stock Corporation Act) on compliance with the recommendations of the German Corporate Governance
Information for our shareholders – Supervisory Board report
—24—
Elmos Annual Report 2015
Prof. Dr. Günter Zimmer, chairmanGraduate physicist | Duisburg
Dr. Burkhard Dreher, vice chairman Graduate economist | Dortmund Dr. Klaus EggerGraduate engineer | Steyr-Gleink, Austria
Thomas Lehner1
Graduate engineer | Dortmund
Sven-Olaf Schellenberg1
Graduate physicist | Dortmund
Dr. Klaus WeyerGraduate physicist | Penzberg1 Employee representative
Code in the version of May 5, 2015. It can be found in this Annual Report on page 27. This declaration of compliance and all previous ones have been made permanently available to the shareholders on the Company’s website. The joint corporate governance report prepared by Management Board and Supervisory Board is also part of this Annual Report, starting on page 26.
COMPOSITION OF SUPERVISORY BOARD AND MANAGEMENT BOARDThere were no changes on the Supervisory Board in fiscal year 2015. The next elections of shareholder representatives to the Supervisory Board will be held at the Annual General Meeting on May 11, 2016. Elections of the employee representatives will be held prior to the Annual General Meeting.
There were no changes on the Management Board either in fiscal year 2015.
More information about the members of the Management Board can be found on page 21 of this Annual Report. Information on the members of the Supervisory Board is listed on the right.
The Supervisory Board thanks all employees and all members of the Management Board for their work and their contribution to the success achieved in fiscal year 2015.
Dortmund, March 2, 2016
On behalf of the Supervisory BoardProf. Dr. Günter ZimmerChairman of the Supervisory Board
Supervisory Board
—25—
Management Board and Supervisory Board work closely together for the benefit of the Company.
Information for our shareholders – Supervisory Board report
—26—
Elmos Annual Report 2015
In the following chapter, the Management Board – also on behalf of the Supervisory Board – reports on corporate governance at Elmos Semiconductor AG pursuant to No. 3.10 of the German Corporate Governance Code. This chapter also includes the statement on corporate governance in accordance with Section 289a HGB (Commercial Code) and the remuneration report.
IMPLEMENTATION OF THE GERMAN CORPORATE GOVERNANCE CODEFor the Management Board and the Supervisory Board of Elmos Semiconductor AG, corporate governance means the implementation of responsible and sustainable business management with the necessary transparency across all areas of the Group. Management Board and Supervisory Board have again concerned themselves intensively in fiscal year 2015 with the provisions of the German Corporate Governance Code. In doing so, the amendments to the Code released in May 2015 by the Government Commission were considered. In September 2015, Supervisory Board and Management Board jointly released the declaration of compliance in accordance with Section 161 AktG once again. Apart from the reported deviations, all recommendations of the German Corporate Governance Code are complied with. All previously released declarations of compliance have been made permanently available on the Elmos website.
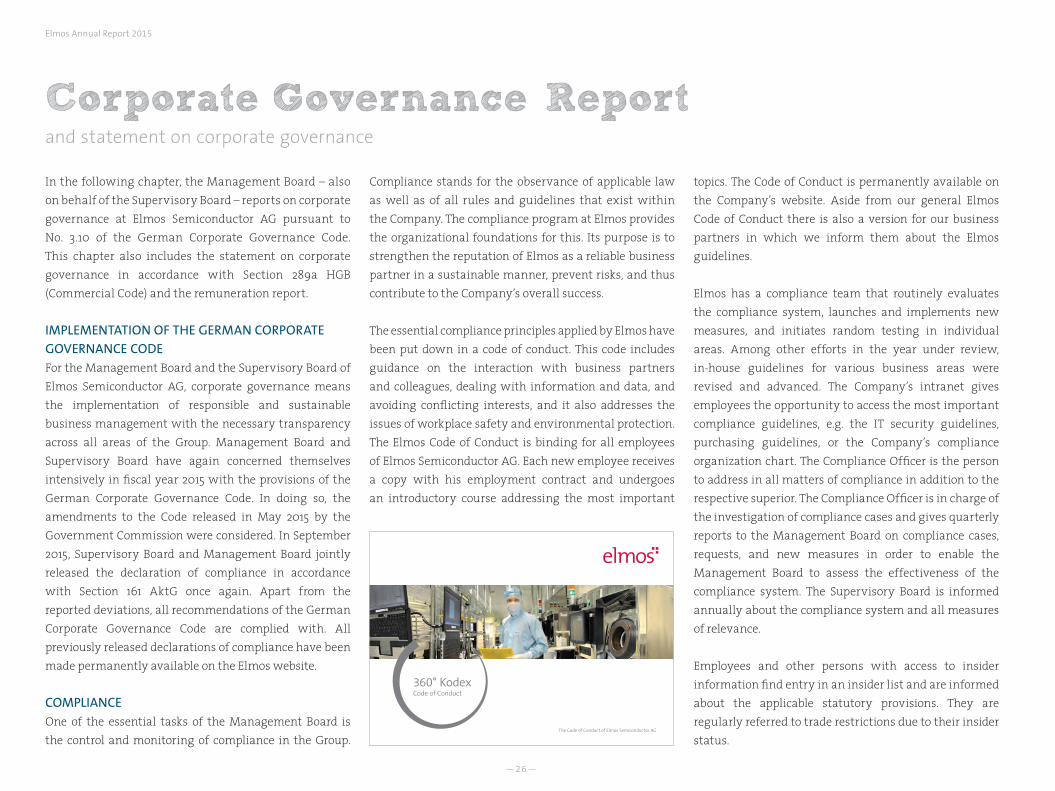
COMPLIANCE One of the essential tasks of the Management Board is the control and monitoring of compliance in the Group.
Compliance stands for the observance of applicable law as well as of all rules and guidelines that exist within the Company. The compliance program at Elmos provides the organizational foundations for this. Its purpose is to strengthen the reputation of Elmos as a reliable business partner in a sustainable manner, prevent risks, and thus contribute to the Company’s overall success.
The essential compliance principles applied by Elmos have been put down in a code of conduct. This code includes guidance on the interaction with business partners and colleagues, dealing with information and data, and avoiding conflicting interests, and it also addresses the issues of workplace safety and environmental protection. The Elmos Code of Conduct is binding for all employees of Elmos Semiconductor AG. Each new employee receives a copy with his employment contract and undergoes an introductory course addressing the most important
topics. The Code of Conduct is permanently available on the Company’s website. Aside from our general Elmos Code of Conduct there is also a version for our business partners in which we inform them about the Elmos guidelines.
Elmos has a compliance team that routinely evaluates the compliance system, launches and implements new measures, and initiates random testing in individual areas. Among other efforts in the year under review, in-house guidelines for various business areas were revised and advanced. The Company’s intranet gives employees the opportunity to access the most important compliance guidelines, e.g. the IT security guidelines, purchasing guidelines, or the Company’s compliance organization chart. The Compliance Officer is the person to address in all matters of compliance in addition to the respective superior. The Compliance Officer is in charge of the investigation of compliance cases and gives quarterly reports to the Management Board on compliance cases, requests, and new measures in order to enable the Management Board to assess the effectiveness of the compliance system. The Supervisory Board is informed annually about the compliance system and all measures of relevance.
Employees and other persons with access to insider information find entry in an insider list and are informed about the applicable statutory provisions. They are regularly referred to trade restrictions due to their insider status.
Corporate Governance Reportand statement on corporate governance
—27—
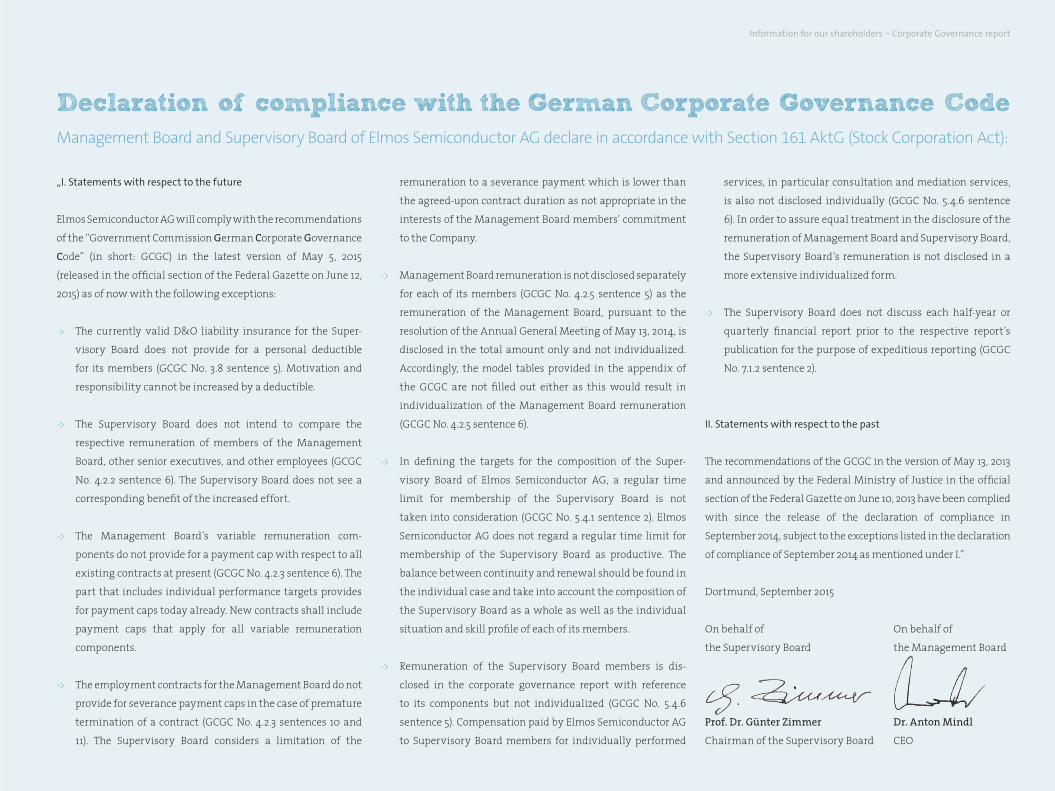
Declaration of compliance with the German Corporate Governance Code
Management Board and Supervisory Board of Elmos Semiconductor AG declare in accordance with Section 161 AktG (Stock Corporation Act):
„I. Statements with respect to the future
Elmos Semiconductor AG will comply with the recommendations
of the “Government Commission German Corporate Governance
Code” (in short: GCGC) in the latest version of May 5, 2015
(released in the official section of the Federal Gazette on June 12,
2015) as of now with the following exceptions:
-> The currently valid D&O liability insurance for the Super-
visory Board does not provide for a personal deductible
for its members (GCGC No. 3.8 sentence 5). Motivation and
responsibility cannot be increased by a deductible.
-> The Supervisory Board does not intend to compare the
respective remuneration of members of the Management
Board, other senior executives, and other employees (GCGC
No. 4.2.2 sentence 6). The Supervisory Board does not see a
corresponding benefit of the increased effort.
-> The Management Board’s variable remuneration com-
ponents do not provide for a payment cap with respect to all
existing contracts at present (GCGC No. 4.2.3 sentence 6). The
part that includes individual performance targets provides
for payment caps today already. New contracts shall include
payment caps that apply for all variable remuneration
components.
-> The employment contracts for the Management Board do not
provide for severance payment caps in the case of premature
termination of a contract (GCGC No. 4.2.3 sentences 10 and
11). The Supervisory Board considers a limitation of the
remuneration to a severance payment which is lower than
the agreed-upon contract duration as not appropriate in the
interests of the Management Board members’ commitment
to the Company.
-> Management Board remuneration is not disclosed separately
for each of its members (GCGC No. 4.2.5 sentence 5) as the
remuneration of the Management Board, pursuant to the
resolution of the Annual General Meeting of May 13, 2014, is
disclosed in the total amount only and not individualized.
Accordingly, the model tables provided in the appendix of
the GCGC are not filled out either as this would result in
individualization of the Management Board remuneration
(GCGC No. 4.2.5 sentence 6).
-> In defining the targets for the composition of the Super-
visory Board of Elmos Semiconductor AG, a regular time
limit for membership of the Supervisory Board is not
taken into consideration (GCGC No. 5.4.1 sentence 2). Elmos
Semiconductor AG does not regard a regular time limit for
membership of the Supervisory Board as productive. The
balance between continuity and renewal should be found in
the individual case and take into account the composition of
the Supervisory Board as a whole as well as the individual
situation and skill profile of each of its members.
-> Remuneration of the Supervisory Board members is dis-
closed in the corporate governance report with reference
to its components but not individualized (GCGC No. 5.4.6
sentence 5). Compensation paid by Elmos Semiconductor AG
to Supervisory Board members for individually performed
services, in particular consultation and mediation services,
is also not disclosed individually (GCGC No. 5.4.6 sentence
6). In order to assure equal treatment in the disclosure of the
remuneration of Management Board and Supervisory Board,
the Supervisory Board’s remuneration is not disclosed in a
more extensive individualized form.
-> The Supervisory Board does not discuss each half-year or
quarterly financial report prior to the respective report’s
publication for the purpose of expeditious reporting (GCGC
No. 7.1.2 sentence 2).
II. Statements with respect to the past
The recommendations of the GCGC in the version of May 13, 2013
and announced by the Federal Ministry of Justice in the official
section of the Federal Gazette on June 10, 2013 have been complied
with since the release of the declaration of compliance in
September 2014, subject to the exceptions listed in the declaration
of compliance of September 2014 as mentioned under I.”
Dortmund, September 2015
On behalf of
the Supervisory Board
Prof. Dr. Günter Zimmer
Chairman of the Supervisory Board
On behalf of
the Management Board
Dr. Anton Mindl
CEO
Information for our shareholders – Corporate Governance report
—28—
Elmos Annual Report 2015
WORKING METHODS OF MANAGEMENT BOARD AND SUPERVISORY BOARD Management Board and Supervisory Board share the commitment to responsible corporate governance. Their highest goal is to safeguard the Company’s existence and to increase the shareholder value. The Management Board has four members. The individual members of the Management Board are responsible for their respective key areas (overview on page 21); together they assume responsibility for the entire management in accordance with the applicable law, the Articles of Incorporation, the Board’s rules of procedure, and the resolutions of the General Meeting of shareholders. The Management Board represents the Company to the outside world. The Board is responsible for the management of the Group, the definition and monitoring of the Group’s strategic orientation and corporate targets, and the Group’s financing. The Management Board usually meets in full session once a week. The Management Board gives regular, extensive and timely reports to the Supervisory Board on all developments and events of relevance to the Company.
The Supervisory Board supervises the Management Board, appoints its members, and advises them with respect to the Company’s management. Upon the nomination of candidates for the Management Board, the Supervisory Board examines the eligibility of women and men equally. Finding the right person for the position according to his or her qualification for the benefit of the Company remains the top priority.
Management Board and Supervisory Board work together closely based on mutual trust. The Management Board always involves the Supervisory Board in essential decisions. The rules of procedure of the two Boards define this cooperation, among other issues. A detailed summary of the Supervisory Board’s work can be found in the Supervisory Board Report starting on page 22. The chairman gives a report to the shareholders on the Supervisory Board’s work over the past fiscal year at each Annual General Meeting.
The Supervisory Board of Elmos Semiconductor AG has six members, elected for five years in accordance with the Articles of Incorporation. Pursuant to the provisions of the German One-Third Participation Act (Drittelbeteiligungsgesetz), the Supervisory Board consists of four shareholder representatives and two employee representatives. The representatives of the shareholders are elected by the General Meeting of shareholders, the employee representatives are elected by the staff. The most recent elections were held in 2011 so that the acting Supervisory Board is elected until the 2016 Annual General Meeting. The Supervisory Board does not set up committees.
GOALS OF THE SUPERVISORY BOARD WITH RESPECT TO ITS COMPOSITIONIn its meetings held on September 2, 2015 and March 2, 2016, the Supervisory Board has renewed the goals and principles established with respect to the Board’s composition. Among them are international experience, technical and
entrepreneurial expertise, strategic vision, knowledge of the Company, industry specific know-how, and experience with accounting and internal control processes. Diversity and the avoidance of conflicting interests are other goals. The Supervisory Board has also defined an age limit for the Board’s members at the time of election. Of the four shareholder representatives on the Supervisory Board, at least one member shall be independent within the meaning of No. 5.4.2 of the German Corporate Governance Code. The target with respect to the adequate participation of women has been redefined within the framework of the implementation of the “Act on the Equal Participation of Women and Men in Leadership Positions in the Private Sector and the Public Sector” (see below).
The goals and principles are fully realized with the present composition of the Supervisory Board of Elmos Semiconductor AG and will also be considered for future nominations. The election proposals made by the Supervisory Board for the election of Supervisory Board members will primarily remain oriented toward the Company’s benefit while considering all above-mentioned goals.
The composition of the Supervisory Board is listed on page 24 of this Annual Report.
IMPLEMENTATION OF EQUAL PARTICIPATIONIn accordance with the “Act on the Equal Participation of Women and Men in Leadership Positions in the Private Sector and the Public Sector”, Elmos has defined quotas
—29—
for the respective underrepresented sex for Management Board and Supervisory Board by the Supervisory Board and for the first and second senior executive levels by the Management Board.
Both on the Supervisory Board and the Management Board of Elmos Semiconductor AG, there are no women at present. At the next senior executive level, the share of women is 4%, at the second-next senior executive level, it comes to 5%. All data refer to the employees of Elmos Semiconductor AG in Germany.
Due to the short time span for the implementation of targets until June 30, 2017 and also due to the decidedly technical orientation with a typically low participation of women, maintaining the status quo was determined as the target for all groups of people. In selecting suitable
candidates, Supervisory Board and Management Board will assess the suitability of female and male applicants equally. However, for the individual choice the candidate’s suitability for the job will remain the deciding criterion for the benefit of the Company. Elmos thus keeps within the framework of statutory provisions.
Due to the decidedly technical orientation of the Company, most executives at Elmos have completed studies of corresponding subjects. Women have been and still are noticeably underrepresented in such study paths.
Based on the average age, the Elmos share of women in executive positions reflects the level of the corresponding graduating class. If women are increasingly schooled in technical professions, the share of women among the staff will probably rise as a whole and thus correspondingly in executive positions as well.
SHAREHOLDERS AND GENERAL MEETING Shareholders make use of their rights at the Annual General Meeting. Prior to the meeting, they receive the agenda, information regarding participation, and upon request the Annual Report.
All the relevant documents relating to the upcoming and past Annual General Meetings as well as further information on participation in and voting at the General Meeting are available on our website – also in English – and can be requested in print from the Company.
Shareholders who cannot attend the General Meeting in person have the option to assign their voting rights to proxies nominated by Elmos. The proxy can be contacted throughout the entire length of the General Meeting. Furthermore, the Annual General Meeting is webcast in its entirety on our website. After the General Meeting, shareholder presence and voting results will be announced on the Internet. The next Annual General Meeting will be held on May 11, 2016 in Dortmund.
Dates of importance to the shareholders are compiled annually in a financial calendar which is published on the Internet and in the Annual Report. All quarterly and annual financial reports are available on the website. The CEO and the CFO regularly provide information on the current position of the Company to analysts and investors within the framework of roadshows and conferences. The investor relations team of Elmos Semiconductor AG is also available for any questions the shareholders may have.
ANTICIPATORY RISK MANAGEMENTEfficient risk management contributes to the success of sound corporate governance. Risk management of this grade does its part in detecting risks at an early stage, assessing them, and initiating adequate countermeasures. All company divisions are involved in the risk management system implemented at Elmos. Parameters for risk assessment are the probability of occurrence and the estimated amount of loss. This risk assessment is regularly updated, even at short notice if necessary. We give account of the principles of the risk
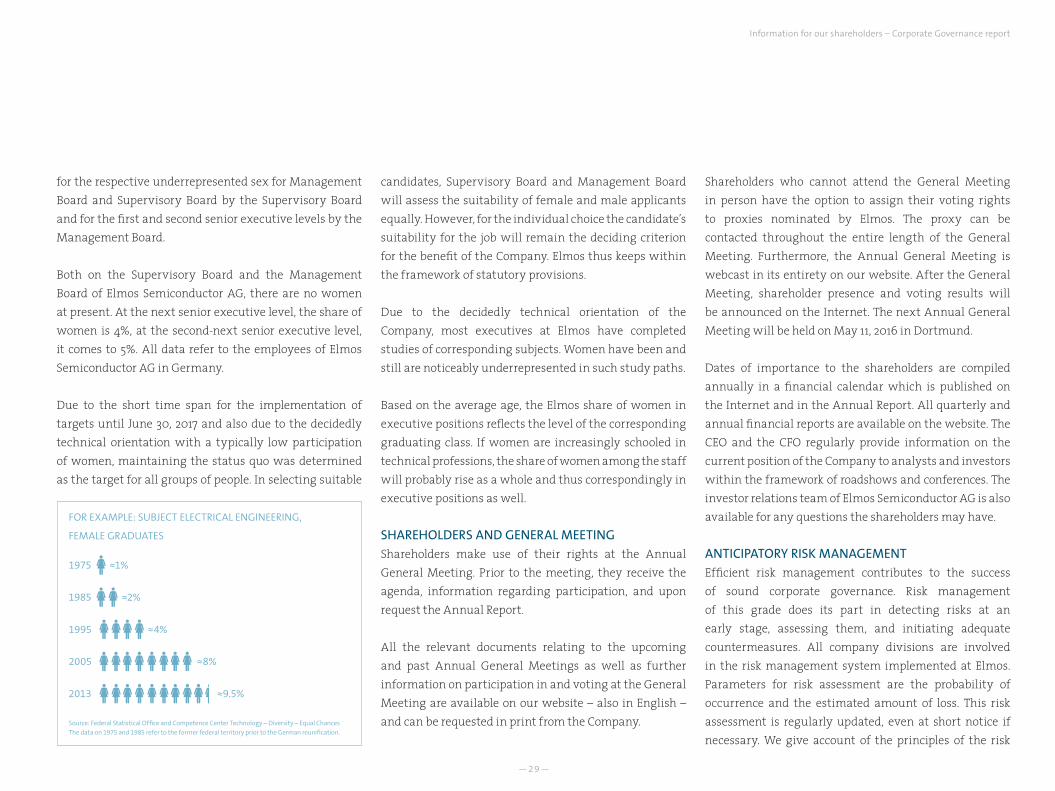
Source: Federal Statistical Office and Competence Center Technology – Diversity – Equal Chances The data on 1975 and 1985 refer to the former federal territory prior to the German reunification.
FOR EXAMPLE: SUBJECT ELECTRICAL ENGINEERING,
FEMALE GRADUATES
≈1%1975
≈2%1985
≈4%1995
≈8%2005
≈9.5%2013
Information for our shareholders – Corporate Governance report
—30—
Elmos Annual Report 2015
management system as well as of current corporate risks in the joint management report under “Opportunities and risks”, starting on page 62.
AUDIT OF FINANCIAL STATEMENTSBefore submitting the proposal for the appointment of the auditor, the Supervisory Board once again obtained a declaration from the auditor on relationships between the auditor, its boards, and its audit manager with the Company or the Company’s Board members for fiscal year 2015. This declaration furnished no doubts about auditor independence. Compliant with No. 7.2.3 of the German Corporate Governance Code, the Supervisory Board arranged for the auditor to give account without delay of any material findings and incidents to occur during the performance of the audit. The Supervisory Board also determined that the auditor inform the Supervisory Board or make note in the audit report if the auditor establishes differences from the declaration of compliance as issued by the Management Board and the Supervisory Board. No inconsistencies of this kind were established.
STOCK OPTION PLANSElmos has issued stock option plans for employees, executives and Management Board members. The stock price is a central criterion for our shareholders to determine the return on an investment in the Company. The link to the stock price is therefore the beneficiaries’ incentive within the scope of the stock option plan.
The plans are explained in detail in the notes to the consolidated financial statements; therefore please refer to note 23 for further information.
REMUNERATION REPORTTotal remuneration of the Management BoardThe Supervisory Board decides and routinely reviews the remuneration system and the essential contract terms and conditions for the Management Board members. Total Management Board remuneration comprises a fixed monthly salary, a management bonus and stock-based payment as well as fringe benefits and pension benefits. The Company does not provide an individualized disclosure of the remuneration with respect to privacy protection. Management Board and Supervisory Board agree that such a disclosure would not contribute to greater transparency in the form of additional information relevant to the capital market. By resolution of the Annual General Meeting of May 13, 2014, the Company is exempt from its legal obligation for individualized disclosure of Management Board remuneration for the period of five years.
Management Board remuneration comprises fixed components and variable incentive components. In fiscal year 2015, the members of the Management Board received a total fixed remuneration of 1,515 thousand Euro (2014: 1,512 thousand Euro) and variable remuneration of 997 thousand Euro (2014: 775 thousand Euro). The variable incentive components are linked to the Group’s current
earnings before taxes on the one hand and to personal, individualized targets, agreed on annually with the Supervisory Board, on the other hand.
Within the framework of a share matching plan, no stock claims were issued to the members of the Management Board in fiscal year 2015 (2014: 3,488 stock claims, time value: 86 thousand Euro). There are indirect pension commitments of a pension fund to members of the Management Board of Elmos. The pension fund has taken out corresponding reinsurance policies for the completely congruent coverage of its plan contributions. In 2015 payments for these reinsurance policies amounted to 454 thousand Euro (2014: 451 thousand Euro), included in the fixed components of the remuneration.
Remuneration of former Management Board members or their surviving dependents amounted to 224 thousand Euro in fiscal year 2015 (2014: 167 thousand Euro). In addition, insurance premiums of 111 thousand Euro were paid for this group of beneficiaries (2014: 111 thousand Euro). Facing these amounts are reimbursements from reinsurance policies in the amount of 119 thousand Euro (2014: 123 thousand Euro). Pension provisions for former Management Board members or their surviving dependents came to 1,543 thousand Euro as of December 31, 2015 (2014: 1,610 thousand Euro). After setting off pension provisions against the time value of pension plan reinsurance, 67 thousand Euro (2014: 192 thousand Euro) remain as part of the pension provisions altogether recognized for the Group.
—31—
Apart from pension commitments and compensation agreements in case of a change of control or as a consequence of a non-competition clause, no additional benefits have been promised to any Management Board member in case of the termination of occupation. Nor did any member of the Management Board receive benefits or corresponding commitments from third parties with regard to his position on the Management Board in the past fiscal year.
Total remuneration of the Supervisory BoardThe Supervisory Board’s remuneration is defined by Section 9 of the Articles of Incorporation. The Supervisory Board members receive fixed and incentive payments in addition to the reimbursement of their expenses. The incentive remuneration is linked to the dividend and thus oriented toward the Company’s long-term and sustained success. 25% of the fixed remuneration and 50% of the variable remuneration are paid in shares of the Company. A holding period of three calendar years as of the shares’ respective grant date applies to shares received as remuneration. The Supervisory Board members are not granted Elmos stock options for their positions on the Board.
Compliant with the recommendation of the German Corporate Governance Code for Supervisory Board remuneration in consideration of chairmanship and vice chairmanship, the chairman receives twice the amount of the regular fixed and variable payments and the vice chairman receives one and a half times of said amount. The Supervisory Board members’ remuneration is disclosed in summarized form, yet not individualized. This also applies for payments made to Supervisory Board members for individually performed services, particularly consulting and mediation services.
The fixed remuneration paid to members of the Supervisory Board in fiscal year 2015 amounted to the total of 84 thousand Euro (2014: 82 thousand Euro). This amount includes expenses and disbursements. Payments of variable remuneration amounted to 218 thousand Euro (2014: 158 thousand Euro). The Company paid 0 thousand Euro (2014: 22 thousand Euro) to members of the Supervisory Board for consulting and other services rendered.
DIRECTORS’ DEALINGS Persons who hold executive positions with an issuer of stock and persons closely related to such a person are obligated by law to disclose the purchase and sale of such stock in accordance with Section 15a WpHG (Securities Trading Act). All such directors’ dealings are
announced immediately upon notification Europe-wide and made public on the Company’s website. For detailed information about directors’ dealings, please refer to the notes to the consolidated financial statements (note 38) in this Annual Report.
HOLDINGS OF STOCK AND STOCK OPTIONSThe disclosures of the Company’s stock and stock options held by members of Management Board and Supervisory Board are explained in detail in the notes to the consolidated financial statements; please refer to note 35 for this information. In accordance with No. 6.3 GCGC, the members of the Supervisory Board had combined direct or indirect holdings of approx. 34.5% and the members of the Management Board had combined direct or indirect holdings of 1.2% of the stock issued by the Company (as of December 31, 2015).
Information for our shareholders – Corporate Governance report
—32—
Elmos Annual Report 2015
Sustainability is part of our corporate strategy. We perceive added value in a comprehensive way and orient the success of our business activities not only toward financial key figures but we also want to connect that success to social acceptance.
ENVIRONMENTEnvironmental protection is one of our guiding corporate principles. Acting responsibly today means securing the future. The following principles determine our conduct:
-> Legal compliance: Laws and provisions on environ-mental protection and other standards the Company has committed to are strictly complied with.
-> Minimization of environmental hazards: Environ-mental issues concern many processes and patterns of behavior in the Company. In this regard, we aim for an economical and efficient use of resources, the application of economically sound state-of-the-art technologies, and precaution against accidents and the interruption of business operations.
-> Sense of responsibility among the staff: Each employee pays attention to environmentally responsible conduct. The active promotion of a sense of responsibility by employee training is a constant management task.
-> Eco management: Elmos has implemented an eco management system based on a structure of clearly defined responsibilities and tasks.
-> Continuous improvement: The goal of the eco protection management system is a systematic and continuous improvement of our Company’s environmental protection performance.
Elmos is certified in accordance with the high eco protection standards of DIN 14001 and the energy management certificate ISO 50001. One example of the accord between cost savings and environmental protection is the combined heat and power plant at the Dortmund location. Elmos generates a considerable amount of the required electric power by itself with its own power plant, in operation since 2012.
In 2015 the cooling units in production were optimized, among other measures, and conventional pumps were replaced by high-efficiency pumps. One reason for this was to reach the targets defined by the Federal Ministry for Economic Affairs and Energy (reduction of primary energy consumption by 20% until 2020). Power consumption of numerous plants has been improved as well.
In 2015 Elmos released statements on its policies with respect to conflict minerals, the EU chemicals regulation REACH (Registration, Evaluation, Authorization and Restriction of Chemicals) and EU regulation RoHS (Restriction of Hazardous Substances). These statements as well as other details of our environmental activities can be found on our website (www.elmos.com/english/about-us/responsibility).
EMPLOYEES For Elmos as a technology company, the employees’ know-how is a particularly crucial factor. Their motivation, expert knowledge and flexibility are the prerequisite to the Company’s long-term success. Especially with regard to the development of new products and processes, the employees are the deciding criterion for innovation and growth.
The principles of proper conduct towards and among employees are defined in our code of conduct. The code addresses issues such as values, law-abiding behavior, conflicting interests, dealing with information, data and the Company’s assets, etc. The code of conduct is binding for all employees and represents a part of our corporate culture.
In order to ensure the continuous professional develop-ment of the employees, Elmos offers specific topical training courses. Over the past year, selected training courses for certain employee groups were also conducted in the form of efficient online training.
In-house health management is an essential social standard implemented by Elmos Semiconductor AG. Elmos wants to provide more than just a workplace and the Company is aware of its social responsibility for its employees. Health management at Elmos rests on four pillars: general health programs, executive coaching, special offers for employees doing shift work, and talks with employees returning from sick leave. The health team
Sustainability
—33—
provides for certain medical examinations, screenings, and influenza vaccination during working hours. In 2015 Elmos also offered courses for nicotine withdrawal. Moreover, the health team organizes the participation in running events and training. Elmos employees once again took part successfully in several business run events and in a dragon boat race on Dortmund’s Lake Phoenix in 2015. Another Elmos soccer cup was held as well.
Among other benefits that go beyond the usual are the in-house cafeteria, our own parking garage, and our in-house gym, providing massages and various training programs.
At its locations in Germany’s most-populated federal state North Rhine-Westphalia (NRW), Elmos is able to recruit from a large number of well-trained young engineers as there are more than 50 universities and colleges in the vicinity. Elmos has maintained close cooperation with some of them ever since the Company’s foundation and holds a unique position as the region’s only semiconductor manufacturer. Elmos is also active in recruitment events in the region, such as “einstieg” for high school students or “konaktiva” for college students, and on the Internet of course (job search engines, Xing, our own website) in order to find suitable applicants for openings. We cooperate with high schools and local institutions of education and hold informative events for college students.
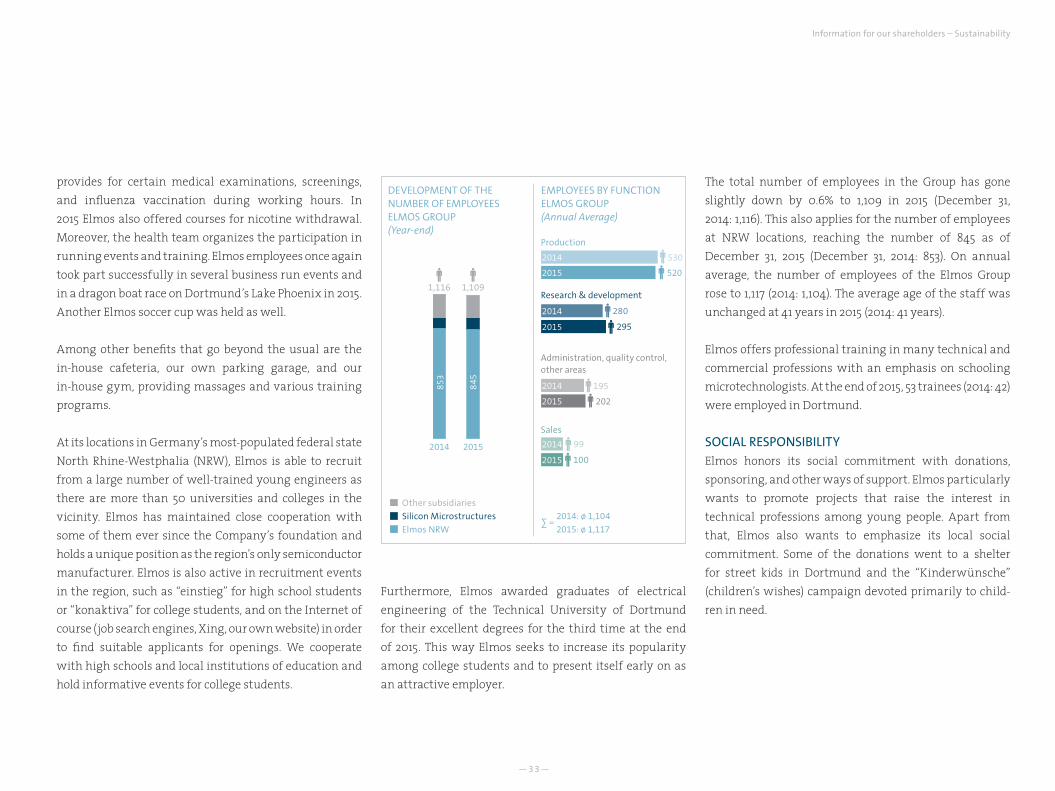
The total number of employees in the Group has gone slightly down by 0.6% to 1,109 in 2015 (December 31, 2014: 1,116). This also applies for the number of employees at NRW locations, reaching the number of 845 as of December 31, 2015 (December 31, 2014: 853). On annual average, the number of employees of the Elmos Group rose to 1,117 (2014: 1,104). The average age of the staff was unchanged at 41 years in 2015 (2014: 41 years).
Elmos offers professional training in many technical and commercial professions with an emphasis on schooling microtechnologists. At the end of 2015, 53 trainees (2014: 42) were employed in Dortmund.
SOCIAL RESPONSIBILITYElmos honors its social commitment with donations, sponsoring, and other ways of support. Elmos particularly wants to promote projects that raise the interest in technical professions among young people. Apart from that, Elmos also wants to emphasize its local social commitment. Some of the donations went to a shelter for street kids in Dortmund and the “Kinderwünsche” (children’s wishes) campaign devoted primarily to child-ren in need.
1,116 1,109
201485
32015
845
Other subsidiaries
Silicon Microstructures
Elmos NRW
DEVELOPMENT OF THE NUMBER OF EMPLOYEESELMOS GROUP(Year-end)
2015 520
2014 530
Production
2015 100
2014 99
Sales
2015 202
2014 195
Administration, quality control, other areas
Research & development
2015 295
2014 280
EMPLOYEES BY FUNCTIONELMOS GROUP(Annual Average)
2014: ø 1,104
2015: ø 1,117∑ =
Furthermore, Elmos awarded graduates of electrical engineering of the Technical University of Dortmund for their excellent degrees for the third time at the end of 2015. This way Elmos seeks to increase its popularity among college students and to present itself early on as an attractive employer.
Information for our shareholders – Sustainability
—34—
Elmos Annual Report 2015
100%
110%
70%
80%
90%
120%
130%
140%
150%
RELATIVE PRICE PERFORMANCE 2015
ELMOS TRADING VOLUME (XETRA AND FRANKFURT FLOOR) IN THOUSAND SHARES
DAXsector Technology
Technology All Share
TecDAX
0
50
100
150
200
Jan. Feb. March April May June July Aug. Sep. Oct. Nov. Dec.
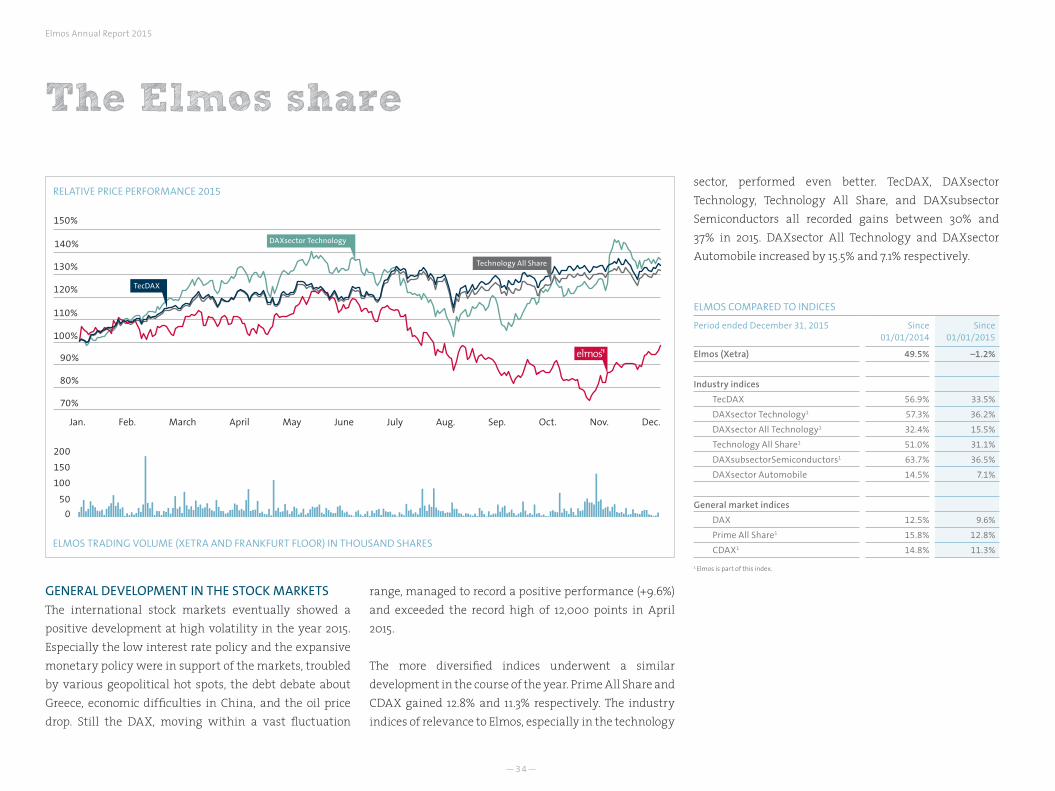
GENERAL DEVELOPMENT IN THE STOCK MARKETSThe international stock markets eventually showed a positive development at high volatility in the year 2015. Especially the low interest rate policy and the expansive monetary policy were in support of the markets, troubled by various geopolitical hot spots, the debt debate about Greece, economic difficulties in China, and the oil price drop. Still the DAX, moving within a vast fluctuation
range, managed to record a positive performance (+9.6%) and exceeded the record high of 12,000 points in April 2015.
The more diversified indices underwent a similar development in the course of the year. Prime All Share and CDAX gained 12.8% and 11.3% respectively. The industry indices of relevance to Elmos, especially in the technology
sector, performed even better. TecDAX, DAXsector Technology, Technology All Share, and DAXsubsector Semiconductors all recorded gains between 30% and 37% in 2015. DAXsector All Technology and DAXsector Automobile increased by 15.5% and 7.1% respectively.
ELMOS COMPARED TO INDICES
Period ended December 31, 2015 Since 01/01/2014
Since 01/01/2015
Elmos (Xetra) 49.5% –1.2%
Industry indices
TecDAX 56.9% 33.5%
DAXsector Technology1 57.3% 36.2%
DAXsector All Technology1 32.4% 15.5%
Technology All Share1 51.0% 31.1%
DAXsubsectorSemiconductors1 63.7% 36.5%
DAXsector Automobile 14.5% 7.1%
General market indices
DAX 12.5% 9.6%
Prime All Share1 15.8% 12.8%
CDAX1 14.8% 11.3%
1 Elmos is part of this index.
The Elmos share
—35—
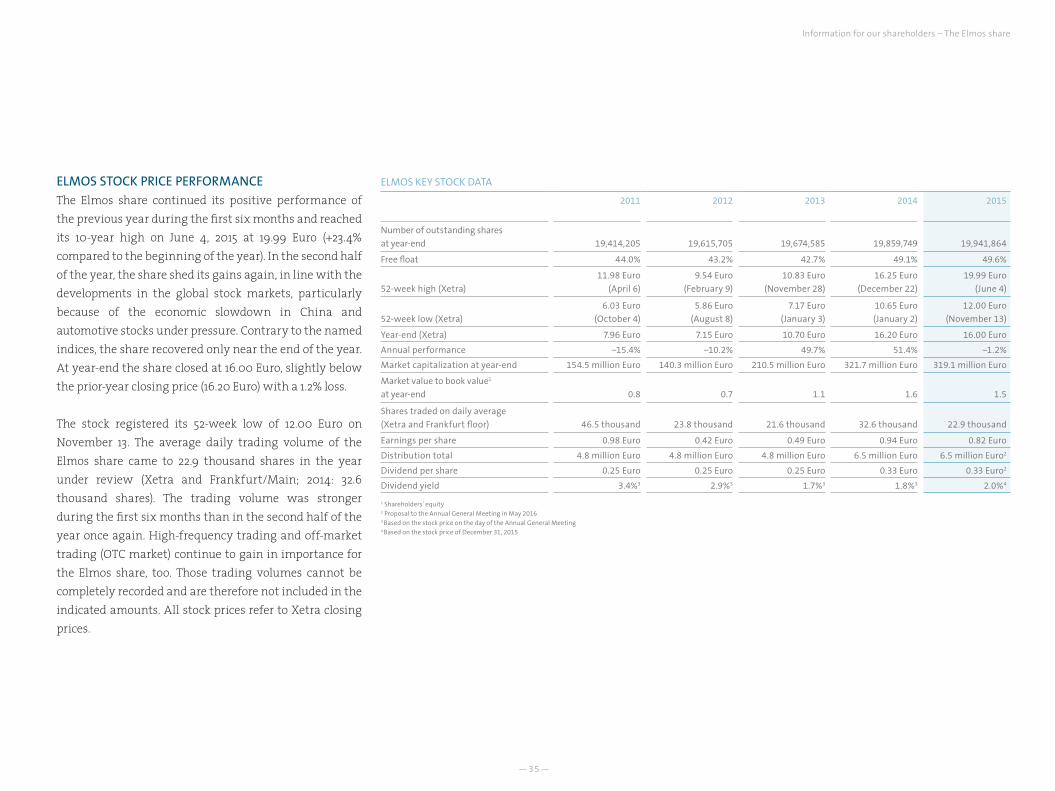
ELMOS STOCK PRICE PERFORMANCE The Elmos share continued its positive performance of the previous year during the first six months and reached its 10-year high on June 4, 2015 at 19.99 Euro (+23.4% compared to the beginning of the year). In the second half of the year, the share shed its gains again, in line with the developments in the global stock markets, particularly because of the economic slowdown in China and automotive stocks under pressure. Contrary to the named indices, the share recovered only near the end of the year. At year-end the share closed at 16.00 Euro, slightly below the prior-year closing price (16.20 Euro) with a 1.2% loss.
The stock registered its 52-week low of 12.00 Euro on November 13. The average daily trading volume of the Elmos share came to 22.9 thousand shares in the year under review (Xetra and Frankfurt/Main; 2014: 32.6 thousand shares). The trading volume was stronger during the first six months than in the second half of the year once again. High-frequency trading and off-market trading (OTC market) continue to gain in importance for the Elmos share, too. Those trading volumes cannot be completely recorded and are therefore not included in the indicated amounts. All stock prices refer to Xetra closing prices.
ELMOS KEY STOCK DATA
2011
2012 2013 2014 2015
Number of outstanding shares
at year-end 19,414,205 19,615,705 19,674,585 19,859,749 19,941,864
Free float 44.0% 43.2% 42.7% 49.1% 49.6%
52-week high (Xetra)
11.98 Euro
(April 6)
9.54 Euro
(February 9)
10.83 Euro
(November 28)
16.25 Euro
(December 22)
19.99 Euro
(June 4)
52-week low (Xetra)
6.03 Euro
(October 4)
5.86 Euro
(August 8)
7.17 Euro
(January 3)
10.65 Euro
(January 2)
12.00 Euro
(November 13)
Year-end (Xetra) 7.96 Euro 7.15 Euro 10.70 Euro 16.20 Euro 16.00 Euro
Annual performance −15.4% −10.2% 49.7% 51.4% −1.2%
Market capitalization at year-end 154.5 million Euro 140.3 million Euro 210.5 million Euro 321.7 million Euro 319.1 million Euro
Market value to book value1
at year-end 0.8 0.7 1.1 1.6 1.5
Shares traded on daily average
(Xetra and Frankfurt floor) 46.5 thousand 23.8 thousand 21.6 thousand 32.6 thousand 22.9 thousand
Earnings per share 0.98 Euro 0.42 Euro 0.49 Euro 0.94 Euro 0.82 Euro
Distribution total 4.8 million Euro 4.8 million Euro 4.8 million Euro 6.5 million Euro 6.5 million Euro2
Dividend per share 0.25 Euro 0.25 Euro 0.25 Euro 0.33 Euro 0.33 Euro2
Dividend yield 3.4%3 2.9%3 1.7%3 1.8%3 2.0%4
1 Shareholders’ equity2 Proposal to the Annual General Meeting in May 20163 Based on the stock price on the day of the Annual General Meeting4 Based on the stock price of December 31, 2015
Information for our shareholders – The Elmos share
—36—
Elmos Annual Report 2015
BASIC STOCK INFORMATION
ISIN / WKN DE0005677108 / 567710
Stock symbol / Reuters ELG / ELGG
Industry Chip manufacturer / Semiconductor
Type of shares No-par ordinary bearer shares
Transparency level Prime Standard
Market segment Xetra Frankfurt 2 – Regulated Market
IPO October 11, 1999
Designated sponsor M.M. Warburg & Co.
Index inclusion CDAX, DAX International Mid 100, DAXPLUS FAMILY, DAXsector All Technology, DAXsector Technology, DAXsubsector All Semiconductors, DAXsubsector Semiconductors, Prime All Share, Technology All Share
The number of treasury shares was reduced to 214,587 shares by the end of the year, equivalent to 1.08% of the share capital, by partially servicing stock options with treasury shares among other reasons (December 31, 2014: 280,825 shares or 1.41%).
In the year 2015 stock options from the tranches issued in 2009, 2010 and 2011 were exercised. This led to an increase in share capital by 82,115 Euro in the year 2015 (2014: 185,164 Euro). As the 2009 tranche expired in 2015, no stock options can be exercised from this tranche anymore in the future. 70,867 stock options from the 2010 tranche can still be exercised until 2017 and 177,902 stock options from
the 2011 tranche can be exercised until 2018. Moreover, the exercise timeframe for another tranche of stock options (the 2012 tranche) will open in the year 2016. No further tranches of stock options are issued at present.
All voting rights announcements, disclosures of the total number of voting rights, and directors’ dealings notifications were made public Europe-wide according to statutory regulations and are also available at www.elmos.com.
INVESTOR RELATIONS In 2015 Elmos continued to inform investors about the current situation and the corporate strategy within the framework of roadshows and conferences in Germany and several other European countries as well as company visits on location. We noticed yet another significant demand for meetings with new investors in the year 2015. We also cultivated our existing contacts. In addition to that, we informed analysts and investors by conducting conference calls after the announcement of results and, upon request, individual shareholders as well. Thus we enable our shareholders and other interested capital market participants to realistically assess our business situation and, in particular, to consider our prospects.
Elmos pursues the goal of informing comprehensively and quickly about economic developments and to be conveniently accessible – for private and institutional investors and for analysts alike. Aiming for both comprehensive and timely information provided equally to all target groups, we have compiled a large body
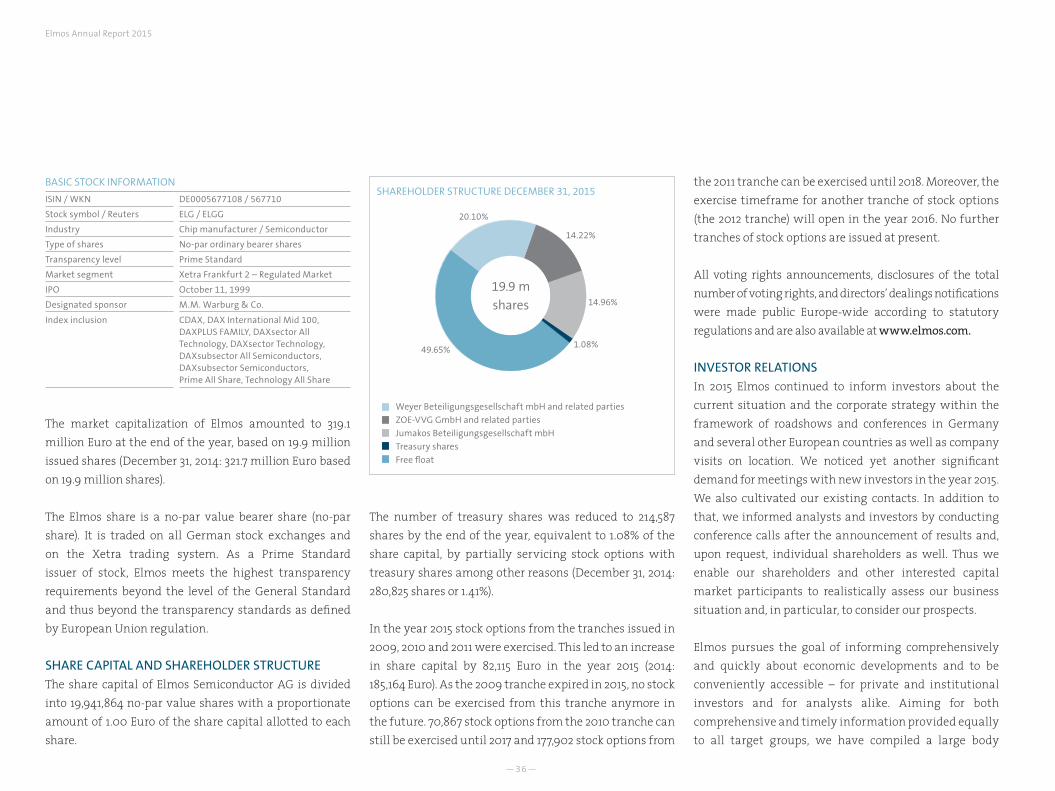
SHAREHOLDER STRUCTURE DECEMBER 31, 2015
20.10%
49.65%
14.96%
14.22%
1.08%
Weyer Beteiligungsgesellschaft mbH and related parties
ZOE-VVG GmbH and related parties
Jumakos Beteiligungsgesellschaft mbH
Treasury shares
Free float
The market capitalization of Elmos amounted to 319.1 million Euro at the end of the year, based on 19.9 million issued shares (December 31, 2014: 321.7 million Euro based on 19.9 million shares).
The Elmos share is a no-par value bearer share (no-par share). It is traded on all German stock exchanges and on the Xetra trading system. As a Prime Standard issuer of stock, Elmos meets the highest transparency requirements beyond the level of the General Standard and thus beyond the transparency standards as defined by European Union regulation.
SHARE CAPITAL AND SHAREHOLDER STRUCTUREThe share capital of Elmos Semiconductor AG is divided into 19,941,864 no-par value shares with a proportionate amount of 1.00 Euro of the share capital allotted to each share.
19.9 mshares
—37—
of corporate information on our website. Interested investors may inform themselves in detail about the Company and its products and technologies at www.elmos.com on the Internet. Apart from information about corporate governance, the “Investor & Press relations” section also offers financial reports, a financial calendar, the Company’s Articles of Incorporation, information on the Annual General Meeting, press releases, directors’ dealings, and the recordings of our conference calls on the occasion of quarterly and annual financial statements. Elmos is also happy to send out information such as annual or quarterly financial reports by mail or e-mail. We maintain an e-mail distribution list to inform interested investors routinely about corporate news, and we are also active in social networks (Twitter, YouTube, Xing, and SlideShare).
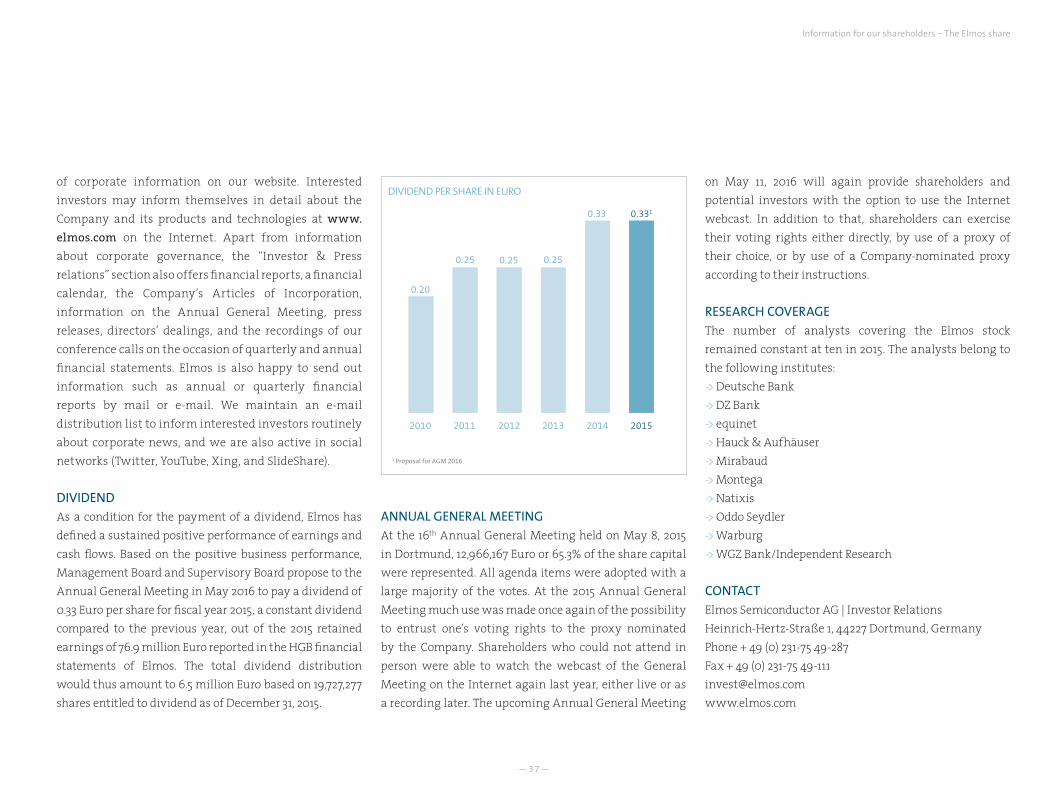
DIVIDENDAs a condition for the payment of a dividend, Elmos has defined a sustained positive performance of earnings and cash flows. Based on the positive business performance, Management Board and Supervisory Board propose to the Annual General Meeting in May 2016 to pay a dividend of 0.33 Euro per share for fiscal year 2015, a constant dividend compared to the previous year, out of the 2015 retained earnings of 76.9 million Euro reported in the HGB financial statements of Elmos. The total dividend distribution would thus amount to 6.5 million Euro based on 19,727,277 shares entitled to dividend as of December 31, 2015.
ANNUAL GENERAL MEETING At the 16th Annual General Meeting held on May 8, 2015 in Dortmund, 12,966,167 Euro or 65.3% of the share capital were represented. All agenda items were adopted with a large majority of the votes. At the 2015 Annual General Meeting much use was made once again of the possibility to entrust one’s voting rights to the proxy nominated by the Company. Shareholders who could not attend in person were able to watch the webcast of the General Meeting on the Internet again last year, either live or as a recording later. The upcoming Annual General Meeting
DIVIDEND PER SHARE IN EURO
1 Proposal for AGM 2016
on May 11, 2016 will again provide shareholders and potential investors with the option to use the Internet webcast. In addition to that, shareholders can exercise their voting rights either directly, by use of a proxy of their choice, or by use of a Company-nominated proxy according to their instructions.
RESEARCH COVERAGE The number of analysts covering the Elmos stock remained constant at ten in 2015. The analysts belong to the following institutes:-> Deutsche Bank -> DZ Bank -> equinet -> Hauck & Aufhäuser -> Mirabaud -> Montega -> Natixis -> Oddo Seydler -> Warburg -> WGZ Bank/Independent Research
CONTACTElmos Semiconductor AG | Investor RelationsHeinrich-Hertz-Straße 1, 44227 Dortmund, GermanyPhone + 49 (0) 231-75 49-287Fax + 49 (0) 231-75 [email protected]
2010
0.33
0.250.250.25
0.20
2011 2012 2013 2014
0.331
2015
Information for our shareholders – The Elmos share
—38—
Elmos Annual Report 2015
Significant events 2015
January – No. 1 in gesture controlThe Consumer Electronic Show (CES) in Las Vegas (U.S.A.) presented the trends set by the electronics industry at the beginning of the year. Major carmakers displayed, among other things, different kinds of gesture control in vehicles. With several million supplied components, Elmos is global market leader in this field. The Elmos chip, making first functions possible – namely approaching and swiping – is currently being used in series production of cars of the major auto manufacturers.
February – Successful start at trade shows Right at the beginning of the year, Elmos was present at two of the globally regarded trade shows: Electronica China in Shanghai and Embedded World in Nuremberg were the industry’s stomping grounds. Among other solutions, Elmos introduced LED voltage supply com-ponents, sensor readout ICs, and pressure sensors.
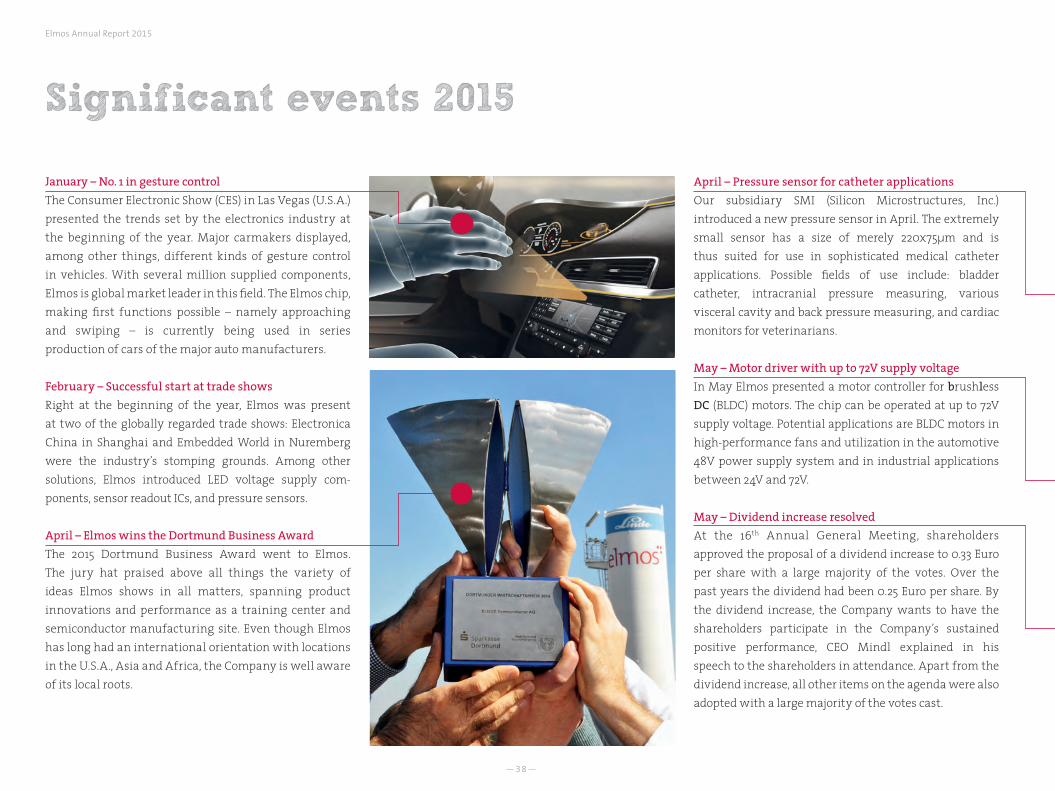
April – Elmos wins the Dortmund Business AwardThe 2015 Dortmund Business Award went to Elmos. The jury hat praised above all things the variety of ideas Elmos shows in all matters, spanning product innovations and performance as a training center and semiconductor manufacturing site. Even though Elmos has long had an international orientation with locations in the U.S.A., Asia and Africa, the Company is well aware of its local roots.
April – Pressure sensor for catheter applicationsOur subsidiary SMI (Silicon Microstructures, Inc.) introduced a new pressure sensor in April. The extremely small sensor has a size of merely 220x75µm and is thus suited for use in sophisticated medical catheter applications. Possible fields of use include: bladder catheter, intracranial pressure measuring, various visceral cavity and back pressure measuring, and cardiac monitors for veterinarians.
May – Motor driver with up to 72V supply voltageIn May Elmos presented a motor controller for brushless DC (BLDC) motors. The chip can be operated at up to 72V supply voltage. Potential applications are BLDC motors in high-performance fans and utilization in the automotive 48V power supply system and in industrial applications between 24V and 72V.
May – Dividend increase resolved At the 16th Annual General Meeting, shareholders approved the proposal of a dividend increase to 0.33 Euro per share with a large majority of the votes. Over the past years the dividend had been 0.25 Euro per share. By the dividend increase, the Company wants to have the shareholders participate in the Company’s sustained positive performance, CEO Mindl explained in his speech to the shareholders in attendance. Apart from the dividend increase, all other items on the agenda were also adopted with a large majority of the votes cast.
—39—
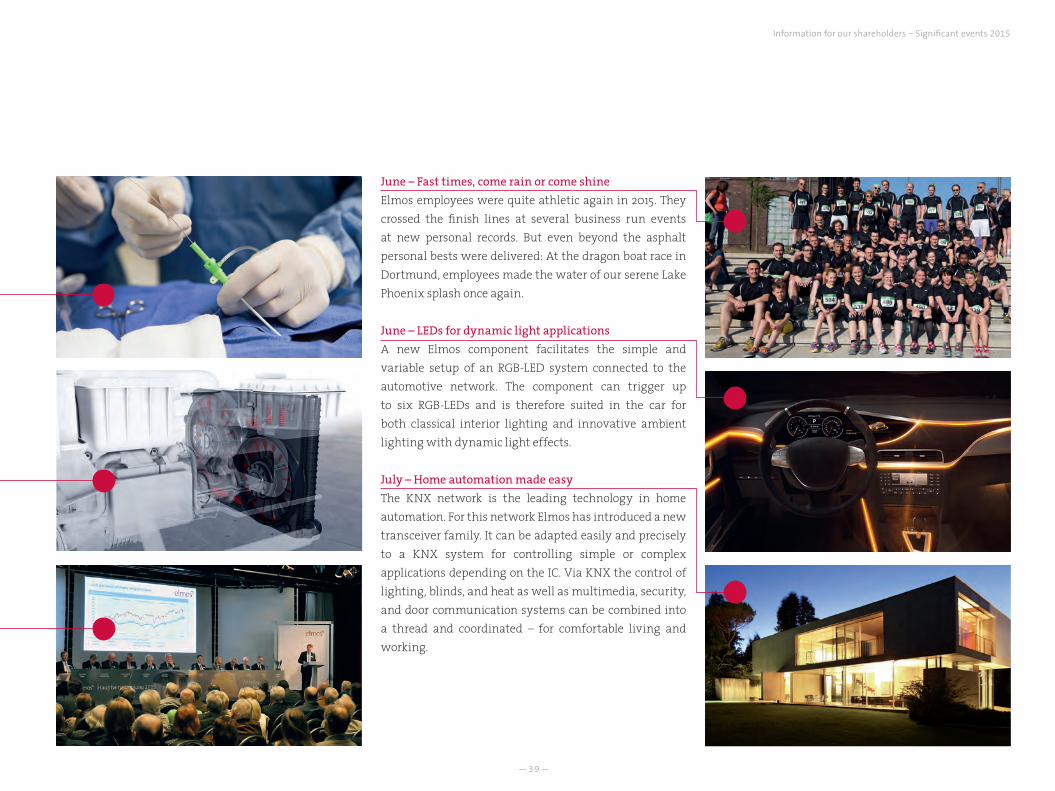
June – Fast times, come rain or come shineElmos employees were quite athletic again in 2015. They crossed the finish lines at several business run events at new personal records. But even beyond the asphalt personal bests were delivered: At the dragon boat race in Dortmund, employees made the water of our serene Lake Phoenix splash once again.
June – LEDs for dynamic light applicationsA new Elmos component facilitates the simple and variable setup of an RGB-LED system connected to the automotive network. The component can trigger up to six RGB-LEDs and is therefore suited in the car for both classical interior lighting and innovative ambient lighting with dynamic light effects.
July – Home automation made easyThe KNX network is the leading technology in home automation. For this network Elmos has introduced a new transceiver family. It can be adapted easily and precisely to a KNX system for controlling simple or complex applications depending on the IC. Via KNX the control of lighting, blinds, and heat as well as multimedia, security, and door communication systems can be combined into a thread and coordinated – for comfortable living and working.
Information for our shareholders – Significant events 2015
—40—
Elmos Annual Report 2015
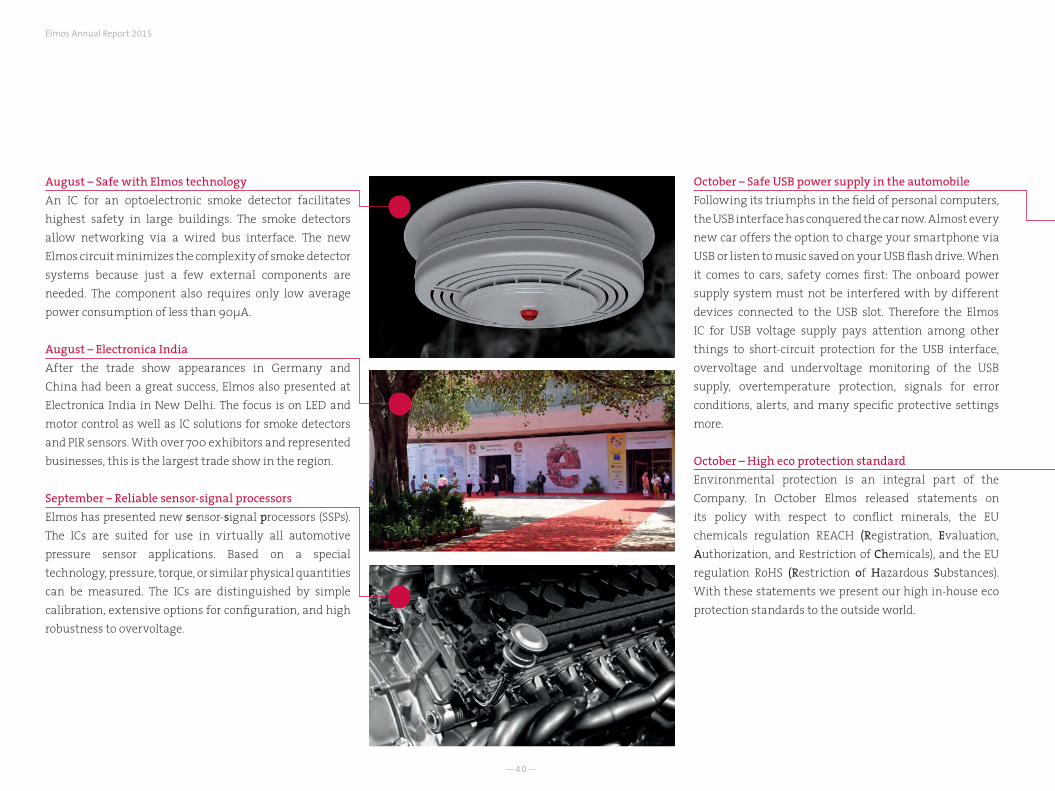
October – Safe USB power supply in the automobile Following its triumphs in the field of personal computers, the USB interface has conquered the car now. Almost every new car offers the option to charge your smartphone via USB or listen to music saved on your USB flash drive. When it comes to cars, safety comes first: The onboard power supply system must not be interfered with by different devices connected to the USB slot. Therefore the Elmos IC for USB voltage supply pays attention among other things to short-circuit protection for the USB interface, overvoltage and undervoltage monitoring of the USB supply, overtemperature protection, signals for error conditions, alerts, and many specific protective settings more.
October – High eco protection standardEnvironmental protection is an integral part of the Company. In October Elmos released statements on its policy with respect to conflict minerals, the EU chemicals regulation REACH (Registration, Evaluation, Authorization, and Restriction of Chemicals), and the EU regulation RoHS (Restriction of Hazardous Substances). With these statements we present our high in-house eco protection standards to the outside world.
August – Safe with Elmos technologyAn IC for an optoelectronic smoke detector facilitates highest safety in large buildings. The smoke detectors allow networking via a wired bus interface. The new Elmos circuit minimizes the complexity of smoke detector systems because just a few external components are needed. The component also requires only low average power consumption of less than 90µA.
August – Electronica IndiaAfter the trade show appearances in Germany and China had been a great success, Elmos also presented at Electronica India in New Delhi. The focus is on LED and motor control as well as IC solutions for smoke detectors and PIR sensors. With over 700 exhibitors and represented businesses, this is the largest trade show in the region.
September – Reliable sensor-signal processorsElmos has presented new sensor-signal processors (SSPs). The ICs are suited for use in virtually all automotive pressure sensor applications. Based on a special technology, pressure, torque, or similar physical quantities can be measured. The ICs are distinguished by simple calibration, extensive options for configuration, and high robustness to overvoltage.
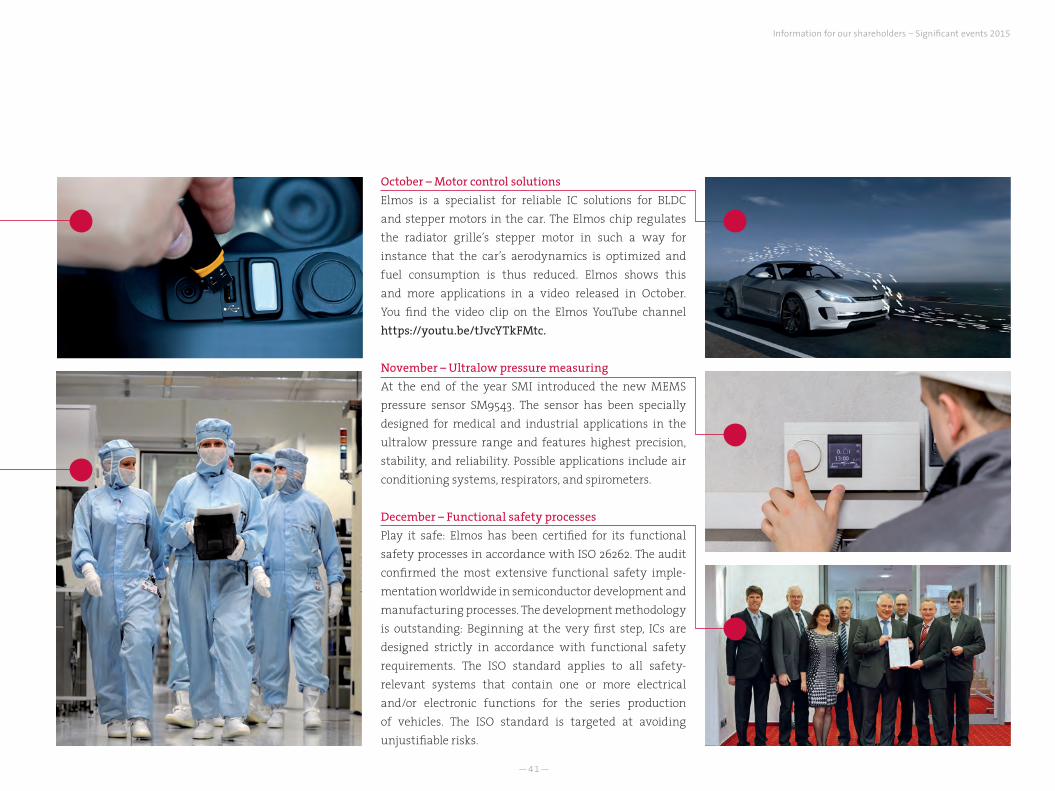
—41—
October – Motor control solutionsElmos is a specialist for reliable IC solutions for BLDC and stepper motors in the car. The Elmos chip regulates the radiator grille’s stepper motor in such a way for instance that the car’s aerodynamics is optimized and fuel consumption is thus reduced. Elmos shows this and more applications in a video released in October. You find the video clip on the Elmos YouTube channel https://youtu.be/tJvcYTkFMtc. November – Ultralow pressure measuringAt the end of the year SMI introduced the new MEMS pressure sensor SM9543. The sensor has been specially designed for medical and industrial applications in the ultralow pressure range and features highest precision, stability, and reliability. Possible applications include air conditioning systems, respirators, and spirometers.
December – Functional safety processesPlay it safe: Elmos has been certified for its functional safety processes in accordance with ISO 26262. The audit confirmed the most extensive functional safety imple-mentation worldwide in semiconductor development and manufacturing processes. The development methodology is outstanding: Beginning at the very first step, ICs are designed strictly in accordance with functional safety requirements. The ISO standard applies to all safety-relevant systems that contain one or more electrical and/or electronic functions for the series production of vehicles. The ISO standard is targeted at avoiding unjustifiable risks.
Information for our shareholders – Significant events 2015
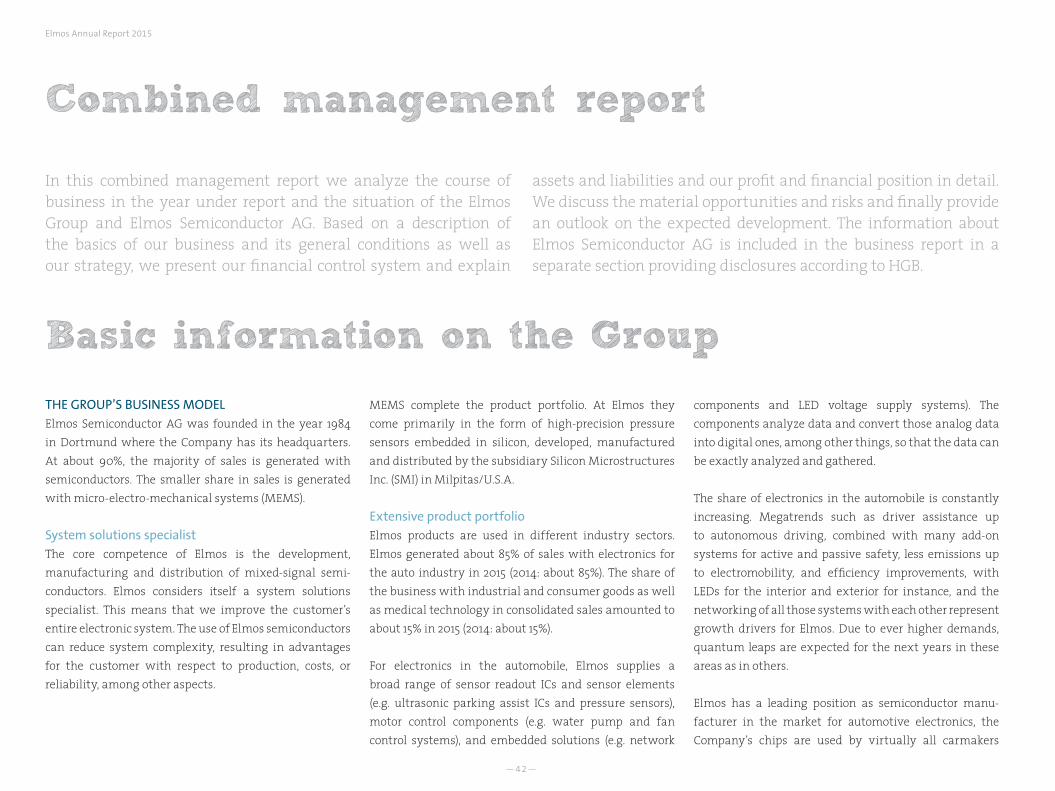
—42—
Elmos Annual Report 2015
In this combined management report we analyze the course of business in the year under report and the situation of the Elmos Group and Elmos Semiconductor AG. Based on a description of the basics of our business and its general conditions as well as our strategy, we present our financial control system and explain
assets and liabilities and our profit and financial position in detail. We discuss the material opportunities and risks and finally provide an outlook on the expected development. The information about Elmos Semiconductor AG is included in the business report in a separate section providing disclosures according to HGB.
THE GROUP’S BUSINESS MODEL Elmos Semiconductor AG was founded in the year 1984 in Dortmund where the Company has its headquarters. At about 90%, the majority of sales is generated with semiconductors. The smaller share in sales is generated with micro-electro-mechanical systems (MEMS).
System solutions specialistThe core competence of Elmos is the development, manufacturing and distribution of mixed-signal semi-conductors. Elmos considers itself a system solutions specialist. This means that we improve the customer’s entire electronic system. The use of Elmos semiconductors can reduce system complexity, resulting in advantages for the customer with respect to production, costs, or reliability, among other aspects.
Combined management report
Basic information on the Group
MEMS complete the product portfolio. At Elmos they come primarily in the form of high-precision pressure sensors embedded in silicon, developed, manufactured and distributed by the subsidiary Silicon Microstructures Inc. (SMI) in Milpitas/U.S.A.
Extensive product portfolio Elmos products are used in different industry sectors. Elmos generated about 85% of sales with electronics for the auto industry in 2015 (2014: about 85%). The share of the business with industrial and consumer goods as well as medical technology in consolidated sales amounted to about 15% in 2015 (2014: about 15%).
For electronics in the automobile, Elmos supplies a broad range of sensor readout ICs and sensor elements (e.g. ultrasonic parking assist ICs and pressure sensors), motor control components (e.g. water pump and fan control systems), and embedded solutions (e.g. network
components and LED voltage supply systems). The components analyze data and convert those analog data into digital ones, among other things, so that the data can be exactly analyzed and gathered.
The share of electronics in the automobile is constantly increasing. Megatrends such as driver assistance up to autonomous driving, combined with many add-on systems for active and passive safety, less emissions up to electromobility, and efficiency improvements, with LEDs for the interior and exterior for instance, and the networking of all those systems with each other represent growth drivers for Elmos. Due to ever higher demands, quantum leaps are expected for the next years in these areas as in others.
Elmos has a leading position as semiconductor manu-facturer in the market for automotive electronics, the Company’s chips are used by virtually all carmakers
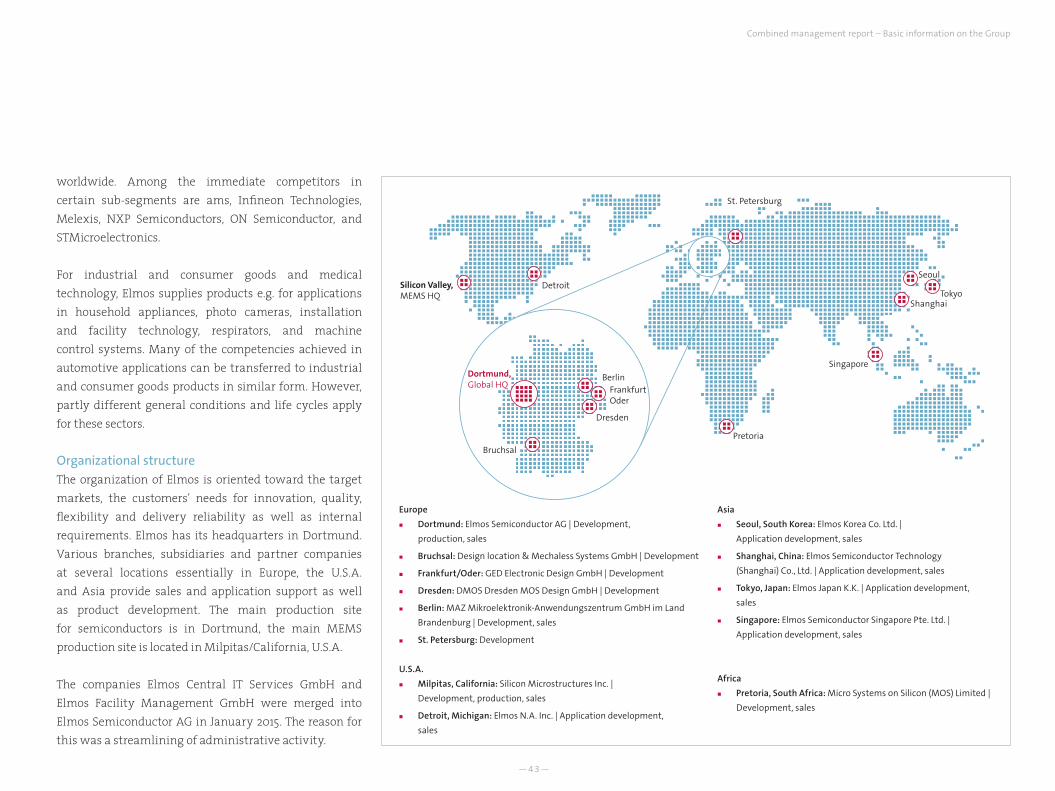
—43—
worldwide. Among the immediate competitors in certain sub-segments are ams, Infineon Technologies, Melexis, NXP Semiconductors, ON Semiconductor, and STMicroelectronics.
For industrial and consumer goods and medical technology, Elmos supplies products e.g. for applications in household appliances, photo cameras, installation and facility technology, respirators, and machine control systems. Many of the competencies achieved in automotive applications can be transferred to industrial and consumer goods products in similar form. However, partly different general conditions and life cycles apply for these sectors.
Organizational structureThe organization of Elmos is oriented toward the target markets, the customers’ needs for innovation, quality, flexibility and delivery reliability as well as internal requirements. Elmos has its headquarters in Dortmund. Various branches, subsidiaries and partner companies at several locations essentially in Europe, the U.S.A. and Asia provide sales and application support as well as product development. The main production site for semiconductors is in Dortmund, the main MEMS production site is located in Milpitas/California, U.S.A.
The companies Elmos Central IT Services GmbH and Elmos Facility Management GmbH were merged into Elmos Semiconductor AG in January 2015. The reason for this was a streamlining of administrative activity.
Pretoria
DetroitSilicon Valley,MEMS HQ
St. Petersburg
Singapore
ShanghaiTokyo
Seoul
Bruchsal
Dortmund,Global HQ
BerlinFrankfurtOder
Dresden
Europe
Dortmund: Elmos Semiconductor AG | Development,
production, sales
Bruchsal: Design location & Mechaless Systems GmbH | Development
Frankfurt/Oder: GED Electronic Design GmbH | Development
Dresden: DMOS Dresden MOS Design GmbH | Development
Berlin: MAZ Mikroelektronik-Anwendungszentrum GmbH im Land
Brandenburg | Development, sales
St. Petersburg: Development
U.S.A.
Milpitas, California: Silicon Microstructures Inc. |
Development, production, sales
Detroit, Michigan: Elmos N.A. Inc. | Application development,
sales
Asia
Seoul, South Korea: Elmos Korea Co. Ltd. |
Application development, sales
Shanghai, China: Elmos Semiconductor Technology
(Shanghai) Co., Ltd. | Application development, sales
Tokyo, Japan: Elmos Japan K.K. | Application development,
sales
Singapore: Elmos Semiconductor Singapore Pte. Ltd. |
Application development, sales
Africa
Pretoria, South Africa: Micro Systems on Silicon (MOS) Limited |
Development, sales
Combined management report – Basic information on the Group
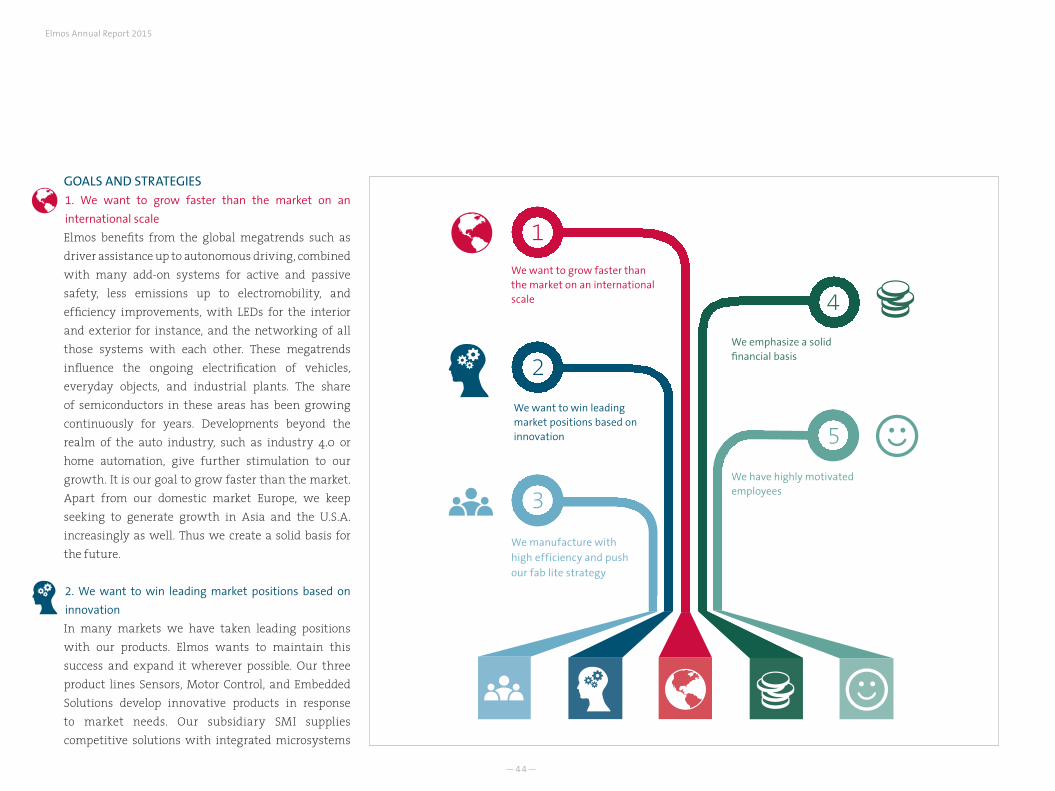
—44—
Elmos Annual Report 2015
1
2
3
4
5
We want to grow faster than the market on an international scale
We want to win leading market positions based on innovation
We manufacture with high efficiency and push our fab lite strategy
We emphasize a solid financial basis
We have highly motivated employees
GOALS AND STRATEGIES 1. We want to grow faster than the market on an
international scale
Elmos benefits from the global megatrends such as driver assistance up to autonomous driving, combined with many add-on systems for active and passive safety, less emissions up to electromobility, and efficiency improvements, with LEDs for the interior and exterior for instance, and the networking of all those systems with each other. These megatrends influence the ongoing electrification of vehicles, everyday objects, and industrial plants. The share of semiconductors in these areas has been growing continuously for years. Developments beyond the realm of the auto industry, such as industry 4.0 or home automation, give further stimulation to our growth. It is our goal to grow faster than the market. Apart from our domestic market Europe, we keep seeking to generate growth in Asia and the U.S.A. increasingly as well. Thus we create a solid basis for the future.
2. We want to win leading market positions based on
innovation
In many markets we have taken leading positions with our products. Elmos wants to maintain this success and expand it wherever possible. Our three product lines Sensors, Motor Control, and Embedded Solutions develop innovative products in response to market needs. Our subsidiary SMI supplies competitive solutions with integrated microsystems
—45—
or microchips based on MEMS. With these innovative solutions – be it specially tailored customer solutions or application specific standard components – Elmos wants to be successful also by close cooperation with the customers. Roughly 35% of sales are currently achieved with application specific components (ASSPs) already (2014: about 25%). A majority of the products in development targets the growth field of ASSPs. We focus on our strengths and will keep convincing customers in application fields with specialized and in part protected solutions. The development of new products is based on our significant research and development efforts.
3. We manufacture with high efficiency and push our
fab lite strategy
In our in-house production facilities we work daily at increasing efficiency by optimization in all areas and steps of the manufacturing process. In our in-house manufacturing we benefit from our specialized mixed-signal portfolio and our know-how. Apart from our own manufacture, we cooperate for a part of our value added chain with foundries, depending on requirements and volumes, and thus push our fab lite strategy. With this network we can respond more flexibly and offer an even broader portfolio to the customers. We will continue and expand the cooperation with partners over the next years. In addition to the technological advantages, we thus avoid costly investments in our in-house
manufacturing for potentially short-lived volume peaks.
4. We emphasize a solid financial basis
Elmos operates from a solid financial basis. We want to protect this financial strength and flexibility Elmos has with continued profitable growth. The goal is to achieve a sustained positive (adjusted) free cash flow with solid business results and reasonable capital expenditures. The management‘s focus is also on the continued participation of the shareholders in the Company’s success by the distribution of an adequate dividend.
5. We have highly motivated employees
Highly motivated employees are of particular importance to the successful development of our business. Elmos relies on a corporate culture geared to performance and development, combined with strong social responsibility. We promote personal and cultural diversity in the Company. We also place special emphasis on an appealing work environment, flexible working conditions, and good opportunities for further training. We offer attractive prospects and want to keep winning talented young professionals for our Company’s successful and sustained develop-ment. We expect impeccable behavior from our employees in interaction with the Company, their colleagues, and third parties.
CONTROL SYSTEMControl factors The Elmos control system is based on four essential elements:
-> Sales-> EBIT-> Capital expenditures-> Free cash flow (adjusted)
Each indicator is considered and analyzed both individually and in connection to the other ones. As a growth-oriented company, Elmos attaches great importance to the profitable growth of sales. Sales are positively affected by the following factors among others: success with new customers and new products, expansion to new regions, and the consistent advancement of marketable products in respect of their competitiveness. Semiconductor manufacturing comes at a high fixed cost burden. Therefore sales as an essential lever for determining capacity utilization become especially important. All activities toward sales increase are also judged by their potential to increase earnings in the long term.
Combined management report – Basic information on the Group
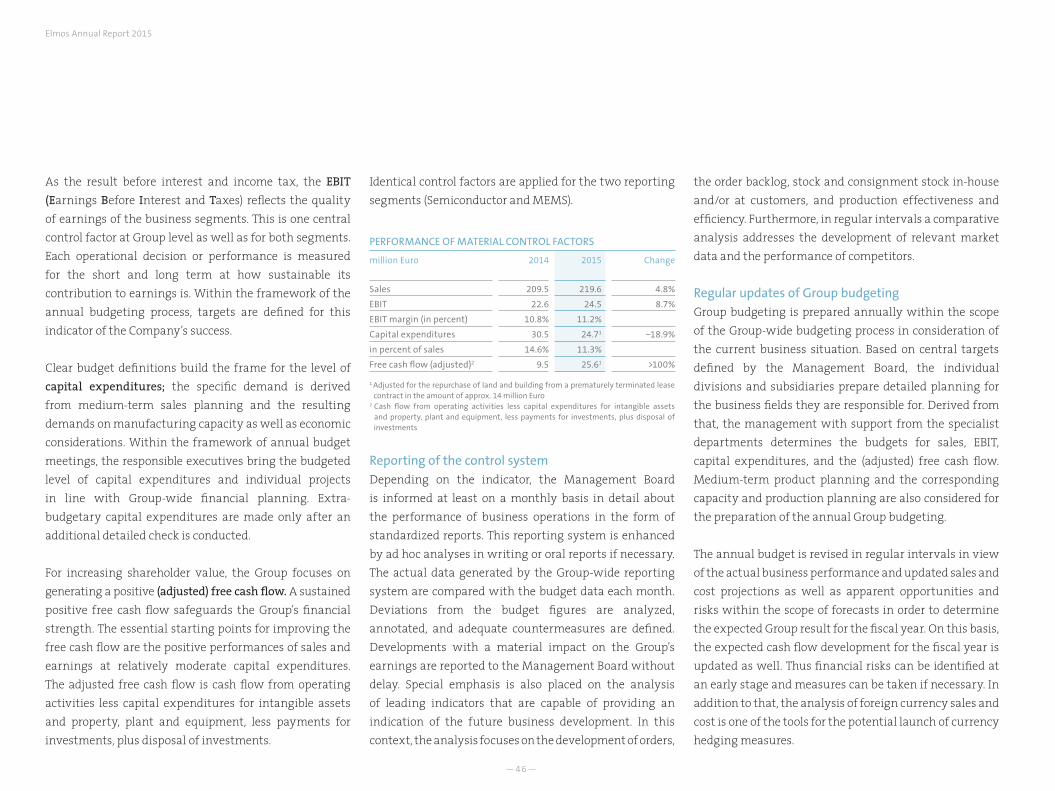
—46—
Elmos Annual Report 2015
As the result before interest and income tax, the EBIT (Earnings Before Interest and Taxes) reflects the quality of earnings of the business segments. This is one central control factor at Group level as well as for both segments. Each operational decision or performance is measured for the short and long term at how sustainable its contribution to earnings is. Within the framework of the annual budgeting process, targets are defined for this indicator of the Company’s success.
Clear budget definitions build the frame for the level of capital expenditures; the specific demand is derived from medium-term sales planning and the resulting demands on manufacturing capacity as well as economic considerations. Within the framework of annual budget meetings, the responsible executives bring the budgeted level of capital expenditures and individual projects in line with Group-wide financial planning. Extra-budgetary capital expenditures are made only after an additional detailed check is conducted.
For increasing shareholder value, the Group focuses on generating a positive (adjusted) free cash flow. A sustained positive free cash flow safeguards the Group’s financial strength. The essential starting points for improving the free cash flow are the positive performances of sales and earnings at relatively moderate capital expenditures. The adjusted free cash flow is cash flow from operating activities less capital expenditures for intangible assets and property, plant and equipment, less payments for investments, plus disposal of investments.
Identical control factors are applied for the two reporting segments (Semiconductor and MEMS).
PERFORMANCE OF MATERIAL CONTROL FACTORS
million Euro 2014 2015 Change
Sales 209.5 219.6 4.8%
EBIT 22.6 24.5 8.7%
EBIT margin (in percent) 10.8% 11.2%
Capital expenditures 30.5 24.71 −18.9%
in percent of sales 14.6% 11.3%
Free cash flow (adjusted)2 9.5 25.61 >100%
1 Adjusted for the repurchase of land and building from a prematurely terminated lease contract in the amount of approx. 14 million Euro2 Cash flow from operating activities less capital expenditures for intangible assets and property, plant and equipment, less payments for investments, plus disposal of investments
Reporting of the control systemDepending on the indicator, the Management Board is informed at least on a monthly basis in detail about the performance of business operations in the form of standardized reports. This reporting system is enhanced by ad hoc analyses in writing or oral reports if necessary. The actual data generated by the Group-wide reporting system are compared with the budget data each month. Deviations from the budget figures are analyzed, annotated, and adequate countermeasures are defined. Developments with a material impact on the Group’s earnings are reported to the Management Board without delay. Special emphasis is also placed on the analysis of leading indicators that are capable of providing an indication of the future business development. In this context, the analysis focuses on the development of orders,
the order backlog, stock and consignment stock in-house and/or at customers, and production effectiveness and efficiency. Furthermore, in regular intervals a comparative analysis addresses the development of relevant market data and the performance of competitors.
Regular updates of Group budgetingGroup budgeting is prepared annually within the scope of the Group-wide budgeting process in consideration of the current business situation. Based on central targets defined by the Management Board, the individual divisions and subsidiaries prepare detailed planning for the business fields they are responsible for. Derived from that, the management with support from the specialist departments determines the budgets for sales, EBIT, capital expenditures, and the (adjusted) free cash flow. Medium-term product planning and the corresponding capacity and production planning are also considered for the preparation of the annual Group budgeting.
The annual budget is revised in regular intervals in view of the actual business performance and updated sales and cost projections as well as apparent opportunities and risks within the scope of forecasts in order to determine the expected Group result for the fiscal year. On this basis, the expected cash flow development for the fiscal year is updated as well. Thus financial risks can be identified at an early stage and measures can be taken if necessary. In addition to that, the analysis of foreign currency sales and cost is one of the tools for the potential launch of currency hedging measures.
—47—
RESEARCH AND DEVELOPMENT The development activity of Elmos centers on the market-oriented expansion of the product portfolio along the three product lines Sensors, Motor Control, and Embedded Solutions. The majority of the product development cost Elmos incurs is pre-financed by the Company and must be amortized through the current series production business. This applies in particular to the development of application specific standard products (ASSPs), a mainstay of development for a few years now and representing an ever larger share in total sales of Elmos.
Product developments are strictly aligned with market needs. Elmos prioritizes different product ideas and takes into account volumes, information on the competition, and technical feasibility, among other factors. Only those projects are realized that meet the Company’s targets for market expectations, margin potential, and strategic orientation. The outcome of these product developments is a number of new semiconductors and sensors. Among the innovations Elmos presented in 2015 are the following:
-> Elmos introduced a component for optoelectronic smoke detectors with wired bus interface with the E520.30. The IC facilitates programmable smoke detector platforms.
-> SMI presented the new MEMS pressure sensor SM9543. The sensor features the highest grade of precision and reliability worldwide. Possible applications include air conditioning systems, respirators, and spirometers (lung capacity measuring devices).
-> Elmos showed its innovative motor control com-ponents in an application video. The video clip stars Elmos components in air flap control systems, engine radiator fans, water pumps, and headlight adjustment systems. The idea behind each application is explained as is the chip itself with its technical characteristics. The video is available on the Elmos YouTube channel (www.youtube.com/user/ELMOS1984).
-> The Elmos IC E521.31 facilitates the simple and variable setup of an LED system. The component is especially suited for use in cost efficient dynamic light elements in vehicles.
-> Elmos has expanded its KNX/EIB transceiver family. The customer can choose now from three components with different specifications for rigging up his optimal KNX system.
In 2015 research and development expenses amounted to 37.1 million Euro or 16.9% of sales (2014: 36.1 million Euro or 17.2% of sales).
PRODUCTIONElmos operates semiconductor manufacturing sites in Germany using various CMOS technologies. The Dortmund manufacturing site was converted successively from 6-inch to 8-inch wafers over the past years. At the end of the first quarter of 2015 the final 6-inch wafer charge was completed. Remaining machines have since then been either converted to the larger 8-inch wafer diameter or otherwise utilized depending on demand and feasibility.
In addition to that, MEMS pressure sensors are manu-factured predominantly in 6-inch production in-house at subsidiary SMI in Milpitas/California, U.S.A.
In-house capacity is completed by cooperation agreements with contract manufacturers (foundries). These foundries make additional capacity available, thus enabling Elmos to respond flexibly even to heavily fluctuating demand, both with respect to delivery capability and the capital expenditures required. In 2015 Elmos continued to obtain processed wafers from foundries with a global reputation. The percentage share of acquired wafers went down to roughly 12% in 2015 compared to the previous year (2014: roughly 15%) despite increased sales as larger in-house capacity was available due to the finalized conversion from 6-inch to 8-inch wafers. That share will probably increase in the medium run in line with the fab lite strategy.
Combined management report – Basic information on the Group
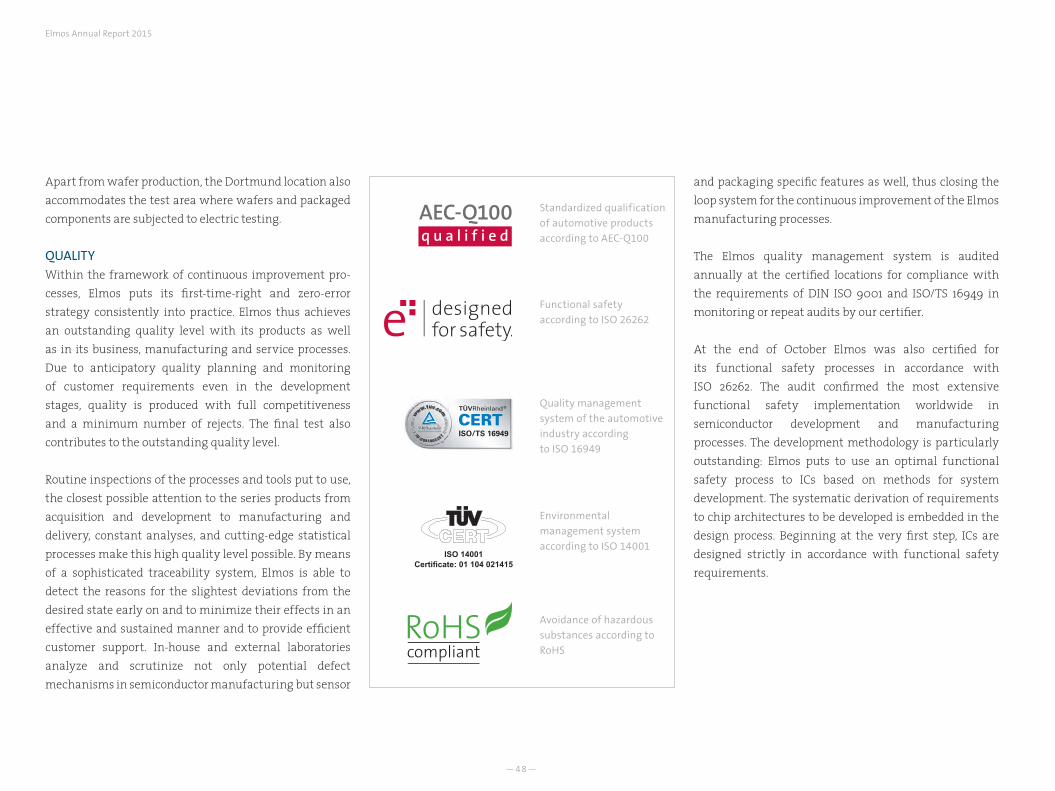
—48—
Elmos Annual Report 2015
Apart from wafer production, the Dortmund location also accommodates the test area where wafers and packaged components are subjected to electric testing.
QUALITYWithin the framework of continuous improvement pro-cesses, Elmos puts its first-time-right and zero-error strategy consistently into practice. Elmos thus achieves an outstanding quality level with its products as well as in its business, manufacturing and service processes. Due to anticipatory quality planning and monitoring of customer requirements even in the development stages, quality is produced with full competitiveness and a minimum number of rejects. The final test also contributes to the outstanding quality level.
Routine inspections of the processes and tools put to use, the closest possible attention to the series products from acquisition and development to manufacturing and delivery, constant analyses, and cutting-edge statistical processes make this high quality level possible. By means of a sophisticated traceability system, Elmos is able to detect the reasons for the slightest deviations from the desired state early on and to minimize their effects in an effective and sustained manner and to provide efficient customer support. In-house and external laboratories analyze and scrutinize not only potential defect mechanisms in semiconductor manufacturing but sensor
and packaging specific features as well, thus closing the loop system for the continuous improvement of the Elmos manufacturing processes.
The Elmos quality management system is audited annually at the certified locations for compliance with the requirements of DIN ISO 9001 and ISO/TS 16949 in monitoring or repeat audits by our certifier.
At the end of October Elmos was also certified for its functional safety processes in accordance with ISO 26262. The audit confirmed the most extensive functional safety implementation worldwide in semiconductor development and manufacturing processes. The development methodology is particularly outstanding: Elmos puts to use an optimal functional safety process to ICs based on methods for system development. The systematic derivation of requirements to chip architectures to be developed is embedded in the design process. Beginning at the very first step, ICs are designed strictly in accordance with functional safety requirements.
AEC-Q100q u a l i f i e d
Standardized qualification of automotive products according to AEC-Q100
Functional safety according to ISO 26262
Quality management system of the automotive industry according to ISO 16949
Environmental management system according to ISO 14001
Avoidance of hazardous substances according to RoHS

—49—
Fab lite strategy
In house
production plus
cooperation with
service providers
Elmos Losungen
machen den
Alltag einfacher:
besser und
sicherer.
Elmos Losungen
machen den
Alltag einfacher:
besser und
sicherer.
Combined management report – Basic information on the Group
—50—
Elmos Annual Report 2015
MACROECONOMIC AND INDUSTRY SPECIFIC FRAMEWORK Automotive industryIn the year 2015, new car registrations in the globally most important regions (China, U.S.A., and Western Europe) scored good growth rates even though increases were lower compared to the past few years for instance in China. Other regions such as Japan, Russia, and Brazil reported partly dramatically declining numbers, according to the German Association of the Automotive Industry (VDA; German: Verband der Automobilindustrie).
In Western Europe, new registrations reached the highest level in five years with a gain of 9.3% to 13.7 million car registrations. Even though the trend is positive, the volume still falls significantly below the 2007 record number of 14.4 million new automobiles. The most relevant European markets registered most different growth rates in 2015: Spain +20.9%, Italy +15.8%, France +6.8%, Great Britain +6.3%, and Germany +5.6%, the European association ACEA (French: Association des Constructeurs Européens d'Automobiles) has announced.
The U.S. market showed an ambivalent picture in 2015: While light trucks gained 13% to 9.9 million units, the passenger car segment went down 2% to 7.5 million new registrations. The total market for light vehicles (light trucks and passenger cars) still set a new record of 17.4 million vehicles, equivalent to a 6% gain.
Passenger car sales in China gained 9% in the full year 2015 to some 20 million new vehicles, according to the VDA. The tax relief for passenger cars with small cubic capacity engines in force since October 2015 has had a positive effect. However, growth has slowed down considerably compared to 2014. In 2014 the increase in new vehicles was close to 13%.
In Japan the market volume was reduced by 10% to 4.2 million new cars. In Brazil (–26% to 2.5 million new cars) and Russia (–36% to 1.6 million new cars), the respective decline was even more dramatic.
DEVELOPMENT OF NEW CAR REGISTRATIONS
Change 2014/15
Western Europe1 +9%
Germany2 +6%
China2 +9%
U.S.A.2 +6%
DEVELOPMENT OF SEMICONDUCTOR MARKET
Change 2014/15
General semiconductor market (worldwide)3 –1.9%
Automotive semiconductor market (worldwide)4 0%
1 Source: ACEA2 Source: VDA3 Source: Gartner4 Source: IHS
General semiconductor marketThe global semiconductor market lost 1.9% to 333.7 billion U.S. dollar in 2015, according to the market research institute Gartner, citing as reasons for this decrease a weaker demand for electronic devices, the strong U.S. dollar, and increased inventories. While optoelectronic components, non-optical sensors, analog semiconductors, and ASICs recorded growth, sales with all other components, e.g. memory or logic semiconductors, went down.
Automotive semiconductor marketThe global market for automotive semiconductors was subject to highly intense competition in the year 2015 and could not escape the negative trend in the general semiconductor market. According to data supplied by market researcher IHS (Information Handling Services), the sector stagnated. Sales with semiconductors for cars amounted to 29 billion U.S. dollar in the year 2014; expectations for 2015 come to the same amount, according to an IHS forecast of December 2015.
Business report
—51—
TARGET ACHIEVEMENT: PRESENTATION OF THE BUSINESS PERFORMANCE COMPARED TO THE FORECAST FOR 2015
TARGET ACHIEVEMENT 2015
ForecastFebruary 2015
Forecast May 2015
ForecastOctober 2015
Actuals
Sales growth
2015 (vs. 2014)
Mid single-digit
percentage range
Sales growth of
5% - 9%
Sales growth
of about 4% 4.8% EBIT margin
(in % of sales)
Slightly better than
2014 (10.8%)
Slightly better than
2014 (10.8%)
At prior-year level
(10.8%) 11.2% Capital expenditures1
(in % of sales)
Less than
15% of sales
Less than
15% of sales
Less than
15% of sales 11.3% Adjusted
free cash flow1, 2 Positive Positive Positive 25.6 million Euro Assumed
exchange rate 1.20 USD/EUR 1.10 USD/EUR 1.10 USD/EUR 1.11 USD/EUR3
1 Not including one-off effect from repurchase of land and building from prematurely terminated lease contracts in the amount of approx. 14 million Euro 2 Cash flow from operating activities less capital expenditures for intangible assets and property, plant and equipment, less payments for investments, plus disposal of investments 3 Average exchange rate 2015
BUSINESS PERFORMANCE AND ECONOMIC SITUATIONFinancial statements according to IFRSThe consolidated financial statements of Elmos Semiconductor AG for fiscal year 2015 have been prepared in accordance with the International Financial Reporting Standards (IFRS) as applicable in the EU.
CONDENSED INCOME STATEMENT
in million Euro or % unless indicated otherwise
2014 2015 Change
Sales 209.5 219.6 4.8%
Gross profit 91.4 91.6 0.2%
in % 43.6% 41.7%
Research and
development expenses 36.1 37.1 2.7%
in % 17.2% 16.9%
Distribution expenses 19.0 19.0 0.1%
in % 9.1% 8.7%
Administrative expenses 16.9 17.4 2.9%
in % 8.1% 7.9%
Operating income before other
operating expenses/income 19.4 18.1 –6.8%
in % 9.3% 8.2%
EBIT 22.6 24.5 8.7%
in % 10.8% 11.2%
Earnings before taxes 23.1 24.1 4.5%
in % 11.0% 11.0%
Consolidated net income attributable to owners of the
parent 18.3 16.2 –11.4%
in % 8.7% 7.4%
Earnings per share (basic) in Euro 0.94 0.82
Dividend per share in Euro 0.33 0.331
1 Proposal to the Annual General Meeting in May 2016
With a sales growth of 4.8% in 2015, an EBIT margin of 11.2%, capital expenditures amounting to 11.3% of sales, and an adjusted free cash flow of 25.6 million Euro (capital expenditures and cash flow without one-off effect from prematurely terminated lease contracts), Elmos achieved all the targets defined in its updated October 2015 forecast in 2015.
Combined management report – Business report
—52—
Elmos Annual Report 2015
Sales performanceSales were up 4.8% to 219.6 million Euro in the year under review 2015 (2014: 209.5 million Euro). Total sales were spread over the four quarters more or less evenly. This development is due to the fact that the first quarter was favored by closing date effects and the second half of the year was affected by the developments in China and a resulting more cautious order behavior. Considered on the whole, Elmos benefits from new product ramp-ups and a deeper penetration with existing products.
Sales by region
The Asia/Pacific region is increasingly gaining in relevance to Elmos. Despite the ailing economy in China, this region’s contribution was increased once again in the year 2015, coming now to 68.9 million Euro or 31.4% of total sales (2014: 55.9 million Euro or 26.7%). With a growth rate of 23.1% or an increase in sales by 12.9 million Euro, Asia/Pacific compensates for the development in other regions. U.S. sales went up from 22.0 million Euro to 23.4 million Euro due to the strength of the U.S. dollar. Business with European customers went slightly down in the year under report, achieving sales of 116.9 million Euro (2014: 119.0 million Euro). However, Europe remains the region of the highest relevance to Elmos with a share in total sales of 53.2% in 2015 (2014: 56.8%).
Sales by customer and product
Elmos supplies a large number of customers. Among them are suppliers to the auto industry and also industrial customers and manufacturers of medical technology and consumer goods. In 2015 two of our customers accounted for more than 10% of sales each. Sales generated with the largest customers are usually attributable to different products at different stages in their respective life cycles. Further diversification took place with respect to customers as well as to products. The top ten customers thus amounted only to about 64% of sales in 2015 (2014: 68%). The combined share of the ten bestselling products went down as well, coming now to about 41% (2014: 44%).
Order backlog
Orders received and order situation typically reflect the current business performance, giving account of the year’s sales performance. To determine the book-to-bill, the orders received for the next three months are compared with sales of the past three months. At the end of the year 2015 the book-to-bill ratio was slightly above one.
Order backlog is usually entered upon receiving the customer’s order. It is influenced by different factors such as demand, order behavior, production lead time, etc. Order backlog may vary between the time of placing the order and delivery due to changes in customer demand,
market conditions, or closing date effects such as changes in consignment stock withdrawals. As soon as production is started, an order usually cannot be canceled anymore. However, there is no guaranty for order backlog to turn automatically into sales.
New projects (design wins)
The competition for new projects continued to be intense as it has been over the past years. The year 2015 was a very successful one for design wins, in respect of the number and volume of acquired new projects, and took up speed especially by the end of the year. As in the past few years the number of ASSPs clearly dominated design wins, proof of the fact that Elmos solutions are attractive in the marketplace. The number of about 20 partners won as new customers in 2015 is pleasant as well. The design wins cover a broad range of application fields addressed by Elmos with its three business lines (Sensors, Motor Control, and Embedded Solutions).
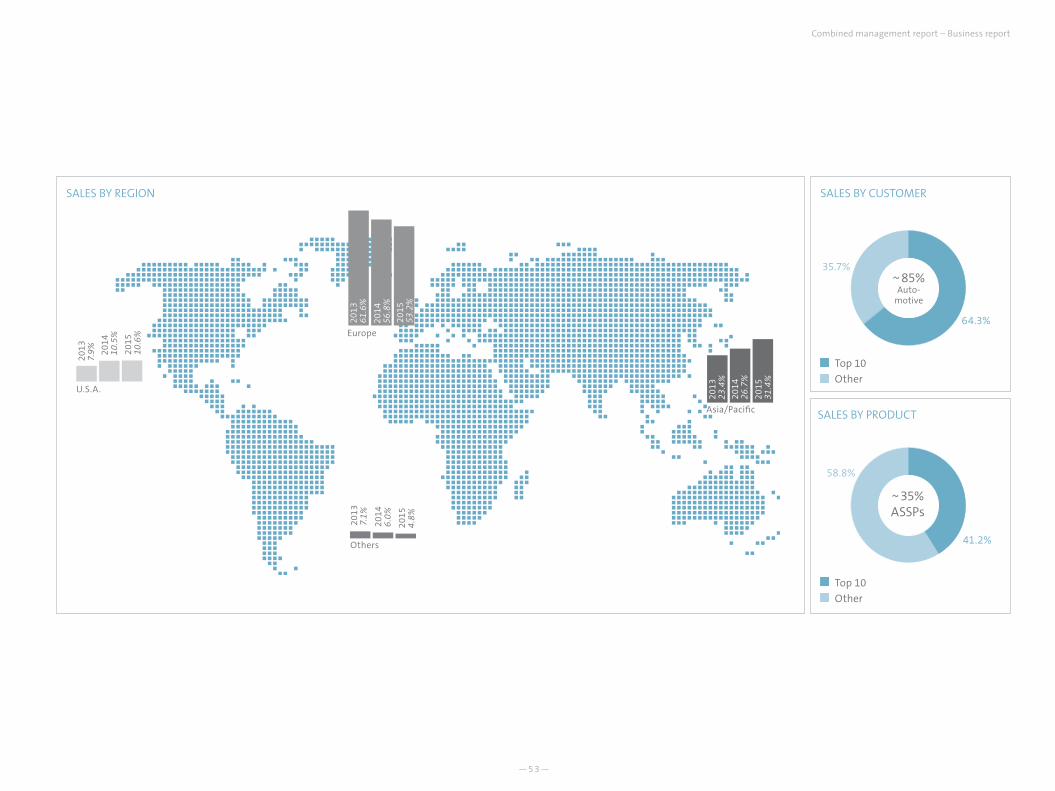
—53—
SALES BY REGION
Top 10
Other
Top 10
Other
SALES BY CUSTOMER
SALES BY PRODUCT
35.7%
64.3%
41.2%
58.8%
U.S.A.
Europe
Others
Asia/Pacific
2013
7.9%
2014
6.0
%
2013
61.6
%
2013
23.4
%
2014
10.5
%
2013
7.1%
2014
56.8
%
2014
26.7
%
2015
10.6
%
2015
4.8
%20
1553
.2%
2015
31.4
%
~85%Auto-
motive
~35%ASSPs
Combined management report – Business report
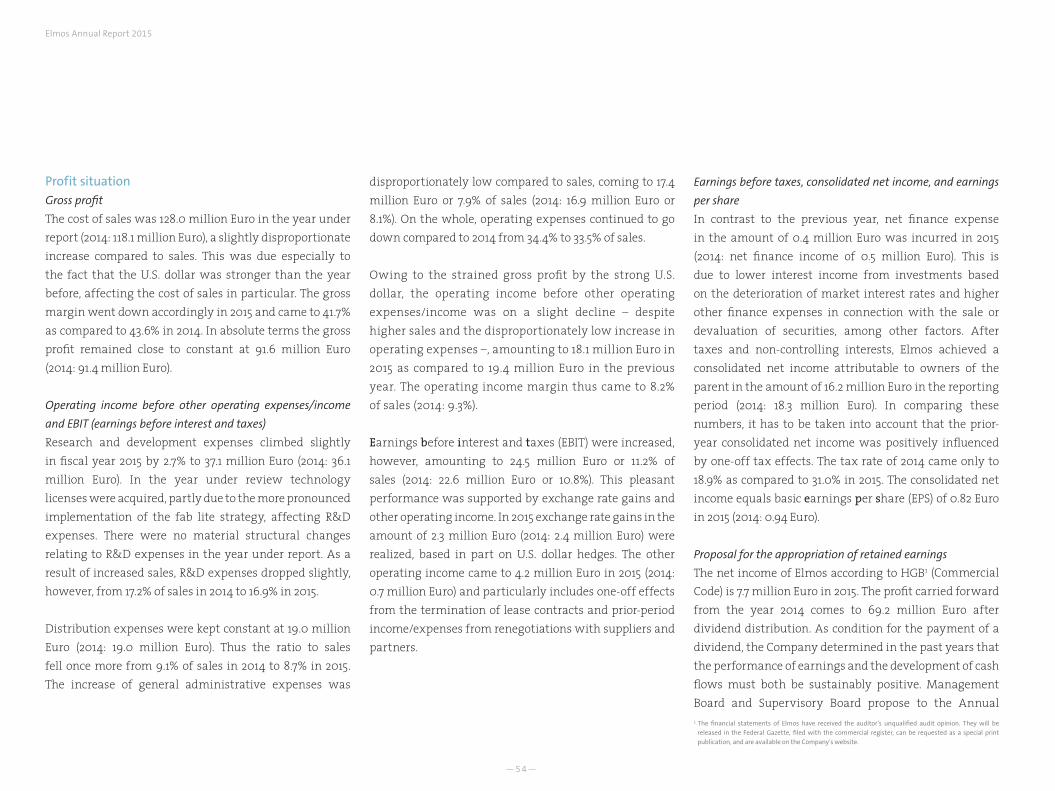
—54—
Elmos Annual Report 2015
Profit situationGross profit
The cost of sales was 128.0 million Euro in the year under report (2014: 118.1 million Euro), a slightly disproportionate increase compared to sales. This was due especially to the fact that the U.S. dollar was stronger than the year before, affecting the cost of sales in particular. The gross margin went down accordingly in 2015 and came to 41.7% as compared to 43.6% in 2014. In absolute terms the gross profit remained close to constant at 91.6 million Euro (2014: 91.4 million Euro).
Operating income before other operating expenses/income
and EBIT (earnings before interest and taxes)
Research and development expenses climbed slightly in fiscal year 2015 by 2.7% to 37.1 million Euro (2014: 36.1 million Euro). In the year under review technology licenses were acquired, partly due to the more pronounced implementation of the fab lite strategy, affecting R&D expenses. There were no material structural changes relating to R&D expenses in the year under report. As a result of increased sales, R&D expenses dropped slightly, however, from 17.2% of sales in 2014 to 16.9% in 2015.
Distribution expenses were kept constant at 19.0 million Euro (2014: 19.0 million Euro). Thus the ratio to sales fell once more from 9.1% of sales in 2014 to 8.7% in 2015. The increase of general administrative expenses was
disproportionately low compared to sales, coming to 17.4 million Euro or 7.9% of sales (2014: 16.9 million Euro or 8.1%). On the whole, operating expenses continued to go down compared to 2014 from 34.4% to 33.5% of sales.
Owing to the strained gross profit by the strong U.S. dollar, the operating income before other operating expenses/income was on a slight decline – despite higher sales and the disproportionately low increase in operating expenses –, amounting to 18.1 million Euro in 2015 as compared to 19.4 million Euro in the previous year. The operating income margin thus came to 8.2% of sales (2014: 9.3%).
Earnings before interest and taxes (EBIT) were increased, however, amounting to 24.5 million Euro or 11.2% of sales (2014: 22.6 million Euro or 10.8%). This pleasant performance was supported by exchange rate gains and other operating income. In 2015 exchange rate gains in the amount of 2.3 million Euro (2014: 2.4 million Euro) were realized, based in part on U.S. dollar hedges. The other operating income came to 4.2 million Euro in 2015 (2014: 0.7 million Euro) and particularly includes one-off effects from the termination of lease contracts and prior-period income/expenses from renegotiations with suppliers and partners.
Earnings before taxes, consolidated net income, and earnings
per share
In contrast to the previous year, net finance expense in the amount of 0.4 million Euro was incurred in 2015 (2014: net finance income of 0.5 million Euro). This is due to lower interest income from investments based on the deterioration of market interest rates and higher other finance expenses in connection with the sale or devaluation of securities, among other factors. After taxes and non-controlling interests, Elmos achieved a consolidated net income attributable to owners of the parent in the amount of 16.2 million Euro in the reporting period (2014: 18.3 million Euro). In comparing these numbers, it has to be taken into account that the prior-year consolidated net income was positively influenced by one-off tax effects. The tax rate of 2014 came only to 18.9% as compared to 31.0% in 2015. The consolidated net income equals basic earnings per share (EPS) of 0.82 Euro in 2015 (2014: 0.94 Euro).
Proposal for the appropriation of retained earnings
The net income of Elmos according to HGB1 (Commercial Code) is 7.7 million Euro in 2015. The profit carried forward from the year 2014 comes to 69.2 million Euro after dividend distribution. As condition for the payment of a dividend, the Company determined in the past years that the performance of earnings and the development of cash flows must both be sustainably positive. Management Board and Supervisory Board propose to the Annual 1 The financial statements of Elmos have received the auditor’s unqualified audit opinion. They will be
released in the Federal Gazette, filed with the commercial register, can be requested as a special print publication, and are available on the Company’s website.
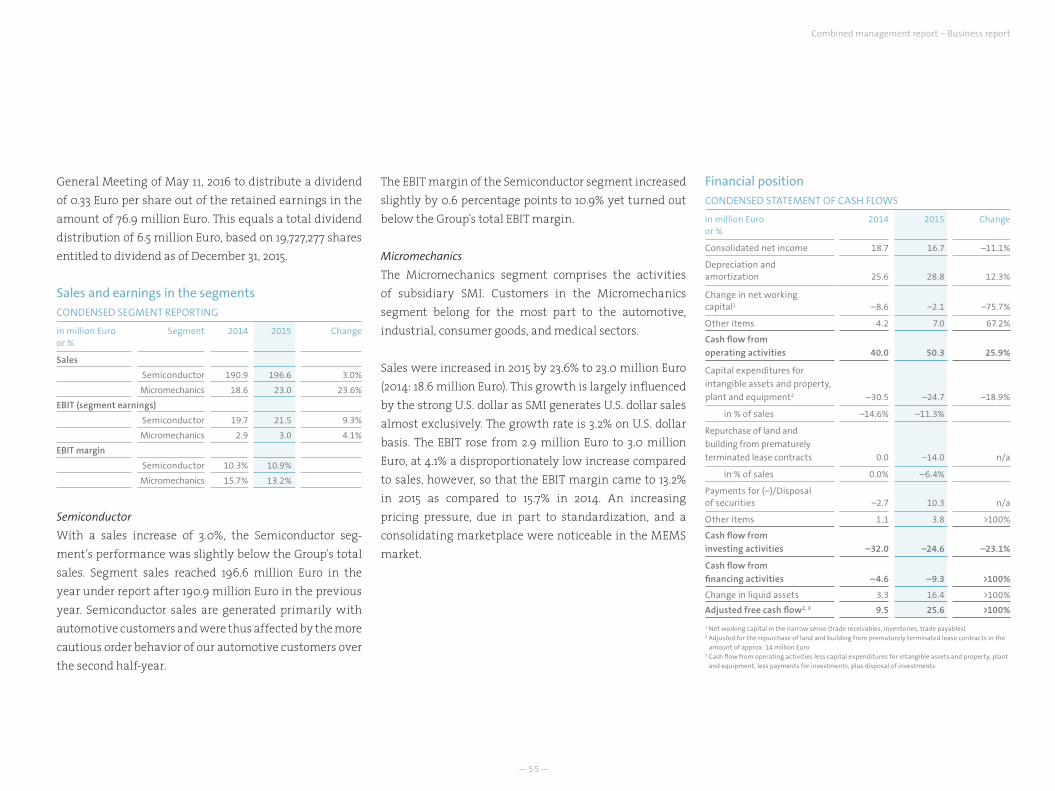
—55—
General Meeting of May 11, 2016 to distribute a dividend of 0.33 Euro per share out of the retained earnings in the amount of 76.9 million Euro. This equals a total dividend distribution of 6.5 million Euro, based on 19,727,277 shares entitled to dividend as of December 31, 2015.
Sales and earnings in the segments CONDENSED SEGMENT REPORTING
in million Euro or %
Segment 2014 2015 Change
Sales
Semiconductor 190.9 196.6 3.0%
Micromechanics 18.6 23.0 23.6%
EBIT (segment earnings)
Semiconductor 19.7 21.5 9.3%
Micromechanics 2.9 3.0 4.1%
EBIT margin
Semiconductor 10.3% 10.9%
Micromechanics 15.7% 13.2%
Semiconductor
With a sales increase of 3.0%, the Semiconductor seg-ment’s performance was slightly below the Group’s total sales. Segment sales reached 196.6 million Euro in the year under report after 190.9 million Euro in the previous year. Semiconductor sales are generated primarily with automotive customers and were thus affected by the more cautious order behavior of our automotive customers over the second half-year.
The EBIT margin of the Semiconductor segment increased slightly by 0.6 percentage points to 10.9% yet turned out below the Group’s total EBIT margin.
Micromechanics
The Micromechanics segment comprises the activities of subsidiary SMI. Customers in the Micromechanics segment belong for the most part to the automotive, industrial, consumer goods, and medical sectors.
Sales were increased in 2015 by 23.6% to 23.0 million Euro (2014: 18.6 million Euro). This growth is largely influenced by the strong U.S. dollar as SMI generates U.S. dollar sales almost exclusively. The growth rate is 3.2% on U.S. dollar basis. The EBIT rose from 2.9 million Euro to 3.0 million Euro, at 4.1% a disproportionately low increase compared to sales, however, so that the EBIT margin came to 13.2% in 2015 as compared to 15.7% in 2014. An increasing pricing pressure, due in part to standardization, and a consolidating marketplace were noticeable in the MEMS market.
Financial positionCONDENSED STATEMENT OF CASH FLOWS
in million Euro or %
2014 2015 Change
Consolidated net income 18.7 16.7 –11.1%
Depreciation and amortization 25.6 28.8 12.3%
Change in net working capital1 –8.6 –2.1 –75.7%
Other items 4.2 7.0 67.2%
Cash flow from
operating activities 40.0 50.3 25.9%
Capital expenditures for
intangible assets and property,
plant and equipment2 –30.5 –24.7 –18.9%
in % of sales –14.6% –11.3%
Repurchase of land and
building from prematurely
terminated lease contracts 0.0 –14.0 n/a
in % of sales 0.0% –6.4%
Payments for (–)/Disposal of securities –2.7 10.3 n/a
Other items 1.1 3.8 >100%
Cash flow from
investing activities –32.0 –24.6 –23.1%
Cash flow from
financing activities –4.6 –9.3 >100%
Change in liquid assets 3.3 16.4 >100%
Adjusted free cash flow2, 3 9.5 25.6 >100%
1 Net working capital in the narrow sense (trade receivables, inventories, trade payables)2 Adjusted for the repurchase of land and building from prematurely terminated lease contracts in the
amount of approx. 14 million Euro3 Cash flow from operating activities less capital expenditures for intangible assets and property, plant
and equipment, less payments for investments, plus disposal of investments
Combined management report – Business report
—56—
Elmos Annual Report 2015
Cash flow from operating activities
The cash flow from operating activities was increased again over the previous year to 50.3 million Euro in the year 2015 in comparison with 40.0 million Euro in 2014. Lower additions to inventories in the year under review are a main reason for this (4.0 million Euro in 2015 vs. 12.7 million Euro in 2014). In addition to that, the decrease in other assets (3.0 million Euro), caused essentially by diminished current financial assets and lower sales tax assets, made a major contribution to the improvement of the operating cash flow compared to the increase of the previous year (–1.7 million Euro).
Cash flow from investing activities
The cash-effective capital expenditures for intangibles and property, plant and equipment, adjusted for the one-off effect of approx. 14 million Euro from the repurchase of land and building from prematurely terminated lease contracts, amounted to 24.7 million Euro or 11.3% of sales in the year 2015 (2014: 30.5 million Euro or 14.6%). Thus capital expenditures have been reduced after the completed conversion of production from 6-inch to 8-inch wafers. A material part of capex was utilized for the expansion of testing capacity.
The largest portion of the reporting period’s capital expenditures in the amount of 23.6 million Euro (2014: 29.5 million Euro) was accounted for by the Semiconductor segment; 1.1 million Euro was invested in the Micromechanics segment (2014: 1.0 million Euro).
The cash flow from investing activities amounted to –24.6 million Euro in 2015 after –32.0 million Euro in 2014. It has to be taken into account here that securities in the net amount of 10.3 million Euro were sold in the year under review (2014: payments for securities in the net amount of 2.7 million Euro), reported in the cash flow from investing activities. Apart from that, 3.0 million Euro more were collected from the disposal of non-current assets than the year before.
The adjusted free cash flow was thus increased again in 2015 and came to 25.6 million Euro after 9.5 million Euro in the previous year.
Cash flow from financing activities
The cash flow from financing activities came to –9.3 million Euro for this fiscal year (2014: –4.6 million Euro) and was determined, apart from the higher dividend payment of 6.5 million Euro compared to the previous year (2014: 4.8 million Euro), by payments to non-controlling shareholders in the amount of 3.4 million Euro, essentially for the increase of the interest in MAZ Brandenburg from 50% to 80% in fiscal year 2014.
Liquid assets
In addition to cash and cash equivalents totaling 50.0 million Euro, the Company holds long-term and short-term securities in the amount of 40.5 million Euro (December 31, 2014: 32.5 million Euro and 51.9 million Euro respectively). Cash and cash equivalents plus marketable
securities thus amounted to altogether 90.5 million Euro as of December 31, 2015, thus exceeding the value of the prior-year reporting date in spite of continued sizable capital expenditures, the higher dividend payment, and the premature repurchase of land and building from leases (December 31, 2014: 84.4 million Euro).
Financing
In addition to financing through equity, Elmos also draws on traditional long-term credit facilities in part (36.6 million Euro as of December 31, 2015), maturing essentially in fiscal years 2017 and 2018. Effective interest rates of the long-term loans range between 1.75% and 4.90%. In addition to that, as of December 31, 2015 the Company had various short-term lines of credit at its disposal in the total amount of 16.5 million Euro. As of December 31, 2015 the Company provided these credit facilities in the amount of 0.7 million Euro as security.
Principles and goals of financial management
It is the primary objective of the Elmos Group’s capital management to assure that an adequate credit rating, liquidity provision at any time and at high financial flexibility, as well as a solid capital structure are maintained in support of the Company’s business operations for the long term and for the protection of the interests of shareholders, employees, and other stakeholders. Elmos thus stands for the strategy of a continuous, sustained increase in shareholder value.
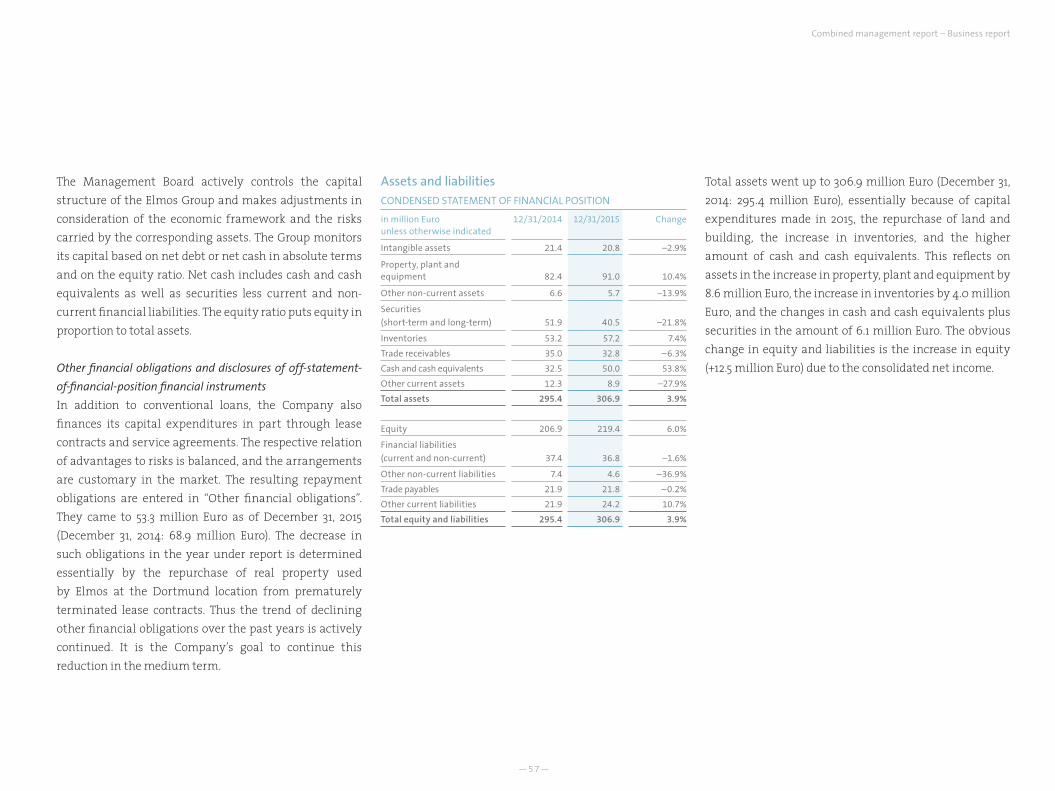
—57—
The Management Board actively controls the capital structure of the Elmos Group and makes adjustments in consideration of the economic framework and the risks carried by the corresponding assets. The Group monitors its capital based on net debt or net cash in absolute terms and on the equity ratio. Net cash includes cash and cash equivalents as well as securities less current and non-current financial liabilities. The equity ratio puts equity in proportion to total assets.
Other financial obligations and disclosures of off-statement-
of-financial-position financial instruments
In addition to conventional loans, the Company also finances its capital expenditures in part through lease contracts and service agreements. The respective relation of advantages to risks is balanced, and the arrangements are customary in the market. The resulting repayment obligations are entered in “Other financial obligations”. They came to 53.3 million Euro as of December 31, 2015 (December 31, 2014: 68.9 million Euro). The decrease in such obligations in the year under report is determined essentially by the repurchase of real property used by Elmos at the Dortmund location from prematurely terminated lease contracts. Thus the trend of declining other financial obligations over the past years is actively continued. It is the Company’s goal to continue this reduction in the medium term.
Assets and liabilitiesCONDENSED STATEMENT OF FINANCIAL POSITION
in million Eurounless otherwise indicated
12/31/2014 12/31/2015 Change
Intangible assets 21.4 20.8 –2.9%
Property, plant and equipment 82.4 91.0 10.4%
Other non-current assets 6.6 5.7 –13.9%
Securities
(short-term and long-term) 51.9 40.5 –21.8%
Inventories 53.2 57.2 7.4%
Trade receivables 35.0 32.8 –6.3%
Cash and cash equivalents 32.5 50.0 53.8%
Other current assets 12.3 8.9 –27.9%
Total assets 295.4 306.9 3.9%
Equity 206.9 219.4 6.0%
Financial liabilities
(current and non-current) 37.4 36.8 –1.6%
Other non-current liabilities 7.4 4.6 –36.9%
Trade payables 21.9 21.8 –0.2%
Other current liabilities 21.9 24.2 10.7%
Total equity and liabilities 295.4 306.9 3.9%
Total assets went up to 306.9 million Euro (December 31, 2014: 295.4 million Euro), essentially because of capital expenditures made in 2015, the repurchase of land and building, the increase in inventories, and the higher amount of cash and cash equivalents. This reflects on assets in the increase in property, plant and equipment by 8.6 million Euro, the increase in inventories by 4.0 million Euro, and the changes in cash and cash equivalents plus securities in the amount of 6.1 million Euro. The obvious change in equity and liabilities is the increase in equity (+12.5 million Euro) due to the consolidated net income.
Combined management report – Business report
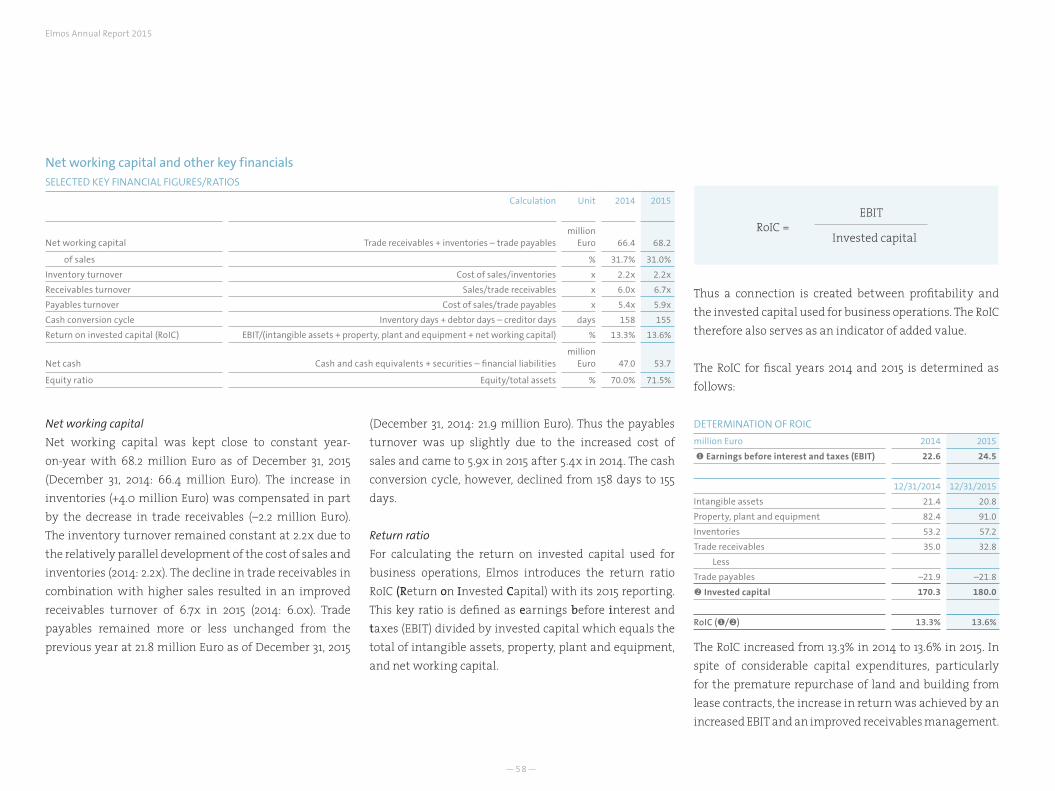
—58—
Elmos Annual Report 2015
Net working capital
Net working capital was kept close to constant year-on-year with 68.2 million Euro as of December 31, 2015 (December 31, 2014: 66.4 million Euro). The increase in inventories (+4.0 million Euro) was compensated in part by the decrease in trade receivables (–2.2 million Euro). The inventory turnover remained constant at 2.2x due to the relatively parallel development of the cost of sales and inventories (2014: 2.2x). The decline in trade receivables in combination with higher sales resulted in an improved receivables turnover of 6.7x in 2015 (2014: 6.0x). Trade payables remained more or less unchanged from the previous year at 21.8 million Euro as of December 31, 2015
Thus a connection is created between profitability and the invested capital used for business operations. The RoIC therefore also serves as an indicator of added value.
The RoIC for fiscal years 2014 and 2015 is determined as follows:
DETERMINATION OF ROIC
million Euro 2014 2015
Earnings before interest and taxes (EBIT) 22.6 24.5
12/31/2014 12/31/2015
Intangible assets 21.4 20.8
Property, plant and equipment 82.4 91.0
Inventories 53.2 57.2
Trade receivables 35.0 32.8
Less
Trade payables –21.9 –21.8
Invested capital 170.3 180.0
RoIC (/) 13.3% 13.6% The RoIC increased from 13.3% in 2014 to 13.6% in 2015. In spite of considerable capital expenditures, particularly for the premature repurchase of land and building from lease contracts, the increase in return was achieved by an increased EBIT and an improved receivables management.
Net working capital and other key financialsSELECTED KEY FINANCIAL FIGURES/RATIOS
Calculation Unit 2014 2015
Net working capital Trade receivables + inventories – trade payablesmillion
Euro 66.4 68.2
of sales % 31.7% 31.0%
Inventory turnover Cost of sales/inventories x 2.2x 2.2x
Receivables turnover Sales/trade receivables x 6.0x 6.7x
Payables turnover Cost of sales/trade payables x 5.4x 5.9x
Cash conversion cycle Inventory days + debtor days – creditor days days 158 155
Return on invested capital (RoIC) EBIT/(intangible assets + property, plant and equipment + net working capital) % 13.3% 13.6%
Net cash Cash and cash equivalents + securities – financial liabilitiesmillion
Euro 47.0 53.7
Equity ratio Equity/total assets % 70.0% 71.5%
(December 31, 2014: 21.9 million Euro). Thus the payables turnover was up slightly due to the increased cost of sales and came to 5.9x in 2015 after 5.4x in 2014. The cash conversion cycle, however, declined from 158 days to 155 days.
Return ratio
For calculating the return on invested capital used for business operations, Elmos introduces the return ratio RoIC (Return on Invested Capital) with its 2015 reporting. This key ratio is defined as earnings before interest and taxes (EBIT) divided by invested capital which equals the total of intangible assets, property, plant and equipment, and net working capital.
RoIC =
EBIT
Invested capital
—59—
Other key financial figures/ratios
Net cash increased year-on-year to 53.7 million Euro as of December 31, 2015 (December 31, 2014: 47.0 million Euro). The equity ratio reached 71.5% as of December 31, 2015, slightly increased over the prior year ratio (December 31, 2014: 70.0%).
OVERALL STATEMENT ON THE ECONOMIC SITUATION Despite the challenging environment during the past year, Elmos managed to extend its financial strength further in 2015 owing to the solid corporate structure. The adjusted free cash flow was clearly positive once more, thus making it possible to further strengthening the net cash position and thus consolidating the solid financial position despite sizable capital expenditures and the higher dividend payment. The equity ratio was also increased over the previous year once again. Based on structural changes, Elmos has further expanded and optimized the product portfolio of the business lines. The Company continued to invest in new products and their development as well. Thus existing customer relationships were intensified and new customers were won.
All this together with the solid financial basis strengthen the competitive position and provide a good foundation for the Company’s future development.
ELMOS SEMICONDUCTOR AG (ANNOTATIONS BASED ON HGB)Elmos Semiconductor AG is the parent company of the Elmos Group. The Management Board of Elmos Semi- conductor AG is responsible for managing the Com-pany and the Group. Elmos Semiconductor AG is a semi-conductor manufacturer of chips for Sensors, Motor Control, and Embedded Solutions primarily for the automotive industry. Elmos Semiconductor AG is also influenced by its directly and indirectly held subsidiaries and investments. Apart from responsibility for business operations, the Group’s parent is also responsible for the Group’s strategic orientation and thus determines the corporate strategy within the framework of higher-level group functions, represented by the members of the Management Board.
Unlike the consolidated financial statements, Elmos Semiconductor AG does not prepare its separate financial statements according to International Financial Repor-ting Standards (IFRS) but pursuant to the provisions of the German Commercial Code (HGB). The complete financial statements are released separately. The financial statements have received the auditor’s unqualified audit opinion. They are released in the Federal Gazette, filed with the register of companies, they can be requested in print and are available on the Company’s website.
Business performance 2015The business performance and economic situation of Elmos Semiconductor AG essentially determine the busi-
ness performance and success of the Group. We give detailed account of this in the chapters “Basic information on the Group” and “Business report”.
Business outlook 2016 and material opportunities and risksThe expectations for Elmos Semiconductor AG reflect in the outlook for the Group due to the Company’s ties with the Group companies and its relevance for the Group. The expected performance of Elmos Semiconductor AG in fiscal year 2016 also depends essentially on the performance of the Group and its situation with respect to opportunities and risks. This is the subject of the report on “Opportunities and risks” and the Group’s “Outlook”. Insofar the statements made therein on the Group’s expected performance and its risk position also apply to the expected performance and risk position of Elmos Semiconductor AG. The description of the internal control system concerning Elmos Semiconductor AG pursuant to Section 289 (5) HGB follows in the chapter “Opportunities and Risks “.
As the Group’s parent, Elmos Semiconductor AG receives income especially from its subsidiaries. The income from investments is composed of transfers of profit or loss from domestic subsidiaries and distributions from foreign subsidiaries. Accordingly the business performance expected for the Group in 2016 can be assumed to influence the business result of Elmos Semiconductor AG as well. On the whole we expect 2016 retained earnings of Elmos Semiconductor AG in an amount which makes it possible
Combined management report – Business report
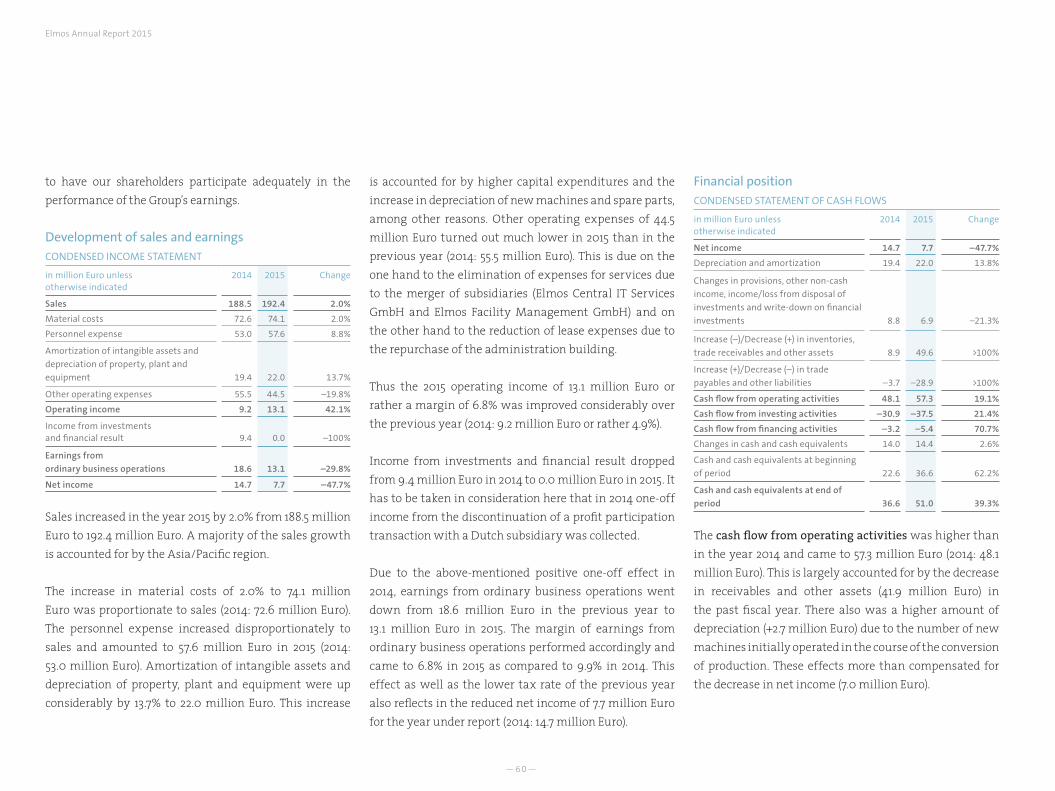
—60—
Elmos Annual Report 2015
to have our shareholders participate adequately in the performance of the Group’s earnings.
Development of sales and earningsCONDENSED INCOME STATEMENT
in million Euro unless otherwise indicated
2014 2015 Change
Sales 188.5 192.4 2.0%
Material costs 72.6 74.1 2.0%
Personnel expense 53.0 57.6 8.8%
Amortization of intangible assets and
depreciation of property, plant and
equipment 19.4 22.0 13.7%
Other operating expenses 55.5 44.5 –19.8%
Operating income 9.2 13.1 42.1%
Income from investments and financial result 9.4 0.0 –100%
Earnings from
ordinary business operations 18.6 13.1 –29.8%
Net income 14.7 7.7 –47.7%
Sales increased in the year 2015 by 2.0% from 188.5 million Euro to 192.4 million Euro. A majority of the sales growth is accounted for by the Asia/Pacific region.
The increase in material costs of 2.0% to 74.1 million Euro was proportionate to sales (2014: 72.6 million Euro). The personnel expense increased disproportionately to sales and amounted to 57.6 million Euro in 2015 (2014: 53.0 million Euro). Amortization of intangible assets and depreciation of property, plant and equipment were up considerably by 13.7% to 22.0 million Euro. This increase
Financial positionCONDENSED STATEMENT OF CASH FLOWS
in million Euro unless otherwise indicated
2014 2015 Change
Net income 14.7 7.7 –47.7%
Depreciation and amortization 19.4 22.0 13.8%
Changes in provisions, other non-cash
income, income/loss from disposal of
investments and write-down on financial
investments 8.8 6.9 –21.3%
Increase (–)/Decrease (+) in inventories,
trade receivables and other assets 8.9 49.6 >100%
Increase (+)/Decrease (–) in trade
payables and other liabilities –3.7 –28.9 >100%
Cash flow from operating activities 48.1 57.3 19.1%
Cash flow from investing activities –30.9 –37.5 21.4%
Cash flow from financing activities –3.2 –5.4 70.7%
Changes in cash and cash equivalents 14.0 14.4 2.6%
Cash and cash equivalents at beginning
of period 22.6 36.6 62.2%
Cash and cash equivalents at end of
period 36.6 51.0 39.3%
The cash flow from operating activities was higher than in the year 2014 and came to 57.3 million Euro (2014: 48.1 million Euro). This is largely accounted for by the decrease in receivables and other assets (41.9 million Euro) in the past fiscal year. There also was a higher amount of depreciation (+2.7 million Euro) due to the number of new machines initially operated in the course of the conversion of production. These effects more than compensated for the decrease in net income (7.0 million Euro).
is accounted for by higher capital expenditures and the increase in depreciation of new machines and spare parts, among other reasons. Other operating expenses of 44.5 million Euro turned out much lower in 2015 than in the previous year (2014: 55.5 million Euro). This is due on the one hand to the elimination of expenses for services due to the merger of subsidiaries (Elmos Central IT Services GmbH and Elmos Facility Management GmbH) and on the other hand to the reduction of lease expenses due to the repurchase of the administration building.
Thus the 2015 operating income of 13.1 million Euro or rather a margin of 6.8% was improved considerably over the previous year (2014: 9.2 million Euro or rather 4.9%).
Income from investments and financial result dropped from 9.4 million Euro in 2014 to 0.0 million Euro in 2015. It has to be taken in consideration here that in 2014 one-off income from the discontinuation of a profit participation transaction with a Dutch subsidiary was collected.
Due to the above-mentioned positive one-off effect in 2014, earnings from ordinary business operations went down from 18.6 million Euro in the previous year to 13.1 million Euro in 2015. The margin of earnings from ordinary business operations performed accordingly and came to 6.8% in 2015 as compared to 9.9% in 2014. This effect as well as the lower tax rate of the previous year also reflects in the reduced net income of 7.7 million Euro for the year under report (2014: 14.7 million Euro).
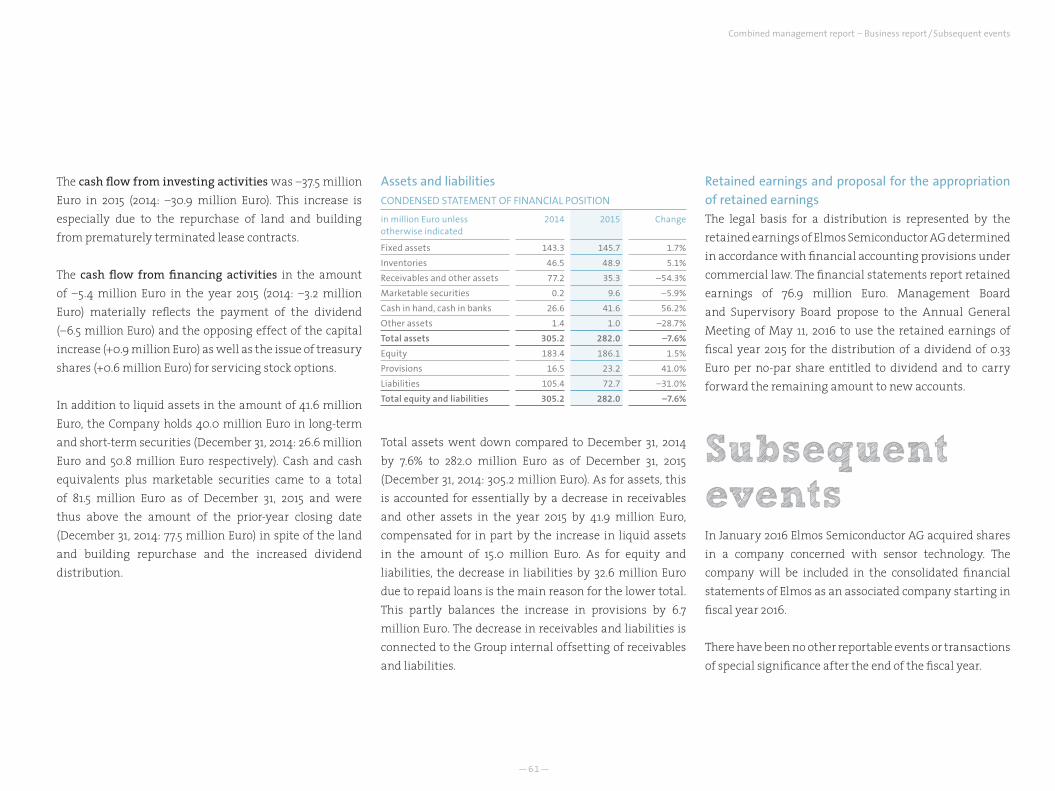
—61—
The cash flow from investing activities was –37.5 million Euro in 2015 (2014: –30.9 million Euro). This increase is especially due to the repurchase of land and building from prematurely terminated lease contracts.
The cash flow from financing activities in the amount of –5.4 million Euro in the year 2015 (2014: –3.2 million Euro) materially reflects the payment of the dividend (–6.5 million Euro) and the opposing effect of the capital increase (+0.9 million Euro) as well as the issue of treasury shares (+0.6 million Euro) for servicing stock options.
In addition to liquid assets in the amount of 41.6 million Euro, the Company holds 40.0 million Euro in long-term and short-term securities (December 31, 2014: 26.6 million Euro and 50.8 million Euro respectively). Cash and cash equivalents plus marketable securities came to a total of 81.5 million Euro as of December 31, 2015 and were thus above the amount of the prior-year closing date (December 31, 2014: 77.5 million Euro) in spite of the land and building repurchase and the increased dividend distribution.
Assets and liabilitiesCONDENSED STATEMENT OF FINANCIAL POSITION
in million Euro unless otherwise indicated
2014 2015 Change
Fixed assets 143.3 145.7 1.7%
Inventories 46.5 48.9 5.1%
Receivables and other assets 77.2 35.3 –54.3%
Marketable securities 0.2 9.6 –5.9%
Cash in hand, cash in banks 26.6 41.6 56.2%
Other assets 1.4 1.0 –28.7%
Total assets 305.2 282.0 –7.6%
Equity 183.4 186.1 1.5%
Provisions 16.5 23.2 41.0%
Liabilities 105.4 72.7 –31.0%
Total equity and liabilities 305.2 282.0 –7.6%
Total assets went down compared to December 31, 2014 by 7.6% to 282.0 million Euro as of December 31, 2015 (December 31, 2014: 305.2 million Euro). As for assets, this is accounted for essentially by a decrease in receivables and other assets in the year 2015 by 41.9 million Euro, compensated for in part by the increase in liquid assets in the amount of 15.0 million Euro. As for equity and liabilities, the decrease in liabilities by 32.6 million Euro due to repaid loans is the main reason for the lower total. This partly balances the increase in provisions by 6.7 million Euro. The decrease in receivables and liabilities is connected to the Group internal offsetting of receivables and liabilities.
Retained earnings and proposal for the appropriation of retained earningsThe legal basis for a distribution is represented by the retained earnings of Elmos Semiconductor AG determined in accordance with financial accounting provisions under commercial law. The financial statements report retained earnings of 76.9 million Euro. Management Board and Supervisory Board propose to the Annual General Meeting of May 11, 2016 to use the retained earnings of fiscal year 2015 for the distribution of a dividend of 0.33 Euro per no-par share entitled to dividend and to carry forward the remaining amount to new accounts.
SubsequenteventsIn January 2016 Elmos Semiconductor AG acquired shares in a company concerned with sensor technology. The company will be included in the consolidated financial statements of Elmos as an associated company starting in fiscal year 2016.
There have been no other reportable events or transactions of special significance after the end of the fiscal year.
Combined management report – Business report /Subsequent events
—62—
Elmos Annual Report 2015
OPPORTUNITIESOpportunities are identified and analyzed in the Group. We constantly monitor our markets and are thus able to detect market opportunities that become available. We are also in continuous dialogue with customers in order to identify trends and developments early on.
Just like risk management, the management of oppor-tunities is aimed at increasing the shareholder value systematically and continuously. A quantification of opportunities is not possible as they are usually affected by external general conditions and influencing factors as well as complex interrelations which are controllable by Elmos only to a limited extent.
The economic framework influences our assets and liabilities, financial position, and profitability. Our outlook for 2016 and our medium-term prospects are based on the expectation that the future general economic conditions will correspond to our presentation in the outlook report that is part of this joint management report.
Macroeconomic opportunities Macroeconomic opportunities open up for Elmos because we operate in growth markets. Most notable among those is the Asian market that has shown a sustained positive development for us. We want to participate in growth and increase our market shares. At the same time we assert our position as a market leader for automotive
semiconductors in certain applications in the established markets. Moreover, we consider the U.S.A. a market of disproportionate opportunity for us because of the low degree of penetration at present.
Industry specific opportunitiesIndustry specific opportunities become available to us as a consequence of the following megatrends: driver assistance up to autonomous driving, combined with many add-on systems for active and passive safety, less emissions up to electromobility, and efficiency improvements, e.g. with the interior and exterior use of LEDs, as well as networking these systems. To our industrial customers we also want to offer solutions that will help them assume market leading positions.
Business strategy opportunitiesBusiness strategy opportunities open up for Elmos due to innovation leadership. In the segment of sensors, we offer innovative or advanced high-quality products in the technology fields of ultrasonics, sensor analysis, pressure sensorics, and optical sensors/HALIOS®. With new and efficient systems for electric motor control (stepper, DC and BLDC motors) we can generate further opportunities in the markets and with customers. With new products we seek to continuously increase the efficiency of the systems we bring to market in the field of embedded solutions (interface products and LED voltage supply components, among others).
In addition to our core business of customer specific semiconductors for the automotive industry, the ongoing implementation of our strategy provides opportunities to the Company. These exist in the increased develop-ment, production and sale of application specific semi-conductors (ASSPs). Furthermore, we put a lot of effort and commitment into seizing these opportunities by consistently investing in research and development. If our research and development makes better progress than currently expected, this might have the effect that more new and improved products will be brought to market, that they are better received than expected, or that new products will be available sooner than scheduled.
Elmos also sees an opportunity in the expansion of its product portfolio. This can take place by the convenient enhancement through acquisitions of third-party entities or technologies and thus open up new markets as well.
Opportunities created by our employees Our employees are the core of the Company. We are able to generate sustained growth and safeguard our Company’s profitability only with motivated and committed colleagues. With various efforts we aim at increasing our employees’ performance, their know-how, and not least their commitment to the Company.
Opportunities and risks
—63—
Opportunities based on customer relationships Elmos markets its products and services according to the respective application, region, and industry. Within the regions we focus our sales capacities on the markets that show the largest business and sales potential. We invest in the development of our sales division and application support close to the customer in order to distribute our solutions effectively and to intensify our customer relationships.
Other opportunitiesWe also seize our opportunities beyond the scope mentioned above: We are working tirelessly at the optimization of our processes in development, production, technology, quality, administration, and logistics. We invest throughout the Group in measures for efficiency increase and in projects for environmentally friendly power generation. In addition to that, we provide a considerable part of our energy demand by ourselves.
MANAGEMENT’S OVERALL ASSESSMENT OF OPPORTUNITIES The Elmos management is confident that the Group’s profitability presents a solid foundation for our future business performance and provides the necessary resources in order to pursue and seize the opportunities that become available to the Group.
If we make better progress with these measures and methods than expected at present, this might have a
positive effect on our financial, profit and economic position and make us exceed our forecast and our medium-term prospects. Particularly the macroeconomic, industry specific and business strategy opportunities have considerable potential to make a positive contribution to the financial, profit and economic position.
RISK MANAGEMENT SYSTEM AND INTERNAL CONTROL SYSTEM WITH RESPECT TO FINANCIAL ACCOUNTINGThe following explanations also include information in accordance with Sections 289 (5) and 315 (2) no. 5 HGB (Commercial Code) as well as the explanatory report on the key features of the accounting-related internal control and risk management system.
Elmos comprises the measures for risk management as well as early risk detection in the Company in an integrated risk management system. This system focuses on safeguarding the Company’s continued existence and increasing the shareholder value systematically and continuously. The management system complies with the legal stipulations for an anticipatory risk detection system and the principles defined by the German Corporate Governance Code.
Based on the internal control and risk management system, risks and opportunities are routinely identified and their effects on the Company’s targets are analyzed. The Group deliberately assumes certain risks in areas
of its competence if adequate yields can be expected at the same time. Beyond that, major risks are avoided if possible. It is altogether assured that the Group analyzes and assesses any known risks taken and, insofar as possible, develops adequate countermeasures.
Binding standards and rules have been defined for risk identification and risk management. Speculative transactions or other actions of a speculative nature are generally prohibited. The observance of these principles is monitored regularly. The respective operating superiors are directly responsible for the early detection and control of risks. The next levels of seniority see to the management of risks. The Management Board assumes overall responsibility for the internal control and risk management system in the Group. In a well-established process, the divisions report on the current state of material risks through risk inventory with defined gradual thresholds. Risks are valuated and classified according to the probability of occurrence and the estimated amount of loss. Depending on estimated probability of occurrence and probable amount of loss in consideration of our business as well as our financial, profit and economic position, we classify risks according to the matrix presented on the next page and accordingly assess them as “very low”, “low”, “low to medium”, “medium”, “medium to high”, “high”, or “very high”.
Combined management report – Opportunities and risks
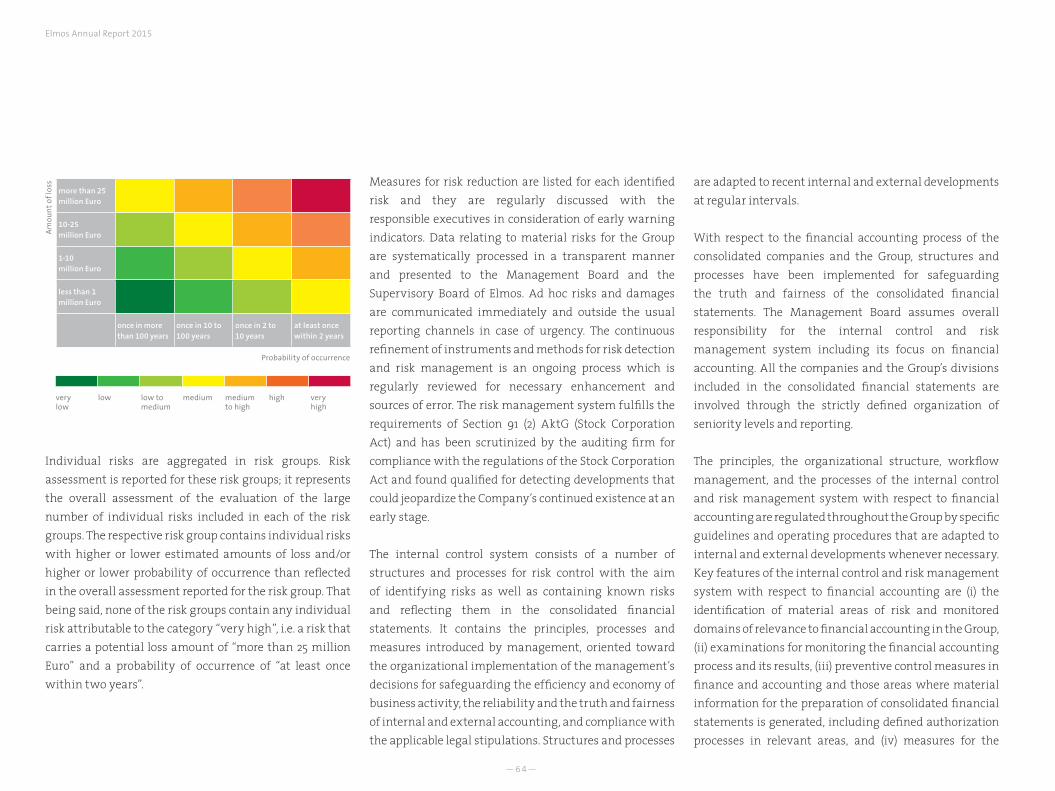
—64—
Elmos Annual Report 2015
Individual risks are aggregated in risk groups. Risk assessment is reported for these risk groups; it represents the overall assessment of the evaluation of the large number of individual risks included in each of the risk groups. The respective risk group contains individual risks with higher or lower estimated amounts of loss and/or higher or lower probability of occurrence than reflected in the overall assessment reported for the risk group. That being said, none of the risk groups contain any individual risk attributable to the category “very high”, i.e. a risk that carries a potential loss amount of “more than 25 million Euro” and a probability of occurrence of “at least once within two years”.
Measures for risk reduction are listed for each identified risk and they are regularly discussed with the responsible executives in consideration of early warning indicators. Data relating to material risks for the Group are systematically processed in a transparent manner and presented to the Management Board and the Supervisory Board of Elmos. Ad hoc risks and damages are communicated immediately and outside the usual reporting channels in case of urgency. The continuous refinement of instruments and methods for risk detection and risk management is an ongoing process which is regularly reviewed for necessary enhancement and sources of error. The risk management system fulfills the requirements of Section 91 (2) AktG (Stock Corporation Act) and has been scrutinized by the auditing firm for compliance with the regulations of the Stock Corporation Act and found qualified for detecting developments that could jeopardize the Company’s continued existence at an early stage.
The internal control system consists of a number of structures and processes for risk control with the aim of identifying risks as well as containing known risks and reflecting them in the consolidated financial statements. It contains the principles, processes and measures introduced by management, oriented toward the organizational implementation of the management’s decisions for safeguarding the efficiency and economy of business activity, the reliability and the truth and fairness of internal and external accounting, and compliance with the applicable legal stipulations. Structures and processes
are adapted to recent internal and external developments at regular intervals.
With respect to the financial accounting process of the consolidated companies and the Group, structures and processes have been implemented for safeguarding the truth and fairness of the consolidated financial statements. The Management Board assumes overall responsibility for the internal control and risk management system including its focus on financial accounting. All the companies and the Group’s divisions included in the consolidated financial statements are involved through the strictly defined organization of seniority levels and reporting.
The principles, the organizational structure, workflow management, and the processes of the internal control and risk management system with respect to financial accounting are regulated throughout the Group by specific guidelines and operating procedures that are adapted to internal and external developments whenever necessary. Key features of the internal control and risk management system with respect to financial accounting are (i) the identification of material areas of risk and monitored domains of relevance to financial accounting in the Group, (ii) examinations for monitoring the financial accounting process and its results, (iii) preventive control measures in finance and accounting and those areas where material information for the preparation of consolidated financial statements is generated, including defined authorization processes in relevant areas, and (iv) measures for the
more than 25 million Euro
10-25 million Euro
1-10 million Euro
less than 1 million Euro
once in more than 100 years
once in 10 to 100 years
once in 2 to 10 years
at least once within 2 years
Am
oun
t o
f lo
ss
Probability of occurrence
very low
low to medium
medium medium to high
high very high
low
—65—
proper EDP-supported processing of items and data relating to the Group’s financial accounting.
Essential elements of risk management and control in financial accounting are the unambiguous assignment of responsibility and examinations during the preparation of financial statements, transparent provisions by way of guidelines for accounting and the preparation of financial statements, appropriate regulations for access to EDP systems relevant to financial statements, and the unambiguous definition of responsibilities for the involvement of external experts. The four-eye principle and the separation of functions are also important control principles in the financial accounting process.
Summarizing the above information, it can be stated that the risk management and internal control system introduced by the Management Board of Elmos, particularly with respect to the financial accounting process, has proven efficient. Further information on the risk management system can be found in the notes to the consolidated financial statements
RISKSEconomic, political, social and regulatory risks (risk assessment: medium)The willingness of our customers to use our products depends on the current economic, financial and political general conditions. Events such as a global economic crisis, political changes, fluctuations in national currencies, a potential breakup of the euro area, a recession in Europe
or other parts of the world, a significant slowdown of growth in Asia (particularly in China), and an increase in sovereign debt could have a negative effect on the ability and willingness of our customers to use our products. Such events could weaken the demand for automobiles and thus for our semiconductors as well.
Social and political instability, for instance caused by acts of terror, war, or international conflicts, or by pandemics, natural disasters, or long-lasting strikes, could have negative effects on the respective national economy or even beyond that scope and therefore on our business, too.
Industry/Market risks (risk assessment: medium to high)Dependence on the automotive industry
The core business of Elmos is linked directly to the automotive industry’s demand or rather its suppliers’ demand for semiconductors. The majority of sales was generated with chips for automotive electronics in the past fiscal year 2015. On the one hand this demand depends on the number of cars produced, on the other hand it is governed by the lasting trend towards more electronics in the automobile. A collapse in car production and sales figures also represents a risk for Elmos as semiconductor supplier. The demand for semiconductors and sensors made by Elmos is also affected by the delivery capability of other suppliers as systems and cars can be manufactured only if all suppliers are capable of delivery.
The customer structure of Elmos indicates a certain degree of dependence on a few major suppliers to the automotive industry. However, it has to be taken into account that one customer usually purchases several products with different life cycles, often to be used for different car models, brands, and markets. By the increased commitment of Elmos to application specific standard products (ASSPs) over the past few years, this kind of customer dependence is reduced as such products can be marketed to several customers. On the other hand, the risk of replaceability increases as the competition may offer comparable products.
Competition risk
A large number of competitors in the semiconductor market for automotive applications offer products similar to the ones Elmos supplies, based on a similar technological foundation. Elmos also competes with large manufacturers for high-volume contracts and is thus exposed to corresponding pricing pressure.
Personnel risk (risk assessment: low to medium)Dependence on individual employees
The Company’s highly development-intensive business activity leads to a clearly pronounced and very specific engineering know-how but not necessarily to patents. The consequence for Elmos, as for any other technology company, is an increased dependence on individual employees.
Combined management report – Opportunities and risks
—66—
Elmos Annual Report 2015
Shortage of qualified employees
An important aspect of success in the market is the quality and availability of employees. There is the risk that qualified employees might leave the Company and no adequate replacements can be found in good time. There is also the risk that the Company might not be able to recruit qualified employees if new demand arises. This could affect the Company’s development in a negative way. Elmos has therefore intensified its commitment to find suitable applicants for staff openings in the course of the past few years. Elmos is present at recruiting events, active on the Internet, cooperates with local high schools and other institutions of education, provides informative events and scholarships for college students, and offers professional training in many technical and commercial professions.
Research and development risk (risk assessment: medium to high)The market for Elmos products is characterized by the constant advancement and improvement of products. Therefore the success of Elmos is closely related to the ability to judge market trends and technological development correctly in order to develop innovative and complex products or successors of existing products efficiently, to introduce them to the market on time, and to
see to it that these products are chosen by the customers. There is also the risk that products or entire application fields relevant to the sales of Elmos are replaced by new technologies either completely or partly so that Elmos cannot offer any competitive products in such fields anymore.
One-off development costs incurred for the customer specific development of products are usually paid for only in part by the customers. Those development costs not covered in advance must be amortized through the later volumes in series production. There is the risk that not amortized expenses for product developments that do not result in a supplier relationship will remain with the Company. Particularly with high-volume projects for which a greater number of suppliers are in competition, the customer is usually not willing to pay for development costs in advance but expects the supplier to pre-finance these expenses instead.
For product developments initiated by Elmos, e.g. all ASSPs, there are no binding customer orders so that Elmos bears the development costs. However, Elmos works together with a lead customer if possible in the development of ASSP components as well in order to increase the chances of success in the market.
The future success of Elmos also depends on the ability to develop or apply new development and production technologies. Elmos develops analog and digital semi-conductor structures and functions for its self-developed modular high-voltage CMOS process technology and also develops products applying processes provided by foundries.
If Elmos ceases to be capable of developing, manufacturing and selling new products and product upgrades in the future, significant effects on the financial, profit and economic position will likely be the result.
Financial risks (risk assessment: medium)Risks associated with financial instruments
The maximum default risk associated with the use of financial instruments in the Elmos Group is limited to the book values of the financial assets.
Investments
The allocation of financial resources to the subsidiary companies and investments results in an increased obliga-tion to detect and, if necessary, to minimize potential risks by means of adequate controlling instruments and continuous target/actual analyses at the earliest possible stages. The implemented risk management and internal control system is constantly being expanded and improved for this purpose. In addition to that, the subsidiaries and investments are subject to routine reviews.
—67—
Currency risk
Due to the international scope of business activity and the Group’s global structure, Elmos is exposed to risks and opportunities from fluctuating exchange rates. These result from operating receivables and payables, expected future cash flows from sales and costs in foreign currencies, capital expenditures, and financial transactions. For Elmos, opportunities and risks primarily result from price movements of the U.S. dollar. For controlling and containing the above-mentioned risks, Elmos applies different derivatives. Elmos also pursues the goal for the medium term to achieve a natural hedge, i.e. a balance between the inflow and outflow of foreign currency payments.
Business and operational risks (risk assessment: medium to high)Purchasing risk
The raw materials Elmos needs for manufacturing are available worldwide from different suppliers in part, yet controlled by monopolists in some cases. With regard to assembly, a certain dependence on individual Far Eastern partners is typical of the trade. Elmos has spread this risk by cooperating with several partners. The same applies for cooperation with foundries. Due to past supply bottlenecks, also typical for the industry, the commitment to regional risk distribution was intensified and the number of potential partners was increased accordingly. There is a tendency among the machine suppliers towards an oligopoly, limiting the negotiating power of Elmos.
Product liability
The products manufactured by Elmos are integrated as components into complex electronic systems. Defects or malfunctions of the semiconductors made by Elmos or of the electronic systems into which they are integrated can be directly or indirectly damaging to the property, health, or lives of third parties. In most cases Elmos cannot com-pletely exclude its liability to customers or third parties in its sales contracts.
Elmos consistently follows a zero-error strategy and con-stantly invests in the detection and avoidance of sources of error and defects. In order to minimize potential sources of error with respect to safety-relevant components for vehicles, Elmos has introduced a development process in accordance with ISO 26262 (functional safety), which has also been audited already. The semiconductor chips are tested extensively in production as well, usually in view of automotive applications, with regard to quality and functionality. Even though the Company applies elaborate test procedures before commencing delivery of its products, product defects might still show only on the occasion of installation or the end consumer’s use of the product. If such product defects materialize, expensive and time-consuming product modifications might ensue and further liability claims might be raised.
Legal risk
At present there are no legal disputes whose outcome might have a material effect on the financial, profit and economic position. However, it cannot be ruled out that it might come to such litigations in the future. Legal disputes might arise from business operations or in matters of property rights or trademarks. Depending on risk assessment, adequate provisions are made for legal risks in the statement of financial position as a preventive measure; recognition and measurement find entry in the consolidated financial statements in accordance with IAS 37. As the results of lawsuits cannot be predicted, expenses may incur that might have a material effect on our business and might exceed the respective provisions made.
Information technology risk
For Elmos as for other globally operating companies, the reliability and safety of the information technology (IT) applied are of great importance. This applies increasingly to the utilization of IT systems in support of operational processes as well as to the support of internal and external communication. Despite all technical precaution, any serious failure of these systems can lead to data loss and/or the disturbance of production or the interference with operational processes.
Combined management report – Opportunities and risks
—68—
Elmos Annual Report 2015
Business interruption
According to the assessment of Elmos, the risk of the destruction of production facilities by fire or other disasters is a material operational risk capable of significantly damaging the development of the Group and jeopardizing the Company’s continued existence, in addition to the operational risks already described and explained. Even though the risk of business interruption by such events is adequately covered by insurance, a significant threat of losing key customers remains in such a case. This risk cannot be insured against.
Business interruption could also occur as a result of power outage. The production facilities are prepared for short-term power failures as far as possible. The risk of business interruption is reduced by the fact that Elmos manufactures semiconductors at various locations. Furthermore, Elmos obtains processed wafers from foundries.
The usual insurable risks such as fire, water, storm, theft, third-party liability, and costs of a possible recall action are adequately covered by insurance. However, it cannot be ruled out that the costs of a potential recall might exceed the maximum amount covered. Further typically insurable risks capable of significantly damaging the development of the Group or jeopardizing its continued existence are not discernable at present.
MANAGEMENT’S OVERALL ASSESSMENT OF RISKS Elmos consolidates and aggregates all risks reported by the various Company divisions and functions in accordance with the Group-wide control and risk management system. Risks are analyzed by applying state-of-the-art analysis technology; however, individual risks might cause considerable damage in extreme cases. Such a scenario is neither foreseeable nor can it be ruled out. Apart from that it must be noted that the occurrence of an individual risk might have material negative effects on the Company’s financial, profit and economic position even without escalating to extremes.
The above-mentioned risks are assessed by management for potential amounts of loss and probability of occurrence according to the respective risk category as stated. It must be stated that some categories contain risks that pose potential threats to the Company’s continued existence; however, those risks usually carry a relatively low probability of occurrence. As a consequence, no individual risks are currently assessed as belonging to the categories for both the highest amount of loss and the highest probability of occurrence (i.e. no risk assessment as “very high”).
—69—
Elmos has an
efficient risk
management and
control system.
Combined management report – Opportunities and risks
—70—
Elmos Annual Report 2015
ECONOMIC AND INDUSTRY SPECIFIC FRAMEWORKThe International Monetary Fund (IMF) sees the world economy exposed to great challenges in 2016. Therefore the IMF has reduced its 2016 forecast to 3.4% growth (as of January 2016). This is 0.2% points less than still assumed in October 2015. Expectations for growth seem to be sagging, according to the IMF’s chief economist. Currently the IMF sees the largest risks for growth in the economic development of China, the tightening monetary policy in the U.S.A. combined with a strong U.S. dollar, and in a possible escalation of the existing geopolitical tensions.
Especially the slowdown in China’s economic growth strongly affects prospects. The IMF assumes dropping growth rates for the Chinese economy from 7.4% in 2014 and 6.9% in 2015 to 6.3% in 2016.
Both IMF and the Bundesbank anticipate a positive development for Germany. The Fund expects 1.7% growth in Germany. This indicates a slightly faster growth compared to the previous forecast. The Bundesbank predicts similar growth at an increased economic output of 1.8% compared to the previous year and also additional potential: In the course of the year 2016 the German economy might pick up even more speed, according to the Bundesbank in December 2015.
PREDICTED MARKET DEVELOPMENT
Performance of gross domestic product1 2016 forecast
Worldwide +3.4%
Europe +1.7%
Germany +1.7%
China +6.3%
U.S.A. +2.6%
Development of new car registrations
Worldwide2 +2%
Europe3 +2%
Germany2 0%
China4 +5.4%
U.S.A.2 +1%
Performance of automotive semiconductor market5 ø2016-2021
Worldwide (average in the period from 2016 to 2021) +4.5%
1 Source: IWF2 Source: VDA3 Source: ACEA4 Source: IHS 5 Source: ZVEI
For the global automotive market in 2016, the German Association of the Automotive Industry (VDA; German: Verband der Automobilindustrie) anticipates little growth of 2% to 78.1 million new registrations. The fight against terror, the economic risks in emerging countries such as Russia and Brazil, and the political tensions in the Middle East darken the moods of the carmakers, according to the VDA.
No growth is predicted for the car market in Germany in 2016. Both Central Association of the German Automobile Industry as well as VDA anticipate 3.2 million new car
registrations for 2016 (2015: 3.2 million new registrations). For Europe, European manufacturers‘ association ACEA (French: Association des Constructeurs Européens d'Auto-mobiles) expects an increase in new registrations by 2% to roughly 14 million vehicles. As reasons for this little growth, the association cites e.g. the weak economic activity in the region and concerns for security. Especially in the major Western European markets such as Spain, Great Britain, France, and Italy, growth is supposed to slow down.
The market research company IHS (Information Handling Services) anticipates a 5.4% gain in new registrations for China. This forecast falls significantly short of the increase achieved in 2015 at about 9%.
Due to the high level of new registrations in the U.S.A. of some 17.4 million light vehicles in 2015, the VDA assumes a saturated market for 2016 and expects a low increase by 1% to 17.5 million new vehicles.
The uncertainty with respect to the global semiconductor market in 2016 is high. This reflects in the margin of available forecasts. According to the market research company IHS Technology, the market is supposed to shrink by 0.4%. The German Electrical and Electronic Manufacturers' Association (ZVEI; German: Zentralverband Elektrotechnik- und Elektronikindustrie), however, assumes an increase in the worldwide semiconductor market of roughly 2%.
Outlook
—71—
With respect to the product categories, some memory types are expected to record losses of more than 9%, according to IHS; microprocessors are supposed to register a sales loss in excess of 5% in 2016 compared to 2015. The market researchers anticipate a positive trend for optical components (+3.8%), analog ICs (+3.4%), and sensors (+2.8%).
For the worldwide automotive semiconductor market, the ZVEI expects an average annual growth of roughly 4.5% for the next five years. Today innovation in carmaking usually is not based on automobile technology anymore but driven to 80% by microelectronics and software, according to the ZVEI.
The market researchers of IHS expect the market for automotive MEMS to increase at an average annual growth rate of 3.4% over the period from 2014 to 2021, according to a survey of June 2015.
STRATEGYWe want to achieve profitable growth throughout our entire product portfolio. As in the previous years, the emphasis is placed on the long-term increase in sales, EBIT, and (adjusted) free cash flow. Customer relationships of many years solidly based on trust provide the foundation of our business performance. Partnerships with new customers are intended to open additional opportunities.
We will continue our strategy for long-term profitable growth in 2016:
-> We want to seize our opportunities on an international scale. The foundation for this plan are new and existing products that stimulate our business in the context of the global megatrends. We will introduce these products in our home market Europe, in Asia, the U.S.A., as well as other international markets.
-> Based on the three product lines, Elmos will present innovative solutions to the market. The goal is to take the leading position in the market if possible. Application specific components (ASSPs) are increasingly in focus and will account for a growing share in sales. We will push the development of new products in all three product lines with great commitment.
-> We will target the analysis of optimization potential in our production and our processes and implement improvements. We will also continuously extend our fab lite strategy together with partners.
-> Elmos seeks to strengthen its financial basis even further. Sales, EBIT, capital expenditures and (adjusted) free cash flow are therefore of the highest importance as Group-wide control indicators. The focus is also on the participation of the shareholders in the Company’s success.
-> We want our employees to develop themselves professionally and personally and to have input in a corporate culture oriented towards performance and development. We also want to recruit new young professionals so that we will remain capable of applying our know-how in all areas and enhancing it.
OPERATIONAL TARGETS 2016Targets for sales and earnings Based on currently available information, the Manage-ment Board presents the following outlook for the full year 2016. The forecasts for the automotive market in Germany and Europe as a whole are modest: No or little growth is expected. And only little growth or rather a considerable slowdown in growth is predicted for other important regional markets such as the U.S.A. or China.
Even though we regard the medium and long-term growth prospects for automotive electronics as positive and market dynamics still as high, the year 2016 is dominated by difficult signals. The Asian markets, particularly China, the political developments in the Middle East, and the exchange rates and the responses of the central banks remain determining factors. These prospects influence our sales forecast for 2016.
Combined management report – Outlook
—72—
Elmos Annual Report 2015
Based on internal and external assessments of the market, Elmos expects the following results for sales and EBIT margin.
Elmos expects an increase in sales in 2016 of 2% to 6% compared to 2015. We also assume we will be able to further expand the strength of business operations. However, heavier burdens by the currently stronger U.S. dollar than in the previous year will have a negative effect on our earnings. In addition to that, the volume increase necessary for realizing efficiency gains will be relatively low in 2016. We therefore anticipate an EBIT margin of roughly 10% for 2016.
The two segments Semiconductor and Micromechanics will make contributions to the increase in sales and EBIT in a similar way.
Targets for capital expendituresDue to the focus on the increasing implementation of the fab lite strategy over the past few years, a significant expansion of in-house frontend capacity is not on the agenda for the time being. This will lead to lower capital expenditures in this area than in previous years so that capital expenditures for intangible assets and property, plant and equipment are expected to come to no more than 12% of sales in 2016, as compared to the previous target of up to 15% of sales. Capital expenditures will concern both segments.
Targets for liquidity and finance We expect Elmos to generate a positive adjusted free cash flow in 2016 once again.
Dividend targetsFree liquidity is scheduled to be utilized in part for the payment of a dividend. Supervisory Board and Management Board will propose to the Annual General Meeting in May 2016 the payment of a dividend, constant in comparison with the previous year, in the amount of 0.33 Euro per share.
FORECAST 2016
2016 sales growth (vs. 2015) 2% to 6%
EBIT margin (in % of sales) Roughly 10%
Capital expenditures (in % of sales) < 12%
Adjusted free cash flow Positive
Underlying assumptions of our forecastsUnder the condition of an essentially unchanged general economic framework, it is expected that Elmos will show modest growth in the automotive semiconductor market in 2016. Electrification will continue in this market even if it stagnates. A positive development for Elmos is based on the success of our current and future customers as well as on our ability to sell our products to them. The international competition among suppliers to the auto industry is subject to ever increasing intensification. Effects from resulting market shifts or portfolio changes at our customers can hardly be predicted.
Our forecasts consider all events with a potential material effect on the business performance of the Elmos Group known at the time of the preparation of this report. The outlook is based among other factors on the assumptions for the economic development as described as well as the remarks included in the report on opportunities and risks. Expectations can be affected by market turbulence. The forecast is based on an exchange rate of 1.10 USD/EUR.
—73—
DISCLOSURES PURSUANT TO TAKEOVER LAWIn this chapter, information required by takeover law as stipulated under Sections 289 (4), 315 (4) HGB (Commercial Code) is disclosed as of December 31, 2015 (also representing the explanatory report in accordance with Section 176 (1) sentence 1 AktG (Stock Corporation Act)).
Composition of subscribed capitalAs of December 31, 2015 the subscribed capital (share capital) of Elmos amounted to 19,941,864 Euro and was comprised of 19,941,864 no-par value bearer shares with a theoretical share in the share capital of 1 Euro each. Each share carries the same rights and grants one vote in the General Meeting. As of December 31, 2015 the Company held 214,587 treasury shares included in the above-mentioned total number of issued shares. Treasury shares held by the Company on the day of the Annual General Meeting (AGM) are neither entitled to vote nor entitled to dividend.
Limitations with regard to voting rights or the transfer of shares We are not aware of any contractual limitations with regard to voting rights or the transfer of shares.
Shareholdings in excess of 10% of the voting rightsThe following shareholdings are on record as of December 31, 2015:
SHAREHOLDERS OF THE COMPANY
Entity’s registered office/country Euro/Shares %
Weyer Beteiligungsgesellschaft mbH
Schwerte/Germany 3,626,584 18.19
Jumakos Beteiligungsgesellschaft mbH
Dortmund/Germany 2,983,600 14.96
ZOE-VVG GmbH
Duisburg/Germany 2,306,833 11.57
Treasury shares 214,587 1.08
Shareholders <10% interest 10,810,260 54.21
19,941,864 100.00
More information on shareholder structure can be found in this Annual Report in the chapter “The Elmos share” starting on page 34.
Shares with special rights conferring powers of control Shares with special rights conferring powers of control have not been issued.
Form of voting rights control in case of employee shareholdings Employees who hold shares in Elmos Semiconductor AG exercise their control rights just like other shareholders directly in accordance with legal stipulations and the Articles of Incorporation.
Legal stipulations and provisions of the articles of incorpo-ration for the appointment and dismissal of management board members and for amendments to the articles We refer to the respective legal stipulations for the appointment and dismissal of management board
members (Sections 84, 85 AktG) and for amendments to the articles of incorporation (Sections 133, 179 AktG). The Company’s Articles of Incorporation do not provide for supplementary provisions.
The management board’s authorization to issue shares The Management Board is authorized to increase the Company's share capital up to and including May 16, 2016, subject to the Supervisory Board’s consent, by up to 9,707,100 Euro, once or more than once, through the issue of new no-par value bearer shares against contributions in cash or in kind (authorized capital 2011/I). If the capi-tal is increased against contributions in cash, subscription rights shall be granted to the shareholders. The shares may be taken over by banks under the obligation to offer them to the shareholders for subscription. However, the Management Board is authorized to exclude the share-holders’ subscription rights, subject to the Supervisory Board’s approval. The total of the shares issued accord-ing to this authorization against contributions in cash or in kind under exclusion of the shareholders’ subscription rights must not exceed a proportionate amount of the share capital of 4,853,551 Euro. The Management Board is further authorized to determine all other rights attached to the shares as well as the particulars of the issue, subject to the Supervisory Board’s consent.
The share capital is conditionally increased by up to 33,720 Euro (conditional capital 2009). The conditional capital increase serves the redemption of stock options issued to employees, executives and Management Board members
Legal information
Combined management report – Outlook /Legal information
—74—
Elmos Annual Report 2015
of the Company as well as to employees and executives of affiliated companies up to and including May 5, 2014 on the basis of the authorization given by the AGM of May 6, 2009 (stock option plan 2009). The conditional capital increase is realized only insofar as options are issued within the scope of the Company’s stock option plan 2009 in observance of the resolution of the AGM of May 6, 2009 and as these options are exercised by their owners within the exercise period insofar as no cash compensation is granted or treasury shares are utilized for payment. The new shares are entitled to dividend from the beginning of the fiscal year in which they come into being by the exercise of options.
The share capital is conditionally increased by up to 665,198 Euro (conditional capital 2010/I). The conditional capital increase serves the redemption of stock options issued to employees, executives and Management Board members of the Company as well as to employees and executives of affiliated companies up to and including May 3, 2015 on the basis of the authorization given by the AGM of May 4, 2010 (stock option plan 2010). The conditional capital increase is realized only insofar as options are issued within the scope of the Company’s stock option plan 2010 in observance of the resolution of the AGM of May 4, 2010 and as these options are exercised by their owners within the exercise period insofar as no cash compensation is granted or treasury shares are utilized for payment. The new shares are entitled to
dividend from the beginning of the fiscal year in which they come into being by the exercise of options.
The share capital is conditionally increased by up to 1,200,000 Euro (conditional capital 2015/I). The conditional capital increase serves the redemption of stock options issued to employees, executives and Management Board members of the Company as well as to employees and executives of affiliated companies up to and including May 7, 2020 on the basis of the authorization given by the AGM of May 8, 2015 (stock option plan 2015). The conditional capital increase is realized only insofar as options are issued within the scope of the Company’s stock option plan 2015 in observance of the resolution of the AGM of May 8, 2015 and as these options are exercised by their owners within the exercise period insofar as no cash compensation is granted or treasury shares are utilized for payment. The new shares are entitled to dividend from the beginning of the fiscal year in which they come into being by the exercise of options. Deviating from this, the Management Board or, insofar as members of the Management Board are concerned, the Supervisory Board may determine that the new shares are entitled to dividend from the beginning of the fiscal year for which no resolution by the AGM on the appropriation of retained earnings has been adopted yet at the time of exercising stock options.
Further information can be found under notes 22 and 23.
The management board’s authorization to issue con-vertible bonds and option bonds The share capital is conditionally increased by up to 7,800,000 Euro (conditional capital 2015/II). The conditional capital increase is carried out only to the extent that the holders or creditors of convertible bonds or subscription warrants from option bonds, issued by Elmos or one of the Company’s group companies within the meaning of Section 18 AktG until May 7, 2020 on the basis of the Management Board’s authorization by the AGM of May 8, 2015 under agenda item 7, make use of their conversion or option privileges or fulfill their conversion obligations, or shares are supplied under tender rights unless other forms of performance are utilized for servicing. The new shares are issued at the conversion or option prices to be determined respectively in the terms and conditions of the convertible bonds or option bonds in accordance with the above-mentioned authorization resolution. The new shares are entitled to dividend from the beginning of the fiscal year in which they come into being by the exercise of conversion or option privileges or the fulfillment of conversion obligations. Deviating from this, the Management Board may determine that the new shares are entitled to dividend from the beginning of the fiscal year for which no resolution by the AGM on the appropriation of retained earnings has been adopted yet at the time of exercising conversion or option privileges or fulfilling conversion obligations, subject to the Supervisory Board’s consent. The Management
—75—
Board is authorized to determine the further particulars of the implementation of the conditional capital increase, subject to the Supervisory Board’s consent.
More information can be found under note 22.
The management board’s authorization to buy back sharesThe Management Board is authorized by the AGM’s resolution of May 8, 2015 to purchase the Company’s shares up to and including May 7, 2020, subject to the Supervisory Board’s consent. This authorization is limited to the purchase of shares in the total volume of up to 10% of the current share capital. The authorization may be exercised entirely or in several parts, once or more than once, and for one or more than one purpose within the scope of the aforementioned limitation. The purchase may be made at the stock exchange or through a public purchase bid tendered to all shareholders of the Company, or through purchasing from individual shareholders based on individual agreements, yet not from Weyer Beteiligungsgesellschaft mbH, ZOE-VVG GmbH, Jumakos Beteiligungsgesellschaft mbH, or other reportable enti-ties or persons in accordance with Section 15a WpHG (Securities Trading Act). The authorization contains differ-entiating requirements for the separate purchase types, particularly with respect to the admissible purchase price.
AUTHORIZATIONS OF THE MANAGEMENT BOARD
Authorized capital
Conditional capital
Repurchase of the Company’s shares
2011/I: 9,707,100 Euroup to and including May 16, 2016
2009: 33,720 Euro stock option plan 2009up to and including May 5, 2014
2010/I: 665,198 Eurostock option plan 2010up to and including May 3, 2015
2015/I:1,200,000 Eurostock option plan 2015up to and including May 7, 2020
2015/II:7,800,000 EuroOption bonds or convertible bondsUp to and including May 7, 2020
up to 10% of the share capital up to and includingMay 7, 2020
Material agreements on the condition of a change of control as a result of a takeover bid There are no material agreements on the condition of a change of control as a result of a takeover bid.
Compensation agreements in case of a takeover bidIn case of a change of control, the members of the Manage-ment Board are entitled to terminate their respective employment contracts within three months from the
occurrence of a change of control with six-month notice to the end of the month and to resign from their duties as of the termination of their employment contracts. In case of the exercise of this right of termination, each Management Board member is entitled to compensation in the amount of the remuneration for two to three years, limited by the amount of the remuneration to be paid for the remaining term of the respective employment contract. Applicable is the remuneration amount paid during the last fiscal year prior to the occurrence of the change of control. The Company is also committed to compensation payments for the post-termination effects of non-competition clauses. In some cases provisions also govern the exercise of options and retirement provision in case of a change of control. REMUNERATION REPORT Total remuneration of the members of Management Board and Supervisory Board comprises a number of remuneration components. The details are explained in the remuneration report included in the corporate governance report, starting on page 26 of this Annual Report. The remuneration report, audited by the auditor, is part of the joint management report.
STATEMENT ON CORPORATE GOVERNANCE The statement on corporate governance pursuant to Section 289a HGB is part of the joint management report and can be found in the chapter “Corporate Governance” on page 27.
Combined management report – Legal information
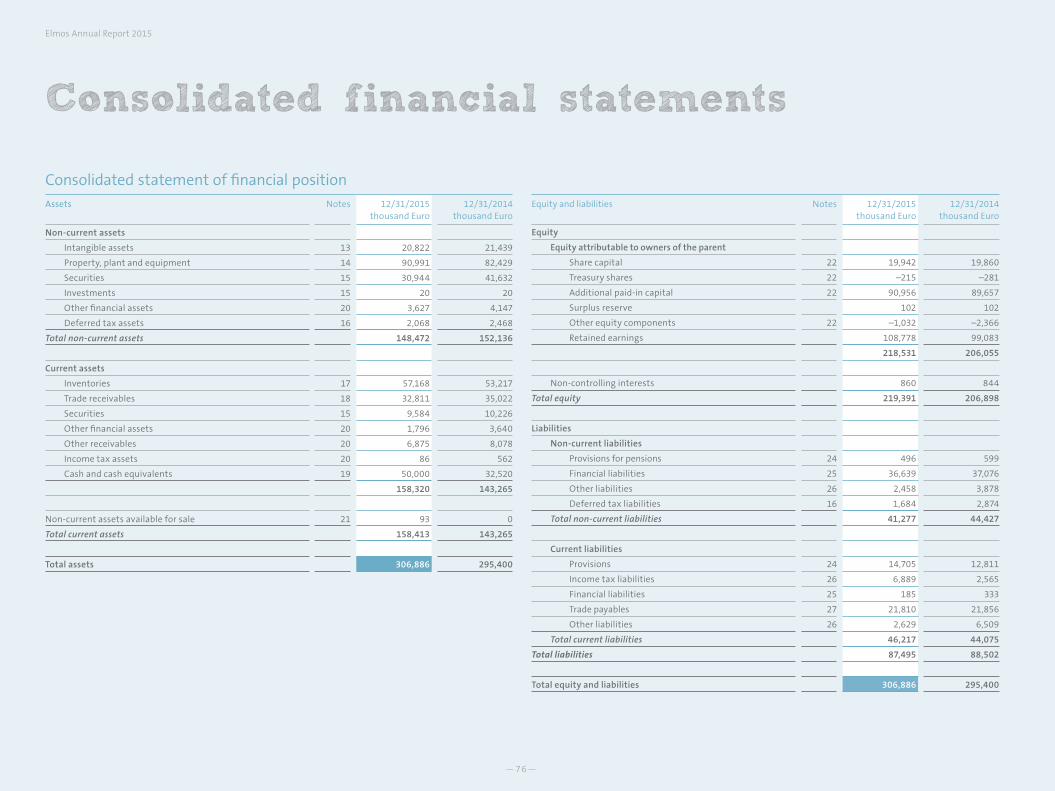
—76—
Elmos Annual Report 2015
Consolidated statement of financial positionAssets Notes 12/31/2015
thousand Euro12/31/2014
thousand Euro
Non-current assets
Intangible assets 13 20,822 21,439
Property, plant and equipment 14 90,991 82,429
Securities 15 30,944 41,632
Investments 15 20 20
Other financial assets 20 3,627 4,147
Deferred tax assets 16 2,068 2,468
Total non-current assets 148,472 152,136
Current assets
Inventories 17 57,168 53,217
Trade receivables 18 32,811 35,022
Securities 15 9,584 10,226
Other financial assets 20 1,796 3,640
Other receivables 20 6,875 8,078
Income tax assets 20 86 562
Cash and cash equivalents 19 50,000 32,520
158,320 143,265
Non-current assets available for sale 21 93 0
Total current assets 158,413 143,265
Total assets 306,886 295,400
Equity and liabilities Notes 12/31/2015thousand Euro
12/31/2014thousand Euro
Equity
Equity attributable to owners of the parent
Share capital 22 19,942 19,860
Treasury shares 22 –215 –281
Additional paid-in capital 22 90,956 89,657
Surplus reserve 102 102
Other equity components 22 –1,032 –2,366
Retained earnings 108,778 99,083
218,531 206,055
Non-controlling interests 860 844
Total equity 219,391 206,898
Liabilities
Non-current liabilities
Provisions for pensions 24 496 599
Financial liabilities 25 36,639 37,076
Other liabilities 26 2,458 3,878
Deferred tax liabilities 16 1,684 2,874
Total non-current liabilities 41,277 44,427
Current liabilities
Provisions 24 14,705 12,811
Income tax liabilities 26 6,889 2,565
Financial liabilities 25 185 333
Trade payables 27 21,810 21,856
Other liabilities 26 2,629 6,509
Total current liabilities 46,217 44,075
Total liabilities 87,495 88,502
Total equity and liabilities 306,886 295,400
Consolidated financial statements
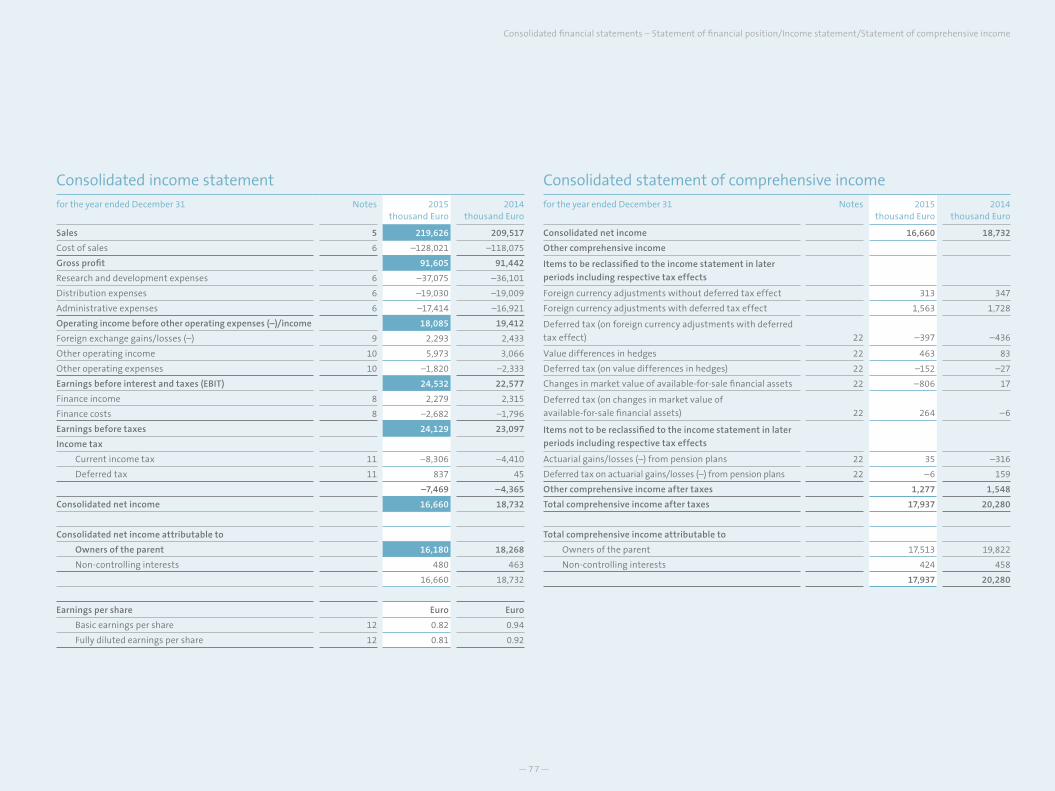
—77—
Consolidated financial statements – Statement of financial position/Income statement/Statement of comprehensive income
Consolidated income statementfor the year ended December 31 Notes 2015
thousand Euro2014
thousand Euro
Sales 5 219,626 209,517
Cost of sales 6 –128,021 –118,075
Gross profit 91,605 91,442
Research and development expenses 6 –37,075 –36,101
Distribution expenses 6 –19,030 –19,009
Administrative expenses 6 –17,414 –16,921
Operating income before other operating expenses (–)/income 18,085 19,412
Foreign exchange gains/losses (–) 9 2,293 2,433
Other operating income 10 5,973 3,066
Other operating expenses 10 –1,820 –2,333
Earnings before interest and taxes (EBIT) 24,532 22,577
Finance income 8 2,279 2,315
Finance costs 8 –2,682 –1,796
Earnings before taxes 24,129 23,097
Income tax
Current income tax 11 –8,306 –4,410
Deferred tax 11 837 45
–7,469 –4,365
Consolidated net income 16,660 18,732
Consolidated net income attributable to
Owners of the parent 16,180 18,268
Non-controlling interests 480 463
16,660 18,732
Earnings per share Euro Euro
Basic earnings per share 12 0.82 0.94
Fully diluted earnings per share 12 0.81 0.92
Consolidated statement of comprehensive incomefor the year ended December 31 Notes 2015
thousand Euro2014
thousand Euro
Consolidated net income 16,660 18,732
Other comprehensive income
Items to be reclassified to the income statement in later
periods including respective tax effects
Foreign currency adjustments without deferred tax effect 313 347
Foreign currency adjustments with deferred tax effect 1,563 1,728
Deferred tax (on foreign currency adjustments with deferred
tax effect) 22 –397 –436
Value differences in hedges 22 463 83
Deferred tax (on value differences in hedges) 22 –152 –27
Changes in market value of available-for-sale financial assets 22 –806 17
Deferred tax (on changes in market value of
available-for-sale financial assets) 22 264 –6
Items not to be reclassified to the income statement in later
periods including respective tax effects
Actuarial gains/losses (–) from pension plans 22 35 –316
Deferred tax on actuarial gains/losses (–) from pension plans 22 –6 159
Other comprehensive income after taxes 1,277 1,548
Total comprehensive income after taxes 17,937 20,280
Total comprehensive income attributable to
Owners of the parent 17,513 19,822
Non-controlling interests 424 458
17,937 20,280
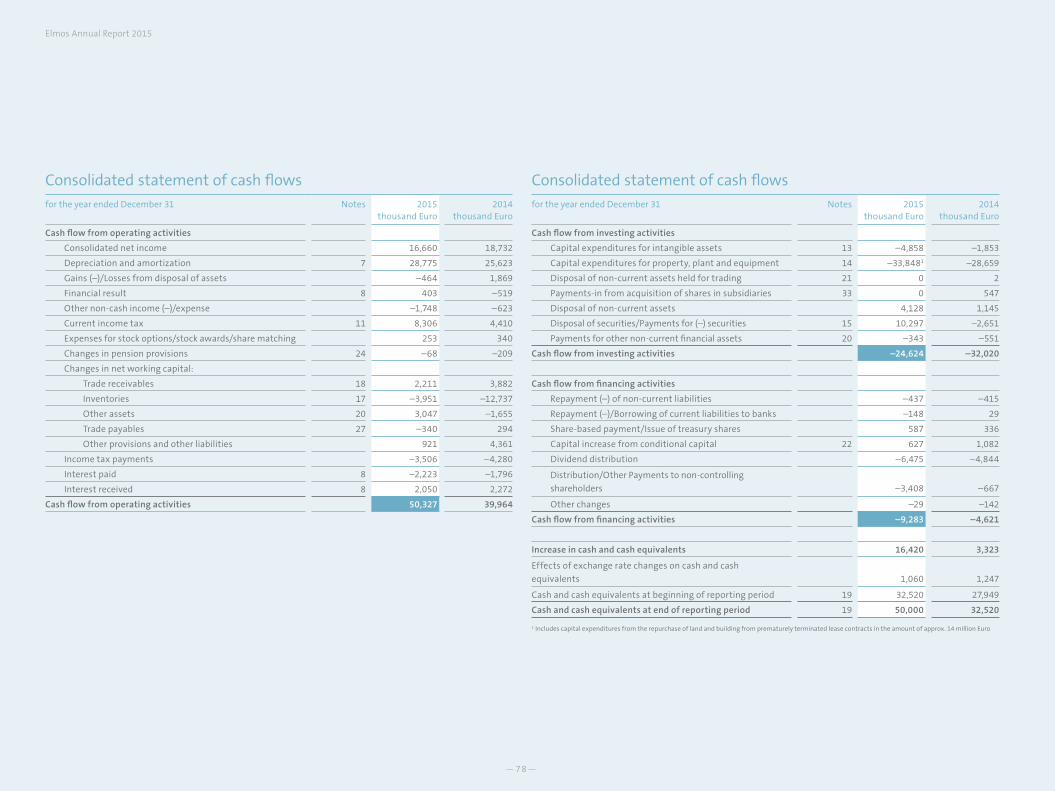
—78—
Elmos Annual Report 2015
Consolidated statement of cash flowsfor the year ended December 31 Notes 2015
thousand Euro2014
thousand Euro
Cash flow from operating activities
Consolidated net income 16,660 18,732
Depreciation and amortization 7 28,775 25,623
Gains (–)/Losses from disposal of assets –464 1,869
Financial result 8 403 –519
Other non-cash income (–)/expense –1,748 –623
Current income tax 11 8,306 4,410
Expenses for stock options/stock awards/share matching 253 340
Changes in pension provisions 24 –68 –209
Changes in net working capital:
Trade receivables 18 2,211 3,882
Inventories 17 –3,951 –12,737
Other assets 20 3,047 –1,655
Trade payables 27 –340 294
Other provisions and other liabilities 921 4,361
Income tax payments –3,506 –4,280
Interest paid 8 –2,223 –1,796
Interest received 8 2,050 2,272
Cash flow from operating activities 50,327 39,964
Consolidated statement of cash flowsfor the year ended December 31 Notes 2015
thousand Euro2014
thousand Euro
Cash flow from investing activities
Capital expenditures for intangible assets 13 –4,858 –1,853
Capital expenditures for property, plant and equipment 14 –33,8481 –28,659
Disposal of non-current assets held for trading 21 0 2
Payments-in from acquisition of shares in subsidiaries 33 0 547
Disposal of non-current assets 4,128 1,145
Disposal of securities/Payments for (–) securities 15 10,297 –2,651
Payments for other non-current financial assets 20 –343 –551
Cash flow from investing activities –24,624 –32,020
Cash flow from financing activities
Repayment (–) of non-current liabilities –437 –415
Repayment (–)/Borrowing of current liabilities to banks –148 29
Share-based payment/Issue of treasury shares 587 336
Capital increase from conditional capital 22 627 1,082
Dividend distribution –6,475 –4,844
Distribution/Other Payments to non-controlling
shareholders –3,408 –667
Other changes –29 –142
Cash flow from financing activities –9,283 –4,621
Increase in cash and cash equivalents 16,420 3,323
Effects of exchange rate changes on cash and cash
equivalents 1,060 1,247
Cash and cash equivalents at beginning of reporting period 19 32,520 27,949
Cash and cash equivalents at end of reporting period 19 50,000 32,520
1 Includes capital expenditures from the repurchase of land and building from prematurely terminated lease contracts in the amount of approx. 14 million Euro
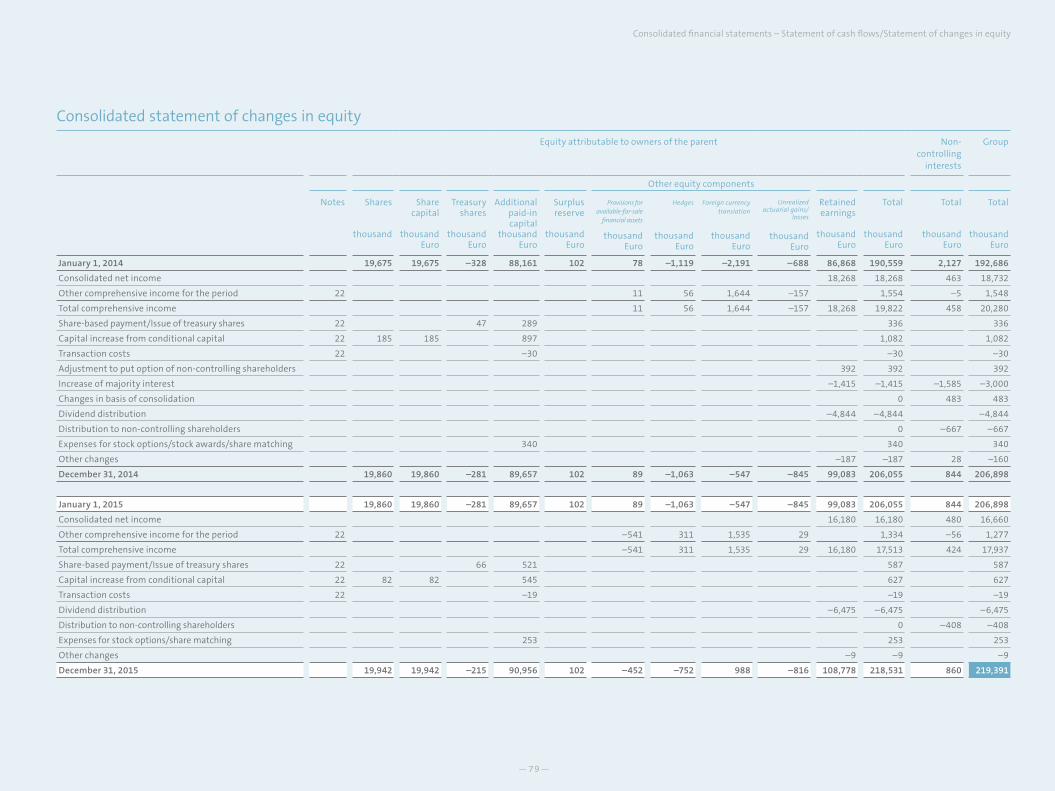
—79—
Consolidated statement of changes in equity
Equity attributable to owners of the parent Non-controlling
interests
Group
Other equity components
Notes Shares
thousand
Share capital
thousand
Euro
Treasury shares
thousand
Euro
Additional paid-in capital
thousand Euro
Surplus reserve
thousand Euro
Provisions for available-for-sale
financial assets
thousand Euro
Hedges
thousand Euro
Foreign currency translation
thousand Euro
Unrealized actuarial gains/
losses
thousand Euro
Retained earnings
thousand Euro
Total
thousand Euro
Total
thousand Euro
Total
thousand Euro
January 1, 2014 19,675 19,675 –328 88,161 102 78 –1,119 –2,191 –688 86,868 190,559 2,127 192,686
Consolidated net income 18,268 18,268 463 18,732
Other comprehensive income for the period 22 11 56 1,644 –157 1,554 –5 1,548
Total comprehensive income 11 56 1,644 –157 18,268 19,822 458 20,280
Share-based payment/Issue of treasury shares 22 47 289 336 336
Capital increase from conditional capital 22 185 185 897 1,082 1,082
Transaction costs 22 –30 –30 –30
Adjustment to put option of non-controlling shareholders 392 392 392
Increase of majority interest –1,415 –1,415 –1,585 –3,000
Changes in basis of consolidation 0 483 483
Dividend distribution –4,844 –4,844 –4,844
Distribution to non-controlling shareholders 0 –667 –667
Expenses for stock options/stock awards/share matching 340 340 340
Other changes –187 –187 28 –160
December 31, 2014 19,860 19,860 –281 89,657 102 89 –1,063 –547 –845 99,083 206,055 844 206,898
January 1, 2015 19,860 19,860 –281 89,657 102 89 –1,063 –547 –845 99,083 206,055 844 206,898
Consolidated net income 16,180 16,180 480 16,660
Other comprehensive income for the period 22 –541 311 1,535 29 1,334 –56 1,277
Total comprehensive income –541 311 1,535 29 16,180 17,513 424 17,937
Share-based payment/Issue of treasury shares 22 66 521 587 587
Capital increase from conditional capital 22 82 82 545 627 627
Transaction costs 22 –19 –19 –19
Dividend distribution –6,475 –6,475 –6,475
Distribution to non-controlling shareholders 0 –408 –408
Expenses for stock options/share matching 253 253 253
Other changes –9 –9 –9
December 31, 2015 19,942 19,942 –215 90,956 102 –452 –752 988 –816 108,778 218,531 860 219,391
Consolidated financial statements – Statement of cash flows/Statement of changes in equity
—80—
Elmos Annual Report 2015
GENERAL INFORMATION
Elmos Semiconductor AG (“the Group”, “the Company”, or “Elmos”) has its registered office
in Dortmund (Germany) and is entered in the register of companies kept at the District Court
(Amtsgericht) Dortmund, section B, under no. 13698. The Articles of Incorporation are in effect in
the version of March 26, 1999, last amended by resolution of the Annual General Meeting of May 8,
2015 and edited by resolution of the Supervisory Board of December 18, 2015.
The Company’s business is the development, manufacture and distribution of microelectronic
components and system parts (application specific integrated circuits or, in short: ASICs, and
application specific standard products or, in short: ASSPs) and technological devices with similar
functions. The Company may conduct all transactions suitable for serving the object of the
business directly or indirectly. The Company is authorized to establish branches, acquire or lease
businesses of the same or a similar kind or invest in them, and conduct all business transactions
that are beneficial to the Articles of Association. The Company is authorized to conduct business in
Germany as well as abroad.
In addition to its domestic branches, the Company maintains sales companies and locations in
Europe, Asia, South Africa and the U.S.A. and cooperates with other German and international
companies in the development and manufacture of semiconductor chips.
The Company is a listed stock corporation and its shares are traded in the Prime Standard in
Frankfurt/Main.
The address of the Company’s registered office is:
44227 Dortmund/Germany, Heinrich-Hertz-Straße 1.
ACCOUNTING POLICIES
1 – Principles of financial accounting
General information
The consolidated financial statements have been prepared in Euro. Values stated in “thousand
Euro” have been rounded up or down to thousand Euro according to financial rounding.
The consolidated financial statements of Elmos have been prepared in accordance with the
International Financial Reporting Standards (IFRS) as applicable in the European Union (EU) and
the supplementary applicable regulations of German commercial law as stipulated by Section
315a (1) HGB (Commercial Code). All of the IFRS released by the International Accounting Standards
Board (IASB) in effect at the time of the preparation of the consolidated financial statements and
applied by Elmos were endorsed by the European Commission for adoption in the EU.
The consolidated statement of financial position, the consolidated income statement, and the con-
solidated statement of comprehensive income have been prepared according to IAS 1 “Presentation of
Financial Statements”. Individual items have been summarized for improved clarity; those items are
explained in the notes.
The consolidated financial statements have been released for publication by the Management
Board in March 2016.
Estimates and assumptions
The most important forward-looking assumptions as well as other material sources of estimate
uncertainty identified as of the end of the reporting period on the basis of which there is a considerable
risk that a material adjustment of the book values of assets and liabilities will become necessary
within the next fiscal year are explained in the following. Beyond the scope of the areas described
below, assumptions and estimates are also necessary for valuation allowances for bad debt as well as
for contingent liabilities and other provisions. In accordance with IAS 8 – Accounting Policies, Changes
in Accounting Estimates and Errors, changes in estimates are recognized in profit or loss as of the
date on which new information becomes available. Changes in estimates did not result in material
consequences in the reporting period nor are such effects expected for future reporting periods.
Notes to the consolidated financial statements
—81—
Impairment of goodwill
The Group reviews goodwill for impairment at least once a year. This requires an estimate of the
values in use of the cash-generating units goodwill is allocated to. For an assessment of the value
in use, the Company’s management has to estimate the respective cash-generating unit’s probable
future cash flows and also choose an adequate discount rate in order to determine the net present
value of these cash flows.
With respect to the assumptions on the basis of which the value in use is determined, uncertainties
of estimates especially relate to gross margins and discount rates. Gross margins have been
estimated on the basis of historical values of past years in consideration of expected changes in
demand and increases in efficiency. Discount rates reflect current market assessments and have
been estimated on the basis of customary weighted average cost of capital.
More details can be found under notes 3 and 13.
Deferred tax assets
Deferred tax assets are recognized for all unutilized tax loss carry-forward to the extent it appears
probable that taxable income will be available so that loss carry-forward can in fact be utilized. For
the determination of the amount of deferred tax assets, a material discretionary decision made by
the Company’s management is required, based on the expected time of occurrence and the amount
of taxable future income as well as future tax planning strategies. More details can be found under
note 16.
Pension commitments
Expenses for defined benefit pension plans are determined according to actuarial calculations. The
actuarial evaluation is made on the basis of assumptions with regard to discount rates, expected
returns on pension plan assets, future raises of wages and salaries, mortality, and increased future
retirement pensions. Due to the long-term orientation of those plans, such estimates are subject to
material uncertainty. More details can be found under note 24.
Development expenses
Development expenses are capitalized in accordance with the accounting policies and valuation
methods described under note 3 at the best possible estimates. More details can be found under
note 13.
New and amended standards and interpretations
The accounting policies applied generally correspond to the policies applied in the previous year.
Exceptions were the following standards subject to first-time mandatory application for fiscal year
2015.
IFRIC 21 – Levies
With IFRIC 21 – Levies, the IASB issued an interpretation of IAS 37 – Provisions, Contingent Liabilities and
Contingent Assets in May 2013. This interpretation governs the accounting treatment of public levies
that are not income taxes in accordance with IAS 12 and particularly clarifies the circumstances
under which an obligation to pay such levies must be recognized as a liability. The interpretation is
subject to application for fiscal years beginning on or after June 17, 2014. This new interpretation had
no effect on the Group’s financial reporting.
Improvements to IFRS 2011-2013
The Improvements to IFRS 2011-2013 represent a collection of amendments released in December
2013, carrying amendments to several IFRS. It contains the following individual amendments:
-> IFRS 1: Clarification that a first-time IFRS adopter may choose to apply new, non-mandatory
IFRS if early adoption is permitted;
Consolidated financial statements – Notes
—82—
Elmos Annual Report 2015
-> IFRS 3: Clarification that all kinds of joint agreements within the meaning of IFRS 11 – Joint
Agreements are excluded from the scope of IFRS 3 and that the scope exception as defined in
paragraph 2 (a) of IFRS 3 only applies to the financial statements of the joint venture or the joint
operation itself;
-> IFRS 13: Clarification that the portfolio exception of paragraph 52 of IFRS 13 is applicable to all
agreements within the scope of IAS 39 – Financial Instruments: Recognition and Measurement
or IFRS 9 – Financial Instruments, regardless of whether or not such agreements meet the
definitions of financial assets or financial liabilities in accordance with IAS 32 – Financial
Instruments: Presentation;
-> IAS 40: Clarification that IAS 40 and IFRS 3 are not mutually exclusive. The assessment if the
acquisition of investment property represents the acquisition of an asset or rather a group of
assets or a business combination in accordance with IFRS 3 – Business Combinations must be
made on the basis of the provisions of IFRS 3.
This collection of amendments is subject to mandatory application for fiscal years beginning
on or after July 1, 2014; early adoption is permitted. First-time application of this collection of
amendments had no effect on the consolidated financial statements..
Standards and interpretations voluntarily applicable in advance (EU endorsed)
The IASB has released the following standards and interpretations which have already been
incorporated into EU law within the framework of the comitology procedure but were not subject
to mandatory application in fiscal year 2015 yet. The Group does not apply these standards and
interpretations in advance.
Amendments to IAS 19 – Employee Benefits: Employee Contributions
In November 2013 the IASB released narrow-scope amendments to IAS 19 Employee Benefits:
Employee Contributions. The amendments are applicable to the recognition of contributions
made by employees or third parties to defined benefit pension plans. It is permitted to recognize
employee or third-party contributions as a reduction of current service cost in the period in which
the corresponding service was provided if contributions are independent of the number of years
of service. The amendments to IAS 19 are subject to application for fiscal years beginning on or
after February 1, 2015; early adoption is permitted. These amendments will have no effect on the
consolidated financial statements.
Improvements to IFRS 2010-2012
The Improvements to IFRS 2010-2012 represent a collection of amendments released in December
2013, carrying amendments to several IFRS. It contains the following individual amendments:
-> IFRS 2: Specification of the definition of vesting conditions;
-> IFRS 3 and consequential amendment to IFRS 9: Clarification that an entity has to apply IAS 32 if
it classifies a contingent consideration within the scope of a business combination as financial
liability or equity. IFRS 9 is intended to be amended accordingly to assure that contingent
considerations cannot be recognized at amortized cost;
-> IFRS 8: Extension of mandatory disclosures by a description of combined business segments
and the economic indicators thus analyzed and clarification that a reconciliation of the total
amount of the assets of reportable segments to the assets of the entity must be presented in the
financial statements only if the chief operating decision maker is regularly informed about the
measurement of the assets of the business segments;
-> IFRS 13: Clarification of the option to measure current receivables and liabilities without
discounting despite consequential amendments to IFRS 9 and IAS 39;
-> IAS 16/IAS 38: Calculation (or reconciliation) of accumulated depreciation/amortization in
applying the revaluation method;
—83—
-> IAS 24: Treatment of cases where key management functions are assumed by legal entities.
This collection of amendments is subject to mandatory application for fiscal years beginning on or
after February 1, 2015; early adoption is permitted. Apart from partially expanded disclosures in the
notes, the Group does not expect material effects on the consolidated financial statements from
first-time application of this collection of amendments at present.
Amendments to IAS 1 – Disclosure Initiative
In December 2014 the IASB released amendments to IAS 1 aimed at eliminating obstacles perceived
by reporting entities with respect to the exercise of judgments regarding the presentation of
financial statements. These amendments to IAS 1 contain the following changes or clarifications:
-> Materiality: The amendments clarify that (1) information should not be obscured by
aggregation, (2) considerations of materiality have to be applied to all components of the
financial statements, and (3) materiality has to be considered even if a standard stipulates a
certain disclosure.
-> Presentation of assets and liabilities and presentation in the income statement or in other
comprehensive income: The IASB clarifies that (1) the list of line items for the statements can
be aggregated and disaggregated for considerations of relevance and provides additional
guidance with respect to subtotals in the statements; the IASB clarifies that (2) the share of an
entity in other comprehensive income of associates or joint ventures accounted for at equity
should be disclosed in aggregate as single line items on the basis of whether or not it will later
be reclassified to profit or loss in the income statement.
-> Disclosures: Additional examples for the potential sequences of disclosures are included in
order to clarify that comprehensibility and comparability should be considered in determining
the order of the notes and that notes do not have to be made in the order shown at present in
IAS 1.114. The IASB has also eliminated provisions and examples with respect to identifying the
significant accounting policies and valuation methods regarded as potentially not that helpful.
The amendments are subject to mandatory application for fiscal years beginning on or after January
1, 2016; early adoption is permitted. The Group management does not expect the amendments to
have a material effect on the presentation of consolidated financial statements.
Amendments to IAS 16 – Property, Plant and Equipment and 38 – Intangible Assets: Clarification of
Acceptable Methods of Depreciation and Amortization
In May 2014 the IASB released amendments to IAS 16 – Property, Plant and Equipment and IAS 38 –
Intangible Assets. With these amendments the IASB makes further guidance available for
determining acceptable methods of depreciation and amortization. Accordingly sales-based
methods of depreciation and amortization are not appropriate for property, plant and equipment
and appropriate only in certain exceptional cases for intangible assets. The amendments are subject
to mandatory application for fiscal years beginning on or after January 1, 2016; early adoption is
permitted. As the Group does not apply any sales-based methods of depreciation and amortization,
the Group management does not expect the application of the amended standards to have any
effects.
Amendments to IAS 16 – Property, Plant and Equipment and IAS 41 – Agriculture: Bearer Plants
In June 2014 the IASB released amendments to IAS 16 – Property, Plant and Equipment and IAS 41 –
Agriculture: Bearer Plants. With these amendments bearer plants used only for the production of
agricultural products have been included in the scope of IAS 16 so that they have to be accounted
for like items of property, plant and equipment. In order to exclude bearer plants from the scope
of IAS 41 and include them in the scope of IAS 16, thus enabling entities to account for them at
amortized cost or according to the revaluation model, the definition of a bearer plant is included in
both standards. The amendments are subject to mandatory application for fiscal years beginning
on or after January 1, 2016; early adoption is permitted. As the Group’s business model is not based
on bearer plants, the amendments are not expected to have any effect on the consolidated financial
statements.
Consolidated financial statements – Notes
—84—
Elmos Annual Report 2015
Amendment to IAS 27 – Separate Financial Statements: Equity Method in Separate Financial Statements
In August 2014 the IASB released amendments to IAS 27 – Separate Financial Statements. With these
amendments the equity method is permitted again as an option for the accounting treatment of
investments in subsidiaries, joint ventures and associated companies in the investor’s separate
financial statements. The amendments are subject to mandatory application for fiscal years
beginning on or after January 1, 2016; early adoption is permitted. As the option for accounting
treatment concerns separate financial statements, the amendments will have no effect on the
consolidated financial statements.
Amendments to IFRS 11 – Joint Arrangements: Accounting for Acquisitions of Interests in Joint Operations
In May 2014 the IASB released amendments to IFRS 11 – Joint Arrangements. They clarify that
the initial acquisition as well as the subsequent acquisition of interests in joint operations that
constitute a business have to be accounted for in application of the provisions for the accounting
treatment of business combinations under IFRS 3 unless these provisions contradict the provisions
under IFRS 11. The disclosure requirements under IFRS 3 must be fulfilled as well. The amendments
are subject to mandatory application for fiscal years beginning on or after January 1, 2016; early
adoption is permitted. As such acquisitions have not been made, the Group management currently
assumes that the application of the amended standard will have no effect.
Improvements to IFRS 2012-2014
The annual Improvements to IFRS 2012-2014 represent the collection of amendments released in
September 2014, carrying amendments to four standards:
-> IFRS 5: Inclusion of specific guidance for cases in which an entity reclassifies an asset from
“held for sale” to “held for distribution” or vice versa and cases in which held-for-distribution
accounting is discontinued.
-> IFRS 7: Inclusion of additional guidance to clarify whether a servicing contract is a continuing
involvement in a transferred asset; clarification of the applicability of the amendments to IFRS 7
on offsetting disclosures to condensed interim financial statements.
-> IAS 19: Clarification that high-quality corporate bonds used for determining the discount rate
for post-employment benefits should be denominated in the same currency as the benefits to
be paid so that the depth of the market for high-quality corporate bonds should be assessed at
currency level.
-> IAS 34: Clarification of the meaning of the phrase “elsewhere” in the interim report and
inclusion of a requirement for a cross-reference to that other place unless it is within the main
part of the report.
The amendments are subject to mandatory application for fiscal years beginning on or after
January 1, 2016, providing for prospective or retrospective application depending on the respective
amendment; early adoption is permitted. Group management currently assumes that the
application of this collection of amendments will have no effect.
Standards and interpretations not yet applicable in the EU (no EU endorsement yet)
The IASB has released the following standards and interpretations that were not subject to
mandatory application in fiscal year 2015 yet. These standards and interpretations have so far not
been endorsed by the EU and are therefore not adopted by the Group.
Amendments to IAS 7 – Statement of Cash Flows
Within the context of its disclosure initiative, the IASB released amendments to IAS 7 – Statement
of Cash Flows. The heart of these amendments represents provisions for additional disclosures in
the notes aimed at enabling the reader of financial statements to evaluate changes in liabilities
from the reporting entity’s financing activities. The amendments are subject to mandatory first-
time application for fiscal years beginning on or after January 1, 2017; early adoption is permitted.
Upon first-time application no comparative information on previous reporting periods has to be
provided. EU endorsement is still pending. Except for extended disclosures in the notes, the Group
management does not expect any effect on the consolidated financial statements.
—85—
Amendments to IAS 12 – Income Taxes
In January 2016 the IASB released amendments to IAS 12 – Income Taxes. The amendment contains
clarifications for the accounting treatment of deferred tax assets for unrealized losses on debt
instruments. Accordingly unrealized losses on debt instruments measured at fair value yet whose
tax base is acquisition cost generally result in deductible temporary differences. This applies
regardless of whether the holder of the instrument expects to realize the asset’s book value by
holding until maturity and collecting all contractual payments or if he intends to sell it in the
meantime. The book value of an asset does not represent the upper limit for the estimate of probable
future taxable profit. Tax deductions from the reversal of deductible temporary differences must be
excluded in the estimate of probable future taxable profit. An entity must not only assess a deferred
tax asset by itself but also in combination with other deferred tax assets. If the respective applicable
tax law restricts the utilization of tax losses, the reporting entity has to assess a deferred tax asset
in combination with other deferred tax assets of the same (admissible) type. The amendments are
subject to mandatory first-time application for fiscal years beginning on or after January 1, 2017. EU
endorsement is still pending. The Group management cannot conclusively assess at present what
effects the first-time application of this amended standard will have provided it will be endorsed
by the EU as released.
Amendments to IAS 28 – Investments in Associates and Joint Ventures and IFRS 10 – Consolidated
Financial Statements: Sale or Contribution of Assets between an Investor and its Associate or Joint Venture
In September 2014 the IASB released amendments to IFRS 10 Consolidated Financial Statements
and IAS 28 Investments in Associates and Joint Ventures. The amendments address a known
inconsistency between the two standards in the accounting treatment of a sale of an investor’s
assets or rather the contribution to the investor’s associate or joint venture. Insofar the transaction
involves a business within the meaning of IFRS 3, the investor has to account for the full gain
or loss; if the transaction involves only the sale of assets that do not constitute a business, only
part of the gain or loss has to be accounted for. Determination of the date of initial mandatory
application of these amendments has been suspended indefinitely by the IASB. Endorsement of
the amendments by the EU is still pending. The Group management cannot assess conclusively yet
which effects the first-time application of the amended standards might have provided they will
be endorsed by the EU as released.
IFRS 9 – Financial Instruments: Classification and Measurement
IFRS 9 Financial Instruments contains requirements for measurement, recognition and
derecognition as well as for the accounting treatment of hedges. The IASB released the final version
of the standard within the framework of the completion of the various stages of its elaborate
project on financial instruments on July 24, 2014. Thus the accounting treatment of financial
instruments previously governed by IAS 39 Financial Instruments: Recognition and Measurement
can now be superseded entirely by accounting treatment according to IFRS 9. This new release
of IFRS 9 supersedes all previous versions. The key requirements of the finalized IFRS 9 can be
summarized as follows:
-> The requirements of IFRS 9 with respect to scope and recognition and derecognition are largely
unchanged compared to the predecessor standard IAS 39.
-> However, compared to IAS 39 the provisions under IFRS 9 do provide for a new classification
model for financial assets.
-> Subsequent measurement of financial assets is now aligned with three categories, providing
different principles of valuation and different recognition of changes in value. The categorization
depends on the contractual cash flows of the instrument as well as on the business model
according to which the instrument is held. The categories are therefore mandatory as a general
rule. However, a few options are available to reporting entities beyond that.
Consolidated financial statements – Notes
—86—
Elmos Annual Report 2015
-> Existing provisions for financial liabilities have for the most part been adopted by IFRS 9,
however. The only material new provision concerns financial liabilities under the fair value
option. For those liabilities, fluctuations in fair value due to changes in their own contingency
risk have to be recognized in other comprehensive income.
-> IFRS 9 provides for three levels that determine the amount of losses and collected interest to
be recognized. Upon addition expected losses in the amount of the cash value of an expected
12-month credit loss have to be recognized (level 1). If there is a significant increase in
contingency loss, provision for risk has to be increased up to the amount of the losses expected
for the entire remaining term (level 2). Upon objective indication of impairment, the collection
of interest has to be made on the basis of the net book value (book value less provision for risk)
(level 3).
-> Apart from extensive transitional provisions, IFRS 9 is also linked to comprehensive disclosure
provisions both in the transition period and in ongoing application. New requirements
compared to IFRS 7 Financial Instruments: Disclosures primarily result from new impairment
regulation.
The final IFRS 9 standard is subject to mandatory application for fiscal years beginning on or after
January 1, 2018; early adoption is permitted. Endorsement of the amendments by the EU is still
pending. The Group assumes that future application of IFRS 9 might affect the reporting of the
Group’s financial assets and financial liabilities. However, a reliable assessment of the effects of the
application of IFRS 9 can only be made once a detailed analysis has been conducted, scheduled for
2016 at present.
IFRS 14 – Regulatory Deferral Accounts
In January 2014 the IASB released the new standard IFRS 14 – Regulatory Deferral Accounts. This
standard aims at allowing entities that are first-time IFRS adopters and have so far recognized
regulatory deferral accounts according to their previous financial reporting provisions to continue
to do so after adopting IFRS. As the Group is not a first-time IFRS adopter, this standard (not yet
endorsed by the EU) has no relevance to the Group.
IFRS 15 – Revenue from Contracts with Customers
In May 2014 the IASB released the new standard IFRS 15 – Revenue from Contracts with Customers.
The new standard for the recognition of revenue aims at harmonizing the large number of
provisions previously contained in various standards and interpretations. At the same time
consistent basic principles are determined, applicable for all industries and all kinds of sales
transactions. The questions to what amount and at what time or over what time period revenue
has to be recognized are to be answered with the help of a 5-stage model. Apart from that, the
standard includes a number of other provisions on questions of detail as well as an extension of the
disclosures required in the notes. Due to the amendment to IFRS 15 released in September 2015, the
initial date of mandatory first-time application has been postponed from January 1, 2017 to fiscal
years beginning on or after January 1, 2018. Generally adoption has to take place retrospectively;
however, various options for simplification are granted; early adoption continues to be permitted.
Endorsement of the standard including its amendment by the EU is still pending. In fiscal year 2016
the Group management will specifically assess the potential effects of the first-time application of
IFRS 15 on the consolidated financial statements and determine the date of first-time application as
well as the interim method provided the standard will be endorsed by the EU as released. Extended
disclosures in the notes are to be expected in any case.
IFRS 16 – Leases
In January 2016 the IASB released the new standard IFRS 16 – Leases. IFRS 16 defines principles for the
recognition, measurement, disclosure, and the notes relating to leases with the purpose of assuring
that lessee and lessor make relevant information available with respect to the effects of leases.
At the same time, the previous accounting model according to IAS 17 with a distinction between
operating and finance leases is abandoned in favor of a uniform accounting model for leases
—87—
committed to the control concept. The new standard provides for a single accounting model for the
lessee. This model leads to the lessee entering all assets and liabilities from leases in the statement
of financial position provided the lease term exceeds 12 months and the asset is not immaterial
(right to choose). The lessor will maintain the distinction between finance and operating leases for
the purpose of accounting. IFRS 16 – Leases is subject to mandatory first-time application for fiscal
years beginning on or after January 1, 2019; early adoption is generally permitted if IFRS 15 – Revenue
from Contracts with Customers is also completely applied (early). The lessee has to either apply IFRS
16 completely and retrospectively include previous reporting periods or recognize the cumulative
effect of adjustment as of first-time application as an entry in equity as of the beginning of the
fiscal year of first-time application. EU endorsement of this standard is still pending. The Group
management is currently assessing what effects the first-time application of IFRS 16 will have on
the consolidated financial statements and it will determine both the date of first-time application
and the interim method provided the standard will be endorsed by the EU as released.
Amendments to IFRS 10, IFRS 12 and IAS 28: Applying the Consolidation Exception
In the collection of amendments on the new consolidation exception for investment entities now
released, the following clarifications have been framed:
-> Exception to the preparation of consolidated financial statements: The amendments clarify that
an entity may apply the consolidation exception even if its parent accounts for its subsidiaries
at fair value in accordance with IFRS 10.
-> A subsidiary that renders services linked to the investment activity of the parent does not have
to be consolidated if the subsidiary is also an investment entity.
-> Upon application of the equity method to an associate or a joint venture that is an investment
entity, an investor that is not an investment entity may maintain the measurement at fair
value applied by the holding company to its investments in subsidiaries.
-> Required disclosures: An investment entity that measures all its subsidiaries at fair value has
to provide the disclosures with respect to investment entities as stipulated by IFRS 12.
The amendments are subject to mandatory application for fiscal years beginning on or after
January 1, 2016; early adoption is permitted. Endorsement of the amendments by the EU is still
pending. Provided the amendments will be endorsed by the EU as released, the Group management
currently assumes that their application will have no effect.
2 – Principles of consolidation
Basis of consolidation and consolidation methods
In addition to Elmos Semiconductor AG, the consolidated financial statements prepared for
fiscal year 2015 include all entities whose voting rights Elmos has the direct or indirect majority
of, or based on other rights in cases of control over the entity as defined by IFRS 10 Consolidated
Financial Statements. Capital consolidation is based on the purchase method. The investments’
acquisition values are set off against the proportionate balance of assets and liabilities acquired at
their respective time values. As of the acquisition date, identifiable assets and liabilities are fully
accounted for at their respective fair values. The balance of a remaining asset difference is stated
as goodwill.
The separate financial statements of the entities included in the Elmos consolidated financial
statements are stated in correspondence to the reporting date of the consolidated financial
statements.
All material receivables and liabilities as well as transactions between the consolidated entities
have been eliminated in the consolidated financial statements.
Consolidated financial statements – Notes
—88—
Elmos Annual Report 2015
A list of the subsidiaries included in the consolidated financial statements can be found under
note 33.
Foreign currency translation and transactions
The functional currency of Elmos Semiconductor AG and its European subsidiaries is the Euro. The
consolidated financial statements have been prepared in Euro.
Assets and liabilities denominated in foreign currencies are generally translated at the closing
exchange rate as of the reporting date.
With regard to subsidiaries whose functional currency is the national currency of the respective
country in which the subsidiary keeps its registered office, assets and liabilities stated in foreign
currency in the statements of financial position of the economically independent international
subsidiaries are translated into Euro at the closing exchange rates as of the respective reporting
dates. Income and expense items are translated at average exchange rates over the underlying
period. Differences resulting from the valuation of equity at historical rates and closing rates as
of the end of the reporting period are recognized outside profit or loss as changes in equity under
“Other equity components”.
The Company occasionally enters into forward exchange contracts and option transactions to
hedge foreign currency transactions for periods consistent with committed exposures. These
hedging activities reduce the impact of foreign exchange rate fluctuations on the Company’s
profitability. The Company is not involved in speculative transactions. For the realized and
unrealized exchange rate gains and losses from currency hedges during fiscal year 2015, please
refer to note 30.
Statement of cash flows
The cash flow statement shows how cash and cash equivalents have changed in the course of the
fiscal year by inflows and outflows of funds. The effects of acquisitions and divestitures as well
as other changes of the basis of consolidation have been considered. In accordance with IAS 7, the
statement distinguishes between cash flows from operating activities, investing activities, and
financing activities. Finance expenses and finance income recognized in the consolidated income
statement essentially correspond to the amounts paid.
3 – Accounting and valuation principles
Sales
The Company generates sales by selling ASICs, ASSPs and micromechanical sensor elements, as
well as by their development. Sales are stated net of sales tax and after deduction of any discounts
given.
Sales are realized either at the time products are shipped to the customer or at the time the risk of loss
passes to the customer. Within the framework of consignment warehousing agreements, sales are
realized either at the time of acceptance by the customer or at the time the consignment warehouse
is stocked up, depending on the time of the passing of risk. Sales from development activities are
realized upon reaching predefined milestones depending on the degree of the project’s completion.
Goodwill
Goodwill from business acquisitions is not amortized but reviewed for recoverability at least once
a year. In addition to that, an impairment test is made if special events or market developments
indicate that the fair value of a reporting unit might have fallen below its book value. As of the
acquisition date, the acquired goodwill is allocated to the cash-generating unit (CGU) expected to
benefit from the business combination’s synergy effects.
Impairment is identified by determining the recoverable amount of the CGU the goodwill is
allocated to. If the recoverable amount of the CGU is below its book value, the impairment of
goodwill needs to be recognized. The recoverable amount is the higher of the two amounts of fair
value less cost to sell and value in use.
—89—
All goodwill is allocated to the respective CGUs. For that purpose, each subsidiary usually
represents one CGU.
The determination of the CGU’s recoverable amount is based on the value in use. For each CGU,
future cash flows are determined on the basis of detailed long-term planning which involves a
period of five years. Based on an assumed perpetuity growth rate of 0.5%, the net present value of
these future cash flows is then calculated by way of discounting.
Other intangible assets
In accordance with IAS 38, intangible assets originating from development are capitalized only
if, among other criteria, it is a) sufficiently probable that the Company will receive the asset’s
future economic benefit and b) if the asset’s cost can be valuated reliably. These criteria apply to
capitalized development projects in connection with the development of ASICs. Such projects are
capitalized even if they are not yet connected to customer orders (ASSPs). Their recoverability is
reviewed annually by the Company. Depreciation is begun with after the development stage is
completed or at the start of pilot series production.
Development expenses are capitalized after technological feasibility or realizability is provided
and (pilot) series production (so-called PPAP status) is launched.
Cost is amortized as of the start of production on a straight-line basis over the estimated useful life
of three to seven years.
Expenses for the in-house development of design and process technology are capitalized if all
conditions in accordance with IAS 38 are met. Expenses are amortized under the straight-line
method over the shortest respective period of the estimated useful life of the technology, the
patent protection term or the term of the contract, yet over a maximum period of 20 years.
Acquired intangible assets are recognized at cost and amortized over their estimated useful lives of
3 to 20 years under the straight-line method.
Amortization is entered in the consolidated income statement (cf. note 7).
Property, plant and equipment
Items of property, plant and equipment are basically capitalized at acquisition or production cost.
Property, plant and equipment are depreciated over their estimated useful lives using the straight-
line method as follows:
Buildings 25 to 50 years
Building improvements 8 to 10 years
Technical equipment and machinery/Factory and office equipment 5 to 12 years
If the book value exceeds the expected recoverable amount, impairment loss is recognized for this
asset in accordance with IAS 36.
Upon the sale or disposal of property, plant and equipment, corresponding acquisition cost and
corresponding accumulated depreciation are eliminated from the accounts. Gains or losses from
the disposal of property, plant and equipment are stated as other operating income or expenses.
Costs for maintenance and repair are recorded in the consolidated income statement as expense.
In application of IAS 17, leased property attributable to the Company as its economic proprietor
is capitalized and depreciated over its estimated useful life (so-called finance lease). Accordingly,
liabilities originating from the lease contract are recognized as liabilities and reduced by the
discharge portion of lease payments.
Consolidated financial statements – Notes
—90—
Elmos Annual Report 2015
Other lease agreements the Company has entered into are considered operating leases. Lease
payments made are recognized in the consolidated income statement using the straight-line
method over the contract terms.
Investments
Investments represent interests in entities over which Elmos has neither control nor significant
influence. Investments for which there is a quoted market price are classified as “available for
sale” and measured at that price. Investments for which there is no active market are classified as
“available for sale” and measured at amortized cost. Insofar as there is no active market for those
entities, it is assumed that the book value equals the market value.
Financial instruments
According to IAS 39, a financial instrument is a contract that leads to the origination of a financial
asset for one entity and to the origination of a financial liability or an equity instrument for another
entity at the same time.
Financial instruments are recognized according to IAS 39.14 as of the time the Company becomes
the financial instrument’s contracting party. Regular purchase and sale transactions are entered
as of settlement date. Financial instruments are classified in accordance with IAS 39 into the
following categories:
-> Financial assets held for trading
-> Financial assets held to maturity
-> Loans and receivables granted by the Company
-> Available-for-sale financial assets
-> Financial liabilities measured at amortized cost, and
-> Financial liabilities measured at fair value through profit or loss.
The financial instruments accounted for include liquid assets, securities, trade receivables, trade
payables, forward loans including corresponding interest swap transactions (cash flow hedges),
forward exchange contracts, and other outside financing.
Financial assets
Financial assets with determined or determinable payments and fixed terms which the Company
is willing and able to hold to final maturity are classified as held-to-maturity financial assets,
with the exception of loans and receivables granted by the Company. Financial assets acquired
primarily to gain profits from short-term price fluctuations are classified as financial assets held
for trading. All other financial assets except for loans and receivables granted by the Company are
classified as available-for-sale financial assets.
Held-to-maturity financial assets are accounted for under non-current assets unless they mature
within twelve months of the reporting date. Financial assets held for trading are regarded as
current assets. Available-for-sale financial assets are regarded as non-current or current assets,
depending on their remaining term to maturity. If they are intended to be sold within twelve
months of the reporting date, they are categorized as current assets.
Upon their first-time recognition, financial assets are measured at fair value corresponding to the
time value attributable to the consideration received. With respect to financial assets classified
at fair value outside profit or loss, transaction costs directly attributable to the asset’s acquisition
are also taken into account. Subsequent measurement of financial assets depends on their
classification:
Available-for-sale financial assets and financial assets held for trading are subsequently measured
at fair value without deduction of any transaction costs incurred and under disclosure of their
listed market prices as of the reporting date.
—91—
Gains and losses from the measurement of available-for-sale financial assets at fair value are
recognized directly under other equity components until the financial asset is sold, collected,
or otherwise disposed of, or until the financial asset’s impairment is determined so that the
accumulated gains or losses previously recognized in equity are included in income/loss for the
period at that point in time.
Changes in fair value of financial assets held for trading are recognized in the financial result
insofar as there is a direct connection to the Company’s financing or its financial investments. Held-
to-maturity financial assets are measured at amortized cost using the effective interest method.
Financial liabilities
Financial liabilities generally constitute a claim for return in cash or in the shape of another
financial asset. This category particularly includes trade payables, financial liabilities, and other
liabilities.
After their first-time recognition, financial liabilities are measured at amortized cost using the
effective interest method. Financial liabilities measured at fair value through profit or loss include
financial liabilities held for trading. Derivatives are classified as held for trading unless they
are designated as hedging instruments and are effective as such. Gains or losses from financial
liabilities held for trading or from liabilities for which the fair value option has been exercised are
recognized in profit or loss.
Upon their first-time recognition, financial instruments are classified either as assets, liabilities or
equity, depending on the contractual agreement’s economic matter.
Interest, dividends, gains and losses in connection with financial instruments classified as
financial liabilities are recognized as expenses or income in the consolidated income statement for
the period in which they incur. Dividend payments to owners of financial instruments classified as
equity are deducted directly from equity.
The Company has so far made no use of the option to designate financial assets and financial
liabilities as financial assets and liabilities at fair value through profit or loss upon their first-time
recognition.
Upon their first-time recognition, put options written on non-controlling interests are recorded
as financial liabilities at the cash value of their repurchase amounts in accordance with IAS 32.23.
Such financial liabilities are measured in accordance with IAS 39, and any changes resulting from
subsequent measurement are recognized in profit or loss.
Financial guarantee contracts issued by the Group are contracts that commit to payments in
compensation of a loss incurred by the guarantee holder because a specific debtor has not fulfilled
his payment obligations on the due date according to the terms and conditions of a debt instrument.
Upon first-time recognition, financial guarantee contracts are recognized as liabilities at fair
value less transaction costs directly linked to the contract’s issuance. Subsequently the liability is
measured at the best possible estimate of expenses required for the fulfillment of the obligation as
of the reporting date or the higher stated amount less accumulated amortization.
Derivative financial instruments
Elmos uses derivative financial instruments for hedging interest rate risks. On concluding hedges,
certain derivatives are assigned to certain hedged items. The conditions stipulated by IAS 39 for the
qualification of transactions as hedges are met at all times.
Consolidated financial statements – Notes
—92—
Elmos Annual Report 2015
Insofar as derivative financial instruments utilized are effective hedges within the framework
of a hedging relationship in accordance with IAS 39 (cash flow hedges), changes in fair value do
not have an effect on the income for the period during the term of the derivative. Changes in fair
value are recognized in equity outside profit or loss. The amortized value in equity is considered in
income for the period as profit or loss upon maturity of the hedged cash flow.
The fair value generally corresponds to the market or stock market price. If there is no active market,
the fair value is determined on the basis of established valuation models.
The hedging strategy pursued by the Elmos Group is to exclusively enter into effective derivatives
for hedging interest rate risks. The conditions defined by IAS 39 as required for the accounting
treatment as hedging transactions were met upon conclusion of the hedging instruments as well
as at the reporting date.
Elmos also makes use of derivative financial instruments such as foreign exchange option
transactions and forward exchange transactions in order to hedge against currency risk.
According to IAS 39, such derivative financial instruments are to be assigned to the category “at
fair value through profit or loss” and to be accounted for at fair value, regardless of the purpose
or intention for which they have been concluded. Changes in fair value of derivative financial
instruments are recognized in profit or loss.
Inventories
Inventories are measured at acquisition or production cost or at the lower net recoverable value
as of the reporting date. In addition to directly attributable cost, production cost also includes
manufacturing cost and overhead as well as depreciation. Overhead costs are recognized as fixed
amounts on the basis of the production facilities’ usual utilization. Costs of unused production
capacity (idle capacity costs) are disclosed in the consolidated income statement under cost of sales.
Inventory allowances are made insofar as acquisition or production cost exceeds the expected
recoverable net sales proceeds.
Trade receivables
Trade receivables as well as other receivables are generally recognized at face value in consideration
of adequate allowances.
The valuation allowance for bad debt comprises to a considerable degree estimates and assessments
of individual receivables based on the respective customer’s creditworthiness, current economic
developments, and the analysis of historical bad debt loss on portfolio basis.
Cash and cash equivalents (liquid assets)
Liquid assets comprise cash on hand, checks, and cash in banks.
Non-current assets available-for-sale
An asset is to be classified as available for sale if the corresponding book value is realized primarily
by a sale transaction and not by the asset’s continued use.
Provisions
Provisions are made for legal or factual obligations with historical origins if it is probable that the
sufficiently reliable fulfillment of the obligation will lead to an outflow of the Group’s resources
and if a reliable estimate of the amount of the obligation can be made.
Recurring net pension expenses according to IAS 19 are made up of different components, reflecting
different aspects of the Company’s financial agreements as well as the expense for the benefits
received by the employees. These components are determined by using the actuarial cost method
on the basis of actuarial assumptions as stated under note 24.
—93—
The accounting principles provide that
-> all benefit improvements the Company is committed to as of the current valuation date are
reflected in the planned benefit obligation, and
-> actuarial gains and losses are directly recognized outside profit or loss in other comprehensive
income.
Adequate provisions for warranty are made in individual cases upon risk assessment with respect
to sales-oriented and legal consequences.
Income tax
Current tax assets and tax liabilities for the current period and previous periods are measured at
the amounts expected for tax refunds to be collected from the tax authorities or tax payments to be
made to the tax authorities. The calculation of these amounts is based on the tax rates and tax laws
in effect as of the reporting date in those countries where the Group has operations and generates
taxable income.
Deferred taxes are determined under the liability method. Deferred income taxes reflect the net tax
expense/income of temporary differences between the carrying amounts of assets and liabilities
in the statement of financial position and their respective tax values. The calculation of deferred
tax assets and liabilities is carried out on the basis of the tax rates expected as applicable for the
period in which an asset is realized or a debt is repaid. The measurement of deferred tax assets and
liabilities considers the tax effects resulting from the way an entity expects to realize its assets’
carrying amounts or repay its debts as of the reporting date.
Deferred tax assets and liabilities are recognized regardless of the point in time at which the
temporary accounting differences are expected to reverse. Deferred tax assets and liabilities are
not discounted and they are included in the statement of financial position as non-current assets
or non-current liabilities.
A deferred tax asset is recognized for all deductible temporary differences to the extent it is probable
that taxable income will be available against which the temporary difference can be offset. As
of each reporting date, the Company assesses deferred tax assets not accounted for anew. The
Company recognizes a deferred tax asset previously unaccounted for to the extent it has become
probable that future taxable income will allow the deferred tax asset’s realization.
In the opposite case, the deferred tax asset’s book value is reduced to the extent it appears no longer
probable that there will be sufficient taxable income in order to make use of the benefit of the
deferred tax asset – either in its entirety or in part.
Current taxes and deferred taxes are charged or credited directly to equity if the tax relates to items
credited or charged directly to equity in the same period or in another period.
No deferred tax liabilities incur to the extent that non-distributed profits of foreign investments
are to remain invested in that entity for an incalculable period of time. Deferred tax liabilities are
recognized for all taxable temporary differences insofar as the deferred tax liability does not result
from goodwill which does not allow for amortization for tax purposes.
Deferred tax assets also include tax relief claims resulting from the expected utilization of loss
carry-forwards and tax credits in the following years insofar as their realization appears assured
with sufficient reliability.
Deferred tax is determined on the basis of the tax rates in effect at or expected for the time of
realization according to the respective countries’ current legal situation.
Consolidated financial statements – Notes
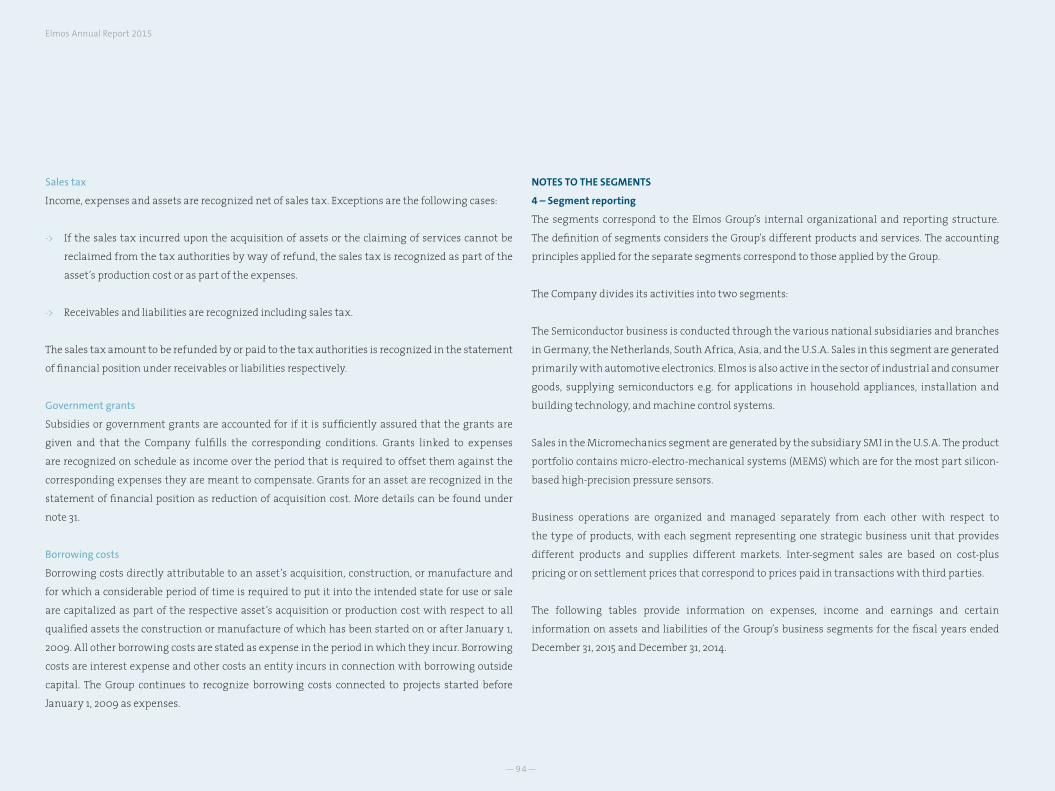
—94—
Elmos Annual Report 2015
Sales tax
Income, expenses and assets are recognized net of sales tax. Exceptions are the following cases:
-> If the sales tax incurred upon the acquisition of assets or the claiming of services cannot be
reclaimed from the tax authorities by way of refund, the sales tax is recognized as part of the
asset’s production cost or as part of the expenses.
-> Receivables and liabilities are recognized including sales tax.
The sales tax amount to be refunded by or paid to the tax authorities is recognized in the statement
of financial position under receivables or liabilities respectively.
Government grants
Subsidies or government grants are accounted for if it is sufficiently assured that the grants are
given and that the Company fulfills the corresponding conditions. Grants linked to expenses
are recognized on schedule as income over the period that is required to offset them against the
corresponding expenses they are meant to compensate. Grants for an asset are recognized in the
statement of financial position as reduction of acquisition cost. More details can be found under
note 31.
Borrowing costs
Borrowing costs directly attributable to an asset’s acquisition, construction, or manufacture and
for which a considerable period of time is required to put it into the intended state for use or sale
are capitalized as part of the respective asset’s acquisition or production cost with respect to all
qualified assets the construction or manufacture of which has been started on or after January 1,
2009. All other borrowing costs are stated as expense in the period in which they incur. Borrowing
costs are interest expense and other costs an entity incurs in connection with borrowing outside
capital. The Group continues to recognize borrowing costs connected to projects started before
January 1, 2009 as expenses.
NOTES TO THE SEGMENTS
4 – Segment reporting
The segments correspond to the Elmos Group’s internal organizational and reporting structure.
The definition of segments considers the Group’s different products and services. The accounting
principles applied for the separate segments correspond to those applied by the Group.
The Company divides its activities into two segments:
The Semiconductor business is conducted through the various national subsidiaries and branches
in Germany, the Netherlands, South Africa, Asia, and the U.S.A. Sales in this segment are generated
primarily with automotive electronics. Elmos is also active in the sector of industrial and consumer
goods, supplying semiconductors e.g. for applications in household appliances, installation and
building technology, and machine control systems.
Sales in the Micromechanics segment are generated by the subsidiary SMI in the U.S.A. The product
portfolio contains micro-electro-mechanical systems (MEMS) which are for the most part silicon-
based high-precision pressure sensors.
Business operations are organized and managed separately from each other with respect to
the type of products, with each segment representing one strategic business unit that provides
different products and supplies different markets. Inter-segment sales are based on cost-plus
pricing or on settlement prices that correspond to prices paid in transactions with third parties.
The following tables provide information on expenses, income and earnings and certain
information on assets and liabilities of the Group’s business segments for the fiscal years ended
December 31, 2015 and December 31, 2014.
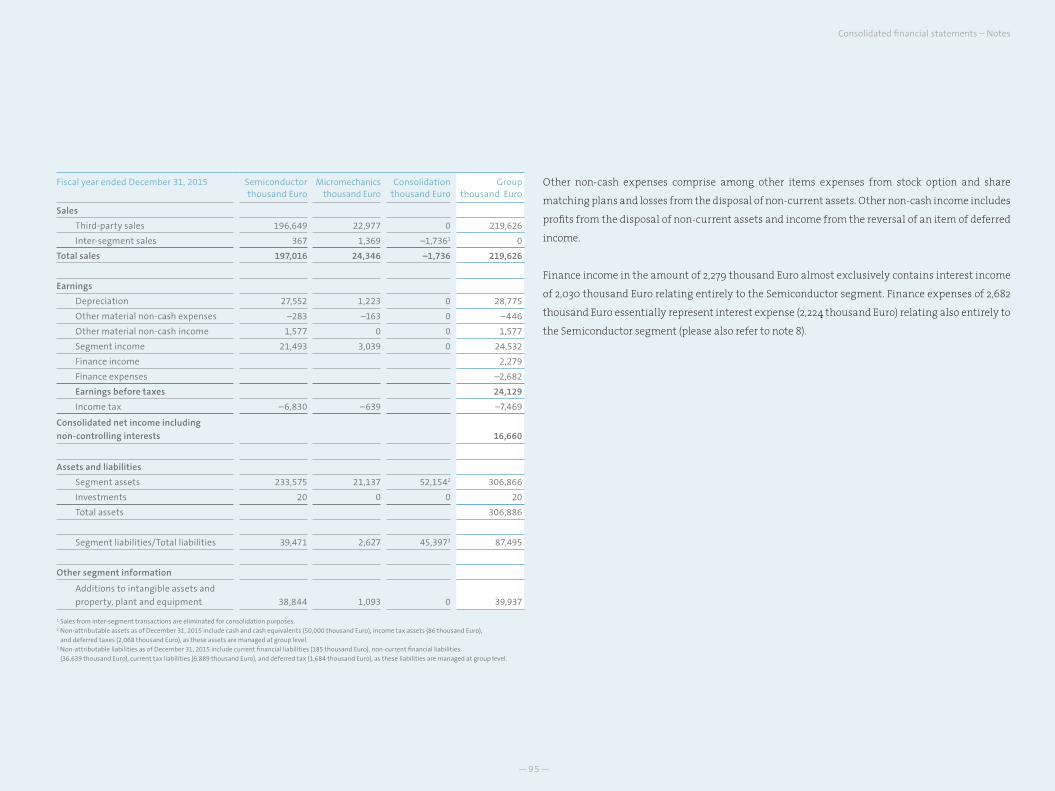
—95—
Fiscal year ended December 31, 2015 Semiconductorthousand Euro
Micromechanicsthousand Euro
Consolidationthousand Euro
Groupthousand Euro
Sales
Third-party sales 196,649 22,977 0 219,626
Inter-segment sales 367 1,369 –1,7361 0
Total sales 197,016 24,346 –1,736 219,626
Earnings
Depreciation 27,552 1,223 0 28,775
Other material non-cash expenses –283 –163 0 –446
Other material non-cash income 1,577 0 0 1,577
Segment income 21,493 3,039 0 24,532
Finance income 2,279
Finance expenses –2,682
Earnings before taxes 24,129
Income tax –6,830 –639 –7,469
Consolidated net income including
non-controlling interests 16,660
Assets and liabilities
Segment assets 233,575 21,137 52,1542 306,866
Investments 20 0 0 20
Total assets 306,886
Segment liabilities/Total liabilities 39,471 2,627 45,3973 87,495
Other segment information
Additions to intangible assets and
property, plant and equipment 38,844 1,093 0 39,937
1 Sales from inter-segment transactions are eliminated for consolidation purposes.2 Non-attributable assets as of December 31, 2015 include cash and cash equivalents (50,000 thousand Euro), income tax assets (86 thousand Euro), and deferred taxes (2,068 thousand Euro), as these assets are managed at group level.3 Non-attributable liabilities as of December 31, 2015 include current financial liabilities (185 thousand Euro), non-current financial liabilities (36,639 thousand Euro), current tax liabilities (6,889 thousand Euro), and deferred tax (1,684 thousand Euro), as these liabilities are managed at group level.
Other non-cash expenses comprise among other items expenses from stock option and share
matching plans and losses from the disposal of non-current assets. Other non-cash income includes
profits from the disposal of non-current assets and income from the reversal of an item of deferred
income.
Finance income in the amount of 2,279 thousand Euro almost exclusively contains interest income
of 2,030 thousand Euro relating entirely to the Semiconductor segment. Finance expenses of 2,682
thousand Euro essentially represent interest expense (2,224 thousand Euro) relating also entirely to
the Semiconductor segment (please also refer to note 8).
Consolidated financial statements – Notes
—96—
Elmos Annual Report 2015
Fiscal year ended December 31, 2014 Semiconductorthousand Euro
Micromechanicsthousand Euro
Consolidationthousand Euro
Groupthousand Euro
Sales
Third-party sales 190,923 18,594 0 209,517
Inter-segment sales 667 1,727 –2,3941 0
Total sales 191,590 20,321 –2,394 209,517
Earnings
Depreciation 24,789 834 0 25,623
Other material non-cash expenses –2,209 –127 0 –2,336
Other material non-cash income 710 0 0 710
Segment income 19,659 2,918 0 22,577
Finance income 2,315
Finance expenses –1,796
Earnings before taxes 23,097
Income tax –3,853 –512 –4,365
Consolidated net income including
non-controlling interests 18,732
Assets and liabilities
Segment assets 241,553 18,277 35,5502 295,380
Investments 20 0 0 20
Total assets 295,400
Segment liabilities/Total liabilities 43,424 2,230 42,8483 88,502
Other segment information
Additions to intangible assets and
property, plant and equipment 31,302 972 0 32,274
1 Sales from inter-segment transactions are eliminated for consolidation purposes.2 Non-attributable assets as of December 31, 2014 include cash and cash equivalents (35,520 thousand Euro), income tax assets (562 thousand Euro), and deferred taxes (2,468 thousand Euro), as these assets are managed at group level.3 Non-attributable liabilities as of December 31, 2014 include current financial liabilities (333 thousand Euro), non-current financial liabilities (37,076 thousand Euro), current tax liabilities (2,565 thousand Euro), and deferred tax (2,874 thousand Euro), as these liabilities are managed at group level.
Other non-cash expenses comprise among other items expenses from stock option/stock award/
share matching plans and accounting losses from the derecognition of intangible assets. Other
non-cash income includes income connected to the first-time consolidation of DMOS Dresden MOS
Design GmbH, Dresden, and income from the reversal of an item of deferred income.
Finance income in the amount of 2,315 thousand Euro almost exclusively contains interest income
of 2,1654 thousand Euro relating entirely to the Semiconductor segment. Finance expenses of 1,796
thousand Euro exclusively include interest expense relating entirely to the Semiconductor segment
(please also refer to note 8).4 Adjustment from the previous year
Geographic information
The geographic segment “Other EU countries” basically includes all member states of the European
Union as of the respective reporting date with the exception of Germany. Those European
countries that are currently not members of the European Union are included in the segment
“Other countries”. Third-party sales are broken down according to the customers’ delivery location.
Geographic information
Third-party sales 2015thousand Euro
2014thousand Euro
Germany 71,166 70,423
Other EU countries 45,732 48,621
U.S.A. 23,378 21,975
Asia/Pacific 68,853 55,914
Other countries 10,496 12,584
Consolidated sales 219,626 209,517
Geographic breakdown of non-current assets 12/31/2015thousand Euro
12/31/2014thousand Euro
Germany 136,387 136,444
Other EU countries 804 3,846
U.S.A. 5,499 5,113
Other countries 87 118
Non-current assets 142,777 145,521
—97—
Sales generated with the top two customers who account for more than 10% of sales each amount
to 36.2 million Euro and 25.9 million Euro respectively and result from sales in the Semiconductor
segment (2014: top two customers with sales of 41.2 million Euro, 21.9 million Euro respectively).
NOTES TO THE CONSOLIDATED INCOME STATEMENT AND THE CONSOLIDATED STATEMENT OF
COMPREHENSIVE INCOME
5 – Sales
The Company generates sales from selling semiconductors and micromechanical sensor elements
as well as from developing them.
Sales of the Group and its segments can be broken down as follows:
2015thousand Euro
2014thousand Euro
Semiconductor 196,649 190,923
Micromechanics 22,977 18,594
Group 219,626 209,517
Sales increased by 4.8% to 219,626 thousand Euro. An increase in sales is recorded in both of the
Group’s segments. While sales in the Semiconductor segment gained 3.0% to 196,649 thousand
Euro, sales in the Micromechanics segment climbed 23.6% to 22,977 thousand Euro.
6 – Notes to the income statement according to the cost of sales method
Cost of sales
The cost of sales contains costs of performances rendered toward the generation of sales. In addition
to direct material costs, direct labor costs and special direct costs, the cost of sales also includes
manufacturing and material overhead as well as lease expenses and depreciation. Furthermore,
the cost of sales contains changes in work in process and finished goods inventories and shows the
following development:
2015thousand Euro
2014thousand Euro
Material costs –51,882 –50,166
Personnel expense –33,709 –33,223
Other overhead –44,286 –46,630
Changes in inventories 1,856 11,944
–128,021 –118,075
The cost of sales was up 8.4% from 118,075 thousand Euro in 2014 to 128,021 thousand Euro in the
year under review. Due to the higher demand compared to the previous year and the resulting
increased production output, an increase in material costs by the amount of 1,716 thousand Euro
was recorded. Other overhead (–2,344 thousand Euro) went down despite higher depreciation
compared to fiscal year 2014. The main reason for this are one-off effects due to the termination
of lease agreements (cf. note 14) and renegotiations with suppliers and partners. Adjusted for the
effects of changes in inventories, the resulting cost of sales is almost unchanged.
Research and development expenses
Substantial expenses regularly incur with regard to research and development projects carried
out in anticipation of future sales. Research expenses are recognized in profit or loss according to
the amount of work invested. Development expenses are capitalized depending on the project and
then amortized or – insofar as capitalization requirements are not met – recognized in profit or loss.
In fiscal year 2015, R&D expenses of 37,075 thousand Euro (2014: 36,101 thousand Euro) were charged
to expenses.
Distribution expenses
Distribution expenses in the amount of 19,030 thousand Euro (2014: 19,009 thousand Euro)
essentially include expenses for staff, leases, travel, commission, and depreciation.
Administrative expenses
Administrative expenses of 17,414 thousand Euro (2014: 16,921 thousand Euro) include personnel
expense for the administrative staff and proportionate personnel expense for the Management
Consolidated financial statements – Notes
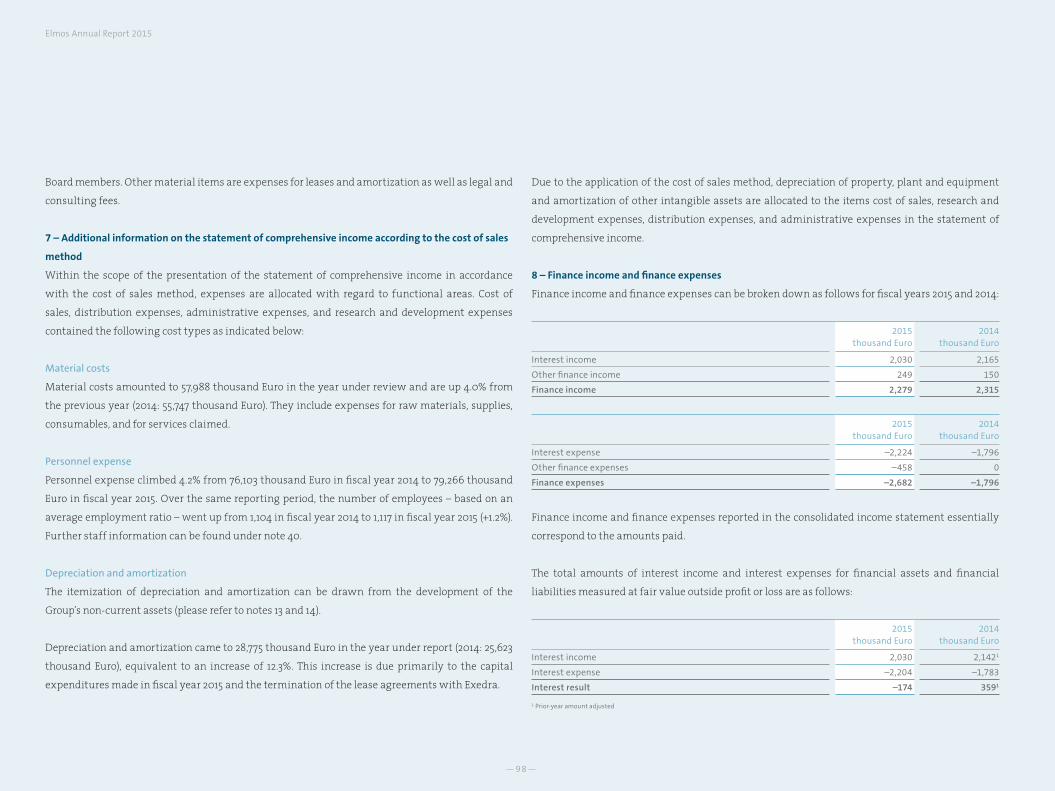
—98—
Elmos Annual Report 2015
Board members. Other material items are expenses for leases and amortization as well as legal and
consulting fees.
7 – Additional information on the statement of comprehensive income according to the cost of sales
method
Within the scope of the presentation of the statement of comprehensive income in accordance
with the cost of sales method, expenses are allocated with regard to functional areas. Cost of
sales, distribution expenses, administrative expenses, and research and development expenses
contained the following cost types as indicated below:
Material costs
Material costs amounted to 57,988 thousand Euro in the year under review and are up 4.0% from
the previous year (2014: 55,747 thousand Euro). They include expenses for raw materials, supplies,
consumables, and for services claimed.
Personnel expense
Personnel expense climbed 4.2% from 76,103 thousand Euro in fiscal year 2014 to 79,266 thousand
Euro in fiscal year 2015. Over the same reporting period, the number of employees – based on an
average employment ratio – went up from 1,104 in fiscal year 2014 to 1,117 in fiscal year 2015 (+1.2%).
Further staff information can be found under note 40.
Depreciation and amortization
The itemization of depreciation and amortization can be drawn from the development of the
Group’s non-current assets (please refer to notes 13 and 14).
Depreciation and amortization came to 28,775 thousand Euro in the year under report (2014: 25,623
thousand Euro), equivalent to an increase of 12.3%. This increase is due primarily to the capital
expenditures made in fiscal year 2015 and the termination of the lease agreements with Exedra.
Due to the application of the cost of sales method, depreciation of property, plant and equipment
and amortization of other intangible assets are allocated to the items cost of sales, research and
development expenses, distribution expenses, and administrative expenses in the statement of
comprehensive income.
8 – Finance income and finance expenses
Finance income and finance expenses can be broken down as follows for fiscal years 2015 and 2014:
2015thousand Euro
2014thousand Euro
Interest income 2,030 2,165
Other finance income 249 150
Finance income 2,279 2,315
2015thousand Euro
2014thousand Euro
Interest expense –2,224 –1,796
Other finance expenses –458 0
Finance expenses –2,682 –1,796
Finance income and finance expenses reported in the consolidated income statement essentially
correspond to the amounts paid.
The total amounts of interest income and interest expenses for financial assets and financial
liabilities measured at fair value outside profit or loss are as follows:
2015thousand Euro
2014thousand Euro
Interest income 2,030 2,1421
Interest expense –2,204 –1,783
Interest result –174 3591
1 Prior-year amount adjusted
—99—
9 – Foreign exchange gains/losses
Gains from exchange rate changes recognized in profit or loss amount to 2,293 thousand Euro in
fiscal year 2015 (2014: 2,433 thousand Euro). Gains result essentially from price gains realized in
forward exchange contracts and option transactions made by the Company (please refer to note 30).
Exchange rate changes attributable to the owners of the parent and recognized outside profit
or loss amount to 988 thousand Euro in fiscal year 2015 (2014: –547 thousand Euro), considering
corresponding deferred tax. Further information on changes in foreign currency exchange rates
recognized outside profit or loss can be found under note 22.
10 – Other operating expenses and income
Other operating income in the amount of 5,973 thousand Euro (2014: 3,066 thousand Euro) include
among other items income from the reversal of provisions in the amount of 1,053 thousand Euro
(2014: 463 thousand Euro), insurance settlements in the amount of 411 thousand Euro (2014: 100
thousand Euro), rental income in the amount of 418 thousand Euro (2014: 355 thousand Euro), income
from the derecognition of deferred income connected to the termination of the lease agreements
with Exedra in the amount of 1,113 thousand Euro (2014: 202 thousand Euro), income from the sale of
non-current assets in the amount of 464 thousand Euro (2014: 0 thousand Euro), other prior-period
income in the amount of 1,716 thousand Euro (2014: 620 thousand Euro), and various individual
items.
Other operating expenses in the amount of 1,820 thousand Euro (2014: 2,333 thousand Euro) include
among other items real-estate charges in the amount of 338 thousand Euro (2014: 283 thousand
Euro), write-down on a part of a building in the amount of 416 thousand Euro (2014: 390 thousand
Euro) allocated to the Semiconductor segment, other prior-period expenses in the amount of 265
thousand Euro (2014: 144 thousand Euro), accounting loss from the disposal of non-current assets in
the amount of 30 thousand Euro (2014: 146 thousand Euro), and various individual items.
11 – Income tax
Taxes on income either paid or owed as well as corresponding deferred taxes are reported as
income tax.
2015thousand Euro
2014thousand Euro
Current income tax
Germany –5,705 –3,903
Outside Germany –2,601 –507
–8,306 –4,410
thereof taxes from previous years –400 151
Deferred tax
Germany 1,065 208
Outside Germany –228 –163
837 45
thereof taxes from previous years 229 236
Total –7,469 –4,365
Deferred tax has been calculated under the so-called liability method pursuant to IAS 12.
For Germany, the combined income tax rate of 32.805% (2014: 32.805%) has been applied. The
Company’s combined income tax rate includes the trade tax collection rate of 485% (2014: 485%),
the corporate tax rate of 15.0% (2014: 15.0%), and the solidarity surcharge of 5.5% (2014: 5.5%). With
respect to the international subsidiaries, respective country-specific tax rates have been applied for
the calculation of deferred tax.
Deferred taxes are determined for the temporary differences between the book values of assets
and liabilities in the consolidated financial statements and the tax statements in the separate
financial statements. The deferral of taxes shows tax assets and tax liabilities that result from
the approximation of book value differences over time. Material components of the Company’s
deferred tax assets and deferred tax liabilities are described under note 16.
The differences between the anticipated tax amount in application of the statutory tax rate on the
consolidated net income and the Company’s effective income tax are as follows:
Consolidated financial statements – Notes
—100—
Elmos Annual Report 2015
2015%
2014%
Statutory tax rate 32.81 32.81
Foreign tax rate differential –3.23 –0.49
Expenses disallowable against tax 0.62 0.84
Trade tax additions/cuts 1.13 1.02
Taxes from previous years 0.71 –1.67
Tax-free income –2.13 –12.17
Others 1.05 –1.44
Effective tax rate 30.96 18.90
12 – Earnings per share
Basic earnings per ordinary share are calculated on the basis of the weighted average number of
ordinary shares outstanding in the respective fiscal year. Diluted earnings per ordinary share are
calculated on the basis of the weighted average number of ordinary shares outstanding plus all
stock options with dilutive potential according to the so-called treasury stock method.
Basic earnings and diluted earnings per ordinary share have been determined as follows:
Reconciliation of shares
2015 2014
Weighted average number of ordinary shares outstanding 19,653,847 19,454,715
Stock options with dilutive potential 334,364 369,689
Weighted average number of ordinary shares outstanding, including
dilutive effect 19,988,210 19,824,404
Calculation of earnings per share
in Euro 2015 2014
Consolidated net income attributable to owners of the parent 16,179,631 18,268,231
Basic earnings per share 0.82 0.94
Fully diluted earnings per share 0.81 0.92
The weighted average number of shares in 2015 and 2014 includes the weighted average effect of
changes from transactions with treasury shares, the weighted average effect of the exercise of
stock options from the 2009, 2010 and 2011 tranches in the course of the year 2015, and the weighted
average effect of the exercise of stock options from the 2009 and 2010 tranches in the course of the
year 2014.
All outstanding stock options originating from the 2010, 2011 and 2012 tranches (for 2015) or rather
from the 2009, 2010, 2011 and 2012 tranches (for 2014) have been included in the calculation of
diluted earnings per share. Further information on stock option plans can be found under note 23.
In the period between the reporting date and the preparation of the consolidated financial
statements, Elmos Semiconductor AG carried out no further share buyback transactions.
—101—
NOTES TO THE STATEMENT OF FINANCIAL POSITION
13 – Intangible assets
in thousand Euro Goodwill
Development
projects
Software and
licenses and similar
rights
and assets
Payments on
account and
projects under
development
Total
Acquisition and
production cost
In-house
effort
Purchase
In-house
effort
Purchase
December 31, 2013 3,623 22,309 6,322 47,712 793 55 80,814
Foreign currency adjustments 25 0 0 351 0 0 376
Additions 0 533 663 684 92 24 1,996
Additions to basis of consolidation 0 0 0 466 0 0 466
Transfers 0 99 580 73 –689 –38 25
Disposals 0 –99 0 –7,862 –12 0 –7,973
December 31, 2014 3,648 22,842 7,565 41,424 184 41 75,705
Foreign currency adjustments 23 0 0 136 0 0 159
Additions 0 1,572 0 2,439 248 626 4,885
Transfers 0 124 0 10 –124 0 10
Disposals 0 –27 –3 –3,990 0 0 –4,020
December 31, 2015 3,671 24,511 7,562 40,019 308 667 76,739
Depreciation and amortization
December 31, 2013 0 17,497 3,365 33,288 0 0 54,150
Foreign currency adjustments 0 0 0 295 0 0 295
Additions 0 1,684 819 2,487 0 0 4,990
Additions to basis of consolidation
0 0 0 461 0 0 461
Disposals 0 –99 0 –5,530 0 0 –5,629
December 31, 2014 0 19,082 4,184 31,001 0 0 54,266
Foreign currency adjustments 0 0 0 85 0 0 85
Additions 0 1,859 882 2,829 0 0 5,570
Disposals 0 –11 –3 –3,990 0 0 –4,004
December 31, 2015 0 20,930 5,063 29,925 0 0 55,917
Book value December 31, 2015 3,671 3,581 2,499 10,095 308 667 20,822
Book value December 31, 2014 3,648 3,760 3,381 10,424 184 41 21,439
Goodwill
Goodwill shows the following development:
12/31/2015thousand Euro
12/31/2014thousand Euro
Elmos N.A.
Acquisition cost 555 555
Foreign currency adjustments 45 22
Book value 600 577
Elmos Semiconductor AG (formerly Elmos France S.A.S.) 1,615 1,615
Elmos Services B.V. 206 206
MAZ Mikroelektronik-Anwendungszentrum GmbH im Land
Brandenburg 1,250 1,250
3,671 3,648
In accordance with IFRS 3. B63(a) read in conjunction with IAS 38 and IAS 36, goodwill is not
amortized but reviewed for impairment at least once every year. Measurement is made on the
basis of cash generating units, corresponding here with the legal entities the respective goodwill
is attributed to. The subsidiary Elmos France S.A.S., Levallois Perret/France left the Elmos Group’s
basis of consolidation effective March 30, 2012. Elmos Semiconductor AG, Dortmund, is the legal
successor with respect to the subsidiary’s assets and liabilities accounted for. The goodwill
attributed to the former subsidiary is reported at the level of Elmos Semiconductor AG as of the date
of the transaction.
For the purpose of the impairment tests to be conducted annually in accordance with IAS 36, the
Group determines the recoverable amount on the basis of value in use. Forecasts are based on free
cash flows. They in turn are based on detailed planning adopted by the management and consider
the Company's own empirical data as well as external general economic data. The forecasts are
based both on historical values and the general market performance expected for the future.
Determining the value in use implies estimation uncertainty with respect to individual sales and
cost planning as approved by management.
Consolidated financial statements – Notes
—102—
Elmos Annual Report 2015
Material parameters are established in the context of bottom-up planning by the subsidiaries
and business divisions. Methodically, the detailed planning phase comprises a five-year planning
period from 2016 to 2020. For the value added from 2021 it is enhanced by the perpetual annuity
which is based on an annual growth rate of 0.5%.
Further basic assumptions for the calculation of value in use
Gross margins – Gross margins are generally determined on the basis of the average values
generated in the previous fiscal years before the beginning of the planning period. These margins
are increased in the individual case by the expected efficiency increases in the course of the
detailed planning period. For the individual cash generating units, gross margins with different
bandwidths are taken as a basis. The budgeted annual performance of the gross margins was
established individually for each cash generating unit, ranging from decreasing gross margins to
mid single-digit percentage growth rates in the detailed planning period.
Development of prices for raw materials – Raw material price developments of the past are regarded
as indicative of future price developments. Forecast data are used only if they are accessible to the
public.
Assumptions on market shares – These assumptions are relevant insofar as the Company’s
management assesses – as in establishing assumptions on growth rates – how the positions of
the individual entities might change in relation to their competitors during the budgeting period.
Management anticipates steady market shares in probably growing markets.
Discount rates – The pre-tax interest rates applied were determined under the capital asset pricing
model (CAPM) and come to 15.69% for Elmos N.A., 14.69% for Elmos Semiconductor AG, 11.76% for
Elmos Services B.V., and 12.18% for MAZ Mikroelektronik-Anwendungszentrum GmbH im Land
Brandenburg before deduction of respective growth rates. These interest rates correspond to the
weighted average cost of capital. The cost of equity is based on a risk-free interest rate (1.5% or 3.25%
for Elmos N.A.) plus an average market risk premium (6.25%), multiplied by an entity specific equity
beta based on a so-called levered beta of 1.18. All values stated are derived from market data.
In 2015 impairment tests were conducted that did not result in impairment. It was established that
the recoverable amounts of the respective units exceeded the respective book values.
Elmos has conducted sensitivity analyses, examining the effects of the simultaneous reduction of
the budgeted earnings before interest and taxes (EBIT) in all planning periods beginning in 2016
by 10% compared to the adopted corporate budgets, a weighted average cost of capital increased
by another 1.0 percentage point, and a reduction of the growth rate for perpetual annuity to 0.0%
with respect to the recoverability of goodwill in the business divisions. The sensitivity analyses
have shown that from today's viewpoint there would be no need for impairment of the goodwill of
any of the entities even under these changed assumptions.
Other intangible assets
Development projects
In 2015 expenses linked to product developments were capitalized as development projects and
projects under development in the amount of 1,750 thousand Euro (2014: 624 thousand Euro).
Depreciation of capitalized developments amounted to 1,859 thousand Euro in 2015 (2014: 1,684
thousand Euro). The book value of capitalized development efforts (including projects under
development) is 3,762 thousand Euro as of December 31, 2015 (2014: 3,886 thousand Euro).
Amounts reported under “development projects” exclusively relate to the Company’s in-house
developments.
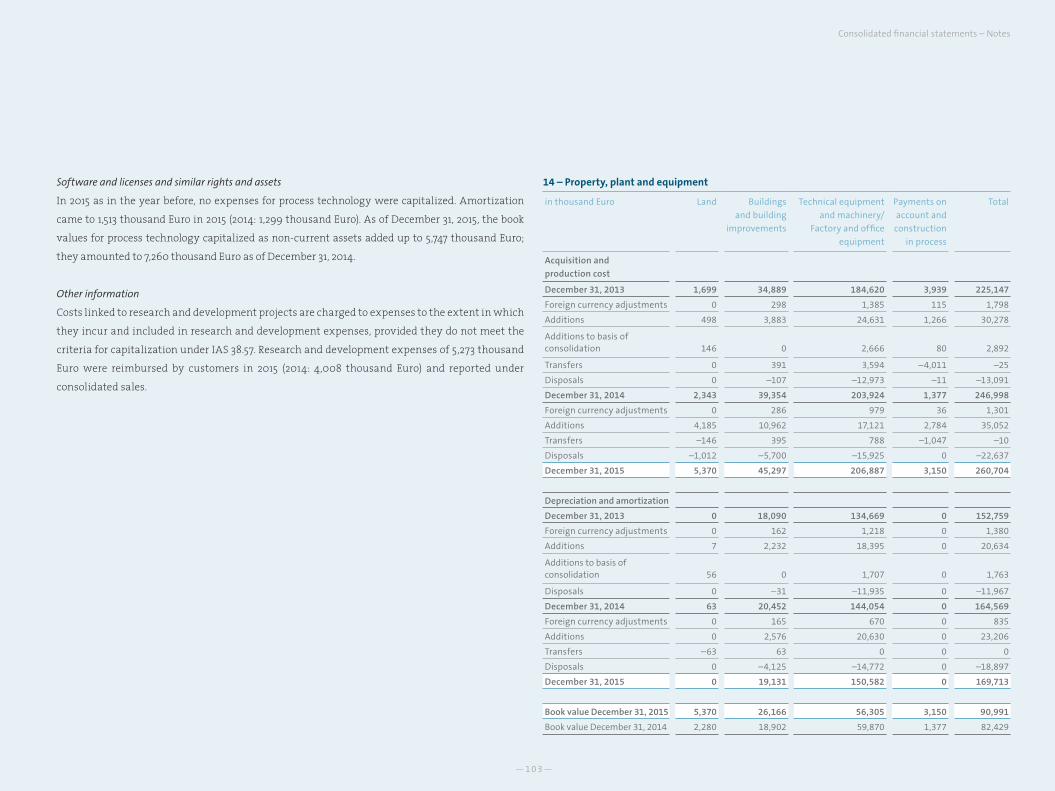
—103—
Software and licenses and similar rights and assets
In 2015 as in the year before, no expenses for process technology were capitalized. Amortization
came to 1,513 thousand Euro in 2015 (2014: 1,299 thousand Euro). As of December 31, 2015, the book
values for process technology capitalized as non-current assets added up to 5,747 thousand Euro;
they amounted to 7,260 thousand Euro as of December 31, 2014.
Other information
Costs linked to research and development projects are charged to expenses to the extent in which
they incur and included in research and development expenses, provided they do not meet the
criteria for capitalization under IAS 38.57. Research and development expenses of 5,273 thousand
Euro were reimbursed by customers in 2015 (2014: 4,008 thousand Euro) and reported under
consolidated sales.
14 – Property, plant and equipment
in thousand Euro Land Buildings
and building
improvements
Technical equipment
and machinery/
Factory and office
equipment
Payments on
account and
construction
in process
Total
Acquisition and
production cost
December 31, 2013 1,699 34,889 184,620 3,939 225,147
Foreign currency adjustments 0 298 1,385 115 1,798
Additions 498 3,883 24,631 1,266 30,278
Additions to basis of consolidation 146 0 2,666 80 2,892
Transfers 0 391 3,594 –4,011 –25
Disposals 0 –107 –12,973 –11 –13,091
December 31, 2014 2,343 39,354 203,924 1,377 246,998
Foreign currency adjustments 0 286 979 36 1,301
Additions 4,185 10,962 17,121 2,784 35,052
Transfers –146 395 788 –1,047 –10
Disposals –1,012 –5,700 –15,925 0 –22,637
December 31, 2015 5,370 45,297 206,887 3,150 260,704
Depreciation and amortization
December 31, 2013 0 18,090 134,669 0 152,759
Foreign currency adjustments 0 162 1,218 0 1,380
Additions 7 2,232 18,395 0 20,634
Additions to basis of consolidation 56 0 1,707 0 1,763
Disposals 0 –31 –11,935 0 –11,967
December 31, 2014 63 20,452 144,054 0 164,569
Foreign currency adjustments 0 165 670 0 835
Additions 0 2,576 20,630 0 23,206
Transfers –63 63 0 0 0
Disposals 0 –4,125 –14,772 0 –18,897
December 31, 2015 0 19,131 150,582 0 169,713
Book value December 31, 2015 5,370 26,166 56,305 3,150 90,991
Book value December 31, 2014 2,280 18,902 59,870 1,377 82,429
Consolidated financial statements – Notes
—104—
Elmos Annual Report 2015
Additions to “Technical equipment and machinery/Factory and office equipment” include purchase
transactions for fiscal year 2015 (2014) in the amount of 1,696 thousand Euro (December 31, 2014:
Euro 1,429 thousand Euro) where the corresponding cash outflows only take place in 2016 (2015).
No borrowing costs were capitalized in fiscal year 2015 or the previous year.
Lease agreements
On December 11, 2007 the Company entered into a supplementary agreement to an existing
finance lease agreement with Exedra, to the effect that the original agreement was restructured
into an operating lease agreement in compliance with the accounting principles according to IAS/
IFRS and extended to a building erected on the lessor’s property in the amount of 4,816 thousand
Euro. The leased assets to be subsumed under the existing contract were previously classified as
finance lease and were recognized accordingly under non-current assets. By the adjustment of
the contract modalities, the contract was converted to operating lease in fiscal year 2007; thus the
corresponding lease liabilities (December 28, 2007: 16,175 thousand Euro) as well as the leased assets
were no longer accounted for. The profit resulting from this transaction was collected in the amount
of 4,756 thousand Euro in 2007 (reported under other operating income) and recognized as deferred
income under other liabilities in the amount of 2,530 thousand Euro. This item was amortized
over the remaining term of 12.5 years until 2020. Within the framework of the negotiated lease
contract, the Company was committed to total lease payments of 23,050 thousand Euro (including
contribution to administrative expenses) until 2020. According to the contractual arrangements,
additional payments were owed for tenant loans in the amount of 7,330 thousand Euro until the
end of the lease term. In August 2015 Elmos and the lessor prematurely terminated the existing
lease agreement amicably and Elmos bought back the leased assets. The Group’s property, plant
and equipment include additions in the amount of about 14 million Euro (not including real estate
transfer tax) for the land and buildings concerned. The accrued tenant loan was offset against
the corresponding expenditures and the profit from the previous transaction reported as deferred
income under other liabilities was capitalized in profit or loss (cf. note 10).
Furthermore, on December 30, 2008 the Company entered into a supplementary agreement to
an existing finance lease agreement with Epigone, to the effect that the original agreement was
restructured into an operating lease agreement in compliance with the accounting principles
according to IAS/IFRS. The leased assets to be subsumed under the existing contract were previously
classified as finance lease and were recognized accordingly under non-current assets. By the
adjustment of the contract modalities, the contract was converted to operating lease in fiscal year
2008; thus the corresponding lease liabilities (December 30, 2008: 10,862 thousand Euro) as well
as the leased assets were no longer accounted for. The profit resulting from this transaction was
collected in the amount of 2,565 thousand Euro in 2008 (reported under other operating income). In
August 2015 Elmos entered into a supplementary agreement to the existing lease agreement with
the lessor under which future lease and tenant loan payments were reduced. Starting in 2016, the
Company is committed to total lease payments of 4,988 thousand Euro (including contribution to
administrative expenses) and total payments for tenant loans in the amount of 2,340 thousand
Euro until 2021.
The Group did not generate material income from subletting in fiscal year 2015 (2014). Future
minimum payments from non-cancelable subletting agreements are immaterial as well. Please
refer to note 32 for further information.
15 – Securities and investments
a) Securities
In fiscal years 2010 through 2015, the Company purchased securities (bonds) from different banks.
Insofar as the bonds’ remaining terms to maturity are more than one year, they have been allocated
to non-current assets (30,944 thousand Euro; 2014: 41,632 thousand Euro). Bonds that mature within
one year have been allocated to current assets (9,584 thousand Euro; 2014: 10,226 thousand Euro).
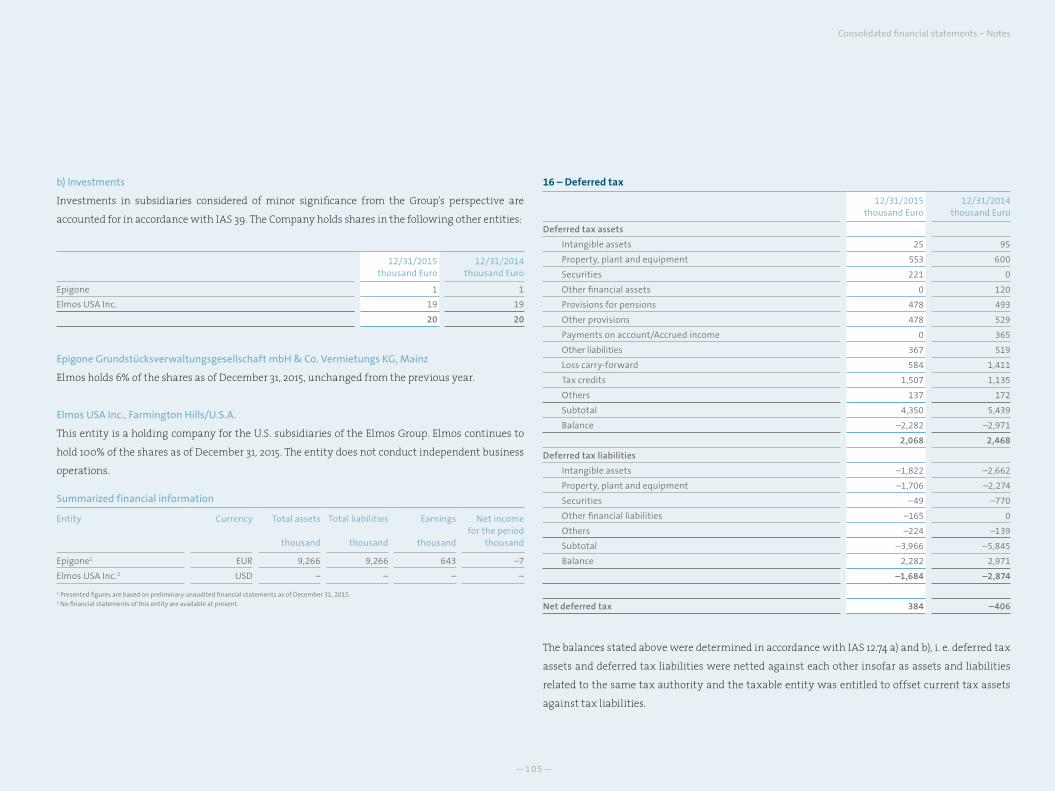
—105—
b) Investments
Investments in subsidiaries considered of minor significance from the Group’s perspective are
accounted for in accordance with IAS 39. The Company holds shares in the following other entities:
12/31/2015thousand Euro
12/31/2014thousand Euro
Epigone 1 1
Elmos USA Inc. 19 19
20 20
Epigone Grundstücksverwaltungsgesellschaft mbH & Co. Vermietungs KG, Mainz
Elmos holds 6% of the shares as of December 31, 2015, unchanged from the previous year.
Elmos USA Inc., Farmington Hills/U.S.A.
This entity is a holding company for the U.S. subsidiaries of the Elmos Group. Elmos continues to
hold 100% of the shares as of December 31, 2015. The entity does not conduct independent business
operations.
Summarized financial information
Entity Currency Total assets
thousand
Total liabilities
thousand
Earnings
thousand
Net income for the period
thousand
Epigone1 EUR 9,266 9,266 643 –7
Elmos USA Inc.2 USD – – – –
1 Presented figures are based on preliminary unaudited financial statements as of December 31, 2015.2 No financial statements of this entity are available at present.
16 – Deferred tax
12/31/2015thousand Euro
12/31/2014thousand Euro
Deferred tax assets
Intangible assets 25 95
Property, plant and equipment 553 600
Securities 221 0
Other financial assets 0 120
Provisions for pensions 478 493
Other provisions 478 529
Payments on account/Accrued income 0 365
Other liabilities 367 519
Loss carry-forward 584 1,411
Tax credits 1,507 1,135
Others 137 172
Subtotal 4,350 5,439
Balance –2,282 –2,971
2,068 2,468
Deferred tax liabilities
Intangible assets –1,822 –2,662
Property, plant and equipment –1,706 –2,274
Securities –49 –770
Other financial liabilities –165 0
Others –224 –139
Subtotal –3,966 –5,845
Balance 2,282 2,971
–1,684 –2,874
Net deferred tax 384 –406
The balances stated above were determined in accordance with IAS 12.74 a) and b), i. e. deferred tax
assets and deferred tax liabilities were netted against each other insofar as assets and liabilities
related to the same tax authority and the taxable entity was entitled to offset current tax assets
against tax liabilities.
Consolidated financial statements – Notes
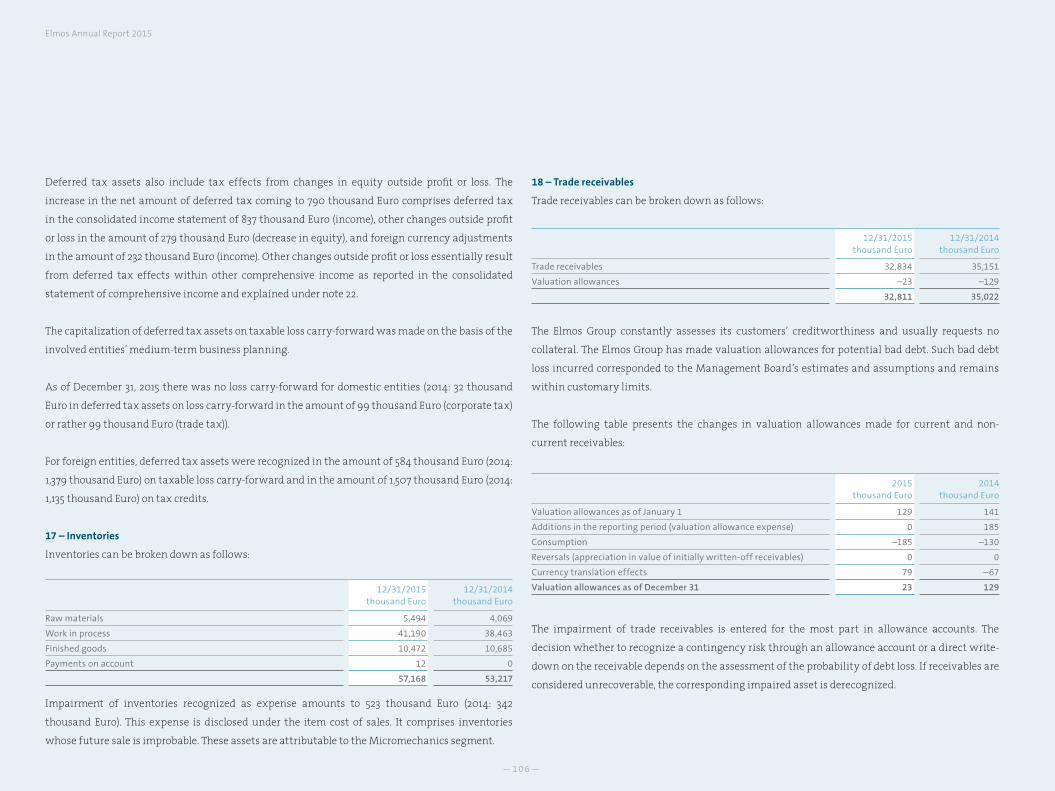
—106—
Elmos Annual Report 2015
18 – Trade receivables
Trade receivables can be broken down as follows:
12/31/2015thousand Euro
12/31/2014thousand Euro
Trade receivables 32,834 35,151
Valuation allowances –23 –129
32,811 35,022
The Elmos Group constantly assesses its customers’ creditworthiness and usually requests no
collateral. The Elmos Group has made valuation allowances for potential bad debt. Such bad debt
loss incurred corresponded to the Management Board’s estimates and assumptions and remains
within customary limits.
The following table presents the changes in valuation allowances made for current and non-
current receivables:
2015thousand Euro
2014thousand Euro
Valuation allowances as of January 1 129 141
Additions in the reporting period (valuation allowance expense) 0 185
Consumption –185 –130
Reversals (appreciation in value of initially written-off receivables) 0 0
Currency translation effects 79 –67
Valuation allowances as of December 31 23 129
The impairment of trade receivables is entered for the most part in allowance accounts. The
decision whether to recognize a contingency risk through an allowance account or a direct write-
down on the receivable depends on the assessment of the probability of debt loss. If receivables are
considered unrecoverable, the corresponding impaired asset is derecognized.
Deferred tax assets also include tax effects from changes in equity outside profit or loss. The
increase in the net amount of deferred tax coming to 790 thousand Euro comprises deferred tax
in the consolidated income statement of 837 thousand Euro (income), other changes outside profit
or loss in the amount of 279 thousand Euro (decrease in equity), and foreign currency adjustments
in the amount of 232 thousand Euro (income). Other changes outside profit or loss essentially result
from deferred tax effects within other comprehensive income as reported in the consolidated
statement of comprehensive income and explained under note 22.
The capitalization of deferred tax assets on taxable loss carry-forward was made on the basis of the
involved entities’ medium-term business planning.
As of December 31, 2015 there was no loss carry-forward for domestic entities (2014: 32 thousand
Euro in deferred tax assets on loss carry-forward in the amount of 99 thousand Euro (corporate tax)
or rather 99 thousand Euro (trade tax)).
For foreign entities, deferred tax assets were recognized in the amount of 584 thousand Euro (2014:
1,379 thousand Euro) on taxable loss carry-forward and in the amount of 1,507 thousand Euro (2014:
1,135 thousand Euro) on tax credits.
17 – Inventories
Inventories can be broken down as follows:
12/31/2015thousand Euro
12/31/2014thousand Euro
Raw materials 5,494 4,069
Work in process 41,190 38,463
Finished goods 10,472 10,685
Payments on account 12 0
57,168 53,217
Impairment of inventories recognized as expense amounts to 523 thousand Euro (2014: 342
thousand Euro). This expense is disclosed under the item cost of sales. It comprises inventories
whose future sale is improbable. These assets are attributable to the Micromechanics segment.
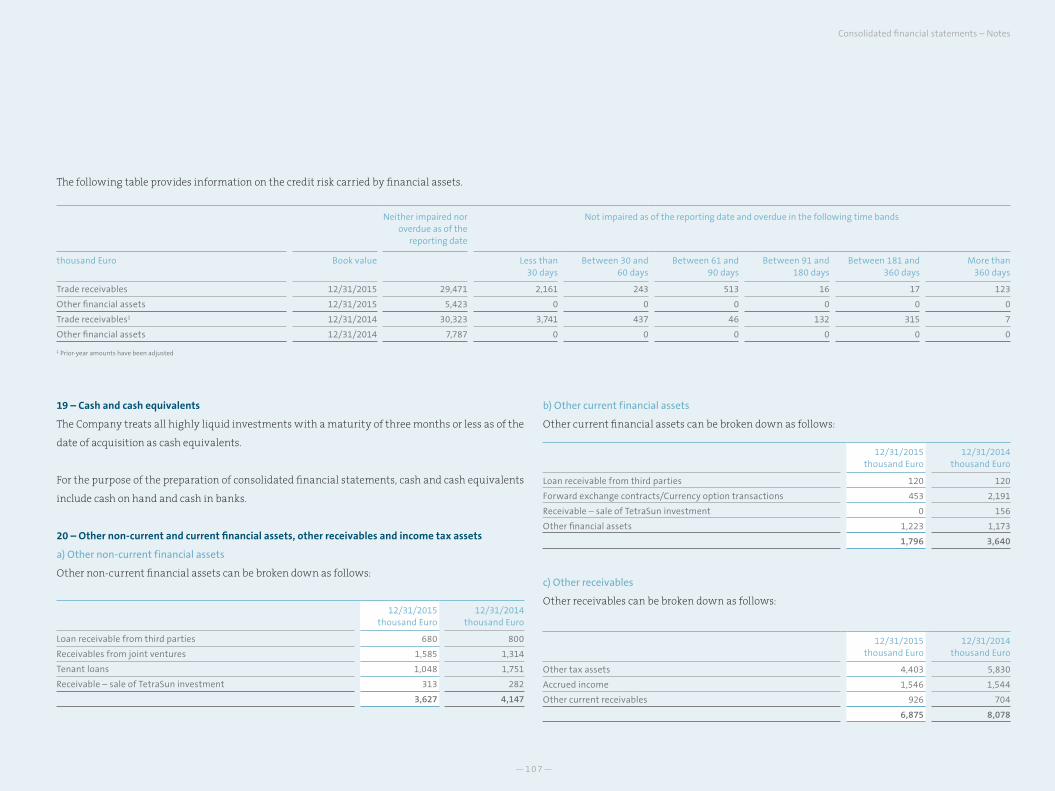
—107—
The following table provides information on the credit risk carried by financial assets.
Neither impaired nor overdue as of the
reporting date
Not impaired as of the reporting date and overdue in the following time bands
thousand Euro Book value Less than 30 days
Between 30 and 60 days
Between 61 and 90 days
Between 91 and 180 days
Between 181 and 360 days
More than 360 days
Trade receivables 12/31/2015 29,471 2,161 243 513 16 17 123
Other financial assets 12/31/2015 5,423 0 0 0 0 0 0
Trade receivables1 12/31/2014 30,323 3,741 437 46 132 315 7
Other financial assets 12/31/2014 7,787 0 0 0 0 0 0
1 Prior-year amounts have been adjusted
b) Other current financial assets
Other current financial assets can be broken down as follows:
12/31/2015thousand Euro
12/31/2014thousand Euro
Loan receivable from third parties 120 120
Forward exchange contracts/Currency option transactions 453 2,191
Receivable – sale of TetraSun investment 0 156
Other financial assets 1,223 1,173
1,796 3,640
c) Other receivables
Other receivables can be broken down as follows:
12/31/2015thousand Euro
12/31/2014thousand Euro
Other tax assets 4,403 5,830
Accrued income 1,546 1,544
Other current receivables 926 704
6,875 8,078
19 – Cash and cash equivalents
The Company treats all highly liquid investments with a maturity of three months or less as of the
date of acquisition as cash equivalents.
For the purpose of the preparation of consolidated financial statements, cash and cash equivalents
include cash on hand and cash in banks.
20 – Other non-current and current financial assets, other receivables and income tax assets
a) Other non-current financial assets
Other non-current financial assets can be broken down as follows:
12/31/2015thousand Euro
12/31/2014thousand Euro
Loan receivable from third parties 680 800
Receivables from joint ventures 1,585 1,314
Tenant loans 1,048 1,751
Receivable – sale of TetraSun investment 313 282
3,627 4,147
Consolidated financial statements – Notes
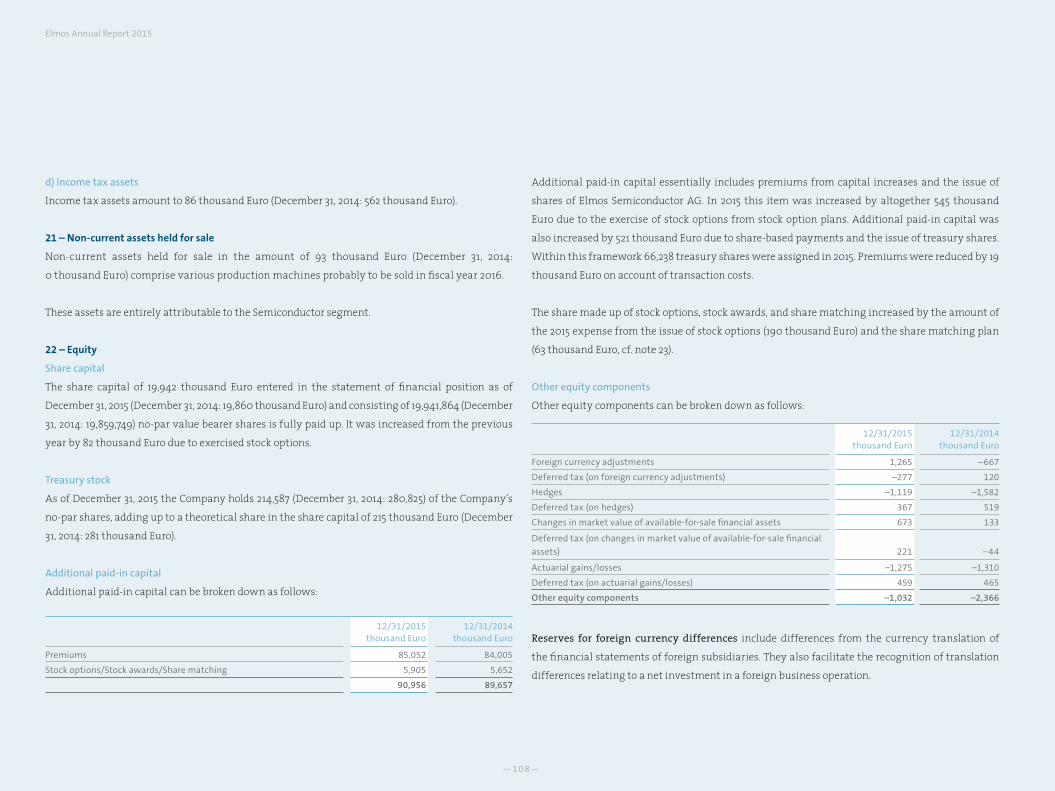
—108—
Elmos Annual Report 2015
d) Income tax assets
Income tax assets amount to 86 thousand Euro (December 31, 2014: 562 thousand Euro).
21 – Non-current assets held for sale
Non-current assets held for sale in the amount of 93 thousand Euro (December 31, 2014:
0 thousand Euro) comprise various production machines probably to be sold in fiscal year 2016.
These assets are entirely attributable to the Semiconductor segment.
22 – Equity
Share capital
The share capital of 19,942 thousand Euro entered in the statement of financial position as of
December 31, 2015 (December 31, 2014: 19,860 thousand Euro) and consisting of 19,941,864 (December
31, 2014: 19,859,749) no-par value bearer shares is fully paid up. It was increased from the previous
year by 82 thousand Euro due to exercised stock options.
Treasury stock
As of December 31, 2015 the Company holds 214,587 (December 31, 2014: 280,825) of the Company’s
no-par shares, adding up to a theoretical share in the share capital of 215 thousand Euro (December
31, 2014: 281 thousand Euro).
Additional paid-in capital
Additional paid-in capital can be broken down as follows:
12/31/2015thousand Euro
12/31/2014thousand Euro
Premiums 85,052 84,005
Stock options/Stock awards/Share matching 5,905 5,652
90,956 89,657
Additional paid-in capital essentially includes premiums from capital increases and the issue of
shares of Elmos Semiconductor AG. In 2015 this item was increased by altogether 545 thousand
Euro due to the exercise of stock options from stock option plans. Additional paid-in capital was
also increased by 521 thousand Euro due to share-based payments and the issue of treasury shares.
Within this framework 66,238 treasury shares were assigned in 2015. Premiums were reduced by 19
thousand Euro on account of transaction costs.
The share made up of stock options, stock awards, and share matching increased by the amount of
the 2015 expense from the issue of stock options (190 thousand Euro) and the share matching plan
(63 thousand Euro, cf. note 23).
Other equity components
Other equity components can be broken down as follows:
12/31/2015thousand Euro
12/31/2014thousand Euro
Foreign currency adjustments 1,265 –667
Deferred tax (on foreign currency adjustments) –277 120
Hedges –1,119 –1,582
Deferred tax (on hedges) 367 519
Changes in market value of available-for-sale financial assets 673 133
Deferred tax (on changes in market value of available-for-sale financial
assets) 221 –44
Actuarial gains/losses –1,275 –1,310
Deferred tax (on actuarial gains/losses) 459 465
Other equity components –1,032 –2,366
Reserves for foreign currency differences include differences from the currency translation of
the financial statements of foreign subsidiaries. They also facilitate the recognition of translation
differences relating to a net investment in a foreign business operation.
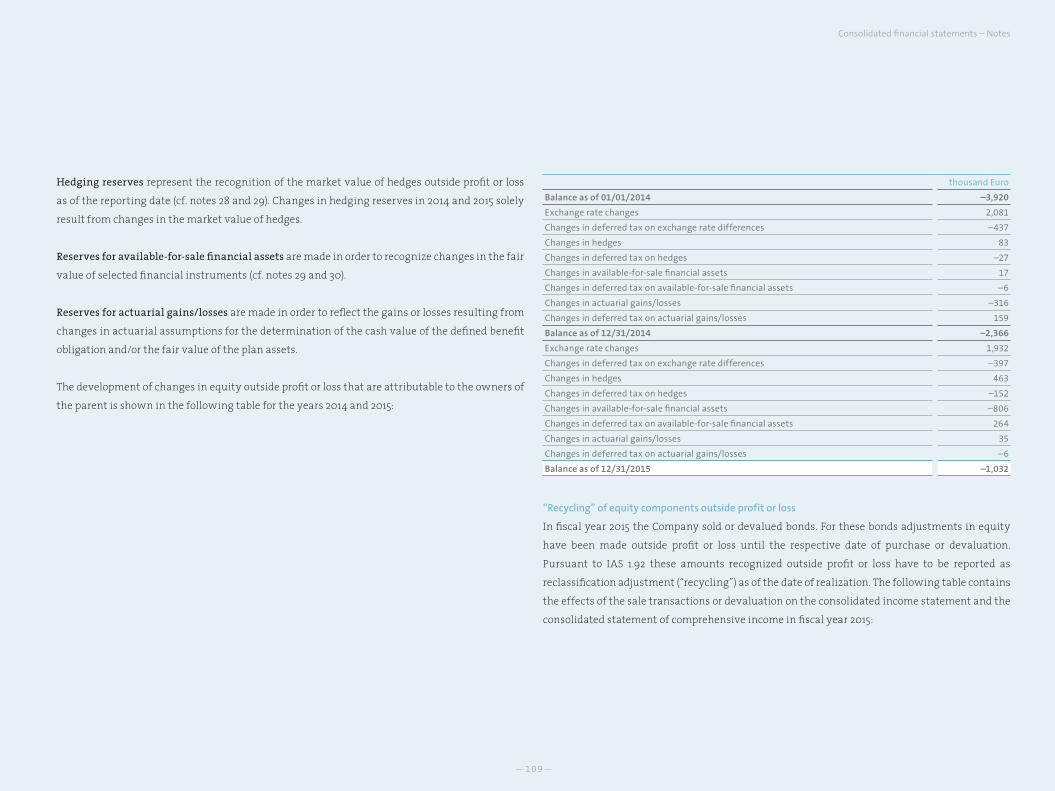
—109—
Hedging reserves represent the recognition of the market value of hedges outside profit or loss
as of the reporting date (cf. notes 28 and 29). Changes in hedging reserves in 2014 and 2015 solely
result from changes in the market value of hedges.
Reserves for available-for-sale financial assets are made in order to recognize changes in the fair
value of selected financial instruments (cf. notes 29 and 30).
Reserves for actuarial gains/losses are made in order to reflect the gains or losses resulting from
changes in actuarial assumptions for the determination of the cash value of the defined benefit
obligation and/or the fair value of the plan assets.
The development of changes in equity outside profit or loss that are attributable to the owners of
the parent is shown in the following table for the years 2014 and 2015:
thousand Euro
Balance as of 01/01/2014 –3,920
Exchange rate changes 2,081
Changes in deferred tax on exchange rate differences –437
Changes in hedges 83
Changes in deferred tax on hedges –27
Changes in available-for-sale financial assets 17
Changes in deferred tax on available-for-sale financial assets –6
Changes in actuarial gains/losses –316
Changes in deferred tax on actuarial gains/losses 159
Balance as of 12/31/2014 –2,366
Exchange rate changes 1,932
Changes in deferred tax on exchange rate differences –397
Changes in hedges 463
Changes in deferred tax on hedges –152
Changes in available-for-sale financial assets –806
Changes in deferred tax on available-for-sale financial assets 264
Changes in actuarial gains/losses 35
Changes in deferred tax on actuarial gains/losses –6
Balance as of 12/31/2015 –1,032
“Recycling” of equity components outside profit or loss
In fiscal year 2015 the Company sold or devalued bonds. For these bonds adjustments in equity
have been made outside profit or loss until the respective date of purchase or devaluation.
Pursuant to IAS 1.92 these amounts recognized outside profit or loss have to be reported as
reclassification adjustment (“recycling”) as of the date of realization. The following table contains
the effects of the sale transactions or devaluation on the consolidated income statement and the
consolidated statement of comprehensive income in fiscal year 2015:
Consolidated financial statements – Notes
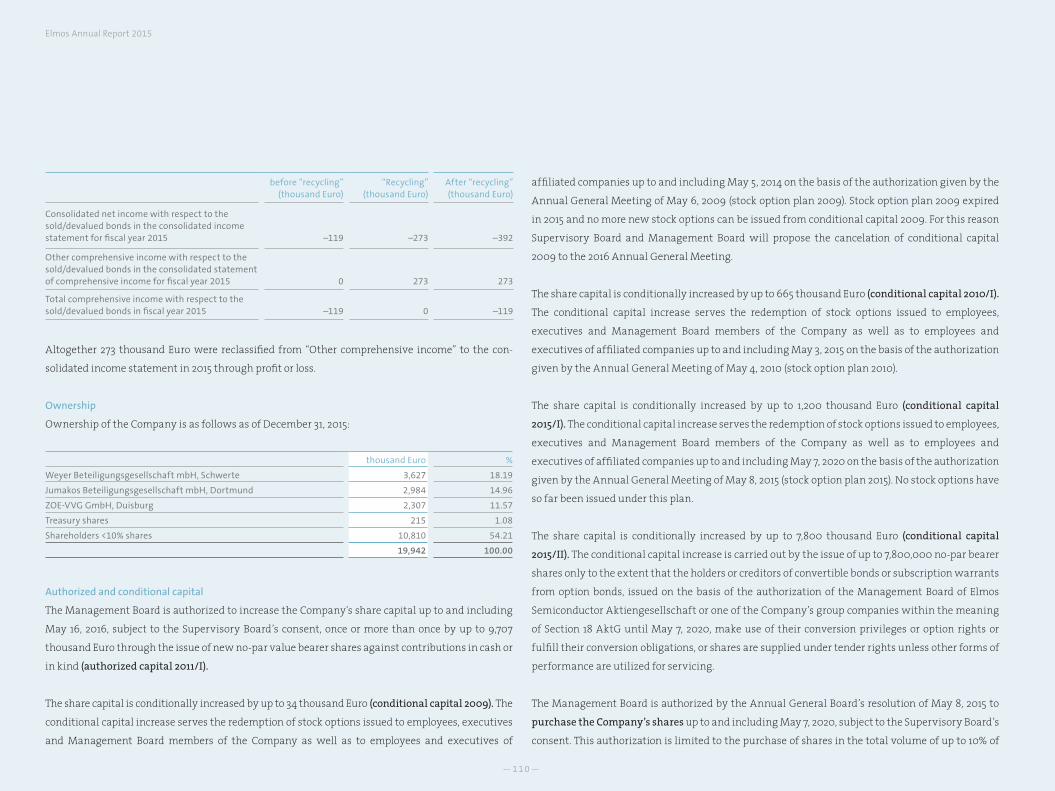
—110—
Elmos Annual Report 2015
before “recycling” (thousand Euro)
“Recycling” (thousand Euro)
After “recycling” (thousand Euro)
Consolidated net income with respect to the sold/devalued bonds in the consolidated income statement for fiscal year 2015 –119 –273 –392
Other comprehensive income with respect to the sold/devalued bonds in the consolidated statement of comprehensive income for fiscal year 2015 0 273 273
Total comprehensive income with respect to the sold/devalued bonds in fiscal year 2015 –119 0 –119
Altogether 273 thousand Euro were reclassified from “Other comprehensive income” to the con-
solidated income statement in 2015 through profit or loss.
Ownership
Ownership of the Company is as follows as of December 31, 2015:
thousand Euro %
Weyer Beteiligungsgesellschaft mbH, Schwerte 3,627 18.19
Jumakos Beteiligungsgesellschaft mbH, Dortmund 2,984 14.96
ZOE-VVG GmbH, Duisburg 2,307 11.57
Treasury shares 215 1.08
Shareholders <10% shares 10,810 54.21
19,942 100.00
Authorized and conditional capital
The Management Board is authorized to increase the Company's share capital up to and including
May 16, 2016, subject to the Supervisory Board’s consent, once or more than once by up to 9,707
thousand Euro through the issue of new no-par value bearer shares against contributions in cash or
in kind (authorized capital 2011/I).
The share capital is conditionally increased by up to 34 thousand Euro (conditional capital 2009). The
conditional capital increase serves the redemption of stock options issued to employees, executives
and Management Board members of the Company as well as to employees and executives of
affiliated companies up to and including May 5, 2014 on the basis of the authorization given by the
Annual General Meeting of May 6, 2009 (stock option plan 2009). Stock option plan 2009 expired
in 2015 and no more new stock options can be issued from conditional capital 2009. For this reason
Supervisory Board and Management Board will propose the cancelation of conditional capital
2009 to the 2016 Annual General Meeting.
The share capital is conditionally increased by up to 665 thousand Euro (conditional capital 2010/I).
The conditional capital increase serves the redemption of stock options issued to employees,
executives and Management Board members of the Company as well as to employees and
executives of affiliated companies up to and including May 3, 2015 on the basis of the authorization
given by the Annual General Meeting of May 4, 2010 (stock option plan 2010).
The share capital is conditionally increased by up to 1,200 thousand Euro (conditional capital
2015/I). The conditional capital increase serves the redemption of stock options issued to employees,
executives and Management Board members of the Company as well as to employees and
executives of affiliated companies up to and including May 7, 2020 on the basis of the authorization
given by the Annual General Meeting of May 8, 2015 (stock option plan 2015). No stock options have
so far been issued under this plan.
The share capital is conditionally increased by up to 7,800 thousand Euro (conditional capital
2015/II). The conditional capital increase is carried out by the issue of up to 7,800,000 no-par bearer
shares only to the extent that the holders or creditors of convertible bonds or subscription warrants
from option bonds, issued on the basis of the authorization of the Management Board of Elmos
Semiconductor Aktiengesellschaft or one of the Company’s group companies within the meaning
of Section 18 AktG until May 7, 2020, make use of their conversion privileges or option rights or
fulfill their conversion obligations, or shares are supplied under tender rights unless other forms of
performance are utilized for servicing.
The Management Board is authorized by the Annual General Board’s resolution of May 8, 2015 to
purchase the Company’s shares up to and including May 7, 2020, subject to the Supervisory Board’s
consent. This authorization is limited to the purchase of shares in the total volume of up to 10% of
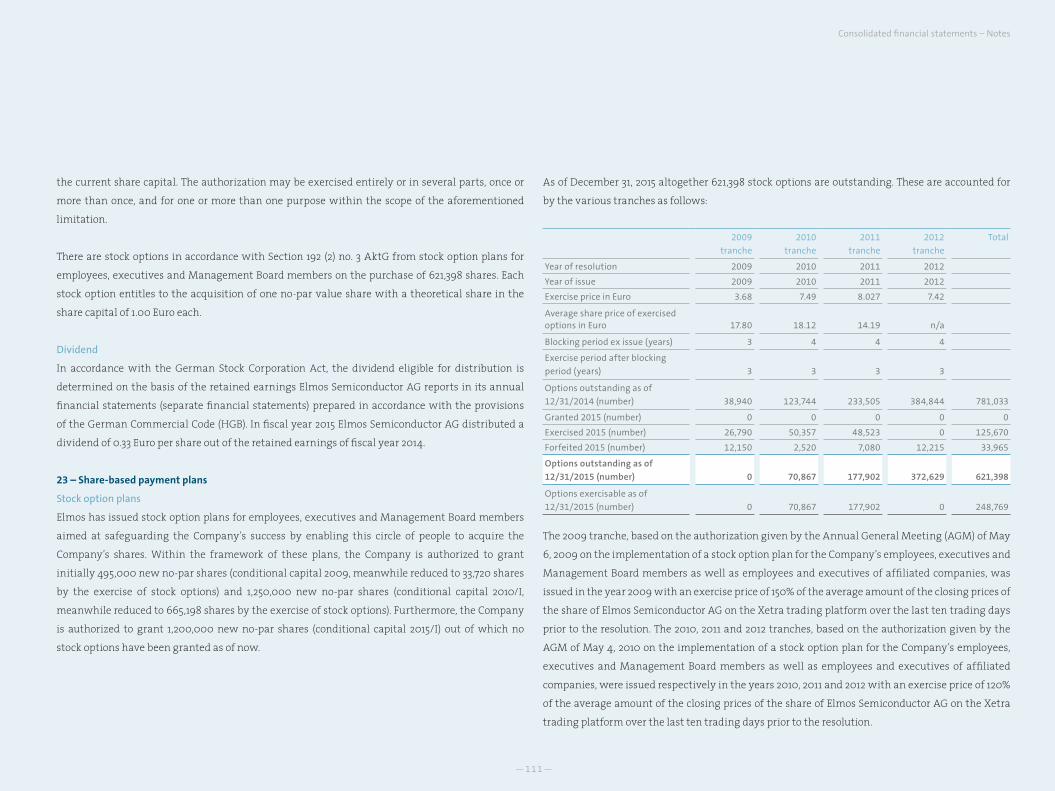
—111—
the current share capital. The authorization may be exercised entirely or in several parts, once or
more than once, and for one or more than one purpose within the scope of the aforementioned
limitation.
There are stock options in accordance with Section 192 (2) no. 3 AktG from stock option plans for
employees, executives and Management Board members on the purchase of 621,398 shares. Each
stock option entitles to the acquisition of one no-par value share with a theoretical share in the
share capital of 1.00 Euro each.
Dividend
In accordance with the German Stock Corporation Act, the dividend eligible for distribution is
determined on the basis of the retained earnings Elmos Semiconductor AG reports in its annual
financial statements (separate financial statements) prepared in accordance with the provisions
of the German Commercial Code (HGB). In fiscal year 2015 Elmos Semiconductor AG distributed a
dividend of 0.33 Euro per share out of the retained earnings of fiscal year 2014.
23 – Share-based payment plans
Stock option plans
Elmos has issued stock option plans for employees, executives and Management Board members
aimed at safeguarding the Company’s success by enabling this circle of people to acquire the
Company’s shares. Within the framework of these plans, the Company is authorized to grant
initially 495,000 new no-par shares (conditional capital 2009, meanwhile reduced to 33,720 shares
by the exercise of stock options) and 1,250,000 new no-par shares (conditional capital 2010/I,
meanwhile reduced to 665,198 shares by the exercise of stock options). Furthermore, the Company
is authorized to grant 1,200,000 new no-par shares (conditional capital 2015/I) out of which no
stock options have been granted as of now.
As of December 31, 2015 altogether 621,398 stock options are outstanding. These are accounted for
by the various tranches as follows:
2009
tranche
2010
tranche
2011
tranche
2012
tranche
Total
Year of resolution 2009 2010 2011 2012
Year of issue 2009 2010 2011 2012
Exercise price in Euro 3.68 7.49 8.027 7.42
Average share price of exercised options in Euro 17.80 18.12 14.19 n/a
Blocking period ex issue (years) 3 4 4 4
Exercise period after blocking
period (years) 3 3 3 3
Options outstanding as of
12/31/2014 (number) 38,940 123,744 233,505 384,844 781,033
Granted 2015 (number) 0 0 0 0 0
Exercised 2015 (number) 26,790 50,357 48,523 0 125,670
Forfeited 2015 (number) 12,150 2,520 7,080 12,215 33,965
Options outstanding as of
12/31/2015 (number) 0 70,867 177,902 372,629 621,398
Options exercisable as of
12/31/2015 (number) 0 70,867 177,902 0 248,769
The 2009 tranche, based on the authorization given by the Annual General Meeting (AGM) of May
6, 2009 on the implementation of a stock option plan for the Company’s employees, executives and
Management Board members as well as employees and executives of affiliated companies, was
issued in the year 2009 with an exercise price of 150% of the average amount of the closing prices of
the share of Elmos Semiconductor AG on the Xetra trading platform over the last ten trading days
prior to the resolution. The 2010, 2011 and 2012 tranches, based on the authorization given by the
AGM of May 4, 2010 on the implementation of a stock option plan for the Company’s employees,
executives and Management Board members as well as employees and executives of affiliated
companies, were issued respectively in the years 2010, 2011 and 2012 with an exercise price of 120%
of the average amount of the closing prices of the share of Elmos Semiconductor AG on the Xetra
trading platform over the last ten trading days prior to the resolution.
Consolidated financial statements – Notes
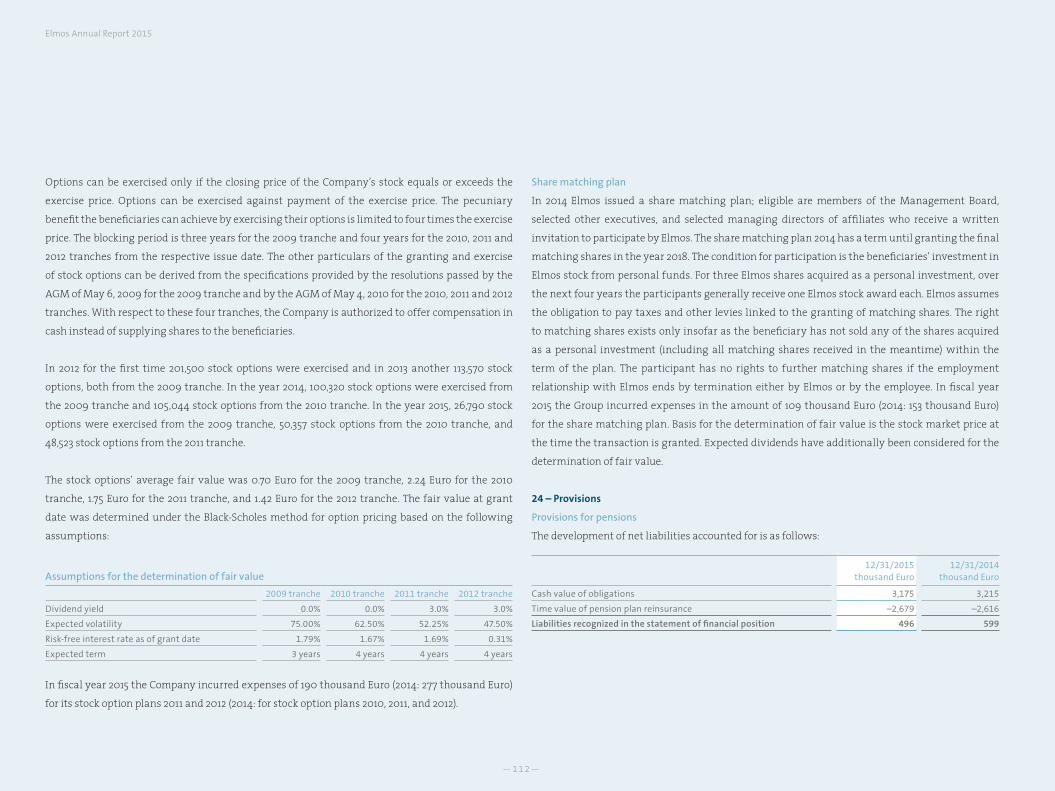
—112—
Elmos Annual Report 2015
Options can be exercised only if the closing price of the Company’s stock equals or exceeds the
exercise price. Options can be exercised against payment of the exercise price. The pecuniary
benefit the beneficiaries can achieve by exercising their options is limited to four times the exercise
price. The blocking period is three years for the 2009 tranche and four years for the 2010, 2011 and
2012 tranches from the respective issue date. The other particulars of the granting and exercise
of stock options can be derived from the specifications provided by the resolutions passed by the
AGM of May 6, 2009 for the 2009 tranche and by the AGM of May 4, 2010 for the 2010, 2011 and 2012
tranches. With respect to these four tranches, the Company is authorized to offer compensation in
cash instead of supplying shares to the beneficiaries.
In 2012 for the first time 201,500 stock options were exercised and in 2013 another 113,570 stock
options, both from the 2009 tranche. In the year 2014, 100,320 stock options were exercised from
the 2009 tranche and 105,044 stock options from the 2010 tranche. In the year 2015, 26,790 stock
options were exercised from the 2009 tranche, 50,357 stock options from the 2010 tranche, and
48,523 stock options from the 2011 tranche.
The stock options’ average fair value was 0.70 Euro for the 2009 tranche, 2.24 Euro for the 2010
tranche, 1.75 Euro for the 2011 tranche, and 1.42 Euro for the 2012 tranche. The fair value at grant
date was determined under the Black-Scholes method for option pricing based on the following
assumptions:
Assumptions for the determination of fair value
2009 tranche 2010 tranche 2011 tranche 2012 tranche
Dividend yield 0.0% 0.0% 3.0% 3.0%
Expected volatility 75.00% 62.50% 52.25% 47.50%
Risk-free interest rate as of grant date 1.79% 1.67% 1.69% 0.31%
Expected term 3 years 4 years 4 years 4 years
In fiscal year 2015 the Company incurred expenses of 190 thousand Euro (2014: 277 thousand Euro)
for its stock option plans 2011 and 2012 (2014: for stock option plans 2010, 2011, and 2012).
Share matching plan
In 2014 Elmos issued a share matching plan; eligible are members of the Management Board,
selected other executives, and selected managing directors of affiliates who receive a written
invitation to participate by Elmos. The share matching plan 2014 has a term until granting the final
matching shares in the year 2018. The condition for participation is the beneficiaries’ investment in
Elmos stock from personal funds. For three Elmos shares acquired as a personal investment, over
the next four years the participants generally receive one Elmos stock award each. Elmos assumes
the obligation to pay taxes and other levies linked to the granting of matching shares. The right
to matching shares exists only insofar as the beneficiary has not sold any of the shares acquired
as a personal investment (including all matching shares received in the meantime) within the
term of the plan. The participant has no rights to further matching shares if the employment
relationship with Elmos ends by termination either by Elmos or by the employee. In fiscal year
2015 the Group incurred expenses in the amount of 109 thousand Euro (2014: 153 thousand Euro)
for the share matching plan. Basis for the determination of fair value is the stock market price at
the time the transaction is granted. Expected dividends have additionally been considered for the
determination of fair value.
24 – Provisions
Provisions for pensions
The development of net liabilities accounted for is as follows:
12/31/2015thousand Euro
12/31/2014thousand Euro
Cash value of obligations 3,175 3,215
Time value of pension plan reinsurance –2,679 –2,616
Liabilities recognized in the statement of financial position 496 599
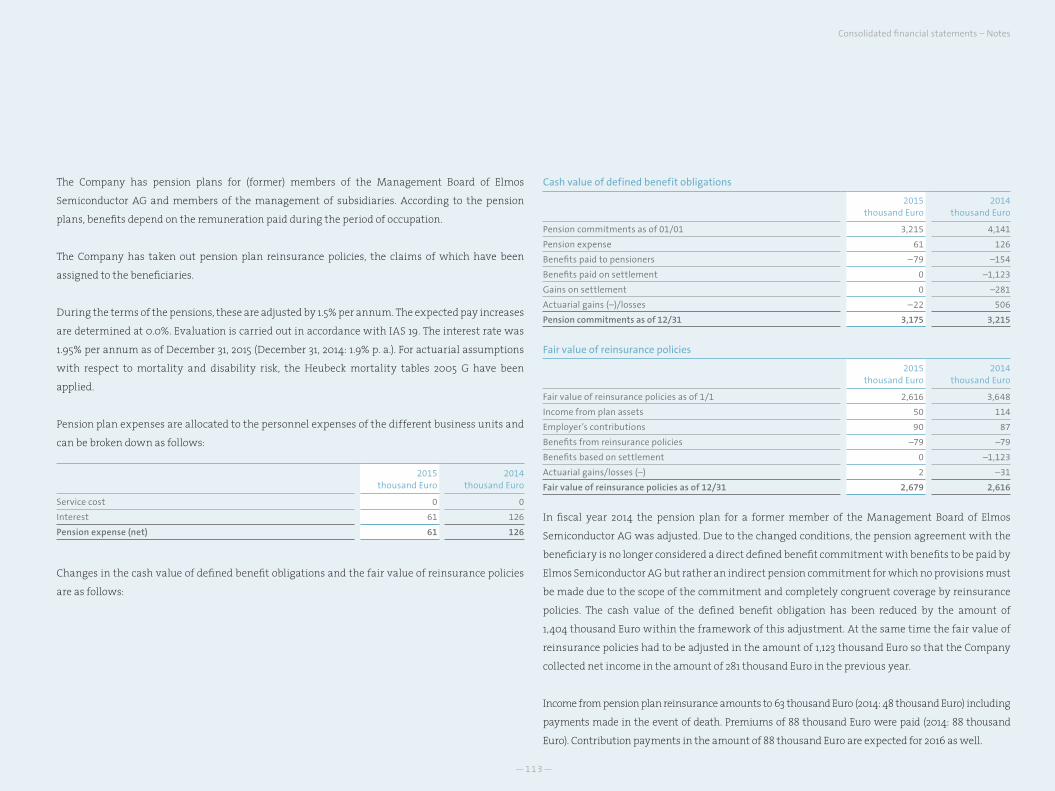
—113—
The Company has pension plans for (former) members of the Management Board of Elmos
Semiconductor AG and members of the management of subsidiaries. According to the pension
plans, benefits depend on the remuneration paid during the period of occupation.
The Company has taken out pension plan reinsurance policies, the claims of which have been
assigned to the beneficiaries.
During the terms of the pensions, these are adjusted by 1.5% per annum. The expected pay increases
are determined at 0.0%. Evaluation is carried out in accordance with IAS 19. The interest rate was
1.95% per annum as of December 31, 2015 (December 31, 2014: 1.9% p. a.). For actuarial assumptions
with respect to mortality and disability risk, the Heubeck mortality tables 2005 G have been
applied.
Pension plan expenses are allocated to the personnel expenses of the different business units and
can be broken down as follows:
2015thousand Euro
2014thousand Euro
Service cost 0 0
Interest 61 126
Pension expense (net) 61 126
Changes in the cash value of defined benefit obligations and the fair value of reinsurance policies
are as follows:
Cash value of defined benefit obligations
2015thousand Euro
2014thousand Euro
Pension commitments as of 01/01 3,215 4,141
Pension expense 61 126
Benefits paid to pensioners –79 –154
Benefits paid on settlement 0 –1,123
Gains on settlement 0 –281
Actuarial gains (–)/losses –22 506
Pension commitments as of 12/31 3,175 3,215
Fair value of reinsurance policies
2015thousand Euro
2014thousand Euro
Fair value of reinsurance policies as of 1/1 2,616 3,648
Income from plan assets 50 114
Employer’s contributions 90 87
Benefits from reinsurance policies –79 –79
Benefits based on settlement 0 –1,123
Actuarial gains/losses (–) 2 –31
Fair value of reinsurance policies as of 12/31 2,679 2,616
In fiscal year 2014 the pension plan for a former member of the Management Board of Elmos
Semiconductor AG was adjusted. Due to the changed conditions, the pension agreement with the
beneficiary is no longer considered a direct defined benefit commitment with benefits to be paid by
Elmos Semiconductor AG but rather an indirect pension commitment for which no provisions must
be made due to the scope of the commitment and completely congruent coverage by reinsurance
policies. The cash value of the defined benefit obligation has been reduced by the amount of
1,404 thousand Euro within the framework of this adjustment. At the same time the fair value of
reinsurance policies had to be adjusted in the amount of 1,123 thousand Euro so that the Company
collected net income in the amount of 281 thousand Euro in the previous year.
Income from pension plan reinsurance amounts to 63 thousand Euro (2014: 48 thousand Euro) including
payments made in the event of death. Premiums of 88 thousand Euro were paid (2014: 88 thousand
Euro). Contribution payments in the amount of 88 thousand Euro are expected for 2016 as well.
Consolidated financial statements – Notes
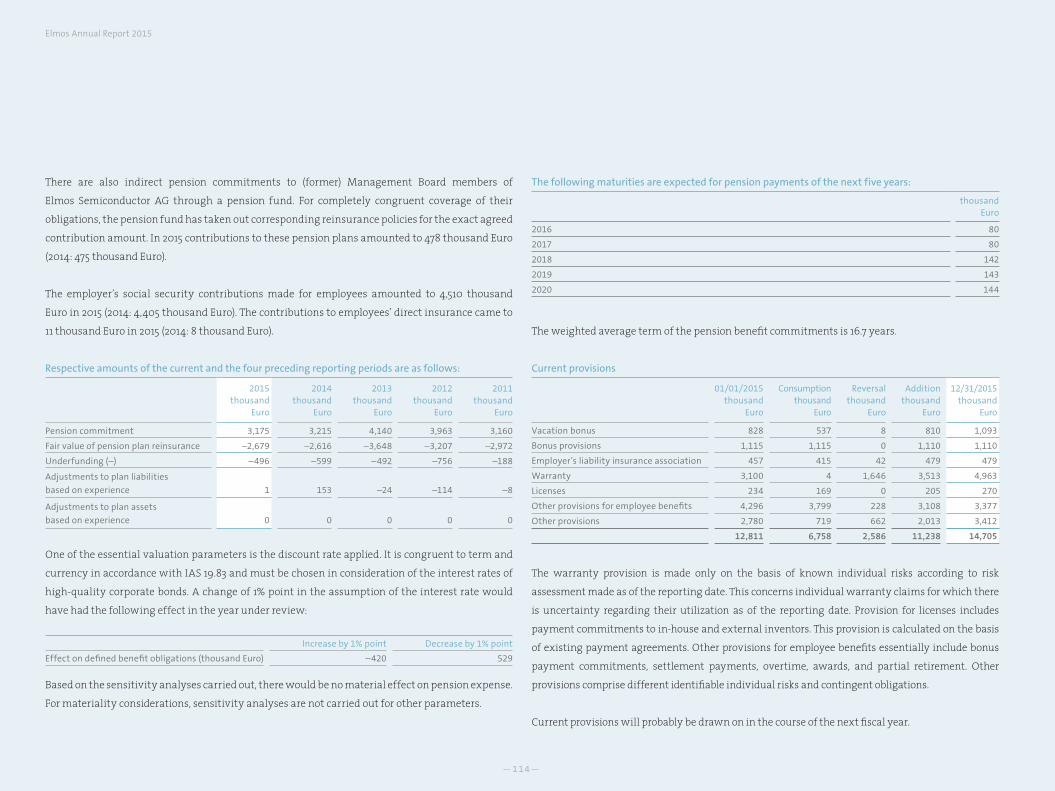
—114—
Elmos Annual Report 2015
There are also indirect pension commitments to (former) Management Board members of
Elmos Semiconductor AG through a pension fund. For completely congruent coverage of their
obligations, the pension fund has taken out corresponding reinsurance policies for the exact agreed
contribution amount. In 2015 contributions to these pension plans amounted to 478 thousand Euro
(2014: 475 thousand Euro).
The employer’s social security contributions made for employees amounted to 4,510 thousand
Euro in 2015 (2014: 4,405 thousand Euro). The contributions to employees’ direct insurance came to
11 thousand Euro in 2015 (2014: 8 thousand Euro).
Respective amounts of the current and the four preceding reporting periods are as follows:
2015thousand
Euro
2014thousand
Euro
2013thousand
Euro
2012thousand
Euro
2011thousand
Euro
Pension commitment 3,175 3,215 4,140 3,963 3,160
Fair value of pension plan reinsurance –2,679 –2,616 –3,648 –3,207 –2,972
Underfunding (–) –496 –599 –492 –756 –188
Adjustments to plan liabilities
based on experience 1 153 –24 –114 –8
Adjustments to plan assets
based on experience 0 0 0 0 0
One of the essential valuation parameters is the discount rate applied. It is congruent to term and
currency in accordance with IAS 19.83 and must be chosen in consideration of the interest rates of
high-quality corporate bonds. A change of 1% point in the assumption of the interest rate would
have had the following effect in the year under review:
Increase by 1% point Decrease by 1% point
Effect on defined benefit obligations (thousand Euro) –420 529
Based on the sensitivity analyses carried out, there would be no material effect on pension expense.
For materiality considerations, sensitivity analyses are not carried out for other parameters.
The following maturities are expected for pension payments of the next five years:
thousandEuro
2016 80
2017 80
2018 142
2019 143
2020 144
The weighted average term of the pension benefit commitments is 16.7 years.
Current provisions
01/01/2015thousand
Euro
Consumptionthousand
Euro
Reversalthousand
Euro
Additionthousand
Euro
12/31/2015thousand
Euro
Vacation bonus 828 537 8 810 1,093
Bonus provisions 1,115 1,115 0 1,110 1,110
Employer’s liability insurance association 457 415 42 479 479
Warranty 3,100 4 1,646 3,513 4,963
Licenses 234 169 0 205 270
Other provisions for employee benefits 4,296 3,799 228 3,108 3,377
Other provisions 2,780 719 662 2,013 3,412
12,811 6,758 2,586 11,238 14,705
The warranty provision is made only on the basis of known individual risks according to risk
assessment made as of the reporting date. This concerns individual warranty claims for which there
is uncertainty regarding their utilization as of the reporting date. Provision for licenses includes
payment commitments to in-house and external inventors. This provision is calculated on the basis
of existing payment agreements. Other provisions for employee benefits essentially include bonus
payment commitments, settlement payments, overtime, awards, and partial retirement. Other
provisions comprise different identifiable individual risks and contingent obligations.
Current provisions will probably be drawn on in the course of the next fiscal year.
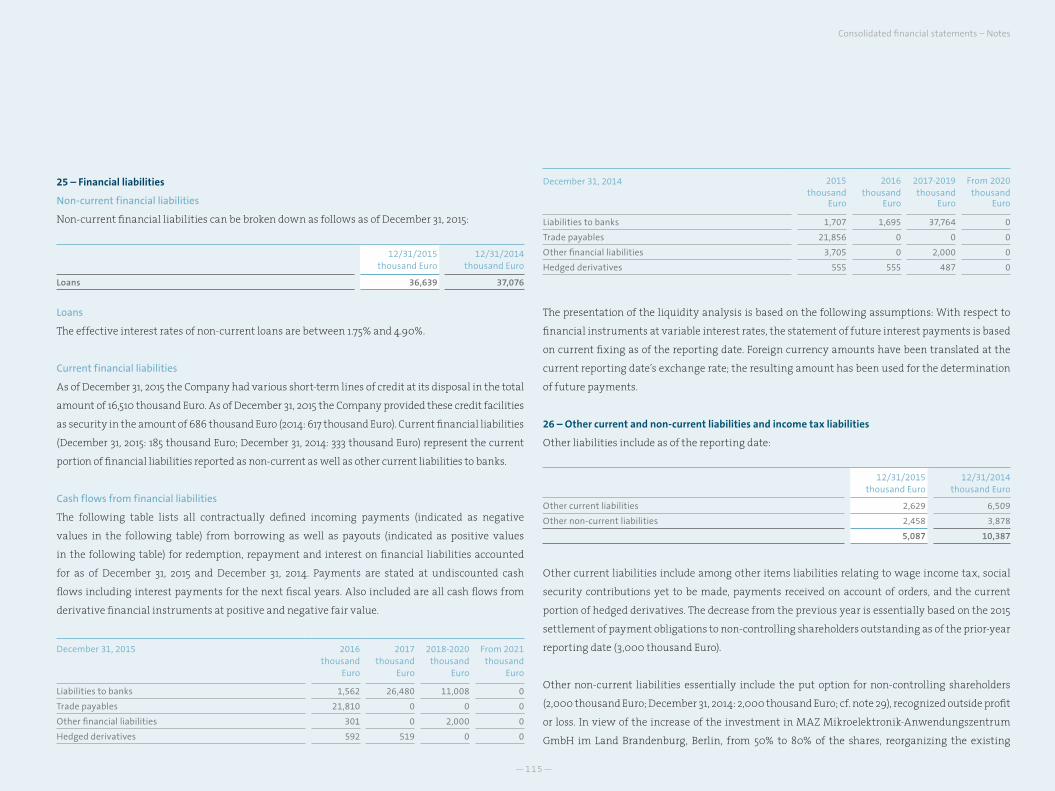
—115—
25 – Financial liabilities
Non-current financial liabilities
Non-current financial liabilities can be broken down as follows as of December 31, 2015:
12/31/2015thousand Euro
12/31/2014thousand Euro
Loans 36,639 37,076
Loans
The effective interest rates of non-current loans are between 1.75% and 4.90%.
Current financial liabilities
As of December 31, 2015 the Company had various short-term lines of credit at its disposal in the total
amount of 16,510 thousand Euro. As of December 31, 2015 the Company provided these credit facilities
as security in the amount of 686 thousand Euro (2014: 617 thousand Euro). Current financial liabilities
(December 31, 2015: 185 thousand Euro; December 31, 2014: 333 thousand Euro) represent the current
portion of financial liabilities reported as non-current as well as other current liabilities to banks.
Cash flows from financial liabilities
The following table lists all contractually defined incoming payments (indicated as negative
values in the following table) from borrowing as well as payouts (indicated as positive values
in the following table) for redemption, repayment and interest on financial liabilities accounted
for as of December 31, 2015 and December 31, 2014. Payments are stated at undiscounted cash
flows including interest payments for the next fiscal years. Also included are all cash flows from
derivative financial instruments at positive and negative fair value.
December 31, 2015 2016thousand
Euro
2017thousand
Euro
2018-2020 thousand
Euro
From 2021 thousand
Euro
Liabilities to banks 1,562 26,480 11,008 0
Trade payables 21,810 0 0 0
Other financial liabilities 301 0 2,000 0
Hedged derivatives 592 519 0 0
December 31, 2014 2015thousand
Euro
2016thousand
Euro
2017-2019thousand
Euro
From 2020thousand
Euro
Liabilities to banks 1,707 1,695 37,764 0
Trade payables 21,856 0 0 0
Other financial liabilities 3,705 0 2,000 0
Hedged derivatives 555 555 487 0
The presentation of the liquidity analysis is based on the following assumptions: With respect to
financial instruments at variable interest rates, the statement of future interest payments is based
on current fixing as of the reporting date. Foreign currency amounts have been translated at the
current reporting date’s exchange rate; the resulting amount has been used for the determination
of future payments.
26 – Other current and non-current liabilities and income tax liabilities
Other liabilities include as of the reporting date:
12/31/2015thousand Euro
12/31/2014thousand Euro
Other current liabilities 2,629 6,509
Other non-current liabilities 2,458 3,878
5,087 10,387
Other current liabilities include among other items liabilities relating to wage income tax, social
security contributions yet to be made, payments received on account of orders, and the current
portion of hedged derivatives. The decrease from the previous year is essentially based on the 2015
settlement of payment obligations to non-controlling shareholders outstanding as of the prior-year
reporting date (3,000 thousand Euro).
Other non-current liabilities essentially include the put option for non-controlling shareholders
(2,000 thousand Euro; December 31, 2014: 2,000 thousand Euro; cf. note 29), recognized outside profit
or loss. In view of the increase of the investment in MAZ Mikroelektronik-Anwendungszentrum
GmbH im Land Brandenburg, Berlin, from 50% to 80% of the shares, reorganizing the existing
Consolidated financial statements – Notes
—116—
Elmos Annual Report 2015
call and put options became necessary. As a consequence the put option, treated as a deferred
item in the amount of 2,392 thousand Euro in fiscal year 2013, was dissolved outside profit or
loss in 2014 and the fair value of the put option on the remaining 20% interest was treated as a
deferred item outside profit or loss based on the adjusted agreement. In combination with this
put option Elmos Semiconductor AG simultaneously concluded a new call option. The identity of
the vesting conditions of both options results in the immediate transfer of the economic property
of the optioned shares (please also refer to note 33). From an economic perspective this meant an
acquisition of 100% of the shares with the recognition of a purchase price liability (in this case in
the amount of 2,000 thousand Euro). In addition to that, other non-current liabilities include the
non-current portion of hedged derivatives (459 thousand Euro; December 31, 2014: 967 thousand
Euro). Hedged derivatives are presented under note 29. The decrease in other non-current liabilities
is based primarily on the reversal of the deferred income item (please also refer to note 14) in
connection with the termination of an existing lease agreement, reported at 911 thousand Euro
(non-current portion of the 1,113 thousand Euro cited under note 10) as of December 31, 2014.
Income tax liabilities amount to 6,889 thousand Euro (December 31, 2014: 2,565 thousand Euro) and
include liabilities of the domestic and international subsidiaries originating in part from previous
years.
27 – Trade payables
Trade payables primarily concern the purchasing of materials and the claiming of services for
maintaining business operations. Trade payables fully mature within one year.
28 – Derivative financial instruments
The Company monitors the development of liabilities at fixed and variable interest rates and of
current and non-current liabilities. In this context, business and other finance risks are reviewed.
In 2010 the Company entered into two variable-interest rate loan agreements (forward loans) to
safeguard financing through fiscal year 2017 within the framework of a comprehensive and long-
term financing strategy oriented toward solidity. These transactions are accompanied by the
respective agreement of a forward interest rate swap in form of a payer swap that corresponds
with the respective underlying transaction in terms of volume, term, currency, and reference
interest rate, i.e. economically the variable interest rate of the forward loan is converted into a fixed
interest rate. The agreed forward loan agreements in the amounts of 15 million Euro (term: August
1, 2013 to September 30, 2017) and 2.5 million Euro (term: November 20, 2012 to November 20, 2017)
form a hedging relationship with the respective forward interest rate swap in accordance with
IAS 39, with the forward loan being declared as hedged item and the respective corresponding
forward interest rate swap being declared as hedge. The reverse cash flows of forward loans and
corresponding forward interest rate swaps are expected to balance each other completely over the
respective terms. Due to the correspondence of the material parameters and terms and conditions
of hedged item and hedge, the hedge is generally suited to provide effective protection for the
hedged item. The hedge as forward interest rate swap is suited to adequately cover the risk of
interest rate changes which affects the performance of the hedged item. The effectiveness of the
hedging connection is regarded as “highly effective” for the beginning, the future, and the term of
the hedging relationship. As the material terms and conditions and the parameters of hedged item
and hedge match (critical term match) and as the transaction as a whole can also be referred to as
a perfect micro hedge, the conditions for an assessment as “highly effective” are entirely given.
The assessment of effectiveness based on a comparison of the critical terms will be conducted as of
the following reporting dates as well. A review conducted as of December 31, 2015 did result in no
changes to the assessment as “highly effective”.
The interest rate swap is recognized at its fair value (market value including accrued interest) in the
statement of financial position (cf. note 29). The cash flow hedging reserve or the cash flow hedge
market value corresponds to the fair value. Changes in the fair value of the hedge are adjusted
outside profit or loss if changes in the hedged item are outside profit or loss or not yet to be accounted
for. The equity item is reversed if the hedged item must be recognized in profit or loss. Deferred tax
outside profit or loss is considered for the market value of the cash flow hedge recognized in the
statement of financial position.
—117—
Within the framework of the comprehensive approach described above, the Company also
concluded two fixed-interest rate forward loans in 2010 with terms until 2017 (face value 7.5
million Euro) and 2018 (face value 10 million Euro) for which there are no corresponding hedges.
The loan with a term until November 20, 2017 (7.5 million Euro) represents follow-up financing of a
loan expired as of November 20, 2012 (10 million Euro). The loan with a term until June 30, 2018 (10
million Euro) represents follow-up financing of a loan expired as of June 30, 2013. Both loans have
been reported under the Group’s financial liabilities since the beginning of their respective terms.
The measurement of the interest rate swaps follows corresponding evaluation procedures or is
based on evaluations provided by the banks involved. The market value of interest rate swaps
accounted for is determined by applying the interest rates and credit ratings of the contracting
parties as of the reporting date on the basis of a discounted cash flow model.
The Company has concluded several currency-related hedges. Those are forward exchange rate
contracts for the currency U.S. dollar; corresponding income or expenses have been stated under
the item “Exchange rate gains/losses” (cf. note 29). The market value of forward exchange rate
contracts is measured in application of the exchange rates as of the reporting date based on market
assessments of the banks involved.
Moreover, the Company concluded structured term deposit transactions in 2015, providing for
repayment of the investment amount in a foreign currency (essentially U.S. dollar) if a predefined
EUR/foreign currency reference exchange rate is exceeded upon the date of maturity of the
transaction (cf. note 29 for further information).
29 – Additional information on financial instruments
Book values, measurement, and fair value according to measurement categories
With respect to the classification of financial instruments, the Company follows the measurement
categories defined by IAS 39 as the spreading of risks within these measurement categories is
similar.
The book values of financial instruments such as trade receivables and trade payables essentially
correspond to the market value due to the short-term maturities of these financial instruments.
The book values of short-term and long-term securities classified as “available for sale correspond to
the market value. Measurement was made on the basis of market values provided by the involved
banks as of the reporting date. Securities classified as “loans and receivables” were measured at
amortized cost.
The (forward) interest rate swaps reported under the item hedged derivatives (cf. note 28) were
recognized at (negative) market value under other financial liabilities outside profit or loss
according to their respective maturities. The determination of the market values as of December
31, 2015 was based on a discounted cash flow (DCF) model in consideration of current interest yield
curves as of the reporting date.
The market value of forward exchange contracts/currency option transactions (cf. note 30) was
determined on the basis of the currency exchange rates provided by the involved banks as of the
reporting date.
The market value of liabilities to banks was established on the basis of market prices determined
for the same or comparable issues and of the interest rates currently offered to the Company.
With respect to other financial liabilities accounted for at fair value, the market value of the put
option for non-controlling shareholders was determined on the basis of a DCF model according to
the terms and conditions of the contract agreed on with the shareholder (please also refer to note 26).
The following tables indicate book values and fair values of each category of financial assets and
liabilities.
Consolidated financial statements – Notes
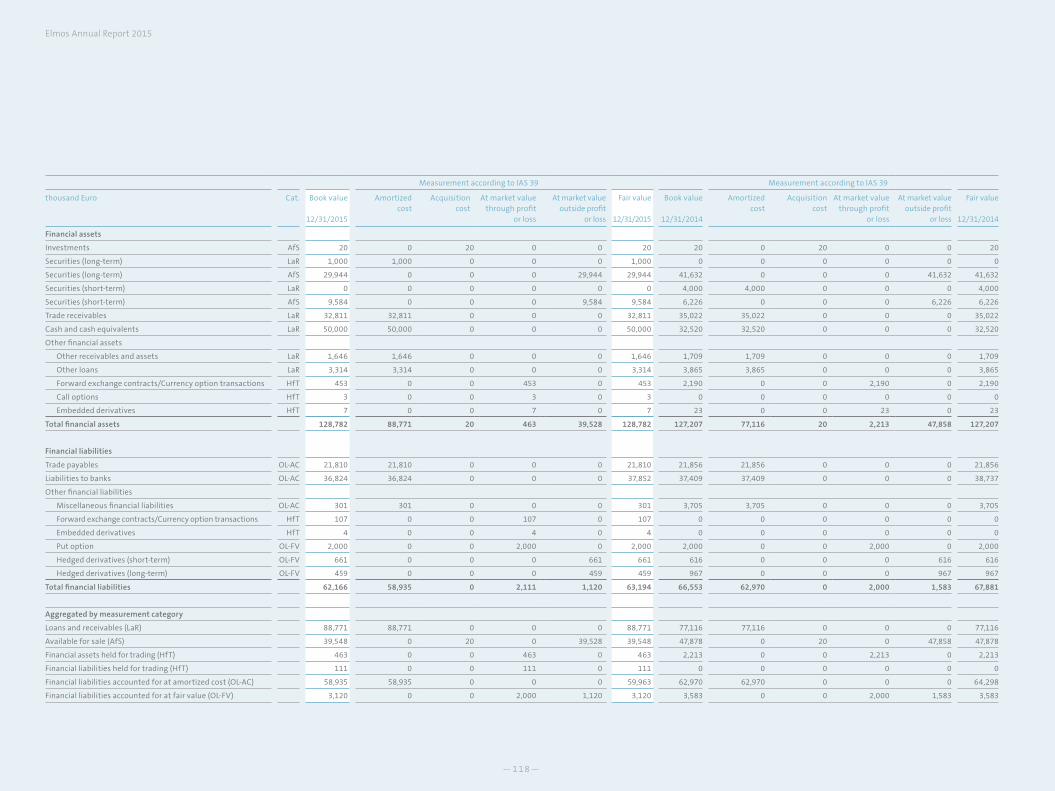
—118—
Elmos Annual Report 2015
Measurement according to IAS 39 Measurement according to IAS 39
thousand Euro Cat. Book value
12/31/2015
Amortized cost
Acquisition cost
At market value through profit
or loss
At market value outside profit
or loss
Fair value
12/31/2015
Book value
12/31/2014
Amortized cost
Acquisition cost
At market value through profit
or loss
At market value outside profit
or loss
Fair value
12/31/2014
Financial assets
Investments AfS 20 0 20 0 0 20 20 0 20 0 0 20
Securities (long-term) LaR 1,000 1,000 0 0 0 1,000 0 0 0 0 0 0
Securities (long-term) AfS 29,944 0 0 0 29,944 29,944 41,632 0 0 0 41,632 41,632
Securities (short-term) LaR 0 0 0 0 0 0 4,000 4,000 0 0 0 4,000
Securities (short-term) AfS 9,584 0 0 0 9,584 9,584 6,226 0 0 0 6,226 6,226
Trade receivables LaR 32,811 32,811 0 0 0 32,811 35,022 35,022 0 0 0 35,022
Cash and cash equivalents LaR 50,000 50,000 0 0 0 50,000 32,520 32,520 0 0 0 32,520
Other financial assets
Other receivables and assets LaR 1,646 1,646 0 0 0 1,646 1,709 1,709 0 0 0 1,709
Other loans LaR 3,314 3,314 0 0 0 3,314 3,865 3,865 0 0 0 3,865
Forward exchange contracts/Currency option transactions HfT 453 0 0 453 0 453 2,190 0 0 2,190 0 2,190
Call options HfT 3 0 0 3 0 3 0 0 0 0 0 0
Embedded derivatives HfT 7 0 0 7 0 7 23 0 0 23 0 23
Total financial assets 128,782 88,771 20 463 39,528 128,782 127,207 77,116 20 2,213 47,858 127,207
Financial liabilities
Trade payables OL-AC 21,810 21,810 0 0 0 21,810 21,856 21,856 0 0 0 21,856
Liabilities to banks OL-AC 36,824 36,824 0 0 0 37,852 37,409 37,409 0 0 0 38,737
Other financial liabilities
Miscellaneous financial liabilities OL-AC 301 301 0 0 0 301 3,705 3,705 0 0 0 3,705
Forward exchange contracts/Currency option transactions HfT 107 0 0 107 0 107 0 0 0 0 0 0
Embedded derivatives HfT 4 0 0 4 0 4 0 0 0 0 0 0
Put option OL-FV 2,000 0 0 2,000 0 2,000 2,000 0 0 2,000 0 2,000
Hedged derivatives (short-term) OL-FV 661 0 0 0 661 661 616 0 0 0 616 616
Hedged derivatives (long-term) OL-FV 459 0 0 0 459 459 967 0 0 0 967 967
Total financial liabilities 62,166 58,935 0 2,111 1,120 63,194 66,553 62,970 0 2,000 1,583 67,881
Aggregated by measurement category
Loans and receivables (LaR) 88,771 88,771 0 0 0 88,771 77,116 77,116 0 0 0 77,116
Available for sale (AfS) 39,548 0 20 0 39,528 39,548 47,878 0 20 0 47,858 47,878
Financial assets held for trading (HfT) 463 0 0 463 0 463 2,213 0 0 2,213 0 2,213
Financial liabilities held for trading (HfT) 111 0 0 111 0 111 0 0 0 0 0 0
Financial liabilities accounted for at amortized cost (OL-AC) 58,935 58,935 0 0 0 59,963 62,970 62,970 0 0 0 64,298
Financial liabilities accounted for at fair value (OL-FV) 3,120 0 0 2,000 1,120 3,120 3,583 0 0 2,000 1,583 3,583
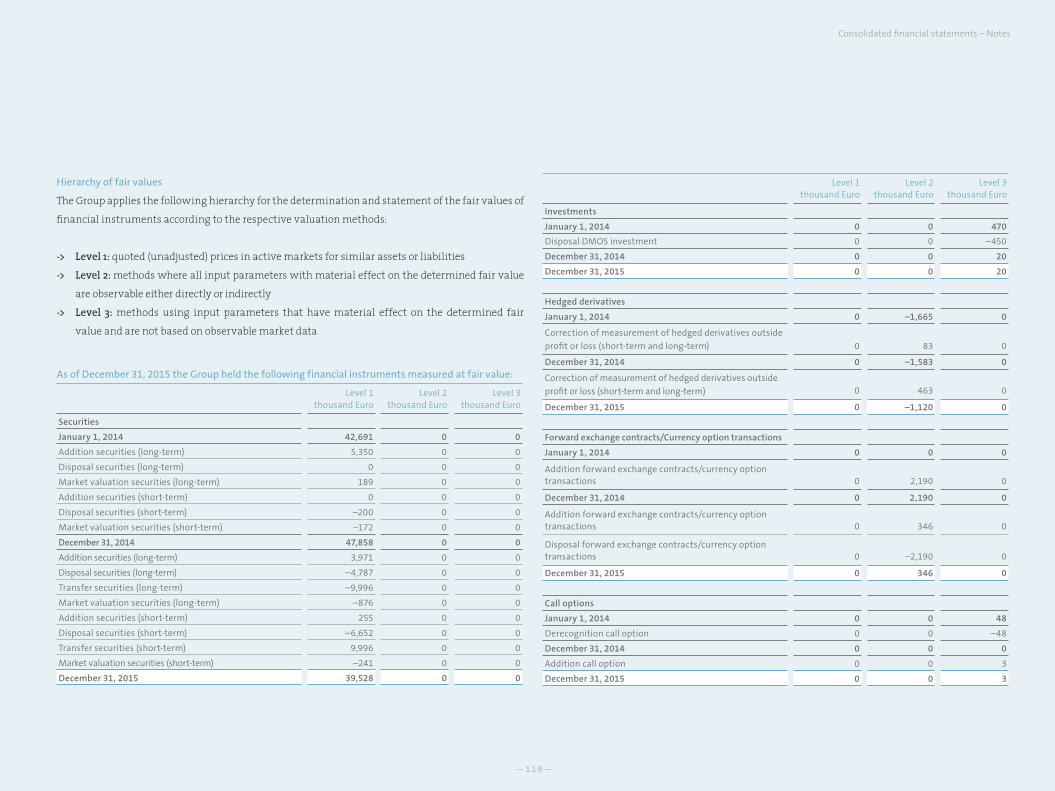
—119—
Hierarchy of fair values
The Group applies the following hierarchy for the determination and statement of the fair values of
financial instruments according to the respective valuation methods:
-> Level 1: quoted (unadjusted) prices in active markets for similar assets or liabilities
-> Level 2: methods where all input parameters with material effect on the determined fair value
are observable either directly or indirectly
-> Level 3: methods using input parameters that have material effect on the determined fair
value and are not based on observable market data
As of December 31, 2015 the Group held the following financial instruments measured at fair value:
Level 1thousand Euro
Level 2 thousand Euro
Level 3 thousand Euro
Securities
January 1, 2014 42,691 0 0
Addition securities (long-term) 5,350 0 0
Disposal securities (long-term) 0 0 0
Market valuation securities (long-term) 189 0 0
Addition securities (short-term) 0 0 0
Disposal securities (short-term) –200 0 0
Market valuation securities (short-term) –172 0 0
December 31, 2014 47,858 0 0
Addition securities (long-term) 3,971 0 0
Disposal securities (long-term) –4,787 0 0
Transfer securities (long-term) –9,996 0 0
Market valuation securities (long-term) –876 0 0
Addition securities (short-term) 255 0 0
Disposal securities (short-term) –6,652 0 0
Transfer securities (short-term) 9,996 0 0
Market valuation securities (short-term) –241 0 0
December 31, 2015 39,528 0 0
Level 1thousand Euro
Level 2 thousand Euro
Level 3 thousand Euro
Investments
January 1, 2014 0 0 470
Disposal DMOS investment 0 0 –450
December 31, 2014 0 0 20
December 31, 2015 0 0 20
Hedged derivatives
January 1, 2014 0 –1,665 0
Correction of measurement of hedged derivatives outside
profit or loss (short-term and long-term) 0 83 0
December 31, 2014 0 –1,583 0
Correction of measurement of hedged derivatives outside
profit or loss (short-term and long-term) 0 463 0
December 31, 2015 0 –1,120 0
Forward exchange contracts/Currency option transactions
January 1, 2014 0 0 0
Addition forward exchange contracts/currency option transactions 0 2,190 0
December 31, 2014 0 2,190 0
Addition forward exchange contracts/currency option transactions 0 346 0
Disposal forward exchange contracts/currency option transactions 0 –2,190 0
December 31, 2015 0 346 0
Call options
January 1, 2014 0 0 48
Derecognition call option 0 0 –48
December 31, 2014 0 0 0
Addition call option 0 0 3
December 31, 2015 0 0 3
Consolidated financial statements – Notes
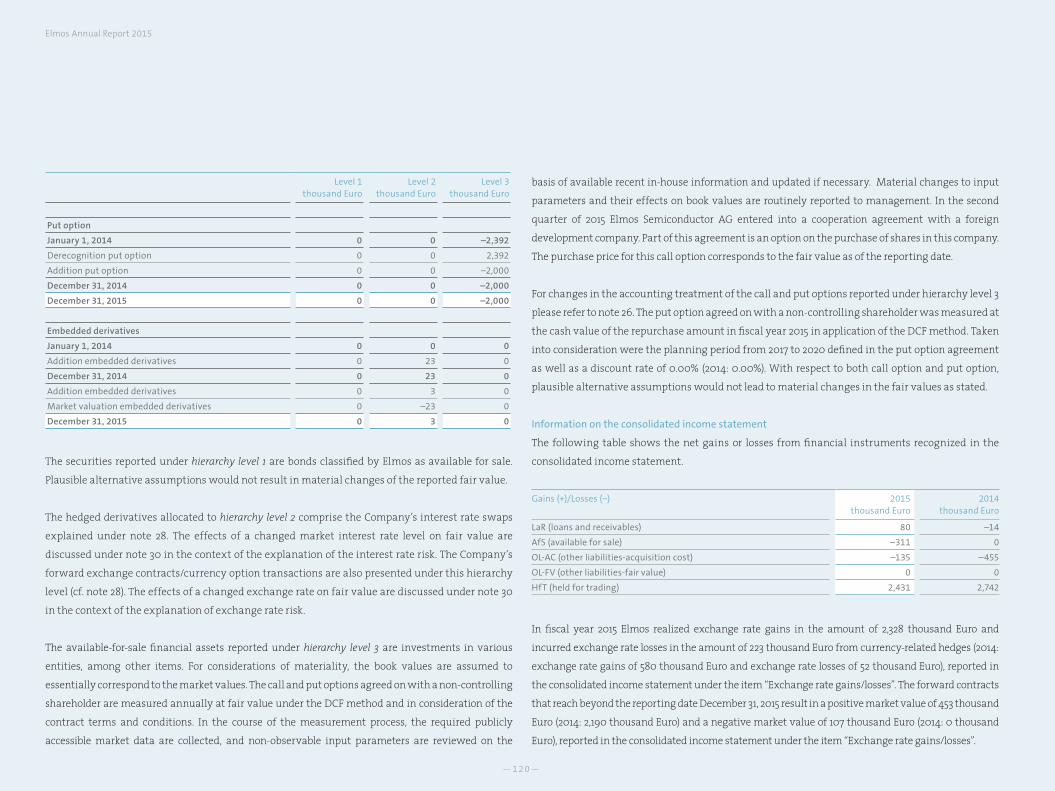
—120—
Elmos Annual Report 2015
Level 1thousand Euro
Level 2 thousand Euro
Level 3 thousand Euro
Put option
January 1, 2014 0 0 –2,392
Derecognition put option 0 0 2,392
Addition put option 0 0 –2,000
December 31, 2014 0 0 –2,000
December 31, 2015 0 0 –2,000
Embedded derivatives
January 1, 2014 0 0 0
Addition embedded derivatives 0 23 0
December 31, 2014 0 23 0
Addition embedded derivatives 0 3 0
Market valuation embedded derivatives 0 –23 0
December 31, 2015 0 3 0
The securities reported under hierarchy level 1 are bonds classified by Elmos as available for sale.
Plausible alternative assumptions would not result in material changes of the reported fair value.
The hedged derivatives allocated to hierarchy level 2 comprise the Company’s interest rate swaps
explained under note 28. The effects of a changed market interest rate level on fair value are
discussed under note 30 in the context of the explanation of the interest rate risk. The Company’s
forward exchange contracts/currency option transactions are also presented under this hierarchy
level (cf. note 28). The effects of a changed exchange rate on fair value are discussed under note 30
in the context of the explanation of exchange rate risk.
The available-for-sale financial assets reported under hierarchy level 3 are investments in various
entities, among other items. For considerations of materiality, the book values are assumed to
essentially correspond to the market values. The call and put options agreed on with a non-controlling
shareholder are measured annually at fair value under the DCF method and in consideration of the
contract terms and conditions. In the course of the measurement process, the required publicly
accessible market data are collected, and non-observable input parameters are reviewed on the
basis of available recent in-house information and updated if necessary. Material changes to input
parameters and their effects on book values are routinely reported to management. In the second
quarter of 2015 Elmos Semiconductor AG entered into a cooperation agreement with a foreign
development company. Part of this agreement is an option on the purchase of shares in this company.
The purchase price for this call option corresponds to the fair value as of the reporting date.
For changes in the accounting treatment of the call and put options reported under hierarchy level 3
please refer to note 26. The put option agreed on with a non-controlling shareholder was measured at
the cash value of the repurchase amount in fiscal year 2015 in application of the DCF method. Taken
into consideration were the planning period from 2017 to 2020 defined in the put option agreement
as well as a discount rate of 0.00% (2014: 0.00%). With respect to both call option and put option,
plausible alternative assumptions would not lead to material changes in the fair values as stated.
Information on the consolidated income statement
The following table shows the net gains or losses from financial instruments recognized in the
consolidated income statement.
Gains (+)/Losses (−) 2015thousand Euro
2014thousand Euro
LaR (loans and receivables) 80 –14
AfS (available for sale) –311 0
OL-AC (other liabilities-acquisition cost) –135 –455
OL-FV (other liabilities-fair value) 0 0
HfT (held for trading) 2,431 2,742
In fiscal year 2015 Elmos realized exchange rate gains in the amount of 2,328 thousand Euro and
incurred exchange rate losses in the amount of 223 thousand Euro from currency-related hedges (2014:
exchange rate gains of 580 thousand Euro and exchange rate losses of 52 thousand Euro), reported in
the consolidated income statement under the item “Exchange rate gains/losses”. The forward contracts
that reach beyond the reporting date December 31, 2015 result in a positive market value of 453 thousand
Euro (2014: 2,190 thousand Euro) and a negative market value of 107 thousand Euro (2014: 0 thousand
Euro), reported in the consolidated income statement under the item “Exchange rate gains/losses”.
—121—
Moreover, the Company concluded structured term deposit transactions in 2015. The effects on
the financial position as of December 31, 2015 are limited to the collected interest income (2014:
collected interest income and exchange rate gains generated in the amount of 0 thousand Euro and
exchange rate losses incurred at 66 thousand Euro).
In the category “available for sale”, securities were written down through profit or loss as the
market value of these financial assets is below their book value and there are objective indications
of impairment within the meaning of IAS 39.59 (f). The corresponding expense of 311 thousand Euro
was determined according to the listed stock market price of these securities and reported in the
consolidated income statement under the item finance expense.
Elmos recognizes valuation allowances for trade receivables classifiable as “loans and receivables”
under other operating expenses. Gains from foreign currency translation of financial assets
classifiable as “loans and receivables” primarily result from trade receivables. Net gains and losses
essentially comprise valuation allowances, currency translation effects, and debt loss.
Expenses or income classifiable as “OL-AC” result from exchange rate differences of trade payables.
Interest relating to financial instruments is stated in interest income (cf. note 8).
30 – Financial risk management and financial derivatives
Basic principles of risk management
Elmos Semiconductor AG comprises the various risk managing measures within the Company in a
uniform and consistent risk management system. This system provides for regular interviews and
the routine identification and assessment of new and known risks by the respective responsible
executives and employees and defines a closed-loop reporting system.
In addition to that, the Elmos Group’s business units give reports on the development of finance
and operations on a monthly basis. By these measures, Management Board and Supervisory Board
are informed about the risk situation regularly and in good time and are thus enabled to decide on
appropriate measures for risk minimization and risk prevention.
The risk management system fulfills the requirements of Section 91 (2) AktG and has been reviewed
by the auditing firm for its compliance with the provisions of the Stock Corporation Act (AktG)
and found suitable for detecting developments that could jeopardize the Company’s continued
existence at an early stage. The risk management system will be expanded continuously and
advanced in response to changing basic conditions in the future.
With respect to its assets, liabilities, planned transactions and firm commitments, Elmos is
particularly exposed to credit risks, liquidity risks, and risks from changes in exchange rates and
interest rates as well as other price risks. The financial risk management aims at detecting and
assessing these market risks early on in a continuous process and in close cooperation with the
Group’s operating business units, and at limiting them if necessary through adequate measures.
A case in point, interest and exchange rate risks are controlled and contained by utilizing suitable
derivatives. In doing so, Elmos enters into forward exchange contracts and currency option
transactions to hedge foreign currency transactions for periods consistent with committed
exposures. These derivative transactions for currency hedging minimize the impact of exchange
rate fluctuations on the Company’s profitability. Elmos exclusively uses these hedging instruments
for non-speculative, risk containing purposes in connection with the hedged items.
The basic principles of financial policy and risk strategy and the derived guidance are discussed
regularly by Management Board and Supervisory Board. The implementation of the strategy and
the operation of financial and risk management are the obligation of the Management Board and
the responsible employees.
In fiscal year 2015 a review of the system for compliance with the requirements resulting from
Section 20 (1) WpHG (German Securities Trading Act) was conducted (“EMIR”), leading to no
objections.
Consolidated financial statements – Notes
—122—
Elmos Annual Report 2015
Credit risk and contingency risk
Liquid assets are essentially cash and cash equivalents. With respect to the investment of liquid
assets, the Group is potentially exposed to losses due to credit risk if banks or issuers do not fulfill
their obligations. Elmos controls the resulting risk position by a diversification of products and
contracting parties.
For the purpose of a portfolio approach, investments of liquid assets are usually short-term to
medium-term in consideration of high flexibility and diversification with respect to banks and
issuers, among other factors. A substantial part of the portfolio is placed with banks with high
credit ratings under deposit protection (e.g. overnight deposits and fixed deposits, structured time
deposits). In addition to that, liquid assets are invested in listed bonds (corporate bonds, structured
bonds with credit rating components) and to a lesser extent, in pursuit of an investment mix, in
borrower’s notes (“Schuldscheinanlagen”). The emphasis of issuer’s ratings continues to be placed
on investment grade ratings.
Trade receivables primarily originate from sales generated with microelectronic components,
sensors, system parts, and development services. Customers are for the most part automotive
suppliers and to a lesser extent companies in the industrial sector, consumer goods industry,
medical technology industry, and other sectors. Accounts receivable are continuously monitored
in the individual segments; contingency risks are met with specific allowances for bad debt.
The terms of payment reflect the historical development of the respective customer-supplier
relationship; observation of the terms is monitored continuously. With respect to new customers,
creditworthiness information is gathered in advance and credit limits are determined if necessary.
Business transactions with major customers are subject to special contingency risk supervision.
Elmos pursues a stringent credit policy altogether. The maximum contingency risk is reflected by
the book values of the financial assets reported in the statement of financial position.
Against the backdrop of continued global uncertainties, outstanding receivables are monitored
and reminded with scrutiny as part of a continuous operational process.
Liquidity and financing risk
The liquidity risk of Elmos addresses the contingency that the Company might not be able to fulfill
its financial obligations, e.g. the payment of finance debt, the payment of trade payables, and the
payment obligations arising from lease agreements, at maturity. A liquidity reserve in the form
of cash and cash equivalents, investments of high fungibility and convertibility into cash, and
sufficiently available free lines of credit is provided so that this risk will not materialize and the
liquidity and financial flexibility of Elmos are assured at any time. In addition to that, the Group’s
liquidity is constantly monitored within the framework of short-term and long-term liquidity
planning. Apart from their respective internal financing power, liquidity of the domestic and
international subsidiaries is provided through the Group’s lines of credit and loans as well as by
banks. The cash flows from financial liabilities are presented under note 25. Further information
about safeguarding medium-term financing can be found under note 28.
Financial market risk
Due to its international business activity, Elmos is exposed to market price risks as a result of
changes in exchange rates, interest rates, and prices for raw materials (e.g. gold). There are also
market price risks within the scope of guaranteeing electric power and natural gas supplies for the
medium term. These market price risks could have a negative effect on the Group’s financial, profit
and economic situation.
a) Exchange rate risk
Business operations as well as financial results and cash flows are partly exposed to risks from
exchange rate fluctuations due to the Company’s international orientation. These fluctuations
occur principally between the euro and the U.S. dollar (USD).
Exchange rate risks result from operating activities (sales, purchasing) and investments. Due to
increased purchasing of services in U.S. dollar, especially assembly and foundry services from
Southeast Asia typically billed in U.S. dollar in the global market, the Group’s currency exposure
has expanded. Generally Elmos still aims for natural hedging, i.e. a balance of U.S. dollar cash
inflow and outflow, and takes measures throughout the Group for containing the exposure. If the
Group management considers it necessary, the excess volume not covered by natural hedging is
—123—
controlled actively by concluding derivative financial instruments for currency hedging, among
other measures. Foreign currency risks that do not affect the Group’s cash flows (i.e. risks resulting
from the translation of foreign subsidiaries’ assets and liabilities into the Group’s reporting
currency) are generally not hedged.
Elmos was exposed to currency risks as of the reporting date. In fiscal year 2015, Elmos realized
exchange rate gains in the amount of 2,328 thousand Euro (2014: 580 thousand Euro) and incurred
exchange rate losses in the amount of 223 thousand Euro (2014: 52 thousand Euro) from U.S. dollar
currency hedges. In addition to that, from the measurement of U.S. dollar hedges still open by
the reporting date, Elmos recorded income of 453 thousand Euro (2014: 2,190 thousand Euro) and
expenses of 107 thousand Euro (2014: 0 thousand Euro) in the consolidated income statement.
Furthermore, exchange rate gains in the amount of 0 thousand Euro (2014: 0 thousand Euro) and
exchange rate losses in the amount of 0 thousand Euro (2014: 66 thousand Euro) resulted in 2015
from structured term deposits where the repayment of the investment amount in foreign currency
(essentially U.S. dollar) is called for insofar as a previously fixed reference exchange rate between
EUR and the foreign currency is exceeded as of the due date of the transaction. These investments
thus resulted solely in interest advantages.
Had the euro been revalued (devalued) against the U.S. dollar by 10% as of December 31, 2015 with
respect to the monetary financial instruments, the income (before taxes) would have been 1,138
thousand Euro lower (1,361 thousand Euro higher) (2014: 1,998 thousand Euro lower (2,424 thousand
Euro higher)). The Group’s equity effect would have been the same amount via the result effect in
consideration of income tax incurred.
b) Interest rate risk
The risk of interest rate changes of Elmos as of the reporting date results from the forward interest
rate swaps concluded in fiscal year 2010 with respect to the correspondingly concluded forward
loans (cf. note 28), among other factors. Had the market interest rate level been higher (lower) by
100 basis points, equity would have been higher by 295 thousand Euro (decrease in equity by 304
thousand Euro) due to group accounting outside profit or loss (2014: increase (decrease) in equity by
493 (501) thousand Euro). Deferred tax on this amount would also have to be considered.
There is also the risk of interest rate changes with respect to the securities classified as “available
for sale”. Had the market interest rate level been higher (lower) by 100 basis points, equity would
have been lower by 738 thousand Euro (increase in equity by 759 thousand Euro) (2014: decrease
(increase) in equity by 1,265 (1,236) thousand Euro) and expenses of 23 thousand Euro (income of 24
thousand Euro) (2014: 0 (0) thousand Euro). Deferred tax on these amounts would also have to be
considered.
With respect to the put option, a 100 basis points higher (lower) market interest rate level would
result in an increase (decrease) in equity of 4 (0) thousand Euro (2014: increase (decrease) in equity
by 59 (0) thousand Euro). The effect on other non-current liabilities would come to a corresponding
amount.
For the forward loans described under note 28, there is no risk from loan commitments as of
December 31, 2015 – corresponding with the previous year – as all loan commitments have been
utilized and there are no new loan commitments.
Elmos is exposed to interest rate risks primarily in the euro area. Within the context of financing
decisions, the Management Board regularly determines the target mix of fixed and variable-
interest liabilities, and the financing structure is derived and implemented on that basis. For
long-term financing projects, fixed interest rates are usually agreed on for securing the basis of
calculation. Interest derivatives are also utilized if necessary.
Further information about securing long-term financing can be found under note 28.
c) Other price risks
Elmos has secured the supply with electricity and natural gas since fiscal year 2014 for the medium
term by concluding a fixed price in advance. A 10% higher (lower) electricity rate would result in an
increase (decrease) in earnings by 175 thousand Euro (175 thousand Euro) for fiscal year 2015 (2014:
increase (decrease) in earnings by 142 thousand Euro (141 thousand Euro)). A 10% higher (lower) gas
Consolidated financial statements – Notes
—124—
Elmos Annual Report 2015
OTHER INFORMATION
31 – Government grants
The Company receives subsidies or government grants used for financing research and development
projects as well as subsidies in accordance with the German Combined Heat and Power Act (“Kraft-
Wärme-Kopplungsgesetz” – KWKG). Government grants used for research and development
projects were offset against research and development expenses and recognized in that item (653
thousand Euro in 2015, 611 thousand Euro in 2014). Subsidies according to the KWKG were allocated
to the individual functional areas depending on causation and offset accordingly (399 thousand
Euro in 2015, 491 thousand Euro in 2014). Government grants for capital expenditures for property,
plant and equipment were collected in the amount of 46 thousand Euro in 2015 (0 thousand Euro
in 2014).
32 – Other financial liabilities and contingencies
The Company has entered into non-cancelable rental and lease agreements for the administration
building and a parking garage, the terms of which extend until 2021. The Company has also
entered into lease agreements for technical equipment and machinery as well as factory and office
equipment, the terms of which extend until 2019 in part. Furthermore, there are lease agreements
for the car pool, office machines, and technical equipment and machinery to a customary extent.
In fiscal year 2015 lease agreements with respect to the production building were terminated
amicably ahead of schedule. The underlying assets (land and building) were bought back and are
now reported under property, plant and equipment in the consolidated financial statements (cf.
note 14).
Within the framework of the lease agreements with Epigone, Elmos is committed to lease payments
of 4,988 thousand Euro until 2021 (including contributions to administrative expenses and sales
tax) plus payments of 2,340 thousand Euro for tenant loans (cf. note 14).
SMI entered into a property lease agreement on January 26, 2006 for land and a plant erected
thereon with McCarthy Manager LLC, Washington/U.S.A. The contract provides for a term of 15
years. The monthly lease is 60 thousand U.S. dollars with the provision of an annual adjustment
price would result in an increase (decrease) in earnings by 238 thousand Euro (237 thousand Euro)
for fiscal year 2015 (2014: increase (decrease) in earnings by 317 thousand Euro (317 thousand Euro)).
The Group’s equity effect with respect to electricity and natural gas would have been the same
amount via the result effect in consideration of income tax incurred.
Capital management
It is the primary objective of the Elmos Group’s capital management to assure that an adequate
credit rating, liquidity at any time and at high financial flexibility, and a solid capital structure
are maintained in support of the Company’s business operations and their continuation in the
long term and for the protection of the interests of the shareholders, employees, and all other
addressees of the annual report. Elmos stands for the strategy of a continuous, sustained increase
in shareholder value.
The Management Board actively controls the capital structure of the Elmos Group and makes
adjustments in consideration of the economic framework as well as the risks carried by the
corresponding assets. For maintaining or adjusting the capital structure, e.g. dividends may be
paid to the shareholders or new stock may be issued. As of December 31, 2015 and December 31, 2014,
no changes were made to the objectives, guidelines, or procedures.
The Group monitors its capital based on net debt or rather net cash in absolute terms and the equity
ratio. Net cash includes cash and cash equivalents as well as securities less current and non-current
financial liabilities. The equity ratio puts equity in proportion to total assets.
2015 2014
Net cash 53.7 million Euro 47.0 million Euro
Equity ratio 71.5% 70.0%
—125—
linked to the U.S. consumer price index, plus supplementary lease of currently 18 thousand U.S.
dollars. The agreement is not cancelable during the lease term. After the completion of the lease
term, SMI may demand the extension of the lease for another ten years, and the lessor may demand
an extension for another five years.
In 2005 Elmos entered into an agreement for the provision of research and development services
as well as the use of a production line with a contract term until 2015; the period for using the
production line has meanwhile been extended to 2017.
Total expenditure for rental and lease agreements amounted to 8,404 thousand Euro in 2015 and
9,791 thousand Euro in 2014.
As of December 31, 2015 and December 31, 2014, future minimum payments owed under non-
cancelable rental, lease, maintenance, and insurance agreements with initial or remaining terms
of more than one year are as follows:
Rental and lease payments, maintenance, insurance premiums, various purchase obligations, etc.
December 31, 2015thousand Euro
December 31, 2014thousand Euro
2015 n/a 24,312
2016 25,615 17,242
2017 10,898 10,733
2018 7,556 6,159
2019 4,164 5,429
2020 3,060 n/a1
Later years 2,043 5,043
53,336 68,918
1 Included in later years
There is a purchase commitment in the amount of 4,283 thousand Euro from investment orders
placed (2014: 2,867 thousand Euro).
Elmos has assumed joint liability, in effect until 2016 at the latest, with respect to lease liabilities
transferred to a third-party company within the framework of an asset deal in the amount of 45
thousand Euro as of the reporting date (2014: 379 thousand Euro). So far no claims have been filed.
The risk of future claims is considered low.
33 – Group companies
The parent company as well as the subsidiaries controlled in accordance with IFRS 10 have been
included in the consolidated financial statements at hand.
Capital share 1
(direct and
indirect) in %
Parent
Elmos Semiconductor AG, Dortmund
Subsidiaries
Elmos Design Services B.V., Nijmegen/Netherlands 100.0
Elmos Korea Co. Ltd., Seoul/Korea 100.0
Elmos N.A. Inc., Farmington Hills/U.S.A. 100.0
Elmos Semiconductor B.V., Nijmegen/Netherlands 100.0
Elmos Semiconductor Singapore Pte. Ltd., Singapore 100.0
Elmos Japan K.K., Tokyo/Japan 100.0
Elmos Semiconductor Technology (Shanghai) Co., Ltd., Shanghai/China 100.0
Elmos Services B.V., Nijmegen/Netherlands 100.0
European Semiconductor Assembly (eurasem) B.V., Nijmegen/Netherlands 100.0
GED Electronic Design GmbH, Frankfurt/Oder 100.0
DMOS Dresden MOS Design GmbH, Dresden 74.8
MAZ Mikroelektronik-Anwendungszentrum GmbH im Land Brandenburg, Berlin 80.0
Mechaless Systems GmbH, Bruchsal 100.0
Micro Systems on Silicon (MOS) Limited, Pretoria/South Africa 51.0
Silicon Microstructures Inc., Milpitas/U.S.A. 100.0
1 Unchanged from the previous year
Consolidated financial statements – Notes
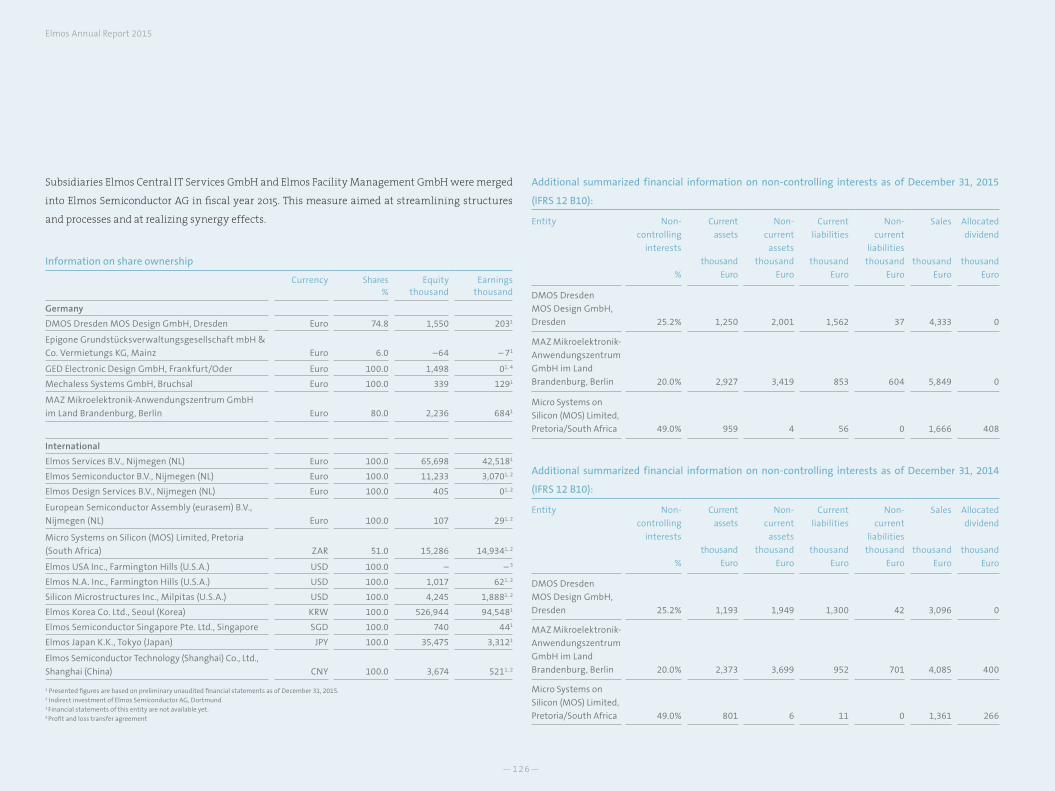
—126—
Elmos Annual Report 2015
Subsidiaries Elmos Central IT Services GmbH and Elmos Facility Management GmbH were merged
into Elmos Semiconductor AG in fiscal year 2015. This measure aimed at streamlining structures
and processes and at realizing synergy effects.
Information on share ownership
Currency Shares %
Equity thousand
Earnings thousand
Germany
DMOS Dresden MOS Design GmbH, Dresden Euro 74.8 1,550 2031
Epigone Grundstücksverwaltungsgesellschaft mbH &
Co. Vermietungs KG, Mainz Euro 6.0 –64 – 71
GED Electronic Design GmbH, Frankfurt/Oder Euro 100.0 1,498 01, 4
Mechaless Systems GmbH, Bruchsal Euro 100.0 339 1291
MAZ Mikroelektronik-Anwendungszentrum GmbH
im Land Brandenburg, Berlin Euro 80.0 2,236 6841
International
Elmos Services B.V., Nijmegen (NL) Euro 100.0 65,698 42,5181
Elmos Semiconductor B.V., Nijmegen (NL) Euro 100.0 11,233 3,0701, 2
Elmos Design Services B.V., Nijmegen (NL) Euro 100.0 405 01, 2
European Semiconductor Assembly (eurasem) B.V.,
Nijmegen (NL) Euro 100.0 107 291, 2
Micro Systems on Silicon (MOS) Limited, Pretoria
(South Africa) ZAR 51.0 15,286 14,9341, 2
Elmos USA Inc., Farmington Hills (U.S.A.) USD 100.0 – – 3
Elmos N.A. Inc., Farmington Hills (U.S.A.) USD 100.0 1,017 621, 2
Silicon Microstructures Inc., Milpitas (U.S.A.) USD 100.0 4,245 1,8881, 2
Elmos Korea Co. Ltd., Seoul (Korea) KRW 100.0 526,944 94,5481
Elmos Semiconductor Singapore Pte. Ltd., Singapore SGD 100.0 740 441
Elmos Japan K.K., Tokyo (Japan) JPY 100.0 35,475 3,3121
Elmos Semiconductor Technology (Shanghai) Co., Ltd.,
Shanghai (China) CNY 100.0 3,674 5211, 2
1 Presented figures are based on preliminary unaudited financial statements as of December 31, 2015.2 Indirect investment of Elmos Semiconductor AG, Dortmund3 Financial statements of this entity are not available yet.4 Profit and loss transfer agreement
Additional summarized financial information on non-controlling interests as of December 31, 2015
(IFRS 12 B10):
Entity Non-
controlling
interests
%
Current
assets
thousand
Euro
Non-
current
assets
thousand
Euro
Current
liabilities
thousand
Euro
Non-
current
liabilities
thousand
Euro
Sales
thousand
Euro
Allocated
dividend
thousand
Euro
DMOS Dresden
MOS Design GmbH,
Dresden 25.2% 1,250 2,001 1,562 37 4,333 0
MAZ Mikroelektronik-
Anwendungszentrum
GmbH im Land
Brandenburg, Berlin 20.0% 2,927 3,419 853 604 5,849 0
Micro Systems on
Silicon (MOS) Limited,
Pretoria/South Africa 49.0% 959 4 56 0 1,666 408
Additional summarized financial information on non-controlling interests as of December 31, 2014
(IFRS 12 B10):
Entity Non-
controlling
interests
%
Current
assets
thousand
Euro
Non-
current
assets
thousand
Euro
Current
liabilities
thousand
Euro
Non-
current
liabilities
thousand
Euro
Sales
thousand
Euro
Allocated
dividend
thousand
Euro
DMOS Dresden
MOS Design GmbH,
Dresden 25.2% 1,193 1,949 1,300 42 3,096 0
MAZ Mikroelektronik-
Anwendungszentrum
GmbH im Land
Brandenburg, Berlin 20.0% 2,373 3,699 952 701 4,085 400
Micro Systems on
Silicon (MOS) Limited,
Pretoria/South Africa 49.0% 801 6 11 0 1,361 266
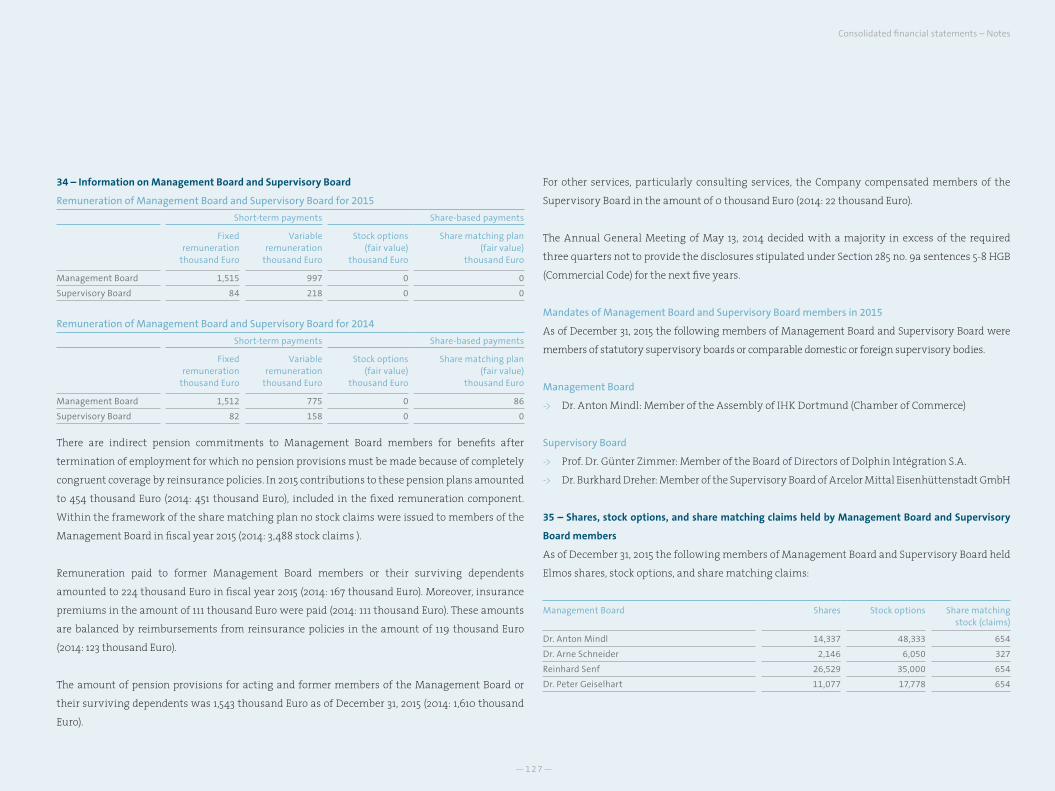
—127—
34 – Information on Management Board and Supervisory Board
Remuneration of Management Board and Supervisory Board for 2015
Short-term payments Share-based payments
Fixed remuneration
thousand Euro
Variable remuneration
thousand Euro
Stock options(fair value)
thousand Euro
Share matching plan (fair value)
thousand Euro
Management Board 1,515 997 0 0
Supervisory Board 84 218 0 0
Remuneration of Management Board and Supervisory Board for 2014
Short-term payments Share-based payments
Fixed remuneration
thousand Euro
Variable remuneration
thousand Euro
Stock options(fair value)
thousand Euro
Share matching plan (fair value)
thousand Euro
Management Board 1,512 775 0 86
Supervisory Board 82 158 0 0
There are indirect pension commitments to Management Board members for benefits after
termination of employment for which no pension provisions must be made because of completely
congruent coverage by reinsurance policies. In 2015 contributions to these pension plans amounted
to 454 thousand Euro (2014: 451 thousand Euro), included in the fixed remuneration component.
Within the framework of the share matching plan no stock claims were issued to members of the
Management Board in fiscal year 2015 (2014: 3,488 stock claims ).
Remuneration paid to former Management Board members or their surviving dependents
amounted to 224 thousand Euro in fiscal year 2015 (2014: 167 thousand Euro). Moreover, insurance
premiums in the amount of 111 thousand Euro were paid (2014: 111 thousand Euro). These amounts
are balanced by reimbursements from reinsurance policies in the amount of 119 thousand Euro
(2014: 123 thousand Euro).
The amount of pension provisions for acting and former members of the Management Board or
their surviving dependents was 1,543 thousand Euro as of December 31, 2015 (2014: 1,610 thousand
Euro).
For other services, particularly consulting services, the Company compensated members of the
Supervisory Board in the amount of 0 thousand Euro (2014: 22 thousand Euro).
The Annual General Meeting of May 13, 2014 decided with a majority in excess of the required
three quarters not to provide the disclosures stipulated under Section 285 no. 9a sentences 5-8 HGB
(Commercial Code) for the next five years.
Mandates of Management Board and Supervisory Board members in 2015
As of December 31, 2015 the following members of Management Board and Supervisory Board were
members of statutory supervisory boards or comparable domestic or foreign supervisory bodies.
Management Board
-> Dr. Anton Mindl: Member of the Assembly of IHK Dortmund (Chamber of Commerce)
Supervisory Board
-> Prof. Dr. Günter Zimmer: Member of the Board of Directors of Dolphin Intégration S.A.
-> Dr. Burkhard Dreher: Member of the Supervisory Board of Arcelor Mittal Eisenhüttenstadt GmbH
35 – Shares, stock options, and share matching claims held by Management Board and Supervisory
Board members
As of December 31, 2015 the following members of Management Board and Supervisory Board held
Elmos shares, stock options, and share matching claims:
Management Board Shares Stock options Share matching stock (claims)
Dr. Anton Mindl 14,337 48,333 654
Dr. Arne Schneider 2,146 6,050 327
Reinhard Senf 26,529 35,000 654
Dr. Peter Geiselhart 11,077 17,778 654
Consolidated financial statements – Notes
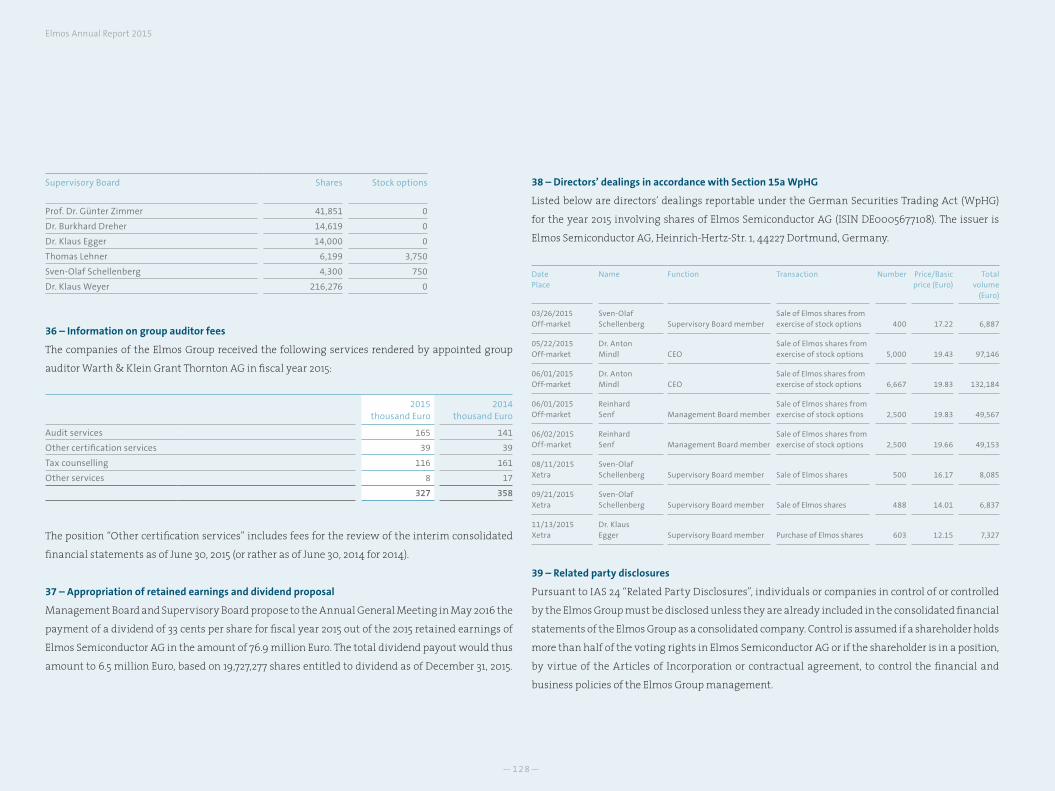
—128—
Elmos Annual Report 2015
Supervisory Board Shares Stock options
Prof. Dr. Günter Zimmer 41,851 0
Dr. Burkhard Dreher 14,619 0
Dr. Klaus Egger 14,000 0
Thomas Lehner 6,199 3,750
Sven-Olaf Schellenberg 4,300 750
Dr. Klaus Weyer 216,276 0
36 – Information on group auditor fees
The companies of the Elmos Group received the following services rendered by appointed group
auditor Warth & Klein Grant Thornton AG in fiscal year 2015:
2015thousand Euro
2014thousand Euro
Audit services 165 141
Other certification services 39 39
Tax counselling 116 161
Other services 8 17
327 358
The position “Other certification services” includes fees for the review of the interim consolidated
financial statements as of June 30, 2015 (or rather as of June 30, 2014 for 2014).
37 – Appropriation of retained earnings and dividend proposal
Management Board and Supervisory Board propose to the Annual General Meeting in May 2016 the
payment of a dividend of 33 cents per share for fiscal year 2015 out of the 2015 retained earnings of
Elmos Semiconductor AG in the amount of 76.9 million Euro. The total dividend payout would thus
amount to 6.5 million Euro, based on 19,727,277 shares entitled to dividend as of December 31, 2015.
38 – Directors’ dealings in accordance with Section 15a WpHG
Listed below are directors’ dealings reportable under the German Securities Trading Act (WpHG)
for the year 2015 involving shares of Elmos Semiconductor AG (ISIN DE0005677108). The issuer is
Elmos Semiconductor AG, Heinrich-Hertz-Str. 1, 44227 Dortmund, Germany.
Date Place
Name Function Transaction Number Price/Basic price (Euro)
Total volume
(Euro)
03/26/2015Off-market
Sven-Olaf Schellenberg Supervisory Board member
Sale of Elmos shares from exercise of stock options 400 17.22 6,887
05/22/2015Off-market
Dr. Anton Mindl CEO
Sale of Elmos shares from exercise of stock options 5,000 19.43 97,146
06/01/2015Off-market
Dr. Anton Mindl CEO
Sale of Elmos shares from exercise of stock options 6,667 19.83 132,184
06/01/2015Off-market
Reinhard Senf Management Board member
Sale of Elmos shares from exercise of stock options 2,500 19.83 49,567
06/02/2015Off-market
Reinhard Senf Management Board member
Sale of Elmos shares from exercise of stock options 2,500 19.66 49,153
08/11/2015 Xetra
Sven-Olaf Schellenberg Supervisory Board member Sale of Elmos shares 500 16.17 8,085
09/21/2015 Xetra
Sven-Olaf Schellenberg Supervisory Board member Sale of Elmos shares 488 14.01 6,837
11/13/2015Xetra
Dr. Klaus Egger Supervisory Board member Purchase of Elmos shares 603 12.15 7,327
39 – Related party disclosures
Pursuant to IAS 24 “Related Party Disclosures”, individuals or companies in control of or controlled
by the Elmos Group must be disclosed unless they are already included in the consolidated financial
statements of the Elmos Group as a consolidated company. Control is assumed if a shareholder holds
more than half of the voting rights in Elmos Semiconductor AG or if the shareholder is in a position,
by virtue of the Articles of Incorporation or contractual agreement, to control the financial and
business policies of the Elmos Group management.

—129—
Mandatory disclosure pursuant to IAS 24 also includes transactions with associated companies
and individuals who have significant influence over the Elmos Group’s financial and business
policies, including close relatives or interconnected companies. Significant influence on the Elmos
Group’s financial and business policies may be based on an interest in Elmos Semiconductor AG of
20% or more, a position on the Management Board or Supervisory Board of Elmos Semiconductor
AG, or another key function in management.
The Elmos Group maintains relationships with closely related companies and persons in the
context of usual business activity. These supply and performance relationships are transacted at
market prices.
Apart from the remuneration of Management Board and Supervisory Board, representing the key
management personnel of the Elmos Group, disclosed under note 34 (“Information on Management
Board and Supervisory Board”), there are no material relationships with related individuals.
Beyond that, companies of the Elmos Group did not engage in any material reportable transactions
with members of the Management Board or the Supervisory Board of Elmos Semiconductor AG,
other key executives in management, or with companies whose managing or supervising bodies
these individuals are represented in. This also applies for close relatives of said group of people.
40 – Number of employees
In fiscal year 2015 the average number of employees in the Group was 1,117 (2014: 1,104).
The average number of employees can be broken down as follows:
Group 2015Number
2014Number
Production 520 5301
Sales 100 991
Administration 162 1581
Quality control 40 37
Research & development 295 2801
Total 1,117 1,104
1 Prior-year number has been adjusted
41 – Significant events after the end of the fiscal year
In January 2016 Elmos Semiconductor AG acquired shares in a company concerned with sensor
technology. The company will be included in the consolidated financial statements of Elmos as an
associated company starting in fiscal year 2016.
There have been no other reportable events or transactions of special significance after the end of
the fiscal year.
42 – Declaration of compliance in accordance with Section 161 AktG
In September 2015 Management Board and Supervisory Board of Elmos Semiconductor AG released
the declaration pursuant to Section 161 AktG (Stock Corporation Act) and made it permanently
available to the shareholders on the Company’s website.
Dortmund, March 2, 2016
Dr. Anton Mindl Dr. Arne Schneider Reinhard Senf Dr. Peter Geiselhart
Consolidated financial statements – Notes
—130—
Elmos Annual Report 2015
We have issued the following audit opinion on the consolidated financial statements and the joint management report, the audited version of which includes the complete and identical remuneration report as contained here as part of the corporate governance report:
“We have audited the consolidated financial statements prepared by Elmos Semiconductor AG, Dortmund, comprising the consolidated statement of financial position, consolidated income statement, consolidated statement of comprehensive income, consolidated statement of cash flows, consolidated statement of changes in equity, and the notes to the consolidated financial statements, together with the group management report, combined with the management report of Elmos Semiconductor AG, for the fiscal year ended December 31, 2015. The preparation of the consolidated financial statements and the joint management report in accordance with IFRS as applicable in the EU and the additional requirements of German commercial law pursuant to Sec. 315a (1) HGB (Commercial Code) is the responsibility of the Company’s management. Our responsibility is to express an opinion on the consolidated financial statements and on the joint management report based on our audit.
We conducted our audit of the consolidated financial statements in accordance with Section 317 HGB and the generally accepted German standards for the audit of financial statements promulgated by the Institut der Wirtschaftsprüfer (IDW – Institute of Public Auditors in Germany). Under those standards we are required to plan and perform the audit such that misstatements and violations materially affecting the presentation of the net assets, financial position and results of operations in the consolidated financial statements in accordance with the applicable financial reporting framework and in the joint management report are detected with reasonable assurance. Knowledge of the business activities and the economic and legal environment of the Group and expectations as to possible misstatements are taken into account in the determination
of audit procedures. The effectiveness of the accounting-related internal control system and the evidence supporting the disclosures in the consolidated financial statements and the joint management report are examined primarily on a test basis within the framework of the audit. The audit includes assessing the annual financial statements of the entities included in the consolidated financial statements, the definition of the basis of consolidation, the accounting and consolidation principles used and the significant estimates made by management, as well as evaluating the overall presentation of the consolidated financial statements and the joint management report. We believe that our audit provides a reasonable basis for our opinion.
Our audit has not led to any reservations.
In our opinion, based on the findings of our audit, the consolidated financial statements of Elmos Semiconductor AG, Dortmund, for the fiscal year ended December 31, 2015 comply with the IFRS as applicable in the EU and the additional requirements of German commercial law pursuant to Sec. 315a (1) HGB and give a true and fair view of the net assets, financial position and results of operations of the Group in accordance with these requirements. The joint management report is consistent with the consolidated financial statements and as a whole provides a fair view of the Group’s position and presents the opportunities and risks of future development correctly.”
Düsseldorf, March 2, 2016
Warth & Klein Grant Thornton AGWirtschaftsprüfungsgesellschaft
Dr. Thomas Senger Ulrich DierschWirtschaftsprüfer Wirtschaftsprüfer
Auditor s report
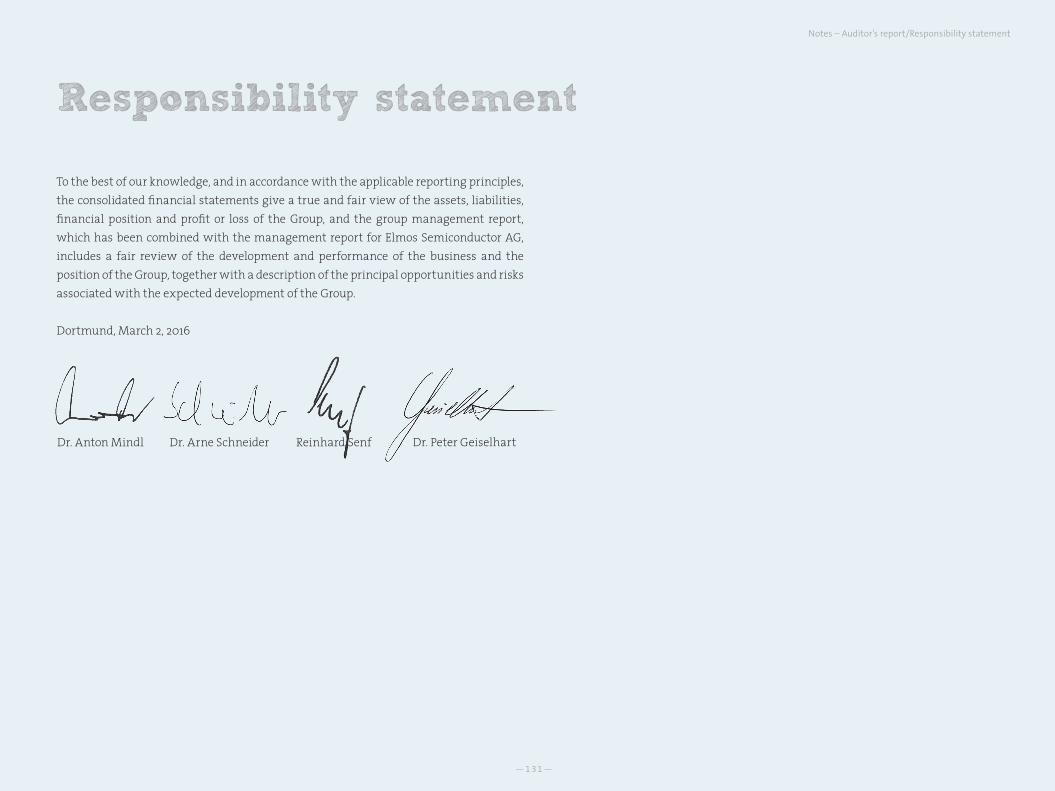
—131—
Responsibility statement
To the best of our knowledge, and in accordance with the applicable reporting principles, the consolidated financial statements give a true and fair view of the assets, liabilities, financial position and profit or loss of the Group, and the group management report, which has been combined with the management report for Elmos Semiconductor AG, includes a fair review of the development and performance of the business and the position of the Group, together with a description of the principal opportunities and risks associated with the expected development of the Group.
Dortmund, March 2, 2016
Dr. Anton Mindl Dr. Arne Schneider Reinhard Senf Dr. Peter Geiselhart
Notes – Auditor’s report/Responsibility statement
—132—
Elmos Annual Report 2015
Advanced driver assistance systems Advanced driver assistance systems (ADAS) are electronic devices in cars for the driver’s support in certain driving situations. The focus is often placed on safety aspects but also on increasing the driving comfort (e.g. by automatic parking or automatic braking systems).
Ambient lighting Colored LEDs are used for lighting car interiors. Using such flexible LEDs results in new concepts for the interior the driver can influence in terms of color.
ASIC An application specific integrated circuit (ASIC) is a circuit developed individually for a specific application and a specific customer, as opposed to standard com-ponents that are not configured in a customer specific way, for example voltage regulators, memory chips, and processors.
ASSP An application specific standard product (ASSP) is an integrated circuit developed individually for a specific application. It can be marketed to several customers as an application standard.
Backend manufacturing Backend manufacturing describes the part of the semiconductor manufacturing process that is carried out after the wafer has left the clean room. The inspection of the chips on the wafer, assembly (fitting the IC into the package), the functional testing of the assembled components, and packing (tape&reel) are all part of this process.
BLDC motor A brushless DC motor is a rotating electric machine with a classic three-phase stator. BLDC motors operate lossless unlike brush motors. They are also maintenance-free and durable.
BUS A communication system that allows the exchange of information between several participants on an electronic or optical basis. Among the standards used in the automobile are the following: LIN, CAN, MOST, and FlexRay™.
Chip An electronic circuit that contains electric functions realized in semiconductor material.
Clean room A sealed-off part of a building where humi-dity, temperature and dust particle contamination are monitored and maintained precisely.
CMOS Complementary metal oxide semiconductor (CMOS) is the basic technology for manufacturing microchips with a high integration rate and low energy consumption.
Design win or design in A design win is a new contract for a project acquired from a customer. Such a contract covers product development (in case of an ASIC) or the use of an existing component (in case of an ASSP, so-called design in), usually by specifying planned unit numbers and prices. Binding orders are placed at a later point in time.
Distributor Distributors are business partners responsible for pushing the marketing and distribution primarily of standard products.
Electronic circuit A combination of different electrical components, each assuming a specific function within an electrical system.
Glossary
—133—
ESD Electrostatic discharge (ESD) is for instance a spark which causes a short high electric voltage pulse in an electronic device. Depending on the circumstances, such a voltage pulse can damage electrical components.
FlexRay™ The high-speed bus system FlexRay™ is a standard for time-critical applications e.g. in car networks. Among other fields of use, FlexRay™ facilitates real-time communication in active chassis control systems.
Foundry A semiconductor manufacturer whose primary business objective is the production and sale of processed silicon wafers. Development and distribution of the wafer-based products are provided by the foundry’s customers.
Frontend manufacturing The production of electronic circuits on silicon wafers by means of physical and chemical processing methods under clean room conditions.
Functional safety Functional safety according to ISO 26262 defines a process model for the development of safety relevant systems, aiming at the avoidance of unjustifiable risks.
HALIOS® HALIOS® (High Ambient Light Independent Optical System) technology is distinguished by its detection of three-dimensional motion. Optical outside influences such as strong incidence of light or dust do not affect the performance. The electronic compensation of external light influence is the technically deciding function.
HMI The acronym HMI stands for Human-Machine Interface. It describes the different ways a human being can operate a machine. This can happen for instance by way of switches, voice command, or gesture control.
Industry 4.0 The term industry 4.0 stands for creating an intelligent network of product development, production, logistics, and customers. Its goal is the autonomous sensor-supported planning and control of production resources (manufacturing machinery, robots, feed and storage systems, and operating material).
Integrated circuit, IC An electronic circuit consisting of different miniaturized electronic components (e.g. resistors, capacitors, transistors, etc.) embedded in semiconductor material.
IO-Link is a communication standard for connecting sensors and actuators to an industrial automation system.
KNX The KNX protocol is a global standard for data exchange most often used in building automation. KNX controls the heat, lights, blinds, air condition, multimedia, and security technology, among other things.
Layout Describes the information gained from circuit development that is required for manufacturing inte-grated circuits with simple geometric shapes.
MEMS Micro-electro-mechanical systems are in particular sensors based on semiconductor technologies. Among other values, they can detect pressure, acceleration, or tilt.
Appendix – Glossary
—134—
Elmos Annual Report 2015
Microprocessor/Microcontroller An integrated, complex electronic unit programmed to control and operate an electronic system. Microprocessors are the central brains of an electronic system such as the computer.
Microsystem A microsystem is the combination of sensorics and readout electronics in a special package. Among other advantages, a microsystem requires very little constructed space due to its high integration level.
Mixed-signal A combination of analog and digital signals simultaneously generated, controlled, or modified on one and the same chip.
MOS Metal oxide semiconductor (MOS) describes the setup of the central control device for the field effect in a particular category of semiconductor transistors.
OEM An original equipment manufacturer (OEM) distri-butes (partial) systems to a reseller. In the automotive industry, the car manufacturers are referred to as OEMs.
PIR sensor The PIR sensor (for passive infrared) is the most commonly used type of motion detector. It shows the optimal response to angle changes, i.e. if a person walks by the sensor.
Pressure sensor The pressure sensor can detect low or high pressure, depending on the application, and transmit the data to readout electronics. Pressure sensors find use for instance in medical applications (e.g. respirators, blood pressure meters) or automotive applications (e.g. tire pressure monitoring).
RoIC The return on invested capital (RoIC) is a key ratio used in finance and describes the profitability of invested capital. RoIC is determined by earnings before interest and taxes divided by invested capital.
Semiconductor A solid material (e.g. silicon or germanium) whose electrical conductivity can be changed toward positive and/or negative currents by deliberate doping (mostly with phosphor or boron).
Sensor An electronic unit that measures or detects a real physical quantity, e.g. motion, pressure, heat, or light, and converts it subsequently into an analog or digital electric signal.
Silicon The most common semiconductor material, used for approx. 95% of all chips produced.
Stepper motor A stepper motor is a synchronous motor whose rotor (rotatable motor part with a shaft) can be rotated through a controlled electromagnetic field of stator coils (stator = non-rotatable motor part), rotating step by step, by either a minimal angle (step) or its multiple.
Structure width The term structure width is used for integrated circuits and identifies the technical feasibility of the width of current circuits and electrical components. Structure width is indicated in micrometers (µm) or nanometers (nm).
TPMS A tire pressure monitoring system (TPMS) monitors the pressure in the car tire and notifies the driver if the pressure is too low.
USPA USPA stands for Ultrasonic Park Assist Systems, monitoring the parking process and informing the driver optically and acoustically on the distance to the next object.
Wafer The basic material in chip production. A wafer is a disc sawn out of a single silicon crystal and polished. Typical diameters are 150mm (6-inch), 200mm (8-inch), and 300 mm (12-inch). In series production wafers are processed in so-called charges of 25 wafers each.
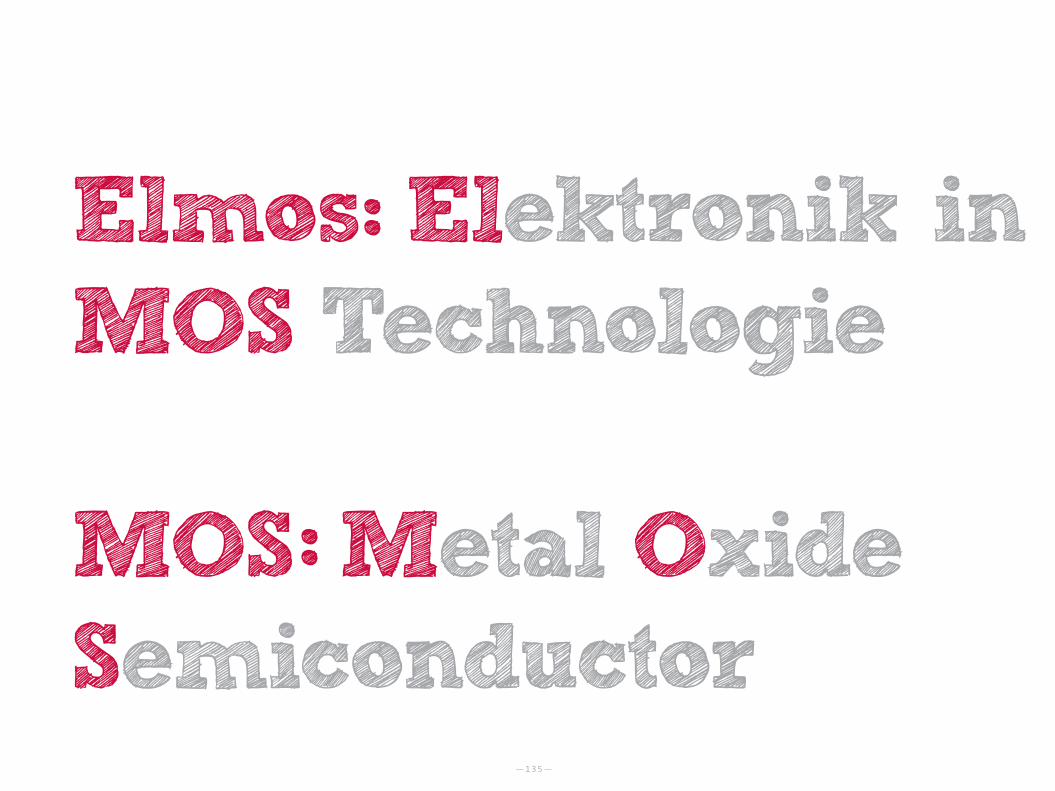
—135—
Elmos Elektronik in MOS Technologie MOS Metal Oxide Semiconductor
ii
ii
—136—
Elmos Geschäftsbericht 2015
Ergebnis 20151, Bilanzpresse- und Analystenkonferenz 16. März 2016
Quartalsergebnis Q1/20161 3. Mai 2016
Hauptversammlung in Dortmund 11. Mai 2016
Quartalsergebnis Q2/20161 3. August 2016
Quartalsergebnis Q3/20161 8. November 2016
1 Das deutsche Wertpapierhandelsgesetz verpflichtet Emittenten, Informationen mit erheblichem Kursbeeinflussungspotenzial – unabhängig vom Finanzkalender – unverzüglich zu veröffentlichen. Aufgrund dessen ist es möglich, dass wir Eckdaten unserer Quartals- und Geschäftsjahresergeb-nisse vor den oben genannten Terminen publizieren. Da wir Terminverschiebungen grundsätzlich nicht ausschließen können, empfehlen wir, die Termine und Nachrichten kurzfristig zu überprüfen (www.elmos.com).
Informationsmaterial
Wenn Sie mehr über Elmos erfahren möchten, senden wir Ihnen gerne folgende Dokumente zu:
-> Geschäftsbericht-> Zwischenberichte/Quartalsberichte-> Verhaltenskodex (Code of Conduct)-> Produktkatalog
Alle aufgeführten Dokumente befinden sich auch auf unserer Internetseite unter www.elmos.com. Wenn Sie regelmäßig unsere Veröffentlichungen erhalten möchten, schicken Sie uns bitte eine E-Mail an [email protected].
Dieser Geschäftsbericht liegt auch in englischer Sprache vor. Beide Versionen wurden klimaneutral gedruckt.
Sie können unsere YouTube, Twitter, Xing, SlideShare und Google+ Seiten natürlich auch über unsere Homepage (www.elmos.com) erreichen:
-> YouTube: www.youtube.com/user/ELMOS1984-> Twitter: www.twitter.com/elmos_ag-> Xing: www.xing.com/companies/elmossemiconductorag-> SlideShare: de.slideshare.net/ELMOS_AG-> Google+: https://plus.google.com/+Elmos-Semiconductor/posts
Finanzkalender 2016
Print kompensiertId-Nr. 1653728
www.bvdm-online.de
—137—
Appendix – Informationsmaterial/Finanzkalender 2016/Kontakt / Impressum
Kontakt
Janina Rosenbaum | Investor RelationsTelefon: + 49 (0) 231-75 49-287Telefax: + 49 (0) 231-75 [email protected]
Elmos Semiconductor AGHeinrich-Hertz-Straße 144227 Dortmund | DeutschlandTelefon: + 49 (0) 231-75 49-0Telefax: + 49 (0) 231-75 [email protected] | www.elmos.com
Impressum
Herausgeber und Redaktion
Elmos Semiconductor AG, Dortmund
Gestaltung
Elmos Semiconductor AG, Dortmund, Investor Relations
Fotonachweise
kukune mediendesign: Titel, 2-13, 38-41Elmos Semiconductor AG: 15, 20, 22, 26, 38-41iStockphoto: 39-41electronica India: 40
Druck
Scholz Druck, Dortmund
Hinweis
Der Begriff Mitarbeiter wird im vorliegenden Geschäftsbericht für Mitarbeiter und Mitarbeiterinnen zwecks besserer Lesbarkeit gleichermaßen verwendet.
Zukunftsorientierte Aussagen
Dieser Bericht enthält in die Zukunft gerichtete Aussagen, die auf Annahmen und Schätzungen der Unternehmensleitung von Elmos beruhen. Obwohl wir anneh-men, dass die Erwartungen dieser vorausschauenden Aussagen realistisch sind, können wir nicht dafür garantieren, dass die Erwartungen sich auch als richtig erweisen. Die Annahmen können Risiken und Unsicherheiten bergen, die dazu führen können, dass die tatsächlichen Ergebnisse wesentlich von den voraus-schauenden Aussagen abweichen. Zu den Faktoren, die solche Abweichungen verursachen können, gehören u.a. Veränderungen im wirtschaftlichen und geschäftlichen Umfeld, Wechselkurs- und Zinsschwankungen, Einführungen von Konkurrenzprodukten, mangelnde Akzeptanz neuer Produkte und Änderungen der Geschäftsstrategie. Eine Aktualisierung der vorausschauenden Aussagen durch Elmos ist weder geplant noch übernimmt Elmos die Verpflichtung dazu.

—138—
Elmos Geschäftsbericht 2015
Elmos Semiconductor AG
Heinrich-Hertz-Straße 1
44227 Dortmund | Deutschland
Telefon + 49 (0) 231 - 75 49 - 0
Fax + 49 (0) 231 - 75 49 - 149
[email protected] | www.elmos.com