Embed Size (px)
Citation preview
Swedbank – Year-end report 2015 Page 1 of 58
Interim report for the fourth quarter 2015
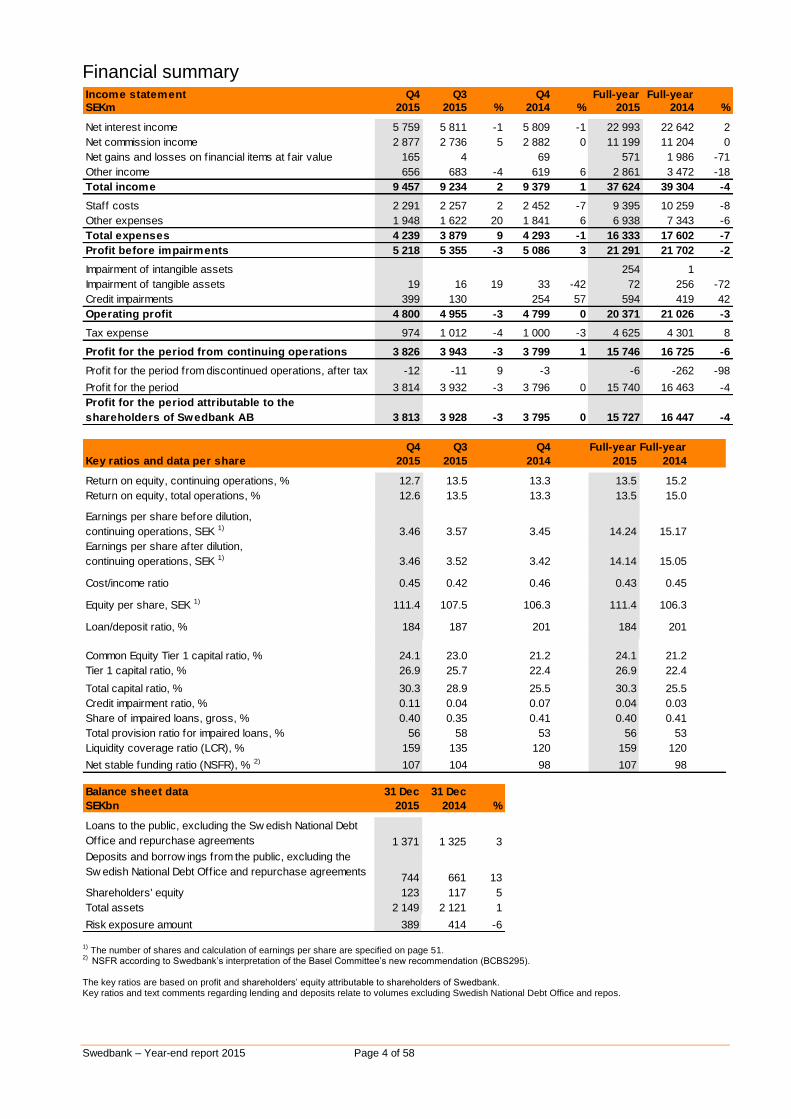
Financial information Q4 Q3 Full-year Full-year
SEKm 2015 2015 % 2015 2014 %
Total income 9 457 9 234 2 37 624 39 304 -4
of w hich net interest income 5 759 5 811 -1 22 993 22 642 2
Total expenses 4 239 3 879 9 16 333 17 602 -7
Profit before impairments 5 218 5 355 -3 21 291 21 702 -2
Impairment of intangible assets 0 254 254 1
Credit impairments 399 130 594 419 42
Tax expense1) 974 1 012 -4 4 625 4 301 8
Profit for the period attributable to the shareholders of Sw edbank AB 3 813 3 928 -3 15 727 16 447 -4
Earnings per share total operations, SEK, after dilution 3.44 3.51 14.13 14.81
Return on equity, total operations, % 12.6 13.5 13.5 15.0
C/I-ratio 0.45 0.42 0.43 0.45
Common Equity Tier 1 capital ratio, % 24.1 23.0 24.1 21.2
Credit impairment ratio, % 0.11 0.04 0.04 0.03
1) One-off tax expense of SEK 447m during second quarter 2015.
Swedbank – Year-end report 2015 Page 2 of 58
CEO Comment
Our most important priorities in 2015 were to further improve customer value, increase efficiency and integrate Sparbanken Öresund. Our entire organisation has worked wholeheartedly to ensure our long-term competitive strength by focusing on these priorities, and it has produced results. Satisfaction among our Swedish private customers, our largest customer group, has improved. To meet growing requirements in terms of service and functionality, we have focused on creating an organisation around our customers that makes us more effective and responsive. During the year we launched several digital solutions. We cut our costs by about SEK 1.3bn, thanks in large part to one-off expenses that arose in connection with the acquisition of Sparbanken Öresund in the previous year, but also through other efficiency improvements. I am extremely proud of my colleagues and what we have accomplished together, however we have a lot of work ahead of us as constant change is required in a changing world. Global economic growth remained uneven
Falling commodity prices, strong economic performance in the US and Sweden, and continued uncertainty in emerging economies distinguished the fourth quarter. This led to forecast revisions and high market volatility. The US Federal Reserve raised its benchmark rate for the first time since 2006. The Riksbank maintained the repo rate at a negative level of -0.35 per cent. At the end of the quarter there were signs that Swedish housing prices were levelling off. The housing debate intensified in light of rising population growth. Politicians have started to consider measures other than the anticipated amortisation requirement in order to increase housing construction and mobility in the existing housing stock. Swedbank welcomes such initiatives and is actively participating in the debate. Digitisation continued to change people’s everyday lives. Customers are the main driver behind this trend. This has contributed to a significant increase in competition in recent years, especially from non-traditional banks. Swedbank is well placed to meet this competition, including through our participation in the payment service Swish, which in two years gained over 3 million users. Stable result in a volatile market
Despite these challenges, fourth-quarter profit was stable. Though earnings remained under pressure from lower interest rates, increased mortgage and deposit volumes contributed positively.
The Baltic countries posted another quarter where they demonstrated their resilience in an environment marked by geopolitical uncertainty and low interest rates. The digitisation trend in our Baltic home markets is significant. Nearly half of new sales today is through our digital channels. Moreover, there are many development opportunities, including in the savings and mortgage businesses. Corporate customer activity was somewhat higher than in the previous quarter, but many deals were postponed due to the market uncertainty. In the savings area in Sweden we saw large deposit volumes due to the turmoil in the stock market. Our funds reported better results and had net inflows for the quarter. We completed several measures during the year. Fees were cut on a large number of funds, and we adapted our range of funds to clarify our customer offering. Credit impairments increased slightly during the quarter due to provisions for specific commitments, but as a whole remained at a low level. The low risk in the bank was reaffirmed by a credit upgrade from S&P to AA-. Falling oil prices increased risks in the oil sector, but to date have not resulted in any credit impairments. We are actively dialoguing with our customers and continue to work intensely with them. High capitalisation makes us resilient
I am pleased with the opportunities we have created to thrive in a world in constant change. Our cost control is good. The intention is to cut total expenses down to SEK 16bn for the full-year 2016, as previously announced. This will help to strengthen our customer offering by allowing us to invest more in cost-effective solutions. More digital launches are scheduled in 2016 to add customer value. At the same time we are continuing to modernise our branches and adapt them to our customers’ needs. Our capitalisation remains strong with a Common Equity Tier 1 capital ratio of 24.1 per cent. This gives us buffers that are large enough to withstand economic slowdowns and meet more stringent regulatory requirements. For the fourth consecutive year the dividend policy to distribute 75 per cent of profits remains unchanged. In line with this policy, Swedbank’s Board of Directors is proposing that the Annual General Meeting approve a dividend of SEK 10.70 (11.35) per share for 2015.
Michael Wolf President and CEO
Swedbank – Year-end report 2015 Page 3 of 58
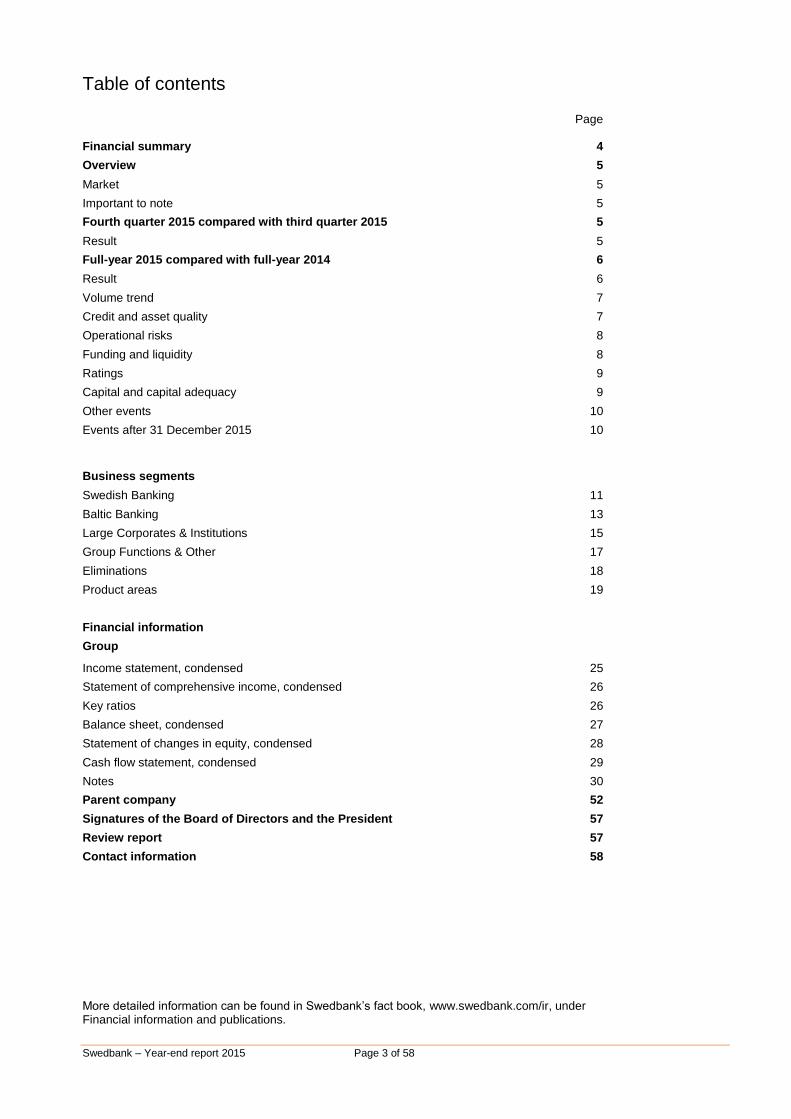
Table of contents
Page
Financial summary 4
Overview 5
Market 5
Important to note 5
Fourth quarter 2015 compared with third quarter 2015 5
Result 5
Full-year 2015 compared with full-year 2014 6
Result 6
Volume trend 7
Credit and asset quality 7
Operational risks 8
Funding and liquidity 8
Ratings 9
Capital and capital adequacy 9
Other events 10
Events after 31 December 2015 10
Business segments
Swedish Banking 11
Baltic Banking 13
Large Corporates & Institutions 15
Group Functions & Other 17
Eliminations 18
Product areas 19
Financial information
Group
Income statement, condensed 25
Statement of comprehensive income, condensed 26
Key ratios 26
Balance sheet, condensed 27
Statement of changes in equity, condensed 28
Cash flow statement, condensed 29
Notes 30
Parent company 52
Signatures of the Board of Directors and the President 57
Review report 57
Contact information 58
More detailed information can be found in Swedbank’s fact book, www.swedbank.com/ir, under Financial information and publications.
Swedbank – Year-end report 2015 Page 4 of 58
Financial summary Income statement Q4 Q3 Q4 Full-year Full-year
SEKm 2015 2015 % 2014 % 2015 2014 %
Net interest income 5 759 5 811 -1 5 809 -1 22 993 22 642 2
Net commission income 2 877 2 736 5 2 882 0 11 199 11 204 0
Net gains and losses on f inancial items at fair value 165 4 69 571 1 986 -71
Other income 656 683 -4 619 6 2 861 3 472 -18
Total income 9 457 9 234 2 9 379 1 37 624 39 304 -4
Staff costs 2 291 2 257 2 2 452 -7 9 395 10 259 -8
Other expenses 1 948 1 622 20 1 841 6 6 938 7 343 -6
Total expenses 4 239 3 879 9 4 293 -1 16 333 17 602 -7
Profit before impairments 5 218 5 355 -3 5 086 3 21 291 21 702 -2
Impairment of intangible assets 0 254 0 254 1
Impairment of tangible assets 19 16 19 33 -42 72 256 -72
Credit impairments 399 130 254 57 594 419 42
Operating profit 4 800 4 955 -3 4 799 0 20 371 21 026 -3
Tax expense 974 1 012 -4 1 000 -3 4 625 4 301 8
Profit for the period from continuing operations 3 826 3 943 -3 3 799 1 15 746 16 725 -6
Profit for the period from discontinued operations, after tax -12 -11 9 -3 -6 -262 -98
Profit for the period 3 814 3 932 -3 3 796 0 15 740 16 463 -4
Profit for the period attributable to the
shareholders of Swedbank AB 3 813 3 928 -3 3 795 0 15 727 16 447 -4
Q4 Q3 Q4 Full-year Full-year
Key ratios and data per share 2015 2015 2014 2015 2014
Return on equity, continuing operations, % 12.7 13.5 13.3 13.5 15.2
Return on equity, total operations, % 12.6 13.5 13.3 13.5 15.0
Earnings per share before dilution,
continuing operations, SEK 1) 3.46 3.57 3.45 14.24 15.17
Earnings per share after dilution,
continuing operations, SEK 1) 3.46 3.52 3.42 14.14 15.05
Cost/income ratio 0.45 0.42 0.46 0.43 0.45
Equity per share, SEK 1) 111.4 107.5 106.3 111.4 106.3
Loan/deposit ratio, % 184 187 201 184 201
Common Equity Tier 1 capital ratio, % 24.1 23.0 21.2 24.1 21.2
Tier 1 capital ratio, % 26.9 25.7 22.4 26.9 22.4
Total capital ratio, % 30.3 28.9 25.5 30.3 25.5
Credit impairment ratio, % 0.11 0.04 0.07 0.04 0.03
Share of impaired loans, gross, % 0.40 0.35 0.41 0.40 0.41
Total provision ratio for impaired loans, % 56 58 53 56 53
Liquidity coverage ratio (LCR), % 159 135 120 159 120
Net stable funding ratio (NSFR), % 2) 107 104 98 107 98
Balance sheet data 31 Dec 31 Dec
SEKbn 2015 2014 %
Loans to the public, excluding the Sw edish National Debt
Office and repurchase agreements 1 371 1 325 3
Deposits and borrow ings from the public, excluding the
Sw edish National Debt Office and repurchase agreements744 661 13
Shareholders' equity 123 117 5
Total assets 2 149 2 121 1
Risk exposure amount 389 414 -6 1)
The number of shares and calculation of earnings per share are specified on page 51. 2)
NSFR according to Swedbank’s interpretation of the Basel Committee’s new recommendation (BCBS295). The key ratios are based on profit and shareholders’ equity attributable to shareholders of Swedbank. Key ratios and text comments regarding lending and deposits relate to volumes excluding Swedish National Debt Office and repos.
Swedbank – Year-end report 2015 Page 5 of 58
Overview
Market
The global economy is divided. In Europe recovery is continuing, albeit at a slower pace. At the same time low inflation pressure persists, not least due to falling commodity prices, and the European Central Bank (ECB) announced further stimulus measures in connection with its rate decision in December. The US economy also continued to recover and, as expected, the US central bank, the Federal Reserve, raised its benchmark rate in December for the first time in nearly a decade. Macroeconomic data were weaker in the fourth quarter, however. On the other hand, global growth concerns increased in the final months of the year due to the slowdown in China, which led to a decline in global trade and commodity prices. The Swedish economy continues to post strong growth, with record-low interest rates and the refugee stream providing a boost through increased private and public consumption. In the third quarter annual GDP growth was nearly 4 per cent. Optimism among businesses rose in the fourth quarter, while households became more cautious. In the housing market there are signs that prices are levelling off after climbing in recent years. The underlying inflation rate gradually rose in 2015 in the wake of a weaker krona, but still rests on a shaky foundation. Although the Riksbank did not take any additional monetary action at its December meeting, it is prepared to further easing if the krona were to appreciate quickly. The Baltic economies continue to expand. GDP growth in the third quarter was 3.3 per cent in Lithuania, 1.7 per cent in Latvia and 0.7 per cent in Estonia. The biggest contributor to the increase was households, whose consumption was supported by wage increases of 5-7 per cent. Exports to Russia fell by 20-40 per cent in 2015, but they rose to other markets, leading to a slight rise in total exports in Latvia and only marginal declines in Estonia and Lithuania. The pace of investment has to increase, however, for productivity and competitive reasons. Consumer prices fell somewhat in Estonia and Lithuania, while in Latvia they were practically unchanged due to the decline in global commodity prices. Though the labour market is tight, it is still contributing little to the total inflation rate. The Stockholm stock exchange (OMXSPI) gained 6.6 per cent during the year and by 6.2 per cent in the fourth quarter. The Tallinn stock exchange (OMXTGI) rose by 19.1 per cent, the Riga stock exchange (OMXRGI) by 45.7 per cent and the Vilnius stock exchange (OMXVGI) by 7.4 per cent during the year. During the fourth quarter the Tallinn stock exchange rose by 4.1 per cent, the Riga stock exchange by 4.0 per cent and the Vilnius stock exchange by 1.3 per cent.
Important to note
The bank’s total expenses for 2015 amounted to SEK 16.3bn. The intention to reduce total expenses for 2016 to SEK 16bn, which was announced in connection with the interim report for the third quarter 2014, is unchanged. This is a part of increasing digitisation, which creates greater competition and price pressure and will ensure Swedbank’s continued competitiveness. The savings consist of synergies related to the acquisition of Sparbanken Öresund, lower costs due to
increased digitisation and changes in distribution forms, as well as reductions in personnel. The Board of Directors proposes that the Annual General Meeting extend the current repurchase programme, which authorises the Board to decide to repurchase shares up to a maximum of one tenth of all the shares in Swedbank (including own shares acquired by the securities operations), by one year and extend the mandate to issue convertibles in the form of subordinated debt that can be converted to shares. The reason for the proposals is that they are part of the measures to give the Board the opportunity to continuously adapt the bank’s capital structure to prevailing capital needs. The dividend proposed by the Board of Directors is SEK 10.70 (11.35) per share for the financial year 2015. This corresponds to a dividend ratio of 75 per cent. The proposed record day for the dividend is 7 April. The last day for trading Swedbank’s shares with the right to the dividend will thus be 5 April. If the Annual General Meeting accepts the Board of Directors’ proposal, the dividend is expected to be paid out by Euroclear on 12 April 2016. Swedbank’s Annual General Meeting will be held at 11 am (CET) on Tuesday, 5 April 2016, at Dansens Hus, Barnhusgatan 12-14, in Stockholm. More information on Swedbank’s Annual General Meeting will be made available on the bank’s website, www.swedbank.se, under the heading About Swedbank/Corporate governance.
Fourth quarter 2015 Compared with third quarter 2015
Result
The result decreased by 3 per cent to SEK 3 813m (3 928). The main reasons were higher expenses and credit impairments. Income increased, however. Profit before impairments decreased to SEK 5 218m (5 355). Profit increased in Baltic Banking, but decreased in Swedish Banking, LC&I and Group Functions & Other. The return on equity decreased to 12.6 per cent (13.5). The cost/income ratio rose to 0.45 (0.42).
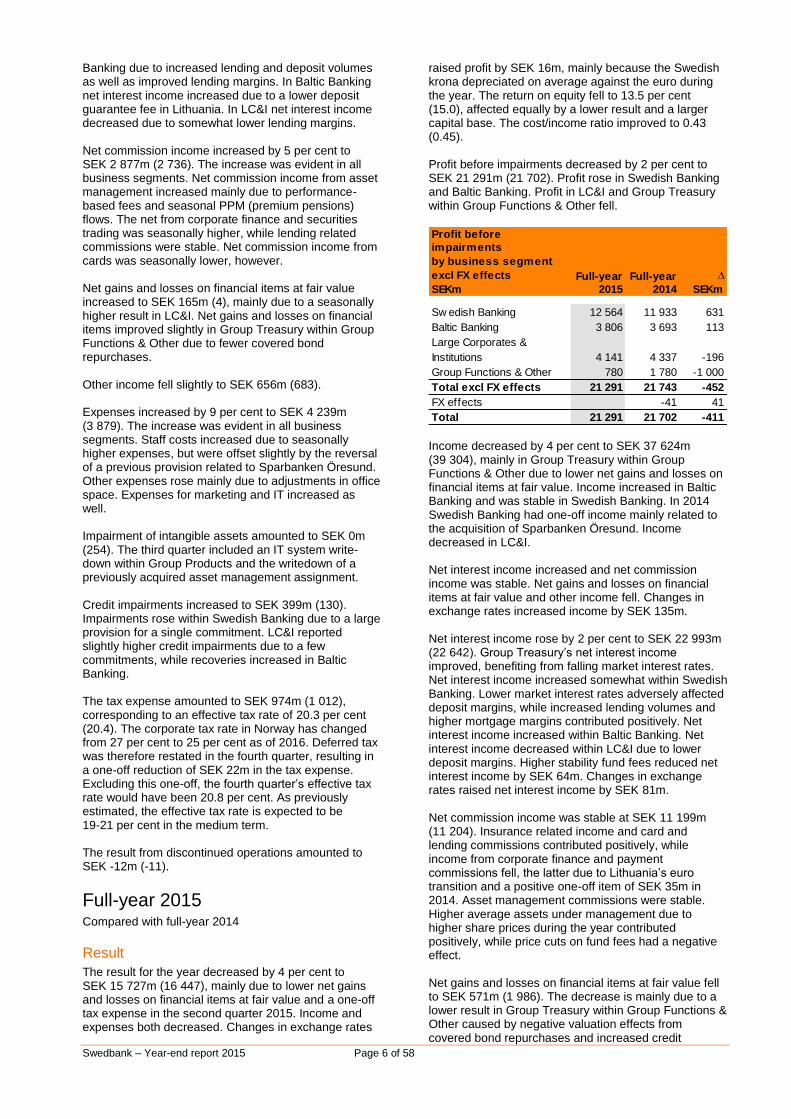
Profit before
impairments
by business segment
excl FX effects Q4 Q3 Q4
SEKm 2015 2015 2014
Sw edish Banking 3 261 3 161 2 888
Baltic Banking 1 033 945 863
Large Corporates &
Institutions 956 951 992
Group Functions & Other -32 276 317
Total excl FX effects 5 218 5 333 5 060
FX effects 22 26
Total 5 218 5 355 5 086 Income increased by 2 per cent to SEK 9 457m (9 234) due to higher net commission income and net gains and losses on financial items at fair value. Net interest income decreased by 1 per cent to SEK 5 759m (5 811). The main reason was lower net interest income in Group Treasury within Group Functions & Other partly due to maturing positions taken earlier. Net interest income increased in Swedish
Swedbank – Year-end report 2015 Page 6 of 58
Banking due to increased lending and deposit volumes as well as improved lending margins. In Baltic Banking net interest income increased due to a lower deposit guarantee fee in Lithuania. In LC&I net interest income decreased due to somewhat lower lending margins. Net commission income increased by 5 per cent to SEK 2 877m (2 736). The increase was evident in all business segments. Net commission income from asset management increased mainly due to performance-based fees and seasonal PPM (premium pensions) flows. The net from corporate finance and securities trading was seasonally higher, while lending related commissions were stable. Net commission income from cards was seasonally lower, however. Net gains and losses on financial items at fair value increased to SEK 165m (4), mainly due to a seasonally higher result in LC&I. Net gains and losses on financial items improved slightly in Group Treasury within Group Functions & Other due to fewer covered bond repurchases. Other income fell slightly to SEK 656m (683). Expenses increased by 9 per cent to SEK 4 239m (3 879). The increase was evident in all business segments. Staff costs increased due to seasonally higher expenses, but were offset slightly by the reversal of a previous provision related to Sparbanken Öresund. Other expenses rose mainly due to adjustments in office space. Expenses for marketing and IT increased as well. Impairment of intangible assets amounted to SEK 0m (254). The third quarter included an IT system write-down within Group Products and the writedown of a previously acquired asset management assignment. Credit impairments increased to SEK 399m (130). Impairments rose within Swedish Banking due to a large provision for a single commitment. LC&I reported slightly higher credit impairments due to a few commitments, while recoveries increased in Baltic Banking. The tax expense amounted to SEK 974m (1 012), corresponding to an effective tax rate of 20.3 per cent (20.4). The corporate tax rate in Norway has changed from 27 per cent to 25 per cent as of 2016. Deferred tax was therefore restated in the fourth quarter, resulting in a one-off reduction of SEK 22m in the tax expense. Excluding this one-off, the fourth quarter’s effective tax rate would have been 20.8 per cent. As previously estimated, the effective tax rate is expected to be 19-21 per cent in the medium term. The result from discontinued operations amounted to SEK -12m (-11).
Full-year 2015 Compared with full-year 2014
Result
The result for the year decreased by 4 per cent to SEK 15 727m (16 447), mainly due to lower net gains and losses on financial items at fair value and a one-off tax expense in the second quarter 2015. Income and expenses both decreased. Changes in exchange rates
raised profit by SEK 16m, mainly because the Swedish krona depreciated on average against the euro during the year. The return on equity fell to 13.5 per cent (15.0), affected equally by a lower result and a larger capital base. The cost/income ratio improved to 0.43 (0.45). Profit before impairments decreased by 2 per cent to SEK 21 291m (21 702). Profit rose in Swedish Banking and Baltic Banking. Profit in LC&I and Group Treasury within Group Functions & Other fell.
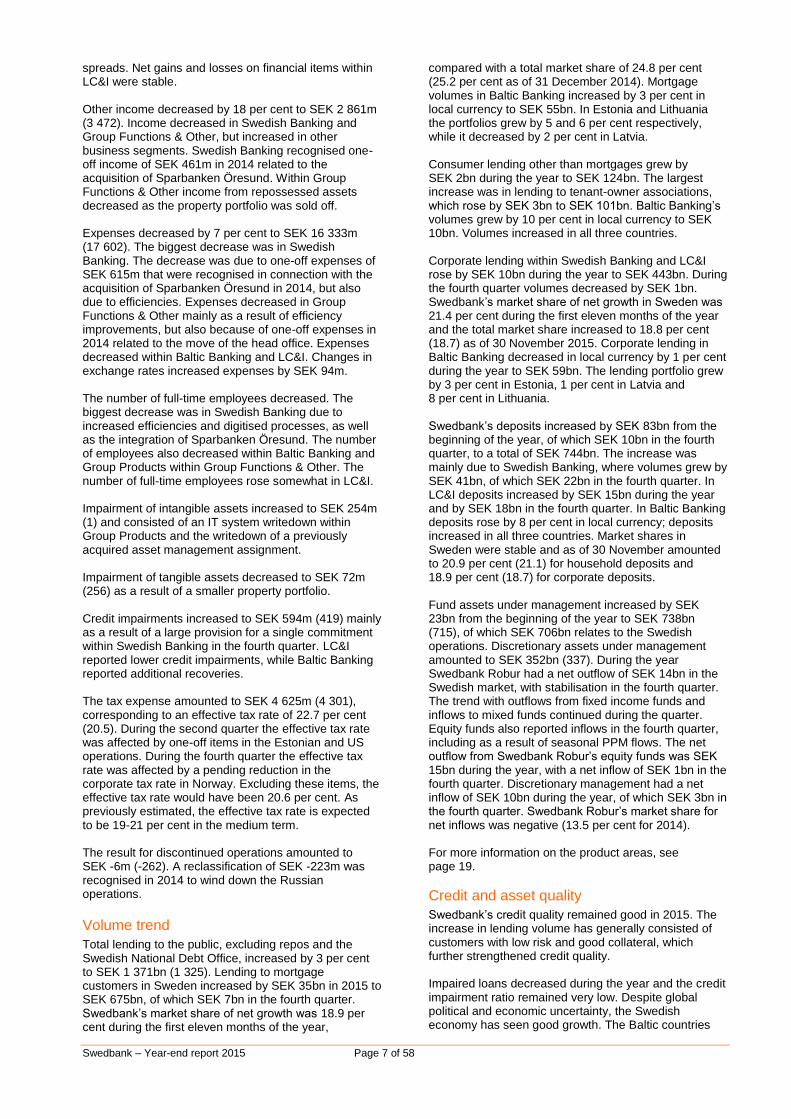
Profit before
impairments
by business segment
excl FX effects Full-year Full-year ∆
SEKm 2015 2014 SEKm
Sw edish Banking 12 564 11 933 631
Baltic Banking 3 806 3 693 113
Large Corporates &
Institutions 4 141 4 337 -196
Group Functions & Other 780 1 780 -1 000
Total excl FX effects 21 291 21 743 -452
FX effects -41 41
Total 21 291 21 702 -411 Income decreased by 4 per cent to SEK 37 624m (39 304), mainly in Group Treasury within Group Functions & Other due to lower net gains and losses on financial items at fair value. Income increased in Baltic Banking and was stable in Swedish Banking. In 2014 Swedish Banking had one-off income mainly related to the acquisition of Sparbanken Öresund. Income decreased in LC&I. Net interest income increased and net commission income was stable. Net gains and losses on financial items at fair value and other income fell. Changes in exchange rates increased income by SEK 135m. Net interest income rose by 2 per cent to SEK 22 993m (22 642). Group Treasury’s net interest income improved, benefiting from falling market interest rates. Net interest income increased somewhat within Swedish Banking. Lower market interest rates adversely affected deposit margins, while increased lending volumes and higher mortgage margins contributed positively. Net interest income increased within Baltic Banking. Net interest income decreased within LC&I due to lower deposit margins. Higher stability fund fees reduced net interest income by SEK 64m. Changes in exchange rates raised net interest income by SEK 81m. Net commission income was stable at SEK 11 199m (11 204). Insurance related income and card and lending commissions contributed positively, while income from corporate finance and payment commissions fell, the latter due to Lithuania’s euro transition and a positive one-off item of SEK 35m in 2014. Asset management commissions were stable. Higher average assets under management due to higher share prices during the year contributed positively, while price cuts on fund fees had a negative effect. Net gains and losses on financial items at fair value fell to SEK 571m (1 986). The decrease is mainly due to a lower result in Group Treasury within Group Functions & Other caused by negative valuation effects from covered bond repurchases and increased credit
Swedbank – Year-end report 2015 Page 7 of 58
spreads. Net gains and losses on financial items within LC&I were stable. Other income decreased by 18 per cent to SEK 2 861m (3 472). Income decreased in Swedish Banking and Group Functions & Other, but increased in other business segments. Swedish Banking recognised one-off income of SEK 461m in 2014 related to the acquisition of Sparbanken Öresund. Within Group Functions & Other income from repossessed assets decreased as the property portfolio was sold off. Expenses decreased by 7 per cent to SEK 16 333m (17 602). The biggest decrease was in Swedish Banking. The decrease was due to one-off expenses of SEK 615m that were recognised in connection with the acquisition of Sparbanken Öresund in 2014, but also due to efficiencies. Expenses decreased in Group Functions & Other mainly as a result of efficiency improvements, but also because of one-off expenses in 2014 related to the move of the head office. Expenses decreased within Baltic Banking and LC&I. Changes in exchange rates increased expenses by SEK 94m. The number of full-time employees decreased. The biggest decrease was in Swedish Banking due to increased efficiencies and digitised processes, as well as the integration of Sparbanken Öresund. The number of employees also decreased within Baltic Banking and Group Products within Group Functions & Other. The number of full-time employees rose somewhat in LC&I. Impairment of intangible assets increased to SEK 254m (1) and consisted of an IT system writedown within Group Products and the writedown of a previously acquired asset management assignment. Impairment of tangible assets decreased to SEK 72m (256) as a result of a smaller property portfolio. Credit impairments increased to SEK 594m (419) mainly as a result of a large provision for a single commitment within Swedish Banking in the fourth quarter. LC&I reported lower credit impairments, while Baltic Banking reported additional recoveries. The tax expense amounted to SEK 4 625m (4 301), corresponding to an effective tax rate of 22.7 per cent (20.5). During the second quarter the effective tax rate was affected by one-off items in the Estonian and US operations. During the fourth quarter the effective tax rate was affected by a pending reduction in the corporate tax rate in Norway. Excluding these items, the effective tax rate would have been 20.6 per cent. As previously estimated, the effective tax rate is expected to be 19-21 per cent in the medium term. The result for discontinued operations amounted to SEK -6m (-262). A reclassification of SEK -223m was recognised in 2014 to wind down the Russian operations.
Volume trend
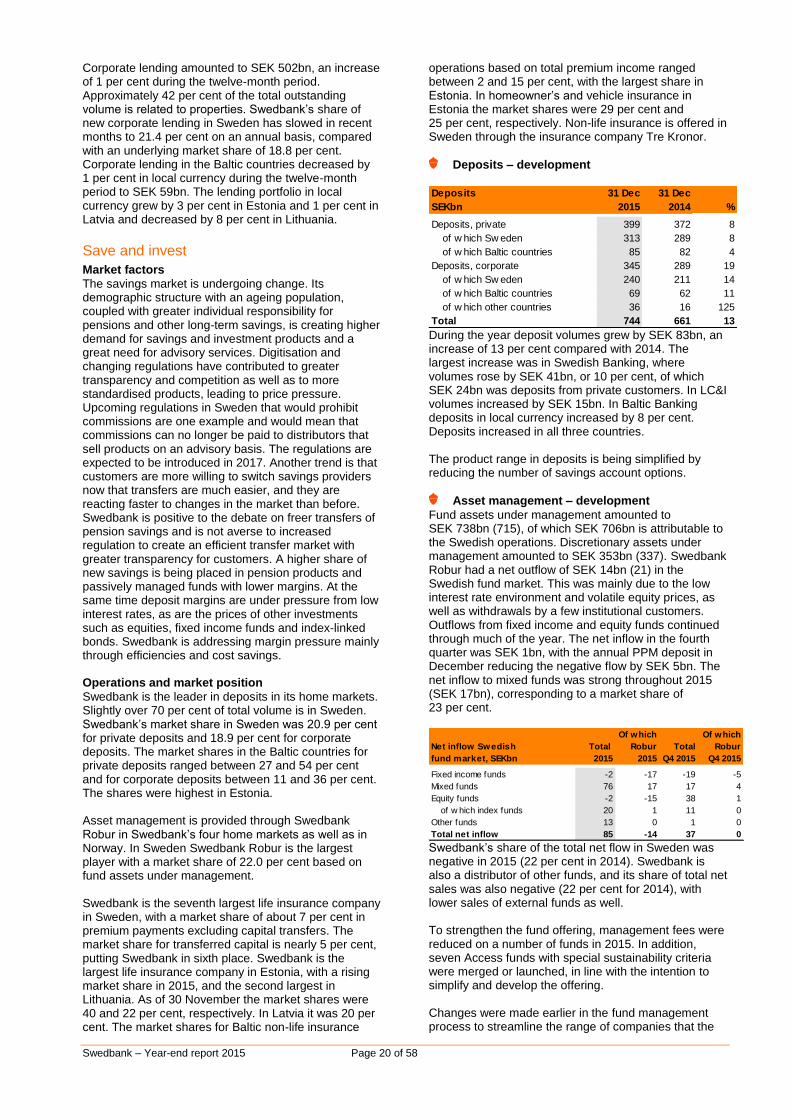
Total lending to the public, excluding repos and the Swedish National Debt Office, increased by 3 per cent to SEK 1 371bn (1 325). Lending to mortgage customers in Sweden increased by SEK 35bn in 2015 to SEK 675bn, of which SEK 7bn in the fourth quarter. Swedbank’s market share of net growth was 18.9 per cent during the first eleven months of the year,
compared with a total market share of 24.8 per cent (25.2 per cent as of 31 December 2014). Mortgage volumes in Baltic Banking increased by 3 per cent in local currency to SEK 55bn. In Estonia and Lithuania the portfolios grew by 5 and 6 per cent respectively, while it decreased by 2 per cent in Latvia. Consumer lending other than mortgages grew by SEK 2bn during the year to SEK 124bn. The largest increase was in lending to tenant-owner associations, which rose by SEK 3bn to SEK 101bn. Baltic Banking’s volumes grew by 10 per cent in local currency to SEK 10bn. Volumes increased in all three countries. Corporate lending within Swedish Banking and LC&I rose by SEK 10bn during the year to SEK 443bn. During the fourth quarter volumes decreased by SEK 1bn. Swedbank’s market share of net growth in Sweden was 21.4 per cent during the first eleven months of the year and the total market share increased to 18.8 per cent (18.7) as of 30 November 2015. Corporate lending in Baltic Banking decreased in local currency by 1 per cent during the year to SEK 59bn. The lending portfolio grew by 3 per cent in Estonia, 1 per cent in Latvia and 8 per cent in Lithuania. Swedbank’s deposits increased by SEK 83bn from the beginning of the year, of which SEK 10bn in the fourth quarter, to a total of SEK 744bn. The increase was mainly due to Swedish Banking, where volumes grew by SEK 41bn, of which SEK 22bn in the fourth quarter. In LC&I deposits increased by SEK 15bn during the year and by SEK 18bn in the fourth quarter. In Baltic Banking deposits rose by 8 per cent in local currency; deposits increased in all three countries. Market shares in Sweden were stable and as of 30 November amounted to 20.9 per cent (21.1) for household deposits and 18.9 per cent (18.7) for corporate deposits. Fund assets under management increased by SEK 23bn from the beginning of the year to SEK 738bn (715), of which SEK 706bn relates to the Swedish operations. Discretionary assets under management amounted to SEK 352bn (337). During the year Swedbank Robur had a net outflow of SEK 14bn in the Swedish market, with stabilisation in the fourth quarter. The trend with outflows from fixed income funds and inflows to mixed funds continued during the quarter. Equity funds also reported inflows in the fourth quarter, including as a result of seasonal PPM flows. The net outflow from Swedbank Robur’s equity funds was SEK 15bn during the year, with a net inflow of SEK 1bn in the fourth quarter. Discretionary management had a net inflow of SEK 10bn during the year, of which SEK 3bn in the fourth quarter. Swedbank Robur’s market share for net inflows was negative (13.5 per cent for 2014). For more information on the product areas, see page 19.
Credit and asset quality
Swedbank’s credit quality remained good in 2015. The increase in lending volume has generally consisted of customers with low risk and good collateral, which further strengthened credit quality. Impaired loans decreased during the year and the credit impairment ratio remained very low. Despite global political and economic uncertainty, the Swedish economy has seen good growth. The Baltic countries
Swedbank – Year-end report 2015 Page 8 of 58
have been adversely affected by trade restrictions against Russia, but still continued to generate economic growth. Oil prices remained under pressure throughout 2015. At the end of the fourth quarter prices fell further and at the beginning of the first quarter 2016 they remained at historically low levels. Swedbank’s customers in oil-related sectors managed the situation well in 2015 and the bank was not affected by any credit impairments in the sector. Towards the end of the fourth quarter, however, we saw signs of lower credit quality among a few commitments. Since Swedbank expects weakness in the market to continue in 2016, it is likely to lead to the need for provisions. Swedbank is closely dialoguing with customers in oil-related sectors, which mainly consist of listed companies with high credit ratings and long-term customer contracts. During the year Swedbank introduced new mortgage lending guidelines. The change applies to new loans and includes stricter amortisation guidelines, in line with the SFSA’s proposal, a limit on how much customers can borrow in relation to their annual income, and tighter requirements on the interest mark-up customers must be able to pay. The change has been made to maintain the high quality in the mortgage portfolio and to limit risks for both the bank and customers if interest rates rise or prices decline. Swedbank’s mortgage volume to households in Sweden continued to increase during the year, though the growth rate slowed in the second half-year partly due to the guidelines Swedbank introduced. During the fourth quarter 95 per cent of new mortgages granted in Sweden with a loan-to-value ratio of over 70 per cent were being amortised, unchanged compared with the previous quarter. Of new loans with a loan-to-value ratio of between 50 and 70 per cent, 82 per cent were being amortised, compared with 64 per cent in the third quarter. Amortisations in the Swedish mortgage portfolio totalled around SEK 11.2bn in the last 12-month period. The average loan-to-value ratio for Swedbank’s mortgages in Sweden was 56.9 per cent (60.1 as of 31 December 2014). In Estonia it was 50.8 per cent (53.9), in Latvia 98.0 per cent (108.2) and in Lithuania 78.9 per cent (84.8), based on property level. For more information, see the Lending section on page 19 and page 52 of the fact book. Lending to non-housing related property companies in Sweden rose by 4.1 per cent to SEK 123bn during the year. The portfolio risk remained low. Impaired loans continued to decrease during the year and corresponded to 0.40 per cent (0.41) of total lending. The provision ratio for impaired loans was 40 per cent (35) and including portfolio provisions was 56 per cent (53). For more information on credit risk, see pages 45-51 of the fact book.
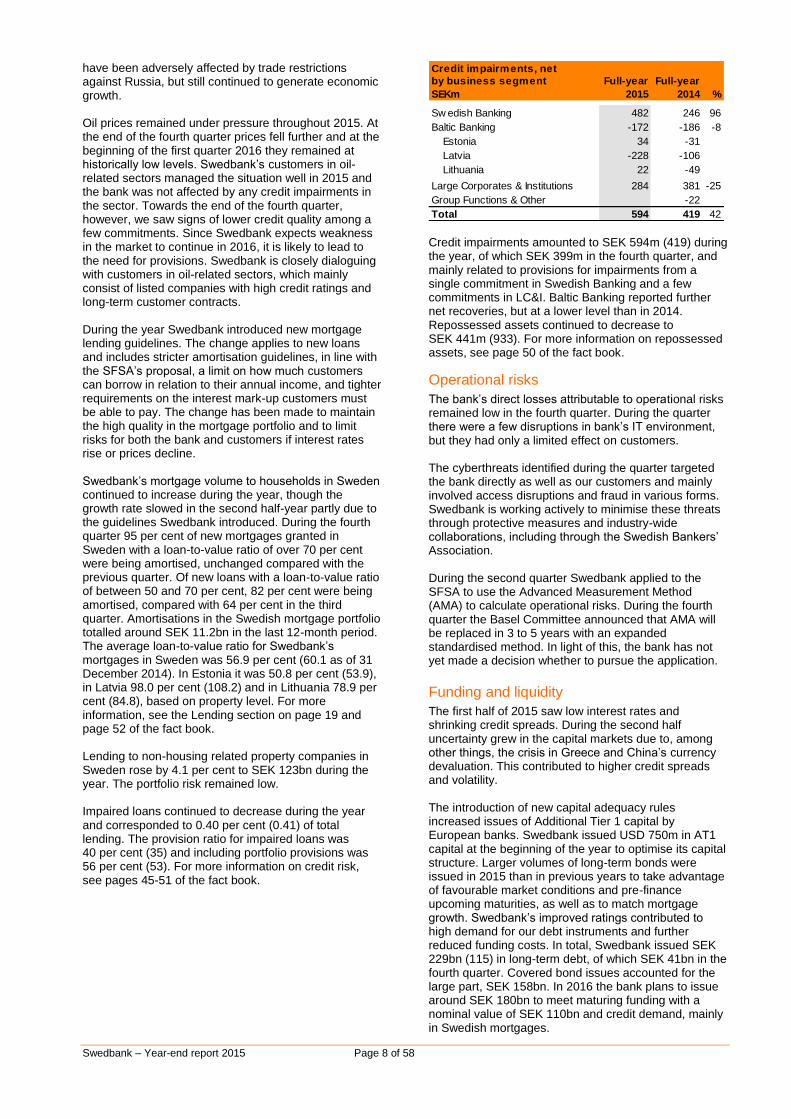
Credit impairments, net
by business segment Full-year Full-year
SEKm 2015 2014 %
Sw edish Banking 482 246 96
Baltic Banking -172 -186 -8
Estonia 34 -31
Latvia -228 -106
Lithuania 22 -49
Large Corporates & Institutions 284 381 -25
Group Functions & Other 0 -22
Total 594 419 42 Credit impairments amounted to SEK 594m (419) during the year, of which SEK 399m in the fourth quarter, and mainly related to provisions for impairments from a single commitment in Swedish Banking and a few commitments in LC&I. Baltic Banking reported further net recoveries, but at a lower level than in 2014. Repossessed assets continued to decrease to SEK 441m (933). For more information on repossessed assets, see page 50 of the fact book.
Operational risks
The bank’s direct losses attributable to operational risks remained low in the fourth quarter. During the quarter there were a few disruptions in bank’s IT environment, but they had only a limited effect on customers. The cyberthreats identified during the quarter targeted the bank directly as well as our customers and mainly involved access disruptions and fraud in various forms. Swedbank is working actively to minimise these threats through protective measures and industry-wide collaborations, including through the Swedish Bankers’ Association. During the second quarter Swedbank applied to the SFSA to use the Advanced Measurement Method (AMA) to calculate operational risks. During the fourth quarter the Basel Committee announced that AMA will be replaced in 3 to 5 years with an expanded standardised method. In light of this, the bank has not yet made a decision whether to pursue the application.
Funding and liquidity
The first half of 2015 saw low interest rates and shrinking credit spreads. During the second half uncertainty grew in the capital markets due to, among other things, the crisis in Greece and China’s currency devaluation. This contributed to higher credit spreads and volatility. The introduction of new capital adequacy rules increased issues of Additional Tier 1 capital by European banks. Swedbank issued USD 750m in AT1 capital at the beginning of the year to optimise its capital structure. Larger volumes of long-term bonds were issued in 2015 than in previous years to take advantage of favourable market conditions and pre-finance upcoming maturities, as well as to match mortgage growth. Swedbank’s improved ratings contributed to high demand for our debt instruments and further reduced funding costs. In total, Swedbank issued SEK 229bn (115) in long-term debt, of which SEK 41bn in the fourth quarter. Covered bond issues accounted for the large part, SEK 158bn. In 2016 the bank plans to issue around SEK 180bn to meet maturing funding with a nominal value of SEK 110bn and credit demand, mainly in Swedish mortgages.
Swedbank – Year-end report 2015 Page 9 of 58
At year-end 2015 outstanding short-term funding amounted to SEK 107bn. At the same time SEK 186bn was placed with central banks. The liquidity reserve amounted to SEK 314bn (224) as of 31 December 2015. In addition, liquid securities in other parts of the Group amounted to SEK 50bn (76). The liquidity reserve and the Liquidity Coverage ratio (LCR) fluctuate over time depending on, among other things, the maturity structure of the bank’s issued securities. The Group’s LCR was 159 (120) per cent, and 363 per cent and 638 per cent respectively, for USD and EUR. According to our interpretation of the Basel Committee’s latest proposed Net Stable Funding Ratio (NSFR), Swedbank’s NSFR was 107 per cent (98). The improvement during the year was driven by increased long-term funding, which also reduced the bank’s structural liquidity sensitivity.
Ratings
In June Moody’s upgraded Swedbank’s rating by one step to Aa3 with a stable outlook. Swedbank’s individual rating was upgraded as well, from baa1 to a3. The upgrade was due to Swedbank’s strong earnings ability and high asset quality, as well as the bank’s long-term strategy and strong brand. S&P also upgraded Swedbank’s individual rating by one step, to AA-. Its individual rating was upgraded as well, from a to a+. The upgrade was due to Swedbank’s governance continuity, stable profitability and high efficiency. S&P’s outlook for Swedbank’s rating, like that of most Swedish banks, is negative. This is due to S&P’s assessment of house prices and household debt, which it feels increase economic risk for the banks. Swedbank’s high credit quality, stable earnings and strong capitalisation were also the reasons behind Fitch Ratings’ decision in June to affirm the positive outlook for the bank’s rating.
Capital and capital adequacy
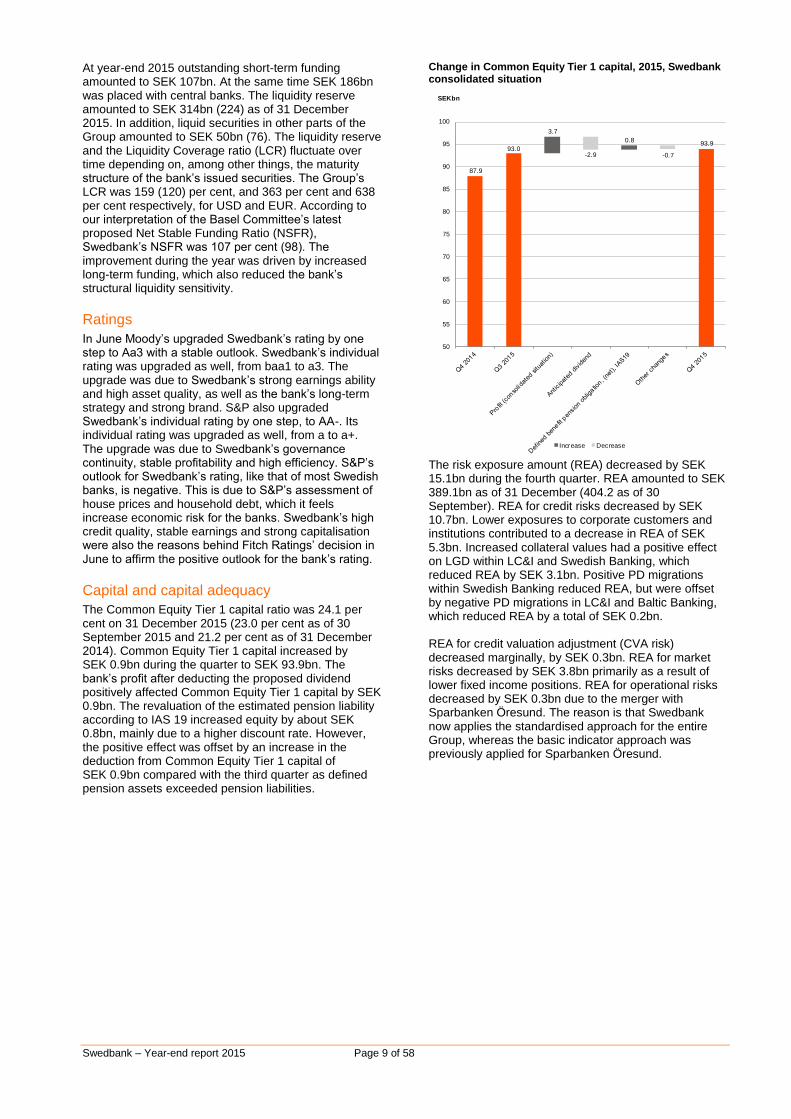
The Common Equity Tier 1 capital ratio was 24.1 per cent on 31 December 2015 (23.0 per cent as of 30 September 2015 and 21.2 per cent as of 31 December 2014). Common Equity Tier 1 capital increased by SEK 0.9bn during the quarter to SEK 93.9bn. The bank’s profit after deducting the proposed dividend positively affected Common Equity Tier 1 capital by SEK 0.9bn. The revaluation of the estimated pension liability according to IAS 19 increased equity by about SEK 0.8bn, mainly due to a higher discount rate. However, the positive effect was offset by an increase in the deduction from Common Equity Tier 1 capital of SEK 0.9bn compared with the third quarter as defined pension assets exceeded pension liabilities.
Change in Common Equity Tier 1 capital, 2015, Swedbank consolidated situation
87.9
93.90.8
-0.7
3.7
-2.993.0
50
55
60
65
70
75
80
85
90
95
100
SEKbn
Increase Decrease
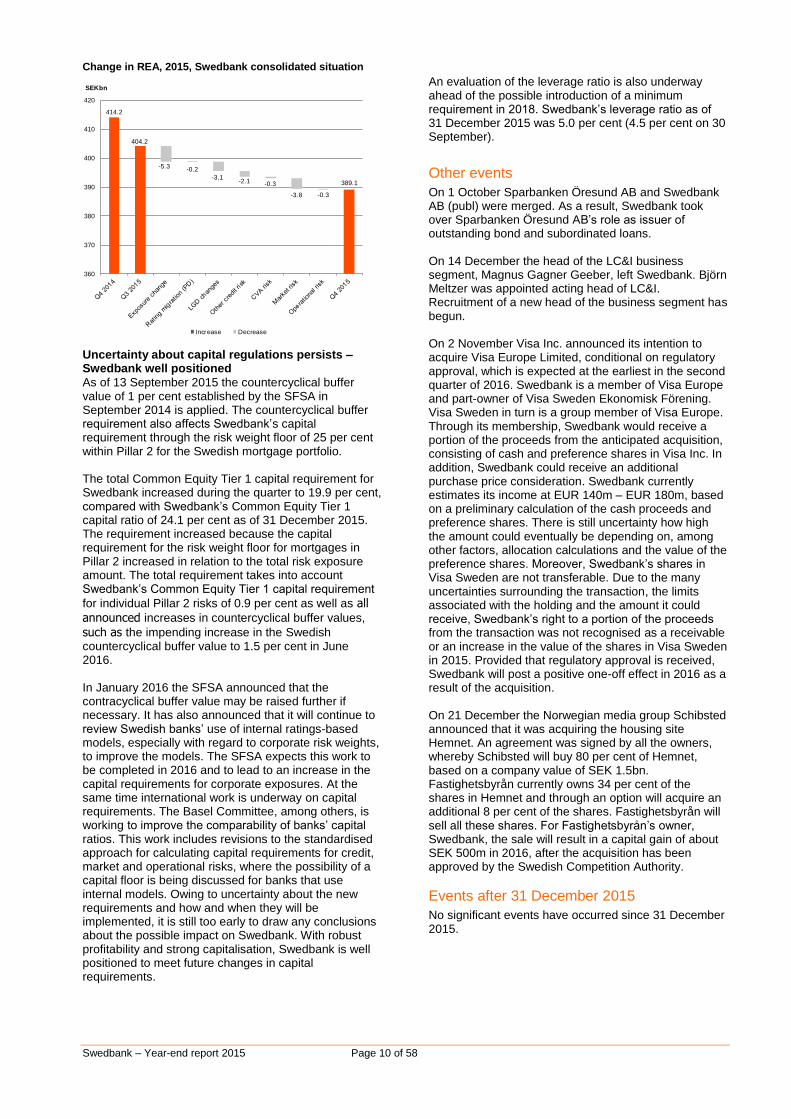
The risk exposure amount (REA) decreased by SEK 15.1bn during the fourth quarter. REA amounted to SEK 389.1bn as of 31 December (404.2 as of 30 September). REA for credit risks decreased by SEK 10.7bn. Lower exposures to corporate customers and institutions contributed to a decrease in REA of SEK 5.3bn. Increased collateral values had a positive effect on LGD within LC&I and Swedish Banking, which reduced REA by SEK 3.1bn. Positive PD migrations within Swedish Banking reduced REA, but were offset by negative PD migrations in LC&I and Baltic Banking, which reduced REA by a total of SEK 0.2bn. REA for credit valuation adjustment (CVA risk) decreased marginally, by SEK 0.3bn. REA for market risks decreased by SEK 3.8bn primarily as a result of lower fixed income positions. REA for operational risks decreased by SEK 0.3bn due to the merger with Sparbanken Öresund. The reason is that Swedbank now applies the standardised approach for the entire Group, whereas the basic indicator approach was previously applied for Sparbanken Öresund.
Swedbank – Year-end report 2015 Page 10 of 58
Change in REA, 2015, Swedbank consolidated situation
-0.2-5.3
-3.1-2.1 -0.3
-3.8 -0.3
414.2
404.2
389.1
360
370
380
390
400
410
420
SEKbn
Increase Decrease
Uncertainty about capital regulations persists – Swedbank well positioned
As of 13 September 2015 the countercyclical buffer value of 1 per cent established by the SFSA in September 2014 is applied. The countercyclical buffer requirement also affects Swedbank’s capital requirement through the risk weight floor of 25 per cent within Pillar 2 for the Swedish mortgage portfolio. The total Common Equity Tier 1 capital requirement for Swedbank increased during the quarter to 19.9 per cent, compared with Swedbank’s Common Equity Tier 1 capital ratio of 24.1 per cent as of 31 December 2015. The requirement increased because the capital requirement for the risk weight floor for mortgages in Pillar 2 increased in relation to the total risk exposure amount. The total requirement takes into account Swedbank’s Common Equity Tier 1 capital requirement
for individual Pillar 2 risks of 0.9 per cent as well as all announced increases in countercyclical buffer values, such as the impending increase in the Swedish countercyclical buffer value to 1.5 per cent in June 2016. In January 2016 the SFSA announced that the contracyclical buffer value may be raised further if necessary. It has also announced that it will continue to review Swedish banks’ use of internal ratings-based models, especially with regard to corporate risk weights, to improve the models. The SFSA expects this work to be completed in 2016 and to lead to an increase in the capital requirements for corporate exposures. At the same time international work is underway on capital requirements. The Basel Committee, among others, is working to improve the comparability of banks’ capital ratios. This work includes revisions to the standardised approach for calculating capital requirements for credit, market and operational risks, where the possibility of a capital floor is being discussed for banks that use internal models. Owing to uncertainty about the new requirements and how and when they will be implemented, it is still too early to draw any conclusions about the possible impact on Swedbank. With robust profitability and strong capitalisation, Swedbank is well positioned to meet future changes in capital requirements.
An evaluation of the leverage ratio is also underway ahead of the possible introduction of a minimum requirement in 2018. Swedbank’s leverage ratio as of 31 December 2015 was 5.0 per cent (4.5 per cent on 30 September).
Other events
On 1 October Sparbanken Öresund AB and Swedbank AB (publ) were merged. As a result, Swedbank took over Sparbanken Öresund AB’s role as issuer of outstanding bond and subordinated loans. On 14 December the head of the LC&I business segment, Magnus Gagner Geeber, left Swedbank. Björn Meltzer was appointed acting head of LC&I. Recruitment of a new head of the business segment has begun. On 2 November Visa Inc. announced its intention to acquire Visa Europe Limited, conditional on regulatory approval, which is expected at the earliest in the second quarter of 2016. Swedbank is a member of Visa Europe and part-owner of Visa Sweden Ekonomisk Förening. Visa Sweden in turn is a group member of Visa Europe. Through its membership, Swedbank would receive a portion of the proceeds from the anticipated acquisition, consisting of cash and preference shares in Visa Inc. In addition, Swedbank could receive an additional purchase price consideration. Swedbank currently estimates its income at EUR 140m – EUR 180m, based on a preliminary calculation of the cash proceeds and preference shares. There is still uncertainty how high the amount could eventually be depending on, among other factors, allocation calculations and the value of the preference shares. Moreover, Swedbank’s shares in Visa Sweden are not transferable. Due to the many uncertainties surrounding the transaction, the limits associated with the holding and the amount it could receive, Swedbank’s right to a portion of the proceeds from the transaction was not recognised as a receivable or an increase in the value of the shares in Visa Sweden in 2015. Provided that regulatory approval is received, Swedbank will post a positive one-off effect in 2016 as a result of the acquisition. On 21 December the Norwegian media group Schibsted announced that it was acquiring the housing site Hemnet. An agreement was signed by all the owners, whereby Schibsted will buy 80 per cent of Hemnet, based on a company value of SEK 1.5bn. Fastighetsbyrån currently owns 34 per cent of the shares in Hemnet and through an option will acquire an additional 8 per cent of the shares. Fastighetsbyrån will sell all these shares. For Fastighetsbyrån’s owner, Swedbank, the sale will result in a capital gain of about SEK 500m in 2016, after the acquisition has been approved by the Swedish Competition Authority.
Events after 31 December 2015
No significant events have occurred since 31 December 2015.
Swedbank – Year-end report 2015 Page 11 of 58
Swedish Banking
Higher net interest income
Increased deposit volumes
Improved satisfaction among private customers
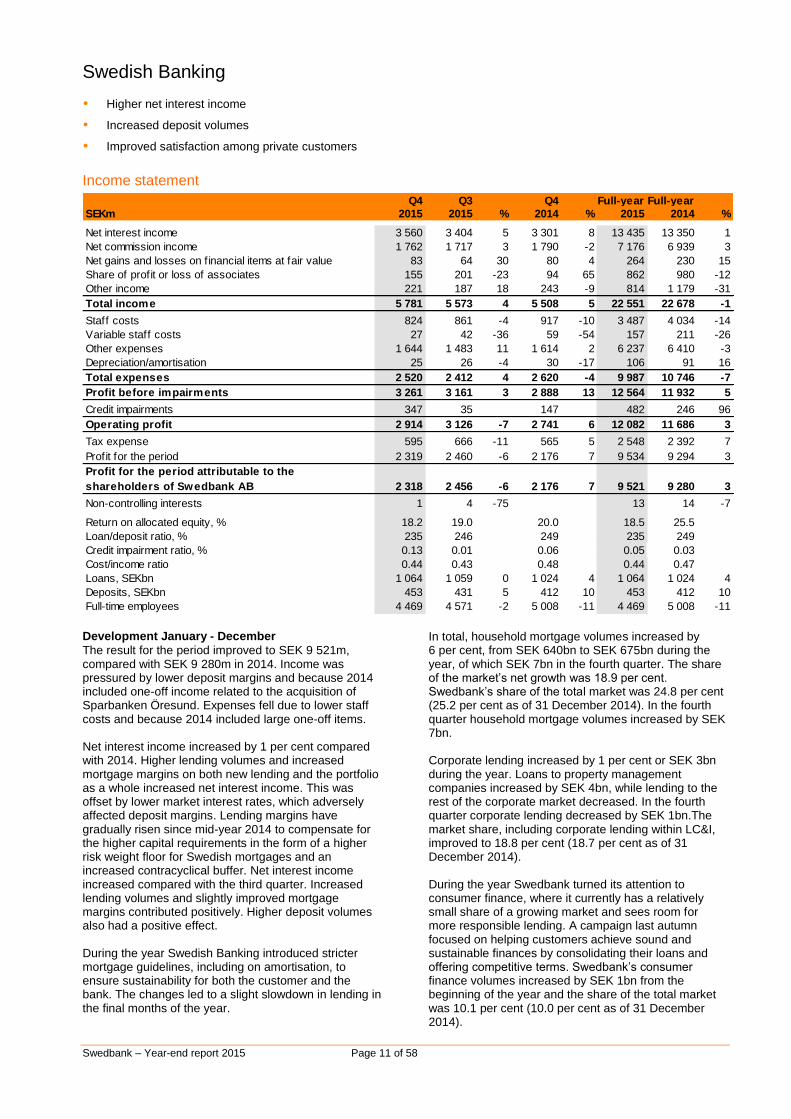
Income statement
Q4 Q3 Q4 Full-year Full-year
SEKm 2015 2015 % 2014 % 2015 2014 %
Net interest income 3 560 3 404 5 3 301 8 13 435 13 350 1
Net commission income 1 762 1 717 3 1 790 -2 7 176 6 939 3
Net gains and losses on f inancial items at fair value 83 64 30 80 4 264 230 15
Share of profit or loss of associates 155 201 -23 94 65 862 980 -12
Other income 221 187 18 243 -9 814 1 179 -31
Total income 5 781 5 573 4 5 508 5 22 551 22 678 -1
Staff costs 824 861 -4 917 -10 3 487 4 034 -14
Variable staff costs 27 42 -36 59 -54 157 211 -26
Other expenses 1 644 1 483 11 1 614 2 6 237 6 410 -3
Depreciation/amortisation 25 26 -4 30 -17 106 91 16
Total expenses 2 520 2 412 4 2 620 -4 9 987 10 746 -7
Profit before impairments 3 261 3 161 3 2 888 13 12 564 11 932 5
Credit impairments 347 35 147 482 246 96
Operating profit 2 914 3 126 -7 2 741 6 12 082 11 686 3
Tax expense 595 666 -11 565 5 2 548 2 392 7
Profit for the period 2 319 2 460 -6 2 176 7 9 534 9 294 3
Profit for the period attributable to the
shareholders of Swedbank AB 2 318 2 456 -6 2 176 7 9 521 9 280 3
Non-controlling interests 1 4 -75 0 13 14 -7
Return on allocated equity, % 18.2 19.0 20.0 18.5 25.5
Loan/deposit ratio, % 235 246 249 235 249
Credit impairment ratio, % 0.13 0.01 0.06 0.05 0.03
Cost/income ratio 0.44 0.43 0.48 0.44 0.47
Loans, SEKbn 1 064 1 059 0 1 024 4 1 064 1 024 4
Deposits, SEKbn 453 431 5 412 10 453 412 10
Full-time employees 4 469 4 571 -2 5 008 -11 4 469 5 008 -11 Development January - December
The result for the period improved to SEK 9 521m, compared with SEK 9 280m in 2014. Income was pressured by lower deposit margins and because 2014 included one-off income related to the acquisition of Sparbanken Öresund. Expenses fell due to lower staff costs and because 2014 included large one-off items. Net interest income increased by 1 per cent compared with 2014. Higher lending volumes and increased mortgage margins on both new lending and the portfolio as a whole increased net interest income. This was offset by lower market interest rates, which adversely affected deposit margins. Lending margins have gradually risen since mid-year 2014 to compensate for the higher capital requirements in the form of a higher risk weight floor for Swedish mortgages and an increased contracyclical buffer. Net interest income increased compared with the third quarter. Increased lending volumes and slightly improved mortgage margins contributed positively. Higher deposit volumes also had a positive effect. During the year Swedish Banking introduced stricter mortgage guidelines, including on amortisation, to ensure sustainability for both the customer and the bank. The changes led to a slight slowdown in lending in the final months of the year.
In total, household mortgage volumes increased by 6 per cent, from SEK 640bn to SEK 675bn during the year, of which SEK 7bn in the fourth quarter. The share of the market’s net growth was 18.9 per cent. Swedbank’s share of the total market was 24.8 per cent (25.2 per cent as of 31 December 2014). In the fourth quarter household mortgage volumes increased by SEK 7bn. Corporate lending increased by 1 per cent or SEK 3bn during the year. Loans to property management companies increased by SEK 4bn, while lending to the rest of the corporate market decreased. In the fourth quarter corporate lending decreased by SEK 1bn.The market share, including corporate lending within LC&I, improved to 18.8 per cent (18.7 per cent as of 31 December 2014). During the year Swedbank turned its attention to consumer finance, where it currently has a relatively small share of a growing market and sees room for more responsible lending. A campaign last autumn focused on helping customers achieve sound and sustainable finances by consolidating their loans and offering competitive terms. Swedbank’s consumer finance volumes increased by SEK 1bn from the beginning of the year and the share of the total market was 10.1 per cent (10.0 per cent as of 31 December 2014).
Swedbank – Year-end report 2015 Page 12 of 58
Household deposit volumes increased by SEK 24bn from the beginning of the year, of which SEK 5bn in the fourth quarter. Swedbank’s share of household deposits was 20.9 per cent (21.1 per cent as of 31 December 2014). Corporate deposits within Swedish Banking increased by SEK 17bn from the beginning of the year and by SEK 16bn in the quarter. Swedbank’s market share, including corporate deposits within LC&I, increased to 18.9 per cent as of 30 November (18.7 per cent as of 31 December 2014). Net commission income rose by 3 per cent in 2015 compared with the same period in 2014. The increase was mainly due to higher income from equity trading and structured products as well as card and payment commissions resulting from higher volumes. Asset management commissions decreased, mainly affected by price cuts on fund fees. During the fourth quarter net commission income rose by 3 per cent compared with the third quarter, mainly due to increased sales of structured products. The net flow to equity and mixed funds was positive, bolstered by seasonal PPM flows, while outflows from fixed income funds continued. The shift towards lower risk savings continued as well. The share of associates’ profit decreased compared with the previous year, mainly due to one-off income in 2014 of SEK 230m related to Entercard. Other income was lower than in the previous year due to one-off income in connection with the acquisition of Sparbanken Öresund. Expenses decreased in 2015 mainly due to lower staff costs and one-off items related to the acquisition of Sparbanken Öresund, which contributed to higher expenses in 2014. The increased focus on cost efficiencies also reduced expenses, mainly related to staff. Compared with the third quarter expenses increased, mainly for adjustments in branches and marketing, but were offset slightly by the reversal of a previous provision related to Sparbanken Öresund. Staff costs continued to decrease.
Credit impairments remained low but increased compared with 2014 and amounted to SEK 482m, corresponding to a credit impairment ratio of 0.05%. In the fourth quarter credit impairments amounted to SEK 347m, the large part of which related to a provision tied to a single commitment. The share of impaired loans was 0.17 per cent (0.15) as of 31 December. During the year Swedish Banking focused on stronger coordination of customer offerings and simplification of internal processes in order to better meet customer expectations. The annual customer satisfaction survey saw a clear improvement among private customers. A new channel strategy has been developed as well to coordinate customer service across channels – digitally, by phone and at all branches – to provide better and faster service based on customers’ needs. During the year 39 branches were closed, mainly due to the integration of Sparbanken Öresund and customers’ increased activity in digital channels. The Telephone Bank received 3.6 million calls, an increase of over 8 per cent compared with 2014. The number of customers who use Swedbank’s digital channels continues to grow. The Internet Bank had 3.9 million users as of 31 December, an increase of over 214 000 during the year. The Mobile Bank had 2.5 million users, an increase of 478 000 compared to 2014.
Sweden is Swedbank’s largest market, with around 4 million private customers and more than 250 000 corporate customers. This makes it Sweden’s largest bank by number of customers. Through our digital channels (Telephone Bank, Internet Bank, Mobile Bank and iPad Bank) and branches, and with the cooperation of savings banks and franchisees, we are always available. Swedbank is part of the local community. The bank’s branch managers have a strong mandate to act in their local communities. The bank’s presence and engagement are expressed in various ways. A project called “Young Jobs”, which has created several thousand trainee positions for young people, has played an important part in recent years. Swedbank has 275 branches in Sweden. The various product areas are described beginning on page 19.
Swedbank – Year-end report 2015 Page 13 of 58
Baltic Banking
Strong finish to the year in a challenging environment
Lending growth to private customers
Increased net commission income
Income statement
Q4 Q3 Q4 Full-year Full-year
SEKm 2015 2015 % 2014 % 2015 2014 %
Net interest income 962 900 7 863 11 3 558 3 496 2
Net commission income 548 511 7 505 9 2 052 1 956 5
Net gains and losses on f inancial items at fair value 59 48 23 64 -8 202 239 -15
Other income 118 107 10 102 16 476 416 14
Total income 1 687 1 566 8 1 534 10 6 288 6 107 3
Staff costs 222 204 9 216 3 845 783 8
Variable staff costs 18 20 -10 20 -10 75 78 -4
Other expenses 382 349 9 400 -5 1 426 1 512 -6
Depreciation/amortisation 32 32 0 37 -14 136 144 -6
Total expenses 654 605 8 673 -3 2 482 2 517 -1
Profit before impairments 1 033 961 7 861 20 3 806 3 590 6
Impairment of tangible assets 3 6 -50 10 -70 8 10 -20
Credit impairments -112 -2 -10 -172 -186 -8
Operating profit 1 142 957 19 861 33 3 970 3 765 5
Tax expense 183 132 39 128 43 1 510 565
Profit for the period 959 825 16 733 31 2 460 3 200 -23
Profit for the period attributable to the
shareholders of Swedbank AB 959 825 16 733 31 2 460 3 200 -23
Return on allocated equity, % 19.3 16.2 13.9 12.3 14.6
Loan/deposit ratio, % 86 90 91 86 91
Credit impairment ratio, % -0.35 -0.01 -0.04 -0.14 -0.16
Cost/income ratio 0.39 0.39 0.44 0.39 0.41
Loans, SEKbn 124 129 -4 126 -2 124 126 -2
Deposits, SEKbn 145 144 1 138 5 145 138 5
Full-time employees 3 853 3 786 2 3 920 -2 3 853 3 920 -2 Development January - December
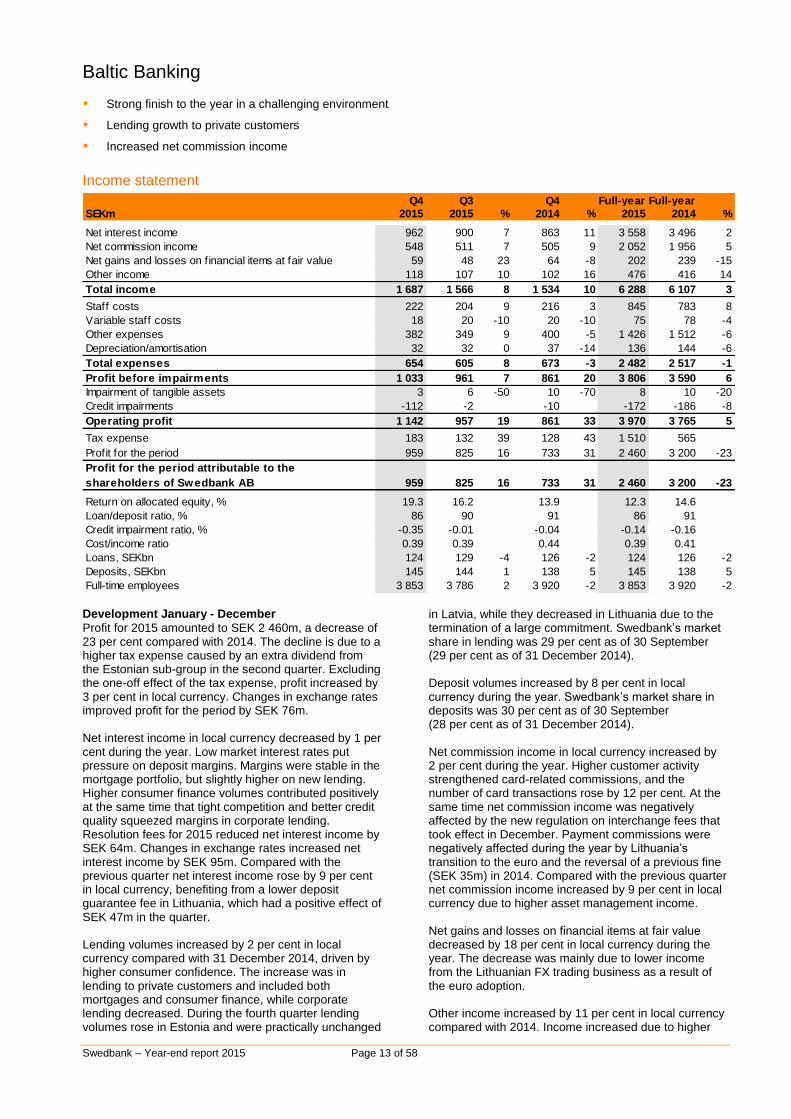
Profit for 2015 amounted to SEK 2 460m, a decrease of 23 per cent compared with 2014. The decline is due to a higher tax expense caused by an extra dividend from the Estonian sub-group in the second quarter. Excluding the one-off effect of the tax expense, profit increased by 3 per cent in local currency. Changes in exchange rates improved profit for the period by SEK 76m. Net interest income in local currency decreased by 1 per cent during the year. Low market interest rates put pressure on deposit margins. Margins were stable in the mortgage portfolio, but slightly higher on new lending. Higher consumer finance volumes contributed positively at the same time that tight competition and better credit quality squeezed margins in corporate lending. Resolution fees for 2015 reduced net interest income by SEK 64m. Changes in exchange rates increased net interest income by SEK 95m. Compared with the previous quarter net interest income rose by 9 per cent in local currency, benefiting from a lower deposit guarantee fee in Lithuania, which had a positive effect of SEK 47m in the quarter. Lending volumes increased by 2 per cent in local currency compared with 31 December 2014, driven by higher consumer confidence. The increase was in lending to private customers and included both mortgages and consumer finance, while corporate lending decreased. During the fourth quarter lending volumes rose in Estonia and were practically unchanged
in Latvia, while they decreased in Lithuania due to the termination of a large commitment. Swedbank’s market share in lending was 29 per cent as of 30 September (29 per cent as of 31 December 2014). Deposit volumes increased by 8 per cent in local currency during the year. Swedbank’s market share in deposits was 30 per cent as of 30 September (28 per cent as of 31 December 2014). Net commission income in local currency increased by 2 per cent during the year. Higher customer activity strengthened card-related commissions, and the number of card transactions rose by 12 per cent. At the same time net commission income was negatively affected by the new regulation on interchange fees that took effect in December. Payment commissions were negatively affected during the year by Lithuania’s transition to the euro and the reversal of a previous fine (SEK 35m) in 2014. Compared with the previous quarter net commission income increased by 9 per cent in local currency due to higher asset management income. Net gains and losses on financial items at fair value decreased by 18 per cent in local currency during the year. The decrease was mainly due to lower income from the Lithuanian FX trading business as a result of the euro adoption. Other income increased by 11 per cent in local currency compared with 2014. Income increased due to higher
Swedbank – Year-end report 2015 Page 14 of 58
insurance-related income for the full-year as well as in the fourth quarter. Total expenses decreased by 4 per cent in local currency during the year, mainly as a result of lower expenses for premises, consultancy and IT. Staff costs rose due to wage increases. Due to customers’ growing preference for digital services, the number of branches was reduced by 12 to 144 during the year, of which 50 are cash-smart branches that focus on advisory services. The emphasis on digital sales is continuing through automated campaigns and targeted offerings. Around 40 per cent of new sales to private customers are through the bank’s digital channels. IT expenses decreased after work related to Lithuania’s transition to the euro was completed. Compared with the previous quarter expenses increased by 10 per cent in local currency, driven by seasonally higher expenses, mainly for staff and marketing. Net recoveries amounted to SEK 172m (186). Credit quality remained stable despite market uncertainty. Swedbank continued to focus on stable customers with low risk. Latvia reported net recoveries of SEK 228m during the year, while Estonia and Lithuania reported credit impairments of SEK 34m and SEK 22m respectively, related to a few customers. During the fourth quarter net recoveries of SEK 112m were reported, of which SEK 106m in Latvia and SEK 14m in Lithuania, while minor credit impairments were reported in Estonia.
The situation in Russia has not had a financial impact. The sectors most affected by the Russian recession are agriculture and transport. Swedbank’s direct or indirect exposures to these sectors are limited. Swedbank continues to take preventive measures to help customers who could be affected by the situation in Russia. The tax expense increased during the year to SEK 1 510m (565), mainly due to an extra dividend from the Estonian sub-group in the second quarter, which resulted in an extra tax expense of SEK 929m. During the fourth quarter a dividend was also approved from the Estonian asset management company, which resulted in an extra tax expense of SEK 22m. Swedbank reached an agreement with Danske Bank to acquire Danske´s retail banking business in Lithuania and Latvia. The acquisition is subject to regulatory approval in both Lithuania and Latvia and is scheduled to close in the first half-year 2016.
Swedbank is the largest bank by number of customers in Estonia, Latvia and Lithuania, with more than 3 million private customers and more than 300 000 corporate customers. According to surveys, Swedbank is also the most respected company in the financial sector. Through its digital channels (Telephone Bank, Internet Bank and Mobile Bank) and branches, the bank is always available. Swedbank is part of the local community. Its local social engagement is expressed in many ways, with initiatives to promote education, entrepreneurship and social welfare. Swedbank has 36 branches in Estonia, 41 in Latvia and 67 in Lithuania. The various product areas are described on page 19.
Swedbank – Year-end report 2015 Page 15 of 58
Large Corporates & Institutions
Increased deposit volumes
Higher activity in equity and FX trading in the fourth quarter
Stronger position in EUR bond issues
Income statement
Q4 Q3 Q4 Full-year Full-year
SEKm 2015 2015 % 2014 % 2015 2014 %
Net interest income 839 865 -3 890 -6 3 428 3 485 -2
Net commission income 529 509 4 534 -1 2 025 2 233 -9
Net gains and losses on f inancial items at fair value 413 315 31 434 -5 1 891 1 929 -2
Other income 36 33 9 20 80 143 121 18
Total income 1 817 1 722 6 1 878 -3 7 487 7 768 -4
Staff costs 375 328 14 363 3 1 425 1 364 4
Variable staff costs 17 57 -70 67 -75 228 288 -21
Other expenses 454 365 24 411 10 1 629 1 644 -1
Depreciation/amortisation 15 16 -6 16 -6 64 68 -6
Total expenses 861 766 12 857 0 3 346 3 364 -1
Profit before impairments 956 956 0 1 021 -6 4 141 4 404 -6
Credit impairments 164 97 69 120 37 284 381 -25
Operating profit 792 859 -8 901 -12 3 857 4 023 -4
Tax expense 170 193 -12 217 -22 630 880 -28
Profit for the period 622 666 -7 684 -9 3 227 3 143 3
Profit for the period attributable to the
shareholders of Swedbank AB 622 666 -7 684 -9 3 227 3 143 3
Return on allocated equity, % 12.9 13.3 15.1 16.2 19.3
Loan/deposit ratio, % 150 177 165 150 165
Credit impairment ratio, % 0.24 0.14 0.21 0.16 0.18
Cost/income ratio 0.47 0.44 0.46 0.45 0.43
Loans, SEKbn 182 182 0 175 4 182 175 4
Deposits, SEKbn 121 103 17 106 14 121 106 14
Full-time employees 1 195 1 205 -1 1 193 0 1 195 1 193 0 Development January - December
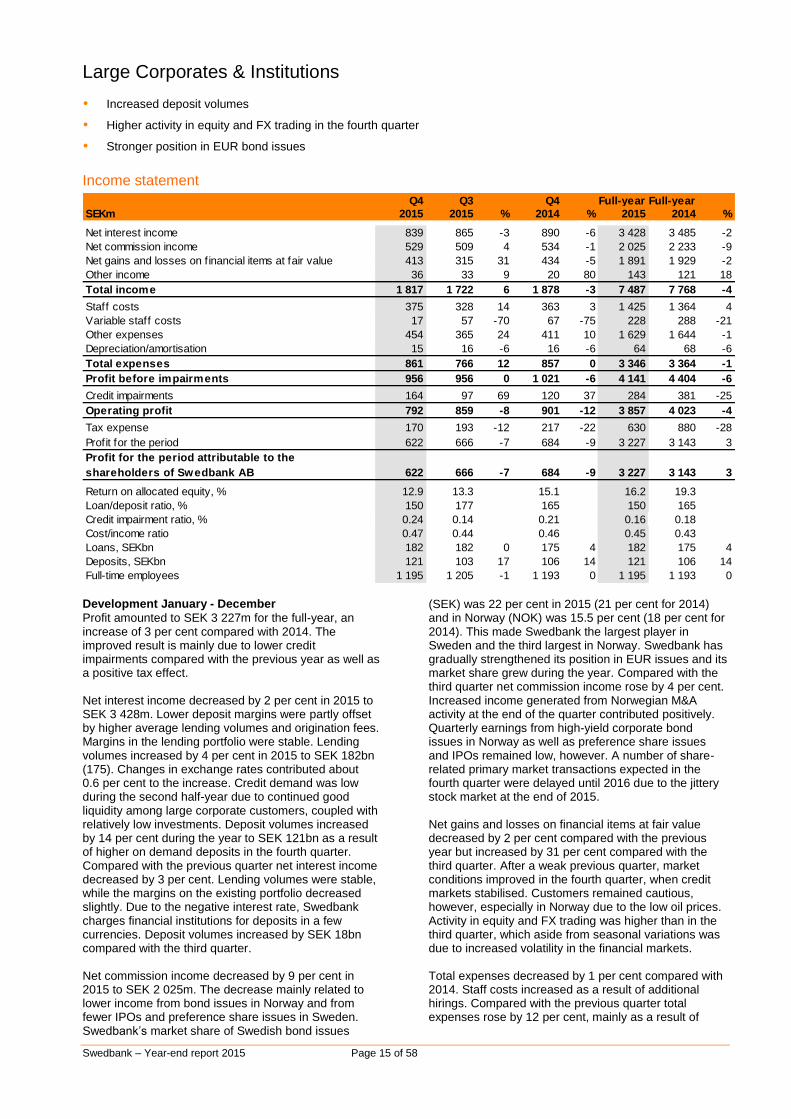
Profit amounted to SEK 3 227m for the full-year, an increase of 3 per cent compared with 2014. The improved result is mainly due to lower credit impairments compared with the previous year as well as a positive tax effect. Net interest income decreased by 2 per cent in 2015 to SEK 3 428m. Lower deposit margins were partly offset by higher average lending volumes and origination fees. Margins in the lending portfolio were stable. Lending volumes increased by 4 per cent in 2015 to SEK 182bn (175). Changes in exchange rates contributed about 0.6 per cent to the increase. Credit demand was low during the second half-year due to continued good liquidity among large corporate customers, coupled with relatively low investments. Deposit volumes increased by 14 per cent during the year to SEK 121bn as a result of higher on demand deposits in the fourth quarter. Compared with the previous quarter net interest income decreased by 3 per cent. Lending volumes were stable, while the margins on the existing portfolio decreased slightly. Due to the negative interest rate, Swedbank charges financial institutions for deposits in a few currencies. Deposit volumes increased by SEK 18bn compared with the third quarter. Net commission income decreased by 9 per cent in 2015 to SEK 2 025m. The decrease mainly related to lower income from bond issues in Norway and from fewer IPOs and preference share issues in Sweden. Swedbank’s market share of Swedish bond issues
(SEK) was 22 per cent in 2015 (21 per cent for 2014) and in Norway (NOK) was 15.5 per cent (18 per cent for 2014). This made Swedbank the largest player in Sweden and the third largest in Norway. Swedbank has gradually strengthened its position in EUR issues and its market share grew during the year. Compared with the third quarter net commission income rose by 4 per cent. Increased income generated from Norwegian M&A activity at the end of the quarter contributed positively. Quarterly earnings from high-yield corporate bond issues in Norway as well as preference share issues and IPOs remained low, however. A number of share-related primary market transactions expected in the fourth quarter were delayed until 2016 due to the jittery stock market at the end of 2015. Net gains and losses on financial items at fair value decreased by 2 per cent compared with the previous year but increased by 31 per cent compared with the third quarter. After a weak previous quarter, market conditions improved in the fourth quarter, when credit markets stabilised. Customers remained cautious, however, especially in Norway due to the low oil prices. Activity in equity and FX trading was higher than in the third quarter, which aside from seasonal variations was due to increased volatility in the financial markets. Total expenses decreased by 1 per cent compared with 2014. Staff costs increased as a result of additional hirings. Compared with the previous quarter total expenses rose by 12 per cent, mainly as a result of
Swedbank – Year-end report 2015 Page 16 of 58
higher IT expenses at the end of the year and higher staff costs in Norway. The tax expense amounted to SEK 630m for 2015. The second quarter was positively affected by a one-off item of SEK 230m related to the US operations. Credit impairments amounted to SEK 284m in 2015 (381). The year’s credit impairments were primarily attributable to increased provisions during the second half-year for a small number commitments.
The share of impaired loans was 0.37 per cent (0.22). Credit quality in the loan portfolio is good. At the end of the fourth quarter oil prices fell to historically low levels, and the investment level in the oil sector is expected to remain low for some time. Since Swedbank expects weakness in the market to continue in 2016, it is likely to lead to the need for provisions. Companies in oil-related sectors continue to take measures to adjust to the low oil prices and lower investment level in the oil sector. Swedbank is closely dialoguing with customers in these sectors, which mainly consist of listed companies with high credit ratings and long-term customer contracts.
Large Corporates & Institutions is responsible for Swedbank’s offering to customers with revenues above SEK 2 billion and those whose needs are considered complex due to multinational operations or a need for sophisticated financing solutions. They are also responsible for developing corporate and capital market products for other parts of the bank and the Swedish savings banks. LC&I works closely with customers, who receive advice on decisions that create sustainable profits and growth. LC&I is represented in Sweden, Norway, Estonia, Latvia, Lithuania, Finland, Luxembourg, China, the US and South Africa.
Swedbank – Year-end report 2015 Page 17 of 58
Group Functions & Other
Income statement
Q4 Q3 Q4 Full-year Full-year
SEKm 2015 2015 % 2014 % 2015 2014 %
Net interest income 398 642 -38 750 -47 2 572 2 302 12
Net commission income 17 -22 31 -45 -134 0
Net gains and losses on f inancial items at fair value -390 -423 -8 -510 -24 -1 785 -413
Share of profit or loss of associates 0 0 -1 1 0
Other income 172 210 -18 242 -29 759 1 072 -29
Total income 197 407 -52 512 -62 1 413 2 961 -52
Staff costs 773 697 11 757 2 2 964 3 272 -9
Variable staff costs 35 48 -27 54 -35 214 230 -7
Other expenses -664 -705 -6 -707 -6 -2 911 -2 727 -7
Depreciation/amortisation 85 90 -6 92 -8 366 410 -11
Total expenses 229 130 76 196 17 633 1 185 -47
Profit before impairments -32 277 316 780 1 776 -56
Impairment of intangible assets 0 254 0 254 0
Impairment of tangible assets 16 10 60 23 -30 64 246 -74
Credit impairments 0 0 -3 0 -22
Operating profit -48 13 296 462 1 552 -70
Tax expense 26 21 24 90 -71 -63 464
Profit for the period from continuing operations -74 -8 206 525 1 088 -52
Profit for the period from discontinued operations, after tax -12 -11 9 -3 -6 -262 -98
Profit for the period -86 -19 203 519 826 -37
Profit for the period attributable to the
shareholders of Swedbank AB -86 -19 202 519 824 -37
Non-controlling interests 0 0 1 0 2
Full-time employees 4 376 4 367 0 4 462 -2 4 376 4 462 -2
Net interest income and net gains and losses on financial items mainly stem from Group Treasury. Other income mainly refers to income from the savings banks. Expenses mainly relate to Group Products and Group staffs and are allocated to a large extent. The product areas are described in more detail on page 19.
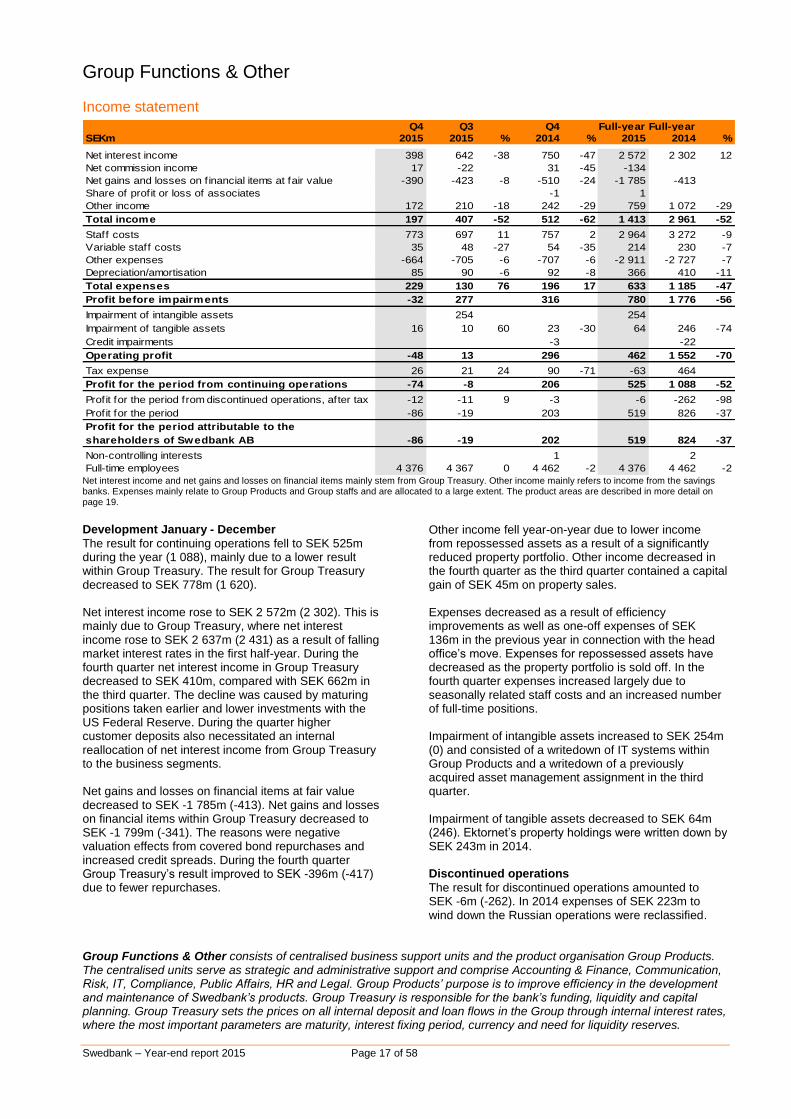
Development January - December
The result for continuing operations fell to SEK 525m during the year (1 088), mainly due to a lower result within Group Treasury. The result for Group Treasury decreased to SEK 778m (1 620). Net interest income rose to SEK 2 572m (2 302). This is mainly due to Group Treasury, where net interest income rose to SEK 2 637m (2 431) as a result of falling market interest rates in the first half-year. During the fourth quarter net interest income in Group Treasury decreased to SEK 410m, compared with SEK 662m in the third quarter. The decline was caused by maturing positions taken earlier and lower investments with the US Federal Reserve. During the quarter higher customer deposits also necessitated an internal reallocation of net interest income from Group Treasury to the business segments. Net gains and losses on financial items at fair value decreased to SEK -1 785m (-413). Net gains and losses on financial items within Group Treasury decreased to SEK -1 799m (-341). The reasons were negative valuation effects from covered bond repurchases and increased credit spreads. During the fourth quarter Group Treasury’s result improved to SEK -396m (-417) due to fewer repurchases.
Other income fell year-on-year due to lower income from repossessed assets as a result of a significantly reduced property portfolio. Other income decreased in the fourth quarter as the third quarter contained a capital gain of SEK 45m on property sales. Expenses decreased as a result of efficiency improvements as well as one-off expenses of SEK 136m in the previous year in connection with the head office’s move. Expenses for repossessed assets have decreased as the property portfolio is sold off. In the fourth quarter expenses increased largely due to seasonally related staff costs and an increased number of full-time positions. Impairment of intangible assets increased to SEK 254m (0) and consisted of a writedown of IT systems within Group Products and a writedown of a previously acquired asset management assignment in the third quarter. Impairment of tangible assets decreased to SEK 64m (246). Ektornet’s property holdings were written down by SEK 243m in 2014. Discontinued operations
The result for discontinued operations amounted to SEK -6m (-262). In 2014 expenses of SEK 223m to wind down the Russian operations were reclassified.
Group Functions & Other consists of centralised business support units and the product organisation Group Products. The centralised units serve as strategic and administrative support and comprise Accounting & Finance, Communication, Risk, IT, Compliance, Public Affairs, HR and Legal. Group Products’ purpose is to improve efficiency in the development and maintenance of Swedbank’s products. Group Treasury is responsible for the bank’s funding, liquidity and capital planning. Group Treasury sets the prices on all internal deposit and loan flows in the Group through internal interest rates, where the most important parameters are maturity, interest fixing period, currency and need for liquidity reserves.
Swedbank – Year-end report 2015 Page 18 of 58
Eliminations
Income statement
Q4 Q3 Q4 Full-year Full-year
SEKm 2015 2015 % 2014 % 2015 2014 %
Net interest income 0 0 5 0 9
Net commission income 21 21 0 22 -5 80 76 5
Net gains and losses on financial items at fair value 0 0 1 -1 1
Other income -46 -55 16 -81 43 -194 -296 34
Total income -25 -34 26 -53 -53 -115 -210 45
Staff costs 0 0 -1 0 -1
Variable staff costs 0 0 0 0 0
Other expenses -25 -34 26 -57 -56 -115 -214 46
Depreciation/amortisation 0 0 5 0 5
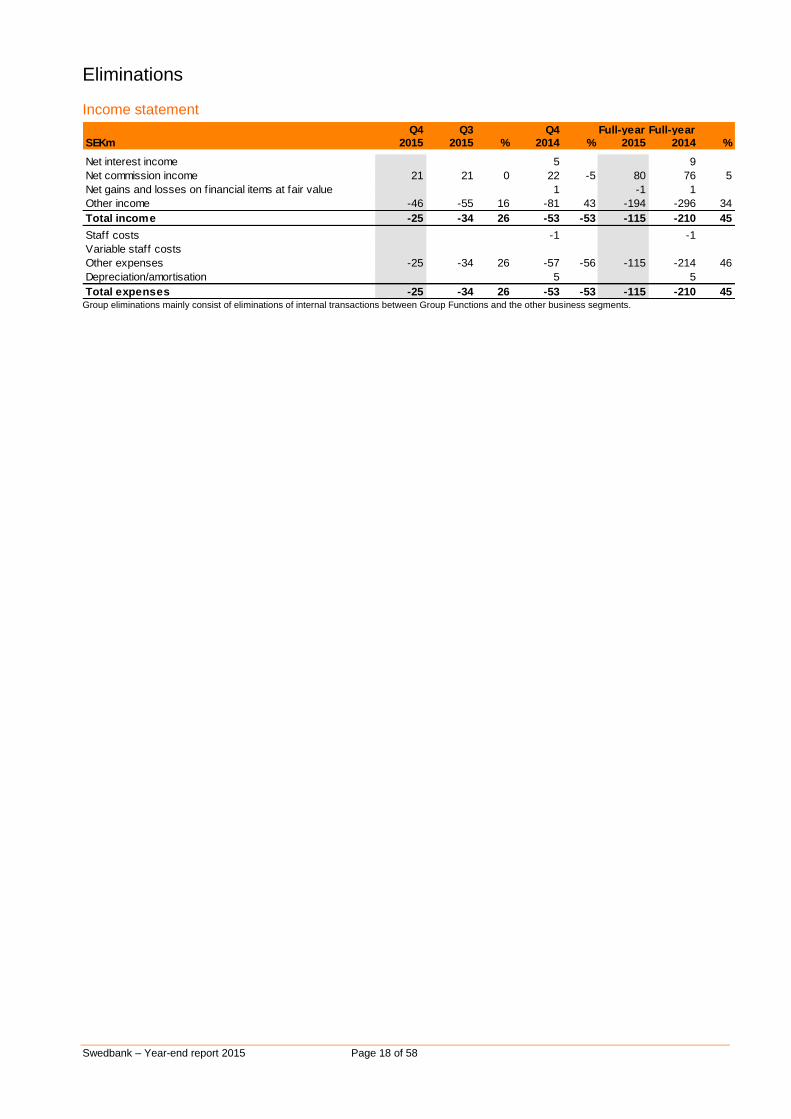
Total expenses -25 -34 26 -53 -53 -115 -210 45 Group eliminations mainly consist of eliminations of internal transactions between Group Functions and the other business segments.
Swedbank – Year-end report 2015 Page 19 of 58
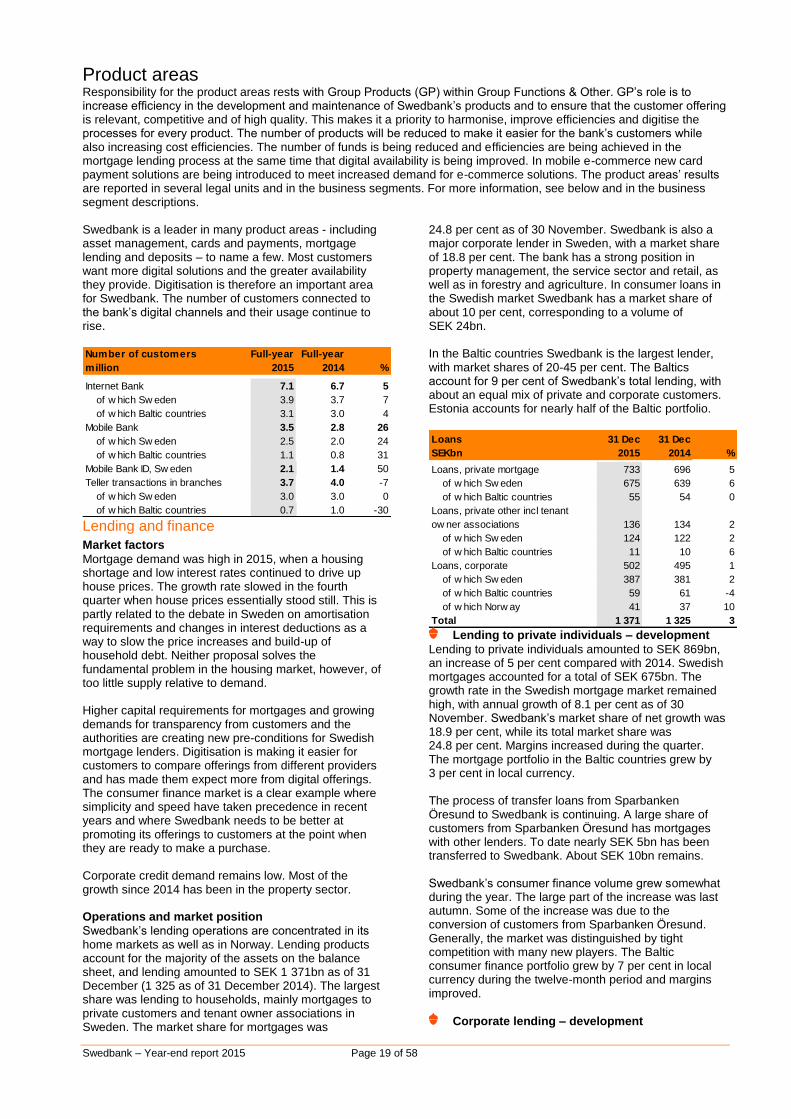
Product areasResponsibility for the product areas rests with Group Products (GP) within Group Functions & Other. GP’s role is to increase efficiency in the development and maintenance of Swedbank’s products and to ensure that the customer offering is relevant, competitive and of high quality. This makes it a priority to harmonise, improve efficiencies and digitise the processes for every product. The number of products will be reduced to make it easier for the bank’s customers while also increasing cost efficiencies. The number of funds is being reduced and efficiencies are being achieved in the mortgage lending process at the same time that digital availability is being improved. In mobile e-commerce new card payment solutions are being introduced to meet increased demand for e-commerce solutions. The product areas’ results are reported in several legal units and in the business segments. For more information, see below and in the business segment descriptions. Swedbank is a leader in many product areas - including asset management, cards and payments, mortgage lending and deposits – to name a few. Most customers want more digital solutions and the greater availability they provide. Digitisation is therefore an important area for Swedbank. The number of customers connected to the bank’s digital channels and their usage continue to rise. Number of customers Full-year Full-year
million 2015 2014 %
Internet Bank 7.1 6.7 5
of w hich Sw eden 3.9 3.7 7
of w hich Baltic countries 3.1 3.0 4
Mobile Bank 3.5 2.8 26
of w hich Sw eden 2.5 2.0 24
of w hich Baltic countries 1.1 0.8 31
Mobile Bank ID, Sw eden 2.1 1.4 50
Teller transactions in branches 3.7 4.0 -7
of w hich Sw eden 3.0 3.0 0
of w hich Baltic countries 0.7 1.0 -30 Lending and finance
Market factors
Mortgage demand was high in 2015, when a housing shortage and low interest rates continued to drive up house prices. The growth rate slowed in the fourth quarter when house prices essentially stood still. This is partly related to the debate in Sweden on amortisation requirements and changes in interest deductions as a way to slow the price increases and build-up of household debt. Neither proposal solves the fundamental problem in the housing market, however, of too little supply relative to demand. Higher capital requirements for mortgages and growing demands for transparency from customers and the authorities are creating new pre-conditions for Swedish mortgage lenders. Digitisation is making it easier for customers to compare offerings from different providers and has made them expect more from digital offerings. The consumer finance market is a clear example where simplicity and speed have taken precedence in recent years and where Swedbank needs to be better at promoting its offerings to customers at the point when they are ready to make a purchase. Corporate credit demand remains low. Most of the growth since 2014 has been in the property sector. Operations and market position
Swedbank’s lending operations are concentrated in its home markets as well as in Norway. Lending products account for the majority of the assets on the balance sheet, and lending amounted to SEK 1 371bn as of 31 December (1 325 as of 31 December 2014). The largest share was lending to households, mainly mortgages to private customers and tenant owner associations in Sweden. The market share for mortgages was
24.8 per cent as of 30 November. Swedbank is also a major corporate lender in Sweden, with a market share of 18.8 per cent. The bank has a strong position in property management, the service sector and retail, as well as in forestry and agriculture. In consumer loans in the Swedish market Swedbank has a market share of about 10 per cent, corresponding to a volume of SEK 24bn. In the Baltic countries Swedbank is the largest lender, with market shares of 20-45 per cent. The Baltics account for 9 per cent of Swedbank’s total lending, with about an equal mix of private and corporate customers. Estonia accounts for nearly half of the Baltic portfolio.
Loans 31 Dec 31 Dec
SEKbn 2015 2014 %
Loans, private mortgage 733 696 5
of w hich Sw eden 675 639 6
of w hich Baltic countries 55 54 0
Loans, private other incl tenant
ow ner associations 136 134 2
of w hich Sw eden 124 122 2
of w hich Baltic countries 11 10 6
Loans, corporate 502 495 1
of w hich Sw eden 387 381 2
of w hich Baltic countries 59 61 -4
of w hich Norw ay 41 37 10
Total 1 371 1 325 3 Lending to private individuals – development
Lending to private individuals amounted to SEK 869bn, an increase of 5 per cent compared with 2014. Swedish mortgages accounted for a total of SEK 675bn. The growth rate in the Swedish mortgage market remained high, with annual growth of 8.1 per cent as of 30 November. Swedbank’s market share of net growth was 18.9 per cent, while its total market share was 24.8 per cent. Margins increased during the quarter. The mortgage portfolio in the Baltic countries grew by 3 per cent in local currency. The process of transfer loans from Sparbanken Öresund to Swedbank is continuing. A large share of customers from Sparbanken Öresund has mortgages with other lenders. To date nearly SEK 5bn has been transferred to Swedbank. About SEK 10bn remains. Swedbank’s consumer finance volume grew somewhat during the year. The large part of the increase was last autumn. Some of the increase was due to the conversion of customers from Sparbanken Öresund. Generally, the market was distinguished by tight competition with many new players. The Baltic consumer finance portfolio grew by 7 per cent in local currency during the twelve-month period and margins improved.
Corporate lending – development
Swedbank – Year-end report 2015 Page 20 of 58
Corporate lending amounted to SEK 502bn, an increase of 1 per cent during the twelve-month period. Approximately 42 per cent of the total outstanding volume is related to properties. Swedbank’s share of new corporate lending in Sweden has slowed in recent months to 21.4 per cent on an annual basis, compared with an underlying market share of 18.8 per cent. Corporate lending in the Baltic countries decreased by 1 per cent in local currency during the twelve-month period to SEK 59bn. The lending portfolio in local currency grew by 3 per cent in Estonia and 1 per cent in Latvia and decreased by 8 per cent in Lithuania.
Save and invest
Market factors
The savings market is undergoing change. Its demographic structure with an ageing population, coupled with greater individual responsibility for pensions and other long-term savings, is creating higher demand for savings and investment products and a great need for advisory services. Digitisation and changing regulations have contributed to greater transparency and competition as well as to more standardised products, leading to price pressure. Upcoming regulations in Sweden that would prohibit commissions are one example and would mean that commissions can no longer be paid to distributors that sell products on an advisory basis. The regulations are expected to be introduced in 2017. Another trend is that customers are more willing to switch savings providers now that transfers are much easier, and they are reacting faster to changes in the market than before. Swedbank is positive to the debate on freer transfers of pension savings and is not averse to increased regulation to create an efficient transfer market with greater transparency for customers. A higher share of new savings is being placed in pension products and passively managed funds with lower margins. At the same time deposit margins are under pressure from low interest rates, as are the prices of other investments such as equities, fixed income funds and index-linked bonds. Swedbank is addressing margin pressure mainly through efficiencies and cost savings. Operations and market position
Swedbank is the leader in deposits in its home markets. Slightly over 70 per cent of total volume is in Sweden. Swedbank’s market share in Sweden was 20.9 per cent for private deposits and 18.9 per cent for corporate deposits. The market shares in the Baltic countries for private deposits ranged between 27 and 54 per cent and for corporate deposits between 11 and 36 per cent. The shares were highest in Estonia. Asset management is provided through Swedbank Robur in Swedbank’s four home markets as well as in Norway. In Sweden Swedbank Robur is the largest player with a market share of 22.0 per cent based on fund assets under management. Swedbank is the seventh largest life insurance company in Sweden, with a market share of about 7 per cent in premium payments excluding capital transfers. The market share for transferred capital is nearly 5 per cent, putting Swedbank in sixth place. Swedbank is the largest life insurance company in Estonia, with a rising market share in 2015, and the second largest in Lithuania. As of 30 November the market shares were 40 and 22 per cent, respectively. In Latvia it was 20 per cent. The market shares for Baltic non-life insurance
operations based on total premium income ranged between 2 and 15 per cent, with the largest share in Estonia. In homeowner’s and vehicle insurance in Estonia the market shares were 29 per cent and 25 per cent, respectively. Non-life insurance is offered in Sweden through the insurance company Tre Kronor.
Deposits – development
Deposits 31 Dec 31 Dec
SEKbn 2015 2014 %
Deposits, private 399 372 8
of w hich Sw eden 313 289 8
of w hich Baltic countries 85 82 4
Deposits, corporate 345 289 19
of w hich Sw eden 240 211 14
of w hich Baltic countries 69 62 11
of w hich other countries 36 16 125
Total 744 661 13 During the year deposit volumes grew by SEK 83bn, an increase of 13 per cent compared with 2014. The largest increase was in Swedish Banking, where volumes rose by SEK 41bn, or 10 per cent, of which SEK 24bn was deposits from private customers. In LC&I volumes increased by SEK 15bn. In Baltic Banking deposits in local currency increased by 8 per cent. Deposits increased in all three countries. The product range in deposits is being simplified by reducing the number of savings account options.
Asset management – development
Fund assets under management amounted to SEK 738bn (715), of which SEK 706bn is attributable to the Swedish operations. Discretionary assets under management amounted to SEK 353bn (337). Swedbank Robur had a net outflow of SEK 14bn (21) in the Swedish fund market. This was mainly due to the low interest rate environment and volatile equity prices, as well as withdrawals by a few institutional customers. Outflows from fixed income and equity funds continued through much of the year. The net inflow in the fourth quarter was SEK 1bn, with the annual PPM deposit in December reducing the negative flow by SEK 5bn. The net inflow to mixed funds was strong throughout 2015 (SEK 17bn), corresponding to a market share of 23 per cent.
Net inflow Swedish Total
Of which
Robur Total
Of which
Robur
fund market, SEKbn 2015 2015 Q4 2015 Q4 2015
Fixed income funds -2 -17 -19 -5
Mixed funds 76 17 17 4
Equity funds -2 -15 38 1
of w hich index funds 20 1 11 0
Other funds 13 0 1 0
Total net inflow 85 -14 37 0
Swedbank’s share of the total net flow in Sweden was negative in 2015 (22 per cent in 2014). Swedbank is also a distributor of other funds, and its share of total net sales was also negative (22 per cent for 2014), with lower sales of external funds as well. To strengthen the fund offering, management fees were reduced on a number of funds in 2015. In addition, seven Access funds with special sustainability criteria were merged or launched, in line with the intention to simplify and develop the offering. Changes were made earlier in the fund management process to streamline the range of companies that the
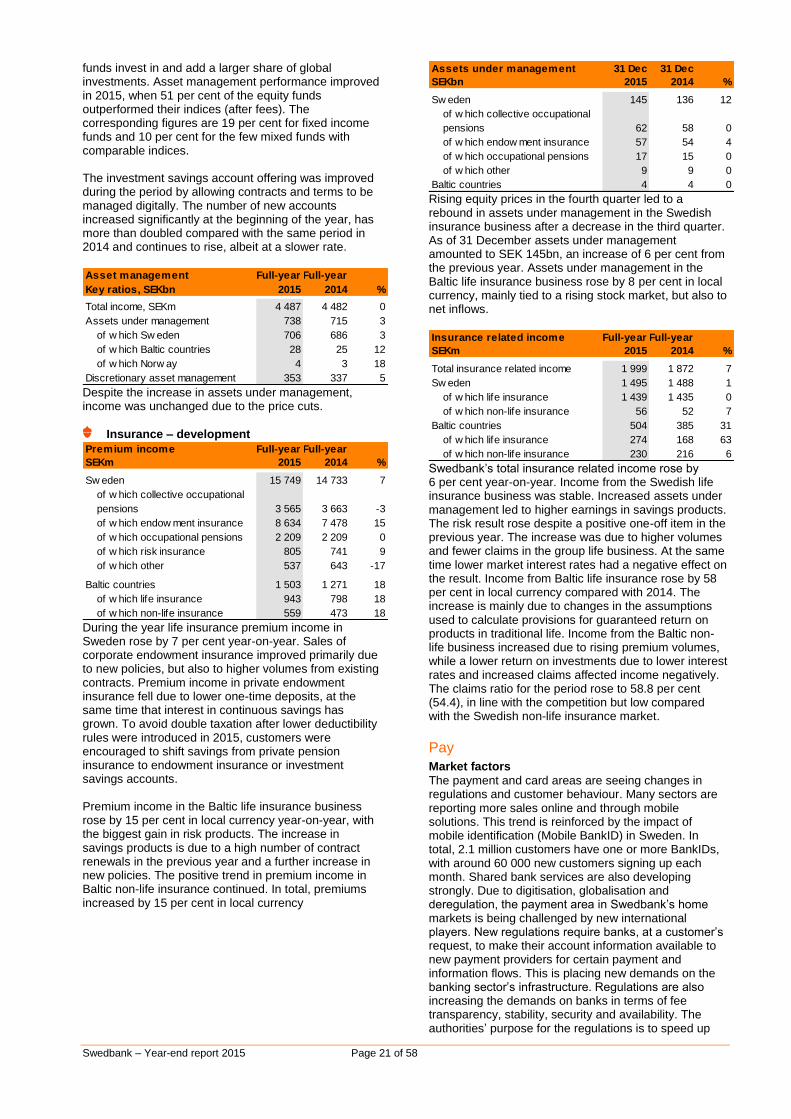
Swedbank – Year-end report 2015 Page 21 of 58
funds invest in and add a larger share of global investments. Asset management performance improved in 2015, when 51 per cent of the equity funds outperformed their indices (after fees). The corresponding figures are 19 per cent for fixed income funds and 10 per cent for the few mixed funds with comparable indices. The investment savings account offering was improved during the period by allowing contracts and terms to be managed digitally. The number of new accounts increased significantly at the beginning of the year, has more than doubled compared with the same period in 2014 and continues to rise, albeit at a slower rate. Asset management Full-year Full-year
Key ratios, SEKbn 2015 2014 %
Total income, SEKm 4 487 4 482 0
Assets under management 738 715 3
of w hich Sw eden 706 686 3
of w hich Baltic countries 28 25 12
of w hich Norw ay 4 3 18
Discretionary asset management 353 337 5
Despite the increase in assets under management, income was unchanged due to the price cuts.
Insurance – development
Premium income Full-year Full-year
SEKm 2015 2014 %
Sw eden 15 749 14 733 7
of w hich collective occupational
pensions 3 565 3 663 -3
of w hich endow ment insurance 8 634 7 478 15
of w hich occupational pensions 2 209 2 209 0
of w hich risk insurance 805 741 9
of w hich other 537 643 -17
Baltic countries 1 503 1 271 18
of w hich life insurance 943 798 18
of w hich non-life insurance 559 473 18 During the year life insurance premium income in Sweden rose by 7 per cent year-on-year. Sales of corporate endowment insurance improved primarily due to new policies, but also to higher volumes from existing contracts. Premium income in private endowment insurance fell due to lower one-time deposits, at the same time that interest in continuous savings has grown. To avoid double taxation after lower deductibility rules were introduced in 2015, customers were encouraged to shift savings from private pension insurance to endowment insurance or investment savings accounts. Premium income in the Baltic life insurance business rose by 15 per cent in local currency year-on-year, with the biggest gain in risk products. The increase in savings products is due to a high number of contract renewals in the previous year and a further increase in new policies. The positive trend in premium income in Baltic non-life insurance continued. In total, premiums increased by 15 per cent in local currency
Assets under management 31 Dec 31 Dec
SEKbn 2015 2014 %
Sw eden 145 136 12
of w hich collective occupational
pensions 62 58 0
of w hich endow ment insurance 57 54 4
of w hich occupational pensions 17 15 0
of w hich other 9 9 0
Baltic countries 4 4 0
Rising equity prices in the fourth quarter led to a rebound in assets under management in the Swedish insurance business after a decrease in the third quarter. As of 31 December assets under management amounted to SEK 145bn, an increase of 6 per cent from the previous year. Assets under management in the Baltic life insurance business rose by 8 per cent in local currency, mainly tied to a rising stock market, but also to net inflows.
Insurance related income Full-year Full-year
SEKm 2015 2014 %
Total insurance related income 1 999 1 872 7
Sw eden 1 495 1 488 1
of w hich life insurance 1 439 1 435 0
of w hich non-life insurance 56 52 7
Baltic countries 504 385 31
of w hich life insurance 274 168 63
of w hich non-life insurance 230 216 6
Swedbank’s total insurance related income rose by 6 per cent year-on-year. Income from the Swedish life insurance business was stable. Increased assets under management led to higher earnings in savings products. The risk result rose despite a positive one-off item in the previous year. The increase was due to higher volumes and fewer claims in the group life business. At the same time lower market interest rates had a negative effect on the result. Income from Baltic life insurance rose by 58 per cent in local currency compared with 2014. The increase is mainly due to changes in the assumptions used to calculate provisions for guaranteed return on products in traditional life. Income from the Baltic non-life business increased due to rising premium volumes, while a lower return on investments due to lower interest rates and increased claims affected income negatively. The claims ratio for the period rose to 58.8 per cent (54.4), in line with the competition but low compared with the Swedish non-life insurance market.
Pay
Market factors
The payment and card areas are seeing changes in regulations and customer behaviour. Many sectors are reporting more sales online and through mobile solutions. This trend is reinforced by the impact of mobile identification (Mobile BankID) in Sweden. In total, 2.1 million customers have one or more BankIDs, with around 60 000 new customers signing up each month. Shared bank services are also developing strongly. Due to digitisation, globalisation and deregulation, the payment area in Swedbank’s home markets is being challenged by new international players. New regulations require banks, at a customer’s request, to make their account information available to new payment providers for certain payment and information flows. This is placing new demands on the banking sector’s infrastructure. Regulations are also increasing the demands on banks in terms of fee transparency, stability, security and availability. The authorities’ purpose for the regulations is to speed up
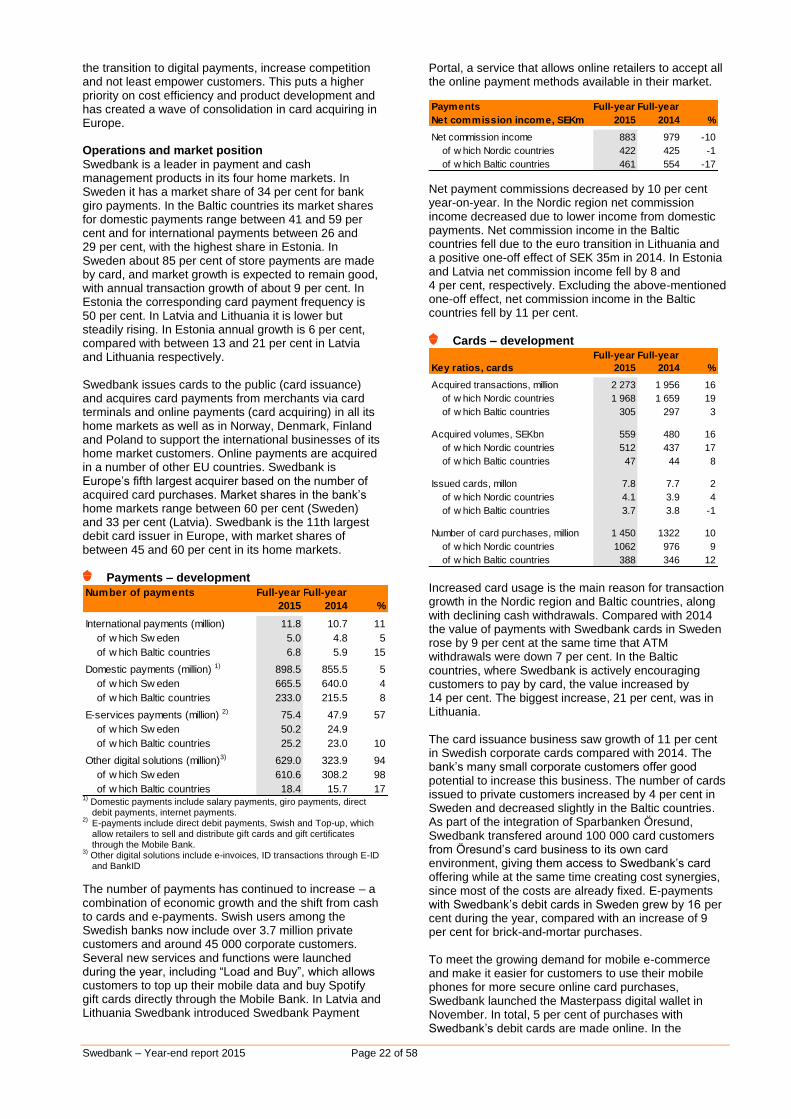
Swedbank – Year-end report 2015 Page 22 of 58
the transition to digital payments, increase competition and not least empower customers. This puts a higher priority on cost efficiency and product development and has created a wave of consolidation in card acquiring in Europe. Operations and market position
Swedbank is a leader in payment and cash management products in its four home markets. In Sweden it has a market share of 34 per cent for bank giro payments. In the Baltic countries its market shares for domestic payments range between 41 and 59 per cent and for international payments between 26 and 29 per cent, with the highest share in Estonia. In Sweden about 85 per cent of store payments are made by card, and market growth is expected to remain good, with annual transaction growth of about 9 per cent. In Estonia the corresponding card payment frequency is 50 per cent. In Latvia and Lithuania it is lower but steadily rising. In Estonia annual growth is 6 per cent, compared with between 13 and 21 per cent in Latvia and Lithuania respectively. Swedbank issues cards to the public (card issuance) and acquires card payments from merchants via card terminals and online payments (card acquiring) in all its home markets as well as in Norway, Denmark, Finland and Poland to support the international businesses of its home market customers. Online payments are acquired in a number of other EU countries. Swedbank is Europe’s fifth largest acquirer based on the number of acquired card purchases. Market shares in the bank’s home markets range between 60 per cent (Sweden) and 33 per cent (Latvia). Swedbank is the 11th largest debit card issuer in Europe, with market shares of between 45 and 60 per cent in its home markets.
Payments – development
Number of payments Full-year Full-year
2015 2014 %
International payments (million) 11.8 10.7 11
of w hich Sw eden 5.0 4.8 5
of w hich Baltic countries 6.8 5.9 15
Domestic payments (million) 1) 898.5 855.5 5
of w hich Sw eden 665.5 640.0 4
of w hich Baltic countries 233.0 215.5 8
E-services payments (million) 2) 75.4 47.9 57
of w hich Sw eden 50.2 24.9
of w hich Baltic countries 25.2 23.0 10
Other digital solutions (million)3) 629.0 323.9 94
of w hich Sw eden 610.6 308.2 98
of w hich Baltic countries 18.4 15.7 17
1) Domestic payments include salary payments, giro payments, direct debit payments, internet payments.
2) E-payments include direct debit payments, Swish and Top-up, which allow retailers to sell and distribute gift cards and gift certificates through the Mobile Bank.
3) Other digital solutions include e-invoices, ID transactions through E-ID and BankID
The number of payments has continued to increase – a combination of economic growth and the shift from cash to cards and e-payments. Swish users among the Swedish banks now include over 3.7 million private customers and around 45 000 corporate customers. Several new services and functions were launched during the year, including “Load and Buy”, which allows customers to top up their mobile data and buy Spotify gift cards directly through the Mobile Bank. In Latvia and Lithuania Swedbank introduced Swedbank Payment
Portal, a service that allows online retailers to accept all the online payment methods available in their market.
Payments Full-year Full-year
Net commission income, SEKm 2015 2014 %
Net commission income 883 979 -10
of w hich Nordic countries 422 425 -1
of w hich Baltic countries 461 554 -17
Net payment commissions decreased by 10 per cent year-on-year. In the Nordic region net commission income decreased due to lower income from domestic payments. Net commission income in the Baltic countries fell due to the euro transition in Lithuania and a positive one-off effect of SEK 35m in 2014. In Estonia and Latvia net commission income fell by 8 and 4 per cent, respectively. Excluding the above-mentioned one-off effect, net commission income in the Baltic countries fell by 11 per cent.
Cards – development Full-year Full-year
Key ratios, cards 2015 2014 %
Acquired transactions, million 2 273 1 956 16
of w hich Nordic countries 1 968 1 659 19
of w hich Baltic countries 305 297 3
Acquired volumes, SEKbn 559 480 16
of w hich Nordic countries 512 437 17
of w hich Baltic countries 47 44 8
Issued cards, millon 7.8 7.7 2
of w hich Nordic countries 4.1 3.9 4
of w hich Baltic countries 3.7 3.8 -1
Number of card purchases, million 1 450 1322 10
of w hich Nordic countries 1062 976 9
of w hich Baltic countries 388 346 12
Increased card usage is the main reason for transaction growth in the Nordic region and Baltic countries, along with declining cash withdrawals. Compared with 2014 the value of payments with Swedbank cards in Sweden rose by 9 per cent at the same time that ATM withdrawals were down 7 per cent. In the Baltic countries, where Swedbank is actively encouraging customers to pay by card, the value increased by 14 per cent. The biggest increase, 21 per cent, was in Lithuania. The card issuance business saw growth of 11 per cent in Swedish corporate cards compared with 2014. The bank’s many small corporate customers offer good potential to increase this business. The number of cards issued to private customers increased by 4 per cent in Sweden and decreased slightly in the Baltic countries. As part of the integration of Sparbanken Öresund, Swedbank transfered around 100 000 card customers from Öresund’s card business to its own card environment, giving them access to Swedbank’s card offering while at the same time creating cost synergies, since most of the costs are already fixed. E-payments with Swedbank’s debit cards in Sweden grew by 16 per cent during the year, compared with an increase of 9 per cent for brick-and-mortar purchases. To meet the growing demand for mobile e-commerce and make it easier for customers to use their mobile phones for more secure online card purchases, Swedbank launched the Masterpass digital wallet in November. In total, 5 per cent of purchases with Swedbank’s debit cards are made online. In the
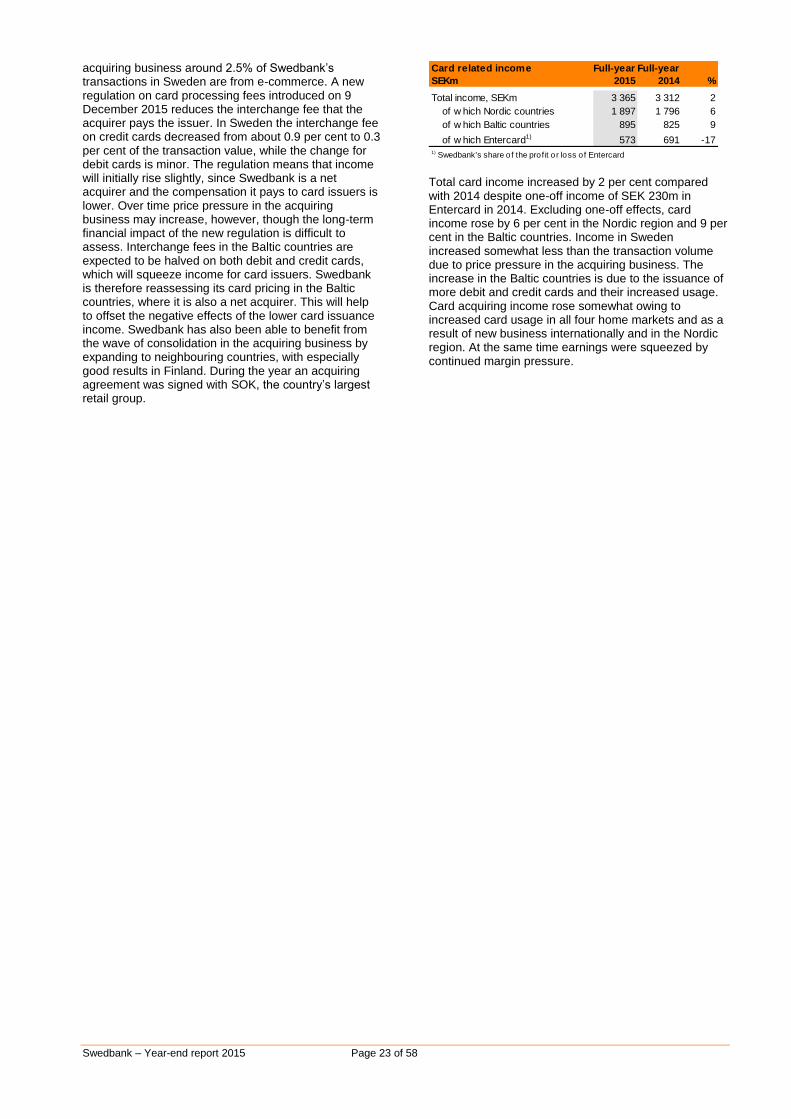
Swedbank – Year-end report 2015 Page 23 of 58
acquiring business around 2.5% of Swedbank’s transactions in Sweden are from e-commerce. A new regulation on card processing fees introduced on 9 December 2015 reduces the interchange fee that the acquirer pays the issuer. In Sweden the interchange fee on credit cards decreased from about 0.9 per cent to 0.3 per cent of the transaction value, while the change for debit cards is minor. The regulation means that income will initially rise slightly, since Swedbank is a net acquirer and the compensation it pays to card issuers is lower. Over time price pressure in the acquiring business may increase, however, though the long-term financial impact of the new regulation is difficult to assess. Interchange fees in the Baltic countries are expected to be halved on both debit and credit cards, which will squeeze income for card issuers. Swedbank is therefore reassessing its card pricing in the Baltic countries, where it is also a net acquirer. This will help to offset the negative effects of the lower card issuance income. Swedbank has also been able to benefit from the wave of consolidation in the acquiring business by expanding to neighbouring countries, with especially good results in Finland. During the year an acquiring agreement was signed with SOK, the country’s largest retail group.
Card related income Full-year Full-year
SEKm 2015 2014 %
Total income, SEKm 3 365 3 312 2
of w hich Nordic countries 1 897 1 796 6
of w hich Baltic countries 895 825 9
of w hich Entercard1) 573 691 -171) Swedbank's share of the profit or loss of Entercard Total card income increased by 2 per cent compared with 2014 despite one-off income of SEK 230m in Entercard in 2014. Excluding one-off effects, card income rose by 6 per cent in the Nordic region and 9 per cent in the Baltic countries. Income in Sweden increased somewhat less than the transaction volume due to price pressure in the acquiring business. The increase in the Baltic countries is due to the issuance of more debit and credit cards and their increased usage. Card acquiring income rose somewhat owing to increased card usage in all four home markets and as a result of new business internationally and in the Nordic region. At the same time earnings were squeezed by continued margin pressure.
Swedbank – Year-end report 2015 Page 24 of 58
Financial information - contents Group
Page
Income statement, condensed 25
Statement of comprehensive income, condensed 26
Key ratios 26
Balance sheet, condensed 27
Statement of changes in equity, condensed 28
Cash flow statement, condensed 29
Notes
Note 1 Accounting policies 30
Note 2 Critical accounting estimates 30
Note 3 Changes in the Group structure 30
Note 4 Operating segments (business areas) 31
Note 5 Net interest income 33
Note 6 Net commission income 34
Note 7 Net gains and losses on financial items at fair value 35
Note 8 Other expenses 36
Note 9 Credit impairments 36
Note 10 Loans 37
Note 11 Impaired loans etc. 38
Note 12 Assets taken over for protection of claims and cancelled leases 38
Note 13 Credit exposures 38
Note 14 Intangible assets 39
Note 15 Amounts owed to credit institutions 40
Note 16 Deposits and borrowings from the public 40
Note 17 Debt securities in issue 40
Note 18 Derivatives 41
Note 19 Financial instruments carried at fair value 41
Note 20 Pledged collateral 44
Note 21 Offsetting financial assets and liabilities 44
Note 22 Capital adequacy consolidated situation 45
Note 23 Internal capital requirement 48
Note 24 Risks and uncertainties 48
Note 25 Business combinations 49
Note 26 Discontinued operations 50
Note 27 Related-party transactions 51
Note 28 Swedbank’s share 51
Parent company
Income statement, condensed 52
Statement of comprehensive income, condensed 52
Balance sheet, condensed 53
Statement of changes in equity, condensed 54
Cash flow statement, condensed 54
Capital adequacy 55
More detailed information can be found in Swedbank’s fact book, www.swedbank.com/ir, under Financial information and publications.
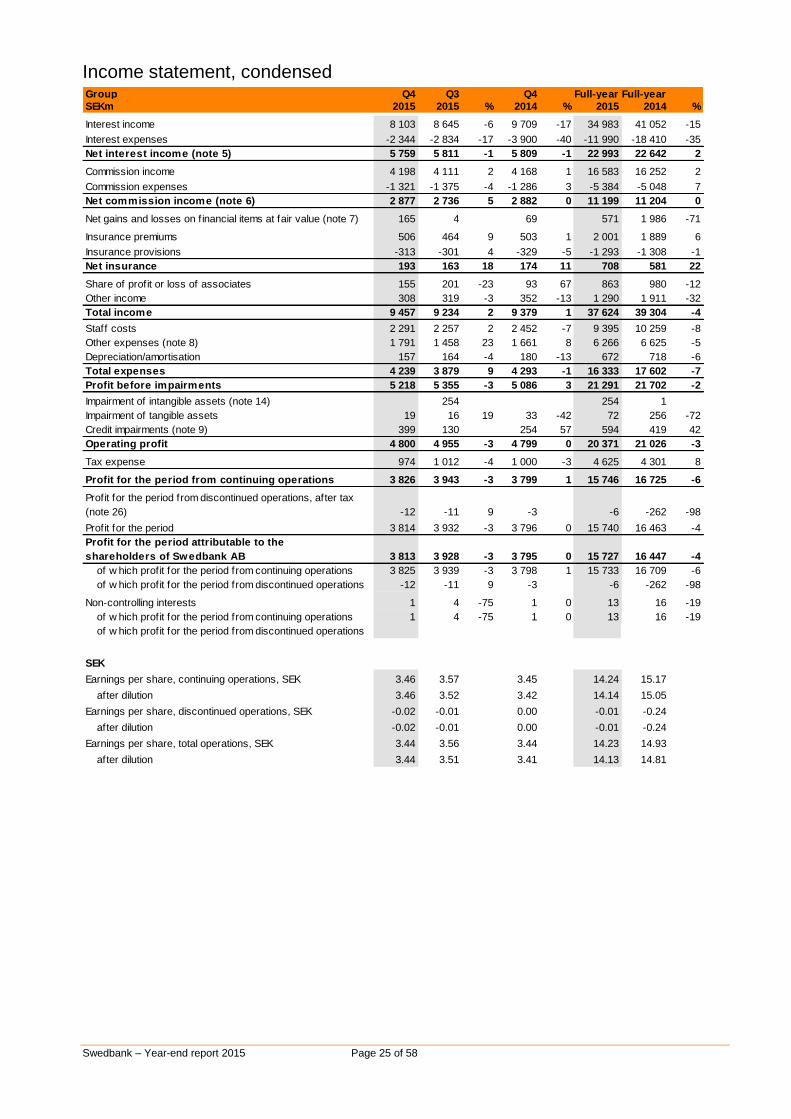
Swedbank – Year-end report 2015 Page 25 of 58
Income statement, condensed Group Q4 Q3 Q4 Full-year Full-year
SEKm 2015 2015 % 2014 % 2015 2014 %
Interest income 8 103 8 645 -6 9 709 -17 34 983 41 052 -15
Interest expenses -2 344 -2 834 -17 -3 900 -40 -11 990 -18 410 -35
Net interest income (note 5) 5 759 5 811 -1 5 809 -1 22 993 22 642 2
Commission income 4 198 4 111 2 4 168 1 16 583 16 252 2
Commission expenses -1 321 -1 375 -4 -1 286 3 -5 384 -5 048 7
Net commission income (note 6) 2 877 2 736 5 2 882 0 11 199 11 204 0
Net gains and losses on f inancial items at fair value (note 7) 165 4 69 571 1 986 -71
Insurance premiums 506 464 9 503 1 2 001 1 889 6
Insurance provisions -313 -301 4 -329 -5 -1 293 -1 308 -1
Net insurance 193 163 18 174 11 708 581 22
Share of profit or loss of associates 155 201 -23 93 67 863 980 -12
Other income 308 319 -3 352 -13 1 290 1 911 -32
Total income 9 457 9 234 2 9 379 1 37 624 39 304 -4
Staff costs 2 291 2 257 2 2 452 -7 9 395 10 259 -8
Other expenses (note 8) 1 791 1 458 23 1 661 8 6 266 6 625 -5
Depreciation/amortisation 157 164 -4 180 -13 672 718 -6
Total expenses 4 239 3 879 9 4 293 -1 16 333 17 602 -7
Profit before impairments 5 218 5 355 -3 5 086 3 21 291 21 702 -2
Impairment of intangible assets (note 14) 0 254 0 254 1
Impairment of tangible assets 19 16 19 33 -42 72 256 -72
Credit impairments (note 9) 399 130 254 57 594 419 42
Operating profit 4 800 4 955 -3 4 799 0 20 371 21 026 -3
Tax expense 974 1 012 -4 1 000 -3 4 625 4 301 8
Profit for the period from continuing operations 3 826 3 943 -3 3 799 1 15 746 16 725 -6
Profit for the period from discontinued operations, after tax
(note 26) -12 -11 9 -3 -6 -262 -98
Profit for the period 3 814 3 932 -3 3 796 0 15 740 16 463 -4
Profit for the period attributable to the
shareholders of Swedbank AB 3 813 3 928 -3 3 795 0 15 727 16 447 -4
of w hich profit for the period from continuing operations 3 825 3 939 -3 3 798 1 15 733 16 709 -6
of w hich profit for the period from discontinued operations -12 -11 9 -3 -6 -262 -98
Non-controlling interests 1 4 -75 1 0 13 16 -19
of w hich profit for the period from continuing operations 1 4 -75 1 0 13 16 -19
of w hich profit for the period from discontinued operations 0 0 0 0 0
SEK
Earnings per share, continuing operations, SEK 3.46 3.57 3.45 14.24 15.17
after dilution 3.46 3.52 3.42 14.14 15.05
Earnings per share, discontinued operations, SEK -0.02 -0.01 0.00 -0.01 -0.24
after dilution -0.02 -0.01 0.00 -0.01 -0.24
Earnings per share, total operations, SEK 3.44 3.56 3.44 14.23 14.93
after dilution 3.44 3.51 3.41 14.13 14.81
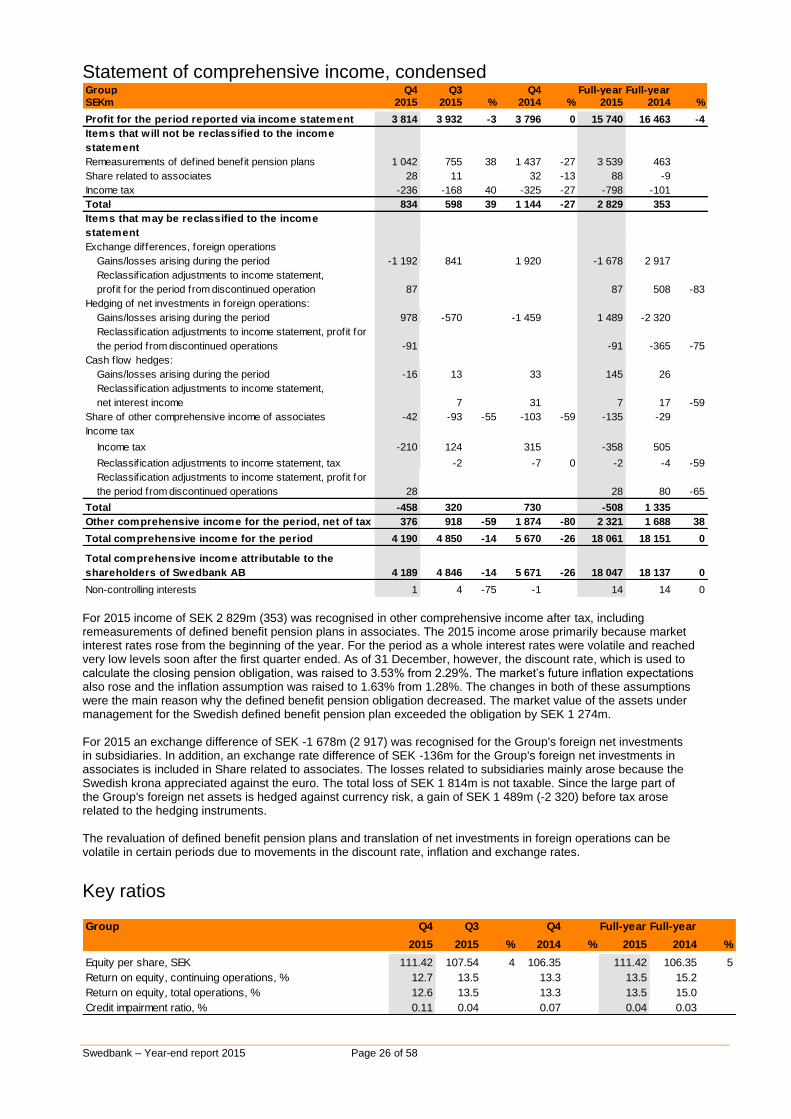
Swedbank – Year-end report 2015 Page 26 of 58
Statement of comprehensive income, condensed Group Q4 Q3 Q4 Full-year Full-year
SEKm 2015 2015 % 2014 % 2015 2014 %
Profit for the period reported via income statement 3 814 3 932 -3 3 796 0 15 740 16 463 -4
Items that w ill not be reclassified to the income
statement
Remeasurements of defined benefit pension plans 1 042 755 38 1 437 -27 3 539 463
Share related to associates 28 11 32 -13 88 -9
Income tax -236 -168 40 -325 -27 -798 -101
Total 834 598 39 1 144 -27 2 829 353
Items that may be reclassified to the income
statement
Exchange differences, foreign operations
Gains/losses arising during the period -1 192 841 1 920 -1 678 2 917
Reclassif ication adjustments to income statement,
profit for the period from discontinued operation 87 0 0 87 508 -83
Hedging of net investments in foreign operations: 0 0 0 0 0
Gains/losses arising during the period 978 -570 -1 459 1 489 -2 320
Reclassif ication adjustments to income statement, profit for
the period from discontinued operations -91 0 0 -91 -365 -75
Cash flow hedges: 0 0 0 0 0
Gains/losses arising during the period -16 13 33 145 26
Reclassif ication adjustments to income statement,
net interest income 0 7 31 7 17 -59
Share of other comprehensive income of associates -42 -93 -55 -103 -59 -135 -29
Income tax
Income tax -210 124 315 -358 505
Reclassif ication adjustments to income statement, tax 0 -2 -7 0 -2 -4 -59
Reclassif ication adjustments to income statement, profit for
the period from discontinued operations 28 0 0 0 28 80 -65
Total -458 320 730 -508 1 335
Other comprehensive income for the period, net of tax 376 918 -59 1 874 -80 2 321 1 688 38
Total comprehensive income for the period 4 190 4 850 -14 5 670 -26 18 061 18 151 0
Total comprehensive income attributable to the
shareholders of Swedbank AB 4 189 4 846 -14 5 671 -26 18 047 18 137 0
Non-controlling interests 1 4 -75 -1 14 14 0 For 2015 income of SEK 2 829m (353) was recognised in other comprehensive income after tax, including remeasurements of defined benefit pension plans in associates. The 2015 income arose primarily because market interest rates rose from the beginning of the year. For the period as a whole interest rates were volatile and reached very low levels soon after the first quarter ended. As of 31 December, however, the discount rate, which is used to calculate the closing pension obligation, was raised to 3.53% from 2.29%. The market’s future inflation expectations also rose and the inflation assumption was raised to 1.63% from 1.28%. The changes in both of these assumptions were the main reason why the defined benefit pension obligation decreased. The market value of the assets under management for the Swedish defined benefit pension plan exceeded the obligation by SEK 1 274m. For 2015 an exchange difference of SEK -1 678m (2 917) was recognised for the Group's foreign net investments in subsidiaries. In addition, an exchange rate difference of SEK -136m for the Group's foreign net investments in associates is included in Share related to associates. The losses related to subsidiaries mainly arose because the Swedish krona appreciated against the euro. The total loss of SEK 1 814m is not taxable. Since the large part of the Group's foreign net assets is hedged against currency risk, a gain of SEK 1 489m (-2 320) before tax arose related to the hedging instruments. The revaluation of defined benefit pension plans and translation of net investments in foreign operations can be volatile in certain periods due to movements in the discount rate, inflation and exchange rates.
Key ratios Group Q4 Q3 Q4 Full-year Full-year
2015 2015 % 2014 % 2015 2014 %
Equity per share, SEK 111.42 107.54 4 106.35 111.42 106.35 5
Return on equity, continuing operations, % 12.7 13.5 13.3 13.5 15.2
Return on equity, total operations, % 12.6 13.5 13.3 13.5 15.0
Credit impairment ratio, % 0.11 0.04 0.07 0.04 0.03
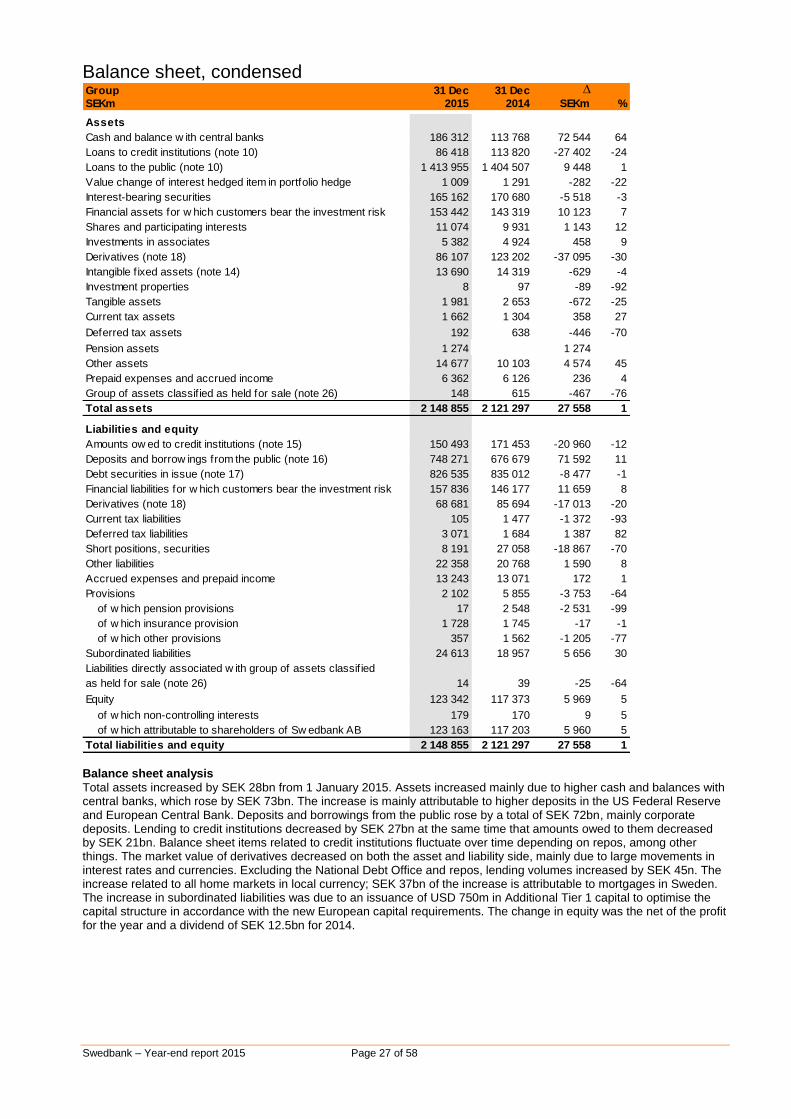
Swedbank – Year-end report 2015 Page 27 of 58
Balance sheet, condensed Group 31 Dec 31 Dec ∆SEKm 2015 2014 SEKm %
Assets
Cash and balance w ith central banks 186 312 113 768 72 544 64
Loans to credit institutions (note 10) 86 418 113 820 -27 402 -24
Loans to the public (note 10) 1 413 955 1 404 507 9 448 1
Value change of interest hedged item in portfolio hedge 1 009 1 291 -282 -22
Interest-bearing securities 165 162 170 680 -5 518 -3
Financial assets for w hich customers bear the investment risk 153 442 143 319 10 123 7
Shares and participating interests 11 074 9 931 1 143 12
Investments in associates 5 382 4 924 458 9
Derivatives (note 18) 86 107 123 202 -37 095 -30
Intangible f ixed assets (note 14) 13 690 14 319 -629 -4
Investment properties 8 97 -89 -92
Tangible assets 1 981 2 653 -672 -25
Current tax assets 1 662 1 304 358 27
Deferred tax assets 192 638 -446 -70
Pension assets 1 274 0 1 274
Other assets 14 677 10 103 4 574 45
Prepaid expenses and accrued income 6 362 6 126 236 4
Group of assets classif ied as held for sale (note 26) 148 615 -467 -76
Total assets 2 148 855 2 121 297 27 558 1
Liabilities and equity
Amounts ow ed to credit institutions (note 15) 150 493 171 453 -20 960 -12
Deposits and borrow ings from the public (note 16) 748 271 676 679 71 592 11
Debt securities in issue (note 17) 826 535 835 012 -8 477 -1
Financial liabilities for w hich customers bear the investment risk 157 836 146 177 11 659 8
Derivatives (note 18) 68 681 85 694 -17 013 -20
Current tax liabilities 105 1 477 -1 372 -93
Deferred tax liabilities 3 071 1 684 1 387 82
Short positions, securities 8 191 27 058 -18 867 -70
Other liabilities 22 358 20 768 1 590 8
Accrued expenses and prepaid income 13 243 13 071 172 1
Provisions 2 102 5 855 -3 753 -64
of w hich pension provisions 17 2 548 -2 531 -99
of w hich insurance provision 1 728 1 745 -17 -1
of w hich other provisions 357 1 562 -1 205 -77
Subordinated liabilities 24 613 18 957 5 656 30
Liabilities directly associated w ith group of assets classif ied
as held for sale (note 26) 14 39 -25 -64
Equity 123 342 117 373 5 969 5
of w hich non-controlling interests 179 170 9 5
of w hich attributable to shareholders of Sw edbank AB 123 163 117 203 5 960 5
Total liabilities and equity 2 148 855 2 121 297 27 558 1 Balance sheet analysis
Total assets increased by SEK 28bn from 1 January 2015. Assets increased mainly due to higher cash and balances with central banks, which rose by SEK 73bn. The increase is mainly attributable to higher deposits in the US Federal Reserve and European Central Bank. Deposits and borrowings from the public rose by a total of SEK 72bn, mainly corporate deposits. Lending to credit institutions decreased by SEK 27bn at the same time that amounts owed to them decreased by SEK 21bn. Balance sheet items related to credit institutions fluctuate over time depending on repos, among other things. The market value of derivatives decreased on both the asset and liability side, mainly due to large movements in interest rates and currencies. Excluding the National Debt Office and repos, lending volumes increased by SEK 45n. The increase related to all home markets in local currency; SEK 37bn of the increase is attributable to mortgages in Sweden. The increase in subordinated liabilities was due to an issuance of USD 750m in Additional Tier 1 capital to optimise the capital structure in accordance with the new European capital requirements. The change in equity was the net of the profit for the year and a dividend of SEK 12.5bn for 2014.
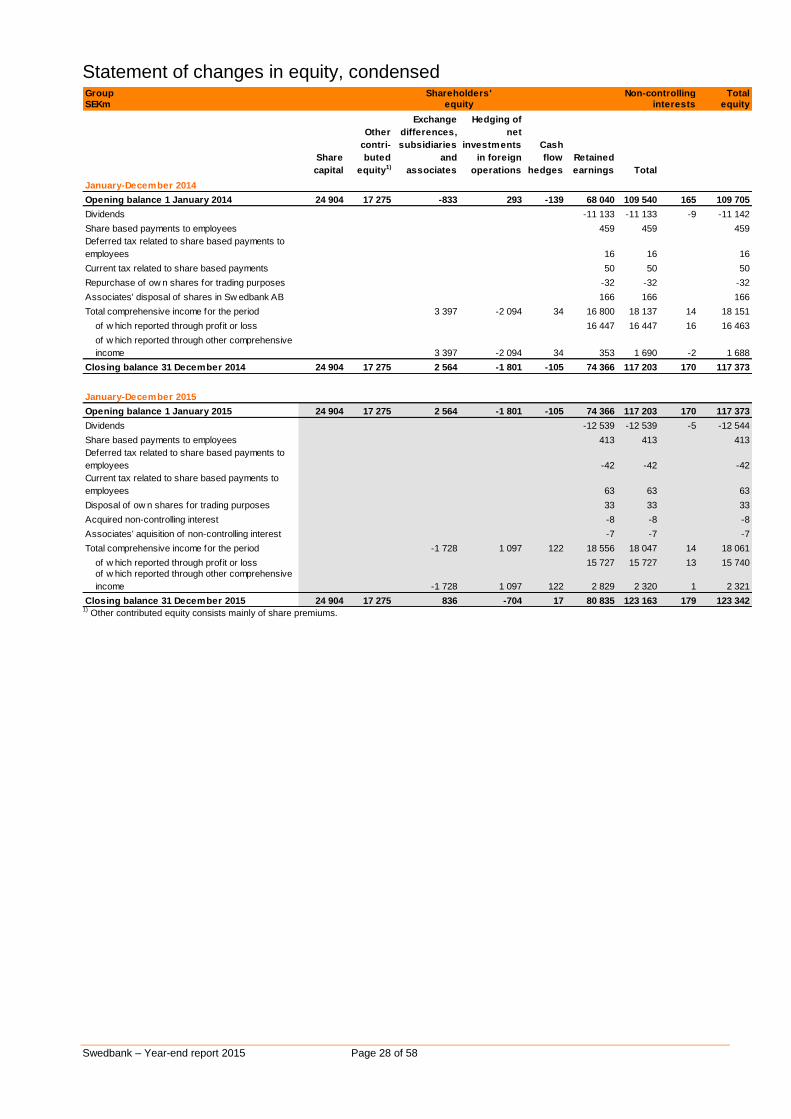
Swedbank – Year-end report 2015 Page 28 of 58
Statement of changes in equity, condensed
Group Non-controlling Total
SEKm interests equity
Share
capital
Other
contri-
buted
equity1)
Exchange
differences,
subsidiaries
and
associates
Hedging of
net
investments
in foreign
operations
Cash
flow
hedges
Retained
earnings Total
January-December 2014
Opening balance 1 January 2014 24 904 17 275 -833 293 -139 68 040 109 540 165 109 705
Dividends 0 0 0 0 0 -11 133 -11 133 -9 -11 142
Share based payments to employees 0 0 0 0 0 459 459 0 459
Deferred tax related to share based payments to
employees 0 0 0 0 0 16 16 0 16
Current tax related to share based payments 0 0 0 0 0 50 50 0 50
Repurchase of ow n shares for trading purposes 0 0 0 0 0 -32 -32 0 -32
Associates' disposal of shares in Sw edbank AB 0 0 0 0 0 166 166 0 166
Total comprehensive income for the period 0 0 3 397 -2 094 34 16 800 18 137 14 18 151
of w hich reported through profit or loss 0 0 0 0 0 16 447 16 447 16 16 463
of w hich reported through other comprehensive
income 0 0 3 397 -2 094 34 353 1 690 -2 1 688
Closing balance 31 December 2014 24 904 17 275 2 564 -1 801 -105 74 366 117 203 170 117 373
January-December 2015
Opening balance 1 January 2015 24 904 17 275 2 564 -1 801 -105 74 366 117 203 170 117 373
Dividends 0 0 0 0 0 -12 539 -12 539 -5 -12 544
Share based payments to employees 0 0 0 0 0 413 413 0 413
Deferred tax related to share based payments to
employees 0 0 0 0 0 -42 -42 0 -42
Current tax related to share based payments to
employees 0 0 0 0 0 63 63 0 63
Disposal of ow n shares for trading purposes 0 0 0 0 0 33 33 0 33
Acquired non-controlling interest 0 0 0 0 0 -8 -8 0 -8
Associates' aquisition of non-controlling interest 0 0 0 0 0 -7 -7 0 -7
Total comprehensive income for the period 0 0 -1 728 1 097 122 18 556 18 047 14 18 061
of w hich reported through profit or loss 0 0 0 0 0 15 727 15 727 13 15 740
of w hich reported through other comprehensive
income 0 0 -1 728 1 097 122 2 829 2 320 1 2 321
Closing balance 31 December 2015 24 904 17 275 836 -704 17 80 835 123 163 179 123 342
Shareholders'
equity
1) Other contributed equity consists mainly of share premiums.
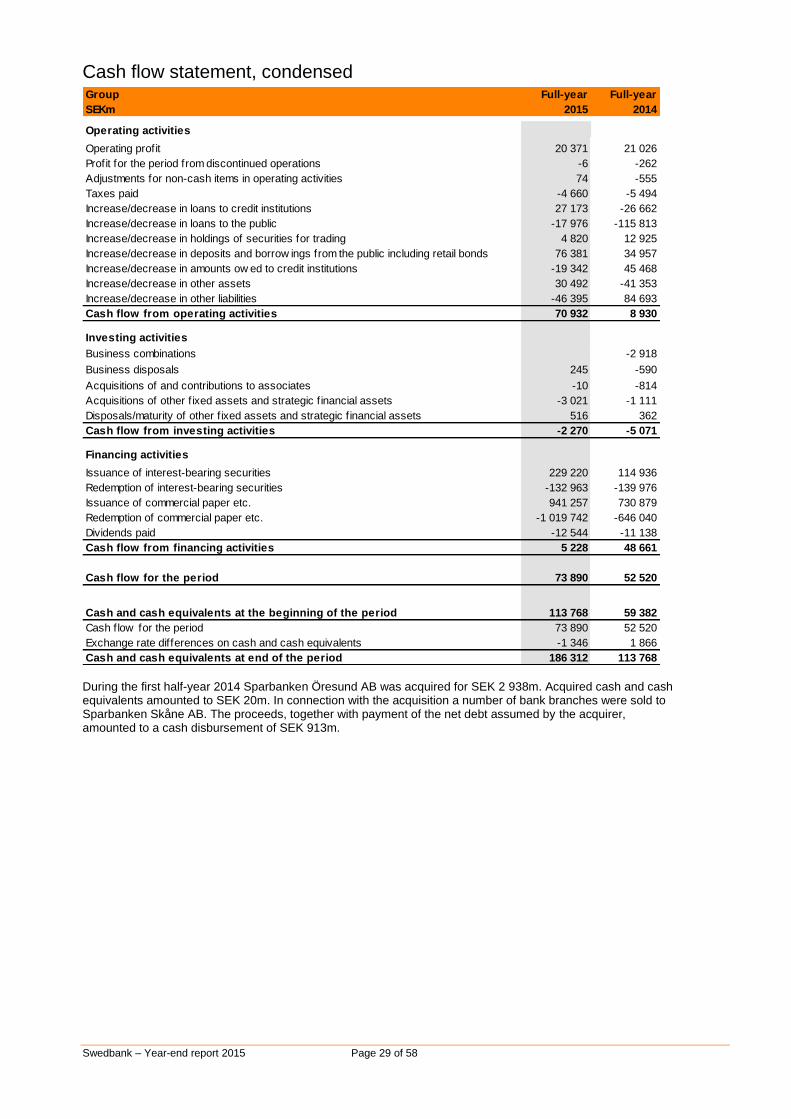
Swedbank – Year-end report 2015 Page 29 of 58
Cash flow statement, condensed Group Full-year Full-year
SEKm 2015 2014
Operating activities
Operating profit 20 371 21 026
Profit for the period from discontinued operations -6 -262
Adjustments for non-cash items in operating activities 74 -555
Taxes paid -4 660 -5 494
Increase/decrease in loans to credit institutions 27 173 -26 662
Increase/decrease in loans to the public -17 976 -115 813
Increase/decrease in holdings of securities for trading 4 820 12 925
Increase/decrease in deposits and borrow ings from the public including retail bonds 76 381 34 957
Increase/decrease in amounts ow ed to credit institutions -19 342 45 468
Increase/decrease in other assets 30 492 -41 353
Increase/decrease in other liabilities -46 395 84 693
Cash flow from operating activities 70 932 8 930
Investing activities
Business combinations 0 -2 918
Business disposals 245 -590
Acquisitions of and contributions to associates -10 -814
Acquisitions of other f ixed assets and strategic f inancial assets -3 021 -1 111
Disposals/maturity of other f ixed assets and strategic f inancial assets 516 362
Cash flow from investing activities -2 270 -5 071
Financing activities
Issuance of interest-bearing securities 229 220 114 936
Redemption of interest-bearing securities -132 963 -139 976
Issuance of commercial paper etc. 941 257 730 879
Redemption of commercial paper etc. -1 019 742 -646 040
Dividends paid -12 544 -11 138
Cash flow from financing activities 5 228 48 661
Cash flow for the period 73 890 52 520
Cash and cash equivalents at the beginning of the period 113 768 59 382
Cash flow for the period 73 890 52 520
Exchange rate differences on cash and cash equivalents -1 346 1 866
Cash and cash equivalents at end of the period 186 312 113 768 During the first half-year 2014 Sparbanken Öresund AB was acquired for SEK 2 938m. Acquired cash and cash equivalents amounted to SEK 20m. In connection with the acquisition a number of bank branches were sold to Sparbanken Skåne AB. The proceeds, together with payment of the net debt assumed by the acquirer, amounted to a cash disbursement of SEK 913m.
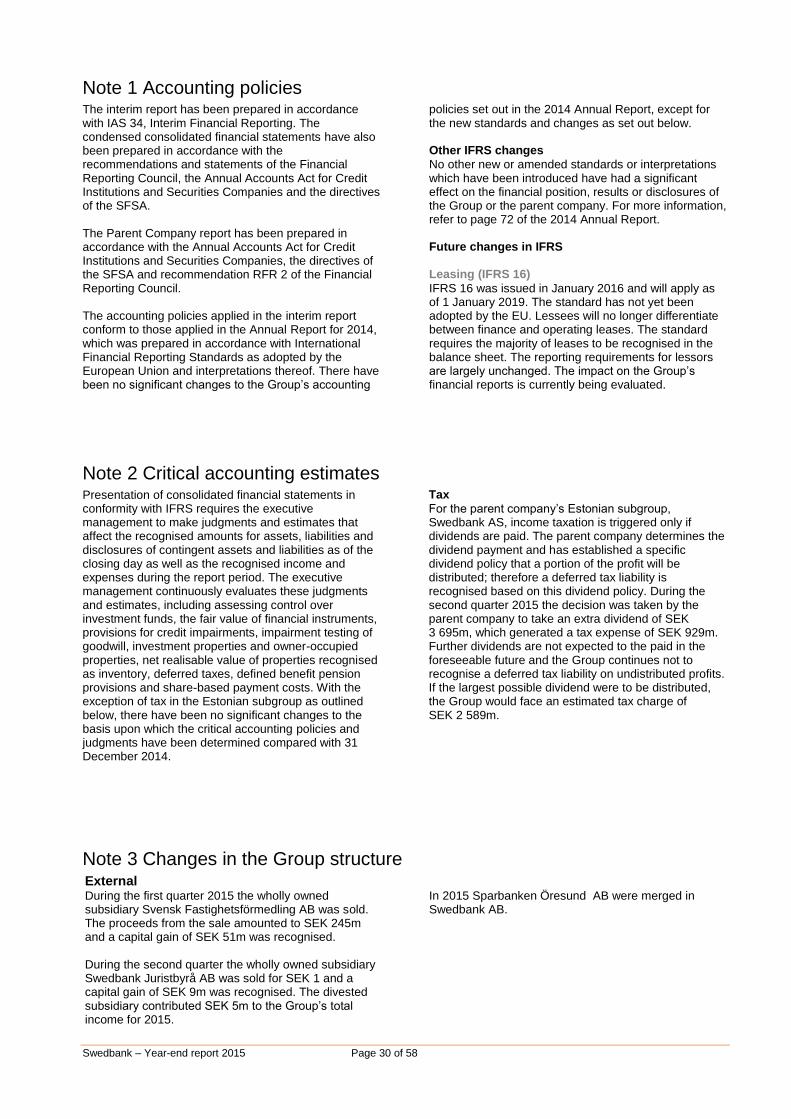
Swedbank – Year-end report 2015 Page 30 of 58
Note 1 Accounting policies The interim report has been prepared in accordance with IAS 34, Interim Financial Reporting. The condensed consolidated financial statements have also been prepared in accordance with the recommendations and statements of the Financial Reporting Council, the Annual Accounts Act for Credit Institutions and Securities Companies and the directives of the SFSA. The Parent Company report has been prepared in accordance with the Annual Accounts Act for Credit Institutions and Securities Companies, the directives of the SFSA and recommendation RFR 2 of the Financial Reporting Council. The accounting policies applied in the interim report conform to those applied in the Annual Report for 2014, which was prepared in accordance with International Financial Reporting Standards as adopted by the European Union and interpretations thereof. There have been no significant changes to the Group’s accounting
policies set out in the 2014 Annual Report, except for the new standards and changes as set out below. Other IFRS changes
No other new or amended standards or interpretations which have been introduced have had a significant effect on the financial position, results or disclosures of the Group or the parent company. For more information, refer to page 72 of the 2014 Annual Report. Future changes in IFRS Leasing (IFRS 16)
IFRS 16 was issued in January 2016 and will apply as of 1 January 2019. The standard has not yet been adopted by the EU. Lessees will no longer differentiate between finance and operating leases. The standard requires the majority of leases to be recognised in the balance sheet. The reporting requirements for lessors are largely unchanged. The impact on the Group’s financial reports is currently being evaluated.
Note 2 Critical accounting estimates Presentation of consolidated financial statements in conformity with IFRS requires the executive management to make judgments and estimates that affect the recognised amounts for assets, liabilities and disclosures of contingent assets and liabilities as of the closing day as well as the recognised income and expenses during the report period. The executive management continuously evaluates these judgments and estimates, including assessing control over investment funds, the fair value of financial instruments, provisions for credit impairments, impairment testing of goodwill, investment properties and owner-occupied properties, net realisable value of properties recognised as inventory, deferred taxes, defined benefit pension provisions and share-based payment costs. With the exception of tax in the Estonian subgroup as outlined below, there have been no significant changes to the basis upon which the critical accounting policies and judgments have been determined compared with 31 December 2014.
Tax
For the parent company’s Estonian subgroup, Swedbank AS, income taxation is triggered only if dividends are paid. The parent company determines the dividend payment and has established a specific dividend policy that a portion of the profit will be distributed; therefore a deferred tax liability is recognised based on this dividend policy. During the second quarter 2015 the decision was taken by the parent company to take an extra dividend of SEK 3 695m, which generated a tax expense of SEK 929m. Further dividends are not expected to the paid in the foreseeable future and the Group continues not to recognise a deferred tax liability on undistributed profits. If the largest possible dividend were to be distributed, the Group would face an estimated tax charge of SEK 2 589m.
Note 3 Changes in the Group structure External During the first quarter 2015 the wholly owned subsidiary Svensk Fastighetsförmedling AB was sold. The proceeds from the sale amounted to SEK 245m and a capital gain of SEK 51m was recognised. During the second quarter the wholly owned subsidiary Swedbank Juristbyrå AB was sold for SEK 1 and a capital gain of SEK 9m was recognised. The divested subsidiary contributed SEK 5m to the Group’s total income for 2015.
In 2015 Sparbanken Öresund AB were merged in Swedbank AB.
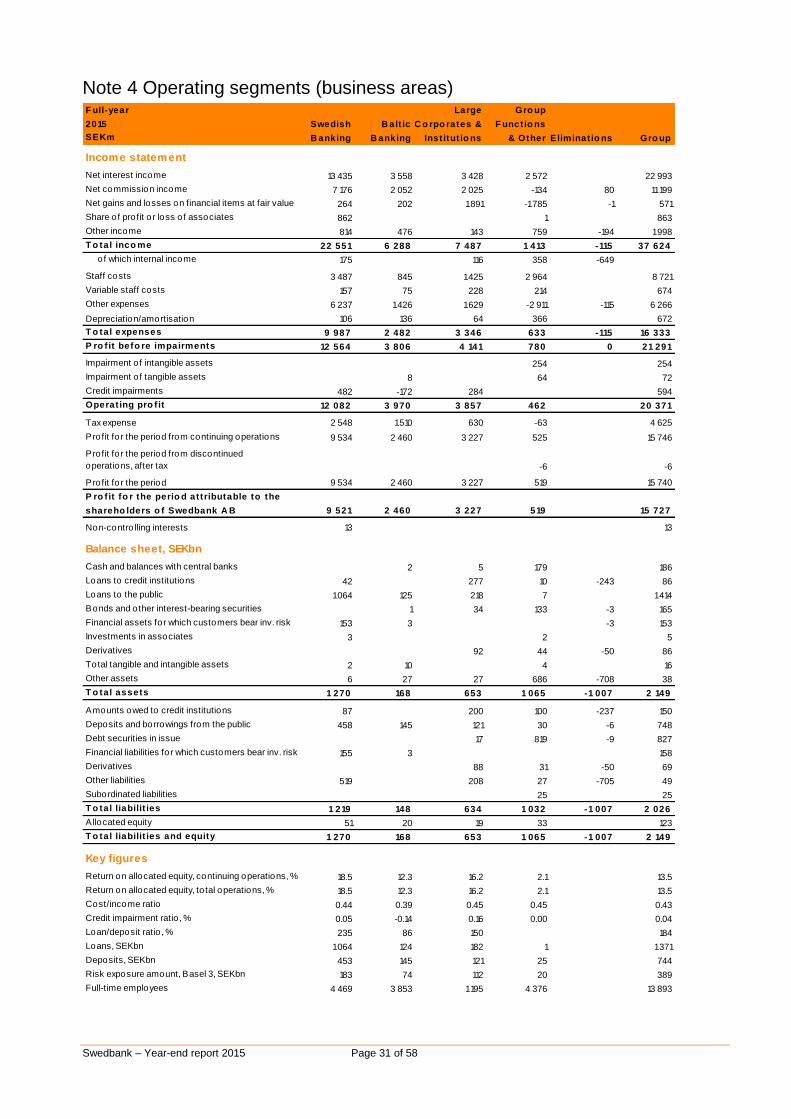
Swedbank – Year-end report 2015 Page 31 of 58
Note 4 Operating segments (business areas) F ull-year Large Gro up
2015 Swedish B alt ic C o rpo rates & F unctio ns
SEKm B anking B anking Inst itut io ns & Other Eliminat io ns Gro up
Income statement
Net interest income 13 435 3 558 3 428 2 572 0 22 993
Net commission income 7 176 2 052 2 025 -134 80 11 199
Net gains and losses on financial items at fair value 264 202 1 891 -1 785 -1 571
Share of profit or loss of associates 862 0 0 1 0 863
Other income 814 476 143 759 -194 1 998
T o tal inco me 22 551 6 288 7 487 1 413 -115 37 624
of which internal income 175 0 116 358 -649 0
Staff costs 3 487 845 1 425 2 964 0 8 721
Variable staff costs 157 75 228 214 0 674
Other expenses 6 237 1 426 1 629 -2 911 -115 6 266
Depreciation/amortisation 106 136 64 366 0 672
T o tal expenses 9 987 2 482 3 346 633 -115 16 333
P ro f it befo re impairments 12 564 3 806 4 141 780 0 21 291
Impairment o f intangible assets 0 0 0 254 0 254
Impairment o f tangible assets 0 8 0 64 0 72
Credit impairments 482 -172 284 0 0 594
Operat ing pro f it 12 082 3 970 3 857 462 0 20 371
Tax expense 2 548 1 510 630 -63 0 4 625
Profit for the period from continuing operations 9 534 2 460 3 227 525 0 15 746
Profit for the period from discontinued
operations, after tax 0 0 0 -6 0 -6
Profit for the period 9 534 2 460 3 227 519 0 15 740
P ro f it fo r the perio d attributable to the
shareho lders o f Swedbank A B 9 521 2 460 3 227 519 0 15 727
Non-contro lling interests 13 0 0 0 0 13
Balance sheet, SEKbn
Cash and balances with central banks 0 2 5 179 0 186
Loans to credit institutions 42 0 277 10 -243 86
Loans to the public 1 064 125 218 7 0 1 414
Bonds and other interest-bearing securities 0 1 34 133 -3 165
Financial assets for which customers bear inv. risk 153 3 0 0 -3 153
Investments in associates 3 0 0 2 0 5
Derivatives 0 0 92 44 -50 86
Total tangible and intangible assets 2 10 0 4 0 16
Other assets 6 27 27 686 -708 38
T o tal assets 1 270 168 653 1 065 -1 007 2 149
Amounts owed to credit institutions 87 0 200 100 -237 150
Deposits and borrowings from the public 458 145 121 30 -6 748
Debt securities in issue 0 0 17 819 -9 827
Financial liabilities for which customers bear inv. risk 155 3 0 0 0 158
Derivatives 0 0 88 31 -50 69
Other liabilities 519 0 208 27 -705 49
Subordinated liabilities 0 0 0 25 0 25
T o tal liabilit ies 1 219 148 634 1 032 -1 007 2 026
Allocated equity 51 20 19 33 0 123
T o tal liabilit ies and equity 1 270 168 653 1 065 -1 007 2 149
Key figures
Return on allocated equity, continuing operations, % 18.5 12.3 16.2 2.1 0.0 13.5
Return on allocated equity, to tal operations, % 18.5 12.3 16.2 2.1 0.0 13.5
Cost/income ratio 0.44 0.39 0.45 0.45 0.00 0.43
Credit impairment ratio , % 0.05 -0.14 0.16 0.00 0.00 0.04
Loan/deposit ratio , % 235 86 150 0 0 184
Loans, SEKbn 1 064 124 182 1 0 1 371
Deposits, SEKbn 453 145 121 25 0 744
Risk exposure amount, Basel 3, SEKbn 183 74 112 20 0 389
Full-time employees 4 469 3 853 1 195 4 376 0 13 893
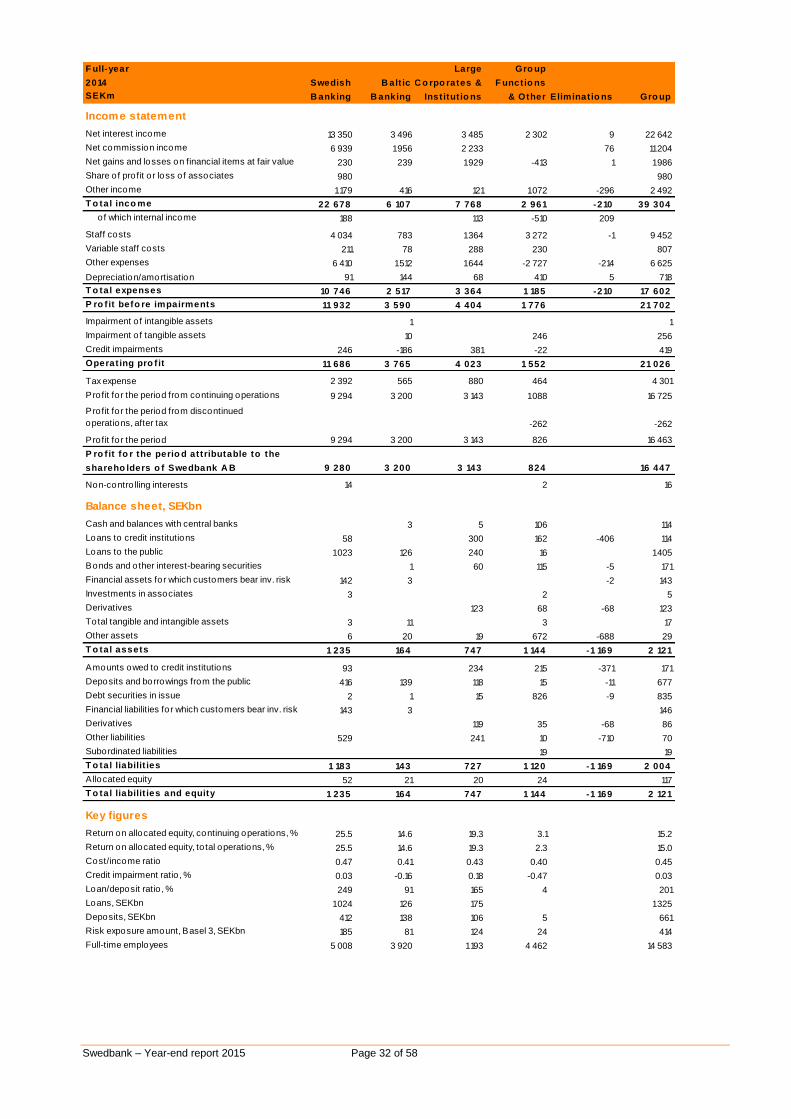
Swedbank – Year-end report 2015 Page 32 of 58
F ull-year Large Gro up
2014 Swedish B alt ic C o rpo rates & F unctio ns
SEKm B anking B anking Inst itut io ns & Other Eliminat io ns Gro up
Income statement
Net interest income 13 350 3 496 3 485 2 302 9 22 642
Net commission income 6 939 1 956 2 233 0 76 11 204
Net gains and losses on financial items at fair value 230 239 1 929 -413 1 1 986
Share of profit or loss of associates 980 0 0 0 0 980
Other income 1 179 416 121 1 072 -296 2 492
T o tal inco me 22 678 6 107 7 768 2 961 -210 39 304
of which internal income 188 0 113 -510 209
Staff costs 4 034 783 1 364 3 272 -1 9 452
Variable staff costs 211 78 288 230 0 807
Other expenses 6 410 1 512 1 644 -2 727 -214 6 625
Depreciation/amortisation 91 144 68 410 5 718
T o tal expenses 10 746 2 517 3 364 1 185 -210 17 602
P ro f it befo re impairments 11 932 3 590 4 404 1 776 0 21 702
Impairment o f intangible assets 0 1 0 0 0 1
Impairment o f tangible assets 0 10 0 246 0 256
Credit impairments 246 -186 381 -22 0 419
Operat ing pro f it 11 686 3 765 4 023 1 552 0 21 026
Tax expense 2 392 565 880 464 0 4 301
Profit for the period from continuing operations 9 294 3 200 3 143 1 088 0 16 725
Profit for the period from discontinued
operations, after tax 0 0 0 -262 0 -262
Profit for the period 9 294 3 200 3 143 826 0 16 463
P ro f it fo r the perio d attributable to the
shareho lders o f Swedbank A B 9 280 3 200 3 143 824 0 16 447
Non-contro lling interests 14 0 2 0 16
Balance sheet, SEKbn
Cash and balances with central banks 0 3 5 106 0 114
Loans to credit institutions 58 0 300 162 -406 114
Loans to the public 1 023 126 240 16 0 1 405
Bonds and other interest-bearing securities 0 1 60 115 -5 171
Financial assets for which customers bear inv. risk 142 3 0 0 -2 143
Investments in associates 3 0 0 2 0 5
Derivatives 0 0 123 68 -68 123
Total tangible and intangible assets 3 11 0 3 0 17
Other assets 6 20 19 672 -688 29
T o tal assets 1 235 164 747 1 144 -1 169 2 121
Amounts owed to credit institutions 93 0 234 215 -371 171
Deposits and borrowings from the public 416 139 118 15 -11 677
Debt securities in issue 2 1 15 826 -9 835
Financial liabilities for which customers bear inv. risk 143 3 0 0 0 146
Derivatives 0 0 119 35 -68 86
Other liabilities 529 0 241 10 -710 70
Subordinated liabilities 0 0 0 19 0 19
T o tal liabilit ies 1 183 143 727 1 120 -1 169 2 004
Allocated equity 52 21 20 24 0 117
T o tal liabilit ies and equity 1 235 164 747 1 144 -1 169 2 121
Key figures
Return on allocated equity, continuing operations, % 25.5 14.6 19.3 3.1 0.0 15.2
Return on allocated equity, to tal operations, % 25.5 14.6 19.3 2.3 0.0 15.0
Cost/income ratio 0.47 0.41 0.43 0.40 0.00 0.45
Credit impairment ratio , % 0.03 -0.16 0.18 -0.47 0.00 0.03
Loan/deposit ratio , % 249 91 165 4 0 201
Loans, SEKbn 1 024 126 175 0 0 1 325
Deposits, SEKbn 412 138 106 5 0 661
Risk exposure amount, Basel 3, SEKbn 185 81 124 24 0 414
Full-time employees 5 008 3 920 1 193 4 462 0 14 583
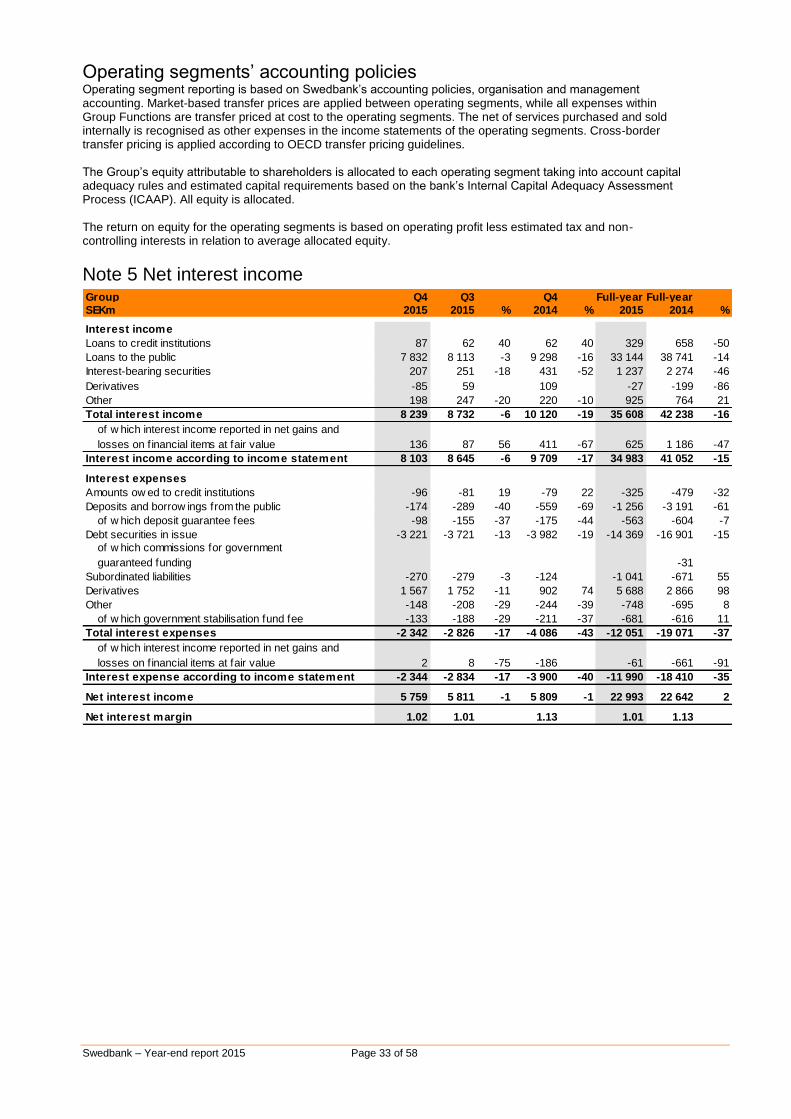
Swedbank – Year-end report 2015 Page 33 of 58
Operating segments’ accounting policies Operating segment reporting is based on Swedbank’s accounting policies, organisation and management accounting. Market-based transfer prices are applied between operating segments, while all expenses within Group Functions are transfer priced at cost to the operating segments. The net of services purchased and sold internally is recognised as other expenses in the income statements of the operating segments. Cross-border transfer pricing is applied according to OECD transfer pricing guidelines.
The Group’s equity attributable to shareholders is allocated to each operating segment taking into account capital adequacy rules and estimated capital requirements based on the bank’s Internal Capital Adequacy Assessment Process (ICAAP). All equity is allocated. The return on equity for the operating segments is based on operating profit less estimated tax and non-controlling interests in relation to average allocated equity.
Note 5 Net interest income Group Q4 Q3 Q4 Full-year Full-year
SEKm 2015 2015 % 2014 % 2015 2014 %
Interest income
Loans to credit institutions 87 62 40 62 40 329 658 -50
Loans to the public 7 832 8 113 -3 9 298 -16 33 144 38 741 -14
Interest-bearing securities 207 251 -18 431 -52 1 237 2 274 -46
Derivatives -85 59 109 -27 -199 -86
Other 198 247 -20 220 -10 925 764 21
Total interest income 8 239 8 732 -6 10 120 -19 35 608 42 238 -16
of w hich interest income reported in net gains and
losses on f inancial items at fair value 136 87 56 411 -67 625 1 186 -47
Interest income according to income statement 8 103 8 645 -6 9 709 -17 34 983 41 052 -15
Interest expenses
Amounts ow ed to credit institutions -96 -81 19 -79 22 -325 -479 -32
Deposits and borrow ings from the public -174 -289 -40 -559 -69 -1 256 -3 191 -61
of w hich deposit guarantee fees -98 -155 -37 -175 -44 -563 -604 -7
Debt securities in issue -3 221 -3 721 -13 -3 982 -19 -14 369 -16 901 -15
of w hich commissions for government
guaranteed funding 0 0 0 0 -31
Subordinated liabilities -270 -279 -3 -124 -1 041 -671 55
Derivatives 1 567 1 752 -11 902 74 5 688 2 866 98
Other -148 -208 -29 -244 -39 -748 -695 8
of w hich government stabilisation fund fee -133 -188 -29 -211 -37 -681 -616 11
Total interest expenses -2 342 -2 826 -17 -4 086 -43 -12 051 -19 071 -37
of w hich interest income reported in net gains and
losses on f inancial items at fair value 2 8 -75 -186 -61 -661 -91
Interest expense according to income statement -2 344 -2 834 -17 -3 900 -40 -11 990 -18 410 -35
Net interest income 5 759 5 811 -1 5 809 -1 22 993 22 642 2
Net interest margin 1.02 1.01 1.13 1.01 1.13
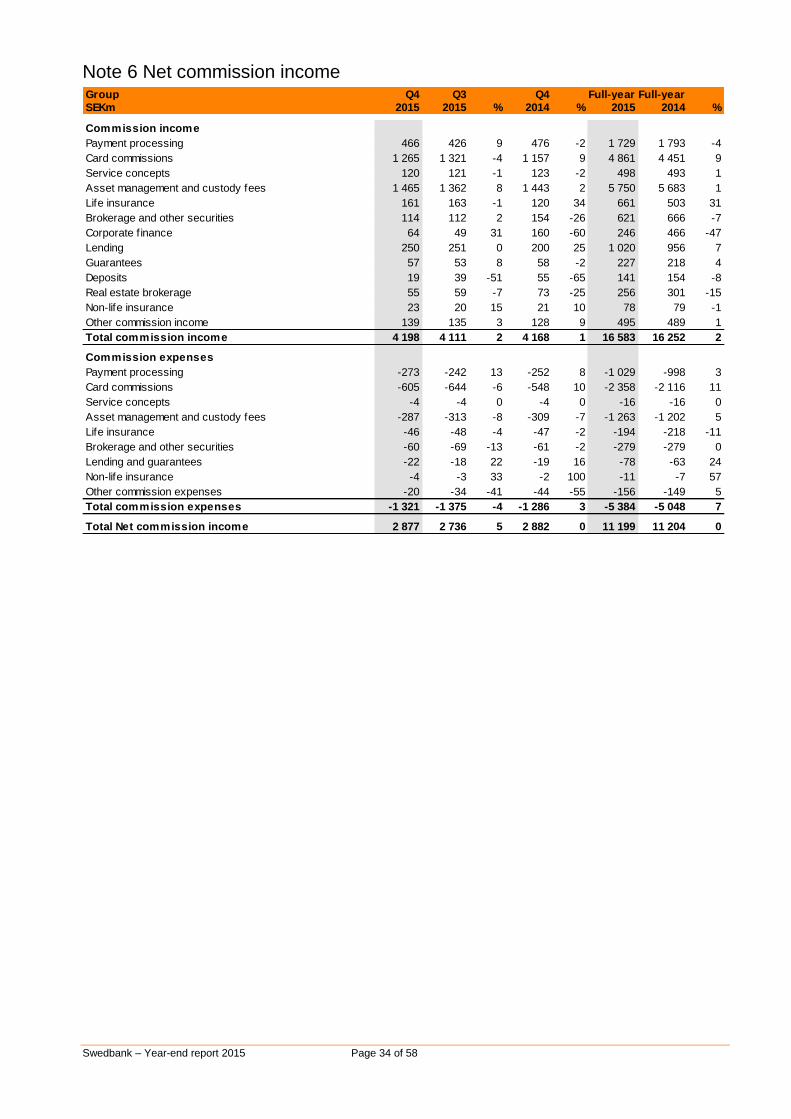
Swedbank – Year-end report 2015 Page 34 of 58
Note 6 Net commission income Group Q4 Q3 Q4 Full-year Full-year
SEKm 2015 2015 % 2014 % 2015 2014 %
Commission income
Payment processing 466 426 9 476 -2 1 729 1 793 -4
Card commissions 1 265 1 321 -4 1 157 9 4 861 4 451 9
Service concepts 120 121 -1 123 -2 498 493 1
Asset management and custody fees 1 465 1 362 8 1 443 2 5 750 5 683 1
Life insurance 161 163 -1 120 34 661 503 31
Brokerage and other securities 114 112 2 154 -26 621 666 -7
Corporate f inance 64 49 31 160 -60 246 466 -47
Lending 250 251 0 200 25 1 020 956 7
Guarantees 57 53 8 58 -2 227 218 4
Deposits 19 39 -51 55 -65 141 154 -8
Real estate brokerage 55 59 -7 73 -25 256 301 -15
Non-life insurance 23 20 15 21 10 78 79 -1
Other commission income 139 135 3 128 9 495 489 1
Total commission income 4 198 4 111 2 4 168 1 16 583 16 252 2
Commission expenses
Payment processing -273 -242 13 -252 8 -1 029 -998 3
Card commissions -605 -644 -6 -548 10 -2 358 -2 116 11
Service concepts -4 -4 0 -4 0 -16 -16 0
Asset management and custody fees -287 -313 -8 -309 -7 -1 263 -1 202 5
Life insurance -46 -48 -4 -47 -2 -194 -218 -11
Brokerage and other securities -60 -69 -13 -61 -2 -279 -279 0
Lending and guarantees -22 -18 22 -19 16 -78 -63 24
Non-life insurance -4 -3 33 -2 100 -11 -7 57
Other commission expenses -20 -34 -41 -44 -55 -156 -149 5
Total commission expenses -1 321 -1 375 -4 -1 286 3 -5 384 -5 048 7
Total Net commission income 2 877 2 736 5 2 882 0 11 199 11 204 0
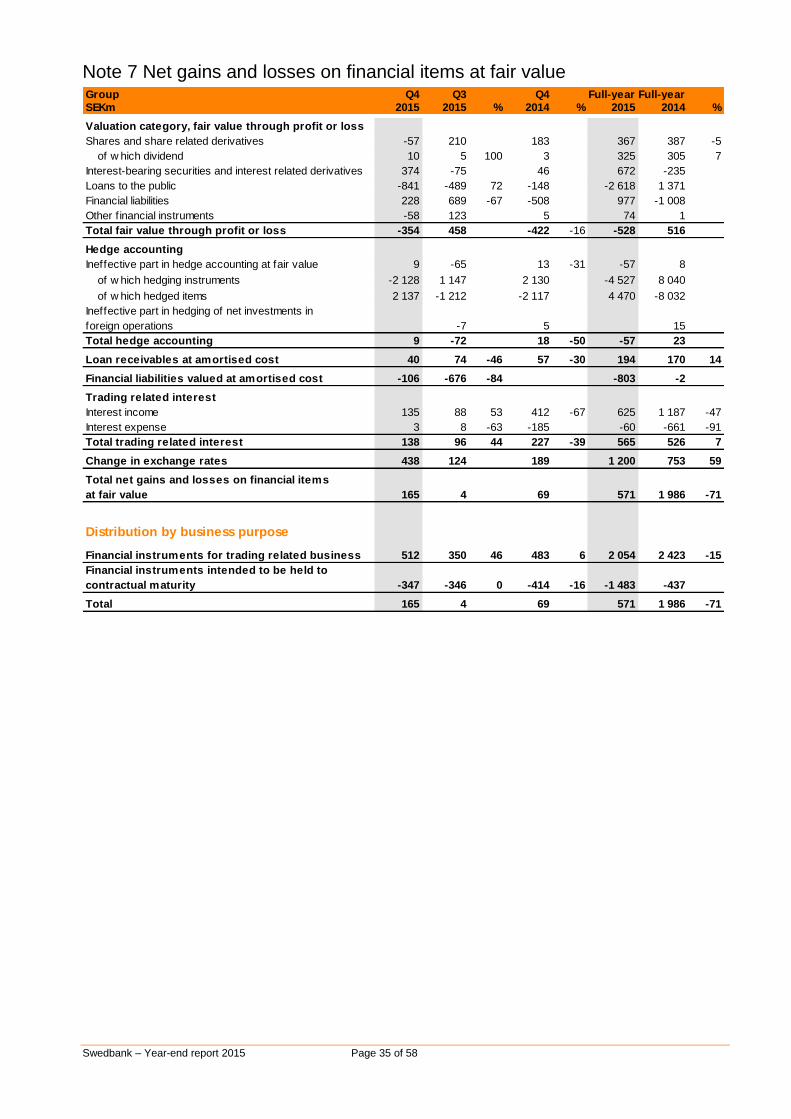
Swedbank – Year-end report 2015 Page 35 of 58
Note 7 Net gains and losses on financial items at fair value Group Q4 Q3 Q4 Full-year Full-year
SEKm 2015 2015 % 2014 % 2015 2014 %
Valuation category, fair value through profit or loss
Shares and share related derivatives -57 210 183 367 387 -5
of w hich dividend 10 5 100 3 325 305 7
Interest-bearing securities and interest related derivatives 374 -75 46 672 -235
Loans to the public -841 -489 72 -148 -2 618 1 371
Financial liabilities 228 689 -67 -508 977 -1 008
Other f inancial instruments -58 123 5 74 1
Total fair value through profit or loss -354 458 -422 -16 -528 516
Hedge accounting
Ineffective part in hedge accounting at fair value 9 -65 13 -31 -57 8
of w hich hedging instruments -2 128 1 147 2 130 -4 527 8 040
of w hich hedged items 2 137 -1 212 -2 117 4 470 -8 032
Ineffective part in hedging of net investments in
foreign operations 0 -7 5 0 15
Total hedge accounting 9 -72 18 -50 -57 23
Loan receivables at amortised cost 40 74 -46 57 -30 194 170 14
Financial liabilities valued at amortised cost -106 -676 -84 0 -803 -2
Trading related interest
Interest income 135 88 53 412 -67 625 1 187 -47
Interest expense 3 8 -63 -185 -60 -661 -91
Total trading related interest 138 96 44 227 -39 565 526 7
Change in exchange rates 438 124 189 1 200 753 59
Total net gains and losses on financial items
at fair value 165 4 69 571 1 986 -71
Distribution by business purpose
Financial instruments for trading related business 512 350 46 483 6 2 054 2 423 -15
Financial instruments intended to be held to
contractual maturity -347 -346 0 -414 -16 -1 483 -437
Total 165 4 69 571 1 986 -71
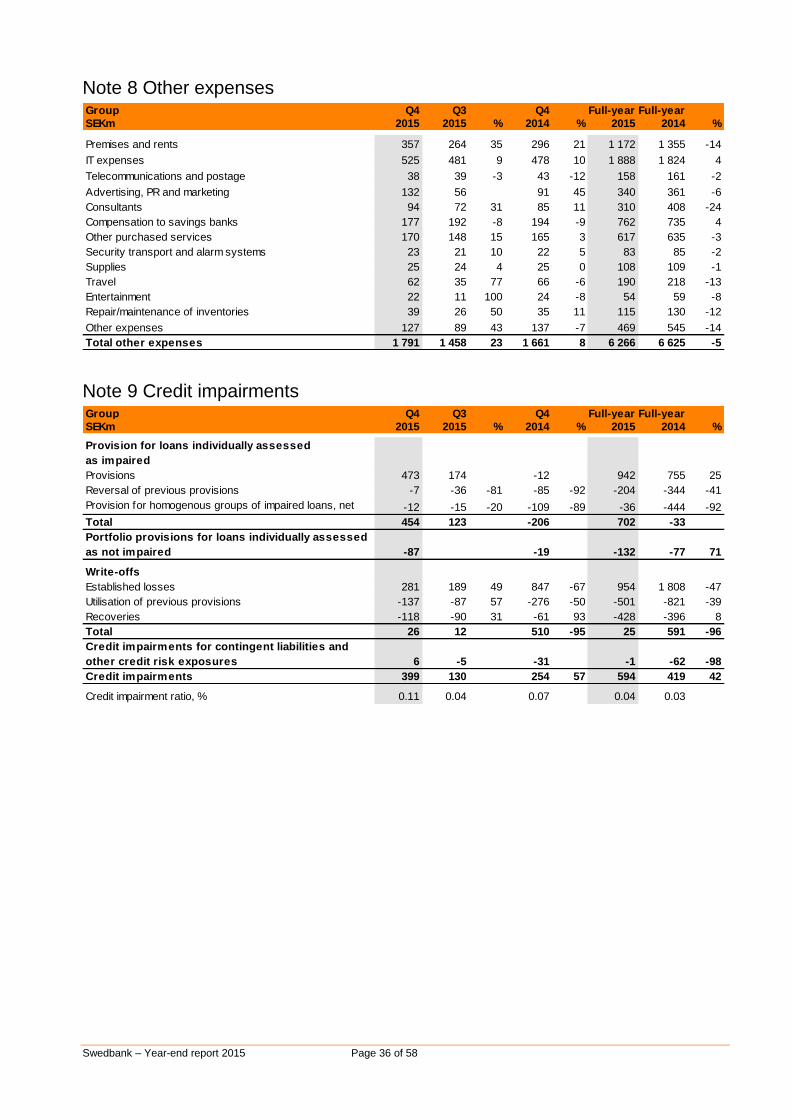
Swedbank – Year-end report 2015 Page 36 of 58
Note 8 Other expenses Group Q4 Q3 Q4 Full-year Full-year
SEKm 2015 2015 % 2014 % 2015 2014 %
Premises and rents 357 264 35 296 21 1 172 1 355 -14
IT expenses 525 481 9 478 10 1 888 1 824 4
Telecommunications and postage 38 39 -3 43 -12 158 161 -2
Advertising, PR and marketing 132 56 91 45 340 361 -6
Consultants 94 72 31 85 11 310 408 -24
Compensation to savings banks 177 192 -8 194 -9 762 735 4
Other purchased services 170 148 15 165 3 617 635 -3
Security transport and alarm systems 23 21 10 22 5 83 85 -2
Supplies 25 24 4 25 0 108 109 -1
Travel 62 35 77 66 -6 190 218 -13
Entertainment 22 11 100 24 -8 54 59 -8
Repair/maintenance of inventories 39 26 50 35 11 115 130 -12
Other expenses 127 89 43 137 -7 469 545 -14
Total other expenses 1 791 1 458 23 1 661 8 6 266 6 625 -5
Note 9 Credit impairments Group Q4 Q3 Q4 Full-year Full-year
SEKm 2015 2015 % 2014 % 2015 2014 %
Provision for loans individually assessed
as impaired
Provisions 473 174 -12 942 755 25
Reversal of previous provisions -7 -36 -81 -85 -92 -204 -344 -41
Provision for homogenous groups of impaired loans, net -12 -15 -20 -109 -89 -36 -444 -92
Total 454 123 -206 702 -33
Portfolio provisions for loans individually assessed
as not impaired -87 0 -19 -132 -77 71
Write-offs
Established losses 281 189 49 847 -67 954 1 808 -47
Utilisation of previous provisions -137 -87 57 -276 -50 -501 -821 -39
Recoveries -118 -90 31 -61 93 -428 -396 8
Total 26 12 510 -95 25 591 -96
Credit impairments for contingent liabilities and
other credit risk exposures 6 -5 -31 -1 -62 -98
Credit impairments 399 130 254 57 594 419 42
Credit impairment ratio, % 0.11 0.04 0.07 0.04 0.03
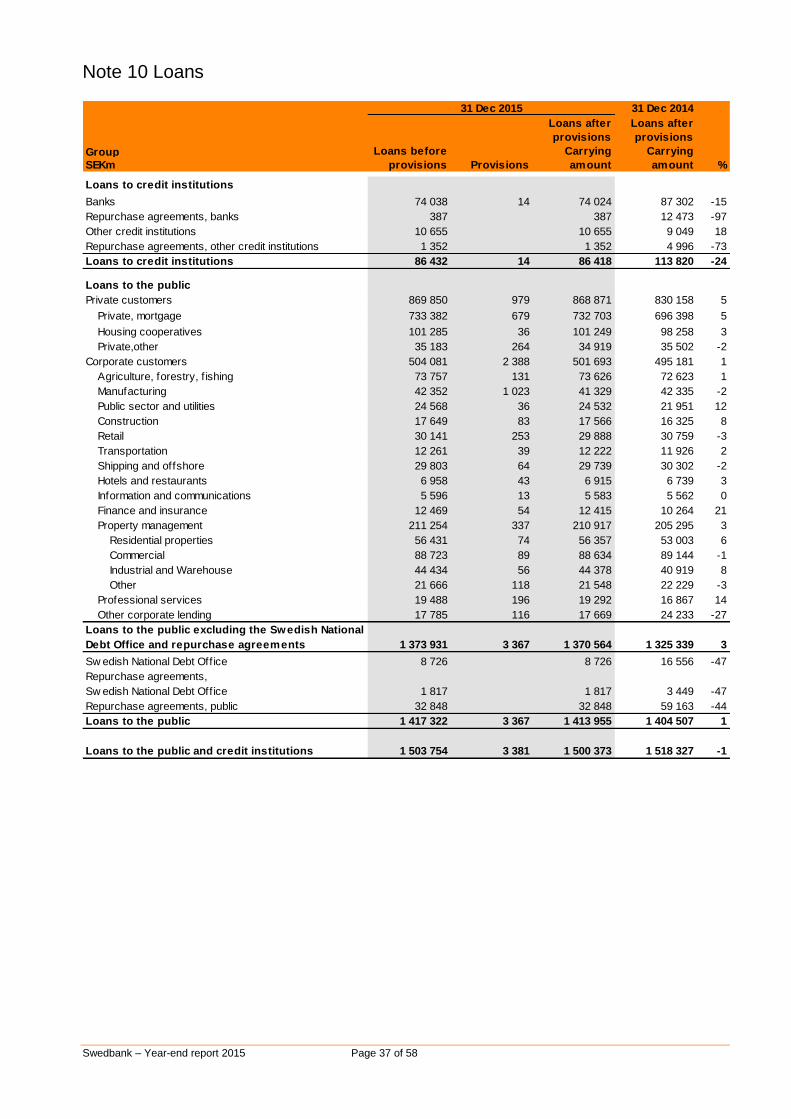
Swedbank – Year-end report 2015 Page 37 of 58
Note 10 Loans
31 Dec 2014
Loans after Loans after
provisions provisions
Group Loans before Carrying Carrying
SEKm provisions Provisions amount amount %
Loans to credit institutions
Banks 74 038 14 74 024 87 302 -15
Repurchase agreements, banks 387 0 387 12 473 -97
Other credit institutions 10 655 0 10 655 9 049 18
Repurchase agreements, other credit institutions 1 352 0 1 352 4 996 -73
Loans to credit institutions 86 432 14 86 418 113 820 -24
Loans to the public
Private customers 869 850 979 868 871 830 158 5
Private, mortgage 733 382 679 732 703 696 398 5
Housing cooperatives 101 285 36 101 249 98 258 3
Private,other 35 183 264 34 919 35 502 -2
Corporate customers 504 081 2 388 501 693 495 181 1
Agriculture, forestry, f ishing 73 757 131 73 626 72 623 1
Manufacturing 42 352 1 023 41 329 42 335 -2
Public sector and utilities 24 568 36 24 532 21 951 12
Construction 17 649 83 17 566 16 325 8
Retail 30 141 253 29 888 30 759 -3
Transportation 12 261 39 12 222 11 926 2
Shipping and offshore 29 803 64 29 739 30 302 -2
Hotels and restaurants 6 958 43 6 915 6 739 3
Information and communications 5 596 13 5 583 5 562 0
Finance and insurance 12 469 54 12 415 10 264 21
Property management 211 254 337 210 917 205 295 3
Residential properties 56 431 74 56 357 53 003 6
Commercial 88 723 89 88 634 89 144 -1
Industrial and Warehouse 44 434 56 44 378 40 919 8
Other 21 666 118 21 548 22 229 -3
Professional services 19 488 196 19 292 16 867 14
Other corporate lending 17 785 116 17 669 24 233 -27
Loans to the public excluding the Swedish National
Debt Office and repurchase agreements 1 373 931 3 367 1 370 564 1 325 339 3
Sw edish National Debt Office 8 726 0 8 726 16 556 -47
Repurchase agreements,
Sw edish National Debt Office 1 817 0 1 817 3 449 -47
Repurchase agreements, public 32 848 0 32 848 59 163 -44
Loans to the public 1 417 322 3 367 1 413 955 1 404 507 1
Loans to the public and credit institutions 1 503 754 3 381 1 500 373 1 518 327 -1
31 Dec 2015
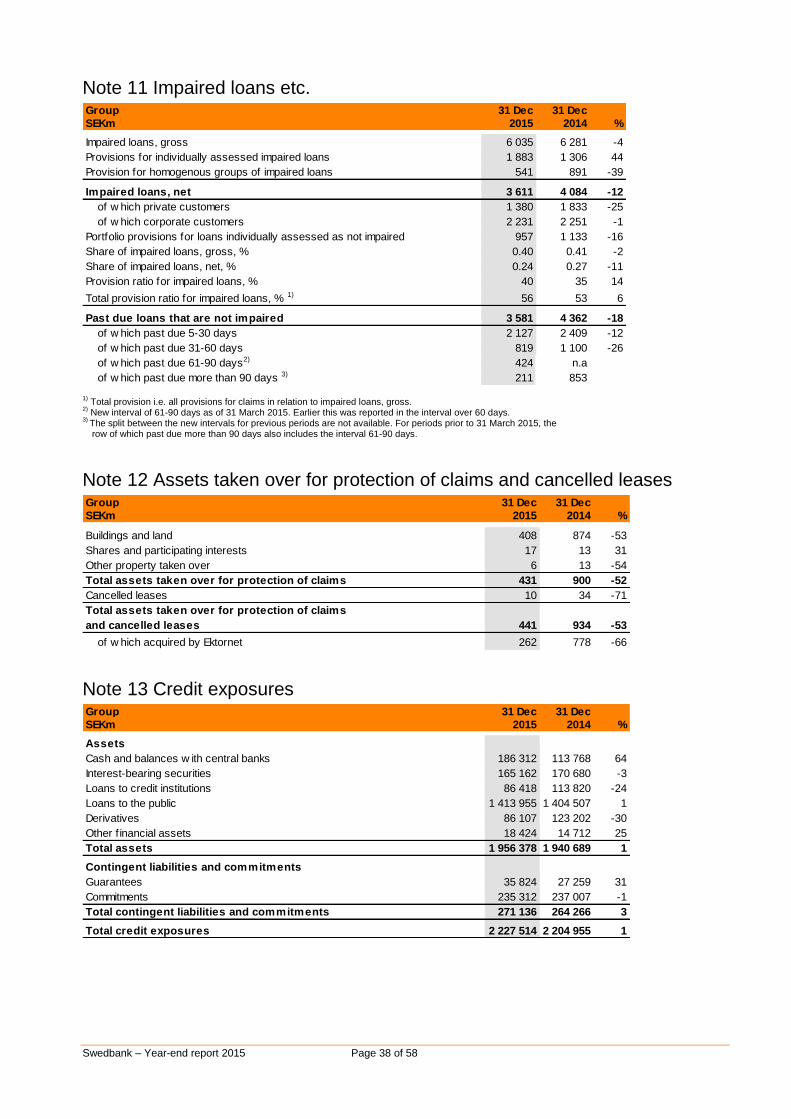
Swedbank – Year-end report 2015 Page 38 of 58
Note 11 Impaired loans etc. Group 31 Dec 31 Dec
SEKm 2015 2014 %
Impaired loans, gross 6 035 6 281 -4
Provisions for individually assessed impaired loans 1 883 1 306 44
Provision for homogenous groups of impaired loans 541 891 -39
Impaired loans, net 3 611 4 084 -12
of w hich private customers 1 380 1 833 -25
of w hich corporate customers 2 231 2 251 -1
Portfolio provisions for loans individually assessed as not impaired 957 1 133 -16
Share of impaired loans, gross, % 0.40 0.41 -2
Share of impaired loans, net, % 0.24 0.27 -11
Provision ratio for impaired loans, % 40 35 14
Total provision ratio for impaired loans, % 1) 56 53 6
Past due loans that are not impaired 3 581 4 362 -18
of w hich past due 5-30 days 2 127 2 409 -12
of w hich past due 31-60 days 819 1 100 -26
of w hich past due 61-90 days2) 424 n.a
of w hich past due more than 90 days 3) 211 853 1)
Total provision i.e. all provisions for claims in relation to impaired loans, gross. 2)
New interval of 61-90 days as of 31 March 2015. Earlier this was reported in the interval over 60 days.
3) The split between the new intervals for previous periods are not available. For periods prior to 31 March 2015, the row of which past due more than 90 days also includes the interval 61-90 days.
Note 12 Assets taken over for protection of claims and cancelled leases Group 31 Dec 31 Dec
SEKm 2015 2014 %
Buildings and land 408 874 -53
Shares and participating interests 17 13 31
Other property taken over 6 13 -54
Total assets taken over for protection of claims 431 900 -52
Cancelled leases 10 34 -71
Total assets taken over for protection of claims
and cancelled leases 441 934 -53
of w hich acquired by Ektornet 262 778 -66
Note 13 Credit exposures Group 31 Dec 31 Dec
SEKm 2015 2014 %
Assets
Cash and balances w ith central banks 186 312 113 768 64
Interest-bearing securities 165 162 170 680 -3
Loans to credit institutions 86 418 113 820 -24
Loans to the public 1 413 955 1 404 507 1
Derivatives 86 107 123 202 -30
Other f inancial assets 18 424 14 712 25
Total assets 1 956 378 1 940 689 1
Contingent liabilities and commitments
Guarantees 35 824 27 259 31
Commitments 235 312 237 007 -1
Total contingent liabilities and commitments 271 136 264 266 3
Total credit exposures 2 227 514 2 204 955 1
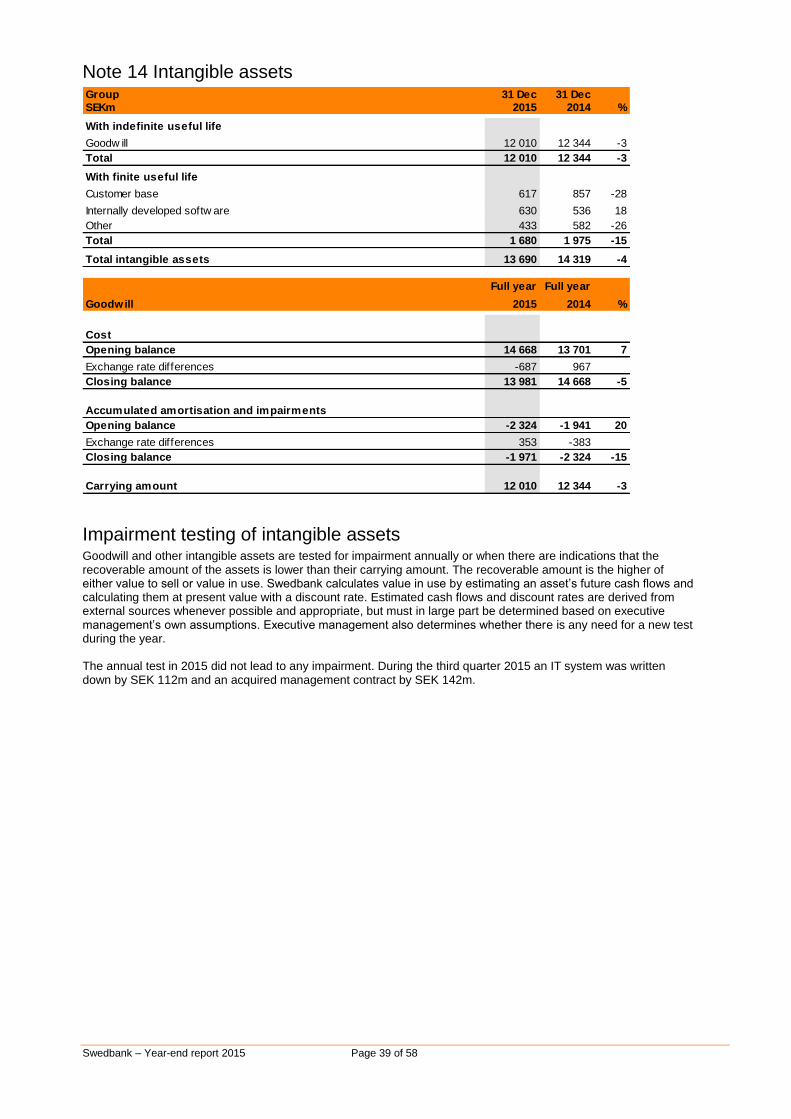
Swedbank – Year-end report 2015 Page 39 of 58
Note 14 Intangible assets Group 31 Dec 31 Dec
SEKm 2015 2014 %
With indefinite useful life
Goodw ill 12 010 12 344 -3
Total 12 010 12 344 -3
With finite useful life
Customer base 617 857 -28
Internally developed softw are 630 536 18
Other 433 582 -26
Total 1 680 1 975 -15
Total intangible assets 13 690 14 319 -4
Full year Full year
Goodwill 2015 2014 %
Cost
Opening balance 14 668 13 701 7
Exchange rate differences -687 967
Closing balance 13 981 14 668 -5
Accumulated amortisation and impairments
Opening balance -2 324 -1 941 20
Exchange rate differences 353 -383
Closing balance -1 971 -2 324 -15
Carrying amount 12 010 12 344 -3
Impairment testing of intangible assets Goodwill and other intangible assets are tested for impairment annually or when there are indications that the recoverable amount of the assets is lower than their carrying amount. The recoverable amount is the higher of either value to sell or value in use. Swedbank calculates value in use by estimating an asset’s future cash flows and calculating them at present value with a discount rate. Estimated cash flows and discount rates are derived from external sources whenever possible and appropriate, but must in large part be determined based on executive management’s own assumptions. Executive management also determines whether there is any need for a new test during the year. The annual test in 2015 did not lead to any impairment. During the third quarter 2015 an IT system was written down by SEK 112m and an acquired management contract by SEK 142m.
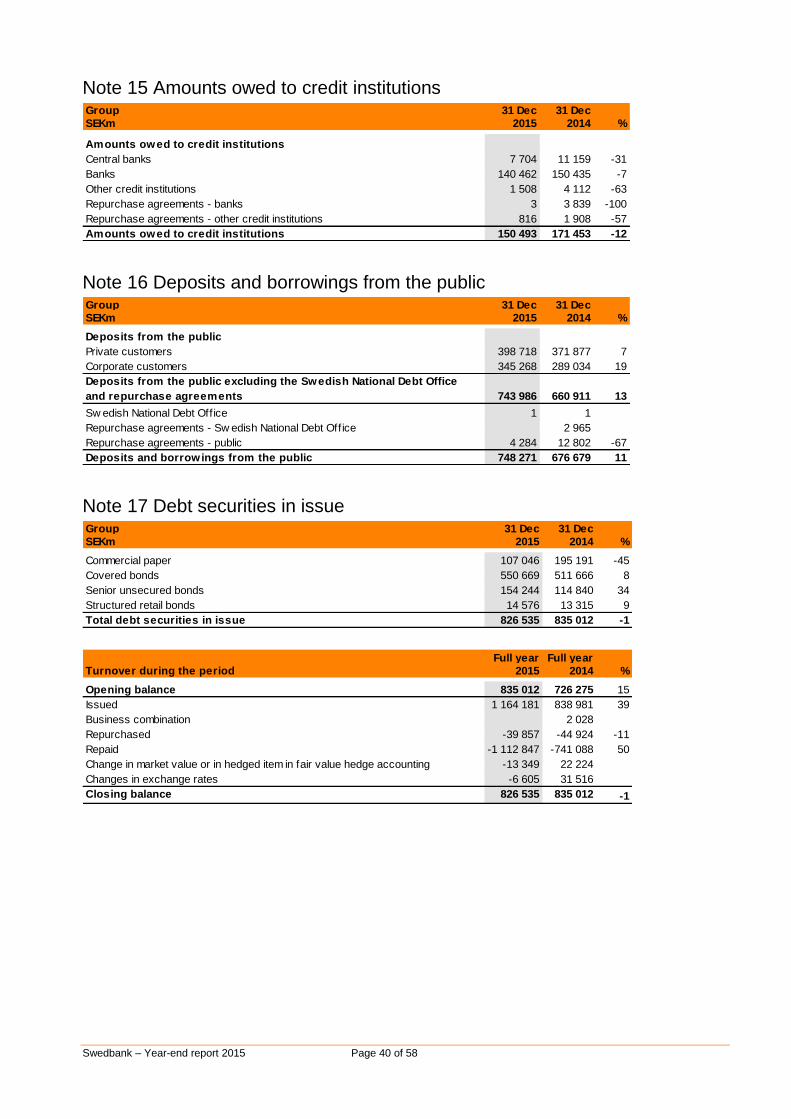
Swedbank – Year-end report 2015 Page 40 of 58
Note 15 Amounts owed to credit institutions Group 31 Dec 31 Dec
SEKm 2015 2014 %
Amounts owed to credit institutions
Central banks 7 704 11 159 -31
Banks 140 462 150 435 -7
Other credit institutions 1 508 4 112 -63
Repurchase agreements - banks 3 3 839 -100
Repurchase agreements - other credit institutions 816 1 908 -57
Amounts owed to credit institutions 150 493 171 453 -12
Note 16 Deposits and borrowings from the public Group 31 Dec 31 Dec
SEKm 2015 2014 %
Deposits from the public
Private customers 398 718 371 877 7
Corporate customers 345 268 289 034 19
Deposits from the public excluding the Swedish National Debt Office
and repurchase agreements 743 986 660 911 13
Sw edish National Debt Office 1 1
Repurchase agreements - Sw edish National Debt Office 0 2 965
Repurchase agreements - public 4 284 12 802 -67
Deposits and borrowings from the public 748 271 676 679 11
Note 17 Debt securities in issue Group 31 Dec 31 Dec
SEKm 2015 2014 %
Commercial paper 107 046 195 191 -45
Covered bonds 550 669 511 666 8
Senior unsecured bonds 154 244 114 840 34
Structured retail bonds 14 576 13 315 9
Total debt securities in issue 826 535 835 012 -1
Full year Full year
Turnover during the period 2015 2014 %
Opening balance 835 012 726 275 15
Issued 1 164 181 838 981 39
Business combination 0 2 028
Repurchased -39 857 -44 924 -11
Repaid -1 112 847 -741 088 50
Change in market value or in hedged item in fair value hedge accounting -13 349 22 224
Changes in exchange rates -6 605 31 516
Closing balance 826 535 835 012 -1
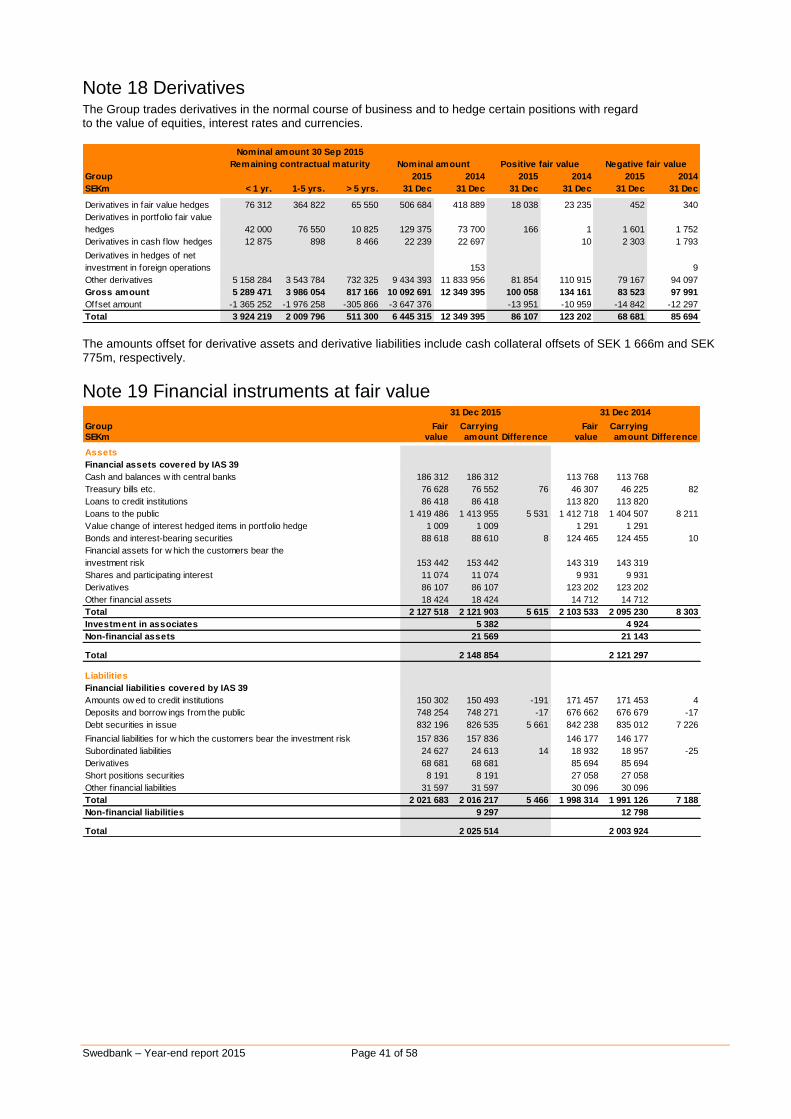
Swedbank – Year-end report 2015 Page 41 of 58
Note 18 Derivatives The Group trades derivatives in the normal course of business and to hedge certain positions with regard to the value of equities, interest rates and currencies.
Group 2015 2014 2015 2014 2015 2014
SEKm < 1 yr. 1-5 yrs. > 5 yrs. 31 Dec 31 Dec 31 Dec 31 Dec 31 Dec 31 Dec
Derivatives in fair value hedges 76 312 364 822 65 550 506 684 418 889 18 038 23 235 452 340
Derivatives in portfolio fair value
hedges 42 000 76 550 10 825 129 375 73 700 166 1 1 601 1 752
Derivatives in cash flow hedges 12 875 898 8 466 22 239 22 697 0 10 2 303 1 793
Derivatives in hedges of net
investment in foreign operations 0 0 0 0 153 0 0 0 9
Other derivatives 5 158 284 3 543 784 732 325 9 434 393 11 833 956 81 854 110 915 79 167 94 097
Gross amount 5 289 471 3 986 054 817 166 10 092 691 12 349 395 100 058 134 161 83 523 97 991
Offset amount -1 365 252 -1 976 258 -305 866 -3 647 376 0 -13 951 -10 959 -14 842 -12 297
Total 3 924 219 2 009 796 511 300 6 445 315 12 349 395 86 107 123 202 68 681 85 694
Nominal amount 30 Sep 2015
Remaining contractual maturity Nominal amount Positive fair value Negative fair value
The amounts offset for derivative assets and derivative liabilities include cash collateral offsets of SEK 1 666m and SEK 775m, respectively.
Note 19 Financial instruments at fair value
Group Fair Carrying Fair Carrying
SEKm value amount Difference value amount Difference
Assets
Financial assets covered by IAS 39
Cash and balances w ith central banks 186 312 186 312 0 113 768 113 768 0
Treasury bills etc. 76 628 76 552 76 46 307 46 225 82
Loans to credit institutions 86 418 86 418 0 113 820 113 820 0
Loans to the public 1 419 486 1 413 955 5 531 1 412 718 1 404 507 8 211
Value change of interest hedged items in portfolio hedge 1 009 1 009 0 1 291 1 291 0
Bonds and interest-bearing securities 88 618 88 610 8 124 465 124 455 10
Financial assets for w hich the customers bear the
investment risk 153 442 153 442 0 143 319 143 319 0
Shares and participating interest 11 074 11 074 0 9 931 9 931 0
Derivatives 86 107 86 107 0 123 202 123 202 0
Other f inancial assets 18 424 18 424 0 14 712 14 712 0
Total 2 127 518 2 121 903 5 615 2 103 533 2 095 230 8 303
Investment in associates 5 382 4 924
Non-financial assets 21 569 21 143
Total 2 148 854 2 121 297
Liabilities
Financial liabilities covered by IAS 39
Amounts ow ed to credit institutions 150 302 150 493 -191 171 457 171 453 4
Deposits and borrow ings from the public 748 254 748 271 -17 676 662 676 679 -17
Debt securities in issue 832 196 826 535 5 661 842 238 835 012 7 226
Financial liabilities for w hich the customers bear the investment risk 157 836 157 836 0 146 177 146 177 0
Subordinated liabilities 24 627 24 613 14 18 932 18 957 -25
Derivatives 68 681 68 681 0 85 694 85 694 0
Short positions securities 8 191 8 191 0 27 058 27 058 0
Other f inancial liabilities 31 597 31 597 0 30 096 30 096 0
Total 2 021 683 2 016 217 5 466 1 998 314 1 991 126 7 188
Non-financial liabilities 9 297 12 798
Total 2 025 514 2 003 924
31 Dec 2015 31 Dec 2014
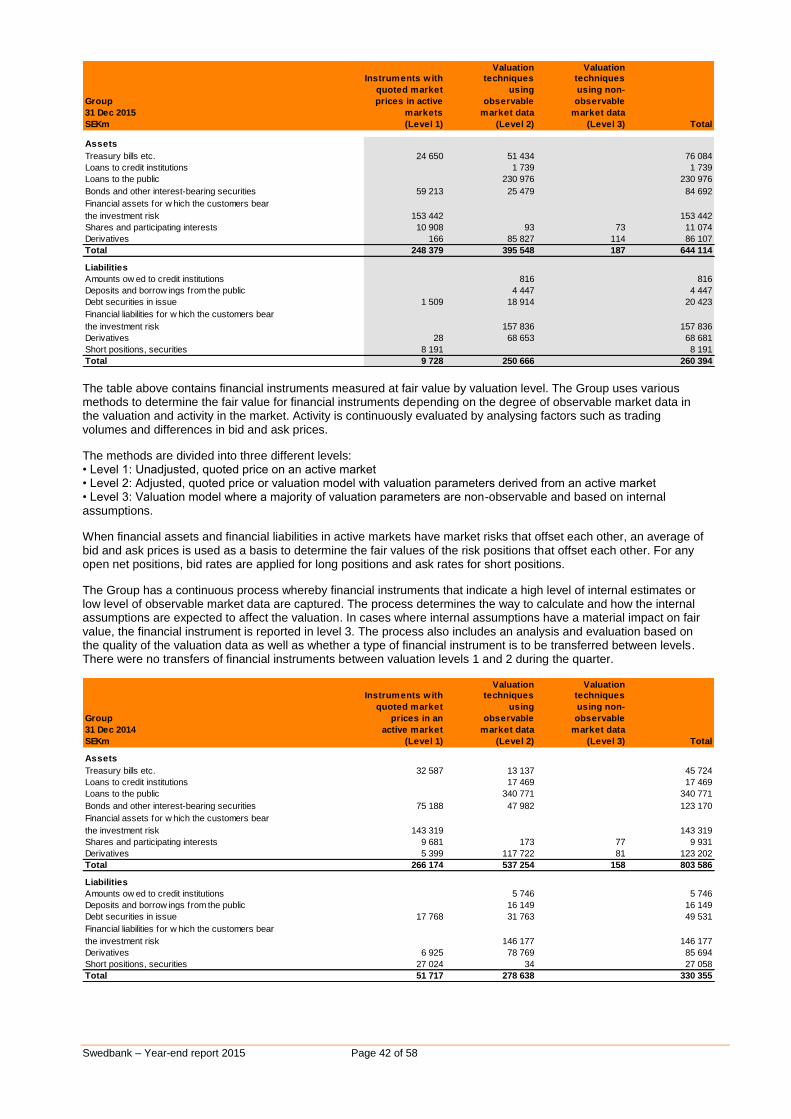
Swedbank – Year-end report 2015 Page 42 of 58
Valuation Valuation
Instruments with techniques techniques
quoted market using using non-
Group prices in active observable observable
31 Dec 2015 markets market data market data
SEKm (Level 1) (Level 2) (Level 3) Total
Assets
Treasury bills etc. 24 650 51 434 0 76 084
Loans to credit institutions 0 1 739 0 1 739
Loans to the public 0 230 976 0 230 976
Bonds and other interest-bearing securities 59 213 25 479 0 84 692
Financial assets for w hich the customers bear
the investment risk 153 442 0 0 153 442
Shares and participating interests 10 908 93 73 11 074
Derivatives 166 85 827 114 86 107
Total 248 379 395 548 187 644 114
Liabilities
Amounts ow ed to credit institutions 0 816 0 816
Deposits and borrow ings from the public 0 4 447 0 4 447
Debt securities in issue 1 509 18 914 0 20 423
Financial liabilities for w hich the customers bear
the investment risk 157 836 0 157 836
Derivatives 28 68 653 0 68 681
Short positions, securities 8 191 0 8 191
Total 9 728 250 666 0 260 394
The table above contains financial instruments measured at fair value by valuation level. The Group uses various methods to determine the fair value for financial instruments depending on the degree of observable market data in the valuation and activity in the market. Activity is continuously evaluated by analysing factors such as trading volumes and differences in bid and ask prices.
The methods are divided into three different levels: • Level 1: Unadjusted, quoted price on an active market • Level 2: Adjusted, quoted price or valuation model with valuation parameters derived from an active market • Level 3: Valuation model where a majority of valuation parameters are non-observable and based on internal assumptions.
When financial assets and financial liabilities in active markets have market risks that offset each other, an average of bid and ask prices is used as a basis to determine the fair values of the risk positions that offset each other. For any open net positions, bid rates are applied for long positions and ask rates for short positions.
The Group has a continuous process whereby financial instruments that indicate a high level of internal estimates or low level of observable market data are captured. The process determines the way to calculate and how the internal assumptions are expected to affect the valuation. In cases where internal assumptions have a material impact on fair value, the financial instrument is reported in level 3. The process also includes an analysis and evaluation based on the quality of the valuation data as well as whether a type of financial instrument is to be transferred between levels. There were no transfers of financial instruments between valuation levels 1 and 2 during the quarter.
Valuation Valuation
Instruments with techniques techniques
quoted market using using non-
Group prices in an observable observable
31 Dec 2014 active market market data market data
SEKm (Level 1) (Level 2) (Level 3) Total
Assets
Treasury bills etc. 32 587 13 137 0 45 724
Loans to credit institutions 0 17 469 0 17 469
Loans to the public 0 340 771 0 340 771
Bonds and other interest-bearing securities 75 188 47 982 0 123 170
Financial assets for w hich the customers bear
the investment risk 143 319 0 0 143 319
Shares and participating interests 9 681 173 77 9 931
Derivatives 5 399 117 722 81 123 202
Total 266 174 537 254 158 803 586
Liabilities
Amounts ow ed to credit institutions 0 5 746 0 5 746
Deposits and borrow ings from the public 0 16 149 0 16 149
Debt securities in issue 17 768 31 763 0 49 531
Financial liabilities for w hich the customers bear
the investment risk 0 146 177 0 146 177
Derivatives 6 925 78 769 0 85 694
Short positions, securities 27 024 34 0 27 058
Total 51 717 278 638 0 330 355
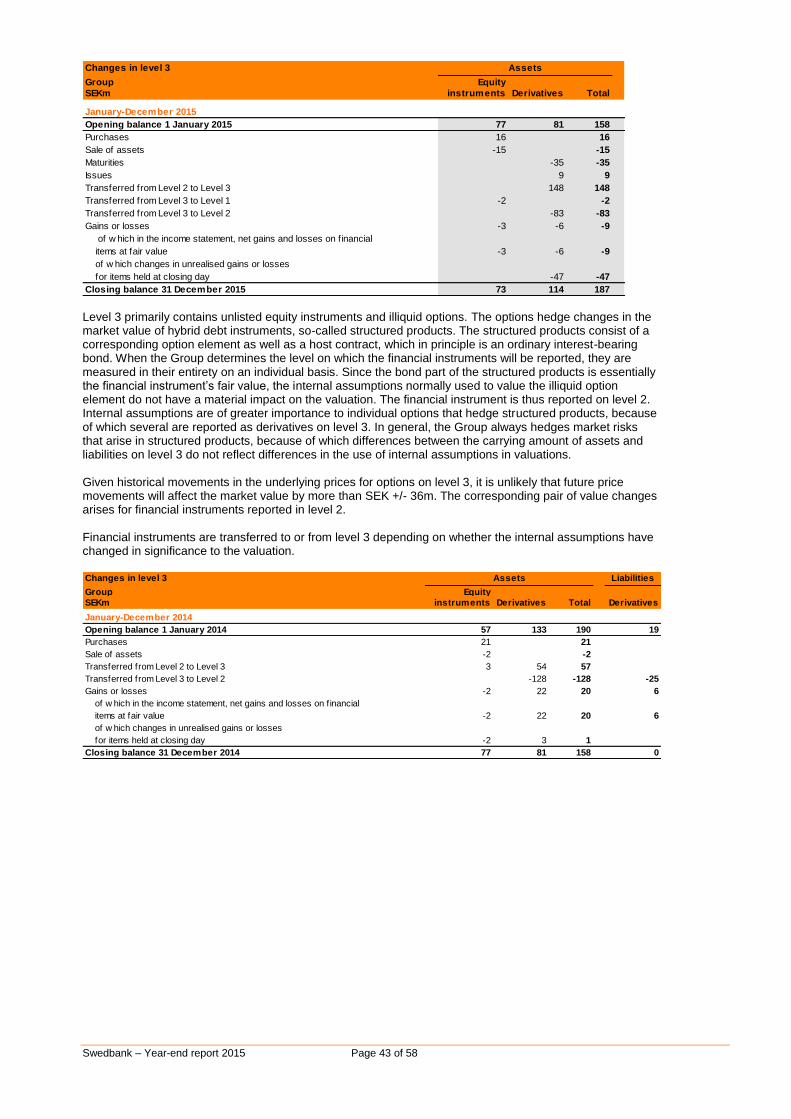
Swedbank – Year-end report 2015 Page 43 of 58
Changes in level 3
Group Equity
SEKm instruments Derivatives Total
January-December 2015
Opening balance 1 January 2015 77 81 158
Purchases 16 0 16
Sale of assets -15 0 -15
Maturities 0 -35 -35
Issues 0 9 9
Transferred from Level 2 to Level 3 0 148 148
Transferred from Level 3 to Level 1 -2 0 -2
Transferred from Level 3 to Level 2 0 -83 -83
Gains or losses -3 -6 -9
of w hich in the income statement, net gains and losses on f inancial
items at fair value -3 -6 -9
of w hich changes in unrealised gains or losses
for items held at closing day 0 -47 -47
Closing balance 31 December 2015 73 114 187
Assets
Level 3 primarily contains unlisted equity instruments and illiquid options. The options hedge changes in the market value of hybrid debt instruments, so-called structured products. The structured products consist of a corresponding option element as well as a host contract, which in principle is an ordinary interest-bearing bond. When the Group determines the level on which the financial instruments will be reported, they are measured in their entirety on an individual basis. Since the bond part of the structured products is essentially the financial instrument’s fair value, the internal assumptions normally used to value the illiquid option element do not have a material impact on the valuation. The financial instrument is thus reported on level 2. Internal assumptions are of greater importance to individual options that hedge structured products, because of which several are reported as derivatives on level 3. In general, the Group always hedges market risks that arise in structured products, because of which differences between the carrying amount of assets and liabilities on level 3 do not reflect differences in the use of internal assumptions in valuations. Given historical movements in the underlying prices for options on level 3, it is unlikely that future price movements will affect the market value by more than SEK +/- 36m. The corresponding pair of value changes arises for financial instruments reported in level 2. Financial instruments are transferred to or from level 3 depending on whether the internal assumptions have changed in significance to the valuation.
Changes in level 3
Group Equity
SEKm instruments Derivatives Total Derivatives
January-December 2014
Opening balance 1 January 2014 57 133 190 19
Purchases 21 0 21 0
Sale of assets -2 0 -2 0
Transferred from Level 2 to Level 3 3 54 57 0
Transferred from Level 3 to Level 2 0 -128 -128 -25
Gains or losses -2 22 20 6
of w hich in the income statement, net gains and losses on f inancial
items at fair value -2 22 20 6
of w hich changes in unrealised gains or losses
for items held at closing day -2 3 1 0
Closing balance 31 December 2014 77 81 158 0
Assets Liabilities
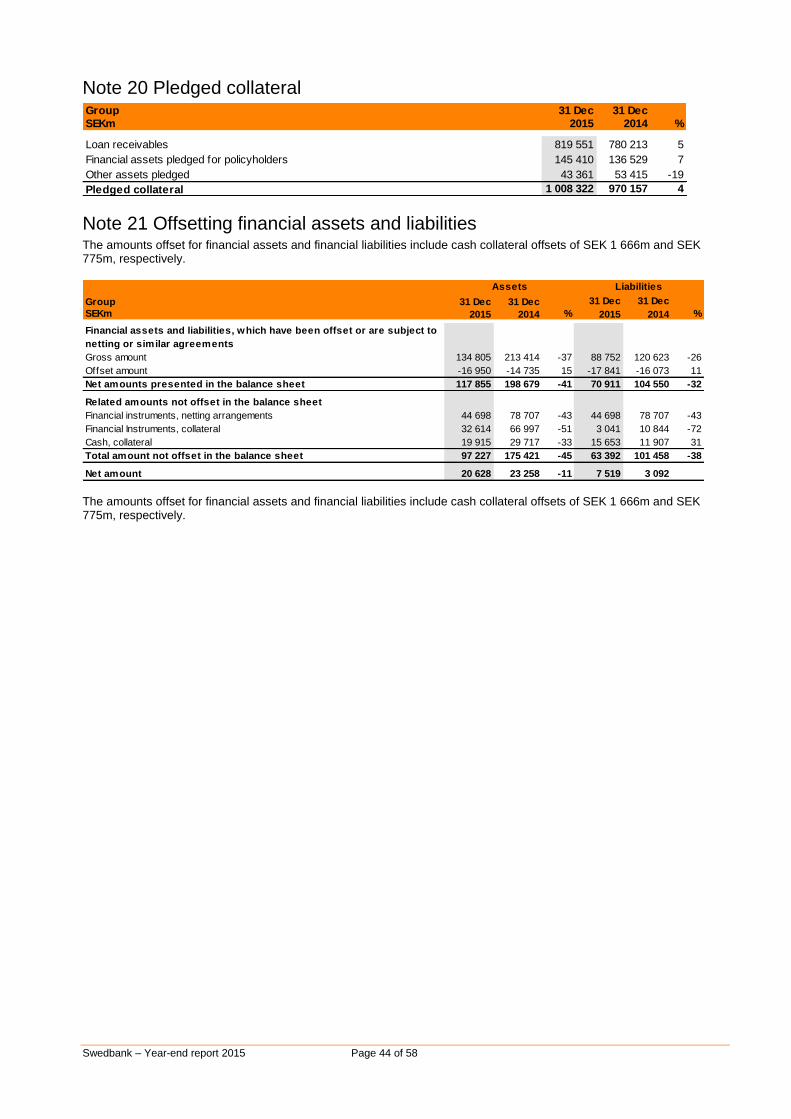
Swedbank – Year-end report 2015 Page 44 of 58
Note 20 Pledged collateral Group 31 Dec 31 Dec
SEKm 2015 2014 %
Loan receivables 819 551 780 213 5
Financial assets pledged for policyholders 145 410 136 529 7
Other assets pledged 43 361 53 415 -19
Pledged collateral 1 008 322 970 157 4
Note 21 Offsetting financial assets and liabilities The amounts offset for financial assets and financial liabilities include cash collateral offsets of SEK 1 666m and SEK 775m, respectively.
Group 31 Dec 31 Dec 31 Dec 31 Dec
SEKm 2015 2014 % 2015 2014 %
Financial assets and liabilities, which have been offset or are subject to
netting or similar agreements
Gross amount 134 805 213 414 -37 88 752 120 623 -26
Offset amount -16 950 -14 735 15 -17 841 -16 073 11
Net amounts presented in the balance sheet 117 855 198 679 -41 70 911 104 550 -32
Related amounts not offset in the balance sheet
Financial instruments, netting arrangements 44 698 78 707 -43 44 698 78 707 -43
Financial Instruments, collateral 32 614 66 997 -51 3 041 10 844 -72
Cash, collateral 19 915 29 717 -33 15 653 11 907 31
Total amount not offset in the balance sheet 97 227 175 421 -45 63 392 101 458 -38
Net amount 20 628 23 258 -11 7 519 3 092
Assets Liabilities
The amounts offset for financial assets and financial liabilities include cash collateral offsets of SEK 1 666m and SEK 775m, respectively.
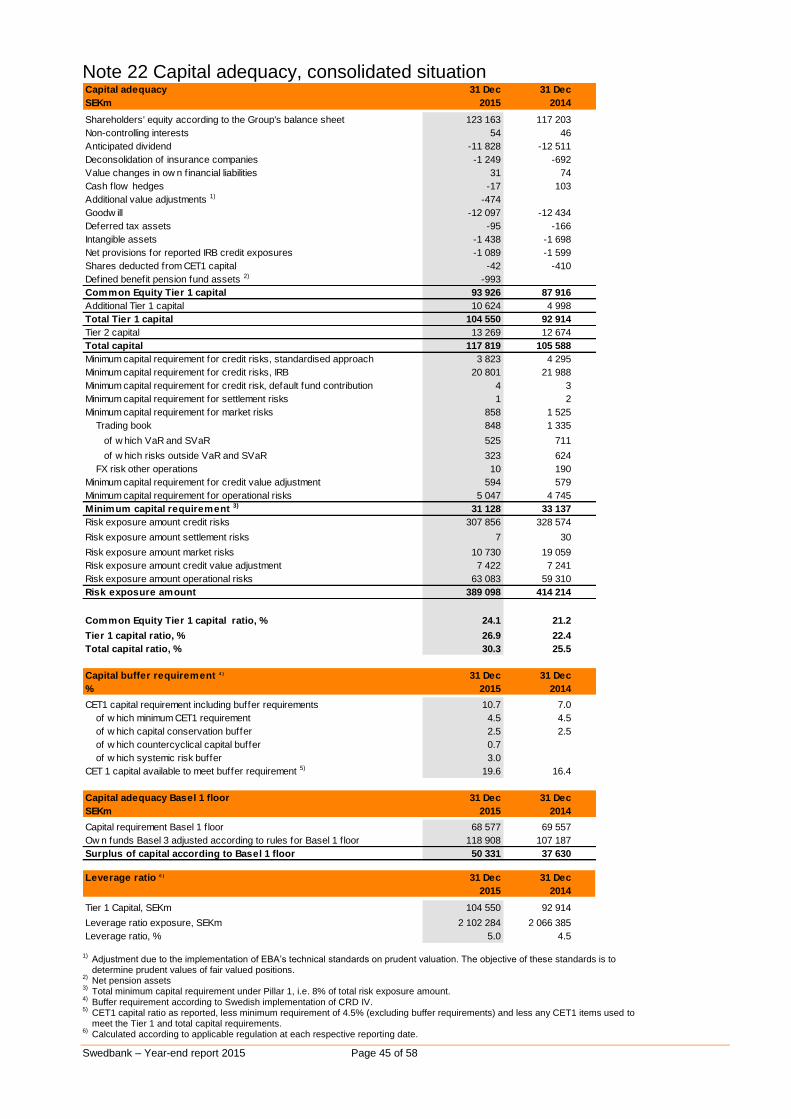
Swedbank – Year-end report 2015 Page 45 of 58
Note 22 Capital adequacy, consolidated situationCapital adequacy 31 Dec 31 Dec
SEKm 2015 2014
Shareholders' equity according to the Group's balance sheet 123 163 117 203
Non-controlling interests 54 46
Anticipated dividend -11 828 -12 511
Deconsolidation of insurance companies -1 249 -692
Value changes in ow n financial liabilities 31 74
Cash flow hedges -17 103
Additional value adjustments 1) -474 0
Goodw ill -12 097 -12 434
Deferred tax assets -95 -166
Intangible assets -1 438 -1 698
Net provisions for reported IRB credit exposures -1 089 -1 599
Shares deducted from CET1 capital -42 -410
Defined benefit pension fund assets 2) -993 0
Common Equity Tier 1 capital 93 926 87 916
Additional Tier 1 capital 10 624 4 998
Total Tier 1 capital 104 550 92 914
Tier 2 capital 13 269 12 674
Total capital 117 819 105 588
Minimum capital requirement for credit risks, standardised approach 3 823 4 295
Minimum capital requirement for credit risks, IRB 20 801 21 988
Minimum capital requirement for credit risk, default fund contribution 4 3
Minimum capital requirement for settlement risks 1 2
Minimum capital requirement for market risks 858 1 525
Trading book 848 1 335
of w hich VaR and SVaR 525 711
of w hich risks outside VaR and SVaR 323 624
FX risk other operations 10 190
Minimum capital requirement for credit value adjustment 594 579
Minimum capital requirement for operational risks 5 047 4 745
Minimum capital requirement 3) 31 128 33 137
Risk exposure amount credit risks 307 856 328 574
Risk exposure amount settlement risks 7 30
Risk exposure amount market risks 10 730 19 059
Risk exposure amount credit value adjustment 7 422 7 241
Risk exposure amount operational risks 63 083 59 310
Risk exposure amount 389 098 414 214
Common Equity Tier 1 capital ratio, % 24.1 21.2
Tier 1 capital ratio, % 26.9 22.4
Total capital ratio, % 30.3 25.5
Capital buffer requirement 4 ) 31 Dec 31 Dec
% 2015 2014
CET1 capital requirement including buffer requirements 10.7 7.0
of w hich minimum CET1 requirement 4.5 4.5
of w hich capital conservation buffer 2.5 2.5
of w hich countercyclical capital buffer 0.7 0.0
of w hich systemic risk buffer 3.0 0.0
CET 1 capital available to meet buffer requirement 5) 19.6 16.4
Capital adequacy Basel 1 floor 31 Dec 31 Dec
SEKm 2015 2014
Capital requirement Basel 1 f loor 68 577 69 557
Ow n funds Basel 3 adjusted according to rules for Basel 1 f loor 118 908 107 187
Surplus of capital according to Basel 1 floor 50 331 37 630
Leverage ratio 6 ) 31 Dec 31 Dec
2015 2014
Tier 1 Capital, SEKm 104 550 92 914
Leverage ratio exposure, SEKm 2 102 284 2 066 385
Leverage ratio, % 5.0 4.5 1)
Adjustment due to the implementation of EBA’s technical standards on prudent valuation. The objective of these standards is to determine prudent values of fair valued positions.
2) Net pension assets
3) Total minimum capital requirement under Pillar 1, i.e. 8% of total risk exposure amount.
4) Buffer requirement according to Swedish implementation of CRD IV.
5) CET1 capital ratio as reported, less minimum requirement of 4.5% (excluding buffer requirements) and less any CET1 items used to meet the Tier 1 and total capital requirements.
6) Calculated according to applicable regulation at each respective reporting date.
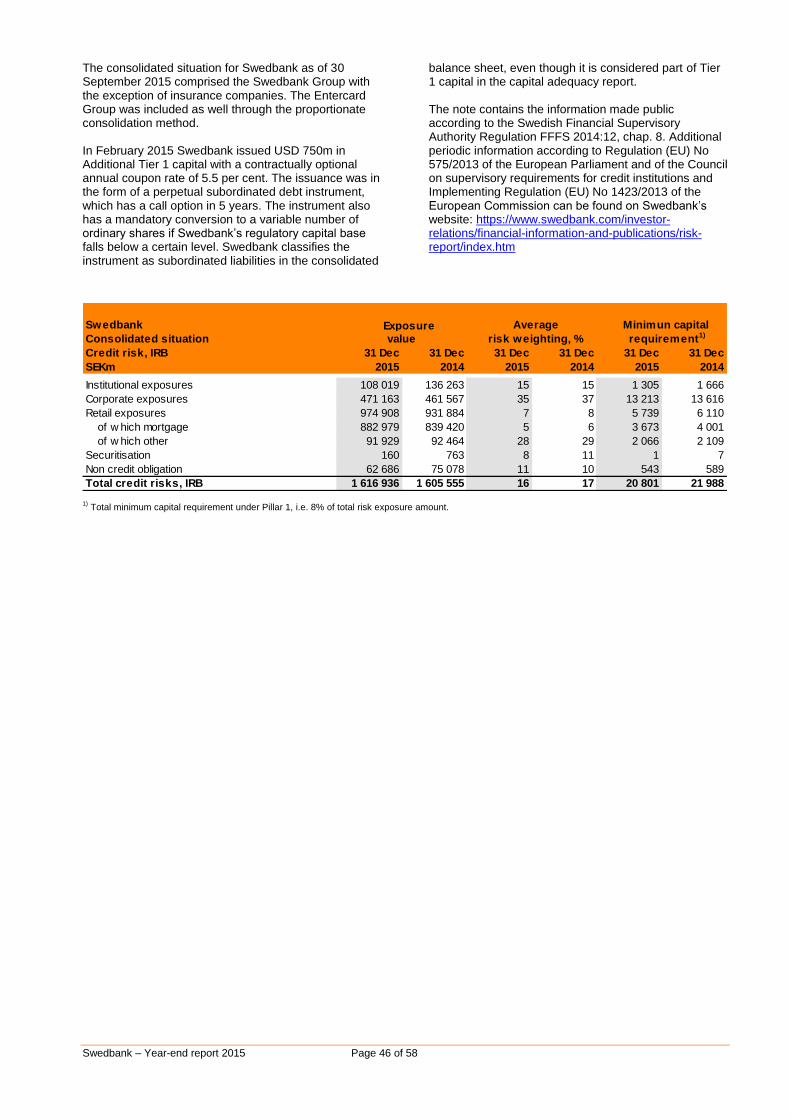
Swedbank – Year-end report 2015 Page 46 of 58
The consolidated situation for Swedbank as of 30 September 2015 comprised the Swedbank Group with the exception of insurance companies. The Entercard Group was included as well through the proportionate consolidation method. In February 2015 Swedbank issued USD 750m in Additional Tier 1 capital with a contractually optional annual coupon rate of 5.5 per cent. The issuance was in the form of a perpetual subordinated debt instrument, which has a call option in 5 years. The instrument also has a mandatory conversion to a variable number of ordinary shares if Swedbank’s regulatory capital base falls below a certain level. Swedbank classifies the instrument as subordinated liabilities in the consolidated
balance sheet, even though it is considered part of Tier 1 capital in the capital adequacy report. The note contains the information made public according to the Swedish Financial Supervisory Authority Regulation FFFS 2014:12, chap. 8. Additional periodic information according to Regulation (EU) No 575/2013 of the European Parliament and of the Council on supervisory requirements for credit institutions and Implementing Regulation (EU) No 1423/2013 of the European Commission can be found on Swedbank’s website: https://www.swedbank.com/investor-relations/financial-information-and-publications/risk-report/index.htm
Swedbank
Consolidated situation
Credit risk, IRB 31 Dec 31 Dec 31 Dec 31 Dec 31 Dec 31 Dec
SEKm 2015 2014 2015 2014 2015 2014
Institutional exposures 108 019 136 263 15 15 1 305 1 666
Corporate exposures 471 163 461 567 35 37 13 213 13 616
Retail exposures 974 908 931 884 7 8 5 739 6 110
of w hich mortgage 882 979 839 420 5 6 3 673 4 001
of w hich other 91 929 92 464 28 29 2 066 2 109
Securitisation 160 763 8 11 1 7
Non credit obligation 62 686 75 078 11 10 543 589
Total credit risks, IRB 1 616 936 1 605 555 16 17 20 801 21 988
requirement1) Exposure
value risk weighting, %
Average Minimun capital
1)
Total minimum capital requirement under Pillar 1, i.e. 8% of total risk exposure amount.
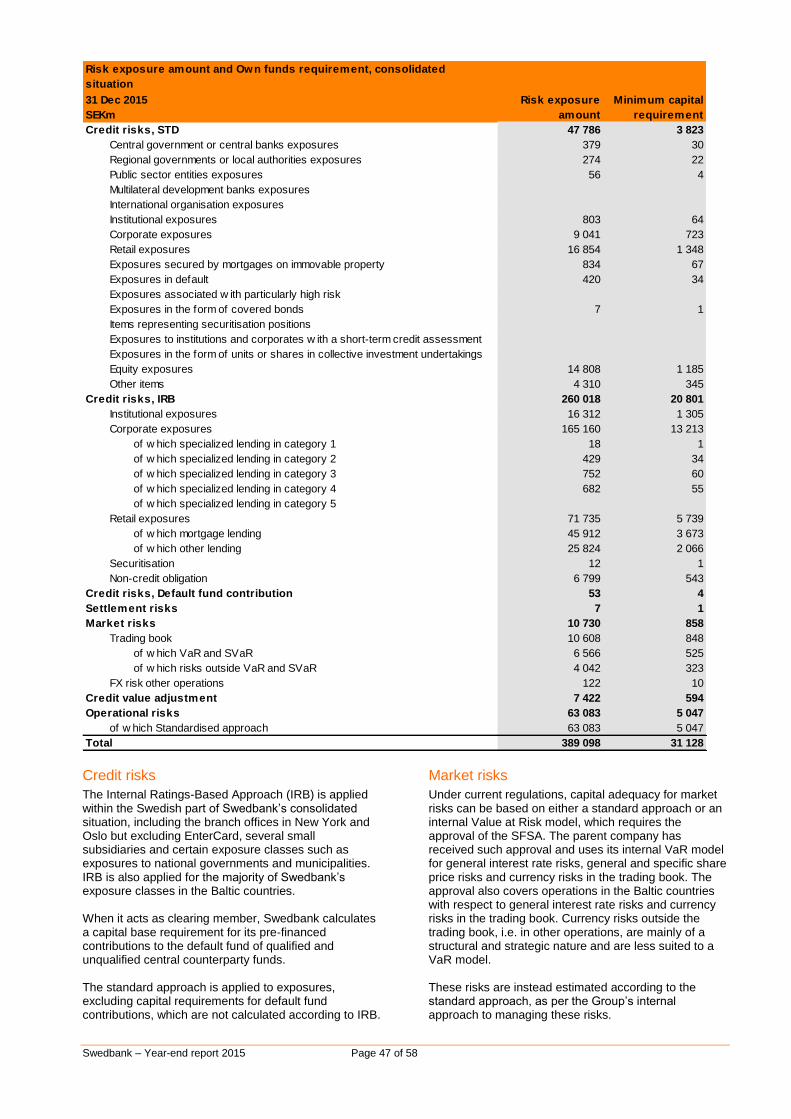
Swedbank – Year-end report 2015 Page 47 of 58
Risk exposure amount and Own funds requirement, consolidated
situation
31 Dec 2015
SEKm
Risk exposure
amount
Minimum capital
requirement
Credit risks, STD 47 786 3 823
Central government or central banks exposures 379 30
Regional governments or local authorities exposures 274 22
Public sector entities exposures 56 4
Multilateral development banks exposures 0 0
International organisation exposures 0 0
Institutional exposures 803 64
Corporate exposures 9 041 723
Retail exposures 16 854 1 348
Exposures secured by mortgages on immovable property 834 67
Exposures in default 420 34
Exposures associated w ith particularly high risk 0 0
Exposures in the form of covered bonds 7 1
Items representing securitisation positions 0 0
Exposures to institutions and corporates w ith a short-term credit assessment 0 0
Exposures in the form of units or shares in collective investment undertakings 0 0
Equity exposures 14 808 1 185
Other items 4 310 345
Credit risks, IRB 260 018 20 801
Institutional exposures 16 312 1 305
Corporate exposures 165 160 13 213
of w hich specialized lending in category 1 18 1
of w hich specialized lending in category 2 429 34
of w hich specialized lending in category 3 752 60
of w hich specialized lending in category 4 682 55
of w hich specialized lending in category 5 0 0
Retail exposures 71 735 5 739
of w hich mortgage lending 45 912 3 673
of w hich other lending 25 824 2 066
Securitisation 12 1
Non-credit obligation 6 799 543
Credit risks, Default fund contribution 53 4
Settlement risks 7 1
Market risks 10 730 858
Trading book 10 608 848
of w hich VaR and SVaR 6 566 525
of w hich risks outside VaR and SVaR 4 042 323
FX risk other operations 122 10
Credit value adjustment 7 422 594
Operational risks 63 083 5 047
of w hich Standardised approach 63 083 5 047
Total 389 098 31 128
Credit risks
The Internal Ratings-Based Approach (IRB) is applied within the Swedish part of Swedbank’s consolidated situation, including the branch offices in New York and Oslo but excluding EnterCard, several small subsidiaries and certain exposure classes such as exposures to national governments and municipalities. IRB is also applied for the majority of Swedbank’s exposure classes in the Baltic countries. When it acts as clearing member, Swedbank calculates a capital base requirement for its pre-financed contributions to the default fund of qualified and unqualified central counterparty funds. The standard approach is applied to exposures, excluding capital requirements for default fund contributions, which are not calculated according to IRB.
Market risks
Under current regulations, capital adequacy for market risks can be based on either a standard approach or an internal Value at Risk model, which requires the approval of the SFSA. The parent company has received such approval and uses its internal VaR model for general interest rate risks, general and specific share price risks and currency risks in the trading book. The approval also covers operations in the Baltic countries with respect to general interest rate risks and currency risks in the trading book. Currency risks outside the trading book, i.e. in other operations, are mainly of a structural and strategic nature and are less suited to a VaR model. These risks are instead estimated according to the standard approach, as per the Group’s internal approach to managing these risks.
Swedbank – Year-end report 2015 Page 48 of 58
Strategic currency risks mainly arise through risks associated with holdings in foreign operations.
Credit valuation adjustment The risk of a credit valuation adjustment is estimated according to the standard approach and was added after the implementation of the new EU regulation (CRR).
Operational risk
Swedbank calculates operational risk using the standard approach. SFSA has stated that Swedbank meets the qualitative requirements to apply this method.
Basel 1 floor
The transition rules state that the minimum capital requirement must not fall below 80 per cent of the requirement according to the Basel 1 rules.
Note 23 Internal capital requirement This note provides information on the internal capital assessment according to chapter 8, section 5 of the SFSA’s regulation on prudential requirements and capital buffers (2014:12). The internal capital assessment is published in the interim report according to chapter 8, section 4 of the SFSA’s regulation and general advice on annual reports from credit institutions and investment firms (2008:25). A bank must identify measure and have control over the risks with which its activities are associated and have sufficient capital to cover these risks. The purpose of the Internal Capital Adequacy Assessment process (ICAAP) is to ensure that the bank is sufficiently capitalised to cover its risks and to carry on and develop its activities. Swedbank applies its own models and processes to evaluate its capital requirements for all relevant risks. The models that serve as a basis for the internal capital assessment evaluate the need for economic capital over a one year horizon at a 99.9% confidence level for each type of risk. Diversification effects between various types of risks are not taken into account in the calculation of economic capital. As a complement to the economic capital calculation, scenario-based simulations and stress tests are conducted at least once a year. The analyses provide an overview of the most important risks Swedbank is exposed to by quantifying their impact on the income
statement and balance sheet as well as the capital base and risk-weighted assets. The purpose is to ensure efficient use of capital. The methodology serves as a basis of proactive risk and capital management. As of 31 December 2015 the internal capital assessment for Swedbank’s consolidated situation amounted to SEK 30.8bn (SEK 31.3bn as of 30 September). The capital to meet the internal capital assessment, i.e. the capital base, amounted to SEK 117.8bn (SEK 116.9bn as of 30 September) (see Note 22). Swedbank’s internal capital assessment with its own models is not comparable with the estimated capital requirement that the SFSA releases quarterly. The internally estimated capital requirement for the Parent Company is SEK 27.1bn (SEK 24.8bn as of 30 September) and the capital base is SEK 92.1bn (SEK 90.0bn as of 30 September) (see Note Capital adequacy for parent company). In addition to what is stated in this interim report, risk management and capital adequacy according to the Basel 3 framework are described in more detail in Swedbank’s annual report for 2014 as well as in Swedbank’s yearly Risk and Capital Adequacy Report, available on www.swedbank.com.
Note 24 Risks and uncertainties Swedbank’s earnings are affected by changes in the global marketplace over which it has no control, including macroeconomic factors such as GDP, asset prices and unemployment as well as changes in interest rates, equity prices and exchange rates.
In addition to what is stated in this interim report, detailed descriptions are provided in Swedbank’s 2014 annual report and in the annual disclosure on risk management and capital adequacy according to Basel 2 rules, available on www.swedbank.com.
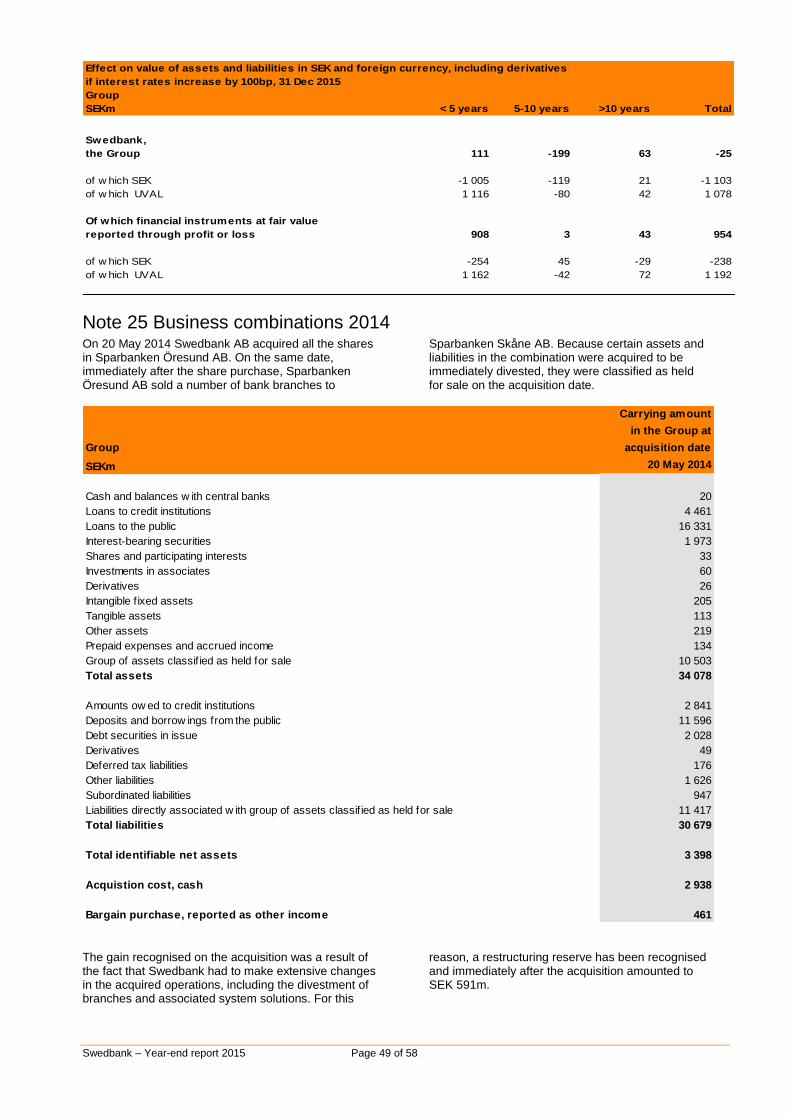
Swedbank – Year-end report 2015 Page 49 of 58
Effect on value of assets and liabilities in SEK and foreign currency, including derivatives
if interest rates increase by 100bp, 31 Dec 2015
Group
SEKm < 5 years 5-10 years >10 years Total
Swedbank,
the Group 111 -199 63 -25
of w hich SEK -1 005 -119 21 -1 103
of w hich UVAL 1 116 -80 42 1 078
Of which financial instruments at fair value
reported through profit or loss 908 3 43 954
of w hich SEK -254 45 -29 -238
of w hich UVAL 1 162 -42 72 1 192
Note 25 Business combinations 2014 On 20 May 2014 Swedbank AB acquired all the shares in Sparbanken Öresund AB. On the same date, immediately after the share purchase, Sparbanken Öresund AB sold a number of bank branches to
Sparbanken Skåne AB. Because certain assets and liabilities in the combination were acquired to be immediately divested, they were classified as held for sale on the acquisition date.
Carrying amount
in the Group at
Group acquisition date
SEKm 20 May 2014
Cash and balances w ith central banks 20
Loans to credit institutions 4 461
Loans to the public 16 331
Interest-bearing securities 1 973
Shares and participating interests 33
Investments in associates 60
Derivatives 26
Intangible f ixed assets 205
Tangible assets 113
Other assets 219
Prepaid expenses and accrued income 134
Group of assets classif ied as held for sale 10 503
Total assets 34 078
Amounts ow ed to credit institutions 2 841
Deposits and borrow ings from the public 11 596
Debt securities in issue 2 028
Derivatives 49
Deferred tax liabilities 176
Other liabilities 1 626
Subordinated liabilities 947
Liabilities directly associated w ith group of assets classif ied as held for sale 11 417
Total liabilities 30 679
Total identifiable net assets 3 398
Acquistion cost, cash 2 938
Bargain purchase, reported as other income 461 The gain recognised on the acquisition was a result of the fact that Swedbank had to make extensive changes in the acquired operations, including the divestment of branches and associated system solutions. For this
reason, a restructuring reserve has been recognised and immediately after the acquisition amounted to SEK 591m.
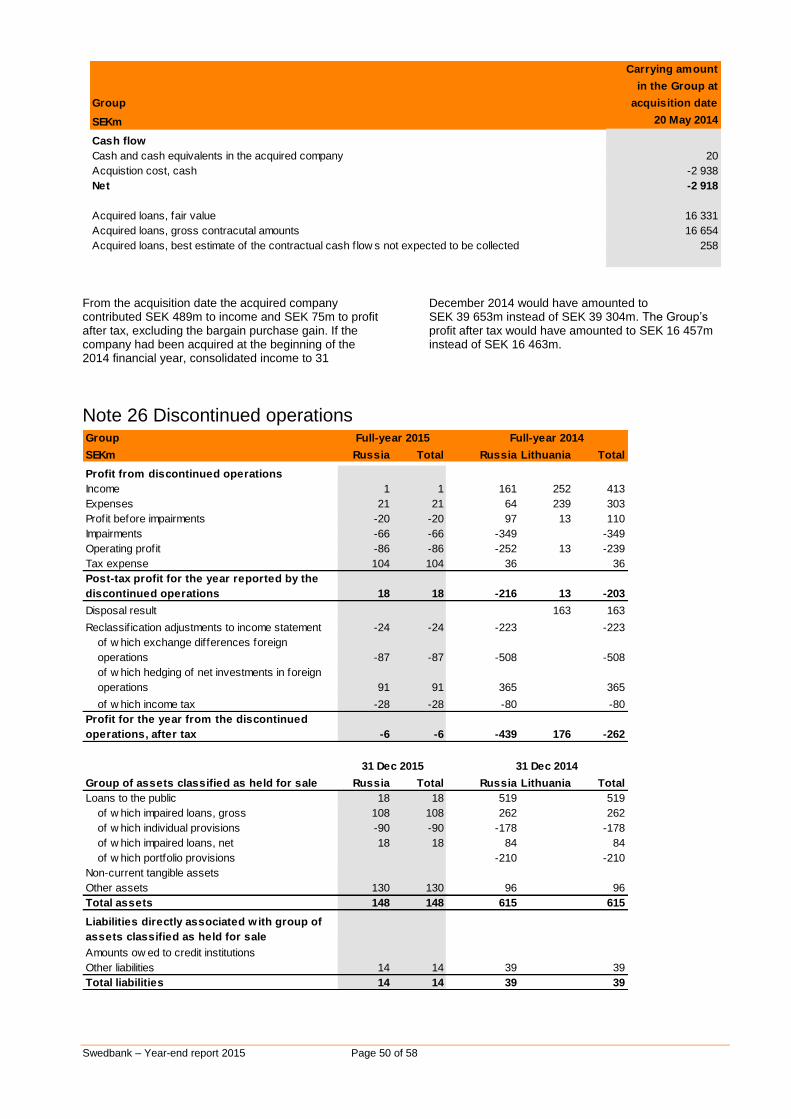
Swedbank – Year-end report 2015 Page 50 of 58
Carrying amount
in the Group at
Group acquisition date
SEKm 20 May 2014
Cash flow
Cash and cash equivalents in the acquired company 20
Acquistion cost, cash -2 938
Net -2 918
Acquired loans, fair value 16 331
Acquired loans, gross contracutal amounts 16 654
Acquired loans, best estimate of the contractual cash flow s not expected to be collected 258
From the acquisition date the acquired company contributed SEK 489m to income and SEK 75m to profit after tax, excluding the bargain purchase gain. If the company had been acquired at the beginning of the 2014 financial year, consolidated income to 31
December 2014 would have amounted to SEK 39 653m instead of SEK 39 304m. The Group’s profit after tax would have amounted to SEK 16 457m instead of SEK 16 463m.
Note 26 Discontinued operations Group
SEKm Russia Total Russia Lithuania Total
Profit from discontinued operations
Income 1 1 161 252 413
Expenses 21 21 64 239 303
Profit before impairments -20 -20 97 13 110
Impairments -66 -66 -349 0 -349
Operating profit -86 -86 -252 13 -239
Tax expense 104 104 36 0 36
Post-tax profit for the year reported by the
discontinued operations 18 18 -216 13 -203
Disposal result 0 0 0 163 163
Reclassif ication adjustments to income statement -24 -24 -223 0 -223
of w hich exchange differences foreign
operations -87 -87 -508 0 -508
of w hich hedging of net investments in foreign
operations 91 91 365 0 365
of w hich income tax -28 -28 -80 0 -80
Profit for the year from the discontinued
operations, after tax -6 -6 -439 176 -262
Group of assets classified as held for sale Russia Total Russia Lithuania Total
Loans to the public 18 18 519 0 519
of w hich impaired loans, gross 108 108 262 0 262
of w hich individual provisions -90 -90 -178 0 -178
of w hich impaired loans, net 18 18 84 0 84
of w hich portfolio provisions 0 0 -210 0 -210
Non-current tangible assets 0 0 0 0 0
Other assets 130 130 96 0 96
Total assets 148 148 615 0 615
Liabilities directly associated with group of
assets classified as held for sale
Amounts ow ed to credit institutions 0 0 0 0 0
Other liabilities 14 14 39 0 39
Total liabilities 14 14 39 0 39
Full-year 2015 Full-year 2014
31 Dec 2015 31 Dec 2014
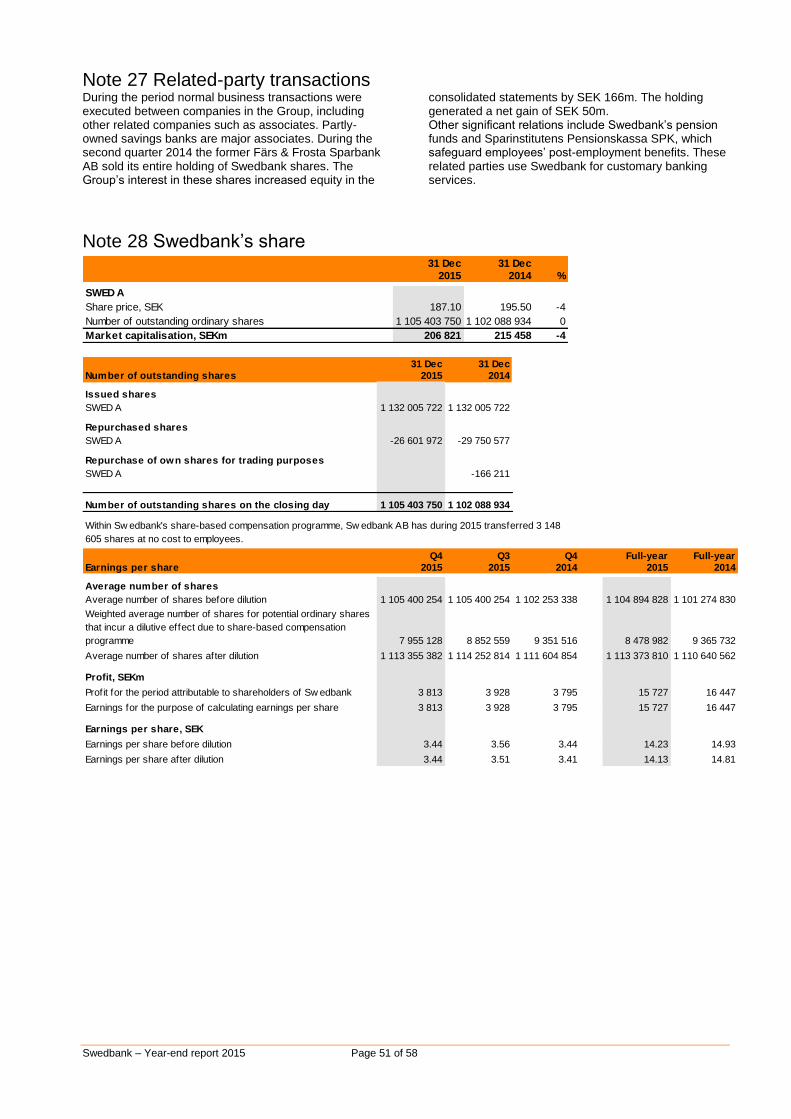
Swedbank – Year-end report 2015 Page 51 of 58
Note 27 Related-party transactions During the period normal business transactions were executed between companies in the Group, including other related companies such as associates. Partly-owned savings banks are major associates. During the second quarter 2014 the former Färs & Frosta Sparbank AB sold its entire holding of Swedbank shares. The Group’s interest in these shares increased equity in the
consolidated statements by SEK 166m. The holding generated a net gain of SEK 50m. Other significant relations include Swedbank’s pension funds and Sparinstitutens Pensionskassa SPK, which safeguard employees’ post-employment benefits. These related parties use Swedbank for customary banking services.
Note 28 Swedbank’s share 31 Dec 31 Dec
2015 2014 %
SWED A
Share price, SEK 187.10 195.50 -4
Number of outstanding ordinary shares 1 105 403 750 1 102 088 934 0
Market capitalisation, SEKm 206 821 215 458 -4
31 Dec 31 Dec
Number of outstanding shares 2015 2014
Issued shares
SWED A 1 132 005 722 1 132 005 722
Repurchased shares
SWED A -26 601 972 -29 750 577
Repurchase of own shares for trading purposes
SWED A 0 -166 211
Number of outstanding shares on the closing day 1 105 403 750 1 102 088 934
Q4 Q3 Q4 Full-year Full-year
Earnings per share 2015 2015 2014 2015 2014
Average number of shares
Average number of shares before dilution 1 105 400 254 1 105 400 254 1 102 253 338 1 104 894 828 1 101 274 830
Weighted average number of shares for potential ordinary shares
that incur a dilutive effect due to share-based compensation
programme 7 955 128 8 852 559 9 351 516 8 478 982 9 365 732
Average number of shares after dilution 1 113 355 382 1 114 252 814 1 111 604 854 1 113 373 810 1 110 640 562
Profit, SEKm
Profit for the period attributable to shareholders of Sw edbank 3 813 3 928 3 795 15 727 16 447
Earnings for the purpose of calculating earnings per share 3 813 3 928 3 795 15 727 16 447
Earnings per share, SEK
Earnings per share before dilution 3.44 3.56 3.44 14.23 14.93
Earnings per share after dilution 3.44 3.51 3.41 14.13 14.81
Within Sw edbank's share-based compensation programme, Sw edbank AB has during 2015 transferred 3 148
605 shares at no cost to employees.
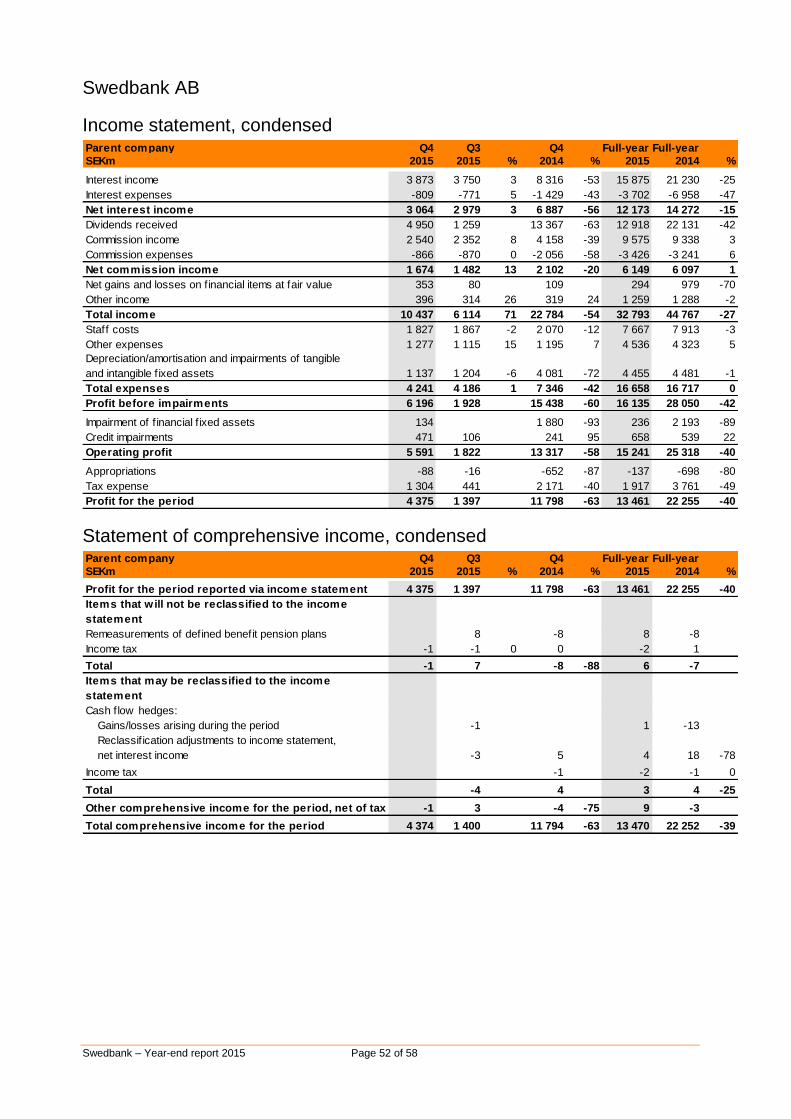
Swedbank – Year-end report 2015 Page 52 of 58
Swedbank AB
Income statement, condensed Parent company Q4 Q3 Q4 Full-year Full-year
SEKm 2015 2015 % 2014 % 2015 2014 %
Interest income 3 873 3 750 3 8 316 -53 15 875 21 230 -25
Interest expenses -809 -771 5 -1 429 -43 -3 702 -6 958 -47
Net interest income 3 064 2 979 3 6 887 -56 12 173 14 272 -15
Dividends received 4 950 1 259 13 367 -63 12 918 22 131 -42
Commission income 2 540 2 352 8 4 158 -39 9 575 9 338 3
Commission expenses -866 -870 0 -2 056 -58 -3 426 -3 241 6
Net commission income 1 674 1 482 13 2 102 -20 6 149 6 097 1
Net gains and losses on f inancial items at fair value 353 80 109 294 979 -70
Other income 396 314 26 319 24 1 259 1 288 -2
Total income 10 437 6 114 71 22 784 -54 32 793 44 767 -27
Staff costs 1 827 1 867 -2 2 070 -12 7 667 7 913 -3
Other expenses 1 277 1 115 15 1 195 7 4 536 4 323 5
Depreciation/amortisation and impairments of tangible
and intangible f ixed assets 1 137 1 204 -6 4 081 -72 4 455 4 481 -1
Total expenses 4 241 4 186 1 7 346 -42 16 658 16 717 0
Profit before impairments 6 196 1 928 15 438 -60 16 135 28 050 -42
Impairment of f inancial f ixed assets 134 0 1 880 -93 236 2 193 -89
Credit impairments 471 106 241 95 658 539 22
Operating profit 5 591 1 822 13 317 -58 15 241 25 318 -40
Appropriations -88 -16 -652 -87 -137 -698 -80
Tax expense 1 304 441 2 171 -40 1 917 3 761 -49
Profit for the period 4 375 1 397 11 798 -63 13 461 22 255 -40
Statement of comprehensive income, condensed Parent company Q4 Q3 Q4 Full-year Full-year
SEKm 2015 2015 % 2014 % 2015 2014 %
Profit for the period reported via income statement 4 375 1 397 11 798 -63 13 461 22 255 -40
Items that w ill not be reclassified to the income
statement
Remeasurements of defined benefit pension plans 0 8 -8 8 -8
Income tax -1 -1 0 0 -2 1
Total -1 7 -8 -88 6 -7
Items that may be reclassified to the income
statement
Cash flow hedges:
Gains/losses arising during the period 0 -1 0 1 -13
Reclassif ication adjustments to income statement,
net interest income 0 -3 5 4 18 -78
Income tax 0 0 -1 -2 -1 0
Total 0 -4 4 3 4 -25
Other comprehensive income for the period, net of tax -1 3 -4 -75 9 -3
Total comprehensive income for the period 4 374 1 400 11 794 -63 13 470 22 252 -39
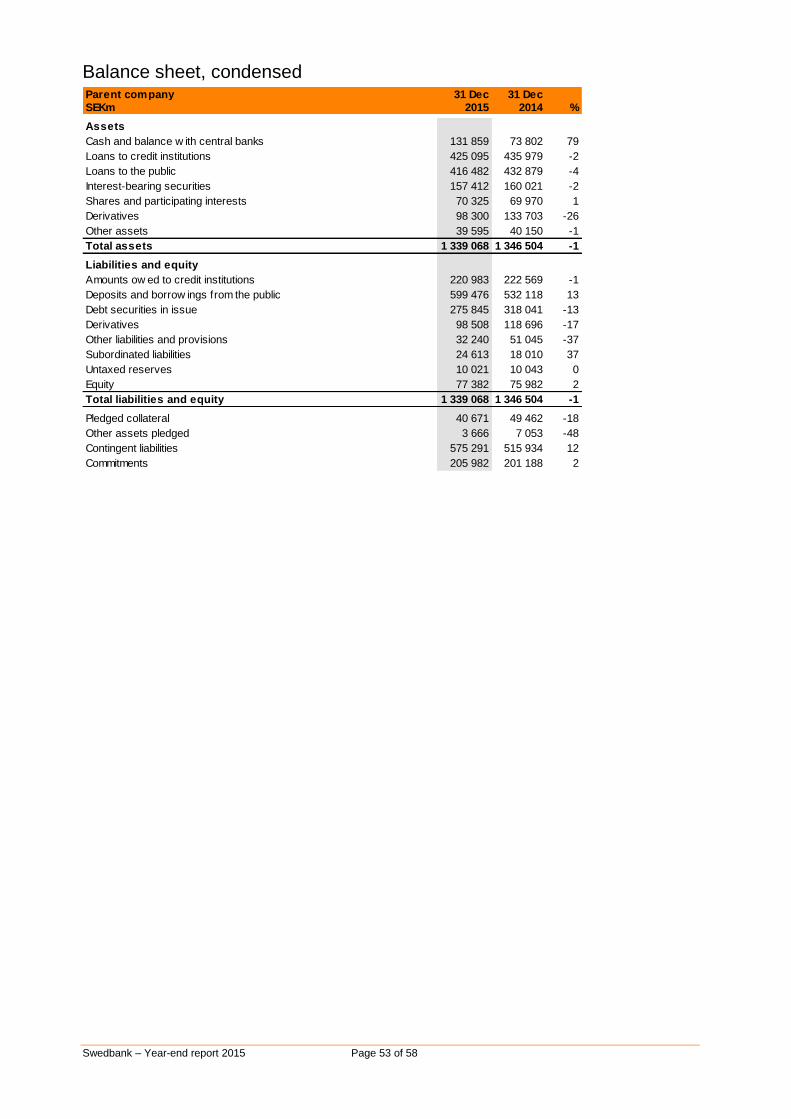
Swedbank – Year-end report 2015 Page 53 of 58
Balance sheet, condensed Parent company 31 Dec 31 Dec
SEKm 2015 2014 %
Assets
Cash and balance w ith central banks 131 859 73 802 79
Loans to credit institutions 425 095 435 979 -2
Loans to the public 416 482 432 879 -4
Interest-bearing securities 157 412 160 021 -2
Shares and participating interests 70 325 69 970 1
Derivatives 98 300 133 703 -26
Other assets 39 595 40 150 -1
Total assets 1 339 068 1 346 504 -1
Liabilities and equity
Amounts ow ed to credit institutions 220 983 222 569 -1
Deposits and borrow ings from the public 599 476 532 118 13
Debt securities in issue 275 845 318 041 -13
Derivatives 98 508 118 696 -17
Other liabilities and provisions 32 240 51 045 -37
Subordinated liabilities 24 613 18 010 37
Untaxed reserves 10 021 10 043 0
Equity 77 382 75 982 2
Total liabilities and equity 1 339 068 1 346 504 -1
Pledged collateral 40 671 49 462 -18
Other assets pledged 3 666 7 053 -48
Contingent liabilities 575 291 515 934 12
Commitments 205 982 201 188 2
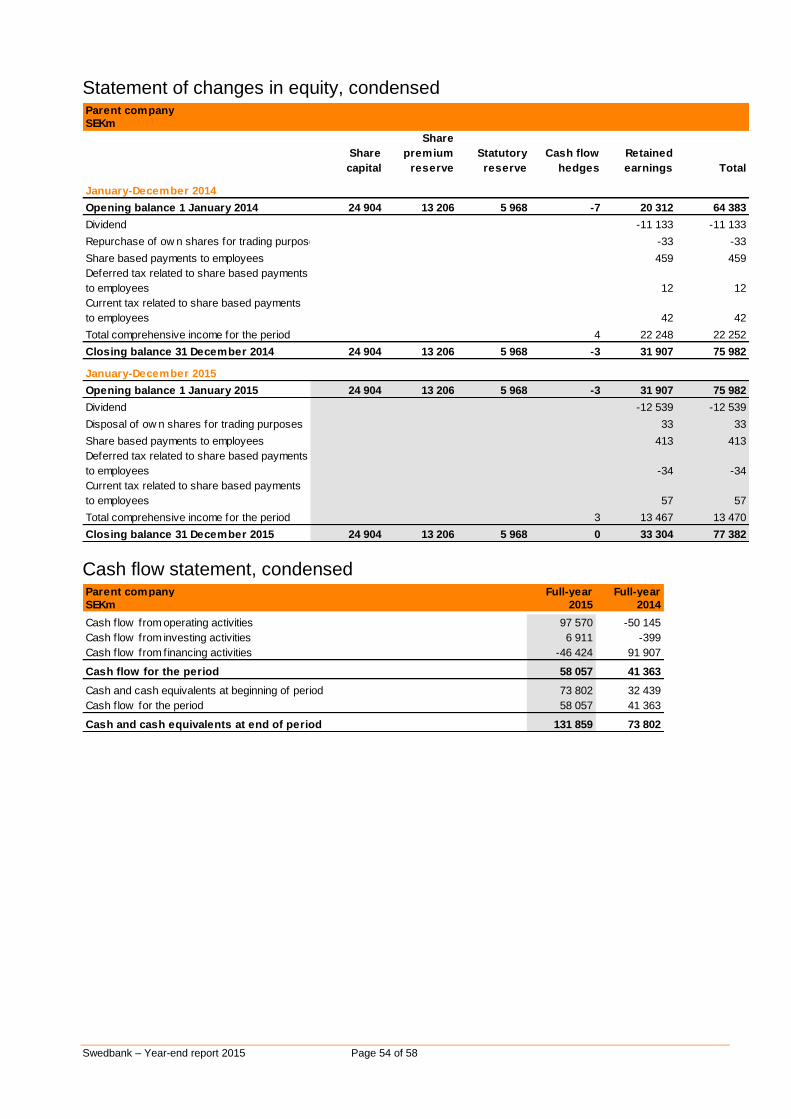
Swedbank – Year-end report 2015 Page 54 of 58
Statement of changes in equity, condensed Parent company
SEKm
Share
capital
Share
premium
reserve
Statutory
reserve
Cash flow
hedges
Retained
earnings Total
January-December 2014
Opening balance 1 January 2014 24 904 13 206 5 968 -7 20 312 64 383
Dividend 0 0 0 0 -11 133 -11 133
Repurchase of ow n shares for trading purposes 0 0 0 0 -33 -33
Share based payments to employees 0 0 0 0 459 459
Deferred tax related to share based payments
to employees 0 0 0 0 12 12
Current tax related to share based payments
to employees 0 0 0 0 42 42
Total comprehensive income for the period 0 0 0 4 22 248 22 252
Closing balance 31 December 2014 24 904 13 206 5 968 -3 31 907 75 982
January-December 2015
Opening balance 1 January 2015 24 904 13 206 5 968 -3 31 907 75 982
Dividend 0 0 0 0 -12 539 -12 539
Disposal of ow n shares for trading purposes 0 0 0 0 33 33
Share based payments to employees 0 0 0 0 413 413
Deferred tax related to share based payments
to employees 0 0 0 0 -34 -34
Current tax related to share based payments
to employees 0 0 0 0 57 57
Total comprehensive income for the period 0 0 0 3 13 467 13 470
Closing balance 31 December 2015 24 904 13 206 5 968 0 33 304 77 382
Cash flow statement, condensed Parent company Full-year Full-year
SEKm 2015 2014
Cash flow from operating activities 97 570 -50 145
Cash flow from investing activities 6 911 -399
Cash flow from financing activities -46 424 91 907
Cash flow for the period 58 057 41 363
Cash and cash equivalents at beginning of period 73 802 32 439
Cash flow for the period 58 057 41 363
Cash and cash equivalents at end of period 131 859 73 802
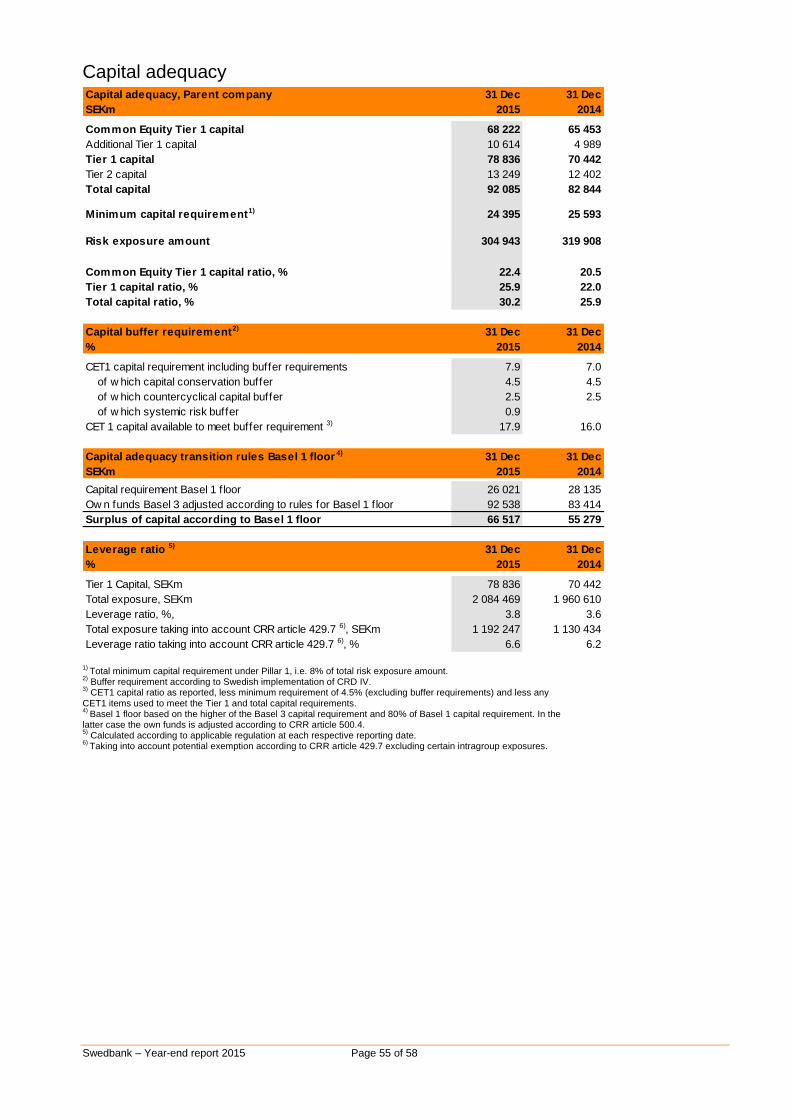
Swedbank – Year-end report 2015 Page 55 of 58
Capital adequacy Capital adequacy, Parent company 31 Dec 31 Dec
SEKm 2015 2014
Common Equity Tier 1 capital 68 222 65 453
Additional Tier 1 capital 10 614 4 989
Tier 1 capital 78 836 70 442
Tier 2 capital 13 249 12 402
Total capital 92 085 82 844
Minimum capital requirement1) 24 395 25 593
Risk exposure amount 304 943 319 908
Common Equity Tier 1 capital ratio, % 22.4 20.5
Tier 1 capital ratio, % 25.9 22.0
Total capital ratio, % 30.2 25.9
Capital buffer requirement2) 31 Dec 31 Dec
% 2015 2014
CET1 capital requirement including buffer requirements 7.9 7.0
of w hich capital conservation buffer 4.5 4.5
of w hich countercyclical capital buffer 2.5 2.5
of w hich systemic risk buffer 0.9 0.0
CET 1 capital available to meet buffer requirement 3) 17.9 16.0
Capital adequacy transition rules Basel 1 floor 4) 31 Dec 31 Dec
SEKm 2015 2014
Capital requirement Basel 1 f loor 26 021 28 135
Ow n funds Basel 3 adjusted according to rules for Basel 1 f loor 92 538 83 414
Surplus of capital according to Basel 1 floor 66 517 55 279
Leverage ratio 5) 31 Dec 31 Dec
% 2015 2014
Tier 1 Capital, SEKm 78 836 70 442
Total exposure, SEKm 2 084 469 1 960 610
Leverage ratio, %, 3.8 3.6
Total exposure taking into account CRR article 429.7 6), SEKm 1 192 247 1 130 434
Leverage ratio taking into account CRR article 429.7 6), % 6.6 6.2
1) Total minimum capital requirement under Pillar 1, i.e. 8% of total risk exposure amount.
2) Buffer requirement according to Swedish implementation of CRD IV.
3) CET1 capital ratio as reported, less minimum requirement of 4.5% (excluding buffer requirements) and less any
CET1 items used to meet the Tier 1 and total capital requirements. 4)
Basel 1 floor based on the higher of the Basel 3 capital requirement and 80% of Basel 1 capital requirement. In the latter case the own funds is adjusted according to CRR article 500.4. 5)
Calculated according to applicable regulation at each respective reporting date. 6)
Taking into account potential exemption according to CRR article 429.7 excluding certain intragroup exposures.
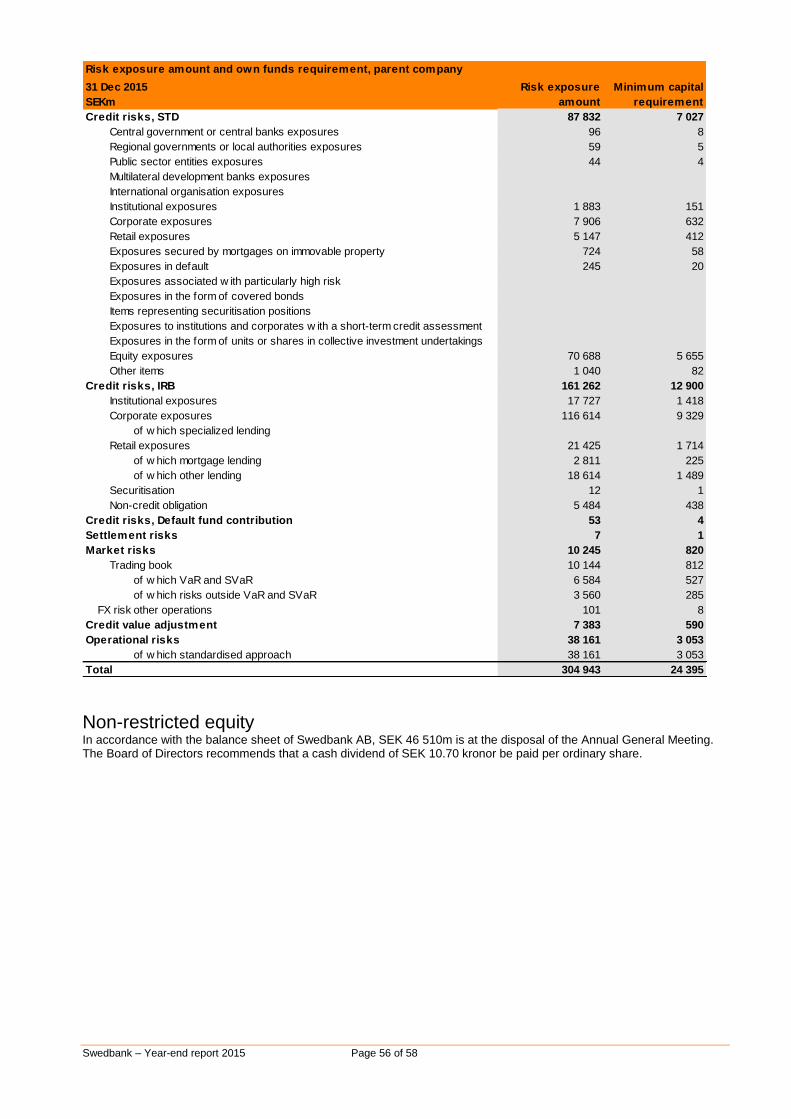
Swedbank – Year-end report 2015 Page 56 of 58
Risk exposure amount and own funds requirement, parent company
31 Dec 2015
SEKm
Risk exposure
amount
Minimum capital
requirement
Credit risks, STD 87 832 7 027
Central government or central banks exposures 96 8
Regional governments or local authorities exposures 59 5
Public sector entities exposures 44 4
Multilateral development banks exposures 0 0
International organisation exposures 0 0
Institutional exposures 1 883 151
Corporate exposures 7 906 632
Retail exposures 5 147 412
Exposures secured by mortgages on immovable property 724 58
Exposures in default 245 20
Exposures associated w ith particularly high risk 0 0
Exposures in the form of covered bonds 0 0
Items representing securitisation positions 0 0
Exposures to institutions and corporates w ith a short-term credit assessment 0 0
Exposures in the form of units or shares in collective investment undertakings 0 0
Equity exposures 70 688 5 655
Other items 1 040 82
Credit risks, IRB 161 262 12 900
Institutional exposures 17 727 1 418
Corporate exposures 116 614 9 329
of w hich specialized lending 0 0
Retail exposures 21 425 1 714
of w hich mortgage lending 2 811 225
of w hich other lending 18 614 1 489
Securitisation 12 1
Non-credit obligation 5 484 438
Credit risks, Default fund contribution 53 4
Settlement risks 7 1
Market risks 10 245 820
Trading book 10 144 812
of w hich VaR and SVaR 6 584 527
of w hich risks outside VaR and SVaR 3 560 285
FX risk other operations 101 8
Credit value adjustment 7 383 590
Operational risks 38 161 3 053
of w hich standardised approach 38 161 3 053
Total 304 943 24 395
Non-restricted equity In accordance with the balance sheet of Swedbank AB, SEK 46 510m is at the disposal of the Annual General Meeting. The Board of Directors recommends that a cash dividend of SEK 10.70 kronor be paid per ordinary share.
Swedbank – Year-end report 2015 Page 57 of 58
Signatures of the Board of Directors and the President The Board of Directors and the President certify that the year-end report for 2015 provides a fair and accurate overview of the operations, position and results of the parent company and the Group and describes the significant risks and uncertainties faced by the parent company and the companies in the Group. Stockholm, 1 February 2016 Anders Sundström Lars Idermark Chair Deputy Chair Ulrika Francke Göran Hedman Anders Igel Board Member Board Member Board Member Pia Rudengren Karl-Henrik Sundström Siv Svensson Board Member Board Member Board Member Maj-Charlotte Wallin Camilla Linder Roger Ljung Board Member Board Member Board Member Employee Representative Employee Representative Michael Wolf President
Review report Introduction
We have reviewed the year-end report for Swedbank AB (publ) for 2015. The Board of Directors and the President are responsible for the preparation and presentation of this year-end report in accordance with IAS 34 and the Annual Accounts Act for Credit Institutions and Securities Companies. Our responsibility is to express a conclusion on this interim report based on our review.
Scope of review
We conducted our review in accordance with the International Standard on Review Engagements (ISRE) 2410 Review of Interim Financial Information performed by the company’s auditors. A review consists of making inquiries, primarily with persons responsible for financial and accounting matters, and applying analytical and other review procedures. A review is substantially less in scope than an audit conducted in accordance with ISA and other generally accepted auditing practices. The procedures performed in a review do not enable us to obtain a level of assurance that would make us aware of all significant matters that might be identified in an audit. Therefore, the conclusion expressed based on a review does not give the same level of assurance as a conclusion expressed based on an audit. Conclusion
Based on our review, nothing has come to our attention that causes us to believe that the year-end report for the Group is not, in all material aspects, in accordance with IAS 34 and the Annual Accounts Act for Credit Institutions and Securities Companies and as regards the parent company in accordance the Annual Accounts Act for Credit Institutions and Securities Companies.
Stockholm, 2 February 2016 Deloitte AB
Svante Forsberg Authorised Public Accountant
Swedbank – Year-end report 2015 Page 58 of 58
Publication of financial information The Group’s financial reports can be found on www.swedbank.com/ir Financial calendar 2016
Annual report published on the website 25 February 2016 Annual General Meeting 5 April 2016 Interim report for the first quarter 26 April 2016 Interim report for the second quarter 18 July 2016 Interim report for the third quarter 25 October 2016
For further information, please contact: Michael Wolf President and CEO Telephone +46 8 585 926 66
Göran Bronner CFO Telephone +46 8 585 906 67
Gregori Karamouzis Head of Investor Relations Telephone +46 8 585 930 31 +46 72 740 63 38
Cecilia Hernqvist Head of Communications Telephone +46 8 585 907 41
Claes Warrén Press Officer Telephone +46 8 585 926 11 +46 70 375 00 54
Information on Swedbank’s strategy, values and share is also available on www.swedbank.com
Swedbank AB (publ)
Registration no. 502017-7753 Landsvägen 40 SE-105 34 Stockholm, Sweden Telephone +46 8 585 900 00 www.swedbank.com [email protected]