Embed Size (px)
Citation preview

VI-207: Beyond the Basics with Vision Project Reporting
Insight 2011Presented byAllen Hibner, Deltek Inc.

April 18, 20232 Copyright © 2011 Deltek, Inc.
Introduction
Speaker: Allen Hibner, Senior Instructor - Deltek University.
Deltek Experience: Four Years of Deltek Vision Training Experience. Over Twenty-Seven Years of Industry Experience.
Deltek University Reporting Training Experience: Currently the Primary Deltek University Instructor Delivering Vision
Report Writing and Business Intelligence Reporting Classes.

April 18, 20233 Copyright © 2011 Deltek, Inc.
Agenda
Adding Calculated and Conditional Report Columns. Search for and Download Report Output in Preview Mode. Using Smart Grids for Project Reporting. Populating User-Defined Fields for Report Filtering Using Workflow. Creating Project Top-Bottom Performer Reports. Adding User Interactivity to Project Reports with Report Builder. Using Report Designer for Advanced Project Reporting. Other Project Reporting Options. Session Quick Review. Next Steps. Q&A.

April 18, 20234 Copyright © 2011 Deltek, Inc.
Key Session Takeaways
Learn How To: Illustrate what projects are in trouble and make them easy to find in your project
reports. Search report results in the preview window and download specific data to Microsoft
Excel® for further analysis. Use Smart Client technology to improve emailing and exporting of project report data in
the project info center grid view. Populate user-defined fields with financial data that will allow you to select project
records for project reports based on those field values. Pinpoint, analyze, and manage the best and worst performers in an organization. Create and preview a single report with both summary and detailed views. Add user selectable multi-value report parameter drop down lists to table, chart and
matrix reports in Vision’s report preview mode. Use interactive sorting with table reports in Vision’s preview mode. Use Report Designer to join tables across info centers and add new fields to custom
project reports.

April 18, 2023 Copyright © 2011 Deltek, Inc.5
Adding Calculated and Conditional Report Columns
April 18, 20236 Copyright © 2011 Deltek, Inc.
Adding Calculated and Conditional Report Columns
Business Case: Illustrate what projects are in trouble and make them easy to find in your
project reports.
What Will be Demonstrated: Calculated Columns. Conditional Columns.

April 18, 20237 Copyright © 2011 Deltek, Inc.
Adding Calculated and Conditional Report Columns (cont’d)Calculated Column
Add Calculated Field — Webpage Dialog

8 Copyright © 2011 Deltek, Inc.
Adding Calculated and Conditional Report Columns (cont’d)
Calculated Column

April 18, 20239 Copyright © 2011 Deltek, Inc.
Adding Calculated and Conditional Report Columns (cont’d) Modify Calculated Field — Webpage Dialog
Conditional Column

April 18, 202310 Copyright © 2011 Deltek, Inc.
Adding Calculated and Conditional Report Columns (cont’d)
Conditional Column

April 18, 2023 Copyright © 2011 Deltek, Inc.11
Search for and Download Report Output in Preview Mode

April 18, 202312 Copyright © 2011 Deltek, Inc.
Search for and Download Report Output in Preview ModeBusiness Case:
Search report results and download specific data to Microsoft Excel for further analysis.
What Will be Demonstrated: Review Standard Vision Report Output. Search Columns Within the Report for Specific Data. Download Search Results to Excel.

13
Search for and Download Report Output in Preview Mode (cont’d)
Copyright © 2011 Deltek, Inc.
Review Report Output

April 18, 2023 Copyright © 2011 Deltek, Inc.
Search for and Download Report Output in Preview Mode (cont’d)
14
Search Columns for Specific Data

April 18, 202315 Copyright © 2011 Deltek, Inc.
Search for and Download Report Output in Preview Mode (cont’d) Download Search
Results to Excel

April 18, 2023
Using Smart Grids for Project Reporting
Copyright © 2011 Deltek, Inc.16

April 18, 202317 Copyright © 2011 Deltek, Inc.
Using Smart Grids for Project Reporting
Business Case: Use Smart Client technology grid control to improve emailing and exporting
of project report data in the project info center grid view.
What Will be Demonstrated: Filters Can Now Be Applied to the Columns in a Grid. Hierarchical Grouping Views of Data Rows Can Be Established. Grid Can Be Exported to Excel or Printed as It Appears on Screen. Grid “Snapshots” Can Be Pasted into an Email or Other Document.

April 18, 202318 Copyright © 2011 Deltek, Inc.
Using Smart Grids for Project Reporting (cont’d)
Filters Can Now Be Applied to the
Columns in a Grid

April 18, 202319 Copyright © 2011 Deltek, Inc.
Using Smart Grids for Project Reporting (cont’d)
Hierarchical Views of Data Rows in the Grid Can Be
Established

April 18, 202320 Copyright © 2011 Deltek, Inc.
Using Smart Grids for Project Reporting (cont’d)
Grid Can be Exported to Excel or Printed as It
Appears on the Screen

April 18, 202321 Copyright © 2011 Deltek, Inc.
Using Smart Grids for Project Reporting (cont’d)
Grid “Snapshots” Can Be Pasted into Email or
Other Documents

April 18, 2023 Copyright © 2011 Deltek, Inc.22
Populating User-Defined Fields for Report Filtering Using Workflow

April 18, 202323 Copyright © 2011 Deltek, Inc.
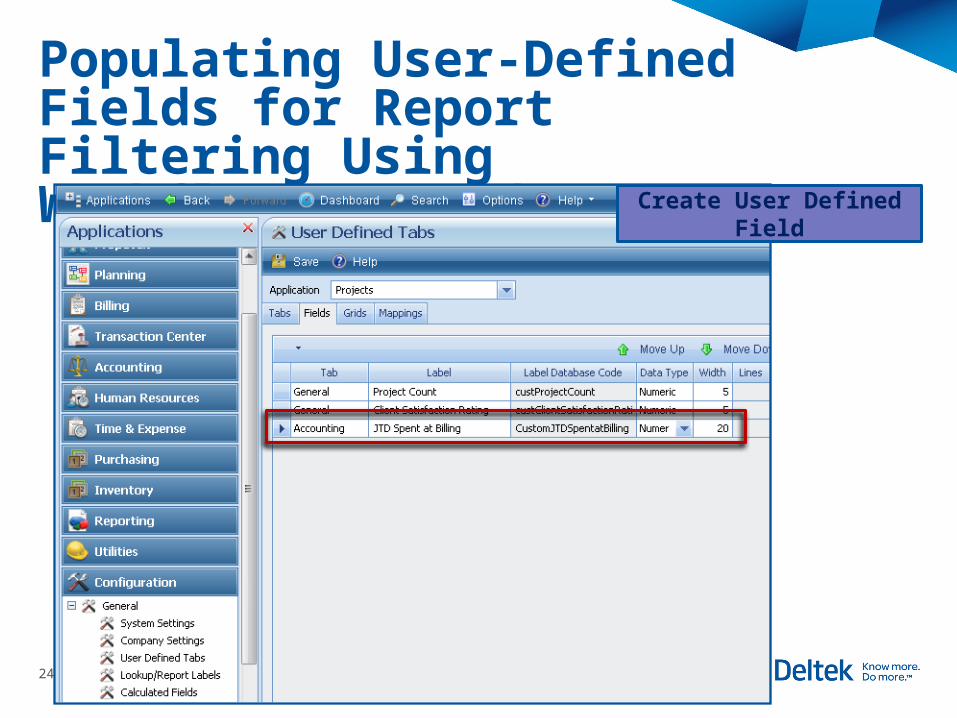
Populating User-Defined Fields for Report Filtering Using WorkflowBusiness Case:
Populate user-defined fields with financial data that will allow you to select project records for project reports based on those fields.
What Will be Demonstrated: Create User-Defined Field. Schedule and Run PR Summary Table Update. Create and Schedule Workflow. Create Report Selection.
April 18, 202324 Copyright © 2011 Deltek, Inc.
Populating User-Defined Fields for Report Filtering Using Workflow (cont’d)
Create User Defined Field

Populating User-Defined Fields for Report Filtering Using Workflow (cont’d)
25 Copyright © 2011 Deltek, Inc.
Schedule and Run PR Summary Table Update

April 18, 202326 Copyright © 2011 Deltek, Inc.
Populating User-Defined Fields for Report Filtering Using Workflow (cont’d)
Create and Schedule Workflow

April 18, 202327 Copyright © 2011 Deltek, Inc.
Populating User-Defined Fields for Report Filtering Using Workflow (cont’d)
SQL Expression Builder – Webpage Dialog
Create and Schedule Workflow

April 18, 202328 Copyright © 2011 Deltek, Inc.
Populating User-Defined Fields for Report Filtering Using Workflow (cont’d)
Project Lookup – Webpage Dialog
Create Report Selection

April 18, 202329 Copyright © 2011 Deltek, Inc.
Creating Project Top-Bottom Performer Reports
Business Case: Pinpoint, analyze, and manage the best and worst performers in an
organization.
What Will be Demonstrated: Use of the Project Top-Bottom Performers report to do the following:
Analyze the performance of projects, principals, project managers, or supervisors.
Review key financial metrics by client. Display results graphically in reports and on the Dashboard.

April 18, 202330 Copyright © 2011 Deltek, Inc.
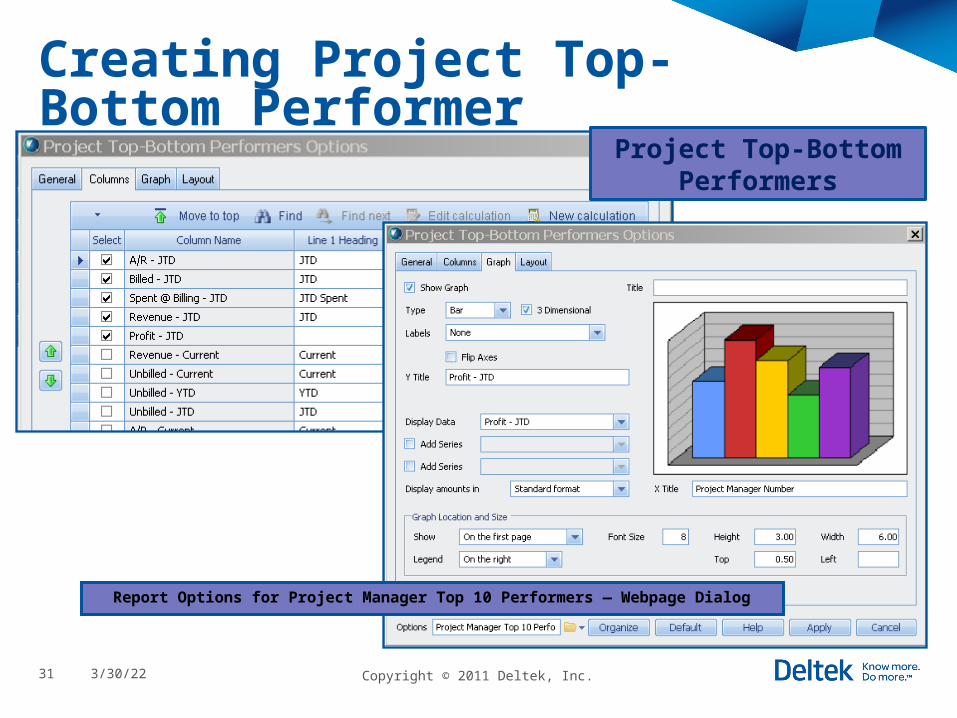
Creating Project Top-Bottom Performer Reports (cont’d)
Project Top-Bottom Performers
Report Options for Project Manager Top 10 Performers – Webpage Dialog
Project Top-Bottom Performers
April 18, 202331 Copyright © 2011 Deltek, Inc.
Creating Project Top-Bottom Performer Reports (cont’d)
Report Options for Project Manager Top 10 Performers — Webpage Dialog
Project Top-Bottom Performers
April 18, 202332 Copyright © 2011 Deltek, Inc.
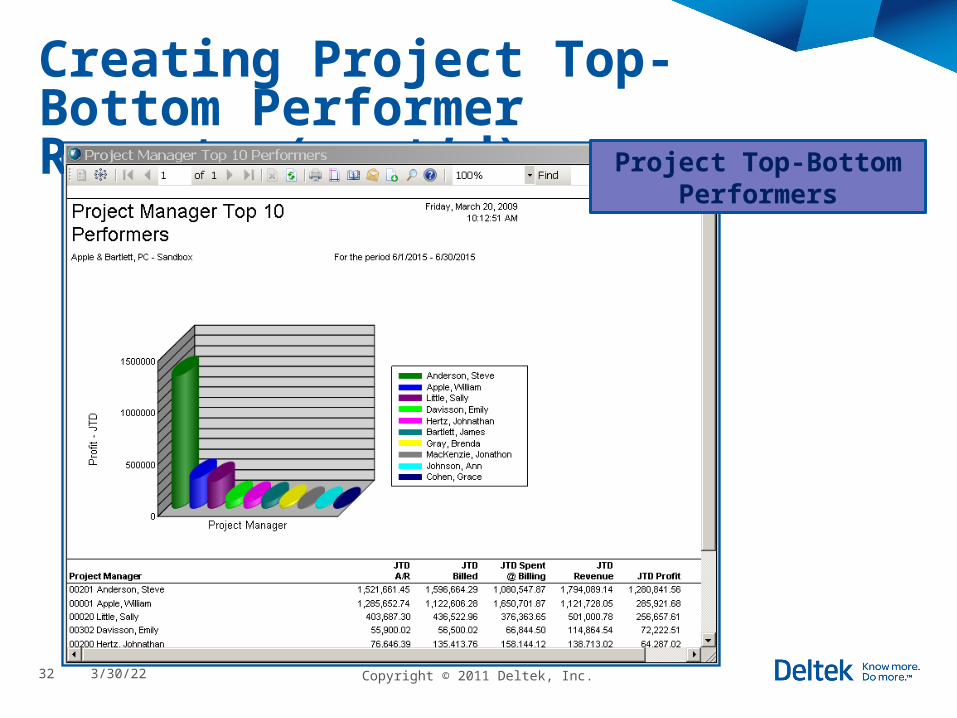
Creating Project Top-Bottom Performer Reports (cont’d)
Project Top-Bottom Performers

April 18, 2023 Copyright © 2011 Deltek, Inc.33
Adding User Interactivity to Reports with Report Builder

April 18, 202334 Copyright © 2011 Deltek, Inc.
Adding User Interactivity to Project Reports with Report BuilderBusiness Case:
Allow Vision report users more interactive control when previewing reports. Create and preview a single report with summary and detailed views. Use interactive sorting with table reports in Vision’s preview mode. Add user selectable multi-value report parameter drop down lists to
table, chart and matrix reports in Vision’s preview mode.
What Will be Demonstrated: Collapse/Expand.
Standard Vision Reports. Report Builder Matrix (Cross Tab) Reports.
Report Builder Interactive Sorting. Report Builder Prompting - Interactive Filtering.

April 18, 202335 Copyright © 2011 Deltek, Inc.
Adding User Interactivity to Project Reports with Report Builder (cont’d) Collapse/Expand
Standard Vision Reports

April 18, 202336 Copyright © 2011 Deltek, Inc.
Adding User Interactivity to Project Reports with Report Builder (cont’d)
Standard Vision Reports - Collapsed
Collapse/Expand

April 18, 202337 Copyright © 2011 Deltek, Inc.
Adding User Interactivity to Project Reports with Report Builder (cont’d)
Standard Vision Reports - Expanded
Collapse/Expand

April 18, 2023
Adding User Interactivity to Project Reports with Report Builder (cont’d)
38 Copyright © 2011 Deltek, Inc.
Report Builder Matrix (Cross Tab) Reports
Collapse/Expand

April 18, 202339 Copyright © 2011 Deltek, Inc.
Adding User Interactivity to Project Reports with Report Builder (cont’d)
Collapse/Expand
Report Builder Matrix (Cross Tab) Report - Collapsed

April 18, 202340 Copyright © 2011 Deltek, Inc.
Adding User Interactivity to Project Reports with Report Builder (cont’d)
Collapse/Expand
Report Builder Matrix (Cross Tab) Report - Expanded

April 18, 2023
Adding User Interactivity to Project Reports with Report Builder (cont’d)
41 Copyright © 2011 Deltek, Inc.
Report Builder Table Report – Ascending Sort – Project Type
Report Builder Interactive Sorting

April 18, 202342 Copyright © 2011 Deltek, Inc.
Adding User Interactivity to Project Reports with Report Builder (cont’d)
Report Builder Interactive Sorting
Report Builder Table Report – Descending Sort – Project Type

April 18, 202343 Copyright © 2011 Deltek, Inc.
Adding User Interactivity to Project Reports with Report Builder (cont’d)
Report Builder Prompting – Interactive Filtering
Report Builder Chart Report – User Prompt for Organization(s)

April 18, 202344 Copyright © 2011 Deltek, Inc.
Adding User Interactivity to Project Reports with Report Builder (cont’d)
Report Builder Prompting – Interactive Filtering
Report Builder Chart Report – User Prompt for Organization(s)

April 18, 202345 Copyright © 2011 Deltek, Inc.
Adding User Interactivity to Project Reports with Report Builder (cont’d)
Report Builder Chart Report – Drill Down to Detail
Report Builder Prompting – Interactive Filtering

April 18, 2023 Copyright © 2011 Deltek, Inc.46
Using Report Designer for Advanced Project Reporting

April 18, 202347 Copyright © 2011 Deltek, Inc.
Using Report Designer for Advanced Project Reporting
Business Case: Customize existing standard Vision project reports to meet specific firm
requirements using Microsoft® SQL Server® Reporting Services – Vision Report Designer.
What Will be Demonstrated: Joining Tables and Adding Fields that Cross Info Centers, into a report.
Import the standard Vision Project Earnings report into Report Designer. Add to the SQL Query to join the Billing Terms table and Billing Terms
fields to this report’s existing dataset. Drag Billing Term fields into this Project Earnings report on the Layout
tab. Preview the report on the Preview tab of Report Designer. Import the finished customized report back into Vision.

April 18, 2023
Using Report Designer for Advanced Project Reporting (cont’d)
Import the standard Vision Project Earnings report into Report Designer
Join Tables and Add Fields that Cross Info Centers
48 Copyright © 2011 Deltek, Inc.
April 18, 202349 Copyright © 2011 Deltek, Inc.
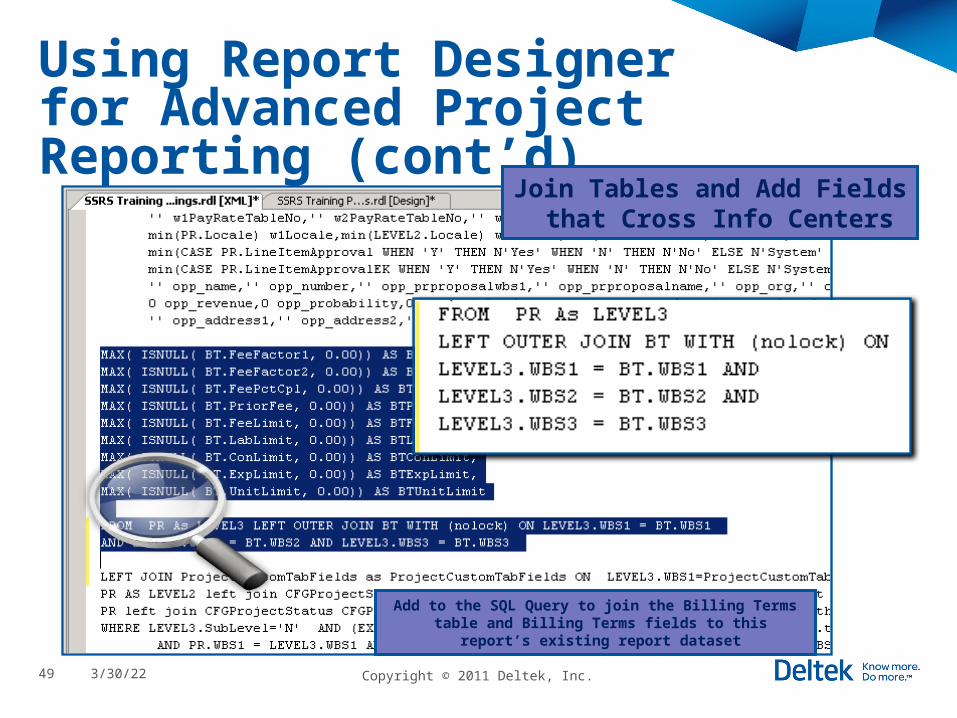
Using Report Designer for Advanced Project Reporting (cont’d)
Join Tables and Add Fields that Cross Info Centers
Add to the SQL Query to join the Billing Terms table and Billing Terms fields to this report’s existing report
dataset

April 18, 202350 Copyright © 2011 Deltek, Inc.
Using Report Designer for Advanced Project Reporting (cont’d)
Drag Billing Term fields into this Project Earnings report on the
Layout tab
Join Tables and Add Fields that Cross Info Centers

April 18, 202351 Copyright © 2011 Deltek, Inc.
Using Report Designer for Advanced Project Reporting (cont’d)
Preview the report on the Preview tab of Report
Designer
Join Tables and Add Fields that Cross Info Centers

April 18, 202352 Copyright © 2011 Deltek, Inc.
Using Report Designer for Advanced Project Reporting (cont’d)
Import the finished customized report back
into Vision
Join Tables and Add Fields that Cross Info Centers

April 18, 2023 Copyright © 2011 Deltek, Inc.53
Other Project Reporting Options

April 18, 202354 Copyright © 2011 Deltek, Inc.
Other Project Reporting Options
Vision Analysis Cubes

April 18, 202355 Copyright © 2011 Deltek, Inc.
Other Project Reporting Options (cont’d)Vision Performance Management Canvases

April 18, 202356 Copyright © 2011 Deltek, Inc.
Session Quick Review
Adding Calculated and Conditional Report Columns.
Search for and Download Report Output in Preview Mode.
Using Smart Grids for Project Reporting.
Populating User-Defined Fields for Report Filtering Using Workflow.
Creating Project Top-Bottom Performer Reports.
Adding User Interactivity to Project Reports with Report Builder.
Using Report Designer for Advanced Project Reporting.
Other Project Reporting Options.

April 18, 2023
Next Steps – Recommended Insight 2011 Sessions
Attend the Following Additional Sessions at Insight 2011: VI-114: Welcome to Vision Analysis Cubes. VI-227: Vision Analysis Cubes: Oh, the Possibilities! VI-208: The Future of Vision Performance Management. VI-224: Getting Started with DIY Vision Reporting. VI-240: The Strength in Using SSRS with Vision 6.1.
Network with Your Peers While You Are at Insight 2011. Start or Join a Vision User Group on Project Reporting.
57 Copyright © 2011 Deltek, Inc.

April 18, 2023
Next Steps - Recommended Deltek University Classes
Consider taking the following Deltek University Webinars or Onsite Classes: V4168VC: Vision Reporting with Report Builder Webinar with Hands-on Lab. V2033: Vision Reporting with Report Designer 3-Day Onsite Class. V2033VC: Vision Reporting with Report Designer 3-Day Online Virtual Class. V4165VC: Vision Performance Management Webinar with Hands-on Lab. V4158VC: Vision Analysis Cubes Webinar with Hands-on Lab. V4174VC: Vision Workflow Webinar with Hands-on Lab.
Research Vision Learning Paths at Deltek University here: http://www.deltek.com/services/deltekuniversity/learningpaths.asp
Browse Vision Course Descriptions and Schedules here: http://www.deltek.com/services/deltekuniversity/default.asp
58 Copyright © 2011 Deltek, Inc.

April 18, 202359 ©2011 Deltek, Inc. All Rights Reserved
Engage With The DeltekAE Community
twitter.com/deltekvision
deltekae.wordpress.com
deltekvisionblog.wordpress.com
facebook.com/deltekinc
youtube.com/user/deltekinc