Embed Size (px)
DESCRIPTION
Citation preview
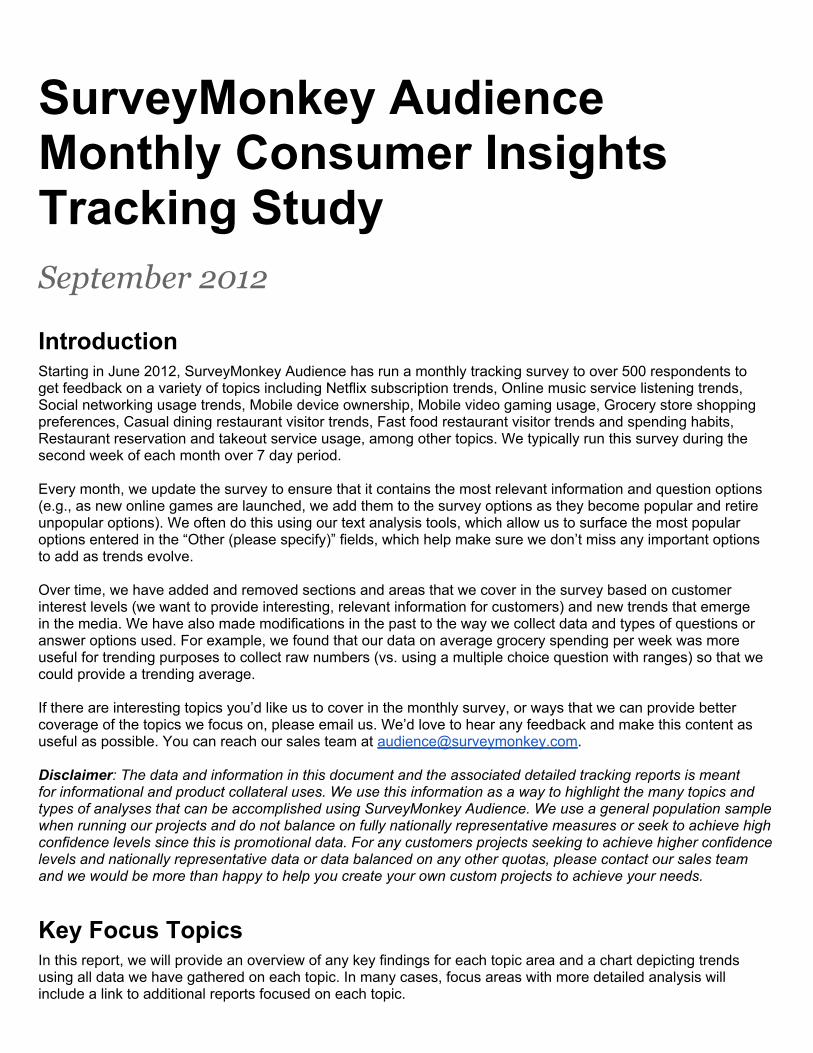
SurveyMonkey Audience Monthly Consumer Insights Tracking StudySeptember 2012
IntroductionStarting in June 2012, SurveyMonkey Audience has run a monthly tracking survey to over 500 respondents to get feedback on a variety of topics including Netflix subscription trends, Online music service listening trends, Social networking usage trends, Mobile device ownership, Mobile video gaming usage, Grocery store shopping preferences, Casual dining restaurant visitor trends, Fast food restaurant visitor trends and spending habits, Restaurant reservation and takeout service usage, among other topics. We typically run this survey during the second week of each month over 7 day period. Every month, we update the survey to ensure that it contains the most relevant information and question options (e.g., as new online games are launched, we add them to the survey options as they become popular and retire unpopular options). We often do this using our text analysis tools, which allow us to surface the most popular options entered in the “Other (please specify)” fields, which help make sure we don’t miss any important options to add as trends evolve. Over time, we have added and removed sections and areas that we cover in the survey based on customer interest levels (we want to provide interesting, relevant information for customers) and new trends that emerge in the media. We have also made modifications in the past to the way we collect data and types of questions or answer options used. For example, we found that our data on average grocery spending per week was more useful for trending purposes to collect raw numbers (vs. using a multiple choice question with ranges) so that we could provide a trending average. If there are interesting topics you’d like us to cover in the monthly survey, or ways that we can provide better coverage of the topics we focus on, please email us. We’d love to hear any feedback and make this content as useful as possible. You can reach our sales team at [email protected]. Disclaimer: The data and information in this document and the associated detailed tracking reports is meant for informational and product collateral uses. We use this information as a way to highlight the many topics and types of analyses that can be accomplished using SurveyMonkey Audience. We use a general population sample when running our projects and do not balance on fully nationally representative measures or seek to achieve high confidence levels since this is promotional data. For any customers projects seeking to achieve higher confidence levels and nationally representative data or data balanced on any other quotas, please contact our sales team and we would be more than happy to help you create your own custom projects to achieve your needs.
Key Focus TopicsIn this report, we will provide an overview of any key findings for each topic area and a chart depicting trends using all data we have gathered on each topic. In many cases, focus areas with more detailed analysis will include a link to additional reports focused on each topic.
The focus areas in the September 2012 edition of the SurveyMonkey Audience Monthly Tracking Study include:
● Netflix Subscription Trends● Online Music Service Listening Trends● Social Networking Usage Trends● Mobile Device Ownership● Mobile Video Gaming Usage● Grocery Store Shopping Preferences● Casual Dining Restaurant Visitor Trends● Fast Food Restaurant Visitor Trends and Spending Habits● Restaurant Reservation and Takeout Service Usage
Netflix Subscription TrendsNetflix (NFLX) is always a hot topic for Internet and Media analysts and investors. The company that brought DVDs into your mailbox for years and grew to become leading a media player and innovator has a strong following and huge customer base. We track several trends on market share, cancellation likelihood and satisfaction. Below is a snapshot of our data and key topics.
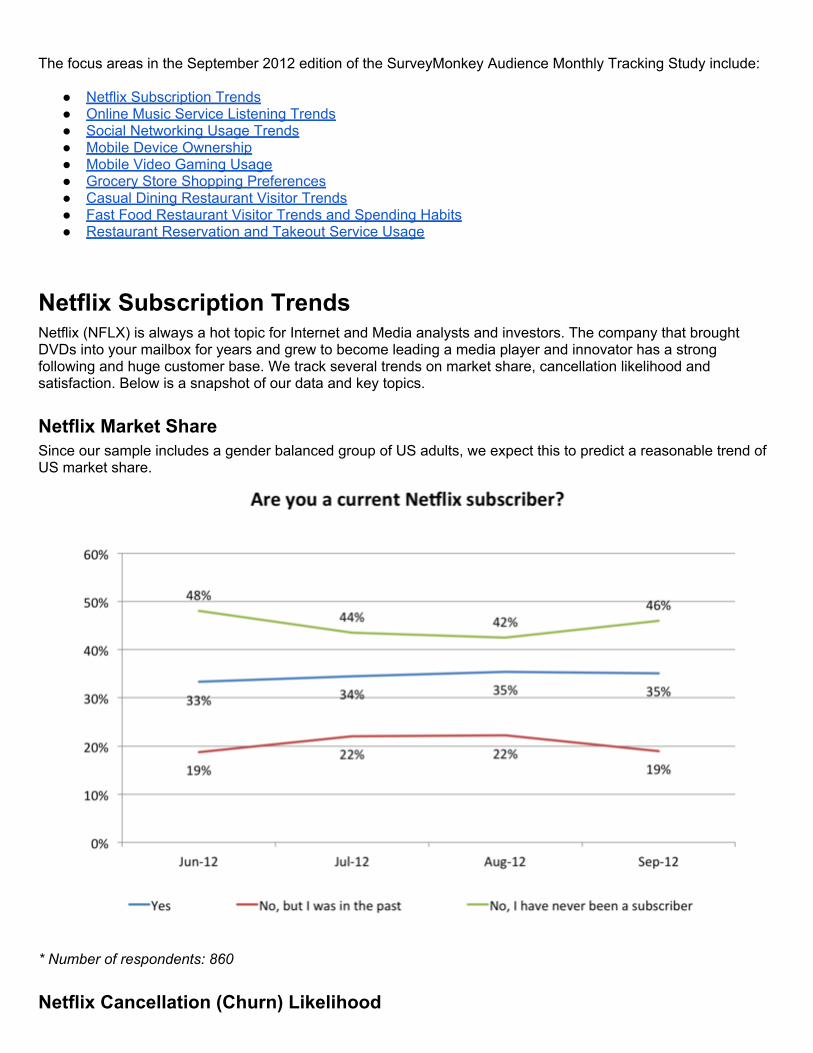
Netflix Market ShareSince our sample includes a gender balanced group of US adults, we expect this to predict a reasonable trend of US market share.
* Number of respondents: 860
Netflix Cancellation (Churn) Likelihood
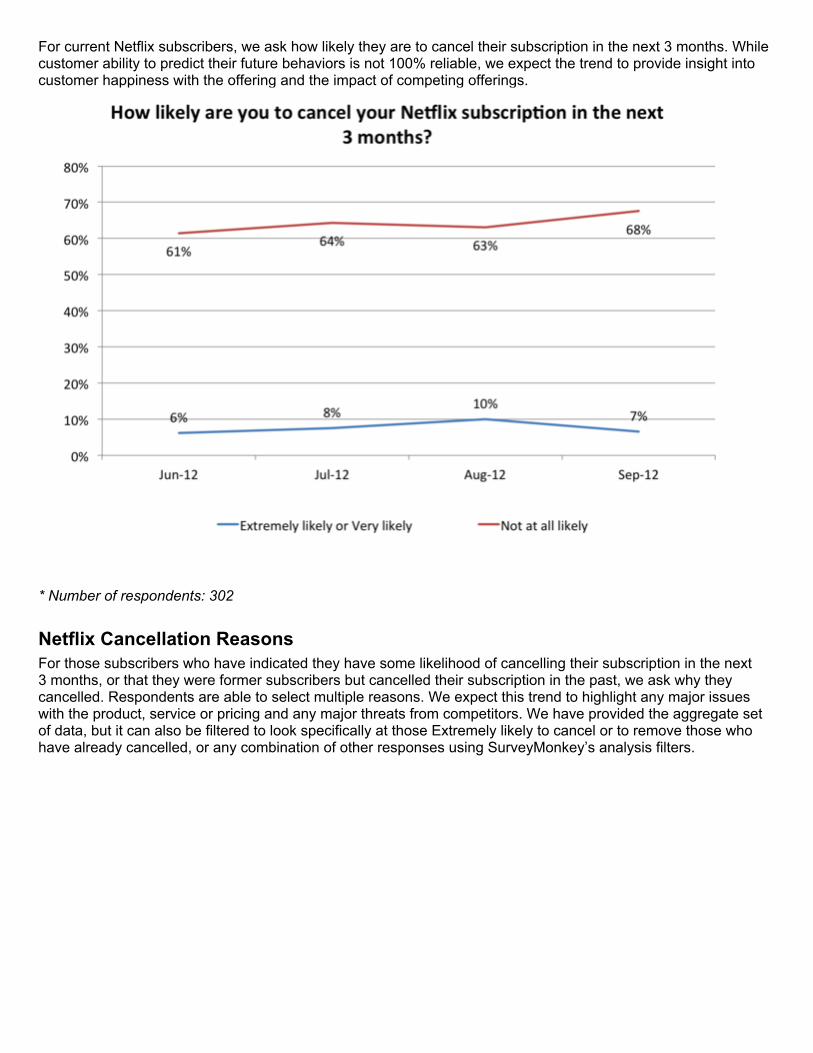
For current Netflix subscribers, we ask how likely they are to cancel their subscription in the next 3 months. While customer ability to predict their future behaviors is not 100% reliable, we expect the trend to provide insight into customer happiness with the offering and the impact of competing offerings.
* Number of respondents: 302
Netflix Cancellation ReasonsFor those subscribers who have indicated they have some likelihood of cancelling their subscription in the next 3 months, or that they were former subscribers but cancelled their subscription in the past, we ask why they cancelled. Respondents are able to select multiple reasons. We expect this trend to highlight any major issues with the product, service or pricing and any major threats from competitors. We have provided the aggregate set of data, but it can also be filtered to look specifically at those Extremely likely to cancel or to remove those who have already cancelled, or any combination of other responses using SurveyMonkey’s analysis filters.
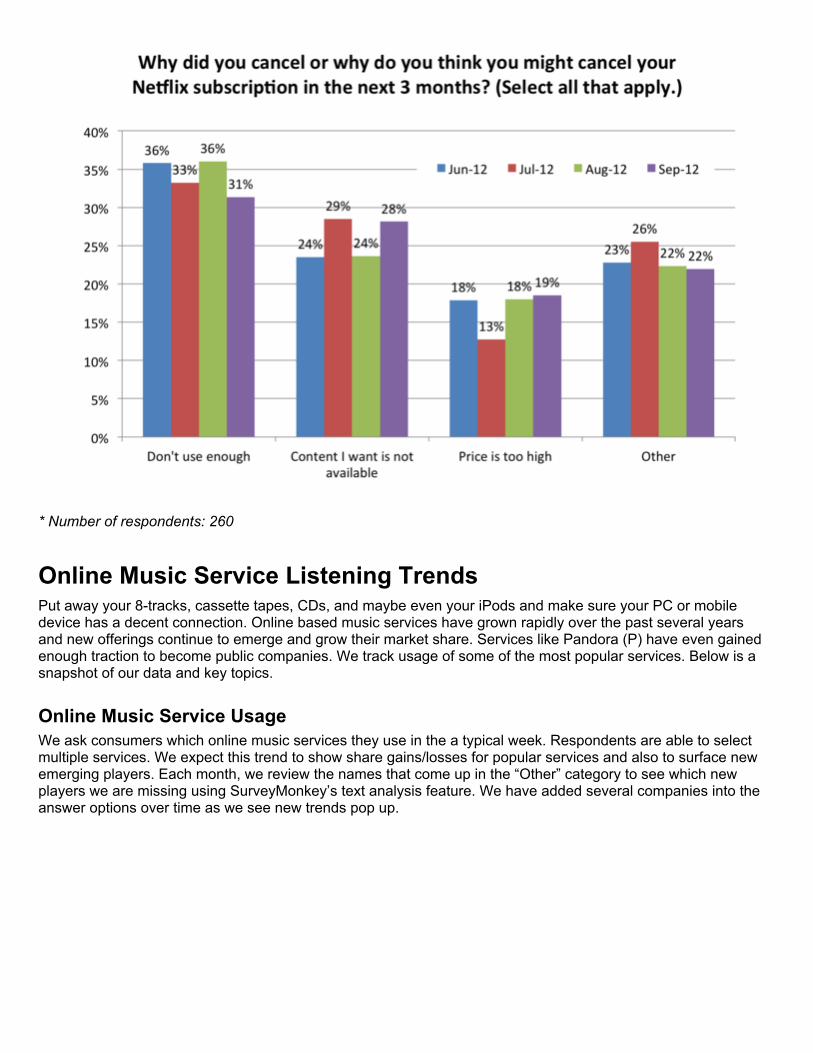
* Number of respondents: 260
Online Music Service Listening TrendsPut away your 8-tracks, cassette tapes, CDs, and maybe even your iPods and make sure your PC or mobile device has a decent connection. Online based music services have grown rapidly over the past several years and new offerings continue to emerge and grow their market share. Services like Pandora (P) have even gained enough traction to become public companies. We track usage of some of the most popular services. Below is a snapshot of our data and key topics.
Online Music Service UsageWe ask consumers which online music services they use in the a typical week. Respondents are able to select multiple services. We expect this trend to show share gains/losses for popular services and also to surface new emerging players. Each month, we review the names that come up in the “Other” category to see which new players we are missing using SurveyMonkey’s text analysis feature. We have added several companies into the answer options over time as we see new trends pop up.
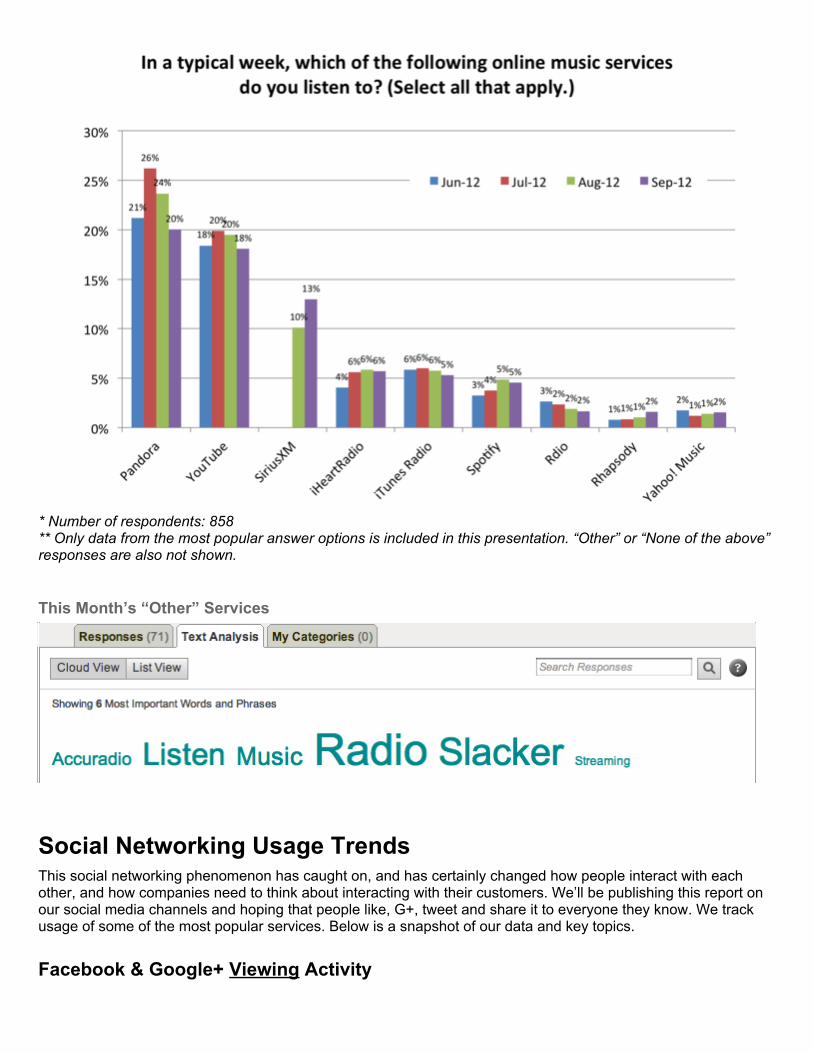
* Number of respondents: 858** Only data from the most popular answer options is included in this presentation. “Other” or “None of the above” responses are also not shown.
This Month’s “Other” Services
Social Networking Usage TrendsThis social networking phenomenon has caught on, and has certainly changed how people interact with each other, and how companies need to think about interacting with their customers. We’ll be publishing this report on our social media channels and hoping that people like, G+, tweet and share it to everyone they know. We track usage of some of the most popular services. Below is a snapshot of our data and key topics.
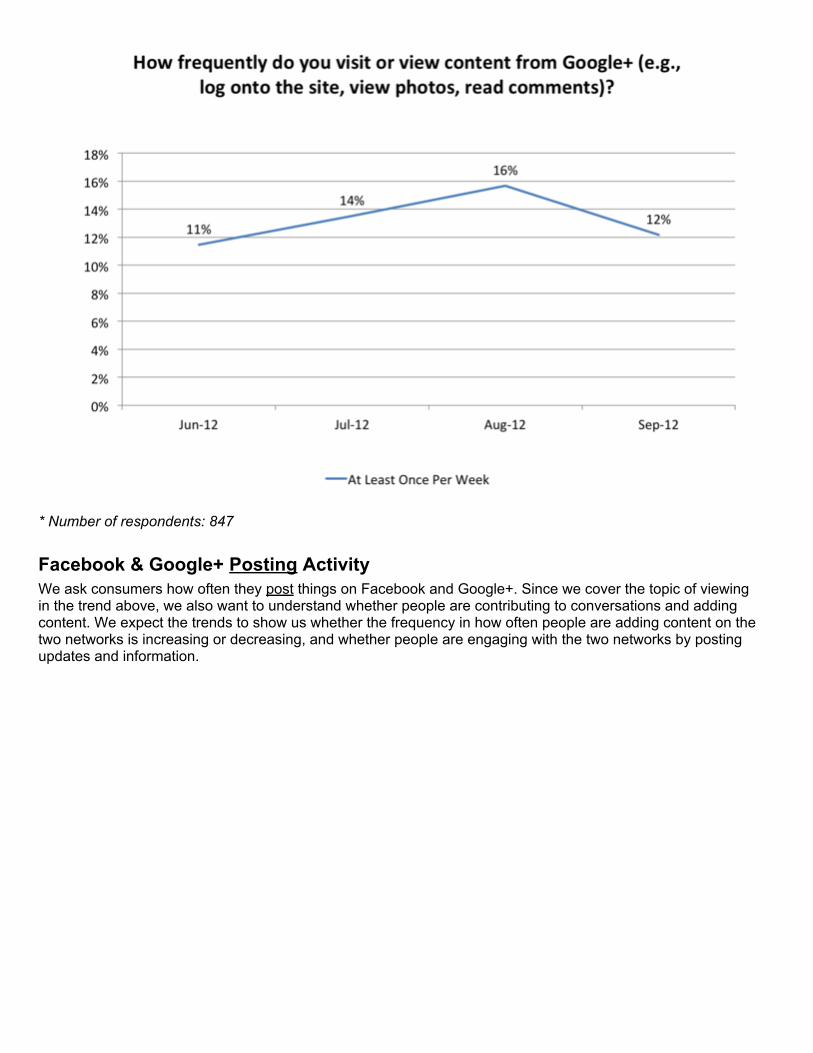
Facebook & Google+ Viewing Activity
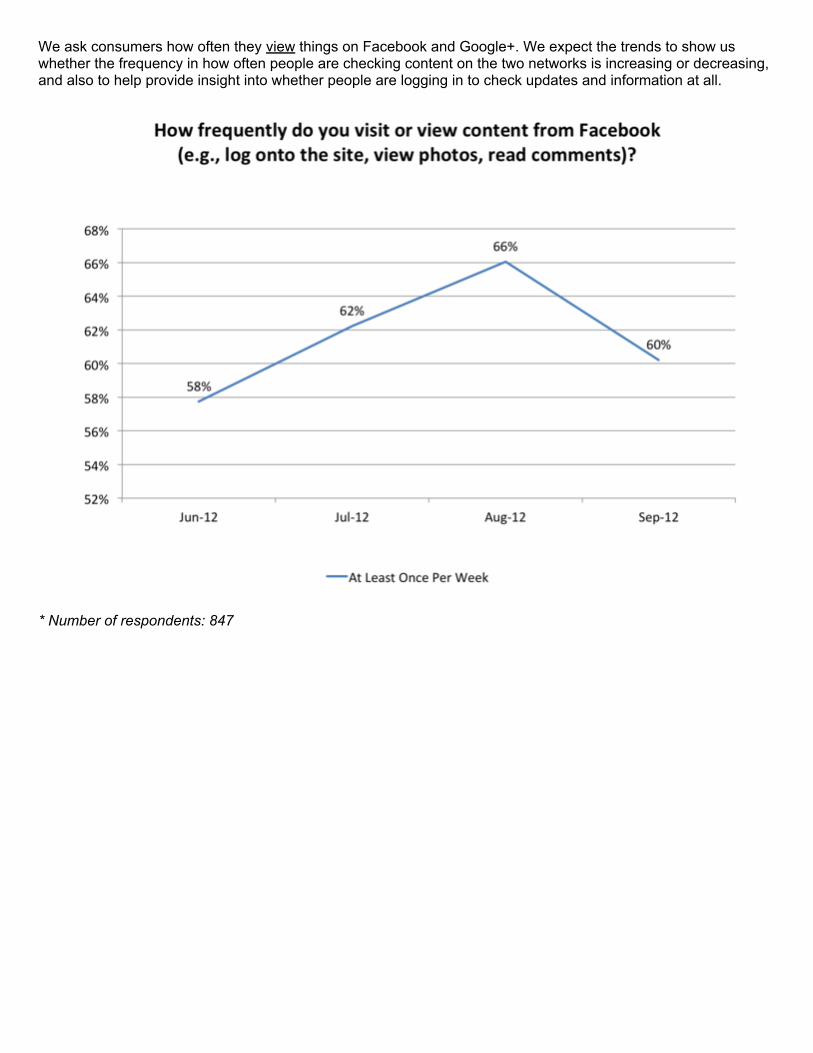
We ask consumers how often they view things on Facebook and Google+. We expect the trends to show us whether the frequency in how often people are checking content on the two networks is increasing or decreasing, and also to help provide insight into whether people are logging in to check updates and information at all.
* Number of respondents: 847
* Number of respondents: 847
Facebook & Google+ Posting ActivityWe ask consumers how often they post things on Facebook and Google+. Since we cover the topic of viewing in the trend above, we also want to understand whether people are contributing to conversations and adding content. We expect the trends to show us whether the frequency in how often people are adding content on the two networks is increasing or decreasing, and whether people are engaging with the two networks by posting updates and information.
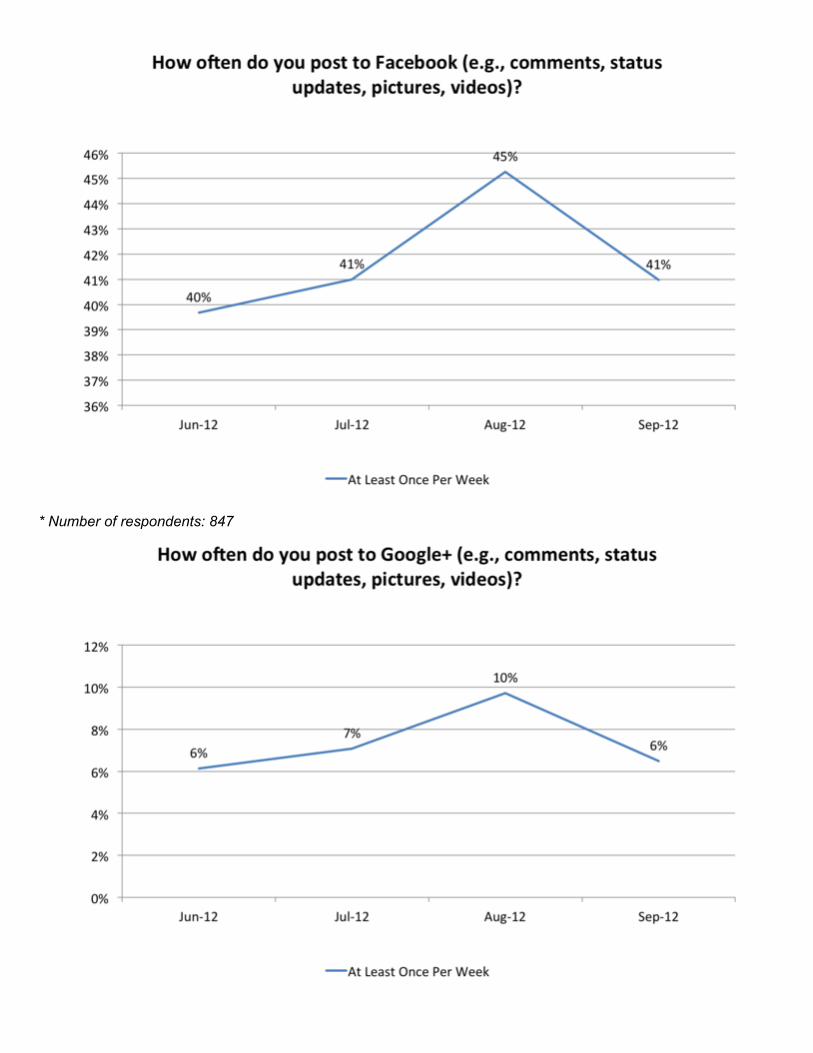
* Number of respondents: 847
* Number of respondents: 847
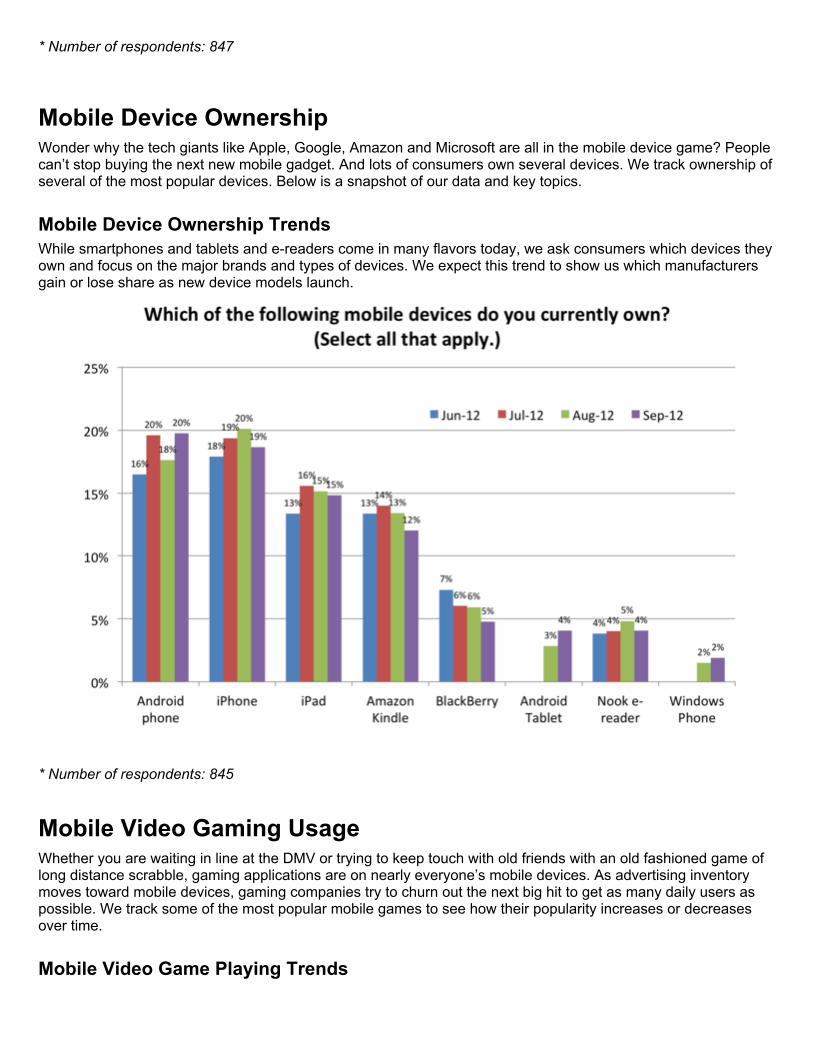
Mobile Device OwnershipWonder why the tech giants like Apple, Google, Amazon and Microsoft are all in the mobile device game? People can’t stop buying the next new mobile gadget. And lots of consumers own several devices. We track ownership of several of the most popular devices. Below is a snapshot of our data and key topics.
Mobile Device Ownership TrendsWhile smartphones and tablets and e-readers come in many flavors today, we ask consumers which devices they own and focus on the major brands and types of devices. We expect this trend to show us which manufacturers gain or lose share as new device models launch.
* Number of respondents: 845
Mobile Video Gaming UsageWhether you are waiting in line at the DMV or trying to keep touch with old friends with an old fashioned game of long distance scrabble, gaming applications are on nearly everyone’s mobile devices. As advertising inventory moves toward mobile devices, gaming companies try to churn out the next big hit to get as many daily users as possible. We track some of the most popular mobile games to see how their popularity increases or decreases over time.
Mobile Video Game Playing Trends
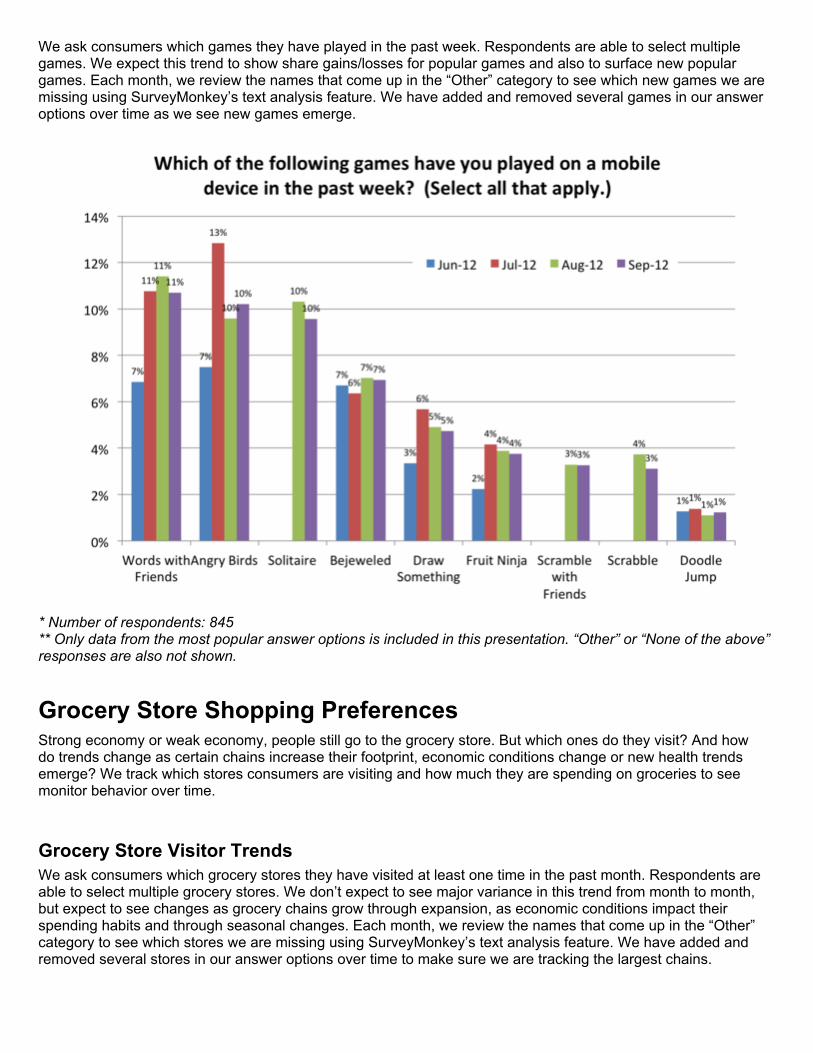
We ask consumers which games they have played in the past week. Respondents are able to select multiple games. We expect this trend to show share gains/losses for popular games and also to surface new popular games. Each month, we review the names that come up in the “Other” category to see which new games we are missing using SurveyMonkey’s text analysis feature. We have added and removed several games in our answer options over time as we see new games emerge.
* Number of respondents: 845** Only data from the most popular answer options is included in this presentation. “Other” or “None of the above” responses are also not shown.
Grocery Store Shopping PreferencesStrong economy or weak economy, people still go to the grocery store. But which ones do they visit? And how do trends change as certain chains increase their footprint, economic conditions change or new health trends emerge? We track which stores consumers are visiting and how much they are spending on groceries to see monitor behavior over time.
Grocery Store Visitor TrendsWe ask consumers which grocery stores they have visited at least one time in the past month. Respondents are able to select multiple grocery stores. We don’t expect to see major variance in this trend from month to month, but expect to see changes as grocery chains grow through expansion, as economic conditions impact their spending habits and through seasonal changes. Each month, we review the names that come up in the “Other” category to see which stores we are missing using SurveyMonkey’s text analysis feature. We have added and removed several stores in our answer options over time to make sure we are tracking the largest chains.
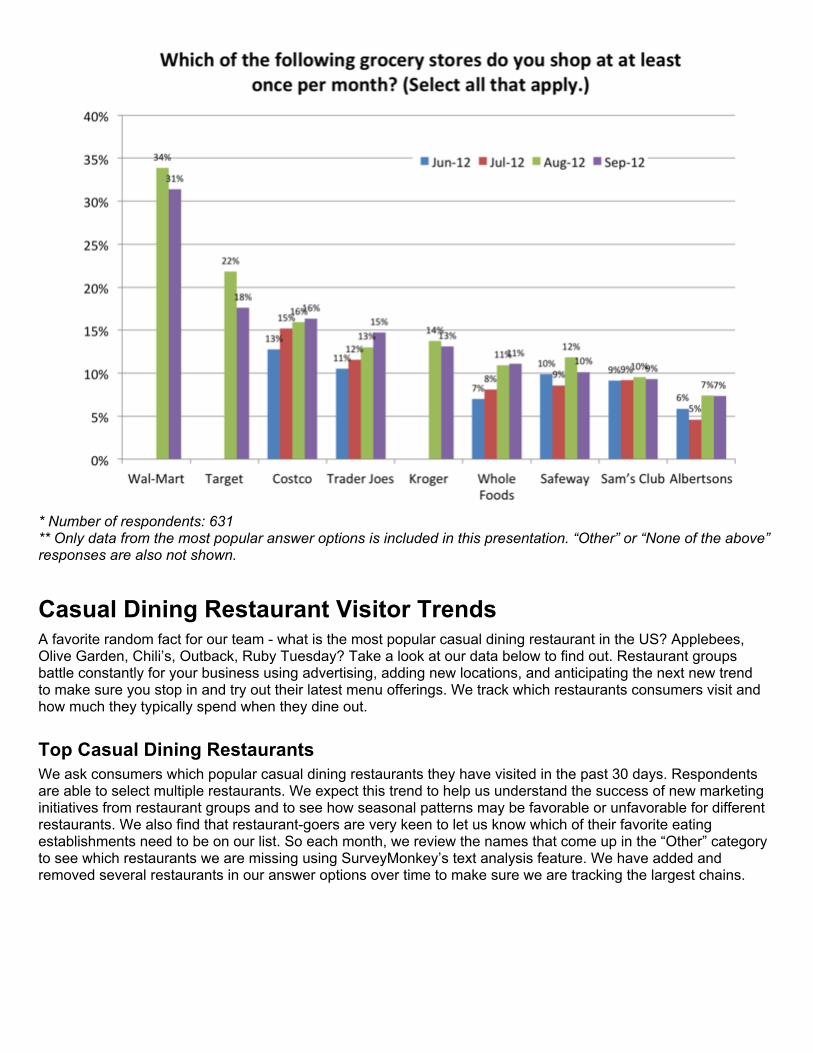
* Number of respondents: 631** Only data from the most popular answer options is included in this presentation. “Other” or “None of the above” responses are also not shown.
Casual Dining Restaurant Visitor TrendsA favorite random fact for our team - what is the most popular casual dining restaurant in the US? Applebees, Olive Garden, Chili’s, Outback, Ruby Tuesday? Take a look at our data below to find out. Restaurant groups battle constantly for your business using advertising, adding new locations, and anticipating the next new trend to make sure you stop in and try out their latest menu offerings. We track which restaurants consumers visit and how much they typically spend when they dine out.
Top Casual Dining RestaurantsWe ask consumers which popular casual dining restaurants they have visited in the past 30 days. Respondents are able to select multiple restaurants. We expect this trend to help us understand the success of new marketing initiatives from restaurant groups and to see how seasonal patterns may be favorable or unfavorable for different restaurants. We also find that restaurant-goers are very keen to let us know which of their favorite eating establishments need to be on our list. So each month, we review the names that come up in the “Other” category to see which restaurants we are missing using SurveyMonkey’s text analysis feature. We have added and removed several restaurants in our answer options over time to make sure we are tracking the largest chains.
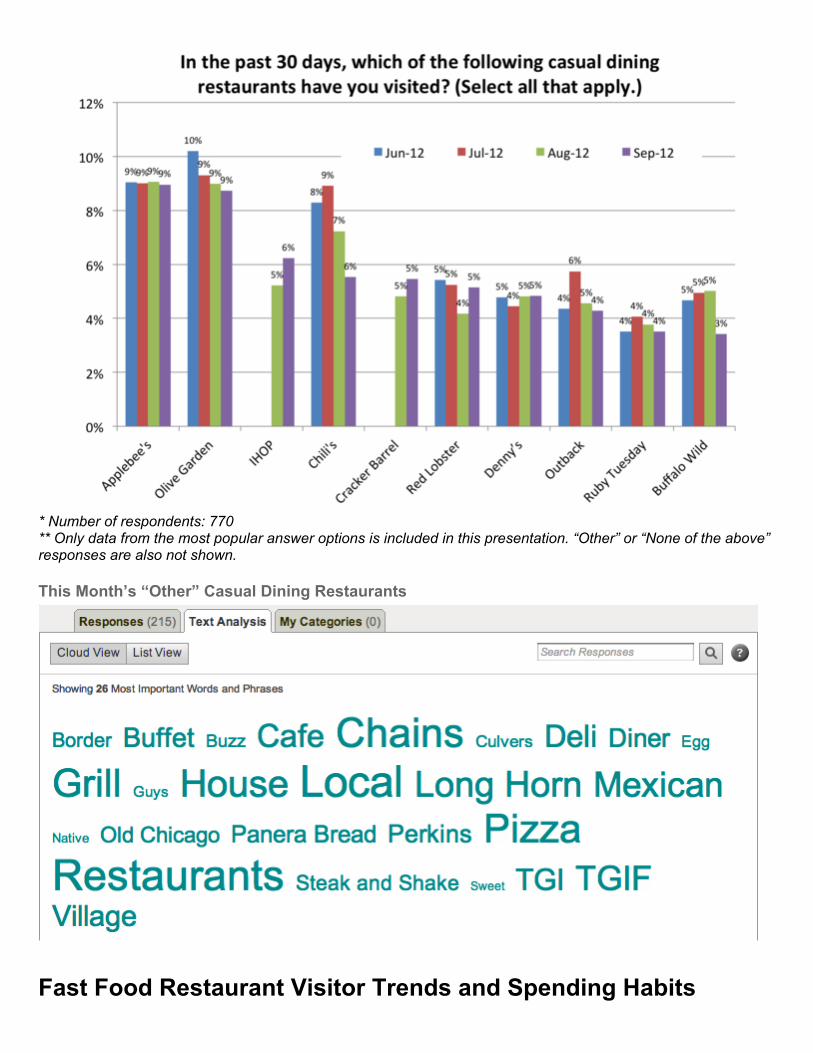
* Number of respondents: 770** Only data from the most popular answer options is included in this presentation. “Other” or “None of the above” responses are also not shown.
This Month’s “Other” Casual Dining Restaurants
Fast Food Restaurant Visitor Trends and Spending Habits
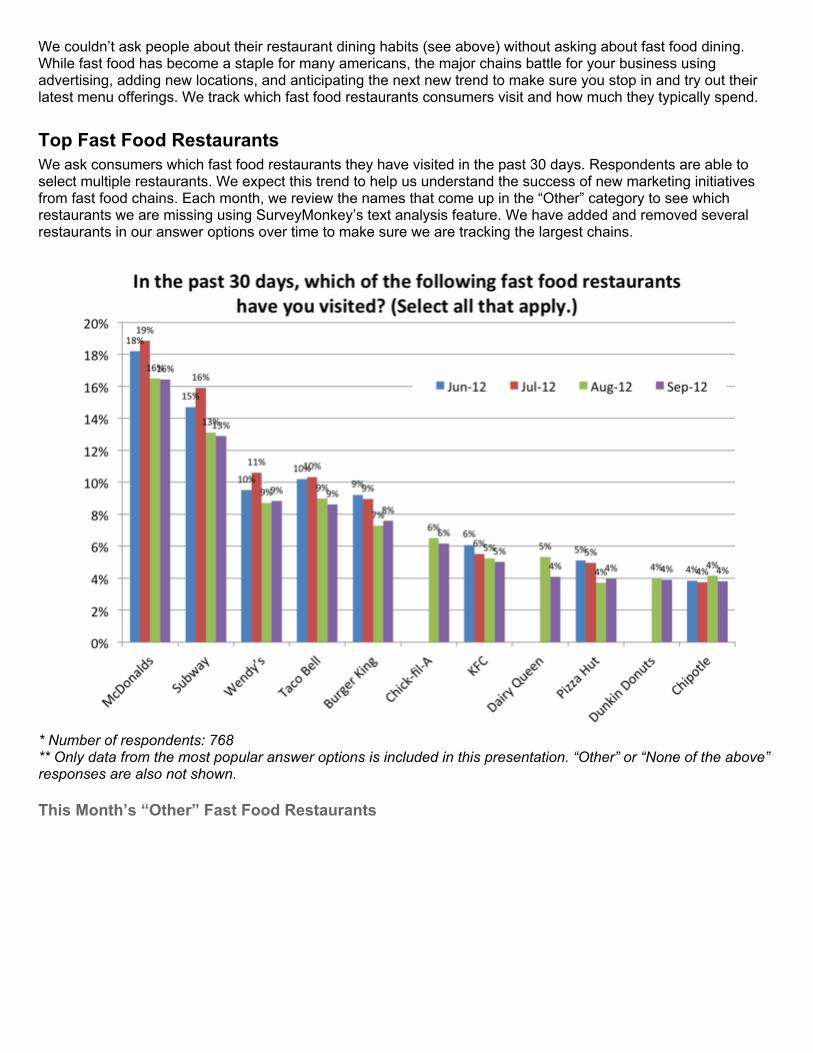
We couldn’t ask people about their restaurant dining habits (see above) without asking about fast food dining. While fast food has become a staple for many americans, the major chains battle for your business using advertising, adding new locations, and anticipating the next new trend to make sure you stop in and try out their latest menu offerings. We track which fast food restaurants consumers visit and how much they typically spend.
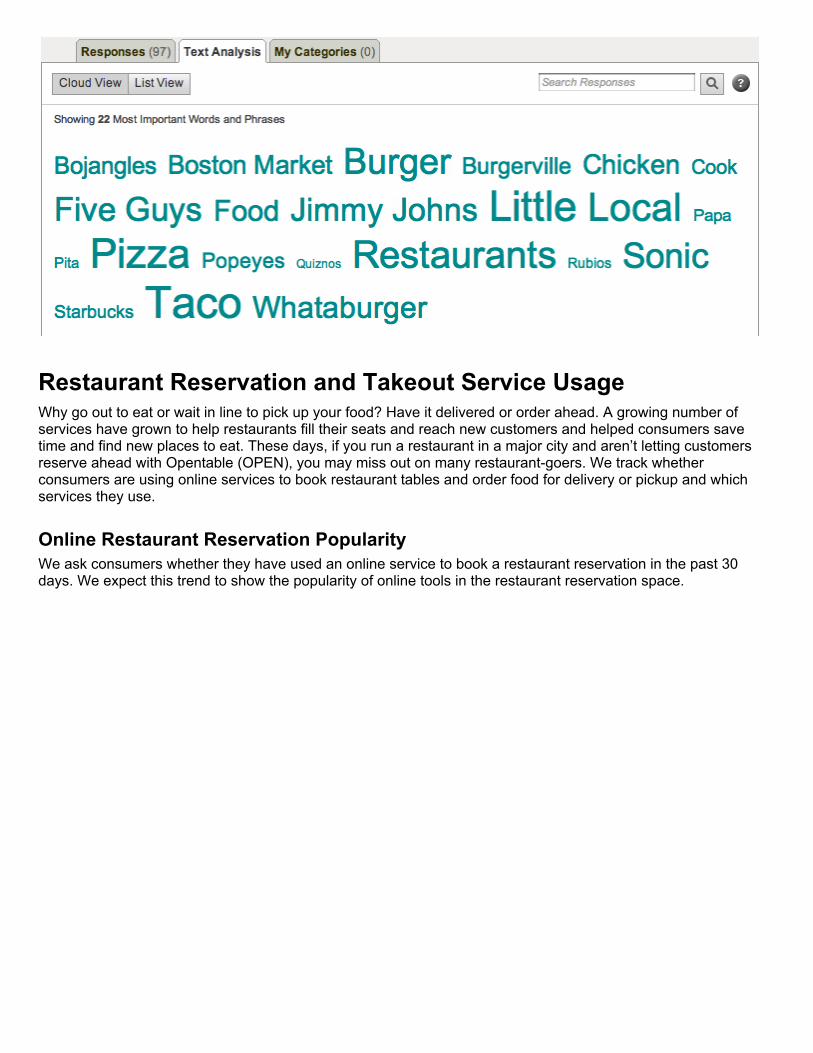
Top Fast Food RestaurantsWe ask consumers which fast food restaurants they have visited in the past 30 days. Respondents are able to select multiple restaurants. We expect this trend to help us understand the success of new marketing initiatives from fast food chains. Each month, we review the names that come up in the “Other” category to see which restaurants we are missing using SurveyMonkey’s text analysis feature. We have added and removed several restaurants in our answer options over time to make sure we are tracking the largest chains.
* Number of respondents: 768** Only data from the most popular answer options is included in this presentation. “Other” or “None of the above” responses are also not shown.
This Month’s “Other” Fast Food Restaurants
Restaurant Reservation and Takeout Service UsageWhy go out to eat or wait in line to pick up your food? Have it delivered or order ahead. A growing number of services have grown to help restaurants fill their seats and reach new customers and helped consumers save time and find new places to eat. These days, if you run a restaurant in a major city and aren’t letting customers reserve ahead with Opentable (OPEN), you may miss out on many restaurant-goers. We track whether consumers are using online services to book restaurant tables and order food for delivery or pickup and which services they use.
Online Restaurant Reservation PopularityWe ask consumers whether they have used an online service to book a restaurant reservation in the past 30 days. We expect this trend to show the popularity of online tools in the restaurant reservation space.
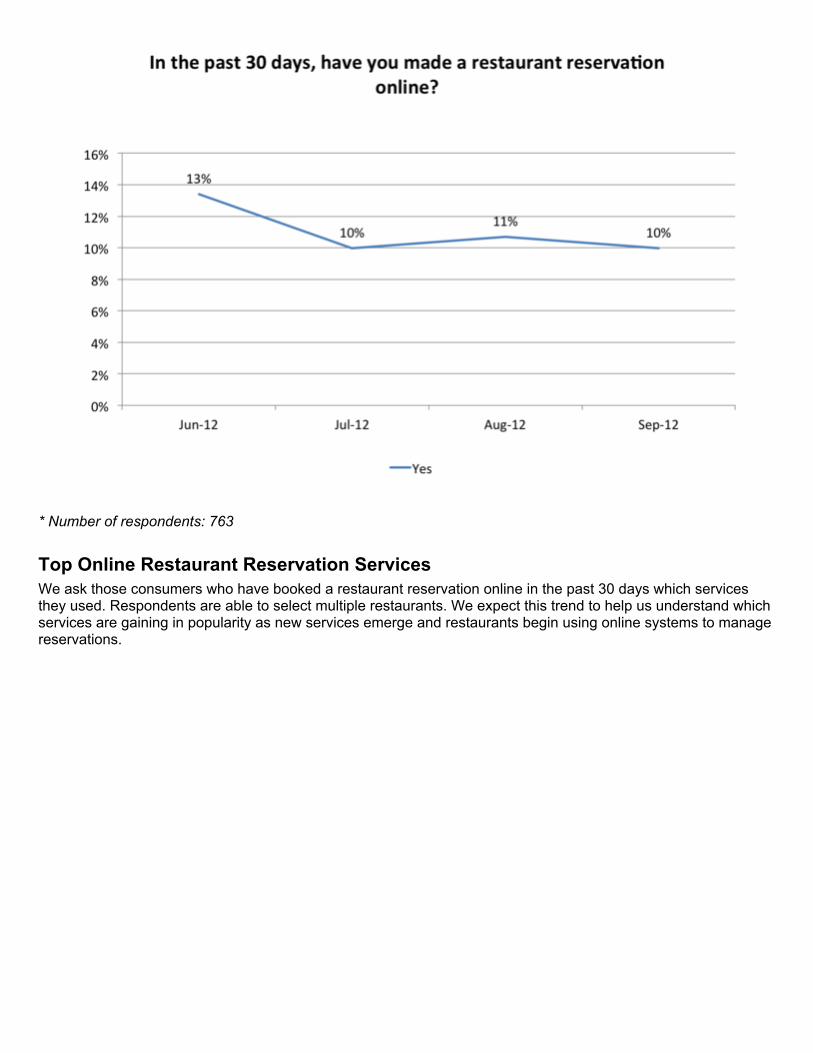
* Number of respondents: 763
Top Online Restaurant Reservation ServicesWe ask those consumers who have booked a restaurant reservation online in the past 30 days which services they used. Respondents are able to select multiple restaurants. We expect this trend to help us understand which services are gaining in popularity as new services emerge and restaurants begin using online systems to manage reservations.
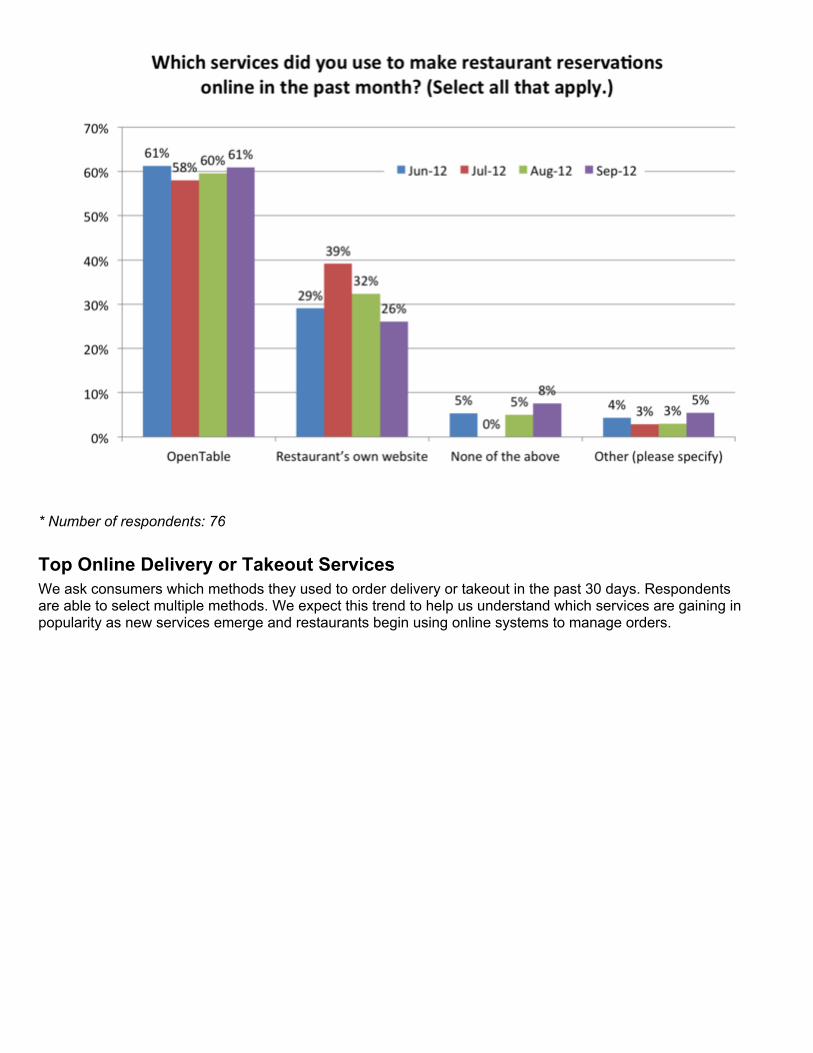
* Number of respondents: 76
Top Online Delivery or Takeout ServicesWe ask consumers which methods they used to order delivery or takeout in the past 30 days. Respondents are able to select multiple methods. We expect this trend to help us understand which services are gaining in popularity as new services emerge and restaurants begin using online systems to manage orders.
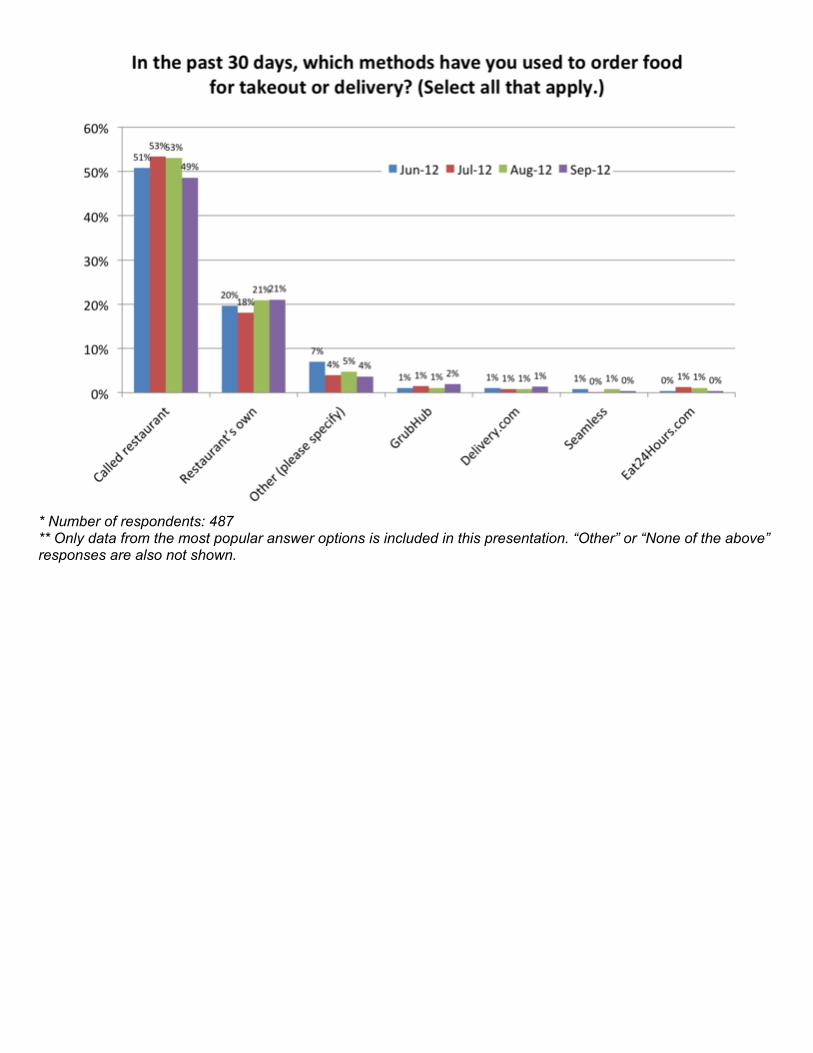
* Number of respondents: 487** Only data from the most popular answer options is included in this presentation. “Other” or “None of the above” responses are also not shown.