Embed Size (px)
Citation preview
17 March 2017
Scania AB (publ) 151 87 Södertälje Tel. +46 8 553 810 00
Corporate identity number Sweden Fax +46 8 553 810 37
556184-8564 www.scania.com
Scania Year-end Report January–December 2016
Summary of the full year 2016
• Operating income excluding items affecting comparability rose by 6 percent to SEK 10,184 m. (9,641), resulting in
an operating margin of 9.8 (10.2) percent
• Operating income amounted to SEK 6,384 m. (9,641) and was negatively impacted by a provision of SEK 3.8
billion related to the European Commission’s competition investigation
• Net sales rose by 10 percent to a record high SEK 103,927 m. (94,897)
• Cash flow amounted to SEK 3,427 m. (4,376) in Vehicles and Services
Comments by Henrik Henriksson, President and CEO: “Scania’s net sales rose to a record level of nearly SEK
104 billion. Total deliveries of trucks and buses and
coaches reached all-time high levels. Service revenue
amounted to a record of almost SEK 22 billion, an
increase of 5 percent (7 percent in local currency). The
company’s operational performance was strong. Higher
vehicle volume in Europe and higher service volume
impacted earnings positively but this was partly offset by
negative currency rate effects, lower deliveries in Latin
America (mainly related to Brazil), and by the high cost of
investments related to Scania’s new truck generation.
Scania’s position in the European market remains strong
with a market share of 16.5 percent. The replacement
need and economic situation in Europe continues to have
a positive impact on demand for trucks. Order bookings in
Latin America remain at a low level, mainly due to the very
uncertain situation in Brazil. In Eurasia, order bookings
increased somewhat and Russia appears to have
bottomed out. Demand for buses and coaches remains at
a high level in Europe. In Engines, demand for industrial
and marine engines is good, while remaining weak on the
power generation side. The success of the new generation
of Scania trucks has been immediate and the truck has
outperformed the competition in all trade press tests it has
entered. Nearly all aspects have been praised – the
powertrain, performance, comfort, braking capacity,
visibility and steering. Combined with Scania Maintenance
with Flexible Plans, our new tailor-made service enabled
by continual monitoring of connected vehicles’ operating
data, customer earning potential is enhanced. When every
truck receives exactly the maintenance it needs, the
customer enjoys maximum vehicle uptime.“
Financial overview Full year 2016 Q4
Trucks and buses, units 2016 2015
Change,
% 2016 2015
Change,
%
Order bookings 85,527 77,091 11 23,262 19,199 21
Deliveries 81,346 76,561 6 22,614 21,626 5
Net sales and earnings
EUR
m.*
Net sales, Scania Group, SEK m. 10,863 103,927 94,897 10 28,718 25,211 14
Operating income, Vehicles and Services, SEK m. 561 5,369 8,601 -38 2,401 2,349 2
Operating income, excl. items affecting comparability,
vehicles and Services, SEK m. 958 9,169 8,601 7 2,401 2,349 2
Operating income, Financial Services, SEK m. 106 1,015 1,040 -2 250 246 2
Operating income, SEK m. 667 6,384 9,641 -34 2,651 2,595 2
Income before taxes, SEK m. 623 5,963 9,109 -35 2,520 2,420 4
Net income for the period, SEK m. 339 3,243 6,753 -52 1,816 1,813 0
Operating margin, % 6.1 10.2 9.2 10.3
Operating margin, excl. items affecting comparability, % 9.8 10.2 9.2 10.3
Return on capital employed, Vehicles and Services, % 14.0 19.3
Return on capital employed, excl. items affecting
comparability, Vehicles and Services, % 21.5 19.3
Cash flow, Vehicles and Services, SEK m. 358 3,427 4,376 -22 3,619 3,156 15
* Translated to EUR solely for the convenience of the reader at a closing day rate of SEK 9,5672 = EUR 1.00.
Unless otherwise stated, all comparisons refer to the corresponding period of the preceding year.
This interim report has not been subject to review by the company’s auditors. This report is also available on www.scania.com
Scania Year-end Report January-December 2016
Business overview
0
3,000
6,000
9,000
12,000
15,000
18,000
21,000
24,000
27,000
Q1 Q2 Q3 Q4
Number of vehicles delivered2013 2014 2015 2016
0
5,000
10,000
15,000
20,000
25,000
30,000
Q1 Q2 Q3 Q4
Net sales, SEK m.2013 2014 2015 2016
0
400
800
1,200
1,600
2,000
2,400
2,800
3,200
Q1 Q2 Q3 Q4
Operating income, SEK m.2013 2014 2015 2016
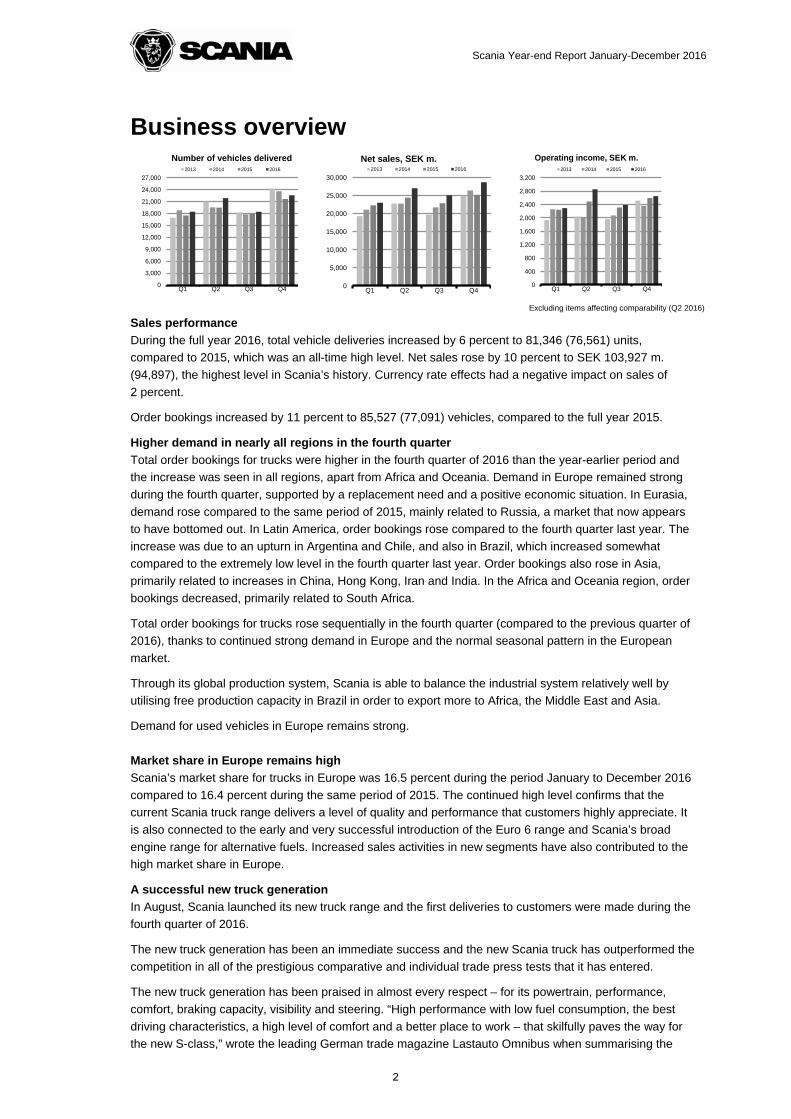
Sales performance
During the full year 2016, total vehicle deliveries increased by 6 percent to 81,346 (76,561) units,
compared to 2015, which was an all-time high level. Net sales rose by 10 percent to SEK 103,927 m.
(94,897), the highest level in Scania’s history. Currency rate effects had a negative impact on sales of
2 percent.
Order bookings increased by 11 percent to 85,527 (77,091) vehicles, compared to the full year 2015.
Higher demand in nearly all regions in the fourth quarter
Total order bookings for trucks were higher in the fourth quarter of 2016 than the year-earlier period and
the increase was seen in all regions, apart from Africa and Oceania. Demand in Europe remained strong
during the fourth quarter, supported by a replacement need and a positive economic situation. In Eurasia,
demand rose compared to the same period of 2015, mainly related to Russia, a market that now appears
to have bottomed out. In Latin America, order bookings rose compared to the fourth quarter last year. The
increase was due to an upturn in Argentina and Chile, and also in Brazil, which increased somewhat
compared to the extremely low level in the fourth quarter last year. Order bookings also rose in Asia,
primarily related to increases in China, Hong Kong, Iran and India. In the Africa and Oceania region, order
bookings decreased, primarily related to South Africa.
Total order bookings for trucks rose sequentially in the fourth quarter (compared to the previous quarter of
2016), thanks to continued strong demand in Europe and the normal seasonal pattern in the European
market.
Through its global production system, Scania is able to balance the industrial system relatively well by
utilising free production capacity in Brazil in order to export more to Africa, the Middle East and Asia.
Demand for used vehicles in Europe remains strong.
Market share in Europe remains high
Scania’s market share for trucks in Europe was 16.5 percent during the period January to December 2016
compared to 16.4 percent during the same period of 2015. The continued high level confirms that the
current Scania truck range delivers a level of quality and performance that customers highly appreciate. It
is also connected to the early and very successful introduction of the Euro 6 range and Scania’s broad
engine range for alternative fuels. Increased sales activities in new segments have also contributed to the
high market share in Europe.
A successful new truck generation
In August, Scania launched its new truck range and the first deliveries to customers were made during the
fourth quarter of 2016.
The new truck generation has been an immediate success and the new Scania truck has outperformed the
competition in all of the prestigious comparative and individual trade press tests that it has entered.
The new truck generation has been praised in almost every respect – for its powertrain, performance,
comfort, braking capacity, visibility and steering. “High performance with low fuel consumption, the best
driving characteristics, a high level of comfort and a better place to work – that skilfully paves the way for
the new S-class,” wrote the leading German trade magazine Lastauto Omnibus when summarising the
Excluding items affecting comparability (Q2 2016)
2
Scania Year-end Report January-December 2016
demanding comparative 1,000 point test. It further reported, “Scania excels in lateral stability with precise
steering and an overall feeling of control.”
In another comparative test led by German trade magazine KFZ-Anzeiger, the Scania S 500 was found to
be “sensationally economical”. In fact, it was the first truck to register under 30 litres/100 km on their test
route. Definitely value for money, was the verdict.
The excellent fuel economy performance was also confirmed in Routes’ test, the leading trade magazine in
France. It subjected the new Scania R 500 to rigorous tests along a 419-kilometre route in south-eastern
France. Over the five hours of testing, the new generation Scania R 500 recorded the lowest-ever average
fuel consumption of 28.4 litres/100 km.
The truck market Order bookings
Scania’s order bookings rose during the fourth quarter of 2016 and totalled 21,727 (17,044) trucks. Order
bookings in Europe increased by 19 percent to 13,871 (11,660) units, compared to the fourth quarter of
2015. Demand rose in several major European markets such as Great Britain, Germany, Poland and
France. Order bookings rose sequentially (compared to the previous quarter) in Europe in line with the
seasonal pattern in the European market.
Order bookings in Latin America increased during the fourth quarter of 2016 compared to the same period
of the previous year, mainly due to increases in Brazil, Argentina and Chile. Order bookings also rose
somewhat sequentially in Latin America. The outlook for the region remains uncertain due to low economic
growth.
In Eurasia, total order bookings rose during the fourth quarter and amounted to 1,582 (340) trucks. The
upturn was mainly attributable to Russia. Order bookings also rose sequentially in Eurasia. The outlook for
the region remains uncertain due to geopolitical turbulence.
In Asia, demand during the quarter increased by 23 percent compared to the year-earlier period and order
bookings amounted to 2,912 (2,367) units. Compared to the third quarter of 2016, order bookings also
rose.
In Africa and Oceania, order bookings were lower at 1,194 (1,284) units compared to the fourth quarter of
2015, mainly related to a downturn in South Africa. Order bookings also decreased sequentially in Africa
and Oceania.
Deliveries
Scania's total truck deliveries increased by 2 percent to 20,033 (19,601) units during the fourth quarter
compared to the year-earlier period. In Europe, deliveries rose by 3 percent to 12,877 (12,462) units
compared to the fourth quarter of 2015. In Eurasia, deliveries rose to 1,335 (672) trucks. In Latin America,
deliveries rose by 2 percent to 2,077 (2,038) units compared to the fourth quarter of 2015. In Asia,
deliveries decreased compared to the fourth quarter of 2015 to 2,490 (3,003) trucks. Deliveries in Africa
and Oceania decreased by 12 percent to 1,254 (1,426) trucks.
Sales
Net sales of trucks rose by 7 percent to SEK m. 65,615 (61,250) during the full year 2016. During the fourth
quarter, sales increased by 9 percent to SEK m. 18,557 (17,046).
The total European market for heavy trucks
The total market for heavy trucks in 25 of the European Union member countries (all EU countries except
Greece, Bulgaria and Malta) plus Norway and Switzerland increased by 12.4 percent to about 300,200
(267,100) units during the full year 2016. Scania truck registrations amounted to some 49,500 (44,100)
units, equivalent to a market share of about 16.5 (16.4) percent.
3
Scania Year-end Report January-December 2016
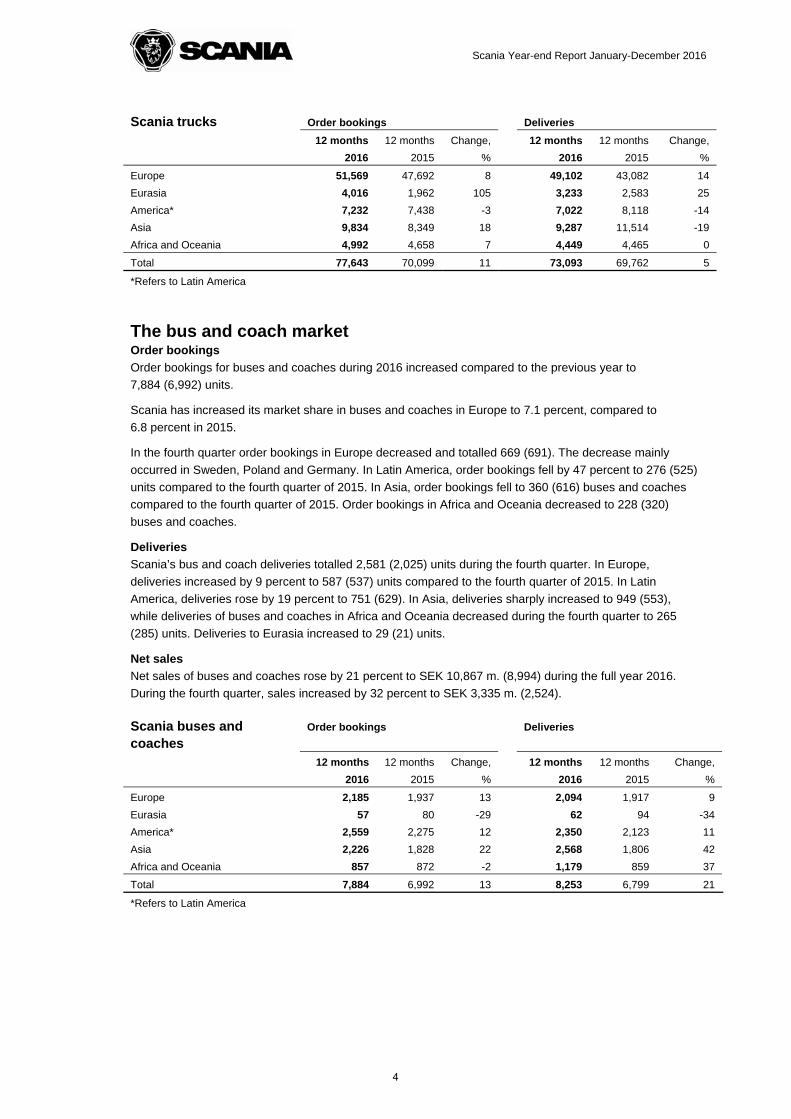
Scania trucks Order bookings Deliveries
12 months
2016
12 months
2015
Change,
%
12 months
2016
12 months
2015
Change,
%
Europe 51,569 47,692 8 49,102 43,082 14
Eurasia 4,016 1,962 105 3,233 2,583 25
America* 7,232 7,438 -3 7,022 8,118 -14
Asia 9,834 8,349 18 9,287 11,514 -19
Africa and Oceania 4,992 4,658 7 4,449 4,465 0
Total 77,643 70,099 11 73,093 69,762 5
*Refers to Latin America
The bus and coach market Order bookings
Order bookings for buses and coaches during 2016 increased compared to the previous year to
7,884 (6,992) units.
Scania has increased its market share in buses and coaches in Europe to 7.1 percent, compared to
6.8 percent in 2015.
In the fourth quarter order bookings in Europe decreased and totalled 669 (691). The decrease mainly
occurred in Sweden, Poland and Germany. In Latin America, order bookings fell by 47 percent to 276 (525)
units compared to the fourth quarter of 2015. In Asia, order bookings fell to 360 (616) buses and coaches
compared to the fourth quarter of 2015. Order bookings in Africa and Oceania decreased to 228 (320)
buses and coaches.
Deliveries
Scania’s bus and coach deliveries totalled 2,581 (2,025) units during the fourth quarter. In Europe,
deliveries increased by 9 percent to 587 (537) units compared to the fourth quarter of 2015. In Latin
America, deliveries rose by 19 percent to 751 (629). In Asia, deliveries sharply increased to 949 (553),
while deliveries of buses and coaches in Africa and Oceania decreased during the fourth quarter to 265
(285) units. Deliveries to Eurasia increased to 29 (21) units.
Net sales
Net sales of buses and coaches rose by 21 percent to SEK 10,867 m. (8,994) during the full year 2016.
During the fourth quarter, sales increased by 32 percent to SEK 3,335 m. (2,524).
Scania buses and coaches
Order bookings Deliveries
12 months
2016
12 months
2015
Change,
%
12 months
2016
12 months
2015
Change,
%
Europe 2,185 1,937 13 2,094 1,917 9
Eurasia 57 80 -29 62 94 -34
America* 2,559 2,275 12 2,350 2,123 11
Asia 2,226 1,828 22 2,568 1,806 42
Africa and Oceania 857 872 -2 1,179 859 37
Total 7,884 6,992 13 8,253 6,799 21
*Refers to Latin America
4
Scania Year-end Report January-December 2016
Engines Order bookings
In Engines, demand for industrial and marine engines is good, while remaining weak on the power
generation side. Total engine order bookings fell by 6 percent to 7,611 (8,140) units during 2016 compared
to 2015. During the fourth quarter, order bookings increased by 6 percent to 1,838 (1,726) units.
Deliveries
Engine deliveries decreased by 8 percent to 7,800 (8,485) units during the full year 2016. During the fourth
quarter, deliveries rose by 29 percent to 2,380 (1,846) units.
Net sales
During the full year, net sales decreased by 1 percent to SEK 1,647 m. (1,656). Net sales in the fourth
quarter amounted to SEK 517 m. (369), an upturn of 40 percent.
Services Record high revenue
Service revenue amounted to a record high SEK 21,611 m. (20,585) during the full year 2016, an increase
of 5 percent. Higher volume, mainly in Europe, had a positive impact, while currency rate effects were
negative. In local currencies, revenue increased by 7 percent. During the fourth quarter, revenue rose by
10 percent to SEK 5,782m. (5,260). In local currency, the upturn was 6 percent.
In Europe, service revenue rose by 6 percent to SEK 15,020 m. (14,180) compared to the full year 2015.
In Latin America, revenue decreased by 1 percent to SEK 2,660 m. (2,698) and revenue in Asia was 11
percent higher than the previous year at SEK 1,998 m. (1,800). In Africa and Oceania, service revenue
rose by 4 percent to SEK 1,393 m. (1,337), while in Eurasia it decreased by 5 percent to SEK 540 m. (570)
compared to the full year 2015.
Earnings Vehicles and Services Full year 2016
Operating income in Vehicles and Services amounted to SEK 5,369 m. (8,601) during the full year 2016.
It was negatively impacted by a provision of SEK 3.8 billion related to the European Commission’s
competition investigation. Adjusted for items affecting comparability, operating income in Vehicles and
Services amounted to SEK 9,169 m. (8,601) during the full year 2016. Higher vehicle volume in Europe
and higher service volume impacted earnings positively but this was partly offset by negative currency rate
effects, lower deliveries in Latin America (mainly related to Brazil), and by the high cost of investments
related to Scania’s new truck generation.
Compared to the full year 2015, the total currency rate effect was negative and amounted to about
SEK 900 m.
Scania’s research and development expenditures amounted to SEK 7,199 m. (7,043). After adjusting for
SEK 1,682 m. (1,863) in capitalised expenditures and SEK 387 m. (393) in depreciation of previously
capitalised expenditures, recognised expenses increased to SEK 5,904 m. (5,573).
The fourth quarter
Operating income in Vehicles and Services totalled SEK 2,401 m. (2,349) during the fourth quarter. Higher
vehicle volume in Europe, high service volume and currency rate effects had a positive impact on earnings.
The high cost of investments related to Scania’s new truck generation and lower deliveries in Latin America
(mainly related to Brazil), had a negative effect.
Compared to the fourth quarter of 2015, the total currency rate effect was positive and amounted to about
SEK 225 m.
5
Scania Year-end Report January-December 2016
Scania’s research and development expenditures amounted to SEK 1,893 m. (1,968). After adjusting for
SEK 449 m. (568) in capitalised expenditures and SEK 102 m. (100) in depreciation of previously
capitalised expenditures, recognised expenses increased to SEK 1,546 m. (1,500).
Financial Services Customer finance portfolio
At the end of 2016, the size of Scania’s customer finance portfolio amounted to SEK 67.9 billion, which
was SEK 11.4 billion higher than the end of 2015. In local currencies, the portfolio increased by SEK 8.0
billion, equivalent to 14.2 percent.
Penetration rate
The penetration rate was 43 (42) percent during the full year 2016 in those markets where Scania has its
own financing operations. The increase was mainly attributable to the market mix.
Operating income
Operating income in Financial Services decreased to SEK 1,015 m. (1,040) for the full year 2016,
compared to 2015. A larger portfolio had a positive impact on earnings while lower margins and negative
currency rate effects had an adverse impact. Bad debt expenses decreased somewhat. In the fourth
quarter, operating income rose by 2 percent to SEK 250 m. (246).
Scania Group During the full year 2016, Scania’s operating income amounted to SEK 6,384 m. (9,641). Operating margin
amounted to 6.1 (10.2) percent. Operating income was negatively impacted by a provision of SEK 3.8
billion related to the European Commission’s competition investigation. Adjusted for items affecting
comparability, operating income amounted to SEK 10,184 m. (9,641) during 2016. Scania’s net financial
items amounted to SEK -421 m (-532).
The Scania Group’s tax expense amounted to SEK 2,720 m. (2,356), equivalent to 27.9 (25.9) percent of
income before taxes when adjusted for items affecting comparability.
Net income for the period totalled SEK 3,243 m. (6,753), equivalent to a net margin of 3.1 (7.1) percent.
Adjusted for items affecting comparability, net income for the period totalled SEK 7,043 m. (6,753),
equivalent to a net margin of 6.8 (7.1) percent.
Cash flow Vehicles and Services Scania’s cash flow in Vehicles and Services amounted to SEK 3,427 m. (4,376) for the full year 2016.
Tied-up working capital decreased by SEK 878 m (1,656).
Net investments amounted to SEK 7,864 m. (7,737) including SEK 1,682 m. (1,863) in capitalisation of
development expenses. At the end of the fourth quarter of 2016, the net cash position in Vehicles and
Services amounted to SEK 10,954 m. compared to a net cash position of SEK 7,579 m. at the end of 2015.
Scania Group Scania’s cash flow in Financial Services amounted to SEK -7,784 m. (-3,816) during the full year 2016 due
to a growing customer finance portfolio. The Group’s net debt increased by about SEK 7.6 billion compared
to the end of 2015 mainly due to investments in the Financial Services portfolio which was partly offset by a
positive cash flow.
6
Scania Year-end Report January-December 2016
Parent Company The assets of the Parent Company, Scania AB, consist of shares in Scania CV AB. Scania CV AB is the
Parent Company of the Group that comprises all production and sales and service companies as well as
other companies. Income before taxes of Scania AB totalled SEK 0 m. (0) during 2016.
Miscellaneous Number of employees At the end of 2016, the number of employees totalled 46,243 compared to 44,409 on the same date in
2015.
Material risks and uncertainty factors The section entitled “Risks and risk management” in Scania’s Annual and Sustainability Report for 2015
describes Scania’s strategic, operational, legal and financial risks. Note 2 of the same report provides a
detailed account of key judgements and estimates. Note 27 of the same report describes the financial
risks, such as currency risk and interest rate risk. The risks that have the greatest impact on financial
performance and on reporting for the Group and the Parent Company are summarised as follows:
a) Sales with obligations
About 15 percent of the vehicles Scania sells are delivered with residual value obligations or repurchase
obligations. These are recognised as operating lease contracts, with the consequence that recognition of
revenue and earnings is allocated over the life of the obligation (contract). If there are major changes in the
market value of used vehicles, this increases the risk of future losses when selling returned vehicles. When
a residual value obligation is deemed likely to cause a future loss, a provision is made in cases where the
expected loss exceeds the as-yet-unrecognised profit on the vehicle.
b) Credit risks
In its Financial Service operations, Scania has an exposure in the form of contractual future payments.
This exposure is reduced by the collateral Scania has in the form of the right to repossess the underlying
vehicle. In case the market value of the collateral does not cover the exposure to the customer, Scania
runs a credit risk. Reserves for probable losses in Financial Service operations are set aside in the
estimated amounts required.
Accounting principles Scania applies International Financial Reporting Standards (IFRSs) as adopted by the EU. This Interim
Report for the Scania Group has been prepared in accordance with IAS 34, “Interim Financial Reporting”
and the Annual Accounts Act. New and revised standards and interpretations that have been applied from
1 January 2016 have not had any significant impact on Scania’s financial statements. Accounting principles
and calculation methods are unchanged from those applied in the Annual Report for 2015.
The Year-end Report for the Parent Company, Scania AB, has been prepared in accordance with the
Annual Accounts Act and recommendation RFR 2, “Accounting for Legal Entities” of the Swedish Financial
Reporting Board.
Dividend and Annual General Meeting Scania held an Extraordinary General Meeting in December 2015 and decided on a dividend of
SEK 9,600 m. The dividend of SEK 9,600 m. corresponded to approximately 50 percent of the net income
for the financial years of 2013, 2014 and 2015.
Scania’s Annual General Meeting for the financial year 2015 was held in Södertälje, Sweden on 11 May
2016.
7
Scania Year-end Report January-December 2016
The board decided on a dividend proposal of SEK 0 for the financial year of 2016. The dividend policy of
distributing approximately 50 percent of the net income over time is still valid, why future dividends can
comprise accumulated earnings from several years.
Contact persons
Susanna Berlin
Investor Relations
Tel. +46 8 553 861 12
Mobil tel. +46 70 086 05 02
Erik Ljungberg
Corporate Relations
Tel. +46 8 553 835 57
Mobile tel. +46 73 988 35 57
8
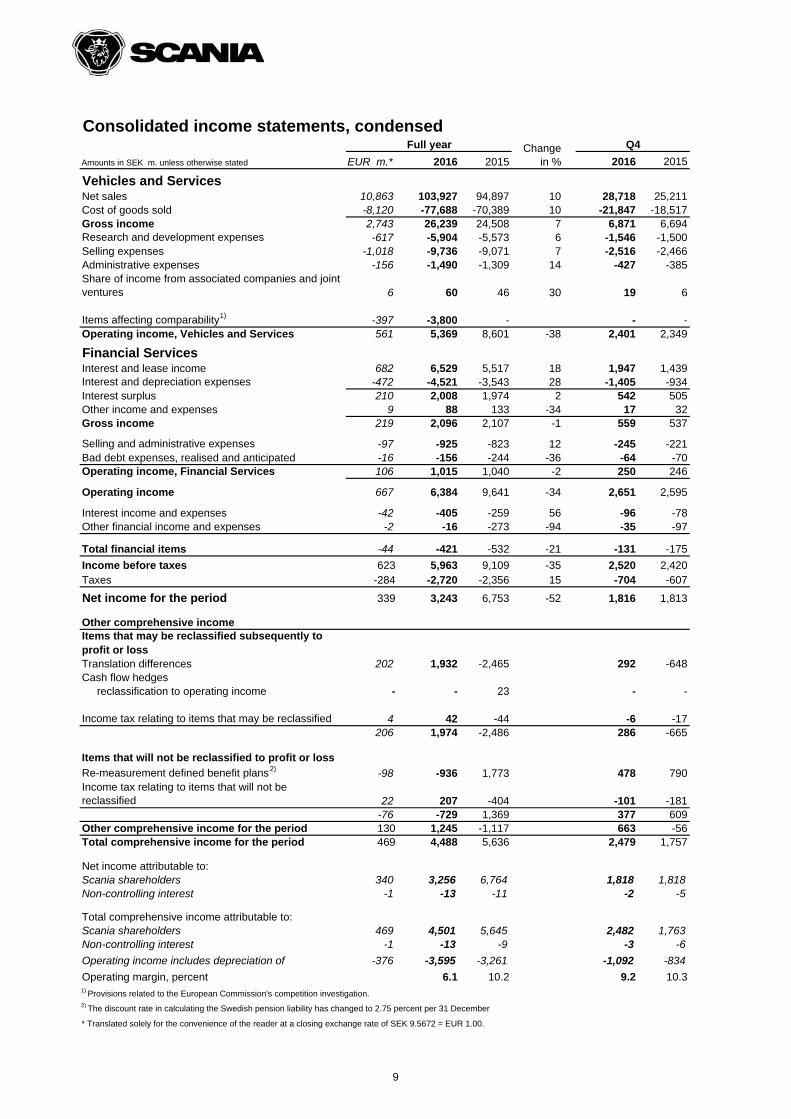
Consolidated income statements, condensed
EUR m.* 2016 2015 2016 2015
Vehicles and ServicesNet sales 10,863 103,927 94,897 10 28,718 25,211Cost of goods sold -8,120 -77,688 -70,389 10 -21,847 -18,517Gross income 2,743 26,239 24,508 7 6,871 6,694Research and development expenses -617 -5,904 -5,573 6 -1,546 -1,500Selling expenses -1,018 -9,736 -9,071 7 -2,516 -2,466Administrative expenses -156 -1,490 -1,309 14 -427 -385Share of income from associated companies and joint ventures 6 60 46 30 19 6
Items affecting comparability1) -397 -3,800 - - -Operating income, Vehicles and Services 561 5,369 8,601 -38 2,401 2,349
Financial ServicesInterest and lease income 682 6,529 5,517 18 1,947 1,439Interest and depreciation expenses -472 -4,521 -3,543 28 -1,405 -934Interest surplus 210 2,008 1,974 2 542 505Other income and expenses 9 88 133 -34 17 32Gross income 219 2,096 2,107 -1 559 537
Selling and administrative expenses -97 -925 -823 12 -245 -221Bad debt expenses, realised and anticipated -16 -156 -244 -36 -64 -70Operating income, Financial Services 106 1,015 1,040 -2 250 246
Operating income 667 6,384 9,641 -34 2,651 2,595
Interest income and expenses -42 -405 -259 56 -96 -78Other financial income and expenses -2 -16 -273 -94 -35 -97
Total financial items -44 -421 -532 -21 -131 -175
Income before taxes 623 5,963 9,109 -35 2,520 2,420Taxes -284 -2,720 -2,356 15 -704 -607
Net income for the period 339 3,243 6,753 -52 1,816 1,813
Other comprehensive incomeItems that may be reclassified subsequently to profit or lossTranslation differences 202 1,932 -2,465 292 -648Cash flow hedges reclassification to operating income - - 23 - -
Income tax relating to items that may be reclassified 4 42 -44 -6 -17206 1,974 -2,486 286 -665
Items that will not be reclassified to profit or loss
Re-measurement defined benefit plans2) -98 -936 1,773 478 790Income tax relating to items that will not be reclassified 22 207 -404 -101 -181
-76 -729 1,369 377 609Other comprehensive income for the period 130 1,245 -1,117 663 -56Total comprehensive income for the period 469 4,488 5,636 2,479 1,757
Net income attributable to:Scania shareholders 340 3,256 6,764 1,818 1,818Non-controlling interest -1 -13 -11 -2 -5
Total comprehensive income attributable to:Scania shareholders 469 4,501 5,645 2,482 1,763Non-controlling interest -1 -13 -9 -3 -6
Operating income includes depreciation of -376 -3,595 -3,261 -1,092 -834
Operating margin, percent 6.1 10.2 9.2 10.31) Provisions related to the European Commission's competition investigation.2) The discount rate in calculating the Swedish pension liability has changed to 2.75 percent per 31 December
* Translated solely for the convenience of the reader at a closing exchange rate of SEK 9.5672 = EUR 1.00.
Amounts in SEK m. unless otherwise stated
Change in %
Q4Full year
9
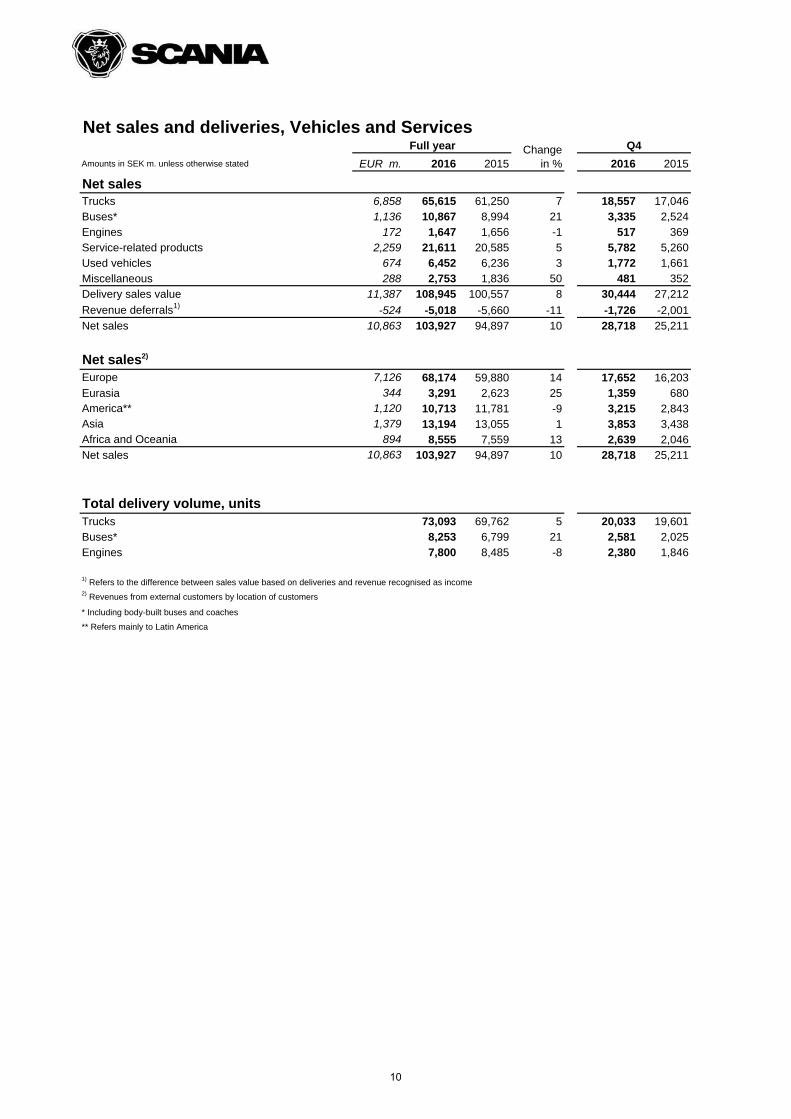
Net sales and deliveries, Vehicles and Services
Amounts in SEK m. unless otherwise stated EUR m. 2016 2015 2016 2015
Net salesTrucks 6,858 65,615 61,250 7 18,557 17,046Buses* 1,136 10,867 8,994 21 3,335 2,524Engines 172 1,647 1,656 -1 517 369Service-related products 2,259 21,611 20,585 5 5,782 5,260Used vehicles 674 6,452 6,236 3 1,772 1,661Miscellaneous 288 2,753 1,836 50 481 352Delivery sales value 11,387 108,945 100,557 8 30,444 27,212
Revenue deferrals1) -524 -5,018 -5,660 -11 -1,726 -2,001Net sales 10,863 103,927 94,897 10 28,718 25,211
Net sales2)
Europe 7,126 68,174 59,880 14 17,652 16,203Eurasia 344 3,291 2,623 25 1,359 680America** 1,120 10,713 11,781 -9 3,215 2,843Asia 1,379 13,194 13,055 1 3,853 3,438Africa and Oceania 894 8,555 7,559 13 2,639 2,046Net sales 10,863 103,927 94,897 10 28,718 25,211
Total delivery volume, unitsTrucks 73,093 69,762 5 20,033 19,601Buses* 8,253 6,799 21 2,581 2,025Engines 7,800 8,485 -8 2,380 1,846
1) Refers to the difference between sales value based on deliveries and revenue recognised as income2) Revenues from external customers by location of customers
* Including body-built buses and coaches
** Refers mainly to Latin America
Full year Change in %
Q4
10
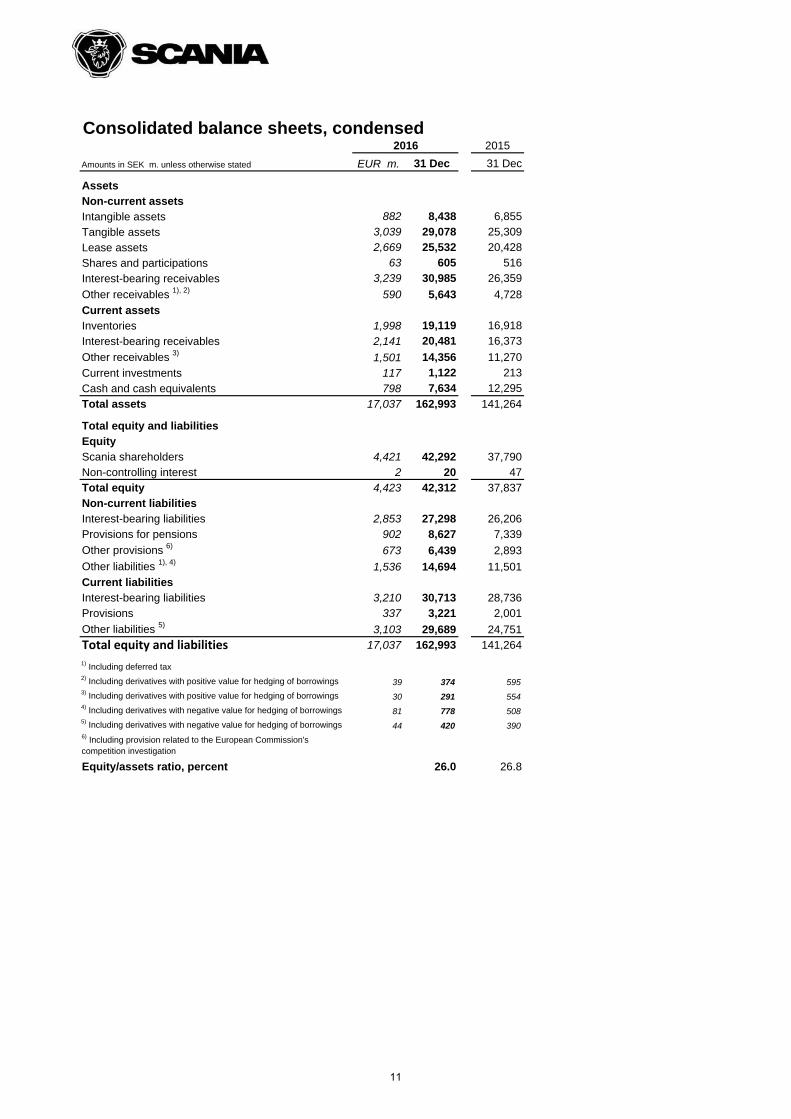
Consolidated balance sheets, condensed
EUR m. 31 Dec 31 Dec
AssetsNon-current assetsIntangible assets 882 8,438 6,855
Tangible assets 3,039 29,078 25,309
Lease assets 2,669 25,532 20,428
Shares and participations 63 605 516
Interest-bearing receivables 3,239 30,985 26,359
Other receivables 1), 2) 590 5,643 4,728
Current assetsInventories 1,998 19,119 16,918
Interest-bearing receivables 2,141 20,481 16,373
Other receivables 3) 1,501 14,356 11,270
Current investments 117 1,122 213
Cash and cash equivalents 798 7,634 12,295
Total assets 17,037 162,993 141,264
Total equity and liabilitiesEquityScania shareholders 4,421 42,292 37,790Non-controlling interest 2 20 47Total equity 4,423 42,312 37,837Non-current liabilitiesInterest-bearing liabilities 2,853 27,298 26,206Provisions for pensions 902 8,627 7,339
Other provisions 6) 673 6,439 2,893
Other liabilities 1), 4) 1,536 14,694 11,501Current liabilitiesInterest-bearing liabilities 3,210 30,713 28,736Provisions 337 3,221 2,001
Other liabilities 5) 3,103 29,689 24,751
Total equity and liabilities 17,037 162,993 141,264
1) Including deferred tax2) Including derivatives with positive value for hedging of borrowings 39 374 5953) Including derivatives with positive value for hedging of borrowings 30 291 5544) Including derivatives with negative value for hedging of borrowings 81 778 5085) Including derivatives with negative value for hedging of borrowings 44 420 3906) Including provision related to the European Commission's competition investigation
Equity/assets ratio, percent 26.0 26.8
2016
Amounts in SEK m. unless otherwise stated
2015
11
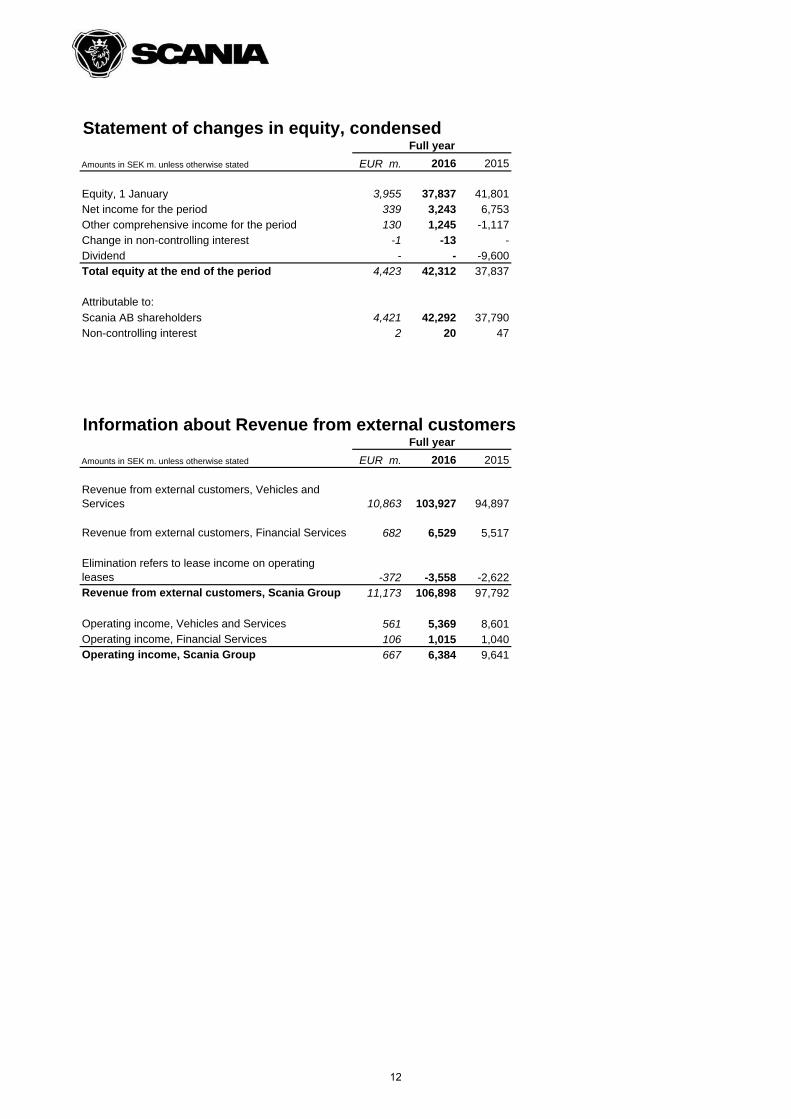
Statement of changes in equity, condensed
Amounts in SEK m. unless otherwise stated EUR m. 2016 2015
Equity, 1 January 3,955 37,837 41,801Net income for the period 339 3,243 6,753Other comprehensive income for the period 130 1,245 -1,117Change in non-controlling interest -1 -13 -Dividend - - -9,600Total equity at the end of the period 4,423 42,312 37,837
Attributable to:
Scania AB shareholders 4,421 42,292 37,790Non-controlling interest 2 20 47
Information about Revenue from external customers
Amounts in SEK m. unless otherwise stated EUR m. 2016 2015
Revenue from external customers, Vehicles and Services 10,863 103,927 94,897
Revenue from external customers, Financial Services 682 6,529 5,517
Elimination refers to lease income on operating leases -372 -3,558 -2,622Revenue from external customers, Scania Group 11,173 106,898 97,792
Operating income, Vehicles and Services 561 5,369 8,601Operating income, Financial Services 106 1,015 1,040Operating income, Scania Group 667 6,384 9,641
Full year
Full year
12
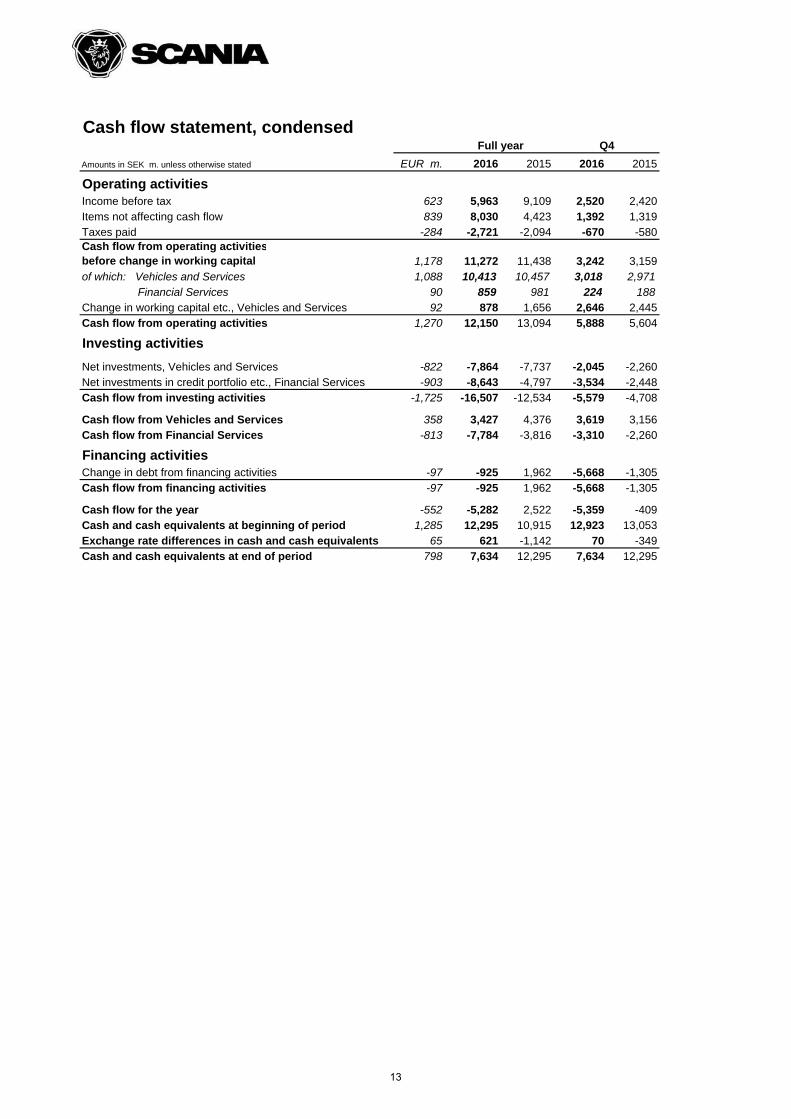
Cash flow statement, condensed
EUR m. 2016 2015 2016 2015
Operating activitiesIncome before tax 623 5,963 9,109 2,520 2,420Items not affecting cash flow 839 8,030 4,423 1,392 1,319Taxes paid -284 -2,721 -2,094 -670 -580Cash flow from operating activitiesbefore change in working capital 1,178 11,272 11,438 3,242 3,159of which: Vehicles and Services 1,088 10,413 10,457 3,018 2,971 Financial Services 90 859 981 224 188Change in working capital etc., Vehicles and Services 92 878 1,656 2,646 2,445Cash flow from operating activities 1,270 12,150 13,094 5,888 5,604
Investing activities
Net investments, Vehicles and Services -822 -7,864 -7,737 -2,045 -2,260Net investments in credit portfolio etc., Financial Services -903 -8,643 -4,797 -3,534 -2,448Cash flow from investing activities -1,725 -16,507 -12,534 -5,579 -4,708
Cash flow from Vehicles and Services 358 3,427 4,376 3,619 3,156Cash flow from Financial Services -813 -7,784 -3,816 -3,310 -2,260
Financing activitiesChange in debt from financing activities -97 -925 1,962 -5,668 -1,305Cash flow from financing activities -97 -925 1,962 -5,668 -1,305
Cash flow for the year -552 -5,282 2,522 -5,359 -409Cash and cash equivalents at beginning of period 1,285 12,295 10,915 12,923 13,053Exchange rate differences in cash and cash equivalents 65 621 -1,142 70 -349Cash and cash equivalents at end of period 798 7,634 12,295 7,634 12,295
Amounts in SEK m. unless otherwise stated
Full year Q4
13
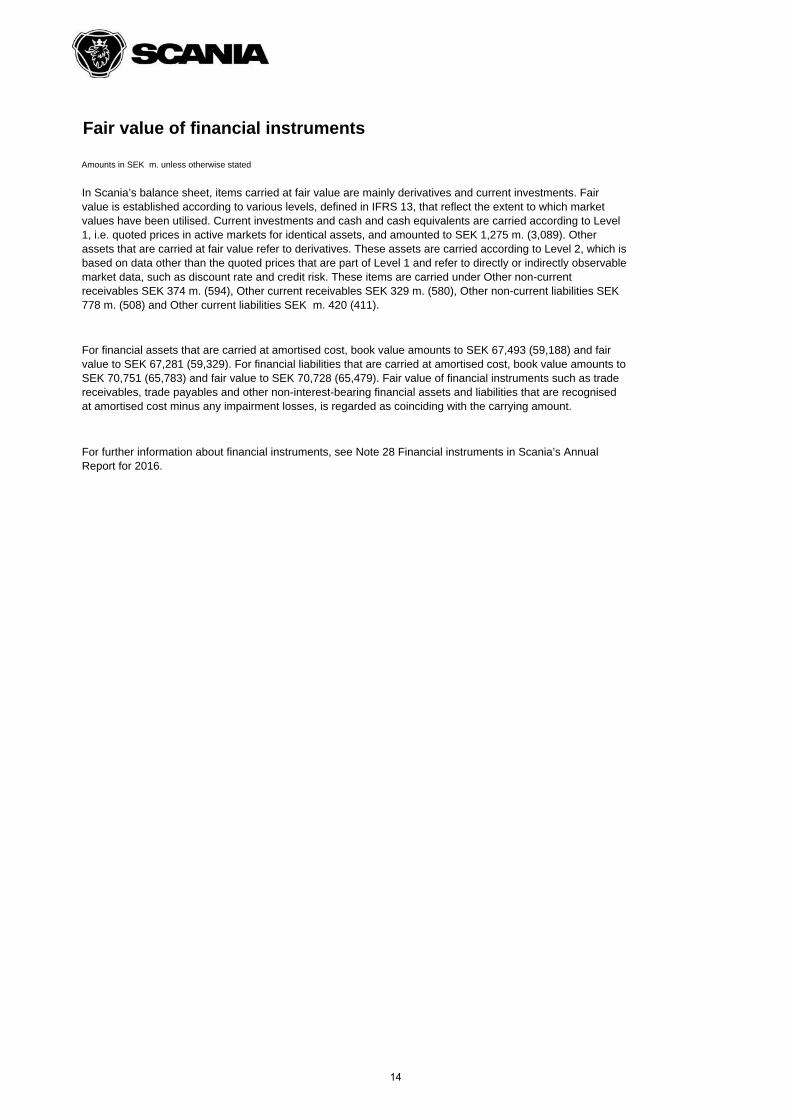
Fair value of financial instruments
Amounts in SEK m. unless otherwise stated
For further information about financial instruments, see Note 28 Financial instruments in Scania’s Annual Report for 2016.
In Scania’s balance sheet, items carried at fair value are mainly derivatives and current investments. Fair value is established according to various levels, defined in IFRS 13, that reflect the extent to which market values have been utilised. Current investments and cash and cash equivalents are carried according to Level 1, i.e. quoted prices in active markets for identical assets, and amounted to SEK 1,275 m. (3,089). Other assets that are carried at fair value refer to derivatives. These assets are carried according to Level 2, which is based on data other than the quoted prices that are part of Level 1 and refer to directly or indirectly observable market data, such as discount rate and credit risk. These items are carried under Other non-current receivables SEK 374 m. (594), Other current receivables SEK 329 m. (580), Other non-current liabilities SEK 778 m. (508) and Other current liabilities SEK m. 420 (411).
For financial assets that are carried at amortised cost, book value amounts to SEK 67,493 (59,188) and fair value to SEK 67,281 (59,329). For financial liabilities that are carried at amortised cost, book value amounts to SEK 70,751 (65,783) and fair value to SEK 70,728 (65,479). Fair value of financial instruments such as trade receivables, trade payables and other non-interest-bearing financial assets and liabilities that are recognised at amortised cost minus any impairment losses, is regarded as coinciding with the carrying amount.
14
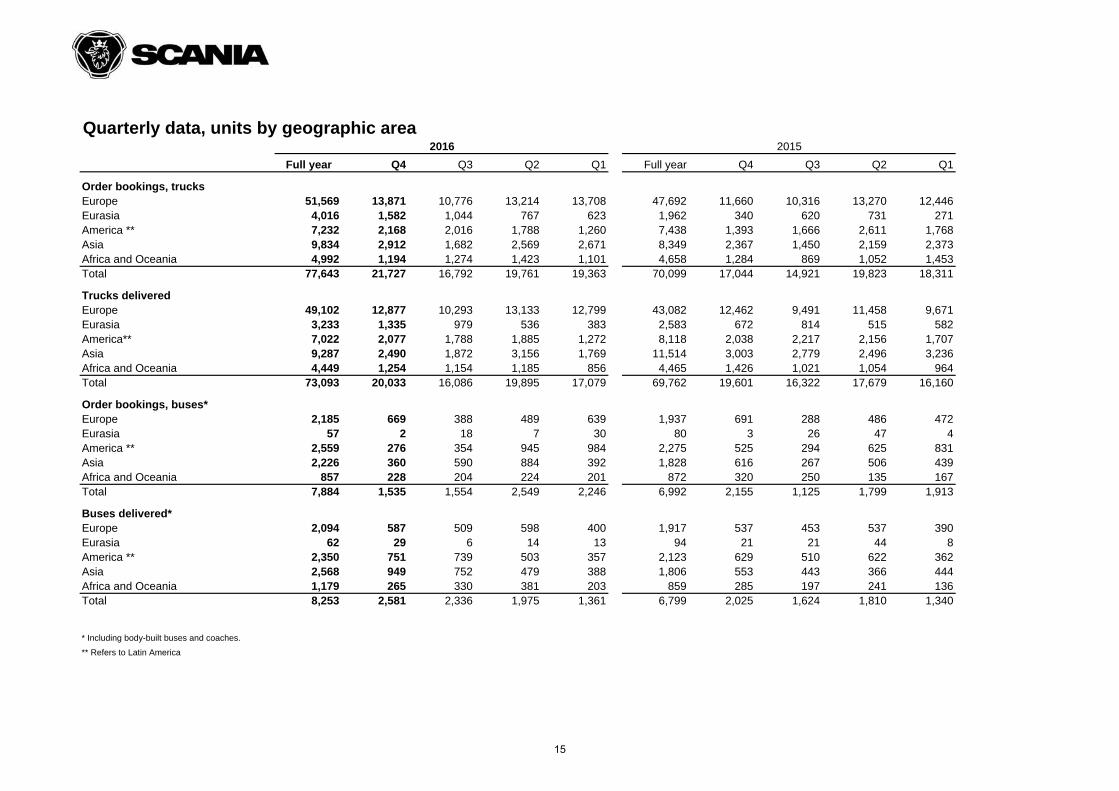
Quarterly data, units by geographic area
Full year Q4 Q3 Q2 Q1 Full year Q4 Q3 Q2 Q1
Order bookings, trucksEurope 51,569 13,871 10,776 13,214 13,708 47,692 11,660 10,316 13,270 12,446Eurasia 4,016 1,582 1,044 767 623 1,962 340 620 731 271America ** 7,232 2,168 2,016 1,788 1,260 7,438 1,393 1,666 2,611 1,768Asia 9,834 2,912 1,682 2,569 2,671 8,349 2,367 1,450 2,159 2,373Africa and Oceania 4,992 1,194 1,274 1,423 1,101 4,658 1,284 869 1,052 1,453Total 77,643 21,727 16,792 19,761 19,363 70,099 17,044 14,921 19,823 18,311
Trucks deliveredEurope 49,102 12,877 10,293 13,133 12,799 43,082 12,462 9,491 11,458 9,671Eurasia 3,233 1,335 979 536 383 2,583 672 814 515 582America** 7,022 2,077 1,788 1,885 1,272 8,118 2,038 2,217 2,156 1,707Asia 9,287 2,490 1,872 3,156 1,769 11,514 3,003 2,779 2,496 3,236Africa and Oceania 4,449 1,254 1,154 1,185 856 4,465 1,426 1,021 1,054 964Total 73,093 20,033 16,086 19,895 17,079 69,762 19,601 16,322 17,679 16,160
Order bookings, buses*Europe 2,185 669 388 489 639 1,937 691 288 486 472Eurasia 57 2 18 7 30 80 3 26 47 4America ** 2,559 276 354 945 984 2,275 525 294 625 831Asia 2,226 360 590 884 392 1,828 616 267 506 439Africa and Oceania 857 228 204 224 201 872 320 250 135 167Total 7,884 1,535 1,554 2,549 2,246 6,992 2,155 1,125 1,799 1,913
Buses delivered*Europe 2,094 587 509 598 400 1,917 537 453 537 390Eurasia 62 29 6 14 13 94 21 21 44 8America ** 2,350 751 739 503 357 2,123 629 510 622 362Asia 2,568 949 752 479 388 1,806 553 443 366 444Africa and Oceania 1,179 265 330 381 203 859 285 197 241 136Total 8,253 2,581 2,336 1,975 1,361 6,799 2,025 1,624 1,810 1,340
* Including body-built buses and coaches.
** Refers to Latin America
20152016
15
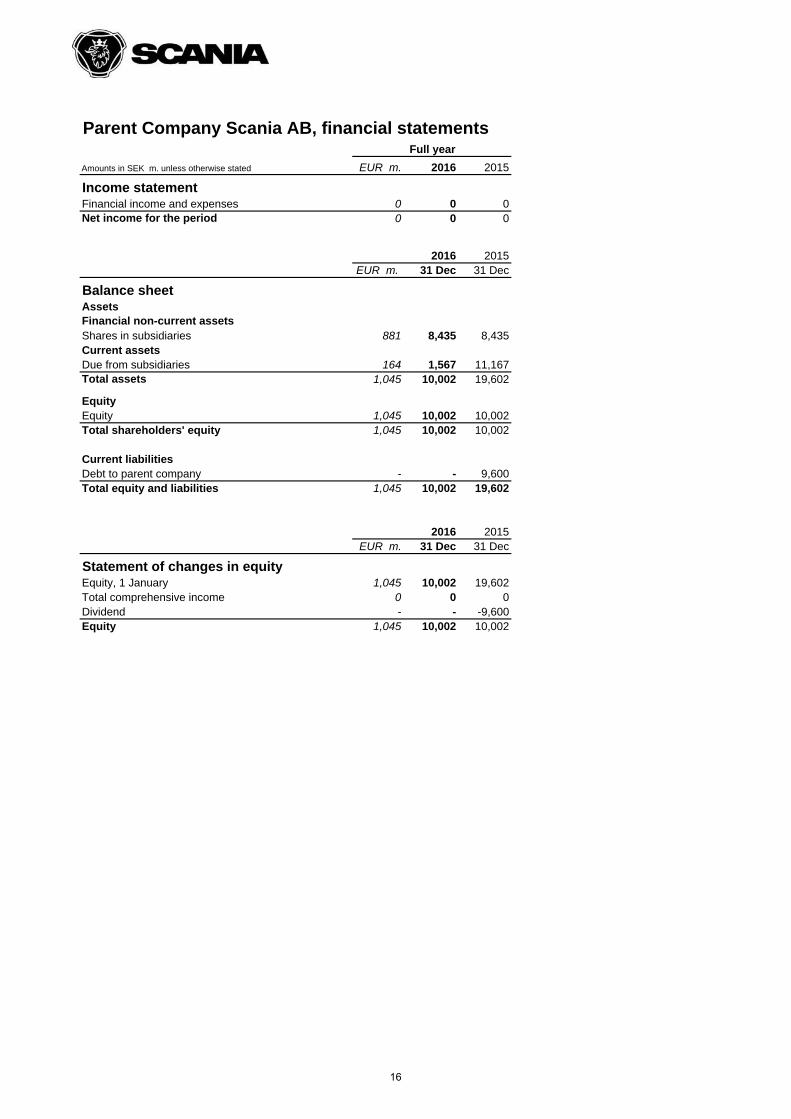
Parent Company Scania AB, financial statements
EUR m. 2016 2015
Income statementFinancial income and expenses 0 0 0Net income for the period 0 0 0
2016 2015EUR m. 31 Dec 31 Dec
Balance sheetAssetsFinancial non-current assetsShares in subsidiaries 881 8,435 8,435Current assetsDue from subsidiaries 164 1,567 11,167Total assets 1,045 10,002 19,602
EquityEquity 1,045 10,002 10,002Total shareholders' equity 1,045 10,002 10,002
Current liabilitiesDebt to parent company - - 9,600Total equity and liabilities 1,045 10,002 19,602
2016 2015EUR m. 31 Dec 31 Dec
Statement of changes in equityEquity, 1 January 1,045 10,002 19,602Total comprehensive income 0 0 0Dividend - - -9,600Equity 1,045 10,002 10,002
Amounts in SEK m. unless otherwise stated
Full year
16
Key financial ratios and figures
DEFINITIONS
Operating margin
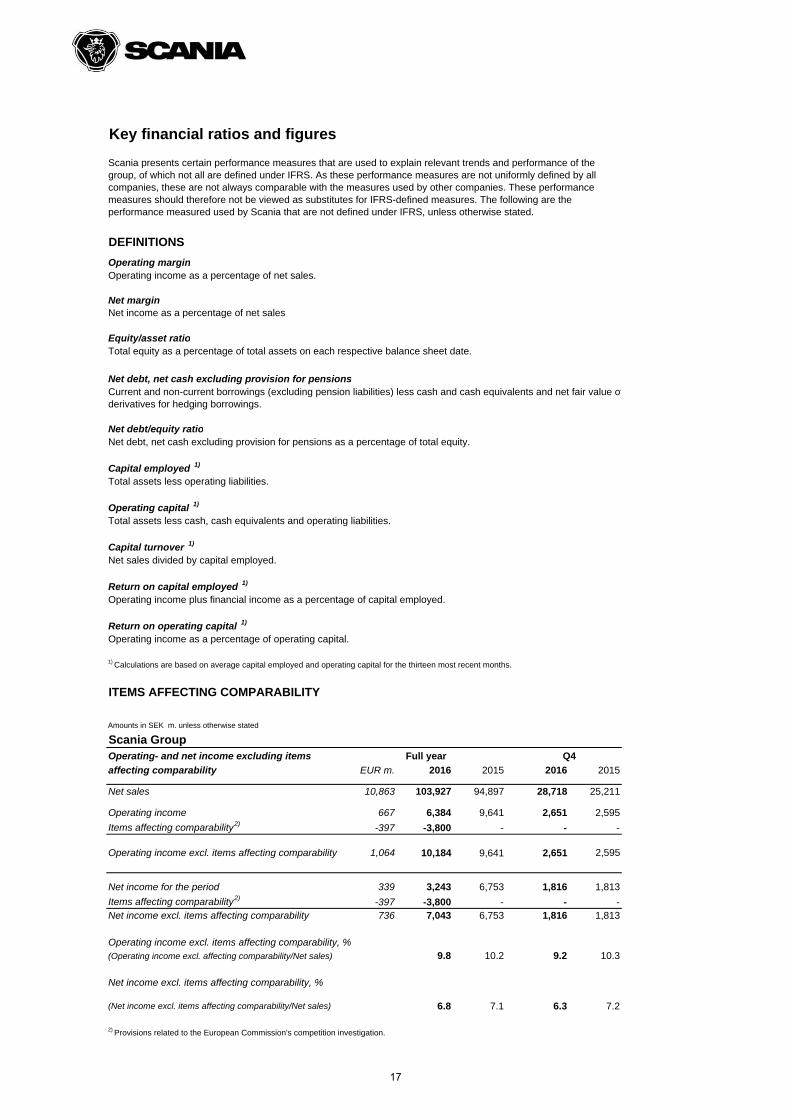
Net marginNet income as a percentage of net sales.
Equity/asset ratio
Net debt/equity ratio
Capital employed 1)
Operating capital 1)
Capital turnover 1)
Return on capital employed 1)
Return on operating capital 1)
ITEMS AFFECTING COMPARABILITY
Amounts in SEK m. unless otherwise stated
Scania GroupOperating- and net income excluding items
affecting comparability EUR m. 2016 2015 2016 2015
Net sales 10,863 103,927 94,897 28,718 25,211
Operating income 667 6,384 9,641 2,651 2,595
Items affecting comparability2) -397 -3,800 - - -
Operating income excl. items affecting comparability 1,064 10,184 9,641 2,651 2,595
Net income for the period 339 3,243 6,753 1,816 1,813
Items affecting comparability2) -397 -3,800 - - -Net income excl. items affecting comparability 736 7,043 6,753 1,816 1,813
Operating income excl. items affecting comparability, %(Operating income excl. affecting comparability/Net sales) 9.8 10.2 9.2 10.3
Net income excl. items affecting comparability, %
(Net income excl. items affecting comparability/Net sales) 6.8 7.1 6.3 7.2
2) Provisions related to the European Commission's competition investigation.
Q4
Scania presents certain performance measures that are used to explain relevant trends and performance of the group, of which not all are defined under IFRS. As these performance measures are not uniformly defined by all companies, these are not always comparable with the measures used by other companies. These performance measures should therefore not be viewed as substitutes for IFRS-defined measures. The following are the performance measured used by Scania that are not defined under IFRS, unless otherwise stated.
Operating income as a percentage of net sales.
Total equity as a percentage of total assets on each respective balance sheet date.
Current and non-current borrowings (excluding pension liabilities) less cash and cash equivalents and net fair value ofderivatives for hedging borrowings.
Net debt, net cash excluding provision for pensions as a percentage of total equity.
Total assets less operating liabilities.
Total assets less cash, cash equivalents and operating liabilities.
Net sales divided by capital employed.
Operating income plus financial income as a percentage of capital employed.
Operating income as a percentage of operating capital.
Net debt, net cash excluding provision for pensions
1) Calculations are based on average capital employed and operating capital for the thirteen most recent months.
Full year
17
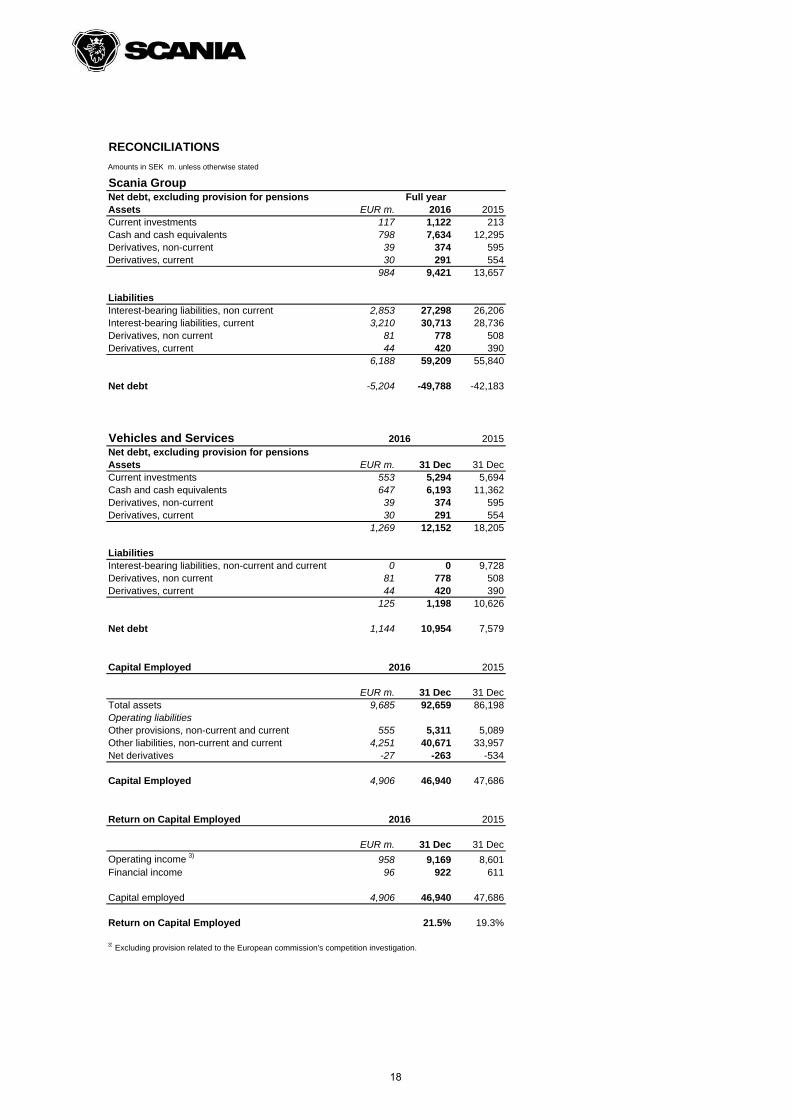
RECONCILIATIONS
Amounts in SEK m. unless otherwise stated
Scania GroupNet debt, excluding provision for pensionsAssets EUR m. 2016 2015Current investments 117 1,122 213Cash and cash equivalents 798 7,634 12,295Derivatives, non-current 39 374 595Derivatives, current 30 291 554
984 9,421 13,657
LiabilitiesInterest-bearing liabilities, non current 2,853 27,298 26,206Interest-bearing liabilities, current 3,210 30,713 28,736Derivatives, non current 81 778 508Derivatives, current 44 420 390
6,188 59,209 55,840
Net debt -5,204 -49,788 -42,183
Vehicles and Services 2015Net debt, excluding provision for pensionsAssets EUR m. 31 Dec 31 DecCurrent investments 553 5,294 5,694Cash and cash equivalents 647 6,193 11,362Derivatives, non-current 39 374 595Derivatives, current 30 291 554
1,269 12,152 18,205
LiabilitiesInterest-bearing liabilities, non-current and current 0 0 9,728Derivatives, non current 81 778 508Derivatives, current 44 420 390
125 1,198 10,626
Net debt 1,144 10,954 7,579
Capital Employed 2015
EUR m. 31 Dec 31 DecTotal assets 9,685 92,659 86,198Operating liabilitiesOther provisions, non-current and current 555 5,311 5,089Other liabilities, non-current and current 4,251 40,671 33,957Net derivatives -27 -263 -534
Capital Employed 4,906 46,940 47,686
Return on Capital Employed 2015
EUR m. 31 Dec 31 Dec
Operating income 3) 958 9,169 8,601Financial income 96 922 611
Capital employed 4,906 46,940 47,686
Return on Capital Employed 21.5% 19.3%
3) Excluding provision related to the European commission's competition investigation.
Full year
2016
2016
2016
18