Embed Size (px)
Citation preview
The Customer Experience
Nigel H.M. Wilson
Professor of Civil & Environmental Engineering
MIT
email: [email protected]
1 BRT Workshop: Experiences and Challenges
September 2013
Outline
• The changing environment and customer expectations
• Customer Information Strategies
• Recent Research
• OD Matrix Estimation
• Measuring Service Reliability
• Role for Customer Surveys
• Customer Classification
• Summary and Prospects
2 Nigel Wilson, BRT Workshop: Experiences and Challenges
September 2013
The Changing Environment and Customer Expectations
• Many customers expect a personal relationship with service providers, e.g., Amazon
• Information technology advances provide raised expectations and new opportunities
• Wireless communications raise expectations for good real-time information
• Rising incomes result in more choice riders and fewer captive riders
• Finance for capital and operations remains a challenge
3 Nigel Wilson, BRT Workshop: Experiences and Challenges
September 2013
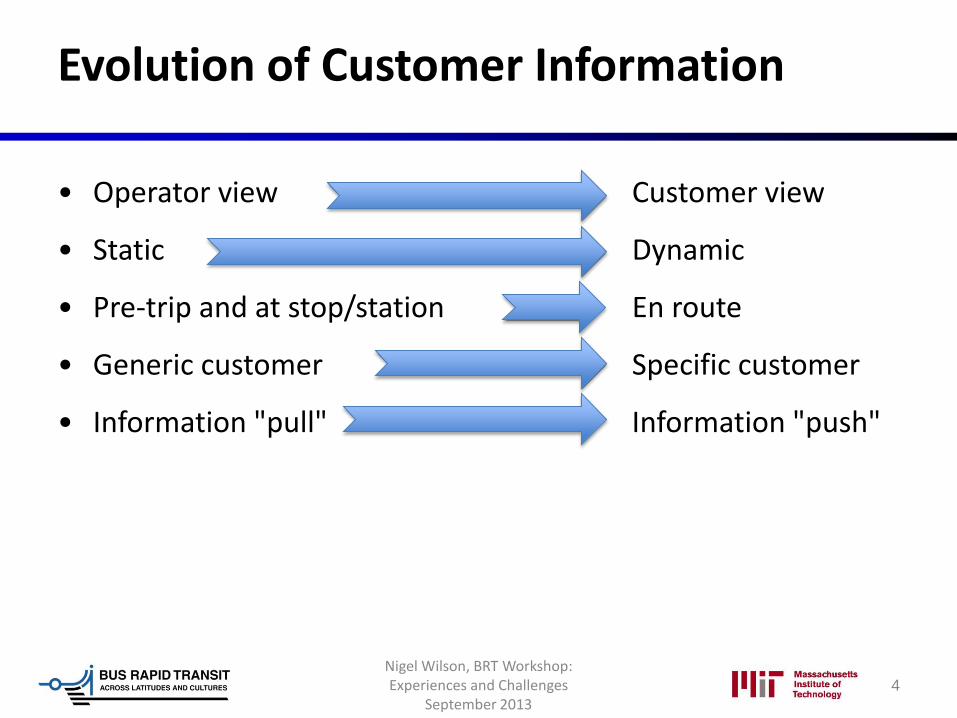
Evolution of Customer Information
• Operator view Customer view
• Static Dynamic
• Pre-trip and at stop/station En route
• Generic customer Specific customer
• Information "pull" Information "push"
4 4
Nigel Wilson, BRT Workshop: Experiences and Challenges
September 2013
Enabling Technologies
• AVL provides current vehicle locations
• Automated scheduling systems make service plan accessible
• Google Transit standard formats provide universal trip planning
• GPS- and WIFI cell phones provide current customer location
• AFC provides database on individual trip-making
• Wireless communication/Internet apps
5 5
Nigel Wilson, BRT Workshop: Experiences and Challenges
September 2013
State of Research/Knowledge in CI
• Pre-trip journey planner systems widely deployed but with limited functionality in terms of recognizing individual preferences (e.g., Google Transit)
• Next vehicle arrival times at stops/stations well developed and increasingly widely deployed
• both often strongly reliant on veracity of service schedules
• ineffective in dealing with disrupted service
• Real-time mobile phone information
• open data • many new apps, some great, some not so great
• Google's entry may be game-changer in the long run
6
Nigel Wilson, BRT Workshop: Experiences and Challenges
September 2013
Example of Well-Designed Mobile Web App: NextBus.com/webkit
• First finds your location
• Lists all services and nearest stops for each within 1/4 mile radius
• Scrolls to show next two vehicles for each service in each direction
• www.nextbus.com/webkit
7
Nigel Wilson, BRT Workshop: Experiences and Challenges
September 2013
Emerging Possibilities
• Exception-based CI based on stated and revealed individual preferences, typical individual trip-making, and current AVL data
• Integration of AFC and CI functions through payment-capable cell phones
• Can CI actually attract more customers?
• multi-modal trip planner/navigation systems
8
Nigel Wilson, BRT Workshop: Experiences and Challenges
September 2013
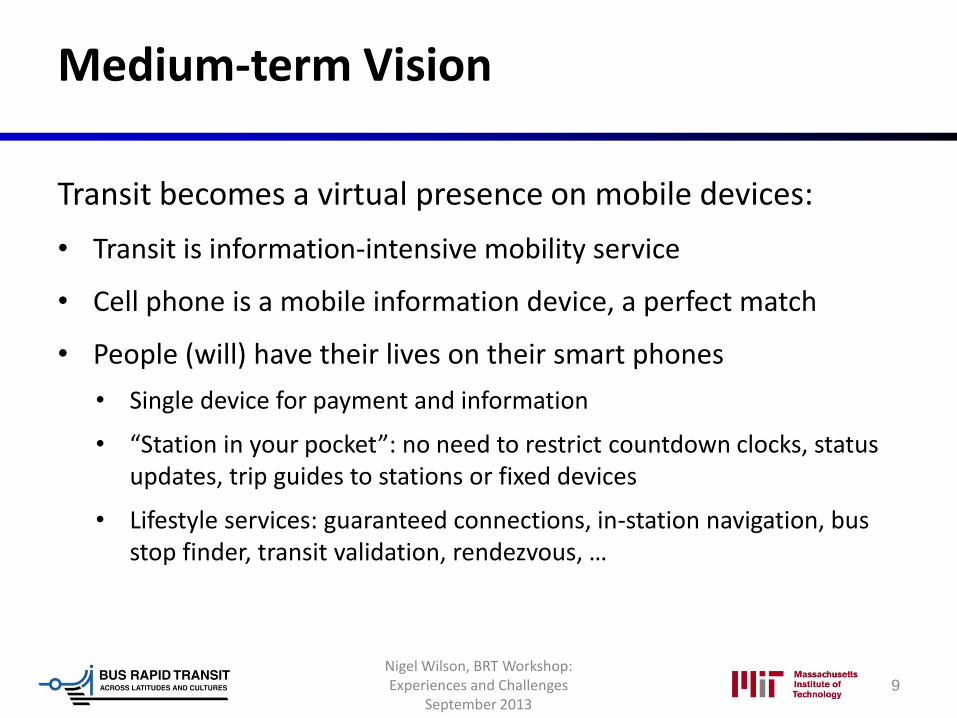
Medium-term Vision
Transit becomes a virtual presence on mobile devices:
• Transit is information-intensive mobility service
• Cell phone is a mobile information device, a perfect match
• People (will) have their lives on their smart phones
• Single device for payment and information
• “Station in your pocket”: no need to restrict countdown clocks, status updates, trip guides to stations or fixed devices
• Lifestyle services: guaranteed connections, in-station navigation, bus stop finder, transit validation, rendezvous, …
9
Nigel Wilson, BRT Workshop: Experiences and Challenges
September 2013
Recent Research
• OD Matrix Estimation
• Measuring Service Reliability
• Roles for Customer Surveys
• Customer Classification
10 Nigel Wilson, BRT Workshop: Experiences and Challenges
September 2013
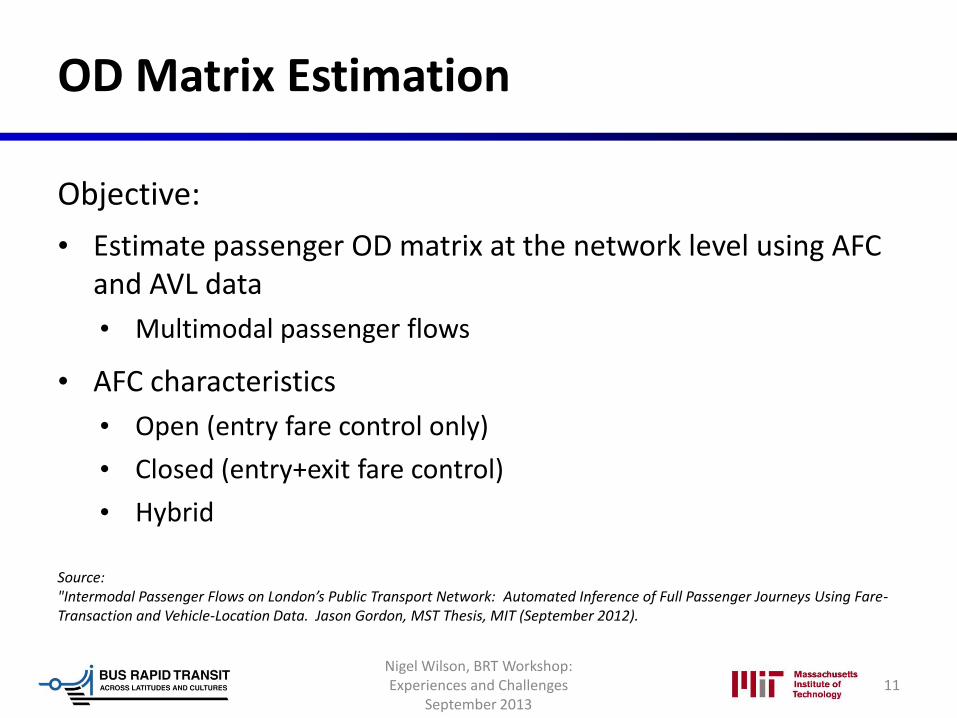
OD Matrix Estimation
Objective:
• Estimate passenger OD matrix at the network level using AFC and AVL data
• Multimodal passenger flows
• AFC characteristics
• Open (entry fare control only)
• Closed (entry+exit fare control)
• Hybrid
11
Source: "Intermodal Passenger Flows on London’s Public Transport Network: Automated Inference of Full Passenger Journeys Using Fare-Transaction and Vehicle-Location Data. Jason Gordon, MST Thesis, MIT (September 2012).
Nigel Wilson, BRT Workshop: Experiences and Challenges
September 2013
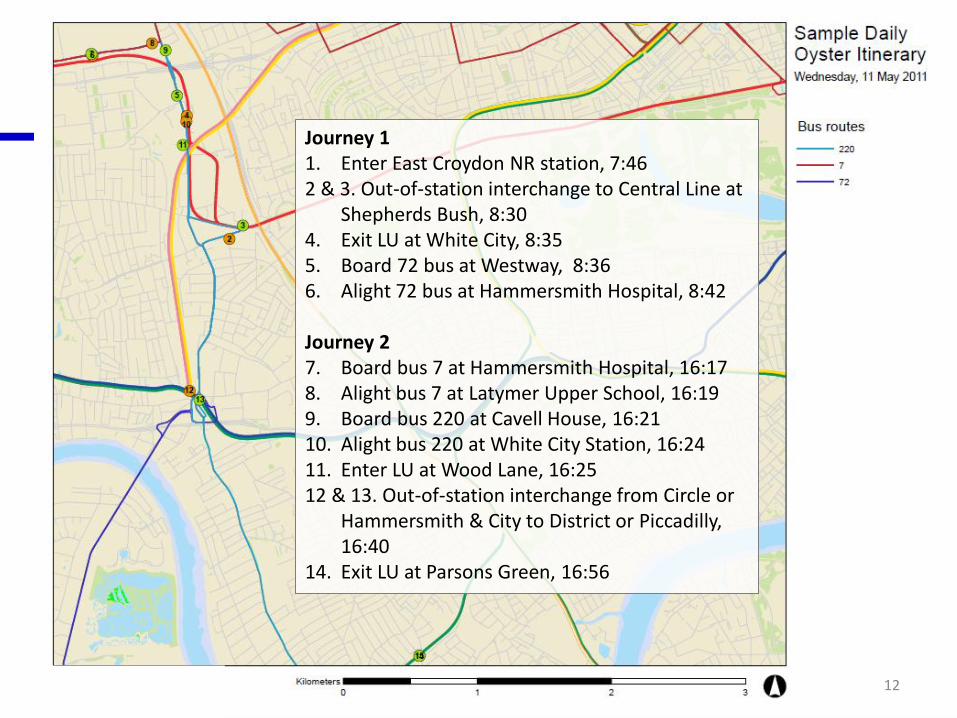
Journey 1 1. Enter East Croydon NR station, 7:46 2 & 3. Out-of-station interchange to Central Line at
Shepherds Bush, 8:30 4. Exit LU at White City, 8:35 5. Board 72 bus at Westway, 8:36 6. Alight 72 bus at Hammersmith Hospital, 8:42
Journey 2 7. Board bus 7 at Hammersmith Hospital, 16:17 8. Alight bus 7 at Latymer Upper School, 16:19 9. Board bus 220 at Cavell House, 16:21 10. Alight bus 220 at White City Station, 16:24 11. Enter LU at Wood Lane, 16:25 12 & 13. Out-of-station interchange from Circle or
Hammersmith & City to District or Piccadilly, 16:40
14. Exit LU at Parsons Green, 16:56
12
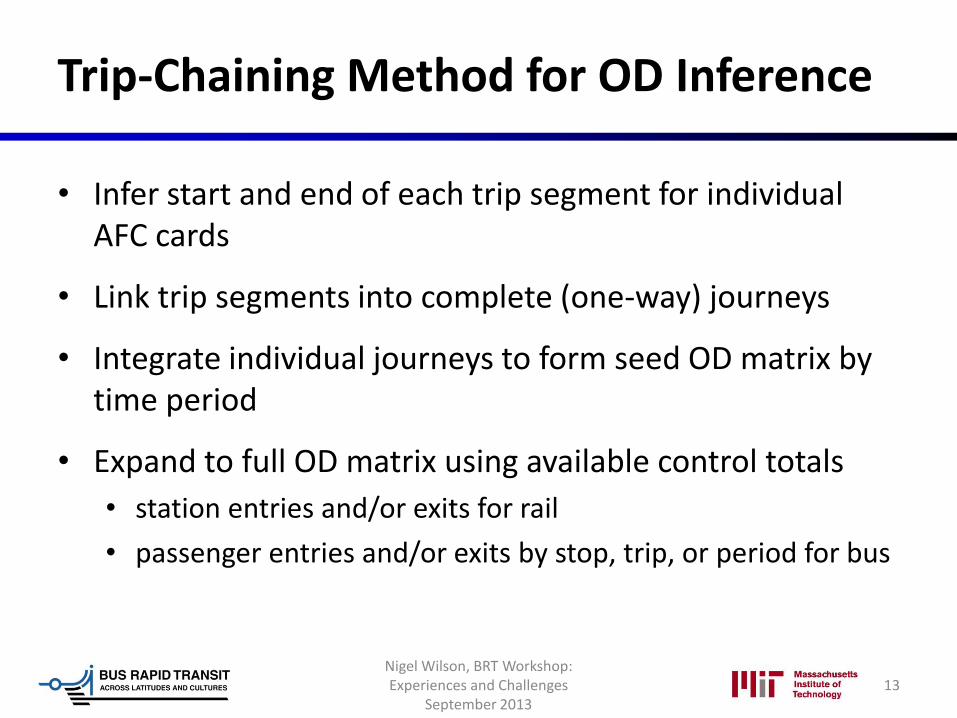
Trip-Chaining Method for OD Inference
• Infer start and end of each trip segment for individual AFC cards
• Link trip segments into complete (one-way) journeys
• Integrate individual journeys to form seed OD matrix by time period
• Expand to full OD matrix using available control totals
• station entries and/or exits for rail
• passenger entries and/or exits by stop, trip, or period for bus
13 Nigel Wilson, BRT Workshop: Experiences and Challenges
September 2013
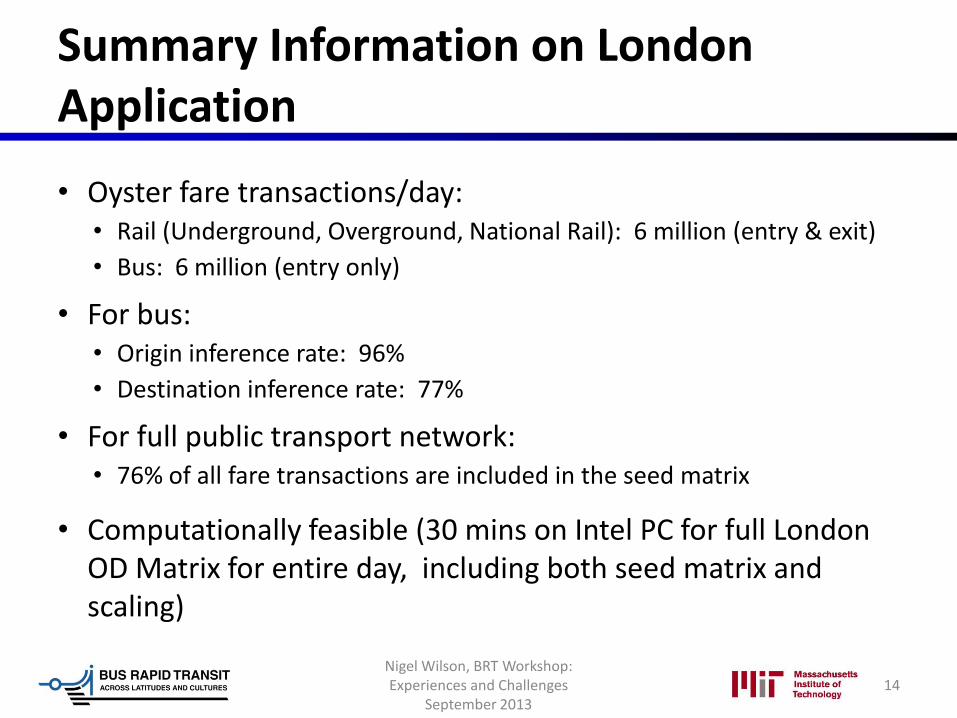
Summary Information on London Application
• Oyster fare transactions/day: • Rail (Underground, Overground, National Rail): 6 million (entry & exit)
• Bus: 6 million (entry only)
• For bus: • Origin inference rate: 96%
• Destination inference rate: 77%
• For full public transport network: • 76% of all fare transactions are included in the seed matrix
• Computationally feasible (30 mins on Intel PC for full London OD Matrix for entire day, including both seed matrix and scaling)
14 Nigel Wilson, BRT Workshop: Experiences and Challenges
September 2013
Reliability Metrics
• Goal: characterize transit service reliability from passenger's perspective
• Application: London rail services • entry and exit fare transactions • train tracking data
• Application: London bus services • typically high frequency • entry fare transactions only
15
Sources:
"Service Reliability Measurement Framework using Smart Card Data: Application to the London Underground." David Uniman, MST Thesis, MIT (2009)
"Automatic Data for Applied Railway Management: Passenger Demand, Service Quality Measurement, and Tactical Planning on the London Overground Network." Michael Frumin, MST Thesis, MIT (2010)
"Applications of Automatic Vehicle Location Systems Towards Improving Service Reliability and Operations Planning in London." Joseph Ehrlich, MST Thesis, MIT (2010)
Nigel Wilson, BRT Workshop: Experiences and Challenges
September 2013

Excess Journey Time (EJT)
16
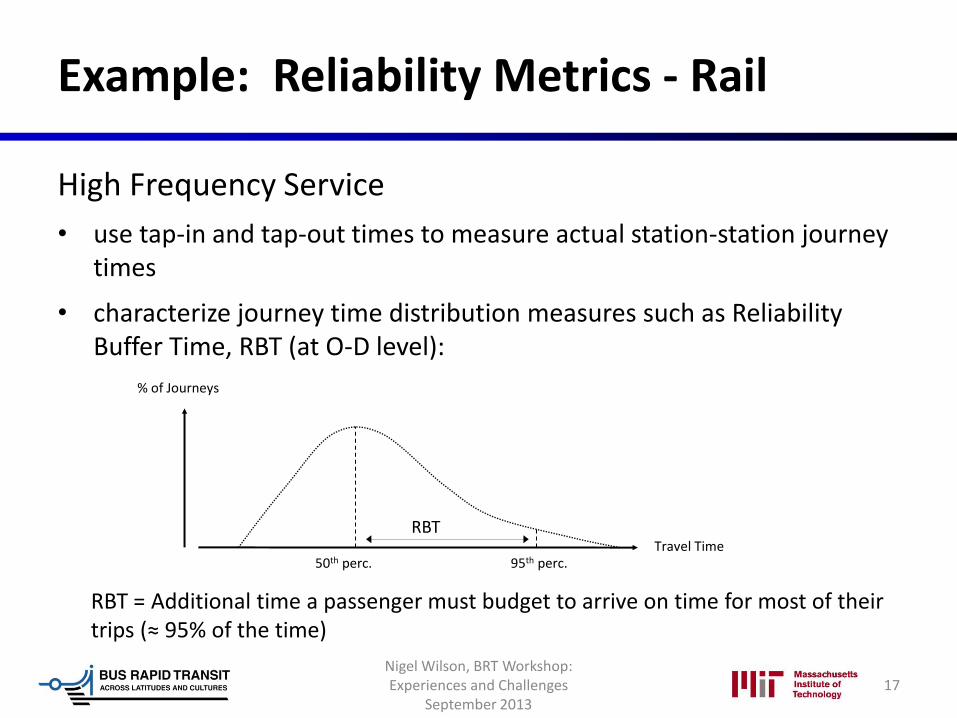
Example: Reliability Metrics - Rail
High Frequency Service
• use tap-in and tap-out times to measure actual station-station journey times
• characterize journey time distribution measures such as Reliability Buffer Time, RBT (at O-D level):
17
RBT = Additional time a passenger must budget to arrive on time for most of their trips (≈ 95% of the time)
50th perc.
% of Journeys
Travel Time 95th perc.
RBT
Nigel Wilson, BRT Workshop: Experiences and Challenges
September 2013
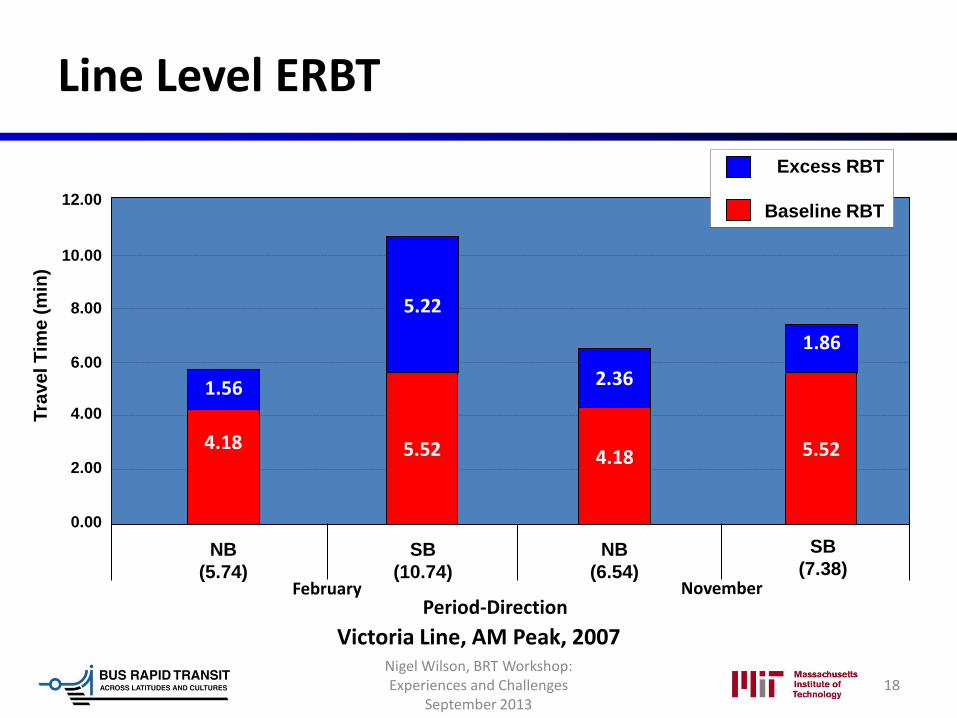
Line Level ERBT
18
Victoria Line, AM Peak, 2007
Tra
ve
l T
ime
(m
in)
February November
NB
(5.74)
SB
(10.74)
NB
(6.54)
SB
(7.38)
12.00
10.00
8.00
6.00
4.00
2.00
0.00
Excess RBT
Baseline RBT
4.18 5.52 4.18 5.52
1.56
5.22
2.36
1.86
Period-Direction
Nigel Wilson, BRT Workshop: Experiences and Challenges
September 2013
Reliability Metrics: Bus
Challenge to measure passenger journey time because:
• no tap-off, just tap-on
• tap-on occurs after wait at stop, but wait is an important part of journey time
Strategy:
• trip-chaining to infer destination for all possible boardings
• AVL to estimate: • average passenger wait time (based on assumed passenger arrival
process)
• actual in-vehicle time
19 Nigel Wilson, BRT Workshop: Experiences and Challenges
September 2013
Role for Customer Surveys
• Agencies/operators have traditionally relied on customer surveys for data on:
• multi-modal trip-making
• demographics
• attitudes and perceptions
• Surveys provide the base for travel demand modeling
• Surveys will remain important, but can they be more cost-effective and reliable?
• Research in London compared Oyster records with LTDS (Household survey) responses for approximately 4,000 individuals in 2011-2012
20 Nigel Wilson, BRT Workshop: Experiences and Challenges
September 2013
Concerns with Household Surveys
• Expensive and usually conducted infrequently
• Public Transport trips may not be fully captured
• Gathering representative data is becoming more difficult
• Large journey sample over multiple days is desired for public transport planning purposes
• Relies on respondent’s memory
21 Nigel Wilson, BRT Workshop: Experiences and Challenges
September 2013
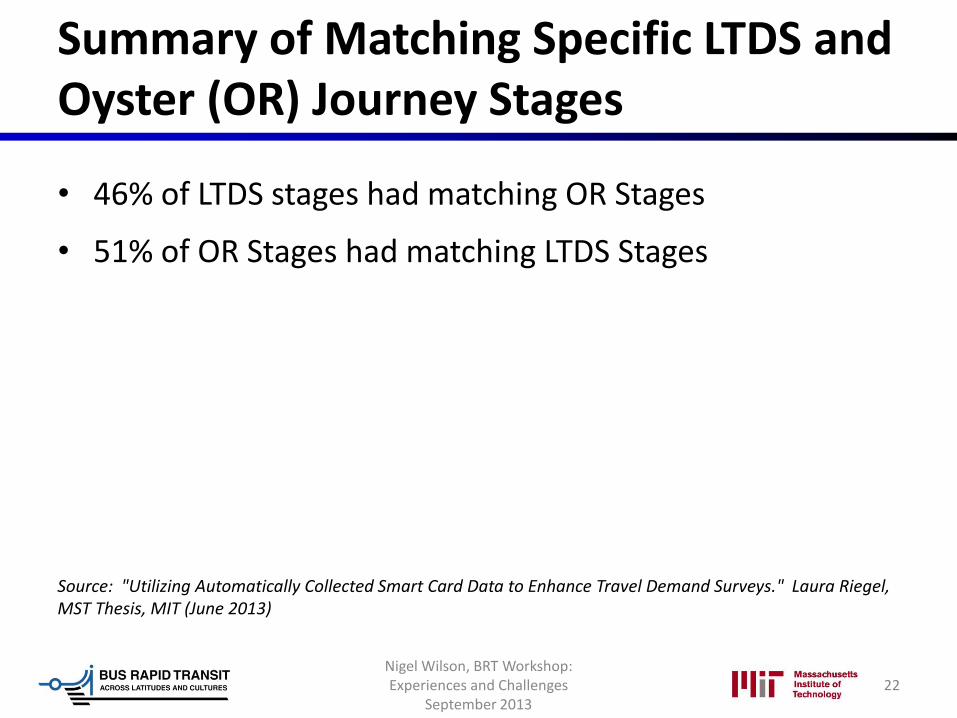
Summary of Matching Specific LTDS and Oyster (OR) Journey Stages
• 46% of LTDS stages had matching OR Stages
• 51% of OR Stages had matching LTDS Stages
Source: "Utilizing Automatically Collected Smart Card Data to Enhance Travel Demand Surveys." Laura Riegel, MST Thesis, MIT (June 2013)
22 Nigel Wilson, BRT Workshop: Experiences and Challenges
September 2013
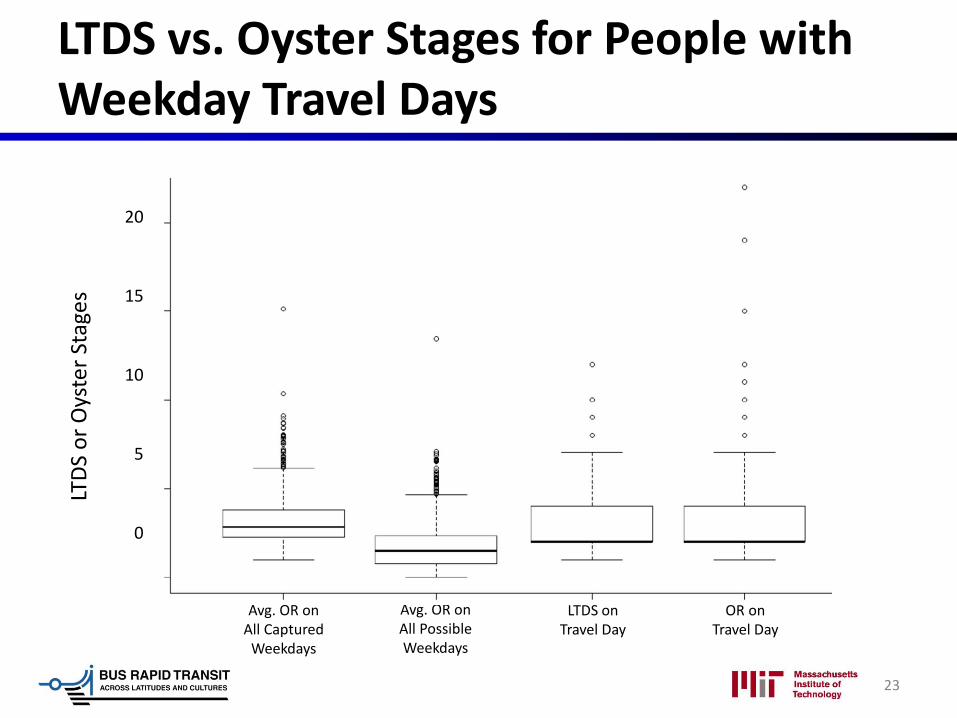
LTDS vs. Oyster Stages for People with Weekday Travel Days
23
Avg. OR on All Captured
Weekdays
Avg. OR on All Possible Weekdays
LTDS on Travel Day
OR on Travel Day
LTD
S o
r O
yste
r St
ages
20
15
10
5
0
Variability of PT Travel
• The surveyed travel day is not representative of all days:
• the single day overestimates typical PT use overall
• underestimates the intensity of PT use on the days it is used
• People who used PT in the survey used it only about half the time (over a four week period), leading to an overestimate of typical PT use.
• The reported frequency of use is much higher than actual PT use and may not be the most accurate way to scale up reported travel day responses
24 Nigel Wilson, BRT Workshop: Experiences and Challenges
September 2013
Recommendations
• It is difficult to combine survey and AFC data after the survey
• AFC records could be used during the interview with a card reader and tablet to enhance the survey process
• AFC records over two weeks (or other time period) could be used to supplement questions regarding PT frequency of use
• A customer panel could be created to understand variability in travel behavior over time
• OD matrix estimation and trip chaining could be used to calculate exact trip attributes (start time, duration speeds)
25 Nigel Wilson, BRT Workshop: Experiences and Challenges
September 2013

Online Customer Survey Strategy
• Aim was to demonstrate the potential of online surveys to gather detailed and representative information from public transport customers identified through Oyster records
• Application was to understand customer behavior in multi-route corridors
Source: "Bus Use Behavior in Multi-Route Corridors." Cecilia Viggiano, MST Thesis, MIT (2013)
26 Nigel Wilson, BRT Workshop: Experiences and Challenges
September 2013
Online Customer Survey Strategy
• Survey e-mailed to about 52,000 registered Oyster Card holders who had used the routes of interest in the prior two weeks
• Incentive was an iPad awarded to a random respondent
• Response rate of 18% yielded over 9,400 responses
Source: "Bus Use Behavior in Multi-Route Corridors." Cecilia Viggiano, MST Thesis, MIT (2013)
27 Nigel Wilson, BRT Workshop: Experiences and Challenges
September 2013
Customer Classification Research
Aims:
• identify homogeneous groups of passengers through analysis of Oyster records
• investigate the representativeness of registered Oyster Card holders
• understand the attrition over time of individual Oyster cards
28
Source: "Classification of London’s Public Transport Users Using Smart Card Data." Meisy Ortega, MST Thesis, MIT (2013)
Nigel Wilson, BRT Workshop: Experiences and Challenges
September 2013
Methodology
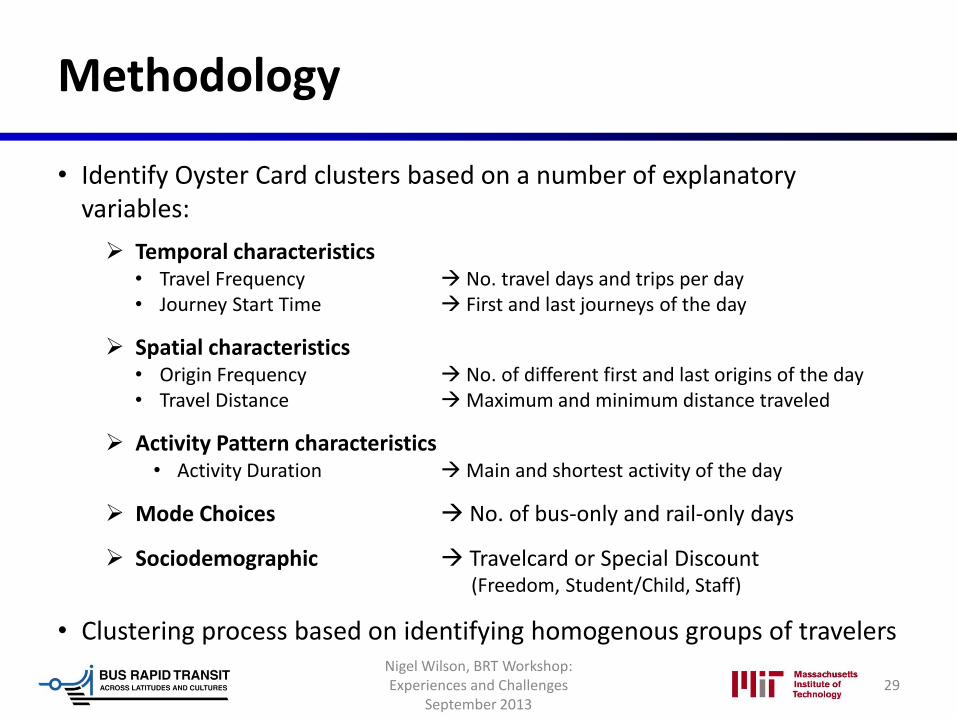
• Identify Oyster Card clusters based on a number of explanatory variables:
Temporal characteristics • Travel Frequency No. travel days and trips per day • Journey Start Time First and last journeys of the day
Spatial characteristics • Origin Frequency No. of different first and last origins of the day • Travel Distance Maximum and minimum distance traveled
Activity Pattern characteristics • Activity Duration Main and shortest activity of the day
Mode Choices No. of bus-only and rail-only days
Sociodemographic Travelcard or Special Discount (Freedom, Student/Child, Staff)
• Clustering process based on identifying homogenous groups of travelers
29 Nigel Wilson, BRT Workshop: Experiences and Challenges
September 2013
Travel Frequency
30
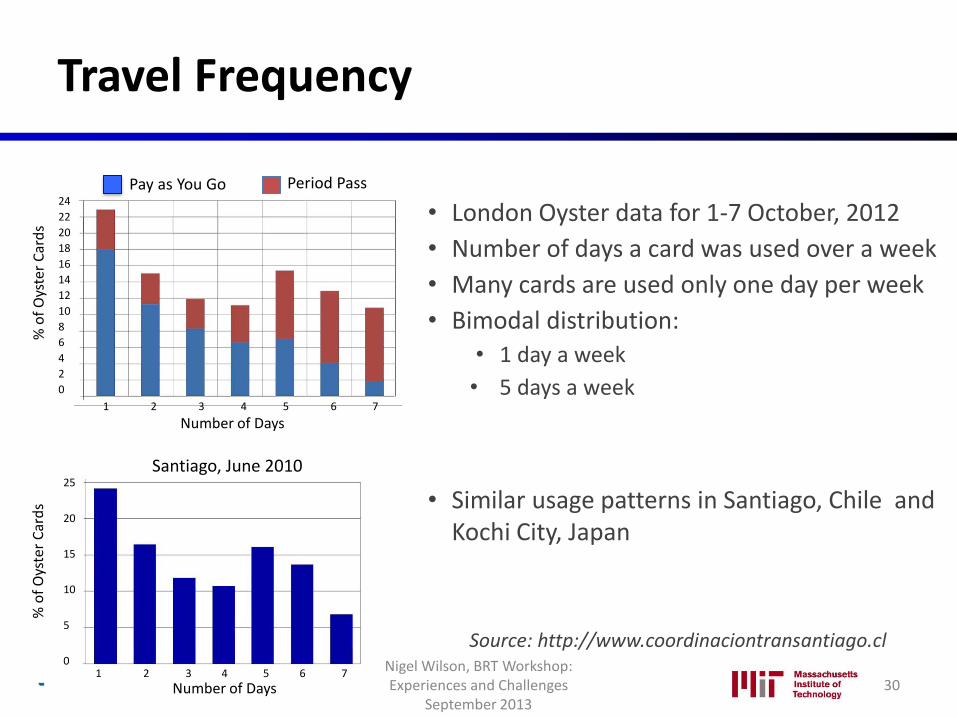
• London Oyster data for 1-7 October, 2012
• Number of days a card was used over a week
• Many cards are used only one day per week
• Bimodal distribution:
• 1 day a week
• 5 days a week
• Similar usage patterns in Santiago, Chile and Kochi City, Japan
Source: http://www.coordinaciontransantiago.cl
Number of Days
% o
f O
yste
r C
ard
s
Pay as You Go Period Pass 24
22
20
18
16
14
12
10
8
6
4
2
0
1 2 3 4 5 6 7
Number of Days
Number of Days
25
20
15
10
5
0 1 2 3 4 5 6 7
% o
f O
yste
r C
ard
s
Santiago, June 2010
Nigel Wilson, BRT Workshop: Experiences and Challenges
September 2013
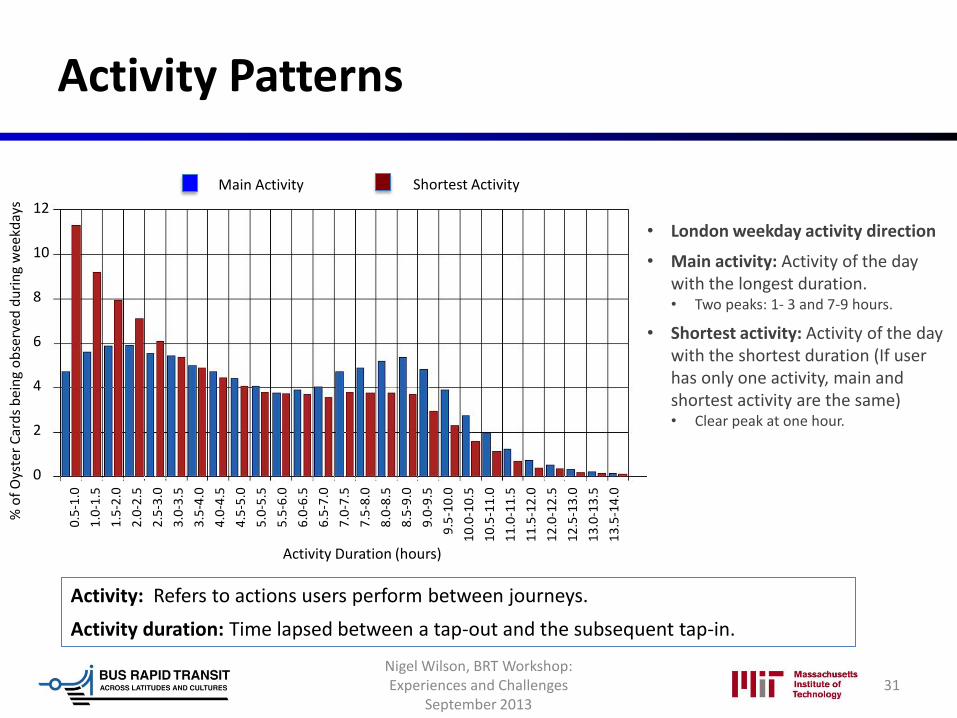
Activity Patterns
• London weekday activity direction
• Main activity: Activity of the day with the longest duration. • Two peaks: 1- 3 and 7-9 hours.
• Shortest activity: Activity of the day with the shortest duration (If user has only one activity, main and shortest activity are the same) • Clear peak at one hour.
31
Activity: Refers to actions users perform between journeys.
Activity duration: Time lapsed between a tap-out and the subsequent tap-in.
% o
f O
yste
r C
ard
s b
ein
g o
bse
rved
du
rin
g w
ee
kday
s 12
10
8
6
4
2
0
Activity Duration (hours)
Main Activity Shortest Activity
0.5
-1.0
1.0
-1.5
1.5
-2.0
2.0
-2.5
2.5
-3.0
3.0
-3.5
3.5
-4.0
4.0
-4.5
4.5
-5.0
5.0
-5.5
5.5
-6.0
6.0
-6.5
6.5
-7.0
7.0
-7.5
7.5
-8.0
8.0
-8.5
8.5
-9.0
9.0
-9.5
9.5
-10
.0
10
.0-1
0.5
10
.5-1
1.0
11
.0-1
1.5
11
.5-1
2.0
12
.0-1
2.5
12
.5-1
3.0
13
.0-1
3.5
13
.5-1
4.0
Nigel Wilson, BRT Workshop: Experiences and Challenges
September 2013
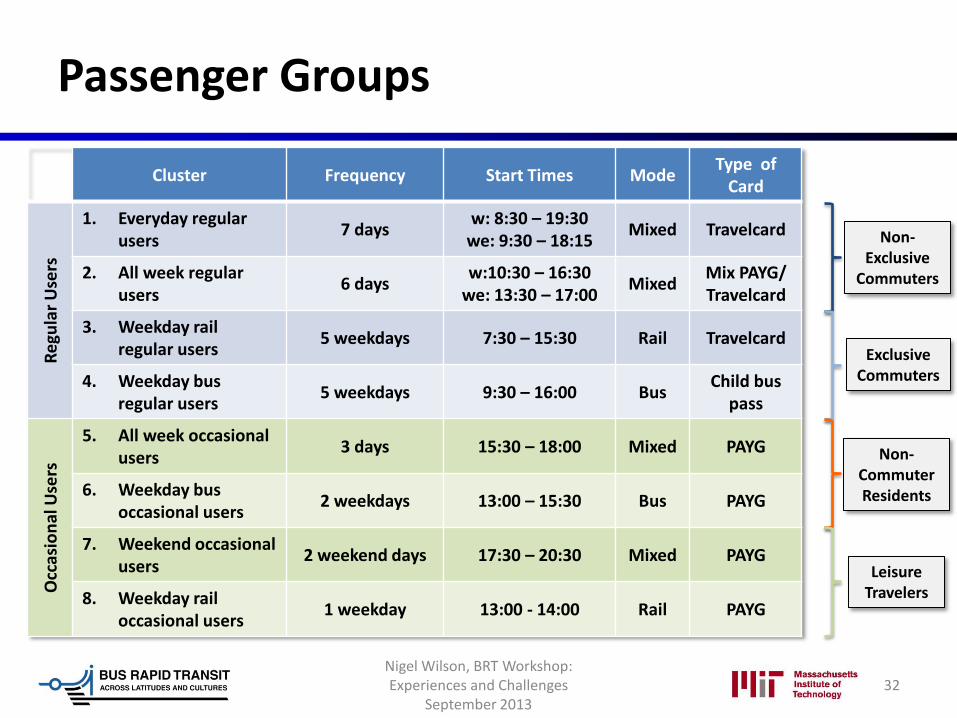
Passenger Groups
32
Cluster Frequency Start Times Mode Type of
Card
Re
gula
r U
sers
1. Everyday regular users
7 days w: 8:30 – 19:30
we: 9:30 – 18:15 Mixed Travelcard
2. All week regular users
6 days w:10:30 – 16:30
we: 13:30 – 17:00 Mixed
Mix PAYG/ Travelcard
3. Weekday rail regular users
5 weekdays 7:30 – 15:30 Rail Travelcard
4. Weekday bus regular users
5 weekdays 9:30 – 16:00 Bus Child bus
pass
Occ
asio
nal
Use
rs
5. All week occasional users
3 days 15:30 – 18:00 Mixed PAYG
6. Weekday bus occasional users
2 weekdays 13:00 – 15:30 Bus PAYG
7. Weekend occasional users
2 weekend days 17:30 – 20:30 Mixed PAYG
8. Weekday rail occasional users
1 weekday 13:00 - 14:00 Rail PAYG
Exclusive Commuters
Non-Exclusive
Commuters
Non-Commuter Residents
Leisure Travelers
Nigel Wilson, BRT Workshop: Experiences and Challenges
September 2013
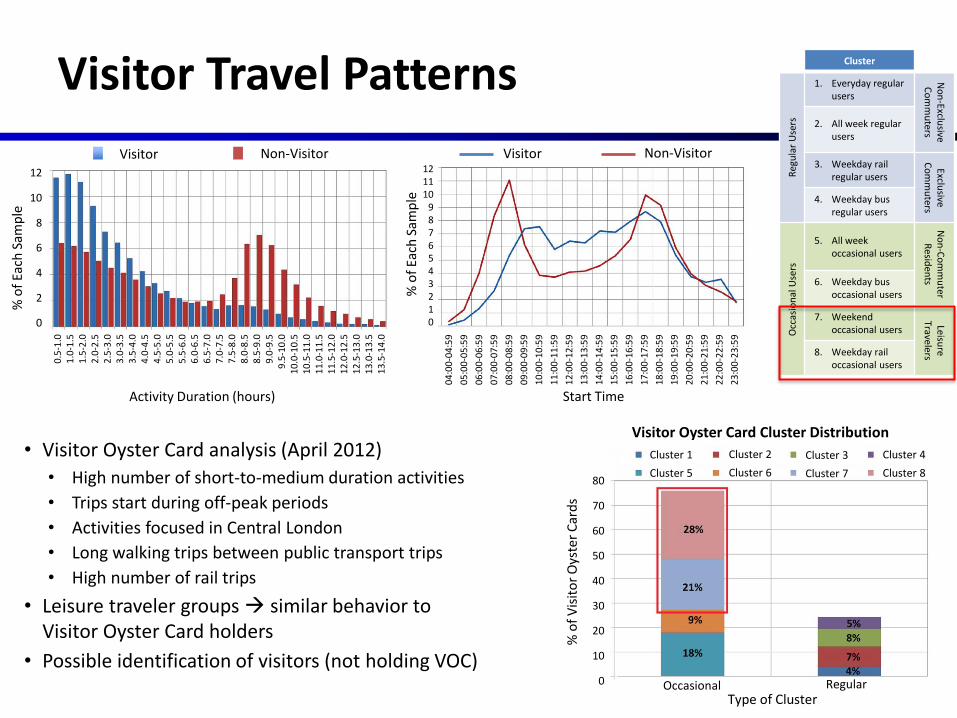
Visitor Travel Patterns Cluster
Reg
ula
r U
sers
1. Everyday regular users
No
n-Exclu
sive C
om
mu
ters
2. All week regular users
3. Weekday rail regular users
Exclusive
Co
mm
uters
4. Weekday bus regular users
Occ
asio
nal
Use
rs
5. All week occasional users
No
n-C
om
mu
ter R
esiden
ts 6. Weekday bus occasional users
7. Weekend occasional users
Leisure
Travelers 8. Weekday rail occasional users
• Visitor Oyster Card analysis (April 2012)
• High number of short-to-medium duration activities
• Trips start during off-peak periods
• Activities focused in Central London
• Long walking trips between public transport trips
• High number of rail trips
• Leisure traveler groups similar behavior to Visitor Oyster Card holders
• Possible identification of visitors (not holding VOC)
% o
f Ea
ch S
amp
le
Activity Duration (hours)
0.5
-1.0
1
.0-1
.5
1.5
-2.0
2
.0-2
.5
2.5
-3.0
3
.0-3
.5
3.5
-4.0
4
.0-4
.5
4.5
-5.0
5
.0-5
.5
5.5
-6.0
6
.0-6
.5
6.5
-7.0
7
.0-7
.5
7.5
-8.0
8
.0-8
.5
8.5
-9.0
9
.0-9
.5
9.5
-10
.0
10
.0-1
0.5
1
0.5
-11
.0
11
.0-1
1.5
1
1.5
-12
.0
12
.0-1
2.5
1
2.5
-13
.0
13
.0-1
3.5
1
3.5
-14
.0
12
10
8
6
4
2
0
Visitor Non-Visitor
04
:00
-04:
59
05
:00
-05:
59
06
:00
-06:
59
07
:00
-07:
59
08
:00
-08:
59
09
:00
-09:
59
10
:00
-10:
59
11
:00
-11:
59
12
:00
-12:
59
13
:00
-13:
59
14
:00
-14:
59
15
:00
-15:
59
16
:00
-16:
59
17
:00
-17:
59
18
:00
-18:
59
19
:00
-19:
59
20
:00
-20:
59
21
:00
-21:
59
22
:00
-22:
59
23
:00
-23:
59
Start Time %
of
Each
Sam
ple
12 11 10
9 8 7 6 5 4 3 2 1 0
Visitor Non-Visitor
Visitor Oyster Card Cluster Distribution
Type of Cluster Regular
Cluster 1
Cluster 5
Cluster 2
Cluster 6
Cluster 3
Cluster 7
Cluster 4
Cluster 8
% o
f V
isit
or
Oys
ter
Car
ds
80
70
60
50
40
30
20
10
0 Occasional

Registered Users
• Registered users are distributed differently among clusters
• Regular user clusters have higher percentage of registered cards
• Representative characteristics in each cluster, but more similarity with regular users behavior
Clu
ster
1
Clu
ster
2
Clu
ster
3
Clu
ster
4
Clu
ster
5
Clu
ster
6
Clu
ster
7
Clu
ster
8
% o
f ea
ch c
lust
er
of
Oys
ter
Car
ds 70
60
50
40
30
20
10
0
Cluster 1 First and Last Journey Start Times
Start Time
Re
lati
ve %
of
Oys
ter
Car
ds 14
12
10
8
6
4
2
0
Registered Total
04
:00
-04
:59
05
:00
-05
:59
06
:00
-06
:59
07
:00
-07
:59
08
:00
-08
:59
09
:00
-09
:59
10
:00
-10
:59
11
:00
-11
:59
12
:00
-12
:59
13
:00
-13
:59
14
:00
-14
:59
15
:00
-15
:59
16
:00
-16
:59
17
:00
-17
:59
18
:00
-18
:59
19
:00
-19
:59
20
:00
-20
:59
21
:00
-21
:59
22
:00
-22
:59
23
:00
-23
:59
Cluster 2 Activity Duration
Activity Duration (hours)
Rel
ativ
e %
of
Oys
ter
Car
ds
8
7
6
5
4
3
2
1
0
0.5
-1.0
1
.0-1
.5
1.5
-2.0
2
.0-2
.5
2.5
-3.0
3
.0-3
.5
3.5
-4.0
4
.0-4
.5
4.5
-5.0
5
.0-5
.5
5.5
-6.0
6
.0-6
.5
6.5
-7.0
7
.0-7
.5
7.5
-8.0
8
.0-8
.5
8.5
-9.0
9
.0-9
.5
9.5
-10
.0
10
.0-1
0.5
10
.5-1
1.0
11
.0-1
1.5
11
.5-1
2.0
12
.0-1
2.5
12
.5-1
3.0
13
.0-1
3.5
13
.5-1
4.0
Registered Total
Cluster
Reg
ula
r U
sers
1. Everyday regular users
No
n-Exclu
sive C
om
mu
ters
2. All week regular users
3. Weekday rail regular users
Exclusive
Co
mm
uters
4. Weekday bus regular users
Occ
asio
nal
Use
rs
5. All week occasional users
No
n-C
om
mu
ter R
esiden
ts
6. Weekday bus occasional users
7. Weekend occasional users
Leisure Travelers
8. Weekday rail occasional users
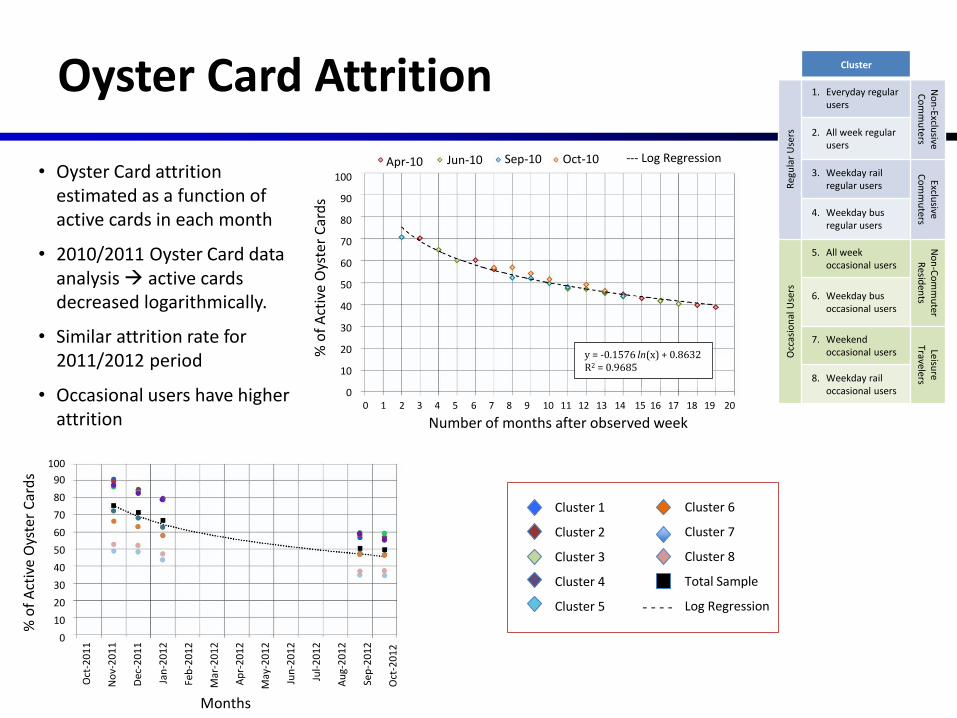
Oyster Card Attrition Cluster
Reg
ula
r U
sers
1. Everyday regular users
No
n-Exclu
sive C
om
mu
ters
2. All week regular users
3. Weekday rail regular users
Exclusive
Co
mm
uters
4. Weekday bus regular users
Occ
asio
nal
Use
rs
5. All week occasional users
No
n-C
om
mu
ter R
esiden
ts 6. Weekday bus occasional users
7. Weekend occasional users
Leisure
Travelers 8. Weekday rail occasional users
• Oyster Card attrition estimated as a function of active cards in each month
• 2010/2011 Oyster Card data analysis active cards decreased logarithmically.
• Similar attrition rate for 2011/2012 period
• Occasional users have higher attrition
y = -0.1576 ln(x) + 0.8632 R2 = 0.9685
Apr-10 Jun-10 Sep-10 Oct-10 --- Log Regression
% o
f A
ctiv
e O
yste
r C
ard
s
100
90
80
70
60
50
40
30
20
10
0
Number of months after observed week 0 1 2 3 4 5 6 7 8 9 10 11 12 13 14 15 16 17 18 19 20
Cluster 1
Cluster 2
Cluster 3
Cluster 4
Cluster 5
Cluster 6
Cluster 7
Cluster 8
Total Sample
Log Regression - - - -
100
90
80
70
60
50
40
30
20
10
0
% o
f A
ctiv
e O
yste
r C
ard
s
Months
Oct
-20
11
No
v-2
01
1
Dec
-20
11
Jan
-20
12
Feb
-20
12
Mar
-20
12
Ap
r-2
01
2
May
-20
12
Jun
-20
12
Jul-
20
12
Au
g-2
01
2
Sep
-20
12
Oct
-20
12

Findings
• 8 homogenous groups of users with distinctive travel behavior were found logical aggregation in 4 groups:
• Exclusive commuters, non exclusive commuters, leisure travelers, and non-commuter residents
• Visitors similar to occasional user clusters business and leisure
• Different % of registered card users per cluster. Registered users travel behavior more similar to regular users behavior.
• Attrition rates decrease over time. Large drop in number of active cards explained by occasional users behavior
• First step in understanding user attrition
36 Nigel Wilson, BRT Workshop: Experiences and Challenges
September 2013
Summary
• Complete Journey OD Estimation practical with ADCS • foundation for many analyses related to customer experience
• Realistic to assess service reliability for individuals and journeys • most critical aspect of customer experience
• Home interview surveys can be enhanced with AFC records
• Targeted on-line surveys an efficient alternative to other survey methods
• Customer classification is critical in understanding the customer experience
37 Nigel Wilson, BRT Workshop: Experiences and Challenges
September 2013
Appendix MIT theses used in this presentation
"Service Reliability Measurement Framework using Smart Card Data: Application to the London Underground." David Uniman, MST Thesis (2009)
"Automatic Data for Applied Railway Management: Passenger Demand, Service Quality Measurement, and Tactical Planning on the London Overground Network." Michael Frumin, MST Thesis (2010)
"Applications of Automatic Vehicle Location Systems Towards Improving Service Reliability and Operations Planning in London." Joseph Ehrlich, MST Thesis (2010)
"Intermodal Passenger Flows on London’s Public Transport Network: Automated Inference of Full Passenger Journeys Using Fare-Transaction and Vehicle-Location Data." Jason Gordon, MST Thesis, MIT (2013).
"Utilizing Automatically Collected Smart Card Data to Enhance Travel Demand Surveys." Laura Riegel, MST Thesis (2013)
"Bus Use Behavior in Multi-Route Corridors." Cecilia Viggiano, MST Thesis (2013)
"Classification of London’s Public Transport Users Using Smart Card Data." Meisy Ortega, MST Thesis (2013)
"Quantifying the Current and Future Impacts of the MBTA Corporate Pass Program." Dianne Kamfonik, MST Thesis (2013)
38 Nigel Wilson, BRT Workshop: Experiences and Challenges
September 2013