Embed Size (px)
Citation preview
Librato One Platform. Unlimited Metrics.Monitoring Zen
Vinay Raj. Software Engineer - Mobile
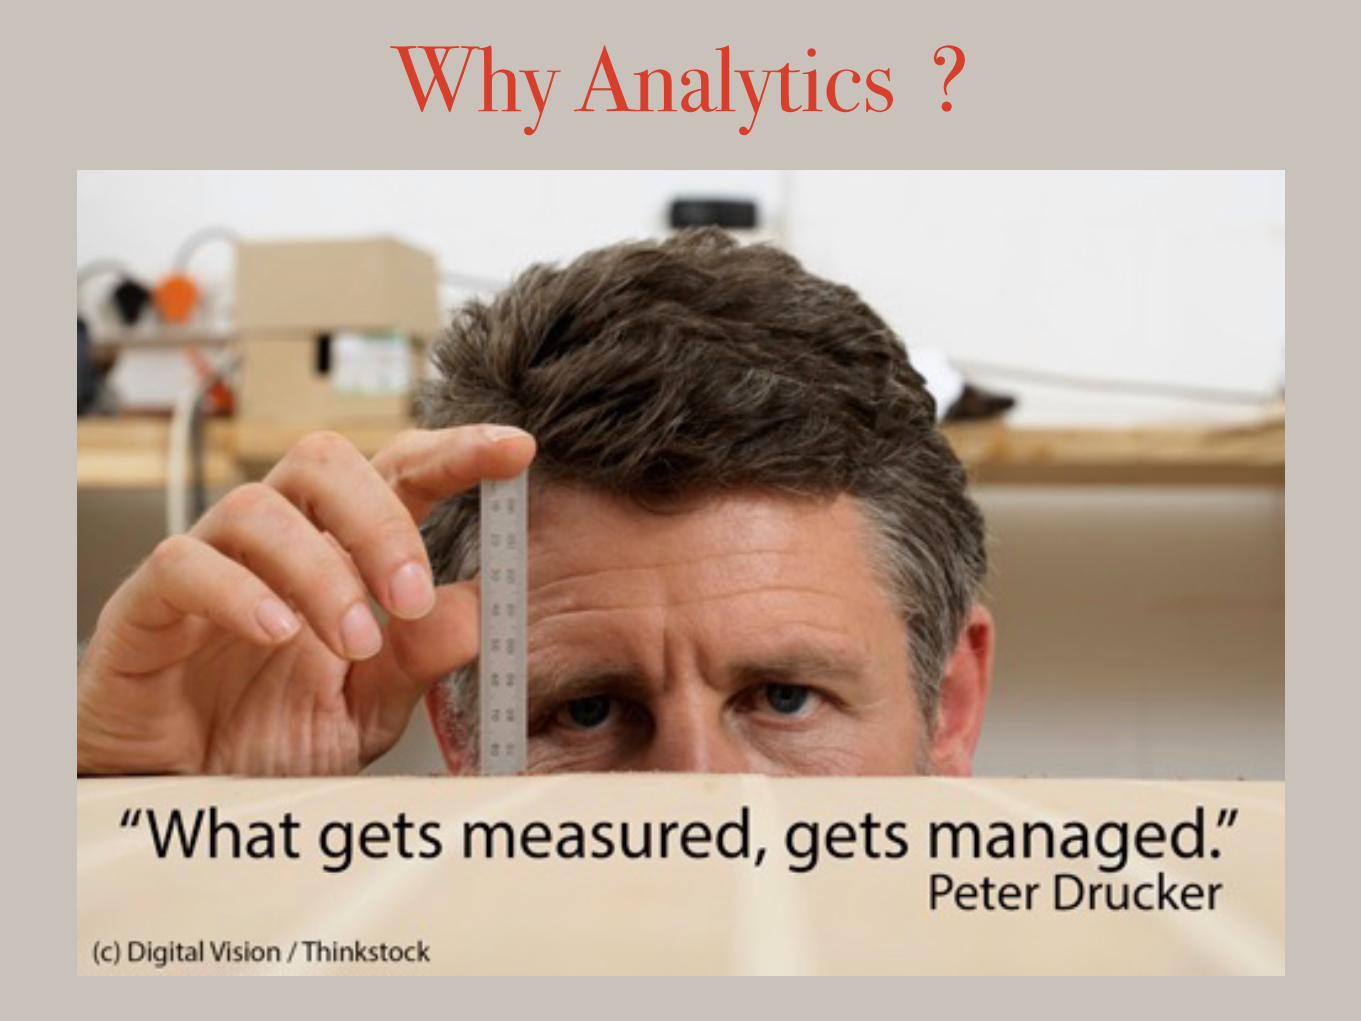
Why Analytics ?
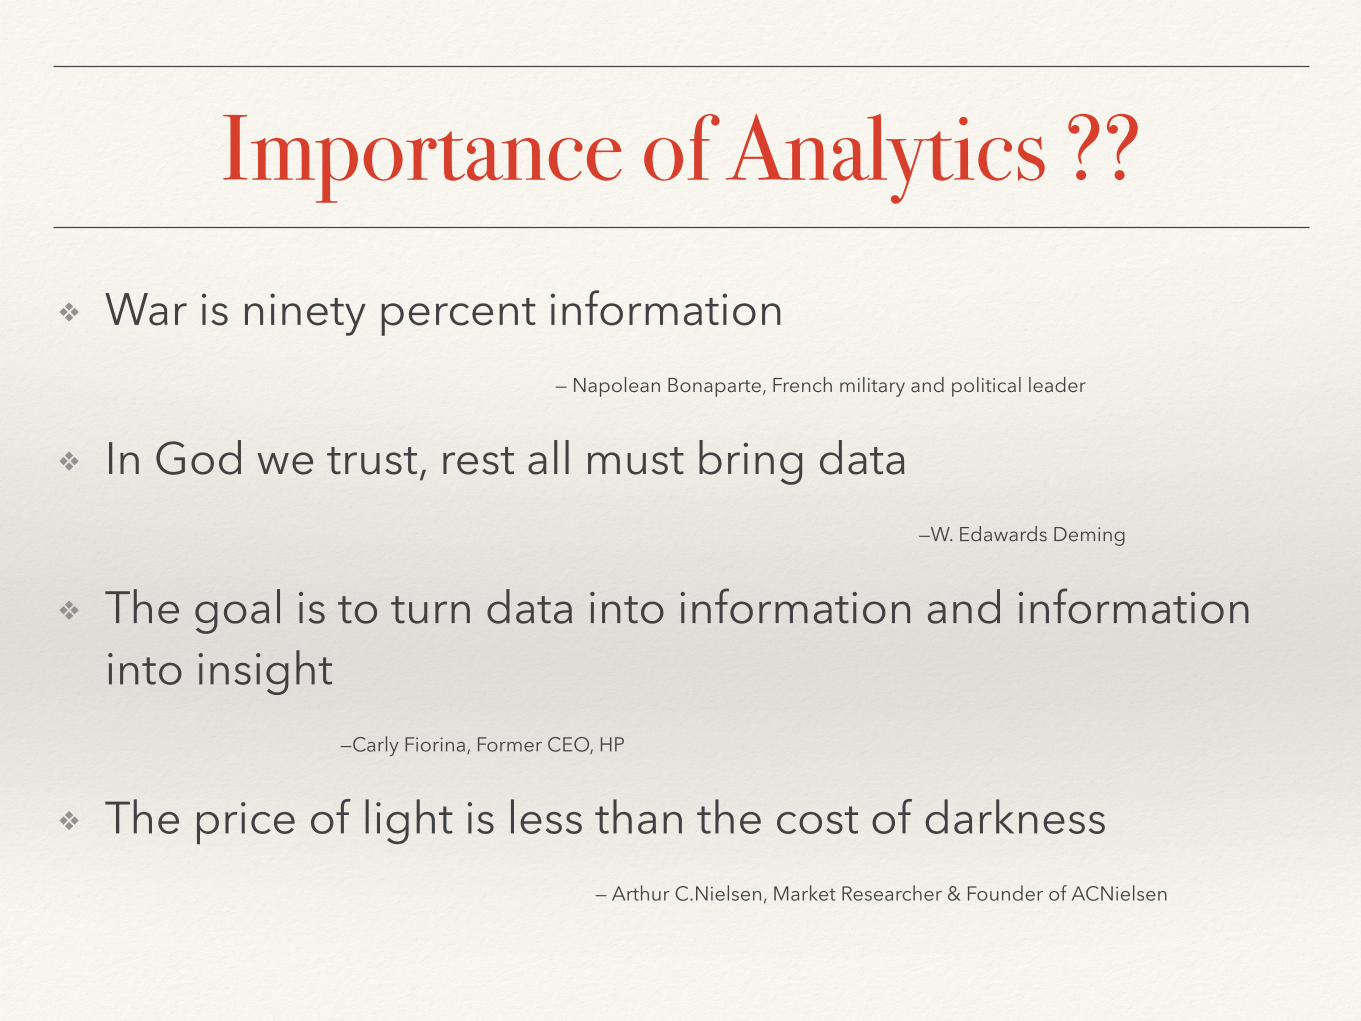
Importance of Analytics ??❖ War is ninety percent information
— Napolean Bonaparte, French military and political leader
❖ In God we trust, rest all must bring data —W. Edawards Deming
❖ The goal is to turn data into information and information into insight
—Carly Fiorina, Former CEO, HP
❖ The price of light is less than the cost of darkness — Arthur C.Nielsen, Market Researcher & Founder of ACNielsen
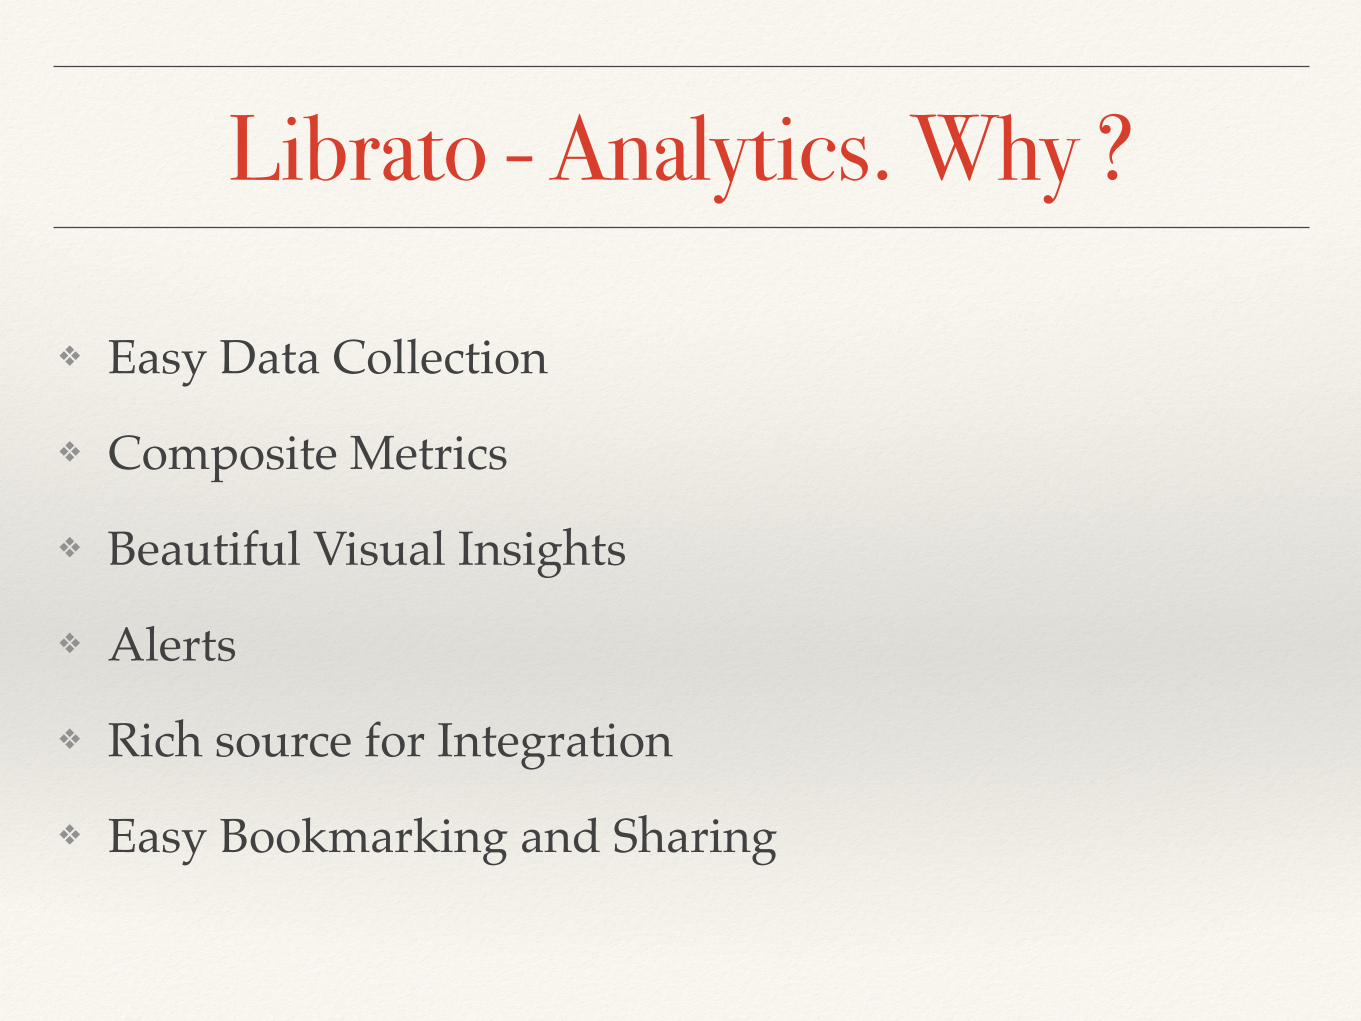
Librato - Analytics. Why ?
❖ Easy Data Collection
❖ Composite Metrics
❖ Beautiful Visual Insights
❖ Alerts
❖ Rich source for Integration
❖ Easy Bookmarking and Sharing

Metrics
❖ The primary data that a client send to Librato.
❖ Anything recorded on Librato
❖ Can be pulled in via1. Command Line
2. Language Bindings
3. Collection Agents
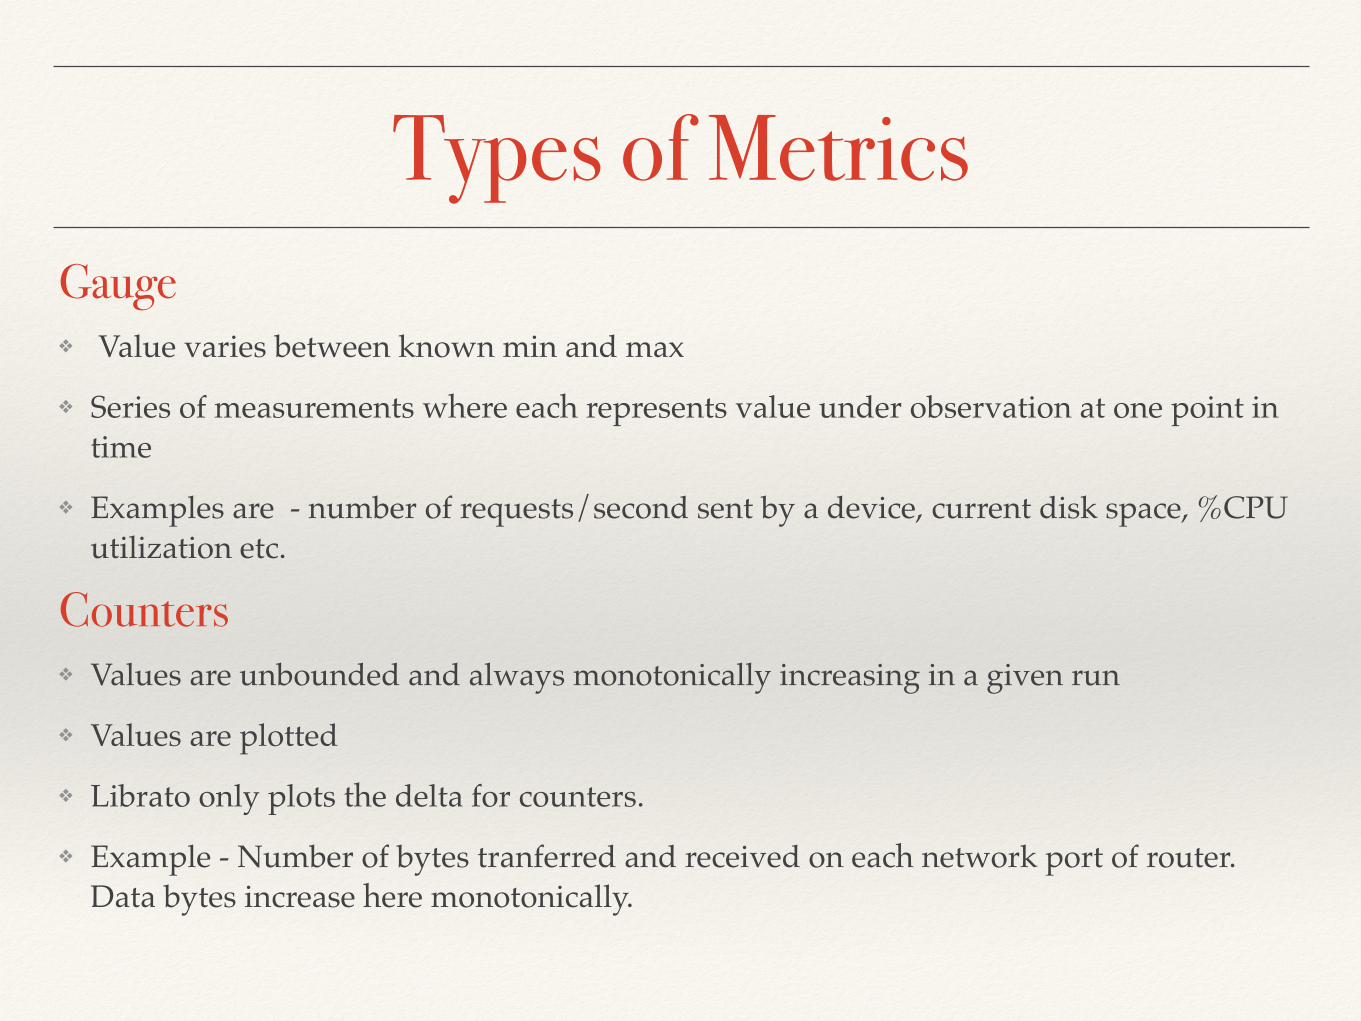
Types of MetricsGauge ❖ Value varies between known min and max
❖ Series of measurements where each represents value under observation at one point in time
❖ Examples are - number of requests/second sent by a device, current disk space, %CPU utilization etc.
Counters ❖ Values are unbounded and always monotonically increasing in a given run
❖ Values are plotted
❖ Librato only plots the delta for counters.
❖ Example - Number of bytes tranferred and received on each network port of router. Data bytes increase here monotonically.
Programing Time - Lets get some data in there !!
❖ We shall quickly see a script that can send in some data to our libretto account.
❖ We shall send the CPU utilisation and Memory Utilisation details of the machine over a period of 10 secs
❖ We shall use the API of Librato to send metrics and execute our script in the terminal.
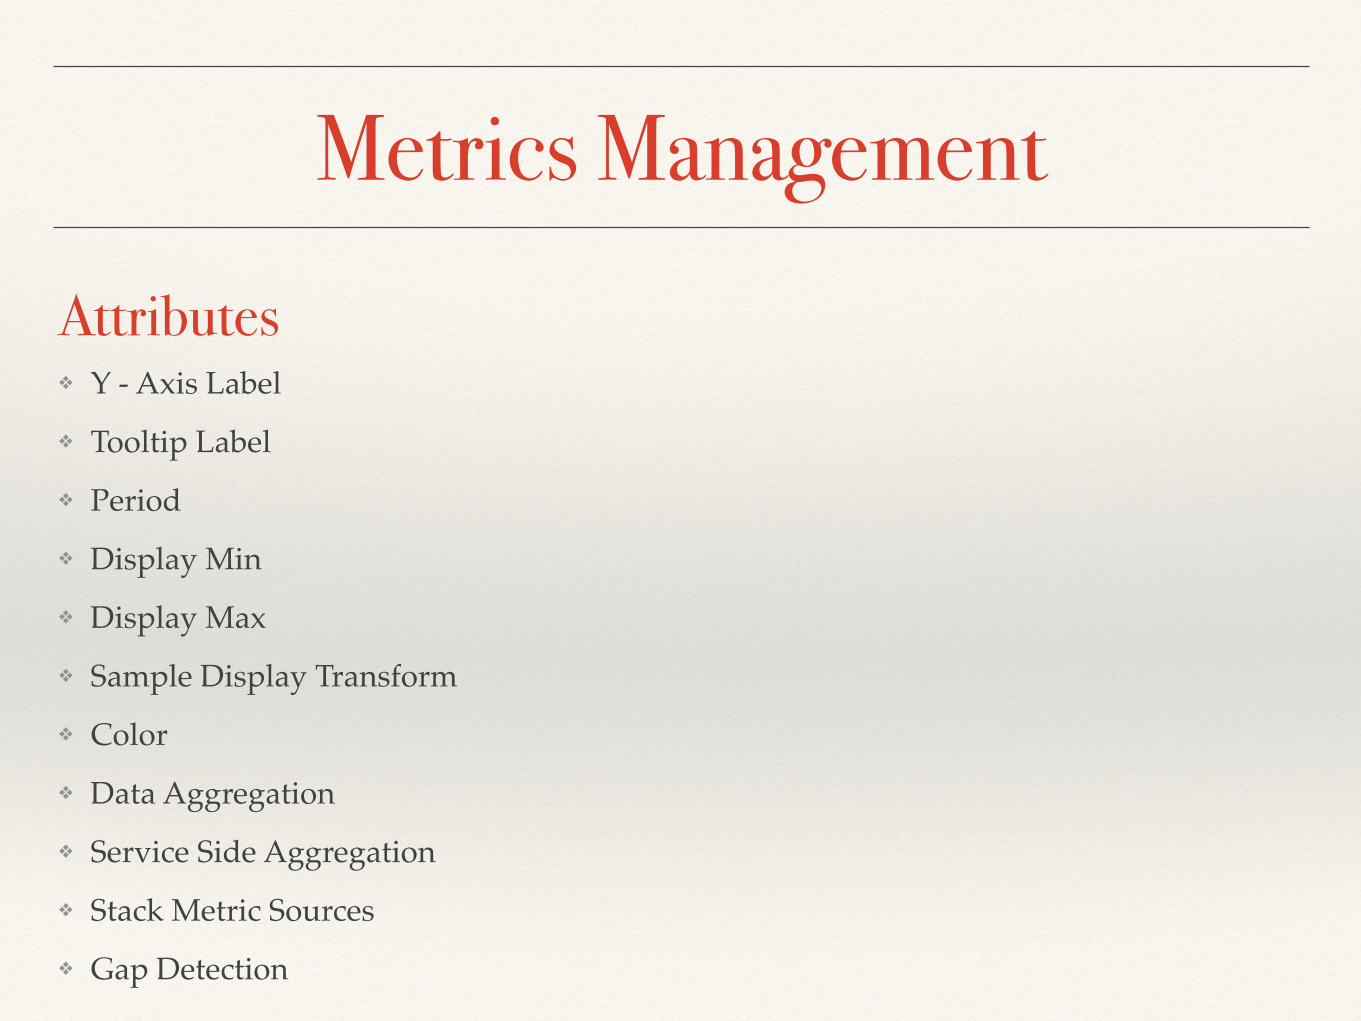
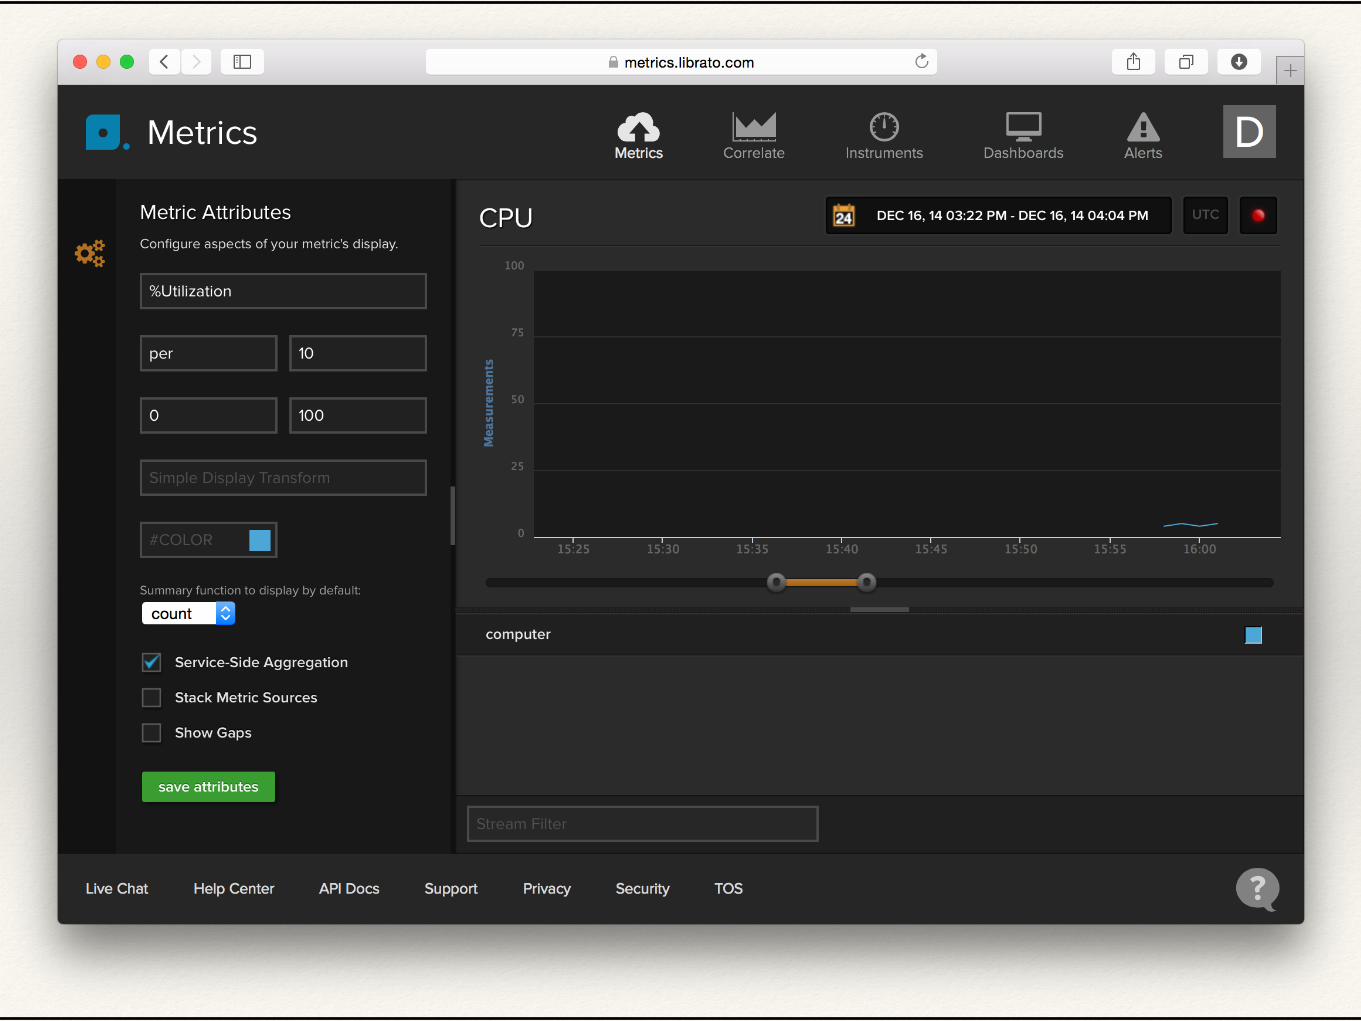
Metrics ManagementAttributes ❖ Y - Axis Label❖ Tooltip Label❖ Period❖ Display Min❖ Display Max❖ Sample Display Transform❖ Color❖ Data Aggregation❖ Service Side Aggregation❖ Stack Metric Sources❖ Gap Detection

Instruments - What they are ??
❖ Composite metrics visual representation
❖ They are used to populate the dashboard
❖ Quickly know how the system performs based on the conglomerated data for related set of metrics
❖ The hierarchy of data collection is as follows
Metrics —> Instruments —> Dashboards

Instruments In Action
Co-Relate
❖ Used for creating Instruments
❖ Select a metric (Click on the + button on the metric to add it to a instrument)
❖ Select a Source Type (Select the sources of the metric that you want to add as a part of the instrument)
❖ Stream Composition (Choose the aggregate rule for composing the metrics from various resources in the instruments)
❖ Manage Metric Attributes (Can share a Y axis for multiple metrics)
❖ Maximizing the graph (Use the controls on the co-relate to resize the graphs)
❖ Stacked Graps (When metrics are related we can stack them to see gruoped result)
❖ Display Integral (Shows the value in numbers for the metrics in the period super imposed on the graph on a instrument)
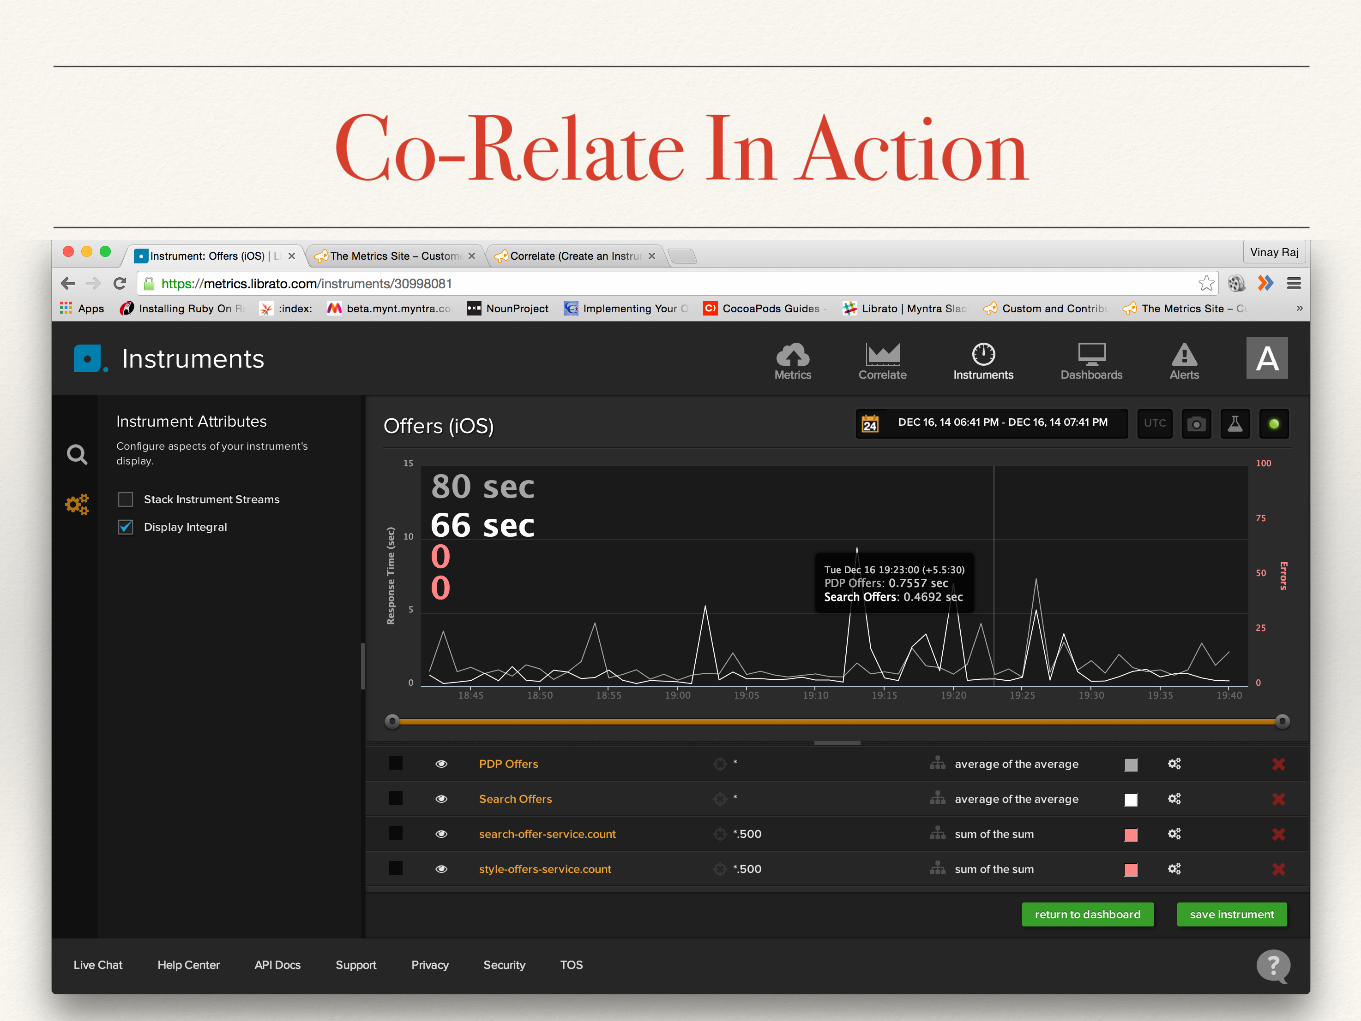
Co-Relate In Action
Dashboards
❖ Aggregation Of Instruments for quick view
❖ Can be shared easily with other collaborators
❖ Instruments in a dashboard can be removed, re-organised and added easily

Sample Dashboard
Alerts - Lets see how they work
❖ Alert Name
❖ Description
❖ While Triggering notify every
❖ Runbook Url
❖ Alert Conditions
❖ Notification Services
Out of the box Notification Services❖ Email
❖ Slack
❖ Campfire
❖ Flowdock
❖ HipChat
❖ OpsGenie
❖ PagerDuty
References
❖ http://blog.librato.com/
❖ https://www.librato.com/
❖ https://www.librato.com/product
❖ http://dev.librato.com/v1/metrics

–Vinay
Thanks !


![Stream Processing Inside Librato [Monitorama PDX 2015]](https://img.pdfslide.net/doc/110x75/55ce01e9bb61eb02588b46a1/stream-processing-inside-librato-monitorama-pdx-2015.jpg)