Embed Size (px)
Citation preview

World Developmenf, Vol. 19, No. 1 I, pp. 163~16Sl,1991. 0305-75OW91 $3.00 + 0.00 Printed in Great Britain. Pergamon Press plc
Adjustment, Incomes and Poverty in Morocco
CHRISTIAN MORRISSON OECD Development Centre, Paris
Summary. -Although fiscal and balance-of-payments problems began in 1976, Morocco did not introduce its stabilization program until 1983. The combination of a short-term stabilization program (devaluations, reductions in public investment, and slower growth in domestic credit and government employment) and medium-term structural adjustment measures (liberalizing trade, agriculture, and financial markets) reduced internal and external deficits while maintaining economic growth and preventing an increase in poverty. Model simulations of three alternative approaches show that the macroeconomic policy adopted could have been better, but only slightly. They also show that the timing of the program was suited to the exogenous shocks Morocco faced and helped to keep the social costs of adjustment low, although additional macroeconomic measures and higher direct taxes on high-income households could have reduced them even further.
1. INTRODUCTION
Of all the countries studied in this issue, Morocco waited the longest before applying a stabilization program to deal with growing exter- nal and internal imbalances. Fiscal and balance- of-payments problems began to emerge in 1976 with the fall in phosphate prices, but the stabili- zation program was not introduced until 1983. (Two earlier attempts in 1978 and 1980 had been abandoned because of political and other prob- lems.) Despite the delay, the economic and social costs were not as high nor the political reactions as hostile or severe as might have been expected in view of the disturbances that followed the 198&81 stabilization attempt. The strategy of combining a short-term stabilization program and a medium-term structural adjustment pro- gram contributed to success. Two exogenous factors also helped to ease the adjustment by reducing the program’s impact on the incomes of poor families: exceptionally favorable rainfall in 1985 and 1986, and the rapid growth in remit- tances from migrant workers.
This paper describes the imbalances and the government’s adjustment policies (Sections 2 and 3) and then reviews the impact of adjustment on employment, primary incomes, household living standards, and poverty (Section 4). The model and simulation results for the short-term effects of the program and the medium-term effects of alternative policies are presented in the fifth section. The simulations show that most of the measures applied by the government were clearly
beneficial, although the program could have been even more effective had Morocco followed a slightly different set of policy options.
2. IMBALANCES AND THE NEED FOR ADJUSTMENT
As the phosphate price tripled in 1974, the Moroccan government used the windfall revenue gains to finance new spending programs. Public investment more than tripled during 197477, government employees received a pay raise of 26%, and food prices were subsidized. In 1976, the phosphate price slumped again, falling 47% from its level in 1975. For technical and political reasons, the government was unable to cut back immediately on its new spending programs, and a serious budget deficit resulted (almost 20% of GDP). Beginning in 1976, the budget deficit and the current account deficit expanded together, as public investment expenditures were funded mainly through foreign loans rather than money creation. The foreign debt grew from US$2.3 billion in 1976 to US$11.9 billion in 1983.
Twice the government attempted to introduce stabilization measures and twice its attempts failed. In 1978, the government tried to reduce public investment, freeze wages, increase taxes, and squeeze credit, but the program was aban- doned in 1979 because of a drought, the second oil shock, and social unrest. As the prices of both domestic and imported goods rose, the govern- ment abandoned the wage freeze and increased
1633

the minimum wage and food subsidies. The
imbalances worsened and during 197X-80. the budget deficit grew from 0.7% to 12.4% of CiDP
and the foreign debt from $5.1 to $7.0 billion.
The government embarked on a second stabiliza- tion program under an agreement with the International Monetary Fund (IMF) in October
lY80. Subsidies were reduced, leading to a 50% increase in the price of essential consumer goods. This price increase sparked serious riots in Casablanca in the spring of 1981. The social
unrest. an exceptionally severe drought, another fall in the phosphate price. and an increase in the
value of the dollar and in interest rates forced the
government to abandon the program. During lYXl-X.3. Morocco continued its expan-
sionist policies. financing its revenue shortfalls
through new foreign loans. Budget and balance- of-payments deficits worsened: the current account deficit grew from 7.8% of GDP in IYXO
to I I .X’%, in lY82 and foreign debt expanded from $7.Y billion in lYX0 to $1 I .c) billion in lYX3. The cost of the debt was also rising ax private Io;ms. with shorter repayment periods and higher
interest rates, began to constitute an increasing
share of foreign debt. Debt servicing costs jumped from 31 .3’S of the value of exports in
1980 to 3Y’%, in lY83.
By lYX3. the gains from the growth policy
pursued by the government had been complctcly
reversed: GDP per capita had returned to its
1980 level, the number of the urban unemployed
had almost doubled, and wages had fallen by
10%. The cost of deferred adjustment was
growing internal and external imbalances, a
stagnating economy. and higher social costs. By
micl- 198.3. foreign exchange reserves were almost
exhausted and the government was forced to
introduce emergency import restrictions and to
negotiate loans with the IMF and the World
Bank in the context of an adjustment program.
In September lYX3. the IMF granted Morocco ;I loan of SDK 200 million. and in early IYX-I,
Morocco negotiated with the World Bank for
$600 million in hectoral adjustment loans for
lYX4G36. Also. $2 billion of Morocco’s foreign
debt was rescheduled by the Paris and I.ondon
clubs.
3. THE ADJUSTMENT PROGKAM
The adjustment program included stabilization
mcasurcs to reduce overall demand. mainlv
under the IMF agreement. and liberaliration
mcasurcs to increase supply through structural
reforms. some of them financed by World Bank
loans (Table I ), The stahiliration mea\urt’\ wcrc
intended to reduce the imbalances in the short
term, and the liberalization measures to increase
supply in the medium term.
On the stabilization side, the government
concentrated first on cutting public investment
expenditure from 13% of <iDP in IYX2 to S’%, in
lY8S. It also slowed the growth of the money
supply; Ml increased by only 7.5’!4 in 1084.
compared with 13.7’% in lYX3. A series of devaluations during lY82X-Z lowered the real
exchange rate by 17.8%. reducing the gap be-
Stabilization measures
- reduction of food subsidies ~ slower growth in domestic credit (IJ.H’%, instead of 70. I%) - devaluation (7% between February and April 10X4) - large reduction in investment expenditure - slower growth in public sector cmploymcnt (25.000 instead 01 40,000)
Structural adjustment measures
- fiscal reform. including introduction of a value-added tax in April IYXh - lower agricultural subsidies - higher production prices in agriculture - breakup of the state monopoly on the sale of lcrtilizers and seeds - abolition of price controls on 60 categories of manufactured products - elimination of export duties - breakup of the state monopoly on agricultural exports - dismantling of the system of quantitative restrictions on imports ~ lower import taxes - improved temporary admission scheme for exporters - simplification of customs procedure - higher interest rates

MOROCCO 1635
tween the official rate and the equilibrium rate in the absence of exchange controls.
The structural measures introduced by the government all moved the economy toward a greater reliance on market mechanisms. Agricul- tural and industrial markets were liberalized. and protection levels were lowered. The most impor- tant policy reforms came in foreign trade and affected both exports and imports, administrative procedures and tariff levels. During 1983-86, the maximum import duty dropped from 400% to 45% while the average total tax fell from 59% to 36%. Liberalization was also extended to the financial sector. To increase savings and invest- ment, cash reserves and minimum domestic bond requirements for term deposits and convertible dirham deposits were removed, and real interest rates, which had been negative up to 1982-83, were raised to positive levels. The government also introduced a system of Treasury bond issues to strengthen its control over monetary policy.
4. SOCIAL EVOLUTION DURING ADJUSTMENT
Unlike many other countries. Morocco managed to avoid a slowdown in economic activity during the stabilization period (Table 2). GDP increased at an average annual rate of more than 4.5% in 198486, and GDP per capita increased at a rate of 5.5% in 1986, after stagnating during 1984-85. Exceptionally good rainfall in 1985 and 1986 accounted for about half of the increase in the rate of economic growth. Because of this high growth rate, the social costs of adjustment were comparatively light in Morocco, although some sectors were hurt more than others. Construction suffered the most from
the cut in public investment, and manufacturing output stagnated in 1084 and rose only slightly in 1985 and 1986. But agricultural production in- creased steadily through the adjustment period. Given these sectoral differences, the stabilization program must clearly have had a different effect on employment and incomes in rural and urban areas.
The program was somewhat less successful in reducing the budget deficit than in reducing the current account deficit. While expenditure cuts reduced the budget deficit from 14% of GDP in 1982 to 6.6% in 1984, accumulated arrears, which had been negligible before 1983, reached 3.5% of GDP in 1985. In terms of absolute expenditure, the budget deficit remained stable during 1083-85 although it fell slightly as a percentage of GDP. In 1986, however, there was a large drop in the deficit (Table 2).
The current account deficit fell more quickly - from 11.8% of GDP in 1982 to 1.4% in 1986. The primary reason was the sharp increase in exports, notably consumer goods (textiles, clothing, carpets, footwear), which doubled. and tourism. which increased by 170% during lYX2- 86. The devaluations helped to boost exports of the goods and services in which Morocco has a comparative advantage (due to skilled labor with fairly low wages and a tradition of craftsmanship in the case of goods, and sites of interest, good climate. and proximity to the European market in the case of tourism).
Morocco managed to reconcile trade liberali- zation and increased openness to the world economy (exports plus imports increased from 42.5% of GDP in 1982 to 50.5% in lY8S) with the reduction of its external deficit - a somewhat risky attempt considering the economic situation at the time. Trade liberalization also had a
Indicator lY82 19x3 lYX4 1YXS 1YXh
GDP GDP per capita Agriculture Manufacturing Construction Export of goods (current prices) Tourism receipts Fiscal deficit (percentage of GDP) Current account deficit (percentage of GDP)
100.0 100.7 102.6 100.0 98.4 Y7.7 100.0 96.0 06.0 100.0 103.X 102.0 100.0 YS.0 90.5
100.0 120.0 153.0 100.0 131.0 170.0
14.1 10.3 11.0
11.x 7.0 Y.‘l
107.0 99.0
108.0 103.0 96.3
174.0 246.0
9.0
6.‘)
116.0 104.5 147.0 104.0 101 .o
178.0 271 .O
5.X
1.4

16X WORLD DEVELOPMENT
favorable impact on employment because it stimulated the growth of the labor-intensive industries rather than the capital-intensive indus- tries that had flourished behind high protective trade barriers. It also reduced the income in- equalities associated with the quota system (eco- nomic rents for those who received licenses and. in some cases, illicit gains for the officials that issued them).
(a) Cl2unge.s in emp/nytnct7t
Adjustment had different employment impacts in rural and urban areas. Because the devalua- tion, high producer prices, and liberalization of agricultural markets stimulated agricultural growth - with a large assist from the weather - rural areas experienced no drop in employment. In fact. the number of jobs in rural areas increased faster than the economically active male population, so male unemployment fell slightly.
In the towns, employment increased by 3.8% a year. a respectable showing during a period of adjustment. but unemployment also increased because the economically active population grew by 5%. The urban unemployment rates rose by 12.2% in IYH? to 15.6% in IY86. The increase in unemployment came from the pressure of high demand for jobs rather than from a stagnating supply. Within urban areas. the effects of adjust- ment varied by sector. Employment in construc- tion and public works fell because of cuts in public investment expenditure. Devaluations and trade liberalization measures reduced cmploy- ment in domestically oriented industries and increased it in export industries. Employment also increased in the public sector and the services sector. which have traditionally played the role of refuge sectors during difficult periods.
Primary incomes pi-obably increased in the agricultural sector across all categories, from small farmers to large farmers. The production of cereals and legumes, the major income source for small farmers, increased substantially in IV84 and 1485’ without causing a drop in real prices. Large farmers benefited both from the large production gains in cereal crops and from increased produc- tion and exports of early vegetables and citrus fruits. whose export prices rose with the devalua- tion of the dirham.-
Primary incomes in the nonagricultural sector did not fare as well. In public administration and
industry, average real wages fell by 13% during 1983-86. Unlike the case in the public sector, where income losses affected all employees, losses in the industrial sector were much greater for professionals and skilled workers than for unskilled workers. It is likely that the real wages of unskilled workers did not fall at all since the legal minimum real wage rose by Y.7% during 1 Y83-86.
Market pressures were responsible for the substantial drop in the real wages of skilled workers, a trend that started before the adjust- ment program. (During lYS(H3. the average industrial wage had fallen by 6.3% and the average public sector wage by 10%). Since the supply of skilled labor was increasing much more rapidly than demand, which was dampened by the stabilization program, wages had to adjust downward. The sharp increase in the supply of skilled labor was the result of the education efforts of the previous decade: a fivefold increase in the total number of university students during lY72-80 and a 140% increase in secondary school students. This rise in education level togcthei with steady increases in the minimum wage during 1083386 made it possible to reduce the wages of those in the middle- or upper-income deciles and to avoid any reduction in the purchas- ing power of unskilled and semi-skilled workers. The unemployment trend in urban areas supports this interpretation: unemployment increased more among adults (2534 years old) than among young people and more among skilled female workers than among skilled male workers. The growing imbalance between supply and demand in the market for skilled labor thus favored adjustment through a lowering of real wages.
Although there are no data on the income sources of entrepreneurs. some indirect notion of how the adjustment program affected entre- preneurs is provided by the trend in the ratio of payroll to value added in manufacturing enterprises.’ For manufacturing as a whole, this ratio fell from 0.43 to 0.41 during 19X1-X5. hut it increased by 0.08 in the three industries paying the lowest wages (textiles. clothing. and leather), in part because real wages in these industries remained stable. This decrease in the ratio for industry as a whole is consistent with an increase in labor productivity (23.5%) greater than that in nominal wages (18.8%) during IYtll-X5.
But while the trend in this ratio was favorable to employers. their net incomes were not neces- sarily increased, because financial charges also increased after lY83-84. To determine whether there was an increase in net profits would require an analysis of the breakdown of gross profits among financial charges. depreciation. taxes, and

MOROCCO 1637
net profits. A survey of a limited sample of 40 enterprises suggests that net profits probably did increase.4 In the majority of these firms, net profits increased despite the sharp increase in financial charges, either because exports were stimulated by the devaluations or because domestic sales improved. A minority of these 40 firms, however, experienced serious difficulties. Their investment decisions had been based on an assumption of continuing strong tariff protection so when they were suddenly exposed to foreign competition, these now noncompetitive firms found themselves with heavy depreciation and increased financial charges, while producing at only one-third capacity.
We can conclude then, on the basis of some- what limited information, that at least two adjustment measures - reduced public invest- ment and liberalized trade - caused a fall in the profits of some enterprises, notably in construc- tion and public works and in the less competitive industrial enterprises. The profits of other enter- prises, probably the majority, however. in- creased despite the slowdown in economic activity because of the fall in real wages.
(c) The impact of adjustment on government social expenditure
The rapid reduction of the budget deficit under
the stabilization program of 1983 involved cuts in all public expenditures including food subsidies. These cuts must have had an effect on standards of living and income distribution, since house- hold structure was unlikely to have changed significantly during 198S86, leaving government social expenditure the only important variable.
(i) The fall in per capita social expenditure The stabilization and adjustment program
caused a distinct break in the trend of total public expenditure. Total expenditure fell by 13.5% in real terms between 1982 and 1983 and remained at the 1983 level until 1986. The picture is less clear when we try to determine whether social expenditures were protected (fell less than other expenditures) during the difficult period of ad- justment. The answer is positive if we take 1982 as the base year - social expenditure as a share of total expenditure rose from 24% in 1982 to 25.8% in 1986 - but negative if we take 1983 as the base year, when the share was 27.6%. Thus social expenditures were the same in 1983 as in 1982, but stagnated thereafter while other ex- penditures increased slightly. Because of rapid population growth, however, this stability in absolute terms translated into a significant reduc- tion in social expenditure per capita (Table 3).
Food subsidies were the only category of social expenditure that did not drop as a percentage of
Table 3. Poverty and social expenditure indicators for Morocco, 1970 and 1982%
Indicator 1970 1982 1983 1985 1986
Poverty (percentage of households)*
Social expenditure per capita (1972 = 100)
Social services Education Health Social security
Social expenditure as a percentage of GDP
Social services Education Health
Social expenditures as a percentage of total public expenditures
Total food subsidies per capita (1972 prices)
42.0 30.0
143.3 130.6 160.6 142.8 101.0 96.3 126.7 121.5
8.3 7.2 6.3 5.4 1.0 0.9
24.0 27.6 25.8
24.0 24.5
*With a constant poverty threshold

163X W0RI.D DEVELOPMENT
total public expenditure. The total subsidy grew rapidly - it almost doubled during 1982-85 - despite the adjustment because of rising prices and population growth. Riots broke out in response to price increases in January 1984 (as they had in 1981). For political reasons, therefore the government abandoned efforts to introduce sudden price increases. There were considerable leakages in the food subsidies program - only 16% of subsidies went to the households in the lowest three income deciles, while 47% went to households in the top three deciles ~ making the program an inefficient way of combating poverty. Nevertheless, the subsidies had a net redistribu- tive effect in urban areas. where they amounted to 20% of the expenditure of poor households, compared with 3% for wealthier households. Since the poor spent 80% of their budget on food, their food consumption would have fallen by one-quarter without the subsidies. This de- pendence helps to explain both the strong oppo- sition to subsidy reductions in poor districts in I981 and I984 and the protection of subsidies (the sole expenditure category to be fully pro- tected) during the stabilization program.
Social spending 1n a II other categories fell, whether measured in per capita terms or as a percentage of GDP. The greatest drop was in education, which was both the largest single category (accounting for over three-quarters of social expenditures) and the fastest rising one. During IY72X3.1. education expenditures per capita increased by 61% while social security increased by 27% and health expcnditurc by I’%,.’ This pattern of expenditure growth came about largely because social demand originated mainly with the urban middle classes, who wanted free secondary and higher education for their children. This pattern of education expend- turea was far more costly to the government than the expansion of primary education. which was desired by poor rural households whose demands were cxprcsscd much less vociferously and much Icss effcctivelv.
The recluctlron in social expenditure affected capital investment much more than operating expenditures. For esample, during, IYX2LXh. operating expenditures for the M1nLtry for National Education fell by 4% and those of the Ministry of Public Health increased by 2%. while their capital cxpcnditures were slashed by IS’%, and 36%. respectively. As a result. the trend in operating expenditure per capita did not change as much as that of total social expenditure.”
(ii) 7irnrl.c i/r eductrtiotr wld hcrrlrl~
In education. the most prominent change under the adjustment program wa\ the drop in
the number of pupils in primary school and the increase at other levels of education. The number of children in primary school. which had been rising steadily since independence (doubling dur- ing lY71-82), fell by 10% during 1983-86. The fall was steeper in rural areas (down 12%) than in the towns (8.8%). which means that poor fami- lies were affected more than others. The fall in the number of primary school students was not. however, a result of a reduction in the supply of primary education. During 1083-86. the number of teachers rose by 14% and the number of schools by 17%. The pupil/teacher ratio also improved, falling from 34.4 to 27.
At the same time, the number of pupils in secondary schools increased very rapidly: up 22% during 1083-86. which raised the enrollment ratio from 29% to 34%. The number of teachers increased at the same rate, so the quality of education - at least as measured by pupil/ teacher ratios - was not affected. The number of students in higher education increased at the even faster rate of 29% over the three years. The gender ratio of enrollment also improved, with female enrollment increasing by 54%.
These trends favored the middle classes in the towns and cities at the cxpcnse of poor housc- holds in rural areas. The very rapid increase in the number of students in secondary and higher education benefited the children of middle- income households, while the children of low- income rural families received less primarJ schooling. For poor households. the effects were twofold: a fall in their standard of living in the short term’ and lower productivity and incomes in the longer term (IO40 years). Only in access to a university education did the children of poor or relatively poor families not lost ground as a result of the stabilization program. During lY)x3- 86, education grants for university study. which arc essential to the children of poor tamilies. continued to increase rapidly (up 36%). and an increasing proportion of students benefited from the grants (SC)‘% in 1987).
Since the enrollment ratio was approaching X(LlOO’%, for the children of middle- and upper- income households, the structural adjustment program was intended to tavor primary educa- tion. which would benefit poor families. What went wrong’? The government cannot be blamed. since the number of teachers and schools in- creased considerably. The fall in the number of primary school pupils was a demand effect and WIS probablv related to economic conditions. Primary education is viewed as a passport to the modern sector but as unnecessary for work in agriculture or the informal \cctor. Some poor families in rural areas. with uneniploynicnt rising

rapidly in the modern sector, saw no point in sending their children to school. Poor families might prefer to entrust a child’s training to a craftsman or small trader in the informal sector, if this would increase the child’s chances of employment. At the same time, the government was unable to reduce demand in the towns for secondary and higher education, a demand that had its roots in the expansion of primary educa- tion during the 1960s and 1970s. Furthermore, those demanding continuing higher education were generally middle-class families that fre- quently had connections with the public sector.
Another surprising aspect of public expendi- ture for education was that current expenditure on education remained unchanged while the number of students increased and student/staff ratios improved. This was possible because the costs of adjustment were borne by the teachers, not by the families. The real wages of primary school teachers fell by 16% during 198X-86, that of college teachers (first-cycle secondary) by 21%. and that of junior lecturers by 20%. This trend had begun before the stabilization pro- gram: during 198G33, the wages of college teachers had fallen by 20%.
Clearly the trend in the provision of education cannot be deduced solely from expenditures on education. Two measures enabled the govern- ment to reconcile the (admittedly very slight) reduction in the education budget with an im- provement in the provision of education: a drastic reduction in capital expenditure and a reduction in teachers’ real wages. Since teachers are in the middle- or upper-income deciles,’ this policy had no negative effect on inequality or poverty, but in the longer run. it is likely to reduce the quality of education because of the shortage of equipment and the harmful effects on the quality and motivation of teachers.
It is more difficult to identify the trend in health services, since statistics are available for medical staff but not for services. Capital ex- penditures in health were drastically cut, and the number of hospital beds per 10,000 people fell by 17% during 1983-87. The failure to build any new hospitals probably hurt rural areas more than others since the new hospitals would have been located in small towns to serve the sur- rounding rural area. The fall in operating ex- penditures per capita may have also reduced the resources available to hospitals, leading to de- terioration in the quality of care. (This decline is not measured by available indicators.)
Medical staff, however, increased rapidly. The number of doctors rose from one for every 7,400 people in 1983 to one for every 5,000 in 1987. The number of medical examinations in public
health training also increased, by 13% in urban areas and by 26% in rural areas during 1982-87. Rural households, most of them poor and with- out access to private medical care, therefore benefited from an increase in public health care. Vaccination data also indicate an improvement: inoculations against measles increased by 110% and those for the diphtheria/tetanus/whooping cough/polio vaccines by 66% during 1983-87 (the only decrease was in inoculations against tuber- culosis, which were down 25%).
Infant mortality rates continued to fall after 1983, but at a slower rate (by one percentage point a year, instead of two). Since the infant mortality rate depends on food supply. diet, and medical services, the deterioration in nutrition for poor families in the towns may have contri- buted to the slower rate of improvement in infant mortality, even without any deterioration in the health care available to these families.
Evaluation of the effects of adjustment on poverty in Morocco is hampered by the lack of household expenditure surveys in 1982 or 1983 to provide base year data for comparison with the findings of the 1985 survey (Ministere du Plan, lY87). The surveys for 1970 and 1985 show that poverty diminished significantly over the period as a whole (Table 3). but reliable information is lacking for the last few years of this period.
In rural areas, the vital factor influencing changes in poverty levels was the increase in agricultural production. Since increases were substantial in the crops commonly grown on small farms (cereals and legumes), poor farmers most likely benefited from an increase in produc- tion and were able to eat better. Migrant workers’ remittances also increased rapidly - up 80% in real terms during 198&87. If we assume that half of these transfers went to farm house-
holds, this inflow was equivalent to 30% of agricultural production (in value added) in 1Y87 compared with 16.5% in lY80. The steady in-
crease in remittances during 1983-87 must have helped to reduce poverty in rural areas.
While two exogenous factors, the weather and migrants’ remittances, played a dominant role, adjustment policies also had a favorable effect. The creation of special foreign currency accounts with higher interest rates and the devaluations of the dirham both helped to stimulate growth in remittances: migrant workers are encouraged to send more money home when the official ex- change rate is not overvalued. Increased pro- ducer prices and the liberalization of supply and
distribution markets improved agricultural incen- response to changes in exchange rate policy, and tives and led to increased production. In addi- that tourism receipts increased by more than tion. the liberalization of foreign trade exerted a 170% during 1982-86. Thus conditions must have downward pressure on the price of manufactured improved among informal sector workers whose goods. This drop in prices increased the real activities depend on tourism. For workers in income of poor farmers who purchased these other informal sector services, which depend on goods and who were also producing for the domestic demand, real income must have fallen market, but had little effect on the income of the because prices have to adjust when demand is very poorest subsistence farmers. falling. Thus for most workers in informal sector
Overall, then, adjustment had a beneficial services, poverty probably worsened. effect on poverty in rural areas: the percentage of As in rural areas, a few poor families in urban the rural population in poverty certainly fell areas also benefited from the sharp increase in between 1982 and 1986. The intensity of poverty remittances. In general, living conditions im- diminished less because the adjustment proved for poor families who were not affected measures, however, and migrants’ remittances by unemployment, who received remittances, or helped the fairly poor rather than the very poor. who worked in export-oriented activities. Condi-
Poor households in urban areas fared less well, tions for many of these families improved enough although some groups suffered less than others. so that they were able to emerge from poverty. For the families of formal sector workers who At the other extreme were families whose kept their jobs, there was no worsening of conditions worsened (unemployment, no remit- poverty. The standard of living of poor families tances, involved in activities that depended on with a single wage earner who received the domestic demand) and who became more im- minimum legal wage probably did not fall be- poverished. cause the minimum wage increased by 7% during The losses of some and the smaller gains of 1983-87. (In 1985, the minimum wage was 8,900 others in the towns, together with the reduction dirhams a year and the poverty threshold for an urban household was 13,300 dirhams.)’
of poverty in rural areas, explain the relative stability in the per capita consumption of basic
For families whose head of household was products during this period and the stabilization working in the informal sector, however, real of poverty - the declining trend in poverty incomes fell in many cases. According to the during the 1970s was not reversed. But while reference simulation using the macro-micro poverty remained stable on average, hundreds of model described below, the average income of thousands of people in the towns may have fallen informal sector workers fell by 8% between 1982 below the poverty line for the first time or fallen and 1984-85, assuming a sharp increase in formal even deeper into poverty. sector unemployment. This average conceals substantial differences among the major cate- gories of activity in the informal sector, however 5. MODEL SIMULATIONS OF - textiles, building, and services. ADJUSTMENT STRATEGIES
Incomes probably did not fall for the majority of informal sector textile, clothing. and leather (a) The model and the base simulation workers since total production (formal and infor- mal sector) in those activities increased by 15% In applying the computable general equili- during 1982-86. Despite the generally favorable brium model to Morocco (see Bourguignon, de trend for this group of industries, incomes may Melo, and Suwa in this issue for a detailed have fallen among those working solely for the description of the model), the economically local market since the adjustment policy favored active population was divided into six groups: production for export and depressed demand in medium-to-large farmers, small farmers, agricul- urban areas. tural workers, wage earners in the modern
In building and public works, the majority of sector, entrepreneurs in the modern sector, and workers were probably worse off because total informal sector workers. Entrepreneurs hold the production (formal and informal sector) during specific factor in the primary export sector and 1984-87 was down an average of 17% from its the greater part of the capital in the other sectors. level in 1982. This interpretation is confirmed by They are the only group to hold foreign secur- a survey of people involved in the building trades ities. Only medium-to-large farmers have capital in Fes, all of whom complained of a sharp fall in and domestic securities. Labor is the only pro- activity (Salahdine. 1988). duction factor in the informal sector. Adjustment
We have no direct information for the services in the goods and services market occurs through sector. We know that tourism grew strongly in prices or quantities in the modern sector (with a
1640 WORLD DEVELOPMENT

MOROCCO 1641
mark-up price) and through price alone in the other sectors. The model was calibrated for 1980 and then adjusted for 198CN36 by introducing economic policy and international environment parameters as exogenous variables.“’
The base simulation (Table 4) satisfactorily reproduces the trends in the variables that matter most during adjustment - the budget deficit and the current account deficit. The simulation re- sults are also satisfactory for the other important aggregates: GDP, household consumption, and investment. (While the discrepancies for these aggregates are bigger than those for the two deficits, reducing them would have increased the discrepancies in the trends for the two deficits. We deliberately gave preference to the latter.) The base simulation was used to evaluate the trend in incomes, inequality, and poverty.
As did observed incomes in agriculture, all agricultural incomes in the base simulation in- creased during the adjustment period (1985-86 compared with 1982) for farmers and for agricul- tural workers. The average income of entre- preneurs also increased by an average of 8%, a plausible increase given the broad definition of this group in the model. All self-employed people in the tertiary sector (except in informal activities) were included, and while their incomes may have stagnated, those of heads of industrial enterprises increased. The average income of wage earners fell by 4.5% (on top of the 6% fall from 198N32.) If the unemployed are also included, the fall is even more marked because of the increase in unemployment. The model under-
states the fall in real wages because the rate of
inflation is underestimated in the base simula-
Table 4. Base simulation with flexible prices, 1980-86
Data 1980 1981 1982 1983 1984 1985 1986
GNP
Household consumption
Current account deficit
Budget deficit
Investment
Theil intergroup value Unemployed considered separately+ Unemployed grouped with wage earners
Percentage of poor Unemployed considered separately+ Unemployed grouped with wage earners
Poverty gap Unemployed considered separately$ Unemployed grouped with wage earners
Entrepreneurs
Medium and large farmers
Small farmers
Wage earners Assumption I$ Assumption 28
Agricultural workers
Urban informal sector
Observed* Simulated
Observed Simulated
Observed Simulated
Observed Simulated
Observedt Simulated
Simulated
Simulated
Simulated
74.8 73.8 78.9 X0.8 82.5 X6.2 91.8 72.8 12.2 ‘77.4 X3.1 8.5.4 87.2 92.7
49.8 50.6 54.0 53.0 53.2 54.2 57.0 50.9 48.9 52.8 53.8 52.2 55.8 58.X
5.6 9.6 11.4 7.1 10.6 8.9 2.1 5.5 8.4 10.9 4.3 10.0 9.5 1.6
7.1 9.8 13.7 10.5 12.5 11.6 8.5 8.5 11.0 13.7 X.7 10.2 10.9 X5
16.1 15.5 17.1 14.X 15.8 16.9 18.9 15.3 14.X 16.6 14.7 17.8 16.0 13.7
46.3 47.0 44.0 50.4 48.2 44.6 44.0 39.4 3X.9 37.5 44.1 41.1 37.1 37.5
37.9 40.9 37.6 40.2 42.9 37.9 36.2 32.3 35.0 32.4 35.4 3X.1 32.6 31.1
7.3 8.X 7.4 X.1 9.3 X.2 7.3 4.X 5.5 4.7 5.4 6.2 4.7 4.2
100.0 Y5.0 92.0 110.0 94.0 97.0 101.0
100.0 104.0 113.0 110.0 112.0 118.0 125.0
100.0 100.0 102.0 100.0 9X.0 116.0 116.0
100.0 96.0 94.0 x9.0 XY.0 Y4.0 90.0 100.0 XY.0 Y4.0 xx.0 x7.0 79.0 83.0
100.0 104.0 104.0 Y5.0 Y3.0 118.0 11x.0
100.0 X6.0 9.5.0 X9.0 7X.0 9X.0 103.0
*Observed value - 1 billion dirhams. tobserved value x 0.9. SThe unemployed receive no income. $The unemployed are grouped with wage earners

1642 WORLD DEVELOPMEN’I
tion. Since wages are adjusted for 30% of the increase in the cost of living, the fall in the real wage is underestimated if the simulated inflation rate is lower than the actual rate.
The series for average informal sector incomes shows a mixed trend: incomes fall sharply in 1983-X4, before picking up again in IYXS and rising even faster in lY86, when they passed the lYX2 level. This estimate is almost certainly too high, however. because the model undcresti- mates the increase in the informal sector labor force during lY82-X6 at 0%. If the labor force grows faster than production. average income will fall because adjustment comes through a fall in the price of labor. With a labor force growth rate of 16%. which is more in line with the true employment figures. the fall in income during 19X3-85 would have been greater, and the income level in I086 would have been the same as in lYX2. This picture is probably closer to what actually happened, although wc have no direct information.
Using these estimates of incomes and assuming income distribution within each group to be constant for the purposes of calculating poverty. the model estimates the trend in income incclual- ity and poverty. The Theil intergroup values clearly increased in IY83 and 1YX-l. before return- ing to their lY82 Icvels in IYXS-86. Two factors accounted for the increase in inequality in IYX3 and lYX4 - higher unemployment and a fall in informal sector incomes - while the substantial income gains among two low-income groups. small farmers and agricultural workers, explain the reduction in inequality in lYX5%6.
Since the concept of poverty refers to the standard of living and concerns the entire popuI;~- tion, the use of poverty indicators in a study of the economically active population raises some objections. In this study, however. povcrtv in- dicators have only a fictive significance: -it is assumed that each member of the economically active population has the national average number of dependents. Below a certain income. this economically active person and his or her family would have a standard of living below the poverty line (assuming no public or private transfers).
After the agricultural crisis of IYXI. when poverty increased, the two poverty indicators - the percentage of the poor and the intensity of poverty (measured by the poverty gap) ~ returned to their lY80 level during lYX2. With respect to this base, the percentage of the poor increased in 19X3-X4, then returned to the base level in 19X5-86. The intensity of poverty fol- lowed the same pattern, but the deterioration lasted until 1985. The improvement seen in lYX6
is explained by the growth in GDP, which corresponds to actual conditions. If we take into account the larger fall in incomes in the informal sector than shown by the model, we can conclude that poverty became more widespread during lY83-X5. then returned to its previous level in lYX6. The income simulations also confirm that this deterioration in lYX3CSS affected only the urban population.
To compare the economic and social costs of the various stabilization measures that a govcrn- ment may introduce to reduce the current account deficit, WC se&ted an identical objective for each measure: a one billion dirham reduction in the deficit (‘fable 5). Since this comparison covers effects for only one year, costs that arise in ~uhsequcnt years do not show up, although they must eventually he taken into account to make the assessment complctc. Furthermore. since migration hetwccn sectors depends on the varia- tion in relative incomes in the prcccding year. the economically active population dots not vary. except among w’age carncrs in the modern \ector. The year 19X1 was chosen for these simulations. Since flexibility of prices in the modern sector i\ not guaranteed in the short term in Morocco (certain prices tend to bc somewhat sticky). all the simulations were run twice: once with flcxiblc prices and once with fixed prices in the modern sector. (Table 5 pre\ents only the simulation results with flexible prices.)
Four stabilization measures can reduce public expenditure and global demand: cuts in operat- ing expenditure, investment expenditure, wages. or public sector employment. Each of these measures also reduces the budget deficit. which was partly financed in 19X1 by an increase in the money supply. This factor was taken into account by correcting the money supply by an amount equal to the reduction in the deficit (the same procedure was followed for the other measures studied below).
Any fall in global demand results in a fall in GDP, household consumption, and imports, to the advantage of exports. While this rcstructur- ing of demand will certainly reduce the external disequilibrium, the economic and social costs vary considerably according to the measure applied. The worst solution is to lay off public service employees, which strongly increases pov- erty. Social and economic costs are much lowjer

Tab
le
5.
Eco
nom
ic
and
soci
al
effe
cts
of
alte
rnut
ive
mea
sure
s fo
r re
duci
ng
the
curr
ent
acco
unt
defi
cit
by
one
bill
ion
dirh
ams
Cur
rent
In
vest
men
t A
vera
ge
Mon
ey
Exc
hang
e Im
port
In
dire
ct
expe
nditu
re
expe
nditu
re
wag
e E
mpl
oym
ent
supp
ly
rate
s du
ties
taxe
s (-
16.4
%)
(-17
.5%
) (-
11.4
%)
(-10
.2%
) (-
3.5%
) (-
7.0%
) (+
fN.o
%)
(+0.
02)
GN
P H
ouse
hold
co
nsum
ptio
n E
xpor
ts
Impo
rts
Inve
stm
ents
U
nem
ploy
men
t C
urre
nt
acco
unt
defi
cit
Bud
get
defi
cit
GD
P de
flat
or
The
il in
terg
roup
va
lue
Une
mpl
oyed
co
nsid
ered
se
para
tely
* U
nem
ploy
ed
grou
ped
with
w
age
earn
ers
Perc
enta
ge
of
poor
U
nem
ploy
ed
cons
ider
ed
sepa
rate
ly*
Une
mpl
oyed
gr
oupe
d w
ith
wag
e ea
rner
s Po
vert
y ga
p U
nem
ploy
ed
cons
ider
ed
sepa
rate
ly*
Une
mpl
oyed
gr
oupe
d w
ith
wag
e ea
rner
s
-0.0
-1
.0
-0.7
-0
.0
+3.3
+3
.3
-2.7
-2
.7
-3.7
-9
.3
i5.4
f6
.X
-11.
8 -1
1.8
-5.3
-5
.4
-1.7
-1
.6
i2.6
+2
.0
t3.4
+1
.4
t3.4
+1
.7
t1.2
-0
.1
t1.9
t1
.1
+4.1
t1
.9
-0.X
-2.4
+3
.7
-2.5
-3
.2
+5.1
-1
1.x
-8.5
-3
.6
-0.1
-2
.0
f2.S
t2
.0
+5.8
t4
.s
-2.2
-2
.4
t3.7
-2
.5
-3.3
+1
4.4
- 11
.8
-8.3
-2
.1
+3.0
-0
.2
t4.3
+2
.5
i9.7
+4
.7
- 1.
0 -0
.6
-1.1
-1
.1
-2.0
-1
.8
t3.3
+6
.5
+1.x
-2
.7
-2.9
-3
.3
-9.3
-6
.2
-5.3
+7
.O
i4.4
+6
.3
-11.
x -1
1.8
-11.
8 t2
.g
-3.1
-6
.3
-1.6
+2
.5
-0.6
+1.2
-0
. I
+1.9
t1
.1
+3.
1 +
1.7
-1.1
-2
.0
+0.7
+0
.7
i2.6
+1
.1
t1.3
0.
0
-1.7
-3
.1
t1.7
-3
.4
-4.1
+
10.2
8
-11.
8 -1
1.0
!
-1.2
0”
+2.3
to
.5
t3.3
+5
.6
t3.0
+5
.2
f6.6
t1
1.0
t5.6
+9
.5
*The
un
empl
oyed
re
ceiv
e no
in
com
e.

1644 WORLD DEVELOPMENT
for a wage cut than for a cut in employment. A wage cut is also preferable to cuts in operating or investment expenditure, because it minimizes the costs in terms of GDP growth, investment, and unemployment. It also increases exports and reduces the budget deficit more than other measures. Finally, a wage cut is the only measure that tends to reduce inequality, because public sector employees arc in the middle- and upper- income deciles. Only in the effect on poverty does another measure ~ a cut in operating or investment expenditure - perform better than a wage cut. This is explained by the indirect effect of a fall in public sector wages. which leads to a fall in demand for informal sector goods and services and therefore to a drop in incomes in this sector and increasing poverty.
Since a cut in public investment has undesir- able medium-term effects, the choice of stabiliza- tion measures comes down to cutting operating expenditure or cutting wages. According to all indicators except those for poverty. the second option is preferable. Therefore, unless the main aim of the adjustment policy is to combat poverty. a public sector wage cut may be the favored option. Thus the policy chosen by the Moroccan government - to increase employ- ment slightly and to reduce wages - was the right one. In many countries, however, public sector wage cuts are a difficult measure to implement because public servants constitute a strong pressure group. There is much less politi- cal opposition to cuts in operating expenditure, because their effects are spread throughout the economy. or cuts in investment expenditure that affect mainly builders and their relatively un- skilled and unorganized labor force. In addition, a long period of low wages can have important negative effects in the longer term, which the model does not take into account. such as absenteeism, moonlighting, or corruption.
Since all the structural adjustment measures aggravate poverty, it is interesting to consider them from the perspective of net benefits, or the difference between the reduction they achieve in the budget deficit and the additional cost of public transfers to the poor to prevent any increase in total poverty. For operating expendi- ture cuts, the net benefit is 400 million dirhams (a 580 million dirham cut in the deficit minus a 180 million dirham transfer to the poor); for wage cuts, it is 640 million dirhams (940 million minus 300 million).
(ii) Fiscalpolicy Of the two fiscal policy options. increasing
import duties or indirect taxes, the results are better with import duties. except for their effect
on the budget deficit and investment (investment is slowed because many capital goods are im- ported). An increase in import duties raises the cost of living for those who consume imported goods: entrepreneurs and wage earners in the modern sector. Small farmers. agricultural workers, and informal sector workers are less affected by import duties than by increased indirect taxes. Increasing indirect taxes worsens poverty because the price increase in the formal sector causes a contraction of demand and a fall in the price of goods in the informal sector. It also increases unemployment. The average wealth of informal sector workers (cash holdings) falls because of the fall in incomes in this sector. while that of entrepreneurs increases because of a decrease in their work force (down 4.5%) and no change in the value of capital (which repre- sents the greater part of their assets).
(iii) Morrrrary and exchmge rutepolicy The monetary policy simulation assumed a
3.5% reduction in the money supply, a plausible assumption given the 14% increase in the money supply in 1981 and the contraction of GDP. This restrictive policy considerably dampens invest- ment because the interest rate rises from 6.9% to the ceiling level of 8°K.” Since tax revenues also fall while expenditure does not change, the budget deficit increases instead of falling as it does under all the alternative stabilization measures.
The income effects of this combination of recession and lower prices vary. Real wages increase for government employees, whose wages are fixed in nominal terms, and for wage earners in the modern sector, because the adjust- ment mechanism for their nominal wage reduces the wage loss in real terms as the rate of inflation falls. Farmers maintain their real incomes, with gains on exports compensating for losses in the domestic market. Real income falls in the infor- mal sector because of the contraction of demand. and together with higher unemployment. leads to a worsening of poverty. Average wealth in- creases among entrepreneurs because the total value of their assets (mainly physical capital) remains constant while the number of entre- preneurs falls slightly. Average wealth decreases in the informal sector, where assets (mainly cash holdings) fall by 45% because of lower income and higher interest rates. Since the restrictive monetary policy. however, also reduces inflation (from 8.8% to 7%). it affects the distribution of wealth to the benefit of low-income groups (informal sector and agricultural workers), whose money assets are reduced by inflation, rather than the wealthiest group. entrepreneurs.

MOROCCO 1645
whose assets are in productive capital and foreign securities.
The exchange rate policy option for stabiliza- tion has many short-term advantages. Devalua- tion is the least costly measure in terms of growth, has the most favorable effect on exports, and results in the smallest increases in unemploy- ment and poverty while reducing income inequal- ity. Its disadvantages are lower investment (because of higher interest rates), leading to slower growth in subsequent years, and higher inflation. The higher inflation contributes to the inequality of wealth and engages the economy in a process of successive devaluations to compen- sate for domestic price increases, especially if agents’ expectations change. Workers are likely to demand wage increases through strikes and other means.
These effects result from the price movements brought about by devaluation: domestic prices rise because of the increased foreign demand in export sectors. As a result, the incomes of those engaged in agriculture remain stable or increase, and farmers and agricultural workers consume more informal sector goods, which compensates for the lower consumption by modern sector wage earners. Informal sector incomes fall very little. unlike the case with other stabilization measures. The higher cost of living, which is only partially compensated for by the wage adjust- ment mechanism, leads to a fall in real wages among modern sector wage earners. The effect on the incomes of entrepreneurs is similar because of the fixed division of value added between wages and profits. Average wealth increases for entrepreneurs, however, because they hold mainly physical capital, while the wealth of all other groups falls because of the higher prices.
This pattern of income effects explains the reduction in inequality and the negligible impact on poverty. Incomes remain stable or virtually stable among the lowest income groups, who benefit from the restructuring of the economy toward outwardly directed activities, such as export crops, fisheries, tourism, and industries that use low-skill labor. In addition, incomes fall among the middle- and upper-income groups, which feel the effects of the increase in the price of imported consumer goods. In rural areas, however, because of the structure of agriculture, it is the medium and large farmers who profit most from higher export prices, although small farmers benefit from the indirect effects.‘”
(iv) Conclusion of model simulations Of the eight stabilization options evaluated.
devaluation performs best in terms of all the
social criteria, but a reduction in the average wage is preferable from the perspective of three important economic variables: inflation, invest- ment, and the budget deficit. In practice, of course, no government attempts to stabilize its economy using a single policy instrument; any stabilization program necessarily includes a pack- age of measures. This study clearly shows that two measures, devaluation and wage reduction, are more effective than others in the shorter term for Morocco. It is therefore appropriate, that these two measures played a major role in Morocco’s stabilization program in 1983-84.
Because this analysis has dealt only with some of the short-term effects, however, ignoring others as well as all longer-term effects, the results need to be interpreted with caution. For example, the model does not take into account the redistributive effects of changes in public expenditure. Thus in the model, a reduction of operating expenditure affects only employment and primary incomes, whereas in reality this measure may reduce food subsidies or provision of education and health services. If poverty is estimated as a function of the standard of living rather than primary income, this negative impact should be taken into account. Interactions be- tween variables could also alter some results. For example, devaluation worsens poverty less than does a reduction in public sector wages. But the net benefit measure (reduction in the budget deficit minus public transfers needed to stabilize poverty) shows that, after compensating for any change in poverty. devaluation results in a net gain of only 170 million dirhams compared with 600 million for wage reduction.
Because this analysis looks only at the short term, it cannot be used as the basis for a medium- term stabilization strategy. Certain negative effects do not appear immediately. Thus, for example, the comparison between cuts in operat- ing expenditure or investment expenditure is distorted if the assessment is made for only one year. Simulating the economic trend in subse- quent years reveals that the investment cut leads to a slowdown in growth because the productivity of private capital depends partly on public investment in preceding years. Similarly, although devaluation seems to be the most satisfactory measure in the short term, it has important negative consequences in the longer term. With successive devaluations over several years, budget deficits and external indebtedness would accumulate. The fall in investment would slow growth, while the acceleration of inflation would aggravate inequalities in wealth and could discourage productive investment, encouraging speculative investment and capital flight instead.

1646 WORLD DEVELOPMEN
Thus, the results are valid only for a stabilization program lasting 12-18 months. Once the im- balances have been reduced, new macroecono- mic policies aimed at a return to growth would be needed.
The results presented here support the case for flexible prices in the modern sector. With fixed prices, the ranking of measures remains the same, but the costs of adjustment are higher: the fall in GDP is greater and, in most cases, inequality and poverty increase more. Thus a structural adjustment program that increased price flexibility would reduce the social costs of stabilization.
Finally, because the parameter values also influence the results, we conducted sensitivity tests on three parameters - wage indexation, price elasticity of foreign demand, and invest- ment elasticity with respect to Tobin’s q - to see how sensitive the results are to a change in values. Devaluation, by increasing inflation, has an impact on real wages in the modern sector. so we estimated this impact for coefficients of indexation both higher (0.4) and lower (0.2) than the coefficient used in the simulation (0.3). With a lower coefficient, the modern sector wage falls by 0.6%) while the real incomes of small farmers and agricultural workers increase slightly because of the shift in relative prices in the agricultural and nonagricultural sectors. As a result, inequal- ity and poverty are reduced. These variations are very slight, however, as are those for the macroeconomic aggregates and for the impact on the two deficits.
Devaluation also has an impact on exports, so we also estimated the consequences for exports of a price elasticity of foreign demand of 4 and 2 (instead of 3) for goods exported from Morocco (excluding phosphates). The value of this para- meter turned out to be vital. To achieve the same one billion dirham reduction in the external deficit, the devaluation would have to be much greater with an elasticity of 2 than with an elasticity of 3. This would involve various dis- advantages, such as accelerated inflation. Since the change in this parameter does not modify the impact of other measures, the ranking of measures by performance might be altered if the value of this parameter were different.
Finally, we looked at the effect of a change in the elasticity of investment in the case of the restrictive monetary policy measure. For an elasticity of 2. the impact of the same monetary measure is more pronounced: a 14.2% reduction in the current account deficit instead of 11 .X’s, and an 11.8% cut in investment instead of 9.3%. The effects of this measure on GDP and on the social indicators, however, remain almost the same.
Thus the sensitivity tests for key parameters showed the results to be fairly solid, except for the impact of a devaluation on exports. In that case, additional analysis may be needed to determine the most reliable value for the price elasticity of foreign demand.
(c) The medium-term effects of alternative policies
To answer the question, whether it would have been better to adjust differently (or not at all), we simulated the effects of a set of measures over several years rather than just one. We considered three alternative scenarios: no adjustment. earlier adjustment, and greater adjustment (greater deficit reduction and lower social costs). The parameters for these alternative policies are presented in Table 6, and the results of the simulations are shown in Tables 7 and 8. For each alternative scenario, the variations in results are shown relative to the base simulation with flexi- ble prices, a more plausible assumption than fixed prices in the medium term.
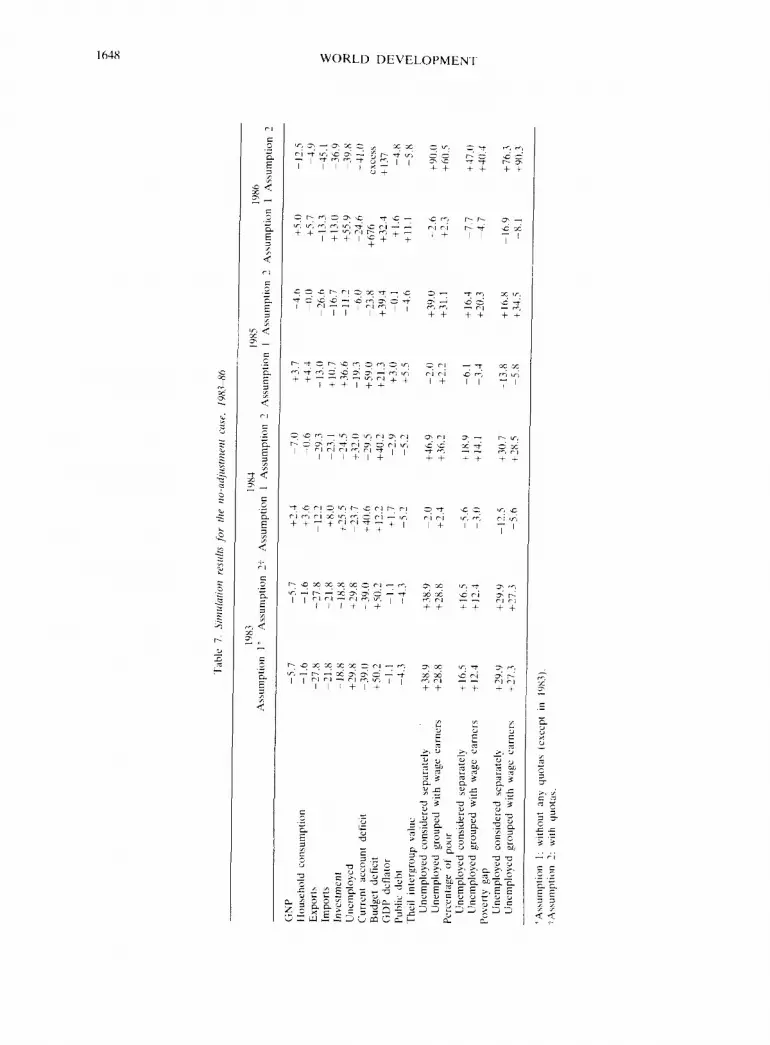
(i) No adjustment Because of the political costs of stabilization,
governments are often tempted not to adjust. For the no-adjustment case, we assumed that the government maintained its earlier investment and exchange rate policies, extrapolating the trends observed before 1983. Since Morocco’s foreign reserves were exhausted and its external disequilibrium was worsening in 1983. the government was forced to impose import quotas in 1983. Accordingly, we assume that quotas are maintained throughout the period (assumption 2 in Table 7). We also assumed, however unreahs- tically. that Morocco does not impose quotas after 1983 but continues to receive foreign loans, despite its serious imbalances (assumption 1).
The results of the no-adjustment case with quotas (assumption 2) are clear: Morocco is heading for a deep crisis and a catastrophic increase in poverty because of the shortage of foreign currency. As unemployment increases and incomes in the informal sector fall, the number of the poor increases by 50%. Incomes fall for all groups except the entrepreneurs, who enjoy high profits (they receive the rent on imported products resulting from the rationing); thus inequality increases substantially. With im- ports rationed and export growth slowed by appreciation of the exchange rate, the economy turns inward. These results show that Morocco suffered much lower social costs by adopting an

MOROCCO
Table 6. Parameter values for simularions. 1981~%*
1981 1982 1983 1984 1985 1986
1647
No adjustment Public investment
Exchange rate
Earlier adjustment Public investment
Exchange rate
Wage indexation
Different adjustment Public investment
Exchange rate
Wage indexation
Employment (public sector)
Wages (public sector)
4.28 4.28 4.28 (5.15) (6.67) (4.28)
1.20 (1.08)
0.2 (0.3)
1.20 (1.11)
0.2 (0.3)
1.20 ( 1.20)
0.2
(0.3)
7.0 (4.28)
1.15 (1.20)
7.5 8.0 8.S (5.77) (4.83) (5.06)
1.22 1.29 1.33 (1.28) (1.35) (1.41)
4.28 4.28 4.28 (4.2X) (5.77) (4.X3)
1.25 1.32 (1.20) (1.28)
0.2
(0.3)
0.2
(0.3)
6.45 6.6 (5.83) (5.85)
2.05 2.1 (2.27) (2.37)
1.40 (1.35)
0.2 (0.3)
6.6 (5.88)
2.28 (2X)
*Numbers in parentheses are observed values.
adjustment program than it would have otherwise.13
The adjustment program nevertheless met with considerable resistance and criticism by those who believed that Morocco could go on borrowing without any adjustment (assumption 1 in Table 7). Such a belief was unrealistic of course, but the results explain the temptation to continue along the same dangerous path: there would have been more growth and less unem- ployment and poverty, but at the cost of increas- ingly serious imbalances. These results explain both the refusal of lenders to continue to finance these imbalances and the desire to defer adjust- ment.
(ii) Earlier adjustment While the policy of no adjustment clearly could
not continue indefinitely, a related question is whether adjustment was deferred for too long.
Would earlier stabilization, in 1981 for example, have been more effective? We tested this hypo- thesis by assuming that the government cut public investment and devalued earlier and froze the minimum wage (we reduced the coefficient of adjustment of nominal wages to the cost of living from 0.3 to 0.2).
Under this scenario, the situation in 1983 is substantially improved: GDP is the same, but the two deficits and the public debt are lower (Table 8). There is also less unemployment, less inequal- ity, and less poverty. The costs of adjustment, however, have been transposed to 1981-82. The external deficit is reduced immediately, at the cost of a substantial fall in GDP, household consumption, and, above all, investment. Unem- ployment increases, as does poverty. The net benefit measure is very favorable, however: in 1981 and 1982, the transfers to the poor that would have been required to stabilize poverty
WORLD DEVELOPMENT

Tab
le
8.
Sim
ulat
ron
resu
lts fo
r ea
rlie
r and
diffe
rent
ad
just
men
t m
rasu
res.
19
8143
an
d 19
8345
Ear
lier
adju
stm
ent
Dif
fere
nt
adju
stm
ent
1981
19
82
1983
19
83
1984
19
85
Ass
umpt
ion
1’
Ass
umpt
ion
21-
Ass
umpt
ion
1 A
ssum
ptio
n 2
Ass
umpt
ion
1 A
ssum
ptio
n 2
GN
P -2
.1
-2.1
+
0.6
+0.
5 f1
.9
-‘:.6
+
1.0
-1.0
+
0.6
Hou
seho
ld
cons
umpt
ion
-4.0
-3
.6
-0.1
-1
.1
-1.2
-1
.4
-1.4
-1
.8
-1.7
E
xpor
ts
+14
.7
+12
.9
+1.
8 +
8.4
+8.
6 +
5.2
+5.
2 +
4.5
+4.
5 Im
port
s -8
.0
-7.1
+
3.0
+1.
8 +
1.x
-2.6
-2
.7
-3.0
-3
.0
Inve
stm
ent
-21.
4 -1
8.2
+6.
1 -2
.7
-2.5
-8
.1
-8.2
-8
.2
-9.0
U
nem
ploy
ed
+13
.6
+ll.l
-1
3.3
-1.1
-1
3.3
+s.
o -8
.1
+6.
S
-1.8
C
urre
nt
acco
unt
defi
cit
-35.
0 -3
0.0
-4.2
-1
8.3
-18.
3 -1
7.0
-17.
2 -1
9.2
-14.
6 B
udge
t de
fici
t -9
.1
-20.
4 ~1
1.5
-6.3
-6
.4
-15.
8 -1
5.9
-8.5
-7
.4
GD
P de
flat
or
il.6
f0.8
f0
.7
+1.
2 -0
.2
-0.1
-1
.8
+o.
g -0
.7
Publ
ic
debt
+
11.0
-9
.2
-22.
3 f4
.1
+4.
1 -0
.8
-0.8
-3
.0
-3.1
T
heil
inte
rgro
up
valu
e U
nem
ploy
ed
cons
ider
ed
sepa
rate
lyt.
-0.8
-0
.3
-4.6
-6
.2
-8.8
f0
.1
-3.4
-0
.3
-3.8
U
nem
ploy
ed
grou
Ped
with
w
age
earn
ers
-3.2
-2
.2
-2.2
-5
.8
-6.8
P
O.8
-2
.3
-0.6
-2
.8
Per
cent
age
of
poor
U
nem
ploy
ed
cons
ider
ed
sepa
rate
ly$
+3.
0 +
3.2
-2.3
-1
.8
-3.8
f1
.6
-0.6
+
1.0
-1.4
U
nem
ploy
ed
grou
ped
with
w
age
earn
ers
+2.
5 +
2.5
-0.3
-1
.4
-1.9
+
1.4
f0.7
0.
0 -1
.1
Pove
rty
gap
Une
mpl
oyed
co
nsid
ered
se
para
tely
$ tg
.2
t7.5
-5
.0
-2.0
-6
.2
+3.
4 -0
.1
t3.4
-2.5
U
nem
ploy
ed
grou
ped
with
w
age
earn
ers
+3.
1 t3
.8
PO
.4
-2.8
-3
.0
i2.3
i-
1.8
+o.
o -0
.8
*Ass
umpt
ion
1:
with
out
publ
ic
sect
or
recr
uitm
ent
tAss
umpt
ion
2:
with
pu
blic
se
ctor
re
crui
tmen
t. $U
nem
ploy
ed
rece
ive
no
inco
me.

1650 WORLD DEVELOPMENT
represent only a small percentage of the reduc- tion in the budget deficit. In that case, earlier adjustment could have resulted in improved economic and social conditions in 1983, and the poor would not have had to bear the cost in lY81- 82. Thus a country may be better off by adjusting as soon as imbalances emerge and by making the appropriate transfers to prevent poverty from worsening, and so avoid much of the potential opposition to adjustment.
The policy of choice under the early adjust- ment scenario is to reduce wages. With lower wages, entrepreneurs hire more labor and pro- duction increases. Exports also increase because of lower costs. and investment increases with the return on capital. This wage policy also reduces poverty in 1981-82. While wage earners in the modern sector would bear much of the cost of adjustment, other members of the economically active population could be made to bear some of the cost, perhaps through direct taxes affecting entrepreneurs and large farmers, thus making the program politically more palatable.
(iii) More efficient adjusmenr The third question we considered was whether
it would have been possible to stabilize even more in 1983-85 and also to further reduce the social costs? We examine this question under two assumptions, one with a public works program to increase employment (assumption 2) and one without (assumption 1). The budget and the current account deficits fall substantially under both assumptions, but only with a public sector recruitment policy could poverty also be re- duced.
Under assumption 1. public investment re- mains frozen at the 1983 level, the devaluation is greater than in the base case, making it possible to remove quotas in 1983, and the rise in nominal wages is slowed (coefficient of adjustment to the cost of living of 0.2 instead of 0.3). This policy succeeds in achieving its stabilization goals: the external deficit is reduced each year and there is less indebtedness in 1985. But it also involves costs: less growth in 1984-85 and lower invest- ment. Inequality is reduced because of the wage policy, but poverty increases slightly. Because of the substantial reduction in the budget deficit. however, the net benefit measure (deficit reduc- tion minus transfers to stabilize poverty) remains favorable: 1.43 billion dirhams in 1084 and 630 million in 1985. It would therefore have been possible to substantially reduce the two deficits while also preventing any increase in poverty through compensatory transfers. The only nega- tive effect is the fall in investment, which would slow growth after 1985. A cut in investment.
however. has fewer disadvantages than a cut in operating expenditure provided that investment resumes quickly after stabilization. A larger cut in operating expenditure would further lower the standard of living of the poor by reducing education and health services provision, an effect that is not taken into account by the model.
To reduce poverty rapidly, a new public sector employment policy would be needed (assump- tion 2). The simulation assumes that young, unskilled people are recruited at a low wage for a public works program. Their wages are covered by a slight reduction in the wages of public servants recruited before 1983, so the total government payroll does not increase. This policy leads to social benefits all around: lower unemployment, inequality, and poverty. Growth is also higher throughout the period and stabiliza- tion proceeds at the same rate.
6. CONCLUSION
Despite the need for considerable caution in interpreting simulation results,” this study shows that a model can make two very important contributions to stabilization programs. A model makes it possible to simultaneously take into account all the relevant monetary, economic, and social phenomena. A good example is the calcu- lation of the net benefit (budget deficit reduction minus compensatory transfers to stabilize pov- erty). The second advantage of a model is that it can reduce the intensity of the political debate on adjustment. Simulating the effects of alternative policies provides rational grounds for comparing their costs and benefits and deflects criticism based on ignorance of the negative effects of other policies.
The no-adjustment simulation showed that Morocco would have headed for a deeper crisis and a catastrophic increase in poverty because of the shortage of foreign exchange. Earlier adjust- ment would have taken place in a context of more adverse international and national circum- stances, given the combined effects of the world- wide recession and a drought. Thus an earlier program would have resulted in improved adjust- ment but at the expense of the poor.
In this respect, the timing of adjustment was suitable. Because of the economic upturn in Europe after 1983-84, which had very favorable consequences for Moroccan exports, tourism. and migrants’ remittances. and the good rainfall in 1984-86, the social costs of adjustment were fairly limited. The social costs were not as low as they could have been, however; the scenario of more efficient adjustment demonstrated that

MOROCCO 1651
adding a public sector employment policy could
have helped alleviate social costs, particularly for the young, unskilled, lower-income workers. The
simulation of alternative policies showed that the
NOTES
1. Cereal production increased by 79% in 1984 and 1985 over the average for 1982 and 1983, legume production by 61%.
2. Fishermen (classified with farmers) also experi- enced a very favorable trend in incomes as the value of their production almost doubled during 1983-86 because of a one-third increase in volume and a substantial price increase due partly to the devalua- tions.
3. According to the annual survey by the Ministry of Commerce, Industry, and Tourism.
4. The survey was carried out to assess the conse- quences of trade liberalization (World Bank, 1987).
5. Food subsidies are excluded from this comparison because they did not exist in 1972.
6. If such a policy is pursued for very long, however, it will compromise the future provision of education and health services.
7. If their primary income remains constant.
8. Keuning and Thorbecke (1989), using a social accounting matrix, show that the decline in the wages of these public servants affected only the households in these income deciles.
9. On the determination of this threshold, see Morrisson (1991), chapters I and II.
10. The other main assumptions are as follows: agricultural wages are determined by markets, nominal wages in the modern private sector cannot go down and are partly indexed, public sector wages are fixed in nominal terms, the exchange rate is fixed for each year and corresponds to the observed value, import ration-
stabilization program could have been improved, but that the room for improvement was relatively small.
ing was introduced in 1983 (the only year it was in effect for more than six months), credit is rationed and distributed by sector proportionately to capital when interest rates exceed 8%, and there are no exchange controls, but the elasticity between domestic and foreign securities is very low. (In fact, foreign exchange controls do exist, but because of the importance of migrant workers’ remittances, compensation is prac- ticed and investment abroad is allowed. This is done at a rate higher than the official exchange rate and involves risks, so that arbitrage between national and foreign securities is to a large extent prevented.)
11. The model also estimated the interest rate that would result in equilibrium between supply and de- mand. In this case, it barely exceeds the ceiling rate (it is 8.02%).
12. For example, a large purchase of tomatoes by Algeria recently caused a sharp increase in their price (it roughly tripled). The exporters were medium and larger farmers, but small peasant farmers who do not export but who sell in local markets also benefited from the price increase.
13. The refusal to adjust nevertheless leads to adjust- ment of a sort: the current account deficit is lower and even disappears in 1986. Thus, import rationing makes it possible to eliminate the foreign trade deficit.
14. Caution is necessary because the results must be interpreted and corrected as a function of the observed data. This requires knowledge of the previous history of incomes, employment during the adjustment period, and the basic relationships between this history and macroeconomic policy. Also, the sensitivity of the results to variations in the key parameters must be taken into account when measures are being ranked according to performance.
REFERENCES
Bourguignon, F., W. Branson, and J. de Melo, et Depenses des Menages 1984-85, (Rabat: Ministere “Adjustment and income distribution: A counter- du Plan, 1987). factual analysis,” Journal of Development Economics Morrisson, C., Adjustment and Equity in Morocco (forthcoming). (Paris: OECD Development Center, 1991).
Keuning, S., and E. Thorbecke, “The impact of budget Salahdine, M., Les petits mktiers clandestins (Casa- retrenchment on income distribution in Indonesia: A blanca: Eddif Maroc, 1988). social accounting matrix application,” Technical World Bank, “Morocco: The impact of liberalization Paper 3 (Paris: OECD Development Center, 1989). on commercial and industrial adjustment,” mimeo
Ministere du Plan. Royaume du Maroc, Consommation (Washington, DC: World Bank, October 1987).