Embed Size (px)
Citation preview

ARTICLE IN PRESS
0925-2312/$ - se
doi:10.1016/j.ne
�CorrespondE-mail addr
(M. Setic), dsve
Neurocomputing 70 (2007) 1977–1982
www.elsevier.com/locate/neucom
A model of the illusory contour formation based ondendritic computation
Drazen Domijan�, Mia Setic, Domagoj Svegar
Department of Psychology, Faculty of Philosophy, University of Rijeka, I. Klobucarica 1, 51000 Rijeka, Croatia
Available online 9 November 2006
Abstract
We proposed a new model of illusory contour formation based on the properties of dendritic computation. The basic elements of the
network are a single-excitatory cell with two dendritic branches and an inhibitory cell. Both dendritic branches behave as an independent
linear unit with a threshold. They sum all excitatory input from the nearby collinear cells, and the inhibition from one collateral of the
corresponding inhibitory cell. Furthermore, the output of dendritic branches multiplicatively interacts before it is sent to the soma. The
multiplication allows the excitatory cell to be active only if both of its branches receive enough excitation to reach the threshold.
Computer simulations showed that the presented model of the illusory contour formation is able to perform perceptual grouping of
nonadjacent collinear elements. It shows a linear response relationship with the input magnitude because dendritic inhibition counteracts
recurrent excitation. The model can explain why illusory contours are stronger with irregular placement of inducing elements rather than
regular placement and why top-down influences may prevent the illusory contour formation.
r 2006 Elsevier B.V. All rights reserved.
Keywords: Contour integration; Dendritic computation; Illusory contours; Recurrent excitation; Top-down processing
1. Introduction
Illusory (or subjective) contours are vivid percepts oflines between the inducing elements that do not havesupport in physical stimulation. They give rise to evenmore complex illusory figures such as Kanizsa square(Fig. 1a) or Ehrenstein figure (Fig. 1b) [1]. Neurophysio-logical investigations showed that many neurons in amonkey V2 cortex are sensitive to illusory contours. Thatis, neurons respond as if the real contour is presented intheir receptive field. These neurons respond to realcontours as well and they show similar orientation tuningcurves for real and for illusory contours. Therefore, theycould not distinguish between real and illusory contours.Later it was found that the strength of their responsedepends linearly on the size of the illusory line or thenumber of inducing elements up to a saturation point [2].Psychophysical investigations with humans also revealed
e front matter r 2006 Elsevier B.V. All rights reserved.
ucom.2006.10.095
ing author. Tel.: +385 51 315 233; fax: +385 51 315 228.
esses: [email protected] (D. Domijan), [email protected]
[email protected] (D. Svegar).
graded strength or clarity of illusory contours with therelative size of inducing elements [3].How is sensitivity to the illusory contour formed in the
neural tissue? Grossberg and Mingolla [4] proposed amodel of boundary contour system (BCS), which is able toperform perceptual grouping. BCS is a two-dimensionalnetwork that simulates properties of neurons observed inthe primary visual cortex including simple, complex, andhyper complex neurons. In order to explain illusorycontour formation, they introduce a bipole cell that formsthe illusory contour. The bipole cell is modelled as arecurrent excitatory network that computes the logicalAND function between two collinear but spatially sepa-rated parts (or poles) of their receptive field. Bipole cellsreceive input from a network of complex cells that competewith each other in order to achieve a sharp contourdetection. However, the model was not able to simulate thefinding that the strength of illusory contour varies withinput amplitude or number of inducing elements. Themodel also does not account for the fact that strength ofthe illusory contour depends on the placement of inducingelements. Irregular lines produce stronger impression of the

ARTICLE IN PRESS
c
a
d
b
Fig. 1. Illusory figures: (a) Kanizsa square, (b) Ehrenstein figure; illusory
contours formed by (c) regular inducers or (d) irregular inducers.
FEED FORWARD
INPUT
RECURRENT
INPUT
Fig. 2. A model of the illusory contour formation based on the properties
of dendritic computation.
D. Domijan et al. / Neurocomputing 70 (2007) 1977–19821978
illusory contour (Fig. 1d) than regular inducing lines(Fig. 1c) [5]. Furthermore, illusory contour formation isnot an obligatory process and it could be prevented bycognitive or top-down influences [1]. Moreover, attentionmay prevent collinear interaction between neighbouringline segments [6].
2. Model description
In this paper, we propose a new model of bipole cells andshow how is illusory contour formed based on theproperties of dendritic computation [7]. We suggest thatthe bipole cells use dendritic inhibition in order to achieveanalogue sensitivity to the input magnitude [8]. First,bipole cells sum inputs along its dendritic branches.Outputs from dendritic branches multiplicatively interact(logical AND computation) before they reach cell’s body.Therefore, bipole cell will become active only if bothdendritic branches receive enough stimulation. When it isactive, bipole cell sends inhibition to its dendritic branchesin order to reduce the effect of recurrent excitation. In thisway, the proposed model is able to group collinearelements into the illusory contour with analogue sensitivityto input magnitude.
The basic elements of the network are an excitatory cellwith two dendritic branches and an inhibitory cell (Fig. 2).The excitatory cell (empty circle in Fig. 2) receivesrecurrent input from other excitatory cells, whose receptivefields are collinear with it and, therefore, forming arecurrent excitatory network (horizontal arrows at thetop of the Fig. 2). Also it sends signal to other excitatorycells and to the inhibitory cell (filled circle in Fig. 2).Excitatory and inhibitory cells are modelled as continuous-time linear units with a threshold. The inhibitory cell hastwo collaterals which contacts dendritic branches of theexcitatory cell. Both dendritic branches behave as anindependent linear unit with a threshold. They summed allexcitatory input from nearby collinear cells, and the
inhibition from one collateral of the corresponding inhibi-tory cell. The branches also receive direct input from acomplex cell at corresponding locations. Furthermore, theoutput of dendritic branches multiplicatively interacts beforeit is sent to the soma. The multiplication allows excitatorycell to be active only if both of its branches receive enoughexcitation to reach the threshold. The excitatory cell mustreceive suprathreshold activation from both sides becauseillusory contours are possible only if at least two inducingelements are present. Therefore, basic property of the bipolecell is achieved using the dendritic multiplication.We also introduced two different spatial scales in order
to achieve smooth contour representation. The large-scalebipole cells detect the presence of the illusory contour.Their output is sent to the small-scale cells that smooth thecontour by local recurrent interactions. Formally, thenetwork is described as
dxLi
dt¼ � A1xLi þ f
Xp
gðxLpÞw1ip þ I iw1ii � hðyLiÞ
" #
� fX
q
gðxLqÞw1iq þ I iw1ii � hðyLiÞ
" #, ð1Þ
dyLi
dt¼ �yLi þW 1iigðxLiÞ þ TDi. (2)
Term xLi denotes activity of the large-scale bipole cell atthe spatial location i and yLi is activity of the correspond-ing inhibitory cell. The parameter A describes passive decaythat drives the cell toward the zero when no input ispresented. Function f() describes output of the computa-tion from a single dendritic branch. In the simplest case it isgiven by
f ½a� ¼ max½a� Tr; 0�n, (3)
where Tr is a threshold, and n could be smaller, larger orequal to 1. We also studied model behaviour with a morecomplex and biologically more realistic sigmoid function
f ½a� ¼1
1þ e�Bða�CÞ. (4)
Functions g() and h() describe an output from theexcitatory and the inhibitory cells, respectively. They aredefined as linear above threshold as shown in Eq. (3) with
ARTICLE IN PRESSD. Domijan et al. / Neurocomputing 70 (2007) 1977–1982 1979
n ¼ 1. Feedforward input is denoted with Ii and therecurrent excitatory input is denoted with xp and xq, whereindices p and q describes the left and the right pole of thebipole cell. Indices are given by p ¼ {j: 1, y, joi} andq ¼ {j: j4i, y, N} and N is a network dimension. Term,wij, denotes strength of excitatory feedback and, wii, denotestrength of feedforward excitatory connections. Recurrentconnections are described with Gaussian fall-off from thecentre of the receptive field
w1ir ¼D
2ps2exp �
ðr� iÞ2
2ps2
� �, (5)
where r is either p or q, D is amplitude and s is a spatialspread of the Gauss kernel. Wii denotes strength ofexcitatory to the inhibitory connection. The multiplicationbetween two dendritic branches is denoted with � sign. InEq. (2), term TDi describes top-down influences oninhibitory cells which could prevent collinear contourgrouping.
The small-scale bipole cells xSi are given by
dx Si
dt¼ � A2xSi þ f
Xp
gðxSpÞw2ip þ gðxLiÞw2ii � hðySiÞ
" #
� fX
q
gðxSqÞw2iq þ gðxLiÞw2ii � hðySiÞ
" #, ð6Þ
0 10 20 30
0
0.5
1
1.5
2
Input
0 10
0
0.5
1
1.5
2
0 10 20 30
0
1
2
3
4
xL
0 100
1
2
3
4
0 10 20 30
0
1
2
3
4
5
Spatial Position
xS
0 10
0
1
2
3
4
Spatia
ba
Fig. 3. Computer simulations illus
and their corresponding inhibitory cells ySi are given by
dy Si
dt¼ �ySi þW 2iigðxSiÞ þ TDi. (7)
The small-scale bipole cells receive input from the large-scale bipole cells. Their lateral connections are restricted tothe nearest neighbours. Therefore, p ¼ i�1 and q ¼ i+1.
3. Results
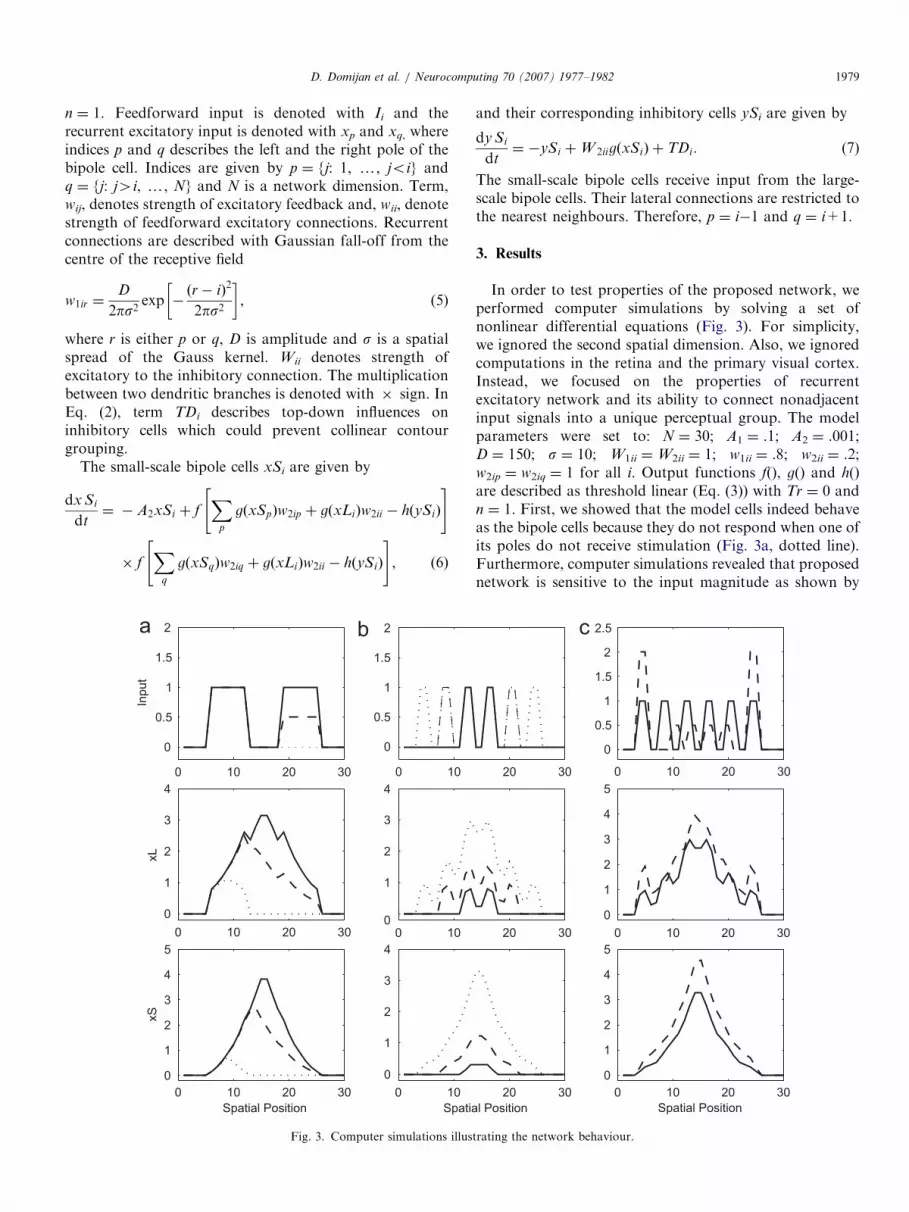
In order to test properties of the proposed network, weperformed computer simulations by solving a set ofnonlinear differential equations (Fig. 3). For simplicity,we ignored the second spatial dimension. Also, we ignoredcomputations in the retina and the primary visual cortex.Instead, we focused on the properties of recurrentexcitatory network and its ability to connect nonadjacentinput signals into a unique perceptual group. The modelparameters were set to: N ¼ 30; A1 ¼ .1; A2 ¼ .001;D ¼ 150; s ¼ 10; W1ii ¼W2ii ¼ 1; w1ii ¼ .8; w2ii ¼ .2;w2ip ¼ w2iq ¼ 1 for all i. Output functions f(), g() and h()are described as threshold linear (Eq. (3)) with Tr ¼ 0 andn ¼ 1. First, we showed that the model cells indeed behaveas the bipole cells because they do not respond when one ofits poles do not receive stimulation (Fig. 3a, dotted line).Furthermore, computer simulations revealed that proposednetwork is sensitive to the input magnitude as shown by
20 30 0 10 20 30
0
0.5
1
1.5
2
2.5
20 30 0 10 20 30
0
1
2
3
4
5
20 30
l Position
0 10 20 30
0
1
2
3
4
5
Spatial Position
c
trating the network behaviour.

ARTICLE IN PRESSD. Domijan et al. / Neurocomputing 70 (2007) 1977–19821980
different responses to different input magnitude of the rightinducer (Fig. 3a, solid and dashed lines). Fig. 3b shows alinear relationship between the number of inducingelements and excitatory cell response. In this simulation,inducers are added from the middle two toward ends. Inthis way, we simulate the neurophysiological experimentdescribed in [2] showing increase in cell’s response withincrease in the number of inducing elements. Thesesimulations illustrate that the input magnitude could bedefined either as a strength of individual contour elementsor as a number of contour elements within the samedendritic branch. In both cases, cell response increases withinput magnitude.
We also simulated the difference in strength or clarity ofthe illusory contour for regular or irregular placement ofthe inducing elements described by Gillam [5] (Fig. 3c).With irregular placement of the inducing elements some ofthe bipole cells will receive stronger input because thecompetition between the complex cells is distance depen-dent. Consider a case in which certain inducing element isisolated or placed far apart from other elements. Thecomplex cell positioned over it will receive less inhibitioncompared to other complex cells. This situation isillustrated in the input vector of Fig. 3c (dashed line). Onthe other hand, with regular placement of the inducingelements, all complex cells will receive the same amount ofinhibition (Fig. 3c, solid line). Due to the fact that thedistance between regularly spaced elements is smaller thanthe distance between the most isolated elements in irregulararrangement, the total amount of inhibition will be greaterwith regular placement of elements. A strong inhibitionbetween complex cells will provide weaker input to the
0.1 0.2 0.3 0.4 0.5
0
2
4
6
8
10
12
xL
In
0.1 0.2 0.3 0.4 0.5
0
2
4
6
8
10
12
xL
In
a
b
Fig. 4. Parametric simulations with different dendritic output functions f(). (
(dash-dotted line). (b) Sigmoid output function with C ¼ .5 (solid line), 1 (da
bipole cells and consequently lead to weaker illusorycontour when stimulus is a regular set of inducingelements.According to Grossberg and Mingolla [4], illusory
contour formation is an obligatory process that alwaysproduces strong contour. However, Albert [9] showedexamples where illusory contours are weak or absentdespite the existence of collinear inducers (e.g., whencrosses are used as inducers in Fig. 1a). We suggest that thetop-down influences (attending to or recognizing certainperceptual groupings) may reduce the strength of theillusory contour. This may happen because inducers couldbe recognized as independent figures (e.g., crosses) or theycould draw attention to itself due to their symmetry orparallelism. The top-down influence on illusory contourformation and on collinear facilitation is explained in thepresented framework by the operation of the inhibitorycells. We may assume that inhibitory cell receives excitationfrom higher visual centres when attention is directed in thepart of the visual scene where its receptive field is located.This is described by the term TD in Eq. (2). The inhibitorycell will distribute this top-down signal to the dendriticbranches of the corresponding excitatory cell and effec-tively raise their threshold for activation. If top-downsignal is sufficiently strong it will completely preventformation of the illusory contour and cells show noresponse although both parts of its receptive fields arestimulated. This may occur when a stronger perceptualgrouping overrides the illusory figure [1,9]. The samemechanism also helps to explain why attention preventscollinear contour facilitation as observed by Ito andGilbert [6].
0.6 0.7 0.8 0.9 1put
0.6 0.7 0.8 0.9 1put
a) Power function with exponent n ¼ .5 (solid line), 1 (dashed line), or 2
shed line), or 2 (dash-dotted line).

ARTICLE IN PRESSD. Domijan et al. / Neurocomputing 70 (2007) 1977–1982 1981
We checked the robustness of the model in parametricsimulations shown in Fig. 4. First, we studied how thenetwork behaves with a different setting of exponent n inEq. (3), which describes the output function f() of thedendritic branches. Fig. 4a showed cell responses of alarge-scale bipole cell, xLi, as a function of the inputstrength for n ¼ .5 (solid line), 1 (dashed line), and 2 (dash-dotted line). In these simulations, the input vectorrepresents real contour which has the same value at allspatial locations i. All other parameters are set to the samevalues as in the simulations shown in Fig. 3. As can be seen,the model shows the linear response to the input magnitudewhen the dendritic output function is linear or slowerthen linear. For the faster then linear output function,response becomes linear at higher input magnitudes. InFig. 4b we showed that the analogue sensitivity is notpreserved for the sigmoid output function (Eq. (4)) withB ¼ 2 and C ¼ .5 (solid line), 1 (dashed line), or 2 (dash-dotted line).
Furthermore, we studied the model behaviour when thestrength of synaptic weights between excitatory cells (wij)or excitatory and inhibitory cells (Wii) are systematicallyvaried (not shown). For simplicity, we set all wij to be ofequal strength. The basic finding is that the model achievesanalogue sensitivity as long as the synaptic weights betweenthe excitatory cells are kept weaker than the weightsbetween the excitatory and the inhibitory cells. When Wii
is set to 0, an unbounded growth of excitatory activity isobserved. We also showed that the network behaviour isnot altered when the excitatory and the inhibitory cellshave nonlinear output functions or when a more complexneuron model is used instead of a simple linear thresholdunit (i.e., nonlinear shunting model). Also, the introductionof direct inhibition between bipole cells through a separatepopulation of inhibitory cells does not disrupt analoguesensitivity. It is interesting to note that in all simulationsthe network converges to a fixed point, and it does notengage in oscillatory behaviour as in the models of contourintegration proposed by Li [10], and Yen and Finkel [11].This result suggests that the dendritic computationincreases the dynamic stability of the recurrent excitator-y–inhibitory networks.
4. Discussion
The proposed model of bipole cells is based on proper-ties of the dendritic computation. Recent neurophysiolo-gical and theoretical investigations showed that dendritesare not passive neuron’s elements. Rather, they activelyintegrate incoming signals and behave as independentcomputational units with their own input–output functions[12]. Based on these findings, London and Hausser [7]proposed a dendritic toolkit; a set of computationalmechanisms that dendrites could perform. Among themis multiplication or coincidence detection between differentdendritic branches. Here, we proposed that the dendriticmultiplication is responsible for a generation of the illusory
contour. We also used local interaction between excitationand inhibition on isolated dendritic branches in order toachieve the MAX function computation. In [13], it isshown that feedforward dendritic inhibition allows com-putation of MAX function on cell’s input. Here, arecurrent extension of the network with dendritic inhibitionis used. A disadvantage of the proposed model is that adesirable behaviour is achieved when the output of a singledendritic branch is linear above threshold. On the otherhand, theoretical analysis of the detailed model of thepyramidal neuron suggests sigmoid output function as abetter description for dendrites [7].In conclusion, the presented model of the illusory
contour formation is able to perform perceptual groupingof nonadjacent collinear segments. It shows a linearresponse relationship with input magnitude because thedendritic inhibition regulates the signal flow and preventsunbounded growth of activity in the recurrent excitatorynetwork [8]. Analogue sensitivity is achieved under a widevariety of parameter settings and input–output functions asshown in parametric simulations. The model can explainwhy illusory contours are stronger with irregular placementof inducing elements rather than regular placement andwhy the attention or other top-down signals may preventthe illusory contour formation. These findings could not bemodelled with a recent extension of the BCS proposed byGrossberg and Raizada [14] and with the model of V1–V2interaction proposed by Neumann and Sepp [15].
References
[1] G.W. Lesher, Illusory contours: toward a neurally based perceptual
theory, Psychonom. Bull. Rev. 2 (1995) 279–321.
[2] E. Peterhans, R. von der Heydt, Mechanisms of contour perception
in monkey visual cortex: II. Contours bridging gaps, J. Neurosci. 9
(1989) 1749–1763.
[3] T.F. Shipley, P.J. Kellman, Strength of visual interpolation depends
on the ratio of physically specified to total edge length, Percept.
Psychophy. 52 (1992) 97–106.
[4] S. Grossberg, E. Mingolla, Neural dynamics of form perception:
boundary completion, illusory figures, and neon color spreading,
Psychol. Rev. 92 (1985) 173–211.
[5] B. Gillam, Perceptual grouping and subjective contours, in: S. Petry,
G.E. Meyer (Eds.), The Perception of Illusory Contours, Springer,
New York, 1987, pp. 268–273.
[6] M. Ito, C. Gilbert, Attention modulates contextual influences in the
primary visual cortex of alert monkeys, Neuron 22 (1999) 593–604.
[7] M. London, M. Hausser, Dendritic computation, Annu. Rev.
Neurosci. 28 (2005) 503–532.
[8] R.J. Douglas, C. Koch, M. Mahowald, K.A.C. Martin, H.H. Suarez,
Recurrent excitation in neocortical circuits, Science 269 (1995)
981–985.
[9] M.K. Albert, Cue interactions, border ownership and illusory
contours, Vis. Res. 41 (2001) 2827–2834.
[10] Z. Li, A neural model of contour integration in the primary visual
cortex, Neural. Comput. 13 (1998) 903–940.
[11] S.C. Yen, L.H. Finkel, Extraction of perceptually salient contours by
striate cortical networks, Vis. Res. 38 (1998) 719–741.
[12] M. Hausser, B.W. Mel, Dendrites: bug or feature? Curr. Opin.
Neurobiol. 13 (2003) 372–383.
[13] D. Domijan, A neural model for visual selection of grouped spatial
arrays, Neuro Report 14 (2003) 367–370.

ARTICLE IN PRESSD. Domijan et al. / Neurocomputing 70 (2007) 1977–19821982
[14] S. Grossberg, R.D.S. Raizada, Contrast-sensitive perceptual group-
ing and object-based attention in the laminar circuits of primary
visual cortex, Vis. Res. 40 (2000) 1413–1432.
[15] H. Neumann, W. Sepp, Recurrent V1–V2 interaction in early visual
boundary processing, Biol. Cybern. 81 (1999) 425–444.
Drazen Domijan is an Assistant Professor of
Psychology at the University of Rijeka, Croatia.
He received B.A. in Psychology from the
University of Rijeka, Croatia, and Ph.D. in
Psychology from the University of Zagreb,
Croatia. His research interests include computa-
tional modelling of visual perception, attention
and cognition. In particular, he studied how
models of neural networks with dendrites may
help to explain various cognitive phenomena and
how artificial dendrites may increase computational power of neural
networks. He is a member of International Neural Network Society and
Association for Psychological Science.
Mia Setic is a Ph.D. student at the University of
Zagreb, Croatia. She received B.A. in Psychology
from the University of Rijeka, Croatia. Her
research interests include behavioural investiga-
tions of interaction between perception and
abstract conceptual processing. Also she is
interested in computational modelling of percep-
tion, attention, and numerical cognition. She is a
member of Association for Psychological Science.
Domagoj Svegar is a Ph.D. student at the
University of Ljubljana, Slovenia. He received
B.A. in Psychology from the University of
Rijeka, Croatia. His research interests include
behavioural testing and computational modelling
of visual working memory.


