Embed Size (px)
Citation preview
updated on 6/26/2010 1
Griffing and Overcash, Chemical Life Cycle Database, www.environmentalclarity.com, 1999-present.
Acrylonitrile, hydrogen cyanide, and crude acetonitrile [107-
13-1] CONTENTS OF FACTORY GATE TO FACTORY GATE
LIFE CYCLE INVENTORY SUMMARY
Chemistry ....................................................................................................................................................... 2 Process Summary ........................................................................................................................................... 3 Summary of LCI Information ......................................................................................................................... 6 Process Diagram Interpretation Sheet ............................................................................................................ 8 Process Diagram or Boundary of LCI ............................................................................................................ 9 Mass Balance of Chemicals in Each Process Stream ....................................................................................14 Graph of Cumulative Chemical Losses through Manufacturing Process ......................................................23 Graph of Cumulative Contaminated Water Use / Emission through Manufacturing Process .......................24 Graph of Cumulative Non-Contaminated Water Use / Emission through Manufacturing Process ...............25 Energy Input for each Unit Process, Cumulative Energy Requirements, Cooling Requirements (exotherms),
and Assumed Heat Recovery from Hot Streams Receiving Cooling ............................................................26 Graph of Cumulative Energy Requirements ..................................................................................................28
Authors E. Griffing, M. Luhrs, and Students
Peer reviews, name (date) MR Overcash (1-1-1999); MR Overcash (1-1-2001); MR
Overcash (6-14-2009)
Gtg report last modified on 6-26-2010
Checked for database consistency on 6-26-2010
First gtg version finalized on 2-24-2009
Modification history, Author (date) EMG (6-26-2010), EMG (5-18-2006), MKL (1-1-2001), Stu (1-1-
1999), and EMG (6-14-2009)
Products Acrylonitrile, Hydrogen cyanide, crude acetonitrile
Standard inputs Sulfuric acid, Ammonia, Propylene, Oxygen from air
Methodology: Environmental Clarity gtg lci reports are based on industrial practice information, standard
methods of engineering process design, and technical reviews. These reports are intended to be
representative of industrial production based on the stated route.
Terms of use: Environmental Clarity does not assume any liability due to use of these lci data. Integration
of these data with lci data based on other methodologies is the responsibility of the user. Each report may
be updated to improve model accuracy or representativeness.
Users of this report should cite: E. Griffing and M. Overcash, Chemical Life Cycle Database,
www.environmentalclarity.com, 1999 - present.
Reviewed by Michael Overcash 6-4-09
Rereviewed by Michael Overcash 6-14-09
updated on 6/26/2010 2
Griffing and Overcash, Chemical Life Cycle Database, www.environmentalclarity.com, 1999-present.
Chemistry Primary reaction:
C3H6 + NH3 + 3/2 O2 C3H3N + 3 H2O (1)
propylene + ammonia + oxygen acrylonitrile + water
Side reactions: (type of side rxns)
C3H6 + NH3 + 9/4 O2 C2H3N + 3 H2O + ½ CO2 + ½ CO (2)
propene + ammonia + oxygen --> acetonitrile + water + carbon dioxide + carbon monoxide
C2H3N + 3/2 O2 HCN + H2O + CO2 (3)
acetonitrile + oxygen --> hydrogen cyanide + water + carbon dioxide
Notes:
Side reactions: (type of side rxns)
C3H6 + 4.5O2 3CO2+3H2O (9)
propylene combustion
C3H8 + 5O2 3CO2 + 4H2O (10)
propane combustion
CO + 1/2 O2 CO2 (11)
carbon monoxide combustion
updated on 6/26/2010 3
Griffing and Overcash, Chemical Life Cycle Database, www.environmentalclarity.com, 1999-present.
Process Summary Literature
Nearly all commercial acrylonitrile production is done via the Sohio process (Kirk Othmer, 2001).
Ullmann's (2002) states that 90% of world production is based on the Sohio process, which is a vapor-
phase ammoxidation of propylene. Propylene, ammonia, and air are fed to a reactor at about 2 atm and
440oC. The vapor phase product is absorbed in an aqueous phase. Crude acrylonitrile is distilled from
acetonitrile and water. HCN is then removed from the acrylonitrile. A final distillation produces
acrylonitrile as a distillate product, removing heavy impurities in the bottoms. The acetonitrile is recovered
by distillation from the waste water before treatment. Important process parameters are given in Table 1.
Ammonium sulfate can be isolated and used as a fertilizer or disposed of (Kirk Othmer, 2001). Kirk
othmer (2001) states that hydrogen cyanide is used as a product, but Ullmann's (2002) claims that the HCN
is normally incinerated due to an excess supply. Recent cuts in acrylonitrile production have caused a
shortage of acetonitrile (Chemical Week, 2009). In addition, ACS (2008) claims that increasing the
production of HCN as a byproduct of acrylonitrile is highly desirable. Thus, the final disposition of these
byproducts is likely to depend on current economic considerations. In this GTG report, we show the
ammonium sulfate as a waste, but consider the HCN and acetonitrile by-products. However, use of the
acetonitrile stream from this report would require further purification.
Table 1. Process parameters
Ullmann’s
(2002)
Kirk
Othmer
(2001)
CEH
(2005)
Faith,
Keyes, and
Clark (1965)
Petroleum
Handbook
Ulrich and
Vasudevan(2009)
Used in this
GTG report
Reaction T,
oC
400-500 400-
510
405 450 440
Reaction P,
atm
0.3 to 2 0.5 to 2 2 2.5 2
Propylene
conversion,
%
98
(pure
basis)
95.6 (pure
basis)
85 (based on full
feed)
97 (pure
basis)
Yield from
propylene,
%
63 to 71 72 66 to 75 67 – 70 71 69 69 (total
input)
72% (pure
basis)
Ammonia
used, kg /
kg
acrylonitrile
0.475 0.475
Air used,
kg / kg
acrylonitrile
7.0
(6.09 cubic
meter air /
kg
acrylonitrile)
7.0 used for
reaction,
1.3 used for
incineration
HCN
production,
kg/kg
acrylonitrile
0.17 to
0.24
0.1 0.1 (can
increase
to as
much as
0.15
with
catalyst)
0.155 0.11 0.11 0.14
Acetonitrile
production,
kg/kg
acrylonitrile
0.024 to
0.13
0.03 0.0357 0.058 (crude)
0.029 kg
acetonitrile
0.03
updated on 6/26/2010 4
Griffing and Overcash, Chemical Life Cycle Database, www.environmentalclarity.com, 1999-present.
Annual world wide production of acrylonitrile has grown from 260 million pounds in 1960 to more than
11.4 billion pounds in 2005.
LCI design
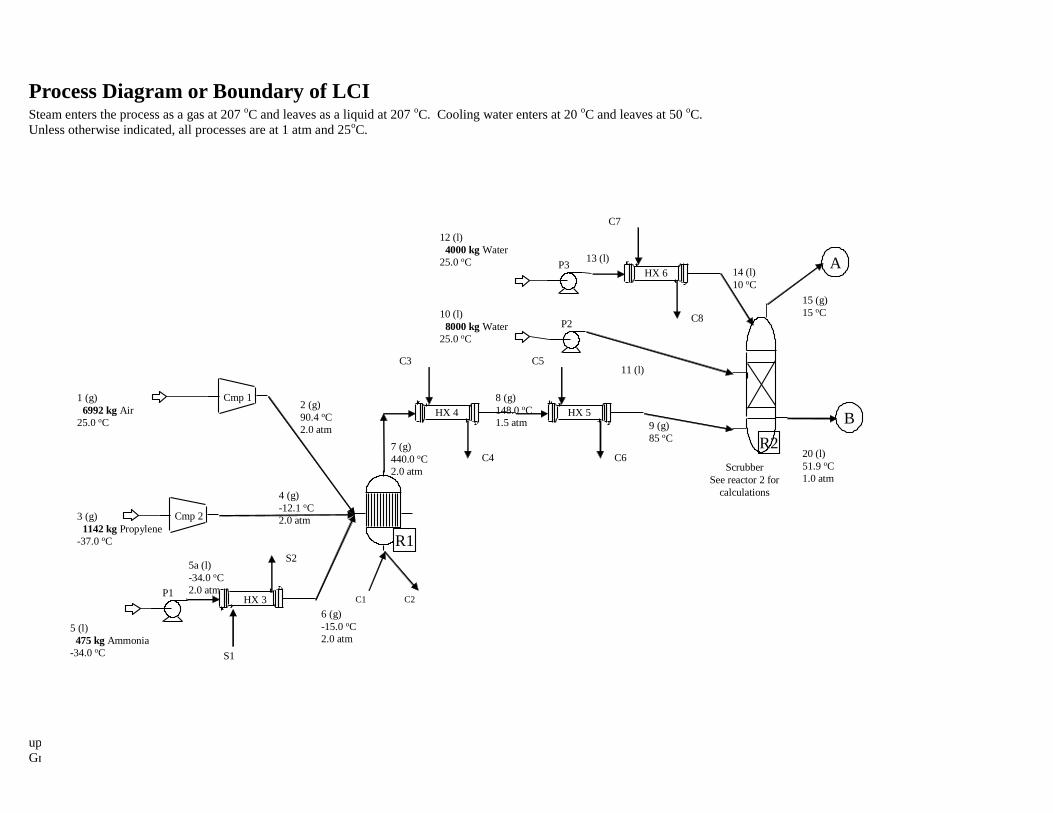
Air is compressed to 2 atmospheres and sent to the reactor. Propylene enters as a gas at -37 oC, is
compressed to 2 atm, and sent to the reactor. Ammonia enters the process as a liquid at -34 oC (in order to
maintain a liquid phase). The ammonia is pumped to two atmospheres, and heated to a vapor at -15 oC
(required to vaporize at 2 atm), and sent to the reactor, which operates at 440 oC. The production of
acrylonitrile is highly exothermic, and heat must be removed from the reactor despite the low input
temperatures. The product is cooled to 148 oC in the vapor phase. In a second heat exchanger, the process
stream is cooled further to 85 oC, condensing out most of the water. The exit stream from the second heat
exchanger is fed to an absorber, where ammonia, acrylonitrile, hydrogen cyanide, and acetonitrile are
absorbed. The pressure is assumed to drop to one atmosphere as it passes through the heat exchangers and
absorber. The nitrogen, carbon dioxide, propene, propane, and carbon monoxide pass through the absorber
and are sent as gases to a combustion reactor.
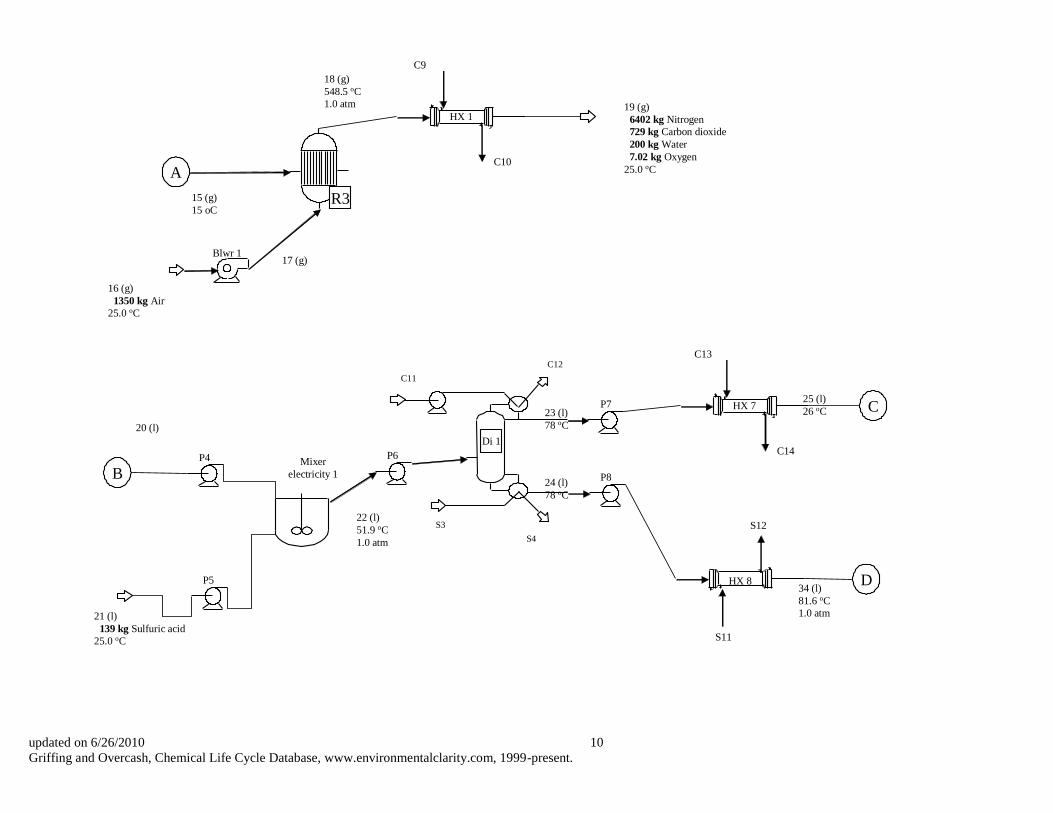
From the absorber, sulfuric acid is added to the aqueous phase to neutralize the unreacted ammonia. A
distillation column separates the acrylonitrile from the acetonitrile and water at one atmosphere and 78 oC
(Di 1). This is a difficult separation, because of the small boiling point difference of acetonitrile and
acrylonitrile. The activity coefficients of these chemicals in water were used to calculate the relative vapor
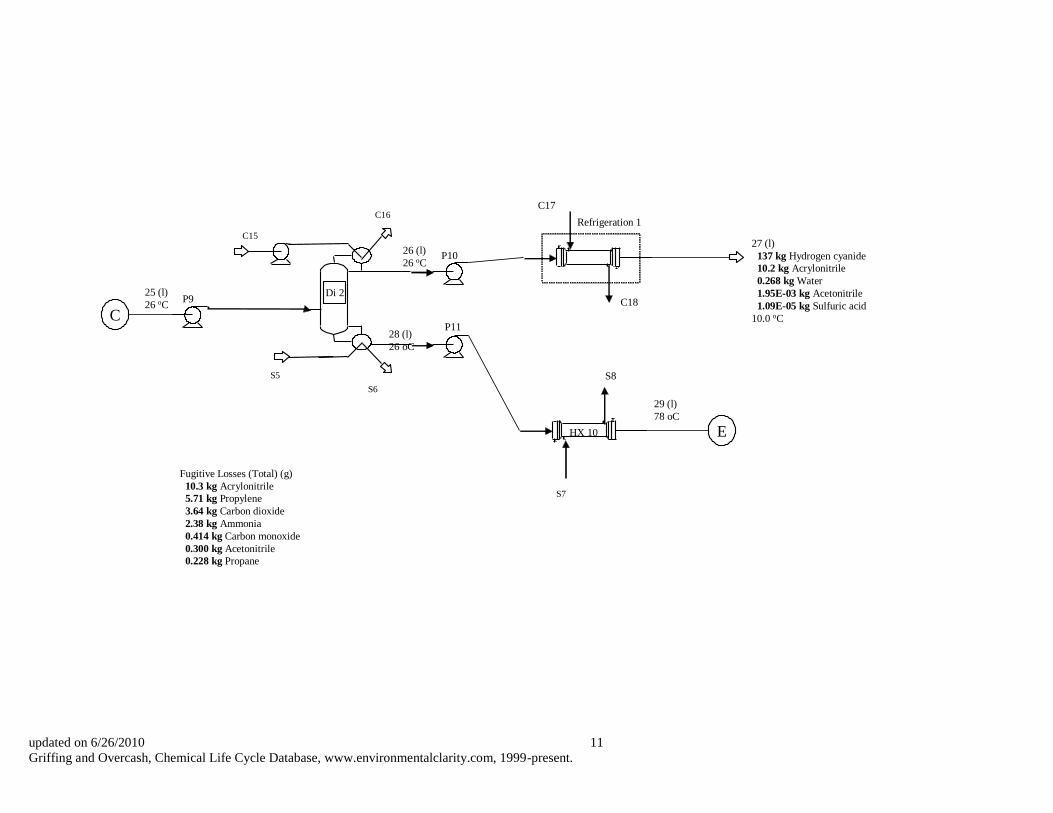
pressure in this column. The acrylonitrile stream (tops from Di 1) is cooled to 26 oC, and hydrogen cyanide
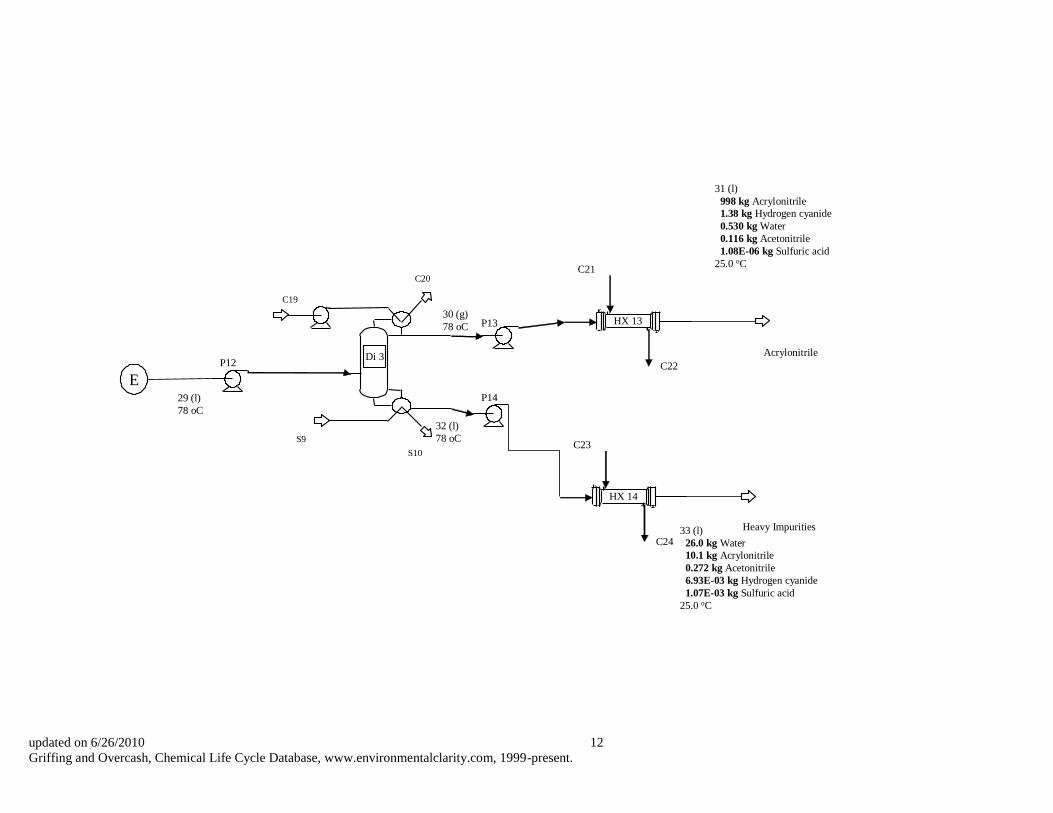
is distilled from the acrylonitrile stream in Di 2. The acrylonitrile is then distilled in Di 3 from any heavy
by-products. The acetonitrile / water bottoms from Di 1 are sent to a recovery column. This column
operates at 81.6 oC. Acetonitrile forms an azeotrope with water at 75 wt% acetonitrile and atmospheric
pressure. In this separation, the distillate is less than 75 wt% acetonitrile. No further purification is done.
U.S. patent 6,326,508 gives the reflux ratio of this column as > 2.7. We use a reflux ratio of three.
References
Kirk Othmer (2001) Encyclopedia of Chemical Technology, Acrylonitrile (Brazdill, J.F, article author).
Ullmann's (2002) Ullmann's Encyclopedia of Industrial Chemistry, Acrylonitrile (Langvardt, P.W., article
author).
CEH (2005) Chemical Economics Handbook, Acrylonitrile (Sesto, B, and Toki, G., article authors)
Faith, W.L., Keyes, D.B., and Clark, R.E., (1965) Industrial Chemicals, 3rd Ed., John Wiley & Sons.
Ulrich, G., and Vasudevan, P. (2009) Acrylonitrile flow sheet, reproduced from Chemical Engineering
Process Design and Economics - A Practicle Guide, accessed online at
http://www.ulrichvasudesign.com/ACN.pdf.
Chemical Week (2009) Accessed online:
http://www.chemweek.com/markets/basic_chemicals/petrochemicals/acrylonitrile/Cuts-in-Acrylonitrile-
Output-Cause-a-Shortage-of-By-product-Acetonitrile_17731.html
ACS (2008) Patent Watch, January 21, 2008. accessed online,
http://portal.acs.org/portal/acs/corg/content?_nfpb=true&_pageLabel=PP_ARTICLEMAIN&node_id=839
&content_id=WPCP_007946&use_sec=true&sec_url_var=region1&__uuid=170656df-daec-4abf-bffc-
40b026b589da
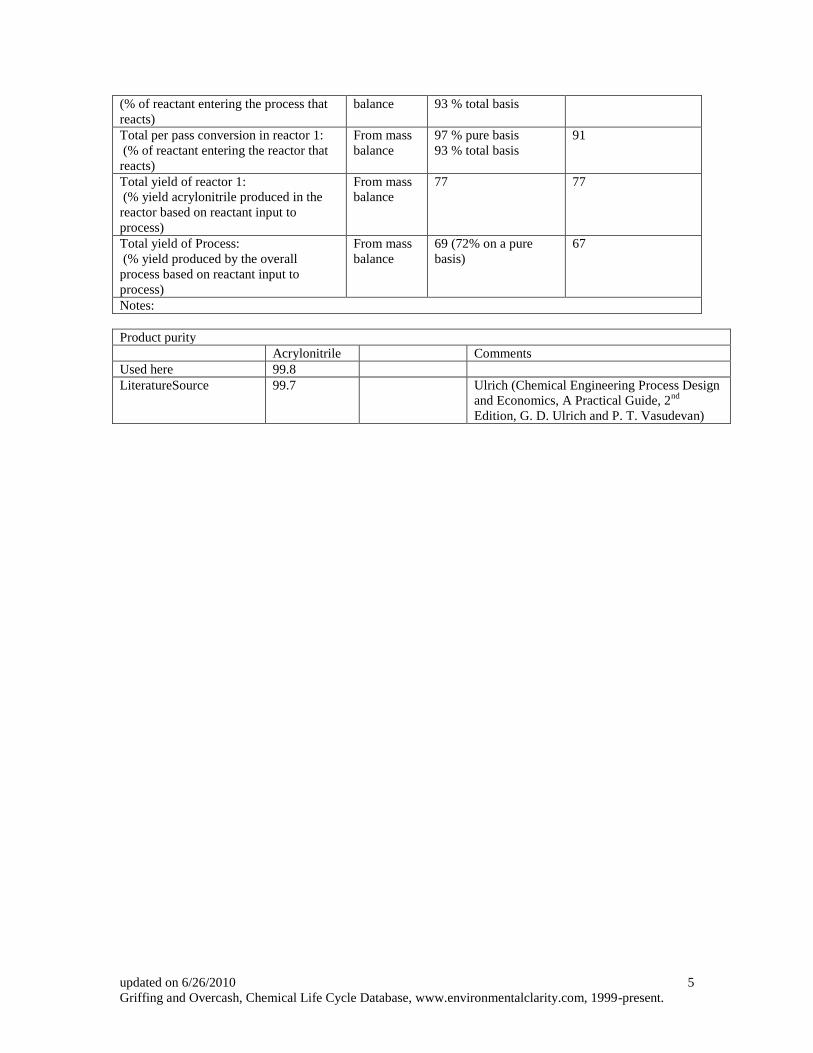
Critical parameters
Conversion / Yield information from both reactors
Conversion of or Yield
from propylene
Conversion of or
Yield from ammonia
Total conversion in reactor 1: From mass 97 % pure basis 91
updated on 6/26/2010 5
Griffing and Overcash, Chemical Life Cycle Database, www.environmentalclarity.com, 1999-present.
(% of reactant entering the process that
reacts)
balance
93 % total basis
Total per pass conversion in reactor 1:
(% of reactant entering the reactor that
reacts)
From mass
balance
97 % pure basis
93 % total basis
91
Total yield of reactor 1:
(% yield acrylonitrile produced in the
reactor based on reactant input to
process)
From mass
balance
77 77
Total yield of Process:
(% yield produced by the overall
process based on reactant input to
process)
From mass
balance
69 (72% on a pure
basis)
67
Notes:
Product purity
Acrylonitrile Comments
Used here 99.8
LiteratureSource 99.7 Ulrich (Chemical Engineering Process Design
and Economics, A Practical Guide, 2nd
Edition, G. D. Ulrich and P. T. Vasudevan)
updated on 6/26/2010 6
Griffing and Overcash, Chemical Life Cycle Database, www.environmentalclarity.com, 1999-present.
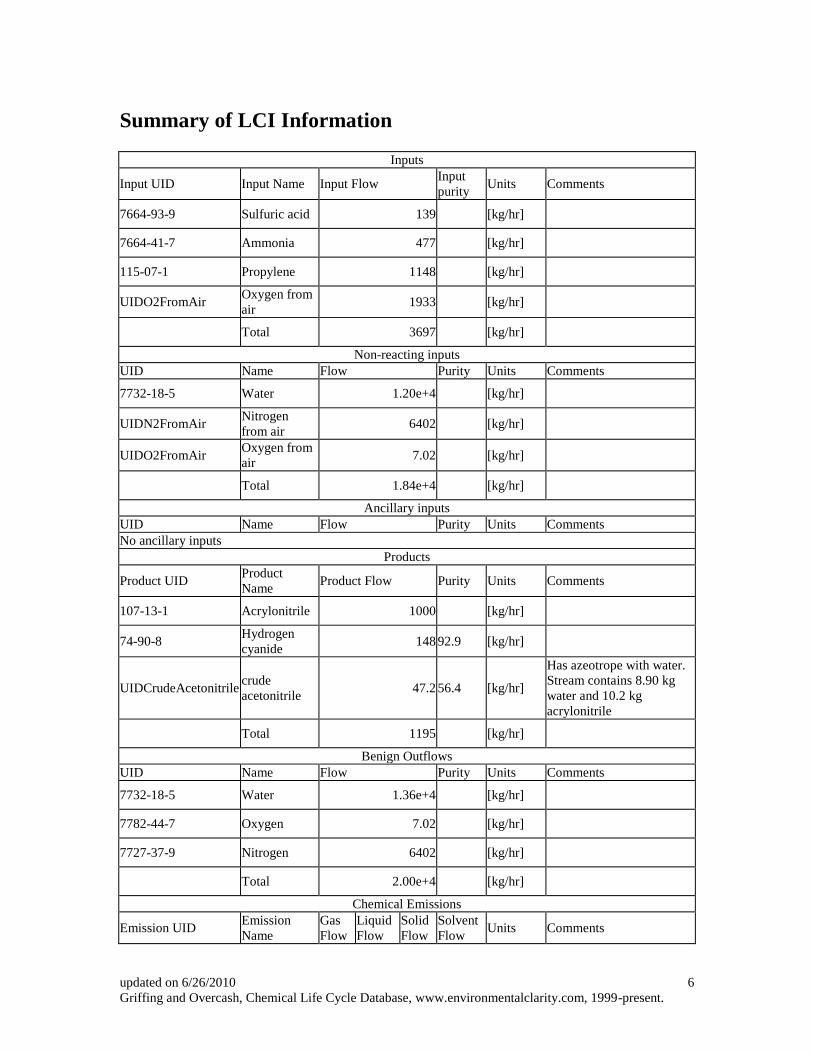
Summary of LCI Information
Inputs
Input UID Input Name Input Flow Input
purity Units Comments
7664-93-9 Sulfuric acid 139 [kg/hr]
7664-41-7 Ammonia 477 [kg/hr]
115-07-1 Propylene 1148 [kg/hr]
UIDO2FromAir Oxygen from
air 1933 [kg/hr]
Total 3697 [kg/hr]
Non-reacting inputs UID Name Flow Purity Units Comments
7732-18-5 Water 1.20e+4 [kg/hr]
UIDN2FromAir Nitrogen
from air 6402 [kg/hr]
UIDO2FromAir Oxygen from
air 7.02 [kg/hr]
Total 1.84e+4 [kg/hr]
Ancillary inputs UID Name Flow Purity Units Comments No ancillary inputs
Products
Product UID Product
Name Product Flow Purity Units Comments
107-13-1 Acrylonitrile 1000 [kg/hr]
74-90-8 Hydrogen
cyanide 148 92.9 [kg/hr]
UIDCrudeAcetonitrile crude
acetonitrile 47.2 56.4 [kg/hr]
Has azeotrope with water.
Stream contains 8.90 kg
water and 10.2 kg
acrylonitrile
Total 1195 [kg/hr]
Benign Outflows UID Name Flow Purity Units Comments
7732-18-5 Water 1.36e+4 [kg/hr]
7782-44-7 Oxygen 7.02 [kg/hr]
7727-37-9 Nitrogen 6402 [kg/hr]
Total 2.00e+4 [kg/hr]
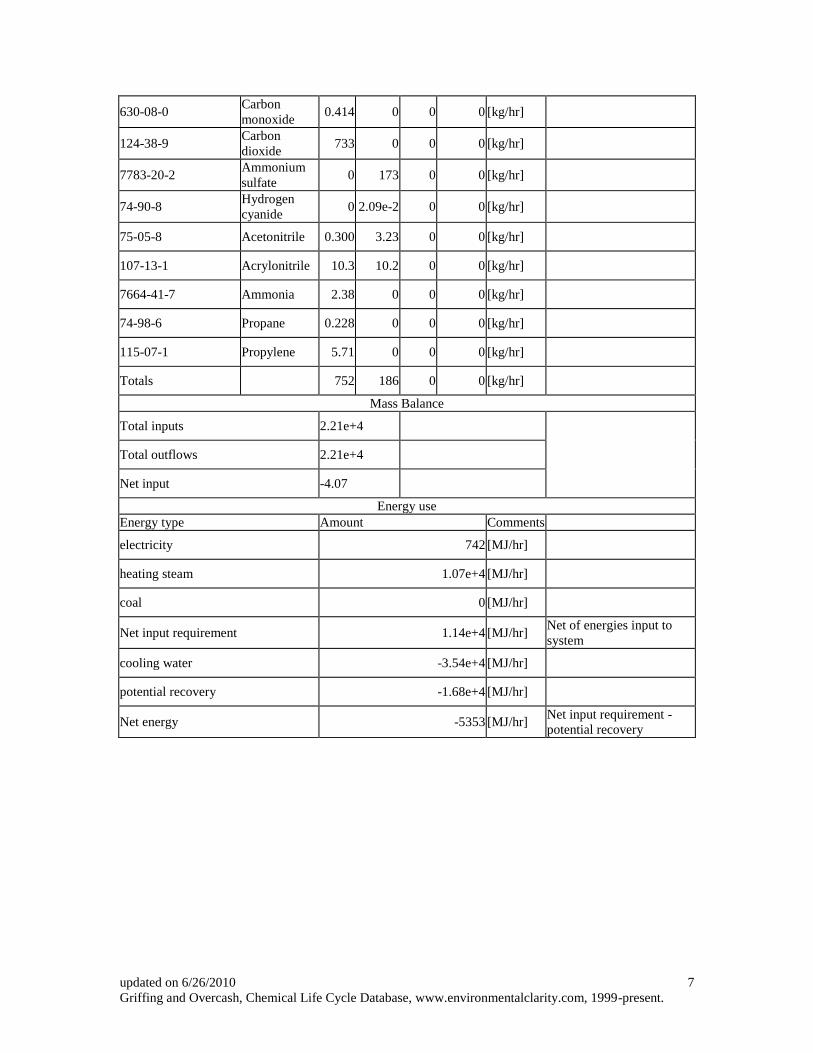
Chemical Emissions
Emission UID Emission
Name Gas
Flow Liquid
Flow Solid
Flow Solvent
Flow Units Comments
updated on 6/26/2010 7
Griffing and Overcash, Chemical Life Cycle Database, www.environmentalclarity.com, 1999-present.
630-08-0 Carbon
monoxide 0.414 0 0 0 [kg/hr]
124-38-9 Carbon
dioxide 733 0 0 0 [kg/hr]
7783-20-2 Ammonium
sulfate 0 173 0 0 [kg/hr]
74-90-8 Hydrogen
cyanide 0 2.09e-2 0 0 [kg/hr]
75-05-8 Acetonitrile 0.300 3.23 0 0 [kg/hr]
107-13-1 Acrylonitrile 10.3 10.2 0 0 [kg/hr]
7664-41-7 Ammonia 2.38 0 0 0 [kg/hr]
74-98-6 Propane 0.228 0 0 0 [kg/hr]
115-07-1 Propylene 5.71 0 0 0 [kg/hr]
Totals 752 186 0 0 [kg/hr]
Mass Balance
Total inputs 2.21e+4
Total outflows 2.21e+4
Net input -4.07
Energy use Energy type Amount Comments
electricity 742 [MJ/hr]
heating steam 1.07e+4 [MJ/hr]
coal 0 [MJ/hr]
Net input requirement 1.14e+4 [MJ/hr] Net of energies input to
system
cooling water -3.54e+4 [MJ/hr]
potential recovery -1.68e+4 [MJ/hr]
Net energy -5353 [MJ/hr] Net input requirement -
potential recovery
updated on 6/26/2010 8
Griffing and Overcash, Chemical Life Cycle Database, www.environmentalclarity.com, 1999-present.
Process Diagram Interpretation Sheet
1) As much as possible, standard symbols are used for all unit processes.
2) Only overall input and output chemicals are labeled on these diagrams. All intermediate information is
given on the attached Process Mass Balance sheet
3) The physical state of most streams is shown (gas, g; liquid, l; solid, s)
4) The process numbering is as follows,
generally numbers progress from the start to the end of the process
numbers are used for process streams
C i , i = 1,..n are used for all cooling non-contact streams
S j, j = 1,...n are used for all steam heating non-contact streams
5) Recycle streams are shown with dotted lines
For most streams, the temperature and pressure are shown, if the pressures are greater than 1 atm
updated on 6/26/2010 9
Griffing and Overcash, Chemical Life Cycle Database, www.environmentalclarity.com, 1999-present.
Process Diagram or Boundary of LCI Steam enters the process as a gas at 207
oC and leaves as a liquid at 207
oC. Cooling water enters at 20
oC and leaves at 50
oC.
Unless otherwise indicated, all processes are at 1 atm and 25oC.
HX 3
S2
S1
Cmp 1
P1
R1
HX 4
C3
C4
HX 5
C5
C6
P3HX 6
C7
C8P2
C1 C2
Scrubber
See reactor 2 for
calculations
R2
A
B
1 (g)
6992 kg Air
25.0 oC
2 (g)
90.4 oC
2.0 atm
3 (g)
1142 kg Propylene
-37.0 oC
4 (g)
-12.1 oC
2.0 atm
5 (l)
475 kg Ammonia
-34.0 oC
6 (g)
-15.0 oC
2.0 atm
7 (g)
440.0 oC
2.0 atm
8 (g)
148.0 oC
1.5 atm 9 (g)
85 oC
10 (l)
8000 kg Water
25.0 oC
11 (l)
12 (l)
4000 kg Water
25.0 oC 13 (l)
14 (l)
10 oC
15 (g)
15 oC
20 (l)
51.9 oC
1.0 atm
Cmp 2
5a (l)
-34.0 oC
2.0 atm
updated on 6/26/2010 10
Griffing and Overcash, Chemical Life Cycle Database, www.environmentalclarity.com, 1999-present.
Di 1
P7
P8
HX 7
C13
C14
HX 8
S11
S12
P4
P5
Mixer
electricity 1B
C
D
21 (l)
139 kg Sulfuric acid
25.0 oC
22 (l)
51.9 oC
1.0 atm
23 (l)
78 oC
24 (l)
78 oC
25 (l)
26 oC
34 (l)
81.6 oC
1.0 atm
A
R3
Blwr 1
HX 1
C9
C10
15 (g)
15 oC
16 (g)
1350 kg Air
25.0 oC
17 (g)
18 (g)
548.5 oC
1.0 atm 19 (g)
6402 kg Nitrogen
729 kg Carbon dioxide
200 kg Water
7.02 kg Oxygen
25.0 oC
20 (l)
P6
C11
C12
S3
S4
updated on 6/26/2010 11
Griffing and Overcash, Chemical Life Cycle Database, www.environmentalclarity.com, 1999-present.
Di 2
P10
P11
C17
C18
HX 10
S8
P9
Refrigeration 1
C
E
25 (l)
26 oC
26 (l)
26 oC
28 (l)
26 oC
27 (l)
137 kg Hydrogen cyanide
10.2 kg Acrylonitrile
0.268 kg Water
1.95E-03 kg Acetonitrile
1.09E-05 kg Sulfuric acid
10.0 oC
29 (l)
78 oC
Fugitive Losses (Total) (g)
10.3 kg Acrylonitrile
5.71 kg Propylene
3.64 kg Carbon dioxide
2.38 kg Ammonia
0.414 kg Carbon monoxide
0.300 kg Acetonitrile
0.228 kg Propane
C15
C16
S5
S6
S7
updated on 6/26/2010 12
Griffing and Overcash, Chemical Life Cycle Database, www.environmentalclarity.com, 1999-present.
Di 3
P13
P14
HX 13
C21
C22
HX 14
C23
C24
P12Acrylonitrile
Heavy Impurities
E
30 (g)
78 oC
32 (l)
78 oC
31 (l)
998 kg Acrylonitrile
1.38 kg Hydrogen cyanide
0.530 kg Water
0.116 kg Acetonitrile
1.08E-06 kg Sulfuric acid
25.0 oC
33 (l)
26.0 kg Water
10.1 kg Acrylonitrile
0.272 kg Acetonitrile
6.93E-03 kg Hydrogen cyanide
1.07E-03 kg Sulfuric acid
25.0 oC
C19
C20
S9
S10
29 (l)
78 oC
updated on 6/26/2010 13
Griffing and Overcash, Chemical Life Cycle Database, www.environmentalclarity.com, 1999-present.
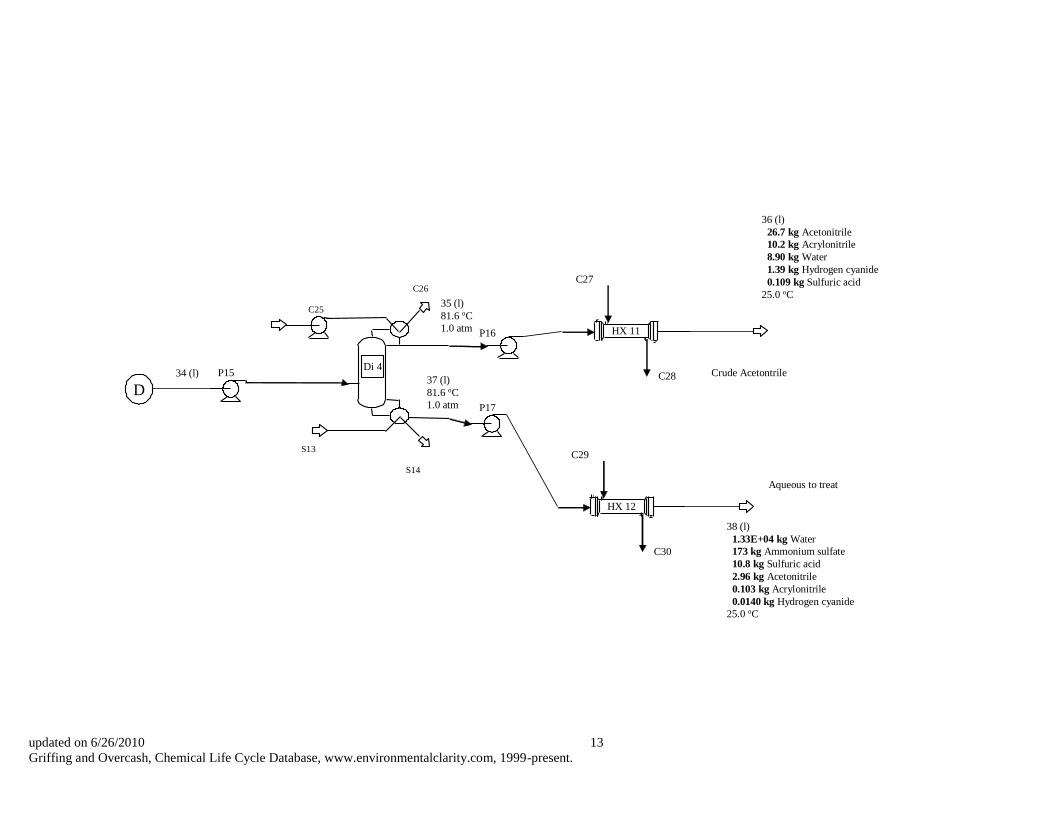
Di 4
P16
P17
HX 11
C27
C28
HX 12
C29
C30
P15 Crude Acetontrile
Aqueous to treat
D
34 (l)
35 (l)
81.6 oC
1.0 atm
37 (l)
81.6 oC
1.0 atm
36 (l)
26.7 kg Acetonitrile
10.2 kg Acrylonitrile
8.90 kg Water
1.39 kg Hydrogen cyanide
0.109 kg Sulfuric acid
25.0 oC
38 (l)
1.33E+04 kg Water
173 kg Ammonium sulfate
10.8 kg Sulfuric acid
2.96 kg Acetonitrile
0.103 kg Acrylonitrile
0.0140 kg Hydrogen cyanide
25.0 oC
C25
C26
S13
S14
updated on 6/26/2010 14
Griffing and Overcash, Chemical Life Cycle Database, www.environmentalclarity.com, 1999-present.
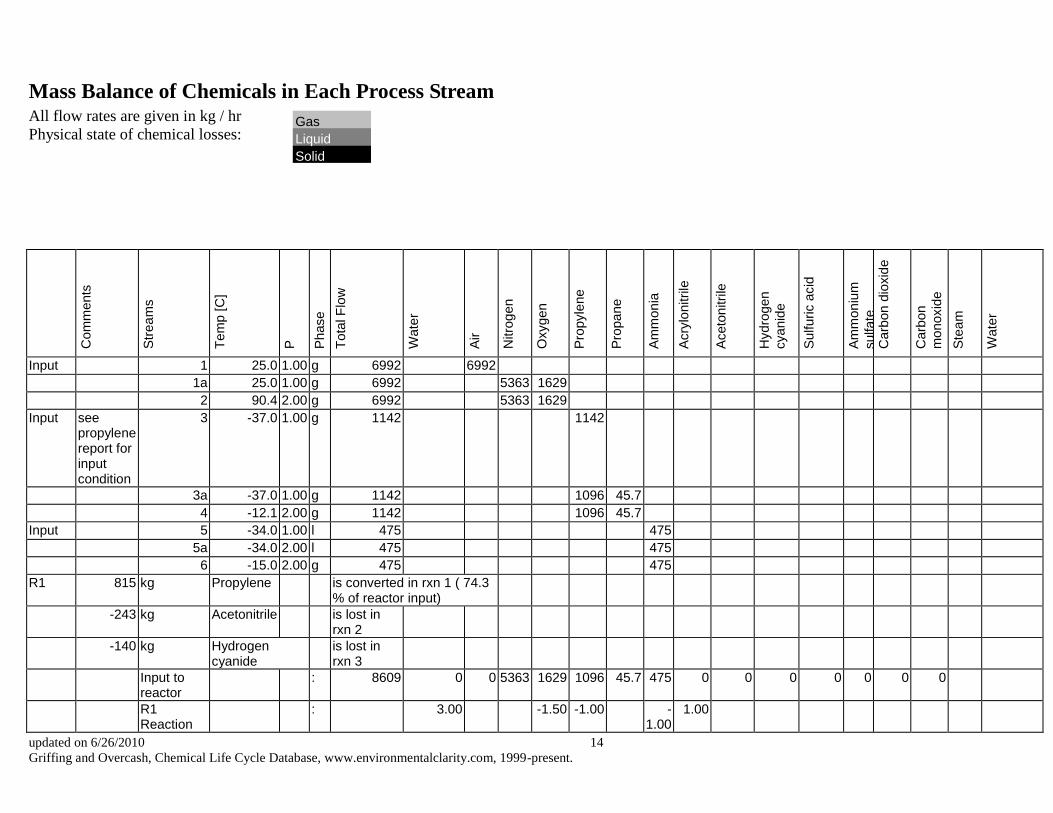
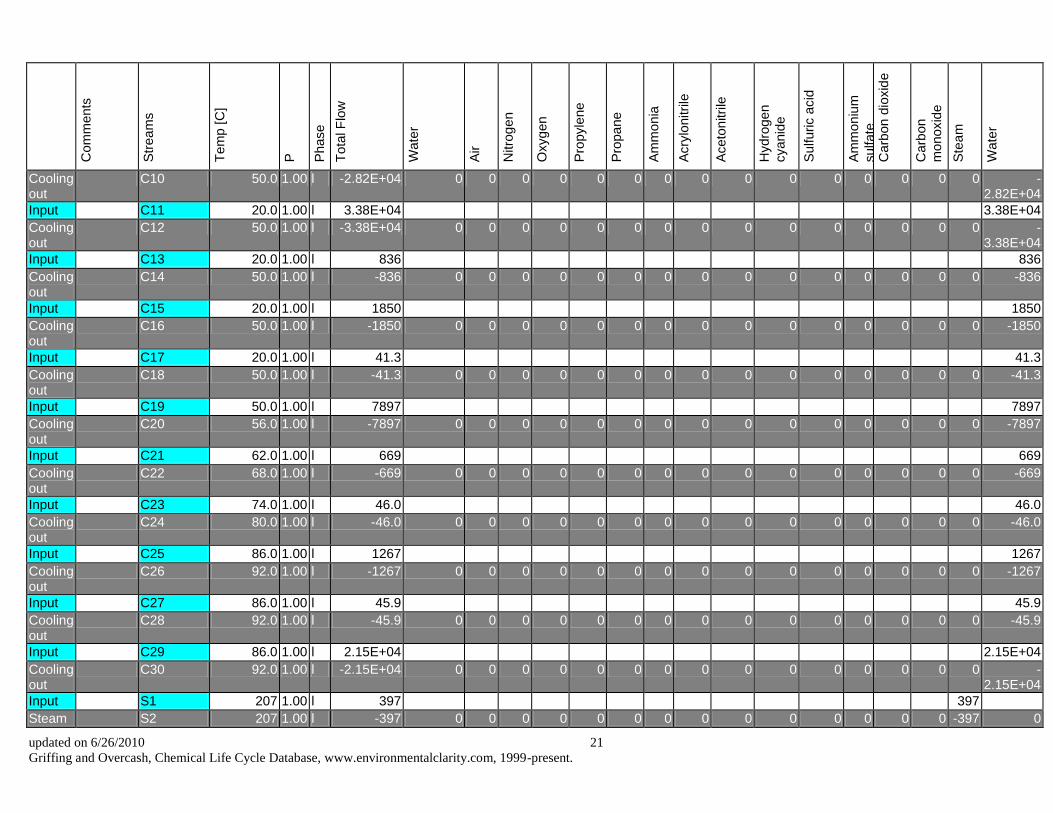
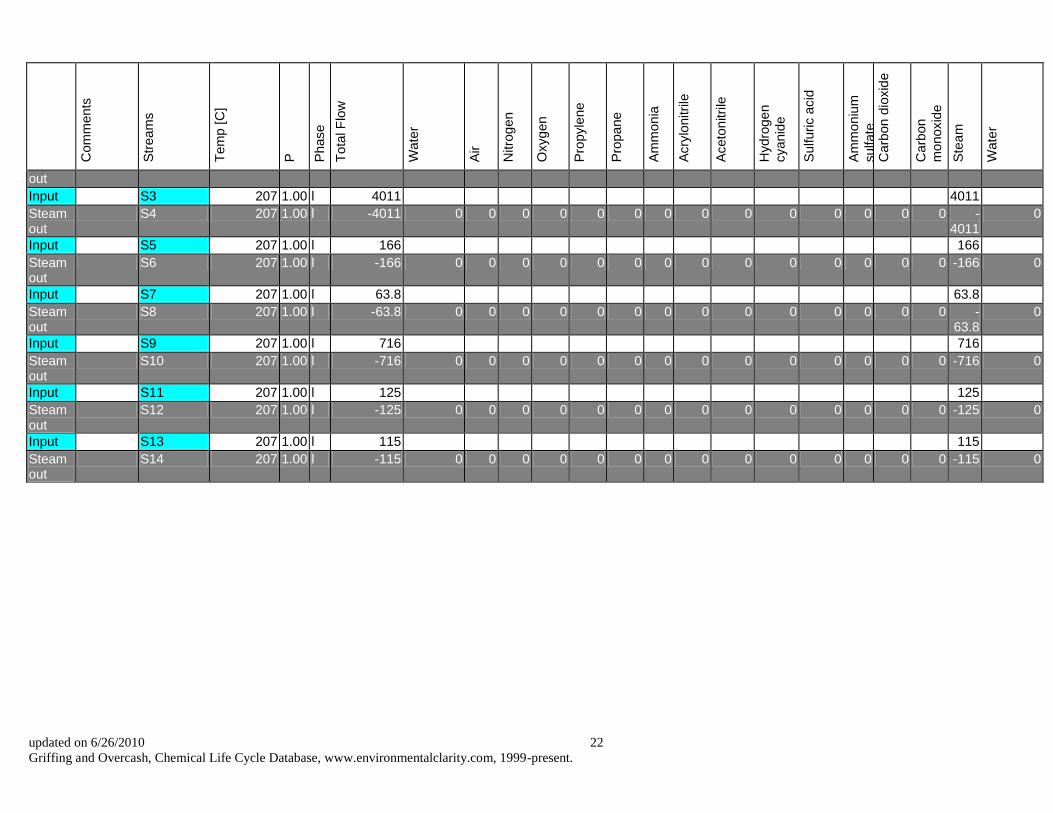
Mass Balance of Chemicals in Each Process Stream All flow rates are given in kg / hr
Physical state of chemical losses:
Com
ments
Str
ea
ms
Tem
p [
C]
P
Phase
Tota
l F
low
Wate
r
Air
Nitro
gen
Oxygen
Pro
pyle
ne
Pro
pa
ne
Am
mon
ia
Acry
lonitrile
Aceto
nitri
le
Hydro
gen
cyanid
e
Sulfuric a
cid
Am
mon
ium
sulfate
C
arb
on d
ioxid
e
Carb
on
monoxid
e
Ste
am
Wate
r
Input 1 25.0 1.00 g 6992 6992
1a 25.0 1.00 g 6992 5363 1629
2 90.4 2.00 g 6992 5363 1629
Input see propylene report for input condition
3 -37.0 1.00 g 1142 1142
3a -37.0 1.00 g 1142 1096 45.7
4 -12.1 2.00 g 1142 1096 45.7
Input 5 -34.0 1.00 l 475 475
5a -34.0 2.00 l 475 475
6 -15.0 2.00 g 475 475
R1 815 kg Propylene is converted in rxn 1 ( 74.3 % of reactor input)
-243 kg Acetonitrile is lost in rxn 2
-140 kg Hydrogen cyanide
is lost in rxn 3
Input to reactor
: 8609 0 0 5363 1629 1096 45.7 475 0 0 0 0 0 0 0
R1 Reaction
: 3.00 -1.50 -1.00 -1.00
1.00
Gas
Liquid
Solid
updated on 6/26/2010 15
Griffing and Overcash, Chemical Life Cycle Database, www.environmentalclarity.com, 1999-present.
Com
ments
Str
ea
ms
Tem
p [
C]
P
Phase
Tota
l F
low
Wate
r
Air
Nitro
gen
Oxygen
Pro
pyle
ne
Pro
pa
ne
Am
mon
ia
Acry
lonitrile
Aceto
nitri
le
Hydro
gen
cyanid
e
Sulfuric a
cid
Am
mon
ium
sulfate
C
arb
on d
ioxid
e
Carb
on
monoxid
e
Ste
am
Wate
r
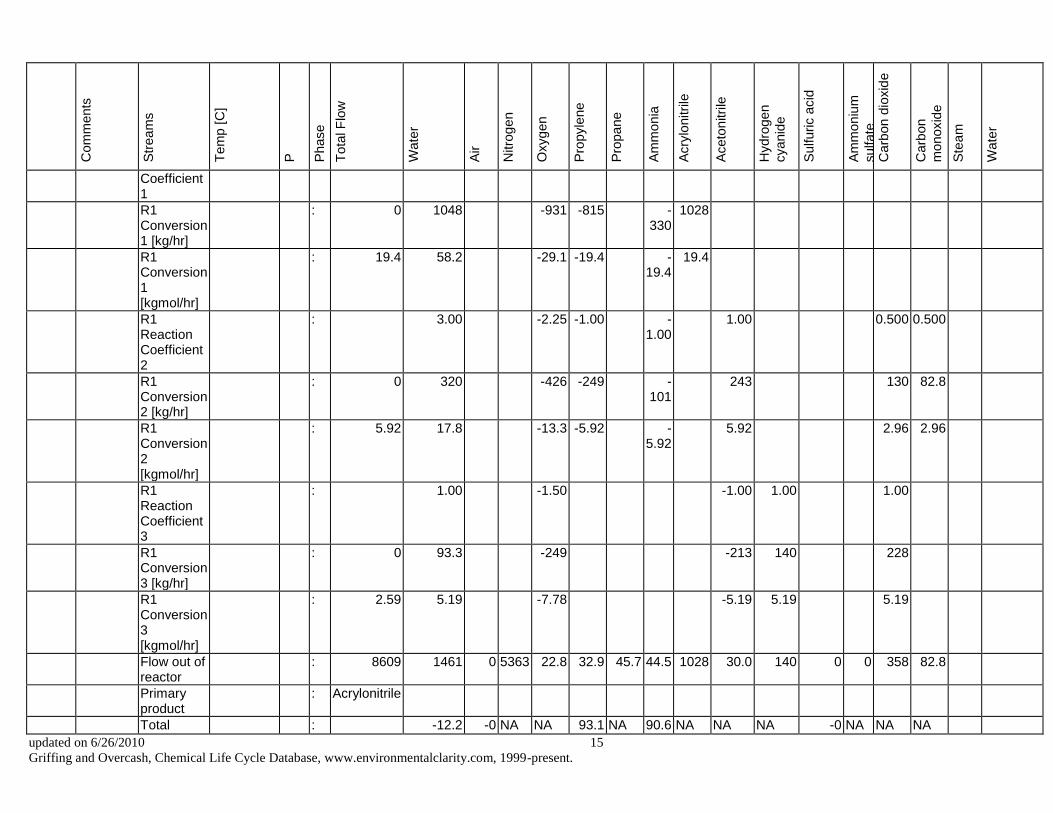
Coefficient 1
R1 Conversion 1 [kg/hr]
: 0 1048 -931 -815 -330
1028
R1 Conversion 1 [kgmol/hr]
: 19.4 58.2 -29.1 -19.4 -19.4
19.4
R1 Reaction Coefficient 2
: 3.00 -2.25 -1.00 -1.00
1.00 0.500 0.500
R1 Conversion 2 [kg/hr]
: 0 320 -426 -249 -101
243 130 82.8
R1 Conversion 2 [kgmol/hr]
: 5.92 17.8 -13.3 -5.92 -5.92
5.92 2.96 2.96
R1 Reaction Coefficient 3
: 1.00 -1.50 -1.00 1.00 1.00
R1 Conversion 3 [kg/hr]
: 0 93.3 -249 -213 140 228
R1 Conversion 3 [kgmol/hr]
: 2.59 5.19 -7.78 -5.19 5.19 5.19
Flow out of reactor
: 8609 1461 0 5363 22.8 32.9 45.7 44.5 1028 30.0 140 0 0 358 82.8
Primary product
: Acrylonitrile
Total : -12.2 -0 NA NA 93.1 NA 90.6 NA NA NA -0 NA NA NA
updated on 6/26/2010 16
Griffing and Overcash, Chemical Life Cycle Database, www.environmentalclarity.com, 1999-present.
Com
ments
Str
ea
ms
Tem
p [
C]
P
Phase
Tota
l F
low
Wate
r
Air
Nitro
gen
Oxygen
Pro
pyle
ne
Pro
pa
ne
Am
mon
ia
Acry
lonitrile
Aceto
nitri
le
Hydro
gen
cyanid
e
Sulfuric a
cid
Am
mon
ium
sulfate
C
arb
on d
ioxid
e
Carb
on
monoxid
e
Ste
am
Wate
r
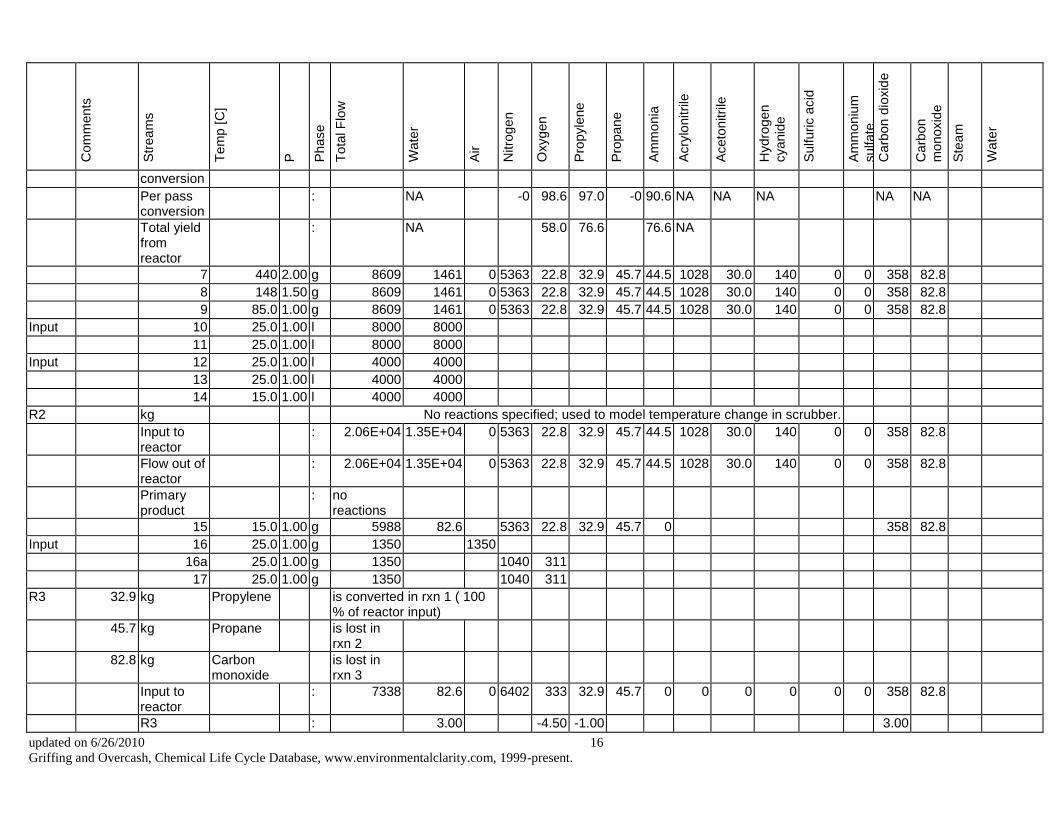
conversion
Per pass conversion
: NA -0 98.6 97.0 -0 90.6 NA NA NA NA NA
Total yield from reactor
: NA 58.0 76.6 76.6 NA
7 440 2.00 g 8609 1461 0 5363 22.8 32.9 45.7 44.5 1028 30.0 140 0 0 358 82.8
8 148 1.50 g 8609 1461 0 5363 22.8 32.9 45.7 44.5 1028 30.0 140 0 0 358 82.8
9 85.0 1.00 g 8609 1461 0 5363 22.8 32.9 45.7 44.5 1028 30.0 140 0 0 358 82.8
Input 10 25.0 1.00 l 8000 8000
11 25.0 1.00 l 8000 8000
Input 12 25.0 1.00 l 4000 4000
13 25.0 1.00 l 4000 4000
14 15.0 1.00 l 4000 4000
R2 kg No reactions specified; used to model temperature change in scrubber.
Input to reactor
: 2.06E+04 1.35E+04 0 5363 22.8 32.9 45.7 44.5 1028 30.0 140 0 0 358 82.8
Flow out of reactor
: 2.06E+04 1.35E+04 0 5363 22.8 32.9 45.7 44.5 1028 30.0 140 0 0 358 82.8
Primary product
: no reactions
15 15.0 1.00 g 5988 82.6 5363 22.8 32.9 45.7 0 358 82.8
Input 16 25.0 1.00 g 1350 1350
16a 25.0 1.00 g 1350 1040 311
17 25.0 1.00 g 1350 1040 311
R3 32.9 kg Propylene is converted in rxn 1 ( 100 % of reactor input)
45.7 kg Propane is lost in rxn 2
82.8 kg Carbon monoxide
is lost in rxn 3
Input to reactor
: 7338 82.6 0 6402 333 32.9 45.7 0 0 0 0 0 0 358 82.8
R3 : 3.00 -4.50 -1.00 3.00
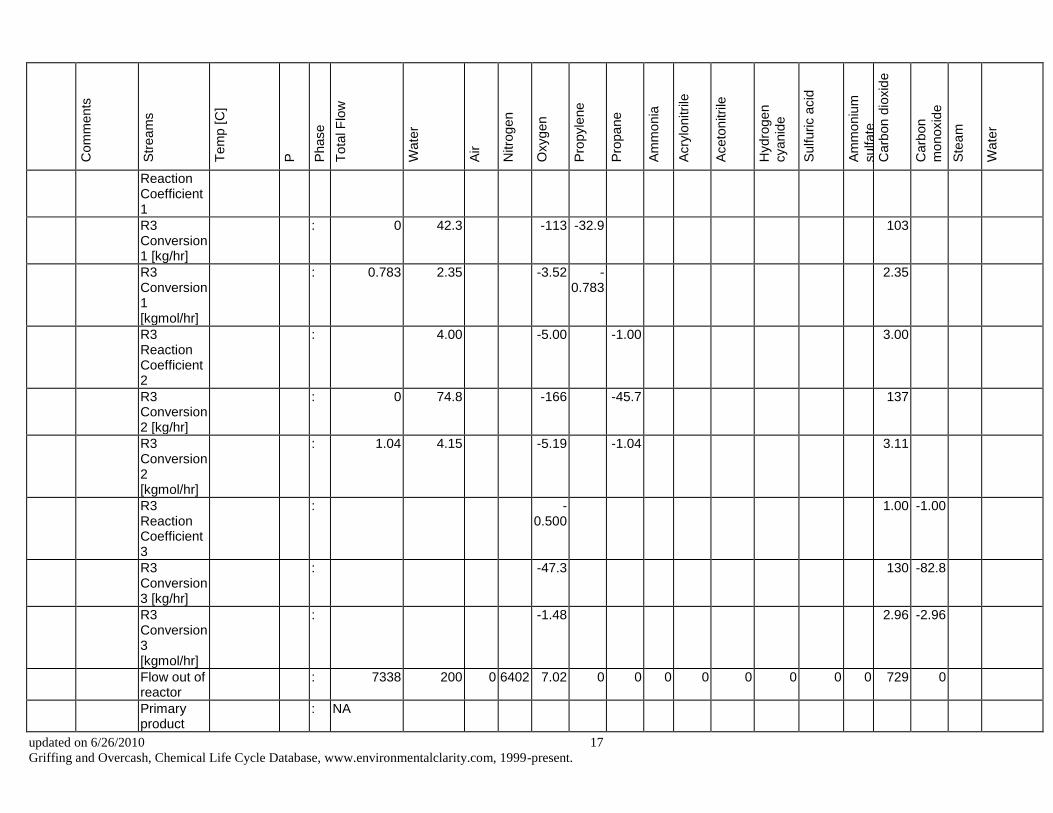
updated on 6/26/2010 17
Griffing and Overcash, Chemical Life Cycle Database, www.environmentalclarity.com, 1999-present.
Com
ments
Str
ea
ms
Tem
p [
C]
P
Phase
Tota
l F
low
Wate
r
Air
Nitro
gen
Oxygen
Pro
pyle
ne
Pro
pa
ne
Am
mon
ia
Acry
lonitrile
Aceto
nitri
le
Hydro
gen
cyanid
e
Sulfuric a
cid
Am
mon
ium
sulfate
C
arb
on d
ioxid
e
Carb
on
monoxid
e
Ste
am
Wate
r
Reaction Coefficient 1
R3 Conversion 1 [kg/hr]
: 0 42.3 -113 -32.9 103
R3 Conversion 1 [kgmol/hr]
: 0.783 2.35 -3.52 -0.783
2.35
R3 Reaction Coefficient 2
: 4.00 -5.00 -1.00 3.00
R3 Conversion 2 [kg/hr]
: 0 74.8 -166 -45.7 137
R3 Conversion 2 [kgmol/hr]
: 1.04 4.15 -5.19 -1.04 3.11
R3 Reaction Coefficient 3
: -0.500
1.00 -1.00
R3 Conversion 3 [kg/hr]
: -47.3 130 -82.8
R3 Conversion 3 [kgmol/hr]
: -1.48 2.96 -2.96
Flow out of reactor
: 7338 200 0 6402 7.02 0 0 0 0 0 0 0 0 729 0
Primary product
: NA
updated on 6/26/2010 18
Griffing and Overcash, Chemical Life Cycle Database, www.environmentalclarity.com, 1999-present.
Com
ments
Str
ea
ms
Tem
p [
C]
P
Phase
Tota
l F
low
Wate
r
Air
Nitro
gen
Oxygen
Pro
pyle
ne
Pro
pa
ne
Am
mon
ia
Acry
lonitrile
Aceto
nitri
le
Hydro
gen
cyanid
e
Sulfuric a
cid
Am
mon
ium
sulfate
C
arb
on d
ioxid
e
Carb
on
monoxid
e
Ste
am
Wate
r
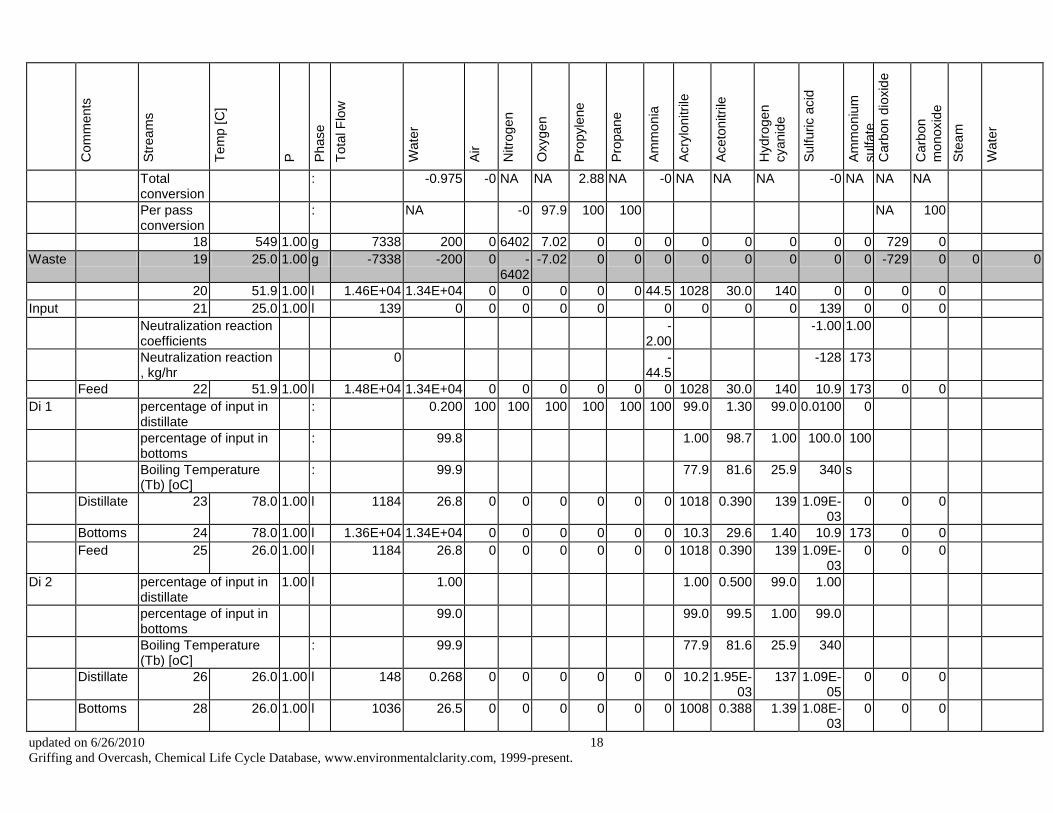
Total conversion
: -0.975 -0 NA NA 2.88 NA -0 NA NA NA -0 NA NA NA
Per pass conversion
: NA -0 97.9 100 100 NA 100
18 549 1.00 g 7338 200 0 6402 7.02 0 0 0 0 0 0 0 0 729 0
Waste 19 25.0 1.00 g -7338 -200 0 -6402
-7.02 0 0 0 0 0 0 0 0 -729 0 0 0
20 51.9 1.00 l 1.46E+04 1.34E+04 0 0 0 0 0 44.5 1028 30.0 140 0 0 0 0
Input 21 25.0 1.00 l 139 0 0 0 0 0 0 0 0 0 139 0 0 0
Neutralization reaction coefficients
-2.00
-1.00 1.00
Neutralization reaction , kg/hr
0 -44.5
-128 173
Feed 22 51.9 1.00 l 1.48E+04 1.34E+04 0 0 0 0 0 0 1028 30.0 140 10.9 173 0 0
Di 1 percentage of input in distillate
: 0.200 100 100 100 100 100 100 99.0 1.30 99.0 0.0100 0
percentage of input in bottoms
: 99.8 1.00 98.7 1.00 100.0 100
Boiling Temperature (Tb) [oC]
: 99.9 77.9 81.6 25.9 340 s
Distillate 23 78.0 1.00 l 1184 26.8 0 0 0 0 0 0 1018 0.390 139 1.09E-03
0 0 0
Bottoms 24 78.0 1.00 l 1.36E+04 1.34E+04 0 0 0 0 0 0 10.3 29.6 1.40 10.9 173 0 0
Feed 25 26.0 1.00 l 1184 26.8 0 0 0 0 0 0 1018 0.390 139 1.09E-03
0 0 0
Di 2 percentage of input in distillate
1.00 l 1.00 1.00 0.500 99.0 1.00
percentage of input in bottoms
99.0 99.0 99.5 1.00 99.0
Boiling Temperature (Tb) [oC]
: 99.9 77.9 81.6 25.9 340
Distillate 26 26.0 1.00 l 148 0.268 0 0 0 0 0 0 10.2 1.95E-03
137 1.09E-05
0 0 0
Bottoms 28 26.0 1.00 l 1036 26.5 0 0 0 0 0 0 1008 0.388 1.39 1.08E-03
0 0 0
updated on 6/26/2010 19
Griffing and Overcash, Chemical Life Cycle Database, www.environmentalclarity.com, 1999-present.
Com
ments
Str
ea
ms
Tem
p [
C]
P
Phase
Tota
l F
low
Wate
r
Air
Nitro
gen
Oxygen
Pro
pyle
ne
Pro
pa
ne
Am
mon
ia
Acry
lonitrile
Aceto
nitri
le
Hydro
gen
cyanid
e
Sulfuric a
cid
Am
mon
ium
sulfate
C
arb
on d
ioxid
e
Carb
on
monoxid
e
Ste
am
Wate
r
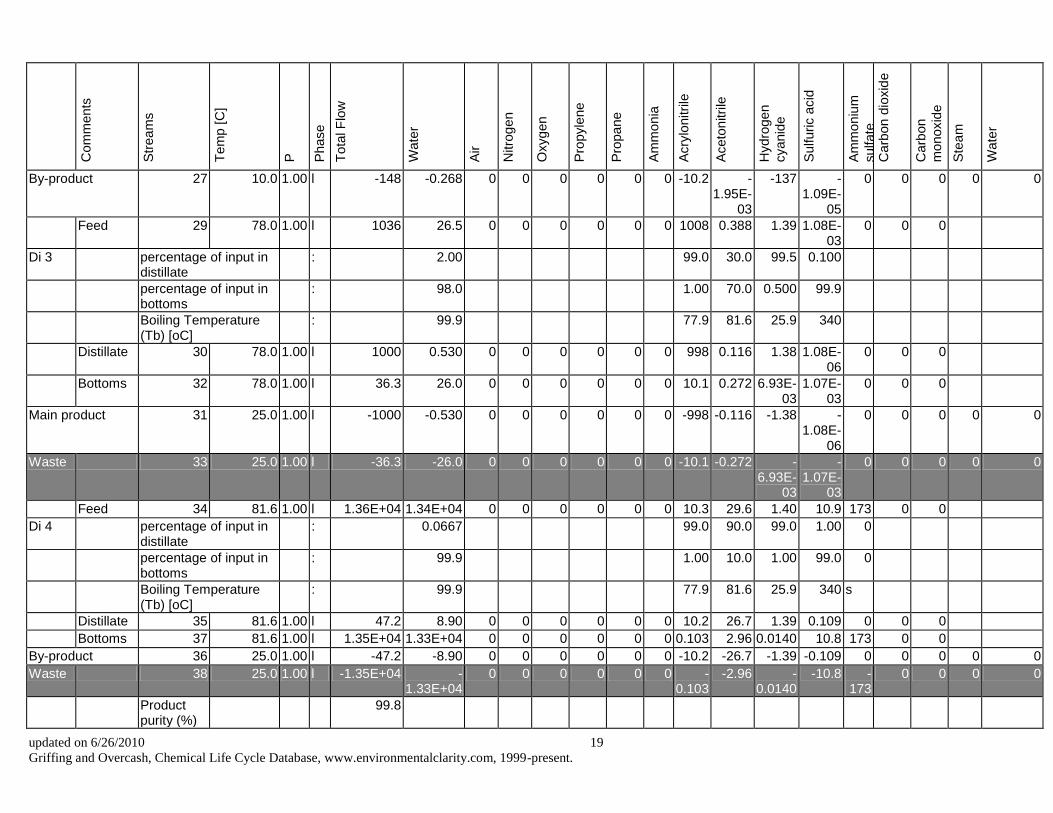
By-product 27 10.0 1.00 l -148 -0.268 0 0 0 0 0 0 -10.2 -1.95E-
03
-137 -1.09E-
05
0 0 0 0 0
Feed 29 78.0 1.00 l 1036 26.5 0 0 0 0 0 0 1008 0.388 1.39 1.08E-03
0 0 0
Di 3 percentage of input in distillate
: 2.00 99.0 30.0 99.5 0.100
percentage of input in bottoms
: 98.0 1.00 70.0 0.500 99.9
Boiling Temperature (Tb) [oC]
: 99.9 77.9 81.6 25.9 340
Distillate 30 78.0 1.00 l 1000 0.530 0 0 0 0 0 0 998 0.116 1.38 1.08E-06
0 0 0
Bottoms 32 78.0 1.00 l 36.3 26.0 0 0 0 0 0 0 10.1 0.272 6.93E-03
1.07E-03
0 0 0
Main product 31 25.0 1.00 l -1000 -0.530 0 0 0 0 0 0 -998 -0.116 -1.38 -1.08E-
06
0 0 0 0 0
Waste 33 25.0 1.00 l -36.3 -26.0 0 0 0 0 0 0 -10.1 -0.272 -6.93E-
03
-1.07E-
03
0 0 0 0 0
Feed 34 81.6 1.00 l 1.36E+04 1.34E+04 0 0 0 0 0 0 10.3 29.6 1.40 10.9 173 0 0
Di 4 percentage of input in distillate
: 0.0667 99.0 90.0 99.0 1.00 0
percentage of input in bottoms
: 99.9 1.00 10.0 1.00 99.0 0
Boiling Temperature (Tb) [oC]
: 99.9 77.9 81.6 25.9 340 s
Distillate 35 81.6 1.00 l 47.2 8.90 0 0 0 0 0 0 10.2 26.7 1.39 0.109 0 0 0
Bottoms 37 81.6 1.00 l 1.35E+04 1.33E+04 0 0 0 0 0 0 0.103 2.96 0.0140 10.8 173 0 0
By-product 36 25.0 1.00 l -47.2 -8.90 0 0 0 0 0 0 -10.2 -26.7 -1.39 -0.109 0 0 0 0 0
Waste 38 25.0 1.00 l -1.35E+04 -1.33E+04
0 0 0 0 0 0 -0.103
-2.96 -0.0140
-10.8 -173
0 0 0 0
Product purity (%)
99.8
updated on 6/26/2010 20
Griffing and Overcash, Chemical Life Cycle Database, www.environmentalclarity.com, 1999-present.
Com
ments
Str
ea
ms
Tem
p [
C]
P
Phase
Tota
l F
low
Wate
r
Air
Nitro
gen
Oxygen
Pro
pyle
ne
Pro
pa
ne
Am
mon
ia
Acry
lonitrile
Aceto
nitri
le
Hydro
gen
cyanid
e
Sulfuric a
cid
Am
mon
ium
sulfate
C
arb
on d
ioxid
e
Carb
on
monoxid
e
Ste
am
Wate
r
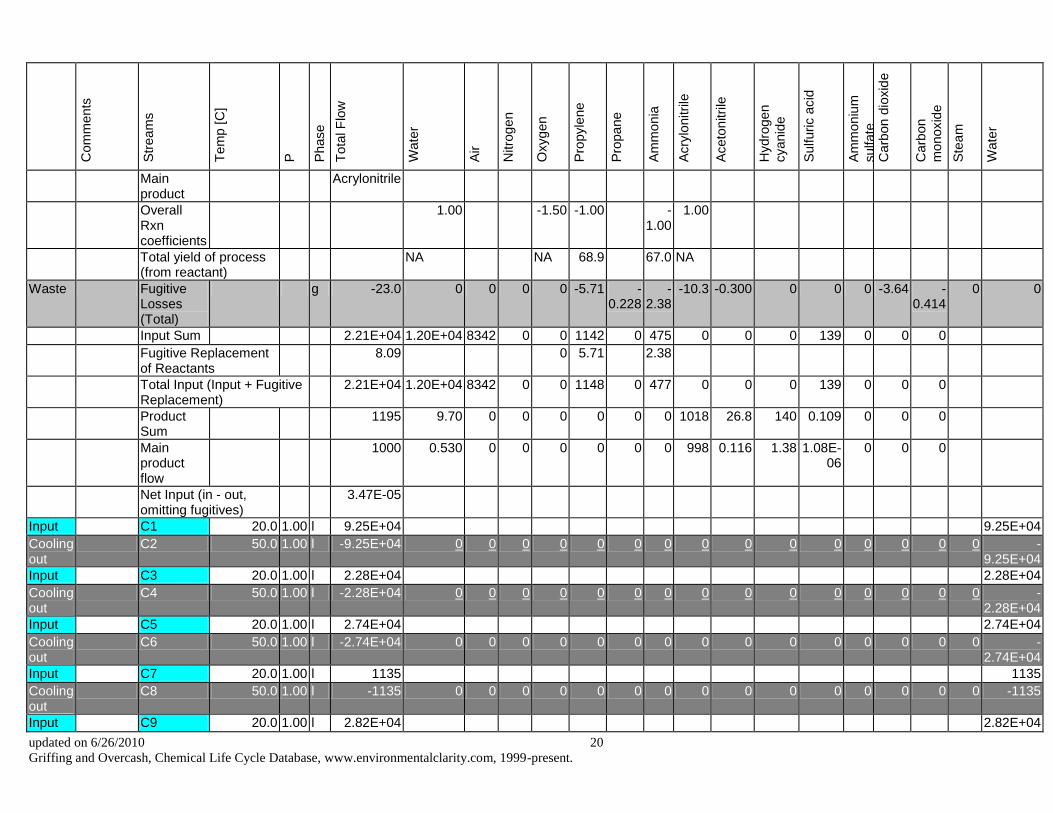
Main product
Acrylonitrile
Overall Rxn coefficients
1.00 -1.50 -1.00 -1.00
1.00
Total yield of process (from reactant)
NA NA 68.9 67.0 NA
Waste Fugitive Losses (Total)
g -23.0 0 0 0 0 -5.71 -0.228
-2.38
-10.3 -0.300 0 0 0 -3.64 -0.414
0 0
Input Sum 2.21E+04 1.20E+04 8342 0 0 1142 0 475 0 0 0 139 0 0 0
Fugitive Replacement of Reactants
8.09 0 5.71 2.38
Total Input (Input + Fugitive Replacement)
2.21E+04 1.20E+04 8342 0 0 1148 0 477 0 0 0 139 0 0 0
Product Sum
1195 9.70 0 0 0 0 0 0 1018 26.8 140 0.109 0 0 0
Main product flow
1000 0.530 0 0 0 0 0 0 998 0.116 1.38 1.08E-06
0 0 0
Net Input (in - out, omitting fugitives)
3.47E-05
Input C1 20.0 1.00 l 9.25E+04 9.25E+04
Cooling out
C2 50.0 1.00 l -9.25E+04 0 0 0 0 0 0 0 0 0 0 0 0 0 0 0 -9.25E+04
Input C3 20.0 1.00 l 2.28E+04 2.28E+04
Cooling out
C4 50.0 1.00 l -2.28E+04 0 0 0 0 0 0 0 0 0 0 0 0 0 0 0 -2.28E+04
Input C5 20.0 1.00 l 2.74E+04 2.74E+04
Cooling out
C6 50.0 1.00 l -2.74E+04 0 0 0 0 0 0 0 0 0 0 0 0 0 0 0 -2.74E+04
Input C7 20.0 1.00 l 1135 1135
Cooling out
C8 50.0 1.00 l -1135 0 0 0 0 0 0 0 0 0 0 0 0 0 0 0 -1135
Input C9 20.0 1.00 l 2.82E+04 2.82E+04
updated on 6/26/2010 21
Griffing and Overcash, Chemical Life Cycle Database, www.environmentalclarity.com, 1999-present.
Com
ments
Str
ea
ms
Tem
p [
C]
P
Phase
Tota
l F
low
Wate
r
Air
Nitro
gen
Oxygen
Pro
pyle
ne
Pro
pa
ne
Am
mon
ia
Acry
lonitrile
Aceto
nitri
le
Hydro
gen
cyanid
e
Sulfuric a
cid
Am
mon
ium
sulfate
C
arb
on d
ioxid
e
Carb
on
monoxid
e
Ste
am
Wate
r
Cooling out
C10 50.0 1.00 l -2.82E+04 0 0 0 0 0 0 0 0 0 0 0 0 0 0 0 -2.82E+04
Input C11 20.0 1.00 l 3.38E+04 3.38E+04
Cooling out
C12 50.0 1.00 l -3.38E+04 0 0 0 0 0 0 0 0 0 0 0 0 0 0 0 -3.38E+04
Input C13 20.0 1.00 l 836 836
Cooling out
C14 50.0 1.00 l -836 0 0 0 0 0 0 0 0 0 0 0 0 0 0 0 -836
Input C15 20.0 1.00 l 1850 1850
Cooling out
C16 50.0 1.00 l -1850 0 0 0 0 0 0 0 0 0 0 0 0 0 0 0 -1850
Input C17 20.0 1.00 l 41.3 41.3
Cooling out
C18 50.0 1.00 l -41.3 0 0 0 0 0 0 0 0 0 0 0 0 0 0 0 -41.3
Input C19 50.0 1.00 l 7897 7897
Cooling out
C20 56.0 1.00 l -7897 0 0 0 0 0 0 0 0 0 0 0 0 0 0 0 -7897
Input C21 62.0 1.00 l 669 669
Cooling out
C22 68.0 1.00 l -669 0 0 0 0 0 0 0 0 0 0 0 0 0 0 0 -669
Input C23 74.0 1.00 l 46.0 46.0
Cooling out
C24 80.0 1.00 l -46.0 0 0 0 0 0 0 0 0 0 0 0 0 0 0 0 -46.0
Input C25 86.0 1.00 l 1267 1267
Cooling out
C26 92.0 1.00 l -1267 0 0 0 0 0 0 0 0 0 0 0 0 0 0 0 -1267
Input C27 86.0 1.00 l 45.9 45.9
Cooling out
C28 92.0 1.00 l -45.9 0 0 0 0 0 0 0 0 0 0 0 0 0 0 0 -45.9
Input C29 86.0 1.00 l 2.15E+04 2.15E+04
Cooling out
C30 92.0 1.00 l -2.15E+04 0 0 0 0 0 0 0 0 0 0 0 0 0 0 0 -2.15E+04
Input S1 207 1.00 l 397 397
Steam S2 207 1.00 l -397 0 0 0 0 0 0 0 0 0 0 0 0 0 0 -397 0
updated on 6/26/2010 22
Griffing and Overcash, Chemical Life Cycle Database, www.environmentalclarity.com, 1999-present.
Com
ments
Str
ea
ms
Tem
p [
C]
P
Phase
Tota
l F
low
Wate
r
Air
Nitro
gen
Oxygen
Pro
pyle
ne
Pro
pa
ne
Am
mon
ia
Acry
lonitrile
Aceto
nitri
le
Hydro
gen
cyanid
e
Sulfuric a
cid
Am
mon
ium
sulfate
C
arb
on d
ioxid
e
Carb
on
monoxid
e
Ste
am
Wate
r
out
Input S3 207 1.00 l 4011 4011
Steam out
S4 207 1.00 l -4011 0 0 0 0 0 0 0 0 0 0 0 0 0 0 -4011
0
Input S5 207 1.00 l 166 166
Steam out
S6 207 1.00 l -166 0 0 0 0 0 0 0 0 0 0 0 0 0 0 -166 0
Input S7 207 1.00 l 63.8 63.8
Steam out
S8 207 1.00 l -63.8 0 0 0 0 0 0 0 0 0 0 0 0 0 0 -63.8
0
Input S9 207 1.00 l 716 716
Steam out
S10 207 1.00 l -716 0 0 0 0 0 0 0 0 0 0 0 0 0 0 -716 0
Input S11 207 1.00 l 125 125
Steam out
S12 207 1.00 l -125 0 0 0 0 0 0 0 0 0 0 0 0 0 0 -125 0
Input S13 207 1.00 l 115 115
Steam out
S14 207 1.00 l -115 0 0 0 0 0 0 0 0 0 0 0 0 0 0 -115 0
updated on 6/26/2010 23
Griffing and Overcash, Chemical Life Cycle Database, www.environmentalclarity.com, 1999-present.
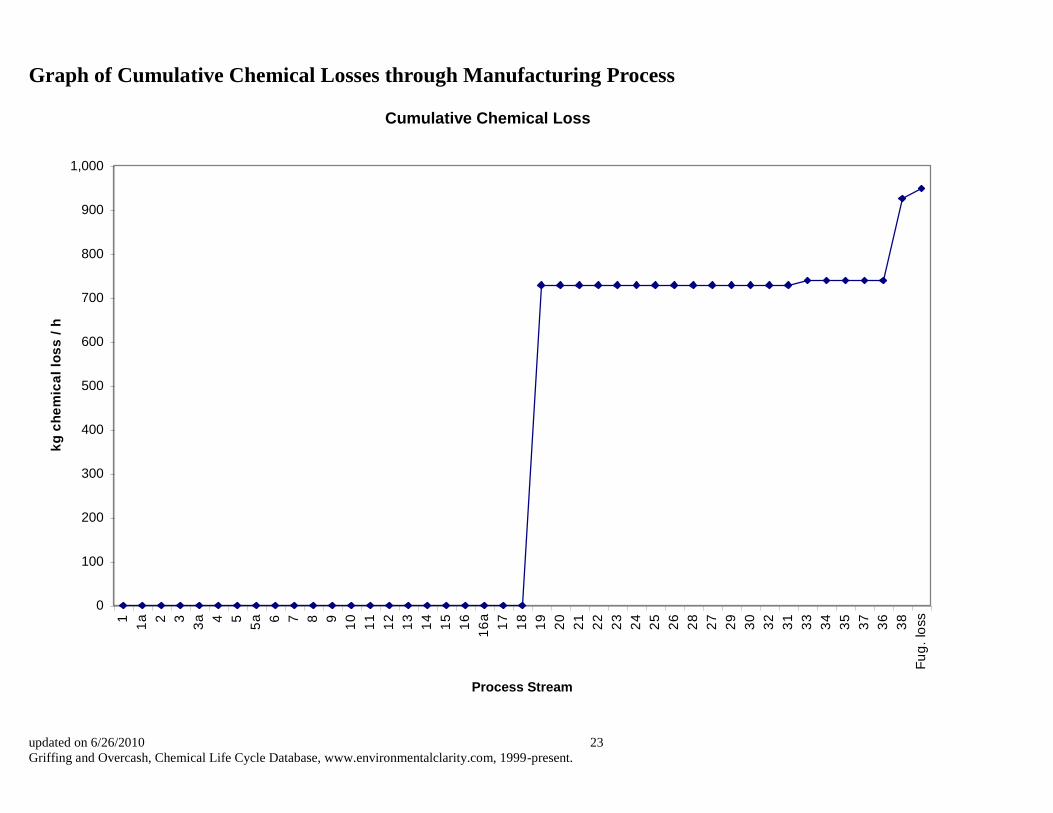
Graph of Cumulative Chemical Losses through Manufacturing Process
Cumulative Chemical Loss
0
100
200
300
400
500
600
700
800
900
1,000
1
1a 2 3
3a 4 5
5a 6 7 8 9
10
11
12
13
14
15
16
16
a
17
18
19
20
21
22
23
24
25
26
28
27
29
30
32
31
33
34
35
37
36
38
Fu
g.
loss
Process Stream
kg
ch
em
ica
l lo
ss
/ h
r
updated on 6/26/2010 24
Griffing and Overcash, Chemical Life Cycle Database, www.environmentalclarity.com, 1999-present.
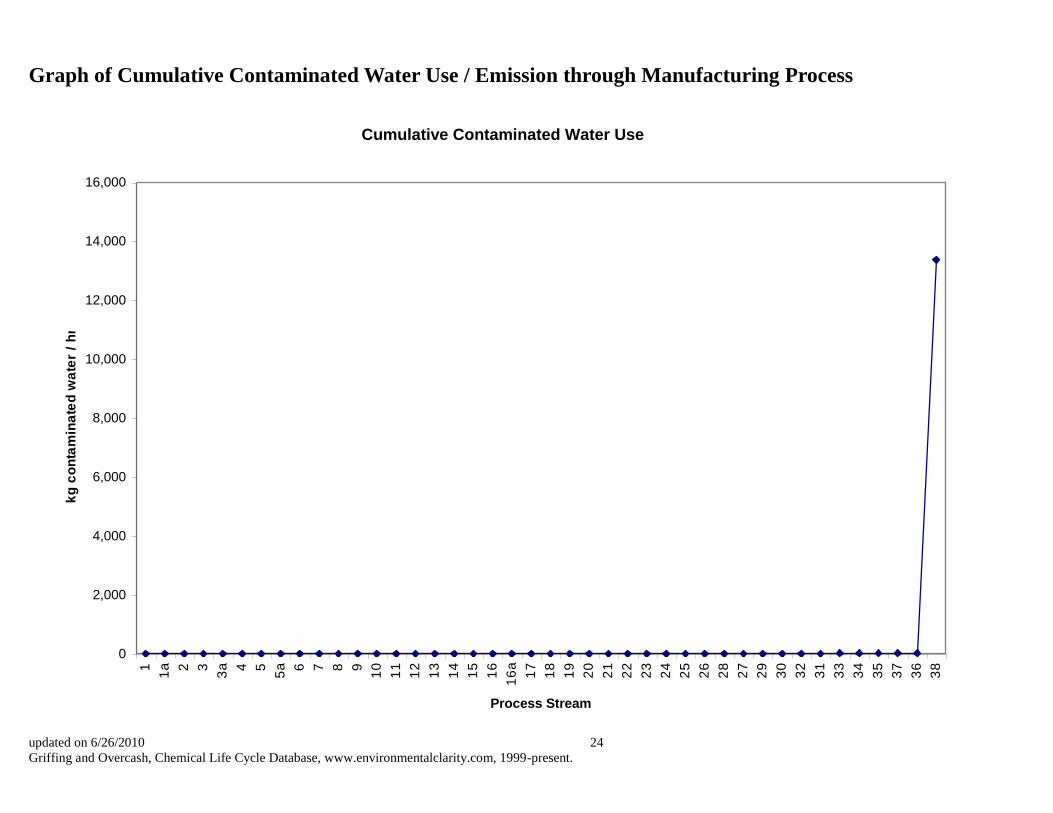
Graph of Cumulative Contaminated Water Use / Emission through Manufacturing Process
Cumulative Contaminated Water Use
0
2,000
4,000
6,000
8,000
10,000
12,000
14,000
16,000
1
1a 2 3
3a 4 5
5a 6 7 8 9
10
11
12
13
14
15
16
16
a
17
18
19
20
21
22
23
24
25
26
28
27
29
30
32
31
33
34
35
37
36
38
Process Stream
kg
co
nta
min
ate
d w
ate
r /
hr
updated on 6/26/2010 25
Griffing and Overcash, Chemical Life Cycle Database, www.environmentalclarity.com, 1999-present.
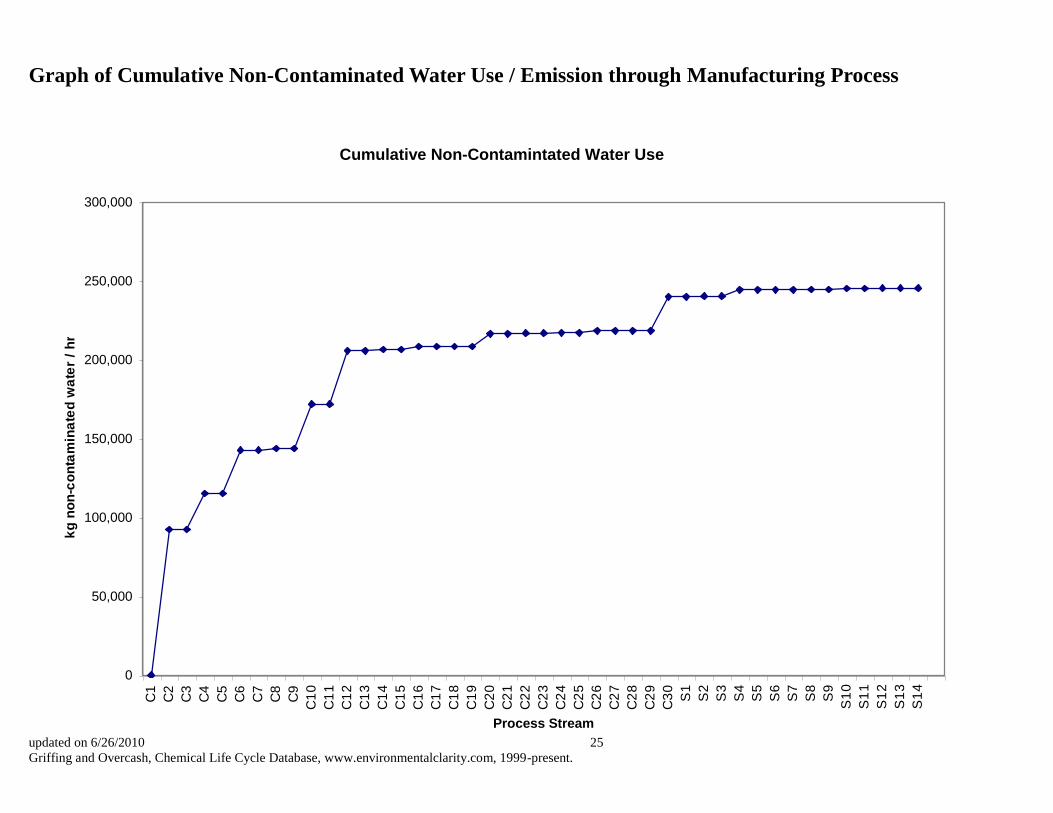
Graph of Cumulative Non-Contaminated Water Use / Emission through Manufacturing Process
Cumulative Non-Contamintated Water Use
0
50,000
100,000
150,000
200,000
250,000
300,000
C1
C2
C3
C4
C5
C6
C7
C8
C9
C1
0
C1
1
C1
2
C1
3
C1
4
C1
5
C1
6
C1
7
C1
8
C1
9
C2
0
C2
1
C2
2
C2
3
C2
4
C2
5
C2
6
C2
7
C2
8
C2
9
C3
0
S1
S2
S3
S4
S5
S6
S7
S8
S9
S1
0
S1
1
S1
2
S1
3
S1
4
Process Stream
kg
no
n-c
on
tam
ina
ted
wa
ter
/ h
r
updated on 6/26/2010 26
Griffing and Overcash, Chemical Life Cycle Database, www.environmentalclarity.com, 1999-present.
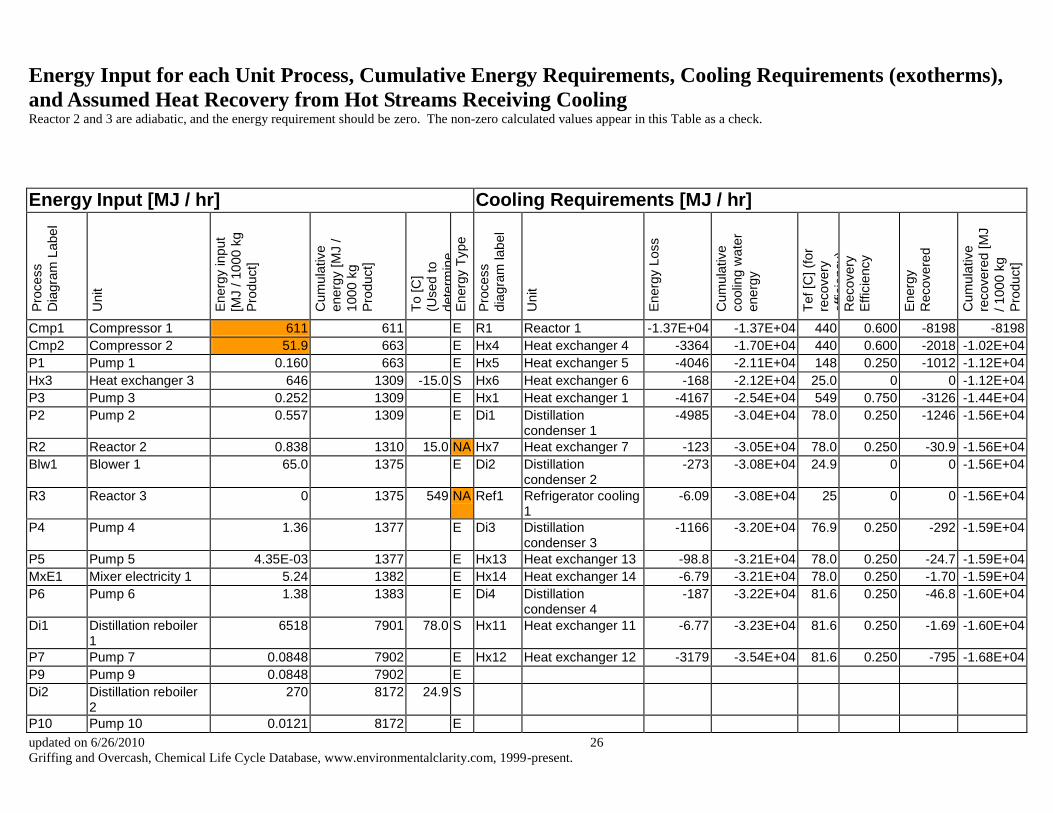
Energy Input for each Unit Process, Cumulative Energy Requirements, Cooling Requirements (exotherms),
and Assumed Heat Recovery from Hot Streams Receiving Cooling Reactor 2 and 3 are adiabatic, and the energy requirement should be zero. The non-zero calculated values appear in this Table as a check.
Energy Input [MJ / hr] Cooling Requirements [MJ / hr]
Pro
cess
Dia
gra
m L
abe
l
Unit
Energ
y inp
ut
[MJ / 1
000 k
g
Pro
duct]
Cum
ula
tive
energ
y [
MJ /
1000
kg
Pro
duct]
To [C
]
(Used to
dete
rmin
e
energ
y type)
Energ
y T
ype
Pro
cess
dia
gra
m lab
el
Unit
Energ
y L
oss
Cum
ula
tive
coolin
g w
ate
r
energ
y
Tef [C
] (f
or
recovery
effic
iency)
Recovery
Effic
iency
Energ
y
Recovere
d
Cum
ula
tive
recovere
d [M
J
/ 100
0 k
g
Pro
duct]
Cmp1 Compressor 1 611 611 E R1 Reactor 1 -1.37E+04 -1.37E+04 440 0.600 -8198 -8198
Cmp2 Compressor 2 51.9 663 E Hx4 Heat exchanger 4 -3364 -1.70E+04 440 0.600 -2018 -1.02E+04
P1 Pump 1 0.160 663 E Hx5 Heat exchanger 5 -4046 -2.11E+04 148 0.250 -1012 -1.12E+04
Hx3 Heat exchanger 3 646 1309 -15.0 S Hx6 Heat exchanger 6 -168 -2.12E+04 25.0 0 0 -1.12E+04
P3 Pump 3 0.252 1309 E Hx1 Heat exchanger 1 -4167 -2.54E+04 549 0.750 -3126 -1.44E+04
P2 Pump 2 0.557 1309 E Di1 Distillation condenser 1
-4985 -3.04E+04 78.0 0.250 -1246 -1.56E+04
R2 Reactor 2 0.838 1310 15.0 NA Hx7 Heat exchanger 7 -123 -3.05E+04 78.0 0.250 -30.9 -1.56E+04
Blw1 Blower 1 65.0 1375 E Di2 Distillation condenser 2
-273 -3.08E+04 24.9 0 0 -1.56E+04
R3 Reactor 3 0 1375 549 NA Ref1 Refrigerator cooling 1
-6.09 -3.08E+04 25 0 0 -1.56E+04
P4 Pump 4 1.36 1377 E Di3 Distillation condenser 3
-1166 -3.20E+04 76.9 0.250 -292 -1.59E+04
P5 Pump 5 4.35E-03 1377 E Hx13 Heat exchanger 13 -98.8 -3.21E+04 78.0 0.250 -24.7 -1.59E+04
MxE1 Mixer electricity 1 5.24 1382 E Hx14 Heat exchanger 14 -6.79 -3.21E+04 78.0 0.250 -1.70 -1.59E+04
P6 Pump 6 1.38 1383 E Di4 Distillation condenser 4
-187 -3.22E+04 81.6 0.250 -46.8 -1.60E+04
Di1 Distillation reboiler 1
6518 7901 78.0 S Hx11 Heat exchanger 11 -6.77 -3.23E+04 81.6 0.250 -1.69 -1.60E+04
P7 Pump 7 0.0848 7902 E Hx12 Heat exchanger 12 -3179 -3.54E+04 81.6 0.250 -795 -1.68E+04
P9 Pump 9 0.0848 7902 E
Di2 Distillation reboiler 2
270 8172 24.9 S
P10 Pump 10 0.0121 8172 E
updated on 6/26/2010 27
Griffing and Overcash, Chemical Life Cycle Database, www.environmentalclarity.com, 1999-present.
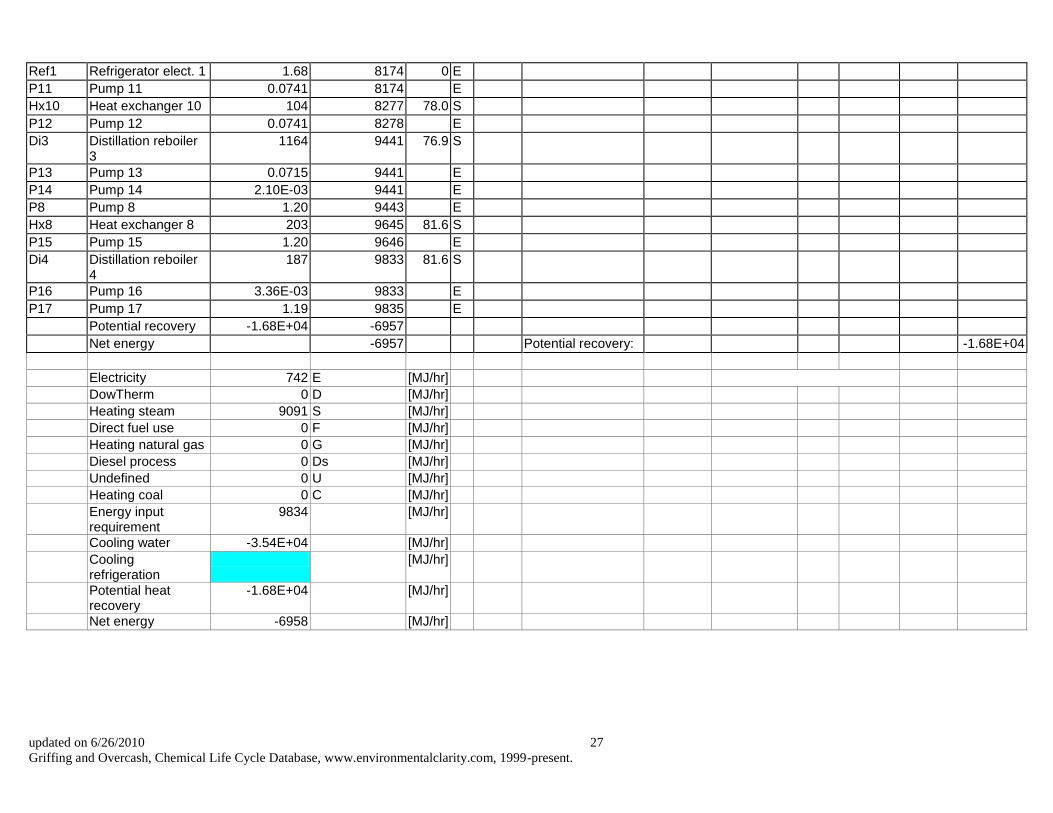
Ref1 Refrigerator elect. 1 1.68 8174 0 E
P11 Pump 11 0.0741 8174 E
Hx10 Heat exchanger 10 104 8277 78.0 S
P12 Pump 12 0.0741 8278 E
Di3 Distillation reboiler 3
1164 9441 76.9 S
P13 Pump 13 0.0715 9441 E
P14 Pump 14 2.10E-03 9441 E
P8 Pump 8 1.20 9443 E
Hx8 Heat exchanger 8 203 9645 81.6 S
P15 Pump 15 1.20 9646 E
Di4 Distillation reboiler 4
187 9833 81.6 S
P16 Pump 16 3.36E-03 9833 E
P17 Pump 17 1.19 9835 E
Potential recovery -1.68E+04 -6957
Net energy -6957 Potential recovery: -1.68E+04
Electricity 742 E [MJ/hr]
DowTherm 0 D [MJ/hr]
Heating steam 9091 S [MJ/hr]
Direct fuel use 0 F [MJ/hr]
Heating natural gas 0 G [MJ/hr]
Diesel process 0 Ds [MJ/hr]
Undefined 0 U [MJ/hr]
Heating coal 0 C [MJ/hr]
Energy input requirement
9834 [MJ/hr]
Cooling water -3.54E+04 [MJ/hr]
Cooling refrigeration
[MJ/hr]
Potential heat recovery
-1.68E+04 [MJ/hr]
Net energy -6958 [MJ/hr]
updated on 6/26/2010 28
Griffing and Overcash, Chemical Life Cycle Database, www.environmentalclarity.com, 1999-present.
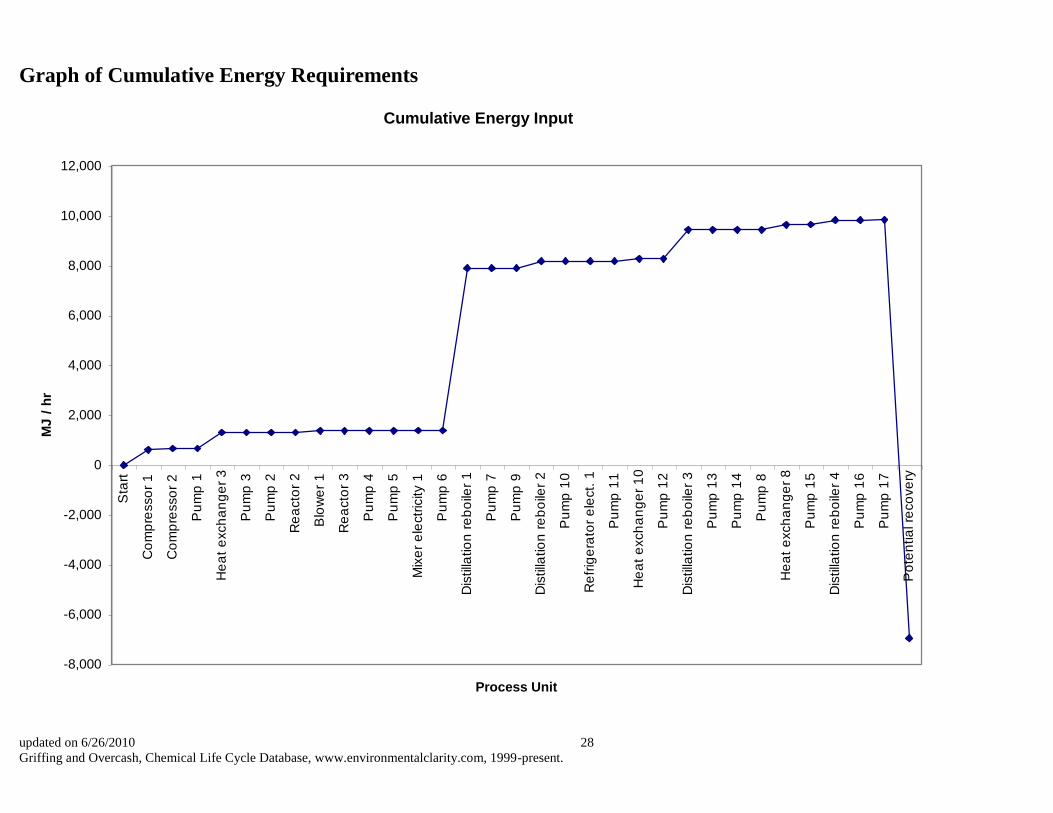
Graph of Cumulative Energy Requirements
Cumulative Energy Input
-8,000
-6,000
-4,000
-2,000
0
2,000
4,000
6,000
8,000
10,000
12,000
Sta
rt
Co
mp
resso
r 1
Co
mp
resso
r 2
Pu
mp
1
He
at
exch
an
ge
r 3
Pu
mp
3
Pu
mp
2
Re
acto
r 2
Blo
we
r 1
Re
acto
r 3
Pu
mp
4
Pu
mp
5
Mix
er
ele
ctr
icity 1
Pu
mp
6
Dis
tilla
tio
n r
eb
oile
r 1
Pu
mp
7
Pu
mp
9
Dis
tilla
tio
n r
eb
oile
r 2
Pu
mp
10
Re
frig
era
tor
ele
ct.
1
Pu
mp
11
He
at
exch
an
ge
r 1
0
Pu
mp
12
Dis
tilla
tio
n r
eb
oile
r 3
Pu
mp
13
Pu
mp
14
Pu
mp
8
He
at
exch
an
ge
r 8
Pu
mp
15
Dis
tilla
tio
n r
eb
oile
r 4
Pu
mp
16
Pu
mp
17
Po
ten
tia
l re
co
ve
ry
Process Unit
MJ
/ h
r


![Di-μ-perchlorato-bis{μ-2-[(2-pyridyl)methylaminomethyl]phenolato)dicopper(II) acetonitrile disolvate](https://img.pdfslide.net/doc/110x75/63204d0e069357aa4506230f/di-m-perchlorato-bism-2-2-pyridylmethylaminomethylphenolatodicopperii.jpg)


