Embed Size (px)
Citation preview

A business model adoption based on tourism innovation: Applying agratification theory to mobile applications
Pedro Palos-Sancheza, Jose Ramon Saurab, Felix Velicia-Martinc,*, Gabriel Cepeda-Carriond
a Department Financial Economy and Research Operation, University of Seville, Spainb Department of Business Economy, University King Juan Carlos, Spainc Department of Business Administration and Marketing, University of Seville, Spaind Department of Business Administration and Marketing, University of Seville, Spain
A R T I C L E I N F O
Article History:
Received 23 July 2020
Revised 12 January 2021
Accepted 3 March 2021
Available online 24 May 2021
A B S T R A C T
The purpose of this paper is to improve understanding of Tourism Innovation by using a Uses and Gratifica-
tion Theory model to investigate tourist intention to visit a city after reading other users' valuations of the
destination on Mobile Applications.
The Uses and Gratification Theory (U&G) model was adapted to investigate the factors which influence tour-
ist intention to visit a city. Satisfaction and Tourism Experience were added as external variables to the U&G
model. The original Convenience construct for mobile tourism applications was changed to Mobile Conve-
nience for this study.
A survey was carried out to investigate the factors which influence tourist intention to visit a City. 261 users
with different nationalities were asked about their experiences and feelings when using Runnin'City, which
was the mobile tourism application used in this study. The results were analyzed with Partial Least Squares
Structural Equation Modeling (PLS-SEM). All the relationships of U&Gwere supported, except for Information
for Tourism Experience.
Self-Expression was found to be especially relevant and was moderated by Entertainment, Information and
Mobile Convenience which in turn influence Satisfaction, Tourism Experience and Intention to visit a City.
The Gender and Running frequency variables were also investigated using multi-group analysis. The influ-
ence of Mobile Convenience on Satisfaction was seen to be moderated by Gender, and the relationships of
Information and Entertainment on satisfaction are moderated by Running Frequency.
The results obtained with the proposed changes in the U&G model will be very useful for academics and also
for designers and developers of mobile tourism apps as they show the special role played by Self-Expression
and Entertainment as relevant factors for the success of a mobile tourism app.
© 2021 The Authors. Published by Elsevier España, S.L.U. on behalf of AEDEM. This is an open access article
under the CC BY-NC-ND license (http://creativecommons.org/licenses/by-nc-nd/4.0/)
Keywords:
Gratification theory
Tourism innovation
Mobile applications
Tourism Business Model adoption
1. Introduction
The tourism industry has been affected by new advances in Infor-
mation and Communication Technologies (ICTs) over the last few
years. The Internet has had an especially strong effect on the changes
which have taken place in the tourism industry with the use of con-
nected devices and the new customer acquisition strategies
(Gretzel, Sigala, Xiang & Koo, 2015). Technological development has
promoted that tourism is now perceived as a product rather than a
service (Matos, Mendes & Valle, 2012).
The use of these strategies in the digital environment is known as
digital marketing and is used to improve recruitment, loyalty and
sales with the Internet. Nowadays, electronic devices with an
Internet connection are continually being used to organize and help
people with their travels around the world by using different applica-
tions such as travel guides, GPS, or interactive history books
(Saura, 2020).
A new business model that is being used in the tourism sector is
the installation of mobile applications in smartphones. These provide
tourism services and also incorporate management, creativity, pro-
ductivity or games. These mobile applications are designed to provide
the user with tourism services their trip and also when travelling in
the future.
The increase in Internet use when travelling and taking part in
tourist activities has increased innovation in this sector with the
emergence of new business models that are increasingly innovative
and are aimed at providing the users with added value on their trips.
GPS allows geolocation, which is the ability of a device to process
information to determine its geographical position. From a* Corresponding author.
E-mail address: [email protected] (F. Velicia-Martin).
https://doi.org/10.1016/j.iedeen.2021.100149
2444-8834/© 2021 The Authors. Published by Elsevier España, S.L.U. on behalf of AEDEM. This is an open access article under the CC BY-NC-ND license
(http://creativecommons.org/licenses/by-nc-nd/4.0/)
European research on management and business economics 27 (2021) 100149
www.elsevier.es/ermbe

commercial point of view, they are known as Location Based Services
(LBS). A typical LBS consists of location-based announcements, emer-
gency evacuation and services social networks (Zhou, 2011).
One of the formulas that is currently being used in these new
business models is geolocation technology which can accurately
identify where a user is when using an application. In this way per-
sonalized information, which changes depending on the user’s posi-
tion, can be offered to the user on their Internet connected device
(Moscardo, 2008). In the tourism field, the adoption of the LBS
depends on the social and environmental benefits obtained by the
downloaded app (Palos-Sanchez, Hernandez-Mogollon & Campon-
Cerro, 2017).
In addition, there are many other new applications and a variety
of innovative business models, which use different strategies to help
users perform day to day tasks and other activities, such as tourism.
An example of an innovative strategy is one that uses the user’s pro-
file to generate a role which can be used in a game with different
milestones that have to be reached in order to win a prize or a
reward.
This type of business models uses the concept of gratification.
Gratification is a strategy that requires users to achieve different
milestones in a mobile application. In order to receive a better prize
at the end of a series of milestones, users must share their achieve-
ments on social networks (Brooker & Joppe, 2014).
In an increasingly connected ecosystem in which users are con-
nected to the Internet for an average of 10 h a week, sharing informa-
tion with the users’ contacts is becoming increasingly important.
Nowadays, many users of tourism applications want to share the
experiences (milestones) they have had (achieved) with their user
community by publishing them on social networks so that their fol-
lowers can see their success with the application (Tajeddini, Ratten &
Denisa, 2017).
This means that users of these tourism applications have social
influence and interact with their social network followers for enter-
tainment by sharing their achievements (Rodríguez, Williams & Hall,
2014).
There has been a real increase in the use of these technologies in
the tourism sector, as indicated by (Palos-Sanchez, Saura, & Correia,
2021). This increase has been exponential, mainly due to the
improvements in new technologies in the tourism sector
(Paget, Dimanche & Mounet, 2010).
The goal of this research is to investigate the business models in
the tourism sector that use this type of personal gratification strategy
where users share their tourism activities and experiences using
mobile applications.
This study uses Runnin’City, which is a smartphone application in
the tourism sector with which users do sport whilst visiting a city
(Tsiotsou & Ratten, 2010). This application allows users to listen to
information about the touristic monuments in a city whilst jogging
through it. This application was chosen because it proposes a new
way of visiting a city and promotes healthy habits with little environ-
mental impact.
The study investigates the Uses and Gratification Theory (U&G)
which is used in the Runnin’City application. The aim is to find the
reasons why users publish their experiences on digital platforms by
studying the publications that users share using the Runnin’City
application. The motivation that the user has when sharing informa-
tion about their achievements on smartphone applications can then
be identified.
This investigation covers an existing gap in the present literature
because it studied an application with a business model which is
innovative and combines the positive aspects of sports with the satis-
faction and mental gratification that users feel when they share infor-
mation on social networks. Other research has commented on
models of gratification in tourism applications, but here it is the main
focus of this research.
This study is organized as follows. First, there is an introduction
and literature review, in which innovation in the tourism sector is
explained. Then, the methodology and hypotheses used in the study
are presented. The results of the research are presented and analysed
and finally, the conclusions and discussion are given.
2. Literature review
2.1. Smartphone applications in the tourism sector
Tourism is an important part of the economy as international
tourism generated 1.5 trillion USD in 2015. Tourism is also essential
for employment and sustainability around the world, as one in every
eleven jobs is connected with the tourism sector (Garsous, Corderi,
Velasco, & Colombo, 2017). The evolution of technology and commu-
nications since the 1980s has led to dramatic changes in the tourism
industry and have allowed global interaction between the parties
involved in tourism services. Social networks and other emergent
forms of online communications are having enormous impact on
travel planning, especially with smartphones that allow access to
information from anywhere in the world and this is producing a radi-
cal change in the behavior of travellers (Xiang, Magnini & Fesenmaier,
2015). The smartphone market has increased exponentially through-
out the world in the last decade (Reyes-Menendez, Saura & Stephen,
2020). This is an important fact as smartphones are the devices which
mobile application work on. The number of tourism applications
downloaded by smartphone users has been steadily increasing over
the last few years.
There are many categories of mobile tourism applications which
can be grouped depending on when they are used during a trip.
Some applications give an initial idea about the destination (Hoyer &
MacInnis, 2001) while others give information about interesting pla-
ces or improve the user experience at the destination. (Panteli-
dis, 2010; Verma, Stock, & McCarthy, 2012). In the second case, the
applications which are used the most are those that provide real time
information about services available at the location such as accom-
modation, transport, restaurants and other leisure activities
(Okazaki, Díaz-Martín, Rozano, & Men�endez-Benito, 2015;
Ardissono, Kuflik, & Petrelli, 2012; Thakran & Verma, 2013).
The information about these services is usually treated as an
accessory which is continually available during a trip. Searches for
information about local transport service are becoming increasingly
popular (Verma, Stock, & McCarthy, 2012). (Liang, Schuckert, Law, &
Masiero, 2017) analysed the trends of different types of tourism
applications for smartphones.
Other applications in the tourism sector focus deal with the user
experience during the trip. García-Magari~no, Palacios-Navarro and
Lacuesta (2017) proposed the use of tourism applications on smart-
phones as a way of improving the decisions made by the agents
involved. Other research into tourism applications has studied tools
for the promotion of destinations, heritage sites and sustainable
development. Applications that use geolocation to add value to the
user experience during trips have also been investigated
(Hardy et al., 2017).
Other characteristics studied was personalization, which gives the
opportunity to choose the information shown to them and to access
only what they think is most relevant to them and to the selected
destination. These features, if correctly studied, can provide app users
with destination experiences to enhance their travelling enjoyment
(Palos-Sanchez, Saura & Correia, 2020).
2.2. Similar studies
Innovation in the tourism sector is an area which researchers have
been investigating over the last decade (Hall & G€ossling, 2013; Hjal-
ager, 2010). The gratification models used by mobile tourism
P. Palos-Sanchez, J.R. Saura, F. Velicia-Martin et al. European research on management and business economics 27 (2021) 100149
2

applications was investigated by (Corrocher, 2011) who studied the
use of this type of application and the factors that affect the amount
of user interaction.
Lampe et al. (2006) investigated the characteristics that users con-
sider important when selecting applications that can be installed in
Internet browsers. (Raacke & Bonds-Raacke, 2008) identified the
social interactions of users when sharing information on social net-
works and investigated the user satisfaction when sharing content.
Joinson (2008) used gratification models to investigate the user
gratification when using the Facebook application. (Xiang & Gret-
zel, 2010) tourism innovation and how social networks can be used
to promote tourism.
(Bilgihan, Barreda, Okumus, & Nusair, 2016) also showed the
amount of user satisfaction when content is shared on social net-
works, and how this satisfaction made users happier and psychologi-
cally stable. Table 1 shows similar research which used gratification
and satisfaction models for innovative smartphone applications in
the tourism sector.
3. Methodology and hypothesis development
3.1. Uses and gratification theory (U&G)
The Uses and Gratification Theory (U&G) model (Katz, Blumler &
Gurevitch, 1973; Rauschnabel, Rossmann, & Dieck, 2017) was used in
this research. This model was used to find out what motivates users
to share content on different application which give rewards.
The model studied the social and psychological characteristics of
users who are motivated and feel satisfied when using mobile tour-
ism applications that include games. The model has three main con-
structs, which are Motivation, Behavioural Use and Gratification/
Satisfaction. In this case, Motivation refers to the characteristics
which positively influence a user’s actions. Behavioural Use refers to
the usage patterns when sharing communications on social media.
These patterns include the exposure time, type of use, and the infor-
mation that is shared on the platform.
U&G is a model which can be applied to all types of communica-
tion channels and media, which may also include games and mile-
stone achievements with short-term goals for gratification and
satisfaction.
A group of new constructs were added to the model following the
research by Ho and See-To (2018) and Choi, Fowler, Goh and
Yuan (2016). Information (INF) is the type of information a user
shares on social networks. Entertainment (ENT) measures how
entertained a user feels with the gratification model used in the
application. Self-Expression (SE) is how free a user feels to share their
true opinions and experiences about a trip or destination. Social
Influence (SI) is the way in which other users of the application influ-
ence the content shared and how their opinions can influence the
gratification of the user. The Tourism Experience (TOUE) is a factor
which measures how a user feels about their tourism experience
with the use of the mobile application and its gratification model.
Mobile Convenience (MOC) measures how convenient a user feels it
is to use the application when at a tourist destination. The last con-
struct added to the model was Visit Intention for the city (VIC) which
shows the intention that a user has to visit a city with the applica-
tion.
3.2. Proposed hypotheses
Ha, Kim, Libaque-Saenz, Chang and Park (2015) found a relation-
ship between Self-Expression (SE) on social media and the Conve-
nience (CON) of using mobile tourism applications to share
information. This means that the user valuation of Self-Expression for
the tourism application can the value a user gives for the Mobile Con-
venience of using an application whilst on tourist trips and excur-
sions. This relationship was also confirmed by Malik, Dhir and
Nieminen (2016), thus showing evidence of the relationship between
Self-Expression and Mobile Convenience when researching digital
media content. Therefore, the following hypothesis was proposed:
H1: User Self-Expression (SE) when using a tourism application
influences Mobile Convenience (MOC) when on tourist trips
Smock (Smock, Ellison, Lampe, & Wohn, 2011) and
Malik et al. (2016) found that the value given to Self-Expression by
users of tourism applications increased the amount of information
available to users of these applications and digital platforms. In addi-
tion, variations were seen the tone and expressions made by users of
the application when on their trip. This may influence how users
behave when traveling and using their apps. The following hypothe-
sis was therefore proposed:
H2: The Self-Expression (SE) of tourists who use mobile tourism
applications influences the type and amount of information (INF)
shared during their travels.
Chang and Thorson (Chang & Thorson, 2004) showed the influ-
ence of Self-Expression on travelers using applications and web pages
and how entertained they feel whilst doing this on their trips abroad.
There is therefore a relationship between the communication that is
made using mobile tourism applications and the entertainment felt by
the users of these applications. Chang and Thorson (2004) also con-
firmed in their findings that the more entertained users feel, the
higher the possibility that they increase using a tourism application
at their destinations. The following hypothesis was therefore
proposed:
H3: Self-Expression (SE) of tourists using mobile tourism applica-
tions has an influence on the Entertainment (ENT) felt by the
tourist
Ha et al. (2015) investigated the relationship between Mobile
Convenience (MOC), which is the ease and comfort of sharing content
on tourism websites, and the satisfaction users felt when sharing
their experiences. This relationship was also included in the research
by Choi et al. (2016) to find how the Mobile Convenience of using
tourism applications influences Satisfaction. The following hypothe-
sis was therefore proposed:
Table 1
Similar studies.
Authors Description
Huang (2008) Uses a model including entertainment and
gratification to find the positive impact on
the perceived use of applications
Mantymaki and riemer (2014) Use a gratification and entertainment model
to show that an application will continue
to be used when there is a positive rela-
tionship between engagement and user’
interactions.
Bilgihan et al. (2016) The study shows that the feelings of satisfac-
tion, gratification and social acceptance are
generated when tourists share their expe-
riences on social networks.
Raacke and BondsRaacke (2008) This study suggests that the information that
users share on social networks influences
the way followers interact and therefore
also influences the interaction and the
gratification users feel when sharing
content
P. Palos-Sanchez, J.R. Saura, F. Velicia-Martin et al. European research on management and business economics 27 (2021) 100149
3

H4: The Mobile Convenience (MOC) of mobile tourism applications
positively influences the Satisfaction (ST) with the trip
Ha et al. (2015) used a gratification model to study the attitudes
and behavior of users while travelling. The positive influence of the
convenience of using mobile tourism applications on the travellers’
experience was proposed. A positive experience provoked a feeling
of satisfaction with the trip. These relationships were also justified in
the findings of Ha et al. (2015) and Malik et al. (2016). The following
hypothesis was therefore proposed:
H5: Mobile Convenience (MOC) positively influences the Tourism
Experience (TOUE) of the users of mobile tourism applications
Li, Liu, Xu, Heikkil€a and Van Der Heijden (2015) found that the
information and experiences that users share with mobile tourism
applications and digital platforms while travelling positively influen-
ces how satisfied they feel with the trip (Ha et al., 2015). The use of
mobile tourism applications could also influence the satisfaction that
tourists feel about their tourism activities while using the tourism
application at their destination. The following hypothesis was there-
fore proposed:
H6: The information (INF) shared by the user with a mobile tour-
ism application has a positive influence on the users Satisfaction
(ST) with the trip
Ducoffe (Ducoffe, 1995) and Li et al. (2015) showed the relation-
ship which exists between the information which is available about
the tourist destination and the user experience at the destination.
Ha et al. (2015) and Choi et al. (2016) found a relationship between
the information that is available on tourism websites with the experi-
ences which users post about their trips (Ho & See-to, 2018). There-
fore, the following hypothesis was proposed:
H7: The Information (INF) which users share with mobile tourism
applications during their trip positively influences Tourism Expe-
rience (TOUE)
Smock (Smock, Ellison, Lampe, & Wohn, 2011) found that the
information and experiences that users share with mobile tourism
applications and digital platforms whilst travelling positively influen-
ces how satisfied they feel with the trip. This is also considered in the
research by Choi et al. (2016) in which it can be seen that the use of
tourist content and applications can influence the satisfaction of tou-
rists at their destinations. The following hypothesis was therefore
proposed:
H8: The information (INF) shared by the user on mobile tourism
applications has a positive influence on user Satisfaction (ST) with
the tourist trip
The research by Ducoffe (1995) found that entertainment with
gratification was a key factor for satisfaction. In addition,
Choi et al. (2016) showed that mobile tourism applications have a
positive influence on users by linking entertainment with the satis-
faction of using tourism applications for personal gratification. The
following research hypothesis was therefore proposed:
H9: The entertainment (ENT) provided by mobile tourism applica-
tions positively influences Satisfaction (ST) when using this type
of application during tourist trips
Ho and See-to (2018) identified the positive influence of user satisfac-
tion with digital tourism platforms on the users’ intention to visit a city
for tourism purposes. The use of mobile tourism applications may then
favor users wanting to visit a city while travelling. This relationship can
therefore influence the attitudes of tourists when they want to visit a city
(Smock, Ellison, Lampe, & Wohn, 2011). The following hypothesis was
therefore proposed:
H10: Satisfaction (ST) with the use of mobile tourism applications
positively influences Visit Intention for the City (VIC) when choos-
ing a tourist destination
Ho and See-to (2018) identified the positive influence of publishing
visitors’ Tourism Experiences at a city with digital tourism platforms on
the Visit Intention for a city. The use of mobile tourism applications
may favor users wanting to visit a city. This was also seen in the
research on tourism by authors such as Ha et al. (2015) and Smock
(Smock, Ellison, Lampe, & Wohn, 2011). The following hypothesis was
therefore proposed:
Fig. 1. Proposed Model.
P. Palos-Sanchez, J.R. Saura, F. Velicia-Martin et al. European research on management and business economics 27 (2021) 100149
4

H11: Publications about Tourism Experience (TOUE) with mobile
tourism applications positively influence the Visit Intention for a
City (VIC) when choosing a tourist destination.
The proposed theoretical model is shown in Figure 1.
3.3. Data collection
Data was collected with a self-administered web survey of smart-
phone users to test the proposed Uses and Gratification Theory
(U&G) model,
The questionnaire was distributed using Google forms and the
link was posted on public forums. The individuals who were sur-
veyed were aged between 18 and 65 years old. An initial study col-
lected data from a small group of Spanish RunninCity app users in
the second half of November 2018 in order to check and correct the
questionnaire and any confusion that it could inadvertently cause.
Later, a non-probability convenience sample of smartphone users at
different university departments at the University of Seville and Uni-
versity of Extremadura in Spain and the Technological Institute of
Costa Rica was used to collect the research data (see table 2). All par-
ticipants agreed to download and use the app before answering the
questionnaire. They were offered an introductory video explaining
the procedure for downloading installation and use. Most of the users
were already users of the app, before they knew about this Research
Project.
The survey was placed on a web site where participants could
access and respond to the survey. After discarding the non-valid
questionnaires, the final sample consisted of 261 users. College stu-
dents have been included as part of the target population in past
research on mobile applications (Bankole, Bankole & Brown, 2011;
Hew, Lee, Ooi & Wei, 2015; Shorfuzzaman & Alhussein, 2016) and
mobile use (Leong, Ooi, Chong & Lin, 2013; Zhou, Lu &Wang, 2010).
All the students in the survey used mobile sports applications and
were used to using ICT. A large number of the students in the sample
studied market research and collaborated as pollsters, passing ques-
tionnaires to others smartphone users. Therefore, a convenience sam-
ple was used because there were a lot of smartphone users and a
large sample size could quickly be reached.
The final version of the questionnaire consisted of 27 items (see
table 2 and appendix), for the ten constructs which were Informa-
tion-INF (3 items), Entertainment-ENT (4 items), Self-Expression-SE
(3 items), Satisfaction-ST (4 items), Visit Intention for the City-VIC (2
items), Mobile Convenience-MOC (2 items) and Tourism Experience-
TOUE (2 items).
Various articles were reviewed in order to find the variables
which should be measured for the constructs of the Uses and Gratifi-
cation Theory (U&G). These were found to be the information shared
and the users’ attitude and motivation when using the technology, as
explained by Ducoffe (Ducoffe, 1995) and Smock (Smock, Ellison,
Lampe, & Wohn, 2011)
Chang and Thorson (Chang & Thorson, 2004) and Ha et al. (2015)
used the Uses and Gratification Theory (U&G) to understand the grat-
ification model and the constructs used in different projects.
Some of the original constructs of the model, such as CONS and SI,
had to be discarded from the final model because they did not reach
the minimum limit for validity in the analysis using PLS-SEM.
The problems that could be caused by the order of some of the
questions was corrected by changing these questions at random.
The collected questionnaires were analyzed with descriptive sta-
tistical methods using PLS-SEM. PSL-SEM is a multivariate analysis
technique which has become popular with researchers in recent
years (Hair, Ringle & Sarstedt, 2011).
3.4. Pros and cons of this type of app
Runnin’City allows users to discover over 100 cities around the
world while running or walking and guides the users through the
main points of interest of a city, thanks to turn by turn, vocal GPS
instructions and reads a 30 s description of the points of interest
when you run past (Soares, 2019).
Among the advantages and disadvantages of running apps and,
specifically, of the app analyzed are the following. This pro and cons
are showed in table 3.
4. Analysis and results
PLS-SEM method was used to analyze the model proposed for this
study. PLS is a method which is recommended for the study of the
latent-constructs models formed by composites (Rigdon, 2016). It is
mostly used to predict and explain relatively new phenomena (Chin
& Newsted, 1999) and therefore can be seen to be applicable for the
study of mobile tourism applications.
The PLS-SEM are analyzed in two stages (Chin, 1998; Cepeda-
Carrion, Cegarra-Navarro, & Cillo, 2019). First, the reliability and
validity of the measurement model must be confirmed and then a
non-iterative application of ordinary least squares algorithm was
made to obtain the loadings for the latent and the manifest variables
of the relationships in the structural model. Second, bootstrapping
Table 2
Sample Distribution.
Sample n = 261
Items (characteristics) Frequency Percentage (%)
Gender
Male 118 45.21
Female 131 50.19
Others 12 4.60
Age
18−30years old 169 64.75
31−45 years old 67 25.67
46−55 years old 17 6.52
56−65 years old 4 1.53
>65 years old 4 1.53
Highest education
Diploma/advance diploma 10 3.83
Bachelor degree/profession qualification 51 19.54
University Students 40 15.33
Graduate University 160 61.30
Residence
Town > 100.000 inhabitants 131 50.18
Town of 20.000 to 100.000 100.000 habitantes 72 27.59
Town of 5.000 to 20.000 habitantes 40 15.33
Town < 5.000 inhabitants 18 6.90
Job
Student 158 60.54
Retired 4 1.53
Unemployed 7 3.45
Salaried worker 67 25.67
Self-employed) 23 8.81
Running frequency
I don’t run 4 1.53
1 or 2 days/week 194 74.33
3 to 5 days/week 42 16.09
Almost/Every day 21 8.05
Tourism frequency
Never 7 2.68
1 to 3 times/year 177 67.82
4 to 6 times/year 53 20.30
> 6 times/year 24 9.20
Country
Costa Rica 26 9.96
Spain 217 83.14
Others 18 6.90
P. Palos-Sanchez, J.R. Saura, F. Velicia-Martin et al. European research on management and business economics 27 (2021) 100149
5

procedure was applied to evaluate the statistical significance of the
relationships of structural model (Chin, 1998).
4.1. Measurement model analysis
Reflective items were used in this model which were interchange-
able equivalent manifestations of the same construct (Mackenzie and
Podsakoff, 2003).
First, the individual reliability of the indicator loads (λ) was calcu-
lated. The minimum acceptance level as part of a construct was
λ> = 0.707 (Carmines & Zeller, 1979). However, other authors consid-
ered this level to be excessively rigid for the initial stages of an inves-
tigation of a relatively unstudied phenomenon. These authors
consider values of 0.5 or 0.6 as acceptable (Barclay et al., 1995)
Barclay, 1995; Chin, 1998). The commonality of a variable (λ2) is the
part of the variance that can be explained by the factor or construct
itself (Bollen, 1989). All the values found in this study exceeded the
minimum load levels (Hair, Sarstedt, Hopkins & Kuelwieser, 2014).
Cronbach’s alpha and the composite reliability (CR) were used to
find the internal consistency of a construct (see table 4) as explained
in the research (G€otz, Liehr-Gobbers, & Krafft, 2010). The internal
consistency shows to what extent the items are measuring the same
latent variable. Cronbach’s alpha gives a value for the internal consis-
tency for each construct and has values between 0 and 1, where a
higher value has more internal consistency. The minimum accep-
tance limit for internal consistency of the construct is usually set
between 0.6 and 0.7 (Hair, Babin, Money & Samouel, 2005).
All the constructs (see table 3) also satisfy the requirements for
the Dijkstra-Henseler’s indicator (rA) (rho_A), as they are all above
0.7 (Dijkstra & Henseler, 2015).
AVE (Average Variance Extracted) shows the variance of a con-
struct due to the measurement error existing in the indicators (For-
nell & Larcker, 1981). A recommendation is given that AVE is >= 0.50,
which means that more than 50% of the variance of the construct is
due to its indicators. The values for Cronbach's alpha and Composite
Reliability and AVE are presented in table 5.
Discriminant validity shows how much one construct is different
to others. A high value shows weak correlation between constructs.
The proposed model was analyzed in two stages for this measure-
ment (Hulland, 1999). Firstly, the measurement model was analyzed
and afterwards the structural model.
Table 3
Pro-and cons of Runnin�City.
Runnin’City app
Pro Cons
This option is totally free, unless the user decides to install the paid version
of the apps because they have some extra functionality that might interest
the user.
These apps are usually quite simple to use and, moreover, when using the mobile
phone's GPS, they are usually more precise when calculating the route, allowing
users to listen to music and share the results on social networks.
It is compatible with the operating systems: Ios, Android and others.
It requires going out to run with the smartphone, so the user must have a place to
take it, that does not bother him and that is safe for the device.
There are bracelets in which the user can easily hook the phone and that allow him
to listen to music with headphones.
Users must be careful with possible falls of the smartphone and distractions from
the runner. In this case, the screen or device may break.
Another problem is the sweat of the runner. In this case, it is important to protect
the smartphone against the entry of sweat. In that case, the terminal could also
be damaged.
Another option is to use a smartwatch or a band electronic bracelet.
Wearables and gadgets
Pro Cons
The best thing about this option is that it allows you to leave your mobile phone
at home and go running with a device that is specifically designed for that.
Many of these devices also have other functionalities such as sleep monitoring
or receiving notifications from your smartphone.
The problem with this option is that you have to buy an additional device, with the
expense that this entails.
Another disadvantage is that not all wearables allow all the options that the smart-
phone does have (not all have GPS, not all allow you to listen to music, etc.. . .).
In addition, wearables require downloading an application to view the results, so
the user must ensure that the wearable purchased is compatible with your
smartphone.
Table 4
Cronbach alpha, rho_A, Composite Reliability and AVE.
Variable Cronbach Alpha rho_A Composite
Reliability
AVE
Entertainment 0.878 0.882 0.918 0.74
Tourism Experience 0.765 0.825 0.892 0.806
Information 0.816 0.817 0.891 0.732
Mobile Convenience 0.855 0.87 0.932 0.873
Satisfaction 0.928 0.929 0.949 0.823
Self-Expression 0.892 0.905 0.933 0.822
Visit Intention for
the City
0.765 0.823 0.893 0.806
Table 5
Correlation and AVE.
ENT TOUE INFORMATION MOC SAT SE VIC
Entertainment 0.86
Tourism Experience 0.733 0.898
Information 0.674 0.543 0.856
Mobile Convenience 0.497 0.499 0.548 0.934
Satisfaction 0.761 0.707 0.761 0.606 0.907
Self-Expression 0.718 0.573 0.621 0.36 0.616 0.907
Visit intention for the City 0.739 0.687 0.586 0.534 0.775 0.58 0.898
P. Palos-Sanchez, J.R. Saura, F. Velicia-Martin et al. European research on management and business economics 27 (2021) 100149
6

The measurement model evaluation checked that the square root
of the AVE was greater than the ratio between the construct and the
other model constructs (Fornell and Larcker, 1981).
A construct should share more variance with its measure-
ments or indicators than with other constructs in a model
(Henseler, Ringle & Sinkovics, 2009). Therefore, the square root of
the AVE was calculated to make sure that it was greater than the
correlation between the construct and the other constructs of the
model. Table 3 shows that this condition was fulfilled for all of
the latent variables in the model.
The constructs therefore share more variance with the indicators
than with other constructs of the investigated model (Henseler et al.,
2009) and have discriminant validity based on this first analysis.
Henseler, Hubona and Ray (2016) carried out simulation studies
to show that a lack of discriminant validity is best detected by the
heterotrait-monotrait ratio (HTMT). The heterotrait-monotrait ratio
(HTMT) gives a value to the average of the heterotrait heteromethod
correlation and the average of the monotrait-heteromethod correla-
tion.
Heterotrait correlations should be smaller than monotrait correla-
tions in a well-adjusted model. For this to be true, the HTMT ratio
should be below 0.9 (Henseler et al., 2016). Table 6 shows that this
condition is fulfilled in the proposed model and therefore the con-
structs have discriminant validity.
4.2. Structural model analysis
Estimations for the relationships of the structural model are given
by the path coefficients (standardized regression coefficients), which
are the hypothesized relationships between constructs. The magni-
tude, algebraic sign, and statistical significance of these were all ana-
lyzed.
Standardized path coefficients (b) explain the size of the contribu-
tion of the predictor variables to the variance of the endogenous vari-
ables. The variance of an endogenous variable can be explained by a
latent variable by using the value found frommultiplying the correla-
tion coefficients of the two variables (Falk & Miller, 1992).
Analyzing these coefficients and their statistical significance
allows the hypotheses of the proposed research to be studied.
Chin (1998)) considered a value of b to be acceptable between 0.2
and 0.3, although a higher value is more favorable.
The bootstrapping statistical technique was used to find if a con-
struct is supported or not. It is a nonparametric re-sampling tech-
nique which is repeated after randomly replacing the original sample
to create a number of samples for the bootstrap test (Hair et al.,
2011). Table 5 shows the results of this test for the values of b (Stan-
dard Path Coefficient), T-Statistics and P-Values. The hypotheses
were found to be supported or not from these results.
The path coefficients calculation must be accompanied by a
measurement of the statistical significance and fit of the hypothe-
ses. The fit is measured by the statistical t-test after applying
bootstrap re-sampling for 5000 subsamples. The Student's t-dis-
tribution was used with one tail, as the model gives the direction
of the relationship.
The results (see table 7) show that the main predictors of Visit
Intention for the City are: Satisfaction (b=0.579; t = 9.940) and Tour-
ism Experience (b=0.278; t = 4.648). The predictors of Satisfaction
were found to be: Entertainment (b=0.409; t = 7.787), Information
(b=0.378; t = 6.811) and Mobile Convenience (b=0.196; t = 3.626).
The predictors for Tourism Experience were found to be: Entertain-
ment (b=0.632; t = 11.287) and Mobile Convenience (b=0.172;
t = 3.071). The relationship of Information ! Tourism Experience
wasn’t supported.
A multi-group analysis (Henseler, 2010) was carried out in order
to test the potential moderating influence of gender and the fre-
quency of running on the relationships in the research model. The
sample was divided into two separate groups for men and women
and then sub-divided into high-frequency runners (3−5 days per
week or every day) and low-frequency runners (1−2 days per week).
The measurement invariance of composite models (MICOM) was
then analyzed (Henseler, Ringle & Sarstedt, 2016). This measurement
checks that the effects of gender and the frequency of running is
restricted to the path coefficients of the structural model and not to
the parameters of the measurement model (Felipe, Rold�an & Leal-
Rodríguez, 2017).
Tables 8a and 8b show that the measurement invariance for gen-
der is positive for the Entertainment, Information, Mobile Conve-
nience, and Self-Expression variables. With frequency of running the
only positive result was for Tourism Experience.
Table 9 shows the results of a multi-group analysis with PLS-MGA
using permutations (). The moderation produced by gender effect and
the frequency of running can be seen. Moderate relationships are
shaded gray and indicate that the influence of Mobile Convenience on
Satisfaction is moderated by gender. This means that there are signifi-
cant differences in the satisfaction felt by men and women for the Con-
venience of using the RunninCity application.
Table 7
Path coefficients (b) and statistical significance.
Hypothesis b (Standard Path Coeff.) T Statistic P Value CI Supported f2
1 SE!MOC 0.360 5.728 0.000 (0.254,0.461) Yes *** 0,149
2 SE! INF 0.621 15.372 0.000 (0,549,0,685) Yes *** 0,626
3 SE! ENT 0.718 21.979 0.000 (0,662,0,773) Yes *** 1065
4 MOC! SAT 0.196 3.626 0.000 (0,113,0,288) Yes *** 0,091
5 MOC!TOUE 0.172 3.071 0.002 (0,083,0,266) Yes ** 0,045
6 INF! SAT 0.378 6.811 0.000 (0,283,0,470) Yes *** 0,246
7 INF!TOUE 0.023 0.331 0.741 (�0,089,0,140 No 0,001
8 ENT! SAT 0.409 7.787 0.000 (0,319,0,494) Yes *** 0,309
9 ENT!TOUE 0.632 11.287 0.000 (0,533,0,719) Yes *** 0,476
10 SAT! VIC 0.579 9.940 0.000 (0,477,0,671) Yes *** 0,466
11 TOUE! VIC 0.278 4.648 0.000 (0,184,0,382) Yes *** 0,108
Notes: For n = 500 subsamples based on distribution t (499) of one-tagged Student: * p <0.05 (t (0.05, 499) = 1.64791345);.
** P <0.01 (t (0.01, 499) = 2.333843952); *** P <0.001 (t (0.001; 499) = 3.106644601).
Table 6
Heterotrait-Monotrait Ratio (HTMT).
ENT TOUE INF MOC SAT SE VIC
Entertainment
Tourism Experience 0.883
Information 0.797 0.675
Mobile Convenience 0.574 0.593 0.654
Satisfaction 0.845 0.822 0.874 0.677
Self-Expression 0.802 0.686 0.722 0.407 0.667
Visit intention to the City 0.892 0.855 0.718 0.64 0.898 0.681
P. Palos-Sanchez, J.R. Saura, F. Velicia-Martin et al. European research on management and business economics 27 (2021) 100149
7
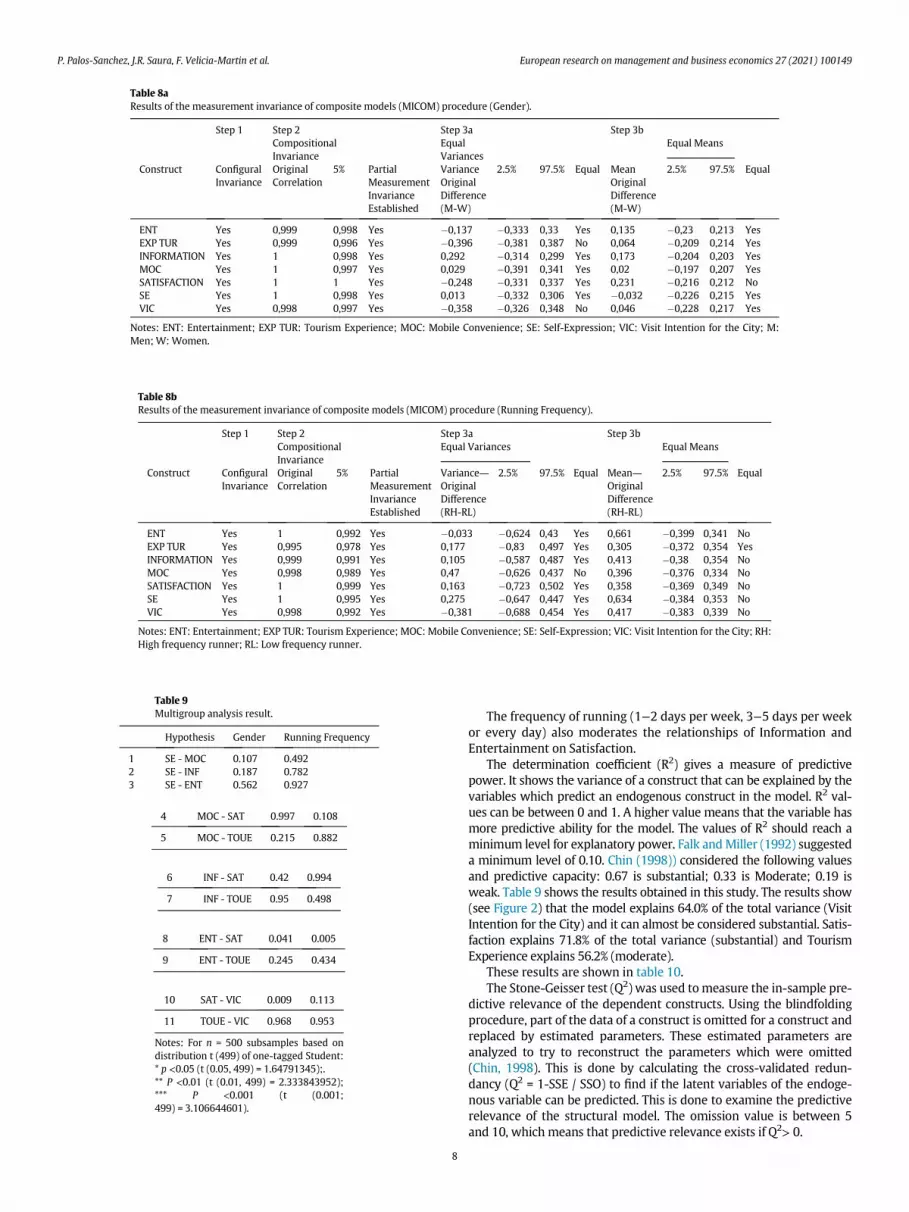
The frequency of running (1−2 days per week, 3−5 days per week
or every day) also moderates the relationships of Information and
Entertainment on Satisfaction.
The determination coefficient (R2) gives a measure of predictive
power. It shows the variance of a construct that can be explained by the
variables which predict an endogenous construct in the model. R2 val-
ues can be between 0 and 1. A higher value means that the variable has
more predictive ability for the model. The values of R2 should reach a
minimum level for explanatory power. Falk andMiller (1992) suggested
a minimum level of 0.10. Chin (1998)) considered the following values
and predictive capacity: 0.67 is substantial; 0.33 is Moderate; 0.19 is
weak. Table 9 shows the results obtained in this study. The results show
(see Figure 2) that the model explains 64.0% of the total variance (Visit
Intention for the City) and it can almost be considered substantial. Satis-
faction explains 71.8% of the total variance (substantial) and Tourism
Experience explains 56.2% (moderate).
These results are shown in table 10.
The Stone-Geisser test (Q2) was used tomeasure the in-sample pre-
dictive relevance of the dependent constructs. Using the blindfolding
procedure, part of the data of a construct is omitted for a construct and
replaced by estimated parameters. These estimated parameters are
analyzed to try to reconstruct the parameters which were omitted
(Chin, 1998). This is done by calculating the cross-validated redun-
dancy (Q2 = 1-SSE / SSO) to find if the latent variables of the endoge-
nous variable can be predicted. This is done to examine the predictive
relevance of the structural model. The omission value is between 5
and 10, which means that predictive relevance exists if Q2> 0.
Table 8a
Results of the measurement invariance of composite models (MICOM) procedure (Gender).
Step 1 Step 2 Step 3a Step 3b
Compositional
Invariance
Equal
Variances
Equal Means
Construct Configural
Invariance
Original
Correlation
5% Partial
Measurement
Invariance
Established
Variance
Original
Difference
(M-W)
2.5% 97.5% Equal Mean
Original
Difference
(M-W)
2.5% 97.5% Equal
ENT Yes 0,999 0,998 Yes �0,137 �0,333 0,33 Yes 0,135 �0,23 0,213 Yes
EXP TUR Yes 0,999 0,996 Yes �0,396 �0,381 0,387 No 0,064 �0,209 0,214 Yes
INFORMATION Yes 1 0,998 Yes 0,292 �0,314 0,299 Yes 0,173 �0,204 0,203 Yes
MOC Yes 1 0,997 Yes 0,029 �0,391 0,341 Yes 0,02 �0,197 0,207 Yes
SATISFACTION Yes 1 1 Yes �0,248 �0,331 0,337 Yes 0,231 �0,216 0,212 No
SE Yes 1 0,998 Yes 0,013 �0,332 0,306 Yes �0,032 �0,226 0,215 Yes
VIC Yes 0,998 0,997 Yes �0,358 �0,326 0,348 No 0,046 �0,228 0,217 Yes
Notes: ENT: Entertainment; EXP TUR: Tourism Experience; MOC: Mobile Convenience; SE: Self-Expression; VIC: Visit Intention for the City; M:
Men; W: Women.
Table 8b
Results of the measurement invariance of composite models (MICOM) procedure (Running Frequency).
Step 1 Step 2 Step 3a Step 3b
Compositional
Invariance
Equal Variances Equal Means
Construct Configural
Invariance
Original
Correlation
5% Partial
Measurement
Invariance
Established
Variance—
Original
Difference
(RH-RL)
2.5% 97.5% Equal Mean—
Original
Difference
(RH-RL)
2.5% 97.5% Equal
ENT Yes 1 0,992 Yes �0,033 �0,624 0,43 Yes 0,661 �0,399 0,341 No
EXP TUR Yes 0,995 0,978 Yes 0,177 �0,83 0,497 Yes 0,305 �0,372 0,354 Yes
INFORMATION Yes 0,999 0,991 Yes 0,105 �0,587 0,487 Yes 0,413 �0,38 0,354 No
MOC Yes 0,998 0,989 Yes 0,47 �0,626 0,437 No 0,396 �0,376 0,334 No
SATISFACTION Yes 1 0,999 Yes 0,163 �0,723 0,502 Yes 0,358 �0,369 0,349 No
SE Yes 1 0,995 Yes 0,275 �0,647 0,447 Yes 0,634 �0,384 0,353 No
VIC Yes 0,998 0,992 Yes �0,381 �0,688 0,454 Yes 0,417 �0,383 0,339 No
Notes: ENT: Entertainment; EXP TUR: Tourism Experience; MOC: Mobile Convenience; SE: Self-Expression; VIC: Visit Intention for the City; RH:
High frequency runner; RL: Low frequency runner.
Table 9
Multigroup analysis result.
Hypothesis Gender Running Frequency
1 SE - MOC 0.107 0.492
2 SE - INF 0.187 0.782
3 SE - ENT 0.562 0.927
4 MOC - SAT 0.997 0.108
5 MOC - TOUE 0.215 0.882
6 INF - SAT 0.42 0.994
7 INF - TOUE 0.95 0.498
8 ENT - SAT 0.041 0.005
9 ENT - TOUE 0.245 0.434
10 SAT - VIC 0.009 0.113
11 TOUE - VIC 0.968 0.953
Notes: For n = 500 subsamples based on
distribution t (499) of one-tagged Student:
* p <0.05 (t (0.05, 499) = 1.64791345);.
** P <0.01 (t (0.01, 499) = 2.333843952);
*** P <0.001 (t (0.001;
499) = 3.106644601).
P. Palos-Sanchez, J.R. Saura, F. Velicia-Martin et al. European research on management and business economics 27 (2021) 100149
8

The values obtained (see table 9) were less than 1 in all the cases
tested in this study, Visit Intention for the City (0.486), Satisfaction
(0.558), Tourism Experience (0.422), Entertainment (0.361), Informa-
tion (0.268) and Mobile Convenience (0.107). This means that the
structural model has predictive relevance.
5. Discussion
The results of this study show that the proposed extension of the
Uses and Gratification Theory (U&G) model is applicable for the
acceptance of innovative applications combining tourism and sports.
The theoretical model was extended with the following constructs,
Tourism Experience and Mobile Convenience. The original construct
Convenience (CON) was varied to measure how convenient the user
feels when using the mobile tourism application. Other constructs
were used in the questionnaire but not in the model, such as Social
Influence (SI), which is the influence of other users on the content
which a user shared and the gratification felt from this influence.
However, this construct was discarded because it did not reach the
minimum value thresholds in the validation stage of the measure-
ment model in the PLS-SEM analysis. Self-Expression (SE) explains
the freedom that users feel they have to express opinions about their
experiences with the application. It was included in the hypotheses
as a construct that indirectly influences Satisfaction, Tourism Experi-
ence and Visit Intention for the City. It was also seen to influence
Entertainment, Information and Mobile Convenience, and therefore
adds another novel construct to the proposed model in this study
which changes the original Uses and Gratification Theory (U&G)
model with these three relationships. The Uses and Gratification The-
ory (U&G) model has been significantly changed by eliminating the
Social Influence construct, extending Convenience to aspects exclu-
sively associated with Mobile Applications and indirectly relating
Self-Expression to Satisfaction.
The initial structural analysis supports most of hypotheses that
were analyzed with the b of each construct. H1 is supported with a
99.9% confidence level, which means that Self-Expression also influ-
ences Mobile Convenience (b=0.360; t = 5.728). This means that users
feel that they receive the information they want from this application
with little effort and without delay.
H2 (b=0.621; t = 15.372) was also supported and had a 99.9% con-
fidence level. Users of the Runnin'City application share information
about positive and negative experiences at a destination which can
help decide which city to visit and enjoy the visit once there. The
information published with the application is received faster than
from anywhere else on the Internet. Users share this information
quickly because they want to help other tourists or simply feel the
need to share the information. Therefore, it seems that this applica-
tion is designed for users who value Self-Expression.
However, the relationship with the highest load in the whole
model is H3 in which Self-Expression influences Entertainment
(b=0.718; t = 21.979) with a confidence level of 99.9%. This means
that giving others the opportunity to enjoy visits to cities with
Runnin City, wanting to help others or sharing personal positive
and negative experiences at the places visited with Runnin'City
strongly influences the user Entertainment with the application.
This means that Self-Expression is one of the main variables in
the model because of the relationship it has with Entertainment.
It is really entertaining for users to share their experiences with
other users to help them to decide if a city is worth visiting as a
tourist destination.
The relationship of Mobile Convenience with Satisfaction, H4,
(b=0.196; t = 3.626) has a 99.9% confidence level. It has a lower load
than Entertainment and Information and is therefore the construct
with the lowest influence on Satisfaction.
H5, the relationship of Mobile Convenience with Tourism Experi-
ence is also supported (b=0.172; t = 3.071) with lower values than H9
(Entertainment) and also a lower confidence level.
H6 shows that Information does have an important relationship
with Satisfaction (b=0.378; t = 6.811) with a 99.9% confidence level.
H7 was not confirmed because (b=0.023; t = 0.331) which shows
that Information does not influence Tourism Experience. This result,
despite being negative, confirms that although the user learns a lot
about the city with the Runnin'City application, this does not mean
that the tourists’ enjoyment or the knowledge they gain about places,
art or history in the city necessarily come from the application. It
must therefore be concluded that the main attraction of this tourism
innovation is not the information which the application provides, but
the Entertainment and Mobile Convenience of using it.
Fig. 2. Final structural model. Notes:! Supported,! n.s Not Supported. Effect: *p<0.05; **p<0.01 ***p<0.001.
Table 10
R2 and Q2.
Constructs R Square SSO SSE Q2 (=1-SSE/SSO)
Entertainment 0.516 1036,00 661,528 0.361
Tourism Experience 0.562 518 299,597 0.422
Information 0.385 777 568,761 0.268
Mobile Convenience 0.130 518 462,384 0.107
Satisfaction 0.718 1.036.00 457,685 0.558
Self-Expression − 777 777 −
Visit intention for the City 0.640 518 266,164 0.486
P. Palos-Sanchez, J.R. Saura, F. Velicia-Martin et al. European research on management and business economics 27 (2021) 100149
9

The relationship of Entertainment with Satisfaction (H8) is a sig-
nificant hypothesis (b=0.409, t = 7.787) and is confirmed. The exter-
nal variable Tourism Experience in the Uses and Gratification Theory
(U&G) model is confirmed, as in other studies.
Entertainment had a strong influence on Tourism Experience
(b=0.632; t = 11.287), which confirmed the hypothesis in H9. This
means that the fact that users of Runnin'City find it entertaining or
fun influences the enjoyment they have on their trip and increases
their knowledge about the cities they visit.
This important finding, which has important practical implica-
tions, is supported by the fact that H9 is confirmed with more than
99.9% confidence level and is a relationship which is significant.
H10 is also supported with more than 99.9% confidence level and
demonstrates that Satisfaction is positively related to Visit Intention
for the City (b=0.579; t = 9.940) and with higher values than H3
(Mobile Convenience).
Finally, H11 is confirmed, meaning that Trust has a positive influ-
ence on Visit Influence for the City (b=0.278; t = 4.648). This relation-
ship has 99.9% significance, which means that it is very important
and shows that enjoyment on the trip, or the knowledge gained
about the city by using the application, increased the users’ intention
to know the city better or visit another city using the same applica-
tion.
6. Conclusions
The main theoretical contribution of this work is the incorpo-
ration of the new Tourism Experience construct to the Uses and Grat-
ification Theory (U&G) model for the case of Tourism Innovation. This
work shows that the U&G model is valid and applicable to tourist
innovation with sufficient explanatory capacity, especially when con-
sidering the Satisfaction construct.
It must also be indicated that changes have been made to the Self-
Expression relationships, which influences Satisfaction and Tourism
Experience by means of Entertainment, Information and Mobile Con-
venience. This construct has been removed from the Social Influence
relationship, which means that the application can work perfectly
without social networks. Another implication is the transformation
of the original Convenience construct to Mobile Convenience (MOC).
The results obtained will be very useful for academics and design-
ers of innovative tourism applications to understand the importance
of Self-Expression, Entertainment and Mobile Convenience in Tour-
ism Innovation. The role played by Satisfaction is especially interest-
ing as is that of Tourism Experience, since both variables directly
influence Visit Intention for the City.
The proposed model is interesting for academics because of the
way the model is used to investigate innovation and the chosen
industry. With the evolution of new technologies and their exponen-
tial growth, the tourism sector can expect to see an increase in this
type of applications in the near future. This study explores the inno-
vative gratification model in a novel application and its success could
be reproduced in the future by taking into consideration the results
of this study.
The results obtained in this study also show the important differ-
ence in the way Mobile Convenience influences Satisfaction for men
and women. Men and women feel differently about the usefulness of
the Runnin'City application. Men believe that the application is more
useful than women do. The frequency with which the subject goes
running (1−2 days per week, 3−5 days per week or every day) mod-
erates the relationship of Information and Entertainment with Satis-
faction. The relationship is less relevant as the frequency of running
increases. This means that this application will be enjoyed most by
people who do not run very regularly. The frequency of tourism (1
−3, 4−6 or more than 6 times per year) moderates the relationship of
Satisfaction with Visit Intention for the City. The Visit Intention is
greater for people who only travel a little. This application will be
seen to be most useful by men who don’t travel very often and only
run a few times a week.
References
Ardissono, L., Kuflik, T., & Petrelli, D. (2012). Personalization in cultural heritage: theroad travelled and the one ahead. User modeling and user-adapted. int, 22(1−2),73–99.
Bankole, F. O., Bankole, O. O., & Brown, I. (2011). Mobile banking adoption in Nigeria..The Electronic Journal of Information Systems in Developing Countries, 47.
Barclay, D., Higgins, C., & Thompson, R. (1995). The Partial Least Squares (PLS) a roachto causal modelling: Personal computer adoption and use as an illustration. Tech-nology Studies, Special Issue on Research Methodology, 285–309.
Bilgihan, A., Barreda, A., Okumus, F., & Nusair, K. (2016). Consumer perception ofknowledge-sharing in travel-related online social networks. Tourism Management,52, 287–296.
Bollen, K. A. (1989). Structural Equations with Latent Variables. New York: Willey.Brooker, E., & Joppe, M. (2014). Developing a tourism innovation typology: Leveraging
liminal insights. Journal of Travel Research, 53(4), 500–508.Carmines, E. G., & Zeller, R. A. (1979). Reliability and Validity Assessment. Beverly Hills,
CA: Sage.Cepeda-Carrion, G., Cegarra-Navarro, J. G., & Cillo, V. (2019). Tips to use partial least
squares structural equation modelling (PLS-SEM) in knowledge management. Jour-nal of Knowledge Management.
Chang, Y., & Thorson, E. (2004). Television and web advertising synergies. Journal ofadvertising, 33(2), 75–84.
Chin, W. W., & Newsted, P. R. (1999). Structural equation modeling analysis with smallsamples using partial least squares. Statistical Strategies for Small Sample Research,2, 307–342.
Chin, W. W. (1998). The partial least squares approach to structural equation modeling.[ed.], In G. A. Marcoulides (Ed.), Modern Methods for Business Research [ed.].(pp. 295−336). Mahwah, NJ: Lawrence Erlbaum Associates, Publisher.
Choi, E. K., Fowler, D., Goh, B., & Yuan, J. (2016a). Social media marketing: Applying theuses and gratifications theory in the hotel industry. Journal of Hospitality Marketing
& Management, 25(7), 771–796.Choi, E. K., Fowler, D., Goh, B., & Yuan, J. (2016b). Social media marketing: Applying the
uses and gratifications theory in the hotel industry. Journal of Hospitality Marketing& Management, 25(7), 771–796.
Corrocher, N. (2011). The adoption of Web 2.0 services: An empirical Investigation.Technological Forecasting and Social Change, 78(4), 547–558.
Dijkstra, T. K., & Henseler, J. (2015). Consistent and asymptotically normal PLS estima-tors for linear structural equations. Computational Statistics & Data Analysis, 81(1),10–23.
Ducoffe, R. H. (1995). How consumers assess the value of advertising. Journal of CurrentIssues & Research in Advertising, 17(1), 1–18.
Falk, R. F., & Miller, N. B. (1992). A Primer for Soft Modeling. Akron, OH: University ofAkron Press.
Felipe, C., Rold�an, J., & Leal-Rodríguez, A. (2017). Impact of organizational culture val-ues on organizational agility. Sustainability, 9(12), 2354.
Fornell, C., & Larcker, D. F. (1981). Evaluating structural equation models with unob-servable variables and measurement error. Journal of marketing research, 18(1),39–50.
García-Magari~no, I., Palacios-Navarro, G., & Lacuesta, R. (2017). TABSAOND: A tech-nique for developing agent-based simulation apps and online tools with nondeter-ministic decisions. Simulation Modelling Practice and Theory, 77, 84–107.doi:10.1016/j.simpat.2017.05.006.
Garsous, G., Corderi, D., Velasco, M., & Colombo, A. (2017). Tax incentives and job crea-tion in the tourism sector of Brazil’s SUDENE area.World Development, 96, 87–101.
G€otz, O., Liehr-Gobbers, K., & Krafft, M. (2010). Evaluation of structural equation mod-els using the partial least squares (PLS) approach. Handbook of partial least squares(pp. 691−711). Berlin, Heidelberg: Springer.
Gretzel, U., Sigala, M., Xiang, Z., & Koo, Ch. (2015). Smart tourism: Foundations anddevelopments. Electronic Markets, 25(3), 179–188.
Ha, Y. W., Kim, J., Libaque-Saenz, C. F., Chang, Y., & Park, M. C. (2015). Use and gratifica-tions of mobile SNSs: Facebook and KakaoTalk in Korea. Telematics and Informatics,32(3), 425–438.
Hair, F., Sarstedt, J., Hopkins, L., & Kuelwieser, V. (2014). Partial least squares structuralequation modeling (PLS-SEM) An emerging tool in business research. EuropeanBusiness Review, 26(2), 106–121.
Hair, J. F., Ringle, C. M., & Sarstedt, M. (2011). PLS-SEM: Indeed a silver bullet. Journal ofMarketing Theory and Practice, 19(2), 139–151.
Hair, J., Babin, B., Money, A., & Samouel, P. (2005). Fundamentos de m�etodos de pesquisa
em administrac~ao. Porto Alegre Bookman.Hall, C. M., & G€ossling, S. (Eds.). (2013). Sustainable Culinary Systems: Local Foods, Inno-
vation, and Tourism & Hospitality. Routledge.Hardy, A., Hyslop, S., Booth, K., Robards, B., Aryal, J., Gretzel, U., & Eccleston, R. (2017).
Tracking tourists’ travel with smartphone-based GPS technology: a methodologi-cal discussion. Information Technology & Tourism, 17(3), 255–274.
Henseler, J., Hubona, G., & Ray, P. A. (2016a). Using PLS path modeling in new technol-ogy research: Updated guidelines. Industrial Management & Data Systems, 116(1),2–20.
Henseler, J., Ringle, C. M.&, & Sarstedt, M. (2016b). Testingmeasurement invariance of com-posites using partial least squares. International Marketing Review, 33, 405–431.
P. Palos-Sanchez, J.R. Saura, F. Velicia-Martin et al. European research on management and business economics 27 (2021) 100149
10

Henseler, J., Ringle, C. M., & Sinkovics, R. R. (2009). The use of partial least squares pathmodeling in international marketing. Advances in International Marketing, 20(1),277–319.
Hew, J. J., Lee, V. H., Ooi, K. B., &Wei, J. (2015). What catalyses mobile apps usage intention:An empirical analysis. Industrial Management & Data Systems, 115(7), 1269–1291.
Hjalager, A. M. (2010). A review of innovation research in tourism. Tourism Manage-
ment, 31(1), 1–12.Ho, K. K., & See-To, E. W. (2018). The impact of the uses and gratifications of tourist
attraction fan page. Internet Research, 28(3), 587–603.Hoyer, W. D., & MacInnis, D. J. (2001). Consumer behavior. (2nd ed.). Boston, MA:
Houghton Mifflin.Hulland, J. (1999). Use of partial least squares (PLS) in strategic management research:
A review of four recent studies. Strategic Management Journal, 20, 195–204.Katz, E., Blumler, J. G., & Gurevitch, M. (1973). Uses and gratifications research. The Pub-
lic Opinion Quarterly, 37(4), 509–523.Leong, L. Y., Ooi, K. B., Chong, A. Y. L., & Lin, B. (2013). Modeling the stimulators of the
behavioral intention to use mobile entertainment: Does gender really matter?Computers in Human Behavior, 29(5), 2109–2121.
Li, H., Liu, Y., Xu, X., Heikkil€a, J., & Van Der Heijden, H. (2015). Modeling hedonic is con-tinuance through the uses and gratifications theory: An empirical study in onlinegames. Computers in Human Behavior, 48, 261–272.
Liang, S., Schuckert, M., Law, R., & Masiero, L. (2017). The relevance of mobile tourismand information technology: an analysis of recent trends and future researchdirections. Journal of Travel & Tourism Marketing, 34(6), 732–748.
Malik, A., Dhir, A., & Nieminen, M. (2016). Uses and gratifications of digital photo shar-ing on Facebook. Telematics and Informatics, 33(1), 129–138.
Matos, N., Mendes, J., & Valle, P. (2012). Revisiting the destination image constructthrough a conceptual model. Dos Algarves, 21, 101–117.
Moscardo, G. (2008). Sustainable tourism innovation: Challenging basic assumptions.Tourism and Hospitality Research, 8(1), 4–13.
Okazaki, S., Díaz-Martín, A. M., Rozano, M., & Men�endez-Benito, H. D. (2015). UsingTwitter to engage with customers: a data mining approach. Internet Research.
Paget, E., Dimanche, F., & Mounet, J. P. (2010). A tourism innovation case: An actor-net-work approach. Annals of Tourism Research, 37(3), 828–847.
Palos-Sanchez, P. R., Hernandez-Mogollon, J. M., & Campon-Cerro, A. M. (2017). Thebehavioral response to location based services: An examination of the influence ofsocial and environmental benefits, and privacy. Sustainability, 9(11), 1988.doi:10.3390/su9111988.
Palos-Sanchez, P. R., Saura, J. R., & Correia, M. B. (2020). Do Tourism Applications’ Quality
and User Experience Influence its Acceptance by Tourists? Review of Managerial Sci-ence. Springer. doi:10.1007/s11846-020-00396-y.
Palos-Sanchez, P., Saura, J. R., & Correia, M. B. (2021). Do tourism applications’ qualityand user experience influence its acceptance by tourists?. Review of ManagerialScience, 1-37.x Palos-Sanchez, P., Saura, J. R., & Correia, M. B. (2021). Do tourism
applications’ quality and user experience influence its acceptance by tourists?.Review of Managerial Science, 1-37.
Pantelidis, I. S. (2010). Electronic meal experience: A content analysis of online restau-rant comments. Cornell Hospitality Quarterly, 51(4), 483–491.
Raacke, J., & Bonds-Raacke, J. (2008). MySpace and Facebook: Applying the uses andgratifications theory to exploring friend-networking sites. Cyberpsychology &
behavior, 11(2), 169–174.Rauschnabel, P. A., Rossmann, A., & Dieck, tom. (2017). An adoption framework for
mobile augmented reality games: The case of Pok�emon Go. Computers in HumanBehavior, 76, 276–286.
Reyes-Menendez, A., Saura, J. R., & Stephen, B. T. (2020). Exploring key indicators of socialidentity in the #MeToo Era: Using discourse analysis in UGC. International Journal ofInformationManagement, 54, 102129. doi:10.1016/j.ijinfomgt.2020.102129.
Rodríguez, I., Williams, A. M., & Hall, C. M. (2014). Tourism innovation policy: Imple-mentation and outcomes. Annals of Tourism Research, 49(1), 76–93.
Saura, J. R. (2020). Using data sciences in digital marketing: Framework, methods, andperformance metrics. Journal of Innovation and Knowledge, 1(2020). doi:10.1016/j.jik.2020.08.001.
Shorfuzzaman, M., & Alhussein, M. (2016). Modeling Learners’ readiness to adoptmobile learning: A perspective from a GCC higher education institution. Mobile
Information Systems. doi:10.1155/2016/6982824.Smock, A. D., Ellison, N. B., Lampe, C., & Wohn, D. Y. (2011). Facebook as a toolkit: A
uses and gratification approach to unbundling feature use. Computers in Human
Behavior, 27(6), 2322–2329.Soares, P. S. (2019). New Business Models in the Digital Economy Applied to the Smart
Tourism Sector-the Case of U. Porto�s Digital Museum App.Tajeddini, K., Ratten, V., & Denisa, M. (2017). Female tourism entrepreneurs in Bali,
Indonesia. Journal of Hospitality and Tourism Management, 31(1), 52–58.Thakran, K., & Verma, R. (2013). The emergence of hybrid online distribution channels
in travel, tourism and hospitality. Cornell Hospitality Quarterly, 54(3), 240–247.Tsiotsou, R., & Ratten, V. (2010). Future research directions in tourism marketing. Mar-
keting Intelligence & Planning, 28(4), 533–544.Verma, R., Stock, D., & McCarthy, L. (2012). Customer preferences for online, social
media, and mobile innovations in the hospitality industry. Cornell Hospitality Quar-
terly, 53(3), 183–186.Xiang, Z., & Gretzel, U. (2010). Role of social media in online travel information search.
Tourism management, 31(2), 179–188.Xiang, Z., Magnini, V. P., & Fesenmaier, D. R. (2015). Information technology and con-
sumer behavior in travel and tourism: Insights from travel planning using theinternet. Journal of Retailing and Consumer Services, 22, 244–249.
Zhou, T. (2011). The impact of privacy concern on user adoption of location-based serv-ices. Industrial Management & Data Systems, 111, 212–226.
Zhou, T., Lu, Y., & Wang, B. (2010). Integrating TTF and UTAUT to explain mobile bank-ing user adoption. Computers in Human Behavior, 26(4), 760–767.
P. Palos-Sanchez, J.R. Saura, F. Velicia-Martin et al. European research on management and business economics 27 (2021) 100149
11


