Embed Size (px)
Citation preview
Science of the Total Environment 502 (2015) 526–536
Contents lists available at ScienceDirect
Science of the Total Environment
j ourna l homepage: www.e lsev ie r .com/ locate /sc i totenv
Arsenic removal from drinking water by a household sand filter inVietnam — Effect of filter usage practices on arsenic removal efficiencyand microbiological water quality
Katja Sonja Nitzsche a, ViMai Lan b, PhamThi Kim Trang b, PhamHungViet b,Michael Berg c, Andreas Voegelin c,Britta Planer-Friedrich d, Jan Zahoransky a, Stefanie-Katharina Müller a, James Martin Byrne a,Christian Schröder a,1, Sebastian Behrens a, Andreas Kappler a,⁎a Geomicrobiology, Center for Applied Geosciences, University of Tübingen, Tübingen, Germanyb Center for Environmental Technology and Sustainable Development (CETASD), Hanoi University, Viet Namc Eawag, Swiss Federal Institute of Aquatic Science and Technology, Dübendorf, Switzerlandd Environmental Geochemistry, University of Bayreuth, Bayreuth, Germany
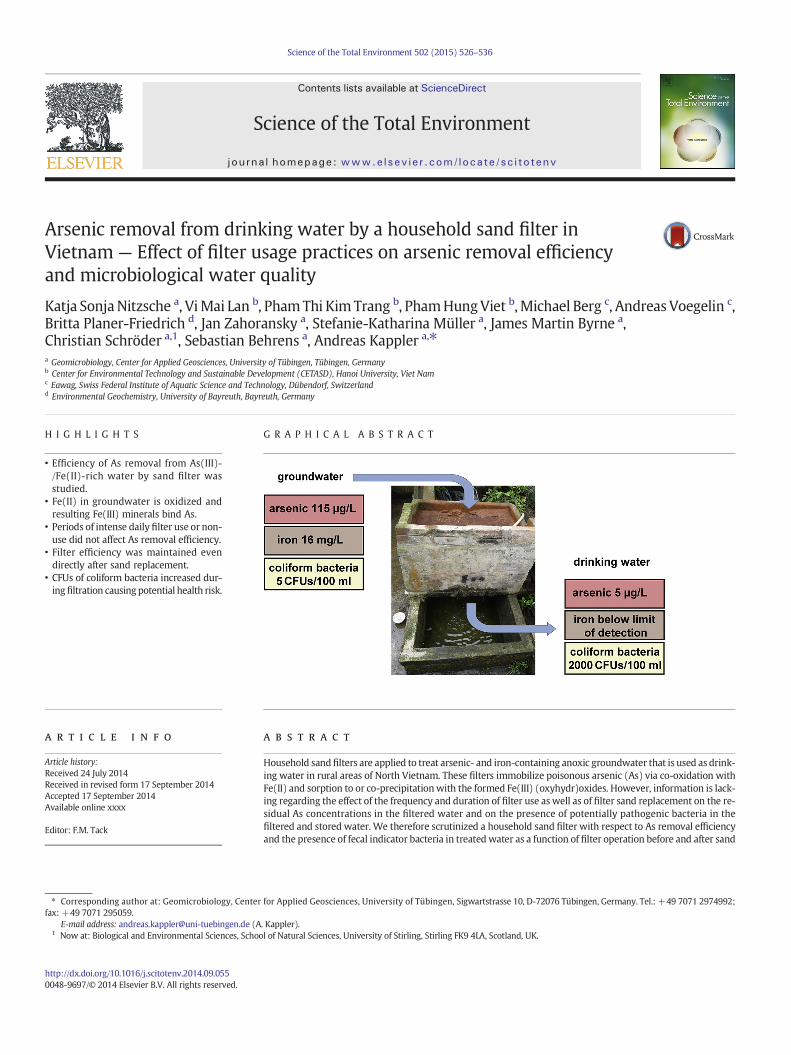
H I G H L I G H T S G R A P H I C A L A B S T R A C T
• Efficiency of As removal from As(III)-/Fe(II)-rich water by sand filter wasstudied.
• Fe(II) in groundwater is oxidized andresulting Fe(III) minerals bind As.
• Periods of intense daily filter use or non-use did not affect As removal efficiency.
• Filter efficiency was maintained evendirectly after sand replacement.
• CFUs of coliform bacteria increased dur-ingfiltration causing potential health risk.
⁎ Corresponding author at: Geomicrobiology, Centerfax: +49 7071 295059.
E-mail address: [email protected] (A1 Now at: Biological and Environmental Sciences, Schoo
http://dx.doi.org/10.1016/j.scitotenv.2014.09.0550048-9697/© 2014 Elsevier B.V. All rights reserved.
a b s t r a c t
a r t i c l e i n f oArticle history:Received 24 July 2014Received in revised form 17 September 2014Accepted 17 September 2014Available online xxxx
Editor: F.M. Tack
Household sandfilters are applied to treat arsenic- and iron-containing anoxic groundwater that is used as drink-ing water in rural areas of North Vietnam. These filters immobilize poisonous arsenic (As) via co-oxidation withFe(II) and sorption to or co-precipitationwith the formed Fe(III) (oxyhydr)oxides. However, information is lack-ing regarding the effect of the frequency and duration of filter use as well as of filter sand replacement on the re-sidual As concentrations in the filtered water and on the presence of potentially pathogenic bacteria in thefiltered and stored water. We therefore scrutinized a household sand filter with respect to As removal efficiencyand the presence of fecal indicator bacteria in treated water as a function of filter operation before and after sand
for Applied Geosciences, University of Tübingen, Sigwartstrasse 10, D-72076 Tübingen, Germany. Tel.: +49 7071 2974992;
. Kappler).l of Natural Sciences, University of Stirling, Stirling FK9 4LA, Scotland, UK.

527K.S. Nitzsche et al. / Science of the Total Environment 502 (2015) 526–536
Keywords:ArsenateArseniteIron mineralsSorptionGroundwaterFecal indicator bacteria
Fig. 1. Example of a household sand filter, commonly usedof two basins stacked on top of each other and covered bygroundwater is pumped from a tubewell onto the upper bas awater storage tank. (D) Schematic cross section of a hoorange/brown iron minerals and black manganese minera
replacement. Quantification of As in the filtered water showed that periods of intense daily use followed by pe-riods of non-use and even sand replacement did not significantly (p b 0.05) affect As removal efficiency. The Asconcentrationwas reducedduringfiltration from115.1±3.4 μg L−1 in the groundwater to 5.3±0.7 μg L−1 in thefilteredwater (95% removal). The first flush ofwater from thefilter contained As concentrations below the drink-ing water limit and suggests that this water can be used without risk for human health. Colony forming units(CFUs) of coliform bacteria increased during filtration and storage from 5 ± 4 per 100 mL in the groundwaterto 5.1 ± 1.5 × 10³ and 15 ± 1.4 × 10³ per 100 mL in the filtered water and in the water from the storage tank,respectively. After filter sand replacement, CFUs of Escherichia coli of b100 per 100 mL were quantified. Noneof the samples contained CFUs of Enterococcus spp. No critical enrichment of fecal indicator bacteria belongingto E. coli or Enterococcus spp. was observed in the treated drinking water by qPCR targeting the 23S rRNA gene.The results demonstrate the efficient and reliable performance of household sand filters regarding As removal,but indicate a potential risk for human health arising from the enrichment of coliform bacteria during filtrationand from E. coli cells that are introduced by sand replacement.
© 2014 Elsevier B.V. All rights reserved.
1. Introduction
South and South-East Asian countries, including Vietnam, are affect-ed by microbially contaminated surface waters and As-contaminatedgroundwater (Smedley and Kinniburgh, 2002; van Geen et al., 2003).This causes a dilemma for the supply of safe, consumable drinkingwater. Pathogenicmicroorganisms in the drinkingwater can cause diar-rheal diseases or other severe health problems with potentially lethalconsequences (UNICEF and WHO, 2009; WHO, 2011). Continuous con-sumption of drinking water exceeding the World Health Organization(WHO) guideline level of 10 μg L−1 As may lead to chronic health im-pairments such as skin lesions, various forms of skin and internal cancer,peripheral vascular disease, neurological effects, hypertension, and car-diovascular disease (Naujokas et al., 2013; Muehe and Kappler, 2014).
Until themid-1990s, surfacewaters and shallow dug wells were themain sources of drinkingwater for the rural inhabitants of the Red RiverDelta in North Vietnam (Berg et al., 2001). Inadequate sanitary stan-dards frequently resulted in the introduction of fecal bacteria into sur-face water bodies and dug wells. Therefore, the rural drinking watersupply was shifted, in addition to using rainwater, to presumablypathogenic-free groundwater by installing tens of thousands of house-hold tube wells (~10–100 m deep) (Berg et al., 2006). Unfortunately,at that time, quality control of the groundwater according to interna-tional guidelines did not include As. In the mid-2000s, the inhabitantsof the Red River Delta began to show the first symptoms indicative of
in the rural areas of the Red River Dela corrugatedmetal sheet. (B) The uppasin, trickles through the sand and leausehold sandfilter depicting the vertils. The whitish layer at the bottom s
chronic As poisoning (Tobias and Berg, 2011) stemming from As thatis present in the aquifers together with high concentrations of dissolvedFe(II) (Winkel et al., 2011). High amounts of aqueous Fe(II) impair thetaste and color of drinking water (Berg et al., 2006) and therefore, inthe mid-1990s, people in the rural areas of North Vietnam installedhousehold sand filters to remove Fe(II) from groundwater (Fig. 1)(Berg et al., 2006). These simple sand filters are mainly applied for puri-fication of smaller amounts of water for drinking, cooking, andwashingfor individual households and not for purification of larger amounts ofwater, e.g. for irrigation purposes.
During water filtration, dissolved Fe(II) is oxidized to Fe(III)(oxyhydr)oxide precipitates (Voegelin et al., 2014). Later was it foundthat As is simultaneously removed from the contaminated groundwaterby arsenite oxidation and either sorption to or co-precipitationwith thenewly formed Fe(III) phases (Berg et al., 2006). This study showed thatover 90% of the investigated 43 sand filters reduced As concentrations tolevels below the previous national limit of 50 μg L−1 and 40% of the fil-ters to levels below theWHO guideline value of 10 μg L−1. Additionally,these authors quantified As concentrations in the outflowwater of foursand filters in 3-min intervals for 10 min and observed no variations ofAs concentrations between the different time points. The efficiency ofthe sand filters was shown to depend on the Fe:As ratio in the ground-water, which should be≥50 for As removal to ensure a reduction of dis-solved As to concentrations below 50 μg L−1. Since this condition ismostly fulfilled in As-contaminated groundwaters in North Vietnam
ta, North Vietnam, to reduce As and Fe concentrations in drinkingwater. (A) Filters consister basin is filledwith locally available sand (e.g., from the river banks of the Red River) andves through holes at the bottom. (C) Thewater is collected in the lower basin,which servescal profile of the sandmaterial, which is differently colored according to the precipitation ofhows the original color of the sand that was used.

528 K.S. Nitzsche et al. / Science of the Total Environment 502 (2015) 526–536
(Berg et al., 2008), these sand filters are a widely used water treatmentmethod, in comparison e.g. to Bangladesh, where this criteria is oftennot fulfilled (Hug et al., 2008). Sand filters are therefore the preferredtreatment method in rural areas in North Vietnam in comparison tomembrane-based technologies, photochemical/photocatalytical oxida-tion, and application of ion-exchangers, adsorbents, and coagulant-flocculants (Berg et al., 2006; Mondal et al., 2013). The advantages ofsand filters are that they can be built from easily accessible materialsby the affected communities, their operation procedures are simple, in-stallation and operation costs are low, and an amount of groundwatersufficient for one household can be treated within just a few minutes(Tobias and Berg, 2011). Potential disadvantages of such filters are clog-ging over time and the formation of preferential flow paths within thefilter, whichmay lower the contact time of water with the sandmateri-al, the lack of quality control and the lack of incentives that lead tochanges in filter usage behavior.
Although household sand filters in North Vietnam have been shownto be an effective tool for mitigating As exposure, the efficiency, i.e. theability of the filter to remove As to concentrations b10 μg L−1 has notbeen investigated systematically with respect to varying filter usagepractices. Potential changes in As removal efficiency have not been ex-amined to date with respect to intermittent filter use or differentusage durations, or after several days of not operating the filter. Varia-tions in As removal efficiencymight occur after several hours/days of fil-ter disuse. Waterlogging and the presence of organics in the filter couldstimulate Fe(III)-reducing bacteria and the reductive dissolution of theAs-loaded Fe-minerals in the sand filter (McArthur et al., 2001; Islamet al., 2004; Weber et al., 2009). Additionally, As(V)-reducing bacteriacould reduce As(V) to As(III) (Zobrist et al., 2000; Tufano et al., 2008).Arsenite is expected to sorb to a lesser extent to Fe(III) (oxyhydr)oxidesthan arsenate at low As concentrations and at pH values of ≤7 (Dixitand Hering, 2003; Stachowicz et al., 2008; Huang et al., 2011) andhence could be released into the water. Furthermore, the effects ofsand replacement on As removal are not known; i.e., whether an equallyeffective As removal occurs immediately after sand exchange. Filtersand replacement could reduce the As removal efficiency, because thenew sand does not initially contain sufficient Fe(III) (oxyhydr)oxidesand such minerals have yet to be formed on the new sand. Fe(III)(oxyhydr)oxide precipitates, however, are essential for a fast heteroge-neous Fe(II) oxidation, which is suggested to be the prominent Fe(II)oxidation and Fe(III) precipitation mechanism in such sand filter sys-tems (van Beek et al., 2012; Voegelin et al., 2014), leading to efficientsorption and co-precipitation of the As. In addition to insufficient As re-moval in the presence of fresh sand, the introduction ofmicroorganismsfrom the sand into the water as well as the presence and growth ofharmful microorganisms in the open water storage tank after filtrationmay pose a risk for the health of the consumers.
The main goal of the present study was therefore to determinewhether prolonged or discontinuous use of a sand filter as well assand replacement influences the efficiency of As removal from thewater. To this end, we quantified Fe and As concentrations in the inflowand outflow water during different filter operation scenarios. We alsoquantified fecal indicator bacteria in the groundwater, in the filteredwater, and in the water storage tank. The overall aim of this study wasto gather critical knowledge on how filter operation affects filter perfor-mance parameters with respect to As removal and pathogen load.
2. Material and methods
2.1. Sampling site
The study was conducted with a representative household sandfilter (Fig. 1) in the rural village of Van Phuc, 10 km Southeast ofHanoi City, Vietnam (20°55′08″ N, 105°54′08″ E). In this area, the aqui-fer groundwater is contaminated by As (average 121 μg L−1 and up to340 μg L−1) (Berg et al., 2008) and in most cases the groundwater
contains at least 50 times more Fe than As (concentration ratio) andlow phosphate concentrations (b1 mg L−1), which is a prerequisitefor the ability of the sand filter to lower the As concentration in thewater to values below 50 μg L−1 (Berg et al., 2006). The sand filter is pri-vately owned and regularly used by one family. The sand filter studiedhere is common and representative for many other filters in terms ofits shape, size and materials (M. Berg, personal communication). Thefilter bed is composed of fine gravel to very fine sand and usually origi-nates from the Red River banks. The groundwater is obtained via a 45mdeep tube well and contained ~115 μg L−1 of As (see Results) and istherefore also representative for this area. Detailed informationregarding filter dimensions and filter bed properties are summarizedin Voegelin et al., (2014). For the present study, the sand filter was sam-pled twice, in March 2012 and in March 2013, to verify the sand filterperformance over a larger time frame. The sampling schemes for bothcampaigns are shown in Tables SI 1 and SI 2.
2.2. Sampling and treatment of sand filter water
The inflow water (freshly pumped groundwater before it enteredthe sand filter) and the outflow water (water that had passed throughthe sand filter) were sampled three times per day (at 10 am, 1 pm,and 4 pm). The sampling schedule simulated typical daily filter use ofa Vietnamese family in rural areaswith awater demand in themorning,during lunchtime and in the afternoon. The outflowwater samplesweretaken immediately with the first drops of filtered water. For the 10 amsampling session, additional outflow water samples were taken at 10and 30 min after the first water flush, to check the filters for short-term and long-term As-leaching. The sampling included outflow watersamples during days of intensive filter use, after hours to days of non-use, and after filter sand replacement. Samples were taken for total As,Fe, Mn, arsenite and PO4
3− for lab analyses and for total Fe and Fe(II)for field analyses and were preserved for analysis as described in theSI. Dissolved organic carbon (DOC) and inorganic ions (Na+, NH4
+, K+,Mg2+, Ca2+, F−, Cl−, NO3
−, SO42−) were determined in the daily 1 pm
samples and preserved for analysis as described in the SI.
2.3. Sand filter solid phase characterization
For sampling of the sand filter material, a vertical profile was duginto the sand filtermaterial. Bulk sampleswere collected from6 differentdepths by pushing 50 mL plastic tubes horizontally into the sand filtermaterial. Samples were stored anoxically in Anaerocult® bags (Merck)and cooled in the dark until further processing. The analyses of the filtersand by X-ray fluorescence (XRF), micro X-ray diffraction (μXRD),Mössbauer spectroscopy, and sequential extractions of Fe after Rodenand Zachara (1996) modified by Amstaetter et al. (2012) and of Asafter Huang and Kretzschmar (2010) are described in the SI.
2.4. Analytical methods
Flow cell electrodes for dissolved O2 (FDO 925, WTW), pH (Sentix940, WTW), and electrical conductivity (TetraCon 925, WTW) analyseswere connected to a multi-parameter analyzer (Multi 3430, WTW).Redox potential was measured with a combination electrode (SensoLytWQL-Pt, WTW) with a pH/mV device (pH 340i, WTW).
Total Fe and Fe(II) of water samples were quantified in triplicates inthe field using the ferrozine assay (Stookey, 1970) and a portablespectrophotometer (DR/2010, HACH). The inflow and outflow watersamples were tested at ratios of sample to ferrozine solution of 1:5and 1:2 (v/v), respectively. Total elemental concentrations (Fe, Mn,As) in water samples were quantified in duplicates by ICP-MS (ICP-MS, Agilent 7500ce). Arsenic was separated in the field into total Asand arsenite by filtration through a disposable anion exchange cartridge(MetalSoft Center, Piscataway, USA) (for details see the manufacturer'smanual) and quantified in duplicates by ICP-MS. Inorganic ions (Na+,

529K.S. Nitzsche et al. / Science of the Total Environment 502 (2015) 526–536
NH4+, K+, Mg2+, Ca2+, F−, Cl−, NO3
−, SO42−) were determined in dupli-
cates by ion chromatography (DionexDX120 equipped with an AS9HCcolumn and an AG9HC precolumn). DOC was quantified in triplicateswith a total organic carbon analyzer (High TOC II, Elementar). Phos-phate was analyzed colorimetrically in duplicates by the molybdenumblue method using a Varian Cary 100 photometer. According to Boltzand Mellon (1947) no interference of As at present As and phosphateconcentrations are expected with this assay.
2.5. Quantification of fecal indicator bacteria
The presence of fecal indicator bacteria in the inflow, outflow, andstorage water was investigated with cultivation-dependent andcultivation-independent techniques during the sampling campaign in2013 (10 am sampling session over several days, as shown in Table SI1). For culture-dependent experiments, water was collected in sterile1 L glass bottleswhichwere cooled on ice during transport and analyzed
Table 1Geochemical parameters of the inflow and outflow water of the household sand filter in Van Psamples n in brackets for all parameters of the sampling campaigns in 2012 and 2013, respect
2012
Inflow water Ou
pH 6.89 ± 0.04(n = 4)
7.0(n
O2 [mg L−1] b0.05(n = 6)
5.4(n
Eh [mV] n.d. n.d
EC [μS cm−1] 1353 ± 1(n = 6)
12(n
Fe species [mg L−1]Fe (ICP-MS) 15.7 ± 2.0
(n = 9)b0(n
Fe (total) (ferrozine assay) 19.7 ± 1.8(n = 19)
b0(n
Fe(II) (ferrozine assay) 19.2 ± 1.8(n = 19)
b0(n
As species [μg L−1]As (total)⁎ 117.8 ± 5.0
(n = 9)4.5(n
Arsenite 107.9 ± 6.0(n = 9)
b0(n
Mn [μg L−1]⁎ 1228.00 ± 139.6(n = 9)
16(n
Cations/anions [mg L−1]Na+⁎⁎ 28.5 ± 3.0
(n = 4)27(n
NH4+⁎ n.d. 2.1(n
K+⁎⁎ 3.5 ± 0.7(n = 4)
2.8(n
Mg2+⁎⁎ 31.2 ± 3.9(n = 4)
28(n
Ca2+⁎⁎ 130.6 ± 15.3(n = 4)
10(n
F−⁎ 0.2 ± 0.1(n = 4)
0.1(n
Cl−⁎⁎ 69.3 ± 2.9(n = 4)
67(n
NO3−⁎ 1.3 ± 1.0(n = 3)
26(n
SO42−⁎ 16.4 ± 2.2(n = 4)
10(n
PO43−-P⁎ 0.5 ± 0.7(n = 6)
0.1(n
DOC [mg L−1]⁎⁎ 2.9 ± 0.2(n = 6)
2.5(n
Eh, redox potential; O2, dissolved oxygen; EC, electric conductivity; n.d., not determined.⁎ Extremely significant (p b 0.001) difference between inflow and outflow water.⁎⁎ No significant (p N 0.05) difference between inflow and outflow water.
in the laboratory at Hanoi University. For culture-independent quantifi-cation of fecal indicator bacteria, 100 mL of water were filtered on sitethrough membrane filters to concentrate biomass for nucleic acid ex-traction (0.22 μm Express® Plus Membrane, Millipore). Filters werecooled on ice, transported to the laboratory, and stored at −20 °Cuntil further use. Total cell numbers and fecal indicator bacteria werequantified by plate counts in duplicates or triplicates according toGerman drinking water regulations (1990) and guidelines of theUSEPA (EPA Methods 1603 and 1600). 16S/23S rRNA gene targetedquantitative PCR (qPCR) was carried out in duplicates as described indetail in the SI. Coliform bacteria, Escherichia coli, and Enterococcusspp., were quantified by plate counts while E. coli and Enterococcusspp. were also quantified by 16S/23S rRNA gene based qPCR.
The plate count method is a standardized procedure described innational and international water quality assessment guidelines and itis frequently used to quantify microorganisms and to monitor the bacte-rial contamination ofwater resources. However, thismethod is limited to
huc, Hanoi, Vietnam. Shown are mean values and standard deviations and the number ofively.
2013
tflow water Inflow water Outflow water
6 ± 0.03= 4)
6.88 ± 0.01(n = 28)
7.08 ± 0.10(n = 28)
2 ± 0.36= 6)
b0.05(n = 28)
5.16 ± 0.66(n = 28)
. −166 ± 11(n = 7)
+171 ± 20(n = 10)
33 ± 11= 6)
1318 ± 5(n = 28)
1196 ± 140(n = 28)
.01= 14)
16.3 ± 0.5(n = 16)
b0.01(n = 20)
.05= 32)
18.1 ± 0.8(n = 28)
b0.05(n = 122)
.05= 32)
17.3 ± 0.6(n = 28)
b0.05(n = 122)
± 1.0= 14)
115.1 ± 3.4(n = 16)
5.3 ± 0.7(n = 20)
.1= 14)
110.8 ± 5.0(n = 16)
b0.1(n = 20)
9.4 ± 155.3= 14)
1187.8 ± 31.2(n = 16)
4.2 ± 7.4(n = 22)
.9 ± 6.1= 4)
36.0 ± 0.7(n = 10)
36.0 ± 1.0(n = 10)
± 1.0= 4)
6.4 ± 0.3(n = 10)
1.6 ± 0.8(n = 10)
± 0.8= 4)
2.7 ± 0.1(n = 10)
2.7 ± 0.2(n = 10)
.2 ± 4.7= 4)
42.5 ± 2.0(n = 10)
44.3 ± 1.8(n = 10)
4.6 ± 24.6= 4)
196.0 ± 10.7(n = 10)
167.8 ± 19.8(n = 10)
± 0.0= 4)
0.3 ± 0.0(n = 10)
0.1 ± 0.0(n = 10)
.9 ± 5.4= 4)
64.6 ± 0.6(n = 10)
64.0 ± 0.8(n = 10)
.3 ± 8.4= 4)
0.1 ± 0.0(n = 9)
19.0 ± 7.0(n = 10)
.2 ± 2= 4)
8.0 ± 0.3(n = 9)
3.8 ± 0.4(n = 10)
± 0.0= 6)
0.5 ± 0.0(n = 10)
0.1 ± 0.0(n = 10)
± 0.5= 6)
2.8 ± 0.2(n = 10)
2.7 ± 0.4(n = 10)
530 K.S. Nitzsche et al. / Science of the Total Environment 502 (2015) 526–536
the detection of microorganisms that are able to grow under laboratoryconditions on the selected media, which is suggested to be less than 1%of the total microbial community (Zengler, 2009; Puspita et al., 2012).Moreover, themethod is based on the assumption that one CFUdescendsfrom only one cell; hence, cell aggregation or clumping of cells underes-timates the real number of living cells. In contrast, the detection of genecopy numbers by qPCR avoids the disadvantages of the cultivation bias ofthe plate count methods; however, one has to take into account thatqPCR quantifies gene copy numbers regardless of whether the amplifiedgene originates from living cells, dead cells, or free DNA. Furthermore,qPCR based 16S/23S rRNA gene counts are usually higher than directcell counts because many microorganisms contain more than one ribo-somal RNA operon. Thus, plate counts generally underestimate andqPCR generally overestimates total or group-specific cell numbers.
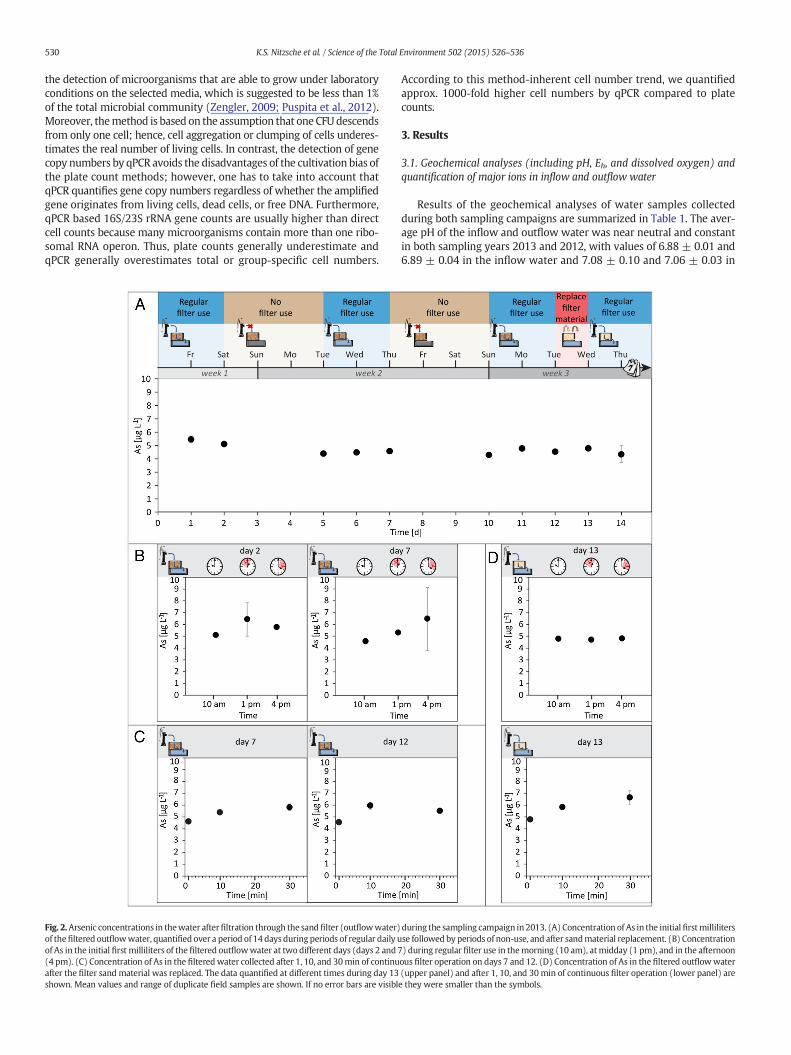
Fig. 2.Arsenic concentrations in thewater afterfiltration through the sandfilter (outflowwater)of thefiltered outflowwater, quantified over a period of 14 days during periods of regular daily uof As in the initial first milliliters of the filtered outflowwater at two different days (days 2 and 7(4 pm). (C) Concentration of As in the filteredwater collected after 1, 10, and 30min of continuafter the filter sand material was replaced. The data quantified at different times during day 13shown. Mean values and range of duplicate field samples are shown. If no error bars are visibl
According to this method-inherent cell number trend, we quantifiedapprox. 1000-fold higher cell numbers by qPCR compared to platecounts.
3. Results
3.1. Geochemical analyses (including pH, Eh, and dissolved oxygen) andquantification of major ions in inflow and outflow water
Results of the geochemical analyses of water samples collectedduring both sampling campaigns are summarized in Table 1. The aver-age pH of the inflow and outflow water was near neutral and constantin both sampling years 2013 and 2012, with values of 6.88 ± 0.01 and6.89 ± 0.04 in the inflow water and 7.08 ± 0.10 and 7.06 ± 0.03 in
during the sampling campaign in 2013. (A) Concentration of As in the initialfirstmillilitersse followed by periods of non-use, and after sandmaterial replacement. (B) Concentration) during regular filter use in themorning (10 am), atmidday (1 pm), and in the afternoonous filter operation on days 7 and 12. (D) Concentration of As in the filtered outflowwater(upper panel) and after 1, 10, and 30min of continuous filter operation (lower panel) aree they were smaller than the symbols.

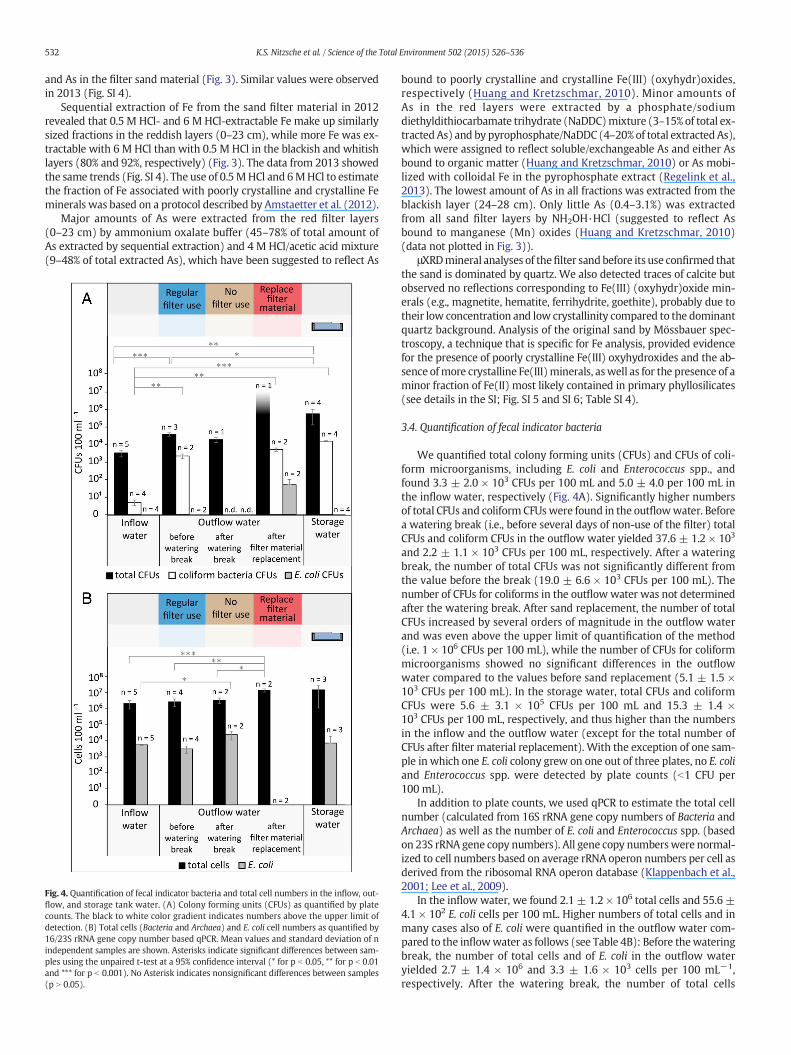
Fig. 3.Depth profiles of: (A) total Fe [g kg−1], total As [mg kg−1], and total Mn [g kg−1] inthe sandmaterial present in the upper filter basin as determined by XRF. The insert showsthe linear correlation of Fe andAs. (B) As and Fe concentrations in different fractions of thesand filtermaterial as quantified by sequential extractions. As extractedwith a phosphate/NaDDC mixture (representing soluble and exchangeable As (Huang and Kretzschmar,2010)), As extracted with a pyrophosphate/NaDDC mixture (representing either Asbound to organic matter (Huang and Kretzschmar, 2010) or As in colloidal particles), Asextracted with NH4
− oxalate buffer (representing As bound to poorly crystalline Fe(oxyhydr)oxides (Huang and Kretzschmar, 2010)), As extracted with 4 M HCl/aceticacid mixture (representing As bound to crystalline Fe (oxyhydr)oxides (Huang andKretzschmar, 2010)). Fe extracted with 0.5 M HCl (representing poorly crystalline Feminerals (Amstaetter et al., 2012)) and Fe extractedwith 6MHCl (representing crystallineFe minerals (Amstaetter et al., 2012)). Mean values and standard deviations of triplicateextractions are plotted. The reddish zone (depth of 0–23 cm) indicates orange/browniron phases, while the blackish layer (23–28 cm) indicates black manganese precipitates,and the whitish layer (28–32 cm) represents the original colored sand. Data obtainedduring the sampling campaign in 2012.
531K.S. Nitzsche et al. / Science of the Total Environment 502 (2015) 526–536
the outflowwater, respectively. The average concentrations of dissolvedoxygen were b0.05 mg L−1 in the inflow water (2013 and 2012) and5.16 ± 0.66 mg L−1 (2013) and 5.42 ± 0.36 mg L−1 (2012) in the out-flowwater. The redox potential of the inflowwater was−166±11mVand indicated reducing conditions, while suboxic conditions were pres-ent in the outflowwater, which had a redox potential of+171±20mVmeasured in 2013.
The inflow water during the sampling campaign in 2013 contained,on average, 115.1 ± 3.4 μg L−1 total As, of which ~96% was presentas arsenite. The inflow water contained 16.3 ± 0.5 mg L−1 total Fe(ICP-MS analysis) while the spectrophotometric ferrozine assay yieldeda slightly higher value of 18.1±0.8mg L−1 total Fewith ~96% Fe(II). Nosignificant variations in As and Fe concentrations were observed in theinflow water during the entire several-week sampling periods of bothcampaigns (Figures SI 1 and SI 2). The outflow water contained, on av-erage, 5.3 ± 0.7 μg L−1 of total As in 2013. In the outflow water, the ar-senite and total Fe were below the detection limit (0.1 μg L−1 for As(ICP-MS), 10 μg L−1 for Fe (ICP-MS) and 50 μg L−1 for Fe (ferrozineassay)) for most of the samples. Fe and As concentrations measured inthe inflow and outflow water during the sampling campaign in 2013were comparable to the data collected in 2012 (Table 1). Mn concentra-tions of N1000 μg L−1 were quantified in the inflowwater in both sam-pling years. Mn concentrations in the outflow water showed strongdifferences between as well as during the two sampling campaigns.Concentrations as low as 0.4 ± 0.3 μg L−1 (2013) and 20.0 ±4.2 μg L−1 (2012) and maximum concentrations of 17.8 ± 20.5 μg L−1
(2013) and 470.5 ± 108.2 μg L−1 (2012) have been quantified(Table 1).
The DOC concentrations of the inflow water of 2.8 ± 0.2 mg L−1
(2013) and 2.9 ± 0.5 mg L−1 (2012) did not differ significantly to theconcentrations in the outflow water of 2.7 ± 0.4 mg L−1 (2013) and2.5 ± 0.5 mg L−1 (2012) (Table 1). The concentrations of PO4
3−, SO42−,
NH4+, and F− were lower and NO3
− was higher in the outflow comparedto the inflowwater in both sampling years (Table 1). In particular, NH4
+
decreased from 6.4 ± 0.3 mg L−1 (inflow) to 1.6 ± 0.8 mg L−1
(outflow) while NO3− increased from 0.1 ± 0.0 mg L−1 (inflow) to
19.0±7.0mg L−1 (outflow). The concentrations of other ions includingK+, Mg2+, Ca2+, and Cl− did not change between the inflow and theoutflow water (Table 1).
3.2. Sand filter performance
The results of the sand filter performance experiments during thesampling campaign in 2013 are summarized in Fig. 2 and for the year2012 in Figure SI 3. Total As concentrations in 2013 remained constantin the outflow water over a period of 14 days during regular daily use,after periods of non-use, and after sand replacement (Fig. 2A). Ondays where the filter was used three times (at 10 am, 1 pm, and at4 pm), total As concentrations did not change in the outflow water(Fig. 2B). A slight but significant (p b 0.05) increase in total As concen-trationwas quantified in the outflowwater between 1, 10 and 30min ofcontinued sand filter use (Fig. 2C) while a similar increase was notquantified in 2012 (Fig. SI 3 C and D). Variation in total As in the outflowwas low within one day and within 30 min of filter usage or after sandmaterial was replaced (Fig. 2D). The data collected in 2012 showed sim-ilar results (Fig. SI 3). Overall,more than 95%of total As and100% of totalFewere removed from the inflowwater during filtration by the sandfil-ter during both sampling campaigns. Concentrations of Aswere reducedbelow the WHO recommended value of 10 μg L−1.
3.3. Sand filter solid phase characterization
The filter sandwas characterized by a reddish colored layer down to~23 cm depth, followed by a blackish layer with a thickness of ~5 cm,and a bottom layer of whitish sand of ~5 cm in 2012 (Fig. 1). In 2013,the reddish layer was ~17 cm thick, the blackish layer was more
pronounced with 16 cm thickness, and the whitish layer was still~5 cm thick.
Total Fe, As, and Mn concentrations were quantified in the filtermaterial by XRF in 2012 (Fig. 3). The highest concentrations of Fe(49 g kg−1) and As (260 mg kg−1) were quantified in the top 2 cm ofthe red colored filter material. Fe and As concentrations decreasedsignificantlywithfiltermaterial depth. In the bottomwhitish layer, con-centrations of Fe and As were similar to the concentrations in the un-used sand material (data not shown). Mn concentrations were highest(1135mg kg−1) in the blackish layer (24–28 cmdepth). A strong corre-lation (coefficient of determination of 0.99) was observed between Fe
532 K.S. Nitzsche et al. / Science of the Total Environment 502 (2015) 526–536
and As in the filter sand material (Fig. 3). Similar values were observedin 2013 (Fig. SI 4).
Sequential extraction of Fe from the sand filter material in 2012revealed that 0.5 M HCl- and 6 M HCl-extractable Fe make up similarlysized fractions in the reddish layers (0–23 cm), while more Fe was ex-tractable with 6 M HCl than with 0.5 M HCl in the blackish and whitishlayers (80% and 92%, respectively) (Fig. 3). The data from 2013 showedthe same trends (Fig. SI 4). The use of 0.5MHCl and 6MHCl to estimatethe fraction of Fe associated with poorly crystalline and crystalline Feminerals was based on a protocol described by Amstaetter et al. (2012).
Major amounts of As were extracted from the red filter layers(0–23 cm) by ammonium oxalate buffer (45–78% of total amount ofAs extracted by sequential extraction) and 4 M HCl/acetic acid mixture(9–48% of total extracted As), which have been suggested to reflect As
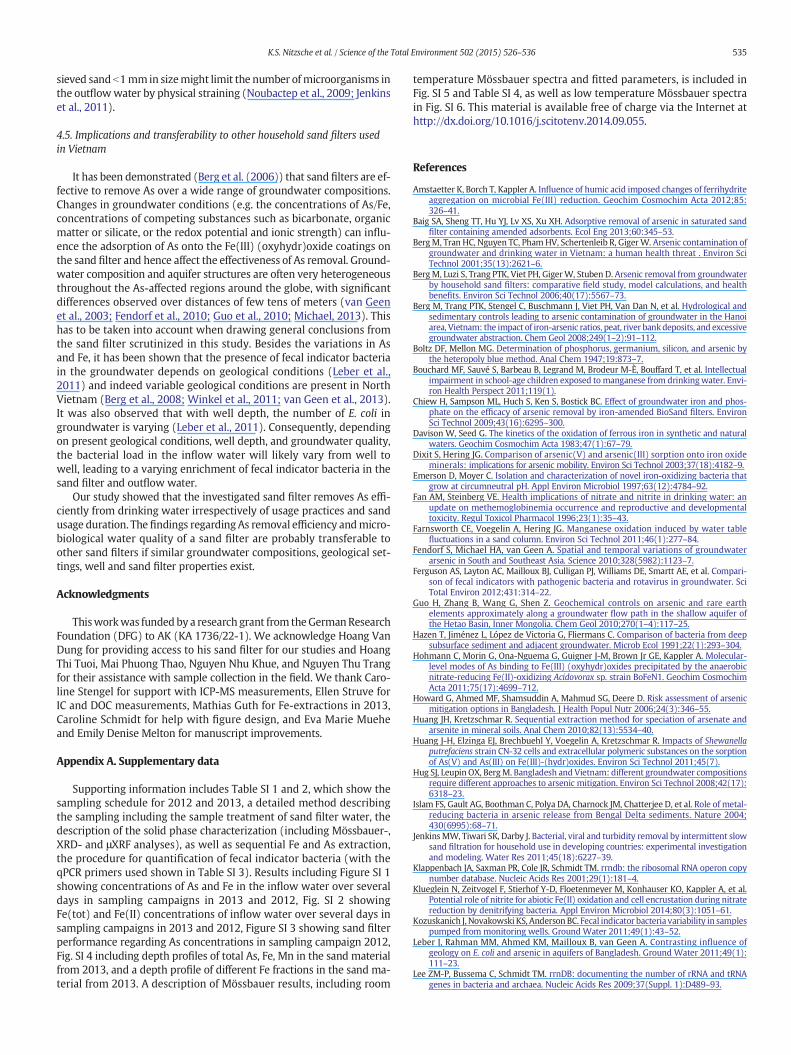
Fig. 4. Quantification of fecal indicator bacteria and total cell numbers in the inflow, out-flow, and storage tank water. (A) Colony forming units (CFUs) as quantified by platecounts. The black to white color gradient indicates numbers above the upper limit ofdetection. (B) Total cells (Bacteria and Archaea) and E. coli cell numbers as quantified by16/23S rRNA gene copy number based qPCR. Mean values and standard deviation of nindependent samples are shown. Asterisks indicate significant differences between sam-ples using the unpaired t-test at a 95% confidence interval (* for p b 0.05, ** for p b 0.01and *** for p b 0.001). No Asterisk indicates nonsignificant differences between samples(p N 0.05).
bound to poorly crystalline and crystalline Fe(III) (oxyhydr)oxides,respectively (Huang and Kretzschmar, 2010). Minor amounts ofAs in the red layers were extracted by a phosphate/sodiumdiethyldithiocarbamate trihydrate (NaDDC)mixture (3–15% of total ex-tractedAs) and by pyrophosphate/NaDDC (4–20%of total extractedAs),which were assigned to reflect soluble/exchangeable As and either Asbound to organic matter (Huang and Kretzschmar, 2010) or As mobi-lized with colloidal Fe in the pyrophosphate extract (Regelink et al.,2013). The lowest amount of As in all fractions was extracted from theblackish layer (24–28 cm). Only little As (0.4–3.1%) was extractedfrom all sand filter layers by NH2OH·HCl (suggested to reflect Asbound to manganese (Mn) oxides (Huang and Kretzschmar, 2010)(data not plotted in Fig. 3)).
μXRDmineral analyses of thefilter sandbefore its use confirmed thatthe sand is dominated by quartz. We also detected traces of calcite butobserved no reflections corresponding to Fe(III) (oxyhydr)oxide min-erals (e.g., magnetite, hematite, ferrihydrite, goethite), probably due totheir low concentration and low crystallinity compared to the dominantquartz background. Analysis of the original sand by Mössbauer spec-troscopy, a technique that is specific for Fe analysis, provided evidencefor the presence of poorly crystalline Fe(III) oxyhydroxides and the ab-sence ofmore crystalline Fe(III)minerals, aswell as for the presence of aminor fraction of Fe(II) most likely contained in primary phyllosilicates(see details in the SI; Fig. SI 5 and SI 6; Table SI 4).
3.4. Quantification of fecal indicator bacteria
We quantified total colony forming units (CFUs) and CFUs of coli-form microorganisms, including E. coli and Enterococcus spp., andfound 3.3 ± 2.0 × 10³ CFUs per 100 mL and 5.0 ± 4.0 per 100 mL inthe inflow water, respectively (Fig. 4A). Significantly higher numbersof total CFUs and coliform CFUswere found in the outflowwater. Beforea watering break (i.e., before several days of non-use of the filter) totalCFUs and coliform CFUs in the outflow water yielded 37.6 ± 1.2 × 10³
and 2.2 ± 1.1 × 10³ CFUs per 100 mL, respectively. After a wateringbreak, the number of total CFUs was not significantly different fromthe value before the break (19.0 ± 6.6 × 10³ CFUs per 100 mL). Thenumber of CFUs for coliforms in the outflowwater was not determinedafter the watering break. After sand replacement, the number of totalCFUs increased by several orders of magnitude in the outflow waterand was even above the upper limit of quantification of the method(i.e. 1 × 10⁶ CFUs per 100 mL), while the number of CFUs for coliformmicroorganisms showed no significant differences in the outflowwater compared to the values before sand replacement (5.1 ± 1.5 ×10³ CFUs per 100 mL). In the storage water, total CFUs and coliformCFUs were 5.6 ± 3.1 × 10⁵ CFUs per 100 mL and 15.3 ± 1.4 ×10³ CFUs per 100 mL, respectively, and thus higher than the numbersin the inflow and the outflow water (except for the total number ofCFUs after filter material replacement). With the exception of one sam-ple in which one E. coli colony grew on one out of three plates, no E. coliand Enterococcus spp. were detected by plate counts (b1 CFU per100 mL).
In addition to plate counts, we used qPCR to estimate the total cellnumber (calculated from 16S rRNA gene copy numbers of Bacteria andArchaea) as well as the number of E. coli and Enterococcus spp. (basedon 23S rRNA gene copy numbers). All gene copy numberswere normal-ized to cell numbers based on average rRNA operon numbers per cell asderived from the ribosomal RNA operon database (Klappenbach et al.,2001; Lee et al., 2009).
In the inflowwater, we found 2.1 ± 1.2 × 10⁶ total cells and 55.6 ±4.1 × 10² E. coli cells per 100 mL. Higher numbers of total cells and inmany cases also of E. coli were quantified in the outflow water com-pared to the inflowwater as follows (see Table 4B): Before thewateringbreak, the number of total cells and of E. coli in the outflow wateryielded 2.7 ± 1.4 × 10⁶ and 3.3 ± 1.6 × 10³ cells per 100 mL−1,respectively. After the watering break, the number of total cells

533K.S. Nitzsche et al. / Science of the Total Environment 502 (2015) 526–536
(3.5 ± 1.2 × 10⁶ per 100 mL) was not significantly different comparedto the value before the break but the number of E. coli cells (2.6 ± 1.4 ×10⁴ per 100 mL) increased by one order of magnitude. The E. colicells were significantly enriched in the outflow water compared tothe inflow water after the watering break. After sand replacement,the total cell number (14.3 ± 3.2 × 10⁶ per 100 mL) was significantlyhigher compared to the values before sand replacement. No E. colicells were detected by qPCR in the outflow water after sand replace-ment. Quantification of total cells and E. coli in the storage wateryielded cell numbers of 1.6 ± 1.4 × 10⁷ and 7.2 × 10³ ± 1.2 × 10⁴
cells per 100 mL−1, respectively. In all samples, total cell numberswere dominated by Bacteria (N92%) as determined by individualqPCRs for Bacteria and Archaea. In all samples, the cell numbers ofE. coli were b1% of total cell numbers. Enterococcus spp. was not de-tected by qPCR.
4. Discussion
4.1. Biogeochemical transformation of Fe, As and Mn
Understanding the functioning of the sandfilterfirst requires analysisof the biogeochemical transformation of Fe, As and Mn. We determinedthe spatial distributions of these elements as well as the mineralogy ofthe sand filter material.
4.1.1. Fe(II) oxidation, Fe(III) precipitation, and As binding in householdsand filters
Dissolved Fe in the pumped groundwater is present as Fe(II) andstarts to oxidize immediatelywhen thewater is exposed to atmosphericO2 (Davison and Seed, 1983). The possibility of biotic Fe(II) oxidation bymicroaerophilic bacteria in suboxic microsites or by denitrifying micro-organisms in anoxic microsites in the sand filter is also conceivable(Emerson and Moyer, 1997; Klueglein et al., 2014). The fact that nitrateconcentrations are increasing from the inflow to the outflowwater sug-gests nitrification rather than denitrification as an important process.And indeed, ametagenome studywith the filtermaterial (K. S. Nitzsche,unpublished data) provided evidence for the presence of ammonium-and nitrite-oxidizing microorganisms.
Virtually all Fe(II) was removed from thewater during filtration andred-brownish precipitates were formed that were identified as 0.5 M-and 6 M-HCl-extractable Fe-fractions (Figs. 3 and SI 4). Based onMössbauer spectroscopy (Fig. SI 5 and 6, Table SI 4), these correspondedto a poorly crystalline Fe(III) oxyhydroxide mineral phase which waspreviously identified as ferrihydrite-like precipitate by X-ray absorptionspectroscopy (XAS) (Voegelin et al., 2014). Ferrihydrite has a high spe-cific surface area and is well known to strongly bind As via relativelystrong inner-sphere complexes (Raven et al., 1998; Sherman andRandall, 2003; Ona-Nguema et al., 2005; Hohmann et al., 2011). Indeed,based on sequential As-extraction, we found a dominating As-fractionassociated with this mineral phase and only a minor portion of As tobe soluble and exchangeable (Fig. 3), suggesting a strong binding of Asto the Fe(III)-precipitate and thus a low probability of As re-mobilization from the sand filter material. This is supported by the Feand As content in the sand filter material, which showed a strong posi-tive correlation (R2 = 0.99), as also observed by Voegelin et al. (2014).This indicates that co-precipitation and adsorption of As onto theferrihydrite-like precipitate are likely the dominant processes of As re-moval from the pumped groundwater during the downwardsmigrationof Fe- and As-containing water through the sand filter material. Aging ofthe ferrihydrite precipitates resulting in an increase of crystallinity couldlead to a reduction in As adsorption capacity over time and thus poten-tially to a release of As. However, ferrihydrite was still present as mainFe phase in the sand filter that was in use for eight years, as shown byVoegelin et al. (in press).
4.1.2. Precipitation ofMn oxideminerals and their role as oxidants for Fe(II)and arsenite
The dissolved Mn present in the groundwater was mostly retainedin the sand filter as precipitate of Mn(IV) oxides. In line with μ-XRFand SEM-EDXdata (Voegelin et al.,2014), sequential extractions suggestthat only a minor fraction (0.4–3.1%) of the total extractable As was as-sociated with Mn oxides. Element distribution profile (Fig. 1) revealedthat the blackish layer just beneath the Fe- and As-rich red-brownishlayers (at a filter depth of 24–28 cm) contained up to ~2.7 times higherMn concentrations and the lowest extractable As fraction of all layers. Alow amount of As bound to Mn oxides is expected since the negativelycharged arsenate has only a low tendency to bind to these Mn oxidesdue to the negative surface charge of the Mn oxides (point of zerocharge of birnessite, i.e. MnO2, is ~2 (Tan et al., 2008)).
Mn(IV) oxides are oxidants for Fe(II) (Postma, 1985; Villinski et al.,2001) and As(III) (Tournassat et al., 2002; Ying et al., 2012). It can be ex-pected that during water infiltration through the filter initially Fe(II),As(III) andMn(II) are oxidized abiotically or biotically but due to the ex-cess of As(III) and Fe(II) compared to the Mn(II), the initially formedMn(IV) oxides function as chemical oxidant for Fe(II) and As(III) leadingto Fe(III) oxyhydroxide precipitation and arsenate immobilization. As aconsequence, the Mn would be remobilized as Mn(II) as long as Fe(II)and As(III) are present in the water and the black Mn-rich layer thusindicates the filter depth at which no As(III) and Fe(II) are presentanymore.
Interestingly, occasionally we observed a breakthrough of Mn andthe presence of measurable Mn concentrations in the outflow water.Thismight be explained by the fact thatMn(II) oxidation by O2 is slowerthan Fe(II) oxidation and needs microbial catalysis to be effective sinceMn(II) oxidation by O2 is rather slow (Farnsworth et al., 2011).Microbi-al enrichment studies indeed provided evidence for the presence of aer-obic Mn(II)-oxidizing bacteria throughout the filter with the by farhighest numbers of cells found in the blackMn-rich layer (K. S. Nitzsche,unpublished data). Thus, fluctuations in O2 supply in the deep filterlayers causing lower microbial activity would lead to varying efficien-cies ofMn(II) oxidation and thus in some cases to incompleteMn(II) ox-idation and aMn release into the outflowwater. Additionally, limitingO2
supply in combination with the presence of organic matter could allowmicrobial Mn(IV) reduction to take place releasing Mn(II) (Voegelinet al., 2014). Although it is known thatMn ingestion can cause neurolog-ical deficiencies and intellectual impairments (Bouchard et al., 2011), itis currently unknownwhether the occasional release of Mn from the fil-ter represents a health risk.
4.2. Efficiency of As removal depending on sand filter usage andrecommendations for water use
The investigated sand filter removed 95% of As from the treatedwater and lowered As to levels below the WHO recommended valueof 10 μg L−1. This result is in agreement with previous reports thatdemonstrated efficient As removal by such filters (Berg et al., 2006;Hug et al., 2008). Other technologies perform similarly or even betterregarding their As removal efficiencies, e.g., chemical coagulation orelectrocoagulation (depending on As species up to 93–99% As removalefficiency (Ratna Kumar et al., 2004)) or pressure-driven membrane-based methods such as nanofiltration or reverse osmosis (both up to99% arsenate removal efficiency (Mondal et al., 2013)). However,these techniques are much more expensive than the simple sand filtersystems and have high operation and maintenance costs (Mondalet al., 2013). Some methods, such as oxidation treatments by ozone orcoagulation–flocculation, require the addition of chemicals that producetoxic or carcinogenic by-products (Mondal et al., 2013). Filters based onactivated carbon are not as efficient regarding As adsorption, having anAs removal efficiency of only up to 60% (Mondal et al., 2013). Most ofthese technologies can be applied for As removal in large and mediumscale treatment plants for centralized services but are not suitable for

534 K.S. Nitzsche et al. / Science of the Total Environment 502 (2015) 526–536
rural areas where only untrained personnel are available to install andmaintain these technologies for daily domestic use. Decentralizedbiosand filter systems (3-Kolshi, SONO or Kanchan™ filters) havebeen applied in rural areas in Nepal, Bangladesh and Cambodia, butdiffer with respect to design and build-up compared to the sand filtersused in North Vietnam. Since groundwater in the other regions tendto have lower Fe concentrations, and hence, form less Fe(III)oxyhydroxide precipitate required for As removal, these filters containseveral layers made of a zero-valent Fe and are thus adapted to lowgroundwater Fe:As ratios as well as to high phosphate:Fe ratios (Huget al., 2008; Noubactep et al., 2009). Several studies showed that thesefilter systems remove As between b40–99%, depending on groundwatercomposition (Ngai et al., 2007; Chiew et al., 2009; Neumann et al.,2013). Therefore, as already concluded by Berg et al. (2006), if the Fe:Asratio is N50 and the groundwater concentration of competing phosphateis b2.5 mg L−1, simple sand filters are excellent alternatives to theseelaborate techniques and advanced sand filter systems in rural areas.
Our simulation of different scenarios of usage, such as repeatedwater filtration several times per day with differing lengths of continu-ous water filtration, or several days of filter non-use, consistently dem-onstrated efficient removal of As. This shows, in contrast to our initialhypothesis, that waterlogging and the possible establishment of anoxicmicrosites leading to Fe(III) mineral reduction and thus a potentialrelease of As are either not occurring on the filter or play only minorroles at least in the sand filter studied here. In addition, the As removalefficiency after sand replacement showed no differences compared tothe As removal before exchange of the filter material. The fact that theoriginal sand that was initially free of Fe(III) oxyhydroxide minerals re-moved the As as efficient as the old and Fe(III) precipitate-enrichedsand is probably due to the high Fe:As ratio in the groundwater, leadingto instant precipitation of sufficient Fe(III) oxyhydroxides and thussufficient binding sites for As.
Overall, As concentrations flushed through the sand filter arereduced as recommended below 10 μg L−1 irrespective of the filteruse practices studied here. Initial flushing of the filter (e.g., to avoid po-tentially higher As concentrations in the initial volumes of filteredwater) or additional water treatment are not required to lower the Ascontent in the outflow water.
4.3. Evidence for nitrification occurring in the drinking water filter
In both sampling campaigns (2012 and 2013)we observed that con-centrations of NH4
+ decreased and NO3− increased significantly compar-
ing the inflow to the outflow water (Table 1). In combination with theobserved presence of microorganisms known for nitrification in ametagenomic microbial community analysis of the filter (K.S. Nitzsche,unpublished data) this suggests nitrification in the sand filter. NH4
+ ox-idation and simultaneousNO2
− or NO3− formation duringwaterfiltration
have been observed in previous studies of biosand filters in field and labexperiments (Chiew et al., 2009; Murphy et al., 2010; Mangoua-Allaliet al., 2012; Baig et al., 2013). Although the NO3
− concentrations in theoutflow water of the investigated sand filter were below the WHOguideline value of 50mg L−1, our study suggests puttingmore attentionon this geochemical parameter in future studies since elevated NO3
−
concentrations in drinking water might harm infants, causing methe-moglobinemia (Fan and Steinberg, 1996).
4.4. Fecal indicator bacteria in sand filters and recommendations forwater use
In the inflowwater, we quantified ~103 total CFUs per 100mLwaterusing cultivation-based plate counts and estimated ~106 total cells per100 mL based on bacterial and archaeal 16S rRNA gene targeted qPCR.These numbers are within the same order of magnitude as previouslypublished for groundwater (Hazen et al., 1991; Lleo et al., 2005;Kozuskanich et al., 2011). With more specific plate growth assays we
found 5 CFUs of coliform bacteria per 100 mL groundwater, a commonfinding in groundwater (Leber et al., 2011), but no CFUs for E. coli andEnterococcus spp. In contrast to the CFU analysis, E. coli could be quanti-fied by qPCR in the inflow water with rRNA gene copy numbers corre-sponding to ca. 103 cells per 100 mL. Similar gene copy numbers havebeen determined by qPCR in groundwater samples of a highly populat-ed rural area in Bangladesh (Ferguson et al., 2012).
In the outflow water, the total number of cells did not increase sig-nificantly (CFU plate counts and qPCR) after several days of not usingthe filter, but the number of E. coli cells was higher (qPCR). After filtersand replacement, the total number of cells increased (CFUs andqPCR), while the number of coliform bacteria (CFUs) and the numberof E. coli cells (qPCR) remained at the same level. However, CFU analysisshowed that E. coli cellswere present in the outflowwater after the sandreplacement posing a potential risk for human health (WHO, 1997).This suggests that the replacement of the filter material and thus thesource of the new sand, but not the filter operation practice is a criticalparameter for microbial contamination of the filtered drinking water.
Compared to the inflow and outflowwater, the water in the storagetank contained higher numbers of total cells (based on qPCR and platecounts) and coliform bacteria (based on plate counts) due to growthof themicroorganisms in the storage tank. It is therefore recommendedto preferentially use the freshly filtered water rather than the waterfrom the storage tank.
Enterococcus spp. were not detected by plate counts or by qPCR.However, the numbers for coliform bacteria clearly exceed the recom-mended value of zero CFUs 100 mL−1 and their presence generallyposes a potential risk for human health, although only a small groupof these fecal bacteria are humanpathogens. This result (CFUs) confirmsour initial hypothesis that potentially harmful microorganisms areenriched in the sand and are flushed out with the outflow water. Ithas been shown for biosand filter systems in rural areas in Nepal,Bangladesh, Cambodia and other developing countries, that generalfecal indicator bacteria such as coliform bacteria and E. coli can be re-moved from the water and hence diarrhea diseases are limited whena layer of small-grained sand (b1 mm) is used (Ngai et al., 2007;Chiew et al., 2009; Stauber et al., 2009; Jenkins et al., 2011). This mate-rial has been suggested to retain fecal indicator bacteria by physicalstraining (Noubactep et al., 2009; Jenkins et al., 2011). Since the sand fil-ter investigated here showed a larger and more heterogeneous grainsize distribution (one third of the particles were N1 mm and two thirdsb1 mm) our filter might not be able to mechanically remove microbialcells as efficiently as other systems.
Seasonal variation of fecal contamination was reported for shallow(b37 m deep) and deep (~100 m deep) tube wells in rural areas ofBangladesh where the quantities of fecal indicator bacteria in thewater were higher during the wet compared to the dry season(Howard et al., 2006; Ferguson et al., 2012; van Geen et al., 2011). Sim-ilar variations might be present in some shallow groundwater wells inVietnam, but our sampling scheme did not account for the analysis ofseasonal variations.
Based on the results from the present study and in order to preventdiarrheal diseases, we recommend avoiding direct consumption of out-flow and storage tank water before it is sterilized by boiling (thermaldisinfection), solar or chemical disinfection, or sterile filtration. Boilingof the water before consumption as drinking water is a simple and effi-cient solution. Furthermore, livestock and other potential sources offecal contamination must be kept at a distance from the sand filter.The container with the sandmaterial and thewater storage tank shouldbe covered at all times to limit phototrophic growth of bacteria and ex-ternal contamination. Following a discontinuation of the filter use forseveral hours/days or after the sand filter material has been replaced,the sand filter should be flushed several times in order to decrease thecell numbers in the filtered water. Alternatively, the new sand that istypically taken from the Red River bank should be washed, boiled anddried before replacement of the used sand. Additionally, the use of
535K.S. Nitzsche et al. / Science of the Total Environment 502 (2015) 526–536
sieved sand b1mmin sizemight limit the number ofmicroorganisms inthe outflowwater by physical straining (Noubactep et al., 2009; Jenkinset al., 2011).
4.5. Implications and transferability to other household sand filters usedin Vietnam
It has been demonstrated (Berg et al. (2006)) that sand filters are ef-fective to remove As over a wide range of groundwater compositions.Changes in groundwater conditions (e.g. the concentrations of As/Fe,concentrations of competing substances such as bicarbonate, organicmatter or silicate, or the redox potential and ionic strength) can influ-ence the adsorption of As onto the Fe(III) (oxyhydr)oxide coatings onthe sand filter and hence affect the effectiveness of As removal. Ground-water composition and aquifer structures are often very heterogeneousthroughout the As-affected regions around the globe, with significantdifferences observed over distances of few tens of meters (van Geenet al., 2003; Fendorf et al., 2010; Guo et al., 2010; Michael, 2013). Thishas to be taken into account when drawing general conclusions fromthe sand filter scrutinized in this study. Besides the variations in Asand Fe, it has been shown that the presence of fecal indicator bacteriain the groundwater depends on geological conditions (Leber et al.,2011) and indeed variable geological conditions are present in NorthVietnam (Berg et al., 2008; Winkel et al., 2011; van Geen et al., 2013).It was also observed that with well depth, the number of E. coli ingroundwater is varying (Leber et al., 2011). Consequently, dependingon present geological conditions, well depth, and groundwater quality,the bacterial load in the inflow water will likely vary from well towell, leading to a varying enrichment of fecal indicator bacteria in thesand filter and outflow water.
Our study showed that the investigated sand filter removes As effi-ciently from drinking water irrespectively of usage practices and sandusage duration. The findings regardingAs removal efficiency andmicro-biological water quality of a sand filter are probably transferable toother sand filters if similar groundwater compositions, geological set-tings, well and sand filter properties exist.
Acknowledgments
Thisworkwas funded by a research grant from theGermanResearchFoundation (DFG) to AK (KA 1736/22-1). We acknowledge Hoang VanDung for providing access to his sand filter for our studies and HoangThi Tuoi, Mai Phuong Thao, Nguyen Nhu Khue, and Nguyen Thu Trangfor their assistance with sample collection in the field. We thank Caro-line Stengel for support with ICP-MS measurements, Ellen Struve forIC and DOC measurements, Mathias Guth for Fe-extractions in 2013,Caroline Schmidt for help with figure design, and Eva Marie Mueheand Emily Denise Melton for manuscript improvements.
Appendix A. Supplementary data
Supporting information includes Table SI 1 and 2, which show thesampling schedule for 2012 and 2013, a detailed method describingthe sampling including the sample treatment of sand filter water, thedescription of the solid phase characterization (including Mössbauer-,XRD- and μXRF analyses), as well as sequential Fe and As extraction,the procedure for quantification of fecal indicator bacteria (with theqPCR primers used shown in Table SI 3). Results including Figure SI 1showing concentrations of As and Fe in the inflow water over severaldays in sampling campaigns in 2013 and 2012, Fig. SI 2 showingFe(tot) and Fe(II) concentrations of inflow water over several days insampling campaigns in 2013 and 2012, Figure SI 3 showing sand filterperformance regarding As concentrations in sampling campaign 2012,Fig. SI 4 including depth profiles of total As, Fe, Mn in the sand materialfrom 2013, and a depth profile of different Fe fractions in the sand ma-terial from 2013. A description of Mössbauer results, including room
temperature Mössbauer spectra and fitted parameters, is included inFig. SI 5 and Table SI 4, as well as low temperature Mössbauer spectrain Fig. SI 6. This material is available free of charge via the Internet athttp://dx.doi.org/10.1016/j.scitotenv.2014.09.055.
References
Amstaetter K, Borch T, Kappler A. Influence of humic acid imposed changes of ferrihydriteaggregation on microbial Fe(III) reduction. Geochim Cosmochim Acta 2012;85:326–41.
Baig SA, Sheng TT, Hu YJ, Lv XS, Xu XH. Adsorptive removal of arsenic in saturated sandfilter containing amended adsorbents. Ecol Eng 2013;60:345–53.
BergM, Tran HC, Nguyen TC, Pham HV, Schertenleib R, Giger W. Arsenic contamination ofgroundwater and drinking water in Vietnam: a human health threat . Environ SciTechnol 2001;35(13):2621–6.
BergM, Luzi S, Trang PTK, Viet PH, GigerW, Stuben D. Arsenic removal from groundwaterby household sand filters: comparative field study, model calculations, and healthbenefits. Environ Sci Technol 2006;40(17):5567–73.
Berg M, Trang PTK, Stengel C, Buschmann J, Viet PH, Van Dan N, et al. Hydrological andsedimentary controls leading to arsenic contamination of groundwater in the Hanoiarea, Vietnam: the impact of iron-arsenic ratios, peat, river bankdeposits, and excessivegroundwater abstraction. Chem Geol 2008;249(1–2):91–112.
Boltz DF, Mellon MG. Determination of phosphorus, germanium, silicon, and arsenic bythe heteropoly blue method. Anal Chem 1947;19:873–7.
Bouchard MF, Sauvé S, Barbeau B, Legrand M, Brodeur M-È, Bouffard T, et al. Intellectualimpairment in school-age children exposed to manganese from drinkingwater. Envi-ron Health Perspect 2011;119(1).
Chiew H, Sampson ML, Huch S, Ken S, Bostick BC. Effect of groundwater iron and phos-phate on the efficacy of arsenic removal by iron-amended BioSand filters. EnvironSci Technol 2009;43(16):6295–300.
Davison W, Seed G. The kinetics of the oxidation of ferrous iron in synthetic and naturalwaters. Geochim Cosmochim Acta 1983;47(1):67–79.
Dixit S, Hering JG. Comparison of arsenic(V) and arsenic(III) sorption onto iron oxideminerals: implications for arsenic mobility. Environ Sci Technol 2003;37(18):4182–9.
Emerson D, Moyer C. Isolation and characterization of novel iron-oxidizing bacteria thatgrow at circumneutral pH. Appl Environ Microbiol 1997;63(12):4784–92.
Fan AM, Steinberg VE. Health implications of nitrate and nitrite in drinking water: anupdate on methemoglobinemia occurrence and reproductive and developmentaltoxicity. Regul Toxicol Pharmacol 1996;23(1):35–43.
Farnsworth CE, Voegelin A, Hering JG. Manganese oxidation induced by water tablefluctuations in a sand column. Environ Sci Technol 2011;46(1):277–84.
Fendorf S, Michael HA, van Geen A. Spatial and temporal variations of groundwaterarsenic in South and Southeast Asia. Science 2010;328(5982):1123–7.
Ferguson AS, Layton AC, Mailloux BJ, Culligan PJ, Williams DE, Smartt AE, et al. Compari-son of fecal indicators with pathogenic bacteria and rotavirus in groundwater. SciTotal Environ 2012;431:314–22.
Guo H, Zhang B, Wang G, Shen Z. Geochemical controls on arsenic and rare earthelements approximately along a groundwater flow path in the shallow aquifer ofthe Hetao Basin, Inner Mongolia. Chem Geol 2010;270(1–4):117–25.
Hazen T, Jiménez L, López de Victoria G, Fliermans C. Comparison of bacteria from deepsubsurface sediment and adjacent groundwater. Microb Ecol 1991;22(1):293–304.
Hohmann C, Morin G, Ona-Nguema G, Guigner J-M, Brown Jr GE, Kappler A. Molecular-level modes of As binding to Fe(III) (oxyhydr)oxides precipitated by the anaerobicnitrate-reducing Fe(II)-oxidizing Acidovorax sp. strain BoFeN1. Geochim CosmochimActa 2011;75(17):4699–712.
Howard G, Ahmed MF, Shamsuddin A, Mahmud SG, Deere D. Risk assessment of arsenicmitigation options in Bangladesh. J Health Popul Nutr 2006;24(3):346–55.
Huang JH, Kretzschmar R. Sequential extraction method for speciation of arsenate andarsenite in mineral soils. Anal Chem 2010;82(13):5534–40.
Huang J-H, Elzinga EJ, Brechbuehl Y, Voegelin A, Kretzschmar R. Impacts of Shewanellaputrefaciens strain CN-32 cells and extracellular polymeric substances on the sorptionof As(V) and As(III) on Fe(III)-(hydr)oxides. Environ Sci Technol 2011;45(7).
Hug SJ, Leupin OX, BergM. Bangladesh and Vietnam: different groundwater compositionsrequire different approaches to arsenic mitigation. Environ Sci Technol 2008;42(17):6318–23.
Islam FS, Gault AG, Boothman C, Polya DA, Charnock JM, Chatterjee D, et al. Role of metal-reducing bacteria in arsenic release from Bengal Delta sediments. Nature 2004;430(6995):68–71.
JenkinsMW, Tiwari SK, Darby J. Bacterial, viral and turbidity removal by intermittent slowsand filtration for household use in developing countries: experimental investigationand modeling. Water Res 2011;45(18):6227–39.
Klappenbach JA, Saxman PR, Cole JR, Schmidt TM. rrndb: the ribosomal RNA operon copynumber database. Nucleic Acids Res 2001;29(1):181–4.
Klueglein N, Zeitvogel F, Stierhof Y-D, Floetenmeyer M, Konhauser KO, Kappler A, et al.Potential role of nitrite for abiotic Fe(II) oxidation and cell encrustation during nitratereduction by denitrifying bacteria. Appl Environ Microbiol 2014;80(3):1051–61.
Kozuskanich J, Novakowski KS, Anderson BC. Fecal indicator bacteria variability in samplespumped from monitoring wells. GroundWater 2011;49(1):43–52.
Leber J, Rahman MM, Ahmed KM, Mailloux B, van Geen A. Contrasting influence ofgeology on E. coli and arsenic in aquifers of Bangladesh. Ground Water 2011;49(1):111–23.
Lee ZM-P, Bussema C, Schmidt TM. rrnDB: documenting the number of rRNA and tRNAgenes in bacteria and archaea. Nucleic Acids Res 2009;37(Suppl. 1):D489–93.

536 K.S. Nitzsche et al. / Science of the Total Environment 502 (2015) 526–536
Lleo MM, Bonato B, Tafi MC, Signoretto C, Pruzzo C, Canepari P. Molecular vs. culturemethods for the detection of bacterial faecal indicators in groundwater for humanuse. Lett Appl Microbiol 2005;40(4):289–94.
Mangoua-Allali ALC, Coulibaly L, Ouattara J-MP, Gourene G. Implementation of biosandfilters in rural area for drinking water production. Afr J Food Sci 2012;6(24).
McArthur JM, Ravenscroft P, Safiulla S, Thirlwall MF. Arsenic in groundwater: testingpollution mechanisms for sedimentary aquifers in Bangladesh. Water Resour Res2001;37(1):109–17.
Michael HA. An arsenic forecast for China. Science 2013;341(6148):852–3.Mondal P, Bhowmick S, Chatterjee D, Figoli A, van der Bruggen B. Remediation of inorganic
arsenic in groundwater for safe water supply: a critical assessment of technologicalsolutions. Chemosphere 2013;92(2):157–70.
Muehe EM, Kappler A. Arsenic mobility and toxicity in the environment — a review onbiogeochemistry, health and socio-economic effects, remediation and future predictions.Environ Chem 2014;5:483–95.
Murphy HM, McBean EA, Farahbakhsh K. A critical evaluation of two point-of-use watertreatment technologies: can they provide water that meets WHO drinking waterguidelines? J Water Health 2010;8(4).
Naujokas MF, Anderson B, Ahsan H, Aposhian HV, Graziano JH, Thompson C, et al. Thebroad scope of health effects from chronic arsenic exposure: update on a worldwidepublic health problem. Environ Health Perspect 2013;121(3):295–302.
Neumann A, Kaegi R, Voegelin A, Hussam A, Munir AKM, Hug SJ. Arsenic removal withcomposite iron matrix filters in Bangladesh: a field and laboratory study. EnvironSci Technol 2013;47(9):4544–54.
Ngai TKK, Shrestha RR, Dangol B, Maharjan M, Murcott SE. Design for sustainable devel-opment—household drinking water filter for arsenic and pathogen treatment inNepal. J Environ Sci Health A 2007;42(12):1879–88.
Noubactep C, Schöner A,Woafo P. Metallic iron filters for universal access to safe drinkingwater. Clean Soil Air Water 2009;37(12):930–7.
Ona-Nguema G, Morin G, Juillot F, Calas G, Brown GE. EXAFS analysis of arsenite adsorp-tion onto two-line ferrihydrite, hematite, goethite, and lepidocrocite. Environ SciTechnol 2005;39(23):9147–55.
Postma D. Concentration of Mn and separation from Fe in sediments—I. Kinetics andstoichiometry of the reaction between birnessite and dissolved Fe(II) at 10 °C.Geochim Cosmochim Acta 1985;49(4):1023–33.
Puspita ID, Kamagata Y, Tanaka M, Asano K, Nakatsu CH. Are uncultivated bacteria reallyuncultivable? Microbes Environ 2012;27(4):346.
Ratna Kumar P, Chaudhari S, Khilar KC, Mahajan SP. Removal of arsenic from water byelectrocoagulation. Chemosphere 2004;55(9):1245–52.
Raven KP, Jain A, Loeppert RH. Arsenite and arsenate adsorption on ferrihydrite: kinetics,equilibrium, and adsorption envelopes. Environ Sci Technol 1998;32(3):344–9.
Regelink IC, Weng L, Koopmans GF, van Riemsdijk WH. Asymmetric flow field-flow frac-tionation as a new approach to analyse iron-(hydr)oxide nanoparticles in soilextracts. Geoderma 2013;202–203:134–41.
Roden EE, Zachara JM. Microbial reduction of crystalline iron(III) oxides: influence of oxidesurface area and potential for cell growth. Environ Sci Technol 1996;30(5):1618–28.
Sherman DM, Randall SR. Surface complexation of arsenic(V) to iron(III) (hydr)oxides:structural mechanism from ab initio molecular geometries and EXAFS spectroscopy.Geochim Cosmochim Acta 2003;67(22):4223–30.
Smedley PL, Kinniburgh DG. A review of the source, behaviour and distribution of arsenicin natural waters. Appl Geochem 2002;17(5):517–68.
Stachowicz M, Hiemstra T, van Riemsdijk WH. Multi-competitive interaction of As(III)and As(V) oxyanions with Ca2+, Mg2+, PO4
3−, and CO32− ions on goethite. J Colloid
Interface Sci 2008;320(2):400–14.
Stauber CE, Ortiz GM, Loomis DP, Sobsey MD. A randomized controlled trial of the con-crete Biosand filter and its impact on diarrheal disease in Bonao, Dominican Republic.Am J Trop Med Hyg 2009;80(2):286–93.
Stookey LL. Ferrozine— a new spectrophotometric reagent for iron. Anal Chem1970;42:779.TanWF, Lu SJ, Liu F, Feng XH, He JZ, Koopal LK. Determination of the point-of-zero, charge
of manganese oxides with different methods including an improved salt titrationmethod. Soil Sci 2008;173(4):277–86.
Tobias R, BergM. Sustainable use of arsenic-removing sand filters in Vietnam: psychologicaland social factors. Environ Sci Technol 2011;45(8):3260–7.
Tournassat C, Charlet L, Bosbach D, Manceau A. Arsenic(III) oxidation by birnessite andprecipitation of manganese(II) arsenate. Environ Sci Technol 2002;36(3):493–500.
Tufano KJ, Reyes C, Saltikov CW, Fendorf S. Reductive processes controlling arsenic reten-tion: revealing the relative importance of iron and arsenic reduction. Environ SciTechnol 2008;42(22):8283–9.
UNICEF, United Nations Children's Fund, World Health Organization. Diarrhoea: whychildren are still dying and what can be done; 2009.
van Beek CGEM, Hiemstra T, Hofs B, Nederlof MM, Van Paassen JAM, Reijnen GK. Homo-geneous, heterogeneous and biological oxidation of iron(II) in rapid sand filtration. JWater Supply Res Technol AQUA 2012;61(1):1–13.
van Geen A, Zheng Y, Versteeg R, Stute M, Horneman A, Dhar R, et al. Spatial variability ofarsenic in 6000 tube wells in a 25 km2 area of Bangladesh. Water Resour Res 2003;39(5):1140.
van Geen A, Ahmed KM, Akita Y, AlamMJ, Culligan PJ, Emch M, et al. Fecal contaminationof shallow tubewells in Bangladesh inversely related to arsenic. Environ Sci Technol2011;45(4).
van Geen A, Bostick BC, Thi Kim Trang P, Lan VM, Mai N-N, Manh PD, et al. Retardation ofarsenic transport through a Pleistocene aquifer. Nature 2013;501(7466):204–7.
Villinski JE, O'Day PA, Corley TL, Conklin MH. In situ spectroscopic and solution analyses ofthe reductive dissolution of MnO2 by Fe(II). Environ Sci Technol 2001;35(6):1157–63.
Voegelin A, Kaegi R, Berg M, Nitzsche KS, Kappler A, Trang P, et al. Solid-phase character-ization of an effective household sand filter for As, Fe and Mn removal from ground-water in Vietnam. Environ Chem 2009:566–78.
Weber F-A, Hofacker AF, Voegelin A, Kretzschmar R. Temperature dependence and cou-pling of iron and arsenic reduction and release during flooding of a contaminatedsoil. Environ Sci Technol 2009;44(1):116–22.
WHO, World Health Organization. Guidelines for drinking-water quality, Geneva,Switzerland; 1997.
WHO, World Health Organization. Guidelines for drinking-water quality, Geneva,Switzerland; 2011.
Winkel LHE, Pham TKT, Vi ML, Stengel C, Amini M, Nguyen TH, et al. Arsenic pollution ofgroundwater in Vietnam exacerbated by deep aquifer exploitation for more than acentury. Proc Natl Acad Sci U S A 2011;108(4):1246–51.
Ying SC, Kocar BD, Fendorf S. Oxidation and competitive retention of arsenic betweeniron- and manganese oxides. Geochim Cosmochim Acta 2012;96:294–303.
Zengler K. Central role of the cell inmicrobial ecology. Microbiol Mol Biol Rev 2009;73(4):712–29.
Zobrist J, Dowdle PR, Davis JA, Oremland RS. Mobilization of arsenite by dissimilatoryreduction of adsorbed arsenate. Environ Sci Technol 2000;34(22):4747–53.