Embed Size (px)
Citation preview

Proceedings of the 4th International Conference on
Research Frontiers in Chalcogen Cycle Science & Technology
May 28 – 29 | 2015 Delft, The Netherlands
Editors: Eldon R. Rene Susma Bhattarai Yarlagadda V. Nancharaiah Piet N. L. Lens

G16 CONFERENCE
Proceedings of the 4th
International Conference on Research Frontiers in Chalcogen Cycle Science & Technology
Editors: Eldon R. Rene, Susma Bhattarai, Yarlagadda V. Nancharaiah and Piet N. L. Lens
UNESCO-IHE, Delft, The Netherlands, May 2015

HOW TO CITE ARTICLES FROM THIS PROCEEDINGS BOOK:
Kaley, N. M., Panda, A. and Behera, R. N. (2015) Computational Study of E…N (E=Se/Te) Intramolecular Interactions in Diaryl Dichalcogenides: Effect on E–E Bond Strength and Antioxidant Activity. In: Rene, E. R., Bhattarai, S., Nancharaiah, Y. V. and Lens, P. N. L (eds.), Proceedings of the 4th International Conference on Research Frontiers in Chalcogen Cycle Science & Technology, Delft, The Netherlands, May 28-29, pp: 3-9.

I
PREFACE TO G16 CONFERENCE
CHALCOGENS are elements belonging to periodic table group 16 (G16) and include the elements oxygen, sulfur, selenium and tellurium, radioactive polonium and synthetic ununhexium. Among these six elements, oxygen and sulfur are non-metals, while selenium, tellerium and polonium are metalloid semi-conductors. These elements, their bio-geological cycles and interactions with metals, still have many un-revealed scientific curiosities and technological potentials. Despite their appealing fundamental and practical importance, biogenic group 16 compounds have so far been less intensively investigated. Over the past two decades, the finer aspects of the biogeochemical cycles of these chalcogens, particularly selenium, have nevertheless begun to emerge. The chalcogen cycles also form the basis of several environmental technologies to treat pollution, including the biodegradation of organics driven by chalcogen bioconversion, nutrient removal processes based on chalcogen redox processes and the formation of thermodynamically stable chalcogen stocks. The first G16 conference was held in June 2008 in Wageningen, The Netherlands, on the occasion of the conclusion of the Marie Curie Actions grant, "Novel Biogeological Methods for Heavy Metal Removal", headed by Prof Piet N. Lens. The Marie Curie Actions of the European Union aims in contributing towards improving the quality and increasing the scientific potential of the European Community. The second and third G16 conferences were held in May 2010 and 2013, respectively, in Delft, The Netherlands. These conferences overviewed a wide range of the topics related to chalcogen research. The Fourth International Conference on Research Frontiers in Chalcogen Cycle Science & Technology (May 2015, Delft, The Netherlands) serves as a platform for academicians, researchers, scientists, plant managers, and industrial experts to discuss and exchange the latest scientific and technological advancements in chalcogen-based research. Apart from enabling attendees to meet their peers and develop professional contacts and collaborations, this conference also promotes discussion on stimulating scientific topics and innovations. Given the rapidity at which science is advancing in all of the areas covered by G16, we firmly believe that this proceedings book will be a valuable contribution to the field of chalcogen research, which ranges from basic studies on the (bio)chemistry of G16 elements to the production, properties and speciation of chalcogen compounds, interactions between and amongst organochalcogen compounds, reduction of chalcogen oxyanions, chalcogen stress in microorganisms, and biogenic production of chalcogenides in novel (bio)reactor configurations.
May 2015
G16 Organizers
Eldon R. Rene, Susma Bhattarai, Yarlagadda V. Nancharaiah and Piet N. L. Lens
UNESCO-IHE, Delft, The Netherlands

II
SCIENTIFIC COMMITTEE
• Aijie Wang (Harbin Institute of Technology, China) • Ajit Annachatre (Asian Institute for Technology, Thailand) • Bo Svensson (Linkoping University, Sweden) • Christian Kennes (University of La Coruña. Spain) • Claus Jacob (Saarland University, Germany) • Davide Zannoni (University of Bologna, Italy) • Derek Lovley (University of Massachusetts, USA) • Eldon Rene (UNESCO-IHE, The Netherlands) • Eric van Hullebusch (Universiy Paris-Est, France) • Erkan Sahinkaya (Istanbul Medeniyet University, Turkey) • Eugênio Foresti (Universidade de São Paulo, Brazil) • Filip Meysman (NIOZ, The Netherlands) • Fons Stams (Wageningen University, The Netherlands) • Gerard Muyzer (University Amsterdam, The Netherlands) • Gijs Du Laing (University Gent, Belgium) • Giovanni Esposito (University Cassino, Italy) • Herman Kramer (TUDelft, The Netherlands) • Jaakko Puhakka (University of Eastern Finland, Finland) • John Lloyd (University of Manchester, UK) • Jos Vink (Deltares, The Netherlands) • Kai Finster (Aarhus University, Denmark) • Kannan Pakshirajan (IIT Guwahati, India) • Karel Keesman (Wageningen University, The Netherlands) • Norbert Jordan (HZDR Dresden-Rossendorf, Germany) • Paul Mason (Utrecht University, The Netherlands) • Piet Lens (UNESCO-IHE, The Netherlands) • Robin Gerlach (Center for Biofilm Engineering, USA) • Ronald Oremland (US Geological Survey, USA) • Venkata Yarlagadda (UNESCO-IHE, The Netherlands)

III
SPONSORS AND PARTNERS _________________________________________________________________________________
The Marie Curie Actions of the European Union aims to contribute towards improving the quality and increasing the scientific potential of the European Community.
The SENSE Research School promotes an integrated understanding of environmental change in terms of the mechanisms that causes it and the consequences that result from it.
The Netherlands Organization for Scientific Research invests in world-class research and scientists who work on solutions to fascinating questions and challenges with full conviction.
The European Federation of Biotechnology promotes safe, sustainable and beneficial use of life sciences, research and innovation at the cutting edge of biotechnology.
COST (European Cooperation in Science and Technology) is one of the longest-running European frameworks supporting cooperation among scientists and researchers across Europe.

IV
ACKNOWLEDGMENTS
________________________________________________________________________________
The G16 conference organizing and scientific committee members gratefully thank and acknowledge the authors who contributed in preparing high quality manuscripts related to Chalcogen research, and such contributions for the G16 proceedings book would certainly enable a surpassingly excellent technical program and a successful interactive conference. All of the authors who submitted papers, both accepted and rejected, are responsible for keeping the G16 conference program vital.
We extend our thanks and appreciation to the PhD students from ETeCOS3
(Environmental Technologies for Contaminated Solids, Soils and Sediments) PhD programme for their support. We acknowledge the voluntary help by Izabela Kolodziej (Germany) in designing the flyers and Alicja Przewoźniak (Poland) for her database support. Special thanks to the following staff members from UNESCO-IHE for their contributions to this year’s conference:
- Chantal Groenendijk & Vanessa Temminck - van Elmpt (EEWT)
- Emma Meurs & Peter Stroo (OR)
- Eric Pluim, Sander Steenweg, Eva de Vree & Ed Gerritsen van der Hoop (CS)
Thanks to The Marie Curie Actions of the European Union, COST & UNESCO-IHE, the continuity of this unique conference has been guaranteed.
G16 Organizers
Eldon R. Rene, Susma Bhattarai, Yarlagadda V. Nancharaiah & Piet N. L. Lens
Local organizing committee members
Lea Chua Tan & Shrutika L. Wadgaonkar
UNESCO-IHE, Delft, The Netherlands

V
TABLE OF CONTENTS
Page
PREFACE TO G16 CONFERENCE I
SCIENTIFIC COMMITTEE II
SPONSORS AND PARTNERS III
ACKNOWLEDGMENTS IV
TABLE OF CONTENTS V
PRODUCTION, PROPERTIES & SPECIATION OF CHALCOGEN COMPOUNDS
Computational Study of E…N (E=Se/Te) Intramolecular Interactions in Diaryl Dichalcogenides: Effect on E–E Bond Strength and Antioxidant Activity Nisheal Michael Kaley, Arunashree Panda and Raghu Nath Behera Mixed Core CdS@ZnS Nanocrystals: Synthesis, Cadmium Dissolution and Cancer Cells Management Peter Baláž, Zdenka Bujňáková, Erika Dutková, Matej Baláž, Anna Zorkovská, Jaroslav Kováč, Jaroslav Kováč, Jr., Martin Kello, Gabriela Mojžišová and Ján Mojžiš Theoretical Investigation of Glutathione Peroxidase like Activity of Some Conformationally Restricted Dichalcogenides Arunashree Panda and Raghu Nath Behera
(BIO)CONVERSION, SPECIATION OF CHALCOGENS & THE ROLE OF METALS
Adsorption of Heavy metals from Acid Mine Drainage by Coal Bottom Ash Varinporn Asokbunyarat, Eric D. van Hullebusch, Piet N. L. Lens and Ajit P. Annachhatre Chemical Speciation of Sulfur and Metals in Biogas Reactors - Implications for Cobalt and Nickel Bio-uptake Processes Sepehr Shakeri Yekta, Ulf Skyllberg, Åsa Danielsson, Annika Björn and Bo H. Svensson Exploring the Fungal Protein Cadre in the Biosynthesis of PbSe Quantum Dots Jaya Mary Jacob, Sumit Sharma and Raj Mohan B Extracellular Production of Tellurium Nanoprecipitates by the Photosynthetic Bacterium Rhodobacter capsulatus Roberto Borghese, Marco Brucale, Gianuario Fortunato, Francesco Valle, Massimo Cavallini and Davide Zannoni
Page No.
3
11
19
29
41
53
63

VI
Optimizing the Fluorescence of Biogenic PbSe Quantum Particles for the Efficient Cadmium (Cd2+
Jaya Mary Jacob and Raj Mohan Balakrishnan ) Ion Sensing in Solution
Selenate Bioreduction in the Presence of Nitrate and Sulfate Lea Chua Tan, Yarlagadda V. Nancharaiah, Eric van Hullebusch and Piet N.L. Lens Selenite Bioreduction by Anaerobic Granular Sludge in Presence of Heavy Metals Joyabrata Mal, Y.V. Nancharaiah, Eric D. van Hullesbusch and Piet N.L. Lens
EMERGING APPLICATION AREAS
Biological Sulfide Removal from Anaerobically Treated Domestic Sewage Graziella P. P. Garcia, Renata C. O. Diniz, Sarah K. Bicalho, Vitor A. S. Franco, Alyne D. Pereira, Emanuel M. F. Brandt, Carlos A. L. Chernicharo and Juliana Calabria Araújo Nitrate-Mediated Microbially Enhanced Oil Recovery (N-MEOR) from Model Upflow Bioreactors Fatma Gassara, Navreet Suri and Gerrit Voordouw Rogoznica Lake - an Extreme Seawater Environment Hosting Specific Sulfate-reducing Bacterial Community Milan Čanković, Ines Petrić and Irena Ciglenečki Sulphate Reduction by Marine Sediments Hosting Anaerobic Oxidation of Methane from Gulf of Cadiz and Marine Lake Grevelingen Susma Bhattarai, Zita Naangmenyele, Chiara Cassarini, Graciela Gonzalez-Gill, Eldon R. Rene and Piet N. L. Lens
(BIO)REACTOR SYSTEMS
Kinetics of Anaerobic Microbial Assemblages from Acid Sulfate Soil for Methane Formation Nusara Sinbuathong, Pramote Sirirote, Roj Khun-anake, Boonsong Sillapacharoenkul,Warawut Chulalaksananukul and Suphang Chulalaksananukul Novel Insights into Biogenesis Mechanisms of Selenium Nanoparticles in Stenotrophomonas maltophilia SeITE02 Silvia Lampis, Cristina Bertolini, Emanuele Zonaro, Daniela Cecconi, Raymond Turner, Clive S. Butler and Giovanni Vallini Strategy of COD Degradation of Wastewater from the Cleaning of Food and Fodder Transportation Nguyen Van Than and Wolfgang Pffeifer
71
81
87
95
105
115
125
133
141
147

VII
Biosorption of Zn (II) with Elemental Selenium Nanoparticles Immobilized Fungal Pellets of Phanerochaete chrysosporium Erika J. Espinosa-Ortiz , Manisha Shakya, Eldon R. Rene, Eric D. van Hullebush and Piet N. L. Lens Biodegradation Kinetics of Methanol and Thiosulphate under Anaerobic Conditions Mekonnen M. Tarekegn, Eldon R. Rene, Jack van de Vossenberg and Piet N. L. Lens
161
171

VIII

1
PRODUCTION, PROPERTIES AND INTERACTIONS OF CHALCOGEN COMPOUNDS

2

3
Computational Study of E…N (E=Se/Te) Intramolecular Interactions in Diaryl
Dichalcogenides: Effect on E–E Bond Strength and Antioxidant Activity
Nisheal Michael Kaley, Arunashree Panda and Raghu Nath Behera
1
Department of Chemistry, Birla Institute of Technology & Science, Pilani – K. K. Birla Goa Campus, Zuarinagar - 403726, Goa, India 1
Corresponding author: [email protected]
______________________________________________________________________________
Abstract Organochalcogen compounds having intramolecular E…Y interactions (where E = Se/Te; Y = O, N etc.) found applications in several areas, including enzyme mimetics (e.g. diaryl diselenide mimics of glutathione peroxidase). Computational methods based on electronic structure calculations have been proved to be very useful in understanding the nature and magnitude of such intramolecular interactions. The detailed studies on such systems suggest that the collinear geometry between the donor atom (Y) and the σ*E–X acceptor orbital helps in maximizing the orbital interaction resulting a distorted T-shaped geometry around the divalent chalcogen atom. In our recent studies, we have used DFT/NBO/AIM methods to investigate the nature of the E…N (E = Se/Te) interactions and the effect of substituents, chelate ring size, rigidity etc. on these interactions in several organochalcogen compounds. In this work, we have extended this methodology to study intramolecular E…N (E = Se/Te) interactions and their effect in the E–E bond strength in a series of diaryl dichalcogenides. The NBO, NBO deletion and AIM analyses suggest that the E…N interaction is predominantly covalent in nature and involves nN → σ*E–E orbital interaction. We also find an opposite trends in the NBO/NBO deletion energies and the E–E bond distances among the studied dichalcogenides. This suggests that as the E…N interactions become stronger, more electron density is pumped from nitrogen lone pairs to anti-bonding σ*E–E
Keywords: Atoms-in-Molecule (AIM), intamolecular interaction, Natural Bond Orbital, Organo- chalcogen compound
orbitals and possibly modify glutathione peroxidase like activity.
1. INTRODUCTION The structures of many main group compounds often reveal short distances between a heavy p-block element and one or more atoms which possess lone pair of electrons. These distances are between a single bond and a van der Waals interatomic distance and cannot be dismissed as “non-bonded interactions”. Alcock used the term “Secondary Bonding Interactions”(SBIs) in 1970 for these types of interactions [1]. These attractive interactions are the result of combination of electrostatic and orbital contributions. The former arises from local partial charges and the later consists of the donation of electrons from a donor (Y) into the σ* molecular orbital corresponding to the primary E-X bond [2]. Furthermore, the secondary bond axis (E…Y) is nearly collinear with a (primary) bond between the central heavy atom (E) and a more electronegative atom (X). The chalcogens (S, Se and Te) display both intra and intermolecular interactions with other electron-rich atoms (such as nitrogen, halogens and other chalcogen atoms) leading to the expansion of the valence shell of the chalcogen atoms. More intriguing are the short intramolecular contacts that occur between atoms that have closed shells due to their many actual and proposed applications. Consequently, systematic investigations on the origin, magnitude and theoretical interpretation of such interactions have been carried out throughout the world [3-10].
These interactions which stabilize the key intermediates in the catalytic cycle play an important role in determining the biological activity of organoselenium compounds. Glutathione peroxidase (GPx) is the first selenoprotein discovered in mammals that protects biomolecules from oxidative damage. The close proximity of two nitrogen containing amino acids (Trp and Gln) to the SeCys residue in GPx led researchers to design molecules with nitrogen either directly bonded to Se or close enough to form an intramolecular interaction. Ebselen (2-phenyl-1,2-benzisoselenazol-3(2H)-one) was the first successful synthetic GPx mimic reported in the literature [11]. The evidence that a diselenide should be a key intermediate in the catalytic mechanism of

4th International Conference on Research Frontiers in Chalcogen Cycle Science & Technology
4
the ebselen instigated several research groups to take notice in this class of compounds as GPx mimics. It has been experimentally suggested that the catalytically active form of the enzyme is either selenolate anion (E-Se-) or selenol (ESeH) [12]. However, one group of diselenides react with thiol to generate the reactive selenol which in turn reduce the peroxides while the other group effectively reduce the peroxides in the presence of thiols through SeII-SeIV redox cycle without producing any selenols [13].
Despite the availability of the detailed experimental information, the catalytic mechanism of the “GPx mimics” and the factors controlling their activities are not known with certainty. The density functional study presented in this paper will not only allow for a detailed study of the nature and strength of the E…N (E = Se or Te) interactions but also will provide the energy and structures of the intermediates in the possible catalytic cycle. This study is an attempt to understand the GPx-like mechanism of several synthetic diorganodichalcogenides.
2. MATERIALS AND METHODS We have studied the E…N (E = Se, Te) non-bonded interactions in four diselenides (1a – 4a) and the corresponding ditellurides (1b – 4b) as given in Figure 1. All these compounds have tertiary nitrogen with different substituents and flexibility. Our aim is to study the nature and effect of E…N interactions on E–E bond strength.
E
NMe2
2 E
N
2
E
N
2
NMe2
E 2
1 2
34(a) E = Se; (b) E = Te
Figure 1.The dichalcogenides 1a-4a and 1b-4b investigated in this study.
2.1. Computational details Gaussian09 [14] was used as source program for geometry optimization, the natural bond orbital (NBO) [15]
3. RESULTS AND DISCUSSION
calculations, NBO deletion analysis and wavefunction calculation for Atoms-in-Molecules (AIM) [16] analysis. Following our previous work [7-9], all the geometries were fully optimized using the hybrid B3LYP exchange correlation functional [17] with 6-31G(d) basis set, except for Tellurium, where we use LanL2DZ basis set. Frequency calculations were performed for all the compounds to check (no imaginary frequencies) the stationary points as minima on the potential energy surface. The topological analysis of electron density with Badar’s theory of Atoms-in-molecules (AIM) was analyzed using AIM2000 [18] software. Since bond path cannot be traced to the nuclei of atoms described by effective core potential [16d], for calculation of wavefunction for all Tellurium compounds, we run a single point calculations at the optimized geometries (at B3LYP/LanL2DZ level) using B3LYP/DZVP(DFT orbital). Bond dissociation enthalpy is calculated as the enthalpy change of the reaction A–A → 2A∙ in the gas phase at the standard condition. In order to understand the GPx like activity of diselenide, free energy change has been calculated for various reaction steps of the catalytic cycle at B3LYP/6-31G(d) level.
Following our recent work [7-9], we have employed the B3LYP/6-31G(d)/LanL2DZ level of theory to study the E…N (E = Se, Te) non-bonded interactions. Selected structural parameters of the optimized geometries of the compounds are summarized in Table 1. The atomic distances between E (= Se, Te) and N atoms (rE…N) varies from 2.62 Å to 2.8 Å for Se complexes and between 2.74 Å to 3.1 Å for Te complexes. The N…E–E…N atoms are found to be almost collinear for all the studied compounds. Comparison of rE…N
with the respective van der Waals radius indicates the presence of a hypervalent E…N interaction for all the studied compounds. compounds.
Computational Study of E…N (E=Se/Te) Intramolecular Interactions in Diaryl Dichalcogenides: Effect on E–E Bond Strength and Antioxidant Activity
5
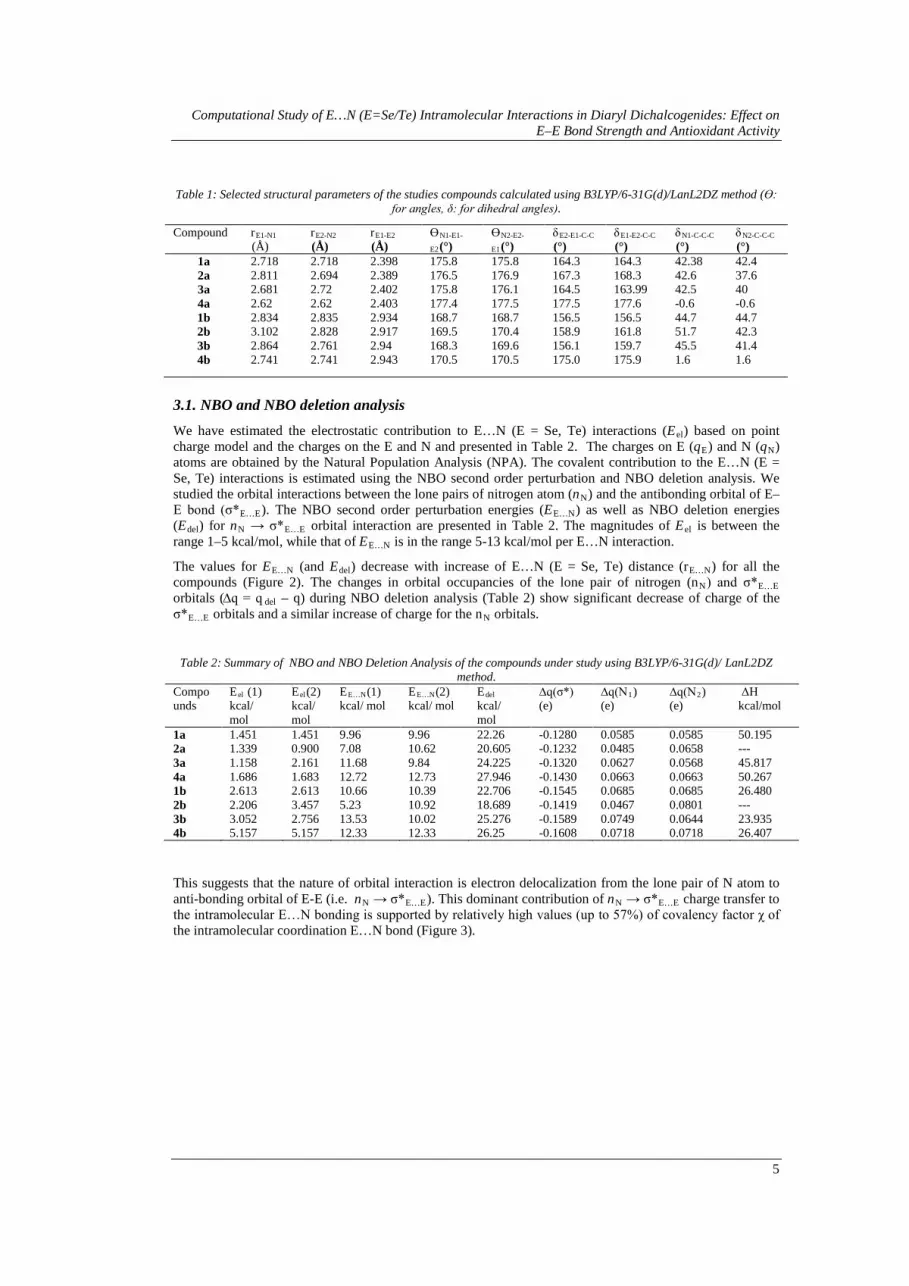
Table 1: Selected structural parameters of the studies compounds calculated using B3LYP/6-31G(d)/LanL2DZ method (ϴ: for angles, δ: for dihedral angles).
Compound rE1-N1 r(Å)
E2-N2 r(Å)
E1-E2 Ө(Å)
N1-E1-
E2
Ө(°)
N2-E2-
E1
δ(°)
E2-E1-C-C δ(°)
E1-E2-C-C δ(°)
N1-C-C-C δ(°)
N2-C-C-C
(°) 1a 2.718 2.718 2.398 175.8 175.8 164.3 164.3 42.38 42.4 2a 2.811 2.694 2.389 176.5 176.9 167.3 168.3 42.6 37.6 3a 2.681 2.72 2.402 175.8 176.1 164.5 163.99 42.5 40 4a 2.62 2.62 2.403 177.4 177.5 177.5 177.6 -0.6 -0.6 1b 2.834 2.835 2.934 168.7 168.7 156.5 156.5 44.7 44.7 2b 3.102 2.828 2.917 169.5 170.4 158.9 161.8 51.7 42.3 3b 2.864 2.761 2.94 168.3 169.6 156.1 159.7 45.5 41.4 4b 2.741 2.741 2.943 170.5 170.5 175.0 175.9 1.6 1.6
3.1. NBO and NBO deletion analysis We have estimated the electrostatic contribution to E…N (E = Se, Te) interactions (Eel) based on point charge model and the charges on the E and N and presented in Table 2. The charges on E (qE) and N (qN) atoms are obtained by the Natural Population Analysis (NPA). The covalent contribution to the E…N (E = Se, Te) interactions is estimated using the NBO second order perturbation and NBO deletion analysis. We studied the orbital interactions between the lone pairs of nitrogen atom (nN) and the antibonding orbital of E–E bond (σ*E…E). The NBO second order perturbation energies (EE…N) as well as NBO deletion energies (Edel) for nN → σ*E…E orbital interaction are presented in Table 2. The magnitudes of Eel is between the range 1–5 kcal/mol, while that of EE…N
The values for E
is in the range 5-13 kcal/mol per E…N interaction.
E…N (and Edel) decrease with increase of E…N (E = Se, Te) distance (rE…N) for all the compounds (Figure 2). The changes in orbital occupancies of the lone pair of nitrogen (nN) and σ*E…E orbitals (∆q = q del – q) during NBO deletion analysis (Table 2) show significant decrease of charge of the σ*E…E orbitals and a similar increase of charge for the nN
orbitals.
Table 2: Summary of NBO and NBO Deletion Analysis of the compounds under study using B3LYP/6-31G(d)/ LanL2DZ method.
Compounds
Eel E (1) kcal/ mol
el E(2) kcal/mol
E…N E(1) kcal/ mol
E…N E(2) kcal/ mol
del ∆q(σ*) (e)
kcal/ mol
∆q(N1 ∆q(N) (e)
2 ΔH kcal/mol
) (e)
1a 1.451 1.451 9.96 9.96 22.26 -0.1280 0.0585 0.0585 50.195 2a 1.339 0.900 7.08 10.62 20.605 -0.1232 0.0485 0.0658 --- 3a 1.158 2.161 11.68 9.84 24.225 -0.1320 0.0627 0.0568 45.817 4a 1.686 1.683 12.72 12.73 27.946 -0.1430 0.0663 0.0663 50.267 1b 2.613 2.613 10.66 10.39 22.706 -0.1545 0.0685 0.0685 26.480 2b 2.206 3.457 5.23 10.92 18.689 -0.1419 0.0467 0.0801 --- 3b 3.052 2.756 13.53 10.02 25.276 -0.1589 0.0749 0.0644 23.935 4b 5.157 5.157 12.33 12.33 26.25 -0.1608 0.0718 0.0718 26.407
This suggests that the nature of orbital interaction is electron delocalization from the lone pair of N atom to anti-bonding orbital of E-E (i.e. nN → σ*E…E). This dominant contribution of nN → σ*E…E
charge transfer to the intramolecular E…N bonding is supported by relatively high values (up to 57%) of covalency factor χ of the intramolecular coordination E…N bond (Figure 3).

4th International Conference on Research Frontiers in Chalcogen Cycle Science & Technology
6
Figure 2. Variation of NBO second order perturbation energies (ESe/Te…N) with the Se/Te…N distances (rSe/Te…N
).
Figure 3. Variation of covalency factor with the Se/Te…N distances (rSe/Te…N
).
3.2. Atoms-in-Molecules (AIM) analysis We also studied the non-bonded E…N interaction using the Bader’s theory of Atoms-in-Molecules (AIM) [16] which states that atoms that chemically bonded atoms have their nuclei linked by a (single) bond path (a single line of locally maximum electron density) and they share a bond critical point (BCP). The presence of BCP between E (= Se, Te) and N atoms and the ring critical point (RCP) for the five membered ring formed with the phenyl ring due to E…N interaction was observed for all the studied compounds. The AIM analysis data of the electron density (ρE…N
2...NE∇ ), its Laplacian ( ) and the total energy density (HE…N ) at the Bond
Critical Point (BCP) along with the electron density at the ring critical point (ρrcp
) due to E…N interactions are given in Table 3.

Computational Study of E…N (E=Se/Te) Intramolecular Interactions in Diaryl Dichalcogenides: Effect on E–E Bond Strength and Antioxidant Activity
7
Table 3: Selected parameters from AIM analysis
Comp ρE…N (e/Å3
ρ)
rcp (e/Å3
2...NE∇
)
(e/Å5H
) E…N
(e/Å4
ρ
)
E…E (e/Å3)
1a 0.02991 0.01607 0.07208 -0.00052 0.09677
2a 0.02492 0.0142 0.06148 0.00012 0.09806
3a 0.03195 0.01649 0.076312 -0.00077 0.09623
4a 0.03613 0.017214 0.08592 -0.001445 0.09640
The values of ρE…N for the studied compounds correlate well with the corresponding Se…N distances (Figure 4) and range from 0.024 to 0.036 e/Å3 which are in between typical covalent bond (e.g. ρC-C ≈ 0.24 e/Å3) and that of hydrogen bond (ρH-Bond ≈ 0.002 – 0.04 e/Å3
). The sign of Laplacian and the total energy density at BCP suggest a dominant covalent nature of the Se…N interaction.
Figure 4. Correlation plot of the NBO second order perturbation energies (EE…N) with the electron density (ρE…N) at the
bond critical point of E…N interaction (E= Se). ρE…N is in unit of e/Å3
.
3.3. Catalytic Activity of Diselenide As mentioned in the introduction, the mechanism of GPx like activity is very complex and there is no unique established mechanism of peroxidase activity for diselenides. We tried one of our diselenide (4a) using the thiol route. We study the following mechanism (Scheme 1) believe to be followed by diphenyldiselenide. The free energy change for each step has been evaluated and is presented in Table 4. As clear from the free energy change, the reactions in second and third steps in the catalytic cycle are spontaneous while the first and fourth steps are unfavourable.

4th International Conference on Research Frontiers in Chalcogen Cycle Science & Technology
8
RSeH
RSeOH
RSe-SPh
H2O2
H2O PhSH
H2O
PhSHPhSSPh
R =
NMe2
Step 1
Step 2 Step 3
Step 4
RSe-SeR
Scheme 1
Table 4: The free energy change for the reaction steps (Scheme 1) of peroxidase activity of diselenide
Steps Free energy change (kcal/mol)
Step 1 17.372 Step 2 -36.632 Step 3 -46.835 Step 4 18.748
4. CONCLUSIONS We have applied the density functional methods to study the nature and strength of intramolecular E…N (E = Se/Te) interactions in a series of diaryl dichalcogenides. Similar to our earlier studies on organochalcogens, these interactions are found to be combination of both electrostatic and covalent interaction. The strength of the electrostatic interaction Eel, increases in the order organoselenium compounds < organtotellurium compounds, and correlate well with the charge on chalcogens. The nature of the E…N interaction is found to be predominantly covalent in nature and involves nN → σ*E–E orbital interaction. The electron density at the E…N bond critical point (ρE…N), obtained from AIM analysis, exhibits a fairly good correlation with the E...N distance. The total energy density at BCP (HE…N
ACKNOWLEDGMENTS
) are all negative (except for one compound) indicating dominant covalent interaction, as predicted by NBO analysis. The bond dissociation enthalpy of E–E bond is about 50 kcal/mol for the diselenides and about 25 kcal/mol for the ditellurides. From the calculated free energy changes, it appears that the diselenide 4a does not follow the pathways similar to that of diphenyldiselenide for GPx like activity.
One of us (AP) thanks DST, New Delhi for financial support under WOS-A scheme (SR/WOS-A/CS-04/2014). The support from BITS, Pilani - K. K. Birla Goa Campus is gratefully acknowledged.
REFERENCES [1] Alcock NW. Secondary bonding to nonmetallic elements. Adv Inorg Chem Radiochem 1972; 15: 1–58. [2] Alcock NW. Bonding and structure: structural principles in inorganic and organic chemistry, Ellis Horwood,
Chichester, 1990. [3] Mukherjee AJ, Zade SS, Singh HB, Sunoj RB. Organoselenium chemistry: role of intramolecular interaction. Chem
Rev 2011; 110: 4357–4416 and references therein.

Computational Study of E…N (E=Se/Te) Intramolecular Interactions in Diaryl Dichalcogenides: Effect on E–E Bond Strength and Antioxidant Activity
9
[4] Panda A, Singh HB. NMR of Organoselenium and Organotellurium Compounds, The Chemistry of organic Selenium
and Tellurium Compounds Vol. IV, (Ed. Z. Rappoport), Wiely, Chichester, 2013 (In Press) [5] Sunoj RB. Theoretical aspects of organoselenium chemistry, PATAI’S chemistry of functional groups, (Ed. Z.
Rappoport), Wiely, Chichester, 2011 (DOI: 10.1002/9780470682531.pat0565) [6] Longo RL, Menezes PH. Theoretical and computational aspects of organotellurium compounds, PATAI’S chemistry of
functional groups, (Ed. Z. Rappoport), Wiely, Chichester, 2011 (DOI: 10.1002/9780470682531.pat0570). [7] Panda A and Behera RN. J . Hazardous Materials 2014; 269: 2-8. [8] Behera RN and Panda A. RSC Advances 2012; 2: 6948-6956. [9] Panda A and Behera RN. Computational and Theoretical Chemistry 2012; 999: 215-224. [10] (a) Panda A. Coord. Chem. Rev.2009; 253: 1056-1098 (b) Panda A. Coord. Chem. Rev 2009; 253: 1947-1965 (c)
Panda A, Panda S, Srivastava K and Singh HB. Inorg. Chim. Acta 2011; 372: 17-31. [11] Müller A, Cadenas E, Graf P, and Sies H. Biochem Phalmacol 1984; 33: 3235-3240. [12] Epp O, Ladenstein R, and Wendel A. Eur. J. Biochem. 1983; 133: 51-69. [13] Bhabak KP, Mugesh G. Chem. Eur. J. 2008: 14: 8640. [14] Gaussian 09, Revision B.01, Frisch MJ, Trucks GW, Schlegel HB, Scuseria GE, Robb MA, Cheeseman JR, Scalmani
G, Barone V, Mennucci B, Petersson GA, Nakatsuji H, Caricato M, Li X, Hratchian HP, Izmaylov AF, Bloino J, Zheng G, Sonnenberg JL, Hada M, Ehara M, Toyota K, Fukuda R, Hasegawa J, Ishida M, Nakajima T, Honda Y, Kitao O, Nakai H, Vreven T, Montgomery JA, Peralta JE, Ogliaro F, Bearpark M, Heyd JJ, Brothers E, Kudin KN, Staroverov NV, Keith T, Kobayashi R, Normand J, Raghavachari K, Rendell A, Burant JC, Iyengar SS, Tomasi J, Cossi M, Rega N, Millam JM, Klene M, Knox JE, Cross JB, Bakken V, Adamo C, Jaramillo J, Gomperts R, Stratmann RE, Yazyev O, Austin AJ, Cammi R, Pomelli C, Ochterski JW, Martin RL, Morokuma K, Zakrzewski VG, Voth GA, Salvador P, Dannenberg JJ, Dapprich S, Daniels AD, Farkas O, Foresman JB, Ortiz JV, Cioslowski J, and Fox DJ. Gaussian, Inc., Wallingford CT, 2010.
[15] (a) Reed AE, Curtiss LA, Weinhold F. Chem. Rev. 1988; 88: 899-926 (b) Reed AE, Curtiss LA, Carpenter JE, Weinhold F. NBO version 3.1.
[16] (a) Bader RFW. Atoms in Molecules: A Quantum Theory, Oxford University Press, New York, 1990 (b) Popelier P. Atoms in Molecules: An Introduction, Pearson, Harlow, 2000 (c) Gillespie RJ, Popelier PLA. Chemical Bonding and Molecular Geometry, Oxford University Press, New York, 2001 (d) Matta CF and Boyd RJ. The Quantum Theory of Atoms in Molecules, Wiley-VCH, 2007.
[17] (a) Lee C, Yang W and Parr RG. Phys. Rev. 1988; B 37: 785– 789 (b) Becke AD. Phys. Rev 1988; A 38: 3098 –3100 (c) Becke AD. J. Chem. Phys. 1993; 98: 5648 –5652.
[18] Biegler-Konig F, Schonbohm J and Bayles D. J. Comput. Chem. 2001; 22: 545– 559. BIOGRAPHY Raghu Nath Behera is an Associate Professor in the Department of Chemistry, BITS, Pilani – K. K. Birla Goa Campus. He obtained his PhD in Chemistry in 2001 from Indian Institute of Technology Kanpur, India. He joined BITS in 2004 after post-docs from UC Davis, USA and University of Heidelberg, Germany. He may be contacted at [email protected].

10

11
Mixed Core CdS@ZnS Nanocrystals: Synthesis, Cadmium Dissolution and Cancer Cells
Management Peter Baláž1, Zdenka Bujňáková1, Erika Dutková1, Matej Baláž1, Anna
Zorkovská1, Jaroslav Kováč2, Jaroslav Kováč, Jr.2, Martin Kello3, Gabriela Mojžišová3, and Ján Mojžiš
3
1 Corresponding author: Peter Baláž; Institute of Geotechnics, Slovak Academy of Sciences, 04001 Košice, Slovakia , [email protected] 2
Institute of Electronics and Photonics, Slovak University of Technology and International Laser Centre, 81219 Bratislava, Slovakia 3
Faculty of Medicine, P.J. Šafárik University, 04011 Košice, Slovakia
Abstract Sulphur, selenium and tellurium as representatives of G16 chalcogens form nanocrystalline compounds, which are being vastly studied nowadays in fluorescent imaging and labelling. Solid-state synthesis using ambient pressure and temperature, short reaction times without application of toxic solvents represent a new challenge in the synthesis [1, 2].
CdS@ZnS nanocomposite has been prepared by a two-step solid-state synthesis with the aim to reduce cadmium dissolution and its toxicity in biological media. Corresponding cadmium and zinc acetates and sodium sulfide were used as reaction precursors. Cubic phases CdS (hawleyite, JCPDS 00-010-0454) and ZnS (sphalerite, JCPDS 00-005-0566) were identified in the produced nanocomposite with the average crystalline size 4.5±0.5 nm.
Dissolution tests in physiological solution (0.95% NaCl, 310 K) strongly reduced cadmium release: for pure CdS this value was 830 ppm, while for CdS@ZnS nanocomposite no cadmium leakage was obtained. In accordance with this observation, very low in vitro cytotoxicity (high viability) in the selected cancer cell lines (applied as models of living cells) has been evidenced for CdS@ZnS in comparison with CdS alone. Therefore, CdS@ZnS nanocrystals can be rendered non-toxic and used as the media for bioimaging applications.
Keywords: cadmium, cancer, chalcogenide, sulfide, sulphur
1. INTRODUCTION Chalcogenides exhibit a great variety of physical, chemical and physico-chemical properties. They display similar structural defects to oxides with cation vacancies, interstitial cations or anionic defects. However, the differences in concentration, structure and mobility of these substances are much more varied in the case of chalcogenides [2]. Chalcogenide nanocrystals (QDs) containing one or more chalcogenide elements such as sulphur, selenium and tellurium, exhibit semiconducting properties after bonding with transition metal elements. Recently, among metal chalcogenide materials, sulphur-based compound are being extensively studied because of their high carrier mobility, large band-gap and good photovoltaic properties. During the last few years, the synthesis and characterization of new transition metal chalcogenides have received considerable attention [3, 4].
Mechanochemistry offers a new option for the synthesis of chalcogenide nanocrystals [1, 2]. This route of synthesis can be performed via simple solid-state approach using ambient pressure and room temperature. In case of II-VI cadmium chalcogenide nanocrystals the application of toxic solvents is not necessary [5]. However, the problem of cadmium toxicity in biological application of the chalcogenide nanocrystals remains still a challenge.
In this work we report the synthesis of CdS@ZnS mixed core nanocrystals. Using the solid state approach in the synthesis, the novel mixed core chalcogenide nanocrystals with properties applicable in bioimaging have been prepared.

4th International Conference on Research Frontiers in Chalcogen Cycle Science & Technology
12
2. EXPERIMENTAL CdS@ZnS nanocrystals were synthesized from cadmium acetate (CH3COO)2Cd.2H2O, zinc acetate (CH3COO)2Zn.2H2O and sodium sulfide Na2S.9H2
2
O as reaction precursors. The synthesis was performed in a Pulverisette 6 planetary mill (Fritsch) in order to prepare nanocrystals with CdS:ZnS weight ratio 1:4. The details of the mechanochemical syntheses via “acetate” route for several chalcogenide QDs are described in our previous papers [ , 5].
The X-ray diffraction patterns were obtained using a D8 Advance diffractometer (Bruker) working with a CuKα radiation and a scintillation detector. The values of specific surface area (SBET
The dissolution tests were conducted at temperature 310 K applying the physiological solution (0.9% NaCl). The amount of dissolved cadmium was determined by the atomic absorption spectroscopy method SPECTRAA L40/FS (Varian).
), adsorption isotherms and pore size distribution were obtained by the low-temperature nitrogen adsorption method using a NOVA 1200e Surface Area & Pore Size Analyzer (Quantachrome Instruments). For the microscopic characterization TEM and HRTEM methods were applied using CM300 microscope (Philips) operated at 300 kV. Optical studies were carried out using a UV-VIS spectrophotometer Helios Gamma (Thermo Electron Corporation). Micro photoluminescence (PL) spectra were measured using a UV-VIS-NIR confocal Raman Microscope (Spectroscopy & Imaging). The Micro-Raman measurements were performed via a confocal Raman Microscope (Spectroscopy & Imaging).
The cytotoxicity tests were performed by the standard method [6] for cancer cell lines A-549 (human lung adenocarcinoma), Caco-2 (epithelial colorectal adenocarcinoma) and HeLa (cervical adenocarcinoma). A-549 and Caco-2 cells were routinely maintained in growth medium consisting of high glucose Dulbecco’s modified Eagle’s medium, HeLa cells were routinely maintained in the RPMI medium. Both media were with Glutamax-I, supplemented with 10% foetal calf serum, penicillin (10 µg.mL-1) and streptomycin (100 µg.mL-
1
The cytotoxic effect of the tested compounds was studied by using colorimetric microculture assay with the MTT (Sigma) end-point. Briefly, 3×10
) (all from Invitrogen,). Before each cytotoxicity assay, cell viability was determined by the tryptan blue exclusion method and was found to be greater than 95%.
3 cells were plated per well into 96-well polystyrene microplates (Sarstedt) in the culture medium containing tested nanocrystals. For in vitro experimentation the starting concentration 100 mg.mL-1 of Cd(II) was diluted in ratio 1:5, 1:10, 1:50, 1:100, 1:500, and 1:1000. After 72 h of incubation,10 µL of MTT (5 mg.mL-1
3. RESULTS AND DISCUSSION
) were added to each well. After additional 4 h, during which an insoluble formazan was produced, 100 µL of 10% sodium dodecylsulphate was added to each well and another 12 h were allowed for dissolution of the formazan. The absorbance was measured at 540 nm using the automated uQuant™ Universal Microplate Spectrophotometer (Biotek). Absorbance of control wells was taken as 100%, and the results were expressed as a percent of control. All experiments were performed in triplicate.
3.1 Structural analysis The diffraction patterns of the synthesized CdS and CdS@ZnS nanocrystals can be seen in Figure 1. The main diffraction peaks (111), (220) and (311) in the face-centered cubic structure are marked by vertical solid and dotted lines for the pure CdS and the CdS@ZnS phases, respectively. The broad diffraction peaks indicate a very fine crystalline structure. Rietveld analysis for CdS nanocrystals yielded a crystallite size d = 2.5±0.5 nm, in the case of the mixed core CdS@ZnS nanocrystals the value d = 4.5±0.5 nm was obtained.

Mixed Core CdS@ZnS Nanocrystals: Synthesis, Cadmium Dissolution and Cancer Cells Management
13
Figure 1. XRD patterns of CdS and CdS@ZnS nanocrystals and the corresponding crystallite sizes
The diffraction peaks match well with JCPDS patterns, which correspond to hawleyite CdS (JCPSD 00-010-044) and sphalerite ZnS (JCPDS 00-005-066). Generally, the calculated dimensions predetermine the synthesized chalcogenides to serve as semiconductor nanocrystals with tunable properties [7].
3.2 Optical properties The micro-Raman spectra of the synthesized samples are given in Figure 2.
.
Figure 2. Raman spectra of CdS and CdS@ZnS nanocrystals
The Raman mode at 321 cm-1 observed in the spectrum of CdS corresponds to the first-order longitudinal optical (1LO) phonon mode of CdS nanoparticles and the one at 600 cm-1 belongs to second-order longitudinal optical (2LO) phonon modes, respectively. The corresponding frequency of the dominant 1LO Raman peak in CdS crystals is reported to be 305-310 cm-1 8[ ]. The photonic peak of CdS in comparison with the theoretical one is shifted by approximately 10 cm-1 and this upward shift can be attributed to strain and structural order-disorder in the lattice. The Raman spectra of CdS@ZnS nanocrystals have one intensive peak centered at 346 cm-1 and a weak peak centered at 690 cm-1
9 which are associated with the first- and second-
order longitudinal optical photon vibrational mode of ZnS, respectively [ ]. This spectrum is almost identical with the Raman spectrum of pure ZnS (not shown in the Figure), only an increase in the Raman intensity and the area under the 1LO peak corresponding to ZnS was observed.
The optical properties can be resolved from the UV-VIS and micro PL spectra of the synthesized products. The UV-VIS and micro PL spectra of synthesized CdS and CdS@ZnS nanocrystals are displayed in Figure 3.

4th International Conference on Research Frontiers in Chalcogen Cycle Science & Technology
14
Figure 3. a) UV-VIS spectra and b) micro PL spectra at excitation 325 nm of the synthesized CdS and CdS@ZnS
nanocrystals
The absorption peaks were observed at 470 nm (2.63 eV) for pure CdS and at 332 nm (3.71 eV) for CdS@ZnS nanocomposite, respectively (Figure 3a). For bulk CdS and ZnS crystals, the absorption edges are at 510 nm and 335 nm, corresponding to energy band gaps 2.4 eV and 3.7 eV, respectively. In the case of CdS a strong blue shifted absorption edge with respect to the bulk material can be seen. It can be due to quantum confinement effect resulting from the small particle size. In Figure 3b it can be seen that there is a strong emission peak at 540 nm (2.3 eV) for pure CdS. The emission peak around 540 nm can be assigned to the surface-trap-induced fluorescence, which involved the recombination of electrons trapped inside a sulphur vacancy with a hole in the valence band of the CdS nanoparticles [10]. The PL spectrum of CdS@ZnS presents a weak emission peak at 404 nm (3.05 eV) and a maximum emission peak around 565 nm (2.18 eV) which is red-shifted compared with pure CdS as well as ZnS (not shown in the Figure). The red shift in the absorption spectrum of CdS@ZnS may be due to an inhomogeneous distribution of the size and the preferential absorption into larger nanoparticles [11]. The PL intensity of CdS@ZnS sample is three times stronger than one of pure CdS. This should come from the luminescence effect of the ZnS present in the CdS@ZnS mixed core nanocrystals.
3.3 Surface properties The effect of the ZnS incorporation into the nanocomposite was also investigated by the specific surface area measurement. The BET surface area for pure CdS was 78 m2.g-1, whereas for the CdS@ZnS nanocrystals, it was 171 m2.g-1
. Because of such great difference, the pore properties, namely the nitrogen adsorption-desorption isotherms and pore size distribution, of these two materials were studied. The results are shown in Figure 4.
Figure 4. Pore properties of mechanochemically synthesized CdS and CdS@ZnS nanocrystals: (a) nitrogen adsorption-desorption isotherms (full shapes correspond to adsorption curve; empty shapes to desorption curve), (b) pore size distributions

Mixed Core CdS@ZnS Nanocrystals: Synthesis, Cadmium Dissolution and Cancer Cells Management
15
It can be seen from Figure 4a that both samples exhibit the adsorption isotherms of type IV. The shape of the isotherms in the area of highest relative pressure suggests the presence of macropores. When the isotherms are analyzed in detail, very small hysteresis loop can be identified in both samples, so there could be mesopores present in the samples.
The pore size distributions of both samples are given in Figure 4b. The results have shown that the porous structure is different. For pure CdS, a wide range of pore sizes ranging from the smallest mesopores of the diameter of 4 nm to the macropores of the diameter around 120 nm can be evidenced. The maximum of the pore size distribution is located at around 45 nm of pore radius, which corresponds to the macropores of the diameter 90 nm, and this sample can be considered mostly macroporous. The situation is different in the case of the CdS@ZnS nanocrystals, in which the very small mesopores of the diameters around 3 nm are present. According to the t-plot analysis, no micropores are present in this sample, so all these small pores are of mesoporous character. Also larger mesopores and macropores are present, however they are less numerous and should not play a key role in the pore properties of this sample. It can be concluded that the incorporation of ZnS brought about a significant improvement of the pore properties due to the formation of very small mesopores in the studied nancomposite and as a result, dramatic increase in the BET surface area was observed. Therefore it broadens its application potential.
Relevant information about surface properties of solids can also be obtained by measuring of zeta potential. Zeta potential of synthesized CdS and CdS@ZnS nanocrystals as a function of pH in the pure water is shown in Figure 5. CdS nanoparticles are negatively charged in whole extent of measured pH range. With increasing addition of alkaline, the particles tend to acquire a more negative charge (up to -43 mV) and with increasing addition of acid a charge is negative to a lesser extent (-18 mV). The isoelectric point (IEP) was not reached. It is in contradiction with the results mentioned in [12] where IEP was established at about pH 7. In case of CdS@ZnS the values of zeta potential in the range of pH 3-9 are shifted to the more positive values and IEP was detected at pH 5. This shift is connected with the presence of Zn(II) ions from ZnS and their transfer from sample surface into solution. As the pH is lower, the absolute magnitude of the ZP increases, the more leakage of zinc occurs. In the range of pH 9-12 zinc hydroxides are formed [13].
Figure 5. Zeta potential for CdS and CdS@ZnS nanocrystals
3.4 Dissolution tests The dissolution activity of CdS and CdS@ZnS nanocrystals as a possible source of soluble toxic Cd(II) ions is illustrated in Figure 6. The course of cadmium leakage after 30 minutes of dissolution was followed in a physiological medium used in medicine for intravenous management (0.9% NaCl solution) and at human body temperature (310 K). The highest concentration of Cd(II) 830 ppm was attained for pure CdS. However, in case of CdS@ZnS nanocrystals no cadmium dissolution was obtained. The similar effect of preventing Cd(II) leaching from CdS/ZnS film catalyst (applied for hydrogen generation as well as model organic substances degradation) has been observed in [14].

4th International Conference on Research Frontiers in Chalcogen Cycle Science & Technology
16
Figure 6. Chemical dissolution of Cd(II) ions from CdS and CdS@ZnS nanocrystals, tL
– dissolution time
3.5 Cytotoxicity issues
The cadmium surface oxidation and its release in the form of soluble Cd(II) into the body liquid is a frequently discussed topic in connection of its toxicity [5, 15, 16], which can hamper the practical application of semiconductor nanocrystals containing cadmium [17]. The detailed mechanism of cadmium effect is not known, but it is considered to be due to the presence of free cadmium (in ionic form), free radical formation or interaction of Cd-containing semiconductor nanocrystals with intracellular components leading to the loss of function [18].
The results of the cytotoxicity tests performed in our study with three human cancer cell lines are shown in Figure 7. Their viability in the presence of CdS nanocrystals is definitely suppressed in the case of the cell lines Caco-2, HeLa and A-549. However, when CdS was coupled with ZnS in the CdS@ZnS nanocrystals the viability in the range 90-100% was achieved. The coupling of CdS with ZnS causes the retention of Cd(II) ions leakage (see also part 3.4) resulting in the high viability of the cells.
Figure 7. Viability (%) of three human cancer cell lines in the presence of CdS and CdS@ZnS nanocrystals: Caco-2
(epithelial colorectal adenocarcinoma); HeLa (cervical adenocarcinoma); A-549 (lung carcinoma)
4. CONCLUSIONS CdS and CdS@ZnS nanocrystals have been synthesized by solid-state mechanochemical reactions. The obtained quantum dots were 3-4 nm in size for both components. Cubic phases hawleyite CdS and sphalerite ZnS have been identified in the nanocrystals. The photoluminescence spectra of the studied nanocrystals span most of the visible spectrum from green to orange and they have shown a role of hole-electron interactions. Very low cytotoxic activity (high viability) has been also evidenced for several cancer cell lines. This fact corresponds with the dissolution of Cd(II) ions which is considerably suppressed when CdS@ZnS is applied instead of CdS alone.
This new type of nanocrystals shows promising potential for medicinal applications. Their application as labelling media and binding targets for drugs is the promising agenda in cancer resarch.

Mixed Core CdS@ZnS Nanocrystals: Synthesis, Cadmium Dissolution and Cancer Cells Management
17
ACKNOWLEDGEMENT The support through the Slovak Grant Agency VEGA (project 2/0027/14) and the Slovak Academy of Sciences Centre of Excellence CFNT-MVEP is gratefully acknowledged. The authors also acknowledge the support of the European Regional Development Fund- project nanoCEXmat (ITMS 26220120035) and APRODIMET (ITMS:26220120014).
REFERENCES [1] Balaz P. Mechanochemistry in Nanoscience and Mineral Enginering. Berlin Heidelberg: Springer Verlag; 2008. [2] Balaz P, Achimovicova M, Balaz M, Billik P, Cherkezova-Zheleva Z, Criado JM, et al. Hallmarks of
mechanochemistry: from nanoparticles to technology. Chem Soc Rev. 2013;42:7571-637. [3] Rogach AL. Semiconductor Nanocrystal Quantum Dots. Wien, New York: Springer; 2008. [4] Rui XH, Tan HT, Yan QY. Nanostructured metal sulfides for energy storage. Nanoscale. 2014;6:9889-924. [5] Balaz P, Sayagues MJ, Balaz M, Zorkovska A, Hronec P, Kovac J, et al. CdSe@ZnS nanocomposites prepared by a
mechanochemical route: No release of Cd2+
[6] Mossman TJ. Rapid colorimetric assay for cellular growth and survival: application to proliferation and cytotoxicity assays. J Immunol Methods. 1983;65:55-63.
ions and negligible in vitro cytotoxicity. Mater Res Bull. 2014;49:302-9.
[7] Hughes SM, Alivisatos AP. Anisotropic Formation and Distribution of Stacking Faults in II-VI Semiconductor Nanorods. Nano Lett. 2013;13:106-10.
[8] Kostic R, Romcevic N. Raman spectroscopy of CdS nanoparticles. Physica Status Solidi C: Current Topics in Solid State Physics, Vol 1, No 11. 2004;1:2646-9.
[9] Serrano J, Cantarero A, Cardona M, Garro N, Lauck R, Tallman RE, et al. Raman scattering in beta-ZnS. Physical Review B. 2004;69.
[10] Wang Y, Herron N. Photoluminescence and Relaxation Dynamics of CdS Superclusters in Zeolites. J Phys Chem. 1988;92:4988-94.
[11] Unni C, Philip D, Gopchandran KG. Studies on optical absorption and photoluminescence of thioglycerol-stabilized ZnS nanoparticles. Opt Mater. 2009;32:169-75.
[12] R. Brayner, Fiévet F, Coradin T. Nanoparticles: a danger or a promise? A chemical and biological perspective London: Springer-Verlag; 2013.
[13] Wang M, Zhang Q, Hao W, Sun Z-X. Surface stechiometry of zinc sulfide and its effect on the adsorption behaviors of xanthate. Chem Cent J. 2011;5:73 (10 pp).
[14] Wang X, Li XY. Photocatalytic hydrogen generation with simultaneous organic degradation by a visible light-driven CdS/ZnS film catalyst. Materials Science and Engineering B-Advanced Functional Solid-State Materials. 2014;181:86-92.
[15] Medintz IL, Uyeda HT, Goldman ER, Mattoussi H. Quantum dot bioconjugates for imaging, labelling and sensing. Nature Materials. 2005;4:435-46.
[16] Choi HS, Liu W, Misra P, Tanaka E, Zimmer JP, Ipe BI, et al. Renal clearance of quantum dots. Nat Biotechnol. 2007;25:1165-70.
[17] Chen N, He Y, Su YY, Li XM, Huang Q, Wang HF, et al. The cytotoxicity of cadmium-based quantum dots. Biomaterials. 2012;33:1238-44.
[18] Hardman R. A toxicologic review of quantum dots: Toxicity depends on physicochemical and environmental factors. Environ Health Perspect. 2006;114:165-72.
BIOGRAPHY Professor Peter Baláž graduated in chemistry from the Faculty of Science of P.J. Šafárik University Košice, Slovakia. He is active in the field of chalcogenide solid state chemistry, nanoscience, materials science and minerals engineering. He published 4 monographs (2 of them in Elsevier and Springer Publishing Houses) and more than 150 papers in reviewed journals. According to Web of Science his papers were cited more than 1600-times. The value of his Hirsch index is 24.
He may be contacted at [email protected]

18

19
Theoretical Investigation of Glutathione Peroxidase like Activity of some Conformationally
Restricted Dichalcogenides Arunashree Panda and Raghu Nath Behera
1
Department of Chemistry, Birla Institute of Technology & Science, Pilani – K. K. Birla Goa Campus, Zuarinagar - 403726, Goa, India 1
Corresponding author: [email protected]
______________________________________________________________________________
Abstract Following the discovery of ebselen which mimics the activity of glutathione peroxidase (GPx), an antioxidant selenoenzyme, there have been growing interests in the synthesis of small organochalcogens as functional mimics of GPx. The mechanistic investigation of the later is important for designing novel antioxidants. The catalytic cycle of GPx activity of these mimics is believed to proceed through the reaction of thiol with E–N/O or E–E (E = Se/Te) bonds. It has been observed that under certain conditions, several diselenides are more efficient oxidant than ebselen. Similarly, conformationally restricted diselenides (where diselenide moiety is strained) show significant enhancement in GPx-like activity than the diaryl diselenides. Also, the presence of substituents and the types of chalcogen atom present play an important role in GPx-like activity. In an attempt to understand some of these points, we have investigated the GPx-like activity of diphenyl diselenide along with napthol[1,8-cd]-1,2-diselelenole (where diselenide moiety is strained) and their derivatives using density functional theory. The strength of E–E (E = Se/Te) bonds in several alkyl and aryl dichalcogenides have been evaluated and compared. We have also investigated the electronic structure and orbital interactions to elucidate the antioxidant mechanism of the above said compounds. The free energy change associated with the catalytic reaction steps shows that the oxidation of Se(II) to Se(IV) is the rate determining steps. The activities of the diselenides are also compared with the ditelluride analogs. Our results are in agreement with the experimental study proposed earlier.
Keywords: Antioxidant activity, DFT, Dichalcogenide, Natural Bond Orbital
1. INTRODUCTION For a long time selenium has been considered a poison. However, the discovery of selenium as selenosysteine (SeCys) in the active site of GPx allowed the researchers to expand their research arena to the biochemistry of selenium.[1-3] Special attention has been paid to understand and mimic the activity of the selenoprotein glutathione peroxidase (GPx), which demonstarates a strong antioxidant activity and protects cell membranes and other cellular components against oxidative damage. The GPx redox cycle involves the oxidation of the catalytically active selenol (E-SeH) moiety by the peroxidase to produce the corresponding selenenic acid (E-SeOH), which undergoes reaction with the thiol cofactor GSH to produce the key intermediate selenenyl sulfide (E-SeSG). The E-SeSG thus produced undergoes further reaction with a second GSH moiety to regenerate the active selenol with the release of the cofactor in its oxidized form GSSG (Scheme-1). After the successful discovery of the first nontoxic synthetic ebselen as a clinically useful antioxidant and anti-inflammatory drug [4-5], several research groups developed a number of aliphatic and aromatic organoselenium compounds for their potential application to the prevention of diseases related to oxidative stress. Unlike the well understood mechanism of GPx (Scheme-1) [6], the mechanisms of synthetic organochalcogen compounds are more complex.

4th International Conference on Research Frontiers in Chalcogen Cycle Science & Technology
20
GPxSeH
GPx-SeSG GPx-SeOH
GSH-GSSG
GSH
-H2O
Scheme 1
H2O2 -H2O
SeSBn SeSBn
MeO OMe
SeSBn SeOH
MeO OMe
BnSHH2O
Se Se
MeO OMe
Se Se
MeO OMe
BnSSBn BnSH
H2O2 H2O
BnSH
BnSSBn + H2O
O
1 2
34
Scheme 2

Theoretical Investigation of Glutathione Peroxidase like Activity of some Conformationally Restricted Dichalcogenides
21
Understanding the mechanisms is important for the design of more effective GPx mimics. Back and coworkers have reported several organoselenium compounds with high GPx-like activity.[7-11] Recently, they have reported the enhanced GPx acivity of conformationally restricted peri-dichalcogenides [12]. The GPx like activity was reported to increase by electron-donating methoxy substituent. The first step in the mechanism proposed by Back (Scheme 2) is the reaction of the diselenide (1) with hydrogen peroxide to form selenoseleninate (2) which then reduced back to the original diselenide (1) by benzyl thiol. In the present study, we have elucidated the antioxidant mechanism of dimethoxy derivatives of naptho[1,8-cd]-1,2-diselenole by means of density functional theory (DFT). In addition to the mechanistic study, we also have estimated and compared the E-E bond strengths of various aliphatic and aromatic diorgano dichalcogenides.
2. MATERIALS AND METHODS In this work, we have studied two series of dichalcogenides, viz. napthol[1,8-cd]-1,2-diselelenole and diphenyl diselenide and the corresponding tellurides using density functional theory. We have also used different substituents to study their effect in various properties of these compounds. The compound under study are given in Figure 1.
E E
R R
a) R = H, b) R = Cl, c) R = OMe, d) R = OH, e) R = CHO
R E E R
E1E2
E = Se, Te
Figure 1.Dichalcogenides investigated in this study.
2.1. Computational details Gaussian09 [14] was used as source program for geometry optimization, the natural bond orbital (NBO) [15]
3. RESULTS AND DISCUSSION
calculations and wavefunction calculation for Atoms-in-Molecules (AIM) [16] analysis. All the geometries were fully optimized without any constraint using the hybrid B3LYP exchange correlation functional [17] with 6-31G(d) basis set, except for Tellurium, where we use LanL2DZ basis set. Frequency calculations were performed for all the compounds to check (no imaginary frequencies) the stationary points as minima on the potential energy surface. The topological analysis of electron density with Badar’s theory of Atoms-in-molecules (AIM) was analyzed using AIM2000 [18] software. Since bond path cannot be traced to the nuclei of atoms described by effective core potential [16d], for calculation of wavefunction for all Tellurium compounds, we run a single point calculations at the optimized geometries (at B3LYP/LanL2DZ level) using B3LYP/DZVP(DFT orbital). The free energy change for various reaction steps of the catalytic cycle has been investigated at B3LYP/6-31G(d) level for GPx like activity of diselenides.
Following our recent work [13], we have employed the B3LYP/6-31G(d)/LanL2DZ level of theory to study the compounds. Representative energy optimized structures are given in Figure 2 and selected structural parameters of all the optimized geometries of the compounds are summarized in Table 1.
Figure 2. Optimized structure of the compound Se1c (left) and Se2c (right) at B3LYP/6-31G(d) level.

4th International Conference on Research Frontiers in Chalcogen Cycle Science & Technology
22
The E–E (= Se, Te) bond length (rE…E) varies from 2.377 Å to 2.891 Å (2.386 Å – 2.408 Å for Se1 series, 2.817Å – 2.869 Å for Te1 series, 2.377 Å – 2.419 Å for Se2 series and 2.846 Å – 2.891 Å for Te2 series) and follow the order CHO < H < Cl < OH ≈ OMe for E1 series, while the trend is roughly CHO < Cl < H < OH ≈ OMe for the E2 series. Also, the E–E bond length of Se1 series is longer than Se2 series (except OMe). The E–C (E = Se, Te) bond length (rE…C) varies from 1.915 Å to 2.158 Å among the studied compounds and follow the order Cl < OH ≈ CHO < OMe < H for Se1 series, where as the trend is roughly OMe < OH < Cl < H < CHO for the rest. Also, we found that rE…C
Table 1: Selected structural parameters of the studies compounds calculated using B3LYP/6-31G(d)/LanL2DZ method (ϴ:
for angles, δ: for dihedral angles).
length for series 2 is always longer than that of series 1, i.e. E2 > E1. The E–E–C bond angles for series E1 are about 90 degree, while those of E2 series are about 100 degree. The dihedral C–E–E–C for series E1 are zero degree (planar) while those of E2 series are in the range 80 to 115 degree.
Compound r(Å)
E-E r(Å)
E-C r(Å)
C-R Ө(°)
C-E1-E2 δC-E2-E1-C
(°) Se1a 2.393 1.924 1.085 88.6 0.0 Se1b 2.401 1.915 1.754 88.9 0.0 Se1c 2.408 1.920 1.367 89.2 0.0 Se1d 2.408 1.919 1.370 89.2 0.0 Se1e 2.386 1.919 1.473 88.4 0.0 Se2a 2.386 1.941 1.084 102.3 81.3 Se2b 2.379 1.939 1.754 101.9 84.9 Se2c 2.419 1.929 1.354 102.3 79.1 Se2d 2.385 1.934 1.357 102.0 86.2 Se2e 2.377 1.947 1.484 101.6 98.9 Te1a 2.834 2.145 1.087 86.2 0.0 Te1b 2.849 2.133 1.827 85.9 0.0 Te1c 2.869 2.126 1.401 85.3 0.0 Te1d 2.867 2.126 1.404 85.3 0.0 Te1e 2.817 2.148 1.478 86.6 0.0 Te2a 2.859 2.146 1.087 99.8 84.9 Te2b 2.846 2.146 1.824 99.5 88.7 Te2c 2.851 2.137 1.395 98.7 108.3 Te2d 2.891 2.135 1.390 99.0 81.3 Te2e 2.846 2.158 1.480 100.1 116.3
3.1. NBO Analysis We have used Natural Bond Orbital (NBO) tool to understand the electron delocalization resulting between different orbitals. This covalent contribution is estimated using the NBO second order perturbation analysis. There is no substantial electron delocalization of Se (or Te) lone pair to other orbitals (nE → σ*C…Y) for diselenides/ditellurides (E2 series) probably due to non-planner geometry. However, a substantial electron delocalization is found in the compounds of E1 series The NBO second order perturbation energies for this delocalization (nE → σ*C…Y) are presented in Table 2. The nE → σ*C2-C3 and nE → σ*C7-C8
Table 2: The NBO second order stabilization energies (in kcal/mol) for the selected molecules using B3LYP/6-31G(d)/LanL2DZ method.
interaction energies varies from 9 to 24 kcal/mol. In compounds Se1c and Se1e, additional delocalization stabilizes substantially (up to 300 kcal/mol). The NPA charge for selected atom center is summarized in Table 3.
Compounds nE → σ* nC2-
C3 E → σ* Additional delocalization C7-C8
Se1a 10.93 10.93 Se1b 16.23 16.24 Se1c - - nE → σ*C1-C6 (30.75), nE → σ*C4-C5 (30.39), nE
→ σ*C5-C10 (22.94), nE → σ*C7-C8 (16.0), nE → σ*C17-O18 (11.85), nE → σ*C17-H21 (173.42), nE → σ*C22-O23
Se1d (65.59)
13.9 13.69 Se1e 24.41 - nE → σ*C4-C5 (33.56), nE → σ*C5-C10 (9.01), nE
→ σ*C17-O18 (9.17), nE → σ*C20-O21Te1a
(300.42) 9.02 9.02
Te1b 11.03 11.03 Te1c 9.91 9.91

Theoretical Investigation of Glutathione Peroxidase like Activity of some Conformationally Restricted Dichalcogenides
23
Te1d 10.04 10.04 Te1e 10.75 10.75
Table 3: Summary of NPA charges of the compounds under study using B3LYP/6-31G(d)/ LanL2DZ method (qE: charge
on Se/Te, qC: charge on carbon bearing E, qX: charge on the substituent, qCX
Compounds
: charge on carbon bearing substituent).
qE q (1) E q (2) C q (1) C q (2) X q (1) X q(2) CX q (1) CX (2) Se1a 0.241 0.241 -0.180 -0.180 0.211 0.211 -0.241 -0.241 Se1b 0.277 0.277 -0.212 -0.212 0.023 0.023 -0.085 -0.085 Se1c 0.250 0.252 -0.225 -0.225 -0.543 -0.544 0.282 0.282 Se1d 0.256 0.256 -0.235 -0.242 -0.671 -0.671 0.273 0.275 Se1e 0.273 0.271 -0.126 -0.134 0.419 0.419 -0.221 -0.218 Se2a 0.172 0.172 -0.239 -0.239 0.216 0.216 -0.198 -0.198 Se2b 0.210 0.210 -0.267 -0.267 0.023 0.023 -0.049 -0.049 Se2c 0.196 0.196 -0.277 -0.277 -0.530 -0.530 0.321 0.321 Se2d 0.159 0.159 -0.319 -0.319 -0.666 -0.667 0.319 0.319 Se2e 0.245 0.245 -0.188 -0.188 0.424 0.424 -0.181 -0.181 Te1a 0.335 0.335 -0.311 -0.311 0.222 0.222 -0.231 -0.231 Te1b 0.376 0.376 -0.352 -0.352 -0.045 -0.045 -0.003 -0.003 Te1c 0.355 0.355 -0.364 -0.364 -0.579 -0.579 0.316 0.316 Te1d 0.364 0.364 -0.377 -0.377 -0.743 -0.743 0.330 0.330 Te1e 0.359 0.359 -0.278 -0.278 0.397 0.397 -0.161 -0.161 Te2a 0.286 0.286 -0.356 -0.356 0.229 0.229 -0.213 -0.213 Te2b 0.336 0.336 -0.384 -0.384 -0.052 -0.052 0.001 0.001 Te2c 0.327 0.327 -0.390 -0.390 -0.571 -0.571 0.326 0.326 Te2d 0.282 0.282 -0.438 -0.438 -0.727 -0.727 0.346 0.346 Te2e 0.394 0.394 -0.331 -0.331 0.397 0.397 -0.153 -0.153 2 1.211 0.149 -0.311 -0.233 -0.537 -0.534 0.338 0.306 3 0.270 0.667 -0.258 -0.310 -0.530 -0.546 0.326 0.340 4 0.258 0.302 -0.268 -0.271 -0.533 -0.530 0.326 0.332
3.2. Atoms-in-Molecules (AIM) study We studied the topology of the electron density using the Bader’s theory of Atoms-in-Molecules (AIM) [16] which states that chemically bonded atoms have their nuclei linked by a (single) bond path (a single line of locally maximum electron density) and they share a bond critical point (BCP). The electron density at the BCP gives valuable information about the nature and the strength of the bond. The AIM analysis data of the electron density (ρE-Y
Table 4: Electron density at the bond critical point of E–E and E–C bond for studied molecules.
) at the Bond Critical Point (BCP) are given in Table 4.
Compound ρ ρE-E compound E-C ρ ρE-E E-C Se1a 0.09253 0.15043 Te1a 0.05962 0.11037 Se1b 0.09213 0.15220 Te1b 0.05941 0.11142 Se1c 0.09119 0.15080 Te1c 0.05794 0.11283 Se1d 0.09113 0.15076 Te1d 0.05798 0.11272 Se1e 0.09119 0.15080 Te1e 0.06154 0.10931 Se2a 0.09174 0.14664 Te2a 0.05711 0.11045 Se2b 0.09289 0.14611 Te2b 0.05823 0.10922 Se2c 0.09197 0.14721 Te2c 0.05814 0.11097 Se2d 0.08753 0.14882 Te2d 0.05500 0.11168 Se2e 0.09197 0.14721 Te2e 0.05922 0.10716
2 0.08472 0.15037 3 0.02446 0.15211
The values of ρE…Y for the studied compounds range from 0.04 to 0.036 e/Å3 which are in between typical covalent bond (e.g. ρC-C ≈ 0.24 e/Å3) and that of hydrogen bond (ρH-Bond ≈ 0.002 – 0.04 e/Å3
3.3. Catalytic Activity of Diselenide
).
As mentioned in the introduction, we have investigated the antioxidant mechanism of naptho[1,8-cd]-1,2-diselenole (dimethoxy derivatives) by means of density functional theory using the steps given in Scheme 2. The free energy change for each step has been evaluated and is presented in Table 4. The free energy change of all the steps, except 2 (Table 4) in the catalytic cycle are spontaneous. There is a substancial increase in charge (0.25e to 1.211e, seeTable 3) on Se while going from 1 to 2. This explains why presence of electron donating group favour this reaction step (oxidation of SeII to SeIV
). This result is in agreement with the experimental results reported earlier [12].

4th International Conference on Research Frontiers in Chalcogen Cycle Science & Technology
24
Table 4: The free energy change for the reaction steps (Scheme 2) of peroxidase activity of diselenide.
Step No.
Reaction Free energy change (kcal/mol)
1 1 + H2O2 → 2 + H2 -30.0881 O 2 2 + BnSH → 3 7.2025 3 3 + BnSH → 4 + H2 -15.051 O 4 4 → 1 + BnSSBn -25.461 5 3 + BnSH → 1 + BnSSBn + H2 -40.476 O
4. CONCLUSIONS We have applied the density functional method to study the electronic structure of two series of substituted dichalcogenides (diselenides & ditellurides), viz. napthol[1,8-cd]-1,2-diselelenole and diphenyl diselenide. The first series compounds are more or less planner, while that of other are near perpendicular. Their E-E (E = Se,Te) bond distances follow the order CHO < H < Cl < OH ≈ OMe for first series, while the trend is roughly CHO < Cl < H < OH ≈ OMe for the second series. NBO analysis show substantial electron delocalization from Se/Te lone pair to many anti-bonding orbitals. The compound Se1c and Se1e show the highest delocalization. The electron density at the bond critical point, obtained from AIM study also support this point. The catalytic cycle of the diselenide was studied. The calculated free energy changes for various steps in the catalytic cycle of recently proposed mechanism of GPx like activity suggest its spontaneity.
ACKNOWLEDGMENTS One of us (AP) thanks DST, New Delhi for financial support under WOS-A scheme (SR/WOS-A/CS-04/2014). The support from BITS, Pilani - K. K. Birla Goa Campus is gratefully acknowledged.
REFERENCES [1] Mugesh G, du Mont W –W., Sies H, Chem. Rev. 2001; 101: 2125-2180. [2] Mugesh G, Singh HB. Chem. Soc. Rev. 2000; 29: 347-357. [3] Bhabak KP., Mugesh G, Acc. Chem. Res. 2010; 43: 1408-1419. [4] Müller A, Cadenas E, Graf P, Sies H, Biochem Pharmacol 1984; 33: 3235-3239. [5] Wendle A, Fausel M, Safayhi H, Tiegs G, Otter R, Biochem Pharmacol 1984; 33: 3241-3245. [6] Gettins P, Crews BC., J. Biol. Chem. 1991; 266: 4804-4809. [7] Back TG., Moussa Z, J. Am. Chem. Soc. 2002; 124: 12104-12105. [8] Back TG., Moussa Z, J. Am. Chem. Soc. 2003; 125: 13455-13460. [9] Back TG., Moussa Z, Parvez M, Angew. Chem. 2004; 116: 1288; Angew. Chem. Int. Ed. 2004; 43: 1268-1270. [10] Back TG., Kuzma D, Parvez M, J. Org. Chem. 2005; 70: 9230-9236. [11] Kuzma D, Parvez M, Back TG. Org. Biomol. Chem. 2007; 5: 3213-3217. [12] Press DJ., Back TG., Org. Lett. 2011; 13: 4104.
[13] Panda A and Behera RN. J . Hazardous Materials 2014; 269: 2-8; Computational and Theoretical Chemistry 2012; 999: 215-224; Behera RN and Panda A. RSC Advances 2012; 2: 6948-6956.
[14] Gaussian 09, Revision B.01, Frisch MJ, Trucks GW, Schlegel HB, Scuseria GE, Robb MA, Cheeseman JR, Scalmani G, Barone V, Mennucci B, Petersson GA, Nakatsuji H, Caricato M, Li X, Hratchian HP, Izmaylov AF, Bloino J, Zheng G, Sonnenberg JL, Hada M, Ehara M, Toyota K, Fukuda R, Hasegawa J, Ishida M, Nakajima T, Honda Y, Kitao O, Nakai H, Vreven T, Montgomery JA, Peralta JE, Ogliaro F, Bearpark M, Heyd JJ, Brothers E, Kudin KN, Staroverov NV, Keith T, Kobayashi R, Normand J, Raghavachari K, Rendell A, Burant JC, Iyengar SS, Tomasi J, Cossi M, Rega N, Millam JM, Klene M, Knox JE, Cross JB, Bakken V, Adamo C, Jaramillo J, Gomperts R, Stratmann RE, Yazyev O, Austin AJ, Cammi R, Pomelli C, Ochterski JW, Martin RL, Morokuma K, Zakrzewski VG, Voth GA, Salvador P, Dannenberg JJ, Dapprich S, Daniels AD, Farkas O, Foresman JB, Ortiz JV, Cioslowski J, and Fox DJ. Gaussian, Inc., Wallingford CT, 2010.
[15] (a) Reed AE, Curtiss LA, Weinhold F. Chem. Rev. 1988; 88: 899-926 (b) Reed AE, Curtiss LA, Carpenter JE, Weinhold F. NBO version 3.1.
[16] (a) Bader RFW. Atoms in Molecules: A Quantum Theory, Oxford University Press, New York, 1990 (b) Popelier P. Atoms in Molecules: An Introduction, Pearson, Harlow, 2000 (c) Gillespie RJ, Popelier PLA. Chemical Bonding and Molecular Geometry, Oxford University Press, New York, 2001 (d) Matta CF and Boyd RJ. The Quantum Theory of Atoms in Molecules, Wiley-VCH, 2007.
[17] (a) Lee C, Yang W and Parr RG. Phys. Rev. 1988; B 37: 785– 789 (b) Becke AD. Phys. Rev 1988; A 38: 3098 –3100 (c) Becke AD. J. Chem. Phys. 1993; 98: 5648 –5652.
[18] Biegler-Konig F, Schonbohm J and Bayles D. J. Comput. Chem. 2001; 22: 545– 559.

Theoretical Investigation of Glutathione Peroxidase like Activity of some Conformationally Restricted Dichalcogenides
25
BIOGRAPHY Raghu Nath Behera is an Associate Professor in the Department of Chemistry, BITS, Pilani – K. K. Birla Goa Campus. He obtained his PhD in Chemistry in 2001 from Indian Institute of Technology Kanpur, India. He joined BITS in 2004 after post-docs from UC Davis, USA and University of Heidelberg, Germany. He may be contacted at [email protected].

4th International Conference on Research Frontiers in Chalcogen Cycle Science & Technology
26

27
(BIO)CONVERSIONS, SPECIATION OF CHALCOGENS AND THE ROLE OF METALS

28

29
Adsorption of Heavy metals from Acid Mine Drainage by Coal Bottom Ash
Varinporn Asokbunyarat1, Eric D. van Hullebusch2
Piet N. L. Lens,
3 and Ajit P. Annachhatre
1
1Corresponding author: School of Environment, Resource and Development, Asian Institute of Technology, P.O. Box 4, Klongluang, Pathumthani 12120, Thailand [email protected] 2Laboratoire Géomatériaux et Environnement (EA 4508), Université Paris-Est, UPEM, 77454 Marne-la-Vallée, France 3
_____________________________________________________________________________________
Department of Environmental Engineering and Water Technology, UNESCO-IHE Institute for Water Education, P.O. Box 3015, 2601 DA Delft, The Netherland
Abstract Investigations were undertaken to study sorption of heavy metals from acid mine draiange onto coal bottom ash. The adsorption processes were strongly affected by parameters such as pH, L/S (liquild-to-solid ratio) and contact time. The adsorption capacity of bottom ash increased with incresing contact time and initial heavy metal concentration. However, it was restricted in sorption behaviour in much higher metal concentration. Adsorption of heavy metal ions from single- and multi-component solution based on AMD characteristic of lignite coal mine in Thailand onto coal bottom ash followed the sequence: Fe2+ > Cu2+ > Zn2+ > Mn2+
Keywords: Coal bottom ash, Acid mine drainge, Heavy metal, Adsorption
. Adsorption of heavy metal ions from single-component solution was higher than multi-component solution due to effect of competing ion. The most suitable kinetic model for providing the best correlation of the adsorption kinetic data was the pseudo-second order model. Bottom ash is made up of heterogeneous and multi-layered surfaces, which are available for adsorption, as demonstrated by the Freundlich isotherm, the governing equilibrium model.
1. INTRODUCTION Acid mine drainage (AMD) is a problem faced by humanity worldwide. AMD is produced when pyrite containing mine tailings are exposed to oxygen in the atmosphere and water as per the following equations [1]: 𝐹𝑒𝑆2(𝑆) + 7
2𝑂2 + 𝐻2𝑂 → 𝐹𝑒2+ + 2𝑆𝑂42− + 2𝐻+ (1)
𝐹𝑒2+ + 1
4𝑂2 + 𝐻+ → 𝐹𝑒3+ + 1
2𝐻2𝑂 (2)
𝐹𝑒𝑆2(𝑆) + 14𝐹𝑒3+ + 8𝐻2𝑂 → 15𝐹𝑒2+ + 2𝑆𝑂42− + 16𝐻+ (3)
AMD generated from abandoned mines and mine tailings have contaminated water bodies and created large acidified lakes all over the world. AMD, which is highly acidic by nature, solubilises heavy metals present in the mine tailings. Due to its low pH and high heavy metal contents, AMD is highly toxic nature and poses a significant environmental threat. Virtually no life can survive in such acidified waters. Heavy metals in soluble form can enter the food chain through bio-accumulation and bio-magnification, posing a greater threat to all forms of life [2]. AMD from these lagoons percolates through soil, thereby affecting the soil chemistry and contaminating the groundwater which is a valuable source for drinking water and for agriculture [3].
Remediation techniques such as physico-chemical treatment by pH adjustment to the alkaline range followed by metal hydroxide precipitation have been employed [4]. These methods are expensive and produce large volumes of inorganic sludge which is often difficult to dispose of due

4th International Conference on Research Frontiers in Chalcogen Cycle Science & Technology
30
to its toxic nature [5]. Pump and treat remediation methods are often difficult to employ when dealing with groundwater contamination from AMD [2]. Passive treatment methods such as permeable reactive barrier (PRB) technology have been employed by researchers [6]. Treatment in PRB can be both biotic and abiotic by nature [7]. As a result, PRB may employ inorganic and / or organic media, depending upon the type of treatment imparted. Organic media are often used in PRB as electron donor to initiate the growth of specific microorganisms. Earlier research has shown that suitable natural organic substrates such as rice husk, coconut husk chips, bamboo chips and sludge from wastewater treatment facility can be used as electron donors to initiate the growth of sulphate reducing bacteria in PRB. Accordingly, sulfide produced by biological sulphate reduction was capable of removing the heavy metals from AMD through sulfide precipitation [2].
In abiotic treatment systems, activated charcoal, clay, limestone, red mud, fly ash, zeolite and zero-valent iron have been used by researchers as reactive materials [8-13]. These media are capable of removing pollutants such as heavy metals from contaminated groundwater. Recently, there has been growing interest in the utilization of bottom ash as a sorbent for the removal of heavy metals from wastewater and groundwater. Earlier research has shown that bottom ash can be used as effective sorption material for removing single heavy metals from aquatic solutions [14-15]. The coarse particle size, large surface face and high porosity of bottom ash make it an attractive choice as a low-cost adsorbent. Moreover, high {SiO2 + Al2O3 + Fe2O3
Accordingly, objective of this research was to determine the suitability of bottom ash as possible inorganic media in PRB for the removal of heavy metals from AMD. Batch kinetics and isotherm experiments were undertaken to assess the potential of bottom ash for adsorption of Fe, Mn, Cu and Zn from AMD.
} content and high calcium content also make bottom ash a suitable adsorbent [7], [16].
2. MATERIALS AND METHODS Bottom ash was obtained from the 2400 MW Mae Moh lignite coal fired thermal power plant of the Electricity Generating Authority of Thailand (EGAT) located in Lampang, Thailand. 2.1. Acid Mine Drainage Acid mine drainage (AMD) was synthesized to simulate characteristics of AMD in an acidified lagoon generated from the leachate of an abandoned coal mine from Lamphun province in northern Thailand [2]. The synthetic AMD was supplemented by heavy metals and then used as feed with characteristics as shown in Table 1 [2]. Analytical grade reagents such as FeSO4.7H2O, MnSO4.H2O, CuSO4.5H2O and ZnSO4.7H2
Table 1. Characteristics of AMD used in batch and column tests
O were used from preparation of heavy metal solutions and AMD.
Parameter AMD Added Synthetic AMD pH 4.16 ± 0.08 - 4.2
Iron, mg/l 0.08 ± 0.05 30 30 Manganese, mg/l 16.7 ± 0.91 - 20
Copper, mg/l 0.04 ± 0.01 20 20 Zinc, mg/l 0.92 ± 0.11 5 5
2.2. Single and Multiple Heavy Metal Batch Adsorption
2.2.1. Adsorption Kinetics
Batch experiments were conducted to study single and multiple adsorption kinetics of Fe(II), Mn(II), Cu(II) and Zn(II) by bottom ash. Single heavy metal solutions of Fe(II) 30 mg/l, Mn(II) 20 mg/l, Cu(II) 20 mg/l and Zn(II) 5 mg/l were prepared as stock solutions. Single heavy metal adsorption kinetic experiments were conducted by mixing 2.5 and 10 g of bottom ash with 200 ml of single heavy metal solutions in 8 separate Erlenmeyer flasks, each with capacity of 250 ml. Multi heavy metal adsorption kinetic experiments were conducted by mixing 2.5 and 10 g of bottom ash with 200 ml of AMD in 2 separate Erlenmeyer flask, each with capacity of 250 ml. The mixtures were agitated at 150 rpm on a magnetic stirrer. 5 ml samples were collected from each flask at time intervals of 1, 2, 3, 4, 5, 10, 20, 30, 50, 120 and 240 min. 5 ml of Milli-Q ultrapure water was added into the each flask every time when the sample was withdrawn from the

Adsorption of Heavy metals from Acid Mine Drainage by Coal Bottom Ash
31
flask in order to maintain the total liquid volume of 200 ml in the flask. The samples were analyzed for pH and heavy metal concentrations.
2.2.2. Equilibrium Adsorption Isotherm
Batch isotherm tests were conducted in 24 separate polycarbonate bottles, each with volume of 125 ml by mixing 0.2, 1.25 and 5 g of bottom ash with 100 ml of synthetic solution containing a mixture of Fe(II), Mn(II), Cu(II) and Zn(II) (Table 2). The bottles were agitated at 150 rpm on a shaker for 18 hours, after which, the liquid portion in each bottle was analyzed for the residual heavy metal concentration.
Table 2. Synthetic solution containing a mixture of Fe(II), Mn(II), Cu(II) and Zn(II) Heavy metal Metal concentration in each batch
1 2 3 4 5 6 7 8 Iron, mg/l 3 6 15 30 45 60 90 120
Manganese, mg/l 2 4 10 20 30 40 60 80 Copper, mg/l 2 4 10 20 30 40 60 80
Zinc, mg/l 0.5 1 2.5 5 7.5 10 15 20 2.3. Analytical Methods Analyses of water samples were performed as per standard methods of the examination of water and wastewater (APHA et al., 2005). pH were measured by pH meter (Metter Toledo SG2). Heavy metals were analyzed by inductively coupled plasma - optical emission spectrometer (ICP-OES) (Perkin Elmer Optima 8300). 3. RESULTS AND DISCUSSION
3.1. Heavy Metal Adsorption Kinetics
Single Heavy Metal Adsorption Kinetic:
As against to the adsorption of Fe, Cu and Zn, adsorption pattern revelaed by Mn is quite different (Figure 1). Firstly, for all (L/S) values, % removal recorded is always less than 90%. Moreover, the adsorption pattern exhibited depends upon the (L/S) maintained during the experiment. Lowest % Mn removal is recorded for (L/S) of 100:1.25, followed by (L/S) of 100:5.
Figure 1 presents the results of the kinetic experiments for adsorption of single heavy metal from aqueous solutions onto the bottom ash. As this figure brings out, the initial % removal is quiet rapid for all the heavy metals. Adsorption pattern of Fe, Cu and Zn reveals that for (L/S) ratio of 100:5, removal of over 90% is recorded for these heavy metals within the first minute itself. On the one hand, for (L/S) ratio of 100:1.25, heavy metal removal of over 90% is recorded within initial 2-3 minutes. This time variation could be attributed to different initial concentrations of these heavy metals.
Multiple Heavy Metal Adsorption Kinetic:
As against to the adsorption of Fe, Cu and Zn, adsorption pattern revelaed by Mn is quite different (Figure 2). Firstly, for all (L/S) values, % removal recorded is always less than 90%. Moreover, the adsorption pattern exhibited depends upon the (L/S) maintained during the experiment. Lowest % Mn removal is recorded for (L/S) of 100:1.25, followed by (L/S) of 100:5.
Figure 2 presents the results of the kinetic experiments for adsorption of multiple heavy metals from acid mine drainage onto the bottom ash. As this figure brings out, the initial % removal is quiet rapid for all the heavy metals. Adsorption pattern of Fe, Cu and Zn reveals that for (L/S) ratio of 100:5, removal of over 90% is recorded for these heavy metals within the first minute itself while above 99% removal is achieved within 50 minutes for Fe, Cu and Zn. On the other hand, for (L/S) ratio of 100:1.25, heavy metal removal increase is only gradual and takes about 2, 3 and 10 minutes to reach above 90% level for Fe, Cu and Zn respectively.

4th International Conference on Research Frontiers in Chalcogen Cycle Science & Technology
32
Figure 1. Kinetics of heavy metal adsorption from single component solutions
Figure 2. Kinetics of heavy metal adsorption from synthetic acid mine drainage

Adsorption of Heavy metals from Acid Mine Drainage by Coal Bottom Ash
33
Adsorption is a heterogeneous process with an initial rapid adsorption rate followed by a slower rate. This is particularly noticeable for the Fe(II), Cu(II) and Zn(II) which are adsorbed more rapidly, while Mn(II) is adsorbed more slowly. In initial process, the adsorption sites are available and the cations interact easily with the sites and hence a higher rate of adsorption is observed. However, after the initial period, slower adsorption may be due to slower diffusion of cations into the interior channels of the bottom ash. Effect of the adsorbent dose on the uptake of heavy metal ions is also shown in Figure 1 and Figure 2. It was observed that an increase in dosage resulted in an increase in the rate of heavy metal uptake; this is because with an increase in mass/dosage there is an introduction of more adsorption sites which adsorb more cations from the solution.
Comparison of Single and Multiple Heavy Metal Adsorption Kinetics:
Figure 3 and Figure 4 compare adsorption of the heavy metals from both single and multiple component solutions at L/S ratios of 100ml/1.25g and 100ml/5g respectively. Most of Fe(II) and Cu(II) ions were adsorbed from solution in comparison with the other cations. The amount of Fe(II) and Cu(II) ions adsorbed by bottom ash from synthetic AMD was less than equal to that adsorbed from its single component solutions. Adsorption of Fe(II) and Cu(II) was significantly unaffected by the presence of competing ions. This may be because the main mechanism responsible for Fe(II) and Cu(II) removal from solution is thought to be precipitation. Adsorption of Mn(II) and Zn(II) was significantly affected. The amount adsorbed from multiple component solutions decreased compared to their single component solutions. This may be due to effect of competing ions.
In particle, acid mine drainage contains a mixture of different heavy metal ions. Experiments were carried out to investigate the influence of the presence of competing cations on the individual adsorption of Fe(II), Mn(II), Cu(II) and Zn(II) by bottom ash.
Figure 3. Comparison of adsorption capacities from single component solutions and synthetic AMD at L/S ratio of
100ml/1.25g

4th International Conference on Research Frontiers in Chalcogen Cycle Science & Technology
34
Figure 4. Comparison of adsorption capacities from single component solutions and synthetic AMD at L/S ratio of
100ml/5g
Model of Heavy Metal Adsorption Kinetics: To explain the adsorption mechanism, kinetic models, such as the pseudo-first order model and pseudo-second order model were tested to fit experimental data obtained from Fe, Mn, Cu and Zn removal experiments. These equations were linearized, and the coefficient of regression (r2
The pseudo-first order model is based on the assumption that the rate is proportional to the number of unoccupied sites [17]. A linear form for the pseudo-first order model is given as:
) was used to determine the adequateness of the different models to fit the adsorption process.
log(𝑞𝑒 − 𝑞𝑡) = log(𝑞𝑒) − 𝑘12.303
𝑡 (4)
where qt (mg/g) is the amount of adsorbate absorbed at time t (min), qe (mg/g) is the adsorption capacity at equilibrium, k1 (min-1
The pseudo-second order model is based on the assumption that the rate is proportional to the square of the number of unoccupied sites [17]. A linear form of the pseudo-second order model is given as:
) is the rate constant for the pseudo first order model.
𝑡𝑞𝑡
= 1𝑘2𝑞𝑒2
+ 𝑡𝑞𝑒
(5)
where k2
Table 3 shows the kinetic parameters and correlation coefficients. The correlation coefficients of Fe, Mn, Cu and Zn for the pseudo-second order were good when compared to the pseudo-first order (r
is the rate constant for the pseudo second order model (g/mg.min).
2: 0.995-1). Obviously, the experimental and theoretical equilibrium adsorption capacity, qe of Fe, Mn, Cu and Zn were in good match. Clearly, the qe of multiple heavy metals was lower than that single heavy metals, indicating that competition existing between heavy metals for adsorption sites on bottom ash.

Adsorption of Heavy metals from Acid Mine Drainage by Coal Bottom Ash
35
Table 3. Parameter of kinetic constants for Fe, Mn, Cu and Zn adsorption L/S
ratio (ml/g)
Metal First order kinetic model Second order kinetic model qe,exp (mg/g)
qe,cal (mg/g)
k(min
1 -1
r)
qe,cal 2 (mg/g)
k2min) (g/mg. r
100:
1.25
2
Fe 2.396 0.116 0.088 0.677 2.398 7.977 1.000
Fe(Fe+Mn+Cu+Zn) 2.398 4.140 0.590 0.972 2.413 0.472 1.000 Mn 1.260 0.261 0.015 0.868 1.301 0.276 0.998
Mn(Mn+Fe+Cu+Zn) 0.996 0.792 0.027 0.991 1.065 0.076 0.995 Cu 1.595 0.021 0.011 0.270 1.592 39.073 1.000
Cu(Cu+Fe+Mn+Zn) 1.593 1.093 0.241 0.997 1.607 0.606 1.000 Zn 0.389 0.015 0.011 0.489 0.394 12.836 1.000
Zn(Zn+Fe+Mn+Cu) 0.397 0.286 0.049 0.975 0.416 0.290 0.999
100:
5
Fe 0.600 0.010 0.014 0.194 0.601 285.5 1.000 Fe(Fe+Mn+Cu+Zn) 0.592 0.009 0.007 0.188 0.595 19.990 1.000
Mn 0.344 0.081 0.023 0.961 0.351 1.317 1.000 Mn(Mn+Fe+Cu+Zn) 0.339 0.187 0.034 0.955 0.350 0.560 1.000
Cu 0.399 0.002 0.004 0.119 0.402 82.784 1.000 Cu(Cu+Fe+Mn+Zn) 0.397 0.027 0.334 0.261 0.398 27.510 1.000
Zn 0.099 0.002 0.016 0.489 0.100 56.004 1.000 Zn(Zn+Fe+Mn+Cu) 0.099 0.057 0.208 0.975 0.100 8.915 1.000
The results suggest that the adsorption of the heavy metals (Fe, Mn, Cu and Zn) from acid mine drainage on bottom ash follows the second-order type kinetic reaction based on the assumption that the rate-limiting step may be chemical sorption or chemisorption between sorbent and sorbate [16].
3.2. Multiple Heavy Metal Adsorption Isotherms
The isothermal relationship between the equilibrium concentrations of combined metals (Fe, Mn, Cu and Zn) in 1.25 g and 5 g of bottom ash and 100 ml of multi-component solution is shown in Figure 5. The amount adsorbed of Fe, Mn, Cu and Zn in bottom ash rapidly increased with increase in the concentration of metals in L/S of 100:1.25 and 100:5. The isotherm plots clearly show that bottom ash had a much higher adsorption capacity of Fe than that of other metals and the uptake of metals was in the order of Fe > Cu > Zn > Mn.
On the other hand, the isothermal relationship between the equilibrium concentrations of combined metals (Fe, Mn, Cu and Zn) in 0.2 g of bottom ash and 100 ml of multi-component solution is shown in Figure 6. The amount adsorbed of Fe in bottom ash rapidly increased with increase in the concentration of metals, while the amount adsorbed of Mn, Cu and Zn in bottom ash slowly increased, followed by slowly decreased with increase in the concentration of metals, indicating bottom ash restricted in sorption behavior in much higher concentration of metals.
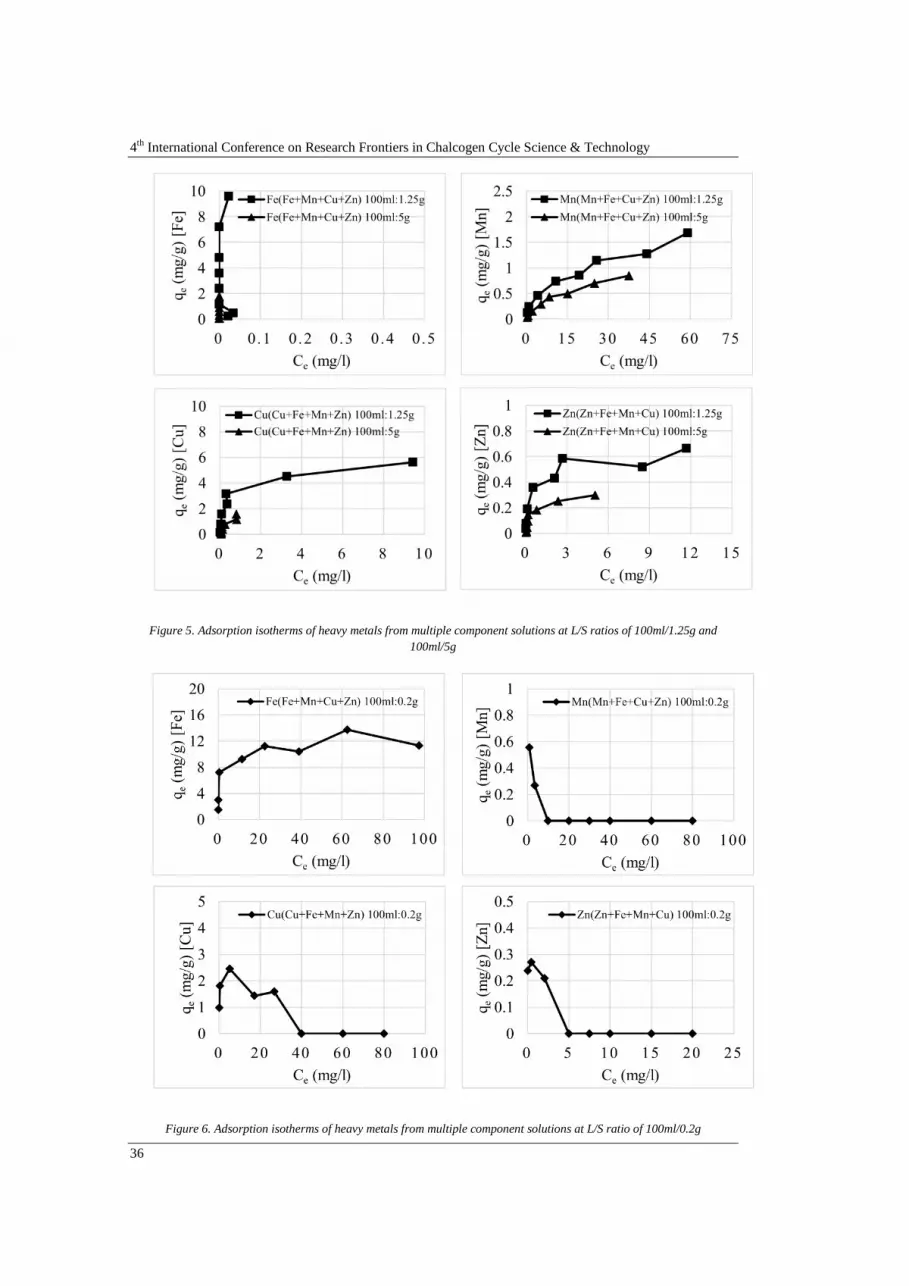
4th International Conference on Research Frontiers in Chalcogen Cycle Science & Technology
36
Figure 5. Adsorption isotherms of heavy metals from multiple component solutions at L/S ratios of 100ml/1.25g and 100ml/5g
Figure 6. Adsorption isotherms of heavy metals from multiple component solutions at L/S ratio of 100ml/0.2g

Adsorption of Heavy metals from Acid Mine Drainage by Coal Bottom Ash
37
Model of Multiple Heavy Metal Adsorption Isotherms:
Isotherm models, such as Langmuir model and Freundlich model were tested to fit the experimental data to estimate the equilibrium relationships between sorbent and sorbate in solution. The Langmuir model is based on the assumption that solid surface has a finite number of identical sites which are energetically uniform [17]. Its mathematical form is as follow:
𝐶𝑒𝑞𝑒
= 1𝑏𝑞𝑚
+ 𝐶𝑒𝑞𝑚
(6) where qe is the amount adsorbed (mg/g), Ce is the equilibrium concentration of the adsorbate (mg/l), qm
is the maximum adsorption capacity (mg/g), b is the adsorption equilibrium constant (L/mg).
The Freundlich model is based on the assumption that a monolayer sorption with a heterogeneous energetic distribution of active sites was accompanied by interaction between adsorbed molecules [17]. Its mathematic formula is given as: log 𝑞𝑒 = log𝐾𝑓 + �1
𝑛� log𝐶𝑒 (7)
where Kf
(mg/g) and n (g/L) are the Freundlich constants related to adsorption capacity and adsorption intensity, respectively.
Table 4 shows the isotherm parameters and correlation coefficients. The correlation coefficients of Fe, Mn, Cu and Zn for the Freundlich isotherm were high when compared to Langmuir model (r2: 0.705-0.998). The Freundlich constants related to adsorption capacity, Kf value of Fe was 5.612 mg/g for L/S of 100:0.2 and the Kf
Table 4. Parameters of isotherm constants for Fe, Mn, Cu and Zn adsorption
values of Mn, Cu and Zn were 0.220, 2.852 and 0.316 mg/g for L/S of 100:1.25, respectively and 0.085, 2.238 and 0.176 mg/g for L/S of 100:5, respectively, which suggested the adsorption affinity of bottom ash decreased in the order of Fe > Cu > Zn > Mn.
Liquid/solid ratio
Metal Langmuir coefficients Freundlich coefficients q
(mg/g) m b
(L/mg) r K2
(mg/g) f 1/n
(L/g) r
100ml:0.2g
2
Fe 11.848 1.267 0.985 5.612 0.197 0.880
100ml:1.25g
Mn 1.769 0.086 0.920 0.220 0.489 0.988 Cu 5.875 1.904 0.994 2.852 0.528 0.793 Zn 0.631 2.350 0.976 0.316 0.385 0.914
100ml:5g
Mn 1.074 0.080 0.958 0.085 0.674 0.977 Cu 5.094 0.476 0.072 2.238 1.072 0.705 Zn 0.333 1.640 0.982 0.176 0.609 0.819
Based on the results, the Freundlich isotherm gave the highest correlation, making the suitable model for the sorption of combined metal (Fe, Mn, Cu and Zn) onto bottom ash, which leads to the conclusion that bottom ash is composed of heterogeneous and multi-layered surfaces in the sorption of combined metal (Fe, Mn, Cu and Zn).

4th International Conference on Research Frontiers in Chalcogen Cycle Science & Technology
38
4. CONCLUSIONS
This study was conducted to assess the effectiveness of the use of bottom ash as a medium for the adsorption of Fe, Mn, Cu and Zn in acid mine drainage. Detailed characterizations of the adsorption capacities of bottom ash were performed. Based on the results, the following conclusions were drawn:
- The adsorption processes were strongly affected by parameters such as pH, L/S (liquild-to-solid ratio) and contact time.
- The adsorption capacity of bottom ash increased with incresing contact time and initial heavy metal concentration. However, it was restricted in sorption behaviour in much higher metal concentration.
- Adsorption of heavy metal ions from single- and multi-component solution based on AMD characteristic of lignite coal mine in Thailand onto coal bottom ash followed the sequence: Fe2+ > Cu2+ > Zn2+ > Mn
- Adsorption of heavy metal ions from single-component solution was higher than multi-component solution due to effect of competing ion.
2+
- The most suitable kinetic model for providing the best correlation of the adsorption kinetic data was the pseudo-second order model.
- Bottom ash is made up of heterogeneous and multi-layered surfaces, which are available for adsorption, as demonstrated by the Freundlich isotherm, the governing equilibrium model.
ACKNOWLEDGMENTS This research was conducted from funding of the French Government under the SCDD/France-AIT Network project and DUPC-funded EVOTEC project from Netherlands. This support is gratefully acknowledged.
REFERENCES
[1] Akcil A, Koldas S. Acid mine drainage (AMD): cause, treatment and case studies. Journal of Cleaner Production 2006;14:1139-1145.
[2] Kijjanapanich P, Pakdeerattanamint K, Lens PNL, Annachhatre P. Organic substrates as electron donors in permeable reactive barriers for removal of heavy metals from acid mine drainage. Environmental Technology 2012;33:2635-2644.
[3] Gibert O, Rotting T, Cortina JL, Pablo JD, Ayora C, Carrera J. In-situ remediation of acid mine drainage using a permeable reactive barrier in Aznalcollar (Sw Spain). Journal of Hazardous Materials 2011;191:287-295.
[4] Mohan D, Chander S. Single component and multi-component adsorption of metal ions by activated carbons. Colloids and Surfaces A: Physicochem. Eng. Aspects 2001;177:183-196.
[5] Johnson DB, Hallberg KB. Acid mine drainage remediation options: a review. Science of the Total Environment 2005;338:3-14.
[6] Thiruvenkatachari R, Vigneswaran S, Naidu R. Permeable reactive barrier for groundwater remediation. Journal of Industrial and Engineering Chemistry 2008;14:145-156.
[7] Hashim MA, Mukhopadhyay S, Sahu JN, Sengupta B. Remediation technologies for heavy metal contaminated groundwater. Journal of Environmental Management 2011;92:2355-2388.
[8] Komnitsas K, Bartzas G, Paspaliaris I. Efficiency of limestone and red mud barriers: laboratory column studies. Minerals Engineering 2004;17:183-194.
[9] Komnitsas K, Bartzas G, Paspaliaris I. Clean up of acidic leachates using fly ash barriers: laboratory column studies. Global Nest: the Int. J. 2004;6:81-89.
[10] Komnitsas K, Bartzas G, Paspaliaris I. Inorganic contaminant fate assessment in zero-valent iron treatment walls. Environmental Forensics 2006;7:207-217.
[11] Komnitsas K, Bartzas G, Fytas K, Paspaliaris I. Long-term efficiency and kinetic evaluation of ZVI barriers during clean-up of copper containing solutions. Minerals Engineering 2007;20:1200-1209.
[12] Yang J, Cao L, Guo R, Jia J. Permeable reactive barrier of surface hydrophobic granular activated carbon coupled with elemental iron for the removal of 2,4-dichlorophenol in water. Journal of Hazardous Materials 2010;184:782-787.

Adsorption of Heavy metals from Acid Mine Drainage by Coal Bottom Ash
39
[13] Chaari I, Medhioub M, Jamoussi F. Use of clay to remove heavy metals from jebel chakir landfill leachate. Journal of Applied Sciences in Environmental Sanitation 2011;6:143-148.
[14] Gorme JB, Maniquiz MC, Kim SS, Son YG, Kim YT. Characterization of bottom ash as an adsorbent of lead from aqueous solutions. Environmental Engineering research 2010;15:207-213.
[15] Asokbunyarat V, Hullebusch EDV, Lens PNL, Annachhatre AP. Coal bottom ash as sorbing material for Fe(II), Cu(II), Mn(II), and Zn(II) removal from aqueous solutions. Water Air Soil Pollut 2015;226:1573-2932.
[16] Mohan S, Gandhimathi R. Removal of heavy metal ions from municipal solid waste leachate using coal fly ash as an adsorbent. Journal of Hazardous Materials 2009;169:351-359.
[17] Sawyer CN, Macarty PL, Parkin GF. Chemistry for environmental engineering and science (15th
BIOGRAPHY
ed.). New York: McGraw-Hill; 2007.
Varinporn ASOKBUNYARAT is studying her PhD in Environmental Engineering and Management from Asian Institute of Technology (AIT), Thailand. She may be contacted at [email protected].
Ajit P. ANNACHHATRE is professor from Environmental Engineering and Management, Asian Institute of Technology (AIT), Thailand. He may be contacted at [email protected].

40

41
Chemical Speciation of Sulfur and Metals in Biogas Reactors - Implications for Cobalt and Nickel Bio-
uptake Processes Sepehr Shakeri Yekta1*, Ulf Skyllberg2, Åsa Danielsson1
Annika Björn,
1, Bo H Svensson
1 1Department of Thematic Studies - Environmental Change, Linköping University, SE-581 83 Linköping, Sweden 2
*Corresponding author: E-mail address: Department of Forest Ecology and Management, Swedish University of Agricultural Sciences, SE-901 83 Umeå, Sweden
[email protected], Phone: +46 (0)13282294
Abstract This article deals with the interrelationship between the overall chemical speciation of S, Fe, Co, and Ni in relation to the metals bio-uptake processes in continuous stirred tank biogas reactors (CSTBR).In order to address this topic, laboratory CSTBRs digesting sulfur (S)-rich grain stillage, as well as a number full-scale CSTBRs treating sewage sludge and various combinations of organic wastes, termed co-digestion, were targeted. Sulfur speciation was evaluated using acid volatile sulfide extraction and S X-ray absorption near edge structure. Chemical speciation of Fe, Co, and Ni was evaluated by the determination of aqueous metals and metal fractions pertaining to solid phases, as well as kinetic and thermodynamic analyses (chemical speciation modelling). The relative Fe to S content in CSTBRs is identified as a critical factor for the chemical speciation and bio-uptake of metals. In the reactors treating Fe-rich sewage sludge, the quantity of Fe exceeds that of S, inducing Fe-dominated conditions under anaerobic conditions, while sulfide dominates in the co-digestion and laboratory reactors due to an excess of S over Fe. Under sulfide-dominated conditions, chemical speciation of the metals is regulated by sulfide and the formation of metal sulfide precipitates, which in turn restrict the availability of metals for microorganisms. However, despite the limitations set by sulfide, aqueous concentrations of different Co and Ni species were shown to be sufficient to support metal acquisition by the microorganisms under sulfidic conditions. Comparatively, the concentrations of free metal ions and labile metal-phosphate and -carbonate complexes in aqueous phase, which directly participate in bio-uptake processes, are higher under Fe-dominated conditions. This results in an enhanced metal adsorption on cell surfaces and faster bio-uptake rates.
Keywords: Biogas, Chemical speciation, bio-uptake, Sulfur, Iron, Cobalt, Nickel
1. INTRODUCTION Anaerobic digestion is a widely applied process for the management of organic waste and the production of biogas, a gas mixture of methane and carbon dioxide [1]. The process depends on the growth of anaerobic microorganisms, and involves a sequence of microbial pathways initiated by hydrolysis of organic composites i.e. carbohydrates, proteins, and lipids into soluble mono- and oligomers such as sugars, amino acids, and fatty acids [2]. The hydrolytic products are subsequently degraded into intermediate fermentation products such as acetate, carbon dioxide, hydrogen, and a number of organic acids. The final steps include the conversion of organic acids into acetate and additional hydrogen, and the production of methane via methanogenic pathways. The methane content of the biogas is used as a renewable energy carrier. Concerted efforts are at present focused on improving the production of biogas in order to expand the economic viability and application of anaerobic digestion technologies [1].
It has long been recognised that the addition of metals, including Fe, Co, and Ni, to biogas reactors improves the efficiency and stability of biogas production, while their absence leads to inefficient biogas formation and process instability [3, 4]. The stimulatory effects of Fe, Co, and Ni additions on biogas formation from a variety of organic substrates have been reported. Jarvis et al. [5] showed that the addition of Co during the anaerobic digestion of grass-clover silage stabilised the digester pH and improved the conversion of acetate. As a result, the addition of Co enabled an increase of the organic loading rate and, consequently, higher methane production as compared to a process which did not incorporate Co. Gustavsson et al. [6] indicated that problems associated with the anaerobic digestion of sulfate-rich grain stillage, such as process instability, low methane production, and the accumulation of volatile carboxylic acids (VCA), could be resolved by the addition of Fe, Co, and Ni. In addition to the stimulated conversion of intermediate fermentation products and methane production, Karlsson et al. [7] showed that an inhibiting effect of phenyl acetate on methane
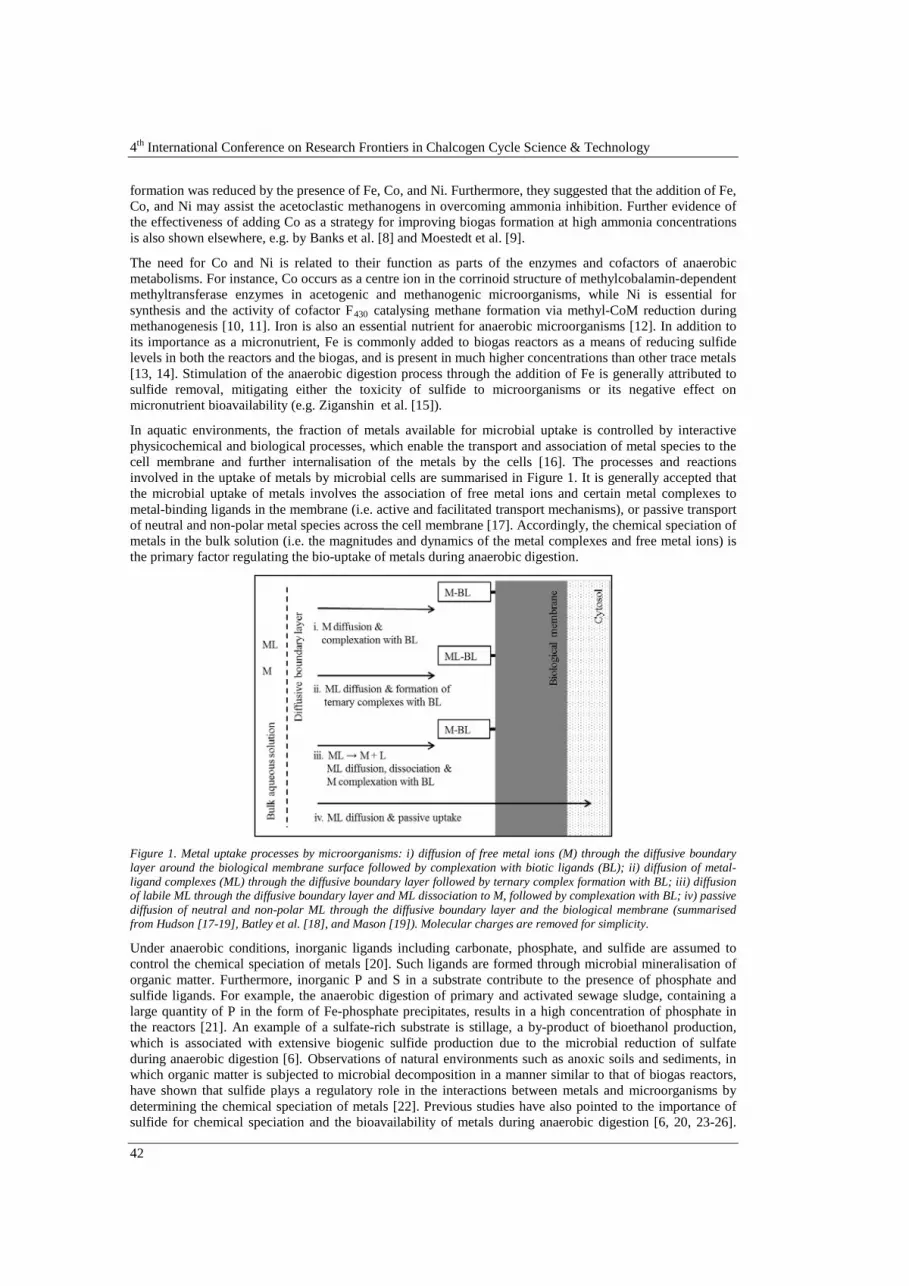
4th International Conference on Research Frontiers in Chalcogen Cycle Science & Technology
42
formation was reduced by the presence of Fe, Co, and Ni. Furthermore, they suggested that the addition of Fe, Co, and Ni may assist the acetoclastic methanogens in overcoming ammonia inhibition. Further evidence of the effectiveness of adding Co as a strategy for improving biogas formation at high ammonia concentrations is also shown elsewhere, e.g. by Banks et al. [8] and Moestedt et al. [9].
The need for Co and Ni is related to their function as parts of the enzymes and cofactors of anaerobic metabolisms. For instance, Co occurs as a centre ion in the corrinoid structure of methylcobalamin-dependent methyltransferase enzymes in acetogenic and methanogenic microorganisms, while Ni is essential for synthesis and the activity of cofactor F430
In aquatic environments, the fraction of metals available for microbial uptake is controlled by interactive physicochemical and biological processes, which enable the transport and association of metal species to the cell membrane and further internalisation of the metals by the cells [16]. The processes and reactions involved in the uptake of metals by microbial cells are summarised in Figure 1. It is generally accepted that the microbial uptake of metals involves the association of free metal ions and certain metal complexes to metal-binding ligands in the membrane (i.e. active and facilitated transport mechanisms), or passive transport of neutral and non-polar metal species across the cell membrane [17]. Accordingly, the chemical speciation of metals in the bulk solution (i.e. the magnitudes and dynamics of the metal complexes and free metal ions) is the primary factor regulating the bio-uptake of metals during anaerobic digestion.
catalysing methane formation via methyl-CoM reduction during methanogenesis [10, 11]. Iron is also an essential nutrient for anaerobic microorganisms [12]. In addition to its importance as a micronutrient, Fe is commonly added to biogas reactors as a means of reducing sulfide levels in both the reactors and the biogas, and is present in much higher concentrations than other trace metals [13, 14]. Stimulation of the anaerobic digestion process through the addition of Fe is generally attributed to sulfide removal, mitigating either the toxicity of sulfide to microorganisms or its negative effect on micronutrient bioavailability (e.g. Ziganshin et al. [15]).
Figure 1. Metal uptake processes by microorganisms: i) diffusion of free metal ions (M) through the diffusive boundary layer around the biological membrane surface followed by complexation with biotic ligands (BL); ii) diffusion of metal-ligand complexes (ML) through the diffusive boundary layer followed by ternary complex formation with BL; iii) diffusion of labile ML through the diffusive boundary layer and ML dissociation to M, followed by complexation with BL; iv) passive diffusion of neutral and non-polar ML through the diffusive boundary layer and the biological membrane (summarised from Hudson [17-19], Batley et al. [18], and Mason [19]). Molecular charges are removed for simplicity.
Under anaerobic conditions, inorganic ligands including carbonate, phosphate, and sulfide are assumed to control the chemical speciation of metals [20]. Such ligands are formed through microbial mineralisation of organic matter. Furthermore, inorganic P and S in a substrate contribute to the presence of phosphate and sulfide ligands. For example, the anaerobic digestion of primary and activated sewage sludge, containing a large quantity of P in the form of Fe-phosphate precipitates, results in a high concentration of phosphate in the reactors [21]. An example of a sulfate-rich substrate is stillage, a by-product of bioethanol production, which is associated with extensive biogenic sulfide production due to the microbial reduction of sulfate during anaerobic digestion [6]. Observations of natural environments such as anoxic soils and sediments, in which organic matter is subjected to microbial decomposition in a manner similar to that of biogas reactors, have shown that sulfide plays a regulatory role in the interactions between metals and microorganisms by determining the chemical speciation of metals [22]. Previous studies have also pointed to the importance of sulfide for chemical speciation and the bioavailability of metals during anaerobic digestion [6, 20, 23-26].

Chemical Speciation of Sulfur and Metals in Biogas Reactors - Implications for Cobalt and Nickel Bio-uptake Processes
43
Sulfide is generally considered to limit the bioavailability of metals by the formation of poorly soluble metal sulfides. The role of aqueous metal sulfide complexes for bio-uptake is generally less recognized. In spite of the fact that the interrelationships between metals and sulfide have been studied in great depth in natural systems (e.g. Rickard and Luther [27]), information regarding the effects of sulfide on the dynamics of Fe, Co, and Ni, and their relationship with the bio-uptake processes in biogas reactors, is limited. We have carried out a series of studies i) to assess the processes which control the chemical speciation of Fe, Co, and Ni under sulfidic conditions and ii) to investigate the effect of sulfide concentration in biogas reactors on the chemical speciation of these metals (cf. Gustavsson et al. [28], Shakeri Yekta et al. [29, 30], and Shakeri Yekta [31]). In this article, these results are combined and evaluated in relation to current theories of metal uptake mechanisms in order to elucidate the role of sulfide in controlling the bio-uptake of metals during anaerobic digestion.
2. MATERIALS AND METHODS Three laboratory and eight full-scale continuous stirred tank biogas reactors (CSTBR) were included as case-studies. Stillage was chosen as the substrate for the laboratory CSTBRs (designated R1, R2) as it contains a high concentration of sulfate and its usage in anaerobic digestion process results in the production of a large amount of biogenic sulfide. Furthermore, efficient and stable biogas production using stillage requires the addition of Fe, Co, and Ni [6]. Accordingly, a high sulfide concentration in stillage-fed biogas reactors, together with the essential addition of metals, provided a system highly suitable for the assessment of the interrelationships between S, Fe, Co, and Ni chemical speciation. The R2 operated with a higher loading rate of S-rich stillage which resulted in an establishment of a higher sulfide concentration compared to R1. The effects of different sulfide concentrations on the chemical speciation of Fe, Co, and Ni were also evaluated using a stillage-fed laboratory CSTBR (R3), which was supplied with increasing amounts of Fe resulting in a decline in sulfide concentrations. The studied full-scale CSTBRs covered a range of sulfide and Fe concentrations common for the operational conditions of Swedish biogas reactors. These varying substrates and conditions provided suitable cases for comparing the S and metal speciation at different sulfide concentrations. The reactors included three sewage sludge digesters (SS) and five co-digesters (CD) fed by different combinations of organic wastes. Information regarding the operational conditions of the laboratory and full-scale CSTBRs are reported in Gustavsson et al. [28] and Shakeri Yekta et al [30], respectively.
Solid phase S speciation was studied by S X-ray absorption near edge structure (XANES) which allowed identification and quantification of major S species in the samples, including FeS, zero-valent S (elemental S and polysulfide), organic reduced S (RSH and RSR), organic disulfide (RSSR), sulfoxide, sulfonate, and sulfate (cf. Shakeri Yekta et al. [30]). The sulfide fraction together with the metals associated with this fraction were quantified using acid volatile sulfide (AVS) and simultaneously extracted metals (AVS-M), as described in Shakeri Yekta et al. [32]. By use of sequential extraction (SE), operationally-defined chemical fractions of metals as exchangeable (e.g. metals adsorbed on particulates), acid-soluble (e.g. metals associated to carbonate), oxidisable (e.g. metals associated to organic matter and sulfide), and residual (i.e. unspecified metal fractions with strong chemical bindings) were addressed for the laboratory reactors (cf. Gustavsson et al. [28]). The removal kinetics of the added metals were studied using time-intensive measurements of their soluble fraction immediately following their addition to the laboratory reactors (cf. Shakeri Yekta et al. [29]). A thermodynamic model was constructed to simulate the chemical speciation of Fe, Co, and Ni in the reactors [30]. The overall performance of the laboratory reactors was monitored by measuring methane production, total solid (TS) and volatile solid (VS) contents, pH, and VCAs. The methods used for the measurements of the monitoring parameters are presented in Gustavsson et al. [6].
3. RESULTS AND DISCUSSION
3.1. Chemical speciation of Fe, Co, and Ni under sulfidic conditions The use of S-rich grain stillage as the substrate for biogas production allowed an establishment of sulfidic conditions in the laboratory reactors. The sulfide concentration, as HS-, in R1 and R2 was 0.7 and 1.5 mmol L-1
Analysis of soluble fraction of metals (i.e. after filtration through filters with 0.2µm pore size) demonstrated that soluble Co fraction comprised up to 20% of the total Co content of R1 and R2 despite a dominance of
, respectively. The SE results demonstrated that approximately 6% and 10% of the total Fe and Co in both reactors were extracted as the sum of the exchangeable and acid-soluble fractions, respectively. Nickel did not occur in these forms. The oxidisable fraction accounted for approximately 65%, 70%, and 100% of total Fe, Co, and Ni, respectively. This fraction was largely dominated by sulfide-bound metals, as demonstrated by analyses of S XANES and AVS-M [28], but also included organically-bound metal fractions of e.g. biomass origin. Approximately 30% and 4% of total Fe and Co occurred in the residual fraction, respectively, while Ni was not present in this fraction.

4th International Conference on Research Frontiers in Chalcogen Cycle Science & Technology
44
CoS(s) minerals in the solid phase. Thermodynamic calculations of soluble Co largely underestimated the measurements [30]. This fraction was apparently very stable, given the observed high solubility of Co in the presence of high aqueous HS- concentrations and predominance of CoS(s) in the solid phases of R1 and R2, as revealed by SE. Thermodynamic calculations of soluble Ni was in reasonable agreement with the measurements of soluble Ni fraction and indicated that Ni in aqueous phase was dominated by Ni-sulfide complexes in equilibrium with NiS(s) in the solid phase. The formation and release of Co-containing vitamin B12
Analysis of the kinetics of Ni removal pattern suggested that the removal of Ni from the aqueous phase was related to chemical processes of Fe, such as reactions involving co-precipitation, ion substitution, and/or adsorption with FeS(s) [29, 39]. Furthermore, studies of the adsorbing capacity of FeS(s) particles formed subsequent to microbial sulfate reduction and biogenic sulfide production have shown that these minerals can effectively scavenge Co and Ni from the aqueous phase [40]. In addition, the presence of metal-binding organic functionalities in the solid phase may promote the association of Fe, Co, and Ni to particulate organic matter at the time of addition. The results from the S K-edge XANES analysis of the samples from R1 and R2 demonstrated that 30% of the total S in the solid phases occurred as reduced organic S, representing the sum of the RSR and RSH species [29]. The occurrence of thiol groups (i.e. RSH) is an indication of the presence of metal-binding organic groups pertaining to the particulate matter. In addition to the thiol groups, other metal-binding organic compounds with O and N functionalities may be present [32]. Particulate organic compounds, such as extracellular polymeric substances and cell surfaces, may also be involved in binding metals [41, 42]. Unfortunately, very little is known about the characteristics and effects of these ligands on the metal speciation in CSTBRs, and further in-depth research on this subject is highly needed. Based on the analysis of the chemical fractions of metals, removal kinetics of metals after supplementation, and thermodynamic calculations, the major chemical reactions which regulate the partitioning of metals between the solid and aqueous phases under sulfidic conditions are summerized in Figure 2.
into methanogenic slurries, reported by Zhang et al. [33], may be the reason behind the observed high solubility of Co. Moreover, specific organic ligands with high affinities for binding Co may be produced by microorganisms as a response to either Co deficiency or excess [34, 35]. Microbial responses to Co stress, such as up-regulation of Fe siderophore transporters for compensating high cellular Co concentration by Fe, or Co efflux proteins, which expedite the export of Co from the cell, have also been observed [36, 37]. It is noteworthy that nano-crystalline Co- and Ni-sulfide particles may be formed under sulfidic conditions and, thus, contribute to the measured soluble fraction of these metals [38].
Figure 2. The major chemical reactions which regulate the partitioning of metals between the solid and aqueous phases under sulfidic conditions, as suggested by the analysis of the chemical fractions of metals, removal kinetics of metals after supplementation, and thermodynamic calculations. Dashed lines represent processes which were hypothesised to occur based on observations.
3.2. Bio-uptake processes of Co and Ni under sulfidic conditions It is generally assumed that less stable metal forms associated with the solid phase (e.g. adsorbed metals) have a higher potential availability for microbial uptake as compared to more stable minerals [43, 44]. Thus, metal fractions in the solid phase as specified by the SE method are (potentially) available for microbial uptake in the order of exchangeable > acid soluble > oxidisable > residual. Assertive bindings of Co and Ni to the oxidisable fraction, containing mainly metal sulfides, suggest that the sulfidic conditions of R1 and R2 restrained the potential bioavailability of these metals. In spite of the limitations set by the sulfidic conditions, Co and Ni additions to these reactors stimulated and stabilised the biogas production performance, and a

Chemical Speciation of Sulfur and Metals in Biogas Reactors - Implications for Cobalt and Nickel Bio-uptake Processes
45
limited supply of either resulted in process disturbances (cf. Gustavsson et al. [45]). Thus, the observed positive effects of metal supplementation on the process performance of the reactors indicated that metals could be utilised by microorganisms and, therefore, microbial uptake of these metals occurred under sulfidic conditions of the laboratory reactors.
Typical microbial mechanisms responsible for the bio-uptake of Co and Ni involve either non-specific ion transporters, or those that specifically transport Co and Ni ions [46, 47]. Thermodynamic modelling of the chemical speciation of Co and Ni demonstrated that free Co2+ and Ni2+ ion concentrations were at the level of pmol L-1. Assuming cellular concentrations of 0.1 – 100 nmol L-1 for Co and Ni as rough estimates [12], the cell requirements for these metals are substantially higher than the concentrations of free Co2+ and Ni2+ ions that were participating in active bio-uptake in R1 and R2. However, by combining experimental data and a modelling approach for the analysis of Co and Ni bio-uptake by cultures of Methanosarcina bakeri, Jansen [48] argued that concentrations of free Co2+ and Ni2+ ions of as low as 0.1 – 0.5 pmol L-1
Little is known about the bio-uptake mechanisms other than free Co and Ni ion transports across the cell-membrane. Aqueous metal sulfide complexes in the form of Co(HS)
may be enough to maintain reasonable bio-uptake fluxes. Accordingly, the free Co and Ni ion concentrations of R1 and R2 could potentially support the cellular requirements of these metals, even at the prevailing sulfide concentrations.
2 and Ni(HS)2 reached concentrations at the level of µmol L-1 in R1 and R2 [29]. The high concentration of these complexes in the bulk solution as compared to the intracellular concentration therefore creates a sharp cross-membrane gradient, which may in turn promote passive uptake of these metal species by the microorganisms. The potential bio-uptake of neutral metal sulfides depends on the permeability of these complexes through the lipid membrane. Benoit et al. [49] demonstrated that the diffusive membrane permeability of neutral Hg-sulfide complexes was sufficient to support the passive transport of these species by the sulfate-reducing bacterium Desulfobulbus propionicus. It has also been suggested that inorganic complexes such as HgCl2, AgCl, and CdCl2 are assimilated via passive uptake mechanisms [19, 50]. Even if information regarding the permeability of Co(HS)2 and Ni(HS)2
The results also demonstrated that a high sulfide concentration and the formation of CoS(s) minerals did not control the high solubility of Co in the studied biogas reactors. The aqueous concentration of Co is regulated by as-yet unidentified mechanisms, which are presumably related to the production of cobalamin-like biomolecules. The incorporation of the complex structures, which are similar to cobalamin, into the membrane-bound transporters and their further uptake is well-known [51]. Thus, the pool of soluble Co fraction in R1 and R2 may also be accessible forms of Co for microorganisms due to their high abundance. In relation to the arguments presented above, it is postulated that the microbial access to metals is restricted at high sulfide concentrations. However, the free Co and Ni ion concentrations, the potential passive uptake of neutral metal sulfide complexes in the aqueous phase, and the high overall solubility of Co allowed metal acquisition by the microorganisms using different transport mechanisms. This may explain why Co and Ni additions stimulated and stabilised the process performance, despite the high sulfide concentrations in R1 and R2.
in lipid media (e.g. octanol – water partitioning) or through cell membranes is scarce, the concentrations of these complexes in the studied biogas reactors should be high enough to support any potential passive uptake of Co and Ni.
3.3. Effects of sulfide concentration on the chemical speciation of Co and Ni Samples from full-scale CSTBRs provided a gradient of inorganic sulfide levels due to different concentrations of S relative to Fe [30]. In the SS reactors, the quantity of Fe exceeded that of S and induced Fe(II)-dominated conditions under anaerobic conditions, while sulfide dominated in the CD and laboratory reactors due to an excess of S over Fe. Based on the thermodynamic modelling results, higher S relative to Fe content gave rise to HS- concentrations ranging between 40 and 150 µmol L-1 in the full-scale CD reactors, while the higher concentration of Fe than S in the SS reactors resulted in relatively low HS- concentrations of 1 – 5 µmol L-1
The analysis of Fe, Co, and Ni concentrations in the solid and aqueous phases of the samples from eight full-scale CSTBRs demonstrated that the aqueous phase of Co comprised between 4 and 18% of the total Co, while aqueous Fe and Ni contributed less than 2% and 5% of the total Fe and total Ni, respectively. The chemical speciation modelling results suggest that metal sulfide precipitation is the major process behind the removal of metals from the aqueous phase, with the exception of Fe in the low sulfide SS reactors, where only 8 – 18% of the total Fe was precipitated as FeS(s). Siderite (FeCO
.
3) and ferrous phosphate (Fe3(PO4)2) are Fe(II)-minerals which potentially occur during anaerobic digestion of Fe-rich sewage sludge. Based on the modelling results, siderite and FeS(s) were the two major solid Fe phases in the SS reactors. In agreement with these results, Mamais et al. [52] and Zhang et al. [53] demonstrated that Fe, when added to anaerobic

4th International Conference on Research Frontiers in Chalcogen Cycle Science & Technology
46
reactors treating sludge, was primarily involved in the precipitation of FeCO3
(s) and FeS(s). However, a more
diverse composition of Fe species might be expected, depending on the overall physicochemical conditions in the reactors. Cobalt and Ni were undersaturated in relation to their solid phases with carbonate, phosphate, hydroxide, and chloride in all reactors, and were present mainly in form of sulfide minerals.
In the aqueous phase, sulfide and thiol complexes dominated the Fe speciation in the sulfidic (CD) reactors. In the SS reactors, a relatively high solubility of Fe was observed as compared to the CD reactors, largely represented by complexes with phosphate [30]. Neutral sulfide, thiols, and carbonate complexes were the major aqueous Co and Ni forms in the CD reactors. In the SS reactors, complexes with carbonate were the major aqueous forms, but thiols, phosphates, and free Co2+ and Ni2+
The effects of the concentration of sulfide on chemical speciation of Co and Ni were further examined by increasing the influent Fe concentration in R3, from 5 to 14 mmol L
ions also made considerable contributions. The ability of the model to predict the solubility of Co and Ni was evaluated. The modelled concentration of aqueous Ni showed a reasonable merit-of-fit in all CD and SS reactors, but the model was less successful in predicting the aqueous concentration of Co. Accordingly, it is suggested that thermodynamic reactions included in the model properly captured the major chemical speciation of Ni, but several important aqueous components were missing for Co. This finding was in line with the previous results from the SE. The presence of Co in soluble fractions may be related to processes which enhance CoS(s) solubility (cf. Fig. 2) and/or the formation of Co-containing biomolecules. The extent of these processes likely differs among full scale CSTBRs due to differing substrate and operational conditions, causing variation in Co partitioning between the solid and aqueous phases.
-1 over the course of 150 days of operation [31]. The primary outcome of the increase in influent Fe concentration was an accumulation of sulfide as FeS(s). This was confirmed by an elevated AVS concentration and a decrease in the hydrogen sulfide content of the biogas overtime. The increase of the total Fe concentration increased the aqueous Fe concentration by approximately 10-fold (from 4 to 36 µmol L-1
To explore the chemical processes which caused the observed shifts in the solid-aqueous partitioning of Fe, Co, and Ni, the chemical interactions between metals and inorganic ligands of carbonate, phosphate, hydroxide, chloride, and sulfide were modelled. The modelling results demonstrated that the addition of Fe led to a decrease in HS
). In parallel, aqueous Co and Ni concentrations in R3 demonstrated a decreasing pattern; from 20% to 10% of total Co, and 2% to <1% of total Ni by the end of the experiment, despite their unchanged total concentrations in the reactor.
- concentration from approximately 2.0 mmol L-1 at the beginning of the experiment down to 0.2 mmol L-1 at the end. The declining HS- concentration caused a substantial decrease in the concentration of aqueous Co- and Ni-sulfide complexes (i.e. Co(HS)2 and Ni(HS)2
The observed increase in the aqueous Fe concentration was likely due to an emerging competition for binding Fe between other available ligands with sulfide when the sulfide concentration changed from high to low. During periods of high sulfide concentration, the solubility of Fe in equilibrium with FeS(s) is primarily dominated by aqueous Fe-sulfide species. As a result of the Fe addition and the decrease in the HS
), while aqueous complexes of Co and Ni formed with other inorganic ligands, as well as their free ion forms, increased by up to two orders of magnitude over the duration of the experiment. Nevertheless, the aqueous Co- and Ni-sulfide complexes dominated over the course of the reactor operation and contributed to >99% of the aqueous concentrations. Accordingly, the decrease in the aqueous concentrations of Co and Ni could mainly be attributed to the decrease in the concentration of sulfide and its related aqueous metal sulfide complexes. Furthermore, it may be argued that an increase in the Fe content and precipitation of FeS(s) in R3 may have triggered co-precipitation and adsorption of Co and Ni with the FeS(s) structure, which could ultimately decrease the overall solubility of Co and Ni [40].
- concentration, a formation of free Fe2+
3.4. Bio-uptake processes of Co and Ni at different sulfide concentrations
ions and aqueous Fe complexes with phosphate and carbonate will predominate the aqueous phase speciation of Fe [31].
The above assessment of Co and Ni chemical speciation provided information regarding the magnitudes and dynamics of major metal species interacting with the microbial interfaces at different sulfide concentrations. The main bio-uptake processes as presented in Figure 1 involve three major categories of inorganic metal species as potential contributors, i.e. free metal ions, labile and easily dissociable compounds (e.g. metal complexes with phosphate, carbonate, hydroxides, and chloride), and non-labile and neutral metal species (e.g. neutral metal sulfide complexes of Co(HS)2 and Ni(HS)2). The relationship between the concentrations of these metal species and the sulfide concentration are presented in Figure 3.

Chemical Speciation of Sulfur and Metals in Biogas Reactors - Implications for Cobalt and Nickel Bio-uptake Processes
47
Figure 3. Results of the thermodynamic modeling of the Co and Ni chemical speciation in full-scale CSTBRs (A and C) and the R3 reactor (B and D) for free metal ions, labile metal complexes with phosphate, carbonate, hydroxide, and chloride ligands, as well as non-labile and neutral metal sulfide complexes of Co(HS)2 and Ni(HS)2
The chemical speciation of Co and Ni in the aqueous phase of the studied CSTBRs is dominated by their complexes with sulfide at the point at which HS
.
- concentration exceeds ~30 µmol L-1 (Fig. 3). The concentration of labile complexes and free ions exceeded the sulfide complexes only in the SS reactors, which were characterised by low HS- concentrations due to the high Fe content of the influent sewage sludge. From a thermodynamic point of view, the bio-uptake of metals via ion transporters can be expressed as surface-complexation reactions between metal ions (M2+) and membrane-bound organic acids (RAH), the metal-binding properties of which depend on the equilibrium constants of the protonation/deprotonation reactions of the organic acids (R-AH = R-A- + H+) and complexation of metal ions with the negatively-charged functional groups (R-A- + M2+ = R-AM+
Moreover, according to the free ion activity model that describes the kinetics of microbial metal uptake [17], the bio-uptake rates of metals are also regulated by the concentration of free metal ions at the membrane-solution interface. The bio-uptake rate (J) depends on the uptake capacity of the microorganisms (J
; [54]). It is therefore postulated that the high free metal ion concentration at low sulfide concentrations stimulates the binding of metals to the membrane-bound organic acids and increases the fraction of metals adsorbed on the cell surface.
max) and the characteristic affinity of the microbial transport systems (Km) for free metal ions (Cm; Worms et al. 2006). The bio-uptake rate is commonly related to the concentration of free metal ions by applying Michalis-Menten kinetics as 𝐽/𝐽𝑚𝑎𝑥 = 𝐶𝑚/(𝐾𝑚 + 𝐶𝑚 ), where J/Jmax is taken to be the relative bio-uptake rate [55]. According to this kinetic approach, the relative bio-uptake flux of metals would increase (i.e. J → Jmax
It is therefore concluded that the extent of the adsorption of Co and Ni on the cell surface, as well as their bio-uptake rates, are potentially higher in the Fe-rich SS reactors and/or following the addition of Fe due to the increased concentration of labile complexes and free ions. As discussed above, neutral metal complexes may be assimilated through passive uptake processes (Fig.1). The passive uptake is derived from the concentration gradient of metals across the membrane, and depends on the permeability of metal species into the membrane layer [19]. As is evident in Figure 3, neutral metal sulfide complexes have concentrations which are up to 4 orders of magnitude higher than those of free ions and labile forms under sulfidic conditions (e.g. in the R3 reactor, with an HS
) for lower sulfide and consequent higher free ion concentrations. In addition, the bio-uptake of free metal ions is assisted by the diffusion of labile metal complexes towards the cell membranes and their further dissociation in the vicinity of membrane-bound ligands (Fig. 1). In this regard, the bio-uptake of Co and Ni is facilitated due to the increase in the concentration of labile Co- and Ni-complexes at lower sulfide concentrations (Fig. 3).
- concentration of up to 2.0 mmol L-1). At low sulfide and consequently low aqueous Co- and Ni-sulfide concentrations, the concentration gradient and, thus, the diffusive forces across the cell membrane diminish, which will decrease the bio-uptake of metals via diffusion-driven mechanisms. It should also be noted that the transport of metal ions across the cell membrane is highly dependent on the quantity of other competing divalent cations in the solution [19]. It has been shown that Co and Ni compete with each other to bind to the metal transporter sites [56]. Therefore, the potential antagonistic effects of Co and Ni on each other’s bio-uptake are likely exacerbated at low concentrations of sulfide and high ionic concentrations of these metals.

4th International Conference on Research Frontiers in Chalcogen Cycle Science & Technology
48
4. CONCLUSIONS The objective of this study was to elucidate the role of sulfide in controlling the bio-uptake of Fe, Co, and Ni in CSTBRs. Accordingly, it is revealed that the dynamics of Co and Ni in biogas reactors have different features, although both metals are strongly affected by the extent of sulfide present through the precipitation of metal sulfide phases and have relatively similar inorganic chemistry in the aqueous phase. High Co solubility was observed in some cases, which appeared to be independent of complexation with inorganic and organic sulfides and the precipitation/dissolution of CoS(s). It is suggested that microorganisms are able to enhance the solubility of the pool of CoS(s) in the reactors by, for example, releasing specific Co-binding organic ligands. It is also possible that vitamin B12
Moreover, the regulatory role of sulfide concentrations in biogas reactors in the chemical speciation of metals and their bio-uptake processes were addressed. It has been shown that decreasing levels of sulfide (as induced through the addition of Fe) may initially lower the concentration of soluble Co and Ni in reactors. This is partially due to a reduction in the formation of aqueous Co- and Ni-sulfide species, which were dominant primarily in the CD reactors or those receiving S-rich substrate (e.g. stillage). However, non-sulfide metal species such as free metal ions and labile metal complexes with phosphate and carbonate in the aqueous phase increase at lower sulfide concentrations. The corresponding effects of changes in the sulfide level on the bio-uptake of Co and Ni by microorganisms could be either positive or negative, depending on the microbial uptake mechanisms involved. The uptake of free metal ions by active/facilitated ion transport mechanisms increases as sulfide is removed from the aqueous phase. This in turn enables a more efficient free metal ion acquisition by the metal transporter systems. However, a lower aqueous concentration of neutral metal sulfide complexes may reduce the cross-membrane concentration gradient, which may diminish diffusion-driven metal uptake mechanisms. Furthermore, the contribution of complex processes which involve interactions of metals with organic functionalities and FeS(s) to the solubility of metals in biogas reactors is suggested. The specific effects of such processes on the regulation of Co and Ni speciation and bio-uptake need to be further studied.
is a part of this phenomenon. It is concluded that the prevailing sulfidic conditions in biogas reactors restrict the accessibility of metals for microorganisms. Nonetheless, it is evident that, even under sulfidic conditions, free metal ion concentrations, the potential passive uptake of aqueous neutral metal sulfide complexes, and high Co solubility were able to support the bio-uptake of metals in CSTBRs.
ACKNOWLEDGEMENT
This study was financed by the Swedish Energy Agency. The staff of the MAX IV laboratory at Lund University for their help with XANES analysis, the staff at the biogas plants for help with sampling, personnel at Scandinavian Biogas Fuel AB for help with running laboratory reactors, and Lantmännen Agroetanol AB, Norrköping, Sweden, for providing the stillage are acknowledged.
REFERENCES [1] M. Krishania, V. Kumar, V.K. Vijay, and A. Malik, Analysis of different techniques used for
improvement of biomethanation process: A review, in Fuel, 2013, pp. 1-9. [2] B.K. Ahring, Perspectives for anaerobic digestion, in Advances in biochemical
engineering/biotechnology, 2003, pp. 1-30. [3] A. Wilkie, M. Goto, F.M. Bordeaux, and P.H. Smith, Enhancement of anaerobic methanogenesis from
napiergrass by addition of micronutrients, in Biomass, 1986, pp. 135-146. [4] M. Takashima, and R.E. Speece, Mineral nutrient requirements for high-rate methane fermentation of
acetate at low SRT, in Research Journal of the Water Pollution Control Federation, 1989, pp. 1645-1650.
[5] Å. Jarvis, Å. Nordberg, T. Jarlsvik, B. Mathisen, and B.H. Svensson, Improvement of a grass-clover silage-fed biogas process by the addition of cobalt, in Biomass and Bioenergy, 1997, pp. 453-460.
[6] J. Gustavsson, B.H. Svensson, and A. Karlsson, The feasibility of trace element supplementation for stable operation of wheat stillage-fed biogas tank reactors, in Water Science and Technology, 2011, pp. 320-325.
[7] A. Karlsson, P. Einarsson, A. Schnürer, C. Sundberg, J. Ejlertsson, and B.H. Svensson, Impact of trace element addition on degradation efficiency of volatile fatty acids, oleic acid and phenyl acetate and on microbial populations in a biogas digester, in Journal of Bioscience and Bioengineering, 2012, pp. 446-452.
[8] C.J. Banks, Y. Zhang, Y. Jiang, and S. Heaven, Trace element requirements for stable food waste digestion at elevated ammonia concentrations, in Bioresource Technology, 2012, pp. 127-135.

Chemical Speciation of Sulfur and Metals in Biogas Reactors - Implications for Cobalt and Nickel Bio-uptake Processes
49
[9] J. Moestedt, S.N. Påledal, A. Schnürer, and E. Nordell, Biogas production from thin stillage on an industrial scale-experience and optimisation, in Energies, 2013, pp. 5642-5655.
[10] G. Diekert, U. Konheiser, K. Piechulla, and R.K. Thauer, Nickel requirement and factor F430 content of methanogenic bacteria, in Journal of Bacteriology, 1981, pp. 459-464.
[11] R. Banerjee, and S.W. Ragsdale, The many faces of vitamin B12: Catalysis by cobalamin-dependent enzymes, in Annual Review of Biochemistry, 2003, pp. 209-247.
[12] R.J.P. Williams, and J.J.R. Fraústo Da Silva, The distribution of elements in cells, in Coordination Chemistry Reviews, 2000, pp. 247-348.
[13] P.N.L. Lens, A. Visser, A.J.H. Janssen, L.W. Hulshoff Pol, and G. Lettinga, Biotechnological treatment of sulfate-rich wastewaters, in Critical Reviews in Environmental Science and Technology, 1998, pp. 41-88.
[14] H. Lindorfer, D. Ramhold, and B. Frauz, Nutrient and trace element supply in anaerobic digestion plants and effect of trace element application, in Water Science and Technology, 2012, pp. 1923-1929.
[15] A.M. Ziganshin, T. Schmidt, F. Scholwin, O.N. Il'Inskaya, H. Harms, and S. Kleinsteuber, Bacteria and archaea involved in anaerobic digestion of distillers grains with solubles, in Applied Microbiology and Biotechnology, 2011, pp. 2039-2052.
[16] I. Worms, D.F. Simon, C.S. Hassler, and K.J. Wilkinson, Bioavailability of trace metals to aquatic microorganisms: importance of chemical, biological and physical processes on biouptake, in Biochimie, 2006, pp. 1721-1731.
[17] R.J.M. Hudson, Which aqueous species control the rates of trace metal uptake by aquatic biota? Observations and predictions of non-equilibrium effects, in Science of the Total Environment, 1998, pp. 95-115.
[18] G.E. Batley, S.C. Apte, and J.L. Stauber, Speciation and bioavailability of trace metals in water: Progress since 1982, in Australian Journal of Chemistry, 2004, pp. 903-919.
[19] R.P. Mason, Trace Metals in Aquatic Systems, in Trace Metals in Aquatic Systems, 2013, pp. 1-431. [20] I.J. Callander, and J.P. Barford, PRECIPITATION, CHELATION, AND THE AVAILABILITY OF
METALS AS NUTRIENTS IN ANAEROBIC DIGESTION. II. APPLICATIONS, in Biotechnology and Bioengineering, 1983, pp. 1959-1972.
[21] C. Carliell-Marquet, J. Smith, I. Oikonomidis, and A. Wheatley, Inorganic profiles of chemical phosphorus removal sludge, in Proceedings of the Institution of Civil Engineers: Water Management, 2010, pp. 65-77.
[22] G.W. Luther Iii, and D.T. Rickard, Metal sulfide cluster complexes and their biogeochemical importance in the environment, in Journal of Nanoparticle Research, 2005, pp. 389-407.
[23] G. Gonzalez-Gil, R. Kleerebezem, and G. Lettinga, Effects of nickel and cobalt on kinetics of methanol conversion by methanogenic sludge as assessed by on-line CH4 monitoring, in Applied and Environmental Microbiology, 1999, pp. 1789-1793.
[24] W.P. Barber, and D.C. Stuckey, Metal bioavailability and trivalent chromium removal in ABR, in Journal of Environmental Engineering, 2000, pp. 649-656.
[25] S.F. Aquino, and D.C. Stuckey, Bioavailability and toxicity of metal nutrients during anaerobic digestion, in Journal of Environmental Engineering, 2007, pp. 28-35.
[26] S. Jansen, G. Gonzalez-Gil, and H.P. van Leeuwen, The impact of Co and Ni speciation on methanogenesis in sulfidic media-Biouptake versus metal dissolution, in Enzyme and Microbial Technology, 2007, pp. 823-830.
[27] D. Rickard, and G.W. Luther Iii, Metal sulfide complexes and clusters, in Reviews in Mineralogy and Geochemistry, 2006, pp. 421-504.
[28] J. Gustavsson, S.S. Yekta, A. Karlsson, U. Skyllberg, and B.H. Svensson, Potential bioavailability and chemical forms of Co and Ni in the biogas process-An evaluation based on sequential and acid volatile sulfide extractions, in Engineering in Life Sciences, 2013, pp. 572-579.
[29] S. Shakeri Yekta, A. Lindmark, U. Skyllberg, A. Danielsson, and B.H. Svensson, Importance of reduced sulfur for the equilibrium chemistry and kinetics of Fe(II), Co(II) and Ni(II) supplemented to semi-continuous stirred tank biogas reactors fed with stillage, in Journal of Hazardous Materials, 2014.
[30] S. Shakeri Yekta, B.H. Svensson, A. Björn, and U. Skyllberg, Thermodynamic modeling of iron and trace metal solubility and speciation under sulfidic and ferruginous conditions in full scale continuous stirred tank biogas reactors, in Applied Geochemistry, 2014, pp. 61-73.
[31] S. Shakeri Yekta, Chemical Speciation of Sulfur and Metals in Biogas Reactors - Implications for Cobalt and Nickel Bio-uptake processes, in The Department of Thematic Studies - Environmental Change, Linköping University, Sweden, 2014, pp. 143.
[32] S. Shakeri Yekta, J. Gustavsson, B.H. Svensson, and U. Skyllberg, Sulfur K-edge XANES and acid volatile sulfide analyses of changes in chemical speciation of S and Fe during sequential extraction of trace metals in anoxic sludge from biogas reactors, in Talanta, 2012, pp. 470-477.

4th International Conference on Research Frontiers in Chalcogen Cycle Science & Technology
50
[33] Z. Zhang, T. Quan, P. Li, Y. Zhang, N. Sugiura, and T. Maekawa, Study on methane fermentation and production of vitamin B12 from alcohol waste slurry, in Applied Biochemistry and Biotechnology - Part A Enzyme Engineering and Biotechnology, 2004, pp. 1033-1039.
[34] M.A. Saito, J.W. Moffett, S.W. Chisholm, and J.B. Waterbury, Cobalt limitation and uptake in Prochlorococcus, in Limnology and Oceanography, 2002, pp. 1629-1636.
[35] K.J. Waldron, and N.J. Robinson, How do bacterial cells ensure that metalloproteins get the correct metal?, in Nature Reviews Microbiology, 2009, pp. 25-35.
[36] J.A. Stadler, and R.J. Schweyen, The yeast iron regulon is induced upon cobalt stress and crucial for cobalt tolerance, in Journal of Biological Chemistry, 2002, pp. 39649-39654.
[37] C. Ranquet, S. Ollagnier-de-Choudens, L. Loiseau, F. Barras, and M. Fontecave, Cobalt stress in Escherichia coli: The effect on the iron-sulfur proteins, in Journal of Biological Chemistry, 2007, pp. 30442-30451.
[38] J. Sitte, K. Pollok, F. Langenhorst, and K. Küsel, Nanocrystalline Nickel and Cobalt Sulfides Formed by a Heavy Metal-Tolerant, Sulfate-Reducing Enrichment Culture, in Geomicrobiology Journal, 2013, pp. 36-47.
[39] J.W. Morse, and T. Arakaki, Adsorption and coprecipitation of divalent metals with mackinawite (FeS), in Geochimica et Cosmochimica Acta, 1993, pp. 3635-3640.
[40] J.H.P. Watson, D.C. Ellwood, Q. Deng, S. Mikhalovsky, C.E. Hayter, and J. Evans, Heavy metal adsorption on bacterially produced FeS, in Minerals Engineering, 1995, pp. 1097-1108.
[41] D. Borrok, M.J. Borrok, J.B. Fein, and L.L. Kiessling, Link between chemotactic response to Ni2+ and its adsorption onto the Escherichia coli cell surface, in Environmental Science and Technology, 2005, pp. 5227-5233.
[42] E.D. Van Hullebusch, J. Gieteling, M. Zhang, M.H. Zandvoort, W.V. Daele, J. Defrancq, and P.N.L. Lens, Cobalt sorption onto anaerobic granular sludge: Isotherm and spatial localization analysis, in Journal of Biotechnology, 2006, pp. 227-240.
[43] T. Jong, and D.L. Parry, Heavy metal speciation in solid-phase materials from a bacterial sulfate reducing bioreactor using sequential extraction procedure combined with acid volatile sulfide analysis, in Journal of Environmental Monitoring, 2004, pp. 278-285.
[44] A. van der Veen, F.G. Fermoso, and P.N.L. Lens, Bonding from analysis of metals and sulfur fractionation in methanol-grown anaerobic granular sludge, in Engineering in Life Sciences, 2007, pp. 480-489.
[45] J. Gustavsson, S. Shakeri Yekta, C. Sundberg, A. Karlsson, J. Ejlertsson, U. Skyllberg, and B.H. Svensson, Bioavailability of cobalt and nickel during anaerobic digestion of sulfur-rich stillage for biogas formation, in Applied Energy, 2013, pp. 473-477.
[46] T. Eitinger, and M.A. Mandrand-Berthelot, Nickel transport systems in microorganisms, in Archives of Microbiology, 2000, pp. 1-9.
[47] S. Okamoto, and L.D. Eltis, The biological occurrence and trafficking of cobalt, in Metallomics, 2011, pp. 963-970.
[48] S. Jansen, Speciation and bioavailability of Co and Ni in anaerobic wastewater treatment, in Wageningen University, The Netherland, 2004.
[49] J.M. Benoit, C.C. Gilmour, and R.P. Mason, The influence of sulfide on solid-phase mercury bioavailability for methylation by pure cultures of Desulfobulbus propionicus (1pr3), in Environmental Science and Technology, 2001, pp. 127-132.
[50] R.P. Mason, J.R. Reinfelder, and F.M.M. Morel, Uptake, toxicity, and trophic transfer of mercury in a coastal diatom, in Environmental Science and Technology, 1996, pp. 1835-1845.
[51] D.P. Chimento, A.K. Mohanty, R.J. Kadner, and M.C. Wiener, Substrate-induced transmembrane signaling in the cobalamin transporter BtuB, in Nature Structural Biology, 2003, pp. 394-401.
[52] D. Mamais, P.A. Pitt, C. Yao Wen, J. Loiacono, and D. Jenkins, Determination of ferric chloride dose to control struvite precipitation in anaerobic sludge digesters, in Water Environment Research, 1994, pp. 912-918.
[53] L. Zhang, J. Keller, and Z. Yuan, Ferrous salt demand for sulfide control in rising main sewers: Tests on a laboratory-scale sewer system, in Journal of Environmental Engineering, 2010, pp. 1180-1187.
[54] S.L. Flynn, J.E.S. Szymanowski, and J.B. Fein, Modeling bacterial metal toxicity using a surface complexation approach, in Chemical Geology, 2014, pp. 110-116.
[55] H.P. Van Leeuwen, Speciation dynamics and bioavailability of metals, in Journal of Radioanalytical and Nuclear Chemistry, 2000, pp. 487-492.
[56] O. Degen, M. Kobayashi, S. Shimizu, and T. Eitinger, Selective transport of divalent cations by transition metal permeases: The Alcaligenes eutrophus HoxN and the Rhodococcus rhodochrous NhiF, in Archives of Microbiology, 1999, pp. 139-145.

Chemical Speciation of Sulfur and Metals in Biogas Reactors - Implications for Cobalt and Nickel Bio-uptake Processes
51
BIOGRAPHY Sepehr Shakeri Yekta obtained his PhD in Environmental Science at Department of Thematic studies - Environmental Change, Linköping University, Linköping, Sweden, in 2015. He completed his MSc in Environmental Science at the same department in 2009, and his B/MSc in Chemical Engineering at Department of Chemical Engineering, Teheran Polytechnic (Amir-Kabir) University, Teheran, Iran, in 2008. He may be contacted at [email protected]

52

53
Exploring the Fungal Protein Cadre in the Biosynthesis of PbSe Quantum Dots
Jaya Mary Jacob, Sumit Sharma and Raj Mohan B
*
Department of Chemical Engineering, National Institute of Technology Karnataka, Surathkal 575 025, INDIA * Corresponding Author:, Associate Professor, Department of Chemical Engineering, National Institute of Technology Karnataka, Surathkal 575 025, INDIA. [email protected]
Abstract While a large number of microbial sources have recently emerged as potent sources for biosynthesis of chalcogenide quantum dots (QDs), studies regarding their biomimetic strategies that initiate QD biosynthesis are scarce. The present study describes several mechanistic aspects PbSe QD biosynthesis using marine Aspergillus terreus. Preliminary studies indicated distinctive morphological features such as abrasion and agglomeration on the fungal biomass after the reaction with the metal/metalloid salts as observed under a scanning electron microscope. To further examine the fungal biomimetic mechanisms that counter the heavy metal stress and initiate the biogenesis of PbSe QDs, specific protein/enzyme assays that studied the variation in total protein content, release of fungal oxido-reductases and metal binding ligands during the course of the reaction was carried out. Bradford assay revealed an increase in the total protein content in the reaction mixture after the biosynthesis reaction in comparison to their initial levels. Fourier Transform Infra-Red Spectroscopic (FTIR) analysis used to interpret the stress components produced by the biomass indicated spectral signatures that are characteristic to primary and secondary stress factors such as thiol compounds and oxalic acid. Further, metal-phytochelatins of the general formula (Cys-Gly)n
Keywords: Aspergillus terreus; Biosynthesis; Metallothionein; PbSe Quantum Dots; Phytochelatin.
were identified as the prominent metal-ion trafficking components in the reaction mixture using Liquid Chromatography Mass Spectroscopic analysis (LCMS). Subsequent assays confirmed the involvement of metal binding peptides namely metallothioneins and other anti-oxidant enzymes like superoxide dismutase that play a prominent role in the microbial metal detoxification system for the biosynthesis of PbSe QDs. Based on these findings a possible mechanism for the biosynthesis of PbSe QDs by marine Aspergillus terreus has also been elucidated.
1. INTRODUCTION The competency of miniature microbial factories in the detoxification of heavy metal/metalloid compounds has always been a subject that has intrigued extensive research fervor [1]. While studies are underway to explore the intricacies revolving around this particular research arena, scientists have simultaneously investigated the utility of the inherent metal detoxification mechanism in microbes for the synthesis of a wide range of technologically relevant metabolites [2, 3]. Noteworthy are the experiments concerning the synthesis and characterization of different types of nanoparticles [4]. One important class of nanofabrications that hold prominence are the chalcogen based semiconductors, usually termed as “Quantum Dots (QDs)” characterized by size tunable optical and electrochemical properties. QDs have gained wide utility as significant entities for bio-imaging, environmental pollution sensing and solar power generation [5]. Recent years have evinced the inception of bio-inspired routes as greener substitutes for the traditional chemical routes for QD syntheses. The microbial factories have proven to be economical and eco-friendly sources for QD synthesis, thus opening prospects as promising sources for meeting their exponentially growing technological demand [6, 7].
The microbial sources that have been explored for the biosynthesis of QDs include prokaryotic bacteria such as E-Coli [6], Brevibacterium casei [7], Lactobacillus [8] etc.; Eukaryotic fungi such as Fusarium oxysporum [9], Saccharomyces cerevisiae [10], Aspergillus terreus [11] etc. and other higher organisms like Lumbricus earthworm [12]. The biosynthesized QDs are attributed with an enhanced biocompatibility because of the presence of the microbial protein capping surrounding them [8,10,12]. Although studies concerning the elucidation of possible microbial pathways that initiate biosyntheses are quite scarce, preliminary studies affirm that the microbial heavy metal detoxification mechanisms and other factors such as the changes in redox potential during the reaction cumulatively negotiate the synthesis of QDs [8,10]. Moreover, studies also direct attention towards the several distinct mechanisms evolved in microorganisms indigenous to heavy metal containing environments. A common mechanism employs the heavy metal efflux pumps to specifically capture and eject cations through cell membrane [13,14]. Alternatively, heavy metal sequestration via cell wall adsorption [15] or by binding to detoxifying ligands, proteins or polymers [16] and the enzymatic

4th International Conference on Research Frontiers in Chalcogen Cycle Science & Technology
54
conversion/detoxification of metal ions into organometallic compounds [17] have been reported. For instance, the redox reactions facilitated by the quinone tautomerization and the elaboration of heavy metal stress proteins in the cytosol and the cellular level detoxification through the process of oxidation/oxygenation has been opined responsible for the synthesis of CdS by yeast cells. However, in case of prokaryotes, the metal detoxification machinery in the cytosol is comparatively less developed and hence any chemical challenge, is circumvented at the membrane level itself, a mildly acidic pH and lowered rH2
In an earlier study, the biogenesis of protein capped PbSe quantum particles by marine Aspergillus terreus was reported [11]. In the present study, the fungal protein cadre involved in the biosynthesis of PbSe QDs by this fungus has been investigated to expound the possible detoxification pathways in the fungus that initiate biosynthesis of QDs.
activates the membrane bound oxido-reductase and makes the requisite ambience for metal oxide nanoparticle synthesis [8].
2. MATERIALS AND METHODS
2.1. Maintenance of fungal cultures and Biosynthesis of PbSe QDs İn the present study, Aspergillus terreus isolated from sae water in proximity to petrochemical industries in Mangalore, Karnataka, India (12.8700° N, 74.8800° E) were used. Briefly, the isolated cultures were maintained on Potato Dextrose Agar medium at room temperature and were subcultured at monthly intervals. Thereafter, biosynthesis of Lead Selenide (PbSe) nanoparticles was initiated by a modification of our protocols mentioned earlier [11]. Growing cultures of Aspergillus terreus was exposed to 10 ml of 0.25 M Lead Nitrate (Pb(NO3)2) and 10 ml of 1.25 M Sodium Seleno Sulphate (Na2SeSO3). The pH of the reaction mixture was fixed at 9.97 and the resultant colloidal solution was heated in a steam bath at 58 oC for 28 min and subsequently subjected to quenching using an ice bath maintained at 4 o
2.2. Studies on mechanism of PbSe QD biosynthesis
C. Further, the flasks were incubated overnight in the laboratory atmosphere, supernatant was collected by filtration under laminar hood and centrifuged for further characterization studies.
To determine the PbSe QD biosynthesis mechanism employed by the fungus, dried fungal biomass and the reaction mixture comprising of the culture supernatant before and after the reaction were analyzed using various sophisticated techniques namely, Scanning Electron Microscopy (SEM) with Energy Dispersive X-ray Analysis (EDAX), Fourier Transform Infra-Red spectroscopic Analysis (FTIR), Liquid Chromatography coupled with Mass Spectrometry (LC-MS) and various assays to confirm the presence of fungal stress proteins were carried out.
2.2.1. Scanning Electron Microscopy (SEM) with Energy Dispersive X-ray Analysis (EDAX)
SEM and EDAX analyses were carried out in order to understand the role of microbial cell surface activity in the presence of Pb and Se salts. The fungal biomass pre and post treatement with the precurssors for PbSe QD synthesis, were harvested by filtration, oven dried at 60 o
2.2.2. Fourier Transform Infra-red Spectroscopic Analysis (FTIR)
C (Rotek, India). The pretreated specimens were then sputtered with gold particles using a sputter coater under vaccum and then observed under a scanning electron microscope (JSM_6380; JEOL, Tokyo) at an accelerating voltage of 12 kV to capture the images. The elemental composition of the scanned surface was analyzed using EDAX measurements at 20 kV.
The fungal biomass before and after the series of reactions for the biosynthesis of PbSe QDs were collected by filteration, washed with distilled water and oven dried at 60 o
2.2.3. Analysis of stress factors using LC-MS
C (Rotek, India). The dried biomass was then powdered and analyzed by Thermo Nicolet 6700, FTIR spectrometer to identify the functional groups and bonds present in them in response to heavy metal stress.
The supernatant after the completion of the biosynthesis reaction was characterized using a liquid chromatographic column equipped with Acela pump and Acela auto-sampler (Thermo Fisher scientific, San Jose, CA, USA). Separation of analytes was conducted on a Luna PFP(2) analytical column (100 mm X 2.0 mm, 3µm). The LC mobile phases were (a) Ammonium formate 0.75 mM adjusted to pH 3.5 with formic acid and (b) methanol. Separation was performed under isocratic conditions with 99% mobile phase A at flow rate of 200 µL/min and a coulmn temperature of 35 oC. total run time per sample was 10 min and all injection

Exploring the fungal protein cadre in the biosynthesis of PbSe quantum dots
55
volumes were 10 µL. Mass spectrometric analysis was performed using a TSQ quantum access (Thermo Fisher Scientific, san Jose, CA, USA) triple quarapole mass spectrometer coupled with electron spay ionization (ESI) operated in multiple rections monitoring (MRM) in positive mode. Data acquisition and analysis were performed with Xcalibur software, version 2.0 (Thermo Fisher Scientific, san Jose, CA, USA).
2.2.4. Bradford assay for estimation of total protein content
The crude filtered supernatant before and after the biosynthesis reaction were initially centrifuged to remove the particulate and cellular debris and then analyzed for its total protein content using Bradford assay [18] Different concentrations of Bovine Serum Albumin (BSA) (Hi-Media) was used as the standard protein for plotting the caliberaton curve. The total protein content in the samples were estimated based on their absorbance at 595 nm using a UV-Vıs spectrophotometer (LAMBDA 40, Perkin Elmer, USA) and the linear fit equation of the calibration plot.
2.2.5. Metallothionein assay
Metallothioneins (MTs) are low molecular weight proteins characterized by a high cysteine content and give rise to metal-thiolate clusters [19]. In the present study, the metallothionein content the crude filtered supernatant before and after the biosynthesis reaction was initially analyzed using the protocol by Linde and Gracia-vazquez [20]. A standard curve with glutathione (GSH) was used as a standard reference for a correct quantification of MT in the samples. GSH contains one cysteine per molecule; thus, it is a standard for quantifying cysteines in protein analyses. Solutions containing different concentrations of GSH were prepared and their absorbance was measured at 412 nm. The amounts of metallothionein in the samples were estimated using the GSH standard, assuming that 1 mol of MT contains 20 mol of cysteine.
2.2.6. Super Oxide Dismutase assay
Super oxide dismutases (SOD) have been recognized as an important class of anti-oxidant enzymes that combat the oxidative stress in the organisms in the presence of heavy metal/foreign pathogen intrusion [21]. The SOD assay is based on the inhibition of the formation of NADH-phenazine methosulphate-nitroblue tetrazolium formazon. The color formed at the end of the reaction can be extracted into butanol and measured at 560 nm. The experimental protocol by Beauchamp and Fridovich (1971) was used to measure the enzyme activity in the the crude filtered supernatant before and after the biosynthesis reaction [22]. The enzyme in the biomass free supernatant after the biosynthesis reaction was also concentrated and purified using 60% acetone precipitation and the enzyme activity was estimated using a spectrophotometer at 560 nm. One unit of enzyme activity is defined as the amount of enzyme that gave 50% inhibition of NBT reduction in one minute.
3. RESULTS AND DISCUSSIONS The present study employed marine Aspergillus terreus for the biosynthesis of PbSe QDs using a green and cost effective protocol. However, the mechanism of formation of QDs by biosynthesis is still largely unexplored [23]. Understanding the cascade of nanoparticle formation is essential from the view-point of maximizing the utility of these nano factories. The following sections explicate the observations of the present study to investigate the mechanism behind the formation of PbSe QDs using marine Aspergillus terreus.
3.1. Morphological studies by scanning electron microscopy (SEM) with Energy Dispersive Analysis using X-rays (EDAX) The remarkable ability of filamentous fungi to bind metal ions is very well documented [24]. The binding of metal ions can be achieved by various processes ranging from physico-chemical interactions, such as absorption or adsorption of metals and their chelation by extra- or intracellular proteins; regulating metal uptake and/or efflux by intracellular sequestration and compartmentalization [25]. In particular, secreted proteins play a vital role in extracellular co-precipitation of metals; a common phenomenon to tackle the high metal concentration among filamentous fungi [26]. In the present study, the scanning electron micrographs of the fungal biomass before and after the biosynthesis of PbSe QDs were analyzed (Figure 1). Figure 1a, revealed that the hyphae of Aspergillus terreus without the Pb and Se stress were cylindrical, and septate, characterized by smooth hyphal filaments. However, the fungal morphology was observed with characteristic surface roughness and agglomerations, and rupture of the hyphae upon treatment with the Pb and Se salts for the biosynthesis of PbSe QDs (Figure 1b). Such surface modifications were earlier reported by Canovas et al. [27] in Aspergillus sp exposed to heavy metals. To further analyze the elemental composition on the surface in the Pb and Se treated biomass, the EDAX results were analyzed, which directed attention towards Pb and

4th International Conference on Research Frontiers in Chalcogen Cycle Science & Technology
56
Se traces on them (figure 1c). The marginal peaks of these metal/metalloid ions in the EDAX spectra and the surface aberrations indicate that surface adsorption and intracellular uptake, could be the initial fungal response that further accelerate the subsequent metal detoxification surge. Irrespective of surface adsorption or intracellular uptake of the metal/metalloid salts, an active microbial metabolism resulting in the production of intracellular detoxifying compounds result in an increased cytosolic pressure leading to the outward growth of the cell wall structures [28]. According to Courbot et al. [29], these intracellular compounds resort to the vacuoles which in turn serves as storage compartments.
Figure 1. SEM images of Aspergillus terreus (a) untreated (b) Pb-Se treated (c) EDAX of the Pb-Se treated biomass
3.2. Fourier Transform Infra-red Spectroscopic Analysis (FTIR) The FTIR spectra of the control and the Pb-Se treated biomass were recorded at a wave number range of 1000-2500 cm-1 to expound the possible cell-stress (metal-metalloid) interactions that lead to the appearance of any microbial stress associated functional groups. The utility of FTIR spectrum as preliminary indicators of primary and secondary stress factors has been reported earlier [30]. In the present study, the FTIR spectrum of the biomass exposed to the precursors for PbSe QD biosynthesis was compared to that of the control to determine the functional groups characteristic to acids, proteinitous and non proteinitous compounds [31,32]. The spectrum of the biomass subjected to PbSe biosynthesis revealed the involvement of oxalic acids as indicated by the absorption peaks at 2495± 5, 1700± 5, 1261± 5, 1201± 5 and 1126± 5 cm-1 and thiol groups at 2561± 5 cm-1 respectively (Figure 2b) [33]. The aforementioned peaks were absent/ exhibited a shift in the spectrum for the control as indicated by Figure 2a. These results indicate the prominent involvement of proteins in Se biosorption and bioreduction by the fungus. Our results are in accordance with prior literature that conclude that proteins and acidic compounds might have aided the bio-reduction of the metal/metalloid salts and the subsequent synthesis of fungal protein stabilized nanoparticles [34]. However, these results are just the preliminary indication of the stress factors; and hence, our samples were further subjected to LC-MS analysis to identify these compounds.
b a
c

Exploring the fungal protein cadre in the biosynthesis of PbSe quantum dots
57
Figure 2.FTIR spectra of the fungal biomass (a) before biosynthesis reaction (control) (b) after reaction with Pb-Se salts
3.3. Liquid Chromatography-Mass Spectrometry Analysis The LC-MS chromatograms for the supernatant after the completion of the biosynthesis reaction are shown in Figure 3 a and b. The HPLC of the sample was eluted at retention times ; 6.979, 10.678, 12.350 and 22.503 min (Figure 3 a). Literature survey revealed that retention times between 6-10 min correspond to the presence of cysteine (Cys) and glutamine (Glu) residues which are the subunits of phytochelatins (𝛾-glutamylcysteine) [33]. Further, based on available literature, the peak obtained at 12.35 min and 22.50 min was attributed to the presence of Phytochelatins (PC2 and PC3 respectively). The m/z peaks of the sample (Figure 3 b) at 308, 541 and 680 was correlated to the m/z peaks of glutathione (GSH), PC2, and PC3 respectively [35]. From the studies of Grill et al. [36], Gekeler et al. [37], Liedschulte et al. [38], and Gill and Tuteja [39], it was revealed that the Phytochelatin of the general formula (𝛾-Glu-Cys)n is the principal heavy metal detoxifying component in both plant and fungal kingdom. The phytochelatins can be viewed as linear polymers of the 𝛾-glutamylcysteine (𝛾-Glu-Cys) portion of glutathione.These peptides could be enzymatically produced by
a
b

4th International Conference on Research Frontiers in Chalcogen Cycle Science & Technology
58
stepwise condensation of 𝛾-Glu-Cys moieties to growing phytochelatin chain (PC). The PC plays a key role in maintaining cell homeostasis under heavymetal stress by binding to heavy metals like Cd, Pb, Zn, Cr, and so forth and trafficking them to vacuoles or periplasmic space for storage [39].
Figure 3. (a)Chromatogram produced by the reaction mixture after PbSe biosynthesis at (a) various retention times (min)
(b) various m/z ratios
3.3. Quantification of other proteins Initially, the total protein content of the cell-free supernatant before and after biosynthesis was estimated using Bradford assay. An active protein secretion was evident in the samples during and after the complete course of the biosynthesis reaction in comparison to the control (Table 1). The total protein content in the supernatant before the reaction was almost negligible when compared to the 10-15 fold protein contents in the samples during and after the reaction respectively. It is speculated that the heat shock and the subsequent quenching of the reaction mixture would have resulted in an outburst of the intracellular metal detoxification proteins to the supernatant. Further, prolonged incubation at room temperature would have resulted in a pH
a
b

Exploring the fungal protein cadre in the biosynthesis of PbSe quantum dots
59
dependent release of the vacuolar metal-protein complexes into the supernatant as observed by elevated protein concentrations in the supernatant after the completion of the reaction.
Several exhaustive reviews report the ubiquitous role of metallothioneins in heavy metal detoxification [40–42]. Metallothionein is a family of cysteine-rich, low molecular weight (MW ranging from 3500 to 14000 Da) proteins which have the capacity to bind both physiological (such as zinc, copper, selenium) and xenobiotic (such as cadmium, lead, mercury, silver and arsenic) heavy metals through the thiol group of its cysteine residues, which represents nearly the 30% of its amino acidic residues [43]. Hence, in the present study, the MT content in the crude supernatant before and after the biosynthesis reaction was analyzed and tabulated (Table 1). Our results indicate higher levels of MT in samples after the biogenesis reaction in comparison to that of the control that further affirm the active role of these metal binding proteins as effective detoxifiers in the fungi that plays a major role in PbSe QD synthesis. Further, to study whether the heavy metal stress response was associated with antioxidant enzyme defense, the changes in the activities of SOD was determined. Table 1 shows the effect of Pb and Se on the antioxidant enzyme levels in fungal cells before and after PbSe biosynthesis. Figures indicate an increase in enzyme activity during the reaction when compared to the SOD activity in the supernatant after the course of the reaction. It is noteworthy that the enzyme activity was absent in the control. These data also suggest that the higher concentrations of Pb (II) ions induced an antioxidant response. The enhanced synthesis of SOD, whose function is to scavenge Reactive Oxygen Species (ROS), suggests that oxidative stress plays a major role in Aspergillus terreus for the synthesis of PbSe QDs. Similar findings have been observed in Candida intermedia under heavy metal stress [44] and A. nidulans in presence of cadmium [45].
Table 1. Protein quantification before and after the biosynthesis reaction
Sl. No. Sample Protein Content Metallothionein
content SOD Activity
mg/mL Total
protein (mg)
µM/mL
Total MT(µM)
Enzyme activity
(mUnits/mL)
Specific activity (mUnits/mgProtein)
1 Crude filtered
supernatant before biosynthesis
8.169 x 10 0.816 -3 3.4 340 N.D N.D
2 Crude filtered
supernatant after biosynthesis
127.4 x 10 12.74 -3 68.8 6880 92.30 724.48
3.4. Mechanism for PbSe QD biosynthesis by Aspergillus terreus Mechanisms of metal detoxification by biomolecules proceeds as cascade of events, such as induction of proteins such as metallothionein, heat-shock protein, phytochelatins, and ferritin, transferring; or by triggering antioxidant enzymes such as superoxide dismutase, catalase, glutathione, and peroxidase; or through high turnover of organic acids such as malate, citrate, oxalate, succinate, aconitate, α- ketoglutarate, etc. Primarily the prominent metal complexation processes are the synthesis of phytochelatins and of other metal-chelating peptides [46]. Based on the above mentioned experimental data, the mechanism for the biogenesis of PbSe QDs by marine Aspergillus terreus was summarized as given in Figure 4.
Initially, the introduction of metal/metalloid precursors activate the cell surface functional groups such as oxalic acid and thiols compounds that reversibly bind the metals on the cell surface as a first line of cellular defense. Oxalate secretion is well-documented in other fungi, and this process has been reported to be stimulated under metal stress [47]. The bulk formation of water-insoluble metal-oxalate crystals is undoubtedly an efficient way to prevent toxic metal ions entering fungal cells [47]. Also, metal chelation by small molecular mass metabolites, peptides and proteins is also documented as a crucially important element of almost all metal/metalloid detoxification processes [48–50]. The presence of metal ions in the biological system activates an enzyme called phytochelatin synthase which utilizes glutathione from the cells to assemble phytochelatins. The metal/metalloid ions tend to bind to the thiol groups leading to the formation of low molecular weight phytochelatin-lead complex. This complex is most likely transported by ATP-binding cassette membrane transport proteins into a vacuole [51]. Subsequently, the selenide ions, in the reaction mixture (produced due to the reducing atmosphere in the growth media) [8], also enter the fungal cytosol. Once within the cytosol, the selenide ions complex with the thiol groups of the metallothioneins. Our observations are in concordance with that of Pal and Das [52], who report that upon exposure to metal ions, fungi synthesize MT and phytochelatins (PC), and cellular resistance to heavy metal cytotoxicity is mainly mediated by the binding of metal ions either to MT or PC.

4th International Conference on Research Frontiers in Chalcogen Cycle Science & Technology
60
Figure 4. Schematic representation of the proposed mechanism for the biosynthesis of PbSe QDs by Aspergillus terreus. (1) Precursors undergo initial redox reactions in the media generating metal/metalloid ions. (2) The metal stress activates the fungal detoxification mechanisms: (a) Surface functional groups; oxalic acids, thiols etc. get activated thus reversibly binding the metal ions (b) Metal stress activate Phytochelatin synthase (PS) to convert glutathione to Phytochelatins (PC)which bind the metal ions and transport them via the ATP binding cassette; (c) Similarly, metallothioneins bind the metal/metalloid ions; (d) Quinone tautomerization (e) Super Oxide Dismutase (SOD) activity and (f) other oxido-reductases create a redox atmosphere to form (3) microscale PbSe and to further initiate transformation to nano scale PbSe in the vacuoles; (4) Heat shock increases the cell wall permeability to drain out the contents into the media where (5) Ostwald ripening of the nuclei take place to result in Protein capped QD formation.
The metal toxicity is also believed to have induced the ROS, thus activating the enzymes to detoxify ROS, namely, SODs. These enzymes utilize the phenolics as preferential electron donors and initiate a series of redox reactions within the fungus. Along with this, a number of simple hydroxy/methoxy derivatives of benzoquinones and toluquinones are elaborated by lower fungi (especially Penicillium and Aspergillus species) [53] that facilitate redox reactions due to its tautomerization [8]. The induced heat shock is anticipated to increase the permeability of the fungal cells, to transport the metal-peptide complexes to the extracellular environment, wherein the redox atmosphere and involvement of glutathiones/ metallothioneins assist the process of nano-fabrication [54] the process of nano-transformation followed by the Oswald ripening, leading to the fabrication of PbSe QDs [10].
4. CONCLUSIONS The present study describes several mechanistic aspects PbSe QD biosynthesis using marine Aspergillus terreus. Preliminary studies indicated distinctive morphological features such as abrasion and agglomeration on the fungal biomass after the reaction with the metal/metalloid salts as observed under a scanning electron microscope. Fourier Transform Infra-Red Spectroscopic (FTIR) analysis used to interpret the stress components produced by the biomass indicated spectral signatures that are characteristic to primary and secondary stress factors such as thiol compounds and oxalic acid. Further, metal-phytochelatins of the general formula (Cys-Gly)n were identified as the prominent metal-ion trafficking components in the reaction mixture using Liquid Chromatography Mass Spectroscopic analysis (LCMS). Bradford assay revealed an increase in the total protein content in the reaction mixture after the biosynthesis reaction in comparison to their initial levels. Subsequent assays confirmed the involvement of metal binding peptides namely metallothioneins and other anti-oxidant enzymes like superoxide dismutase that play a prominent role in the

Exploring the fungal protein cadre in the biosynthesis of PbSe quantum dots
61
microbial metal detoxification system for the biosynthesis of PbSe QDs. Based on these findings a possible mechanism for the biosynthesis of PbSe QDs by marine Aspergillus terreus has also been elucidated.
REFERENCES [1] Wysocki R, Tamás MJ. Cellular Effects of Heavy Metals. Springer Sci + Bus 2011:87–112. doi:10.1007/978-94-
007-0428-2. [2] Kim S-K, editor. Hb25_Springer Handbook of Marine Biotechnology. Berlin, Heidelberg: Springer Berlin
Heidelberg; 2015. doi:10.1007/978-3-642-53971-8. [3] Arora NK, editor. Plant Microbes Symbiosis: Applied Facets. New Delhi: Springer India; 2015. doi:10.1007/978-81-
322-2068-8. [4] Narayanan KB, Sakthivel N. Green synthesis of biogenic metal nanoparticles by terrestrial and aquatic phototrophic
and heterotrophic eukaryotes and biocompatible agents. Adv Colloid Interface Sci 2011;169:59–79. doi:10.1016/j.cis.2011.08.004.
[5] Huang C, Liu S, Chen T, Li Y. A new approach for quantitative determination of glucose by using CdSe/ZnS quantum dots. Sensors Actuators B Chem 2008;130:338–42. doi:10.1016/j.snb.2007.08.021.
[6] Mi C, Wang Y, Zhang J, Huang H, Xu L, Wang S, et al. Biosynthesis and characterization of CdS quantum dots in genetically engineered Escherichia coli. J Biotechnol 2011;153:125–32. doi:10.1016/j.jbiotec.2011.03.014.
[7] Pandian SRK, Deepak V, Kalishwaralal K, Gurunathan S. Biologically synthesized fluorescent CdS NPs encapsulated by PHB. Enzyme Microb Technol 2011;48:319–25. doi:10.1016/j.enzmictec.2011.01.005.
[8] Prasad K, Jha AK. Biosynthesis of CdS nanoparticles: An improved green and rapid procedure. J Colloid Interface Sci 2010;342:68–72. doi:10.1016/j.jcis.2009.10.003.
[9] Ahmad A, Mukherjee P, Mandal D, Senapati S, Khan MI, Kumar R, et al. Enzyme mediated extracellular synthesis of CdS nanoparticles by the fungus, Fusarium oxysporum. J Am Chem Soc 2002;124:12108–9. doi:10.1021/ja027296o.
[10] Bao H, Hao N, Yang Y, Zhao D. Biosynthesis of biocompatible cadmium telluride quantum dots using yeast cells. Nano Res 2010;3:481–9. doi:10.1007/s12274-010-0008-6.
[11] Mary J, Mohan R, Bhat U. Biosynthesis of lead selenide quantum rods in marine Aspergillus terreus. Mater Lett 2014;124:279–81. doi:10.1016/j.matlet.2014.03.106.
[12] Stürzenbaum SR, Höckner M, Panneerselvam a, Levitt J, Bouillard J-S, Taniguchi S, et al. Biosynthesis of luminescent quantum dots in an earthworm. Nat Nanotechnol 2013;8:57–60. doi:10.1038/nnano.2012.232.
[13] Nies DH. Resistance to cadmium, cobalt, zinc, and nickel in microbes. Plasmid 1992;27:17–28. [14] Silver S, Misra TK. Plasmid-mediated heavy metal resistances. Annu Rev Microbiol 1988;42:717–43.
doi:10.1146/annurev.mi.42.100188.003441. [15] Biosci C, Lib NR, Keasling JD, Clark DS, Wang CL, Michels PC, et al. Cadmium removal by a new strain of
Pseudomonas aeruginosa in aerobic culture . Cadmium Removal by a New Strain of Pseudomonas aeruginosa in Aerobic Culture 1997;63.
[16] Volesky B, Prasetyo I. Cadmium removal in a biosorption column. Biotechnol Bioeng 1994;43:1010–5. doi:10.1002/bit.260431103.
[17] Gadd GM. Microbial influence on metal mobility and application for bioremediation. Geoderma 2004;122:109–19. doi:10.1016/j.geoderma.2004.01.002.
[18] Kruger NJ. The Bradford method for protein quantitation. Methods Mol Biol 1994;32:9–15. doi:10.1385/0-89603-268-X:9.
[19] Murthy. Effect of lead on metallothionein concentration in lead-resistant bacteria Bacillus cereus isolated from industrial effluent. African J Biotechnol 2011;10:15966–72. doi:10.5897/AJB11.1645.
[20] Linde AR, Garcia-Vazquez E. A simple assay to quantify metallothionein helps to learn about bioindicators and environmental health. Biochem Mol Biol Educ 2006;34:360–3. doi:10.1002/bmb.2006.494034052653.
[21] Tsekova K, Todorova D. Copper (II) accumulation and superoxide dismutase activity during growth of Aspergillus niger B-77. Z Naturforsch C 2002;57:319–22.
[22] Gels A, Applicable A. Irwin fridovich. Reactions 1971;287:276–87. [23] Kumar V, Yadav SK. Plant-mediated synthesis of silver and gold nanoparticles and their applications. J Chem
Technol Biotechnol 2009;84:151–7. doi:10.1002/jctb.2023. [24] Ghosh A, Ghosh Dastidar M, Sreekrishnan TR. Recent Advances in Bioremediation of Heavy Metals and Metal
Complex Dyes: Review. J Environ Eng 2015:C4015003. doi:10.1061/(ASCE)EE.1943-7870.0000965. [25] Sathiyasarathi VG, Kumar GG. Bio—Resources Mediated Nanosynthesis. Rev Adv Sci Eng 2012;1:148–61.
doi:10.1166/rase.2012.1017. [26] Jain N, Bhargava A, Sabat D, Panwar J. Unveiling the potential of metal-tolerant fungi for efficient enzyme
production. Process Biochem 2014;49:1858–66. doi:10.1016/j.procbio.2014.07.023. [27] Cánovas D, Vooijs R, Schat H, De Lorenzo V. The role of thiol species in the hypertolerance of Aspergillus sp. P37
to arsenic. J Biol Chem 2004;279:51234–40. doi:10.1074/jbc.M408622200. [28] Paraszkiewicz K, Bernat P, Naliwajski M, Długoński J. Lipid peroxidation in the fungus Curvularia lunata exposed
to nickel. Arch Microbiol 2010;192:135–41. doi:10.1007/s00203-009-0542-3. [29] Courbot M, Diez L, Ruotolo R, Chalot M, Leroy P. Cadmium-responsive thiols in the ectomycorrhizal fungus
Paxillus involutus. Appl Environ Microbiol 2004;70:7413–7. doi:10.1128/AEM.70.12.7413-7417.2004. [30] Qian W, Krimm S. Vibrational analysis of glutathione. Biopolymers 1994;34:1377–94. doi:10.1002/bip.360341009. [31] Ivanova J, Chernev G, Samuneva B. Effect of Ag, Cu AND Zn CONTAINING HYBRID NANOMATRIXES ON
THE GREEN ALGAE CHLORELLA KEISSLERI. Gen Appl Plant Physiol 2008;3-4:339–45. [32] Kong J, Yu S. Fourier transform infrared spectroscopic analysis of protein secondary structures. Acta Biochim
Biophys Sin (Shanghai) 2007;39:549–59.

4th International Conference on Research Frontiers in Chalcogen Cycle Science & Technology
62
[33] Damodaran D, Balakrishnan RM, Shetty VK. The Uptake Mechanism of Cd ( II ), Cr ( VI ), Cu ( II ), Pb ( II ), and Zn ( II ) by Mycelia and Fruiting Bodies of Galerina vittiformis 2013;2013.
[34] Sarkar J, Dey P, Saha S, Acharya K. Mycosynthesis of selenium nanoparticles. Micro Nano Lett 2011;6:599. doi:10.1049/mnl.2011.0227.
[35] Robin S, Leveque N, Courderot-Masuyer C, Humbert P. LC-MS determination of oxidized and reduced glutathione in human dermis: a microdialysis study. J Chromatogr B Analyt Technol Biomed Life Sci 2011;879:3599–606. doi:10.1016/j.jchromb.2011.09.052.
[36] Grill E, Winnacker EL, Zenk MH. Phytochelatins: the principal heavy-metal complexing peptides of higher plants. Science 1985;230:674–6. doi:10.1126/science.230.4726.674.
[37] Liedschulte V, Wachter A, Zhigang A, Rausch T. Exploiting plants for glutathione (GSH) production: Uncoupling GSH synthesis from cellular controls results in unprecedented GSH accumulation. Plant Biotechnol J 2010;8:807–20. doi:10.1111/j.1467-7652.2010.00510.x.
[38] Gekeler W, Grill E, Winnacker E-L, Zenk MH. Algae sequester heavy metals via synthesis of phytochelatin complexes. Arch Microbiol 1988;150:197–202. doi:10.1007/BF00425162.
[39] Gill SS, Tuteja N. Cadmium stress tolerance in crop plants: probing the role of sulfur. Plant Signal Behav 2011;6:215–22.
[40] Hall JL. Cellular mechanisms for heavy metal detoxification and tolerance. J Exp Bot 2002;53:1–11. doi:10.1093/jexbot/53.366.1.
[41] Mejáre M, Bülow L. Metal-binding proteins and peptides in bioremediation and phytoremediation of heavy metals. Trends Biotechnol 2001;19:67–73.
[42] Thirumoorthy N, Manisenthil Kumar K-T, Shyam Sundar A, Panayappan L, Chatterjee M. Metallothionein: an overview. World J Gastroenterol 2007;13:993–6.
[43] Sigel A, Sigel H, Sigel RKO. Metallothioneins and Related Chelators. Royal Society of Chemistry; 2009. [44] Fujs S, Gazdag Z, Poljsak B, Stibilj V, Milacic R, Pesti M, et al. The oxidative stress response of the yeast Candida
intermedia to copper, zinc, and selenium exposure. J Basic Microbiol 2005;45:125–35. doi:10.1002/jobm.200410480.
[45] Guelfi A, Azevedo RA, Lea PJ, Molina SMG. Growth inhibition of the filamentous fungus Aspergillus nidulans by cadmium: an antioxidant enzyme approach. J Gen Appl Microbiol 2003;49:63–73.
[46] Carpenè E, Andreani G, Isani G. Metallothionein functions and structural characteristics. J Trace Elem Med Biol 2007;21:35–9. doi:10.1016/j.jtemb.2007.09.011.
[47] Jarosz-Wilkolazka A, Gadd GM. Oxalate production by wood-rotting fungi growing in toxic metal-amended medium. Chemosphere 2003;52:541–7. doi:10.1016/S0045-6535(03)00235-2.
[48] Wysocki R, Tamás MJ. How Saccharomyces cerevisiae copes with toxic metals and metalloids. FEMS Microbiol Rev 2010;34:925–51. doi:10.1111/j.1574-6976.2010.00217.x.
[49] Azcón-Aguilar C, Barea JM, Gianinazzi S, Gianinazzi-Pearson V, editors. Mycorrhizas - Functional Processes and Ecological Impact. Berlin, Heidelberg: Springer Berlin Heidelberg; 2009. doi:10.1007/978-3-540-87978-7.
[50] Tamas MJ, Martinoia E, editors. Molecular Biology of Metal Homeostasis and Detoxification. vol. 14. Berlin, Heidelberg: Springer Berlin Heidelberg; 2006. doi:10.1007/b98249.
[51] Slocik JM, Knecht MR, Wright DW. Biogenic nanoparticles. Encycl Nanosci Nanotechnol 2004;1:293–308. [52] Pal SK, Das TK. Biochemical characterization of N-methyl N’-nitro-N-nitrosoguanidine-induced cadmium resistant
mutants of Aspergillus niger. J Biosci 2005;30:639–646. [53] GOODWIN TW. Chemistry and biochemistry of plant pigments. 1965. [54] Jha AK, Prasad K. Leaf. Int J Green Nanotechnol Phys Chem 2010;1:P110–P117. doi:10.1080/19430871003684572.
ACKNOWLEDGEMENT Authors are thankful to the Department of Metallurgical and Materials Engineering, NITK Surathkal for extending the SEM facility. The support by the Sophisticated Analytical and Instrumentation Facility at the Indian Institute of Science Bangalore for the LC-MS analysis and the Department of Chemistry, Mangalore University for the FTIR analysis is also acknowledged.

63
Extracellular Production of Tellurium Nanoprecipitates by the Photosynthetic Bacterium
Rhodobacter capsulatus Roberto Borghese1*, Marco Brucale2, Gianuario Fortunato1, Francesco Valle3,
Massimo Cavallini3 and Davide Zannoni1* 1Dept. of Pharmacy and Biotechnology, University of Bologna, Italy; 2,3Institute for the Study of Nanostructured Materials (CNR-ISMN), 2Rome and 3*Corresponding authors: Roberto Borghese
Bologna, Italy [email protected]; Davide Zannoni [email protected]
Abstract Tellurium belongs to the group 16 of the periodic table. Remarkably, the high toxicity of the Te oxyanions (mainly tellurite, TeIV) causes environmental problems in contaminated soils and water bodies. The facultative photosynthetic bacterium Rhodobacter capsulatus is featured by a significant level of resistance to tellurite that is dependent on the growth mode. Recently, we have reported that the redox mediator lawsone (2-hydroxy-1,4-naphtoquinone), known as “henna leaf extract” (Lawsonia inermis), allows anaerobic light-grown cultures of R. capsulatus to generate Te0 nano-precipitate outside the cells, i.e. in the growth medium. Here we have optimized the cultural conditions to generate Te0 nano-precipitates by R. capsulatus as a function of the carbon source, lawsone concentration and nano-particles generation kinetics. Pyruvate resulted to be the best electron donor for Te0 generation while lawsone, when used at <10 µM, affected both the kinetic and amount of nano-particles production. Further, growing cultures over a 10 days period with daily additions of 1 mM tellurite, led to the accumulation of progressively larger tellurite nano-precipitates showing a wide size-range up to 600 nm in length. This finding suggests that nucleation of new particles takes place over the entire cell growth period although the addition of new material to pre-formed particles is the main strategy used by R. capsulatus to accumulate Te0 outside the cells. Notably, atomic force microscopy (AFM) and X-ray photoelectron spectroscopy (XPS) analyses of Te0
Keywords: chalcogen oxyanions; nanoparticles; photosynthetic bacteria; Rhodobacter capsulatus; tellurite;
particles indicate the presence of an external organic coating that keeps the particles in solution in aqueous solvents. The abundance of carbonyl groups (C=O) points to proteins as one of the main components of the particle-external coating.
1. INTRODUCTION
Tellurium (Te) is a true metalloid which belongs to the Group 16 elements sometimes referred to as chalcogens, which also includes oxygen (O), sulfur (S), selenium (Se) and polonium (Po). Tellurium is occasionally found native, but is more often found as combined with other metals such as the telluride of gold, calaverite (AuTe2), and silver/gold, sylvanite (AgAuTe4). As Te shows strong metal-like properties, it can exist in a number of redox states, namely: telluride (Te2−) → elemental tellurium (Te0) → tellurite (TeO3
2−) → tellurate (TeO42−
).
Prokaryotes and eukaryotes are exposed to tellurium mainly as its oxidized ions in the form of the oxyanions, as well as in organometalloid forms; however, the exact ionic form of the metalloid to which living organisms are exposed is still unknown [1]. For example, in solution at physiological pH, TeIV likely exists at a ratio HTeO3
−:TeO32− of ≅100:1. Thus, the standard redox potential of
the Te/TeO32− couple (−0.42 V) at basic pHs would raise to −0.12 V for the couple
HTeO3−/TeO3
2− at pH 7.0, with no Te4+
present due to its instability in water [2].
Interestingly, tellurate and tellurite oxyanions can serve as electron acceptors in the respiratory chain and hence sustain anaerobic growth of certain bacteria [3-4]. In the past, periplasmic and membrane-bound nitrate reductases from E. coli, Ralstonia eutropha, Paracoccus denitrificans, P. pantotrophus, and R. sphaeroides have shown the capacity to reduce tellurite in vitro [5-6]. TeO3
2- reduction and precipitation in the form of metal Te0 is not only found into the cytoplasmic space, which necessitates a mechanism of tellurite entry into cells, but also externally to cells, e.g. cell surface and/or periplasmic space [7]. Exogenous Te0 particle deposits are particularly evident in those species such as Sulfurospirillum barnesii and Bacillus beveridgei sp.nov. able to use tellurite

4th International Conference on Research Frontiers in Chalcogen Cycle Science & Technology
64
and tellurate as exogenously electron acceptors under anaerobic respiration [4]. However, also less exotic species such as Pseudomonas aeruginosa, E. coli, Erwinia carotovora and Agrobacterium tumefaciens accumulate Te0
deposits in the periplasmic space [8].
Tellurite reduction to crystal particles of elemental Te0
were reported both inside and/or outside the cells of photosynthetic bacterial species such as Rhodobacter capsulatus [9], R. sphaeroides [10], Pseudomonas pseudoalcaligenes KF707 [2], Strain ER-Te-48 [3], S. barnesii [11], Bacillus selenitireducens [4]. It is noteworthy that the extracellular production of nanoparticles has wider applications than intracellular accumulation. One interesting example is the case of bio-palladium particles accumulated on the cell wall of the iron-reducer Shewanella oneidensis MR-1 used in vivo as catalysts in the dechlorination of polychlorinated biphenyl (PCBs) [12].
Presently there are no reports on the catalytic use of exogenously generated Te-nanoparticles by microorganism; however, the physical properties of this metalloid do not exclude a priori this possibility as telluro-compounds are increasingly being used as catalysts. Indeed, unlike bulk material, nanoparticles show peculiar physical, chemical, electronic and biological properties that derive from their size. These physical properties are caused by their large surface area, large surface energy, spatial confinement and reduced imperfections. Therefore, the synthesis of monodispersed nanoparticles with different size and shapes is a key goal but remains a challenge in nanotechnology due to the use of toxic chemicals on the surface of nanoparticles along with non-polar solvents in the synthesis procedure. Although these latter methods are extensively applied, the presence of toxic chemicals limits their applications in clinical fields being a subject of major concern. Owing to this, microbiological methods to generate nanoparticles are regarded as safe, cost-effective and environment-friendly processes. In this respect, it has been shown that quinone-type redox mediators can participate in the biotransformation of azo dyes, nitroaromatics, polychlorinated compounds, FeIII oxides, UVI, TcVII, AsV, SeIV and TeIV
[13-15].
We have recently reported that photosynthetic cells of Rhodobacter capsulatus grown in the presence of lawsone, i.e. 2-hydroxy-1,4-naphthoquinone, catalyze the extracellular accumulation of Te0 nanoparticles in contrast to the formation of intracellular deposits in the absence of this quinone analogue. Menadione (2-methyl-1,4-naphthoquinone) and juglone (5-hydroxy-1,4-naphthoquinone), two quinones characterized by having similar chemical structures but different redox potentials (Eh
0’ = –14 mV and + 50 mV, respectively) relative to lawsone (Eh0’= – 145 mV),
showed no significant redox activities in mediating tellurite reduction/precipitation outside the cells [16]. Another interesting observation was that production of these extracellular particles is linked to the cell growth carbon source as the accumulation of the particles was not seen with malate, succinate and acetate whereas pyruvate, fructose and to a lesser extent glucose, produced a deep blackening due to Te0
Here we report for the first time the optimization of the cultural conditions to generate Te
precipitates [16]. 0
nano-precipitates in anaerobically-grown cells of R. capsulatus as a function of the carbon source, lawsone concentration and nano-particles generation kinetics.
2. MATERIALS AND METHODS
2.1. Growth conditions and nanoparticles preparation
Rhodobacter capsulatus cells were grown anaerobically in RCV minimal medium [17] under photosynthetic conditions. Anaerobiosis was obtained upon incubation of filled screw-capped bottles, containing the cell suspension, for 20 hrs in the dark, to allow for the complete O2 consumption by bacterial respiration. After reaching anaerobiosis, K2TeO3
and lawsone were added at variable final concentrations as indicated in the text, and the bottles were put in the light. The different carbon sources used in the growth experiments were added at a concentration of 30 mM each.

Extracellular Production of Tellurium Nanoprecipitates by the Photosynthetic Bacterium Rhodobacter
capsulatus
65
The tellurium nanoparticles were prepared after 24, 120 or 240 hrs of incubation in the light in the presence of 1 mM tellurite and 25 µM lawsone. The cultures were first centrifuged at 10,000 rpm for 10 min in order to collect the cells. The supernatant was then centrifuged at 18,000 rpm for 30 min and the nanoparticles were concentrated in a tight pellet. The material obtained consisted mainly of chalcogen nanoparticles, with some residual cells, and was resuspended in a small volume of Millipore purified water. The nanoparticles prepared after 24 hrs were further purified by filtration through a 0.22 μm pores membrane.
2.2. Determination of tellurite concentration
The quantitative determination of potassium tellurite in liquid media was done using the reagent diethyldithiocarbamate (DDTC) (Sigma) as described by Turner et al. [18].
2.3. Atomic Force Microscopy imaging and morphometry
To characterize the morphology of Te nanocrystals, 5 μl aliquots of purified suspensions (see above) were diluted (10x) with 45 μl of ultrapure water and left to equilibrate at room temperature for 10 min. 10 μl of the diluted sample were then deposited on freshly cleaved mica (RubyRed Mica Sheets, Electron Microscopy Sciences, Fort Washington, USA) and left to adsorb for 5 minutes. The sample was then rinsed with ~400 μl of ultrapure water and dried with a gentle nitrogen flow. AFM imaging was performed on a Multimode 8 microscope equipped with a Nanoscope V controller and a type J piezoelectric scanner (Bruker, USA). Samples were scanned in air using Peak Force Tapping mode with Scanasyst-Air probes (Bruker, USA). Special care was taken to obtain images in which the metalloid precipitates appeared well spread and isolated on the surface rather than overlapped and tangled. Raw images were first processed to remove background nonlinearity (flattening) using Gwyddion v2.40 (http://gwyddion.net/). A threshold mask was then used to exclude the flat, empty areas of the images, singling out the aggregates for successive morphometric analysis. Te nanocrystal lengths were simply evaluated my measuring the distance between the two furthest points in the original mask.
3. RESULTS
In Rhodobacter capsulatus the production of tellurium extracellular particles requires anaerobic growth conditions and, as previously shown in [16], is linked to the carbon source added. The strict dependence of tellurite reduction on the presence of a metabolizable carbon source was proven incubating R. capsulatus cells under nanoprecipitates production conditions in the presence of 0.5 mM tellurite and 4mM pyruvate, which represents a limiting concentration able to sustain the complete reduction of the oxyanion over a 24 h period (not shown). Figure 1 shows two parallel cultures subjected to different growth regimes. The first culture received 0.5 mM tellurite (full arrow), with no carbon source, at time 0 and, after 24 and 48 h periods, in which the residual pyruvate from the inoculum was consumed, there were two more additions of 0.5 mM tellurite each (Fig. 1A). The second culture was supplemented with both tellurite 0.5 mM and pyruvate 4 mM (empty arrow) at time 0, 24 and 48 (Fig 1B). By comparing the traces in Figure 1, it is apparent that tellurite reduction takes place only in the presence of pyruvate.

4th International Conference on Research Frontiers in Chalcogen Cycle Science & Technology
66
Figure 1. Dependence of bacterial tellurite reduction on the carbon source. (A) control culture with no carbon source (pyruvate) added; (B) culture to which pyruvate has been added daily. Full vertical arrows: tellurite addition; empty arrows: pyruvate addition
The redox mediator lawsone, albeit essential for the production of external nanoparticles, is quite toxic to the cells when used > 50µM [16]. Therefore, the determination of the lowest concentration able to promote the production of tellurium nanoparticles is an important step for the optimization of a microbiological approach. Nanoparticles were prepared, following the standard procedure outlined in the Materials and Methods section, in the presence of increasing lawsone concentrations, from 2 to 25 µM. At all concentrations tested there was production of nanoparticles as evidenced by AFM analysis (Fig. 2).
Figure 2 . AFM images of nanoparticles prepared at two different lawsone concentrations. (Left) 2 µM; (Right) 25 µM
The increasing concentration of the mediator appeared to have a direct effect on the dimensions of the extracellular material produced. At 2 µM lawsone the particles were too small to be measured with any accuracy, as the mediator concentration increased so did the dimension of the particles (Table 1).

Extracellular Production of Tellurium Nanoprecipitates by the Photosynthetic Bacterium Rhodobacter
capsulatus
67
Table1. Nanoparticles average dimension ± standard deviation as a function of lawsone concentration
Lawsone concentration (µM)
Nanoparticles average length (nm)
2 NDa (<50)
5 98 ± 31
10
b
129 ± 34 25 200 ± 49
a
Not Determined. Particles are too small to be measured with accuracy
The extreme toxicity of the oxyanion tellurite represents a second marked limitation in the development of microbiological methods for the production of nanostructures containing tellurium. Tellurite concentrations above 2 mM are deleterious to R. capsulatus viability and tellurite reduction activity. In order to overcome this limitation, the incubation conditions optimal for extracellular nanoparticles productions were first determined, and it was shown that tellurite, 1 mM, was completely reduced to Te0
by photosynthetic culture in less than 24 hrs, in the presence of 25 µM lawsone and 30 mM pyruvate. Tellurite was then added daily at a concentration of 1 mM and pyruvate was replenished after 4 days over a period of 10 days. This regime led to the accumulation of progressively larger tellurite nano-particles up to 600 nm in length (Fig. 3).
Figure 3. AFM image of tellurium nano-particles after 10 days of photosynthetic incubation with daily addition of 1 mM tellurite
Preliminary analyses of the surface composition of the Te0
nano-particles by AFM and X-ray photoelectron spectroscopy (XPS) indicate the presence of an external organic coating that keeps the particles in solution in aqueous solvents. The abundance of carbonyl groups (C=O) points to proteins as one of the main components of the external coating (not shown).

4th International Conference on Research Frontiers in Chalcogen Cycle Science & Technology
68
4. CONCLUSIONS
This report shows a series of convincing, although preliminary, results on the capacity of anaerobic photosynthetically grown cultures of Rhodobacter capsulatus to biotransform tellurite oxyanions into elemental Te0 nanoprecipitaes as a function of exogenously added lawsone, 2-hydroxy-1,4-naphthoquinone. Pyruvate resulted to be the best electron donor for Te0 generation while lawsone when used at <10 µM affected both the kinetic and amount of nano-particles production. Further, growing cultures over a 10 days period with daily additions of 1 mM tellurite, led to the accumulation of progressively larger tellurite nano-precipitates showing a wide size-range up to 600 nm in length. This finding suggests that nucleation of new particles takes place over the entire cell growth period although the addition of new material to pre-formed particles is the main strategy used by R. capsulatus to accumulate Te0 outside the cells. Notably, atomic force microscopy (AFM) and X-ray photoelectron spectroscopy (XPS) analyses of Te0
particles indicate the presence of an external organic coating that keeps the particles in solution in aqueous solvents. The abundance of carbonyl groups (C=O) points to proteins as one of the main components of the particle-external coating. This finding opens new perspectives but also raises further questions about the microbial processing of chalcogens.
ACKNOWLEDGEMENTS We thank the University of Bologna (Grant RFO 2013-14) and the National Flagship Project NANOMAX N-CHEM for financing this work. We also thank Alessio Messi (CNR-ISMN, Roma, Italy) for his support in XPS measurements. REFERENCES [1] Zannoni D, Borsetti F, Harrison JJ, R.J. Turner RJ. The bacterial response to the chalcogen metalloids Se and Te. Adv
Microb Physiol 2008;53:1-71. [2] Di Tomaso G, Fedi S, Carnevali M, Manegatti M, Taddei C, Zannoni D. The membrane-bound respiratory chain of
Pseudomonas pseudoalcaligenes KF707 cells grown in the presence or absence of potassium tellurite. Microbiology 2002;148:1699-1708.
[3] Csotonyi JT, Stackebrandt E, Yurkov V. Anaerobic respiration on tellurate and other metalloids in bacteria from hydrothermal vent fields in the eastern Pacific Ocean. Appl Environ Microbiol 2006;72:4950-4956.
[4] Baesman SM, Bullen TD, Dewald J, Zhang DH, Curran S, Islam FS, Beveridge TJ, Oremland RS. Formation of tellurium nanocrystals during anaerobic growth of bacteria that use Te oxyanions as respiratory electron acceptors. Appl Environ Microbiol 2007;73:2135-2143.
[5] Avazeri C, Turner RJ, Pommier J, Weiner JH, Giordano G, Vermeglio A. Tellurite and selenite reductase activity of nitrate reductases from Escherichia coli: correlation with tellurite resistance. Microbiology 1997;143:1181-1189.
[6] Sabaty M, Avazeri C, Pignol D, Vermeglio A. Characterization of the reduction of selenate and tellurite by nitrate reductases. Appl Environ Microbiol. 2001;67:5122-5126.
[7] Baesman SM, Stolz JF, Kulp TR, Oremland RS. Enrichment and isolation of Bacillus beveridgei sp. nov., a facultative anaerobic haloalkaliphile from Mono Lake, California, that respires oxyanions of tellurium, selenium, and arsenic. Extremophiles 2009;13:695–705.
[8] Trutko SM, Akimenko VK, Suzina NE, Anisimova LA, Shlyapnikov MG, Baskunov BP, Duda VI, Boronin AM. Involvement of the respiratory chain of gram-negative bacteria in the reduction of tellurite. Arch Microbiol. 2000;173:178-186.
[9] Borsetti F, Borghese R, Francia F, Randi MR, Fedi S, Zannoni D. Reduction of potassium tellurite to elemental tellurium and its effect on the plasma membrane redox components of the facultative phototroph Rhodobacter capsulatus. Protoplasma 2003;221:152-161.
[10] Moore MD, Kaplan S. Members of the family Rhodospirillaceae reduce heavy-metal oxyanions to maintain redox poise during photosynthetic growth. ASM News 1994;60:17–24.
[11] Oremland RS, Herbel MJ, Blum JS, Langley S, Beveridge TJ, Ajayan PM, Sutto T, Ellis AV, Curran S. Structural and spectral features of selenium nanospheres produced by Se-respiring bacteria. Appl Environ Microbiol 2004;70:52-60.
[12] De Windt D, Aelterman P, Verstraete W. Bioreductive deposition of palladium (0) nanoparticles on Shewanella oneidensis with catalytic activity toward reductive of dechlorination of polychlorinated biphenyls. Environ Microbiol 2005;7:314–325.
[13] Zhang B, Hou WY, Ye XC, Fu SQ, Xie Y. 1D Tellurium Nanostructures: Photothermally Assisted Morphology-Controlled Synthesis and Applications in Preparing Functional Nanoscale Materials. Adv Funct Mater 2007;17:486-492.

Extracellular Production of Tellurium Nanoprecipitates by the Photosynthetic Bacterium Rhodobacter
capsulatus
69
[14] Lu Z, Li CM, Bao H, Qiao Y, Toh Y and Yang X. Mechanism of antimicrobial activity of CdTe quantum dots. Langmuir 2008;24:5445-5452.
[15] Wang X, Liu G, Zhou J, Wang J, Jin R and Lv H. Quinone-mediated reduction of selenite and tellurite by Escherichia coli. Bioresour Technol 2011;102:3268-3271.
[16] Borghese R, Baccolini C, Francia F, Sabatino P, Turner RJ, Zannoni D. Reduction of Chalcogen Oxyanions and Generation of Nanoparticles by the Photosynthetic Bacterium Rhodobacter capsulatus. 2014;269:24-30.
[17] Weaver PF, Wall JD, Gest H. Characterization of Rhodopseudomonas capsulata. Arch Microbiol 1975;105:207-216. [18] Turner RJ, Weiner JH, Taylor DE. Use of diethyldithiocarbamate for quantitative determination of tellurite uptake by
bacteria. 1992;204:292-295.
BIOGRAPHY Roberto BORGHESE holds a permanent research position at the Department of Pharmacy and Biotechnology (FaBiT) of the University of Bologna, Bologna, Italy. He received the BSc in Biological Sciences from the University of Bologna and the PhD in Biochemistry from the Missouri University, Columbia, MO, USA. Davide ZANNONI is full professor of Microbiology at the Department of Pharmacy and Biotechnology (FaBiT) of the University of Bologna and presently acting as director of the PhD Program in Cell and Molecular Biology as well as coordinator of the Master Degree in Molecular & Industrial Biotechnology at the University of Bologna, Bologna, Italy.

70

71
Optimizing the Fluorescence of Biogenic PbSe Quantum Particles for the Efficient Cadmium
(Cd2+
Jaya Mary Jacob
) Ion Sensing in Solution 1 and Raj Mohan Balakrishnan
2*
1 Research Scholar, Department of Chemical Engineering, National Institute of Technology Karnataka, Surathkal, India [email protected] 2*Corresponding author: Associate Professor, Department of Chemical Engineering, National Institute of Technology Karnataka, Surathkal, India [email protected]
Abstract The present study reports the statistical optimization of the process parameters during the biosynthesis of PbSe quantum dots (QDs) from marine Aspergillus terreus. It was observed that parameter optimization results in a florescence blue shift and a reduction in PbSe quantum particle size to dimensions comparable to its excitonic Bohr radius (21nm). The fluorescence amenability of the biogenic PbSe QDs were further utilized for the development of a simple and efficient in-situ Cadmium (II) sensing array. Initial experimental observations revealed sensitive and detectable quenching in fluorescence of the biogenic colloidal PbSe QDs in the presence of Cadmium (II) ions in comparison to other tested metal ions ( Cd2+, Fe3+, Cu2+, Hg2+, Al-, Pb2+, Mn2+, Zn2+, Mg2+ and Ni+ ). The fluorescence intensity of the biogenic PbSe QDs was found to vary inversely with the Cd2+
Keywords: Aspergillus terreus; Bio sensing; Biosynthesis; Fluorescence quenching; PbSe Quantum Particles, Response Surface Methodology.
ions present in the colloidal solution over a wide range of 0-100 µM with detection limits around 2.31µM that capacitate these systems as a reliable fluorescence sensing platform that could meet the selective requirements for environmental applications. Stern-Volmer plot of the emission intensities of PbSe QDs at different Cd(II) ion concentrations revealed that the metal ions bind on the surface of QDs inducing recombination centers for electrons and holes, resulting in a quenching of QD’s fluorescence. The present work would add new knowledge in the design and development of a highly sensitive heavy metals in-situ probe using biogenic fluorescent particles produced from a marine fungus.
1. INTRODUCTION Chalcogen based semiconductor nanoparticles also known as quantum particles are venerated as superior entities for fluorescence based sensing and bio-imaging because of the exceptional optical attributes that arise from their size tunable quantum confinement effects [1]. Lead selenide (PbSe) quantum dots (QDs) and Quantum Rods (QRs), characterized by a large excitonic Bohr radii and high dielectric constant, is one such chalcogenide nanofabrication that holds relevance [2]. Recent years have evinced an accelerated pace in chalcogenide quantum particle research that thrusts primarily on exploring greener means for their synthesis and accessorizing their optical traits in diverse functional platforms [3–6]. Unlike the chemical means of synthesizing QDs, biogenic means are relatively cost effective and eco-friendly and results in the formation of biocompatible, hydrophilic and stable nanoparticles under ambient experimental conditions at room temperature [7,8].
One such green route employs the inherent metal tolerance in marine Aspergillus terreus for the biogenesis of PbSe QRs with structural and optical properties in par with the chemically synthesized counterparts. The biogenesis of crystalline rod like structures of PbSe with aspect ratios between 5 and 10, analyzed using TEM, SEM with EDAX and XRD studies, were reported. The biogenic PbSe were also accredited with remarkable biocompatibility, noteworthy optical characteristics in terms of the standard optical constants and an appreciable anti-microbial activity [9,10]. The recent advances in water-soluble QDs preparation and surface-modification have fostered the application of these nanomaterials with biological and biomedical purposes and as chemical sensors in fluorescence based measurements[11,12], emerging as an advantageous alternative to the commonly used molecular probes.

4th International Conference on Research Frontiers in Chalcogen Cycle Science & Technology
72
Earlier, it was reported that biogenic CdTe quantum dots synthesized by Saccharomyces cerevisiae could be used as in-situ bio-labels in yeast cells [8]. Luminescent CdTe QDs synthesized in Lumbricus rubellus earthworms where also characterized with native passivation obtained during synthesis, that allowed their uptake into the cellular cytoplasm of ovarian cancer cell lines for subsequent fluorescence based cell imaging [6]. Of late, chemically synthesized QDs have been applied in fluorescence assays for the quantification of distinct analytes [1,13] including metals [14–18]. Due to the small size and high surface area-to-volume ratio of the nanoparticles, the photoluminescence of QDs is very sensitive to modifications on the surface states. Changes on QDs surface charge or ligands can affect the efficiency of electron–hole recombination [19] yielding in consequence a significant alteration on the magnitude of the fluorescence emission either in a quenching or in an enhancing effect [20]. Recently, chemically synthesized graphene QDs was employed for the efficient Cu (2+
The present study reports the fluorescence enhancement of biosynthesized PbSe QDs by identifying the combinatorial effect of different operational variables during biosynthesis using response surface methodology. Further, the fluorescence amenability of the biosynthesized PbSe QDs were utilized for detecting Cadmium (Cd
) ions in solution [21]. But, the possibilities for tapping the fluorescence potential of biosynthesized chalcogenide QDs as sensors for the detection of environmental pollutants and heavy metals are largely unfathomed. Nevertheless, it is pointed out that the gap between the analytes to be sensed and the availability of efficient, non-toxic and easy to handle sensors is large [20]. In summary, despite the advancements in the biosynthesis of chalcogenide QDs, the prospects of these nanofabrications, in particular PbSe, in analyte sensing and other environmental applications is largely unexplored.
2+
2. MATERIALS AND METHODS
) ions in aqueous solution.
2.1 Biosynthesis of PbSe Nanoparticles and its optimization by response surface methodology Biosynthesis of lead selenide (PbSe) nanoparticles was initiated by a modified low cost green methodology under conditions akin to room temperature in marine Aspergillus terreus [9]. The factors influencing the fluorescence of the biogenic PbSe nanoparticles were investigated using the Box-Benhen Design (BBD) of response surface methodology (RSM). A 3 level 3 factors BBD was investigated to select the appropriate independent variables such as reaction temperature (A) ranging from 20°C to 70°C, the pH of the reaction mixture (B) from 6 to 12 and the duration of heating (C):10 min to 60 min based on its effect on the fluorescent yield of the QD solution (dependent variable) in as presented in Table 1. After the reaction in the aforementioned conditions, the culture flasks were allowed to a sudden temperature quenching at 4 0
The experimental data were fitted to a second-order polynomial model as given in Eq. (1) where, Where Y
C and a subsequent overnight incubation in the laboratory ambience.
i is the predicted response, Xi, Xj are input variables which influence the response variable Y; βo is the offset term; β i is the influence of the ith linear coefficient; β ii is the ith quadratic coefficient and β ij is the ijth
𝑌𝑖 = β0 + Σβ𝑖𝑋𝑖 + Σβ𝑖𝑖𝑋𝑖2 + Σβ𝑖𝑗𝑋𝑖 𝑋𝑗 (1)
interaction coefficient.
2.2 Statistical analysis for BBD The statistical software package Design Expert (Version 8.0.7.1, Stat-Ease Inc., Minneapolis, USA) statistical package was used to analyze the experimental data. The optimal values of the critical variables were obtained by analyzing the contour plots and the statistical analysis in the form of analysis of variance (ANOVA).
2.3 Verification of model Optimal synthesis conditions for an enhanced fluorescence response were obtained using the predictive equations generated by RSM. Verification experiment was done by carrying out the synthesis at the optimized conditions in duplicates. The experimental values and model predicted values were compared to examine the validity of the model. Further, the QD morphology obtained under the optimum biosynthesis conditions were verified using Transmission electron microscopic (TEM) images (JEOL-JSM-6380-LA, Japan).

Optimizing the fluorescence of biogenic PbSe quantum particles for the efficient Cadmium (Cd2+) ion sensing in solution
73
2.4 Procedures for detection of Cd (2+) ions Stock standard solutions 0.1 M Cd (II) were prepared by dissolving an appropriate amount of CdCl2·2H2O in water and adjusting the volume to 5.0 mL in a volumetric flask. It was further diluted to the working volumes using distilled water. A fixed concentration of PbSe QDs was transferred to a fluorescent cuvette. The fluorescent intensity of the solution was recorded from 340 to 620 nm with excitation wavelength fixed at 320 nm. After appropriate amount of Cd2+ ions was titrated, the fluorescent intensity of the solution was again recorded. Similar procedure was performed for various pre-determined concentrations of Cd 2+ ions and other metal ions. For the sake of comparison, the volume of PbSe QDs solution was fixed to be 2 mL before the addition of Cd2+
2.5 Principles of fluorescence quenching
. All measurements were made at room temperature.
The Stern-Volmer equation (Eq.2) was used to comprehend the mechanism involved in the fluorescence quenching of the PbSe QD solution in the presence and absence of Cd2+
𝐹0𝐹
= 1 + 𝐾𝑞𝜏0[𝑄] (2)
ions. While the linear nature of the plot indicates dynamic quenching mechanisms, static quenching is characterized by a non-linear Stern-Volmer plot.
Where
F0
K
and F are the fluorescence intensities before and after the addition of the quencher, respectively,
q
[Q] is the quencher concentration in solution.
is the rate constant of dynamic (collisional) quenching,
3. RESULTS AND DISCUSSION
3.1. Optimization of the fluorescence of the biogenic PbSe QD using RSM Statistical methods for process parameter optimization have proved to be a powerful and useful tool in research. RSM employs quantitative data from appropriate experiments to develop multivariate equations and solve them simultaneously for the design of experiments, constructing models, evaluating the effects of factors, and analyzing the optimum conditions of factors for desirable responses [22]. Over the past decade, many researchers have applied RSM for controlling different aspects for the synthesis of nanomaterials [22–24]. In the present study, a BBD was used for optimizing the process parameters for an enhanced fluorescence by the biogenic PbSe QDs. The BBD Matrix detailing the experimental runs along with the observed and predicted response (i.e., fluorescence intensity) for each of these runs is represented in Table 1.
The adequacy of the model was checked using analysis of variance (ANOVA) which was tested using Fisher’s statistical analysis. The model F value of 7.02% implies the significance of the model also indicates that there is only 0.88% chance that the F value could occur due to noise. The R2
The graphical representations of the regression equation in terms of 3-D contour plots are depicted in Fig 1 (a), (b) and (c). The 3-dimensional contour plots clearly depicts that the optimum point of all variables lies at the centre of the chosen range of the parameters under consideration for an enhanced fluorescence by the biogenic PbSe QDs. According to experimental verifications based on the parameter values recommended by the model, maximum fluorescence intensity of 4.51 X 10
value (multiple correlation coefficients) closer to 1 denotes better correlation between the observed and predicted responses. The coefficient of variation (CV) indicates the degree of precision with which the experiments are compared. The lower reliability of the experiment is usually indicated by high value of CV. In the present case a low CV (0.08) indicated that the experiments performed were highly reliable. The statistical p value ≤ 0.05 for the model and for the independant and mutual interactions between reaction time, temperature and pH denotes the significance of these terms in enhancing the final fluorescence yeild of the PbSe QDs. The results obtained from the BBD were fitted to a second order polynomial equation (Eq. 3) to explain the dependence of the PbSe QD fluorescnce intensityon the process parameters considered during its synthesis from marine Aspergillus terreus.
6 A.U was observed at 450 nm under conditions; pH= 9.97, reaction time = 28 min and reaction temperature= 58 0
C .

4th International Conference on Research Frontiers in Chalcogen Cycle Science & Technology
74
Table 2. BBD Matrix of the process parameters and the Fluorescence response by the PbSe QDs
Run A B C Response 1 45 9 35 4.24 2 20 9 10 0.95 3 45 9 35 4.83 4 45 9 35 4.45 5 70 9 10 3.24 6 45 6 10 1.24 7 45 9 35 4.12 8 45 6 60 2.88 9 20 6 35 0.90
10 70 6 35 2.98 11 20 12 35 0.54 12 20 9 60 3.42 13 70 9 60 2.02 14 45 9 35 4.47 15 45 12 60 3.20 16 70 12 35 3.12 17 45 12 10 3.34
A= Temperature (°C ) ; B= pH; C=Reaction period (min) and Response in terms of Fluorescence Intensity (X 106
𝐹𝑙𝑢𝑜𝑟𝑒𝑠𝑐𝑒𝑛𝑐𝑒 𝐼𝑛𝑡𝑒𝑛𝑠𝑖𝑡𝑦 = 4.42 × 10⁶ + (6.92 × 10⁵)𝐴 + (2.76 × 10⁵)𝐵 + (3.45 × 10⁵)𝐶 +(1.25 × 10⁵)𝐴𝐵 − (9.21 × 10⁵)𝐴𝐶 − (4.44 × 10⁵)𝐵𝐶 − (1.39 × 10⁶)𝐴2 − (1.13 × 10⁶)𝐵2 − (6.19 ×10⁵)𝐶2 (3)
A.U)
The experimental and theoretical response values under the aforementioned conditions were comparable and were notably higher (3 times) than the fluorescence intensity under synthesis conditions mentioned earlier. It was also noted that the fluorescence onset exhibited a blue shift from 475 nm to 450 nm in the PbSe QDs synthesized under optimized synthesis conditions in comparison to the synthesis reported earlier [9].
According to Jamieson et al., the spectral signature of QDs is an assertive indicator of its size [25] and that a reduction in the semiconductor dimensions to its exciton Bohr radii can result in an idealized intense fluorescence spectra in these nanofabrications [26]. Hence, to verify this relation, the sizes of the QDs synthesized under the optimized conditions were visualized using a transmission electron microscope (TEM). Our observations revealed the formation of spherical nanoparticles with diameter ranges from 10-30 nm (Figure 2a). HRTEM images (Figure 2b) and the SAED pattern of the spot array (inset of Figure 2b) revealed distinctive lattice fringes in the spherical nanocrystals with d-spacing that correspond to the planes 111, 200, 220, 222, 400, 420 of the typical PbSe Clausthalite type Rock Salt Structure having Face Centered Cubic Lattice with lattice parameter values of a = b = c = 6:128 (JCPDS Reference Code: 00-065-1040). Previously, biosynthesis of PbSe quantum rods (QRs) with diameter ranges 20-160 nm was reported [9]. Hence it can be concluded that notable enhancement in the QD fluorescence and better size tuning could be attained by optimizing the process parameters during the biosynthesis of PbSe QDs in marine Aspergillus terreus. Further, the fluorescence enhancement in the biogenic PbSe QDs is indicative of the potential of these entities as efficient fluorescent based sensors for analyte detection.
3.2. The quenching effect of metal ions on the fluorescence of PbSe QDs The effect of 10 different metal ions namely Cd, Fe, Cu, Hg, Al, Pb, Mn, Zn, Mg and Ni on the fluorescence of the PbSe QDs was analyzed. Chloride salts of the respective metals were used at a fixed concentration of 25µM for the initial study and the difference in fluorescence intensity ratio (F0/F) of the PbSe QD solution in the absence and presence of the respective metal ions were observed. According to Fig.3, a notable fluorescence quenching was observed in the presence of Cd2+ ions. Metal ions like Fe, Cu, Pb and Zn exhibited a lesser degree of fluorescence quenching, while the other tested metal ions had little or no effect on the fluorescence of the PbSe QDs. Similar observations were reported earlier for the selective detection of Cu 2+ ions using grapheme QDs. The authors report that Cu2+
Based on these results, the Cd
ions quenched the fluorescence intensity of the grapheme QDs by 2-3 times in comparison to other tested metal ions like Fe, Al, Co, Cd, Pb etc. [21].
2+ induced PbSe QD fluorescence quenching was studied in detail. Fig 4a shows that the emission intensity of the PbSe QDs exhibits a gradual decrease with the increase in concentration of Cd 2+ ions. It is evident that the fluorescence of the PbSe QDs experienced a radical fall at Cd concentrations around 40µM, after which the fluorescence evinced a gradual decrease, its value attaining

Optimizing the fluorescence of biogenic PbSe quantum particles for the efficient Cadmium (Cd2+) ion sensing in solution
75
fixed levels after Cd concentrations around 90µM. Our results are contrary to the observations by Li et al. (2007) who reported the fluorescence enhancement in CdSe/ZnS core/shell QDs capped with l-carnitine in the presence of cadmium ions in the concentration a dynamic range upto 50 µM. The luminescence increase was attributed to the formation of a cadmium–carnitine complex on the surface of the QDs. However, the authors also report a decrease in the carnithine capped QD fluorescence intensity at cadmium concentrations around 100 µM [15].
Further, the ratio of the fluorescence intensities of the aqueous QDs in the presence and absence of Cd ions was plotted against the Cd ions in the concentration range 0-200µM (Figure 4b). A linear relationship was obtained for the fluorescence intensities of the QDs at 319 nm in the concentration range 0-20 µM. The standard additions method was applied to the quenching responses in the above mentioned concentration ranges [27]. Accordingly, under the current experimental conditions, the limit of Cd2+ detection was estimated to be 2.31µM based on 3Sb/K. Where, Sb
3.3. The possible Cd ion Sensing Mechanism
is the standard deviation of the corrected blank signals of the PbSe QDs and k is the slope of the calibration curve. Earlier Li et al. (2007) had reported cadmium detection limits up to 0.15 µM using carnithine capped CdSe/ZnS core/shell QDs [15]. Although the calculated LOD for Cd ions using biogenic PbSe QDs is comparatively low, the present findings hold promise as naïve efforts to utilize the fungal protein capped biogenic PbSe QDs as significant cadmium ion sensing platforms that satisfactorily meets the Cd ion detection limits by Environmental Protection Agency (EPA) [28].
A variety of molecular interactions between the analyte/quencher and the flurophore can result in quenching. Typically, these interactions are categorized as Collisional/Dynamic quenching and Static quenching [29,30]. While quenching originating from collisional interactions between the fluorophore and the quencher is called collisional or dynamic quenching, static quenching occurs as a result of the formation of a non-fluorescent complex between the fluorophore and the quencher [31]. Dynamic quenching can be best described by the Stern-Volmer plot that follows a linear trend for quenching based on collisional interactions [29]. However, the formation of the non-fluorescent complex in case of static quenching results in slight modifications in the Stern-Volmer equation,; Ksv is now the association constant KS and τ0
=τ , as the fluorescence lifetime of the fluorophore remains unperturbed by the static quenching. These modifications account for the non-linearity in the Stern-Volmer plot in case of static quenching [21].

4th International Conference on Research Frontiers in Chalcogen Cycle Science & Technology
76
Figure 2. 3-dimensional response surface plots showing the variation of fluorescence intensity with respect to:(a) reaction
time and temperature; (b)temperature and pH; (c) reaction time and pH
a
b
c

Optimizing the fluorescence of biogenic PbSe quantum particles for the efficient Cadmium (Cd2+) ion sensing in solution
77
Figure 2. (a) TEM Microsgraphs of the biogenic PbSe QDs; (b) HRTEM images of the biogenic PbSe QDs, inset: SAED
patterns of the spot array
Figure 3, Variation of fluorescence intensity ratio of PbSe QDs in the presence of various metal ions
a b

4th International Conference on Research Frontiers in Chalcogen Cycle Science & Technology
78
Figure 4. (a) Emission spectra of PbSe QDs in the presence of Cd2+ (from up to down, the concentration of Cu2+ is 0, 5,10, 15, 20, 25, 30, 35, 40, 45, 50, 60, 70, 80, 90, 100µM, respectively); (b) Fluorescence intensity response of PbSe QDs to the concentration Cd
2+
Figure 5. Stern–Volmer plots describing the dependency of the fluorescence intensities on the Cd2+
In the present study, the mechanism of PbSe QDs’ fluorescence quenching by cadmium ions were explored by examining the trend of the Stern –Volmer plot for cadmium concentrations ranging from 0-20 µM (Figure 5). The non-linear nature of the plot signifies that, for the given concentrations of cadmium the metal ions’ binding on to the surface of QDs’ results in triggering the recombination centers of electrons with holes, leading to the quenching of fluorescence of the QDs [32]. Similar
concentration over the range of 0–20 µM.
a b

Optimizing the fluorescence of biogenic PbSe quantum particles for the efficient Cadmium (Cd2+) ion sensing in solution
79
observations that attest the formation of network like structure and induced aggregation of cadmium ions on the surface of carnitine capped CdSe/ZnS core/shell QDs have earlier been reported at high cadmium ion concentrations [15]. However, in order to understand more precisely the fluorescence quenching mechanism, further studies on fluorescence life time of the QDs in the presence and absence of Cd ions have to be carried out.
4. CONCLUSIONS In the present study the fluorescence of biosynthesized PbSe QDs was optimized by identifying the combinatorial effect of different operational variables during biosynthesis using response surface methodology. According to the Box-Benhken Design of RSM, a size tunable blue shift in the PbSe QD fluorescence was observed at Pb:Se precursor concentration ratio of 1:5 at an operational pH= 9.97, reaction time = 28 min and reaction temperature= 58 0C followed sudden quenching at 40C and a subsequent overnight incubation. Further, the fluorescence amenability of the biosynthesized PbSe QDs were utilized for detecting Cadmium (Cd2+) ions in aqueous solution. The fluorescence of the biogenic PbSe QDs was significantly quenched in the presence of Cd2+ ions in comparison to other tested metal ions. Further, it was observed that the fluorescence intensity of the biogenic PbSe QDs vary inversely with the Cd2+
ACKNOWLEDGEMENT
ions present in the colloidal solution over a wide range of 0-100 µM with detection limits around 2.31µM that capacitate these systems as a reliable fluorescence sensing platform that could meet the selective requirements for environmental applications. Stern-Volmer plot of the emission intensities of PbSe QDs at different Cd ion concentrations revealed that the metal ion binds on the surface of QDs inducing recombination centers for electrons and holes, resulting in a quenching of QD’s fluorescence.
The authors are grateful to Dr. Udaya Bhat K, Department of Metallurgical and Materials Engineering, NITK Surathkal for extending the TEM facility. The support by the Department of Physics, NITK Surathkal for the fluorescence spectroscopic analyses is also acknowledged.
REFERENCES [1] Huang C, Liu S, Chen T, Li Y. A new approach for quantitative determination of glucose by using CdSe/ZnS quantum
dots. Sensors Actuators B Chem 2008;130:338–142. doi:10.1016/j.snb.2007.08.021. [2] Baek IC, Seok S Il, Chung Y. The Synthesis of a High Yield PbSe Quantum Dots by Hot Solution Method
2008;29:1729–1731. [3] Pandian SRK, Deepak V, Kalishwaralal K, Gurunathan S. Biologically synthesized fluorescent CdS NPs encapsulated
by PHB. Enzyme Microb Technol 2011;48:319–325. doi:10.1016/j.enzmictec.2011.01.005. [4] Ahmad A, Mukherjee P, Mandal D, Senapati S, Khan MI, Kumar R, et al. Enzyme mediated extracellular synthesis of
CdS nanoparticles by the fungus, Fusarium oxysporum. J Am Chem Soc 2002;124:12108–12109. doi:10.1021/ja027296o.
[5] Mi C, Wang Y, Zhang J, Huang H, Xu L, Wang S, et al. Biosynthesis and characterization of CdS quantum dots in genetically engineered Escherichia coli. J Biotechnol 2011;153:125–132. doi:10.1016/j.jbiotec.2011.03.014.
[6] Stürzenbaum SR, Höckner M, Panneerselvam a, Levitt J, Bouillard J-S, Taniguchi S, et al. Biosynthesis of luminescent quantum dots in an earthworm. Nat Nanotechnol 2013;8:57–60. doi:10.1038/nnano.2012.232.
[7] Prasad K, Jha AK. Biosynthesis of CdS nanoparticles: An improved green and rapid procedure. J Colloid Interface Sci 2010;342:68–72. doi:10.1016/j.jcis.2009.10.003.
[8] Bao H, Hao N, Yang Y, Zhao D. Biosynthesis of biocompatible cadmium telluride quantum dots using yeast cells. Nano Res 2010;3:481–489. doi:10.1007/s12274-010-0008-6.
[9] Mary Jacob J, Balakrishnan RM, Kumar UB. Biosynthesis of lead selenide quantum rods in marine Aspergillus terreus. Mater Lett 2014;124:279–281. doi:10.1016/j.matlet.2014.03.106.
[10] Jacob JM, Raj Mohan B, Akshay Gowda KM. Insights into the optical and anti-bacterial properties of biogenic PbSe quantum rods. J Saudi Chem Soc 2014. doi:10.1016/j.jscs.2014.10.008.
[11] Zhang YC, Lei M, Huang K, Liang C, Wang YJ, Ding SS, et al. A facile route to mono-dispersed CeO 2 nanocubes and their enhanced photocatalytic properties. Mater Lett 2014;116:46–49. doi:10.1016/j.matlet.2013.10.085.
[12] Buenger D, Topuz F, Groll J. Hydrogels in sensing applications. Prog Polym Sci 2012;37:1678–719. doi:10.1016/j.progpolymsci.2012.09.001.
[13] Malik P, Singh J, Kakkar R. A review on CdSe quantum dots in sensing 2014;5:612–628. doi:10.5185/amlett.2014.4562.
[14] Zhang YH, Zhang HS, Guo XF, Wang H. L-Cysteine-coated CdSe/CdS core-shell quantum dots as selective fluorescence probe for copper(II) determination. Microchem J 2008;89:142–147. doi:10.1016/j.microc.2008.01.008.
[15] Li H, Zhang Y, Wang X. l-Carnitine capped quantum dots as luminescent probes for cadmium ions. Sensors Actuators, B Chem 2007;127:593–597. doi:10.1016/j.snb.2007.05.013.

4th International Conference on Research Frontiers in Chalcogen Cycle Science & Technology
80
[16] Koneswaran M, Narayanaswamy R. l-Cysteine-capped ZnS quantum dots based fluorescence sensor for Cu2+ ion. Sensors Actuators, B Chem 2009;139:104–109. doi:10.1016/j.snb.2008.09.028.
[17] Xie HY, Liang JG, Zhang ZL, Liu Y, He ZK, Pang DW. Luminescent CdSe-ZnS quantum dots as selective Cu2+ probe. Spectrochim Acta - Part A Mol Biomol Spectrosc 2004;60:2527–2530. doi:10.1016/j.saa.2003.12.039.
[18] Fernández-Argüelles MT, Wei JJ, Costa-Fernández JM, Pereiro R, Sanz-Medel A. Surface-modified CdSe quantum dots for the sensitive and selective determination of Cu(II) in aqueous solutions by luminescent measurements. Anal Chim Acta 2005;549:20–25. doi:10.1016/j.aca.2005.06.013.
[19] Zhang L, Xu C, Li B. Simple and sensitive detection method for chromium(VI) in water using glutathione-capped CdTe quantum dots as fluorescent probes. Microchim Acta 2009;166:61–68. doi:10.1007/s00604-009-0164-0.
[20] Basabe-Desmonts L, Reinhoudt DN, Crego-Calama M. Design of fluorescent materials for chemical sensing. Chem Soc Rev 2007;36:993–1017. doi:10.1039/b609548h.
[21] Wang F, Gu Z, Lei W, Wang W, Xia X, Hao Q. Graphene quantum dots as a fluorescent sensing platform for highly efficient detection of copper(II) ions. Sensors Actuators, B Chem 2014;190:516–522. doi:10.1016/j.snb.2013.09.009.
[22] Hormozi-Nezhad MR, Jalali-Heravi M, Robatjazi H, Ebrahimi-Najafabadi H. Controlling aspect ratio of colloidal silver nanorods using response surface methodology. Colloids Surfaces A Physicochem Eng Asp 2012;393:46–52. doi:10.1016/j.colsurfa.2011.10.023.
[23] Edrissi M, Soleymani M. Synthesis of Nano-γ-Ferric Oxide by Thermolysis of the 2-Mercapto-5-Methylpyridine-N-Oxide-Iron(III) Complex via Factorial Design. Chem Eng Technol 2011;34:991–996. doi:10.1002/ceat.201000556.
[24] Ganea GM, Sabliov CM, Ishola AO, Fakayode SO, Warner IM. Experimental design and multivariate analysis for optimizing poly(D,L-lactide-co-glycolide) (PLGA) nanoparticle synthesis using molecular micelles. J Nanosci Nanotechnol 2008;8:280–292.
[25] Jamieson T, Bakhshi R, Petrova D, Pocock R, Imani M, Seifalian AM. Biological applications of quantum dots. Biomaterials 2007;28:4717–4732. doi:10.1016/j.biomaterials.2007.07.014.
[26] Chan WCW, Maxwell DJ, Gao X, Bailey RE, Han M, Nie S. Luminescent quantum dots for multiplexed biological detection and imaging. Curr Opin Biotechnol 2002;13:40–46. doi:10.1016/S0958-1669(02)00282-3.
[27] Shrivastava A, Gupta V. Methods for the determination of limit of detection and limit of quantitation of the analytical methods. Chronicles Young Sci 2011;2:21. doi:10.4103/2229-5186.79345.
[28] Rivas RE, López-García I, Hernández-Córdoba M. Determination of traces of lead and cadmium using dispersive liquid-liquid microextraction followed by electrothermal atomic absorption spectrometry. Microchim Acta 2009;166:355–361. doi:10.1007/s00604-009-0206-7.
[29] Bo C, Ping Z. A new determining method of copper(II) ions at ng ml-1 levels based on quenching of the water-soluble nanocrystals fluorescence. Anal Bioanal Chem 2005;381:986–992. doi:10.1007/s00216-004-2963-9.
[30] Chen Y, Rosenzweig Z. Luminescent CdS Quantum Dots as Selective Ion Probes. Anal Chem 2002;74:5132–138. doi:10.1021/ac0258251.
[31] Fan LJ, Zhang Y, Murphy CB, Angell SE, Parker MFL, Flynn BR, et al. Fluorescent conjugated polymer molecular wire chemosensors for transition metal ion recognition and signaling. Coord Chem Rev 2009;253:410–422. doi:10.1016/j.ccr.2008.03.008.
[32] Rodrigues SSM, Lima AS, Teixeira LSG, Korn MDG a, Santos JLM. Determination of iron in biodiesel based on fluorescence quenching of CdTe quantum dots. Fuel 2014;117:520–527. doi:10.1016/j.fuel.2013.09.045.

81
Selenate Bioreduction in the Presence of Nitrate and Sulfate
Lea Chua Tan1*, Yarlagadda V. Nancharaiah1,2
Eric van Hullebusch,
3 and Piet N.L. Lens
1,4
1 Pollution Prevention and Resource Recovery, Environmental Engineering and Water Technology Department, UNESCO-IHE Institute for Water Education, Westvest 7, 2611 AX Delft, The Netherlands 2 Biofouling and Biofilm Process Section, Water and Steam Chemistry Division, Bhabha Atomic Research Centre Kalpakkam – 603102, Tamil Nadu, India [email protected] 3 Université Paris-Est, Laboratoire Géomatériaux et Environnement (EA 4508), UPEMLV, 77454 Marne-la-Vallée, France [email protected] 4 Department of Chemistry and Bioengineering, Tampere University of Technology, P.O-Box 541, Tampere, Finland [email protected] *1Corresponding author: [email protected]
Abstract Selenium contamination in surface waters is essentially an industrial problem due to the high production volume of wastewater but contains low concentrations of selenium making it difficult to achieve the discharge limit of 5 µg-Se/L set by USEPA. Additionally, biological treatment of selenium-contaminated wastewaters (e.g. mining drainage wastewaters) is complicated by various components present, such as other competitive anions, wastewater characteristic and operational condition. This study investigated the effect of NO3
- and SO42- on SeO4
2- removal by a mixed microbial consortium (anaerobic granular sludge) in serum bottles using sodium lactate as electron donor. Results obtained showed that experimental SeO4
2- bioreduction was not hindered by the high concentration of SO42- or NO3
-. Measured reduction profiles correlated with the theoretical reduction order (fastest to slowest) of NO3
- > SeO4
2- > SO42- whether composition of oxyanions are 50-100 fold different (wastewater composition) or
in equimolar concentration. Interestingly, presence of NO3- showed an enhancement of selenate
reduction by almost 50% in wastewater composition and 11% in equimolar concentration. The enhanced bioreduction of SeO4
2- coupled with NO3- removal compared to SeO4
2- alone might be due to the developed denitrifying bacteria (DB) in the granular sludge allowing for a higher state of metabolic activity compared to selenate-reducing bacteria (SeRB). Further investigation is needed in order to fully establish reaction rates and efficiency of SeO4
2- reduction with the presence of NO3- and SO4
2-
Keywords: anaerobic granular sludge; co-contaminants; nitrate; reduction profiles; selenate reduction; sulfate
in long term experiments in bioreactors.
1. INTRODUCTION Selenium (Se) is an ubiquitous, metalloid mineral and a trace nutrient that plays an important role in key metabolic functions in animals and humans [1,2]. Se exist in various forms, mainly as an inorganic, soluble Se form of both selenate (SeO4
2- or Se [+VI]) and selenite (SeO32-
or Se [+IV]) in water environment [3]. About 40% of selenium emission to freshwater is caused by various industrial activities [4]. As such, Se contamination is essentially an industrial problem due to the high production volume of wastewater but contains low concentration of selenium; making it difficult to achieve the discharge limit of 5 µg-Se/L [2] set by the United States Environmental Protection Agency (USEPA).
Many studies have shown that microbial reduction has been proved as an effective biological treatment system for treating Se-laden wastewaters [2,3]. However, soluble selenium oxyanions in wastewaters typically co-exist with other pollutants such as metals, anions, and other dissolved solids. One such challenge is the presence of other electron acceptors such as nitrate (NO3
-) and sulfate (SO42-) that can influence the
SeO42- reduction and thus could impact efficiency of selenium treatment systems [5]. In the case of mining
wastewater, more specifically, acid mine drainage, a large quantity of SO42- and a considerable amount of
NO3- are present, approximately at 1000 times and 100 times higher than Se levels, respectively. This study
investigated the reduction heierarchy in a system where SeO42- ions co-exist with NO3
- and SO42-
at two different different molar ratios. Both oxyanions at a molar ratio (WW) similar to a real industrial wastewater

4th International Conference on Research Frontiers in Chalcogen Cycle Science & Technology
82
values and equimolar concentration was explored to see whether high concentration of competitive electron acceptors has a factor in SeO4
2-
2. MATERIALS AND METHODS
bioreduction.
2.1 Anaerobic Granular Sludge The seed methanogenic anaerobic granular sludge samples were taken from a full-scale UASB reactor treating paper-mill wastewater (Industriewater Eerbeek B.V., Eerbek, The Netherlands). Information regarding the treatment process can be found in Oude Elferink et. Al. [6], while characterization of this particular anaerobic granular sludge community was done by Roest et al. [7].
2.2 Synthetic Wastewater
Synthetic wastewater was composed of the growth medium, carbon source and the three anions. Growth medium was prepared after Stams et al. [8] with few modifications followed after Lenz et al. [9]. The mineral medium was prepared in Millipore Milli-Q water and composition is as followed in mg/L: KH2PO4 (250), Na2HPO4·2H2O (250), CaCl2·2H2O (15), KCl (250), NH4Cl (300), and MgCl2·6H2O (120) with acid and alkaline trace elements in 0.1mL per liter of mineral medium. The acid trace elements solution contained the following in millimolar (mM): FeCl2 (7.5), H3BO4 (1), ZnCl2 (0.5), CuCl2 (0.1), MnCl2 (0.5), CoCl2 (0.5), NiCl2 (0.1), and HCl (50). The alkaline trace elements solution contained the following in millimolar (mM): Na2WO4 (0.1), Na2MoO4 (0.1) and NaOH (10). Sodium lactate (CH3CH(OH)COONa) was used as electron donor and sodium nitrate (NaNO3), sodium sulfate (Na2SO4), and sodium selenate (Na2SeO4
2.3 Batch Experiments (Reduction Profile)
) are the electron acceptors in different concentrations and two molar ratios.
Batch experiments were conducted as shown in Table 1. In batch test, different combinations of oxyanions (NO3
-, SO42- and SeO4
2-) are tested in 250 mL glass serum bottle with excess lactate as the carbon source. Concentration of ions were varied in two different experiments. In the first experiment, WW molar ratio was modelled from a mine-impacted wastewater compositions (NO3
- 4 mM, SO42- 21 mM, and SeO4
2-
Mineral medium with trace elements were mixed with different oxyanion concentrations and pH was adjusted to about 7.0 with 0.5 mM NaOH. About 1 gram (in wet weight) granular sludge per 100 mL was introduced into the serum bottle, sealed tightly and purged with N
0.1 mM) and second experiment was done with equimolar composition at 0.5 mM each for all oxyanions to see the reduction profile without the influence of different molar concentration of each oxyanions.
2
Analysis of lactate, nitrate, sulfate, and selenate was done using ion chromatography (IC, Dionex ICS 1000 AS4A column) at the retention time of approximately 1.3, 3.9, 7.9, and 10.3 min respectively. Selenite and total dissolve sulfide (TDS) was analyzed using spectrophotometric standard methods.
gas to make it anaerobic. Batch experiments were kept in a 30̊ C room and placed on an orbital shaker (150 – 200 RPM) for homogenous mixing. To monitor the bioconversions during incubation, liquid samples were taken using a syringe at a specified time intervals. Biomass and biogenic selenium were analysed upon termination of experiments. All experiments were done in duplicates.
Table 1. Batch experiment set-up and combination
Conditions 1 2 3 4 5 6 pH adjusted to 7.0
RPM 150 - 200 T (˚C) 30
Volume (mL) 250 250 250 250 250 250 Granular Sludge (g) 2.5 2.5 2.5 2.5 2.5 2.5
NO3- 4(mM) a / 0.5 - b - 4a / 0.5 - b 4a / 0.5
SOb
42- - (mM) 21a / 0.5 - b - 21a / 0.5 21b a / 0.5
SeOb
42- - (mM) - 0.1a / 0.5 0.1b a / 0.5 0.1b a / 0.5 0.1b a / 0.5
excess CHb
3CH(OH)COONa 13 (mM) 13 13 13 13 13 a wastewater composition modelled after mine-impacted water; b equimolar composition experiment
3. RESULTS AND DISCUSSION Gibbs’ free energy values for each oxyanion reduction reaction were calculated to establish the theoretical hierarchy in reduction reactions (Figure 1). Experiments were designed and performed to determine the actual

Selenate Bioreduction in the Presence of Nitrate and Sulfate
83
influence of co-existing oxyanions e.g. NO3- and SO4
2- on SeO42- reduction by anaerobic granular sludge.
Lenz and Lens [10] showed a similar theoretical reduction order of NO3- > SeO4
2- > SO42-
, with hydrogen as the electron donor.
Figure 1. Gibbs energy in oxygen, nitrate, sulfate, selenate, and selenite reduction with lactate as electron donor at pH 7.0 and oxyanion concentration of 1M
Results of batch experiment are shown in Figure 2 in wastetwater composition ran for 5 days and Figure 3 in equimolar composition ran for 7 days. Both experiments showed that lactate was utilized within the first 3-4 days mainly due to the methanogenic activity of the granular sludge. Further experiments must then take into account the re-injection of lactate for the continual supply of carbon source. Sampling time for wastewater compostion experiment was conducted daily while equimolar experiment was done twice per day accounting for the lower concentration of NO3
- and SO42-
.
Selenite (SeO32-) was initially measured for the first 3 days and when no SeO3
2-
formation was observed, it was stopped. At the end of experiment, total selenium was measured. Initial pH for all bottles was adjusted to 7.05. Final pH for all the setups ranged from 7.1 to 7.4. Acid digestion was done for the anaerobic granular sludge on the final day using MARS microwave and total selenium was measured through GF-AAS. No significant difference was observed in any of the conditions for the selenium concentration in the sludge, where it ranged from 60 - 200 µg-Se/g-granular sludge for all.
Figure 2. Removal profiles of all oxyanions, lactate and production of total dissolved sulfide (TDS) at wastewater composition
From both experiments, it was clearly seen that SeO4
2- removal was not hindered by either NO3- or SO4
2-. As expected, NO3
- was the first to be reduced within 2 days while SeO42- quickly followed within 1 day
particularly at 0.1 mM. Takada et. al. [11] was observed that reduction of SeO42- to SeO3
2- was not affected by NO3
- till a concentration of 500mg-N/L (36mM NO3-) but SeO3
2- reduction to Se0 showed to be highly

4th International Conference on Research Frontiers in Chalcogen Cycle Science & Technology
84
inhibited even by the addition of 5 mg NO3
--N/L (0.35mM NO3-). However, this was not observed in the
present experiment especially since no SeO32- was detected. Higher concentration of SeO4
2- at 0.5 mM showed a slower reduction time of 7 days as shown in Figure 3 possibly indicating that the mixed cultured needed more time to build selenium specific microorganisms. SO4
2- reduction for both conditions where not complete in both molar ratios and sulfide (reported as total dissolve sulfide or TDS as S2-) production was only observed after NO3
- was completely removed from the system. However, high concentration of SO42-
did not pose a problem for SeO42- reduction. In the case of SO4
2-/SeO42- ratio, it was recommended by Lenz
et. al. [12], for non-specific selenium reduction, that the ratio of SeO42- to SO4
2- should be greater than 1.92 x 10⁻³ to avoid competition with SO4
2- and to maintain complete SeO42- removal which is reflected within the
experiment with a SeO42-/SO4
2- ratio of 4.76 x 10⁻³
.
Figure 3. Removal profiles of all oxyanions, lactate and production of total dissolves sulfide (TDS) at equimolar
composition at equimolar composition
Figure 4. Selenate bioreduction profiles in system with just SeO4
2- and NO3- with SeO4
-
Additionally, one significant difference in SeO
at wastewater composition (a) and equimolar composition (b)
42-
bioreduction was observed when NO3- is present in the
system compared to just SeO42- alone. As shown in Figure 4, there was an increase in SeO4
2- bioreduction in the system with NO3
- present, occurring 50% faster in WW composition experiment and 11% faster in equimolar experiment. Selenate removal was enhanced in the presence of both 0.5 mM and 4 mM of nitrate. Moreover, the enhancement was also dependant in the initial nitrate concentration wherein SeO4
2- reduction was much faster at 4 mM NO3
- mM as compared to 0.5 mM NO3-. In the study by Hunter et. al. [13] of two
pure culture microbes Rhizobium sp. strain B1 and Pseudomonas sp. strain CA5 under denitrifying conditions, NO3
- showed a great influence in both aerobic and anaerobic reduction of SeO42- and SeO3
2-. Rhizobium sp. strained showed a maximum removal rate of SeO3
2– to be 0.20 µmol/mg protein/day only when NO3
- was present. Pseudomonas sp. also indicated that NO3- was necessary to promote SeO3
2- bioreduction but only in aerobic conditions. However, both the pure culture strains individually were unable to reduce SeO4
2- to Se0. NO3- enhancement of SeO4
2- bioreduction was was also reported in the pure culture of Sulfurospirillum barnesii [14] but there is no literature in case of mixed cultures. Enhancement of SeO4
2- could sbe attributed to the faster developed denitrifying bacteria (DB) in the granular sludge allowing for a
Selenate Bioreduction in the Presence of Nitrate and Sulfate
85
higher state of metabolic activity compared to selenate-reducing bacteria (SeRB). This was also observed in the experiment conducted by Oremland et. al. [14] where they hypothesized that the presence of NO3
- enchanced the ability of S. barnasii in SeO4
2-
4. CONCLUSION
reduction by keeping the cells at a high state of metabolic activity and therefore avoiding any physiological constraints caused by the lack or small amounts of electron acceptor.
Overall, experimental reduction profiles followed the theoretical calculations (NO3- > SeO4
2- > SO42-)
whether composition of oxyanions are 50 – 100 fold different (wastewater composition) or in equimolar concentration. SeO4
2- removal was not inhibited by the presence of both NO3- and SO4
2-. Simultaneous reduction occured at a different rate even when high concentration of different oxyanions are present. Additionally, the presence of NO3
- showed faster SeO42- bioreduction implicating that NO3
- ions have a positive effect and indicates many possibility in the improvement of bioreactors for selenium. Further investigation is needed in order to fully establish reaction rates and efficiency of SeO4
2- reduction with the presence of NO3
- and SO42-
in long term experiments in bioreactors.
ACKNOWLEDGEMENT This research was supported through the Erasmus Mundus Joint Doctorate Environmental Technologies for Contaminated Solids, Soils, and Sediments (ETeCoS3
REFERENCES
) (FPA n°2010-0009).
[1] Navarro-Alarcon M, Cabrera-Vique C. Selenium in food and the human body: a review. Sci Total Environ 2008; 400:115–141.
[2] Nancharaiah Y.V., Lens P.N.L. Selenium biomineralization for biotechnology applications. Trends Biotechnol 2015; 33, 323-330.
[3] Nancharaiah Y.V., Lens P.N.L. Ecology and biotechnology of selenium-respiring bacteria. Microbiol Mol Biol Rev 2015; 79, 61-80.
[4] Wen H, Carignan J. Reviews on atmospheric selenium: emissions, speciation and fate. Atmos Environ 2007; 41:34:7151–7165.
[5] Lenz M., Enright AM, O’Flaherty V, van Aelst AC, Lens PLN. Bioaugmentation of UASB reactors with immobilized Sulfurospirillum barnesii for simultaneous selenate and nitrate removal. Appl Microbiol Biotechnol 2009; 83:2:377–388.
[6] Oude Elferink SJW, Vorstman WJ, Sopjes A, Stams AJ. Characterization of the sulfate-reducing and syntrophic population in granular sludge from a full-scale anaerobic reactor treating papermill wastewater. FEMS Microbiol Ecol 1998; 27:2:185–194.
[7] Roest K, Heilig HGH, Smidt H., de Vos WM, Stams AJM, Akkermans ADL. Community analysis of a full-scale anaerobic bioreactor treating paper mill wastewater. Syst Appl Microbiol 2005; 28:2:175–185.
[8] Stams AJM, Grolle KCF, Frijters CTM, van Lier JB. Enrichment of thermophilic propionate-oxidizing bacteria in syntrophy with Methanobacterium thermoautotrophicum or Methanobacterium thermoformicicum. Appl Environ Microbiol 1992; 58:1:346–352.
[9] Lenz M, Gmerek A, Lens PNL. Selenium speciation in anaerobic granular sludge. Int J Environ Anal Chem 2006; 86:9/10:615–627.
[10] Lenz M, Lens PNL. The essential toxin: the changing perception of selenium in environmental sciences. Sci Total Environ 2009; 407:12:3620–3633.
[11] Takada T, Hirata M, Kokubu S, Toorisaka E, Ozaki M, Hano T. Kinetic study on biological reduction of selenium compounds. Process Biochem 2008; 43:11:1304–1307.
[12] Lenz M, van Hullebusch ED, Hommes G, Corvini PFX, Lens PNL Selenate removal in methanogenic and sulfate-reducing upflow anaerobic sludge bed reactors. Water Res 2008; 42:8–9:2184–2194.
[13] Hunter WJ, Manter DK. Reduction of selenite to elemental red selenium by Rhizobium sp. strain B1. Curr Microbiol 2007; 55:344–349.
[14] Oremland RS, Blum JS, Bindi AB, Dowdle PR, Herbel M, Stolz JF. Simultaneous reduction of nitrate and selenate by cell suspensions of selenium-respiring bacteria. Appl Environ Microbiol 1999; 65:10:4385–4392.
BIOGRAPHY Lea Chua TAN obtained her MsC in Environmental Engineering under the Japanese government (Mombukagasho) scholarship at Hokkaido University in 2008 specializing in and toxicity assessment of municipal wastewater treatment and quality control using toxicogenomics method. She is currently a PhD fellow under the Erasmus Mundus Joint Doctorate Environmental Technologies for Contaminated Solids, Soils, and Sediments (ETeCoS3
) at UNESCO-IHE Institute for Water Education, Delft, The Netherlands.

4th International Conference on Research Frontiers in Chalcogen Cycle Science & Technology
86

87
Selenite Bioreduction by Anaerobic Granular Sludge in Presence of Heavy Metals
Joyabrata Mal1,3*, Y.V. Nancharaiah1,2
Eric D. van Hullesbusch,
3 and Piet N.L. Lens
1,4
1Department of Environmental Engineering and Water Technology, UNESCO-IHE, Delft, The Netherlands 2 Biofouling and Biofilm Process Section, Water and Steam Chemistry Division, Bhabha Atomic Research Centre, Kalpakkam- 603102, Tamil Nadu, India 3Laboratoire Géomatériaux et Environnement, Université Paris-Est Marne-la-Vallée, France 4
*Corresponding author’s email: [email protected] Department of Chemistry and Bioengineering, Tampere University of Technology, P.O-Box 541, Tampere, Finland
Abstract Heavy metals are often available in selenium wastewaters as co-contaminants. This study investigated reduction of selenite by anaerobic granular sludge in the presence of heavy metals and analyzed the fate of bioreduced selenium and heavy metals. Selenite reduction of >92% of 1 mM was observed in the presence of Pb(II) and Zn(II) ions. While, 30 - 60% of selenite reduction was observed in the presence of 150 - 400 mg/l Cd(II) ions. A removal efficiency of >90% for Pb, Zn and Cd was observed when the initial concentrations of these metals individually were <150 mg/l. Notably, major fraction of the bioreduced selenium (70-90% for Pb and Zn, 50-70% for Cd) and heavy metals (80-90% for Pb and Zn, 60-80% for Cd) were associated with the anaerobic granular sludge. The results suggest that removal of heavy metals along with selenium could be due to the adsorption and/or concomitant precipitation of metal selenium or metal selenide. Keywords: anaerobic granular sludge; biosorption, selenite bioreduction; heavy metal removal, metal selenide
1. INTRODUCTION
Often, selenium oxyanion contamination occurs concomitantly with sulfate and heavy metals in different waste streams such as acid mine drainage, acid seeps, agriculture drainage [1]. Selenate (Se(VI)) and/or selenite (Se(IV)) reducing microorganisms could be potentially used for the bioremediation of contaminated soils, sediments, industrial effluents, and agricultural drainage waters [2,3,4]. However, the use of these strategies for practical applications may have important limitation because the microbial reduction processes or the fate of bioreduced species can be affected by the presence of co-contaminants such as heavy metals. Heavy metals are toxic for microorganisms and cannot be biodegraded like organic pollutants. However, they cannot be transformed from mobile and toxic forms into immobile and less toxic forms. Bacterial reduction of selenium oxyanions is of interest in green synthesis of metal selenide quantum dots [5, 6], such as cadmium selenide (CdSe), zinc selenide (ZnSe) and lead selenide (PbSe).
Hence, microbial reduction of selenium oxyanions in the presence of heavy metals (particularly Cd, Zn, and Pb) is very important for the development of efficient bioremediation processes and for microbial synthesis of metal selenides. The objective of this work was to investigate microbial reduction of selenite in the presence of heavy metals such as Cd, Zn or Pb.
2. MATERIALS AND METHODS
2.1 Selenite Reduction Experiments Anaerobic granular sludge was collected from a full scale upflow anaerobic sludge blanket (UASB) reactor treating paper mill wastewater (Industriewater Eerbeek B.V., Eerbeek, The Netherlands) and was utilized as inoculum for all the experiments.The mineral medium used in selenite reduction experiments, contained (mg/L): NH4Cl (300), CaCl2.2H2O (15), KH2PO4 (250), Na2HPO4 (250), MgCl2 (120), and KCl (250). Nitrilotriacetic acid (216 mg/1mM metal) was used as the chelating agent to prevent the precipitation of metals. Sodium lactate (10 mM) was used as the carbon source and Na2SeO3 (1 mM) was used as selenite source. The pH of the medium was adjusted to 7.3. The medium was distributed into 100 mL volume glass serum bottles as 70 mL aliquots. The serum bottles were inoculated with 0.7 g (wet weight) of anaerobic granular sludge. The bottles were purged with N2
gas for ~5 min and incubated at 30°C on an orbital shaker set at 150 rpm. All the experiments were performed either in duplicate or triplicate.

4th International Conference on Research Frontiers in Chalcogen Cycle Science & Technology
88
2.2 Effect of Heavy Metal on Selenite Reduction
Selenite reduction experiments as described above were performed in the presence of heavy metals. Stock solutions of heavy metals were prepared by dissolving 1 g/l of CdCl2, ZnCl2, or PbCl2 at 1 g L-1. Heavy metals were added individually at different concentrations (10, 30, 50, 70, 90, 150, 300 and 400 mg/L). Liquid samples were collected at regular time intervals for analysing residual lactate, selenite, elemental selenium, total selenium and heavy metals. After 9 d of incubation period,
biomass was subjected to microwave-assisted acid digestion for measuring total metal concentration (Cd, Zn or Pb) and selenium present in the biomass.
2.3 Analytical methods
The concentration of Cd, Zn and Pb was analysed using atomic absorption spectrophotometer (AAS) (PerkinElmer Model Analyst 200). The samples were first filtered through 0.45 µm cellulose acetate syringe filter (Sigma Aldrich, USA) and then the filtrate was analysed for residual metal ions after acidifying with concentrated nitric acid (pH<2) to prevent metal precipitation and adsorption onto surfaces.
7For Se (IV)
analysis, a spectrophotometric method was followed as described by Dao-bo et al., (2013) [ ]. Liquid samples collected at different time points were centrifuged at 37000 g to remove the suspended cells and Se0
particles. The supernatant (1 mL) was mixed with 0.5 mL of 4 M HCl, and then with 1 mL of 1 M ascorbic acid. After 10 min of incubation at room temperature, the absorbance was determined at 500 nm using UV-Vis spectrophotometer (Hermle Z36 HK).
3. RESULTS
3.1 Effect of Heavy Metals on Selenite Reduction
Selenite removals as a function of time in presence of Pb, Zn and Cd separately at different concentrations and without heavy metal are shown in Fig. 1. Selenite reduction was studied in the presence of up to 400 mg/L of Cd or Zn. To avoid precipitation, Pb concentration was used up to a maximum of 150 mg/L. Presence of Pb and Zn in the medium did not exert a significant inhibition on selenite reduction. At lower (<70 mg/L) concentrations of Pb and Zn, selenite was completely reduced. At lower concentration (<90 mg/L) of Cd, high reduction (~ 95%) selenite was also achieved, however, Cd showed a strong negative influence on selenite reduction at higher concentrations (>150 mg/L) and only 65-48% of selenite was reduced. 3.1 FATE OF HEAVY METALS
Time course removal of Cd, Zn and Pb by anaerobic granular sludge is shown in Figure 2. After 9 d of incubation period, more than 97% removal of metals was observed for Pb and Zn. For Cd, more than 99% metals were removed even at concentration of 150 mg/L. However, at metal concentrations of 150 mg/L, metal removal efficiency decreased to 86% for Pb. While it decreased to 81% for Zn and 87% for Cd at 400 mg/l metal concentration. It was also observed that majority of metals (80-90%) was associated with the biomass.
4 DISCUSSION
The time-course of selenite removal data revealed a two distinct phases: an initial rapid biosorption phase and a slow bioreduction phase. The inhibitory effect of Cd on selenite (Fig 1) reduction was not surprising because Cd 8is known to be much more toxic than both Pb and Zn [ ]. However, the toxicity limit of heavy metals are not similar on microorganisms as the toxic and inhibitory effect of heavy metals on microorganisms are influenced by many factors including the chemical and physiochemical properties of the surrounding environment as well as the species composition of microbial community [6, 9]. Although, there is not much information available on effect of heavy metal on selenate or selenite reducing bacteria, recently, Ayano et al. [6] demonstrated that selenite reduction and synthesis of CdSe by Pseudomonas sp. in the presence of 183 mg/L Cd. Later, it was also reported that Pseudomonas sp. was able to grow even at 3660 mg/L Cd and was able to carry out selenite reduction [10]. The time-course measurements (Fig. 2) demonstrated that removal of heavy metals by anaerobic granular sludge occurred rapidly at the beginning through biosorption, which is a spontaneous process and thereby often occurs very rapidly [11, 12]. It also revealed that the biosorption of metals seemed to have a second

Theoretical Investigation of Glutathione Peroxidase like Activity of some Conformationally Restricted Dichalcogenides
89
removal phase probably via intracellular accumulation [12]. Based on the results presented above, a mechanism for the reduction of selenium oxyanion in the presence of heavy metals and removal of selenium as well as heavy metals is proposed (Fig. 3). Biosorption is not the only mechanism responsible for removal of heavy metals. Adsorption and precipitation mechanisms as either metal-Se and/or metal selenide will be responsible for removing heavy metals from the liquid phase. The results in the paper will help to understand the effect of heavy metals on the microbial reduction of selenite and the fate of selenium in bioreactors as well as for the production of metal selenides.
5 CONCLUSION
In brief, this work presented results on the effect of heavy metals (Cd, Zn, Pb) on microbial reduction of selenite as well as production of elemental selenium and selenide. The results indicate that heavy metals, particularly Pb and Zn did not exert a significant effect on selenite reduction. In contrast, Cd showed inhibitory effect on selenite reduction by anaerobic granular sludge and reduction of selenite was only 60-30% in the presence of 150-400 mg/L Cd. At lower concentration of heavy metals, more than 95% removal of metals was achieved. However, at higher metal concentration, metal removal efficiency decreased to 86% for Pb, 81% for Zn and 91% for Cd.
ACKNOWLEDGEMENT This research was supported through the Erasmus Mundus Joint Doctorate Environmental Technologies for Contaminated Solids, Soils, and Sediments (ETeCoS3) (FPA n˚2010-0009).
REFERENCES [1] Lenz M. and Lens P.N.L., The essential toxin: The changing perception of selenium in environmental sciences.
Sci. Total Environ., 2009. 407(12): p. 3620-3633. [2] Lenz M.; Hullebusch E D V.; Hommes G.; Corvini P F X..; Lens P N L., Selenate removal in methanogenic and
sulfate-reducing upflow anaerobic sludge bed reactors. Water research, 2008a. 42(8-9): p. 2184 - 2194. [3] Nancharaiah Y.V. and Lens P.N.L., Ecology and biotechnology of selenium-respiring bacteria. Microbiol. Mol.
Biol. Rev. 2015, 79, 61-80. [4] Nancharaiah Y.V. and Lens P.N.L., Selenium biomineralization for biotechnology applications. Trends
Biotechnol. 2015, 33, 323-330. [5] Fellowes J.W.; Pattrick R.A.D.; Lloyd J.R.; Charnock J.M.; Coker V.S.; Mosselmans W.; Weng T.C.; Pearce
C.I., Ex situ formation of metal selenide quantum dots using bacterially derived selenide precursors. Nanotechnology, 2013. 24(14): p. 145603 -145612.
[6] Ayano H.; Miyake M.; Terasawa K.; Kuroda M.; Soda S.; Sakaguchi T.; Ike M., Isolation of a selenitereducing and cadmium-resistant bacterium Pseudomonas sp. strain RB for microbial synthesis of CdSe nanoparticles. . J. Biosci. Bioeng., 2013. 117(5): p. 576-581.
[7] Dao-Bo L.; Yuan-Yuan C.; Chao W.; Wen-Wei L.; Na L.; Zong-Chuang Y.; Zhong-Hua T.; Han-Qing Y., Selenite reduction by Shewanella oneidensis MR-1 is mediated by fumarate reductase in periplasm. Scientific Reports, 2013. 4: p. 1 - 7.
[8] Guo H; Luo S.; Chen L.; Xiao X.; Xi Q.; Wei W.; Zeng G.; He Y., Bioremediation of heavy metals by growing hyperaccumulaor endophytic bacterium Bacillus sp. L14. Bioresour. Technol., 2010. 101: p. 8599 - 8605.
[9] Kieu T.Q.H.; Muller E.; Horn H., Heavy metal removal in anaerobic semi-continuous stirred tank reactors by a consortium of sulfate-reducing bacteria. water research, 2011. 45: p. 3863 - 3870.
[10] Ayano H.; Kuroda M.; Soda S.; Ike M., Effects of culture conditions of Pseudomonas aeruginosa strain RB on the synthesis of CdSe nanoparticles. J. Biosci. Bioeng., 2014. 119(4): p. 440 - 445.
[11] Volesky B., Detoxification of metal-bearing effluents: biosorption for the next century. Hydrometallurgy, 2001. 59: p. 203 - 216.
[12] Yuan H.P.; Zhang J.H.; Lu Z.M.; Min H.; Wu C., Studies on biosorption equilibrium and kinetics of Cd+2 by Streptomyces sp. K33 and HL-12. J. Hazard. Mater., 2009. 164: p. 423 - 431.

4th International Conference on Research Frontiers in Chalcogen Cycle Science & Technology
90
Figures
Figure 3. Selenite reduction by anaerobic granular sludge in presence of different concentrations of heavy metals (a) Pb,(b) Zn, and (c) Cd.
Figure 2. Heavy metal removal profiles by anaerobic granular sludge. a) Pb b) Zn and C) Cd.
(b)
Time (h)
0 24 48 72 96 120 144 168 192 216 240
Sel
enite
(mg/
L)
0
20
40
60
8001030507090150300400
Time (h)
0 24 48 72 96 120 144 168 192 216
Pb in
med
ium
(mg/
L)
0
100
200
300
400 (a)
Time (h)
0 24 48 72 96 120 144 168 192 216
Sel
enite
(mg/
L)
0
20
40
60
80 (b) (c)
Time (h)
0 24 48 72 96 120 144 168 192 216
Zn in
med
ium
(mg/
L)
0
100
200
300
400
Time (h)
0 24 48 72 96 120 144 168 192 216
Cd in
med
ium
(mg/
L)
0
100
200
300
400
500
1030507090150300400
(c)
Time (h)
0 24 48 72 96 120 144 168 192 216
Sel
enite
(mg/
L)
0
20
40
60
80 (a)
(b)

91
Figure 3. Proposed mechanism for removal of selenium and heavy metal by anaerobic granular sludge. Due to the deposition/precipitation of Se and/or metal selenide granular sludge became red suggesting the Bioreduction of selenite in
presence of heavy metals like Cd, Zn or Pb.

92

93
EMERGING APPLICATION AREAS

94
95
Biological Sulfide Removal from Anaerobically Treated Domestic Sewage
Graziella P. P. Garcia1, Renata C. O. Diniz1, Sarah K. Bicalho1, Vitor A. S. Franco1, Alyne D. Pereira1, Emanuel M. F. Brandt1
Carlos A. L. Chernicharo,
1and Juliana Calabria Araújo1,*
1 Department of Sanitary and Environmental Engineering, Universidade Federal de Minas Gerais (UFMG), Av. Antonio Carlos 6627, 31270-901, Belo Horizonte,MG, Brazil. * Corresponding author:
Abstract
Two phototrophic reactors were developed to remove sulfide from the UASB effluent treating domestic sewage. The reactors were operated with different packing materials (polypropylene rings and polyurethane foam) and monitored at the hydraulic retention times (HRT) of 24, 12 and 6 hours. Sulfide removal efficiencies of 70%, 90% and 65% were achieved with hydraulic retention times (HRTs) of 6, 12 and 24 hours, respectively, in both reactors. The sulfur mass balance showed that a higher amount of elemental sulfur was formed (and came out in the effluent) in both reactors when operated at HRT of 6 hours (11.5 g and 7.7g in reactor 1 and 2, respectively) than in HRT of 12 and 24 hours (0.5g and 4.5g in reactor 1 and 2 respectively). Denaturing gradient gel electrophoresis (DGGE) results revealed that the pink and green biomass that developed in both reactors comprised a diverse bacterial community and had sequences related to phototrophic green and purple sulfur bacteria such as Chlorobiaceae and Chromatiaceae, respectively. Sequences related to phototrophic purple non-sulfur bacteria such as Rhodopseudomonas palustris, Rhodospirillum centenum and Rhodocista pekingensis were also detected and could be associated with the degradation of lower fatty acids and might also be involved in sulfide oxidation. DGGE band patterns also demonstrated that bacterial community was dynamic over time within the same reactor and that different packing materials selected for distinct bacterial communities. The potential for sulfur formation and recovery (3.2g/m3
Keywords: biological sulfide oxidation, DGGE analysis, elemental sulfur, green and purple sulfur bacteria, UASB reactor effluent
of treated effluent) from anaerobic effluent with low sulfide concentration was demonstrated.
1. INTRODUCTION UASB reactor is an established technology for domestic wastewater treatment in Brazil. However, significant portions of hydrogen sulfide (H2S), resulting from the dissimilative reduction of sulfates or thiosulfates, may remain dissolved in the liquid phase during the anaerobic conversion, being released with the treated effluent. In the case of UASB reactors treating domestic wastewater, the concentration of H2S in the liquid effluent is reported to range between 4 and 17 mg S L-1 [1]. Furthermore, high rates of release of H2
Previous studies have demonstrated the feasibility of using a biological sulfide removal process to remove hydrogen sulfide (H
S to the atmosphere may occur in the hydraulic structures that produce turbulences in the liquid flow [1]. Hydrogen sulfide is a subject of concern in anaerobic treatment, both because of its odorous property, affecting the nuisance conditions in the vicinity of the wastewater treatment plants [2], and because of its role as the most important agent causing corrosion of structures of different materials, such as steel and concrete [3].
2S) from anaerobic effluents [4-8]. Kobayashi et al. [4] investigated the feasibility of using photosynthetic bacteria in fixed films to remove H2S from domestic wastewater using a packed-column and submerged-tube system. Removal efficiencies of 81% to 95% were obtained with a hydraulic retention time (HRT) of 24 h under anaerobic conditions but residual H2S remained in the effluent and the end-product of sulfide oxidation was sulfate. When pure cultures of Chlorobium sp. were used in a non-aerated laboratory-scale reactor with direct incidence of light to treat organic industrial effluent, sulfide removal efficiency of 99.5% was obtained, with a sulfide loading rate of 1.6 g S2- m -3·d-1 [6]. The biological sulphide oxidation process was evaluated in an airlift reactor under oxygen-limited conditions, using activated sludge as seed and synthetic sulfide rich wastewater (0.09 to 0.5 g S L-1). A gradual increase in volumetric sulphide loading rate resulted in an increase in elemental sulfur production [8].

4th International Conference on Research Frontiers in Chalcogen Cycle Science & Technology
96
Most of these studies involved the biological process of sulfide removal using reactors inoculated with pure or mixed cultures of bacteria and/or utilized industrial or synthetic sulfide-rich wastewater. However, the feasibility of using bacterial communities naturally occurring on the surface of the settler compartment of the UASB reactor to remove sulfide from anaerobically treated domestic sewage has not yet been investigated.
The purpose of the present study was to develop an effective and low-cost biotechnological process for sulfide removal from anaerobically treated domestic sewage. The principle of the proposed process was to convert sulfide (dissolved in the effluent) by biological oxidation to elemental sulfur, which could be removed by sedimentation. In order to assess the feasibility of this concept, two reactors were
A better understanding of the composition of microbial communities that naturally developed within the reactors with different packing materials and under various hydraulic retention times may help to improve the biological sulfide removal process that occurs within the reactors, and therefore optimize the recovery of elemental sulfur from anaerobic effluents with low concentrations of sulfide.
designed with a shape similar to that of the settler compartment of a UASB
2. MATERIALS AND METHODS
reactor, but with higher capacity to retain microorganisms that naturally occur on the open surface of UASB reactors used for treating domestic sewage. The performance of the reactors and the structure of the bacterial community that developed within the reactors have been presented and discussed here.
2.1. Experimental Apparatus A pilot-scale UASB reactor (volume of 360 L) followed by two sulfide oxidation reactors (volume of 25 L) operating in parallel (Figure 1) was monitored in three distinct phases, as depicted in Table 1. Reactor 1 (R1) was filled with polypropylene rings in all three phases, while reactor 2 (R2) did not contain packing material in phase 1, but in phases 2 and 3 it was filled with polyurethane foam packing media. After the end of phase 1 the reactors were completely emptied and cleaned (liquid and biomass were removed), and after this the start-up was done again for phase 2.These conditions were applied in order to investigate the effect of the presence and absence of packing material (and the type of material) on sulfide removal efficiency and on bacterial community structure.
The domestic sewage used to feed the UASB reactor was taken after the preliminary treatment of the Arrudas Wastewater Treatment Plant, located in Belo Horizonte City, Minas Gerais State, Brazil. The conceptual design of the two reactors was similar in shape, volume (a cone-shaped bottom with 20cm of height and a cylindrical reaction chamber with 35cm of inner diameter and 30cm of height) and direction of flux (upflow mode), resembling the settler compartment of a UASB reactor, as depicted in Figure 1. Additionally, the reactors were outfitted with a transparent cover (Figure 1), therefore allowing the passage of sunlight and the control of oxygen concentration within the chamber. The reactors were not inoculated; microbial biomass developed naturally within the reactors during operation. Biomass samples were collected
The sulfide concentrations in the effluent from the UASB reactor used to feed the phototrophic reactors were low, ranging from 1 to 6 mg L
from both reactors by removing the cover and taking five pieces of the support material (polypropylene rings or Biobob) at random, while a representative sample of biomass from reactor 2 at an HRT of 24 h (without support material) was obtained with a spatula.
-1 (median values of 2 mg L-1 in phases 1 and 2, and 3 mg L-1
in phase 3) in the three phases of reactor´s operation at different HRTs.
Figure 1. Picture (A) showing the experimental apparatus used in this study, consisting of a pilot-scale UASB reactor and
two biological sulfide oxidation reactors (R1 and R2); Schematic drawing (B) and photograph (C) of the experimental apparatus. The components of the reactors are indicated by numbers: (1) support bench of reactors, (2) inlet
point, (3) reactor (4) internal basket (5) transparent cover, and (6) outlet point (behind the cover).

Biological Sulphide Removal from Anaerobically Treated Domestic Sewage
97
Table 1. Characterization of the operational phases and of the sulfide oxidation reactors.
Phase HRT (h)
Operational days
Duration (days)
Average liquid flow (L/d) Type of packing material
R1 R2 1 24 1 - 257 257 30 polypropylene rings None 2 12 258 - 408 150 60 polypropylene rings Polyurethane foam 3 6 409 - 509 100 120 polypropylene rings Polyurethane foam
2.2. Analytical procedures Analyses of sulfide, sulfate, tiosulfate and volatile total solids (VTSs) were carried out two times per week according to the standard methods [9]. Elemental sulfur in the influent and effluent samples was measured once a week by extracting with chloroform and analysed by high performance liquid chromatography (HPLC) using a PRP-1 reverse phase HPLC column (dimensions: 15 cm L × 4.1 mm ID) as described previously [10]. Elemental sulfur in the biofilm and sludge samples was determined once a month. To extract elemental sulfur, the cells were mechanically lysed using a mini-beadbeater apparatus (Biospec, San Gabriel, China) containing 0.1 mm glass beads (Sigma, Brazil), followed by extraction with chloroform. Elemental sulfur was then measured as described before [10].
2.3. Analysis of the microbial community in the biomass from reactors R1 and R2
2.3.1 Microscopic observations
Phase-contrast microscopy was performed using an Olympus BX50 microscope equipped with an Olympus DP70 camera (Olympus, Tokyo, Japan). Biomass samples were taken monthly from both reactors during the three operational phases and predominant morphologies were observed under the microscope.
2.3.2 PCR-DGGE
The biomass formed in reactors 1 and 2 was sampled at different times during the three operational phases (phase 1: HRT of 24 h, phase 2: HRT of 12 h and phase 3:HRT of 6 h). Biomass samples (2 mL) from the reactor were centrifuged at 14000 rpm for 10 min, and the pellet was used for molecular analyses. DNA was extracted as described previously [11]. Polymerase chain reaction and denaturing gradient gel electrophoresis (PCR-DGGE) was performed using the primer set 1055F and 1392R with a GC clamp, as described previously [12].
DGGE patterns were analysed using the BioNumerics software version 6.6 (Applied Maths, Austin, Belgium). Hierarchical cluster comparisons were carried out to group similar profiles and to generate a binary matrix of band classes. Whole profiles were compared using the Dice similarity coefficient (D
DGGE was performed at 60°C in 0.5 × TAE buffer at 75 V for 17 h using a Bio-Rad DCode Universal Mutation Detection System (Hercules, CA, USA) comprising 8% polyacrylamide gel with a 50% to 65% (M/V) gradient of urea formamide denaturant. Gels were stained with SYBR Gold solution (Invitrogen, NY, USA) and visualized under UV transillumination. Specific gel bands were excised, re-amplified, purified, and sequenced. The PCR products were sequenced using a genomic service (Macrogen Inc., Seoul, Korea). Sequences were compared with that from the National Center for Biotechnology Information database using the Basic Local Alignment Search Tool (BLAST) [13].
sc
3. RESULTS AND DISCUSSION
). A dendrogram was generated using un-weighted pair group method with arithmetic averages (UPGMA) with a 1% band position tolerance.
3.1. Performance of the biological sulphide oxidation reactors Both reactors were operated for approximately 510 days. The mean sulfide removal efficiencies (Figure 2) were higher at phase 2 (HRT of 12 h), reaching 90% for R1 and R2; and phase 3 (HRT of 6 h), reaching 55% for R1 and 70% for R2. Lower efficiencies were obtained in phase 1 (HRT of 24 h), respectively of 30 and 65% for R1 and R2. This was probably due to the sulfide loading rate (SLR) applied to the reactors, which was higher during phases 2 and 3 (median values of 7.0 and 14.0 mg S2-.L-1.d-1, respectively) than that applied during phase 1 (median value of 3.6 mg S2-.L-1.d-1). Therefore, the increase in SLR might have favoured the enrichment of sulfur oxidizing bacteria in the reactors, which consequently contributed to increase the sulfide removal efficiencies.

4th International Conference on Research Frontiers in Chalcogen Cycle Science & Technology
98
Figure 2. Box-plot of sulfide removal efficiency of the two reactors at different HRTs.
The sulfur mass balance for reactors R1 and R2 and for the three operational phases was performed and is presented in Table 2. The sulfur mass balance for reactor 1 shows that there was accumulation of sulfur in all three operational phases, and that in phase 1 the amount of elemental sulfur formed in the reactor (remained in the biomass, 0.5 g) was similar to the amount of S-sulfate formed in the reactor and that came out in the effluent. However, in phase 2, much higher amount of sulfate (2 g) was formed than elemental sulfur (nearly 0.17 g), but in phase 3, much higher amount of elemental sulfur was formed (11.5 g) than sulfate (2.0 g) (Table 2). As far the reactor 2 is concerned, although the mass balance did not close, the results presented in Table 2 indicate that the formation of elemental sulfur was higher compared to the formation of
The sulfur mass balance results (Tables 2 and 3) also showed that a higher amount of elemental sulfur was formed (and came out in the effluent) in both reactors when operated at HRT of 6 hours (11.5 g and 7.7g in reactor 1 and 2, respectively) than in HRT of 12 and 24 hours (0.5g and 4.5g in reactor 1 and 2, respectively). However, much higher percentages of the elemental sulfur formed remained in the biomass of reactor 1 (74% and 88%) with HRT of 12 and 24 hours than that at HRT of 6 hours (9% and 4% in reactor 1 and 2, respectively). Taken together these results indicate that among the conditions tested, the best one to recover sulfur from the biomass was reactor 1 (with polypropylene rings as packing material) at HRT of 12 or 24 hours. Nevertheless, the recovery of sulfur from the effluent would be more feasible for reactor 1 operated at HRT of 6 hours.
sulfate, in all three phases (see also Table 3), thus indicating that the biological oxidation of sulfide to elemental sulfur occurred and prevailed.
Table 2
Sulfur Species (g)
- The sulfur mass balance between influent and effluent of reactors 1 and 2 in the three operational phases. The data were normalized and correspond to one month of reactors operation
Phase 1- HRT 24 h
In Out Bio Out Bioa R1 R1 R2 R2
S-Sulfide 3.0 1.9 nd 1.1 nd S-Sulfate 4.7 5.3 nd 5.6 nd S-Thiosulfate 6.1 5.1 nd 5.4 nd S 0 0 0.06 0.5 4.5 0.005 Total S 13.8 12.4 0.5 16.7 0.005
Sulfur Species (g) Phase 2- HRT 12 h
In Out Bio Out Bioa R1 R1 R2 R2
S-Sulfide 5.1 1.3 nd 0.9 nd S-Sulfate 6.3 8.3 nd 7.4 nd S-Thiosulfate 3.1 2.7 nd 5.5 nd S 0 0 0.04 0.12 4.0 0.05 Total S 14.5 12.3 0.12 17.8 0.05
Sulfur Species (g) Phase 3- HRT 6 h
In Out Bio Out Bioa R1 R1 R2 R2
S-Sulfide 10.6 5.4 nd 4.0 nd S-Sulfate 11.5 13.4 nd 16.5 nd S-Thiosulfate 56.7 56.8 nd 52.6 nd S 0 0 10.5 1.0 7.4 0.3 Total S 78.8 86.1 1.0 80.5 0.3 In: Influent; Out: effluent; Bio: biomass; nd: not determined a values correspond to the sum of S0 determined in the sludge and in the biofilm samples. The highest elemental sulfur values determined for each phase, in the biomass or in the effluent of each reactor, are shown in bold

Biological Sulphide Removal from Anaerobically Treated Domestic Sewage
99
Table 3.
Parameter/phase
Amount of sulfate and elemental sulfur formed in one month of reactors operation in each hydraulic retention time (24, 12 and 6 hours).
Reactor 1 Reactor 2 HRT 24 HRT 12 HRT 6 HRT 24 HRT 12 HRT 6
S-sulfate formed (g) 0.6 1.9 2.0 0.9 1.1 5.0 S0 0.6 formed (g) 0.2 11.5* 4.5 4.1 7.7
S0 88 biomass (%) 74 9 0 1 4 S0 12 effluent (%) 26 91 100 99 96
Values in bold are the total S0
*This amount of elemental sulfur formed represents 3.2g of S/m determined (in the biomass and released in the effluent)
3
3.2. The bacterial community in the biological sulfide oxidation reactors
of treated effluent
3.2.1. Appearance and microscopic observation of samples from reactors 1 and 2
Biomass developed in both reactors in two forms, dispersed in the liquid (similar to microbial mats in reactor 2 at HRT of 24 h) and attached to the packing material. All samples collected were pink and green in colour (Figure 3a and 3b). After 147 days of operation, white particles were visible over the surface of the liquid, indicative of elemental sulphur (Figure 3c).
Microscopic observations of the pink and green microbial biomass samples taken from both reactors during the three operational phases revealed large numbers of oval-to-coccoid-shaped cells similar to those of the phototrophic purple bacterium Chromatium sp. (Figure 3d and 3e), together with cyanobacteria cells similar to Phormidium sp. and algal cells similar to Euglenophyta and diatoms (Figure 3d-f). Chromatium is a genus of phototrophic, purple, gram-negative bacteria found in water and also in sewage treatment plants [14]. This genus belongs to the purple sulfur bacteria group, which can utilize hydrogen sulfide (H2S) as an electron donor for CO2 reduction during anoxygenic photosynthesis. H2S is oxidized to elemental sulfur (S0
), which is stored in globules inside the cells [15].
Figure 3. Pictures (a, b, and c) show the appearance of green and pink microbial biomass that developed in phototrophic reactors 1 and 2 during biological sulfide oxidation. The white particles indicating elemental sulfur (reactor 1 with
polypropylene rings)
3.2.2. Molecular fingerprint of the bacterial community determined by PCR-DGGE
can be observed in panel c. Microscopic observations of the coloured microbial biomass: (d) Phase-contrast micrograph of the coloured biofilm sample from reactor 1, (e) and (f) Phase-contrast micrographs of the coloured biofilm and sludge samples from reactor 2, respectively. Note the ovals cells similar to Chromatium sp. and the globules of
elemental sulfur inside the cells.
In order to investigate the composition of the bacterial community developed in the reactors, the pink and green microbial biomass samples collected from both reactors, during the three HRT (6, 12 and 24 h), were analysed by using DGGE profiles (Figure 4a and 4b). The strongest bands in the DGGE gel were excised and the DNA was sequenced to identify the dominant microorganisms in each sample and period (reactor 1 with polypropylene rings as support, HRTs of 6, 12 and 24 h; reactor 2 without packing material at an HRT of 24 h and with polyurethane foam as support at an HRT of 6 and 12 h) (
Table 4).
a b c
d e fd fe

4th International Conference on Research Frontiers in Chalcogen Cycle Science & Technology
100
15
1607
19
04
05
17
01
06
1008
02
03
21 21
14
18
11
12
20
09
13
12
06 06 06 0613 1313 13 13 13131313
1010
20
02 02
07
05
1 10/12 02/13 06/13 10/12 02/13 06/1308/13 10/13 08/13 10/13
R1 (24h) R2 (24h)R1(12h) R2(12h)
Figure 4. Bacterial community analysis using denaturing gradient gel electrophoresis (DGGE). The DGGE profile of the bacterial community in biomass sampled at different times over the three operational phases from reactors 1 and 2: (a)
phases 1 and 2 (HRT 24 and 12 h); (b) phases 2 and 3(HRT of 12 and 6h).
Sequences affiliated with phototrophic purple non-sulphur bacteria (PPNS) such as Rhodopseudomonas palustris (bands 14, 20 and 25 in figure 4a and 4b), Rhodospirillum centenum (band 17) and Rhodocista pekingensis (band 5 in figure 4a) were found on analyses of specimens from both reactors (Table 4). R. palustris
Phototrophic bacteria such as Rhodopseudomonas palustris, Rhodospirillum tenue, Chromatium vinosum, Thiocapsa roseopersicina, and Chlorobium limicola were found in the activated sludge system. One explanation for their presence was that they may have grown under reduced oxygen tension in the sludge flocs [14]. It has been demonstrated that phototrophic bacteria can compete with other bacteria only under anaerobic conditions in light. Since these
can sustain itself in four different metabolic states: photoautotrophic, photoheterotrophic, chemoautotrophic, and chemoheterotrophic. This metabolic feature helps these bacteria to grow in anaerobic conditions as well as produce energy using light or different organic compounds. This bacterium has the ability to degrade organic compounds in both aerobic and anaerobic conditions [16]. PPNS bacteria have been shown to play primary roles in wastewater treatment processes loaded with high concentrations of lower fatty acids [17]. Therefore the presence of PPNS bacteria in the present study could be associated with the degradation of lower fatty acids possibly present in the anaerobic effluent and/or formed in the phototrophic reactors. In addition, Neutzling et al., (1985) reported that some PPNS bacteria (such as Rhodopseudomonas) can oxidize sulfide to elemental sulfur or to sulfate [18].
were the prevailing conditions within the reactors in the present study, this theory explains the dominance of the pink and green bacteria in the
DGGE results also showed that sequences related to phototrophic green- (GSB) and purple-sulphur bacteria (PSB) were present in both reactors. Bands 9 (which appeared only in reactor 1) and 30 (in both reactors) were affiliated with the Chlorobiaceae family; while bands 10 and 22 had sequences closely related to Chromatiaceae (Table 4). Members of Chlorobium sp. are green sulfur bacteria commonly found in illuminated, stratified, and anoxic aquatic environments, sediments, and other sulfide-rich environments including hot springs [19]. They use electrons derived from reduced sulphur compounds in combination with light energy to reduce carbon and nitrogen.
samples collected.
Due to their tolerance for low oxygen environments, these bacteria grow in environments containing large amounts of decaying organic matter and are extremely well-adapted to oxic-anoxic fluctuations, gradients of oxygen and sulfide, and day-night fluctuations [20]. Chlorobium spp. have been used in a non-aerated bioreactor with direct incidence of light to treat organic industrial effluent. The sulfide removal efficiency was 99.5%, with a sulphide loading rate of 1.6 Kg S2- m -3·d-
1
[6].

Biological Sulphide Removal from Anaerobically Treated Domestic Sewage
101
Table 4. DGGE bands associated with 16S rRNA genes in biomass samples collected from reactors 1 and 2 at the three operational phases (HRT of 6, 12 and 24 h) (see Figure4a and 4b).
Band Taxonomic identity ACC. No. a 16SrRNA gene Similarityb
1, 12 Phylum Firmicutes Order Clostridiales Genus Soehngenia
AB896675 Uncultured Firmicutes bacterium 99%
2 Phylum Proteobacteria Order Burkholderiales
Genus Tepidimonas KF206381 Tepidimonas sp. 100%
3 Phylum Proteobacteria Family Xanthomonadaceae JQ349048 Lysobacter sp. 97%
4 Phylum Proteobacteria Family Xanthomonadaceae KF911330 Lysobacter brunescens 97%
5 Phylum Proteobacteria Genus Rhodocista NR_025830 Rhodocista pekingensis 98%
6 Phylum Cyanobacteria EF123634 Uncultured Cianobacterium 92%
7, 15 Phylum Proteobacteria Genus Thermomonas FJ821616.1 Thermomonas sp. 100%
8 Phylum Proteobacteria Family Methylococcaceae KJ081955 Methylomonas sp. 98%
9 Phylum Chlorobi Family Chlorobiaceae DQ383316 Uncultured Chlorobium
sp. 90%
10,22 Phylum Proteobacteria Family Chromatiaceae HQ003533.1 Uncultured
Chromatiaceae bacterium 97%
11 Phylum Firmicutes Order Clostridiales Genus Soehngenia
NR_025761 Soehngenia saccharolytica 97%
13, 33 Phylum Proteobacteria Class Betaproteobacteria KC492099.1 Gulbenkiania mobilis 90%
14 Phylum Proteobacteria Family Bradyrhizobiaceae FJ210722 Rhodopseudomonas
palustris 93%
16 Phylum Bacteroidetes Family Porphyromonadaceae GU179797 Uncultured Bacterioides
bacterium 93%
17 Phylum Proteobacteria Family Rhodospirillaceae NR_025830 Rhodospirillum centenum 99%
18 Phylum Cyanobacteria EF123634 Uncultured Cianobacterium 92%
19 Phylum Chloroflexi Genus Chloroflexaceae JX298781 Chloronema giganteum 91%
20, 25 Phylum Proteobacteria Family Bradyrhizobiaceae FJ210722 Rhodopseudomonas
palustris 99%
21, 29 Phylum Proteobacteria Genus Thermomonas
KF7170461 FJ821616.1 Thermomonas sp 99%
23 Phylum Proteobacteria Class Gammaproteobacteria HM984596.1 Pseudomonas sp. 83%
24 Phylum Bacteroidetes Family Porphyromonadaceae JQ346770.1 Uncultured Bacteroidetes
bacterium 84%
26 Phylum Verrucomicrobia Family Opitutaceae CU925220.1
Uncultured Verrucomicrobium
bacterium 97%
27 Phylum Bacteroidetes Family Chitinophagaceae HM124372.1 Terrimonas sp. 99%
28 Phylum Bacteroidetes Family Chitinophagaceae KF206394.1 Hydrotalea sp. 99%
30 Phylum Chlorobi Family Chlorobiaceae AY394785.1 Chlorobaculum sp. 94%
31 Phylum Proteobacteria Family Comamonadaceae KJ127965.1 uncultured Acidovorax sp. 99%
32 Phylum Firmicutes Family Clostridiales incertae sedis AB702885.1 Clostridiales bacterium 90%
a The Taxonomic identities of the sequences retrieved from the DGGE were assigned by using the Classifier program of RDP-II at confidence level of 80%. b
Bands in bold show sequences related to phototrophic Green and Purple bacteria. DGGE percentages indicate the similarity between band sequence and the closest matched sequences in GenBank.

4th International Conference on Research Frontiers in Chalcogen Cycle Science & Technology
102
Additionally, Band 2 had a sequence closely related to that of Tepidimonas sp., a chemoheterotrophic bacterium that is slightly thermophilic, aerobic, and able to oxidize thiosulfate and tetrathionate to sulfate [21]. These bacteria could be involved in the oxidation of reduced sulfur compounds present in the anaerobically treated effluent, since elemental sulfur and sulfate were formed and detected in reactors 1 and 2.
Bands 7, 15, 21 and 29 were closely related to the sequence of Thermomonas sp. Members of this genus are gram-negative and some strains have been isolated from a denitrification reactor [22].
Band 8 was closely related to the sequence of Methylomonas sp., which is an obligate methanotrophic bacterium that uses methane or methanol as the sole carbon source. Members of this genus have been isolated from freshwater rivers and lakes, activated sludge, and wastewaters [23]. The presence of this genus can be explained by the fact that some methane remained dissolved in the UASB effluent that entered in the reactors.
Bands 1 and 12 (Fig. 4a), which appeared in both reactors, were closely related to sequences of uncultured Firmicutes (AB896675). Members of this group are typically divided into Clostridia, which are anaerobic and fermentative bacteria; Bacilli, which are obligate or facultative aerobes; and the Mollicutes. Members of the genera Clostridium and Bacillus are the most common representatives of this group [24].
Band 11 was 97% identical to the sequence of Soehngenia saccharolytica (NR_025761), which is benzaldehyde-converting bacterium isolated from an UASB reactor treating potato starch wastewater [25].
Band 26 was related to the Opitutaceae family (uncultured Verrucomicrobium bacterium) and was detected in both reactors. Members of this family are facultatively or obligately anaerobic bacteria and ferment mono and dissacharides to organic acids [23].
The DGGE results together with the sulfur mass balance indicate that the sulfide present in the anaerobic effluent was biologically oxidized and converted to elemental sulfur and/or to sulfate by the phototrophic green-, purple-sulphur and purple-non-sulphur bacteria that developed in the reactors and are able to perform anoxygenic photosynthesis.
Therefore, DGGE band patterns showed that the bacterial community that developed in both reactors was diverse and dynamic over time within the same reactor and that different packing materials selected for distinct bacterial communities. The UPGMA cluster analysis revealed a distinct bacterial community composition of the samples analyzed. Biomass samples retrieved from R1 and R2 (from phases 1 and 2-figure4a) were most dissimilar (showing only 25.5% of similarity), whereas samples retrieved from R1 and R2 (from phases 2 and 3-Figure 4b) were the least dissimilar (48% similarity). In addition, samples retrieved from the same reactor and within the same phase were also dissimilar (showing from 30 to 60% similarity) (data not shown).
4. CONCLUSIONS The reactor configuration (a shape resembling the settler compartment of a UASB reactor with high capacity to retain microorganisms) favoured the development of pink and green microbial biomass containing phototrophic bacteria, which promoted biological sulfide oxidation. Sulfide concentrations of 1 to 6 mg L-1 could be efficiently removed from the effluent of a pilot-scale UASB reactor in two phototrophic reactors at HRTs of 6, 12 and 24 h. However, a higher amount of elemental sulfur was formed (and came out in the effluent) in reactor 1 operated at HRT of 6 hours than in reactor 2. The potential for sulfur formation and recovery (3.2g of S/m3
ACKNOWLEDGEMENTS
of treated effluent) from anaerobic effluent with low sulfide concentration was demonstrated.
This work was supported by the following Brazilian agencies: Conselho Nacional de Desenvolvimento Científico e Tecnológico (CNPq), Financiadora de Estudos e Projetos (FINEP), Fundação de Amparo a Pesquisa do estado de Minas Gerais (FAPEMIG), and Coordenação de Aperfeiçoamento de Pessoal de nível Superior (CAPES)
REFERENCES
.
[1] Souza CL, Chernicharo CAL, Melo GCB. Methane and hydrogen sulfide emissions in UASB reactors treating domestic wastewater. Wat Sci Technol 2012;65:1229-1237.
[2] Gostelow P, Parsons SA, Stuetz RM. Odour measurement in sewage treatment – a review. Water Res 2001;35:579-597. [3] Speece RE. Anaerobic biotechnology for industrial wastewaters. Archae Press. Nashville; 1996. [4] Kobayashi HA, Stenstrom M, Mah RA. Use of photosynthetic bacteria for hydrogen sulfide removal from anaerobic
waste treatment effluent. Water Res 1983;17:579-587. [5] Janssen AJH, Sleyster R, van der Kaa C, Jochemsen A, Bontsema J, Lettinga G. Biological sulphide oxidation in a fed-
batch reactor. Biotechnol Bioeng 1995;47:327-333.

Biological Sulphide Removal from Anaerobically Treated Domestic Sewage
103
[6] Ferrera I, Sánchez O, Mas J. A new non-aerated iluminated packed-column reactor for the development of sulfide-oxidizing biofilms. Appl Microbiol Biotechnol 2004;64:659-664.
[7] Krishnakumar B, Majumdar S, Manilal VB, Haridas A. Treatment of sulphide containing wastewater with sulphur recovery in a novel reverse fluidized loop reactor (RFLR). Water Res 2005;39:639- 647.
[8] Lohwacharin L, Annachhatre AP. Biological sulfide oxidation in an airlift bioreactor. Bioresour Technol 2010;101:2114-2120.
[9] APHA, AWWA. Standard Methods for the Examination of Water and Wastewater. American Public Health Association. Washington; 2005.
[10] Henshaw PF, Bewtra JK, Biswas N. Hydrogen sulphide conversion to elemental sulphur in a suspended-growth continuous stirred tank reactor using Chlorobium limicola. Water Res 1998;32:1769-1778.
[11] Egli K, Langer C, Siegrist HR, Zehnder AJ, Wagner M, van der Meer JR. Community analysis of ammonia and nitrite oxidizers during start-up of nitrification reactors. Appl Environ Microbiol 2003;69:3213-3222.
[12] Ferris MJ, Muyzer G, Ward DM. Denaturing gradient gel electrophoresis profiles of 16S rRNA-defined populations inhabiting a hot spring microbial mat community. Appl Environ Microbiol 1996;62:340-346.
[13] Altschul SF, Gish W, Miller W, Myers EW, Lipman DJ. Basic local alignment search tool. J Mol Biol 1990;215:403-410.
[14] Siefert E, Irgens RL, Pfennig N. Phototrophic purple and green bacteria in a sewage treatment plant. Appl Environ Microbiol 1978;35:38-44.
[15] Madigan MT, Martinko JM, Parker J. BROCK Biology of Microorganisms. Pearson Cummings, San Francisco; 2010. [16] Larimer FW, Chain P, Hauser L, Lamerdin J, Malfatti S, Do L, Land ML, Pelletier DA, Beatty T, Lang AS, Tabita FP,
Gibson JL, Hanson TE, Bobst C, Torres y Torres JL, Peres C, Harrison FH, Gibson J, Harwood CS. Complete genome sequence of the metabolically versatile photosynthetic bacterium Rhodopseudomonas palustris. Nature Biotechnol 2004;22:55-61.
[17] Okubo Y, Futamata H, Hiraishi A. Characterization of phototrophic purple nonsulfur bacteria forming colored microbial mats in a swine wastewater ditch. Appl Environ Microbiol 2006;79:6225-6233.
[18] Neutzling O, Pfleider C, Truper HG. Dissimilatory sulphur metabolism in phototrophic “non-sulphur” bacteria. Microbiology 1985;131:791–798.
[19] van Gemerden H, Mas J. Ecology of phototrophic sulfur bacteria. In: Anoxygenic Photosynthetic Bacteria (Blankenship RE, Madigan MT, Bauer CE, eds.). Kluwer Academic Publishers, Dordrecht, The Netherlands; 1995.
[20] Elshahed MS, Senko JM, Najar FZ, Kenton SM, Roe BA, Dewers TA, Spear JR, Krumholz LR. Bacterial diversity and sulfur cycling in a mesophilic sulfide-rich spring. Appl Environ Microbiol 2003;69:5609-5621.
[21] Moreira C, Rainey FA, Nobre MF, Silva MT, Costa MS. Tepidimonas ignava gen. Nov., sp. Nov., a new chemolithoheterotriphic and slightly thermophilic member of the β-proteobacteria. Int J Syst Evol Microbiol 2000;50:735-742.
[22] Mergaert J, Cnockaert MC, Swings J. Thermomonas fusca sp. nov. and Thermomonas brevis sp. nov., two mesophilic species isolated from a denitrification reactor with poly(ε -caprolactone) plastic granules as fixed bed, and emended description of the genus Thermomonas. Int J Syst Evol Microbiol 2003;53:1961-1966.
[23] Garrity GM, Bell JA, Lilburn T, Class III. Gammaproteobacteria class nov. in: Bergey´s Manual of Systematic Bacteriology (Brenner DJ, Krieg NR, Staley JT, Garrity GM, eds.), second edition, vol. 2 (The Proteobacteria), part B (The Gammaproteobacteria). Springer, New York; 2005.
[24] Wolf M, Muller T, Dandekar T, Pollack JD. Phylogeny of Firmicutes with special reference to Mycoplasma (Mollicutes) as influenced from phosphoglycerate kinase amino acid sequence data. Int J Syst Evol Microbiol 2004;54:871-875.
[25] Parshina SN, Kleerebezem R, Sanz JL, Lettinga G, Nozhevnikova AN, Kostrikina NA, Lysenko AM, Stams AJ, Soehngenia saccharolytica gen. nov., sp. nov. and Clostridium amygdalium sp. nov., two novel anaerobic, benzaldehyde-converting bacteria. Int J Syst Evol Microbiol 2003;53:1791-17.
BIOGRAPHY Juliana CALABRIA ARAUJO obtained her Doctorate in Hydraulic and Sanitation in 2001 at Universidade de São Paulo- São Carlos School of Engineering (USP-EESC), São Carlos, Brazil. During her PhD she did an internship period at EAWAG, Duebendorf, Switzerland. Calabria completed her BSc in Biology in 1992 from Federal University of Rio de Janeiro, Rio de Janeiro, Brazil. Since 2009 she is a professor at Department of Sanitary and Environmental Engineering, Universidade Federal de Minas Gerais (UFMG), Belo Horizonte, Brazil.
She may be contacted at [email protected] ; [email protected]

104
105
Nitrate-Mediated Microbially Enhanced Oil Recovery (N-MEOR) from Model Upflow
Bioreactors Fatma Gassara, Navreet Suri and Gerrit Voordouw
Petroleum Microbiology Research Group, Department of Biological Sciences, University of Calgary, Calgary, Calgary, Alberta, T2N 1N4, Canada. E-mails: [email protected], [email protected], [email protected]
Abstract MEOR can enhance oil production with less energy and less input cost than other technologies. The present study used different aqueous electron donors (acetate, glucose molasses) and an aqueous electron acceptor (nitrate) to stimulate growth of heterotrophic nitrate reducing bacteria (hNRB) to improve production of oil. Initial flooding of columns containing heavy oil (viscosity of 3400 cP at 20°C) with CSBK (Coleville synthetic brine medium) produced 0.5 PV of oil. Bioreactors were then inoculated with hNRB with 5.8 g/L of molasses and 0, 10, 20, 40, 60 or 80 mM nitrate, as well as 17 mM glucose or 57 mM acetate and 80 mM nitrate. During incubations no oil was produced in the bioreactors that received 5.8 g/L of molasses and 0, 10, 20, 40 or 60 mM nitrate. However, the bioreactors injected with 5.8 g/L of molasses, 17 mM glucose or 57 mM acetate and 80 mM nitrate produced 13.9, 11.3±3.1 and 17.8±6.6 % of residual oil, respectively. The significant production of oil from these bioreactors may be caused by N2-CO2
gas production. Following continued injection with CSBK without nitrate, subsequent elution of significant residual oil (5-30%) was observed. Further studies will focus on defining the mechanism of additional oil production and optimizing nutrients in CSBK medium (ammonium, trace elements) to further enhance production of additional oil under low-pressure conditions.
1. INTRODUCTION
Primary oil recovery uses the resident pressure of the reservoir to produce oil. As this pressure dissipates, secondary oil flow to producing wells is achieved by injecting water to repressurize the reservoir. This eventually leads to breakthrough of injection water and to an increasing ratio of produced water to produced oil. Once this ratio becomes too high tertiary production methods must be used. These can include Chemically Enhanced Oil Recovery (CEOR), in which surfactants, polymers, acids, gases or solvents are injected. The target of these methods is to produce the 45-55% of residual oil in place (ROIP) that remains in the reservoir following the primary and secondary phases of production. Heavy oil remains in part due to its high viscosity, which limits its mobility and prevents its production by the less viscous injected water. Viscosity matching, in which water is amended with polyacrylamide or other polymers, can increase production of heavy oil. Production of both heavy and light oils can also be limited by high interfacial tension between oil and water, which results in high capillary forces that retain the oil in small pores in the reservoir rock. These forces can be decreased by injection of chemical surfactants or by injecting alkali, which activates organic acids in the oil to act as surfactants. Extracting the maximum amount of oil from reservoirs through tertiary production methods constitutes a major challenge to the oil industry (Sen, 2008; Youssef et al., 2009). Microbially Enhanced Oil Recovery (MEOR) is an alternative tertiary oil recovery technology in which microbial products (biomass, biopolymers, gases, acids, solvents, enzymes and surface-active compounds) and activities (hydrocarbon degradation, plugging) are used to improve the recovery of ROIP from depleted reservoirs (Sen, 2008; Brown, 2010). This technology typically uses either indigenous or injected microorganisms to produce useful products by fermenting inexpensive raw materials such as molasses. It has the potential to enhance oil production with the input of less energy as in thermal processes and less expensive materials as in CEOR processes (Lazar et al., 2007; Sen, 2008; Youssef et al., 2009). Molasses is a cheap by-product of the refining of sugarcane into sugar that represents an excellent material used in MEOR technology to promote microbial growth. MEOR can also involve injection of nitrate, which serves as a high-

4th International Conference on Research Frontiers in Chalcogen Cycle Science & Technology
106
potential electron acceptor stimulating the metabolic activity of the oil field microbial community. This can lead to increased oil recovery through microbial production of N2 and CO2 gas, production of biosurfactants or the blockage of non-productive subsurface channels by biomass formation. MEOR can also involve injection of nitrate, which serves as a high-potential electron acceptor stimulating the metabolic activity of the oil field microbial community. This can lead to increased oil recovery through microbial production of N2 and CO2
The present study aims to use different aqueous electron donors (acetate, glucose molasses) and an aqueous electron acceptor (nitrate) to stimulate growth of heterotrophic nitrate reducing bacteria (hNRB) under low pressure and low temperature conditions to improve tertiary production of oil. The potential of these mechanisms was analyzed by using model sand-packed columns at low pressure and ambient temperature.
gas, production of biosurfactants or the blockage of non-productive subsurface channels by biomass formation (Bhupathiraju et al., 1993).
2. MATERIALS AND METHODS
2.1. Oil samples Experiments were conducted with heavy oil from the Medicine Hat Glauconitic C (MHGC) field near Medicine Hat, Alberta, Canada. The MHGC field is a shallow (850 m), low-temperature (30 °C) field from which heavy oil with an American Petroleum Institute (API) gravity of 12−18° and a viscosity of 3400 cP at 20ºC is produced by water injection.
2.2. Media and enrichment cultures Enrichment cultures were grown in 120-mL serum bottles, containing 47.5 mL of sterile anaerobic CSBK medium (containing g/L: 1.5 NaCl, 0.05 KH2PO4, 0.32 NH4Cl, 0.21 CaCl2·2H2O, 0.54 g MgCl2·5H2O, 0.1 KCl and 1 ml of trace elements (Widdel and Bak, 1992) with either 0, 10, 20, 40 or 80 mM NaNO3, 1 ml of MHGC oil, a headspace of 90% (v/v) N2 and 10% CO2 (N2-CO2) and additional electron donors (either molasses, acetate or glucose), as described in Table 1. The bottles were closed with butyl rubber stoppers and were inoculated with 2.5 ml of produced water (5PW) from the MHGC field and incubated at 30ºC. Samples from enrichment cultures were taken periodically using N2-CO2
2.3. Bioreactor setup
flushed syringes and used to measure nitrate and nitrite concentrations with high-pressure liquid chromatography (HPLC). These enrichment cultures were used for inoculating bioreactors as described in the next sections.
Syringes of 30 ml without piston were provided with a layer of glass wool and a layer of polymeric mesh and were then packed tightly with sand (Sigma-Aldrich, 50-70 mesh), followed by a top layer of glass wool (Callbeck et al., 2011; Kryachko and Voordouw, 2014). A rubber stopper perforated with a syringe needle was used to seal the columns. Zip ties were used on the outside to enhance the seal. Two Luer-Lock three-way valves were connected to the bottom syringe inlet and the needle outlet so that samples of the influent and effluent stream could be taken for chemical analysis. The three-way valves were connected to 0.76 mm ID PVC tubing (Mandel Scientific) with the aid of steel fitting units (Ochs Laborbedarf). The influent tubing was connected to both sides of a piece of calibrated 0.5 mm ID PVC pump tubing (Mandel Scientific), placed in the head of an 8-channel peristaltic pump (Gilson Inc., Minipuls-3), through 1 mm OD steel connectors (Gilson Inc.). Medium was pumped from a sealed 160 ml serum bottle containing anaerobic CSBK medium with an N2-CO2 headspace, replenished with an N2-CO2
2.4. Effect of addition of water-soluble electron donors at low pressure conditions
filled syringe. The effluent tubing was led into a perforated Falcon tube used to collect the effluent (Figure 1).
For experiments on enhanced oil recovery at low pressure 30 mL plastic syringe sand-pack bioreactors with a pore volume (PV) of 15 ml were injected with CSBK medium under upward flow conditions. The CSBK medium was then replaced with heavy oil. Oil contained in the bioreactors was eluted at a rate of 15 ml/day with anoxic CSBK using a peristaltic pump. The oil content of the produced oil-water mixture was determined daily by adding dichloromethane and measuring with a spectrophotometer. Following injection of 15 PV of CSBK a total of 0.5 PV of oil was produced with approximately 0.45 PV of oil remaining in the bioreactors. We refer to this as stage 1. In stage 2 bioreactors were injected with 0.5 PV of an appropriate microbial culture with 5.8 g/L of molasses (17 mM glucose equivalents) and 0, 10, 20, 40, 60 or 80 mM nitrate (experiment I), as well as with 17 mM glucose or 57 mM acetate and 80 mM nitrate (experiment II). Bioreactors were then incubated without flow for 14 days. Following incubation, flow of CSBK medium at 1 PV/day was resumed in stage 3. Oil and water production were measured

Nitrate-Mediated Microbially Enhanced Oil Recovery (N-MEOR) from Model Upflow Bioreactors
107
throughout the procedure. Concentrations of nitrate and nitrite in the aqueous phase were measured by HPLC. The appropriate microbial culture hNRB grown on the same aqueous electron donors (Table 1).
2.5. Chemical analysis
1 ml of the bioreactor effluent was transferred to a microfuge tube and centrifuged at 13,000 rpm for 5 min to remove oil and biomass and clear fluid was transferred to a clean tube and then used for nitrate and nitrite essay. Nitrite and nitrate were detected using high pressure liquid chromatography (HPLC) using a UV detector (Gilson, USA). Please refer to SOP-2 and SOP-3 on the NSERC IRC website for detailed information (Callbech et al. 2011).
2.6. Oil emulsification
Effluents from low-pressure bioreactors used in experiment VI were centrifuged at 13,000 rpm for 5 min. 2 ml of clear fluid was added to 2 ml of toluene. After mixing toluene and the supernatant by vortexing for 2 min, and leaving to stand for 24 hours, the emulsification index E24 (%) was calculated, as indicated below. A higher E24 indicates the potential presence of a higher concentration of biosurfactant.
E24 (%) = (height of emulsified layer, mm) / total height of the liquid column, mm)*100
2.7. Surface tension measurement
Surface tension is the elastic tendency of liquids, which makes them acquire the smallest possible surface area. Separation of oil and water is caused by interfacial tension between non-mixable liquids. The presence of a surfactant decreases surface tension (interfacial tension), which permits stability of minute droplets of oil in the bulk of water (or vice versa), especially when the polar head groups of the surfactant are charged. The surface tension of the same supernatants obtained in 2.6 was determined according to the ring method (as described by Gudi˜na et al. 2012) using a fully automatic surface tensiometer (Fisher Autotensiomat).
3. RESULTS AND DISCUSSIONS
3. 1. Effect of Molasses on Heavy Oil Recovery Using Microorganisms at Low Pressure Conditions: Experiment 1
In order to enhance oil recovery using an aqueous electron donor, we tested the effect of 5.8 g/L of molasses (17 mM glucose) with 0, 10, 20, 40, 60, 80 mM of nitrate. Note that in the absence of nitrate we expect fermentation of sucrose to organic acids and/or alcohols, whereas in the presence of nitrate hNRB activity will increase production of N2 and CO2. In stage 2 incubations no oil was produced in bioreactors Bio_I1 to Bio_I5 (Table 2, Figure 2). However, Bio_I6 injected with 80 mM nitrate produced 0.92 ml of oil (14.45% of ROIP). Following, continued injection with CSBK without nitrate, significant elution of oil was observed in all bioreactors following stage 3: 15.1, 5.8, 5.2, 6.8, 11.5 and 16.9% of ROIP in Bio_I1 to Bio_I6, respectively (Table 2). These results indicate possible involvement of fermentation products (organic acids, alcohols), but not gases in oil production in Bio_V1, whereas the significant production of oil from Bio_I6 in stage 2 may be caused by N2-CO2
gas production. Hence, different mechanisms may have contributed to additional oil production from molasses at different nitrate concentrations of 0 to 80 mM.
3. 2. Effect of Acetate and Glucose on Heavy Oil Recovery Using Microorganisms at Low Pressure Conditions: Experiment II
In experiment II, we compared the effect of addition of 17 mM glucose or 57 mM acetate, together with 80 mM nitrate in the presence of hNRB cultures grown on these same electron donors (Figure 2). Duplicate stage 2 incubations led to production of 11.3±3.1, 17.8±6.6 and 17.2±1.0 % of ROIP. Almost complete reduction of nitrate and of the intermediate nitrite was observed during all stage 2 incubations (Figure 3). Hence, these results indicated similar effectiveness of aqueous (molasses, acetate, glucose) electron donors under conditions where all nitrate was reduced with formation of
4th International Conference on Research Frontiers in Chalcogen Cycle Science & Technology
108
similar amounts of N2-CO2
In this study we have conducted a number of experiments to demonstrate that additional oil can be produced from bioreactors injected with high concentrations of nitrate, and water-soluble electron donor, which is readily used by hNRB (e.g. acetate, molasses and glucose). Oil production in low-pressure bioreactors was observed during stage 2 incubation, when the bottom of the bioreactor was connected to the anaerobic atmosphere of a serum bottle through a syringe needle and during subsequent injection of more CSBK in stage 3. This oil production was higher and faster than observed by Kryachko and Voordouw (2014). In their experimental set up vials were connected to syringe needles at the top of the bioreactors, causing oil, water and produced gas to all moves in the same direction (upwards). Maximum oil production in this system was 2.06 ml after 341 days of incubation in bioreactors injected with nitrate. However, in our current setup in which produced oil and water moved downwards being replaced by gas that moved upwards, up to 2.6 ml of additional oil was obtained after 1 cycle (14 days) of incubation. Significant oil production in stage 2 appeared to require high concentrations of both electron donor and acceptor. Lower concentrations acceptor gave less oil production. The decrease appeared to be non-linear in the case of a constant concentration of molasses (17 mM of glucose equivalents) stage 2 production of oil was only observed with 80 mM nitrate, not with 10, 20 or 40 mM nitrate (Table 2). The mechanism of oil production during stage 2 incubations of low-pressure bioreactors is likely as a result of N
driving oil from the bioreactors. Following stage 3, continued injection with CSBK without nitrate, the final oil production in the three duplicate sets of bioreactors containing either acetate or glucose was: 17.9±3.7, 36.1±5.0 % of ROIP, respectively.
2-CO2
production.
In order to further define the mechanism involved in enhanced oil recovery at low pressure and low temperature conditions, we measured the E24 and the surface tension for the effluents collected from the bioreactors at the start of stage 3. As shown in Figure 4, one of the effluents from the glucose-amended bioreactors gave a significantly higher emulsification index (E24=64%) than found for the other glucose-amended bioreactor (E24=12%) and the acetate-amended bioreactor (average E24
4. CONCLUSION
=1.5%). The values of the surface tensions obtained for effluents from glucose-, acetate-, or toluene-amended bioreactors were more similar with averages of 55 and 64.5 mN/m, respectively.
The potential of different aqueous electron donors (acetate, glucose molasses) and an aqueous electron acceptor (nitrate) to stimulate growth of heterotrophic nitrate reducing bacteria (hNRB) under low pressure and low temperature conditions to improve tertiary production of oil was tested in this study. The results of this study showed that significant oil production during incubation with hNRB (stage 2) appeared to require high concentrations of both electron donor and acceptor. Lower concentrations of nitrate gave less oil production. The decrease appeared to be non-linear in the case of a constant concentration of molasses (“17 mM”) stage 2 production of oil was only observed with 80 mM nitrate, not with 10, 20 or 40 mM nitrate. The mechanism of oil production during stage 2 incubations of low-pressure bioreactors is likely as a result of N2-CO2
REFERENCES
production. Following continued injection with CSBK without nitrate, significant elution of oil was observed: 15.1, 5.8, 5.2, 6.8, 11.5, 16.9, 17.9±3.7 and 36.1±5.0 % of ROIP in bioreactors injected with 5.8 g/L of molasses (17 mM glucose) and 0, 10, 20, 40, 60 or 80 mM nitrate, as well as of 17 mM glucose or 57 mM acetate and 80 mM nitrate, respectively. These results indicate possible involvement of fermentation products (organic acids, alcohols) to enhance heavy oil recovery. The bioreactor studies indicate that N-MEOR technology can be cost-effective even in the current low oil price environment. Further studies will focus on defining the mechanism of additional oil production and optimizing nutrients in CSBK medium (ammonium and trace elements) to further enhance production of additional oil under low-pressure conditions.
[1] Bhupathiraju VK, McInerney, MJ, and Knapp RM. Pretest studies for a microbiologically enhanced oil recovery field pilot in a hypersaline oil reservoir. Geomicrobiol J 1993; 11:19–34.
[2] Brown, L.R. Microbial enhanced oil recovery (MEOR). Current Opinion in Micro-biology 2010; 13: 316–320.

Nitrate-Mediated Microbially Enhanced Oil Recovery (N-MEOR) from Model Upflow Bioreactors
109
[3] Callbeck CM, Dong X, Chatterjee I, Agrawal A, Caffrey SM, Sensen CW, Voordouw G. Microbial community succession in a bioreactor modeling a souring low-temperature oil reservoir subjected to nitrate injection. Appl Microbiol Biotechnol 2011; 91:799–810.
[4] Gudi˜na EJ, Pereira JFB, Rodrigues LR, Coutinho JAP, Teixeira JA. Isolation and study of microorganisms from oil samples for application in Microbial Enhanced Oil Recovery. International Biodeterioration and Biodegradation 2012; 68:56–64.
[5] Kryachko Y, Voordouw G. Microbially enhanced oil recovery from miniature model columns through stimulation of indigenous microflora with nitrate. International Biodeterioration & Biodegradation 2014; 12/2014; 96. DOI:10.1016/j.ibiod.2014.08.013
[6] Lazar IG, Petrisor TF, Yen. Microbial enhanced oil recovery (MEOR). Petroleum Science and Technology 2007; 25: 1353–1366.
[7] Sen R. Biotechnology in petroleum recovery: the microbial EOR. Progress in Energy and Combustion Science 2008; 34:714–724.
[8] Widdel F, Bak F. Gram-negative mesophilic sulfate-reducing bacteria, p 3352–3378 In Balows ATr̈ , uper HG, Dworkin M, Harder W, Schleifer KH., editors. (ed), The prokaryotes, 2nd ed, vol 4 Springer-Verlag, 1992; New York, NY
[9] Youssef N, Elshahed MS, McInerney MJ. Microbial processes in oil fields:culprits, problems, and opportunities. Advances in Applied Microbiology 2009; 66:141–251.

4th International Conference on Research Frontiers in Chalcogen Cycle Science & Technology
110
Table 1. Concentrations of nitrate (mM) in the 47.5 ml aqueous phase and in enrichment cultures used for experiments I and II, as indicated. The percentage (%) reduction of nitrate achieved at the end of the incubation is indicated.
Nitrate (mM) Molasses (mM)
Reduction (%) Electron donor (mM)
Reduction (%)
Bio1 0 17 NA Acetate: 57 89Bio2 10 17 100 Acetate: 57 89Bio3 20 17 100 Glucose: 17 92Bio4 40 17 100 Glucose: 17 92Bio5 60 17 93Bio6 80 17 89
808080
Experiment I Experiment IINitrate (mM)
80
% of reduction = (nitrite concentration/initial nitrate concentration)*40% + ((initial nitrate concentration - residual nitrate concentration - nitrite concentration)/ initial nitrate concentration)*100%.
Table 2. Summary of oil and water production in low-pressure bioreactors following one cycle of incubation (stage 2), as well as following completion of the experiment (after stage 3). Density of MHGC oil = 0.959 g/ml.
Nitrate (mM) Moleasses (mM) PV (ml) ROIP (ml) Oil_2 (ml) H2O_2 (ml) Oil _2 (% ROIP) Oil (ml) Oil (% ROIP)
Bio_I1 0 17 15.63 6.36 0.00 0.00 0.00 0.96 15.09Bio_I2 10 17 15.09 6.19 0.00 0.00 0.00 0.36 5.82Bio_I3 20 17 15.21 6.32 0.00 0.00 0.00 0.33 5.22Bio_I4 40 17 15.16 5.99 0.01 0.95 0.17 0.41 6.84Bio_I5 60 17 15.32 6.2 0.00 2.10 0.00 0.71 11.45Bio_I6 80 17 15.55 6.64 0.96 3.20 14.45 1.12 16.87
Experiment I Stage 2 Final production
Nitrate (mM) electron donor (mM) PV (ml) ROIP (ml) Oil_2 (ml) H2O_2 (ml) Oil _2 (% ROIP) Oil (ml) Oil (% ROIP)
Bio_II1 80 Acet: 57 15.26 6.97 1.00 2.40 14.37 1.50 21.56Bio_II2 80 Acet: 57 15.11 7.08 0.58 2.80 8.25 1.01 14.29Bio_II3 80 Gluc: 17 15.49 7.51 1.84 3.56 24.44 3.09 41.11Bio_II4 80 Gluc: 17 15.81 7.46 0.83 2.95 11.19 2.31 31.05
Final productionStage 2Experiment II

Nitrate-Mediated Microbially Enhanced Oil Recovery (N-MEOR) from Model Upflow Bioreactors
111
Figure 1. Set of 6 up-flow sand-packed bioreactors subjected to CSBK medium flooding.

4th International Conference on Research Frontiers in Chalcogen Cycle Science & Technology
112
Figure 2. Oil production in low pressure bioreactors in experiments I (top) and II (bottom). The production of oil in PV is plotted against volume of produced fluids (PV) flooded through the column. Stage 2 incubation was for a period of
incubation for 14 days. The numbers in brackets are concentrations in mM. For molasses, this is mM of glucose equivalents.

Nitrate-Mediated Microbially Enhanced Oil Recovery (N-MEOR) from Model Upflow Bioreactors
113
Figure 3. Nitrate and nitrite concentration in the effluents coming from low pressure bioreactors in experiments II. The nitrate and nitrite concentrations are plotted against time in days

4th International Conference on Research Frontiers in Chalcogen Cycle Science & Technology
114
Figure 4. Emulsification index (E24, left scale) and surface tension (right scale) of effluents from low pressure bioreactors
Bio_II1 to Bio_II4. The effluents were collected immediately following stage 2 incubations.

115
Rogoznica Lake – an Extreme Seawater Environment Hosting Specific Sulfate-reducing
Bacterial Community Milan Čanković*, Ines Petrić and Irena Ciglenečki
Division for Marine and Environmental Research, Ruđer Bošković Institute, Bijenička cesta 54, 10 000 Zagreb *Corresponding author email: [email protected]
Abstract Rogoznica Lake is seasonally stratified and highly eutrophic seawater lake with hypoxic/anoxic layer usually occurring below the depth of 8 m. Due to high phytoplankton activity upper part of the water column is well oxygenated while remineralization processes enhance deposition of organic matter and nutrients in deeper layer where appearance of hypoxia/anoxia and microbially production of H2
Keywords: extreme marine environments, Rogoznica Lake, sulfate-reducing bacteria
S is confirmed. We investigated distribution, diversity and abundance of sulfate-reducing bacteria (SRB) during stratified summer and winter season, by targeting six major phylogenetic groups of SRB using specific 16S rRNA primer sets. Our results implied existence of distinct SRB populations in the water column and sediment. Rarefraction analysis revealed higher diversity of the SRB occupying water layer then the one found in sediments, independent of the sampling season. However, seasonal variations in diversity were observed in the water column and sediment. SRB community was more diverse in winter compared to summer season in water layer while, in opposite, sediment community evolved during summer was more diverse then the one found in winter. Water layer community seems to be more susceptible to changes of physico-chemical parameters, while those in sediment do not follow the same pattern having prorogated response to the changes in the Lake. Low homology of our sequences (as low as 85%) to the sequences in NCBI database further indicated that Rogoznica Lake harbor habitat-specific SRB populations that cannot be associated to known SRB but rather to uncultured bacteria found in extreme marine environments.
1. INTRODUCTION Rogoznica Lake, among local inhabitants known as Dragon’s Eye, is a seawater lake situated on the eastern Adriatic coast, 40 km south from Šibenik (Croatia), on the Gradina peninsula (43°32’N 15°58’E). The lake has a circular shape with an area of 10.276m2, maximum length of 143 m, and a maximum depth of 15 m. It is sheltered from the wind by 4–23 m high cliffs that prevent wind-shear mixing (Figure 1). Rogoznica Lake can be characterized as a typical extreme, euxinic environment [1]. The water column is seasonally stratified. Depth of mixolimnion changes seasonally and it is greatly influenced by meteorological conditions, i.e. temperature and rainfall. Vertical mixing usually occurs during winter when cold, oxygen-rich water from the surface sinks downwards [2].

4th International Conference on Research Frontiers in Chalcogen Cycle Science & Technology
116
Figure 1. Location, panoramic view (A) and vertical profile (B) of Rogoznica Lake
From winter to late summer, the less saline top layer is well oxygenated due to very high biological activity (O2
At the oxia-anoxia boundary usually develops the cca 50 cm thick pinky colored chemocline layer due to dense population of purple photoautotrophic sulfide-oxidizing bacteria from genus Chromatium (up to 4.3×10
saturation up to 300%). The more saline bottom layer is enriched with reduced sulfur species, mainly in the form of sulfide which appears there in very high concentration (up to 5 mM) [1-3].
8 cells mL-1 in July 1997) that store sulfur intracellularly and comprises up to 51% of total bacteria [4]. Anoxic deep water is characterized by iodine species (up to 1µM) [5] and nutrients (NH4
+, up to 150 µM; PO4
3-, up to 22 µM; SiO44-, up to 400 µM) [2], [6], as well as dissolved organic carbon (DOC up to 6 mgl-1
Although physico-chemical parameters of the lake are well characterized, little is known about the microbial communities of SRB as a main drivers of dissimilatory sulfate reduction process and their fundamental role in biogeochemical sulfur and carbon cycles, given that the eutrophication of the lake is strongly influenced by nutrient recycling under anaerobic conditions. Therefore the aim of this study was to get the deeper insight in distribution, diversity and abundance of SRB in the water layer and sediment of Rogoznica Lake.
), indicating the pronounced remineralization of allochthonous organic matter in this water layer, produced in the surface water [2], [6], [7]. Sediment is poorly sorted silt and clay silt characterized as authigenic carbonate sediment of mainly biogenic origin with relatively high sedimentation rate (0.093 g/cm3/year). Major mineral is calcite followed by aragonite, quartz, dolomite and pyrite [1].
2. MATERIALS AND METHODS
2.1. Sampling and Physico-chemical Parameters Measurements Water samples were taken in winter and sammer season of 2014, from anoxic (AN) *12 depth m, sampled in February and August 2014) and chemocline (CC) water layers (between 8-9 m depth, sampled in August 2014). Samples were collected by 5 L Niskin bottle, while the sediments were taken by gravity corer up to the 10 cm depth. Water samples were filtered through 0.22 µm MCE filters and sediment was sliced in surface (SURF) 0-5 cm, and lower (LOW) 5-10 cm sections and frozen till further analysis. Samples for reduced sulfur species (RSS) were analyzed immediately after sampling by electrochemical methods [3],[8]. In each sampling temperature (T), salinity (S), oxygen (O2
2.2. DNA Extraction
), pH and redox potential (Eh) were measured in-situ by a HQ40D multimeter probe (Hach Lange, Germany).
DNA from filters were extracted (in triplicates) according to a phenol/chloroform procedure [10], and stored at -20°C. Prior to extraction sediment samples were washed with three washing solutions containing Tris-HCl, EDTA and Triton X-100 in order to eliminate extracellular DNA and to enhance the possibility of PCR amplification (REF). Afterwards, DNA from the sediment samples (in triplicates) was extracted according to modified Aurora High Capacity protocol (http://www.borealgenomics.com). Briefly, up to 5 g of sediment was weigh out into 50 ml centrifuge tubes with addition of extraction buffer (Tris-HCl, disodium EDTA, sodium phosphate, all in 100 mM final concentration, 1.5 M NaCl and 1% CTAB) and 250 µl of 20 mg/ml proteinase K. Tubes were incubated at 37°C for 30 min., after which 10% SDS (final concentration) was added and incubated at 65°C for 2 h. After incubation tubes were centrifuged (10 min./6000 g). To the extracted supernatant an equal volume of 24:1 (v/v) chloroform:isoamyl alcohol was added, gently mixed and centrifuged (10 min./1500 x g). Top aqueous layer was taken out and 0.6 x V of isopropanol was added,

Rogoznica Lake – an extreme environment hosting specific sulfate-reducing bacterial community
117
gently mixed and incubated at room temperature for 1 h. After the centrifugation (30 min./6000 x g) supernatant was discarded and the pellet was washed with 70% ethanol and resuspended in EB buffer. Extracted DNA was additionally purified with PowerClean® DNA Clean-Up Kit (Mo Bio Laboratories, USA) according to manufacturer’s instructions. Quality and quantity of the extracted DNA were checked spectrofotometrically and on 1% agarose gel (wt/vol) in 10x TBE buffer stained with ethidium bromide.
2.3. PCR PCR primer sets for amplification of the 16S rRNA gene fragments, used in this study were previously designed by Daly et al., 2000 specifically targeting six different phylogenetic groups of SRB [11],. Namely, DFM140/824 (TA-58°C), DBB121/1237 (TA-66°C), DBM169/1006 (TA-64°C), DSB127/1273 (TA-60°C), DCC305/1165 (TA-65°C) and DSV230/838 (TA
Although additionally purified, DNA extracted from sediment still contained PCR inhibitors, as indicated by the brown color of the template. In order to circumvent this problem prior to using SRB-specific primers total bacterial 16S rRNA was amplified by using universal 27F/1492R primer set [12]. Afterwards, target groups were amplified by using as a template 2.5 µl of the 16S rRNA product.
-61°C) primer sets were used. PCR amplification was carried out as follows: 95°C for 1 min., annealing at appropriate temperature for 1 min. and 72°C for 1 min. for 40 cycles and additional extension at 72°C for 7 min. Reaction was carried out in total volumeof 25 µl containing: 1.88 µl of each primer (10 µM), 0.2 dNTP mix, 0.1 µl Taq polymerase, 2.5 µl 10x PCR buffer, 13.41 destilled water and 5 µl of DNA template (10 ng/ µl).
PCR products were visualized on 1% agarose gel (wt/vol) in 10x TBE buffer stained with ethidium bromide. Bands of the correct size were excised from the gel and purified using GenElute™ Gel Extraction Kit (Sigma-Aldrich, USA) according to manufacturer’s instructions.
2.4. Cloning and Sequencing For phylogenetic studies PCR products purified from the gels were pooled and cloned using the pGEM®
2.5. Quantitative PCR (qPCR)
-T Vector System (Promega, France) according to manufacturer’s instructions. In total, 192 positive clones were sent for commercial Sanger sequencing (Macrogen, the Netherlands). Retrieved sequences were edited and checked manually, the closest relatives were identified by BLAST software in the NCBI database. The threshold of 97% similarity was used to define an operational taxonomic unit (OTU). Phylogenetic trees were constructed with ClustalX (v. 1.8). Rooted tree was built using the neighbor-joining method. The robustness of individual branches was estimated by bootstrapping based on 1000 replications. Additionally, to compare sampling completeness and richness between different samples and seasons rarefraction analysis was conducted with the Analytic Rarefaction software (http://www.uga.edu/strata/software/).
qPCR was used to determine the abundance of total bacteria community and phylogenetic groups of SRB. qPCR assays were conducted on ABI 7900 HT Real Time PCR System (Applied Biosystems, USA) in 20 µl final volume containing 10 µl SYBR green PCR Master Mix (Absolute QPCR SYBR Green Rox Abgene, France), 2 µl (10 mM) of each primer and 2 ng of template DNA. For each 16S rRNA target, a standard curve was established using serial dilutions of linearized plasmid (102 to 108
3. RESULTS
copies) containing gene of interest (bacterial 16S rRNA or 16S rRNA of SRB groups). No-template controls (NTC, n = 2) were also included in all the assays. For the SRB groups specific primers earlier mentioned were used while total bacterial community was assessed by 341f-534r primer set [13]. Samples were run in triplicates. Cycling conditions for DSV subgroup amplification were as follows: 15 min. at 95°C; 35 cycles of 15 s at 95°C, 30 s at 61°C, 30 s at 72 °C. Cycling conditions for DCC subgroup amplification were as follows: 15 min. at 95°C; 35 cycles of 15 s at 95°C, 30 s at 65°C, 30 s at 72 °C. Melting curves were generated after amplification in order to check the specificity of the assays.
3.1. Physico-chemical Conditions in Rogoznica Lake The vertical profiles of temperature, salinity and oxygen (Figure 2) clearly show stratified water column with well mixed upper oxygenated layer above 6 m in both seasons, and more saline and denser bottom layer. During both seasons CC layer was between 8-9 m, under which anoxic conditions were established.

4th International Conference on Research Frontiers in Chalcogen Cycle Science & Technology
118
Figure 2. Vertical profiles of temperature, salinity and oxygen in Rogoznica Lake measured during winter season 2014. (A) and summer season 2014 (B)
Bottom layer was enriched in RSS, mainly in the form of sulfide. During summer it reached concentration of 1.3 and 0.35 mM in AN and CC layers, respectively. In winter concentration of sulfide was 0.8 mM in AN layer.
3.2. Presence of Phylogenetically Different SRB Subgroups in Samples ‘Direct’ PCR amplification was attempted with the primers specific for each of the six SRB groups. Desulfotomaculum-like group (DFM), Desulfobulbus-like group (DBB), Desulfobacterium-like group (DBM) and Desulfobacter-like group were not detected in any sample during both seasons. In both, water and sediment samples only two SRB groups were successfully detected corresponding to Desulfococcus-Desulfonema-Desulfosarcina-like and Desulfovibrio-Desulfomicrobium-like group as shown in the Table 1.
Table 1. PCR detection of 6 phylogenetically different SRB subgroups in winter and summer season samples by targeting 16SrRNA gene fragment. Winter 2014. Summer 2014.
Target gene
Group name Predicted target group Water
(12m) Sedim. (0-5 cm)
Sedim. (5-10 cm)
Water (8-9 m)
Water (12m)
Sedim. (0-5 cm)
Sedim. (5-10 cm)
16S rRNA DFM Desulfotomaculum - - - - - - -
16S rRNA DBB Desulfobulbus - - - - - - -
16S rRNA DBM Desulfobacterium - - - - - - -
16S rRNA DSB Desulfobacter - - - - - - -
16S rRNA DCC
Desulfonema / Desulfococcus / Desulfosarcina
+ + + - - + +
A
0 10 20 30 40
De
pth
(m
)
0
2
4
6
8
10
12
14
Temperature (°C)Salinity Oxygen (mg/l)
B
0 10 20 30 40
De
pth
(m
)
0
2
4
6
8
10
12
14
Temperature (°C)Salinity Oxygen (mg/l)

Rogoznica Lake – an extreme environment hosting specific sulfate-reducing bacterial community
119
16S rRNA DSV Desulfovibrio /
Desulfomicrobium + - - + + - -
‘’+’’ detected; ‘’-‘’ undetected
2.3. Diversity and Phylogenetic Affiliation of SRB populations
Pseudomonas aeruginosa strain DSM 50071T Uncultured bacterium 014-12FFSCA001-A1B1 stratified seawater lakeSynechococcus sp. RCC36Uncultured bacterium J608-77
Synechococcus sp._RS9918Synechococcus sp. RS9918
943Uncultured Synechococcus_A82
845
Desulfacter sp.Uncultured bacterium clone MD2894-B23Uncultured Desulfuromonadales bacterium clone B154DSV 74954 δ-Proteobacterium FM3-F10
Desulfomicrobium sp. PR4_C11Desulfomicrobium baculatum DSM 4028Desulfomicrobium baculatumDesulfomicrobium baculatum HAQ-8
DSV KK2 1
1000
DSV AN32DSV KK2DSV KK3DSV KK16DSV KK19DSV KK20DSV AN35DSV AN38
DSV AN33Uncultured SRB 2R2V02
Desulfovibrio salexigens DSM 2638Uncultured clone CO1SHNF695Desulfovibrio sp. An30N-mmDSV 77DSV 86DSV 76Desulfovibrio hydrothermalis AM13DSV 90
DSV 96932
1000
Uncultured δ -Proteobacterium_SGTA698Uncultured bacterium JML C01Uncultured δ-Proteobacterium YS-UMF1 C131SRB NaphS3
DSV 82DSV 89566
DSV 91282
Uncultured δ-Proteobacteria PET-124Uncultured Desulfobacteraceae ZLL-D59DSV 79
448
DSV 85DSV 93
639
1000DSV 87
861
Clostridiales bacterium r28Clostridium sp BA-1DSV AN29DSV AN48 1DSV AN31
1000
Thermodesulfovibrio yellowstoniiVerrucomicrobia bacterium Sylt 22DSV 94
998
1000
769DSV 81DSV AN25DSV AN43
DSV AN47DSV AN41DSV AN44DSV KK5998
DSV KK6DSV KK15Uncultured division WS3 anoxic fjord Sweden
Uncultured WS3 bacterium clone BFB005DSV KK11DSV KK17DSV AN30DSV AN45DSV AN37DSV AN40DSV KK4DSV KK14
DSV AN42911
Uncultured δ –Proteobacterium MothraB6-68Planctomycete OGT B4 14 hadopelagic sedimentsUncultured_planctomycete_clone_OGT_B4_14
Uncultured organism SBZO 1841 Guerrero Negro hypersalineUncultured bacterium Ld1 55 Nort Yellow sea sedimentsDSV 88
649
Uncultured bacterium methane seep Tainan RidgeUncultured bacterium C9001C B156 C041Uncultured bacterium PM-150-Bact-09
885
Uncultured bacterium p763 b 4 41DSV AN28999
48
389 DSV AN39DSV KK10DSV AN34DSV AN48DSV AN46DSV KK24DSV AN27
DSV AN34DSV AN26DSV AN36DSV KK7DSV KK13
DSV KK23DSV KK9
111
818
542
106
1000
427
333
437
994
529
238
390
148
995
364
502
DSV 78DSV KK21DSV KK22
DSV 75DSV 84DSV 95 Synecococcus sp KORDI-15Uncultured bacterium clone SPHAL 52DSV KK8
DSV KK12DSV 73DSV 92
945
DSV 80
1000
993
1000
1000
1000
1000
0.1
Synechococcus -related
Summer Cluster 1Uncultured δ-Proteobacterium
WinterCluster 1Uncultured δ-Proteobacteria
Summer Sub-cluster 1aClostridium-related
WinterCluster 2Desulfovibrio-related
SummerCluster 2Desulfomicrobium baculatum
Winter Cluster 3Desulfomonadales-related
Winter Sub-cluster Verrucomicrobia-related
δ-ProteobacteriaDesulfovibrionales
δ-ProteobacteriaDesulfomonadales
Uncultured environmentalδ-Proteobacteria
Uncultured environmentalδ-ProteobacteriaDesulfobacterales
Uncultured environmentalFirmicutes
Verrucomicrobium group
DSV winter AN water layerDSV summer CC water layerDSV summer AN water layer
OTU1
OTU2
OTU3
OTU4
OTU5
OTU6
CC layer -summer
OTU1
OTU2
OTU3
OTU4
OTU5
OTU6
OTU7
AN layer - summerOTU1
OTU2
OTU3
OTU4
OTU5
OTU6
OTU7
OTU8
OTU9
AN layer - winter
Figure 3. Diversity and phylogenetic tree constructed by N-J method of DSV subgroup detected in AN (12 m) and CC (8-9 m) layer in winter and summer season. Pies are representing share of total OTUs based on 97% cutoff value.
Sequence analysis of the DSV clone libraries obtained from the water layer sample suggested high diversity of the DSV subgroups (Figure 3.). Retrieved sequences belonged to three major polygenetic groups (i.e. δ-Proteobacteria, Verrucomicrobium group and Firmicutes). Season specific clustering was likewise observed. Sequences from AN layer in winter season grouped in 10 OTUs (each with up to 3 representatives), majority of which was uncultured δ-Proteobacteria (90-91% homology), followed by Desulfovibrionales-related group (91-96% homology) and Desufomonadales- and Verrucomicrobium-related group (91% homology). Lower diversity of the clone libraries was found during summer season represented by 6 and 7 OTUs in CC and AN layer, respectively. Majority of sequences in CC layer was related to uncultured environmental δ-Proteobacteria (94-97% homology), followed by Desulfovibrionales-related group (91-96% homology). In AN layer dominant OTU was similar to CC layer with dominant sequences belonging to uncultured environmental δ-Proteobacteria (94-95% homology), followed by Desulfovibrionales-related group (85% homology), with exception of OTU related to Firmicutes (Clostridium)-related group (96% homology). Synecoccocus (Cyanobacteria)-related group was also detected by this primer pair (90-99% homology). DCC SRB subgroup was detected only in AN water layer in winter seasons. This subgroup evolved during winter season showed sequences grouping in 10 OTUs. All of retrieved sequences were related to uncultured δ-Proteobacteria, Desulfosarcina- related (Desulfobacterales), showing homology of 92-98%. Sequence analysis showed that sediment samples clearly differentiated from water samples. In sediment samples only DCC subgroups were detected. Retrieved clone sequences, diversity and phylogenetic affiliation of SURF and LOW winter sediment samples are shown in Figure 4.

4th International Conference on Research Frontiers in Chalcogen Cycle Science & Technology
120
Figure 4. Diversity and phylogenetic tree constructed by N-J method of DCC subgroup detected in SURF (0-5 cm) and
LOW (5-10 cm) winter sediment layer. Pies are representing share of total OTUs based on 97% cutoff value. Phylogenetic affiliations of DCC 16SrRNA clone libraries of the sediment microbial community found in the winter season is relatively clearly layering between SURF and LOW samples. Diversity is quite lower than the one found in the water samples, with sequences gouping in only 3 OTUs at each depth. Half of the SURF (0-5 cm) samples sequnces (OTU3) were Desulfosarcina (Desulfobacterales)-related group (97-99% homology) while the rest (OUT1 and 2) corresponded to uncultured environmental δ-Proteobacteria (97-98% homology to uncultured sea-sediment bacteria). SRB community found in LOW (5-10 cm) samples comprised more than 83% (OTU1 and 2) sequences related to uncultured environmental δ-Proteobacteria (98-99% homology to uncultured sea-sediment bacteria), while the rest of the sequences were Desulfosarcina (Desulfobacterales)-related group (99% homology) (OTU3). Analysis of summer sediment samples also showed that only DCC subgroups were present. However, in this season no clear layering between SURF and LOW samples was seen. Based on the observed clustering it is visible that the diversity of SRB communities was generally higher in summer season compared to winter samples, with majority of sequences being correlated to the uncultured environmental δ-Proteobacteria. SURF (0-5 cm) sequences grouped in 4 OTUs, while those from LOW (5-10 cm) samples grouped in 7 OTUs. All clones from SURF samples were related to uncultured environmental δ-Proteobacteria (98-99% homology to uncultured sea-sediment bacteria). Majority of LOW sample clones were related to uncultured environmental Desulfobacteriaceae (98-99% homology), followed by uncultured environmental δ-Proteobacteria (97-98% homology to uncultured sea-sediment bacteria) and uncharacterized marine bacterium and Desulfosarcina (Desulfobacterales)-related group (98% homology).
3.3. Abundance of the Detected SRB Subgroups Quantification of 16S rRNA target gene by using primer sets specific DCC and DSV SRB subgroups allowed us to determine abundances of these populations in total microbial community.

Rogoznica Lake – an extreme environment hosting specific sulfate-reducing bacterial community
121
3.4. Abundance of SRB in Water Column Gene copy number of the total bacterial 16S RNA and 16S rRNA of the DVS and DCC SRB subgroups is shown in Figure 5. As visible total bacteria were more abundant in water layer during the winter season (average 9.53 x 10⁶ gene copy number/ng DNA), while in summer their abundances reached average of 6.56 x 10⁵ and 7.38 x 10⁵
gene copy number/ng DNA in CC and AN layer, respectively.
Figure 5.Copy number of total bacterial 16S rRNA and 16S rRNA of detected SRB subgroups (DSV and DCC) in water layer sampled during winter and summer seasons:CC = chemocline layer (8-9 m); AN = anoxic layer (12 m).
DSV and DCC SRB populations were shown to be represented in small percentage in the total bacterial community. In winter season they accounted only 0.2 and 2.3% (DSV and DCC, respectively) of the total community in AN layer. During the summer season DSV subgroups, comprised 0.5% and 1.9% in AN layer and 0.3% and 1.7% (for DSV and DCC, respectively) in CC layer.
3.5. Abundance of SRB in Sediment Abundances of the 16S rRNA targeted gene in total bacteria and in DCC SRB population are shown in Figure 6. As visible total bacterial abundance varied only slightly between the seasons (5.03 x 10⁵ to 3.39 x 10⁵
gene copy number/ng DNA in winter SURF and summer LOW, respectively). DCC subgroup was comprised from 1.9% up to 5.2% of total 16S rRNA in summer LOW and summer SURF layer, respectively.
Figure 6. Copy number of total bacterial 16S rRNA and 16S rRNA of DCC SRB subgroup in sediment sampled during winter and summer season: SURF = surface 0-5 cm sediment; LOW = lower 5-10 cm sediment
3.6. Rarefaction Analysis Rarefraction analysis was conducted for all samples with results presented in Figure 7.

4th International Conference on Research Frontiers in Chalcogen Cycle Science & Technology
122
Figure 7. Rarefraction analysis conducted with the Analytic Rarefaction software (http://www.uga.edu/strata/software/).
From the rarefaction curves obtained, only those from winter AN layer did not reached an assymptote, indicating that the diversity of theese SRB communities was not fully recovered by the sampling effort. Curves showed that the relative richness was different in different sampling sesasons as well as from the samples collected from various water (AN and CC) and sediment (SURF and LOW) layers.
4. DISCUSSION By using 16S rRNA as a molecular marker we aimed to characterize SRB bacterial community in Rogoznica Lake being a main driver of the sulfate reduction process in this seawater ecosystem. PCR-results suggested presence of two subgroups of SRB, DSV and DCC, implying that bacteria closely related to Desulfonema/Desulfococcus/Desulfosarcina-group and Desulfovibrio/Desulfomicrobium-group represent SRB community of the lake . However, phylogenetic analyses revealed that SRB community existing in anoxic water layer as well as in anoxic sediment is rather unique and that majority of the sequences did not match well (85-98% homology) with known SRB bacteria but rather showed homology to the uncultured bacteria of the δ-Proteobacteria phyla, found in different marine and polluted environments. This was confirmed by the qPCR analysis showing that by using these target genes we were able to characterize only a small fraction of the total SRB community therefore further analysis are required based on some other, most likely functional dsrAB gene, which would give more accurate estimation of the abundance of this community in Rogoznica Lake. 16S rRNA clone libraries revealed clear differences in the structure of the SRB communities across vertical profile of the Lake, from CC water layer to deeper sediment with almost complete shift in the composition of SRB assemblages between water and sediment layers. Several bacterial populations seemed to apear in the targeted community in correlation with the sampling season. Two SRB populations, clustering with Desulfomicrobium baculatum (Desulfovibrionales) (in CC and AN samples) and Clostridium (Firmicutes) (in AN layer) were found exclusively in water layer during summer sampling. During colder winter season members of Desulfomonadales, Desulfovibrionales, Desulfobacterales and Verrucomicrobium groups appeared in the AN water layer. Likewise, SRB population related to Desulfosarcina genera were detected only during winter in the AN layer. These organisms are known to oxidize a diverse range of organic compounds including acetate and other short-chain fatty acids to CO2. Sequences from this group have also been recovered from other marine and freshwater environments [16-18]. Desulfovibrionales and Verrucomucrobium bacteria are also known to oxidize simple molecules such as lactate, pyruvate, malate to CO2
0
2
4
6
8
10
12
0 5 10 15 20 25
Number of OTUs group members
Num
ber o
f OTU
● DSV anoxic water layer summer□ DSV chemocline water layer summer
Δ DSV anoxic water layer winterΧ DCC anoxic water layer winter
● DCC 0-5 cm sediment winterж DCC 5-10 cm sediment winter▄ DCC 0-5 cm sediment summer▲ DCC 5-10 cm sediment summerr
. Rarefraction analysis further confirmed differeneces between water layers and sediment. We observed that SRB community occupying water layer maintained higher diversity throughout the year when compared to the one found in sediments. In addition, in summer water layer, in the conditions of higher hydrogen sulfide concentrations, temperature and total organic carbon values (data not shown), SRB community was less diverse then in the winter water layer probably due to community enrichment by highly adapted sub-population of SRB. Population dynamics observed for the sediments, where diversity was higher during summer season, could not be explained in the same manner indicating that the processes in the sediment, known to be slower and less susceptible to variation of physico-chemical and biological conditions, do not follow the same pattern having prorogated response to the same changes in the

Rogoznica Lake – an extreme environment hosting specific sulfate-reducing bacterial community
123
water column of the Lake. It has been seen previously that extremely variable S, T, concentration of nutrients, mixing, redox and euxinic conditions can highly influence phytoplankton and zooplankton community structure in the upper layers of Rogoznica lake [14]. Likewise, study on bacterial community occupying this oxigenated layer suggested that its structure can be strongly affected by changes in phyciso-chemical parameters in the lake [15]. This community shifted from anoxygenic phototrophic sulfur bacteria populations to gammaproteobacterial sulfur oxidizers as a result of water layer mixing followed by anoxic holomictic event. Although it is known that lower layer of the lake is less susceptible to changes in physico-chemical parameters, confirmed by the measurements during the investigated seasons (T, S and pH varried only slighty in the anoxic layer of the lake), we cannot completely exclude them as being responsible for the observed shifts in the SRB community structure. It is more likely, that dynamics of the phytoplankton community during the year would affect community in deeper layers of the lake. Different composition of organic matter, supplied from this oxygenated upper layer, could be coupled to the changes in the SRB community structure. Simple organic molecules are presumably oxydized above and in the CC and AN layers, while the more complex and refractory fraction probably exists in the prebottom and sediment [1],9], where it could be oxydized by different SRB.
5. CONCLUSION This study explored for the first time specific anoxic SRB community in Rogoznica lake. Results gave new insight on the diversity, abundance and phylogeny of SRB. Althouh such extreme enviroments were once considered as ‘’dead zones’’, from the microbiologically point of view, our results suggested that this ecosystem represent quite vivid area. Results clearly showed distinct seasonal variations in diversity and abundance of SRB communities residing in the water column as well as in the sediment. Low sequence homology to cultured SRB indicated presence of specific SRB community in the lake even on high taxonomical level of phylum. Although small and isolated, seawater system of Rogoznica Lake represents higly productive ecosystem. Therefore, data presented here show a complex SRB distribution and diversity supporting the idea that habitat-specific SRB communities contribute to the anaerobic degradation of organic matter in the Lake as well as the cycling of sulfur and carbon species.
ACKNOWLEDGEMENTS
This study was supported by IP-11-2013-1205 project, funded by Croatian Science Foundation.
REFERENCES [1] Ciglenečki I, Pichler S, Prohić E, Ćosović B. Distribution of redox-sensitive elements in bottom waters, porewaters and
sediments of Rogoznica Lake (Croatia) in both oxic and anoxic conditions. Water Air Soil Poll 2006; 6:537-545. [2] Ciglenečki I, Carić M, Kršinić F, Viličić D, Ćosović B. The extinction by sulfide-turnover and recovery of a naturally
eutrophic, meromictic seawater lake. Journal of Marine Systems 2005; 56:29-44. [3] Bura-Nakić E, Helz GR, Ciglenečki I, Ćosović B. Reduced sulfur species in a stratified seawater lake (Rogoznica Lake,
Croatia); seasonal variations and argument for organic carriers of reactive sulfur. Geochimica et Cosmochimica Acta 2009; 73:3738-3751.
[4] Ciglenečki I, Kodba Z, Viličić D, Ćosović B. 1998. Seasonal variation of anoxic conditions in the Rogoznica Lake. Croat. Chem. Acta 1998; 71:217-232.
[5] Stipaničev V, Branica M. Iodine speciation in the water column of the Rogoznica Lake (Eastern Adriatic Coast). Science of the Total Environment 1996; 182:1 – 9.
[6] Kršinić F, Carić M, Viličić D, Ciglenečki I.The calanoid copepod, Acartia italica Steuer, phenomenon in the small saline Lake Rogoznica (Eastern Adriatic coast). J. Plankton. Res. 2000; 22:1441-1464.
[7] Ćosović B, Ciglenečki I, Viličić D, Ahel M. Distribution and seasonal variability of organic matter in a small eutrophicated salt lake. Estuarine Coastal and Shelf Science 2000; 51:705–715.
[8] Ciglenečki I, Ćosović B. Electrochemical determination of thiosulfate in seawater in the presence of elemental sulfur and sulfide. Electroanalysis 1997; 9:1-7.
[9] Penezić A, Gašparović B, Burić Z, Frka S. Distribution of marine lipid classes in salty Rogoznica Lake (Croatia). Estuar. Coas. Shelf S. 210; 86:625-636.
[10] Massana R, Murray AE, Preston CM, DeLong EF. Vertical Distribution and Phylogenetic Characterization of Marine Planktonic Archaea in the Santa Barbara Channel. Appl. Environ. Microbiol. 1997; 63:50-56.
[11] Daly K, Sharp RJ, McCarthy AJ. Development of oligonucleotide probes and PCR primers for detecting phylogenetic subgroups of sulfate-reducing bacteria. Microbiology 2000; 146:1693-1705
[12] Lane DJ. 16S/23S rRNA Sequencing. Nucleic Acid Techniques in Bacterial Systematic. Unichester, UK; 1991 [13] Henry S, Baudoin E, Lopez-Gutierrez JC, Martin-Laurent F, Baumann A, Philippot L. Quantification of denitrifying
bacteria in soils by nirK gene targeted real-time PCR. J Microbiol. Meth. 2004; 59:327–335 [14] Ciglenečki I, Janeković I, Marguš M, Bura-nakić E, Carić M, Ljubešić Z, Batisić M, Hrustić E., Dupčić I, Garić R.
Impacts of extreme weather events on highly eutrophic marine ecosystem (Rogoznica Lake, Adriatic coast), Cont. Shelf Res.; 2015 (under review).
[15] Pjevac P, Korlević M, Berg JS, Bura-Nakić E, Ciglenečki I, Amann R, Orlić S. Community shift from phototrophic to chemotrophic sulfide oxidation following anoxic holomixis in a stratified seawater lake. Appl. Environ. Microbiol. 2014; doi:10.1128/AEM.02435-14
[16] Bahr M, Crump BC, Klepac-Ceraj V, Teske A, Sogin L, Hobbie. Molecular characterization of sulfate- reducing bacteria in a New England salt marsh. Environ Microbiol. 2005; 7:1175–1185

4th International Conference on Research Frontiers in Chalcogen Cycle Science & Technology
124
[17] Kondo R, Nedwell DB, Purdy KJ, Silva SDQ. Detection and enumeration of sulphate-reducing bacteria in estuarine sediments by competitive PCR. Geomicrobiol J. 2004; 21:145–157
[18] Thomsen TR, Finster K, Ramsing NB. Biogeochemical and molecular signatures of anaerobic methane oxidation in a marine sediment. Appl Environ Microbiol. 2001; 67:1646–1656.

125
Sulphate Reduction by Marine Sediment Hosting Anaerobic Oxidation of Methane from Gulf of
Cadiz and Marine Lake Grevelingen Susma Bhattarai1*, Zita Naangmenyele11, Chiara Cassarini1Graciela Gonzalez-Gill
, 1, Eldon R. Rene1 and Piet N.L. Lens
1
1
*Corresponding author email: UNESCO-IHE Institute for Water Education, Westvest 7, 2611 AX Delft, the Netherlands
Abstract Sulphate reducing anaerobic oxidation of methane (AOM) is an important biochemical process performed by consortia of anaerobic methanotrophic archaea (ANME) and sulphate reducing bacteria (SRB). This naturally occurring phenomenon has a potential application in the biotechnology for treating sulphate containing water by using cheap e-donors like methane. The knowledge on AOM-SR is still hampered by slow growing nature of ANME and lack of culture for both ANME and SRBs. Therefore, the main objective of this research is to assess the sulphate reduction activity and microbial community in marine sediments which are known for the occurrence of AOM by using different sulphate reducing substrates. The sediment from two independent sites, namely; Ginsburg Mud volcano, Gulf of Cadiz (water depth 900m, referred as GC) and shallow Marine Lake Grevelingen (water depth 45 m, referred as GV) was used as inocula. This research for the first time checked the sulphate reduction and involved microbes from these AOM active sites. The result showed that amongst the different electron donors, ethanol recorded the highest cumulative sulphide production in case of both sediments. However, the deeper sediment from GC showed lower sulphide production and simultaneously sulphate reduction for acetate and lactate with ~ 2mM of sulphide production.
Keywords: Anaerobic oxidation of methane, sulphate reduction, electron donors, sulphate reducing bacteria
1. INTRODUCTION The anaerobic oxidation of methane (AOM) occurs when sulphate (SO4
2-) from the seawater being transported downwards in the sediment layers meets either biogenic or thermogenic methane (CH4
1) in the
presence of specific group of microbes anaerobic methanotrophs (ANME) [ , 2]. The AOM coupled to sulphate reduction (AOM-SR) phenomenon has two important significances, one is to balance the methane in the atmosphere, which is a major greenhouse gas and another is the potential application in biotechnology. AOM-SR has a high applicability in the wastewater industry. Despite of the advancement in biotechnology, still sulphate removal from wastewaters is cost-demanding process, which is mainly performed with expensive electron donors like hydrogen [3]. The involvement of methane for sulphate removal, which can be produced by anaerobic digestion of waste, could be one of the appealing cost-effective techniques for sulphate removal in the near future. However, the process is still not well understood, because the microbes involved in this process have not yet been isolated, and the ANME involved are very slow growing archaea (1-7 months doubling time), framing them as the major challenges for AOM-SR application.
For biotechnological application, it is necessary to enrich ANME and SRB involved in sulphate reducing AOM and understand the mechanism and interspecies electron transfer among ANME and SRB, which is still unclear. Acetate, ethanol and lactate have been shown to be good substrates for SRB, with the much higher Gibbs free energy compared to AOM-SR (Table 1). Probably, the sulphate reducers and ANME involved in AOM-SR are capable of growing on sulphate reducing and methanogenic substrates like acetate, lactate or ethanol. If this happens, SRB and ANME could be enriched on these alternative substrates.
It has been reported that sulphate reduction with hydrogen, formate, acetate, methanol and some of other methanogenic substrate was lower than SR coupled with CH4 4 when tested in the AOM active slurry [ ], however, still needed to be checked whether these specific group of SRBs are capable to use other substrate or not. There are several speculation about the mode of inter- specific e-transfer between ANME and SRBs. Some of the researches have suggested methanogenic substrate such as hydrogen, formate and acetate could

4th International Conference on Research Frontiers in Chalcogen Cycle Science & Technology
126
be possible intermediates, however extracellular deposit of such compounds has not evident yet [4, 5]. In the recent past, there were upcoming ideas about the possible utilization of carbon dioxide as a carbon source by AOM community, still challenge the carbon puzzle and preferable e-donors for the ANME and associated SRBs [6, 7]. Hence, the main objective of this research is to check the SR by using different e-donors preferred by sulphate reducer and check the microbial community which is enriched by using potential AOM occurrence inocula.
Table 1. Reactions and Gibbs free energy changes for acetate, ethanol and lactated in anaerobic sulphate reduction
e-donor Reaction ΔG (kJmlo-1) Methane CH4 + SO4
2− → HCO3− + HS− + H20 -16
Lactate 2lactate + SO42− → 2acetate + 2HCO3
− + HS− + H+
2lactate + 3SO42− → 6HCO3
− + 3HS− + H+
3lactate → acetate + 2propionate+HCO3− + H+ + H+
-160.1
-225.3
-169.7
Acetate
CH3COO− + SO42− → HS− + 2HCO3
− -47
Ethanol
1.3CH3CH2OH + SO42− → 1.3CH3COO− + H2S + 1.3H2O -121
2. MATERIALS AND METHODS
2.1. Inocula Biomass was obtained from deep sea Gulf of Cadiz, (~900 m water depth, here referred as GC) which is a known site for AOM and Marine Lake Grevelingen, North Sea (45 m water depth, here referred as GV). The Gulf of Cadiz, cold seep environment is a well-known site for AOM studies due to its complex tectonic activities with mud volcanoes and methane seep [8]. Moreover, Marine Lake Grevelingen is a former estuary with a water depth of ~ 45 m and salinity of 31 g/kg, which is separated from the North Sea by a dam. High rates of deposition and degradation of organic matter have resulted in methane rich anoxic sediments which combined with sulphate from sea water renders the site a potential niche for AOM.
2.2. Experimental Design Grevelingen sediment (GV) and Gulf of Cadiz sediment (GC) were, homogenized in anaerobic globe box and diluted with artificial seawater medium in a 1:3 ratio. The seawater medium was prepared by a standard protocol used before for the enrichment of these microorganisms [11] with 10 mM of sulphate and 5 mM of respective e-donors (acetate, lactate and ethanol). Then aliquots of the slurry were added to 250 mL sterile serum bottles with a gas-liquid ratio of 1:3. The headspace was filled with N2
2.3. Analysis
. Triplicates bottles were incubated in dark with gentle shaking for 2 months. Control incubations were performed without e-donors (triplicates), with killed biomass (duplicates) and without biomass (duplicates) to check the biotic and abiotic interaction. About 2 ml of slurry was obtained from each bottle in every three days for sulphate and sulphide analysis. The samples for microbial analysis and VSS analysis were obtained at the end of incubation.
The pH was measured using a pH indicator paper. Sulphide was analyzed using the methylene blue method immediately after sampling [9]. One volume of sample (0.5 ml) was dilute to one volume of 1 M NaOH to raise the pH there by preventing the volatilization of sulphide. The amount of sulphide measured accounted for all cumulative dissolved sulphide species (H2S, HS- and S2-). Sulphate was analyzed using Ion Chromatograph system (Dionex-ICS-1000 with AS-DV sampler) with a column (IonPac AS14n) at a flow rate of 0.5mL/min with an 8 mM Na2CO3/1 mM NaHCO3
Microbial samples were analysed by using flourescence in situ hybridization method (FISH). All microbial cells were visualised by DAPI staining. Archaeal and bacterial specific oligonucleotide probes ARCH915 [
eluent, a temperature of 35 °C, a current of 35 mA, an injection volume of 10 µL and a retention time of 8 min. The VSS was estimated on the basis of difference between dry weight (TSS) and ash weight of the settled slurry from the bottom of the bottles by using the standard methods (American Public Health Association, 1995).
10] and EUB I-III [11] were used respectively to check the occurrence of archaeal and bacterial cells. Desulfosarcinales (DSS) and Desulfobulbaceae (DBB), the sulphate reducing δ-proteobacteria were visualised by using DSS 658 [12] and DBB 660 [13] probes respectively.

Sulphate Reduction by Marine Sediment Hosting Anaerobic Oxidation of Methane From Gulf of Cadiz and Marine Lake Grevelingen
127
3. RESULTS
3.1. Sulphate reduction and sulphide production by GC The range of pH was 7.5 to 8 during the incubation. The incubations of GC sediment with acetate, ethanol and lactate generally showed a decrease in sulphate concentrations, from an average of 12.70 ± 0.3 mM to 8.95 ± 2.4 mM during 42 days of incubation (Figure 1A). Acetate, ethanol and lactate, showed sulphate removals of 2.21 mM, 6.21 mM and 2.87 mM in 42 days, respectively. Figure 1B shows the sulphide production profiles among the three different electron donors with GC sediment. Among the incubations with three e-donors acetate and lactate showed similar trend of increase in sulphide concentrations, but ethanol reached the highest sulphide concentration, 3.92 mM (day 42), which is ~3 times higher compared to acetate (1.6 mM) and lactate (1.21 mM), respectively. Further, ethanol showed the highest rate of sulphate removal (0.343 mM/d), simultaneously the highest rate of sulphide production (0.338 mM/d) among three e-donors (Table 1). However acetate was lowest performer for the sulphate reduction for the microbes of GC.
A
B
Figure 1. A. Total dissolved sulphate reduction B. Total dissolved sulphide production among the experiment with acetate, ethanol and lactate by GC sediment
3.2. Sulphate reduction and sulphide production by GV The pH during at the beginning of the experiment was ~ 7.5 which increase up to 8 towards the end. As shown in Figure 2A, the sulphate concentration profiles showed a similar trend of decrease for all the three electron donors, amongst which lactate showed the least sulphate concentration in the case of GV sediment. There was an abrupt decrease in sulphate concentration (6.07 mM) during lactate experiments, while in the case of ethanol and acetate experiment; a gradual decline in the sulphate concentrations was observed. Sulphide concentrations amongst the three substrates (acetate, ethanol and lactate) using GV sediment (Figure 2B) showed an increasing and stable trend during the time of incubation. Lactate showed the highest sulphide concentration of 5.40 mM (day 31) compared to acetate and ethanol, 4.47 mM and 3.60 mM, respectively. There was a steep increase in sulphide concentrations for all three e-donors experiment for GV sediment from 4 to 10 days of incubation. Sulphate removal by GV inocula with all three e-donor was almost similar at the end of the experiment, however with the maximum rate achieved by ethanol (Table 1).
A
B
Figure 2. A. Total dissolved sulphate reduction B. Total dissolved sulphide production among the experiment with acetate, ethanol and lactate by GV sediment
0
4
8
12
16
0 10 20 30 40 50
Tota
l dis
solv
ed Su
lpha
te [m
M]
Days
Acetate Ethanol Lactate
0
1
2
3
4
5
0 10 20 30 40 50
Tota
l dis
solv
ed Su
lphi
de [m
M]
Days
Acetate Ethanol
Lactate
0
4
8
12
16
0 10 20 30 40
Tota
l dis
solv
ed Su
lpha
te [m
M]
Days
Acetate Ethanol Lactate
0
2
4
6
0 10 20 30 40
Tota
l dis
solv
ed su
lphi
de[m
M]
Days
Acetate Ethanol Lactate

4th International Conference on Research Frontiers in Chalcogen Cycle Science & Technology
128
Table 2. Volumetric and specific rates of sulphate removal and sulphide production for GC and GV incubations with different e-donors
Incubation type
Volumetric rate (mM
SO42- day-1
Specific rate
) (µM SO4
2-
1day-1 gVSS-1
Volumetric rate (mM S
)
2- day-1
Specific rate
) (µM S2-
1day- gVSS-1
SO
)
4
removed
2-
(mM)
%SO4
removed
2-
Acetate+sulphate, GC 0.075 8.10 0.018 1.90 2.21 18 Ethanol+sulphate, GC 0.343 36.80 0.338 36.30 6.21 50 Lactate+sulphate, GC 0.234 25.10 0.163 17.5 2.87 24 Acetate+sulphate, GV 0.319 21.99 0.372 18.87 3.63 30 Ethanol+sulphate, GV 0.745 44.06 0.641 37.91 4.56 39 Lactate+sulphate, GV 0.393 23.24 0.326 19.28 4.74 42
3.3. Microbial community Microbial community analysis was performed by FISH for both GV and GC sediment for the ethanol incubation which appeared to have the higher sulphate reduction among three e-donor used. Clear image was not observed for the GC sediment due to interference with particles, however GV showed the presence of some archaeal cells and Desulfobulbus (DBB) cells, which are sulphate reducers commonly associated with ANME (Figure 3A and B). It was shown that both sediments are active for sulphate reduction. However, further investigations are required to dissect the sulphate reducing community of those sediments and to determine whether, and how, they are associated with ANME
A
B
Figure 3. A. All cells stained by DAPI from the ethanol incubation, GV sediment and red archaeal cells. B. Green cells showed a bunch of DBB cells observed by FISH from the GV sediment incubated with ethanol.
4. DISCUSSION In summary, among three different e-donors used for testing the sulphate reduction activity by GV and GC sediment, ethanol appeared to be more preferable e-donor. In the case of GC sediment, ethanol demonstrated high reduction of sulphate compared to lactate and acetate, respectively which indicates to host the microbial community which prefers the ethanol instead of acetate and lactate. In GV sediment, all three e-donors showed the fast and quick sulphate reduction whiles ethanol showed the highest volumetric and specific rates of sulphate reduction and sulphide production. The GV sediment was characterized by its active SR activity. Nevertheless, there is the need for more investigation about these sediments microbial community and its electron donor preference.
Production of sulphide from the experiments with the three different electron acceptors; acetate, ethanol and lactate showed the sulphate reduction activity except in the controls experiments. There was no sulphide production in incubations without sediment, with autoclaved sediment and without electron donor. This indicates that that the microbial community from GC and GV sediment utilises these e-donors for removing the sulphate. In the case of GC sediment among three different electron donors, ethanol demonstrated higher SR compared to lactate and acetate, respectively. Incubation with ethanol showed 50% reduction of sulphate

Sulphate Reduction by Marine Sediment Hosting Anaerobic Oxidation of Methane From Gulf of Cadiz and Marine Lake Grevelingen
129
in 31 days, which is almost equal to the amount of ethanol added (5mM) showed the sulphate reduction as defined by stochiometry (Table 1). This substantiates the fact that the GC sediments contain the microbial community which are capable of utilizing the ethanol. Although bacterial community of Ginsburg mud volcano is also not well known yet, the sulphate reducers from the high pressure enrichment from Gulf of Cadiz showed the diverse sulphate reducing bacterial community including the group Desulfuromodales and Desulfobacterales [14]. These bacteria are strictly anaerobes and capable of utilizing wide range of e-donors including acetic acids and even some of them can utilize the inorganic carbon.
Further, the microbial community of GV is being characterised recently, only the speculation could be made to have the wide diversity of bacterial community. Since the sulphate reduction was comparatively faster than GC, with all three e-donors, the sulphate reducing bacteria are assumed to be active in GV sediment. More interestingly, visualization of DBB cells by FISH suggests the presence of some of the sulphate reducers which are commonly associated with ANME, more specifically ANME-3[15], could be indication of presence of ANME. The high organic content in the sediment of Marine Lake Grevelingen makes it as a favourable habitat of the microbial communities.
5. CONCLUSIONS Sulphate reduction has been of concern in recent times due to the cost of electron donors. The discharge of sulphate rich wastewater and other heavy metals concentration above acceptable levels into the environment, poses a lot of risks to humans and aquatic life. It causes the acidic waters and leachate of metals. Studies have suggested that biotechnological process for the biotreatment of inorganic sulphur compounds can be coupled with the reduction of sulphate to elemental sulphur mediated by SRB. This process is useful for the treatment of industrial wastewater because of the availability of CH4
and other electron donors which can be finally eliminated from the system as elemental sulphur or sulphide precipitates. Understanding the process (SR) could also be useful for the enrichment of the archaea and SRB from GC and GV sediment for the better understanding of the microbial community and also possible application with in industrial wastewater treatment removal of sulphate and other elements. In summary, the studied sediments (GC and GV) host diverse microbial communities which can perfom sulphate reduction with diverse e-donors. To have an explicit idea, the microbial study of both GV and GC sediment has to be studied.
ACKNOWLEDGEMENTS
We acknowledge Dr. Yu Zhang from State Key Laboratory of Microbial Metabolism, School of Life Sciences and Biotechnology, Shanghai JiaoTong University, Shanghai, People’s Republic of China for providing the GC sediment and Dr. Filip Meysman from Royal Netherlands Institute of Sea Research (NIOZ), Yerseke, The Netherlands for providing GV sediment. We especially thanks to Dr. Jack van de Vossenberg, UNESCO-HE for his help in FISH analysis and sediment arrangement.
REFERENCES 1. Boetius, A., et al., A marine microbial consortium apparently mediating anaerobic oxidation of methane.
Nature, 2000. 407(6804): p. 623-626. 2. Milucka, J., Dissimilatory sulfur metabolism coupled to anaerobic oxidation of methane. 2011. 3. Meulepas, R., A. Stams, and P. Lens, Biotechnological aspects of sulfate reduction with methane as electron
donor. Reviews in Environmental Science and Biotechnology, 2010. 9(1): p. 59-78. 4. Nauhaus, K., et al., In vitro demonstration of anaerobic oxidation of methane coupled to sulphate reduction in
sediment from a marine gas hydrate area. Environmental Microbiology, 2002. 4(5): p. 296-305. 5. Nauhaus, K., et al., In vitro cell growth of marine archaeal-bacterial consortia during anaerobic oxidation of
methane with sulfate. Environmental Microbiology, 2007. 9(1): p. 187-196. 6. Alperin, M.J. and T.M. Hoehler, Anaerobic methane oxidation by archaea/sulfate-reducing bacteria aggregates:
1. Thermodynamic and physical constraints. American Journal of Science, 2009. 309(10): p. 869-957. 7. Kellermann, M.Y., et al., Autotrophy as a predominant mode of carbon fixation in anaerobic methane-oxidizing
microbial communities. Proceedings of the National Academy of Sciences, 2012. 109(47): p. 19321-19326. 8. Niemann, H., et al., Microbial methane turnover at mud volcanoes of the Gulf of Cadiz. Geochimica et
Cosmochimica Acta, 2006. 70(21): p. 5336-5355. 9. Siegel, L.M., A direct microdetermination for sulfide. Analytical Biochemistry, 1965. 11(1): p. 126-132. 10. Stahl, D., Development and application of nucleic acid probes. Nucleic acid techniques in bacterial systematics,
1991. 11. Daims, H., et al., The domain-specific probe EUB338 is insufficient for the detection of all Bacteria:
development and evaluation of a more comprehensive probe set. Systematic and applied microbiology, 1999. 22(3): p. 434-444.
12. Boetius, A., et al., A marine microbial consortium apparently mediating anaerobic oxidation of methane. Nature, 2000. 407(6804): p. 623-626.
13. Daly, K., R.J. Sharp, and A.J. McCarthy, Development of oligonucleotide probes and PCR primers for detecting phylogenetic subgroups of sulfate-reducing bacteria. Microbiology, 2000. 146(7): p. 1693-1705.

4th International Conference on Research Frontiers in Chalcogen Cycle Science & Technology
130
14. Zhang, Y., et al., Enrichment of a microbial community performing anaerobic oxidation of methane in a continuous high-pressure bioreactor. BMC Microbiology, 2011. 11(1): p. 1-8.
15. Niemann, H., et al., Novel microbial communities of the Haakon Mosby mud volcano and their role as a methane sink. Nature, 2006. 443(7113): p. 854-858.
BIOGRAPHY Susma Bhattarai is a PhD student, at UNESCO-IHE, the Netherlands under ETeCOS3
joint doctorate program. She is conducting research on “Anaerobic oxidation of methane (AOM) in the presence of sulphate as an electron acceptor” for last two years. She is focusing on the enrichment of the anaerobic methane oxidizers (ANME) in different bioreactor configurations. She is following the dynamics of enrichment using various chemical and molecular biology approaches. Prior to her PhD studies, she worked at the molecular biology lab, EAWAG in Switzerland where she studied the microbial community in sediment and water of Lake Kivu, East Africa, which is an ecosystem containing large amounts of methane.

131
(BIO)REACTOR SYSTEMS

132
133
Kinetics of Anaerobic Microbial Assemblages from Acid Sulfate Soil for Methane Formation
Nusara Sinbuathong1 , Pramote Sirirote2, Roj Khun-anake3, Boonsong
Sillapacharoenkul4,Warawut Chulalaksananukul5,6,7
and Suphang Chulalaksananukul,
8
*
1 Scientific Equipment Center, Kasetsart University Research and Development Institute, Kasetsart University, Bangkok 10900, Thailand. 2 Department of Microbiology, Faculty of Science, Kasetsart University, Bangkok 10900, Thailand. 3 Department of Environmental Science, Thammasart University, Pathumtani 12121, Thailand. 4Department of Agro-Industrial Technology, Faculty of Applied Science, King Mongkut’s University of Technology North Bangkok, Bangkok 10800, Thailand. 5 Department of Botany, Faculty of Science, Chulalongkorn University, Bangkok 10330, Thailand. 6 Biofuels by Biocatalysts Research Unit, Chulalongkorn University, Bangkok 10330, Thailand. 7Aquatic Resources Research Institute, Chulalongkorn University, Bangkok 10330, Thailand. 8
*Corresponding author email: Department of Chemical Engineering, Faculty of Engineering, Mahidol University, Nakornpathom 73170, Thailand.
Abstract Kinetics of mixed-bacterial assemblages from acid sulfate soil samples was investigated under typical anaerobic condition and sulfate reducing condition. The biomass inoculum from the mixed culture originated from acid sulfate soil was started up at ambient temperature (30±10 0C) by a synthetic glucose-based substrate in a semi-continuous-flow mode. Glucose at 20000 mg COD/L was used as synthetic waste. Experiments were operated in a batch mode for 1000 hours with initial parameters of pH 7 at ambient temperature. The levels of biomass, COD and biogas were followed through the experiment. The bio-kinetic constants of this culture were evaluated. Under typical anaerobic condition, the specific growth rate of this culture was found to be 0.001 hour-1. Estimates of waste reduction rate were obtained by fitting substrate depletion data with the Michaelis-Menten equation. The waste reduction rate was 9x10⁻⁸ L/mg of biomass.hour. This mixed bacteria showed a specific CH4 production rate of 7x10⁻⁵ ml (at STP)/(mg/L of biomass).hour and a CH4 production yield coefficient of 6.5 ml (at STP)/gram of COD removed. By under sulfate reducing condition, another reactor was fed with glucose-based solution and started at the same concentration of substrate and biomass. Sulfate at 2000 mg/L was added to the reactor. The results found that the specific growth rate of this mixed culture was two times higher than that of typical anaerobic condition. The initial sulfate reduction rate was 9x10⁻⁶ L/mg of biomass.hour and then the rate decreased to 3x10⁻⁷
Keywords: acid sulfate soil, anaerobic process, kinetics, mixed culture, sulfate reducing bacteria
L/mg of biomass.hour.
1. INTRODUCTION
Acid sulfate soils are naturally occurring soils or sediments that are formed under waterlogged conditions. These soils contain iron sulfide minerals predominantly as the mineral pyrite. These conditions are ideal for sulfate-reducing bacteria (SRB) to flourish. If the soils are drained, excavated or exposed to air, the sulfides will react with oxygen to form sulfuric acid. Release of this sulfuric acid from the soil can in turn release iron and other heavy metals within the soil. Once mobilized in this way, the acid and metals can create a variety of adverse impacts: killing vegetation, seeping into and acidifying groundwater and water bodies, killing fish and other aquatic organisms, and degrading concrete and steel structures to the point of failure. SRB are important in the mobility of sulfur in the environment [1- 2]. Both higher plants and animals depend upon microbial produced the reduced sulfur for acquisition in their own metabolism.
Soils and water contaminated with heavy metals pose a major environmental and human health problem that needs an effective and affordable technological solution. Since most current technologies cannot selective

4th International Conference on Research Frontiers in Chalcogen Cycle Science & Technology
134
remove heavy metals, many contaminated sites can be remediated only by using labor-intensive and costly excavation and land filling technology. Many sites around the world remain contaminated with no remediation in sight simply because it is too expensive to clean them up with the available technologies [3]. Anaerobic process has been considered as a highly integrated process because of the close collaboration existing between all the members of bacterial population. Bacterial assemblage from acid sulfate soil was expected to have a high ability to tolerate toxic wastes to some degree because this mixed culture was already acclimated through natural selection to significant levels of various chemical substances. Utilizing a mixed culture was viewed as an advantage in that in an operational bio-treatment scheme, purity of culture in treating large volumes of water will be difficult to maintain. In acid sulfate soil, SRB use sulfate as the terminal electron acceptor during oxidation of organic matter, resulting to the production of hydrogen sulfide (H2S)[2]. Metals may precipitate as metal sulfides, eliminating the toxic effects of the individual components. The precipitation would immobilize heavy metals as well as reduce sulfide and, indirectly, sulfate and organic levels in the effluent. Before a bio-treatment scheme can be designed and implemented, to quantify the kinetics of a process is a prerequisite. Therefore, the goal of this project was to identify the kinetic rates of the mixed culture from acid sulfate soil in terms of bacterial growth, biogas production, COD and sulfate reduction. Rate observations were made under both typical anaerobic conditions (without sulfate) and sulfate reducing conditions (with sulfate).
2. MATERIALS AND METHODS Acid sulfate soil samples with due regard to temporal and spatial heterogeneities were collected from the sites at Ongkarak District, Nakornayok Province, Thailand where there is not any anthropogenic effect. Soil samples were collected into bags from a depth of 0.5 meter below ground surface and brought back to the laboratory. The bagged soil was put into cold storage at 40
The biomass inoculum was initiated in 2-liter plastic bottles that were maintained at ambient temperature (30±1
C. When the soil is to be used, sufficient water was added to produce slurry of about 50% weight by volume.
0
C). The synthetic glucose-based substrate was added and gradually increased in concentration over a range from 2000-10000 mg/L for 2 months to maximize consistency for bacterial cell growth in a semi-continuous-flow mode. They were shaken from time to time. The biogas produced was observed in order to monitor the performance of the bacterial growth. Final mixed liquor volatile suspended solids (MLVSS) were determined in order to start the operation at the same content for the tested reactors under typical anaerobic condition and under sulfate reducing condition. This acclimated culture was used as the parent culture in this study.
For the studies of the specific growth rate of biomass, waste reduction and biogas production rate under typical anaerobic conditions, a reactor was constructed from 6-liter capacity plastic bottles. It was equipped with two outlet ports, one for liquid sample withdrawal and the other for gas exiting (Figure 1). The reactor was connected to a gas collection system, which was based on water displacement by the exiting gases. The reactor inoculated with a parent acclimated culture was fed with the glucose-based solution and was operated in a batch mode for 1000 hours. A glucose composition consisting of 20000 mg COD/L and sufficient inorganic was used as the synthetic waste. The components followed those of Leighton and Forster (1997)[4]. The conditions in the operation were: initial COD of glucose based solution (20000 mg/L), initial biomass in terms of mixed liquor volatile suspended solid (1000 mg MLVSS/L), pH (7) and temperature (30±10
C). Biogas was measured every 3 to 120 hours and collected to determine the gas composition. Digestion gas compositions were determined by a Shimadzu GC-14B GC (TCD). At selected times (10 to 15 days); liquid samples (5 ml) were withdrawn and analyzed for biomass (MLVSS) and COD.
Figure 1. Bioreactor for the studies of waste reduction, biomass and biogas production [10]

Kinetics of Anaerobic Microbial Assemblages from Acid Sulfate Soil for Methane Formation
135
For the studies of the specific growth rate of biomass, waste reduction rate and sulfate reduction rate under SO4
2- reducing conditions, another reactor was constructed from 6-liter capacity plastic bottles. It was equipped with an outlet port for liquid sample withdrawal. Gases were vented through a tube in the rubber cap that was connected to a tube containing water. The reactor was fed with the glucose-based solution and started at the same concentration of substrate and biomass as that of the first reactor. Sulfate in the form of ammonium salt at an initial concentration of 2000 mg SO4
2-/L was added to this reactor. The COD: SO42-
ratio was 10:1 to assure that glucose did not limit the SO42- reduction process. The batch was operated for
1000 hours. Liquid samples (5 ml) were withdrawn periodically and analyzed for MLVSS, COD and SO42-
.
Experiments were conducted in duplicate and analyzed according to the procedure of Standard Methods [5]. The results are calculated using the mean of the experimental values.
3 RESULTS AND DISCUSSION
3.1 Under Typical Anaerobic Conditions Change in the concentration of biomass, organic waste and the amount of biogas from reactors was followed.
The specific growth rate was determined from the cell mass that grew at the period of logarithmic growth phase. At this phase, all components of a cell can multiply rapidly, and cell mass increases exponentially with time. All components of a cell grow at the same rate. Since the waste concentrations are large, the growth rate is independent of waste concentration in this phase. The exponential growth rate is first order:
(1)
Integration of equation (1), yields
(2)
X is the cell mass concentration. µ is the specific growth rate. According to Equation (2), a plot of Ln X evaluating versus time (t) lead to straight lines (Figure 2).
Figure 2. Graphical determination of the specific growth rate, µmax
The good arrangement of the experimental points around straight lines confirms the agreement with the proposed model. Because the waste concentrations are large (20000 mg COD/L) the specific growth rate (µ) is the maximum growth rate (µmax). The value of the maximum specific growth rate of this mixed culture was calculated from the slope of the graph. Estimate of specific growth rate was 0.001 hour-1
The specific organic waste reduction rate was determined. The rate was best fit by a pseudo-first-order model as Equation (3). The COD concentration is relatively large at the beginning and then decreased rapidly (S0>>S1). The data obtained in the experiments followed the Michaelis-Menten equation [6] and the rate equation is
.
y = 0.001x + 7.5991R2 = 0.8584
7.40
7.60
7.80
8.00
8.20
8.40
0 120 240 360 480 600 720
Time (h)
Ln
X
dX/dt = µ X
Ln X = µ t

4th International Conference on Research Frontiers in Chalcogen Cycle Science & Technology
136
(3)
Where K is the specific COD reduction rate by the unit of volume/ (mass microbes)(time).
X = the cell mass concentration during the biochemical reaction. Rearranging for integration gives
(4)
S0 and S are COD at initial time and at time t, respectively. The Ln S at bio-reaction time was calculated and plotted versus time multiplied by the biomass at any time, Xt (similar to Equation 4). The plotted experimental data are shown in Figure 3.
Figure 3. Graphical determination of the specific waste reduction rate, K
Data points lie satisfactorily around a straight line confirming the validity of Equation (4). The waste reduction rate is well described by a pseudo-first order equation. The slope, K, was determined to be 9x10⁻⁸
Regarding to biogas evolution, the gas occurred after 2 days of operation but the percentage of CH4 was very low. During an experiment, the evolution of the CH4 and biomass was followed. Then the specific CH4 production rate was determined. The relationship between the rate of fermentation product generation, dP/dt or the rate of CH4 production may also be expressed as the specific rate, (dP/dt)/X, where X is the cell mass concentration [7].
L/mg of biomass.hour.
(5)
Where Kp is the specific CH4 production rate, volume/(mass microbes)(time). Rearranging by integration and the integration result gives
(6)
(7)
The experimentally determined data pairs (P/X, t) were used to plot for determining the specific CH4 production rate, KP. After least-square regression analysis, a slope of 7x10⁻⁵
ml (at STP)/(mg/L of biomass).hour was expressed in Figure 4.
y = -9E-08x + 9.8667R2 = 0.7186
8.68.89.09.29.49.69.8
10.0
0 1 2 3
X t (x 106 mg/L . h)
Ln
S
P = Kp X t
P/X = Kp t
- (dS/dt)/X = KS
Ln S = Ln S0- KXt
(dP/dt) /X = Kp

Kinetics of Anaerobic Microbial Assemblages from Acid Sulfate Soil for Methane Formation
137
Figure 4. Graphical determination of the specific methane production rate, Kp.
The product production can be represented as a conversion of a number of waste, dP/dS. It gives estimate how much waste should be supplied to reactor to obtain required amount of target product. Where dP is the increase in product (CH4) production consequent on reduction of the amount dS of waste. It should be noticed that rigorous definition of YP/S as derivative dP/dS stems from the fact that YP/S can vary in time, the negative sign being introduced because of P and S vary in opposite senses. A plot of the cumulative volume of CH4 against the S utilized, (S0-St), is a straight line of slope coinciding with the CH4 production yield coefficient (YP/S) (Figure 5). The CH4 production yield coefficient, YP/S, is defined as the ratio of CH4 produced in the experiment to the waste utilized. From this study, CH4 production yield coefficient was 6.5 ml (at STP)/gram of COD removed. It was reported that the theoretical amount of CH4 is 350 ml at STP/gram of COD removed [8]. In this study, very little CH4 production yield coefficient obtained is due to an acidic pH of acid sulfate soil that causes the activity of methane producing bacteria (MPB) to be very low. Another reason is due to high sulfate content in the reactor. Under reduced conditions, SRB and MPB compete for organic matter, especially the main intermediate compounds, acetate and H2/CO2. SRB have an advantage and obtain more energy from the transformation of these substrates.
Figure 5. Graphical determination of the methane production yield coefficient, YP/S
3.2 Under Sulfate Reducing Conditions The experimental data of biomass and COD were plotted in the similar fashion as those obtained under typical anaerobic condition (The graphs were not shown). The specific growth rate of this mixed culture was 0.002 hour-1 that was two times higher than the value under typical anaerobic condition. Girguis et al. (2005) found that the growth rate of Desulfosarcina-like sulfate-reducing bacteria was approximately 0.0018 hour-
1 [9], which is near the values observed in this study. Further in this study, the specific waste reduction rate was 1x10⁻⁷
y = 7E-05x + 0.0657R2 = 0.9380
0.00
0.05
0.10
0.15
0 240 480 720 960 1200
Time (h)
P /
X (
ml
at S
TP
/ (m
g/L
) )
L/mg of biomass.hour that was a little higher than the value obtained under typical anaerobic condition. The results suggested that the growth rate and substrate reduction rate was enhanced by the presence of sulfate. Biogas was not collected during the study since the amount of methane was very small. Sinbuathong et al. (2007) reported that the increment of sulfate loading to biomass leads to the optimum use of glucose substrate as electron donor by methane producing bacteria [10], however, the initial high level of
y = -0.0065x + 22.755R2 = 0.7040
0
100
200
300
-8000 -6000 -4000 -2000 0
S utilized (mg)
P (m
l at S
TP)

4th International Conference on Research Frontiers in Chalcogen Cycle Science & Technology
138
sulfate loading results in toxicity to methane producing bacteria by the formation of hydrogen sulfide, the product from the sulfate reduction reaction. The specific SO4
2- reduction rate was determined. Sulfate reduction was best fit by a pseudo-first-order model as Equation (4). Where S is the model predicted concentration of sulfate, S0 is the initial sulfate concentration, K is the specific sulfate reduction rate expressed as L/mg of biomass.hour, X is the bacterial cell concentration in mg/L, t is time in hour. The graphical determination of the specific sulfate reduction rate is not shown. It was found that at the beginning of time (during 0-150 hours); the specific sulfate reduction rate was 9x10⁻⁶ L/mg of biomass.hour and then gradually decreased to 3x10⁻⁷
The kinetic values of the mixed culture originated from acid sulfate soil under the operational conditions are summarized in Table 1.
L/mg of biomass.hour.
Sulfate reduction by SRB in a consortium depends on initial concentration; initial cell mass and operational conditions [11]. A few reports have described the kinetics for sulfate reduction under various conditions [12- 14]. Spear et al. (2005) found that for SRB mixed cultures at 210
C and sulfate concentrations up to 10 mM, sulfate reduction was best fit by a zero order model [11]; however, limited sulfate reduction occurred at 100 mM initial sulfate concentration. The rates observed in our study are slower than those reported by Spear et al. (2000) at 0.1 to 10 mM sulfate [11], but the sulfate concentration in our study was between 10 and 100 mM, so, these studies are consistent. Further comparison with previous studies measuring kinetics of anaerobic mixed cultures are difficult, due to the different experimental conditions and units used for reporting such rates (e.g. with experiments with pure cultures or no biomass reported).
Table 1 Kinetics values of the mixed culture from acid sulfate soil.
4. CONCLUSIONS
Quantification with modeling of growth rate, COD reduction and biogas production is important for the design of a treatment system. While that of sulfate reduction bacteria can be used for bioremediation of heavy metal by removing some soluble metal from waste streams. For this mixed culture at the tested condition, pseudo first-order model best fits the data for the removal of organic waste and sulfate. The presence of sulfate increase the growth rate and waste reduction rate. Since the rates depend upon the microbial assemblages used and experimental conditions, the findings of the kinetics from this study can be used to develop and design treatment systems employing the mixed culture from acid sulfate soil for bioremediation. ACKNOWLEDGEMENT This research was supported financially by Kasetsart University Research and Development Institute (KURDI), Kasetsart University, Bangkok, Thailand. REFERENCES
[1] Odom JM, Singleton R. The sulfate-reducing bacteria: contemporary perspectives. Springer-Verlag, New York; 1993. [2] Postgate JR. The Sulphate Reducing Bacteria. 2nd ed. Cambridge University Press, Cambridge, England; 1984. [3] Salt DE, Blayblock M, Nanda Kumar NPBA. Phytoremediation: a novel strategy of toxic metals from the environment using plants. Biotechnol 1995;13: 468- 474. [4] Leighton IR, Forster CF. The adsorption of heavy metals in an acidogenic thermophilic anaerobic reactor. Water Res 1997; 31: 2969–2972. [5] APHA, AWWA, WEF, Standard methods for the examination of water and wastewater.18th ed. USA; 1992.
Parameters
Kinetics
UnderTypical Anaerobic Digestion
Under Sulfate Reducing Condition
1. Maximum growth rate (µmax), hour 0.001 -1 0.002
2. Specific COD reduction rate (K), L/mg of biomass.hour 9x10 1x10⁻⁸
3.
-7
Specific CH4 production rate (KP), ml at STP / (mg/L of Biomass). hour 7x10 - -5
4.
CH4 production yield coefficient (YP/S), ml CH4 produced at STP/g COD removed 6.5 -
5. Specific sulfate reduction rate, L/mg of biomass.hour - 9x10⁻⁶- 3x10⁻⁷

Kinetics of Anaerobic Microbial Assemblages from Acid Sulfate Soil for Methane Formation
139
[6] Reynolds TD, Richards PA. Biological Concept in Unit Operations and Process in Environmental Engineering.PWS Publishing Company, Boston; 1996. [7] Aiba S, Hamphrey AE, Millis NF.Biochemical Engineering.Academic Press, New York; 1965. [8] Tchobanoglous G, Burton FL. Wastewater Engineering Treatment, Disposal, and Reuse. Revised from Metcalf & Eddy Inc. 3rd ed. McGraw Hill Inc, Singapore; 1991. [9] Girguis PR, Aaron EC, Edward FD. Growth and population dynamics of anaerobic methane-oxidizing archaea and sulfate-reducing bacteria in a continuous-flow bioreactor. Appl Environ Microbiol 2005; 71: 3725–3733. [10] Sinbuathong N, Khaodhiar S, Liengcharernsit W, Sirirote P, Watts D. Effect of sulfate on the methanogenic activity of a bacterial culture from a brewery wastewater during glucose degradation. J. Environ Sci (China) 2007;19:1025–1027. [11] Spear JR, Figueroa LA, Honeyman BD.Modeling reduction of uranium U(VI) under variable sulfate concentration by sulfate reducing bacteria. Appl Environ Microbiol 2000; 66: 3711-3721. [12] Lovley DR, Phillips EJP.Reduction of uranium by Desulfovibriodesulfuricans.Appl Environ Microbiol1992; 58: 850-856. [13] Okabe S, Characklis WG. Effects of temperature and phosphorous concentration on microbial sulfate reduction by Desulfovibriodesulfuricans.BiotechnolBioeng 1992; 39: 1031-1042. [14] Marschall C, Frenzel P, Cypionka H. Influence of oxygen on sulfate reduction and growth of sulfate-reducing bacteria. Arch Microbiol 1993;159: 168-173.

140

141
Novel Insights into Biogenesis Mechanisms of Selenium Nanoparticles in Stenotrophomonas
maltophilia SeITE02 Silvia Lampis1*, Cristina Bertolini1, Emanuele Zonaro1, Daniela Cecconi1,
Raymond Turner2, Clive S. Butler3 and Giovanni Vallini
1*
1 Department of Biotechnology, University of Verona, Strada Le Grazie 15, 37134 Verona, Italy 2 Biofilm Research Group, Department of Biological Sciences, University of Calgary, Calgary, Alberta, Canada 3
Biosciences, College of Life and Environmental Sciences, University of Exeter, Stocker Road, Exeter EX4 4QD,UK.
*Corresponding author email: [email protected], [email protected]
Abstract The biogenic synthesis of Se nanoparticles (SeNPs) by Stenotrophomonas maltophilia SeITE02, a bacterial strain originally isolated from the rhizosphere of Astragalus bisulcatus grown on a seleniferous soil, is presented. Dynamics of bacterial growth, reduction of selenite and formation of Se0 by the strain SeITE02 were analysed. Biogenesis of SeNPs in SeITE02 cultures was monitored through Scanning Electron Microscopy - Energy Dispersive X-ray (SEM-EDX) microscopy. Biogenic SeNPs were also studied by means of Dynamic Light Scattering (DLS) analysis and Zeta-Potential measurement. Results indicated that S. maltophilia SeITE02 efficiently transforms selenite to Se0. In fact, it could transform about 90% of the selenite originally added to the culture medium into Se0
Keywords: Selenite reduction, Biogenic selenium nanoparticles, Stenotrophomonas maltophilia SeITE02, Alcohol dehydrogenase, Antimicrobial activity.
. SEM analyses revealed extracellular formation of spherical SeNPs. DLS data revealed 160 nm SeNPs after 24 hours of exposure while dimensions increased up to 250 nm after 48 hours of incubation. Utilizing native one-dimension gel electrophoresis on cytoplasmic protein fraction evidenced the presence of one major band after zymogram analysis. Digestion and MS identification of this band evidenced a Zn-dependent alcohol dehydrogenase homologue, suggesting that this enzyme is associated with the biosynthesized SeNPs. Finally, antimicrobial activity tests showed that SeNPs synthesized by S. maltophilia SeITE02 efficiently inhibit biofilm formation by P. aeruginosa PAO1 and S. aureus ATCC25923.
1. INTRODUCTION Selenium is a nonmetallic, natural occurring element, essential in trace for humans and animals but toxic at concentrations higher than the dietary doses, with a narrow concentration margin between essentiality and toxicity [1]. It is a key component of a variety of functional selenoproteins in all living organisms, except for higher plants and yeasts [2]. In human beings, the nutritional functions of selenium are achieved by 25 selenoproteins that have selenocysteine at their active centre [3, 4]. In natural environments, selenium occurs in four valence states: selenate (Se6+), selenite (Se4+), selenide (Se2-), and elemental selenium (Se0). Environmental fate and toxicity of selenium strongly depends on its chemical speciation, with water soluble oxyanions selenite (SeO3
2-) and selenate (SeO42-) showing the highest poisoning effects towards biota.
Microorganisms play a major role in the biogeochemical cycle of this element. Certain microbial strains, that are resistant to selenium oxyanions and reduce selenite and/or selenate to either less available elemental selenium (also called amorphous or colloidal selenium, that forms a red-orange precipitate in aqueous solutions) or methylated Se forms, may be regarded to as potential tools for the bioremediation of contaminated soils, sediments, industrial effluents, and agricultural drainage waters [5, 6, 7]. Therefore, while reducing selenium oxyanions, a number of these microbes perform the biogenic synthesis of Se0 nanoparticles (SeNPs) that can occur either intracellularly or extracellularly. Biogenic SeNPs are mainly of spherical/ovoid shape, with dimensions ranging from 10 to 400 nm. Interestingly, these SeNPs possess special physical characteristics such as photoelectric, semiconducting and X-ray-sensing properties, which make them attractive for possible technological applications. Meanwhile, it has recently been shown that SeNPs can exert high antibacterial activity against human pathogenic bacteria, such as Staphilococcus aureus [8]. In this study, we analysed respectively growth dynamics, selenite reduction pattern and elemental selenium formation in Stenotrophomonas maltophilia SeITE02, a bacterial strain originally isolated from the rhizosphere of the Se hyperaccumulator legume Astragalus bisulcatus, grown on a seleniferous soil [9, 10].

4th International Conference on Research Frontiers in Chalcogen Cycle Science & Technology
142
Characterization of SeNPs biosynthesized by the strain SeITE02 was also carried out through DLS and SEM-EDX analyses. Moreover, a preliminary description of protein components of these SeNPs as well as their antimicrobial activity against Pseudomonas aureoginosa PAO1 and S. aureus ATCC 25923 are here reported. 2. MATERIAL AND METHODS 2.1 Growth of bacterial strain - S. maltophilia SeITE02 was originally isolated from the rhizosphere of the leguminous forage plant Astragalus bisulcatus grown in a seleniferous soil [9]. Bacterial pre-inoculum used in all the experiments was prepared by incubating at 27°C for 48 h on an orbital shaker bacteriological tubes containing 5 ml Nutrient Broth inoculated with the strain SeITE02. 2.2 Transformation of selenite (SeO3
2-) to Se0
- S. maltophilia SeITE02 was cultured in 250 ml Erlenmeyer flasks containing 100 mL Nutrient Broth spiked either with 0.5 or 2.0 mM selenite. Bacterial cultures were incubated at 27°C under aerobic condition on an orbital shaker. Time courses of bacterial growth were obtained through CFU (Colony Forming Units) counting on Nutrient Agar plates. Selenite and elemental Se were determined through spectrophotometric methods as described in [11].
2.3 Scanning electron microscopy (SEM) and energy dispersive microanalysis (EDX) - Samples of SeITE02 liquid culture grown in Nutrient broth added with 0.5 mM selenite were collected after 24 and 48 h of incubation. Bacterial cells were pelleted through centrifugation at 5000 g for 10 min and then fixed in 2.5% glutaraldehyde for 24 h. Afterwards they were rinsed three times in phosphate buffer (0.2 mol/L) and dehydrated in an ethanol series (30%, 50%, 70%, 90%, and 100%). Finally, cells were dried by using the critical point method by using liquid CO2. Cells were mounted on metallic specimens stubs and sputter-coated with carbon (MED 010 Balzers) then directly observed at the electron microscope. SEM observations were done by adopting mainly the back-scattered electron (BSE) emission mode with a XL30 ESEM (FEI-Philips) equipped with an EDAX micro-analytical system. 2.4 Preparation of SeNPs from SeITE02 bacterial cultures - SeITE02 cultures were prepared as described above by inoculating bacterial cells at the final concentration of 107 CFU ml-1
in Nutrient Broth added with 0.5 mM selenite. Bacterial cells and NPs were removed from the culture medium after 24 and 48 h by centrifugation at 10,000 x g for 10 min. Pellets were washed twice with 0.9% NaCl solution, resuspended in Tris/HCl buffer (pH 8.2) and then were disrupted by ultrasonication at 100 W for 5 min. The suspension was then centrifuged at 10000 x g for 30 min to separate disrupted cells (pellet) from NPs (supernatant). NPs were recovered after centrifugation at 40000 x g for 30 min, washed twice and resuspended in deionized water.
2.5 Dynamic light scattering (DLS) analysis and Zeta-Potential measurement - DLS analyses were performed using a Zen 3600 Zetasizer Nano ZS from Malvern Instruments (Worcestershire, UK) equipped with a 633 nm Helium–Neon laser light source (4.0 mW), detecting scattering information at a fixed angle of 173°
. 300 µL from samples were transferred to a quartz cuvette (10 mm path length) and data recorded at 25 °C. Both mean size distribution and zeta-potential of the particles were measured. All the values registered were obtained using the software provided by Malvern with the instrument.
2.6 Proteomic analysis - One-Dimensional Native Gel Electrophoresis - Bacterial proteins were obtained as described before by the authors [11] and concentrated with a Sartorius Vivaspin 6 (5 kDa cut-off). Final concentration of the samples was 6 mg/ml. Proteins were separated on a 6-13 % gradient non-denaturing polyacrylamide electrophoresis gel (Invitrogen, Carlsbad, CA). Native MarkTM Unstained Protein Standard was used as marker. Electrophoretic migration was carried out at 100mA for 60 min and then at 300 mA for 4 h. Afterwards, gels or excised gel lanes were transferred to zymogram buffer. Gels were then incubated on Petri plates with McIlvaine buffer (pH 6.0-6.6) containing 1mM NADH and 100 mM Na2SeO3. Enzymatic activities were noticed from the appearance of a red-band, representing the reduction of selenite to elemental selenium. Finally, bands were cut out from gels and subjected to in-gel trypsin digestion. Peptide sequencing by nanoHPLC-Chip MS/MS - Peptides from 5 μl of each sample were then separated by reversed phase nano-HPLC-Chip technology (Agilent Technologies, Palo Alto, CA, USA) online-coupled with a 3D ion trap mass spectrometer (Esquire 6000, Bruker Daltonics, Bremen, Germany). Protein identification was performed by searching in the National Center for Biotechnology Information non-redundant database (NCBInr) using the Mascot program (http://www.matrixscience.com).The following parameters were adopted: specific trypsin digestion, up to one missed cleavage; fixed and variable modifications: carbamidomethyl (Cys) and oxidation (Met), respectively; peptide and fragment tolerances: ± 0.9 Da and ± 0.9 Da, respectively, and peptide charges: +1, +2 and +3. 2.7 Evaluation of antimicrobial activity of SeNPs – The ability of SeNPs to inhibit the formation of a microbial biofilm was tested against P. aeruginosa PAO1 and S. aureus ATCC 25923. A modification of the MBECTM protocol [12] was utilized. In a 96-well microtiter plate all wells were inoculated with 75 µL of 1/15 dilution of a 1.0 McFarland standard of each organism and 75 µL of LB Broth. The MBECTM lid was

Novel insights into biogenesis mechanisms of selenium nanoparticles in Stenotrophomonas maltophilia SeITE02
143
then attached and cultures were incubated at 37°C, 95% humidity, in shaken conditions at 125 rpm. P. aeruginosa and S. aureus were inoculated in 96-well microtiter plates containing an increasing concentration gradient of nanoparticles. Viability of the bacterial cultures was evaluated by using the established MBECTM
recovery protocol [12] after 24 h of exposure. Effective concentrations causing 50% growth inhibition (EC50) were calculated with GraphPad Prism 6.01 software. All tests were carried out in triplicate (n=3) and the results were averaged.
3. RESULTS AND DISCUSSION 3.1 SeITE02 growth in presence of increasing concentration of selenite Presence of selenite at either 0.5 or 2.0 mM in the culture medium negatively affected the growth of S. maltophilia SeITE02 (Fig. 1). The final biomass obtained after 96 h of incubation resulted lower of about 1 Log unit when compared with control test without selenite. Moreover, growth dynamics was severely impacted. In fact, time courses showed a drop in bacterial growth at 24th
h of incubation, with the exponential phase thus reached much later, after 48 h of incubation.
Fig. 1- Time courses of SeITE02 growth in Nutrient Broth added with respectively 0.5 and 2.0 mM selenite or without selenite. 3.2 Selenite depletion and Se0
formation
Despite the high toxic effect of selenite on SeITE02 growth, this strain efficiently reduced selenite supplied at both 0.5 and 2.0 mM. A whole abatement of selenite was observed after 48 h of incubation when initially added to the culture at 0.5 mM. On the other hand, when SeITE02 was exposed to 2.0 mM selenite, the oxyanion was reduced up to 85% of the initial concentration, after 192 h of incubation. Moreover, S. maltophilia SeITE02 is able to transform 94% and 91.5% of the initially added selenite into Se0
once supplied at 0.5 and 2.0 mM, respectively (Fig. 2A, B).
Fig. 2 - Time courses of selenite reduction (blue curves) and Se0 formation (red curves) by the strain SeITE02 grown in Nutrient Broth added with 0.5 (A) or 2.0 mM (B) selenite.

4th International Conference on Research Frontiers in Chalcogen Cycle Science & Technology
144
3.3 SEM-EDX analyses SeITE02 cells grown in presence of 0.5 mM selenite were sampled after 24 and 48 h of incubation and analyzed through SEM-EDX. Images obtained revealed the presence of extracellular Se0
nanospheres after both 24 and 48 h of incubation (Fig. 3). This result was confirmed also through TEM analyses (data not shown). It is therefore reasonable to infer that reduction of selenite primarily occurs in the extracellular environment. SeNPs appeared spherical in shape and heterogeneous in size. Both number and dimensions of these particles increased with the length of incubation time. SeNPs measured in fact 150 nm in diameter after 24 h of incubation, at the end of the exponential growth phase, while 100 to 300 nm in the late stationary phase, after 48 h. This suggests that small nanoparticles, produced early in the growth phase, can behave as seeds of nucleation for further growth through a maturing process resembling the Ostwald ripening phenomenon, as already observed for other selenite reducing strains [11]. EDX spectra of these nanospheres clearly indicated the presence of selenium: the specific absorption peaks at 1.37, 11.22, and 12.49 keV were in fact recorded.
Fig. 3 - SEM micrographs of S. maltophilia SeITE02 cells from liquid cultures added with 0.5 mM selenite, after 24 (A) and 48 (B) h of incubation. Nanoparticle analysed by EDX is shown arrowed in the picture. 3.4 Characterization of SeNPs through DLS analyses and Zeta-Potential measurements. DLS analyses carried out on SeNPs revealed an average dimension of 160.6 ± 62.2 and 251.9 ± 64.5 for nanoparticles recovered after 24 and 48 h of incubation, respectively (Fig. 4). These results are consistent with those obtained by SEM observations, with SeNPs increasing in size with the extension of the incubation time. Moreover SeNPs revealed a negative Zeta-Potential, as shown in Fig. 5, probably due to the presence of negatively charged proteins on them.
Fig. 4 - DLS spectra of SeNPs retrieved from liquid cultures of S. maltophilia SeITE02 in Nutrient Broth added with 0.5 mM selenite, after 24 (A) and 48 (B) h of incubation, respectively.

Novel insights into biogenesis mechanisms of selenium nanoparticles in Stenotrophomonas maltophilia SeITE02
145
Fig. 5 - Zeta-potential analysis of SeNPs purified from S. maltophilia SeITE02 grown in Nutrient broth added with 0.5 mM selenite after 24 h of incubation. 3.6 Proteomic analyses Native one-dimension gel electrophoresis on cytoplasmic protein fraction evidenced the presence of one major band after zymogram analysis. Digestion and MS identification of this band revealed a Zn-dependent alcohol dehydrogenase homologue, possibly associated with the biogenic synthesis of SeNPs. Interestingly, Dobias and coworkers found an alcohol dehydrogenase specifically bounded to SeNPs produced by an Escherichia coli strain grown in the presence of selenite [13], revealing the important role of such an enzymatic protein in determining the size of nanoparticles. 3.7 Antimicrobial activity of SeNPs synthesized by S. maltophilia SeITE02 against P. aureoginosa PAO1 and S. aureus ATCC 25923 Antimicrobial activity of SeNPs biosynthesized by S. maltophilia SeITE02 was tested against P. aureoginosa PAO1 and S. aureus ATCC 25923 (Tab. 1). EC50 values were determined for NPs synthesized after 24 and 48 h of incubation for their ability to inhibit biofilm formation and development of the bacterial strains considered. Results indicated that SeNPs efficiently inhibited growth in biofilm mode of both strains tested and revealed that nanoparticles obtained after 24 h of incubation (SeNPs24H) exerted a higher antimicrobial activity if compare to the effects caused by nanoparticles obtained after 48 h of incubation (SeNPs48H). This is likely to be strictly dependent on the higher surface to volume ratio of SeNPs24H that in turn could affect their reactivity.
Table 1 - EC50 values of SeNPs for biofilm cultures of P. aeruginosa PAO1 and S. aureus ATCC25923
P. aeruginosa PAO1 S. aureus ATCC25923 SeNPs24H (mg/L) 81.70 62.45 SeNPs48H (mg/L) 184.25 83.49
Data here reported are similar to those obtained for chemically synthesized SeNPs by Tran and Webster [14] and biogenic SeNPs biosynthesized by Bacillus sp. MSh1 [15]. 4. Conclusions Se0 is well known for its photoelectric, semiconductor, free-radical scavenging, anti-oxidative and anti-cancer properties. Synthesis of Se0 can be achieved through physico-chemical procedures or by means of biological catalysts. Physico-chemical methods are proven to be quite expensive, energy-consuming and environmentally harmful because of the generation of toxic by-products and residues that can hardly be treated. Biogenesis of Se0 particles in the nanoscale range relying on microorganisms has been suggested as a possible green method for the production of reactive elemental selenium. In this study, we demonstrated that S. maltophilia SeITE02, originally isolated from the rhizosphere of the forage legume Astragalus bisulcatus grown in a seleniferous soil, is capable of efficiently transform selenite to elemental selenium with extracellular appearance of spherical nanoparticles. SeNPs increased their dimensions with the length of bacterial cultivation and showed an average size of 160 nm in diameter after 24 h of incubation, when selenite

4th International Conference on Research Frontiers in Chalcogen Cycle Science & Technology
146
was initially added at 0.5 mM. Moreover, proteomic analyses through one-dimensional native gel electrophoresis revealed the presence of a Zn-dependent alcohol dehydrogenase probably involved in the formation such SeNPs. Finally, antimicrobial activity tests showed that SeNPs synthesized by S. maltophilia SeITE02 efficiently inhibit biofilm formation by P. aeruginosa PAO1 and S. aureus ATCC25923. This suggests a possible use of S. maltophilia SeITE02 as biogenic agent for the synthesis of Se0
nanoparticles efficiently exploitable as antimicrobial agents with a remarkable biofilm inhibition capacity.
5. References [1] Nuttall, K. L. Evaluating Selenium Poisoning. Ann. Clin. Lab. Sci. 2006, 36, 171-188. [2] Hesketh, J. Nutrigenomics and selenium: Gene expression patterns, physiological targets, and genetics. Annu Rev
Nutr. 2008, 28, 157-177. [3] Kryukov, G.V., Castellano, S., Novoselov, S.V., Lobanov, A.V., Zehtab, O., et al. Characterization of mammalian
selenoproteomes. Science. 2003, 300, 1439–1443. [4] Rayman, M.P. Selenium and human health. Lancet. 2012, 379, 1256–1268. [5] Dungan, R. S., Frankenberger, W. T. Microbial transformations of selenium and the bioremediation of seleniferous
environments. Biorem. J. 1999, 3 (3), 171 −188. [6] Wu, L. Review of 15 years of research on ecotoxicology and remediation of land contaminated by agricultural
drainage sediment rich in selenium. Ecotoxicol. Environ. Saf. 2004, 57 (3), 257 −269.. [7] Lenz, M., Lens, P. N. L. The essential toxin: The changing perception of selenium in environmental sciences. Sci.
Total Environ. 2009, 407 (12), 3620 −3633 [8] Tran, P.A., Webster Y.J. Selenium nanoparticles inhibit Staphylococcus aureus growth. Int J Nanomedicine. 2011;
6: 1553–1558 [9] Di Gregorio S, Lampis S, Vallini G. Selenite precipitation by a rhizospheric strain of Stenotrophomonas sp. isolated
from the root system of Astragalus bisulcatus: a biotechnological perspective. Environ Int. 2005 Feb;31(2):233-41. [10] Antonioli P, Lampis S, Chesini I, Vallini G, Rinalducci S, Zolla L, Righetti PG. Stenotrophomonas maltophilia
SeITE02, a new bacterial strain suitable for bioremediation of selenite-contaminated environmental matrices. Appl Environ Microbiol. 2007 Nov;73(21):6854-63.
[11] Lampis, L., Zonaro, E., Bertolini, C., Bernardi, P., Butler, C. C., Vallini, G. Delayed formation of zero-valent selenium nanoparticles by Bacillus mycoides SeITE01 as a consequence of selenite reduction under aerobic conditions. Microb. Cell Fact. 2014, 13(1): 35-49. http://dx.doi.org/10.1186/1475-2859-13-35.
[12] Harrison, J. J., Stremick, C. A., Turner, R. J., Allan, N. D., Olson, M. E., Ceri, H. Microtiter susceptibility testing of microbes growing on peg lids: a miniaturized biofilm model for high- throughput screening. Nat. Protoc. 2010, 5: 1236–1254. http://dx.doi.org/10.1038/nprot.2010.71
[13] Dobias, J., Suvorova, E. I., Bernier-Latmani, R. Role of proteins in controlling selenium nanoparticle s size. Nanotechnology. 2011, 22, 195605 (9pp) doi:10.1088/0957-4484/22/19/195605
[14] Tran, P. A., Webster, T. J. Selenium nanoparticles inhibit Staphylococcus aureus growth. Int. J. Nanomedicine. 2011, 6, 1553-1558. http://dx.doi.org/10.2147/IJN.S21729.
[15] Shakibaie, M., Forootanfar, H., Golkari, Y., Mohammadi-Khorsand, T., Shakibaie, M. R. Anti-biofilm activity of biogenic selenium nanoparticles and selenium dioxide against clinical isolates of Staphylococcus aureus, Pseudomonas aeruginosa, and Proteus mirabilis. J. Trace Elem. Med. Biol. 2015, 29, 235-241. http://dx.doi.org/10.1016/j.jtemb.2014.07.020

147
Strategy of COD Degradation of Wastewater from the Cleaning of Food and Fodder Transportation
Nguyen Van Than1 and Wolfgang Pffeifer
2
1 Corresponding author: Environmental-Biotechnology, College of Food Industry Da Nang, 101B Le Huu Trac, Son Tra, Da Nang, Vietnam. [email protected] 2 Wismar University, Philipp-Mueller Street 14, 23966 Wismar, Germany. [email protected]
Abstract The investigation of the anaerobic digestion of the glycerol and wastewater with glycerol is in the context of the development of a wastewater treatment process for a plant cleaning tanks for food and fodder road transports. The bench scale investigation showed that anaerobic digestion of glycerol and wastewater with glycerol is possible if the trace elements and the sodium bicarbonate (NaHCO3) are added. The organic loading rate (OLR) for the glycerol wastewater alone is limited to 0.95kgCOD/m3/day. In wastewater with glycerol optimal OLR is reduced by the glycerol from approach 4kgCOD/m3/day to approach 2kgCOD/m3
Keywords: Glycerol wastewater, anaerobic digestion
/day.
1. INTRODUCTION The tanks of road transports of food and fodder need to be cleaned during the transportation system process. The trucks convey usually the liquid food and the fodder such as chocolates, sugar, milk, lipids and glycerol. After the transportation processes, the trucks are cleaned at TS-Clean plant at Fahrbinde, Germany, with two steps. First, the tanks are cleaned with 1600
Glycerol is an organic, readily digestible substance, which can easily be stored over long periods. It is also possible for a co-substrate to enhance the biogas production. The chemical formula of glycerol is C3H5(OH)3. Pure glycerol used in the chemical industry and food industry. Crude glycerol was taken from biodiesel production [
C steam. The mixing wastewater of this process is highly polluted, it is collected and separately contained in a tank at TS-Clean plant. Then the tanks of the trucks are cleaned with soap solution. This wastewater is mild polluted and is discharged to the municipal sewage treatment plant Rastow. The highly polluted wastewater is transported to a biogas plant. The mixing wastewater and glycerol wastewater were collected and separated for our research. Biogas production and COD removal efficiency of this wastewater have to investigation on bench scale before apply to pilot and full scale. The characteristic of mixing wastewater is complex composition; include carbohydrates, fat, protein, and glycerol. The glycerol wastewater is cleaned from the trucks transport pure glycerol. The composition and the characteristics of the wastewater are shown in Table 1 and Table 2.
1]. Recently, many researchers have studied glycerol waste for biogas production. Different temperatures, organic loading rates, reactors, and glycerol doses were investigated at laboratory scales, and pilot scale (co-digestion). The chemical oxygen demand (COD) removal efficiency and the specific biogas production on anaerobic digesters were evaluated. Most researchers reported that the organic loading rate (OLR) has to be controlled through anaerobic digestion. Besides, the co-digestion of glycerol with other substrates was also studied, such as sewage sludge, municipal waste, food waste, industrial waste and manure. The results demonstrated co-digestion with glycerol enhanced the biogas production [2-11].
The COD concentration of glycerol waste is high and ranges between 925-1600g/l. It can cause organic overload when used as a substrate for the anaerobic digester [1]. The glycerol was diluted with water or pretreatment wastewater to avoid the organic overload and reduce the inhibition [1, 8, 12]. The glycerol synthesis wastewater was studied with a 0.5l fixed-bed reactor at a HRT of 14days on both mesophilic and thermophilic conditions [13]. The reactor operated at OLR of 0.25, 0.5 0.7 and 1g COD/l/reactor/day until day 175, 294, 426, 516 repestively. The thermophilic reactor achieved the higtest methane yield at 0.45 lCH4/g dissoved organic carbon (DOC) at the OLR of 0.7gCOD/l reactor/d. By constract the mersophilic reactor achieved the highest methane yield at 0.375l CH4/gDOC at the OLR of 0.25gCOD/l reactor/d. Then the biogas production decreased when the OLR increased. In addition, the glycerol wastewater was investigated anaerobic treatment for methane and hydrogen production on 5l CSTR under mersophilic conditions [14]. The reactor operated at the OLR of 0.25, 0.375 and 0.5 gCOD/l/d. The mean of HRT remained at 20days. The results demonstrated that the anaerobic digester was inhibited by the increasing OLR

4th International Conference on Research Frontiers in Chalcogen Cycle Science & Technology
148
above 0.25gCOD/l/d. The result showed that, the highest biogas production and methane yield were achieved at the OLR of 0.25gCOD/l/d, 0.42l/gCOD/d and 0.30lCH4/gCOD/d, repectively.
Moreover, Miroslav Hutnˇan and coworkers studied treatment of crude glycerol in 3.7l UASB [15]. The reactor was operated under mesophilic conditions. Their research was focused on the investigation of crude glycerol as a sole substrate in a UASB reactor. Different pretreatments of glycerol waste were studied in diluted or undiluted form, with or without previous acidulation. The suspended sludge and granualated sludge was used as an inoculum. The different OLR in each reactor was investigated for using suspended and granualated sludge, at the OLR of 0.5-4.5gCOD/l/d, at the OLR of 0.2-1.4gCOD/l/d, repectively. The OLR was higher when glycerol was dosed, at the OLR of 2-16gCOD/l/d. However, the results showed that at higher OLR value the digester was not stable and occurred overload. The organic acids increased and the pH was dropped then biogas production declined.
Based on these results, the OLR has to be controlled to avoid the risk of organic overloading. As a sole substrate, glycerol is very sensitive of over loading and there is a strong inhibition when the load increases. A different of OLR (0.2-10gCOD/l/d) was investigated by different reactors CSTR, UASB, and anaerobic fixed-bed reactors. In addition, researchers reported that the glycerol has to be dosed or pre-treated (acidified) for enhancing the biogas production and achieving the COD removal efficiency as well as obtaining the reactor stable operation. In addition, the metabolic pathways of the anaerobic digestion of glycerol may be inhibited if some external factor interferes with the biodegradation process as well as operational factors (such as pH, temperature and alkalinity) [1]. Therefore, to avoid organic overloading, the glycerol wastewater was diluted or acidified before adding it to the digester. The results confirmed that the anaerobic biodegradability of the mixture increased by 17% and 22% when the crude glycerol was added at concentrations of 3% and 6% (v/v), respectively. In addition, the trace chemical and the NaHCO3 can be used for adding micronutrients requirements and adjusting the pH value through anaerobic operations. The concentration of NaHCO3 was added to the digester between 0.80g/l/d- 6.5g/l/d [15].
Our preliminary experiment shows that the anaerobic digestion of the wastewater from food and fodder was possible for biogas production. The digesters operated well approach 100 days, and then it deteriorated at both the bench scale (3l) and the pilot scale (500l). Therefore, the wastewater composition, the controlling OLR, the buffer capacity and the addition of the trace metal are investigated. In this paper, we focused and showed the performance of the digester of the wastewater glycerol and the wastewater with glycerol.
In addition our preliminary results observed also that the glycerol is affected on biogas production by the organic loading rate. It is very sensitive to organic over loading of the digester. Our results illustrated that when the OLR of glycerol is fed to anaerobic digester more than 2,15gCOD/l/d (VL=10-50 ml/day), the biogas production and COD elimination achieved low values and the digester failed. However, if the OLR was 1,08g COD/L/d (VL=5ml/day), it produced higher biogas production and achieved higher COD degradation. Therefore, our aim investigates the wastewater glycerol for biogas production at different OLR. Parallel the mixing wastewater will be investigated on bench scale before apply in pilot and full scale. The biogas production and COD removal efficiency will be evaluated. In addition, the micronutrients and sodium bicarbonates will be added to digesters. Then the abundance of trace metals and buffer capacity balance of anaerobic digestion will be analyzed.
2. MATERIALS AND METHODS
2.1. Glycerol wastewater, mixing wastewater and inoculums Our statistics show that the glycerol wastewater contains about 2.5%-14% of total wastewater of TS-Clean plant. The COD of the wastewater is about 343,5-352g/l. The wastewater was collected and stored at 0-4o
Table 1. Chemical analysis of glycerol wastewater
C at the laboratory then used for our study. The characteristic of glycerol wastewater is shown in the Table 1.
Parameter Glycerol wastewater
Total COD 348±4
FOS 0.14g of organic acids/kg of substrate
TAC 0.18g of CaCO3/kg of substrate
pH 6.5±0.2
The mixing wastewater was collected and transported in our laboratory. This wastewater is complex and highly polluted. The composition of this wastewater include: oils (rap, palm oil and cooking oil), proteins (milk) and carbohydrates (glucose, chocolate, fruit juice) and glycerol. This is great wastewater and suitable

Strategy of COD degradation of wastewater from the cleaning of food and fodder transportation
149
substrate for bioenergy. The characteristics and composition are shown in the Table 2. However, our preliminary result showed that the anaerobic digester both bench and pilot scale deteriorated after long time operated. Therefore, the composition, the OLR, the buffer capacity, and the trace metals will be investigated. In this report, we focused on the results of the glycerol wastewater and mixing wastewater with glycerol.
Table 2. Chemical analysis of mixing wastewater
Wastewater type
Total COD (g/l)
TS (%)
VS (%) pH Carbohydrates
(%) Yeats (%)
Fat (%)
Proteins (%)
Glycerol (%)
Others (%)
WWmixing2 62 1.43 1.33 3.46 28.4 5.4 56.8 1.5 5.4 2.7 WWmixing6 110 4.9 4.6 3.6 15.6 5.2 59.7 7.8 5.2 6.5 WWmixing7 151 8.3 8.13 4 33.3 7.7 28.2 25.6 5.1 0 WWmixing5 217 9.45 9.16 4 26.4 3.8 62.3 0 1.9 5.7
The inoculums used for our research were collected from the 3.600 m3 mesophilic anaerobic sewage sludge digester at the Wismar wastewater treatment plant. The sludge was taken from pressure side of the recycle sludge pump of the anaerobic digester of WWTP Wismar. A volume of the sludge was used 1,6l. The sludge collected and inoculated in water bath at 380
The micronutrients are added to the anaerobic digester to avoid the deficiency of the trace metals of the wastewater. The nutrients and micronutrients are supported by ISF Company (Germany) for our research. The nutrient solution was added to anaerobic digester according the concentration requirement is 0.19g/kg of COD.
C before add the substrate.
The sodium bicarbonate is also used for the balance of the buffer capacity of the anaerobic digestion. The concentration of sodium bicarbonates adding to digestion is 1gNaHCO3/l.
Table 3. Feeding characteristic of glycerol wastewater
Day of operation
Glycerol wastewater
Digester name
COD (g/l)
OLR (gCOD/l/day)
HRT (day)
0-4 Un-dilution B3, B4 343.5 10.74 32 5-44 Un-dilution B3, B4 343.5 2.15 160 0-41 Un-dilution Gly.1, Gly.2 343.5 1.08 320
42-51 dilution Gly.1, Gly.2 50.45 1.26 40 53-105 dilution Gly.1, Gly.2 50.45 0.95 53
106-124 dilution Gly.1, Gly.2 50.45 1.11 46 125-159 dilution Gly.1, Gly.2 50.45 0.95 53
Table 4. Feeding characteristic of mixing wastewater
Day of operation
Mixing wastewater
Digester name
COD (g/l)
OLR (gCOD/l/day)
HRT (day)
0-47 WW mixing 2 B9 62 1.94 32 48-56 WW mixing 6 B9 110 3.44 32 57-85 WW mixing 6 B9 110 2.41 46
90-110 WW mixing 6 B9 110 1.72 64 111-135 WW mixing 6 B9 110 2.06 53 136-159 WW mixing 6 B9 110 2.41 46 160-180 WW mixing 7 B9 151 2.37 64
0-5 WW mixing 5 B10 217.07 6.8 32 6-53 WW mixing 5 B10 217.07 3.4 64
54-100 WW mixing 5 B10 217.07 4.7 46
The anaerobic digester of glycerol wastewater was fed with a total feeding volume of 5-35ml/day, resulting in a hydraulic retention time (HRT) of 46-320days. The anaerobic of mixing wastewater, the total feeding volume was 25-50ml/day with the HRT of 32-64days. The details are shown in Table 3 and Table 4. The wastewater was mixed well before adding to the digesters. The temperature was maintained at 38-410C. The mixed liquid from the digesters was shacked two times per day. The pH, FOS, TAC, biogas production and biogas composition of anaerobic digester were measured.

4th International Conference on Research Frontiers in Chalcogen Cycle Science & Technology
150
2.2. Anaerobic digestion In our research 3l glass reactors were used to investigate the biogas production of glycerol wastewater and mixing wastewater. The active volume of the reactor is 1,6l. The reactors are placed in temperature controlled water bath with water temperatures in the range of 38°C to 41°C. The temperature in the rectors should vary significantly less. The temperature in the reactors can be expected to be constant at 38°C ±1°C. The mixing in the reactor is realized by intensive shaking once or twice a day. The produced biogas presses sealing water out of the gas holding vessel into the sealing water reception tank. The volume of the gas holding tank and the reception vessel are 5l. The connections of the tanks are realized by rubber tubes. The system of the bench scale digesters is shown in Figure 1.
Figure 1. Experiment design biogas production of wastewater at bench scale
In Figure 1 a slightly modified system is shown. In this system the digestate is extracted and the substrate is injected thru a submerged pipe. In this setup for the extraction of digestate and the feeding of the substrate the digesters have not to be opened and the biogas can be collected for several days. The filled gas tank can be pressurized by an elevated water reception tank and the composition of the sampled gas can be analyzed. The difference is the digestate extraction and the feeding without opening the lid of the digester and the extraction of the biogas without mixing it with air. The Sewerin SR2-DO device was used to measure the biogas composition.
2.3. Analytical methods Several monitoring parameters were evaluated during the experiment, including chemical oxygen demand (COD), total solid (TS), volatile solid (VS), pH, FOS, TAC, biogas production, and biogas composition. The Sewerin SR2-DO measures the methane and the CO2 content as well as H2S concentration. The O2-sensor was defect. The sum of CH4 and CO2 should be close to 100%. A difference to 100% of the sum of methane and CO2 can either be due to air in the biogas or to an inaccurate measurement. The Sewerin SR2-DO was regularly tested with the biogas from the sewage sludge digester of WWTP Wismar. The COD, TS and VS were measured according to standard methods for the examination of water and waste water. The FOS/TAC ratio was analyzed according to a titration test (Nord-Mann method).
The FOS and TAC value represent of the acid concentration and the buffer capacity in the fermentation substrates. The FOS abbreviates for "Flüchtuige Organische Säuren" volatile organic acids (VOA), and the unit is gram of organic acids/kg of substrate, while the TAC stands for "Totales Anorganisches Carbonat", total inorganic carbonate (alkaline buffer capacity), the unit is gram of CaCO3/kg of substrate. The FOS and TAC values were analyzed by the equipment FOS/TAC 2000 of Pronova brand. The sample was collected and gravity filtered thru paper filters before the analysis. Then we take 5 ml of the sample and add 15ml of demineralised water, after that the subsequent titration process is fully automatic. The result of FOS, the buffer capacity TAC and the FOS/TAC value are displayed after a few minutes. Biogas production was measured by the system showing in the Figure 1. The volume of water in the reception vessel is the volume of the gas production of the digester. Temperature and pressure correction have not been made, because they equalize to a minor error of less than +5%.
3. RESULTS AND DISCUSSION
3.1. Biogas production and COD elimination of glycerol wastewater at different OLR Figure 2 shows the biogas production and COD elimination in the reactor fed with only glycerol wastewater. At the OLR=10.74gCOD/l/d, the digester operated not well and deteriorated easily. At lower OLR =

Strategy of COD degradation of wastewater from the cleaning of food and fodder transportation
151
2.15gCOD/l/d the digester was well digested about 4days, and then it failed. The COD removal efficiency achieved low value, only 40%. This result confirmed that the glycerol wastewater cannot feed larger than 2gCOD/l/d. Therefore, next phase the digester operated at lower ORL. The theoretical amount of methane produced per gram of glycerol wastewater will be calculated according the formula of Buswell et al, 1930 [16].
CnHaOb + (n-a/4-b/2)H2O = (n/2+a/8-b/4)CH4+ (n/2-a/8+b/4)CO2 (1)
C3H5(OH)3 1.75 CH4 + 1.25 CO2 + 0.5 H2O (2)
The theoretical methane production from digestion of glycerol is 0.350lCH4/gCOD and is 0.426lCH4/gVS.
Figure 2. Biogas production and COD elimination at high OLR
The effect of OLR observed and showed in Figure 3. At the OLR =1.08gCOD/l/d, biogas production and COD elimination obtained about 1l/day and 80%, respectively. However, biogas production was not stable. When the OLR increased to 1.26gCOD/l/d, the anaerobic digester was inhibited and the biogas production declined. The feeding was stopped and then the digester recovered at the lower OLR, about 0.95gCOD/l/d.
0.0
2.0
4.0
6.0
8.0
10.0
12.0
0
200
400
600
800
1000
1200
0 3 6 9 12 15 18 21 24 27 30 33 36 39 42 45
OLR
(gC
OD
/l/da
y)
Bio
gas p
rodu
ctio
n (m
l/d)
Time (day)
Biogas production (B3) Biogas production (B4) OLR (gCOD/L/d)
0.0
2.0
4.0
6.0
8.0
10.0
12.0
0
20
40
60
80
0 2 4 6 8 10 12 14 16 18 20 22 24 26 28 30 32 34 36 38 40 42 44 46 O
LR(g
CO
D/l/
day)
CO
D e
limin
atio
n(%
)
Time (day)
COD elimination B3 COD eliminationB4 OLR (gCOD/L/d)
0.0
0.2
0.4
0.6
0.8
1.0
1.2
1.4
0
500
1000
1500
2000
0 7 14 21 28 35 42 49 56 63 70 77 84 91 98 105 112 119 126 133 140 147
OLR
(gC
OD
/l/da
y)
Bio
gas p
rodu
ctio
n (m
l/day
)
Time(day)
Biogas production Gly.1 Biogas production Gly.2 OLR (gCOD/L/d)
Add micronutrients

4th International Conference on Research Frontiers in Chalcogen Cycle Science & Technology
152
Figure 3. Biogas production and COD elimination at low OLR
At the OLR=0.95gCOD/l/d, the anaerobic digester performed well. The biogas production and the COD elimination achieved stable value, approach 1l/day and 90%, respectively. However, the reactor deteriorated again when the OLR increased to 1.1gCOD/l/d. Then the OLR reduced to 0.95gCOD/l/d and the digesters recovered again. The results demonstrated that the glycerol wastewater was sensitive of the organic overload. This can explain that the organic acids are formed by the fermentative acidogenic bacteria, cannot be consumed by the acetogenic or methanogenic archaeaat the same rate. Therefore the organic acids still remain in the digester, and then made the digester failed [1].
Figure 4. Biogas production yield at low OLR
The monitoring profiles of biogas production rate showed in Figure 4. Mean biogas production rate and methane yield achieved approach 454mlbiogas/gCOD/day, and 288mlCH4/gCOD/day, respectively. The biogas production yield was 82.3% of the therotical value by the Buswell formula. Our result was similar with previously research, the biogas production yield achieved about 270-358mlCH4/gCOD/day [14, 17, 18].
3.2. pH, FOS and TAC values during anaerobic digestion of glycerol wastewtaer The pH, organic acids (FOS) and buffer capacity (TAC) were measured during our experiment. The result showed that at a different OLR, the digester obtained in different of pH, organic acids and alkalinity values. Figure 5 shows the change of pH, FOS and TAC on anaerobic digestion without controlling of the buffer capacity. The pH and TAC value dropped quickly when the digester operated at high OLR between 2.15 to 10.74gCOD/l/day. The pH value dropped below 6, and the FOS value increased and remained in digester at high value (2-7g of organic acid/kg of substrate). Then the biogas production decreased and the digester failed. Later, the digester was recovered however it was not recovering due to the inhibition of organic acids.
0.0
0.2
0.4
0.6
0.8
1.0
1.2
1.4
0
20
40
60
80
100
120
140
160
180
200
0 7 14 21 28 35 42 49 56 63 70 77 84 91 98 105 112 119 126 133 140 147
OLR
(gC
OD
/l/da
y)
CO
D e
limin
atio
n(%
)
Time(day)
COD elimination of Gly.1 COD elimination of Gly.2 OLR (gCOD/L/d)
0.0
0.2
0.4
0.6
0.8
1.0
1.2
1.4
1.6
1.8
0
100
200
300
400
500
600
700
800
0 20 40 60 80 100 120 140 160 180
OLR
(gC
OD
/l/da
y)
ml/g
CO
D/d
ay
Time(day)
ml biogas/g COD/day ( Gly-1) ml biogas/g COD/day (gly-2) ml CH4/g COD/day (Gly-1)
ml CH4/g COD/day (Gly-2) OLR (gCOD/L/d)
Add micronutrients
Add micronutrients

Strategy of COD degradation of wastewater from the cleaning of food and fodder transportation
153
Figure 5. FOS, TAC and pH value at high OLR
Figure 6 shows the effect a different of OLR on biogas production and the COD elimination. The result showed clearly in first stage (from day 0-50), the pH changed and was not stable. Then the OLR reduced and buffer capacity was controlled by adding the NaHCO3. The pH values of two digesters were approximately between 7.3 and 7.7. In addition, the micronutrients were also added to digester for achieving of the trace metals requirement.
The results confirmed that the glycerol wastewater is sensitive of organic overload. From day 106-123, the OLR was increased from 0.95 to 1.1gCOD/l/day. The FOS values of the digesters increased and obtained 1.1-2.1g of organic acid/kg of substrate. The biogas production and the COD removal efficiency decreased. Then the OLR was reduced and the digesters recovered again. However, one digester is recovering slowly because the FOS value is still remaining at high value (more than 2g of of organic acids/kg of substrate).
Figure 6. FOS, TAC and pH value at low OLR
0
2
4
6
8
10
12
0
1
2
3
4
5
6
7
8
9
0 3 6 9 12 15 18 21 24 27 30 33 36 39 42 45 48
OLR
(gC
OD
/l/da
y)
pH, F
OS(
g of
org
anic
aci
ds/k
g of
subs
trat
e),
TAC
(g o
f CaC
O3/
kg o
f sub
stra
te)
Time(day)
FOS B3 TAC B3 FOS B4 TAC B4
pH B3 pH B4 OLR (gCOD/L/d)
6.0
6.5
7.0
7.5
8.0
0
2
4
6
8
10
12
0 7 14 21 28 35 42 49 56 63 70 77 84 91 98 105 112 119 126 133 140 147 154
pH
FOS(
g of
org
anic
aci
ds/k
g of
subs
trat
e) a
nd
TAC
(g o
f CaC
O3/
kg o
f sub
stra
te)
Time(day)
FOS Gly.1 FOS Gly.2 TAC Gly.1
TAC Gly.2 pH Gly.1 pH Gly.2
0.0
0.5
1.0
1.5
2.0
2.5
3.0
3.5
0.0
0.2
0.4
0.6
0.8
0 7 14 21 28 35 42 49 56 63 70 77 84 91 98 105 112 119 126 133 140 147 154
NaH
CO
3(g)
and
OLR
(gC
OD
/l/da
y)
FOS/
TAC
Time(day)
FOS/TAC Gly.1 FOS/TAC Gly.2 Add NaHCO3 (g) OLR (gCOD/L/d)

4th International Conference on Research Frontiers in Chalcogen Cycle Science & Technology
154
The FOS/TAC values are measured and confirmed for the controlling of anaerobic digestion. Our results illustrated that the FOS/TAC has to below 0.2, if higher than 0.2 the digestion will be inhibited by the organic overload. Therefore, the anaerobic digestion was controlled by the FOS/TAC ratio. The result illustrated that the FOS values below 2gram of organic acid/kg of substrate, the digester operated well and produced stable biogas. When the FOS value increased more than 2g of organic acids/kg of substrate, the digester inhibited. During the anaerobic digester operation, the TAC decreased. Then NaHCO3 was added to adjust the pH value, and to balance of organic acids. So, the sodium bicarbonate will be added for the balance of buffer capacity and maintaining the FOS/TAC ratio at suitable value.
3.3. Anaerobic co-digestion of mixing wastewater with glycerol wastewater
3.3.1. Biogas production of mixing wastewater with glycerol wastewater Biogas production and COD removal efficiency at different percentage of glycerol wastewater showed in the Figure 7 and Figure 8. At the anaerobic digestion-B9, percentage of glycerol contained higher than the anaerobic digestion- B10 (show in Table 2). The result illustrated clearly that the digester B10 operated at higher OLR than the digester B9. At the digester B9, the optimal OLR was 2.41gCOD/l/day and the limitation OLR was 3.4gCOD/l/day. However, at the digester B10, maximum of OLR was higher, about 4.7gCOD/l/day. We concluded that the glycerol wastewater is significant effected on the anaerobic digestion. Therefore, the OLR has to control when the glycerol wastewater is used for anaerobic digestion process. Our results show that the digester B9, and B10 produced 1560ml/day and 2641ml/day, respectively. Mean of the COD removal efficiency of anaerobic digestion B9 and B10 was 96% and 88%, respectively.
Figure 7. Biogas production and COD elimination during anaerobic co-digestion process (B9)
0.0
1.0
2.0
3.0
4.0
0
500
1000
1500
2000
2500
3000
3500
0 10 20 30 40 50 60 70 80 90 100 110 120 130 140 150 160 170 180 190 200
OLR
(gC
OD
/l/da
y)
Bio
gas p
rodu
ctio
n (m
L/d)
Time(day)
Biogas production of WW mixing-B9 (mL/d) OLR (gCOD/L.d)
Add micronutrients
0.0
0.5
1.0
1.5
2.0
2.5
3.0
3.5
4.0
0
20
40
60
80
100
120
140
160
180
200
0 10 20 30 40 50 60 70 80 90 100 110 120 130 140 150 160 170 180 190 200
OLR
(gC
OD
/l/da
y)
CO
D e
limin
atio
n(%
)
Time(day)
COD elimination of WW mixing- B9 OLR (gCOD/L.d)
Add micronutrients

Strategy of COD degradation of wastewater from the cleaning of food and fodder transportation
155
Figure 8. Biogas production and COD elimination during anaerobic co-digestion process (B10)
Figure 9. Biogas production rate during anaerobic co-digestion process
0.0
1.0
2.0
3.0
4.0
5.0
6.0
7.0
8.0
0
500
1000
1500
2000
2500
3000
3500
4000
4500
0 10 20 30 40 50 60 70 80 90 100
OLR
(gC
OD
/l/da
y)
Bio
gas p
rodu
ctio
n (m
L/da
y)
Time(day)
Biogas production of WW mixing-B10 OLR of WW mixing-B10
Add micronutrients
0.0
1.0
2.0
3.0
4.0
5.0
6.0
7.0
8.0
0
20
40
60
80
100
120
140
0 10 20 30 40 50 60 70 80 90 100
OLR
(gC
OD
/l/da
y)
CO
D e
limin
atio
n(%
)
Time(day)
COD elimination of WW mixing B10 OLR of WW mixing-B10
Add micronutrients
0.0
0.5
1.0
1.5
2.0
2.5
3.0
3.5
4.0
0
100
200
300
400
500
600
700
800
900
1000
0 20 40 60 80 100 120 140 160 180 200
OLR
(gC
OD
/l/da
y)
ml/g
CO
D/d
ay
Time(day)
ml Biogas/g COD/day (WW mixing-B9) ml CH4/g COD/day (WW mixing-B9)
OLR (gCOD/L.d)
0.0
1.0
2.0
3.0
4.0
5.0
6.0
7.0
8.0
0
100
200
300
400
500
600
0 10 20 30 40 50 60 70 80 90 100
OLR
(gC
OD
/l/da
y)
ml /
gCO
D/d
ay
Time(day)
ml Biogas/g COD/d (WW Mixing-B10) ml CH4/g COD/d (WW Mixing-B10)
OLR of WW mixing-B10

4th International Conference on Research Frontiers in Chalcogen Cycle Science & Technology
156
The average of biogas production rate and a methane yield of anaerobic digestion (B9) of the wastewater mixing with glycerol were 451mlbiogas/gCOD/l/day, and 333mlCH4/gCOD/l/day, respectively. At the digester B10 achieved 405mlbiogas/gCOD/l/day, and 308mlCH4/gCOD/l/day, respectively. On anaerobic co-digestion, the biogas production rate and methane composition achieved higher value than alone glycerol wastewater. The biogas composition of glycerol wastewater was 63-66% CH4, whereas the composition of CH4 in B9 and B10 were 70-76%.
3.3.2. pH, FOS and TAC values during anaerobic co-digestion with glycerol wastewater
The pH value and the FOS and TAC value of the anaerobic digestion (B9 and B10) are shown in Figure 10 and Figure 11. During the anaerobic treatment process, the pH in the reactor-B9 is not stable value when the anaerobic digester operates at high OLR. The pH value was observed mostly larger than 7.2. The sodium bicarbonates added to the digester for the adjusting the pH value and balanced the buffer capacity. The pH of reactor-B10 was approximately stable between 7.2 and 7.6. The FOS value of the reactor-B10 obtained stable value, below 2g of organic acids/kg of substrates. The TAC of the reactor-B10 was controlled by adding the sodium bicarbonate for maintaining the buffer capacity (Figure 11).
The result showed that pH, FOS, TAC values have to control if the OLR changed. When the OLR increased, the FOS value increased, TAC decreased. The sodium bicarbonate has to add for maintaining the stable operation of the digester. The FOS/TAC ratio also confirmed for the overload of the digester. This is significant indicator for controlling the anaerobic digestion. Our result demonstrated that the FOS/TAC more than 0.2, the digester deteriorated. The FOS/TAC below 0.2 is a safety for the anaerobic co-digester. Bernhard Drosg found that the alkalinity ratios below 0.3 are safe value for stable anaerobic processes. When the FOS/TAC ration is larger than 0.3, the digester declined biogas and unstable operation [19].
Figure 10. pH, FOS, TAC, and NaHCO3 value during anaerobic co-digestion process(B9)
0.0
0.5
1.0
1.5
2.0
2.5
3.0
3.5
4.0
4.5
5.0
0.0
1.0
2.0
3.0
4.0
5.0
6.0
7.0
8.0
9.0
10.0
0 10 20 30 40 50 60 70 80 90 100 110 120 130 140 150 160 170 180 190 200
OLR
(gC
OD
/l/da
y)
pH, F
OS(
g or
gani
c ac
ids/k
g of
subs
trat
e)
TA
C (g
CaC
O3/
kg o
f sub
stra
te)
Time(day)
FOS B9 TAC B9 pH B9 OLR of Wwmixing B9 (gCOD/l/d)
0
1
2
3
4
5
6
7
0.0
0.2
0.4
0.6
0.8
0 10 20 30 40 50 60 70 80 90 100 110 120 130 140 150 160 170 180 190 200
NaH
CO
3(g)
FOS/
TAC
Time(day)
FOS/TAC Mixing B9 Add NaHCO3(g)

Strategy of COD degradation of wastewater from the cleaning of food and fodder transportation
157
Figure 11. pH, FOS, TAC, and NaHCO3 value during anaerobic co-digestion process(B10)
3.4. The role of micronutrients and sodium bicarbonate on anaerobic digestion of food wastewater
Our wastewater is collected from transportation process of food and fodder. Primary experiment showed that the anaerobic digester operated well for a long time, however, the biogas production and COD removal efficiency were suddenly dropped and the digester failed (data not shown). This issue is considered in our study to avoid the deficiency of trace metal, and the organic overload of food wastewater. In addition, the micronutrients and macronutrients play an important role for the microorganisms during the anaerobic digestion process, such as: microbial growth, chemical reactions, and enzymes catalyze [20].
Recently, many researchers reported the positive effect of the micronutrients on anaerobic digester, especially on the food waste and the agricultural waste. They recommended that for the digesters using sources materials containing large amounts of metals, such as sludge or manure, the trace elements not affect to the anaerobic digester [21, 22]. However, several studies have reported that the food waste or similar wastes contains low concentration of trace elements, especially metals; this cause to the anaerobic digester failed. The result concluded that the food wastes were deficient trace elements, which caused the digester deterioration. Among the trace elements investigated (Co, Mo, Ni, Fe) for anaerobic digestion of food waste, Fe is identified as the most effective for stabilizing anaerobic digester [23]. The results also confirmed that with supplemented trace metals was enhanced the anaerobic digester operation, organic acid remained at low concentration, pH maintained almost stable value. The effect of micronutrients not investigates on the digester. However, the abundance of trace metals will be investigated in our study, on the bench scale, as well as the pilot scale.
Our results illustrated that the micronutrients had significant effect on anaerobic digestion process. Figure 4 and Figure 5 showed clearly the role of micronutrients. In the first stage (day 0 to day 50), the micronutrients did not add to the digestion. Then the biogas production and the COD removal efficiency were not stable value. Later, the micronutrients was added to the digester with the concentration is 0.19g/kg of COD. The biogas production and COD elimination of two digesters were achieved stable value. The abundance of trace metals will be analyzed and confirmed the concentration in next phase.
0
1
2
3
4
5
6
7
8
0
2
4
6
8
10
0 10 20 30 40 50 60 70 80 90 100
OLR
(g C
OD
/l/da
y)
pH, F
OS(
g of
org
anic
aci
ds/k
g of
subs
trat
e)
and
TAC
( g o
f CaC
O3/
kg o
f sub
stra
te)
Time(day)
FOS of WW mixing-B10 TAC of WW mixing-B10
pH of WW mixing-B10 OLR of WW mixing-B10
0.0
0.5
1.0
1.5
2.0
2.5
3.0
3.5
4.0
0.0
0.2
0.4
0 10 20 30 40 50 60 70 80 90 100
NaH
CO
3(g)
FOS/
TAC
Time(day)
FOS/TAC of WW mixing-B10 Add NaHCO3(g)

4th International Conference on Research Frontiers in Chalcogen Cycle Science & Technology
158
On co-substrate of mixing wastewater, our previous experiments observed the biogas production and COD elimination declined without adding the micronutrients (data not shown). Figure 8 and Figure 9 show the biogas production and the COD removal efficiency achieved stable value after the micronutrients are added to the digesters. The results illustrated clearly that the biogas production and COD elimination achieved stable after the micronutrients added. Then the problem of organic overload or suddenly decrease of biogas production is avoided.
The alkalinity ratio is early indicators of process balance of anaerobic digestion and it can define the ratio of the intermediate alkalinity (IA) over the partial alkalinity (PA). In Germany, we called this ratio is FOS/TAC (see the section 2.3). The controlling process of the biogas plant by the measurement of FOS/TAC value is easily and quickly [19]. In our research the sodium bicarbonate was added to the digester for balancing of the FOS and TAC value. The results on glycerol and mixing wastewater are shown clearly of the necessary of adding sodium bicarbonate (Figure 10 and Figure 11). During the anaerobic operation, the TAC value deceased, in addition, the FOS value increased when the OLR increased. Without adding the sodium bicarbonates, the ratio of FOS/TAC will unstable value and then the digester can be deteriorated. Previous results demonstrated that the FOS/TAC value below 0.3 is seemed a good value for stable operation of the anaerobic digestion [19, 24]. In our results illustrated that the ratio of FOS/TAC value was below 0.2, the digester operated well, after adjusting buffer capacity by adding NaHCO3 added to the digester.
4. CONCLUSIONS Anaerobic digestion of glycerol wastewater and mixing wastewater with glycerol is possible. Our results confirmed that the glycerol wastewater was sensitive of organic overload. The anaerobic digester operated stable at the OLR =0.95kgCOD/m3/day. The biogas production rate, methane yield and COD elimination achieved 418-489ml biogas/gCOD/day, 265-311mlCH4/gCOD/day and 83-89%, respectively. The anaerobic digester inhibited at the higher OLR, about 1.1kgCOD/m3
The mixing wastewater co-digestion with glycerol was suitable substrate for biogas production. The results also confirmed that co-substrate enhanced the biogas production yield. The biogas production rate, methane yield and COD elimination were 456mlbiogas/gCOD/day, 333mlCH4/gCOD/l/day and 96%, respectively. However, the OLR have to control at optimal value for the digester operate stable. The OLR of mixing wastewater will be used below 3kgCOD/m
/day.
3
ACKNOWLEDGEMENT
/day for the achieving the biogas production and COD removal efficiency. The micronutrients and the sodium bicarbonates have positive effects and are significant for requirement of trace metal and adjusting the buffer capacity during the digestion process.
This research was financially supported by the German Academic Exchange Service-DAAD. The Authors would like to thank Mr. Jan Neumann for supplying the wastewater.
REFERENCES [1] Viana, M.B., A.V. Freitas, R.C. Leitão, G.A.S. Pinto and S.T. Santaella, Anaerobic digestion of crude glycerol: a
review. Environmental Technology Reviews, 1(1), 81-92 (2012). [2] Fountoulakis, M.S., I. Petousi and T. Manios, Co-digestion of sewage sludge with glycerol to boost biogas
production. Waste management, 30(10), 1849-1853 (2010). [3] Fountoulakis, M.S. and T. Manios, Enhanced methane and hydrogen production from municipal solid waste and agro-
industrial by-products co-digested with crude glycerol. Bioresour Technol, 100(12), 3043-3047 (2009). [4] Nghiem, L.D., T.T. Nguyen, P. Manassa, S.K. Fitzgerald, M. Dawson and S. Vierboom, Co-digestion of sewage
sludge and crude glycerol for on-demand biogas production. International Biodeterioration & Biodegradation, 95, Part A(0), 160-166 (2014).
[5] Jingxing Ma, M.V.W., Marta Carballa, Willy Verstraete, Improvement of the anaerobic treatment of potato processing wastewater in a UASB reactor by co-digestion with glycerol. Biotechnology letters, 30(861–867 (2008).
[6] J.V. Oliveira, M.M.A., J.C. Costa, Optimization of biogas production from Sargassum sp. using a design of experiments to assess the co-digestion with glycerol and waste frying oil. Bioresource Technol, 175(480–485 (2015).
[7] Vahid Razaviarani, I.D.B., Shahid Malik, Hassan Katalambula, Pilot scale anaerobic co-digestion of municipal wastewater sludge with biodiesel waste glycerin. Bioresource Technol, 133(206-212 (2013).
[8] Siles, J.A., M.A. Martin, A.F. Chica and A. Martin, Anaerobic co-digestion of glycerol and wastewater derived from biodiesel manufacturing. Bioresour Technol, 101(16), 6315-6321 (2010).
[9] Luo, G., L. Xie, Q. Zhou and I. Angelidaki, Enhancement of bioenergy production from organic wastes by two-stage anaerobic hydrogen and methane production process. Bioresour Technol, 102(18), 8700-8706 (2011).
[10] Rivero, M., R. Solera and M. Perez, Anaerobic mesophilic co-digestion of sewage sludge with glycerol: Enhanced biohydrogen production. International Journal of Hydrogen Energy, 39(6), 2481-2488 (2014).
[11] Astals, S., V. Nolla-Ardevol and J. Mata-Alvarez, Anaerobic co-digestion of pig manure and crude glycerol at mesophilic conditions: biogas and digestate. Bioresour Technol, 110(63-70 (2012).
[12] Siles Lopez, J.A., L. Martin Santos Mde, A.F. Chica Perez and A. Martin Martin, Anaerobic digestion of glycerol derived from biodiesel manufacturing. Bioresour Technol, 100(23), 5609-5615 (2009).

Strategy of COD degradation of wastewater from the cleaning of food and fodder transportation
159
[13] Yang, Y., K. Tsukahara and S. Sawayama, Biodegradation and methane production from glycerol-containing synthetic wastes with fixed-bed bioreactor under mesophilic and thermophilic anaerobic conditions. Process Biochem, 43(4), 362-367 (2008).
[14] T. Vlassis, G.A., K. Stamatelatou, G.lyberatos Anaerobic Treatment of Glycerol for Methane and Hydrogen Production. Global NEST Journal, 14 No 2(149-156 (2012).
[15] Hutˇnan , M., N. Kolesarova, I. Bodik and M. Czolderova, Long-term monodigestion of crude glycerol in a UASB reactor. Bioresour Technol, 130(88-96 (2013).
[16] A.M.Buswell, S.L.N., Laboratory studies of sludge digestion. Illinois Division of State Water Survey, Bulletin No. 30 (1930).
[17] Baba, Y., C. Tada, R. Watanabe, Y. Fukuda, N. Chida and Y. Nakai, Anaerobic digestion of crude glycerol from biodiesel manufacturing using a large-scale pilot plant: methane production and application of digested sludge as fertilizer. Bioresour Technol, 140(342-348 (2013).
[18] Miroslav Hutˇnan, N.K.a.I.B., Anaerobic digestion of crude glycerol as sole substrate in mixed reactor. Environmental technology, 34(13-16), 2179-2187 (2013).
[19] Drosg, B., Process monitoring in biogas plants. IEA Bioenergy (2013). [20] Mao, C., Y. Feng, X. Wang and G. Ren, Review on research achievements of biogas from anaerobic digestion.
Renewable and Sustainable Energy Reviews, 45(0), 540-555 (2015). [21] Facchin, V., C. Cavinato, F. Fatone, P. Pavan, F. Cecchi and D. Bolzonella, Effect of trace element supplementation
on the mesophilic anaerobic digestion of foodwaste in batch trials: The influence of inoculum origin. Biochem Eng J, 70(71-77 (2013).
[22] Schattauer, A., E. Abdoun, P. Weiland, M. Plöchl and M. Heiermann, Abundance of trace elements in demonstration biogas plants. Biosystems Engineering, 108(1), 57-65 (2011).
[23] Zhang, L. and D. Jahng, Long-term anaerobic digestion of food waste stabilized by trace elements. Waste management, 32(8), 1509-1515 (2012).
[24] I.Vierinck, F.V.a., Evaluation the anaerobic digester in Netherland-Phase II. Agentschap NL, Ministerie van Econonische Zaken (2013).
BIOGRAPHY Nguyen Van Than studied Food-Biotechnology at Da Nang University of Technology, Vietnam, and graduated in 2009. He has been working at the Department of Environment-Biotechnology of College of Food Industry Da Nang, Vietnam, since 2009. Recently, he has graduated from a 2 years master program at the Department of Environmental Engineering, National Cheng Kung University, Taiwan (2011-2013). Now, he is studying at Wismar University in a Ph.D program. He participated in the laboratory work of Professor Wolfgang Pfeiffer to focus on wastewater treatment processes and anaerobic digestion operations.
He may be contacted at [email protected]

160

161
Biosorption of Zn (II) with Elemental Selenium Nanoparticles Immobilized Fungal Pellets of
Phanerochaete chrysosporium
Erika J. Espinosa-Ortiz1*, Manisha Shakya1, Eldon R. Rene1
Eric D. van Hullebush,
2 and Piet N. L. Lens
1
1 UNESCO-IHE Institute for Water Education, 2601 DA Delft, The Netherlands * [email protected] 2
Abstract
Université Paris-Est, Laboratoire Géomatériaux et Environnement (EA 4508), UPEM, 77454 Marne-la-Vallée, France
Biosorption experiments were carried out in order to ascertain the Zn (II) removal efficiency of a novel biosorbent -"Selenium nanoparticles immobilized fungal pellets" (SNIFP) of Phanerochaete chrysosporium from aqueous solution. The influence of different operational parameters such as pH, initial metal ion concentration, ionic strength and biosorbent dosage on the removal of Zn (II) was investigated. The results showed that the maximum Zn (II) removal efficiency of SNIFP was around ~80 % (30°C, pH 5.0, C0 10 mg L-1
Keywords: biosorption, P. chrysosporium, selenium nanoparticles, hybrid sorbent
). The biosorption equilibrium data was fitted to Langmuir, Freundlich, Temkin and Hurkins-Jura isotherm models. It was observed that adsorption of Zn (II) onto Se-free pellets and SNIFP followed the Langmuir and the Temkin model the best.
1. INTRODUCTION Zinc is often found in effluents of acid-mine drainage, electroplating and galvanizing plants. The presence of Zn (II) in water is hazardous to human and ecosystem due to its toxicity, bioaccumulation and persistence. The guideline value for Zn (II) in drinking water and for discharge in natural water bodies is 3 mg L-1 [1] and 5 mg L-1 [2], respectively. Once Zn (II) is released into water bodies, even at low concentrations (0.1 mg dm-
3
Different physicochemical technologies for the removal of heavy metals from wastewater, both at the lab and industrial scale, have been proposed: membrane filtration, chemical precipitation, ion-exchange, reverse osmosis, coagulation–flocculation, flotation and electrochemical methods [5]. Even though extensive research has been done on the use of these technologies, there are still some drawbacks related to their applications. Adsorption has been proposed to be one of the most effective and economic technologies to treat and recover heavy metals from water, due to its flexibility in design, operation and high quality of the treated water [5-8]. Different types of adsorbents (natural and synthetic based) have been used to remove heavy metals from wastewater.
), it can harm fish by binding in gills causing suffocation to them and other aquatic life forms [3]. The presence of Zn (II) above permissible limits causes poisoning, cancer and brain damage in humans [4].
In recent years, the use of fungi as sorbent materials has been found to be promising due to the large amount of biomass that is generated along with the easy manipulation of their genetics and morphology during its production [9-10]. Additionally, fungi have shown high tolerance towards heavy metals and they are capable of growing at low pH. They are also characterised with high cell wall binding capacity and high internal metal uptake capacity [10]. Fungal cells contain polymeric substances consisting of carbohydrates, proteins, lipid and nucleic acids which consists of negatively charged functional groups such as, carboxilate and phosphate [11] which can adsorb heavy metals [12]. Different fungal species have been used for the biosorption of heavy metals, among them, Phanerochaete chrysosporium has been studied as a sorbent material for nickel and lead [13]; Lentinus edodes for the removal of mercury, cadmium and zinc [9]; Neurospora crassa for lead and nickel [14], among others.
The use of nanoparticles as adsorbents has also recently been proven to be successful for the removal of heavy metals, which can be attributed to properties such as large surface area, enormous active sites and high activities of nanoparticles [15]. However, different problems might arise from the use of nanoparticles as

4th International Conference on Research Frontiers in Chalcogen Cycle Science & Technology
162
adsorbents such as activity loss due to agglomeration, separation difficulty and increase in pressure drop during application in flow through systems [15-16]. Recent studies have suggested the need to use hybrid adsorbents which can hold these nanoparticles into porous supports of larger size to overcome these drawbacks [17].
Recently, several previous studies have proved that P. chrysosporium are advantageous due to the following reasons; (i) ability to adsorb heavy metals [8], (ii) produce elemental selenium nanoparticles intracellularly by reducing selenite [18], and (iii) the ability of biogenically produced elemental selenium nanoparticles to adsorb heavy metals like copper [19]. This research focused on assessing the potential use of a hybrid sorbent material consisting of fungal biomass and elemental selenium nanoparticles (selenium nanoparticles immobilized fungal pellets-SNIFP) for the removal of Zn (II) from water. Although there are several studies that have reported the use of P. chrysosporium as a potential or alternative biosorbent for the removal of heavy metals, the synergetic effects and interactions between elemental selenium nanoparticles and fungal pellets for removal of heavy metals has not been addressed so far. The objective of the present study was to evaluate the capacity of selenium nanoparticles immobilized fungal pellets (SNIFP) of P. chrysosporium to bind to Zn (II). Process parameters such as pH, biomass dose, ionic strength and metal concentration affecting adsorption were investigated.
2. MATERIALS AND METHODS
2.1. Biosorbent P. chrysosporium MTCC 787T, obtained from the Institute of Microbial Technology (IMTECH), Chandigarh (India), was used in this study. Malt extract agar was used to culture P. chrysosporium at 37°C, for 3 d and stored in a refrigerator at 4°C. Fungi were precultured once every four weeks in a well defined mineral salt medium [18]. After the growth of fungal pellets, dry weight of the biomass was determined gravimetrically by filtering the biomass suspension through a 0.45 µm pore-sized filter paper (Type GF/F, Whatman Inc., Florham Park, NJ) which was previously dried (24 h at 105o
2.2. Preparation of adsorbate
C) and weighted. Fungal pellets were harvested and cleaned with excess amount of tap water and finally with Milli-Q (18 MΩ-cm) water in order to make the pellets free from the growth medium. Washing was continued until the pH of washed solution was between 6.8 and 7.2. The washed pellets were later used for biosorption experiments.
Zn (II) stock solution (1000 mg L-1
2.3. Batch experiments for biosorption
) was prepared from ZnCl2 (analytical grade). Fresh metal solutions of different concentrations were used in batch experiments which were prepared by diluting the stock solution with required volume of Milli-Q water.
Biosorption of Zn (II) was carried out in 25 mL glass vials by mixing 3 g L-1 of fungal pellets (SNIFP) in 10 mL metal solution of known concentration, pH 4.5, at 150 rpm in an orbital shaker, at 30°C for 24 h to attain equilibrium. The effect of pH on the biosorption of Zn (II) was studied by varying the initial pH (2.0-7.0) of the freshly prepared Zn (II) solution (10 mg Zn L-1) and adsorbent dose of 2 g L-1. The pH was adjusted with 1M HCl and/or 3N KOH and was measured with a pH meter (Metrohm 691). The effect of biomass dose on Zn (II) biosorption was studied by varying the biomass dose (0.8 to 4 g L-1). Solution of Zn (II) with different ionic strength (1mM Na+, 10 mM Na+ and 100 mM Na+
) were used to study the effect of ionic strength. Control experiments were carried out with Se-free biomass. Blank experiments were also conducted in the absence of any biomass.
After incubation, the aqueous phase was separated from the suspended biomass in order to determine the residual metal ion concentration, by centrifuging at 20,000 rpm for 15 min. A flame atomic absorption spectrophotometer AAS (Perkin Elmer model AAnalyst200) was used for the determination of the total metal concentration. The samples were preserved with 0.5% HNO3. The Zn (II) removal efficiency was estimated according to Eq. 1.
Removal % = C0−CeC0
× 100 Eq. 1
Where,
C0 = initial concentration of Zn (II) (mg L-1
Ce = equilibrium concentration of the Zn (II) solution (mg L)
-1
)
The metal uptake was calculated from the mass balance using Eq. 2 [20].

Biosorption of Zn (II) with Elemental Selenium Nanoparticles Immobilized Fungal Pellets of Phanerochaete chrysosporium
163
qe = v(C0−Ct)m
Eq. 2
Where, v= sample volume (L) C0= initial concentration of Zn (II) (mg L-1
Ct= final metal concentrations (mg L)
-1
m= dry biomass (g) )
qe= metal uptake capacity (mg g-1
3. RESULTS AND DISCUSSION
)
3.1. Effects of different operational parameters
3.1.1. Effect of pH The removal of Zn (II) onto the fungal biomass (SNIFP and Se-free pellets) was pH dependent, with an increase of pH leading to an increase of Zn (II) removal, reaching maximal removal efficiencies at pH 7.0 and 5.0 for Se-free pellets (Fig. 1A) and SNIFP (Fig. 1B), respectively. A rapid increase in metal removal was observed for both types of biomass when pH was increased from 2.0 to 3.0. Under acidic condition (below the pH of 3.0), the combination of binding sites with hydrogen ions decreases the negativity of functional groups present in the cell wall of fungi, leading to a decrease in biosorption capacity [21]. The maximum metal uptake capacities for SNIFP and Se-free pellets of P. chrysosporium were found to be 5.6 mg g-1 (pH 5.0) and 2.6 mg g-1
(pH 7.0), with maximum removal efficiency of ~80 and 50%, respectively. An increase in the pH from 2.0 to 4.0 led to an increase in the adsorption capacity of the fungal biomass. This could be attributed to an increase in the negative surface charge. Besides, it was also observed that, at pH > 5.0, there was no remarkable increase in the adsorption of Zn (II) which could be attributed to a limiting amount of negatively charged functional groups present in the fungal cell surface.
Figure 1. Effect of pH on Zn (II) removal efficiency: A) Se-free biomass, B) SNIFP
3.1.2. Effect of biomass dose The removal of Zn (II) depended on the biomass dose used (data not shown). Increasing the biomass dose from 0.8 g L-1 to 3.2 g L-1 for Se-free pellets and from 0.8 g L-1 to 2.4 g L-1 for SNIFP also increased the metal removal efficiency by 20% and 30%, respectively. This might be explained by the increase in the surface area of the fungus and therefore an increase in the number of available binding sites [22]. Further increase in the dose of these biosorbent did not remarkably increase the metal removal efficiency. According to Çeribasi and Yetis [13] and Sari and Tuzen [10], above certain dose of biomass, there is no increase in the adsorption capacity. The aggregation of biomass at higher dose might cause the overlapping of the metal binding sites. According to Shroff and Vaidya [22], less removal percentage achieved at high dose of biosorbent may be due to lack of sufficient metal ions in the solution compared to the dose of biosorbent. From these results, it was observed that about 3.2 g dry biomass L-1
3.1.3. Effect of ionic strength
was the optimal amount of sorbent to remove Zn (II).
The ionic strength is one of the important parameters that affect the biosorption of metals from aqueous solution. Sodium is a common element found in wastewater which can interfere with the metal uptake capacity of the biomass [23]. The results showed an inverse relation between metal uptake and ionic strength, i.e., increase in ionic concentration decreased the metal removal efficiency by both types of biomass (Fig. 2). It could be due to the increase in affinity of Zn (II) towards the Cl- ions which eventually decreased the availability of free Zn (II) for biosorption [24]. As NaCl was used to change the ionic strength of the Zn (II) solution for the experiment, increase in ionic strength increased the amount of Na+
1
2
3
4
5
6
7
01020304050607080
1 2 3 4 5 6 7 8Initial pH
Fina
l pH
Rem
oval
of
Zn (I
I) (
%)
RemovalFinal pH 1
2
3
4
5
6
7
01020304050607080
1 2 3 4 5 6 7 8
Fina
l pH
Rem
oval
of
Zn (I
I) (%
)
Initial pH
RemovalFinal pH
A) B)
ions in the solution. This

4th International Conference on Research Frontiers in Chalcogen Cycle Science & Technology
164
could lead to competition between Na+
and Zn (II) ions for the existing binding sites, and subsequently decreasing the metal removal efficiency by the pellets of P. chrysosporium [25]. These results are similar to the findings from another study [26] wherein the authors reported that intake of metal Cu (II) was inhibited with increasing concentrations of Mg (II) in water. Influence of ionic strength on the metal uptake capacity of other adsorbent (e.g., oxidised activated carbon) has also been reported in the literature [27].
Figure 2. Effect of ionic strength on Zn (II) removal efficiency
3.1.4. Effect of initial metal ion concentration The removal of Zn (II) decreased with an increase in the initial Zn (II) concentration for both Se-free pellets (Fig. 3A) and SNIFP (Fig. 3B), which can be attributed to the limited number of binding sites present in the biosorbent compared to the metal ions. In case of the Se-free biomass, the removal of Zn (II) decreased from 60% to 30% with increasing concentration of the metal solution from 10 to 50 mg L-1; whereas, in the case of SNIFP, it decreased from 82% to 38%. However, the metal uptake capacity increased from 1.9 to 8.3 mg g-1 for Se-free pellets and 2.8 to 11.3 mg g-1 for SNIFP when initial concentration of metal was increased from 10 to 50 mg L-1 respectively. The increase of metal concentration increases the metal uptake capacity of biosorbent because at initial concentration levels (10 mg L-1)m the metal binding sites become unsaturated due to the limited number of metal ions and an increase in the metal concentration will increase the number of metal ions to be adsorbed [28-30]. Apparently, the presence of nSe0 within the fungal biomass might have increased the metal uptake capacity of SNIFP compared to Se-free biomass in all the tested concentrations or it may also be attributed to the morphological changes that were occurred in the SNIFP. Besides, an increase in the metal concentration from 40 to 50 mg L-1 did not increase the metal uptake capacity of Se-free pellets. At a given dose of Se-free biomass (3 g L-1), the sorbent became saturated at 40 mg L-1 and was unable to remove Zn (II) ions above this concentration in contrast to the SNIFP that was not saturated even at 50 mg L-
1
.
Figure 3. Removal of Zn (II) at different initial metal concentrations: A) Se-free pellets, B) SNIFP
3.2. Adsorption isotherms Different models including Langmuir, Freundlich, Temkin and Harkins-Jura isotherms were used to depict the biosorption mechanism of Zn (II). Langmuir isotherm is based on the assumption that there are finite numbers of binding sites over the surface of adsorbent which are distributed homogeneously with equal
50
60
70
80
90
100
0 25 50 75 100Rem
oval
of
Zn (I
I) (%
)
Concentration of NaCl (mM)
Se-free pellets
SNIFP
0
2
4
6
8
10
12
14
0
20
40
60
80
100
0 10 20 30 40 50 60
q e(m
g g-
1 )
Rem
oval
of
Zn
(II)
(%)
Concentration (mg L-1)
Removal
qeqe 0
2
4
6
8
10
12
14
0
20
40
60
80
100
0 10 20 30 40 50 60
q e(m
g g-
1 )
Rem
oval
of
Zn
(II)
(%)
Concentration (mg L-1)
Removal
qeqe
A) B)

Biosorption of Zn (II) with Elemental Selenium Nanoparticles Immobilized Fungal Pellets of Phanerochaete chrysosporium
165
affinity for adsorption in monolayer. It is also based on the assumption that there is no interaction between the adsorbed molecules [22]. Langmuir isotherm can be represented by Eqs. 3 and 4 [31].
qe = KLqmCe1+KLCe
Eq. 3
𝑅𝐿 = 11+𝐾𝐿𝐶0
Eq. 4
Where, qe = amount of metal ion sorbed (mg g-1
qm= maximum adsorption capacity (mg g)
-1
KL= Langmuir constant (L mg)
-1
C0 = initial concentration of metal (mg L
) related to the bond energy of the adsorption reaction between metal ion and material
-1
Ce= equilibrium concentration (mg L)
-1
RL = the equilibrium parameter which could be applied to predict whether the adsorption is favorable
)
The value of RL indicates the type of isotherm to be irreversible (RL = 0), favorable (0 < RL < 1), linear (RL = 1) or unfavorable (RL > 1) [31]. Different models like Langmuir and Freundlich isotherms were used to depict the biosorption mechanism of Zn (II). Two linearized forms of Langmuir isotherms were used in this study (Eq. 5 and 6).
Ceqe
= 1qmKL
+ 1qm
Ce Eq. 5
1qe
= 1qm
+ � 1KLqm
� � 1Ce� Eq. 6
According to the Freundlich adsorption isotherm, the adsorption mechanism is non-ideal heterogeneous adsorption [32]. The mathematical description of this adsorption isotherm in aqueous systems can be expressed according to Eq. 7.
qe = KFCe1n Eq. 7
Where, qe = amount of metal ion sorbed (mg g-1
Ce = equilibrium concentration of the solute (mg L)
-1
KF = Freundlich constant )
n = constant of the system
If 1/n > 1, adsorption is favorable and its value indicates the degree of non-linearity between adsorption and solution concentration [33]. This equation is used to test the heterogeneity of the adsorption process [32]. It proves the multilayer adsorption process with interaction between adsorbed molecules [33]. For linearization of the data, the Freundlich equation can be written in the logarithmic form (Eq. 8).
log qe = log𝐾𝑓 + 1𝑛
log𝐶𝑒 Eq. 8
Temkin isotherm equation is based on the assumption that a decrease in the heat of adsorption of molecules decreases linearly with coverage due to the interaction between the adsorbent and adsorbate and there is a uniform distribution of binding energies up to a maximum limit [34]. This model was chosen to evaluate the adsorption potentials of the tested sorbent material (Eq. 9 and 10).
qe = BT(lnAT + lnCe) Eq. 9
BT = RTbT
Eq.10
Where, BT= constant related to head of adsorption (J mol-1AT= Temkin isotherm constant (L g
) -1
T = absolute temperature (K) )
R= universal gas constant, 8.314 (J mol-1 K-1
bT= Temkin isotherm constant ) and the constant β is related to the heat of adsorption

4th International Conference on Research Frontiers in Chalcogen Cycle Science & Technology
166
Harkins-Jura isotherm is applicable for the multilayer adsorption and explains the existence of a heterogeneous pore distribution [35]. This isotherm is represented by Eq. 11.
1𝑞𝑒2
= 𝐵𝐻𝐴𝐻− 𝑙𝑜𝑔𝑐𝑒
𝐴𝐻 Eq. 11
Where, AH= isotherm parameter BH= constant
The parameters obtained for each model are shown in Table 1, while the fitting of the experimental data to the different isotherms are depicted in Fig. 4.
Figure 4. Isotherm models for the adsorption of Zn (II) onto Se-free pellets and SNIFP
(A: Langmuir 1, B: Langmuir 2, C: Freundlich, D: Temkin, and E:Harkins-Jura)
y = 0.0631x + 1.4538R² = 0.8107
y = 0.0749x + 0.4351R² = 0.9968
0
0.5
1
1.5
2
2.5
3
3.5
4
0 10 20 30
Ce/q
e
Ce
y = 1.9356x + 0.0261R² = 0.9787
y = 0.469x + 0.0715R² = 0.9988
0
0.1
0.2
0.3
0.4
0.5
0.6
0 0.2 0.4 0.6
1/qe
1/Ce
y = 0.7483x - 0.0996R² = 0.9165
y = 0.4774x + 0.3937R² = 0.943
0
0.2
0.4
0.6
0.8
1
1.2
0 0.5 1 1.5
Log
qe
log Ce
A) B)
C)
y = 3.3595x - 2.4724R² = 0.9646
y = 2.903x + 1.5847R² = 0.9881
0
2
4
6
8
10
12
14
0 1 2 3 4
qe
ln Ce
D)
y = -0.2967x + 0.4052R² = 0.7602
y = -0.0927x + 0.1281R² = 0.8328
-0.10
-0.05
0.00
0.05
0.10
0.15
0.20
0.25
0.30
0.35
0 0.5 1 1.5 2
1/qe
2
Log Ce
E)

Biosorption of Zn (II) with Elemental Selenium Nanoparticles Immobilized Fungal Pellets of Phanerochaete chrysosporium
167
Table 1. Isotherm parameters for adsorption of Zn (II) onto Se-free pellets and SNIFP.
Model Parameters Se-free pellets SNIFP
Langmuir 1
qm (mg g-1 15.9 ) 13.3 KL (L mg-1 0.04 ) 0.17 R 0.81 2 0.99 RL 0.3-0.7 0.1-0.3
Langmuir 2
qm (mg g-1 38.31 ) 13.98 KL (L mg-1 0.01 ) 0.15 R 0.97 2 0.99 RL 0.6-0.9 0.1-0.4
Freundlich n 1.33 2.09 KF (mg g-1 0.79 ) 2.47 R 0.91 2 0.94
Temkin
AT (L mg-1 0.48 ) 1.71 BT (J mol-1 3.35 ) 2.903 R 0.96 2 0.99 bT 5.24 1.47
Harkins-Jura AH 10.78 10.78 BH 1.37 1.38 R 0.76 2 0.83
From the results, Langmuir 2 model fits the best (R2 =0.99) to describe the adsorption of SNIFP. According to this model, maximum metal uptake capacity of SNIFP was found to be 13.98 mg g-1 in terms of monolayer adsorption. The qm calculated was similar to the experimental value (11.3 mg g-1) of SNIFP. The adsorption of Se-free pellets also fitted well with Langmuir 2 (R2= 0.97). According to the model, qm was found to be 38.31 mg g-1, however, this value does not correspond to the experimental qm (8.3 31 mg g-1). Fitting to Langmuir 2 describes the adsorption process to occur in a homogeneous surface by monolayer sorption, with no interaction between the adsorbed molecules of Zn (II) [29]. Comparing the k2 values obtained for Se-free pellets and SNIFP from Langmuir 2 isotherms, it was found that adsorption energy involved in Zn (II) adsorption was higher for SNIFP compared to the Se-free pellets. The separation factor (RL) calculated for Se-free pellets and the SNIFP were values lower than 1 (Table 1), which indicates a favorable adsorption process. In the case of SNIFP, adsorption process was even more favorable as observed by the lowest RL values [36]. Temkin isotherm can also be used to describe the interactions between Zn (II) and the sorbent material tested in this study. According to the parameters calculated from the Temkin model, the adsorption potential of SNIFP was higher than that of the Se- free pellets, as suggested by a lower value of AT for Se-free pellets. The low values obtained for the adsorption constants of this model for both SNIFP and Se-free pellets (BT <8 kJ mol -1
4. CONCLUSIONS
) suggests that the adsorption process is not driven by ionic exchange mechanism [36].
The use of SNIFP as a novel hybrid material to remove Zn (II) from water was successfully tested in this study. The presence of elemental selenium in the fungal pellets enhanced the adsorption capacity of the fungi as observed by the higher removal efficiencies of Zn (II) when compared to Se-free pellets. Further investigation is however required to ascertain if the increase in adsorption capacity is mainly due to the change in the morphology of the fungal pellets cause by selenium, or if the metal ions are indeed interacting with the selenium nanoparticles trapped within the fungal cell. Adsorption behavior was best described by the Langmuir and Temkin isotherm models, which suggest monolayer adsorption. The results of this study further prove the benefits of treatment of heavy metal wastewater under semi-acidic conditions using SNIFP.
ACKNOWLEDGEMENT The authors thank the EU for providing financial support through the Erasmus Mundus Joint Doctorate Programme ETeCoS3
REFERENCES
(Environmental Technologies for Contaminated Solids, Soils and Sediments, grant agreement FPA no. 2010-0009).
1. WHO (2008). Guidelines for Drinking-Water Quality, Geneva.

4th International Conference on Research Frontiers in Chalcogen Cycle Science & Technology
168
2. CPCB (1993). Guidelines for the Discharge of Waste-Water in Natural Water-Bodies. New Delhi, India, in: Central Pollution Control Board (Ed).
3. Bannerman R.T., Owens D., Dodds R., Hornewer N., (1993). Sources of pollutants in Wisconsin stormwater. Water Science & Technology 28: 241-259.
4. Mishra V.K., Upadhyaya A.R., Pandey S.K., Tripathi B., (2008). Heavy metal pollution induced due to coal mining effluent on surrounding aquatic ecosystem and its management through naturally occurring aquatic macrophytes. Bioresource Technology 99: 930-936.
5. Fu F., Wang Q., (2011). Removal of heavy metal ions from wastewaters: A review. Journal of Environmental Management 92: 407-418.
6. Huang D., Zeng G., Feng C., Hu S., Zhao M., Lai C., Zhang Y., Jiang X., Liu H., (2010). Mycelial growth and solid-state fermentation of lignocellulosic waste by white-rot fungus Phanerochaete chrysosporium under lead stress. Chemosphere 81: 1091-1097.
7. Mahdavian A.R., Mirrahimi M.A., (2010). Efficient separation of heavy metal cations by anchoring polyacrylic acid on superparamagnetic magnetite nanoparticles through surface modification. Chemical Engineering Journal 159: 264-271.
8. Xu P., Zeng G.M., Huang D.L., Lai C., Zhao M.H., Wei Z., Li N.J., Huang C., Xie G.X., (2012b). Adsorption of Pb (II) by iron oxide nanoparticles immobilized Phanerochaete chrysosporium: equilibrium, kinetic, thermodynamic and mechanisms analysis. Chemical Engineering Journal 203: 423-431.
9. Bayramoglu G., Arıca M.Y., (2008). Removal of heavy mercury (II), cadmium (II) and zinc (II) metal ions by live and heat inactivated Lentinus edodes pellets. Chemical Engineering Journal 143: 133-140.
10. Sarı A., Tuzen M., (2009). Kinetic and equilibrium studies of biosorption of Pb (II) and Cd (II) from aqueous solution by macrofungus (Amanita rubescens) biomass. Journal of Hazardous Materials 164: 1004-1011.
11. Atkinson B., Bux F., Kasan H., (1998). Considerations for application of biosorption technology to remediate metal-contaminated industrial effluents. Water S. A. 24: 129-135.
12. Javanbakht V., Zilouei H., Karimi K., (2011). Lead biosorption by different morphologies of fungus Mucor indicus. International Biodeterioration & Biodegradation 65: 294-300.
13. Çeribasi I.H., Yetis U., (2004). Biosorption of Ni (II) and Pb (II) by Phanerochaete chrysosporium from a binary metal system–kinetics. Water SA 27: 15-20.
14. Kiran I., Akar T., Tunali S., (2005). Biosorption of Pb (II) and Cu (II) from aqueous solutions by pretreated biomass of Neurospora crassa. Process Biochemistry 40: 3550-3558.
15. Hua M., Zhang S., Pan B., Zhang W., Lv L., Zhang Q., (2012). Heavy metal removal from water/wastewater by nanosized metal oxides: A review. Journal of Hazardous Materials 211: 317-331.
16. Cumbal L., Gupta A.K.S., (2005). Arsenic removal using polymer-supported hydrated iron (III) oxide nanoparticles: role of Donnan membrane effect. Environmental Science & Technology 39: 6508-6515.
17. Xu P., Zeng G.M., Huang D.L., Feng C.L., Hu S., Zhao M.H., Lai C., Wei Z., Huang C., Xie G.X., (2012a). Use of iron oxide nanomaterials in wastewater treatment: A review. Science of the Total Environment 424: 1-10.
18. Espinosa-Ortiz E.J., Gonzalez-Gil G., Salikaly P.E., van Hullebusch E.D., Lens P.N. (2015). Effects of selenium oxyanons on the white-rot fungus Phanerochaete chrysosporium. Applied Microbiology and Biotechnology 99 (5): 2405-2418.
19. Igwe J., Abia A., (2006). A bioseparation process for removing heavy metals from waste water using biosorbents. African Journal of Biotechnology 5.
20. Volesky B., (1990). Biosorption of heavy metals. CRC press. 21. Lee S.-H., Park C.-H., (2012). Biosorption of heavy metal ions by brown seaweeds from southern coast of Korea.
Biotechnology and Bioprocess Engineering 17: 853-861. 22. Shroff K.A., Vaidya V.K., (2011). Kinetics and equilibrium studies on biosorption of nickel from aqueous solution by
dead fungal biomass of Mucor hiemalis. Chemical Engineering Journal 171: 1234-1245. 23. Schiewer S., Wong M.H., (2000). Ionic strength effects in biosorption of metals by marine algae. Chemosphere 41:
271-282. 24. El-Bayaa A.A., Badawy N.A., AlKhalik E.A., (2009). Effect of ionic strength on the adsorption of copper and
chromium ions by vermiculite pure clay mineral. Journal of hazardous materials 170: 1204-1209. 25. Wang T., Liu W., Xiong L., Xu N., Ni J., (2013). Influence of pH, ionic strength and humic acid on competitive
adsorption of Pb(II), Cd(II) and Cr(III) onto titanate nanotubes. Chemical Engineering Journal 215–216: 366-374. 26. Sing C., Yu J., (1998). Copper adsorption and removal from water by living mycelium of white-rot fungus
Phanerochaete chrysosporium. Water Research 32: 2746-2752. 27. Moreno-Castilla C., Álvarez-Merino M., Pastrana-Martínez L., López-Ramón M., (2010). Adsorption mechanisms of
metal cations from water on an oxidized carbon surface. Journal of Colloid and Interface Science 345: 461-466. 28. Rawat A.P., Giri K., Rai J., (2014). Biosorption kinetics of heavy metals by leaf biomass of Jatropha curcas in single
and multi-metal system. Environmental Monitoring and Assessment 186: 1679-1687. 29. Tabaraki R., Ahmady-Asbchin S., Abdi O., (2013). Biosorption of Zn(II) from aqueous solutions by Acinetobacter sp.
isolated from petroleum spilled soil. Journal of Environmental Chemical Engineering 1: 604-608. 30. Marandi R., Ardejani D., Afshar A.H., (2010). Biosorption of lead (II) and zinc (II) ions by pretreated biomass of
Phanerochaete chrysosporium. International Journal of Mining and Environmental Issues 1: 9-16. 31. Langmuir I., (1916). The constitution and fundamental properties of solids and liquids.part 1. Solids. Journal of the
American Chemical Society 38: 2221-2295. 32. Naiya T.K., Bhattacharya A.K., Mandal S., Das S.K., (2009). The sorption of lead(II) ions on rice husk ash. Journal of
Hazardous Materials 163: 1254-1264. 33. Rangabhashiyam S., Anu N., Giri Nandagopal M.S., Selvaraju N., (2014). Relevance of isotherm models in
biosorption of pollutants by agricultural byproducts. Journal of Environmental Chemical Engineering 2: 398-414.

Biosorption of Zn (II) with Elemental Selenium Nanoparticles Immobilized Fungal Pellets of Phanerochaete chrysosporium
169
34. Samarghandi M., Hadi M., Moayedi S., Askari F.B., (2009). Two-parameter isotherms of methyl orange sorption by pinecone derived activated carbon. Iranian Journal of Environmental Health Science & Engineering 6: 285-294.
35. Harkins W.D., Jura G., (1944). Surfaces of solids. XIII. A vapor adsorption method for the determination of the area of a solid without the assumption of a molecular area, and the areas occupied by nitrogen and other molecules on the surface of a solid. Journal of the American Chemical Society 66: 1366-1373.
36. Shahmohammadi-Kalalagh S., Babazadeh H., Nazemi A., Manshouri M., (2011). Isotherm and kinetic studies on adsorption of Pb, Zn and Cu by kaolinite. Caspian Journal of Environment Science 9: 243-255.

170

171
Biodegradation Kinetics of Methanol and Thiosulphate under Anaerobic Conditions
Mekonnen M. Tarekegn*
Jack van de Vossenberg and Piet N. L. Lens , Eldon R. Rene,
Environmental Engineering and Water Technology (EEWT) Department, UNESCO-IHE Institute for Water Education, Westvest 7, 2611 AX, Delft, The Netherlands *Corresponding author: [email protected]
Abstract The kinetics and biodegradation of both thiosulphate and methanol were studied under anaerobic condition using batch experiments, at ambient temperature and alkaline conditions. Mixed microbial consortia obtained from a previously operated biotrickling filter (BTF) and fresh activated sludge was used as the biomass source. The growth of biomass during batch experiments correlated well with the accumulation of sulphate and sulphide. The production of sulphide and sulphate during the first few days of incubation was almost instantaneous due to the growth of biomass. The production of hydrogen sulphide declined after the sixth day of batch incubation due to the depletion of thiosulphate substrate. Thiosulphate degradation was fast (~8 days), leading to the formation of sulphide and sulphate species. Compared to the activity of BTF acclimated biomass, the biokinetic activity of activated sludge in the lag phase of the batch experiment was low. It required additional time to acclimatize itself to the new environment containing methanol and thiosulfate. The biomass growth rate (µ) observed in the batch experiment varied between 0.002 and 0.12 h-1. The degradation rate of thiosulphate in the batch reactor during 9 days of experiment time varied between 0.02 and 0.8 per day. However, the activities of the two biomass samples were different. A maximum thiosulphate degradation rate of 0.8 d-1 was achieved in batch experiments inoculated with biomass from the BTF reactor. A maximum biomass yield coefficient of 0.7 gbiomass
gmethanol-1
Keywords: Methanol biodegradation rate, thiosulphate biodegradation rate, sulfur reducing bacteria, biomass growth rate, biotrickling filters
was recorded. The results from this study show that simultaneous removal of thiosulphate and methanol under anaerobic condition can be achieved, at high rates, using anaerobic bioreactors.
1. INTRODUCTION
Methanol gas is one of the dominant volatile organic compound (VOC) emitted from the pulp and paper industries, paint industries and petrochemical industries. About 80% of the COD of pulp and paper industry wastewater is composed of methanol. With increasing pulp and paper manufacturing, the emission of methanol gas causes serious environmental and health effects. It can also be converted into formic acid when ingested into human body and can cause blindness. It also causes serious effects on aquatic life.
In anaerobic environments, methanol can be used up by either methanogenic, acetogenic, sulphate reducing or nitrogen reducing bacteria (Balk, 2002). Methanol can also be degraded by syntrophic cultures of anaerobic microorganisms (Paulo et al., 2004). Acetate and butyrate are produced from methanol degradation in the presence of CO2 using homoacetogens (Badshah et al., 2012; Florencio, 1994). Methanogenic archaea degrade methanol gas to methane and carbon dioxide (Handley et al., 2013). In the sulphidogenic process, methanol acts as an electron donor for sulphate reducing bacteria and it is converted to CO2 while producing H2S either from sulphate or thiosulphate (Nannainga & Gottschal, 1987). However, information on anaerobic biokinetic activities like biodegradation rates of methanol and thiosulphate, biomass growth rate and biomass yield coefficient are limited in the literature. In this study, batch experiments were performed using mixed cultures in order to envisage the biomass growth rate, biomass yield coefficients, and methanol and thiosulphate biodegradation efficiencies under anaerobic conditions.

4th International Conference on Research Frontiers in Chalcogen Cycle Science & Technology
172
2. MATERIALS AND METHODS
2.1 Experimental
Experiment were performed using 500 ml bottles sealed with air tight stoppers. Biomass detached from the sponges of a continuously operated biotrickling filter (BTF) and fresh activated sludge that was taken from Harnaschpolder wastewater treatment plant was used as the inoculum. All the experiments were done in duplicates. 12.5 ml (5% the volume of growing mineral solution) of the inoculum and 250 ml of growth mineral medium (modified DSM 63) was mixed in a 500 ml bottle. Nitrogen gas was sparged to ensure the anaerobic environment in the bottle. The pH was adjusted to 8.0 with 5M NaOH and 5M HCl solution followed by the addition of 150 µl of 24.56 M methanol. Finally, the bottles were kept at a temperature of 20o
C and agitated on a horizontal orbital shaker at 175 rpm. The gas and liquid samples were collected over a period of 10 days.
2.2 Analytical and rate calculations The concentration of SO4
2- and S2O32-
were determined by ion chromatography methods (IC). The samples were filtered, diluted ten times and measured with the IC analytical instrument. Hydrogen sulphide gas in the reactor was regularly measured by gas chromatography (GC). However, concentration of sulphide ions in the liquid was determinate by measuring the spectrophotometric absorbance on UV spectrophotometer. The quantity of methanol in the liquid was determined by quantifying the amount of non purge-able organic carbon (NPOC) using TOC-L Shimadzu total organic carbon analyser. The concentration of carbon dioxide was determined by gas chromatography.
As shown in Equations 1 and 2, the degradation rate of both methanol and thiosulphate were determined by considering the change in concentration of substrate with change in concentration of biomass with time.
𝐷𝑒𝑔𝑟𝑎𝑑𝑎𝑡𝑖𝑜𝑛 𝑜𝑓 𝑡ℎ𝑖𝑜𝑠𝑢𝑙𝑝ℎ𝑎𝑡𝑒 =∆[𝑡ℎ𝑖𝑜𝑠𝑢𝑙𝑝ℎ𝑎𝑡𝑒]∆𝑡 × ∆[𝐵𝑖𝑜𝑚𝑎𝑠𝑠]
(1)
𝐷𝑒𝑔𝑟𝑎𝑑𝑎𝑡𝑖𝑜𝑛 𝑜𝑓 𝑚𝑒𝑡ℎ𝑎𝑛𝑜𝑙 𝑖𝑛 𝑡ℎ𝑒 𝑙𝑖𝑞𝑢𝑖𝑑(𝑏𝑎𝑡𝑐ℎ 𝑟𝑒𝑎𝑐𝑡𝑜𝑟) =∆[𝑁𝑃𝑂𝐶]
∆𝑡 × ∆[𝐵𝑖𝑜𝑚𝑎𝑠𝑠] (2)
3. RESULTS AND DISCUSSIONS The main metabolites in the batch experiments were sulphate, hydrogen sulphide and carbon dioxide. The accumulation of sulphate, sulphide and carbon dioxide were related to the degradation of methanol and thiosulphate in the system. Their accumulation was also directly related with the growth of biomass in the system. 3.1 Thiosulphate degradation profiles
The degradation trends of thiosulphate in both batch reactors were directly correlated with biomass activity (Figure 1). Thiosulphate biodegradation was not observed in the batch vials tested without biomass addition. However, their concentrations decreased from 0.29 to 0.27 g/L by speciation. As shown in Figure 1, there was a sharp decrease in the concentration of thiosulphate from 0.29 to 0.05 g/L in the reactor operated with acclimated biomass taken from the BTF reactor. Then, it was reduced gradually to 0.02 g/L. About 93.9 % of thiosulphate was degraded by the microorganism within 9 days. In contrast to the experiment with acclimated biomass, the thiosulphate reduction using biomass of activated sludge was slower. Its concentration decreased gradually from 0.29 to 0.02 g/L.

Microbial Kinetics and Biodegradation of Methanol and Thiosulphate under Anaerobic Conditions
173
Figure 1. Thiosulphate degradation profiles of the batch reactor
3.2 Non purgeable organic carbon (NPOC) All batch reactors contained 0.44 g/L of non purgeable organic carbon before the experiment was started. As shown in Figure 2, the trends of NPOC degradation were not clearly understood for the first two days. After 3 days of the experiment, NPOC value in the batch experiment operated with activated sludge decreased sharply by 25%, from 0.79 to 0.59 g/L. The NPOC value in the BTF acclimated biomass also decreased from 0.79 to 0.67 g/L. The profile became constant for the next three days in both batch reactors containing biomass. However, the amount of NPOC was greater in the acclimated biomass which was directly related to the amount of biomass in the reactor (BTF data not shown). Then, NPOC in the batch reactor operated with acclimated biomass decreased to 0.29 g/L. A similar trend was also observed for the other reactor operated with activated sludge as a biomass source. As a whole, it was observed that the highest degradation rate was recorded in batch reactor containing BTF acclimated biomass that was taken from the BTF reactor. The amount of 64.8% of total NPOC was degraded by the action of acclimated biomass in 9 days. In addition, 63.2% of the NPOC was degraded by activated sludge biomass.
Figure 2 NPOC profile of the batch experiment
3.3 Carbon dioxide profiles The production of carbon dioxide in different setup of the batch experiment shows different trends. As illustrated in Figure 3, the initial concentration of carbon dioxide was about 4.9×10³ ppmv. The batch operation without biomass showed no production of carbon dioxide. However, there was an increase in the carbon dioxide gas in case of experiment operated with acclimated biomass from the BTF reactor and biomass of activated sludge. The trends of carbon dioxide in the acclimated biomass showed higher production of carbon dioxide for the first 6 days as compared to biomass of activated sludge. The maximum amount of 4.1×10⁴ ppmv carbon dioxide was produced in the eighth day of the experiment time. Then, it
0.00
0.05
0.10
0.15
0.20
0.25
0.30
0.35
1 2 3 4 5 6 7 8 9 10
Thi
osul
phat
e con
cent
ratio
n, g
/L
Time, days
Without biomass
Acclimated biomass from the BTF reactor Activated sludge
0
0.2
0.4
0.6
0.8
1
1 2 3 4 5 6 7 8 9 10
NPO
C,
g/L
Time, days
Without biomass
Acclimated biomass from the BTF reactor Activated sludge

4th International Conference on Research Frontiers in Chalcogen Cycle Science & Technology
174
decreased sharply to 3.2×10⁴ ppmv. On the contrary to acclimated biomass, carbon dioxide production rate in the experiment operated with activated sludge biomass was slower for the first three experiment days. It increases slowly from 3.1×10⁴ ppmv to 3.4×10⁴ ppmv. Then, it increased sharply to 5.1×10⁴ ppmv. Finally, it declined to 3.7×10⁴
ppmv. The difference between results of the duplicate for the reactors was insignificant.
Figure 3 Carbon dioxide profile of the batch experiment
3.4 Sulphate degradation profiles Sulphate was produced as one of the metabolite of thiosulphate degradation in the batch reactor. Its production rate was different under the three tested conditions of biomass. As shown in Figure 4; the rate of sulphate production in the batch reactors was related to the biomass activity. A batch reactor without biomass has very small production of sulphate. It has the maximum production of 0.05 g/L within the period of 9 days. The production of sulphate in the reactor containing an acclimated biomass taken from the BTF reactor increased sharply to 0.12 g/L on the fifth day. There was a slow growth of sulphate production in the batch experiment operated with activated sludge as a biomass source. It grew up slowly until a maximum sulphate amount of 0.13 g/L.
Figure 4 Sulphate formation profiles of the batch reactor
0
10000
20000
30000
40000
50000
60000
1 2 3 4 5 6 7 8 9 10
Car
bond
ioxi
de co
ncen
trat
ion,
ppm
v
Time, days
Without biomass
Acclimated biomass from the BTF reactor Activated sludge
0
0.02
0.04
0.06
0.08
0.1
0.12
0.14
0.16
1 2 3 4 5 6 7 8 9 10
Sulp
hate
con
cent
ratio
n, g
/L
Time, days
Without biomass
Acclimated biomass from the BTF reactor Activated sludge

Microbial Kinetics and Biodegradation of Methanol and Thiosulphate under Anaerobic Conditions
175
3.5 Hydrogen sulphide As shown in Figure 5, sulphide production was correlated to the biomass activity and thiosulphate degradation process in the reactor. There was no hydrogen sulphide production observed in the batch reactor without biomass. Hydrogen sulphide gas production in the reactor using acclimated biomass increased sharply during the first four days and reached a maximum peak concentration of 4.2×10⁴ ppmv. Then, it declined slightly to 7.3×10³ ppmv within the next five days. The production trend of hydrogen sulphide inside the batch reactor operated with activated sludge as a biomass source was similar to the batch reactor operated with acclimated biomass from the BTF reactor. However, the quantity of sulphide gas production using activated sludge was much less. The maximum amount of hydrogen sulphide produced in the batch reactor containing activated sludge as a biomass source was 2.4×10⁴
ppmv.
Figure 5 Hydrogen sulphide production trends of the batch reactor
3.6 Biomass growth profile
Initially, 0.04 and 0.23 g/L of biomass were present in the batch experiment operated using activated sludge and BTF reactor acclimated biomass, respectively. As shown in Figure 6; the biomass in both reactors increased exponentially during the first two days, then it showed gradual increase and finally it became almost constant. The biomass growth trend in the reactor operated by BTF acclimated biomass slightly declined after 7 days. The maximum biomass amount recorded in this reactor was 1.7 g/L. However, the trend of biomass growth in the reactor containing activated sludge was gradually increasing until 9 days. A maximum biomass amount of 2.1 g/L was attained within 9 days in the reactor containing activated sludge.
Figure 6 Biomass profiles of batch reactors
0 5000
10000 15000 20000 25000 30000 35000 40000 45000 50000
1 2 3 4 5 6 7 8 9 10
H2S
con
cent
ratio
n, p
pmv
Time, days
Acclimated biomass from the BTF reactor Activated sludge
Without Biomass
0.0
0.5
1.0
1.5
2.0
2.5
1 2 3 4 5 6 7 8 9 10
Bio
mas
s con
cent
ratio
n, g
pro
tein
/L
Time, days
Acclimated biomass from the BTF reactor
Activated sludge

4th International Conference on Research Frontiers in Chalcogen Cycle Science & Technology
176
3.7 Biokinetic activities The growth of biomass in the batch reactors was correlated to the biodegradation profiles of thiosulphate and methanol, biomass growth rate and yield coefficient expressed as kinetic activities of biomass in the reactor. 3.7.1 Degradation of thiosulphate The biodegradation rate of thiosulphate in the batch reactor during 9 days of experiment varied from 0.02 to 0.8 per day. However, the activities of the two biomass were different. The maximum thiosulphate degradation rate 0.8 d-1
was achieved in the batch experiment operated with biomass taken from the BTF reactor.
3.7.2 Degradation of methanol The biodegradation rate of methanol in the batch experiment operated with biomass from a previously used BTF varied between 0.02 and 0.74 mg/L MeOH per mg/L biomass per day. However, more MeOH was degraded in the reactor operated with the activated sludge as a biomass source. The degradation rate of NPOC in the reactor was found to vary between 0.52 and 1.5 mg/L MeOH per mg/L biomass per day. 3.7.3 Biomass growth Kinetics The biomass growth rate (µ) observed in the batch reactor varied from 0.04 to 1.7 d-1. The growth rate during the initial stages of experiments were higher (1.7 d-1) than the rates achieved during the last few days of experimentation (0.04 d-1). The observed biomass yield coefficient in the reactor was about 0.7 g(biomass). (gMeOH)-1
.
4. CONCLUSION
Simultaneous biodegradation of methanol and thiosulphate in batch systems showed promising results. The biomass used methanol as its carbon source and thiosulphate as an electron acceptor, at a temperature of 20
o
C, pH 8.0 and pressure of 1 atm. Biodegradation of thiosulphate was very fast and it become a limiting substrate for the biodegradation of methanol in the system.
ACKNOWLEDGEMENTS The authors would like to acknowledge NFP for funding the MSc study of Mekonnen at UNESCO-IHE. We thank our laboratory staffs for providing full analytical support.
REFERENCES
[1] Badshah, M., Parawira, W., Mattiasson, B. 2012. Anaerobic treatment of methanol condensate from pulp mill compared with anaerobic treatment of methanol using mesophilic UASB reactors. Bioresource Technology, 125, 318-327.
[2] Balk, M. 2002. Thermotoga lettingae sp. nov., a novel thermophilic, methanol-degrading bacterium isolated from a thermophilic anaerobic reactor. International Journal of Systematic and Evolutionary Microbiology, 52(4), 1361-1368.
[3] Florencio, L. 1994. The Fate of Methanol in Anaerobic Bioreactors. PhD thesis. [4] Handley, K.M., VerBerkmoes, N.C., Steefel, C.I., Williams, K.H., Sharon, I., Miller, C.S., Frischkorn, K.R., Chourey,
K., Thomas, B.C., Shah, M.B., Long, P.E., Hettich, R.L., Banfield, J.F. 2013. Biostimulation induces syntrophic interactions that impact C, S and N cycling in a sediment microbial community. The ISME Journal, 7(4), 800-16.
[5] Nannainga, H.J., Gottschal, J.C. 1987. Properties of Desulfovibrio carbinolicus sp. nov. and other sulfate-reducing bacteria isolated from an anaerobic-purification plant. Applied and Environmental Microbiology, 53(4), 802-809.
[6] Paulo, P.L., Vallero, M.V., Trevino, R.H., Lettinga, G., Lens, P.N. 2004. Thermophilic (55 degrees C) conversion of methanol in methanogenic-UASB reactors: influence of sulphate on methanol degradation and competition. Journal Biotechnology, 111(1), 79-88.

177

178

179

180

Proceedings of the 4th International Conference on Research Frontiers in Chalcogen Cycle Science & Technology
g16.unesco-ihe.org
Delft | The Netherlands | May 2015