Embed Size (px)
Citation preview
/…
For reasons of economy, this document is printed in a limited number. Delegates are kindly requested to bring their copies to meetings and not to request additional copies
CBD
CONVENTION ON BIOLOGICAL DIVERSITY
Distr. GENERAL UNEP/CBD/SBSTTA/9/INF/7 14 October 2003 ENGLISH ONLY
SUBSIDIARY BODY ON SCIENTIFIC, TECHNICAL AND TECHNOLOGICAL ADVICE
Ninth meeting Montreal, 10-14 November 2003 Item 5.3 of the provisional agenda*
* UNEP/CBD/SBSTTA/9/1.
REPORT OF THE EXPERT MEETING ON INDICATORS OF BIOLOGICAL DIVERSITY INCLUDING INDICATORS FOR RAPID ASSESSMENT OF INLAND WATER ECOSYSTEMS
Note by the Executive Secretary
INTRODUCTION
A. Background
13. In its decision VI/7 B, the Conference of the Parties to the Convention on Biological Diversity requested the Executive Secretary to convene a meeting of an expert group to further develop the three annexes to the note by the Executive Secretary on ongoing work on indicators prepared for the seventh meeting of the Subsidiary Body on Scientific, Technical and Technological Advice (UNEP/CBD/SBSTTA/7/12). Those annexes concerned:
(a) Principles for developing national-level monitoring and indicators;
(b) A set of standard questions for developing national-level indicators; and
(c) A list of available and potential indicators based on a conceptual framework that has qualitative and quantitative approach.
14. Paragraph 4 of decision VI/7 B provided guidance on the content and structure of the report to be prepared by the Executive Secretary for consideration by the Subsidiary Body on Scientific, Technical and Technological Advice (SBSTTA) prior to the seventh meeting of the Conference of the Parties.
15. In response to this decision, the Executive Secretary organized a meeting of experts in Montreal from 10 to 12 February 2003, with financial support from the Government of the United Kingdom of Great Britain and Northern Ireland. The members of the expert group were selected by the Executive Secretary, in consultation with the Bureau of SBSTTA, from nominations provided by national focal
UNEP/CBD/SBSTTA/9/INF/7 Page 2
/…
points of the Convention on Biological Diversity in accordance with the modus operandi of SBSTTA (decision IV/16, annex I). The experts were selected on the basis of their expertise in the relevant field, and with due regard to geographical representation, to the special conditions of least developed countries and small island developing States, and to gender.
B. Attendance
16. The meeting was attended by government-nominated experts from Antigua and Barbuda, Argentina, Australia, Canada, Costa Rica, Cuba, the Czech Republic, Egypt, France, Kenya, Lebanon, Namibia, the Netherlands, New Zealand, Niger, Palau, Tajikistan, Ukraine and the United Kingdom, and representatives of the following United Nations, intergovernmental and non-governmental organizations: Food and Agriculture Organization of the United Nations (FAO), Ramsar Convention on Wetlands, European Centre for Nature Conservation (ECNC), UNEP-World Conservation and Monitoring Centre, IUCN/SSC Biodiversity Assessment Initiative, German Agency for Technical Cooperation (GTZ) in Mauritania, Québec Ministry of Environment and Statikron. The full list of participants is attached as annex I.
C. Proceedings
ITEM 1. OPENING OF THE MEETING
17. The Meeting was opened by a representative of the Executive Secretary of the Convention on Biological Diversity at 9.30 a.m., on Monday, 10 February 2003. In his statement, he welcomed the participants and thanked them for making available their time and expertise to contribute to the implementation of the Convention and the important theme on indicator development.
ITEM 2. ORGANIZATIONAL MATTERS
2.1. Election of officers
18. At the opening session, participants from Antigua and Barbuda and Canada were selected as Co-Chairs of the meeting.
2.2. Adoption of the agenda
19. The Expert Meeting adopted the following agenda on the basis of the provisional agenda (UNEP/CBD/EM-Indicators/1/1):
1. Opening of the meeting.
2. Organizational matters:
2.1. Election of Chairperson;
2.2. Adoption of the agenda;
2.3. Organization of work.
3. Design of national-level monitoring programmes and indicators including those for the rapid assessment of inland water ecosystems.
UNEP/CBD/SBSTTA/9/INF/7 Page 3
/…
3.1 Further development of the principles for developing national-level monitoring and indicators;
3.2 Further development of the set of standard questions for developing national-level indicators;
3.3 Further development of the list of indicators based on a conceptual framework.
4. Other matters.
5. Adoption of the report.
6. Closure of the meeting.
2.3. Organization of work
20. A member of the Secretariat gave a brief presentation outlining the function and structure of the Convention on Biological Diversity and the objectives of the meeting. Participants agreed on the proposed organization of work, keeping it flexible to allow for working groups as the need arose. ITEM
3. ISSUES FOR IN-DEPTH CONSIDERATION
3.1 Further development of the principles for developing national-level monitoring and indicators
21. The following presentations were made and discussed:
(a) Louisa Nakanuku: Towards developing a core set of terrestrial biodiversity indicators for the Namibian State of the Environment reporting;
(b) Ben ten Brink: The National Capital Index framework and its application in the Netherlands, the European Union and the Global Environment Outlook;
(c) Vasyl Prydatko: Development of agro-biodiversity indicators in Ukraine within the framework of the UNEP-GEF project on Biodiversity Indicators in National Use (BINU);
(d) Victoria Froude: Lessons learned in the development of terrestrial biodiversity indicators in New Zealand;
(e) Ben Delbaere: Overview of indicator development at the European level;
(f) Linda Collette: FAO-led processes in indicator development in agriculture, fisheries and forestry;
(g) Aref Dia: Benthic macroinvertebrates as indicators of water quality in Lebanon and other Mediterranean countries;
(h) Diann Black Layne: The development of biodiversity indicators within the islands of the Organization of Eastern Caribbean States;
(i) Andrew Stott: The use of headline indicators in the England Biodiversity Strategy;
(j) Richard Norris: Biodiversity indicators: experiences from Australia’s National River Health Programme;
UNEP/CBD/SBSTTA/9/INF/7 Page 4
/…
(k) Nick Davidson: The Ramsar Convention’s guidance on indicators, monitoring and risk assessment;
(l) Risa Smith: The process of developing a Canadian Biodiversity Index;
(m) Janice Long: The availability of Red List data and the development of guidelines for the implementation of the Red List at a regional level.
22. These presentations summarized ongoing processes, tools and lessons learned on the development and application of biodiversity indicators. A number of principles emerged from the discussions, which were considered together with the principles listed in the background document and further elaborated and refined in a group discussion. It was considered important to distinguish principles relating to indicators from those on monitoring and to clarify the different types of monitoring requiring different methods and indicators. It was agreed that further work on these principles needed to be carried out before they could be endorsed by the group (see item 4 below).
3.2 Further development of the set of standard questions for developing national-level indicators
23. Initially two groups worked in parallel on the further development of the set of standard questions. Following discussion of the results it was felt important to further organize the questions. One overarching question relating to each indicator type (drivers, pressures, state, impact and response) and each of the three principal objectives of the Convention should be followed by more specific questions relating to the levels of biological organization and the categories of Annex I to the Convention. A working group refined the set of standard questions on this basis and developed a table with overarching questions. It was, however, found useful to also reconsider the questions listed in the background paper on recommendations for a core set of indicators of biodiversity prepared by the liaison group on indicators of biodiversity for the third meeting of SBSTTA (UNEP/CBD/SBSTTA/3/Inf.13). It was agreed that further work on the standard questions needed to be carried out before they could be endorsed by the group (see item 4 below).
3.3. Further development of the list of indicators based on a conceptual framework
24. The list of indicators and variables relating to inland water biological diversity was organized in a systematic way to demonstrate the indicator types and key areas to which they relate. Three tested composite impact indicators were listed as examples of many that may be available (natural capital index, Red List index, species assemblage indicators). Similar efforts are still required to reorganize the indicators for the other thematic areas but similar categories may be appropriate. It was agreed that further work on the list of indicators needed to be carried out before they could be endorsed by the group (see item 4 below).
ITEM 4. OTHER MATTERS
25. In the concluding plenary session required follow-up activities were discussed.
(a) Further work on the three annexes:
(i) Principles: Separate sets of principles need to be developed to distinguish:
• Principles relating to the development of indicators capable of satisfying the needs of politicians and the general public;
• Principles relating to the underlying science;
UNEP/CBD/SBSTTA/9/INF/7 Page 5
/…
• Principles relating to the different levels of monitoring of the Convention on Biological Diversity (monitoring of management interventions, surveillance monitoring, research monitoring, operational monitoring, monitoring of implementation, state of the environment monitoring);
• Background thoughts and lessons learned on indicator development;
It was agreed that all participants will contribute comments and Victoria Froude (substitute: Andrew Stott) should coordinate the further development of this part of the document.
(ii) Questions: These should be separated into a first level (three objectives of the Convention on Biological Diversity, three-five indicator types depending on the use of DPSIR (driver, pressure, state, impact, response) or PSR (pressure, state, response) model) and second level (relevant to the thematic areas under the Convention on Biological Diversity, level of biological organization and Annex I to the Convention) set of questions. The second-level questions should focus on State/Impact, i.e. status and trends of biological diversity and only refer to driver, pressure and response indicators. It was agreed that all participants should contribute comments and Diann Black-Layne would coordinate the further development of this part of the document;
(iii) Indicators: These should be limited to indicators related to the quantity and/or quality of biodiversity and be presented as a menu and related to categories/headlines. It was considered useful to separate general indicators (e.g. Red List data index) from those related to specific thematic areas (e.g. algae index). It was agreed that all participants should contribute comments and that Richard Norris (substitute: Ben ten Brink) would coordinate the further development of this part of the document
(b) Timetable: the Secretariat would seek to make arrangements to ensure that the coordinators will be in a position to contribute to the further development as required. The following deadlines were agreed:
Draft meeting report: week of 17-21 February 2003
First draft of complete document mid April 2003
Revised draft of complete document end of April 2003
Peer review completed end of May 2003
Meeting of coordinators end of May 2003
Final document 10 June 2003
(c) Other elements and observations:
(i) The Secretariat was requested to provide a working description with examples of the DPSIR model in consultation with other organizations and taking into account the need for harmonization. The OECD description does not address biodiversity adequately;
(ii) It is important to explain the use of terms through a glossary or footnotes
(iii) Participants who have not done so should write up their case study examples focusing on the approach, the specific indicators chosen, why the approach was
UNEP/CBD/SBSTTA/9/INF/7 Page 6
/…
taken, and lessons learned. These case studies will be published on the website and will serve as reference and a nucleus of an information base;
(iv) Fact sheets (1-2 pages) must be prepared for each indicator with standard information on assessment principles, meaning/interpretation, methods including required variables, thematic area(s) for which the indicator applies, and references to a more extensive description of the methodologies;
(v) Ben ten Brink will develop a manual for an implementation plan;
(vi) There is a restricted web site for sharing information, which needs further organization to make it easier for new experts to enter into the process. The long-term objective is to develop a searchable database under the Convention’s clearing house mechanism;
(vii) The Convention Secretariat needs to ensure the necessary coordination with other international initiatives including the United Nations Convention to Combat Desertification, the European Environment Agency (EEA), the Pan-European Biodiversity Monitoring Network, FAO, the Millennium Ecosystem Assessment;
(viii) Capacity-building for indicator development should be included in ongoing initiatives on capacity-building.
ITEM 5. ADOPTION OF THE REPORT
26. The Group agreed to adopt its report after the inter-sessional work. The result of the inter-sessional work are contained in annex II below.
ITEM 6. CLOSURE OF THE MEETING
27. The meeting was closed at 4:30 p.m. on Wednesday 12 February 2003 by the meeting Co-Chairs, Ms Diann Black Layne and Dr. Risa Smith.
UNEP/CBD/SBSTTA/9/INF/7 Page 7
/…
Annex I
LIST OF PARTICIPANTS
GOVERNMENTS Antigua and Barbuda Ms. Diann Black Layne Chief Environmental Officer Environment Division Ministry of Tourism and Environment Governments Buildings #2 Queen Elizabeth Highway St. John's Antigua, Antigua and Barbuda Tel.: +1 268 462 4625 / 460-7278 Fax: +1 268 462 6398 E-Mail: [email protected] Argentina Lic. Sara Beatriz Sverlij Coordination for Biodiversity Conservation Secretariat of Environment and Sustainable Development San Martin 451 Suite 248 1004 Ciudad Autónoma de Buenos Aires, Argentina Tel.: +54 11 4348 8502 Fax: +54 11 4348 8554 E-Mail: [email protected] [email protected] Australia Dr. Richard H. Norris Program Leader Water Quality and Ecological Assessment, CRC for Freshwater Ecology University of Canberra Canberra 2601, Australia Tel.: +61 2 6201 2543 Fax: +61 2 6201 5038 E-Mail: [email protected] Canada Dr. Risa B. Smith Director, Knowledge Integration Directorate National Indicators and Reporting Office Environment Canada 351 St-Joseph Blvd., 9th Floor Place Vincent Massey K1A 0H3 Hull, Pr. Quebec, Canada Tel.: +(819) 994 9570 Fax: +(819) 994 5738 E-Mail: [email protected]
Costa Rica Mr. Gerardo Umaña Villalobos, M.Sc. Profesor Asociado y investigador adjunto Centro de Investigación en Ciencias del Mar y Limnología Escuela de Biología Universidad de Costa Rica Costa Rica Tel.: +506 207 3201 Fax: +506 207 3280 E-Mail: [email protected] Cuba Dr. Teresita Borges Hernández Officer Department of Environment Ministry of Science, Technology and Environment Capitolio Nacional La Habana 1200, Cuba Tel.: +53 7 8670598 Fax: +53 7 8670615 E-Mail: [email protected] [email protected] Czech Republic Mr. David Vackár Agency for Nature Conservation and Landscape Protection of the Czech Republic Kalisnicka 4-6 13023 Prague 3, Czech Republic Tel.: +420 2 8306 9212 Fax: +420 2 6970 012 E-Mail: [email protected] Egypt Mr. Waheed Salama Hameid Nature Conservation Sector Egyptian Environmental Affairs Agency 30 Misr-Helwan road Maadi Cairo, Egypt Tel.: +202 524 8729, 527 1391 Fax: +202 524 8729, 527 1391 E-Mail: [email protected]
UNEP/CBD/SBSTTA/9/INF/7 Page 8
/…
France Dr. Sylvain Joseph Ernest Dolédec CNRS 5023 Ecologie des Hydrosystèmes Fluviaux Bât Darwin C 43 Bd du 11 novembre 69622 Villeurbanne CEDEX, France Tel.: +33 4 72431363 Fax: +33 4 72431141 E-Mail: [email protected] Kenya Ms. Grace N.W. Thitai Head, Monitoring and Evaluation Kenya Wildlife Service Ministry of Environment, National Resources and Wildlife B.O. Box 40421 Nairobi, Kenya Tel.: +254 2 600 543, 501 081 Fax: +254 2 504 133 E-Mail: [email protected] [email protected]; CM&[email protected] Lebanon Dr. Aref Dia Chercheur : Eaux courantes Centre National de la Recherche Scientifique Libanais Conseil National de la Recherche Scientifique P.O. Box 8281-11 Beirouth, Lebanon Tel.: +961 840 260 Fax: +961 1 822 639 E-Mail: [email protected] [email protected] Namibia Ms. Louisa Ogry Nakanuku Infocom Project Coordinator Directorate of Environmental Affairs (DEA) Ministry of Environment and Tourism (MET) P. O. Box 22910 Windhoek Namibia Tel.: +264 61 249015 Fax: +264 61 240339 E-Mail: [email protected] ; [email protected] New Zealand Ms. Victoria Froude Principal Pacific Eco-Logic Limited 18 Seaview Road Paremata Porirua City, New Zealand Tel.: +64 4 233 9823 Fax: +64 4 233 9817 E-Mail: [email protected]
Niger Ms. Solange Bako Safi Mody Hainikoye Conseiller Secrétariat Exécutif Conseil National de l'Environnement pour un Développement Durable BP 10193 Niamey, Niger Tel.: +227 72 25 59 Fax: +227 72 29 81 E-Mail: [email protected] Palau Ms. Portia Franz Researcher Palau Community College Cooperative Research & Extension P.O. Box 9 Koror, PW 96940, Palau Tel.: +680 488 2471/2746 Fax: +680 488 3307 E-Mail: [email protected] Tajikistan Ms. Tatyana Novikova National Consultant “National Strategy and Action Plan on Biodiversity Conservation” Project. Aini Str. 44 Dushanbe, Tajikistan Tel.: +992 372 218978, 274490 Fax: +992 372 21 89 78 E-Mail: [email protected] [email protected] The Netherlands Mr. Ben ten Brink RIVM A. van Leeuwenhoeklaan 9 3721 MA Bilthoven The Netherlands Tel.: +31 30 274 2210 Fax: +31 30 274 4419 E-Mail: [email protected] Ukraine Dr. Vasyl I Prydatko Senior Specialist, Projects (Ph.D Biology) Ukrainian Land and Resource Management Center (ULRMC) 13 Chokolivsky Boulevard Kyiv 03186, Ukraine Tel.: +380 44 230 2266 Fax: +380 44 230 2267 E-Mail: [email protected] Web: http://www.ulrmc.org.ua
UNEP/CBD/SBSTTA/9/INF/7 Page 9
/…
United Kingdom of Great Britain and Northern Ireland Dr. Andrew Stott Head Wildlife and Countryside Science Unit Department of Environment, Food and Rural Affairs (Defra) Rm 1/09 Temple Quay 2 The Square, Temple Quay BS1 6EB Bristol, United Kingdom Tel.: +44 117 372 8445 Fax: +44 117 372 8182 E-Mail: [email protected] Organizations Ms. Linda Collette Senior Officer, Seed and Plant Genetic Resources Service Plant Production and Protection Division, Agriculture Departement Food and Agriculture Organization of the United Nations (FAO) Via delle Terme di Caracalla Rome 00100, Italy Tel.: +39 06 570 52089 Fax: +39 06 5705 3152,/533 69 E-Mail: [email protected] Web: http://www.fao.org Dr. Nick Davidson Deputy Secretary General Ramsar Convention on Wetlands Rue Mauverney 28 CH-1196 Gland, Switzerland Tel.: +41 22 999 0171 Mobile tel: +41 79 290 2622 Fax: +41 22 999 0169 E-Mail: [email protected] [email protected] Mr. Ben Delbaere Senior Programme Coordinator on Biodiversity European Centre for Nature Conservation (ECNC) PO Box 90154 5000 LG Tilburg, The Netherlands Tel.: +31 13 5944944 Fax: +31 13 5944945 E-Mail: [email protected] Web: http://www.ecnc.nl Mr. Martin Jenkins UNEP-WCMC 219 C Huntingdon Road Cambridge United Kingdom of Great Britain and Northern Ireland Tel.: +44 (0) 1223 277 314 Fax: +44 (0) 1223 277 136 E-Mail: [email protected]
Ms. Janice Long Programme Officer CI/CABS - IUCN/SSC Biodiversity Assessment Initiative c/o Center for Applied Biodiversity Science Conservation International 1919 M Street, NW Washington DC 20036, United States of America Tel.: +1 202 912 1548 Fax: +1 202 912 0772 E-Mail: [email protected] Mr. Brahim Sall Technical Advisor, Specialist of Dry and Sub-humid Lands German Agency for Technical Cooperation (GTZ) Nouakchott Mauritania Tel.: +222 529 8525 Fax: +222 525 4423 E-Mail: [email protected] Observers Mr. Jean-Pierre Drapeau Secrétaire Comité interministériel du développement durable Ministère de l'Environnement du Québec Edifice Marie-Guyart, 4ème étage 675, Bd. René Levesque Est, case 21 G1R 5V7 Québec, Canada Tel.: +418 521 3907, poste 4780 Fax: +418 646 6169 E-Mail: [email protected] Dr. Wafa A. Hosn Consultante, Environnement - Statistiques Statikron Consultants 89 Boul. Beaconsfield Beaconsfield Quebec Canada Tel.: +1 514 426 9801 +1 514 803 7828 Fax: +1 514 426 8831 E-Mail: [email protected] Secretariat Mr. Jo Kalemani Mulongoy Principal Officer STTM Secretariat of the Convention on Biological Diversity 393 St. Jacques Office 300 Montreal Quebec H2Y 1N9 Canada Tel.: +1 514 287 7027 Fax: +1 514 288 6588 E-Mail: [email protected]
UNEP/CBD/SBSTTA/9/INF/7 Page 10
/…
Mr. Robert Höft Programme Officer Secretariat of the Convention on Biological Diversity 393 St. Jacques Office 300 Montreal Quebec H2Y 1N9 Canada Tel.: + 1-514-2877028 Fax: +1 514 288 6588 E-Mail: [email protected]
Ms. Juliane ZEIDLER Programme Officer, Dry and Sub-humid lands STTM Secretariat of the Convention on Biological Diversity World Trade Centre 393 St-Jacques, #300 H2Y 1N9 Montreal Quebec Canada Tel.: +1 514 287 7038 Fax: +1 514 288 6588 E-Mail: [email protected]
UNEP/CBD/SBSTTA/9/INF/7 Page 11
/…
Annex II
DESIGNING NATIONAL-LEVEL MONITORING PROGRAMMES AND INDICATORS
EXECUTIVE SUMMARY
Pursuant to the request in decision VI/7-B (paragraph 3), the Executive Secretary convened an expert meeting to further develop the three annexes to the note of the Executive Secretary on ongoing work on indicators. The meeting was held in Montreal from 10 to 12 February 2003. Following the guidance provided in paragraph 4 of the same decision, the group of experts prepared, during its meeting and in subsequent inter-sessional work, a report containing: (i) a set of principles for indicator development in the form of a guiding manual on indicator development; (ii) a list of key questions with reference to the relevant articles of the Convention; and (iii) a list of tested indicators.
To provide guidance to Parties on the selection and use of indicators and the setting-up of a national biodiversity monitoring system, the principles for developing biodiversity indicators for national-level monitoring have been embedded into a stepwise procedure. The seven-step procedure provides a general framework for the process of selection and design of indicators as well as the choices involved. It represents a flexible system, which can be adapted according to individual country’s needs, institutional organization and capacities.
A small number of standard questions provide guidance on the initial steps of the procedure. They serve to define precisely the issues to be addressed and monitored through indicators. A set of key questions that indicators should help to answer is also included. These are segregated by indicator categories and reference is made to the relevant articles of the Convention: state, pressure and use indicators relate to Article 7; response indicators concern Articles 6, 8, 9, 10 and 11; indicators on capacity relate to Articles 12, 13 and 14. To assess the effectiveness of measures, a combination of state and response indicators is required.
The document includes a list of available and tested biodiversity indicators, which meet the set of principles and are generally applicable to all ecosystems and in all countries, and as a combination cover the major issues. Although this document focuses on state indicators, the list presented in section D of annex 2 of the present note also includes indicators of pressures and use, responses and capacity. Parties may need to adapt these according to their country-specific biodiversity, threats, capacity and goals.
Ongoing initiatives on indicator development—such as those in the countries participating in the project funded by the Global Environment Facility (GEF) on biodiversity indicators in national use (BINU), which is implemented by the World Conservation Monitoring Centre (WCMC) and the Netherlands National Institute of Public Health and the Environment (RIVM)—have provided and continue to provide additional insights and examples. The provision of training is considered an important element to enable Parties to develop suitable indicators for national-level monitoring of biodiversity and to put them in a position to measure and monitor the direction and magnitude of change of biodiversity and feed that into the policy process. If indicators should be used as a tool to assess the effectiveness of measures to conserve and sustainably use biodiversity, the provision of training and the dedication of financial resources to develop and apply these will be essential. Initial experiences drawn from the practical application of the document by participants of the BINU project are reflected in the suggested recommendations.
Overall, the document has been prepared to provide a flexible approach in choosing the indicators to be monitored by countries based on their priorities, capabilities, and data availability, thereby taking fully into account national and regional differences.
UNEP/CBD/SBSTTA/9/INF/7 Page 12
/…
CONTENTS
Page
EXECUTIVE SUMMARY........................................................................................................................ 11
A. Framework for designing national-level monitoring programmes and indicators ........................13
B. Guidelines and principles for developing national-level monitoring programmes and indicators for biodiversity ..............................................................................................................................17
Step 1: Define policy issues and goals ...........................................................................................18
Step 2: Establish terms of reference...............................................................................................19
Step 3: Specify indicator requirements ..........................................................................................21
Step 4: Select suitable indicators ...................................................................................................22
Step 5: Technical design of indicator(s) ........................................................................................24
Step 6: Objectives, terms of reference and technical design of monitoring programme ...............25
Step 7: Implement and maintain monitoring programme...............................................................26
C. Key questions that indicators may help to answer ........................................................................28
D. Indicative list of available and potential biodiversity indicators ..................................................30
Appendices
1. INDICATOR FACT SHEETS ...................................................................................................... 39
2. LESSONS LEARNED FROM DEVELOPING INDICATORS................................................... 61
3. ROLE AND FUNCTION OF BASELINES OF BIODIVERSITY............................................... 64
4. INDICATIVE LIST OF INDICATOR INITIATIVES AND SOURCES OF INFORMATION . 69
5. USE OF TERMS .......................................................................................................................... 81
UNEP/CBD/SBSTTA/9/INF/7 Page 13
/…
A. Framework for designing national-level monitoring programmes and indicators
28. This document aims to provide guidance to the Parties to the Convention on Biological Diversity on the development of national-level1 indicators and monitoring for biodiversity. It recognizes that many countries and institutions are engaged in indicator development initiatives and processes2. Given the emphasis of this document on state indicators for the conservation of biodiversity at species and ecosystem level, it is important to recognize existing indicators that have been developed in complementary issues not covered in this document.
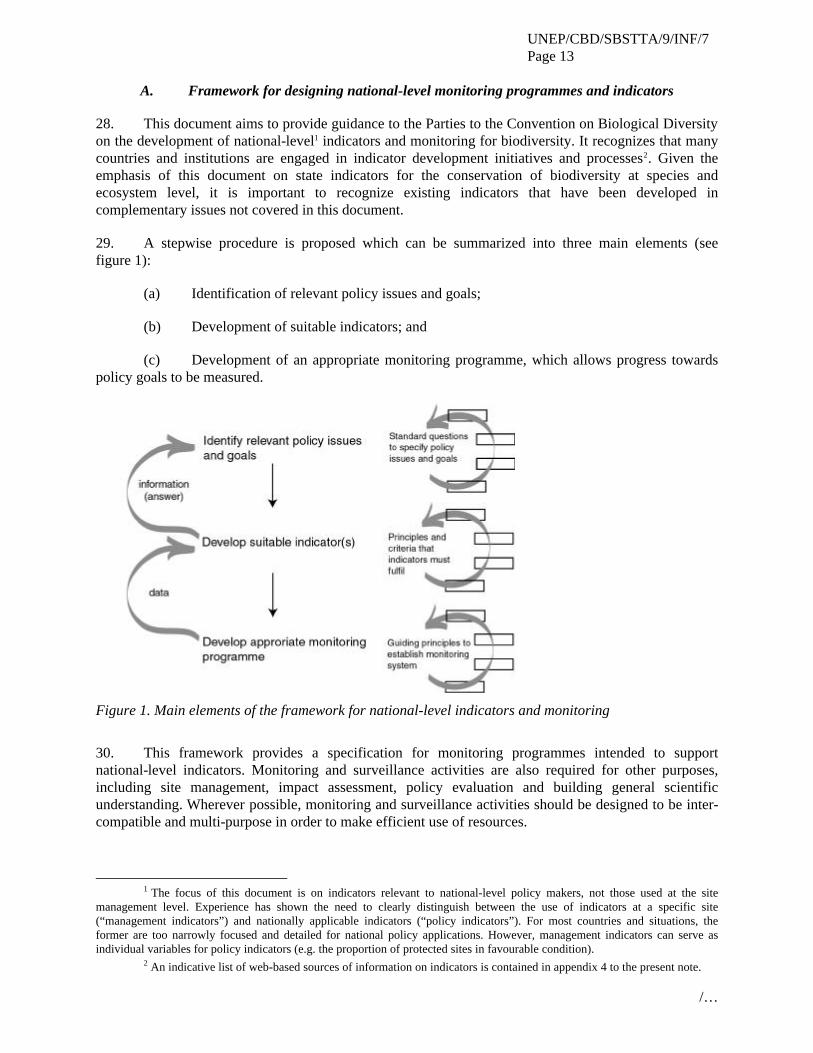
29. A stepwise procedure is proposed which can be summarized into three main elements (see figure 1):
(a) Identification of relevant policy issues and goals;
(b) Development of suitable indicators; and
(c) Development of an appropriate monitoring programme, which allows progress towards policy goals to be measured.
Figure 1. Main elements of the framework for national-level indicators and monitoring
30. This framework provides a specification for monitoring programmes intended to support national-level indicators. Monitoring and surveillance activities are also required for other purposes, including site management, impact assessment, policy evaluation and building general scientific understanding. Wherever possible, monitoring and surveillance activities should be designed to be inter-compatible and multi-purpose in order to make efficient use of resources.
1 The focus of this document is on indicators relevant to national-level policy makers, not those used at the site
management level. Experience has shown the need to clearly distinguish between the use of indicators at a specific site (“management indicators”) and nationally applicable indicators (“policy indicators”). For most countries and situations, the former are too narrowly focused and detailed for national policy applications. However, management indicators can serve as individual variables for policy indicators (e.g. the proportion of protected sites in favourable condition).
2 An indicative list of web-based sources of information on indicators is contained in appendix 4 to the present note.

UNEP/CBD/SBSTTA/9/INF/7 Page 14
/…
31. In accordance with the ecosystem approach, policy indicators should be meaningful in terms of ecosystem processes and management. They should integrate information across sectors and thematic areas and be relevant to defined policy goals3, thereby providing information essential for decision-making. In most cases, a single indicator will be insufficient to inform policy decisions. Therefore, a set of complementary indicators will generally be necessary to provide a sufficiently complete picture relating to the articles of the Convention.
32. Indicators serve four basic functions: simplification, quantification, standardization 4 and communication. They summarize complex and often disparate sets of data and thereby simplify information. They should be based on comparable scientific observations or statistical measures. They should provide a clear message that can be communicated to, and used by, decision makers and the general public.
33. Indicators and monitoring are important tools for adaptive and cost-effective management and policy making. Such effective management systems need:
(a) Verifiable policy targets;
(b) Timely and sufficient knowledge about the current and projected state and the progress made towards a target; and
(c) Measures for making corrections, i.e., implementation of management or policy actions to protect or improve biodiversity.
34. Indicators link monitoring, research and evidence-based policy making. Scientists and policy makers select a set of relevant indicators, which reflects both scientific and societal perspectives. Subsequently, policy makers set targets and measures, while scientists identify specific parameters and establish corresponding monitoring programmes, baseline values and cause-effect relationships. The current state is determined from monitoring, while models of cause-effect relationships provide information on the effectiveness of measures and point towards responses needed.
35. Indicators and monitoring should thus be designed to detect changes in time frames and on the spatial scales that are relevant to policy objectives and decisions. It is important to detect changes before it is too late to correct any observed problems.
36. Within the context of the CBD, indicators may be required to show status and trends of biodiversity, progress on the implementation of the Convention and the effectiveness of the measures taken.
37. The purpose of assessing the status and trends of biodiversity is to inform national-level planners and managers to ensure that projects, activities and policies are compatible with nationally defined biodiversity plans and strategies and contribute to the achievement of relevant biological outcomes. This type of monitoring is called for under Article 7 (b) of the Convention. Its results should be a contribution to the global task of measuring the rate of loss of biodiversity as stipulated in the CBD Strategic Plan and the WSSD 2010 target. This type of monitoring provides information for state indicators.
38. The rationale for assessing progress in the implementation of the Convention on Biological Diversity and/or the National Biodiversity Strategy and Action Plan is to assess to what extent the
3 e.g. Articles of the Convention 4 Standardization in this context relates to the methodology, not the standardization of results
UNEP/CBD/SBSTTA/9/INF/7 Page 15
/…
programmes of work developed under the CBD have been implemented at the local, national, regional and global levels, respectively. This type of monitoring relates to all substantive Articles (6-20) of the Convention. In relation to the 2010 target, it contributes to assessing which actions are being taken to reduce the rate of loss of biodiversity. National and thematic reports prepared under the CBD are a key source of information. This type of monitoring provides information for response indicators.
39. The need to assess the effectiveness of the measures taken within the framework of the Convention on Biological Diversity and/or the National Biodiversity Strategy and Action Plan is fuelled by the urgency to sustain biodiversity as the basis for life. There is a need to analyse the costs and benefits of activities taken under the CBD and, if necessary, to adapt the strategies required to achieve a significant reduction in the rate of loss of biodiversity. The effectiveness of activities carried out as part of the CBD process can be assessed from the way in which these activities lead eventually to changes in the status of biodiversity. An assessment of the effectiveness of measures requires a combination of the above-mentioned state and response indicators.
40. A number of approaches have been used in developing and structuring indicators5 6. One of the commonly used causal frameworks7 for describing the interactions between society and the environment is the DPSIR (driver, pressure, state, impact, response) model. It is an elaboration of the PSR (pressure, state, response) model8. Although the DPSIR model is useful for conceptualizing the various parts in the chain of causes, effects and possible responses, it can complicate matters and frequently appears to cause confusion, especially when applied to biotic components. Depending on how a question is defined, the same factor can relate to different indicator categories. The distinction between driver and pressure indicators as well as that between state and impact can be difficult to establish. For example, biodiversity can be both an aspect of the ‘state’ of the ecosystem and the ‘impact’ which policies are intended to address. Therefore, this document is based on the less ambiguous PSR framework.
41. The PSR framework is particularly suited to address the first objective of the Convention, the conservation of biological diversity. The indicator categories are defined as follows:
(a) Pressure includes indirect or direct human-induced pressures that affect biological diversity. Indirect pressures are related to demography, economy, technology, culture and governance. Direct pressures include inter alia land use, alien invasive species, climate change, emissions of nutrients and pollutants, fragmentation, exploitative human uses;
(b) State is the abiotic state of soil, air and water, as well as the state of the biological diversity at ecosystem/habitat, species/community and genetic level. State includes ecosystem goods and services, the direct benefits of biodiversity and the societal impacts of biodiversity loss;
(c) Responses are the measures taken to change the state, pressure or use. They include measures to protect and conserve biodiversity in situ and ex situ. They include measures to promote the equitable sharing of the monetary or non-monetary gains arising from the utilization of genetic resources. Responses also include steps taken to understand the causal chain and to develop data, knowledge, technologies, models, monitoring, human resources, institutions, legislation and budgets required to achieve the objectives of the Convention.
5 see for example IISD http://www.iisd.org/measure/compendium/searchinitiatives.aspx; 6 Boyle (1998) prepared a literature review on monitoring, indicator frameworks and indicator design and selection
http://ersserver.uwaterloo.ca/jjkay/grad/mboyle/references.pdf 7 DPSIR is used, for example, by the European Environment Agency (EEA). 8 PSR is used by the OECD and the CSD, as well as in previous CBD documents on indicators.
UNEP/CBD/SBSTTA/9/INF/7 Page 16
/…
42. However, additional categories of ‘use’, ‘benefit sharing’ and the ‘capacity’ required to formulate and implement responses do not fit comfortably into the PSR framework. Uses are the various human uses of biodiversity. These include non-use functions, indirect uses and direct uses: provisioning (food, water, fibre, fuel and other biological products), regulating (climate, water, diseases), cultural (spiritual, aesthetic), and supporting (primary production, soil production, erosion control)9. Some uses are also pressures, especially the provisioning uses. Indicators for sustainable use are listed in annex 1 of the Addis Ababa Principles and Guidelines for sustainable use of biodiversity. They are complementary to those proposed in this document.
43. Biodiversity indicators must complement other sets of indicators designed to assess progress in other policy sectors, for example agriculture, forestry, poverty reduction, health, trade and sustainable development as well as those describing the abiotic environment. Various sets of indicators have already been developed at national levels for these sectors. In order to avoid duplication of effort, linkages should be made at national levels between these various initiatives. Indicators of relevance to biodiversity, especially pressure indicators, may be derived from work within other sectors. Likewise biodiversity indicators should be included in sets of indicators within other sectors. An indicative list of sources of information on available indicators and ongoing international or national indicator initiatives is contained in appendix 4 of annex 2.
9 The categories follow the document on “People and Ecosystems: A Framework for Assessment and Action” prepared
by the Millennium Ecosystem Assessment.
UNEP/CBD/SBSTTA/9/INF/7 Page 17
/…
B. Guidelines and principles for developing national-level monitoring programmes and indicators for biodiversity
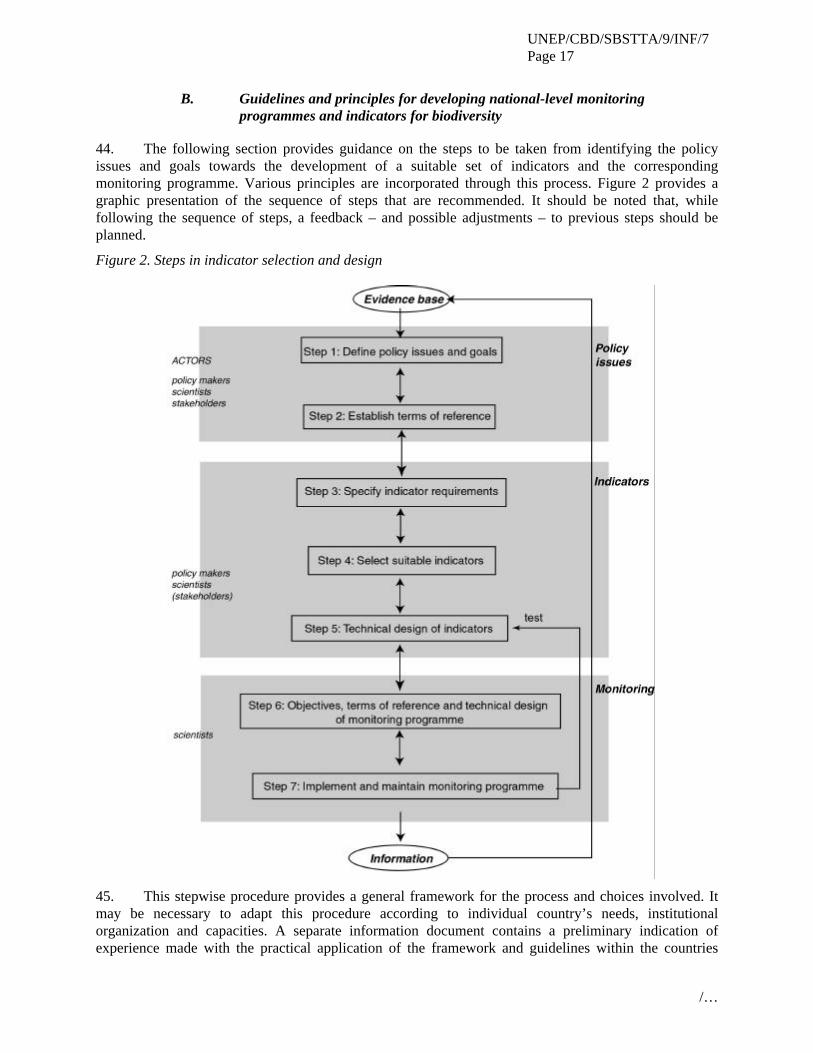
44. The following section provides guidance on the steps to be taken from identifying the policy issues and goals towards the development of a suitable set of indicators and the corresponding monitoring programme. Various principles are incorporated through this process. Figure 2 provides a graphic presentation of the sequence of steps that are recommended. It should be noted that, while following the sequence of steps, a feedback – and possible adjustments – to previous steps should be planned.
Figure 2. Steps in indicator selection and design
45. This stepwise procedure provides a general framework for the process and choices involved. It may be necessary to adapt this procedure according to individual country’s needs, institutional organization and capacities. A separate information document contains a preliminary indication of experience made with the practical application of the framework and guidelines within the countries
UNEP/CBD/SBSTTA/9/INF/7 Page 18
/…
participating in the GEF-funded project on “Biodiversity indicators in national use”. Lessons learned from developing indicators and monitoring programmes are presented in appendix 2 of annex 2.
46. This document focuses on the conservation of biodiversity at ecosystem and species levels and elaborates to a limited extent aspects of sustainable use at ecosystem and species levels. Indicators for sustainable use are further elaborated in annex 1 of the Addis Ababa Principles and Guidelines for sustainable use of biodiversity (see UNEP/CBD/SBSTTA/9/9 and UNEP/CBD/SBSTTA/9/INF/8). Indicators for benefit sharing are not considered in this document.
Step 1: Define policy issues and goals
47. The first step is to choose the policy issues and policy goals to be covered by indicators. These issues will be guided by the provisions of the Convention and by its respective national implementation manifested in the National Biodiversity Strategy and Action Plans. Awareness of the issues will depend on the best available information, including scientific evidence, traditional knowledge and awareness of management and use.
48. The following standard questions can guide the selection of policy issues for which indicators are relevant tools. Does it concern pressures, state, response, use or capacity issues? In case of state, one would ideally like to know about all ecosystems and all species. This would give the most comprehensive overview of a country’s biodiversity. However, apart from practical reasons (scientific and cost-benefit issues), some ecosystems or species might be considered more important than others, because they feature in specific policy plans, attract a lot of public attention, are economically important, or occupy large areas etc. Also one can choose to focus on rare, endemic, threatened ecosystems/species or species which are common and therefore play an important role in the functioning of the ecosystem in terms of energy or biomass flows. Such ecosystems and species can be selected as focal points (see also the categories as listed in annex 1 of the Convention).
49. Other standard questions are: Are you interested in past, current and future state? Past might be important as a reference to put current trends in perspective; current state serves to evaluate whether policies have been successful; future might be important to evaluate the effectiveness of possible measures (responses) being considered. Is it about national policy support or site management? Is detailed information or an overview required? For policy makers often overview information will be useful. For their assistants and scientist more details will be required, to better understand ongoing processes. So often, both will be required. And last, but not least, in which policy process does the indicator feed?
50. Not all policy issues will be amenable to the indicator approach. Therefore, the next standard question should be: does the issue necessitate quantitative, comparable, sensitive and reliable information to track changes over time? If not, indicators may not be appropriate for that issue. Below standard questions are summarized that may be considered in defining the issue.
UNEP/CBD/SBSTTA/9/INF/7 Page 19
/…
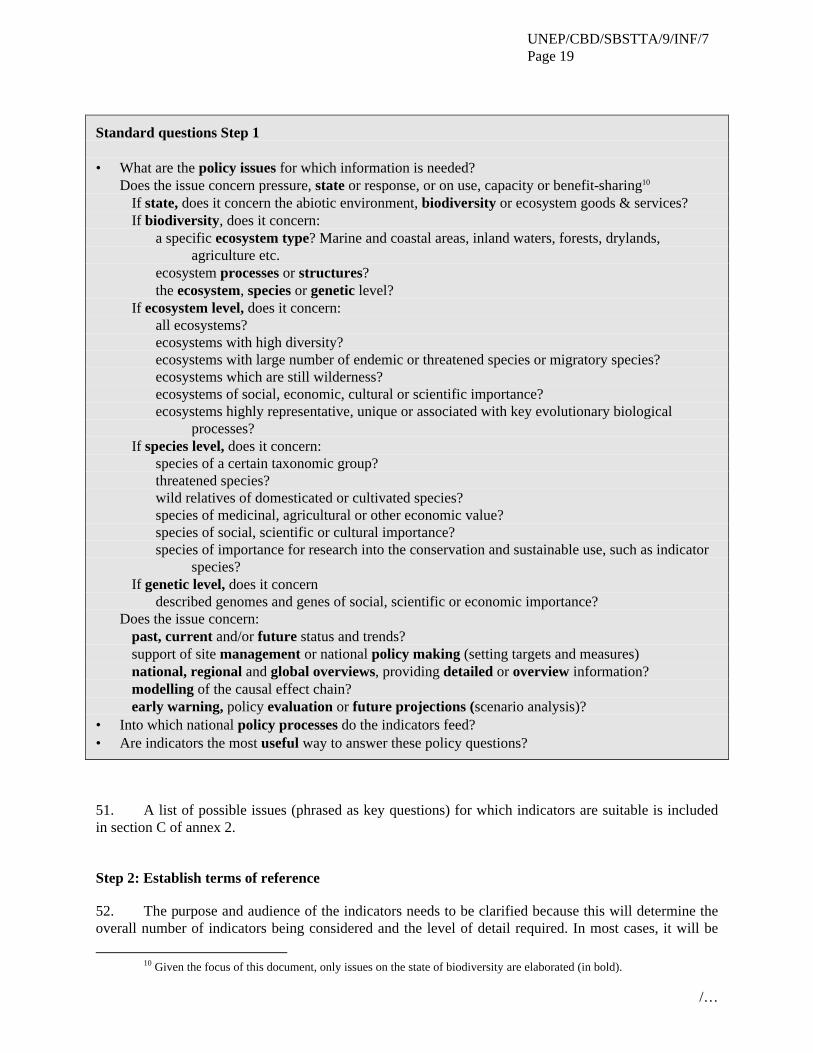
Standard questions Step 1 • What are the policy issues for which information is needed?
Does the issue concern pressure, state or response, or on use, capacity or benefit-sharing10 If state, does it concern the abiotic environment, biodiversity or ecosystem goods & services? If biodiversity, does it concern:
a specific ecosystem type? Marine and coastal areas, inland waters, forests, drylands, agriculture etc.
ecosystem processes or structures? the ecosystem, species or genetic level?
If ecosystem level, does it concern: all ecosystems? ecosystems with high diversity? ecosystems with large number of endemic or threatened species or migratory species? ecosystems which are still wilderness? ecosystems of social, economic, cultural or scientific importance? ecosystems highly representative, unique or associated with key evolutionary biological
processes? If species level, does it concern:
species of a certain taxonomic group? threatened species? wild relatives of domesticated or cultivated species? species of medicinal, agricultural or other economic value? species of social, scientific or cultural importance? species of importance for research into the conservation and sustainable use, such as indicator
species? If genetic level, does it concern
described genomes and genes of social, scientific or economic importance? Does the issue concern:
past, current and/or future status and trends? support of site management or national policy making (setting targets and measures) national, regional and global overviews, providing detailed or overview information? modelling of the causal effect chain? early warning, policy evaluation or future projections (scenario analysis)?
• Into which national policy processes do the indicators feed? • Are indicators the most useful way to answer these policy questions?
51. A list of possible issues (phrased as key questions) for which indicators are suitable is included in section C of annex 2.
Step 2: Establish terms of reference
52. The purpose and audience of the indicators needs to be clarified because this will determine the overall number of indicators being considered and the level of detail required. In most cases, it will be
10 Given the focus of this document, only issues on the state of biodiversity are elaborated (in bold).
UNEP/CBD/SBSTTA/9/INF/7 Page 20
/…
better to start with a relatively small, manageable number of indicators in order to make rapid progress and develop capacity. Inevitably this means a selective approach to identify issues of high priority for policy (see Step 1) and good potential for rapid development of indicators (see Step 4).
53. The structure of the set of indicators as a whole will need to be considered. Many models are available, such as the PSR framework, the levels of biodiversity and the Convention objectives. Often an indicator set will have three components:
(a) A small number (10-15) 11 of ‘headline’ or ‘aggregate’ indicators which are intended to provide a high-level overview for the public and politicians. These will focus on issues of high public concern and provide simple messages about the status and trends in biodiversity and/or the implementation of Action Plans.
(b) A larger number (50-150) of ‘core’ indicators, which provide a more comprehensive picture across the range of policy issues included in Action Plans for policy makers.
(c) Secondary groups or ‘satellite’ indicators associated with the implementation of particular policies or entire policy sectors, for example agricultural biodiversity, especially for policy makers.
54. The selection process should consider whether indicators on pressure, state, response, use or capacity issues adequately cover the major policy needs and whether the balance reflects national priorities.
55. Aggregated indicators can summarize and simplify the presentation information for a wide audience. Additionally, or alternatively, a small number of headline indicators may be selected to represent priority issues of relevance to the target audience. A hierarchy of indicators and information is illustrated in section D of annex 2.
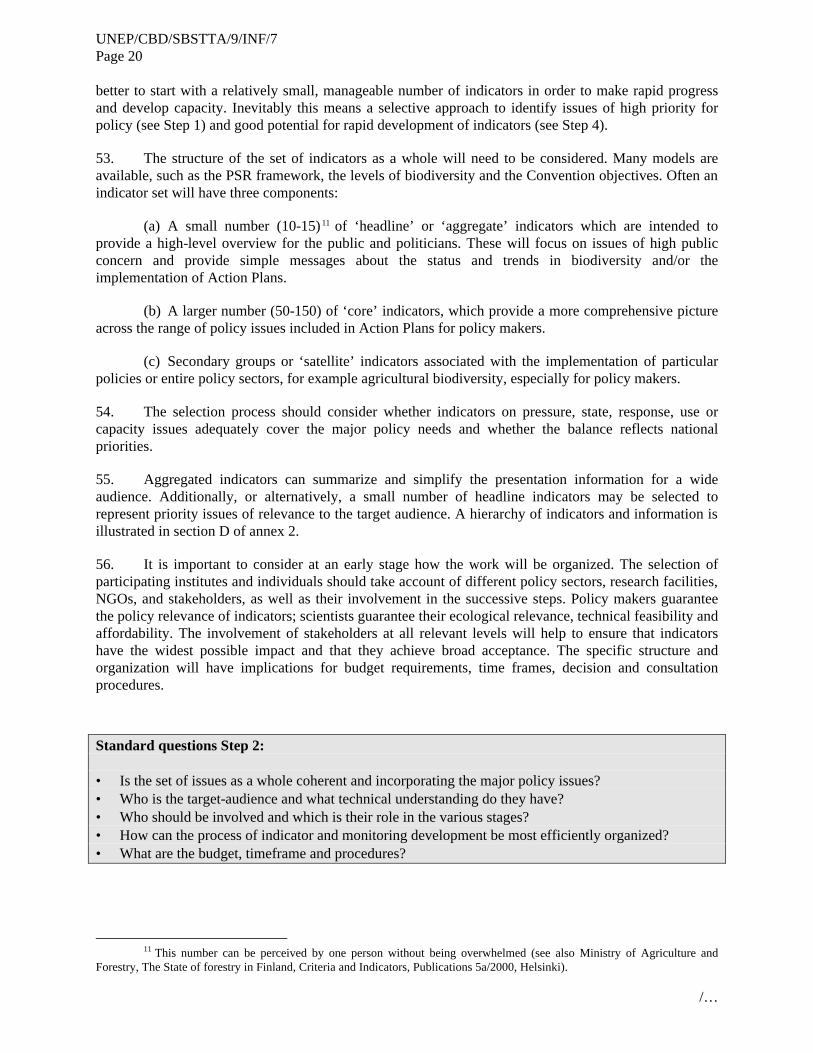
56. It is important to consider at an early stage how the work will be organized. The selection of participating institutes and individuals should take account of different policy sectors, research facilities, NGOs, and stakeholders, as well as their involvement in the successive steps. Policy makers guarantee the policy relevance of indicators; scientists guarantee their ecological relevance, technical feasibility and affordability. The involvement of stakeholders at all relevant levels will help to ensure that indicators have the widest possible impact and that they achieve broad acceptance. The specific structure and organization will have implications for budget requirements, time frames, decision and consultation procedures.
Standard questions Step 2: • Is the set of issues as a whole coherent and incorporating the major policy issues? • Who is the target-audience and what technical understanding do they have? • Who should be involved and which is their role in the various stages? • How can the process of indicator and monitoring development be most efficiently organized? • What are the budget, timeframe and procedures?
11 This number can be perceived by one person without being overwhelmed (see also Ministry of Agriculture and
Forestry, The State of forestry in Finland, Criteria and Indicators, Publications 5a/2000, Helsinki).
UNEP/CBD/SBSTTA/9/INF/7 Page 21
/…
Step 3: Specify indicator requirements
57. The first step in developing relevant and scientifically valid indicators is to clarify what are the underlying processes relating to the policy goals, which are to be assessed. Processes include both natural changes inherent to ecosystems and habitats as well as changes caused by human interventions and management activities affecting pressures and responses. In some cases, where processes are not adequately understood, further scientific research may be required before indicators can be specified. Understanding the underlying processes will help to determine the appropriate frequency and scale of the monitoring required.
58. Major ecosystem types12 provide convenient spatial units corresponding with the thematic areas of the Convention. Adopting these spatial units for analysis facilitates coherent reporting to the Convention and also enables thematic, regional and global overviews13. However, countries will probably use more detailed sub-divisions of these major ecosystem types in national applications. Such a hierarchical system of ecosystem types allows for overviews at different levels within and between countries.
59. Indicators should be designed to track changes over time against a baseline. The baseline may be the earliest data within a time series of consistent observations or a scientific reconstruction of historical conditions, for example a pre-industrial or low impact state. Baseline data help to measure human impact in industrial times and viable population sizes so that the threat of extinction can be assessed. The role and function of baselines is described in more detail in appendix 3 of annex 2. The baseline provides a context for the assessment of change and gives meaning to the indicator. Establishing a common baseline can also provide an effective means of aggregating information at the national and international levels, wherever appropriate. It should be emphasized that the baseline is not the targeted state. If possible, indicators should be related to policy goals such that trends over time allow an assessment of progress towards the goal. If there is sufficient knowledge, it may be possible to define specific, time-limited outcomes or desired target values for indicators. Alternatively the direction of change (i.e. increase or decrease) may be sufficient to assess progress. Documents UNEP/SBSTTA/3/INF/13 and UNEP/SBSTTA/5/12 provide additional background on baselines.
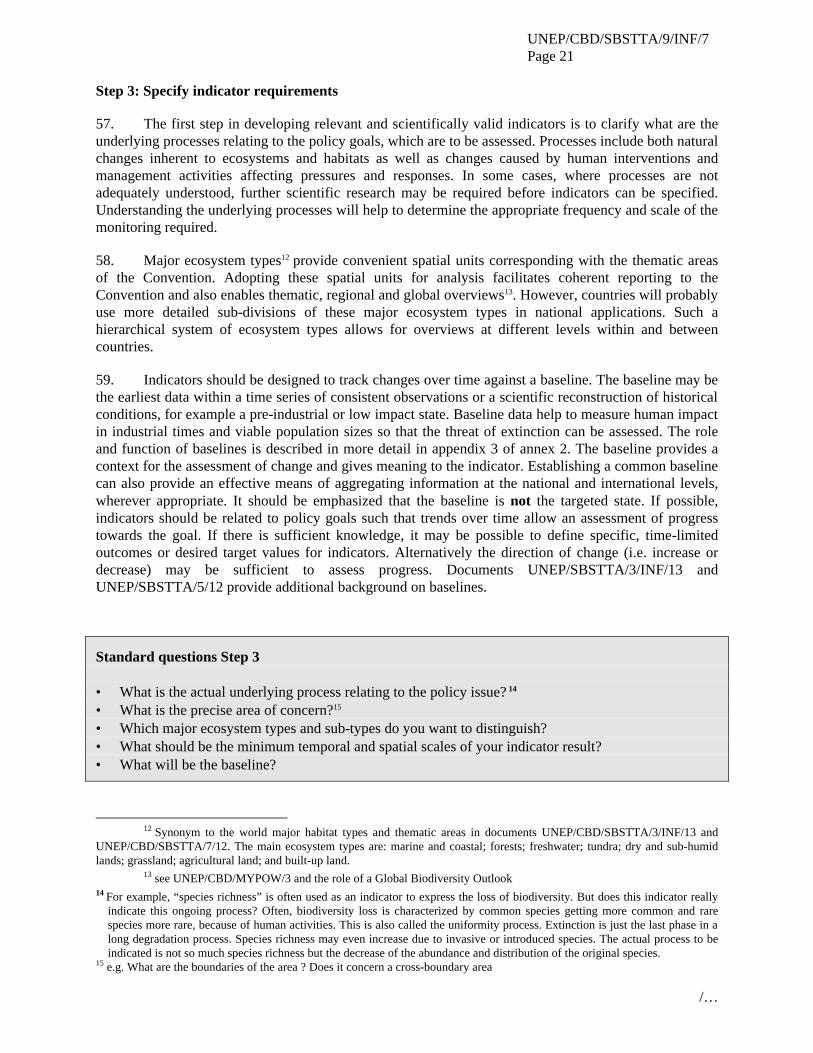
Standard questions Step 3 • What is the actual underlying process relating to the policy issue? 14 • What is the precise area of concern?15 • Which major ecosystem types and sub-types do you want to distinguish? • What should be the minimum temporal and spatial scales of your indicator result? • What will be the baseline?
12 Synonym to the world major habitat types and thematic areas in documents UNEP/CBD/SBSTTA/3/INF/13 and
UNEP/CBD/SBSTTA/7/12. The main ecosystem types are: marine and coastal; forests; freshwater; tundra; dry and sub-humid lands; grassland; agricultural land; and built-up land.
13 see UNEP/CBD/MYPOW/3 and the role of a Global Biodiversity Outlook 14 For example, “species richness” is often used as an indicator to express the loss of biodiversity. But does this indicator really
indicate this ongoing process? Often, biodiversity loss is characterized by common species getting more common and rare species more rare, because of human activities. This is also called the uniformity process. Extinction is just the last phase in a long degradation process. Species richness may even increase due to invasive or introduced species. The actual process to be indicated is not so much species richness but the decrease of the abundance and distribution of the original species.
15 e.g. What are the boundaries of the area ? Does it concern a cross-boundary area
UNEP/CBD/SBSTTA/9/INF/7 Page 22
/…
• Are sufficient scientific data available for establishing the indicator (for monitoring, modelling, baseline)?
Step 4: Select suitable indicators
60. Indicator sets should recognize the different audiences for indicators. In general, indicators should be ecosystem and policy relevant, simple and easily understood16, quantitative, scientifically credible, normative (allowing comparison with a baseline situation and policy target), responsive to changes in time and space, cost-effective and unambiguously, useable for scenarios for future projections, allowing aggregation at the level of ecosystem/habitat types or at national and possibly internationally level. The criteria are listed below.
Principles for choosing indicators On individual indicators: 1. Policy relevant and meaningful Indicators should send a clear message and provide information at a level appropriate for policy and management decision making by assessing changes in the status of biodiversity (or pressures, responses, use or capacity), related to baselines and agreed policy targets if possible. 2. Biodiversity relevant Indicators should address key properties of biodiversity or related issues as state, pressures, responses, use or capacity. 3. Scientifically sound Indicators must be based on clearly defined, verifiable and scientifically acceptable data, which are collected using standard methods with known accuracy and precision, or based on traditional knowledge that has been validated in an appropriate way. 4. Broad acceptance The power of an indicator depends on its broad acceptance. Involvement of the policy makers, and major stakeholders and experts in the development of an indicator is crucial. 5. Affordable monitoring Indicators should be measurable in an accurate and affordable way and part of a sustainable monitoring system, using determinable baselines and targets for the assessment of improvements and declines. 6. Affordable modelling Information on cause-effect relationships should be achievable and quantifiable, in order to link pressures, state and response indicators. These relation models enable scenario analyses and are the basis of the ecosystem approach. 7. Sensitive Indicators should be sensitive to show trends and, where possible, permit distinction between human-induced and natural changes. Indicators should thus be able to detect changes in systems in time frames and on the scales that are relevant to the decisions, but also be robust so that measuring errors do not affect the interpretation. It is important to detect changes before it is too late to correct the problems being detected.
16 simple to interpret, easy to understand, easy to communicate, including through availability of local language versions and
public awareness raising, clearly identify the extent of the issues they represent, and give a clear message on status and trends of biodiversity.
UNEP/CBD/SBSTTA/9/INF/7 Page 23
/…
On the set of indicators:
8. Representative The set of indicators provides a representative picture of the pressures, biodiversity state, responses, uses and capacity (coverage). 9. Small number The smaller the total number of indicators, the more communicable they are to policy makers and the public and the lower the cost. 10. Aggregation and flexibility Indicators should be designed in a manner that facilitates aggregation at a range of scales for different purposes. Aggregation of indicators at the level of ecosystem types (thematic areas) or the national or international levels requires the use of coherent indicators sets (see criteria 8) and consistent baselines. This also applies for pressure, response, use and capacity indicators.
61. The above criteria are not applied in the same way to all indicators. Detailed indicators – often single indicators – are generally used by technical audiences and do not have to be simple; headline indicators – often composite indicators – are generally used by non-technical audiences and should summarize data on complex environmental issues and processes in a simple and easily understood manner.
62. In consultation with stakeholders, a short list of candidate indicators should be selected from those considered relevant and available. Some desirable indicators may have to be eliminated because they cannot be measured reliably or at an affordable cost or fail to fulfil other principles. The chosen set of indicators should be reviewed as a whole with regard to the above principles 8-10, including the coverage of the main aspects relating to policy issues identified in Step 1. It is neither necessary nor possible to monitor all biodiversity, pressures, etc. A smart, representative cross-section of indicators is sufficient17.
63. Realistically, most indicators cannot be expected to meet all criteria mentioned above. Therefore, indicators should be optimized for the purpose and audience using both scientific knowledge and intuition. Choosing indicators is the art of measuring as little as possible with the highest policy significance and sufficient scientific credibility.
64. Although indicators should ideally enable straightforward interpretation, it is obvious that the effectiveness of a measure or the sustainability of a use cannot be simply derived from the change of a state indicator assuming a direct relationship. Therefore, statistical and multivariate analyses can be helpful tools for the sound interpretation of an indicator’s value.
65. It is useful to distinguish between more static ecosystem characteristics and indicators, i.e. species richness and number of endemics versus trends of species abundance or area size, respectively. Indicators are variable and sensitive to change, while ecosystem characteristics hardly change.
66. Indicators may be more or less suitable or desirable in one situation or country than in another. However, to provide guidance on indicators that have been found to work, a list of generally applicable indicators is provided in section D of annex 2.
Principles on Step 4 • Make inventory of existing data
17 This selection problem is similar to that for economic indicators, such as the retail price index, in which a
representative selection of products is monitored in a subset of stores -the so called ‘shopping bag’- in order to measure inflation out of millions of products.
UNEP/CBD/SBSTTA/9/INF/7 Page 24
/…
• Start with a list of existing and most promising candidate indicators • Suitable indicators are those that match many of the above principles • Some, but not all, principles are imperative such as ‘affordable’, ‘monitorable’ and ‘sensitive’ • Adapt the indicator choice until a coherent and representative set is achieved
Step 5: Technical design of indicator(s)
67. The technical design of an indicator comprises a series of activities: definition of the exact units, including spatial and temporal scales, determination of the baseline value and of calculation procedures.18
68. Composite indices provide summaries across a range of indicators (e.g. species groups, habitats or pressures). This can be helpful in presenting a simple message. However, indices tend to obscure trends of individual components and there is need for transparency on how composite indices are calculated and what data are used.19 It must be possible at all stages to assess each underlying indicator individually in case more specific questions need to be addressed.
69. Indicator profiles may be useful tools to describe and update an indicator in a transparent way. It may contain chapters on (i) why it is chosen; (ii) the exact units; (iii) calculation procedures; (iv) baseline value and underpinning; (v) current state values; (vi) cause-effect relationships; and (vii) ecology (in case of species indicators).
70. It may be necessary to refine and validate indicators through successive iterations to ensure that they are both scientifically robust and communicate effectively with the intended audience.
71. Under the UN Commission for Sustainable Development (CSD), guidelines have been prepared for the national testing of sustainable development indicators20. The same guidelines may be applied to the testing of biodiversity indicators. The Commission recognizes that the procedures and processes to be followed in the testing of the indicators may vary from country to country, depending on national objectives and targets, infrastructure, expertise and availability of data and other information for decision-making. CSD promotes a pragmatic approach to the testing of indicators because the whole process is resource intensive. Since the responsibility for indicators and data collection may lie with different institutions, CSD proposes the establishment of a coordination mechanism for the testing of indicators. The guidelines include sections on the implementation of the testing phase, assessment and evaluation, and on reporting.
Principles on Step 5 (for each indicator of the set) • The indicator is not defined until the exact units are determined (incl. spatial and temporal scales) • The calculation procedure has to be determined unambiguously • Baselines and target values should be established where appropriate
18 e.g. aggregating/averaging monitored (or modelled) data in time and space (measurements in various seasons and
sample sites). 19 In case of a composite indicator, the exact calculation procedure for aggregating/averaging the underlying indicators
is determined (generally this results in indices). For this a common baseline is required. Sometimes underlying indicators have to be weighted by the area (or time) they represented before several single indicators are integrated into one composite indicator. Further information is provided in the State-of-the-art Report on Current Methodologies and Practices for Composite Indicator Development (http://www.jrc.cec.eu.int/uasa/prj-comp-ind.asp)
20 http://www.un.org/esa/sustdev/natlinfo/indicators/indi8.htm
UNEP/CBD/SBSTTA/9/INF/7 Page 25
/…
• An indicator profile is a systematic tool to describe exact units, calculation procedures, baseline values, current values and cause-effect relationships
• Does the indicator really match the principles of step 4?
Step 6: Objectives, terms of reference and technical design of monitoring programme
72. The objectives for monitoring programmes might be broader than the assessment of specified policy-related indicators in order to develop the evidence base. For example, it may be desirable to provide for early warning of new phenomena or pressures, for which indicators have not been devised. A major challenge when defining objectives for a monitoring programme is to make them robust to policy changes and to ensure continuity of funding. In many cases, the immediate cost of action may appear high; however, the long-term costs of inaction may be even higher. Political commitment is indispensable to guarantee the continuity of any long-term monitoring programme.
73. The terms of reference for the monitoring programme are derived from the previous steps. They will include the available budget, units of the chosen indicators, accuracy, minimum spatial and temporal scales to detect impact, and sensitivity. Sensitivity can be expressed as time and magnitude for change detection21.
74. Monitoring is expensive. However, not all indicators require the collection of additional data. In many cases, some or all of the required information is already available, either from national statistics or from existing management and research data. It is critical, however, to assess the quality of the data and ensure that collection methods used are sound. Rigorous quality control and assurance is particularly important when data sets from different origins are used.
75. For some state indicators, it will be necessary to devise a cost-effective sampling strategy. The design should ensure that changes can be detected with statistical confidence, in appropriate time frames and that important change can be discriminated from background ‘noise’. The monitoring frequency must be determined and whether the sampling is random or on selected sites (stratified). The exact location of the monitoring sites must be recorded22. This will not only allow repeated measurements at the same location, but also gives an overview of the total monitoring scheme and its representativeness. The sampling strategy is important to make sure that (a) when the monitoring system gives a signal, this signal is reliable (confidence); and (b) when some change occurs in the system, the monitoring indeed picks this up (detection power). Many manuals are available to assist in the selection of sensitive and cost-effective field methods. It is advisable to undertake pilot studies to test sampling approaches before full implementation.
76. Quantitative methods should be used wherever possible. Cost-effective methods of data collection should be used making use of existing facilities and staff, volunteers and earth observation as appropriate. Data should also be objective, reproducible and validated.
77. Monitoring schemes should also be standardized as much as possible between different ecosystem/habitat types and when measuring different variables. Consistent methods are needed across ecosystem types to address changes over time and across environmental gradients. Composite indicators (step 4) are made up from different underlying indicators, which may be based on different field methods.
21 For example, a change of 10% or more must be detectable in time periods of 4 or 10 years (frequency of monitoring) 22 e.g. georeferenced within a Geographical Information System (GIS)
UNEP/CBD/SBSTTA/9/INF/7 Page 26
/…
78. Monitoring information can be effective only if it reaches the decision makers in time to take remedial action. It is therefore important that the data flow is clearly established from the field to the end user and that a procedure for regular23 reporting is established (data logistics). Quality control should be incorporated in the data flow to ensure that data collection and analytical techniques are being performed correctly. Data treatment may be necessary to remove bias and gaps in space and time in the schemes.
79. Good data management is essential for long-term monitoring programmes. Experience has shown that the integrity of long-term programmes can be threatened significantly from (i) periodic institutional or personnel change; (ii) technological advances and obsolescence; (iii) inadequacy of data archives; and, (iv) poor technical documentation.
80. National reporting might require data collation in one location and agreements for data sharing between collecting institutions.
Principles on Step 6 • The monitoring objectives should be clear and unambiguous • The monitoring terms of reference can be derived from the overall terms of reference in step 2 • A clear monitoring strategy is crucial (overall and per indicator) • The data logistics from measurement to indicator production should be well-organized
Step 7: Implement and maintain monitoring programme
81. It is important to start with whatever information is available and gradually modify and improve the monitoring programme. This approach requires a feedback loop between the information produced in the programme and its usefulness in meeting the programme objectives. Pilot studies provide a cost-effective means of testing all elements of a monitoring programme before full implementation.
82. Long-term institutional responsibility, support in terms of capacity for the monitoring programme and a strong sense of ownership appear to be important criteria in the continuation of many monitoring programmes. Effective management programmes often depend on the coordinated contribution of a wide range of partners, including local community groups, management authorities, NGOs, research institutions, local and national government. Best practice guidance can be drawn from successful examples of biodiversity monitoring.
83. Once the monitoring programme provides information, it is necessary to verify whether the design of the indicator is appropriate or whether it requires adjustment. This is done through an evaluation of the programme’s results (i.e. data) against the objectives and terms of reference (step 6). Frequent evaluation and adjustment are essential for programme development. The ultimate test of the performance of the monitoring programme is by the actual use of its output in the indicator protocol (step 5)
Principles on Step 7 (for each indicator) • Start and gradually improve monitoring • Promote a strong ownership
23 e.g. annual, every 3 years etc.
UNEP/CBD/SBSTTA/9/INF/7 Page 27
/…
84. In order to guide Parties in the establishment of biodiversity indicators for policy-making and monitoring, a stepwise procedure and a list of feasible indicators are provided. This facilitates a flexible approach in choosing the indicators to be monitored by countries based on their priorities, capabilities, and data availability, thereby taking fully into account national and regional differences. An energetic implementation is of crucial importance to timely evaluate the progress of the national NSBAP and objectives of the Convention as well as the 2010 targets.
UNEP/CBD/SBSTTA/9/INF/7 Page 28
/…
C. Key questions that indicators may help to answer
85. The set of key questions addresses common concerns regarding the implementation of the Convention on Biological Diversity. They can be summarized in the following five core key questions:
(a) What is changing and to what extent? (state);
(b) Why is it changing? (pressure);
(c) Why is it important? (use);
(d) What are we doing about it? (response);
(e) Do we have the means to formulate and implement response measures? (capacity).
86. The set of key questions are organized according to indicator categories and the corresponding Article(s) of the Convention. Questions listed in previous CBD documents24 for which indicators are less suitable as tools to answer them are not included.
Key questions on state (relates to Article 7)
87. What is the current state of biological diversity? What is the rate of biodiversity loss and how is it changing?
88. Is the status of biological diversity status stable or changing? What is the direction and extent of the change?
89. How many globally or regionally important species, populations and habitats are at risk of extinction?
90. What is the species abundance and/or distribution (evenness), species-richness, and ecosystem structure and complexity of important ecosystems?
91. How much biodiversity (landscape/ecosystem diversity, natural habitats, species and genetic resources) is being lost?
92. Are there early warning signs of problems that require early attention?
Key questions on pressure (relates to Article 7)
93. What is the possible impact of threats and what is their relative contribution?
94. What is the size of these threats, and are they stable, decreasing or growing? What is the threat status of known genetic resources, species, ecosystem types, and habitats of poorly known taxa?
95. What anthropogenic processes have the greatest influence on the current and near future status of biodiversity? Which social and economic root causes are responsible for the observed changes in human threats to biodiversity?
24 UNEP/CBD/SBSTTA/3/INF/13, UNEP/CBD/SBSTTA/5/12; UNEP/CBD/SBSTTA/7/12
UNEP/CBD/SBSTTA/9/INF/7 Page 29
/…
96. Are direct and/or underlying causes of biodiversity loss being addressed?
Key questions on response (relates to Articles 6, 8, 9, 10, 11)
97. Are management efforts targeted to the highest priority threats?
98. Is progress being made in achieving major targets and objectives set out in planning processes, in particular to reduce and prevent biodiversity loss?
99. Are there known perverse management activities, incentives and policies?
100. Is there a protected area network and how representative is it?
Key questions on effectiveness of measures (combination of state and response; relates to Article 7)
101. How effective are/have been the measures taken to implement the Convention?
102. Are management efforts, including resource allocation, in relation to present and past threats sufficient to slow the rate of loss of biodiversity and prevent irreversible loss?
Key questions on use (relates to Article 7)
103. What is the current state of the goods and services provided by biological diversity?
104. What sustainable use practices are in place and how sustainable are they?
105. Are the benefits derived from consumptive and non-consumptive uses known?
Key questions on capacity (relates to Articles 12, 13, 14)
106. How much human and institutional capacity is available to implement the Convention?
107. How much support (financial resources, institutional support and incentives) from national and international sources is currently being provided to implement the Convention?
108. What additional means (including new and additional financial resources) are needed to address the threats?
109. What is the management capacity to quickly react to known (e.g. poaching, fires) or unforeseen (e.g. oil spills, new diseases) threats? What is needed to build the required capacity (according to national priorities)?
110. What is the capacity to effectively manage priority areas?
111. What is the national capacity to put expert (national or international) and traditional knowledge on status and trends of biodiversity to use for slowing down biodiversity loss?
112. What is the capacity to maintain information flow?
UNEP/CBD/SBSTTA/9/INF/7 Page 30
/…
D. Indicative list of available and potential biodiversity indicators
113. Indicators may contain simple or highly aggregated information. Single indicators are single variables related to a reference value (e.g. number of storks compared to viable population). A reference might be a target (distance to target), a baseline (distance to baseline), a threshold value (distance to a collapse), or a reference year (change in time). Composite indicators aggregate various single indicators by transforming them into another common unit (like classifying apples and pears as fruit). One way is to transform single indicators into dimensionless indices by dividing them by a reference value (e.g. average population size of 10 species as % of undisturbed state). Another approach is the weighted transformation into a common unit (e.g. methane and CO2 emissions transform into greenhouse gas equivalents). Subsequently these single indicators can be aggregated. Both calculation procedures and baseline values are required for data processing, which is in fact a form of data compression. Site managers are usually interested in statistics and single-indicators; politicians at the national level are mostly interested in composite indicators.
114. Both the single and composite indicators listed below are generic; they can be applied to all countries and ecosystems. Parties can develop them according to their country-specific biodiversity, threats, pressures, policies and capacity. At this stage, the list focuses on indicators, which are feasible in the short or medium term (see also UNEP/CBD/SBSTTA/3/INF/13). As requested in decision VI/7-B, biodiversity state indicators are structured into indicators on ecosystem quality and those on ecosystem quantity. They relate to the following key questions from section C of the present note25:
(a) What is the current state of biological diversity 26 ? Is it stable, improving or deteriorating? What is the extent of the change? How much is being lost? Are components threatened with extinction? The same questions apply to specific biodiversity components, such as those mentioned in Annex I to the Convention.
(b) What are the major anthropogenic pressures on biodiversity? Are they stable, declining or increasing? What is their relative contribution to the impact on the current and future state of biodiversity? Do the combined pressures enhance or weaken the impact on biodiversity?
(c) What responses have been developed? What is the status of implementation of each provision of the Convention? How effective are the measures taken? Are the national and Johannesburg targets being achieved? Which area is protected? How representative are the protected areas? Are there known perverse management activities, incentives and policies?
(d) What are the current uses of biological diversity? Are they stable, declining or increasing? How sustainable are they?
(e) What capacity is available to establish and maintain an indicator and monitoring system, analyse its results and feed it into policy processes?
115. Additional guidance is contained in two appendices to the present note, which summarize the experience gained and lessons learned from several indicator development processes and present sources of web-based information on indicator initiatives and national monitoring programmes.
25 Indicators are not a suitable tool to answer all key questions from section C. Some can be simply answered by yes or
no, or some require answers of a narrative character. 26 at the level of species and ecosystems
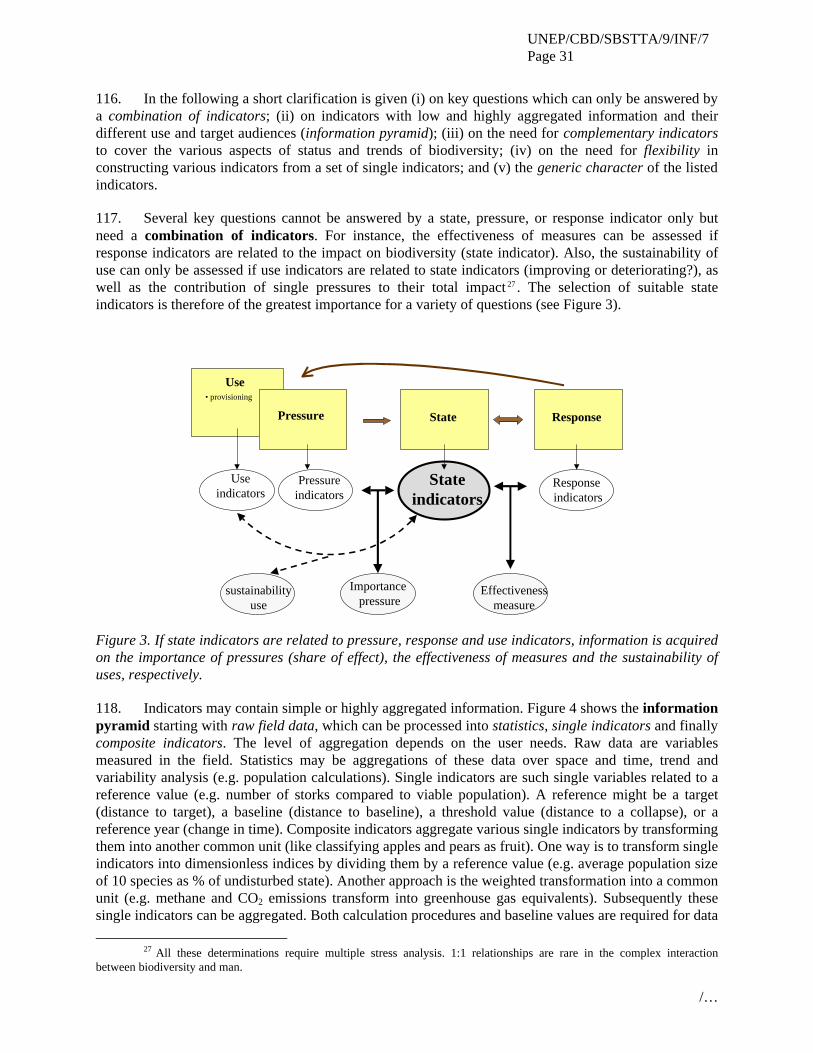
UNEP/CBD/SBSTTA/9/INF/7 Page 31
/…
116. In the following a short clarification is given (i) on key questions which can only be answered by a combination of indicators; (ii) on indicators with low and highly aggregated information and their different use and target audiences (information pyramid); (iii) on the need for complementary indicators to cover the various aspects of status and trends of biodiversity; (iv) on the need for flexibility in constructing various indicators from a set of single indicators; and (v) the generic character of the listed indicators.
117. Several key questions cannot be answered by a state, pressure, or response indicator only but need a combination of indicators. For instance, the effectiveness of measures can be assessed if response indicators are related to the impact on biodiversity (state indicator). Also, the sustainability of use can only be assessed if use indicators are related to state indicators (improving or deteriorating?), as well as the contribution of single pressures to their total impact 27 . The selection of suitable state indicators is therefore of the greatest importance for a variety of questions (see Figure 3).
• provisioning
Use
Pressure State Response
Stateindicators
Response indicators
Pressureindicators
Useindicators
Effectivenessmeasure
Importance pressure
sustainabilityuse
Figure 3. If state indicators are related to pressure, response and use indicators, information is acquired on the importance of pressures (share of effect), the effectiveness of measures and the sustainability of uses, respectively.
118. Indicators may contain simple or highly aggregated information. Figure 4 shows the information pyramid starting with raw field data, which can be processed into statistics, single indicators and finally composite indicators. The level of aggregation depends on the user needs. Raw data are variables measured in the field. Statistics may be aggregations of these data over space and time, trend and variability analysis (e.g. population calculations). Single indicators are such single variables related to a reference value (e.g. number of storks compared to viable population). A reference might be a target (distance to target), a baseline (distance to baseline), a threshold value (distance to a collapse), or a reference year (change in time). Composite indicators aggregate various single indicators by transforming them into another common unit (like classifying apples and pears as fruit). One way is to transform single indicators into dimensionless indices by dividing them by a reference value (e.g. average population size of 10 species as % of undisturbed state). Another approach is the weighted transformation into a common unit (e.g. methane and CO2 emissions transform into greenhouse gas equivalents). Subsequently these single indicators can be aggregated. Both calculation procedures and baseline values are required for data
27 All these determinations require multiple stress analysis. 1:1 relationships are rare in the complex interaction between biodiversity and man.
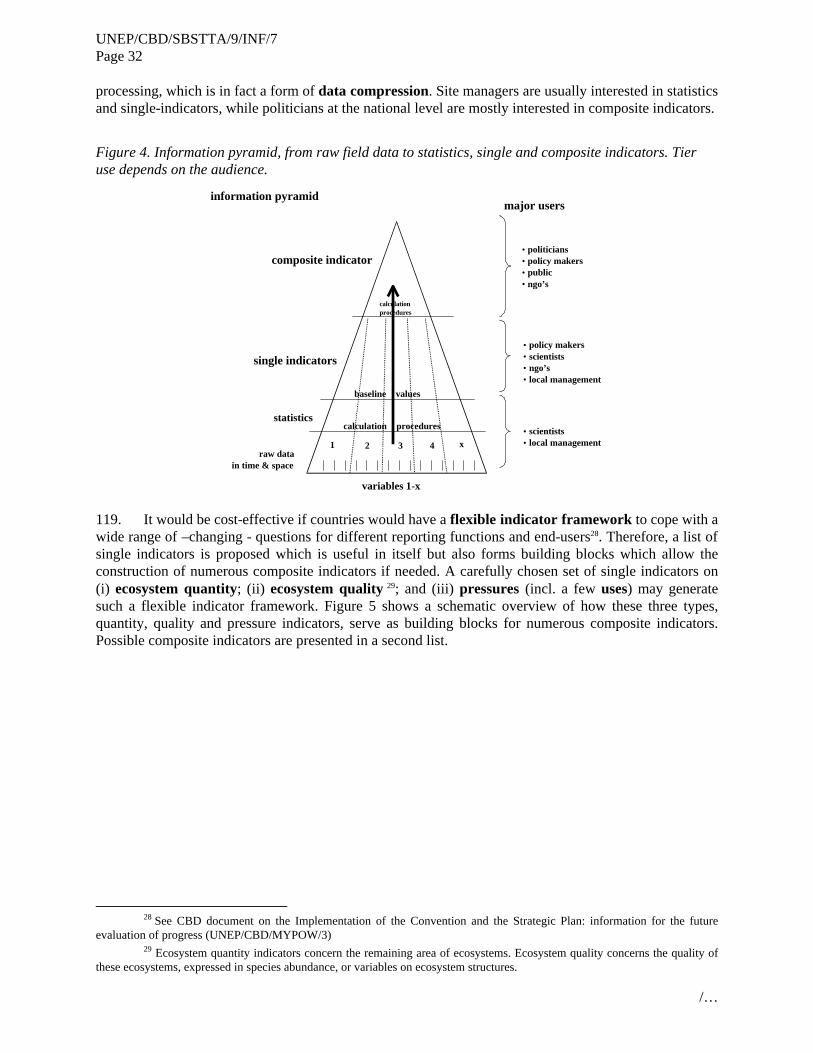
UNEP/CBD/SBSTTA/9/INF/7 Page 32
/…
processing, which is in fact a form of data compression. Site managers are usually interested in statistics and single-indicators, while politicians at the national level are mostly interested in composite indicators.
Figure 4. Information pyramid, from raw field data to statistics, single and composite indicators. Tier use depends on the audience.
information pyramid
raw data in time & space
1 2 3 4 x
baseline values
single indicators
composite indicator
statistics
variables 1-x
calculation procedures
calculation procedures
major users
• politicians • policy makers • public • ngo’s
• policy makers • scientists • ngo’s • local management
• scientists • local management
119. It would be cost-effective if countries would have a flexible indicator framework to cope with a wide range of –changing - questions for different reporting functions and end-users28. Therefore, a list of single indicators is proposed which is useful in itself but also forms building blocks which allow the construction of numerous composite indicators if needed. A carefully chosen set of single indicators on (i) ecosystem quantity; (ii) ecosystem quality 29; and (iii) pressures (incl. a few uses) may generate such a flexible indicator framework. Figure 5 shows a schematic overview of how these three types, quantity, quality and pressure indicators, serve as building blocks for numerous composite indicators. Possible composite indicators are presented in a second list.
28 See CBD document on the Implementation of the Convention and the Strategic Plan: information for the future
evaluation of progress (UNEP/CBD/MYPOW/3) 29 Ecosystem quantity indicators concern the remaining area of ecosystems. Ecosystem quality concerns the quality of
these ecosystems, expressed in species abundance, or variables on ecosystem structures.
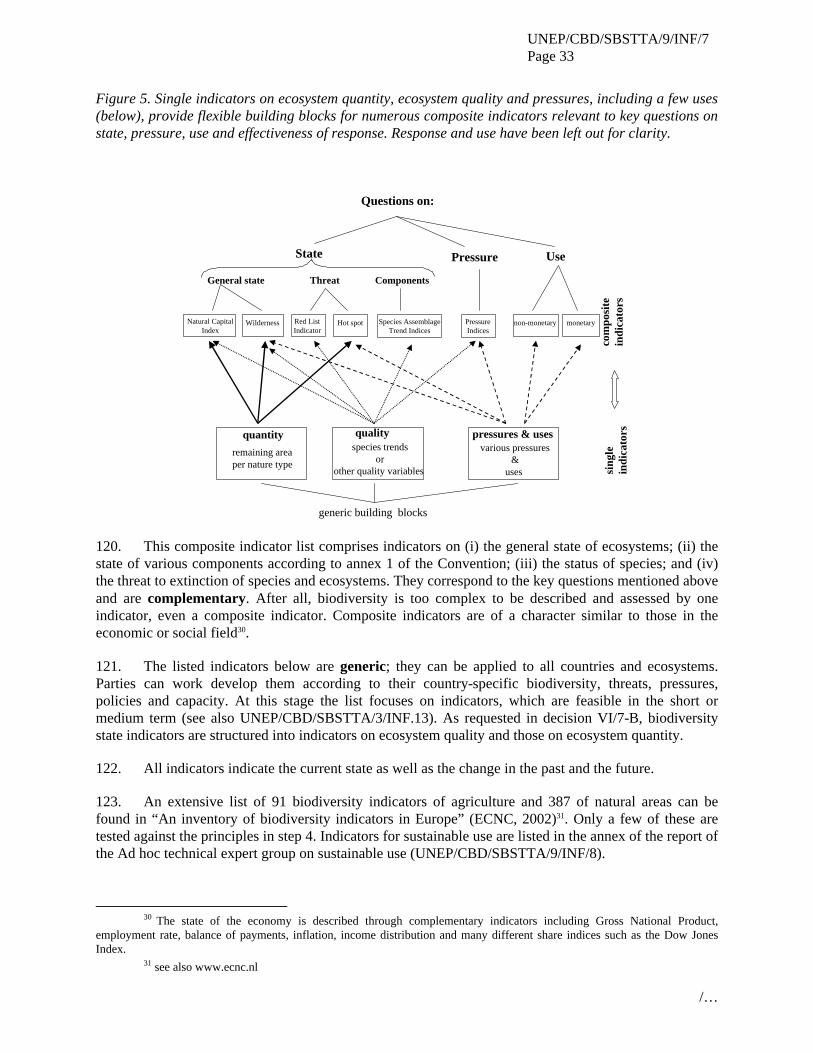
UNEP/CBD/SBSTTA/9/INF/7 Page 33
/…
Figure 5. Single indicators on ecosystem quantity, ecosystem quality and pressures, including a few uses (below), provide flexible building blocks for numerous composite indicators relevant to key questions on state, pressure, use and effectiveness of response. Response and use have been left out for clarity.
General state
Pressure
Components Threat
Use
Natural CapitalIndex
Wilderness Red ListIndicator
Hot spot PressureIndices
Species AssemblageTrend Indices
monetarynon-monetary
Questions on:
remaining areaper nature type
species trendsor
other quality variables
pressures & uses
generic building blocks
quantity qualityvarious pressures
&uses si
ngle
indi
cato
rs
com
posi
te
indi
cato
rs
State
120. This composite indicator list comprises indicators on (i) the general state of ecosystems; (ii) the state of various components according to annex 1 of the Convention; (iii) the status of species; and (iv) the threat to extinction of species and ecosystems. They correspond to the key questions mentioned above and are complementary. After all, biodiversity is too complex to be described and assessed by one indicator, even a composite indicator. Composite indicators are of a character similar to those in the economic or social field30.
121. The listed indicators below are generic; they can be applied to all countries and ecosystems. Parties can work develop them according to their country-specific biodiversity, threats, pressures, policies and capacity. At this stage the list focuses on indicators, which are feasible in the short or medium term (see also UNEP/CBD/SBSTTA/3/INF.13). As requested in decision VI/7-B, biodiversity state indicators are structured into indicators on ecosystem quality and those on ecosystem quantity.
122. All indicators indicate the current state as well as the change in the past and the future.
123. An extensive list of 91 biodiversity indicators of agriculture and 387 of natural areas can be found in “An inventory of biodiversity indicators in Europe” (ECNC, 2002)31. Only a few of these are tested against the principles in step 4. Indicators for sustainable use are listed in the annex of the report of the Ad hoc technical expert group on sustainable use (UNEP/CBD/SBSTTA/9/INF/8).
30 The state of the economy is described through complementary indicators including Gross National Product,
employment rate, balance of payments, inflation, income distribution and many different share indices such as the Dow Jones Index.
31 see also www.ecnc.nl
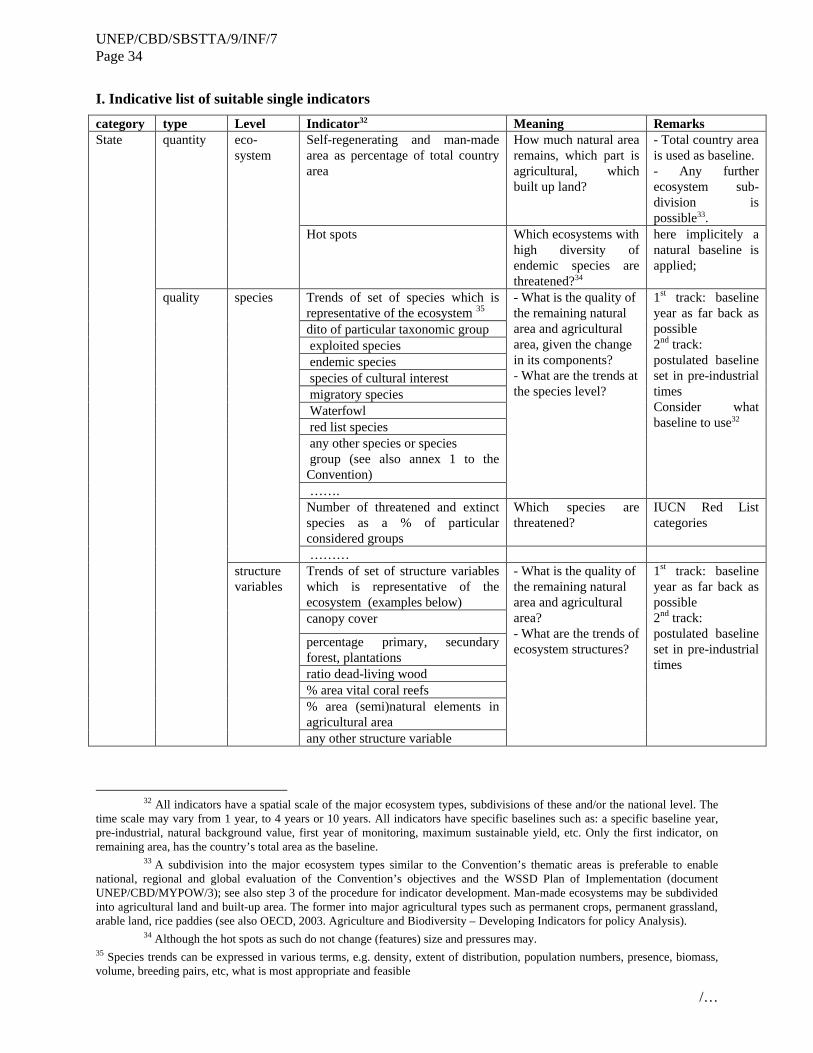
UNEP/CBD/SBSTTA/9/INF/7 Page 34
/…
I. Indicative list of suitable single indicators
category type Level Indicator32 Meaning Remarks Self-regenerating and man-made area as percentage of total country area
How much natural area remains, which part is agricultural, which built up land?
- Total country area is used as baseline. - Any further ecosystem sub-division is possible33.
quantity eco- system
Hot spots Which ecosystems with high diversity of endemic species are threatened?34
here implicitely a natural baseline is applied;
Trends of set of species which is representative of the ecosystem 35 dito of particular taxonomic group exploited species endemic species species of cultural interest migratory species Waterfowl red list species any other species or species group (see also annex 1 to the Convention) …….
- What is the quality of the remaining natural area and agricultural area, given the change in its components? - What are the trends at the species level?
1st track: baseline year as far back as possible 2nd track: postulated baseline set in pre-industrial times Consider what baseline to use32
Number of threatened and extinct species as a % of particular considered groups
Which species are threatened?
IUCN Red List categories
species
……… Trends of set of structure variables which is representative of the ecosystem (examples below) canopy cover
percentage primary, secundary forest, plantations ratio dead-living wood % area vital coral reefs % area (semi)natural elements in agricultural area
State
quality
structure variables
any other structure variable
- What is the quality of the remaining natural area and agricultural area? - What are the trends of ecosystem structures?
1st track: baseline year as far back as possible 2nd track: postulated baseline set in pre-industrial times
32 All indicators have a spatial scale of the major ecosystem types, subdivisions of these and/or the national level. The
time scale may vary from 1 year, to 4 years or 10 years. All indicators have specific baselines such as: a specific baseline year, pre-industrial, natural background value, first year of monitoring, maximum sustainable yield, etc. Only the first indicator, on remaining area, has the country’s total area as the baseline.
33 A subdivision into the major ecosystem types similar to the Convention’s thematic areas is preferable to enable national, regional and global evaluation of the Convention’s objectives and the WSSD Plan of Implementation (document UNEP/CBD/MYPOW/3); see also step 3 of the procedure for indicator development. Man-made ecosystems may be subdivided into agricultural land and built-up area. The former into major agricultural types such as permanent crops, permanent grassland, arable land, rice paddies (see also OECD, 2003. Agriculture and Biodiversity – Developing Indicators for policy Analysis).
34 Although the hot spots as such do not change (features) size and pressures may. 35 Species trends can be expressed in various terms, e.g. density, extent of distribution, population numbers, presence, biomass, volume, breeding pairs, etc, what is most appropriate and feasible
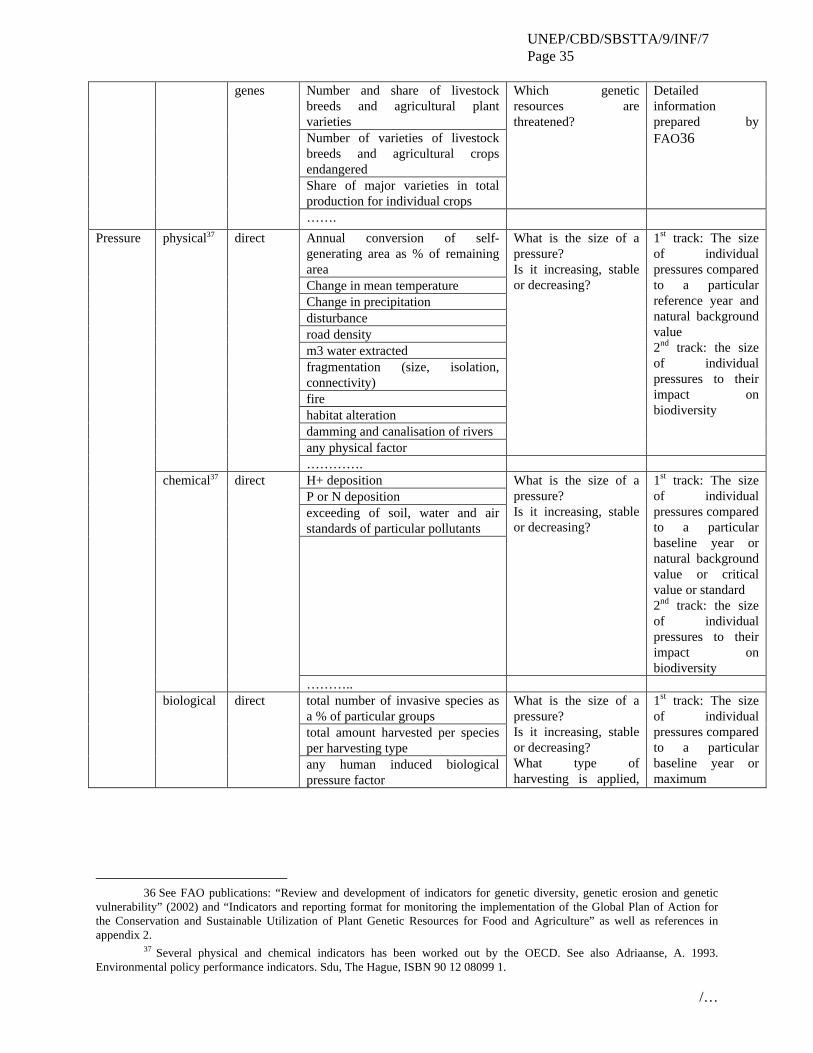
UNEP/CBD/SBSTTA/9/INF/7 Page 35
/…
Number and share of livestock breeds and agricultural plant varieties Number of varieties of livestock breeds and agricultural crops endangered Share of major varieties in total production for individual crops
Which genetic resources are threatened?
Detailed information prepared by FAO36
genes
…….
Annual conversion of self-generating area as % of remaining area Change in mean temperature Change in precipitation disturbance road density m3 water extracted fragmentation (size, isolation, connectivity) fire habitat alteration damming and canalisation of rivers any physical factor
What is the size of a pressure? Is it increasing, stable or decreasing?
1st track: The size of individual pressures compared to a particular reference year and natural background value 2nd track: the size of individual pressures to their impact on biodiversity
physical37 direct
…………. H+ deposition P or N deposition exceeding of soil, water and air standards of particular pollutants
What is the size of a pressure? Is it increasing, stable or decreasing?
1st track: The size of individual pressures compared to a particular baseline year or natural background value or critical value or standard 2nd track: the size of individual pressures to their impact on biodiversity
chemical37 direct
……….. total number of invasive species as a % of particular groups total amount harvested per species per harvesting type
Pressure
biological direct
any human induced biological pressure factor
What is the size of a pressure? Is it increasing, stable or decreasing? What type of harvesting is applied,
1st track: The size of individual pressures compared to a particular baseline year or maximum
36 See FAO publications: “Review and development of indicators for genetic diversity, genetic erosion and genetic
vulnerability” (2002) and “Indicators and reporting format for monitoring the implementation of the Global Plan of Action for the Conservation and Sustainable Utilization of Plant Genetic Resources for Food and Agriculture” as well as references in appendix 2.
37 Several physical and chemical indicators has been worked out by the OECD. See also Adriaanse, A. 1993. Environmental policy performance indicators. Sdu, The Hague, ISBN 90 12 08099 1.
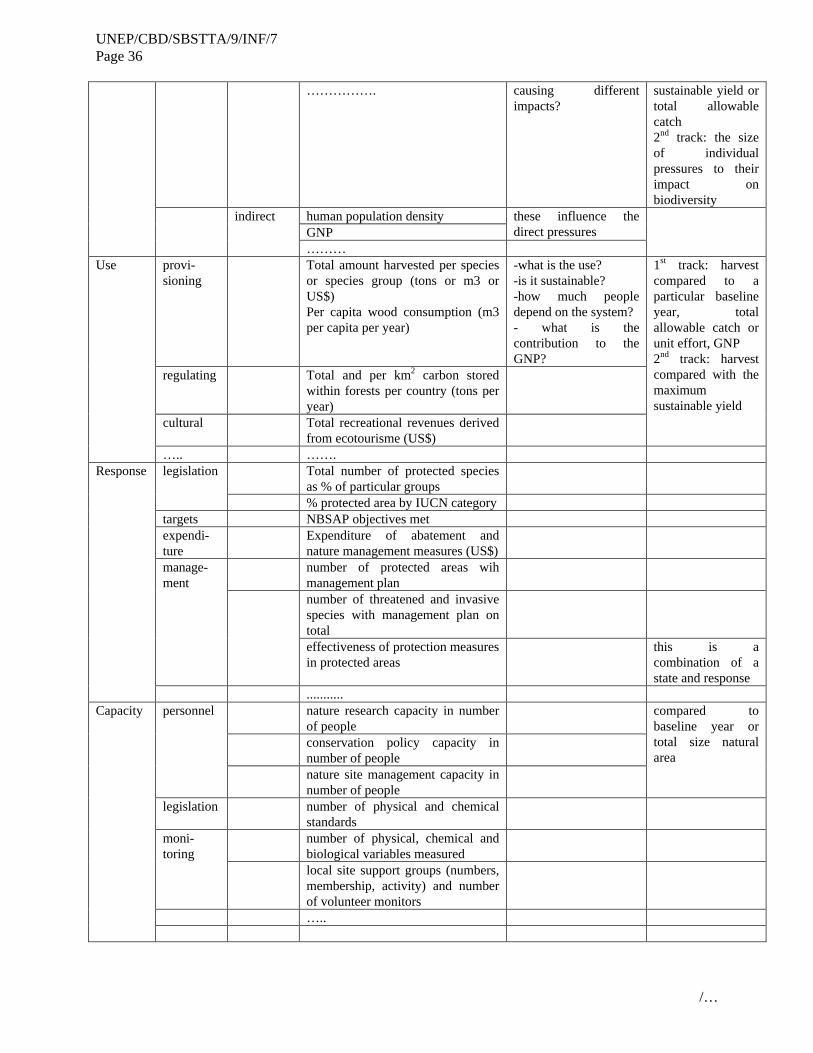
UNEP/CBD/SBSTTA/9/INF/7 Page 36
/…
……………. causing different impacts?
sustainable yield or total allowable catch 2nd track: the size of individual pressures to their impact on biodiversity
human population density GNP
these influence the direct pressures
indirect
………
provi-sioning
Total amount harvested per species or species group (tons or m3 or US$) Per capita wood consumption (m3 per capita per year)
-what is the use? -is it sustainable? -how much people depend on the system? - what is the contribution to the GNP?
regulating Total and per km2 carbon stored within forests per country (tons per year)
cultural Total recreational revenues derived from ecotourisme (US$)
1st track: harvest compared to a particular baseline year, total allowable catch or unit effort, GNP 2nd track: harvest compared with the maximum sustainable yield
Use
….. ……. Total number of protected species
as % of particular groups legislation
% protected area by IUCN category targets NBSAP objectives met expendi-ture
Expenditure of abatement and nature management measures (US$)
number of protected areas wih management plan
number of threatened and invasive species with management plan on total
manage-ment
effectiveness of protection measures in protected areas
this is a combination of a state and response
Response
........... nature research capacity in number
of people
conservation policy capacity in number of people
personnel
nature site management capacity in number of people
compared to baseline year or total size natural area
legislation number of physical and chemical standards
number of physical, chemical and biological variables measured
moni-toring
local site support groups (numbers, membership, activity) and number of volunteer monitors
…..
Capacity
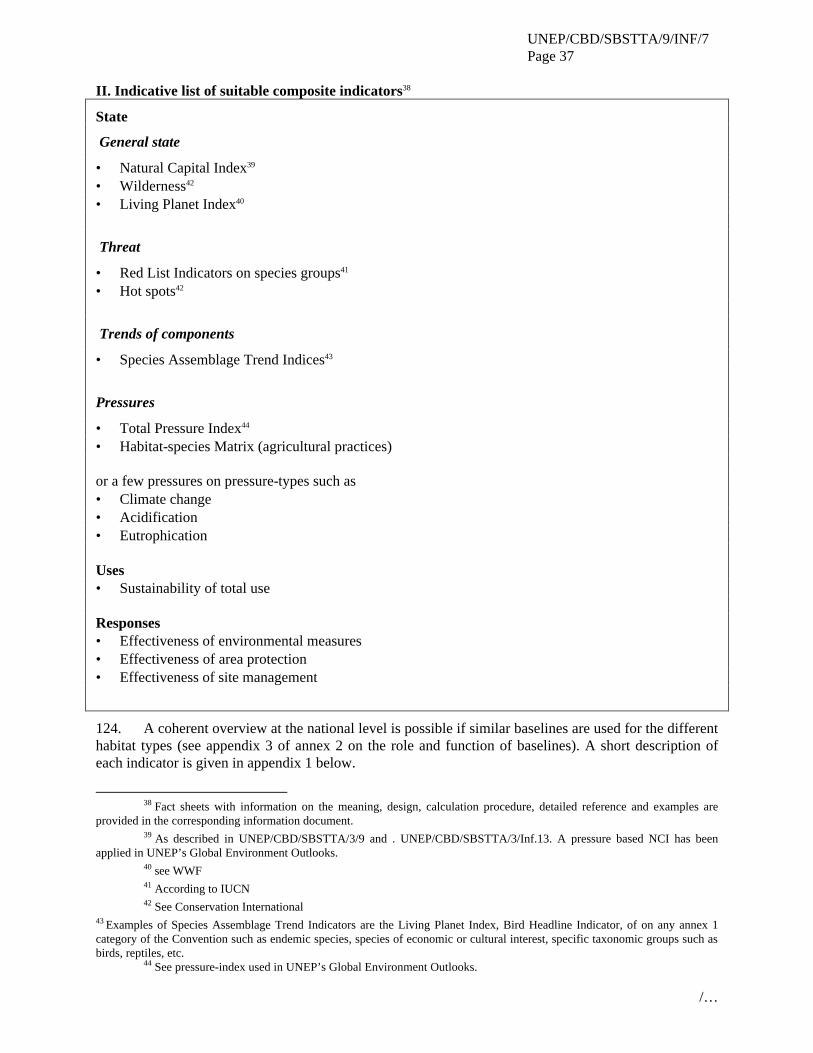
UNEP/CBD/SBSTTA/9/INF/7 Page 37
/…
II. Indicative list of suitable composite indicators38
State
General state
• Natural Capital Index39 • Wilderness42 • Living Planet Index40
Threat
• Red List Indicators on species groups41 • Hot spots42
Trends of components
• Species Assemblage Trend Indices43
Pressures
• Total Pressure Index44 • Habitat-species Matrix (agricultural practices) or a few pressures on pressure-types such as • Climate change • Acidification • Eutrophication Uses • Sustainability of total use Responses • Effectiveness of environmental measures • Effectiveness of area protection • Effectiveness of site management
124. A coherent overview at the national level is possible if similar baselines are used for the different habitat types (see appendix 3 of annex 2 on the role and function of baselines). A short description of each indicator is given in appendix 1 below.
38 Fact sheets with information on the meaning, design, calculation procedure, detailed reference and examples are
provided in the corresponding information document. 39 As described in UNEP/CBD/SBSTTA/3/9 and . UNEP/CBD/SBSTTA/3/Inf.13. A pressure based NCI has been
applied in UNEP’s Global Environment Outlooks. 40 see WWF 41 According to IUCN 42 See Conservation International
43 Examples of Species Assemblage Trend Indicators are the Living Planet Index, Bird Headline Indicator, of on any annex 1 category of the Convention such as endemic species, species of economic or cultural interest, specific taxonomic groups such as birds, reptiles, etc.
44 See pressure-index used in UNEP’s Global Environment Outlooks.
UNEP/CBD/SBSTTA/9/INF/7 Page 38
/…
125. Referring to document UNEP/CBD/SBSTTA/3/9 and UNEP/CBD/SBSTTA/3/INF/13, the process of biodiversity loss generally results in the decline in abundance of many species and the increase in abundance of a few other species due to human activities. Common species are becoming more common, and rare species become even rarer. This is also called the uniformity process. Species extinction is only the last step of a long process of ecosystem degradation. Habitat loss is one major factor in the loss of abundance of many species. Loss of ecosystem quality is the other major factor resulting from many pressures such as exploitation, fragmentation, pollution, eutrophication, climate change etc. The three composite indicators on biodiversity state show different aspects of the above degradation process.
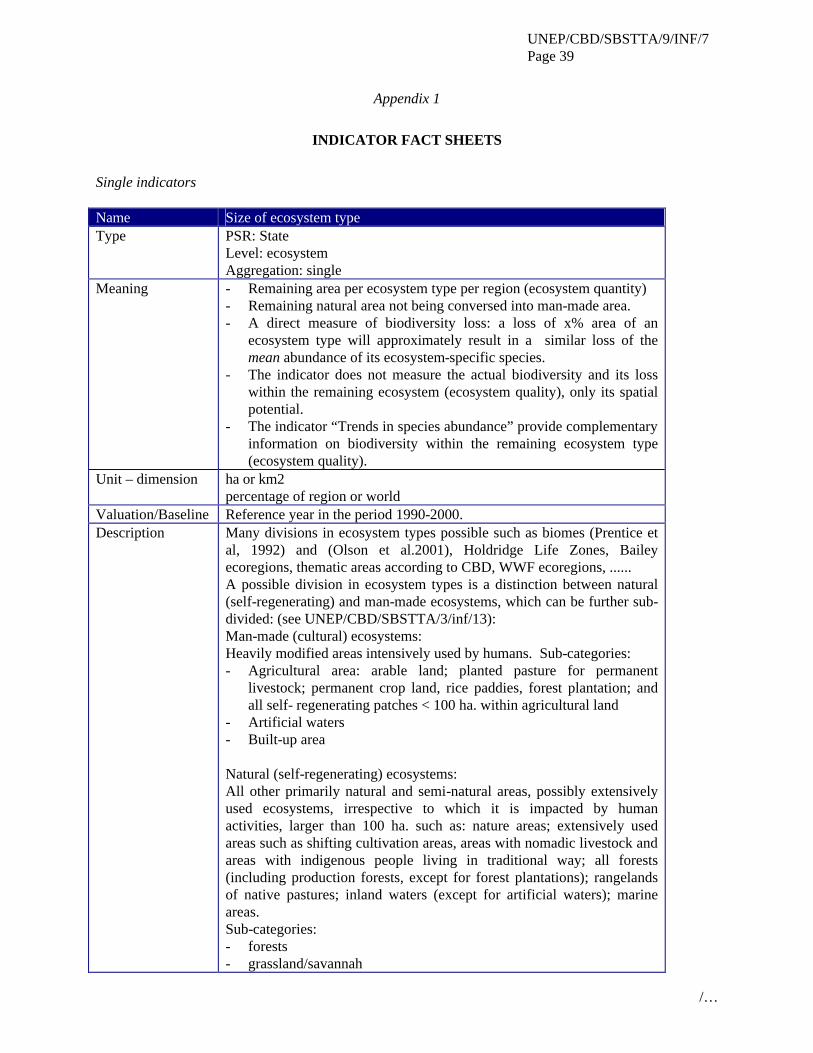
UNEP/CBD/SBSTTA/9/INF/7 Page 39
/…
Appendix 1
INDICATOR FACT SHEETS
Single indicators Name Size of ecosystem type Type PSR: State
Level: ecosystem Aggregation: single
Meaning - Remaining area per ecosystem type per region (ecosystem quantity) - Remaining natural area not being conversed into man-made area. - A direct measure of biodiversity loss: a loss of x% area of an
ecosystem type will approximately result in a similar loss of the mean abundance of its ecosystem-specific species.
- The indicator does not measure the actual biodiversity and its loss within the remaining ecosystem (ecosystem quality), only its spatial potential.
- The indicator “Trends in species abundance” provide complementary information on biodiversity within the remaining ecosystem type (ecosystem quality).
Unit – dimension ha or km2 percentage of region or world
Valuation/Baseline Reference year in the period 1990-2000. Description Many divisions in ecosystem types possible such as biomes (Prentice et
al, 1992) and (Olson et al.2001), Holdridge Life Zones, Bailey ecoregions, thematic areas according to CBD, WWF ecoregions, ...... A possible division in ecosystem types is a distinction between natural (self-regenerating) and man-made ecosystems, which can be further sub-divided: (see UNEP/CBD/SBSTTA/3/inf/13): Man-made (cultural) ecosystems: Heavily modified areas intensively used by humans. Sub-categories: - Agricultural area: arable land; planted pasture for permanent
livestock; permanent crop land, rice paddies, forest plantation; and all self- regenerating patches < 100 ha. within agricultural land
- Artificial waters - Built-up area Natural (self-regenerating) ecosystems: All other primarily natural and semi-natural areas, possibly extensively used ecosystems, irrespective to which it is impacted by human activities, larger than 100 ha. such as: nature areas; extensively used areas such as shifting cultivation areas, areas with nomadic livestock and areas with indigenous people living in traditional way; all forests (including production forests, except for forest plantations); rangelands of native pastures; inland waters (except for artificial waters); marine areas. Sub-categories: - forests - grassland/savannah
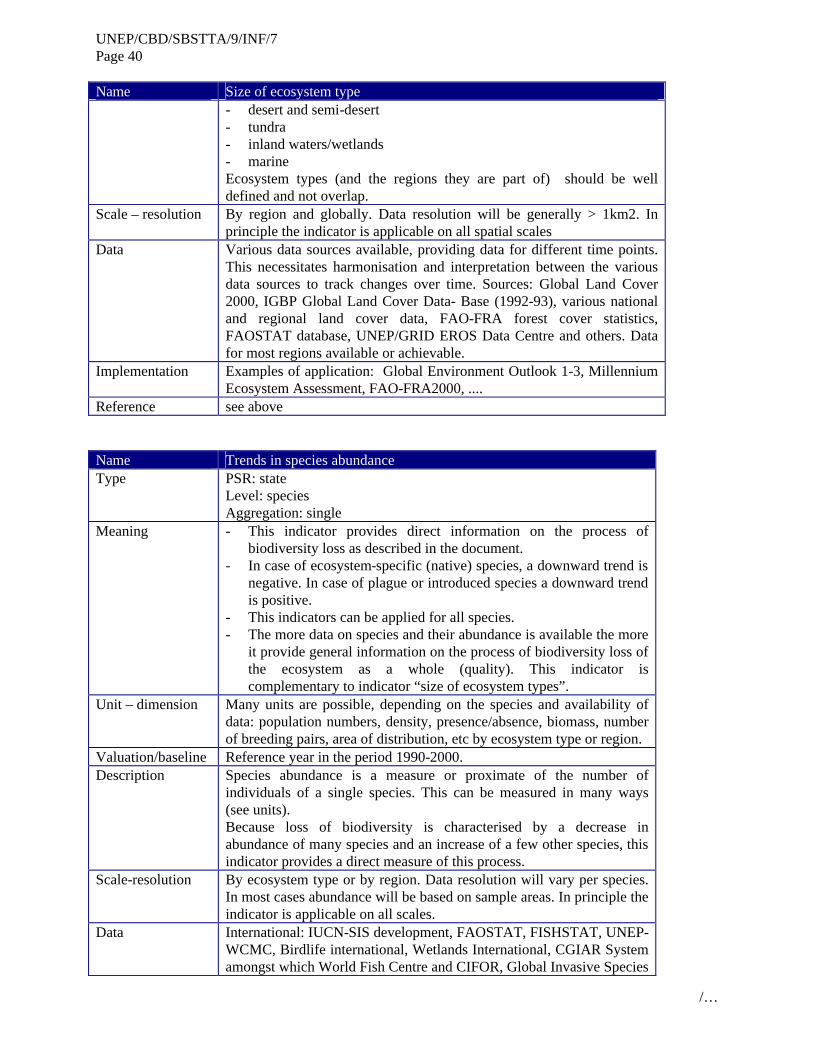
UNEP/CBD/SBSTTA/9/INF/7 Page 40
/…
Name Size of ecosystem type - desert and semi-desert - tundra - inland waters/wetlands - marine Ecosystem types (and the regions they are part of) should be well defined and not overlap.
Scale – resolution By region and globally. Data resolution will be generally > 1km2. In principle the indicator is applicable on all spatial scales
Data Various data sources available, providing data for different time points. This necessitates harmonisation and interpretation between the various data sources to track changes over time. Sources: Global Land Cover 2000, IGBP Global Land Cover Data- Base (1992-93), various national and regional land cover data, FAO-FRA forest cover statistics, FAOSTAT database, UNEP/GRID EROS Data Centre and others. Data for most regions available or achievable.
Implementation Examples of application: Global Environment Outlook 1-3, Millennium Ecosystem Assessment, FAO-FRA2000, ....
Reference see above Name Trends in species abundance Type PSR: state
Level: species Aggregation: single
Meaning - This indicator provides direct information on the process of biodiversity loss as described in the document.
- In case of ecosystem-specific (native) species, a downward trend is negative. In case of plague or introduced species a downward trend is positive.
- This indicators can be applied for all species. - The more data on species and their abundance is available the more
it provide general information on the process of biodiversity loss of the ecosystem as a whole (quality). This indicator is complementary to indicator “size of ecosystem types”.
Unit – dimension Many units are possible, depending on the species and availability of data: population numbers, density, presence/absence, biomass, number of breeding pairs, area of distribution, etc by ecosystem type or region.
Valuation/baseline Reference year in the period 1990-2000. Description Species abundance is a measure or proximate of the number of
individuals of a single species. This can be measured in many ways (see units). Because loss of biodiversity is characterised by a decrease in abundance of many species and an increase of a few other species, this indicator provides a direct measure of this process.
Scale-resolution By ecosystem type or by region. Data resolution will vary per species. In most cases abundance will be based on sample areas. In principle the indicator is applicable on all scales.
Data International: IUCN-SIS development, FAOSTAT, FISHSTAT, UNEP-WCMC, Birdlife international, Wetlands International, CGIAR System amongst which World Fish Centre and CIFOR, Global Invasive Species
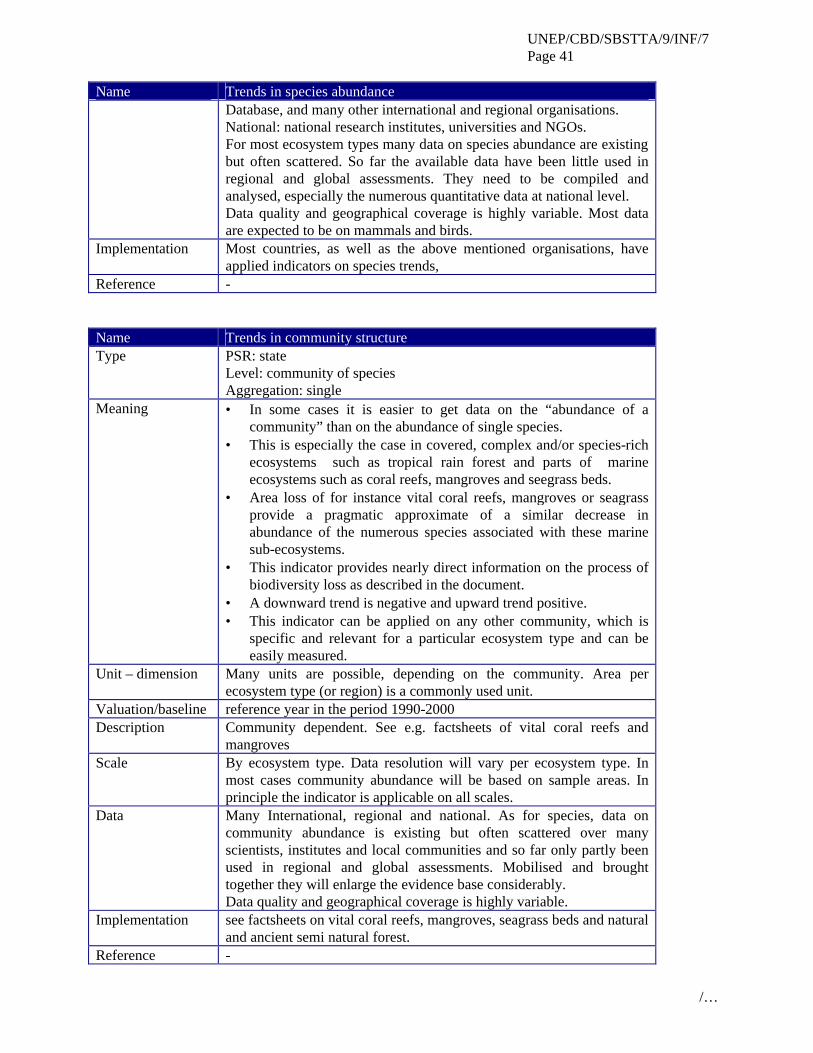
UNEP/CBD/SBSTTA/9/INF/7 Page 41
/…
Name Trends in species abundance Database, and many other international and regional organisations. National: national research institutes, universities and NGOs. For most ecosystem types many data on species abundance are existing but often scattered. So far the available data have been little used in regional and global assessments. They need to be compiled and analysed, especially the numerous quantitative data at national level. Data quality and geographical coverage is highly variable. Most data are expected to be on mammals and birds.
Implementation Most countries, as well as the above mentioned organisations, have applied indicators on species trends,
Reference - Name Trends in community structure Type PSR: state
Level: community of species Aggregation: single
Meaning • In some cases it is easier to get data on the “abundance of a community” than on the abundance of single species.
• This is especially the case in covered, complex and/or species-rich ecosystems such as tropical rain forest and parts of marine ecosystems such as coral reefs, mangroves and seegrass beds.
• Area loss of for instance vital coral reefs, mangroves or seagrass provide a pragmatic approximate of a similar decrease in abundance of the numerous species associated with these marine sub-ecosystems.
• This indicator provides nearly direct information on the process of biodiversity loss as described in the document.
• A downward trend is negative and upward trend positive. • This indicator can be applied on any other community, which is
specific and relevant for a particular ecosystem type and can be easily measured.
Unit – dimension Many units are possible, depending on the community. Area per ecosystem type (or region) is a commonly used unit.
Valuation/baseline reference year in the period 1990-2000 Description Community dependent. See e.g. factsheets of vital coral reefs and
mangroves Scale By ecosystem type. Data resolution will vary per ecosystem type. In
most cases community abundance will be based on sample areas. In principle the indicator is applicable on all scales.
Data Many International, regional and national. As for species, data on community abundance is existing but often scattered over many scientists, institutes and local communities and so far only partly been used in regional and global assessments. Mobilised and brought together they will enlarge the evidence base considerably. Data quality and geographical coverage is highly variable.
Implementation see factsheets on vital coral reefs, mangroves, seagrass beds and natural and ancient semi natural forest.
Reference -
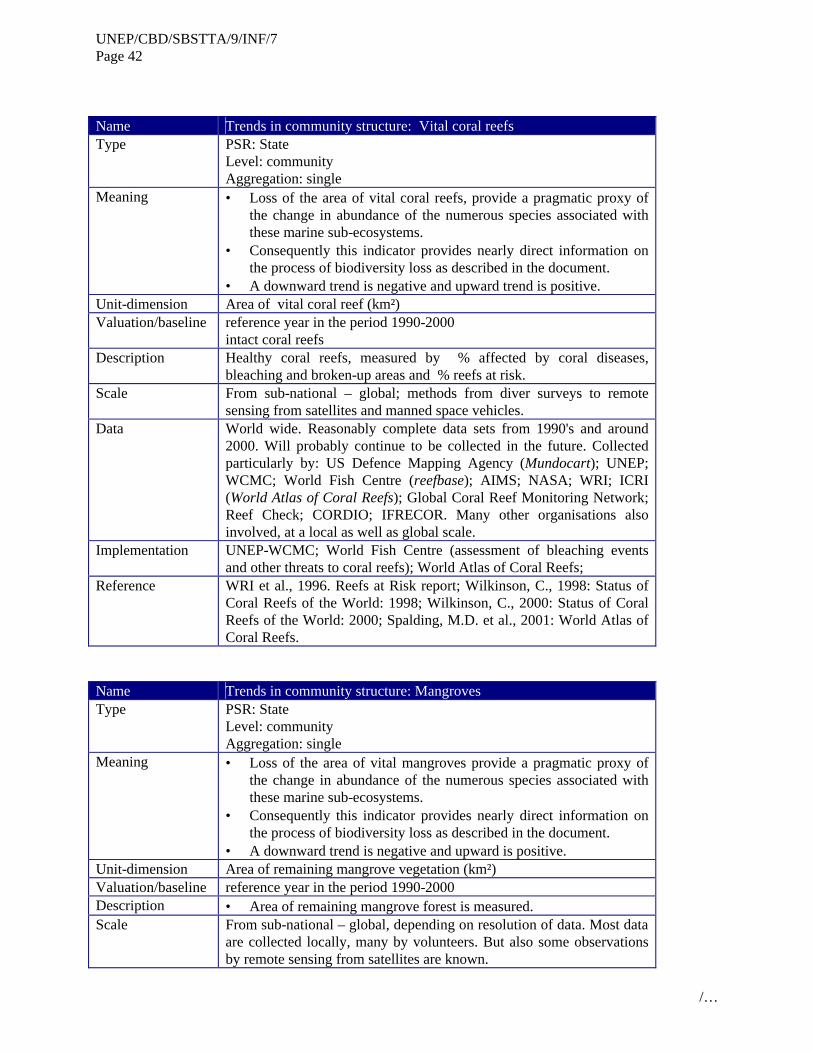
UNEP/CBD/SBSTTA/9/INF/7 Page 42
/…
Name Trends in community structure: Vital coral reefs Type PSR: State
Level: community Aggregation: single
Meaning • Loss of the area of vital coral reefs, provide a pragmatic proxy of the change in abundance of the numerous species associated with these marine sub-ecosystems.
• Consequently this indicator provides nearly direct information on the process of biodiversity loss as described in the document.
• A downward trend is negative and upward trend is positive. Unit-dimension Area of vital coral reef (km²) Valuation/baseline reference year in the period 1990-2000
intact coral reefs Description Healthy coral reefs, measured by % affected by coral diseases,
bleaching and broken-up areas and % reefs at risk. Scale From sub-national – global; methods from diver surveys to remote
sensing from satellites and manned space vehicles. Data World wide. Reasonably complete data sets from 1990's and around
2000. Will probably continue to be collected in the future. Collected particularly by: US Defence Mapping Agency (Mundocart); UNEP; WCMC; World Fish Centre (reefbase); AIMS; NASA; WRI; ICRI (World Atlas of Coral Reefs); Global Coral Reef Monitoring Network; Reef Check; CORDIO; IFRECOR. Many other organisations also involved, at a local as well as global scale.
Implementation UNEP-WCMC; World Fish Centre (assessment of bleaching events and other threats to coral reefs); World Atlas of Coral Reefs;
Reference WRI et al., 1996. Reefs at Risk report; Wilkinson, C., 1998: Status of Coral Reefs of the World: 1998; Wilkinson, C., 2000: Status of Coral Reefs of the World: 2000; Spalding, M.D. et al., 2001: World Atlas of Coral Reefs.
Name Trends in community structure: Mangroves Type PSR: State
Level: community Aggregation: single
Meaning • Loss of the area of vital mangroves provide a pragmatic proxy of the change in abundance of the numerous species associated with these marine sub-ecosystems.
• Consequently this indicator provides nearly direct information on the process of biodiversity loss as described in the document.
• A downward trend is negative and upward is positive. Unit-dimension Area of remaining mangrove vegetation (km²) Valuation/baseline reference year in the period 1990-2000 Description • Area of remaining mangrove forest is measured. Scale From sub-national – global, depending on resolution of data. Most data
are collected locally, many by volunteers. But also some observations by remote sensing from satellites are known.
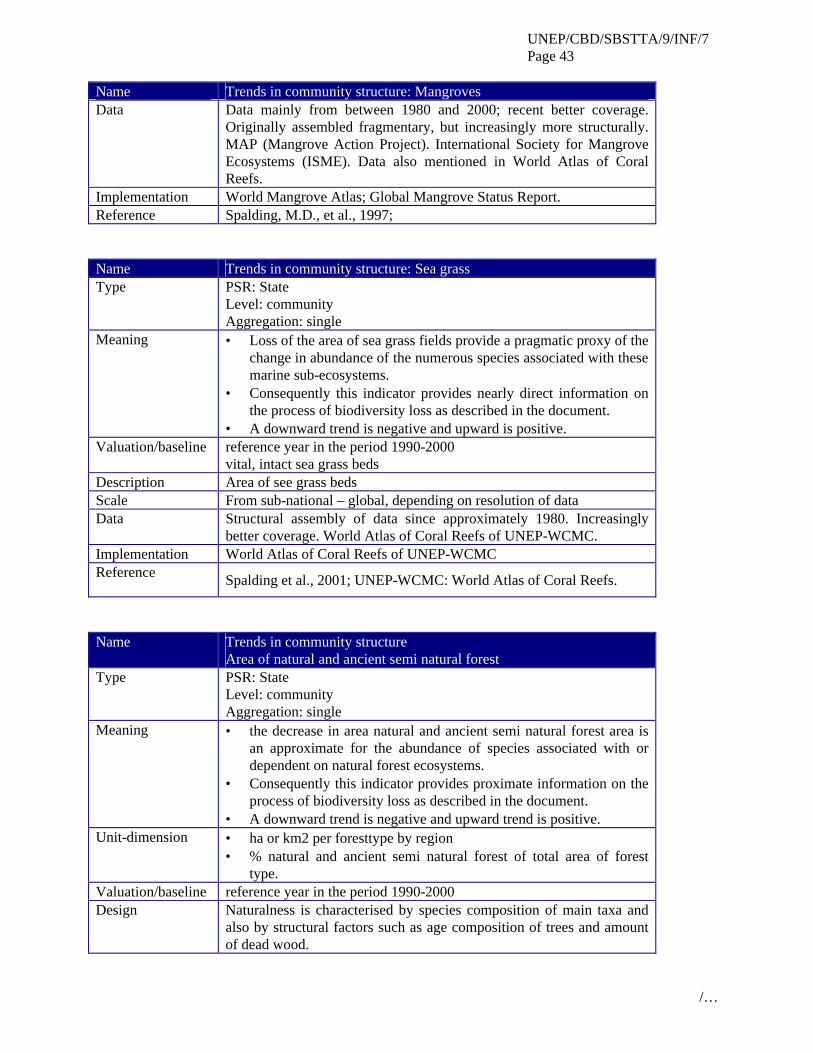
UNEP/CBD/SBSTTA/9/INF/7 Page 43
/…
Name Trends in community structure: Mangroves Data Data mainly from between 1980 and 2000; recent better coverage.
Originally assembled fragmentary, but increasingly more structurally. MAP (Mangrove Action Project). International Society for Mangrove Ecosystems (ISME). Data also mentioned in World Atlas of Coral Reefs.
Implementation World Mangrove Atlas; Global Mangrove Status Report. Reference Spalding, M.D., et al., 1997; Name Trends in community structure: Sea grass Type PSR: State
Level: community Aggregation: single
Meaning • Loss of the area of sea grass fields provide a pragmatic proxy of the change in abundance of the numerous species associated with these marine sub-ecosystems.
• Consequently this indicator provides nearly direct information on the process of biodiversity loss as described in the document.
• A downward trend is negative and upward is positive. Valuation/baseline reference year in the period 1990-2000
vital, intact sea grass beds Description Area of see grass beds Scale From sub-national – global, depending on resolution of data Data Structural assembly of data since approximately 1980. Increasingly
better coverage. World Atlas of Coral Reefs of UNEP-WCMC. Implementation World Atlas of Coral Reefs of UNEP-WCMC Reference Spalding et al., 2001; UNEP-WCMC: World Atlas of Coral Reefs.
Name Trends in community structure
Area of natural and ancient semi natural forest Type PSR: State
Level: community Aggregation: single
Meaning • the decrease in area natural and ancient semi natural forest area is an approximate for the abundance of species associated with or dependent on natural forest ecosystems.
• Consequently this indicator provides proximate information on the process of biodiversity loss as described in the document.
• A downward trend is negative and upward trend is positive. Unit-dimension • ha or km2 per foresttype by region
• % natural and ancient semi natural forest of total area of forest type.
Valuation/baseline reference year in the period 1990-2000 Design Naturalness is characterised by species composition of main taxa and
also by structural factors such as age composition of trees and amount of dead wood.
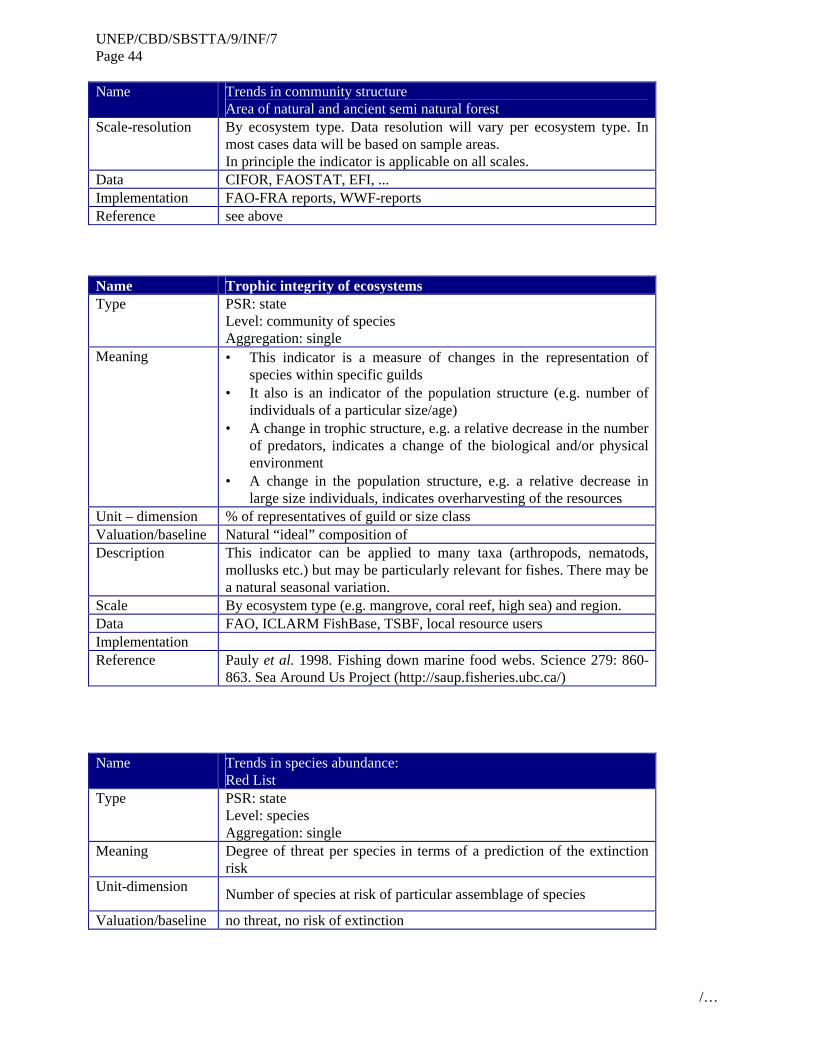
UNEP/CBD/SBSTTA/9/INF/7 Page 44
/…
Name Trends in community structure Area of natural and ancient semi natural forest
Scale-resolution By ecosystem type. Data resolution will vary per ecosystem type. In most cases data will be based on sample areas. In principle the indicator is applicable on all scales.
Data CIFOR, FAOSTAT, EFI, ... Implementation FAO-FRA reports, WWF-reports Reference see above
Name Trophic integrity of ecosystems Type PSR: state
Level: community of species Aggregation: single
Meaning • This indicator is a measure of changes in the representation of species within specific guilds
• It also is an indicator of the population structure (e.g. number of individuals of a particular size/age)
• A change in trophic structure, e.g. a relative decrease in the number of predators, indicates a change of the biological and/or physical environment
• A change in the population structure, e.g. a relative decrease in large size individuals, indicates overharvesting of the resources
Unit – dimension % of representatives of guild or size class Valuation/baseline Natural “ideal” composition of Description This indicator can be applied to many taxa (arthropods, nematods,
mollusks etc.) but may be particularly relevant for fishes. There may be a natural seasonal variation.
Scale By ecosystem type (e.g. mangrove, coral reef, high sea) and region. Data FAO, ICLARM FishBase, TSBF, local resource users Implementation Reference Pauly et al. 1998. Fishing down marine food webs. Science 279: 860-
863. Sea Around Us Project (http://saup.fisheries.ubc.ca/)
Name Trends in species abundance: Red List
Type PSR: state Level: species Aggregation: single
Meaning Degree of threat per species in terms of a prediction of the extinction risk
Unit-dimension Number of species at risk of particular assemblage of species
Valuation/baseline no threat, no risk of extinction
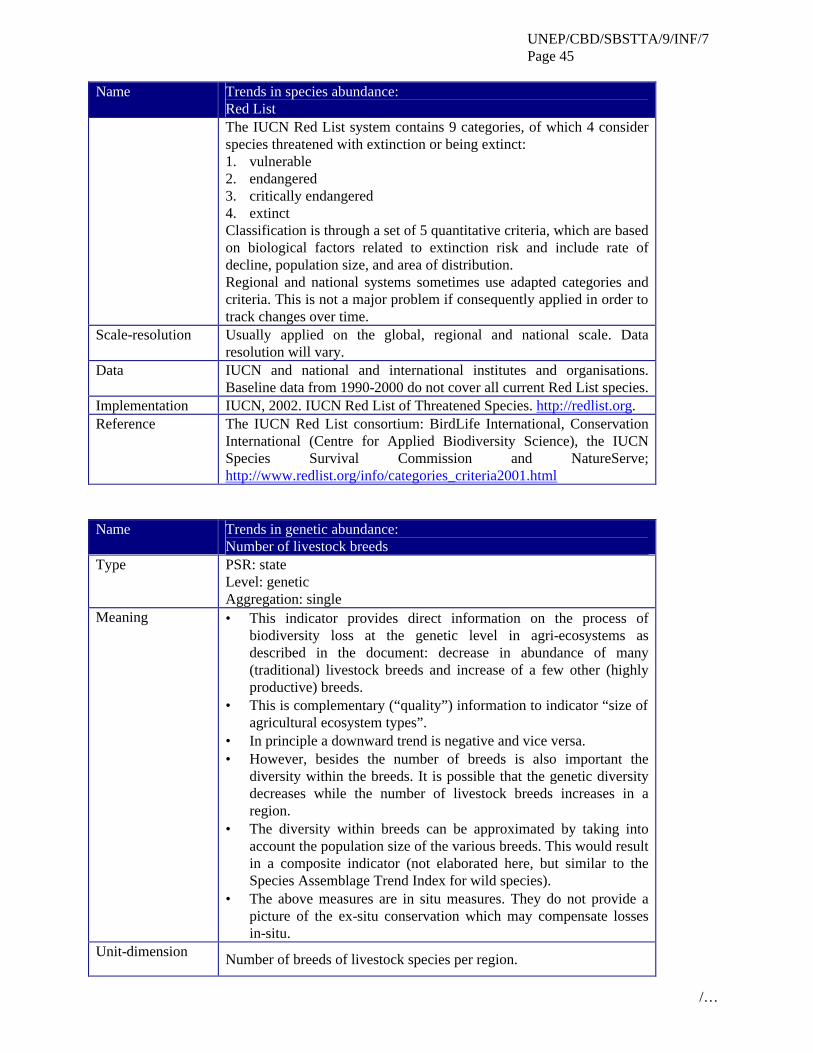
UNEP/CBD/SBSTTA/9/INF/7 Page 45
/…
Name Trends in species abundance: Red List
The IUCN Red List system contains 9 categories, of which 4 consider species threatened with extinction or being extinct: 1. vulnerable 2. endangered 3. critically endangered 4. extinct Classification is through a set of 5 quantitative criteria, which are based on biological factors related to extinction risk and include rate of decline, population size, and area of distribution. Regional and national systems sometimes use adapted categories and criteria. This is not a major problem if consequently applied in order to track changes over time.
Scale-resolution Usually applied on the global, regional and national scale. Data resolution will vary.
Data IUCN and national and international institutes and organisations. Baseline data from 1990-2000 do not cover all current Red List species.
Implementation IUCN, 2002. IUCN Red List of Threatened Species. http://redlist.org. Reference The IUCN Red List consortium: BirdLife International, Conservation
International (Centre for Applied Biodiversity Science), the IUCN Species Survival Commission and NatureServe; http://www.redlist.org/info/categories_criteria2001.html
Name Trends in genetic abundance:
Number of livestock breeds Type PSR: state
Level: genetic Aggregation: single
Meaning • This indicator provides direct information on the process of biodiversity loss at the genetic level in agri-ecosystems as described in the document: decrease in abundance of many (traditional) livestock breeds and increase of a few other (highly productive) breeds.
• This is complementary (“quality”) information to indicator “size of agricultural ecosystem types”.
• In principle a downward trend is negative and vice versa. • However, besides the number of breeds is also important the
diversity within the breeds. It is possible that the genetic diversity decreases while the number of livestock breeds increases in a region.
• The diversity within breeds can be approximated by taking into account the population size of the various breeds. This would result in a composite indicator (not elaborated here, but similar to the Species Assemblage Trend Index for wild species).
• The above measures are in situ measures. They do not provide a picture of the ex-situ conservation which may compensate losses in-situ.
Unit-dimension Number of breeds of livestock species per region.
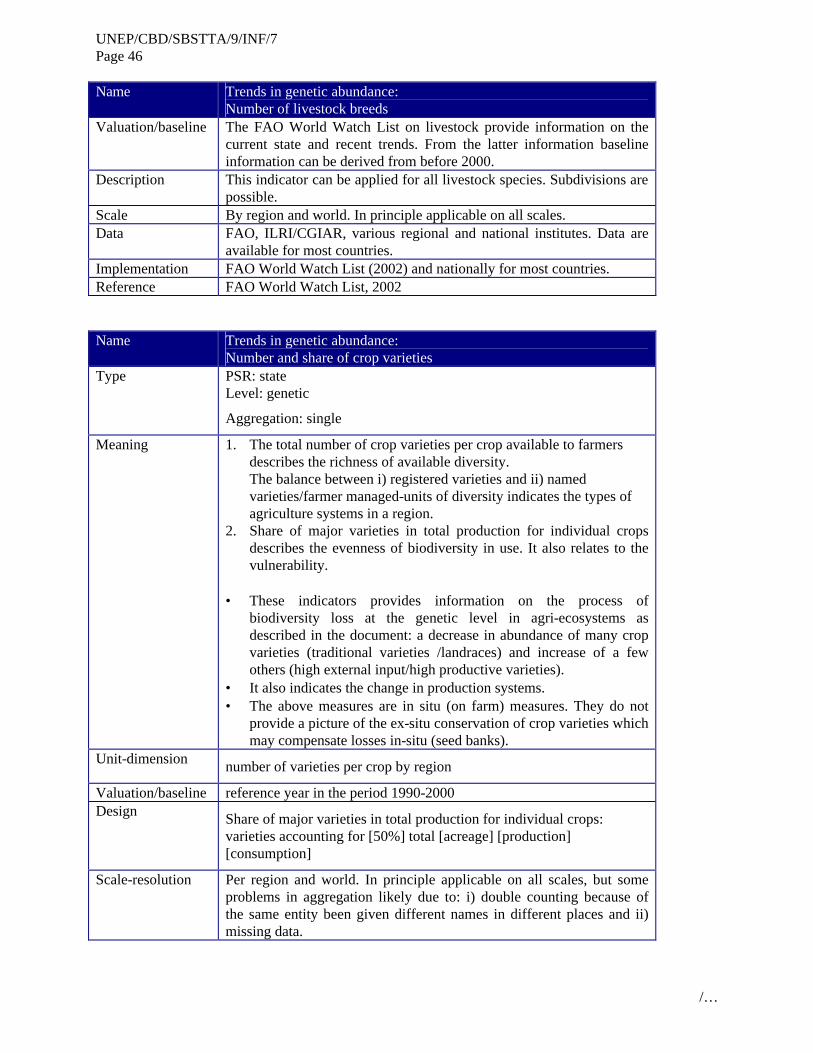
UNEP/CBD/SBSTTA/9/INF/7 Page 46
/…
Name Trends in genetic abundance: Number of livestock breeds
Valuation/baseline The FAO World Watch List on livestock provide information on the current state and recent trends. From the latter information baseline information can be derived from before 2000.
Description This indicator can be applied for all livestock species. Subdivisions are possible.
Scale By region and world. In principle applicable on all scales. Data FAO, ILRI/CGIAR, various regional and national institutes. Data are
available for most countries. Implementation FAO World Watch List (2002) and nationally for most countries. Reference FAO World Watch List, 2002 Name Trends in genetic abundance:
Number and share of crop varieties Type PSR: state
Level: genetic
Aggregation: single
Meaning 1. The total number of crop varieties per crop available to farmers describes the richness of available diversity. The balance between i) registered varieties and ii) named varieties/farmer managed-units of diversity indicates the types of agriculture systems in a region.
2. Share of major varieties in total production for individual crops describes the evenness of biodiversity in use. It also relates to the vulnerability.
• These indicators provides information on the process of
biodiversity loss at the genetic level in agri-ecosystems as described in the document: a decrease in abundance of many crop varieties (traditional varieties /landraces) and increase of a few others (high external input/high productive varieties).
• It also indicates the change in production systems. • The above measures are in situ (on farm) measures. They do not
provide a picture of the ex-situ conservation of crop varieties which may compensate losses in-situ (seed banks).
Unit-dimension number of varieties per crop by region
Valuation/baseline reference year in the period 1990-2000 Design Share of major varieties in total production for individual crops:
varieties accounting for [50%] total [acreage] [production] [consumption]
Scale-resolution Per region and world. In principle applicable on all scales, but some problems in aggregation likely due to: i) double counting because of the same entity been given different names in different places and ii) missing data.
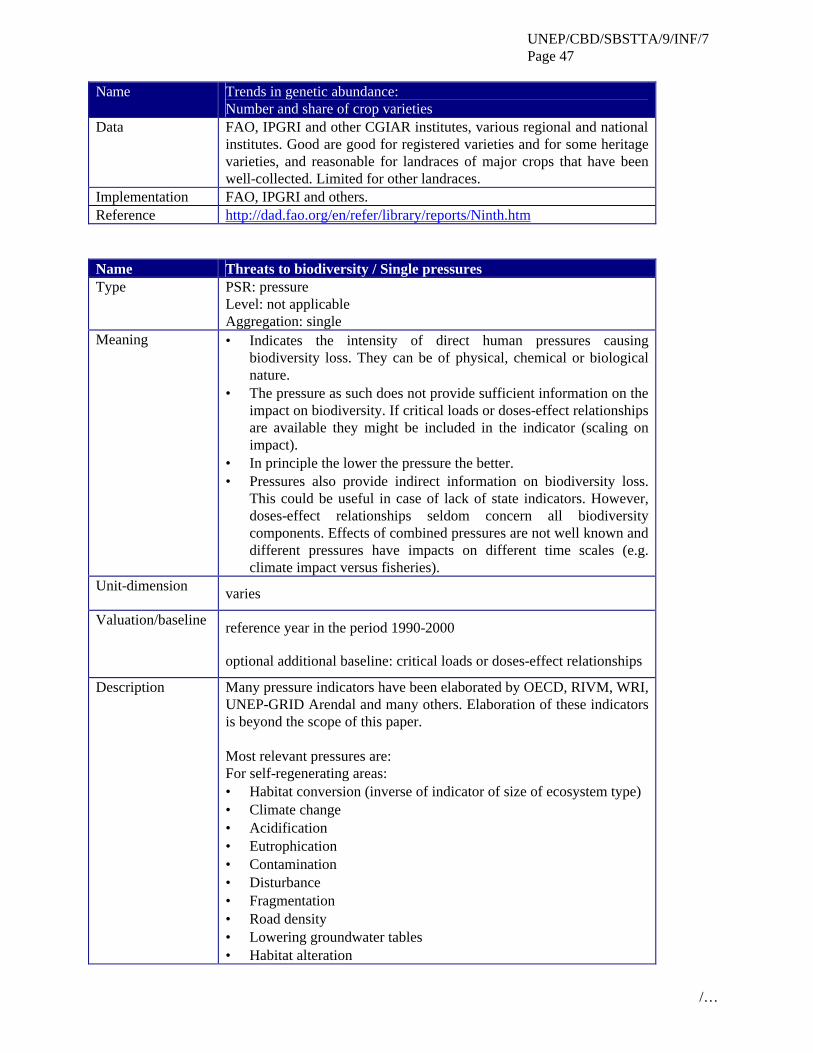
UNEP/CBD/SBSTTA/9/INF/7 Page 47
/…
Name Trends in genetic abundance: Number and share of crop varieties
Data FAO, IPGRI and other CGIAR institutes, various regional and national institutes. Good are good for registered varieties and for some heritage varieties, and reasonable for landraces of major crops that have been well-collected. Limited for other landraces.
Implementation FAO, IPGRI and others. Reference http://dad.fao.org/en/refer/library/reports/Ninth.htm Name Threats to biodiversity / Single pressures Type PSR: pressure
Level: not applicable Aggregation: single
Meaning • Indicates the intensity of direct human pressures causing biodiversity loss. They can be of physical, chemical or biological nature.
• The pressure as such does not provide sufficient information on the impact on biodiversity. If critical loads or doses-effect relationships are available they might be included in the indicator (scaling on impact).
• In principle the lower the pressure the better. • Pressures also provide indirect information on biodiversity loss.
This could be useful in case of lack of state indicators. However, doses-effect relationships seldom concern all biodiversity components. Effects of combined pressures are not well known and different pressures have impacts on different time scales (e.g. climate impact versus fisheries).
Unit-dimension varies
Valuation/baseline reference year in the period 1990-2000
optional additional baseline: critical loads or doses-effect relationships
Description Many pressure indicators have been elaborated by OECD, RIVM, WRI, UNEP-GRID Arendal and many others. Elaboration of these indicators is beyond the scope of this paper. Most relevant pressures are: For self-regenerating areas: • Habitat conversion (inverse of indicator of size of ecosystem type) • Climate change • Acidification • Eutrophication • Contamination • Disturbance • Fragmentation • Road density • Lowering groundwater tables • Habitat alteration
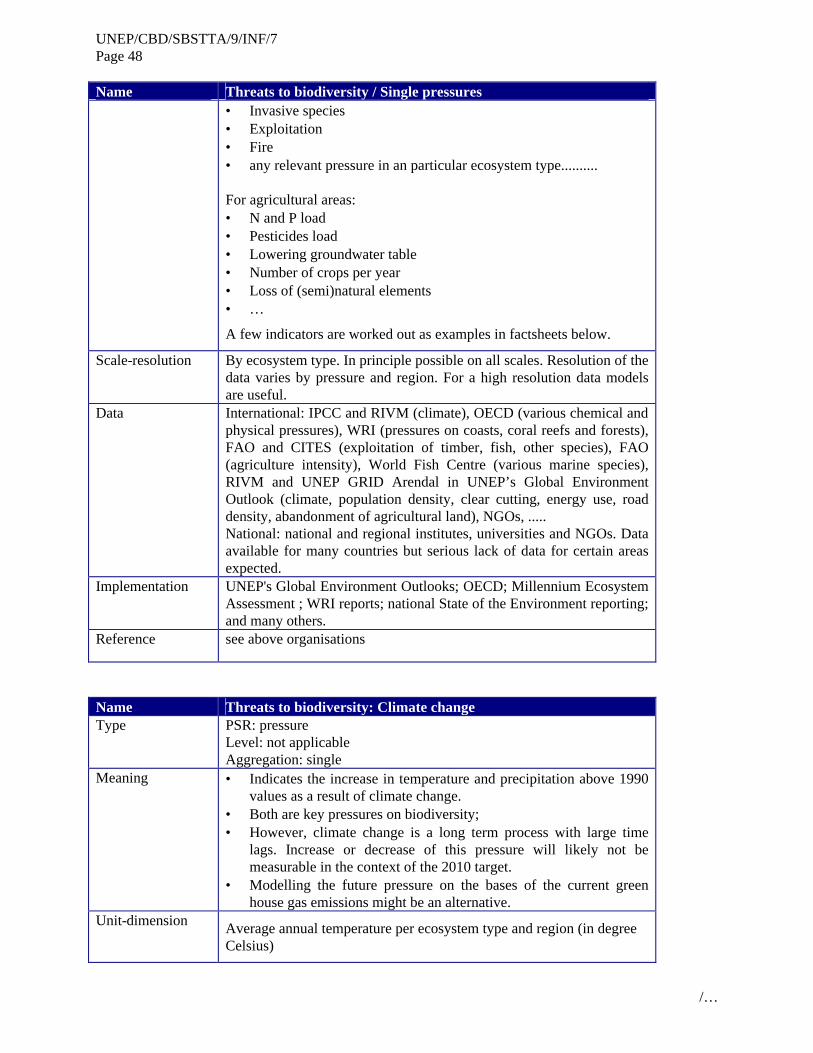
UNEP/CBD/SBSTTA/9/INF/7 Page 48
/…
Name Threats to biodiversity / Single pressures • Invasive species • Exploitation • Fire • any relevant pressure in an particular ecosystem type.......... For agricultural areas: • N and P load • Pesticides load • Lowering groundwater table • Number of crops per year • Loss of (semi)natural elements • …
A few indicators are worked out as examples in factsheets below.
Scale-resolution By ecosystem type. In principle possible on all scales. Resolution of the data varies by pressure and region. For a high resolution data models are useful.
Data International: IPCC and RIVM (climate), OECD (various chemical and physical pressures), WRI (pressures on coasts, coral reefs and forests), FAO and CITES (exploitation of timber, fish, other species), FAO (agriculture intensity), World Fish Centre (various marine species), RIVM and UNEP GRID Arendal in UNEP’s Global Environment Outlook (climate, population density, clear cutting, energy use, road density, abandonment of agricultural land), NGOs, ..... National: national and regional institutes, universities and NGOs. Data available for many countries but serious lack of data for certain areas expected.
Implementation UNEP's Global Environment Outlooks; OECD; Millennium Ecosystem Assessment ; WRI reports; national State of the Environment reporting; and many others.
Reference see above organisations
Name Threats to biodiversity: Climate change Type PSR: pressure
Level: not applicable Aggregation: single
Meaning • Indicates the increase in temperature and precipitation above 1990 values as a result of climate change.
• Both are key pressures on biodiversity; • However, climate change is a long term process with large time
lags. Increase or decrease of this pressure will likely not be measurable in the context of the 2010 target.
• Modelling the future pressure on the bases of the current green house gas emissions might be an alternative.
Unit-dimension Average annual temperature per ecosystem type and region (in degree Celsius)
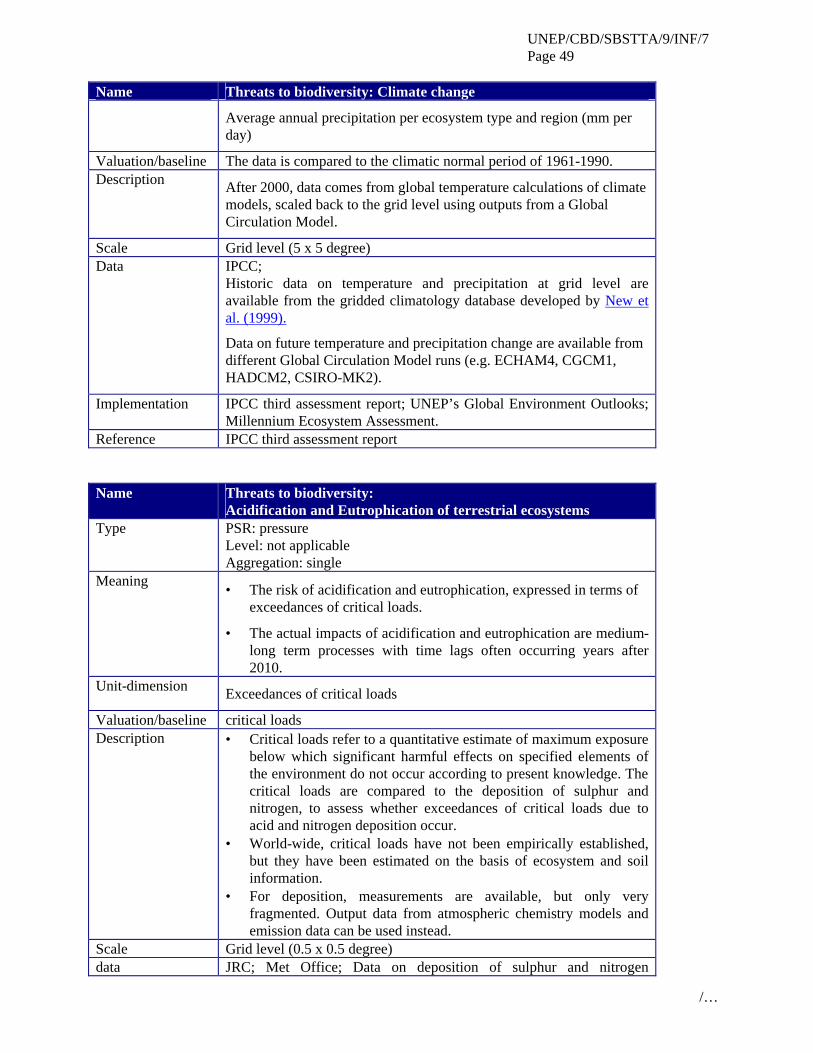
UNEP/CBD/SBSTTA/9/INF/7 Page 49
/…
Name Threats to biodiversity: Climate change
Average annual precipitation per ecosystem type and region (mm per day)
Valuation/baseline The data is compared to the climatic normal period of 1961-1990. Description After 2000, data comes from global temperature calculations of climate
models, scaled back to the grid level using outputs from a Global Circulation Model.
Scale Grid level (5 x 5 degree) Data IPCC;
Historic data on temperature and precipitation at grid level are available from the gridded climatology database developed by New et al. (1999).
Data on future temperature and precipitation change are available from different Global Circulation Model runs (e.g. ECHAM4, CGCM1, HADCM2, CSIRO-MK2).
Implementation IPCC third assessment report; UNEP’s Global Environment Outlooks; Millennium Ecosystem Assessment.
Reference IPCC third assessment report Name Threats to biodiversity:
Acidification and Eutrophication of terrestrial ecosystems Type PSR: pressure
Level: not applicable Aggregation: single
Meaning • The risk of acidification and eutrophication, expressed in terms of exceedances of critical loads.
• The actual impacts of acidification and eutrophication are medium-long term processes with time lags often occurring years after 2010.
Unit-dimension Exceedances of critical loads
Valuation/baseline critical loads Description • Critical loads refer to a quantitative estimate of maximum exposure
below which significant harmful effects on specified elements of the environment do not occur according to present knowledge. The critical loads are compared to the deposition of sulphur and nitrogen, to assess whether exceedances of critical loads due to acid and nitrogen deposition occur.
• World-wide, critical loads have not been empirically established, but they have been estimated on the basis of ecosystem and soil information.
• For deposition, measurements are available, but only very fragmented. Output data from atmospheric chemistry models and emission data can be used instead.
Scale Grid level (0.5 x 0.5 degree) data JRC; Met Office; Data on deposition of sulphur and nitrogen
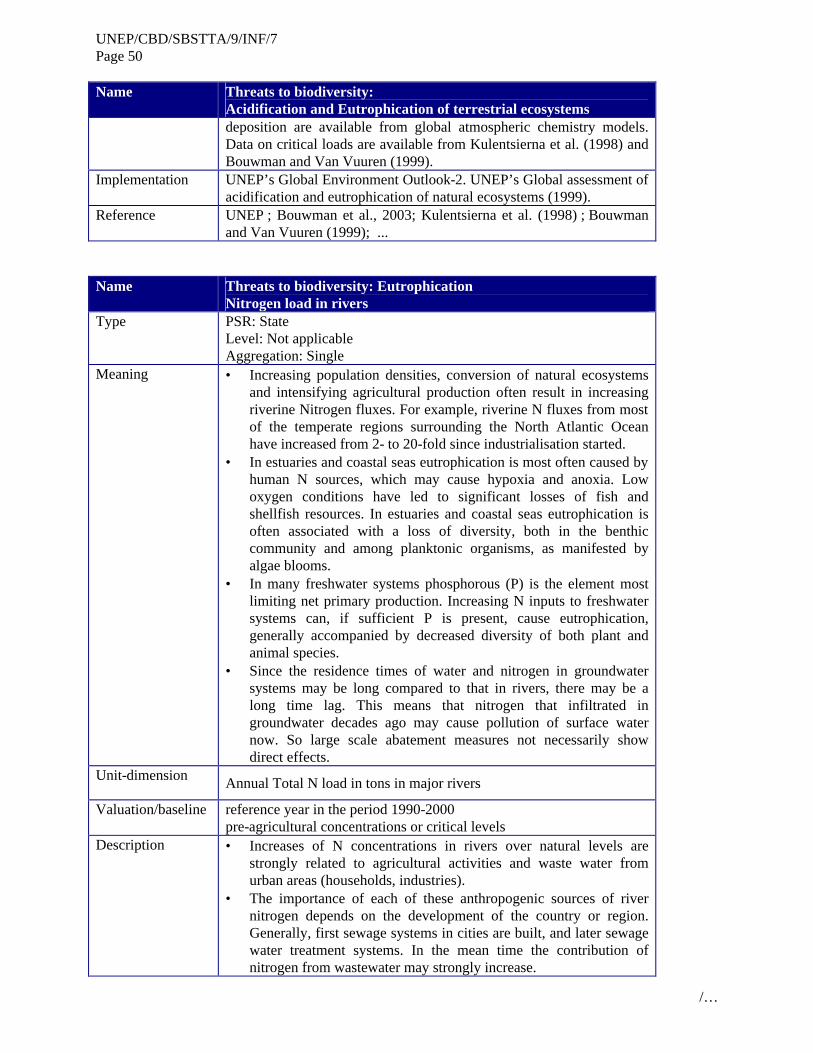
UNEP/CBD/SBSTTA/9/INF/7 Page 50
/…
Name Threats to biodiversity: Acidification and Eutrophication of terrestrial ecosystems
deposition are available from global atmospheric chemistry models. Data on critical loads are available from Kulentsierna et al. (1998) and Bouwman and Van Vuuren (1999).
Implementation UNEP’s Global Environment Outlook-2. UNEP’s Global assessment of acidification and eutrophication of natural ecosystems (1999).
Reference UNEP ; Bouwman et al., 2003; Kulentsierna et al. (1998) ; Bouwman and Van Vuuren (1999); ...
Name Threats to biodiversity: Eutrophication
Nitrogen load in rivers Type PSR: State
Level: Not applicable Aggregation: Single
Meaning • Increasing population densities, conversion of natural ecosystems and intensifying agricultural production often result in increasing riverine Nitrogen fluxes. For example, riverine N fluxes from most of the temperate regions surrounding the North Atlantic Ocean have increased from 2- to 20-fold since industrialisation started.
• In estuaries and coastal seas eutrophication is most often caused by human N sources, which may cause hypoxia and anoxia. Low oxygen conditions have led to significant losses of fish and shellfish resources. In estuaries and coastal seas eutrophication is often associated with a loss of diversity, both in the benthic community and among planktonic organisms, as manifested by algae blooms.
• In many freshwater systems phosphorous (P) is the element most limiting net primary production. Increasing N inputs to freshwater systems can, if sufficient P is present, cause eutrophication, generally accompanied by decreased diversity of both plant and animal species.
• Since the residence times of water and nitrogen in groundwater systems may be long compared to that in rivers, there may be a long time lag. This means that nitrogen that infiltrated in groundwater decades ago may cause pollution of surface water now. So large scale abatement measures not necessarily show direct effects.
Unit-dimension Annual Total N load in tons in major rivers
Valuation/baseline reference year in the period 1990-2000 pre-agricultural concentrations or critical levels
Description • Increases of N concentrations in rivers over natural levels are strongly related to agricultural activities and waste water from urban areas (households, industries).
• The importance of each of these anthropogenic sources of river nitrogen depends on the development of the country or region. Generally, first sewage systems in cities are built, and later sewage water treatment systems. In the mean time the contribution of nitrogen from wastewater may strongly increase.
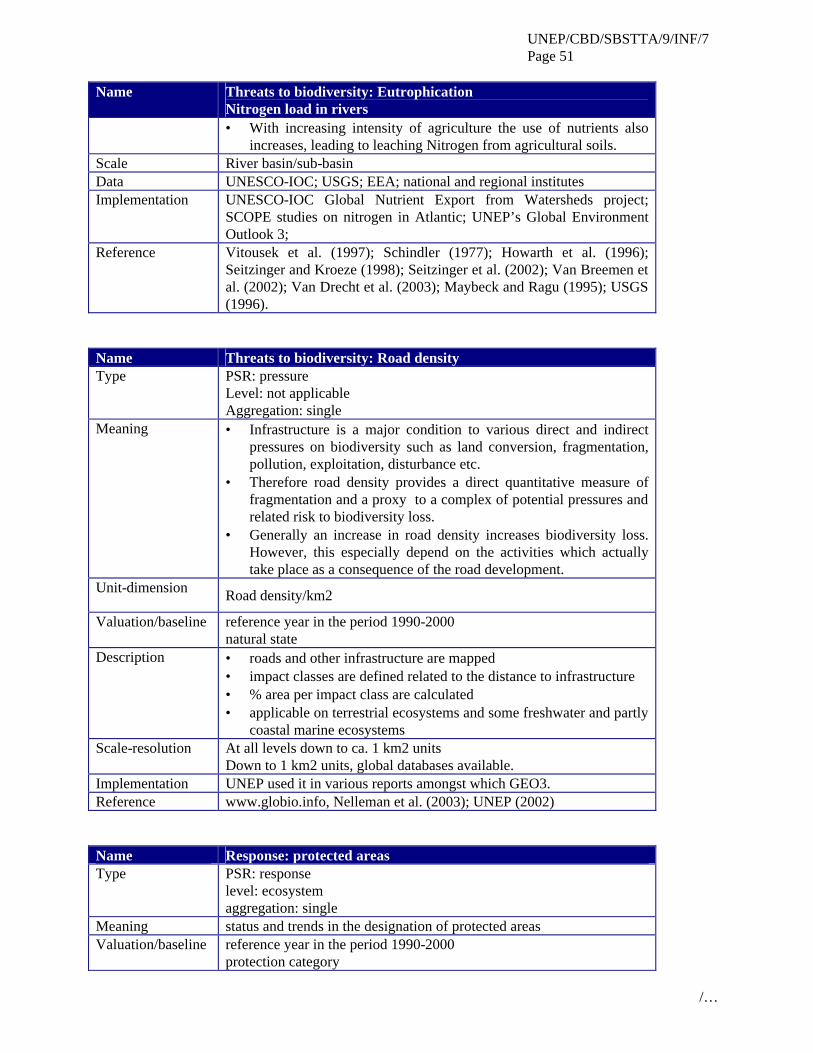
UNEP/CBD/SBSTTA/9/INF/7 Page 51
/…
Name Threats to biodiversity: Eutrophication Nitrogen load in rivers • With increasing intensity of agriculture the use of nutrients also
increases, leading to leaching Nitrogen from agricultural soils. Scale River basin/sub-basin Data UNESCO-IOC; USGS; EEA; national and regional institutes Implementation UNESCO-IOC Global Nutrient Export from Watersheds project;
SCOPE studies on nitrogen in Atlantic; UNEP’s Global Environment Outlook 3;
Reference Vitousek et al. (1997); Schindler (1977); Howarth et al. (1996); Seitzinger and Kroeze (1998); Seitzinger et al. (2002); Van Breemen et al. (2002); Van Drecht et al. (2003); Maybeck and Ragu (1995); USGS (1996).
Name Threats to biodiversity: Road density Type PSR: pressure
Level: not applicable Aggregation: single
Meaning • Infrastructure is a major condition to various direct and indirect pressures on biodiversity such as land conversion, fragmentation, pollution, exploitation, disturbance etc.
• Therefore road density provides a direct quantitative measure of fragmentation and a proxy to a complex of potential pressures and related risk to biodiversity loss.
• Generally an increase in road density increases biodiversity loss. However, this especially depend on the activities which actually take place as a consequence of the road development.
Unit-dimension Road density/km2
Valuation/baseline reference year in the period 1990-2000 natural state
Description • roads and other infrastructure are mapped • impact classes are defined related to the distance to infrastructure • % area per impact class are calculated • applicable on terrestrial ecosystems and some freshwater and partly
coastal marine ecosystems Scale-resolution At all levels down to ca. 1 km2 units
Down to 1 km2 units, global databases available. Implementation UNEP used it in various reports amongst which GEO3. Reference www.globio.info, Nelleman et al. (2003); UNEP (2002) Name Response: protected areas Type PSR: response
level: ecosystem aggregation: single
Meaning status and trends in the designation of protected areas Valuation/baseline reference year in the period 1990-2000
protection category
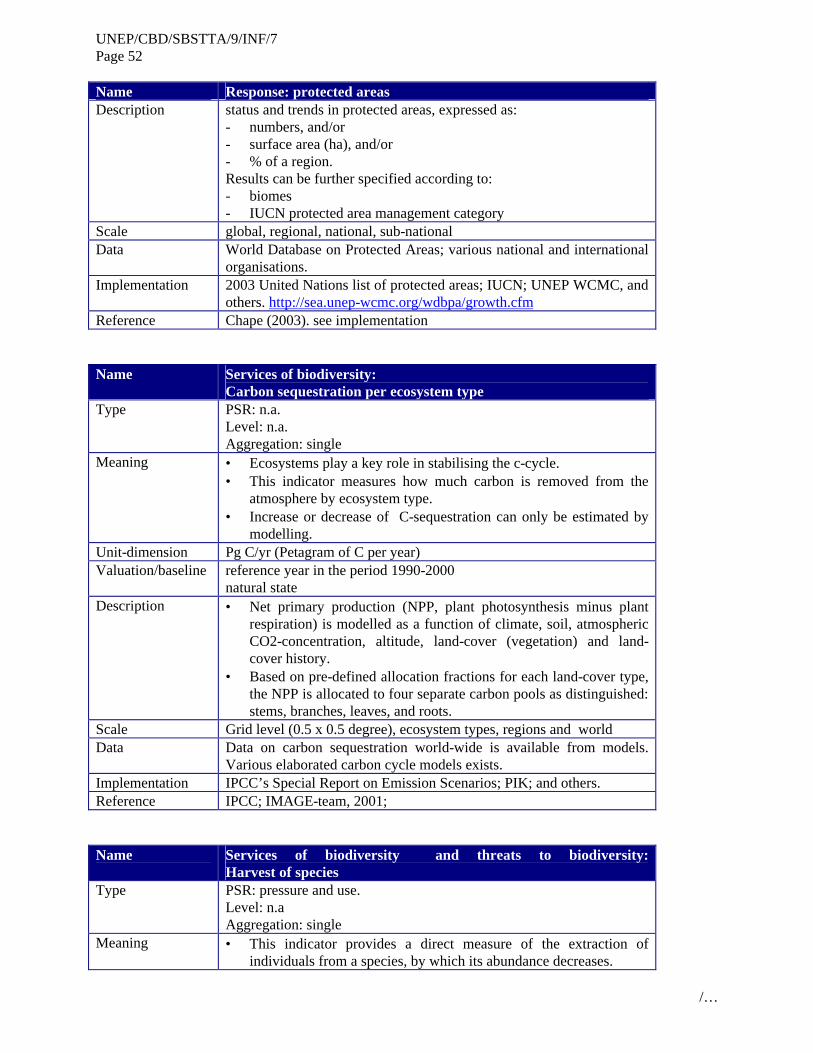
UNEP/CBD/SBSTTA/9/INF/7 Page 52
/…
Name Response: protected areas Description status and trends in protected areas, expressed as:
- numbers, and/or - surface area (ha), and/or - % of a region. Results can be further specified according to: - biomes - IUCN protected area management category
Scale global, regional, national, sub-national Data World Database on Protected Areas; various national and international
organisations. Implementation 2003 United Nations list of protected areas; IUCN; UNEP WCMC, and
others. http://sea.unep-wcmc.org/wdbpa/growth.cfm Reference Chape (2003). see implementation Name Services of biodiversity:
Carbon sequestration per ecosystem type Type PSR: n.a.
Level: n.a. Aggregation: single
Meaning • Ecosystems play a key role in stabilising the c-cycle. • This indicator measures how much carbon is removed from the
atmosphere by ecosystem type. • Increase or decrease of C-sequestration can only be estimated by
modelling. Unit-dimension Pg C/yr (Petagram of C per year) Valuation/baseline reference year in the period 1990-2000
natural state Description • Net primary production (NPP, plant photosynthesis minus plant
respiration) is modelled as a function of climate, soil, atmospheric CO2-concentration, altitude, land-cover (vegetation) and land-cover history.
• Based on pre-defined allocation fractions for each land-cover type, the NPP is allocated to four separate carbon pools as distinguished: stems, branches, leaves, and roots.
Scale Grid level (0.5 x 0.5 degree), ecosystem types, regions and world Data
Data on carbon sequestration world-wide is available from models. Various elaborated carbon cycle models exists.
Implementation IPCC’s Special Report on Emission Scenarios; PIK; and others. Reference IPCC; IMAGE-team, 2001; Name Services of biodiversity and threats to biodiversity:
Harvest of species Type PSR: pressure and use.
Level: n.a Aggregation: single
Meaning • This indicator provides a direct measure of the extraction of individuals from a species, by which its abundance decreases.
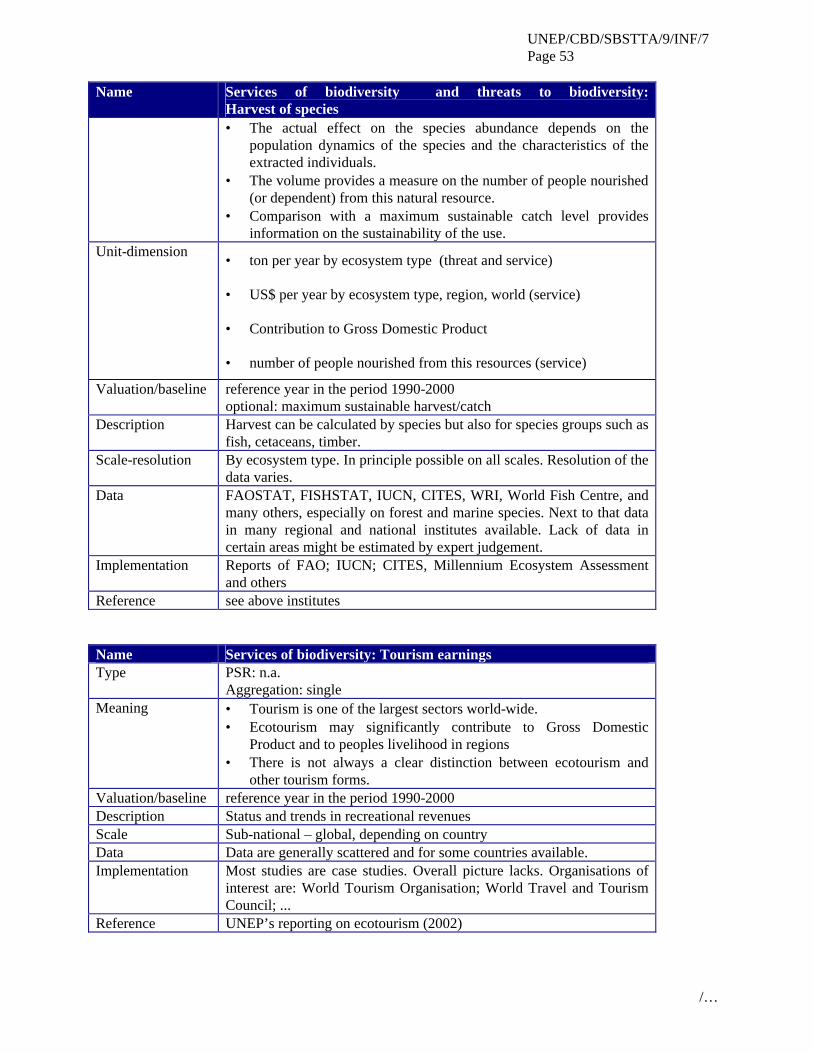
UNEP/CBD/SBSTTA/9/INF/7 Page 53
/…
Name Services of biodiversity and threats to biodiversity: Harvest of species • The actual effect on the species abundance depends on the
population dynamics of the species and the characteristics of the extracted individuals.
• The volume provides a measure on the number of people nourished (or dependent) from this natural resource.
• Comparison with a maximum sustainable catch level provides information on the sustainability of the use.
Unit-dimension • ton per year by ecosystem type (threat and service)
• US$ per year by ecosystem type, region, world (service)
• Contribution to Gross Domestic Product
• number of people nourished from this resources (service)
Valuation/baseline reference year in the period 1990-2000 optional: maximum sustainable harvest/catch
Description Harvest can be calculated by species but also for species groups such as fish, cetaceans, timber.
Scale-resolution By ecosystem type. In principle possible on all scales. Resolution of the data varies.
Data FAOSTAT, FISHSTAT, IUCN, CITES, WRI, World Fish Centre, and many others, especially on forest and marine species. Next to that data in many regional and national institutes available. Lack of data in certain areas might be estimated by expert judgement.
Implementation Reports of FAO; IUCN; CITES, Millennium Ecosystem Assessment and others
Reference see above institutes Name Services of biodiversity: Tourism earnings Type PSR: n.a.
Aggregation: single Meaning • Tourism is one of the largest sectors world-wide.
• Ecotourism may significantly contribute to Gross Domestic Product and to peoples livelihood in regions
• There is not always a clear distinction between ecotourism and other tourism forms.
Valuation/baseline reference year in the period 1990-2000 Description Status and trends in recreational revenues Scale Sub-national – global, depending on country Data Data are generally scattered and for some countries available. Implementation Most studies are case studies. Overall picture lacks. Organisations of
interest are: World Tourism Organisation; World Travel and Tourism Council; ...
Reference UNEP’s reporting on ecotourism (2002)
UNEP/CBD/SBSTTA/9/INF/7 Page 54
/…
Name Services of biodiversity: Soil stability Suspended solids in rivers
Type PSR: n.a. Level: n.a. Aggregation: single
Meaning • Biodiversity and natural vegetation cover have an important function in sustaining top-soil stability.
• Increasing load of suspended solids in rivers is related to erosion due to amongst others conversion of natural ecosystems into agriculture, deforestation and degradation of ecosystems by human activities
• To what extent agricultural systems take over this role depend on agricultural management and soil conservation management.
• Unsustainable use of agricultural ecosystems, causing uncontrolled erosion is apparent in rivers transporting increased loads of suspended solids, mainly sediments.
• Not only vegetation cover but also other factors such as climate change and dams influence sediment load. This should be integral part of the analysis.
• In river basins where dams and reservoirs have been constructed, the load of suspended solids should be determined upstream of the dam, since most sediment is deposited in reservoirs.
Unit Ton sediment km-2 total river basin; or multiple year mean sediment load in g sediment m-3 .
Valuation/baseline reference year in the period 1990-2000 Pre agricultural/natural levels
Description • Erosion can occur in several ways, including sheet erosion leading to loss of fertile topsoil, and rill and gully erosion.
• Climate is an important factor determining soil erosion. It is not the annual precipitation but its distribution which during the year, intensity of individual rainfall events and wetness/soil cover during such events which determine soil erosion risk.
• The rate of soil loss and thus river loads of suspended solids also depends on the characteristics of the soil material. Soil with high silt content (e.g., loess soils) are more susceptible to erosion than soils with low silt content. Therefore baseline values are river-basin specific.
Scale River basin Data UNESCO; USGS; EEA; national and regional institutes.
Data on natural or pre-agricultural load of suspended solids is known for a limited number of river basins .
Implementation UNESCO-IOC Global Nutrient Export from Watersheds project; Reference Ludwig and Probst (1996; 1998); Hovius (1998); Milleman and Meade
(1983); Milleman and Syvitski (1992); Meybeck and Ragu (1995). Name Services of biodiversity:
River flow characteristics/ floods and drought Type PSR: n.a.
Level: n.a.
UNEP/CBD/SBSTTA/9/INF/7 Page 55
/…
Name Services of biodiversity: River flow characteristics/ floods and drought Aggregation: single
Meaning • Living vegetation, along with other characteristics of the land surface, plays a key role in modulating the Earth water cycle and climate.
• Changing vegetation cover, deforestation, land conversion and degradation on a large scale generally affect the water holding capacity of ecosystems.
• Different vegetation patterns also produce different precipitation patterns
• Both directly affect the magnitude and timing of the run off and the intensity of frequencies of flooding and drought.
• Changes in flood and drought periods provides a measure of the intactness of water control and water precipitation functions in the river basin by natural or agricultural ecosystems.
• Increase in floods and drought periods often reflect a loss of the water holding capacity of ecosystems.
• Not only vegetation cover but also other factors such as climate change, water use (irrigation) and dams influence the river flow regime. This should be integral part of the analysis of the causal factors.
Unit number of days < or > x m3/s water Valuation/baseline reference year in the period 1990-2000
historical data series or pre agriculture or pre deforestation state Description • 5-year average of drought and flood period, exceeding long term
average of low and high water discharges • long term averages are river or tributary-specific • it concerns the major river systems.
Scale river basin or tributary Data GRDC-Koblenz; IGBP-BAHC; WL; University of New Hampshire and
others; Various regional and national institutes. Long term data available on major river systems; scattered on minor rivers.
Implementation Various reserach institutes and programmes Reference Shiklomanov (1999); Peterson and Peteke (1999); Arnell (1999);
Vorosmarty (2000); Kabat (2002)
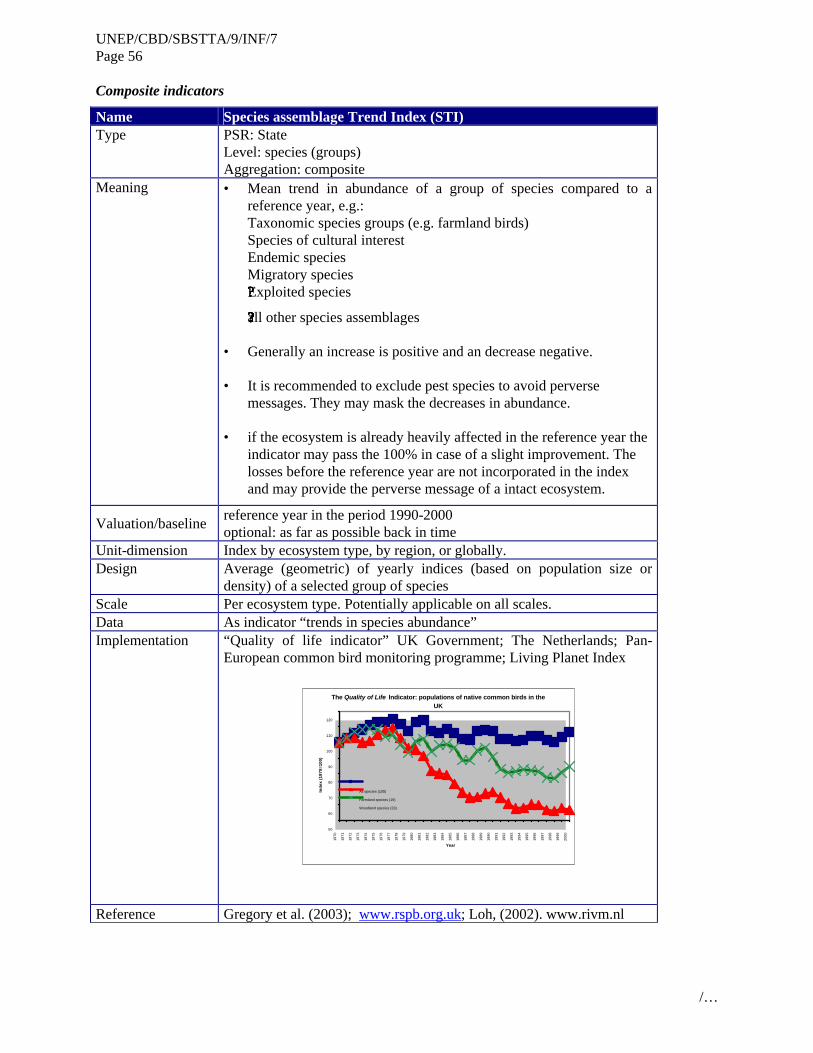
UNEP/CBD/SBSTTA/9/INF/7 Page 56
/…
Composite indicators
Name Species assemblage Trend Index (STI) Type PSR: State
Level: species (groups) Aggregation: composite
Meaning • Mean trend in abundance of a group of species compared to a reference year, e.g.: Taxonomic species groups (e.g. farmland birds) Species of cultural interest Endemic species Migratory species ?????Exploited species
?????all other species assemblages
• Generally an increase is positive and an decrease negative.
• It is recommended to exclude pest species to avoid perverse messages. They may mask the decreases in abundance.
• if the ecosystem is already heavily affected in the reference year the indicator may pass the 100% in case of a slight improvement. The losses before the reference year are not incorporated in the index and may provide the perverse message of a intact ecosystem.
Valuation/baseline reference year in the period 1990-2000 optional: as far as possible back in time
Unit-dimension Index by ecosystem type, by region, or globally. Design Average (geometric) of yearly indices (based on population size or
density) of a selected group of species Scale Per ecosystem type. Potentially applicable on all scales. Data As indicator “trends in species abundance” Implementation “Quality of life indicator” UK Government; The Netherlands; Pan-
European common bird monitoring programme; Living Planet Index
The Quality of Life Indicator: populations of native common birds in the UK
50
60
70
80
90
100
110
120
1970
1971
1972
1973
1974
1975
1976
1977
1978
1979
1980
1981
1982
1983
1984
1985
1986
1987
1988
1989
1990
1991
1992
1993
1994
1995
1996
1997
1998
1999
2000
Year
Ind
ex (
1970
=100
)
All species (105)
Farmland species (19)
Woodland species (33)
Reference Gregory et al. (2003); www.rspb.org.uk; Loh, (2002). www.rivm.nl
UNEP/CBD/SBSTTA/9/INF/7 Page 57
/…
Name Ecosystem quality mean abundance of ecosystem-specific species
Type PSR: State Level: Ecosystem Aggregation: composite
Meaning • The mean abundance of ecosystem-specific species compared to the expected abundance of the intact ecosystem.
• This indicator is a direct measure of the overall process of biodiversity loss within ecosystems as a result of all pressures (excluding area loss).
• This indicator is complementary to indicator “size of ecosystem type”.
• The indicator provides general information on the average ecosystem state, not on specific components (species, extinctions, pests, communities).
• Absence of data on the low-impact state may lead to perverse messages on ecosystem quality and the rate of biodiversity loss at the ecosystem level..
Unit-dimension mean current/baseline abundance -> index 0-100% quality by ecosystem type
Valuation/baseline reference year in the period 1990-2000 low-impact baseline: a fourth measure point as far as possible back in time
Description • Ecosystem quality is defined as the ratio between the current state and the baseline state (%)
• Ecosystem quality is calculated as the mean (arithmetic) of the yearly quality indices of the selected species. For representativeness reasons this may be a weighted mean or any other function.
• The yearly quality index (%) of a species is calculated as the current/baseline state.
• Abundance can be expressed in various terms: population numbers, density, presence/absence, biomass, number of breeding pairs, area of distribution, etc, depending on the species and data availability
• The more species are included the more robust and the better approximate for the change in abundance of all ecosystem-specific species. This multi-species indicator is similar to the “shopping bag” approach applied in the Retail Price Index.
Scale-resolution Per ecosystem type. Potentially applicable on all scales. Resolution of species trends varies per species and region.
Data See indicator “trends in species abundance” and "trends in communities". Data will be scattered over national and international institutes, but probably sufficient for most ecosystem types to provide a general picture on the general process of biodiversity loss.
Implementation Dutch National Nature Outlook 2; GEF projects in Kenya, Ecuador, Philippines and Ukraine.
Reference UNEP/CBD/SBSTTA/3/9 and UNEP/CBD/SBSTTA/3/INF/13; www.rivm.nl
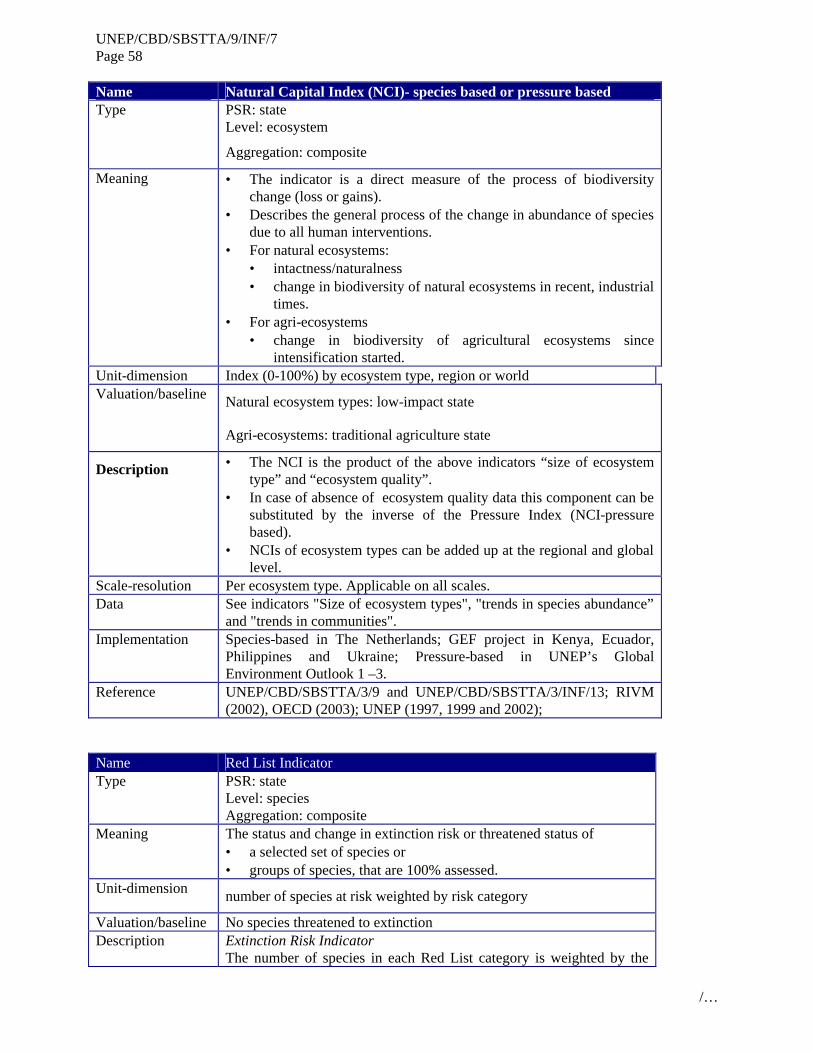
UNEP/CBD/SBSTTA/9/INF/7 Page 58
/…
Name Natural Capital Index (NCI)- species based or pressure based Type PSR: state
Level: ecosystem
Aggregation: composite
Meaning • The indicator is a direct measure of the process of biodiversity change (loss or gains).
• Describes the general process of the change in abundance of species due to all human interventions.
• For natural ecosystems: • intactness/naturalness • change in biodiversity of natural ecosystems in recent, industrial
times. • For agri-ecosystems
• change in biodiversity of agricultural ecosystems since intensification started.
Unit-dimension Index (0-100%) by ecosystem type, region or world Valuation/baseline Natural ecosystem types: low-impact state
Agri-ecosystems: traditional agriculture state
Description • The NCI is the product of the above indicators “size of ecosystem type” and “ecosystem quality”.
• In case of absence of ecosystem quality data this component can be substituted by the inverse of the Pressure Index (NCI-pressure based).
• NCIs of ecosystem types can be added up at the regional and global level.
Scale-resolution Per ecosystem type. Applicable on all scales. Data See indicators "Size of ecosystem types", "trends in species abundance”
and "trends in communities". Implementation Species-based in The Netherlands; GEF project in Kenya, Ecuador,
Philippines and Ukraine; Pressure-based in UNEP’s Global Environment Outlook 1 –3.
Reference UNEP/CBD/SBSTTA/3/9 and UNEP/CBD/SBSTTA/3/INF/13; RIVM (2002), OECD (2003); UNEP (1997, 1999 and 2002);
Name Red List Indicator Type PSR: state
Level: species Aggregation: composite
Meaning The status and change in extinction risk or threatened status of • a selected set of species or • groups of species, that are 100% assessed.
Unit-dimension number of species at risk weighted by risk category
Valuation/baseline No species threatened to extinction Description Extinction Risk Indicator
The number of species in each Red List category is weighted by the
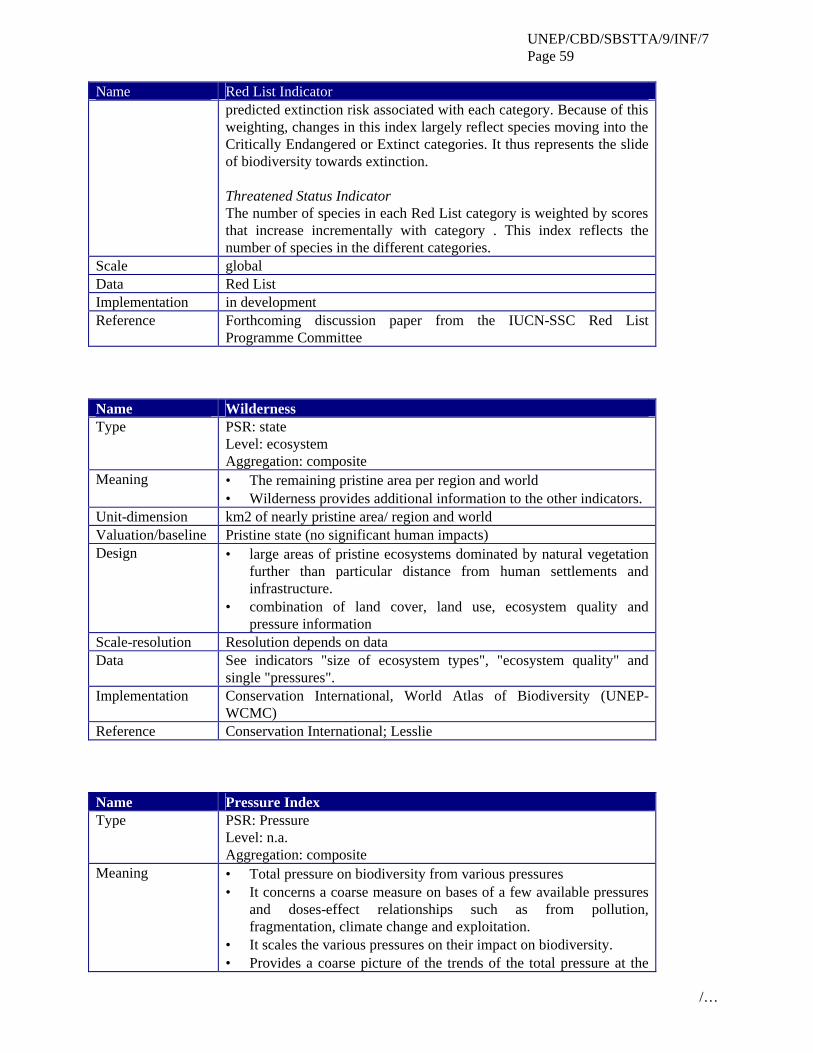
UNEP/CBD/SBSTTA/9/INF/7 Page 59
/…
Name Red List Indicator predicted extinction risk associated with each category. Because of this weighting, changes in this index largely reflect species moving into the Critically Endangered or Extinct categories. It thus represents the slide of biodiversity towards extinction. Threatened Status Indicator The number of species in each Red List category is weighted by scores that increase incrementally with category . This index reflects the number of species in the different categories.
Scale global Data Red List Implementation in development Reference Forthcoming discussion paper from the IUCN-SSC Red List
Programme Committee Name Wilderness Type PSR: state
Level: ecosystem Aggregation: composite
Meaning • The remaining pristine area per region and world • Wilderness provides additional information to the other indicators.
Unit-dimension km2 of nearly pristine area/ region and world Valuation/baseline Pristine state (no significant human impacts) Design • large areas of pristine ecosystems dominated by natural vegetation
further than particular distance from human settlements and infrastructure.
• combination of land cover, land use, ecosystem quality and pressure information
Scale-resolution Resolution depends on data Data See indicators "size of ecosystem types", "ecosystem quality" and
single "pressures". Implementation Conservation International, World Atlas of Biodiversity (UNEP-
WCMC) Reference Conservation International; Lesslie Name Pressure Index Type PSR: Pressure
Level: n.a. Aggregation: composite
Meaning • Total pressure on biodiversity from various pressures • It concerns a coarse measure on bases of a few available pressures
and doses-effect relationships such as from pollution, fragmentation, climate change and exploitation.
• It scales the various pressures on their impact on biodiversity. • Provides a coarse picture of the trends of the total pressure at the
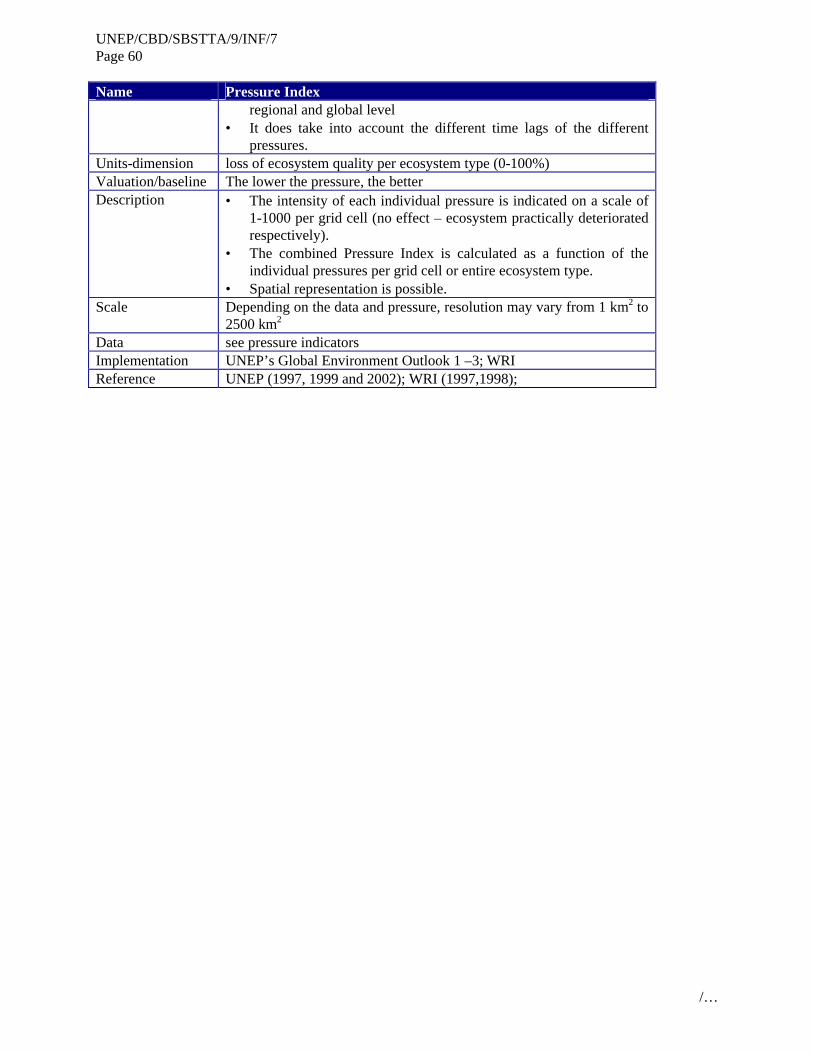
UNEP/CBD/SBSTTA/9/INF/7 Page 60
/…
Name Pressure Index regional and global level
• It does take into account the different time lags of the different pressures.
Units-dimension loss of ecosystem quality per ecosystem type (0-100%) Valuation/baseline The lower the pressure, the better Description • The intensity of each individual pressure is indicated on a scale of
1-1000 per grid cell (no effect – ecosystem practically deteriorated respectively).
• The combined Pressure Index is calculated as a function of the individual pressures per grid cell or entire ecosystem type.
• Spatial representation is possible. Scale Depending on the data and pressure, resolution may vary from 1 km2 to
2500 km2 Data see pressure indicators Implementation UNEP’s Global Environment Outlook 1 –3; WRI Reference UNEP (1997, 1999 and 2002); WRI (1997,1998);

UNEP/CBD/SBSTTA/9/INF/7 Page 61
/…
Appendix 2
LESSONS LEARNED FROM DEVELOPING INDICATORS
1. Developing indicators and monitoring is not an easy task. Before starting this process, the following lessons and general notions may be of help; they have been compiled from experiences gathered in various processes of indicator development and should therefore not be considered as universally applicable.
On questions:
2. Start at the end. What are the aims of the policy makers?
3. A suitable indicator is based on an appropriate question. If the question is not well formulated, the corresponding indicator will not provide the intended answer. Because indicators and monitoring are costly, think twice before you choose.
4. Not all questions are to be answered by indicators. Actually many questions can be answered by one-off information (e.g. statistics) or are of narrative character (see also section C of annex 2). Besides, monitoring budgets are limited, so balance cost and benefits before deciding establishing an indicator.
On indicator development:
5. Indicators are the “eyes and ears” of society, similar to a cockpit for a pilot. They are a prerequisite for adaptive and cost-effective policies.
6. The "keep it simple" principle should be applied; indicators need to be well understood by policy makers and the public.
7. A scientifically perfect indicator does not exist, a politically useful one does.
8. Indicators are not good or bad as such; the suitability of an indicator depends on the purpose it is used for.
9. Choosing indicators is the art of measuring as little as possible with the highest possible policy significance. It is not only a scientific exercise but also a matter of art.
10. Choosing indicators is a cooperative exercise between policy makers and scientists. This guarantees that indicators are policy relevant (targets, baseline choice), affordable, easy to monitor, ecosystem relevant, linkable with socio-economic scenarios (modelling response-pressures-effect relationships) and reliable.
11. Consultation with stakeholders enlists their participation and consequently increases the effectiveness of indicators as policy and management tool.
12. Biodiversity cannot be measured by a single variable or even a composite indicator. A multi-indicator approach consisting of a few complementary indicators is advisable in order to show the various aspects of biodiversity. Such an approach is also common practise in the socio-economic field. The same applies to pressures, uses and responses.
UNEP/CBD/SBSTTA/9/INF/7 Page 62
/…
13. The number of suitable indicators is limited and therefore arbitrary choices are inevitable:
(a) Biodiversity is too extensive to allow measurement of all its components. Only a smart, representative subset of indicators in a limited number of sample areas can and needs to be measured.
(b) This selection problem is similar to that for economic indicators, such as the retail price index: out of millions of products only a representative selection is monitored in a subset of stores - the so called “shopping bag” - to measure inflation.
14. Choosing indicators is not just a matter of science but also a matter of experience and of weighting different factors. The number of indicators is a balance between costs and information needs. This is not a linear relationship. Furthermore, factors other than cost and benefit might play a role, e.g. existing monitoring schemes and institutional partnerships.
15. Be pragmatic:
(a) Get started, learn by doing;
(b) Do not get stuck on concepts like indicator value, keystone species, habitat classification systems, etc. They are not goals but just a way of helping you to choose a representative set of indicators. Do not let them keep you from actually doing the work;
(c) Do not complain about the lack of data but start with the information and indicators you already have;
(d) Indicators do not have to meet all criteria;
(e) Aim at a few, simple and feasible indicators in the short term (1-5 years); if possible undergo a gradual development and improvement in the long term (15 years); Rome was not built in one day either;
(f) Aim at an accuracy that corresponds with the necessity of policy making (is money well spent?), not to write scientific articles;
(g) Be problem-oriented; focus on human-caused changes, not on natural fluctuations;
(h) Develop indicators which are flexible and can be used on different scales for multiple purposes, e.g. Useful for national use, international reporting obligations, possibly site management, sustainability assessment, etc. However, indicators for national policy making tend to be of a different character and scale than those required for site management;
(i) Although there are exceptions, common species tend to be easier and cheaper to monitor than rare species and may provide significant information;
16. Indicators can be single variable or highly aggregated composite indicators. They have different features and serve different users and goals:
(a) Single indicators provide detailed information, often useful for management questions. They may also represent the building bricks for composite indicators.
(b) Composite indicators provide general overviews often useful for policy making and communication with the public.
UNEP/CBD/SBSTTA/9/INF/7 Page 63
/…
On indicator use:
17. The number of indicators one person can simultaneously perceive is around 15.
18. To underpin sector decisions, politicians are more interested in change than in the state of an entity.
19. Indicator values are just means, not the final goal. The final goal is to implement effective sector and conservation measures.
20. To assess improvement or deterioration of the status of biodiversity, a baseline and policy objectives are needed against which current and expected future state can be compared;
21. Assessments can be made from different points of view, e.g. (i) the more species the better; (ii) the less human-affected the better; (iii) the more self-organizing the better; (iv) the more productive the better; or (v) the lower the risk of extinction the better, etc.
22. If chosen carefully, indicators give suitable direction to monitoring and research programmes.
On monitoring:
23. Strong ownership is of great importance for the continuity and quality of monitoring.
24. There is need for co-operation and collaboration across a wide range of partners (local community groups, management authorities, NGOs, research institutions, local and national Government).
25. There is a potential role for volunteer effort and citizen science in collecting useful information.
26. Monitoring intervals and locations and the corresponding levels of confidence can be determined through statistical analyses.
27. Rules of thumb can sometimes provide an alternative to complex statistical solutions.
28. To be sustainable, monitoring systems must be simple and inexpensive enough to work in the long term.
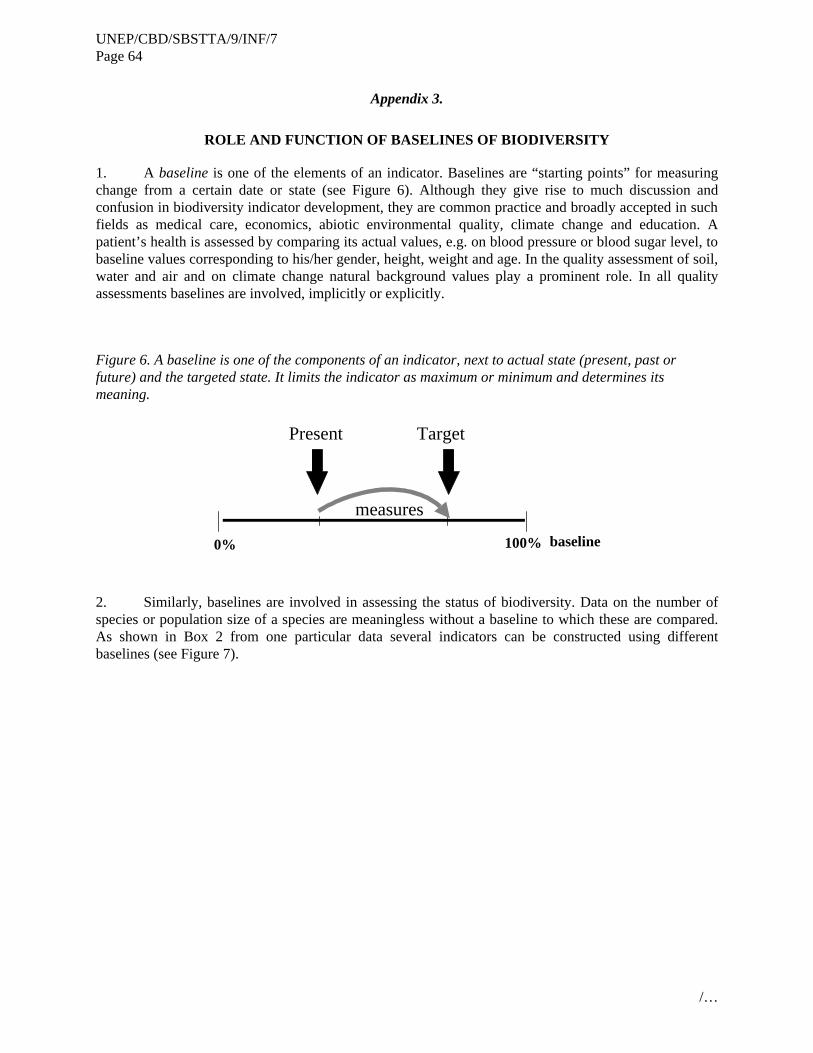
UNEP/CBD/SBSTTA/9/INF/7 Page 64
/…
Appendix 3.
ROLE AND FUNCTION OF BASELINES OF BIODIVERSITY
1. A baseline is one of the elements of an indicator. Baselines are “starting points” for measuring change from a certain date or state (see Figure 6). Although they give rise to much discussion and confusion in biodiversity indicator development, they are common practice and broadly accepted in such fields as medical care, economics, abiotic environmental quality, climate change and education. A patient’s health is assessed by comparing its actual values, e.g. on blood pressure or blood sugar level, to baseline values corresponding to his/her gender, height, weight and age. In the quality assessment of soil, water and air and on climate change natural background values play a prominent role. In all quality assessments baselines are involved, implicitly or explicitly.
Figure 6. A baseline is one of the components of an indicator, next to actual state (present, past or future) and the targeted state. It limits the indicator as maximum or minimum and determines its meaning.
measures
Present Target
baseline0% 100%
2. Similarly, baselines are involved in assessing the status of biodiversity. Data on the number of species or population size of a species are meaningless without a baseline to which these are compared. As shown in Box 2 from one particular data several indicators can be constructed using different baselines (see Figure 7).
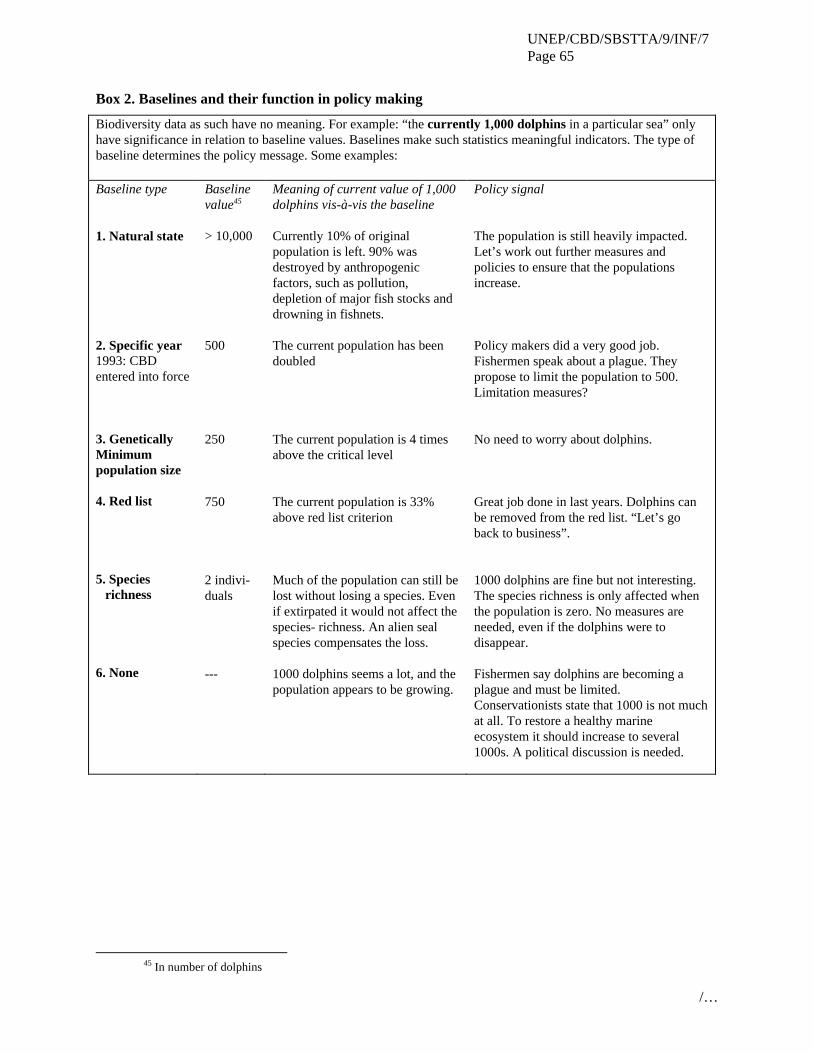
UNEP/CBD/SBSTTA/9/INF/7 Page 65
/…
Box 2. Baselines and their function in policy making
Biodiversity data as such have no meaning. For example: “the currently 1,000 dolphins in a particular sea” only have significance in relation to baseline values. Baselines make such statistics meaningful indicators. The type of baseline determines the policy message. Some examples:
Baseline type 1. Natural state 2. Specific year 1993: CBD entered into force 3. Genetically Minimum population size 4. Red list 5. Species
richness 6. None
Baseline value45 > 10,000 500 250 750 2 indivi-duals ---
Meaning of current value of 1,000 dolphins vis-à-vis the baseline Currently 10% of original population is left. 90% was destroyed by anthropogenic factors, such as pollution, depletion of major fish stocks and drowning in fishnets. The current population has been doubled The current population is 4 times above the critical level The current population is 33% above red list criterion Much of the population can still be lost without losing a species. Even if extirpated it would not affect the species- richness. An alien seal species compensates the loss. 1000 dolphins seems a lot, and the population appears to be growing.
Policy signal The population is still heavily impacted. Let’s work out further measures and policies to ensure that the populations increase. Policy makers did a very good job. Fishermen speak about a plague. They propose to limit the population to 500. Limitation measures? No need to worry about dolphins. Great job done in last years. Dolphins can be removed from the red list. “Let’s go back to business”. 1000 dolphins are fine but not interesting. The species richness is only affected when the population is zero. No measures are needed, even if the dolphins were to disappear. Fishermen say dolphins are becoming a plague and must be limited. Conservationists state that 1000 is not much at all. To restore a healthy marine ecosystem it should increase to several 1000s. A political discussion is needed.
45 In number of dolphins
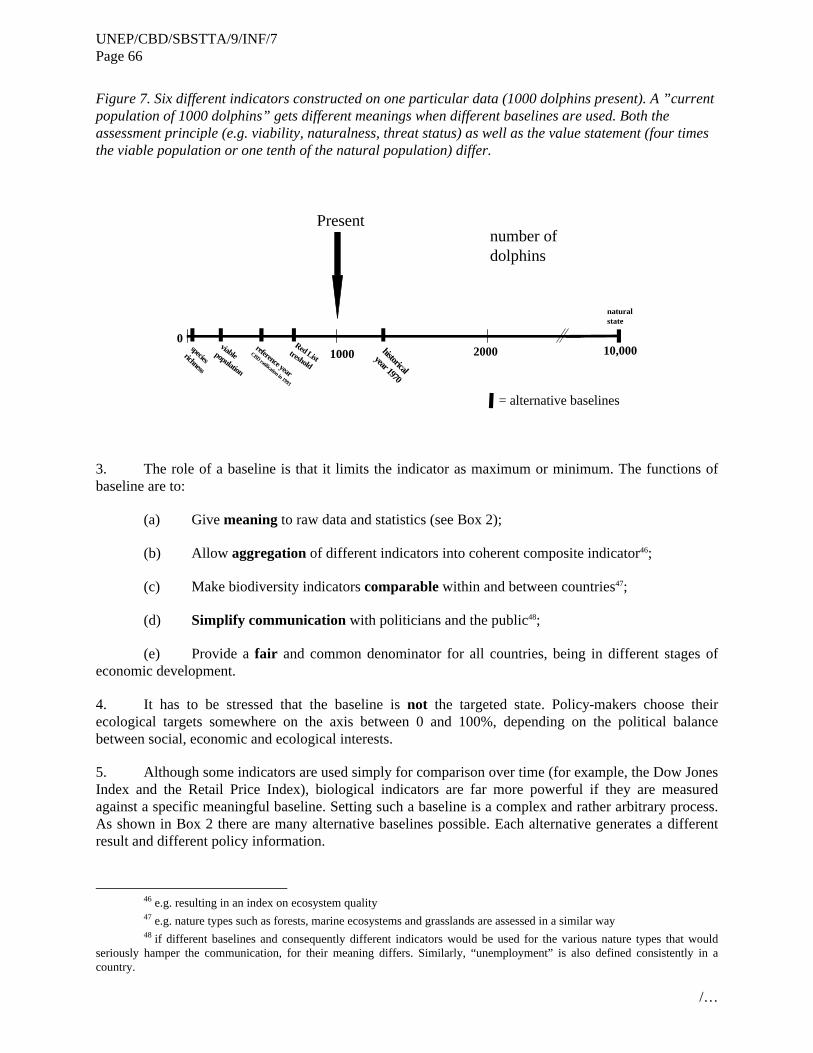
UNEP/CBD/SBSTTA/9/INF/7 Page 66
/…
Figure 7. Six different indicators constructed on one particular data (1000 dolphins present). A ”current population of 1000 dolphins” gets different meanings when different baselines are used. Both the assessment principle (e.g. viability, naturalness, threat status) as well as the value statement (four times the viable population or one tenth of the natural population) differ.
Present
010,0001000
reference year
CBD ratification in 1993
viablepopulation
Red Listtreshold
naturalstate
speciesrichness
number of dolphins
historicalyear 1970
= alternative baselines
2000
3. The role of a baseline is that it limits the indicator as maximum or minimum. The functions of baseline are to:
(a) Give meaning to raw data and statistics (see Box 2);
(b) Allow aggregation of different indicators into coherent composite indicator46;
(c) Make biodiversity indicators comparable within and between countries47;
(d) Simplify communication with politicians and the public48;
(e) Provide a fair and common denominator for all countries, being in different stages of economic development.
4. It has to be stressed that the baseline is not the targeted state. Policy-makers choose their ecological targets somewhere on the axis between 0 and 100%, depending on the political balance between social, economic and ecological interests.
5. Although some indicators are used simply for comparison over time (for example, the Dow Jones Index and the Retail Price Index), biological indicators are far more powerful if they are measured against a specific meaningful baseline. Setting such a baseline is a complex and rather arbitrary process. As shown in Box 2 there are many alternative baselines possible. Each alternative generates a different result and different policy information.
46 e.g. resulting in an index on ecosystem quality 47 e.g. nature types such as forests, marine ecosystems and grasslands are assessed in a similar way 48 if different baselines and consequently different indicators would be used for the various nature types that would
seriously hamper the communication, for their meaning differs. Similarly, “unemployment” is also defined consistently in a country.
UNEP/CBD/SBSTTA/9/INF/7 Page 67
/…
Recommendations of previous CBD expert groups
6. The 1st CBD Liaison Group on Indicators of Biological Diversity considered various baseline options including the following (UNEP/CBD/SBSTTA/3/INF.13):
(a) Baseline at the time when the CBD entered into force (1993);
(b) Baseline before any human interference;
(c) Baseline before major interference by industrial society;
(d) Threat status.
7. Measurement against the conditions at the time of the ratification of the CBD is likely to be an attractive alternative as it is mentioned in existing CBD agreements. However, only using this baseline would raise some important questions: for example how should a change since 1993 be assessed as positive or negative, without a theoretical optimal baseline (see Box 2 and Figure 8). Furthermore, assessing biodiversity only to its condition in 1993 would be perceived as a bias towards the developed countries, because these have already achieved a high level of socio-economic development partly at the expense of their original biodiversity.
8. Since there is no unambiguous natural baseline point in history, and all ecosystems are also transitory by nature, a baseline must be established at an arbitrary but practical point in time. Because it makes the most sense to show the biodiversity change when human influence was accelerating rapidly, the Liaison Group recommended “a postulated baseline, set in pre-industrial times” or a “low-impact baseline” as being the most appropriate. Similarly, it proposed to compare agricultural ecosystems with pre-industrial baseline, actually the traditional agricultural state before industrialization of agricultural practices started.
9. Further the 1st Liaison Group proposed to use 1993 as an intermediate baseline in perspective of the low-impact baseline, in order to show whether the Convention is effective.
10. Next to the above baselines the 1st Liaison Group proposed to use the threat status according to the IUCN Red List categories as baseline.
11. According to the 2nd Liaison Group a 1993 baseline would provide a large amount of easily accessible and compatible data. However, it agreed with the 1st Liaison Group that interpretations of changes since 1993 would be difficult without an optimum baseline. On the other hand a pre-industrial baseline would give important information on biodiversity changes caused by major human impact, but would be limited by data availability.
12. While a pre-industrial baseline would be desirable to establish long-term trends and to enable national, regional and global overviews, the lack of data would impose more recent baselines. Therefore the 2nd Liaison Group proposed a pragmatic, flexible, but transparent, approach in the short and medium term: Parties should establish a baseline as far back in time as data availability allows for in their national reports. The lack of data should not prevent countries from initiating their national indicator programmes with a more recent baseline. On the longer term the 2nd Liaison Group recommended a process of harmonizing baselines towards a common and fair denominator for all countries irrespectively of their stage of socio-economic development.

UNEP/CBD/SBSTTA/9/INF/7 Page 68
/…
13. The expert group, which drafted the current document, considers the establishment of consistent baselines as crucial for any reporting on the progress of implementing NBSAPs and Convention objectives. In agreement with the 2nd liaison group a pragmatic approach is proposed, as stated in the first indicator list.
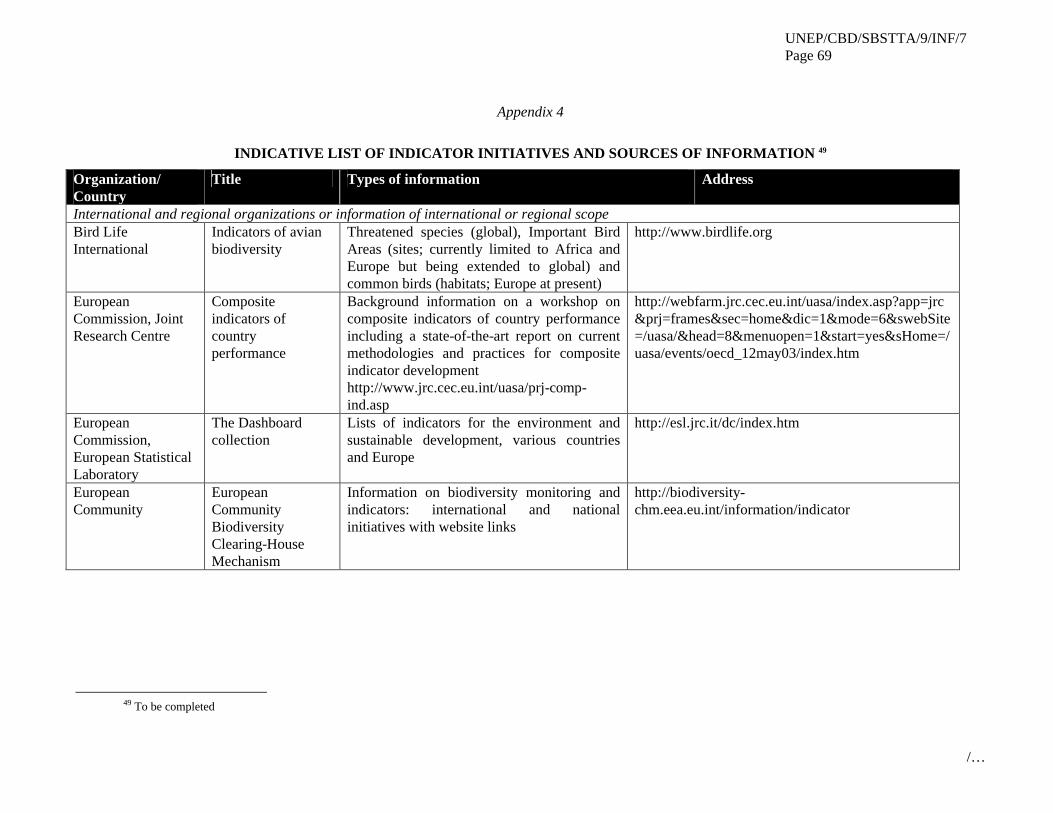
UNEP/CBD/SBSTTA/9/INF/7 Page 69
/…
Appendix 4
INDICATIVE LIST OF INDICATOR INITIATIVES AND SOURCES OF INFORMATION 49
Organization/ Country
Title Types of information Address
International and regional organizations or information of international or regional scope Bird Life International
Indicators of avian biodiversity
Threatened species (global), Important Bird Areas (sites; currently limited to Africa and Europe but being extended to global) and common birds (habitats; Europe at present)
http://www.birdlife.org
European Commission, Joint Research Centre
Composite indicators of country performance
Background information on a workshop on composite indicators of country performance including a state-of-the-art report on current methodologies and practices for composite indicator development http://www.jrc.cec.eu.int/uasa/prj-comp-ind.asp
http://webfarm.jrc.cec.eu.int/uasa/index.asp?app=jrc&prj=frames&sec=home&dic=1&mode=6&swebSite=/uasa/&head=8&menuopen=1&start=yes&sHome=/uasa/events/oecd_12may03/index.htm
European Commission, European Statistical Laboratory
The Dashboard collection
Lists of indicators for the environment and sustainable development, various countries and Europe
http://esl.jrc.it/dc/index.htm
European Community
European Community Biodiversity Clearing-House Mechanism
Information on biodiversity monitoring and indicators: international and national initiatives with website links
http://biodiversity-chm.eea.eu.int/information/indicator
49 To be completed
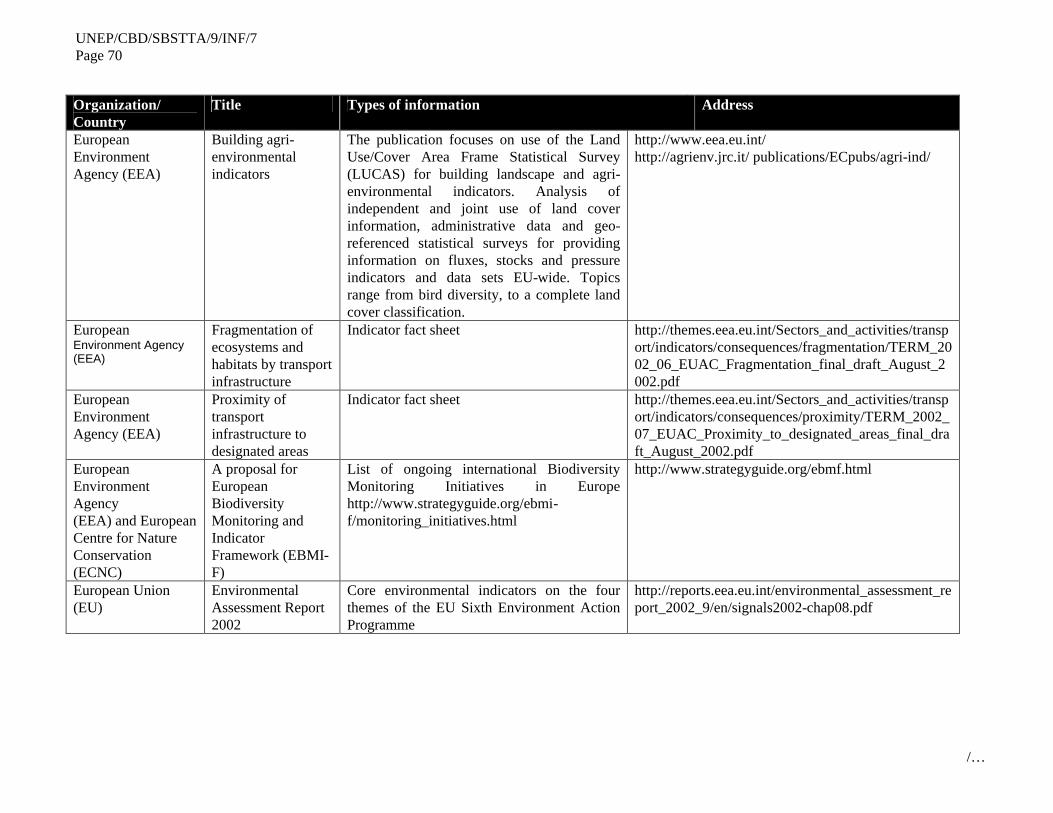
UNEP/CBD/SBSTTA/9/INF/7 Page 70
/…
Organization/ Country
Title Types of information Address
European Environment Agency (EEA)
Building agri-environmental indicators
The publication focuses on use of the Land Use/Cover Area Frame Statistical Survey (LUCAS) for building landscape and agri-environmental indicators. Analysis of independent and joint use of land cover information, administrative data and geo-referenced statistical surveys for providing information on fluxes, stocks and pressure indicators and data sets EU-wide. Topics range from bird diversity, to a complete land cover classification.
http://www.eea.eu.int/ http://agrienv.jrc.it/ publications/ECpubs/agri-ind/
European Environment Agency (EEA)
Fragmentation of ecosystems and habitats by transport infrastructure
Indicator fact sheet http://themes.eea.eu.int/Sectors_and_activities/transport/indicators/consequences/fragmentation/TERM_2002_06_EUAC_Fragmentation_final_draft_August_2002.pdf
European Environment Agency (EEA)
Proximity of transport infrastructure to designated areas
Indicator fact sheet http://themes.eea.eu.int/Sectors_and_activities/transport/indicators/consequences/proximity/TERM_2002_07_EUAC_Proximity_to_designated_areas_final_draft_August_2002.pdf
European Environment Agency (EEA) and European Centre for Nature Conservation (ECNC)
A proposal for European Biodiversity Monitoring and Indicator Framework (EBMI-F)
List of ongoing international Biodiversity Monitoring Initiatives in Europe http://www.strategyguide.org/ebmi-f/monitoring_initiatives.html
http://www.strategyguide.org/ebmf.html
European Union (EU)
Environmental Assessment Report 2002
Core environmental indicators on the four themes of the EU Sixth Environment Action Programme
http://reports.eea.eu.int/environmental_assessment_report_2002_9/en/signals2002-chap08.pdf
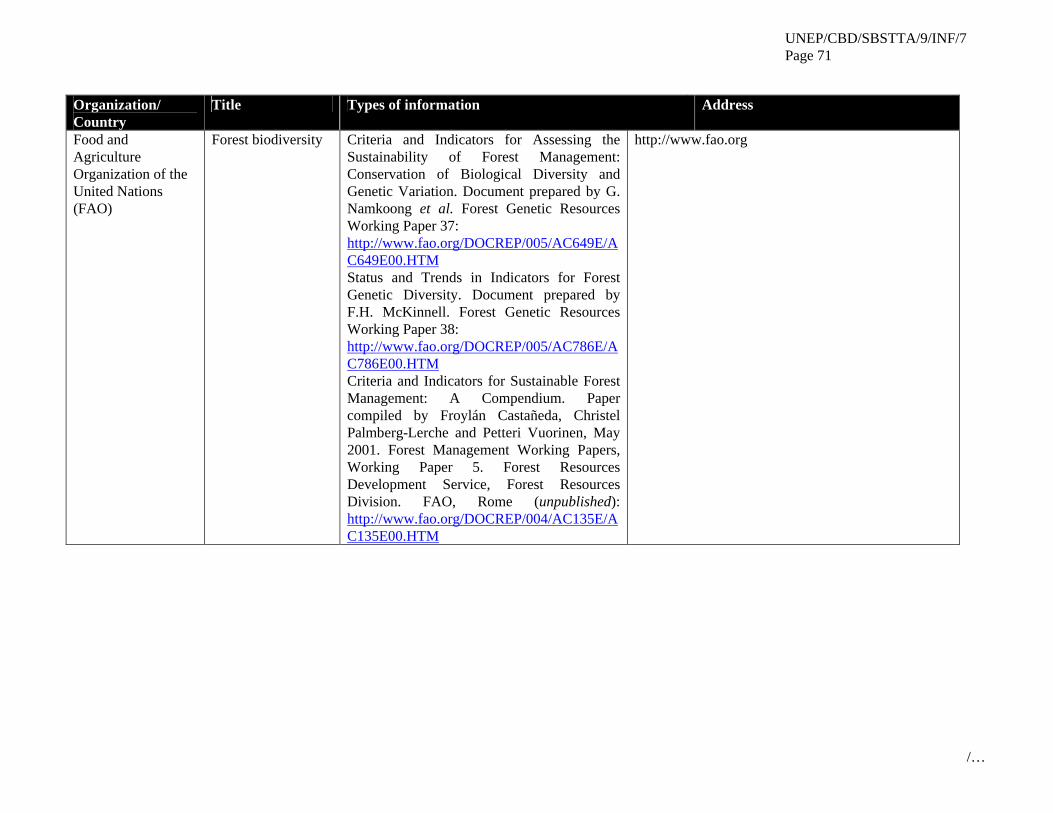
UNEP/CBD/SBSTTA/9/INF/7 Page 71
/…
Organization/ Country
Title Types of information Address
Food and Agriculture Organization of the United Nations (FAO)
Forest biodiversity Criteria and Indicators for Assessing the Sustainability of Forest Management: Conservation of Biological Diversity and Genetic Variation. Document prepared by G. Namkoong et al. Forest Genetic Resources Working Paper 37: http://www.fao.org/DOCREP/005/AC649E/AC649E00.HTM Status and Trends in Indicators for Forest Genetic Diversity. Document prepared by F.H. McKinnell. Forest Genetic Resources Working Paper 38: http://www.fao.org/DOCREP/005/AC786E/AC786E00.HTM Criteria and Indicators for Sustainable Forest Management: A Compendium. Paper compiled by Froylán Castañeda, Christel Palmberg-Lerche and Petteri Vuorinen, May 2001. Forest Management Working Papers, Working Paper 5. Forest Resources Development Service, Forest Resources Division. FAO, Rome (unpublished): http://www.fao.org/DOCREP/004/AC135E/AC135E00.HTM
http://www.fao.org
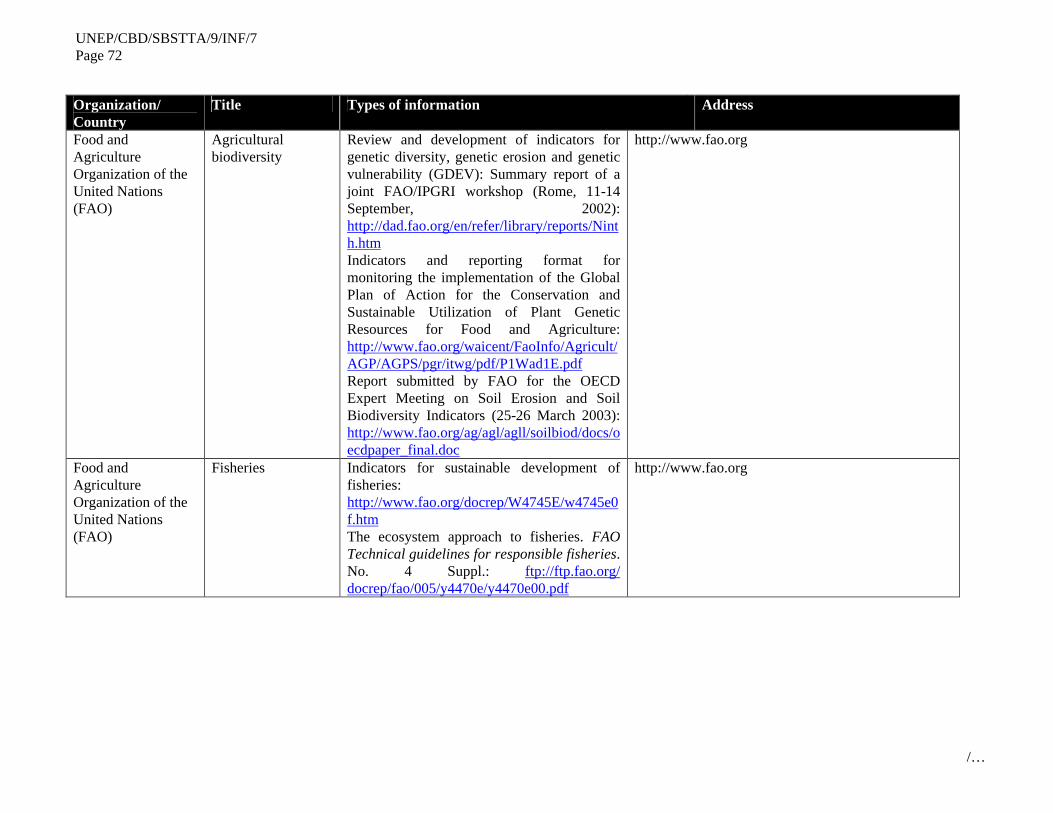
UNEP/CBD/SBSTTA/9/INF/7 Page 72
/…
Organization/ Country
Title Types of information Address
Food and Agriculture Organization of the United Nations (FAO)
Agricultural biodiversity
Review and development of indicators for genetic diversity, genetic erosion and genetic vulnerability (GDEV): Summary report of a joint FAO/IPGRI workshop (Rome, 11-14 September, 2002): http://dad.fao.org/en/refer/library/reports/Ninth.htm Indicators and reporting format for monitoring the implementation of the Global Plan of Action for the Conservation and Sustainable Utilization of Plant Genetic Resources for Food and Agriculture: http://www.fao.org/waicent/FaoInfo/Agricult/AGP/AGPS/pgr/itwg/pdf/P1Wad1E.pdf Report submitted by FAO for the OECD Expert Meeting on Soil Erosion and Soil Biodiversity Indicators (25-26 March 2003): http://www.fao.org/ag/agl/agll/soilbiod/docs/oecdpaper_final.doc
http://www.fao.org
Food and Agriculture Organization of the United Nations (FAO)
Fisheries Indicators for sustainable development of fisheries: http://www.fao.org/docrep/W4745E/w4745e0f.htm The ecosystem approach to fisheries. FAO Technical guidelines for responsible fisheries. No. 4 Suppl.: ftp://ftp.fao.org/ docrep/fao/005/y4470e/y4470e00.pdf
http://www.fao.org
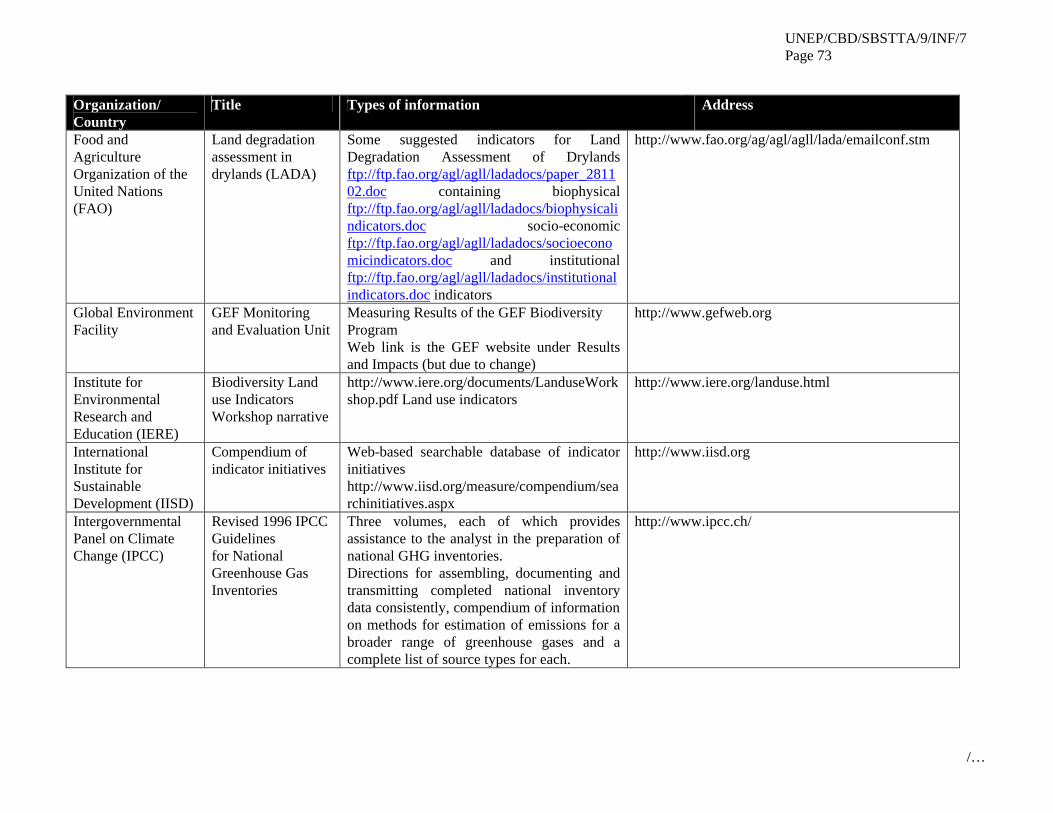
UNEP/CBD/SBSTTA/9/INF/7 Page 73
/…
Organization/ Country
Title Types of information Address
Food and Agriculture Organization of the United Nations (FAO)
Land degradation assessment in drylands (LADA)
Some suggested indicators for Land Degradation Assessment of Drylands ftp://ftp.fao.org/agl/agll/ladadocs/paper_281102.doc containing biophysical ftp://ftp.fao.org/agl/agll/ladadocs/biophysicalindicators.doc socio-economic ftp://ftp.fao.org/agl/agll/ladadocs/socioeconomicindicators.doc and institutional ftp://ftp.fao.org/agl/agll/ladadocs/institutionalindicators.doc indicators
http://www.fao.org/ag/agl/agll/lada/emailconf.stm
Global Environment Facility
GEF Monitoring and Evaluation Unit
Measuring Results of the GEF Biodiversity Program Web link is the GEF website under Results and Impacts (but due to change)
http://www.gefweb.org
Institute for Environmental Research and Education (IERE)
Biodiversity Land use Indicators Workshop narrative
http://www.iere.org/documents/LanduseWorkshop.pdf Land use indicators
http://www.iere.org/landuse.html
International Institute for Sustainable Development (IISD)
Compendium of indicator initiatives
Web-based searchable database of indicator initiatives http://www.iisd.org/measure/compendium/searchinitiatives.aspx
http://www.iisd.org
Intergovernmental Panel on Climate Change (IPCC)
Revised 1996 IPCC Guidelines for National Greenhouse Gas Inventories
Three volumes, each of which provides assistance to the analyst in the preparation of national GHG inventories. Directions for assembling, documenting and transmitting completed national inventory data consistently, compendium of information on methods for estimation of emissions for a broader range of greenhouse gases and a complete list of source types for each.
http://www.ipcc.ch/
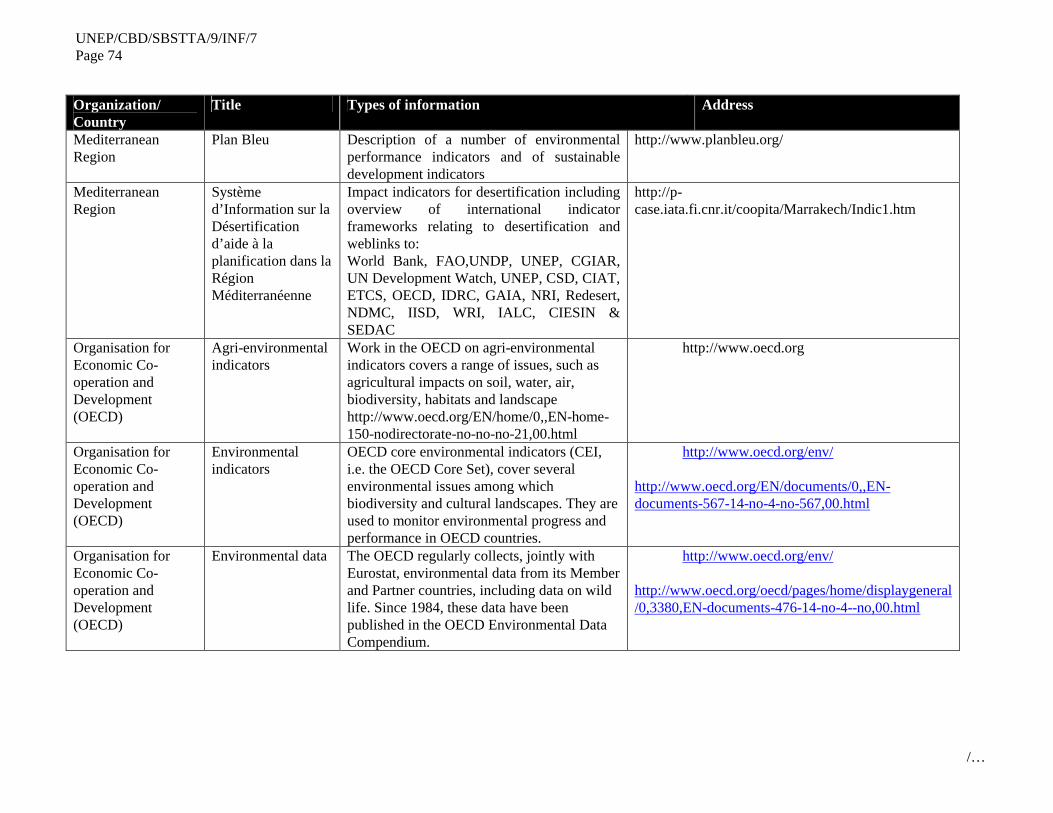
UNEP/CBD/SBSTTA/9/INF/7 Page 74
/…
Organization/ Country
Title Types of information Address
Mediterranean Region
Plan Bleu Description of a number of environmental performance indicators and of sustainable development indicators
http://www.planbleu.org/
Mediterranean Region
Système d’Information sur la Désertification d’aide à la planification dans la Région Méditerranéenne
Impact indicators for desertification including overview of international indicator frameworks relating to desertification and weblinks to: World Bank, FAO,UNDP, UNEP, CGIAR, UN Development Watch, UNEP, CSD, CIAT, ETCS, OECD, IDRC, GAIA, NRI, Redesert, NDMC, IISD, WRI, IALC, CIESIN & SEDAC
http://p-case.iata.fi.cnr.it/coopita/Marrakech/Indic1.htm
Organisation for Economic Co-operation and Development (OECD)
Agri-environmental indicators
Work in the OECD on agri-environmental indicators covers a range of issues, such as agricultural impacts on soil, water, air, biodiversity, habitats and landscape http://www.oecd.org/EN/home/0,,EN-home-150-nodirectorate-no-no-no-21,00.html
http://www.oecd.org
Organisation for Economic Co-operation and Development (OECD)
Environmental indicators
OECD core environmental indicators (CEI, i.e. the OECD Core Set), cover several environmental issues among which biodiversity and cultural landscapes. They are used to monitor environmental progress and performance in OECD countries.
http://www.oecd.org/env/ http://www.oecd.org/EN/documents/0,,EN-documents-567-14-no-4-no-567,00.html
Organisation for Economic Co-operation and Development (OECD)
Environmental data The OECD regularly collects, jointly with Eurostat, environmental data from its Member and Partner countries, including data on wild life. Since 1984, these data have been published in the OECD Environmental Data Compendium.
http://www.oecd.org/env/ http://www.oecd.org/oecd/pages/home/displaygeneral/0,3380,EN-documents-476-14-no-4--no,00.html
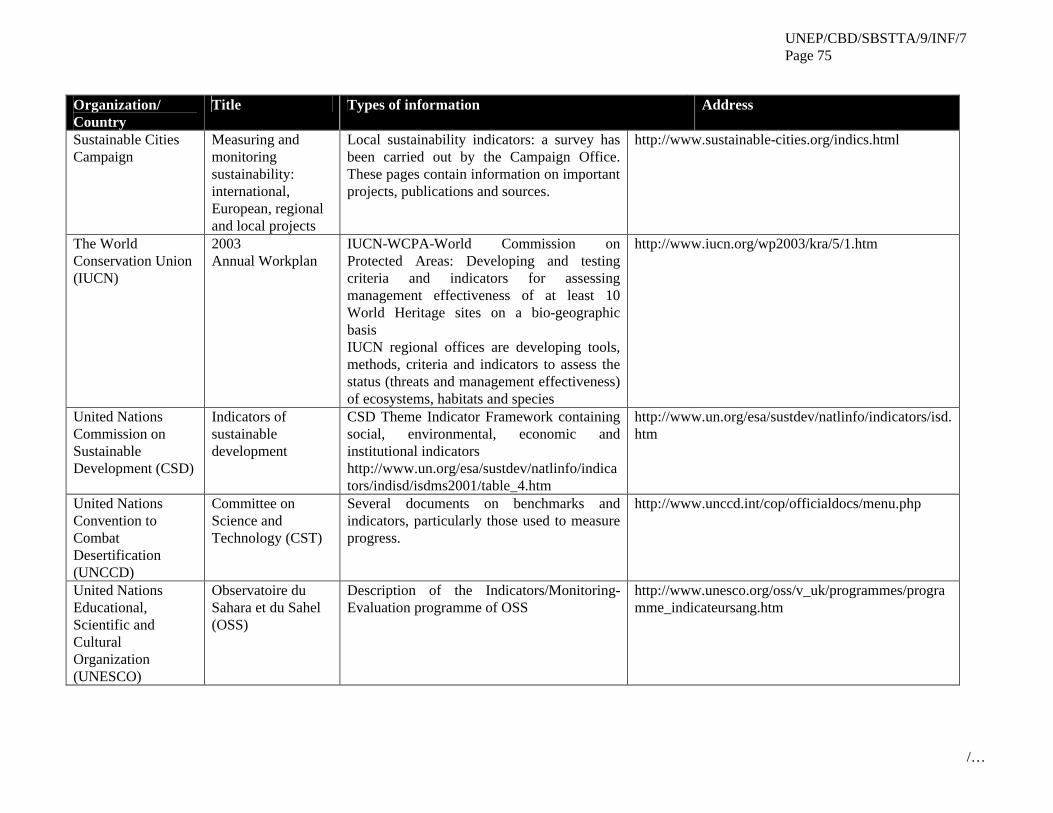
UNEP/CBD/SBSTTA/9/INF/7 Page 75
/…
Organization/ Country
Title Types of information Address
Sustainable Cities Campaign
Measuring and monitoring sustainability: international, European, regional and local projects
Local sustainability indicators: a survey has been carried out by the Campaign Office. These pages contain information on important projects, publications and sources.
http://www.sustainable-cities.org/indics.html
The World Conservation Union (IUCN)
2003 Annual Workplan
IUCN-WCPA-World Commission on Protected Areas: Developing and testing criteria and indicators for assessing management effectiveness of at least 10 World Heritage sites on a bio-geographic basis IUCN regional offices are developing tools, methods, criteria and indicators to assess the status (threats and management effectiveness) of ecosystems, habitats and species
http://www.iucn.org/wp2003/kra/5/1.htm
United Nations Commission on Sustainable Development (CSD)
Indicators of sustainable development
CSD Theme Indicator Framework containing social, environmental, economic and institutional indicators http://www.un.org/esa/sustdev/natlinfo/indicators/indisd/isdms2001/table_4.htm
http://www.un.org/esa/sustdev/natlinfo/indicators/isd.htm
United Nations Convention to Combat Desertification (UNCCD)
Committee on Science and Technology (CST)
Several documents on benchmarks and indicators, particularly those used to measure progress.
http://www.unccd.int/cop/officialdocs/menu.php
United Nations Educational, Scientific and Cultural Organization (UNESCO)
Observatoire du Sahara et du Sahel (OSS)
Description of the Indicators/Monitoring-Evaluation programme of OSS
http://www.unesco.org/oss/v_uk/programmes/programme_indicateursang.htm
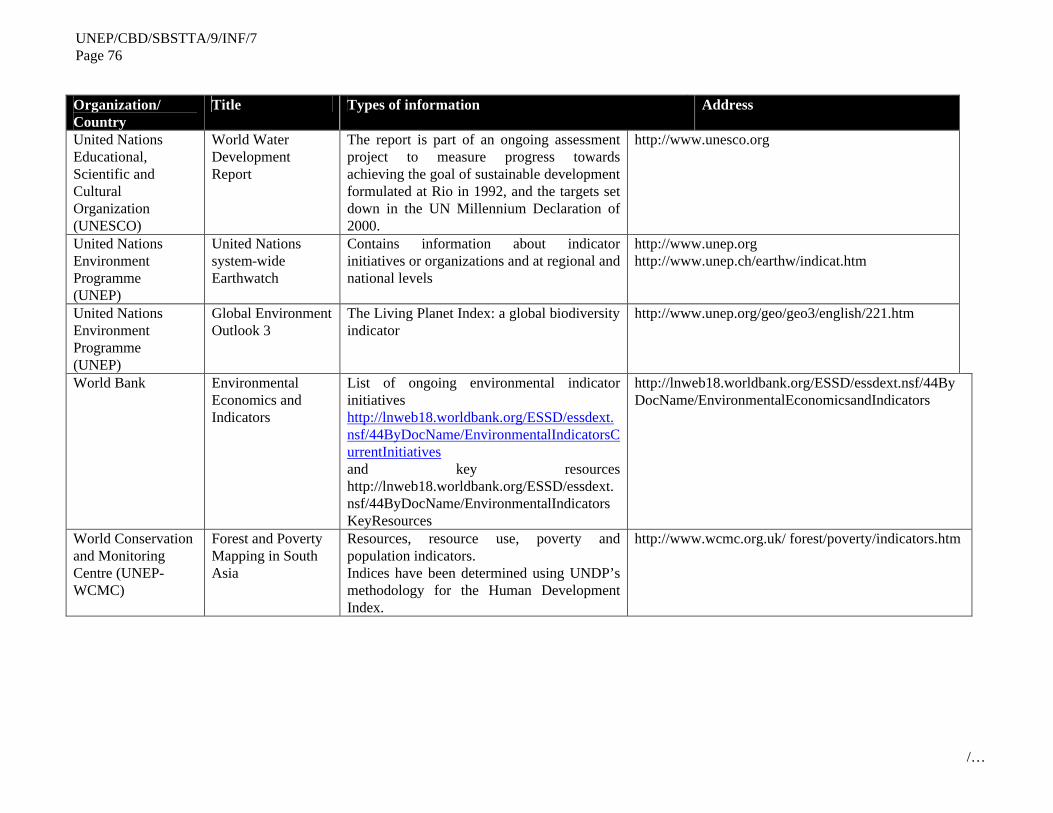
UNEP/CBD/SBSTTA/9/INF/7 Page 76
/…
Organization/ Country
Title Types of information Address
United Nations Educational, Scientific and Cultural Organization (UNESCO)
World Water Development Report
The report is part of an ongoing assessment project to measure progress towards achieving the goal of sustainable development formulated at Rio in 1992, and the targets set down in the UN Millennium Declaration of 2000.
http://www.unesco.org
United Nations Environment Programme (UNEP)
United Nations system-wide Earthwatch
Contains information about indicator initiatives or organizations and at regional and national levels
http://www.unep.org http://www.unep.ch/earthw/indicat.htm
United Nations Environment Programme (UNEP)
Global Environment Outlook 3
The Living Planet Index: a global biodiversity indicator
http://www.unep.org/geo/geo3/english/221.htm
World Bank Environmental Economics and Indicators
List of ongoing environmental indicator initiatives http://lnweb18.worldbank.org/ESSD/essdext.nsf/44ByDocName/EnvironmentalIndicatorsCurrentInitiatives and key resources http://lnweb18.worldbank.org/ESSD/essdext.nsf/44ByDocName/EnvironmentalIndicatorsKeyResources
http://lnweb18.worldbank.org/ESSD/essdext.nsf/44ByDocName/EnvironmentalEconomicsandIndicators
World Conservation and Monitoring Centre (UNEP-WCMC)
Forest and Poverty Mapping in South Asia
Resources, resource use, poverty and population indicators. Indices have been determined using UNDP’s methodology for the Human Development Index.
http://www.wcmc.org.uk/ forest/poverty/indicators.htm
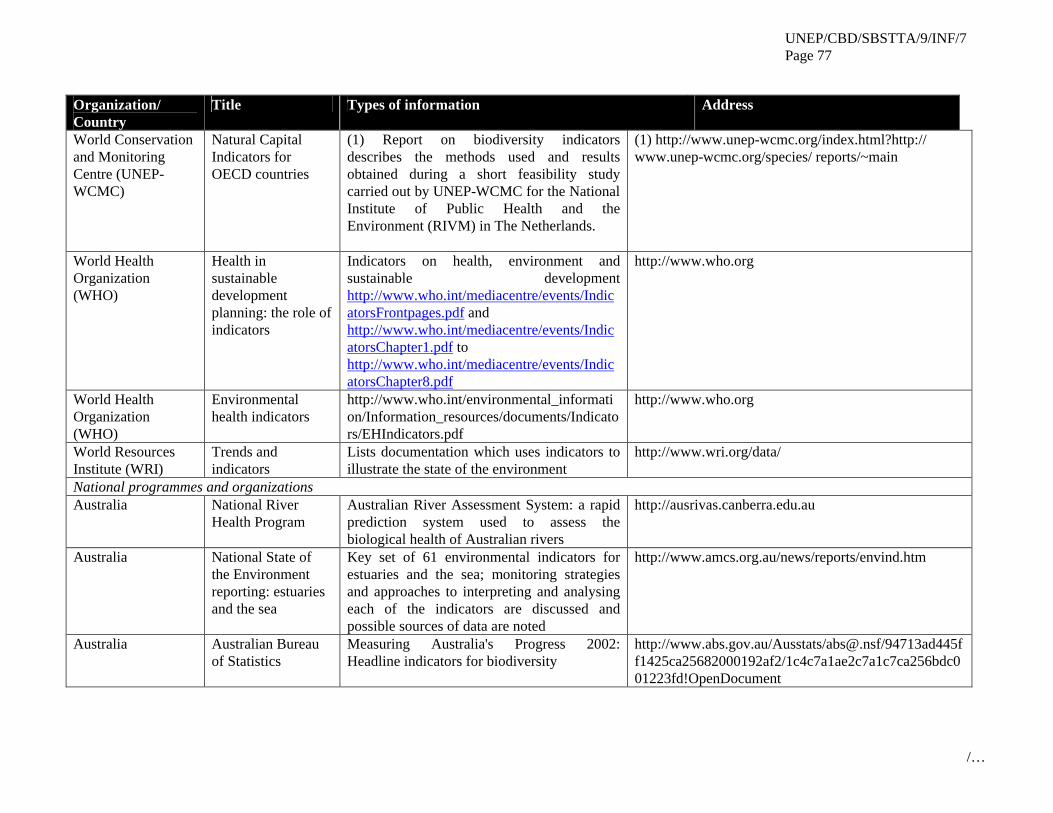
UNEP/CBD/SBSTTA/9/INF/7 Page 77
/…
Organization/ Country
Title Types of information Address
World Conservation and Monitoring Centre (UNEP-WCMC)
Natural Capital Indicators for OECD countries
(1) Report on biodiversity indicators describes the methods used and results obtained during a short feasibility study carried out by UNEP-WCMC for the National Institute of Public Health and the Environment (RIVM) in The Netherlands.
(1) http://www.unep-wcmc.org/index.html?http:// www.unep-wcmc.org/species/ reports/~main
World Health Organization (WHO)
Health in sustainable development planning: the role of indicators
Indicators on health, environment and sustainable development http://www.who.int/mediacentre/events/IndicatorsFrontpages.pdf and http://www.who.int/mediacentre/events/IndicatorsChapter1.pdf to http://www.who.int/mediacentre/events/IndicatorsChapter8.pdf
http://www.who.org
World Health Organization (WHO)
Environmental health indicators
http://www.who.int/environmental_information/Information_resources/documents/Indicators/EHIndicators.pdf
http://www.who.org
World Resources Institute (WRI)
Trends and indicators
Lists documentation which uses indicators to illustrate the state of the environment
http://www.wri.org/data/
National programmes and organizations Australia National River
Health Program Australian River Assessment System: a rapid prediction system used to assess the biological health of Australian rivers
http://ausrivas.canberra.edu.au
Australia National State of the Environment reporting: estuaries and the sea
Key set of 61 environmental indicators for estuaries and the sea; monitoring strategies and approaches to interpreting and analysing each of the indicators are discussed and possible sources of data are noted
http://www.amcs.org.au/news/reports/envind.htm
Australia Australian Bureau of Statistics
Measuring Australia's Progress 2002: Headline indicators for biodiversity
http://www.abs.gov.au/Ausstats/[email protected]/94713ad445ff1425ca25682000192af2/1c4c7a1ae2c7a1c7ca256bdc001223fd!OpenDocument
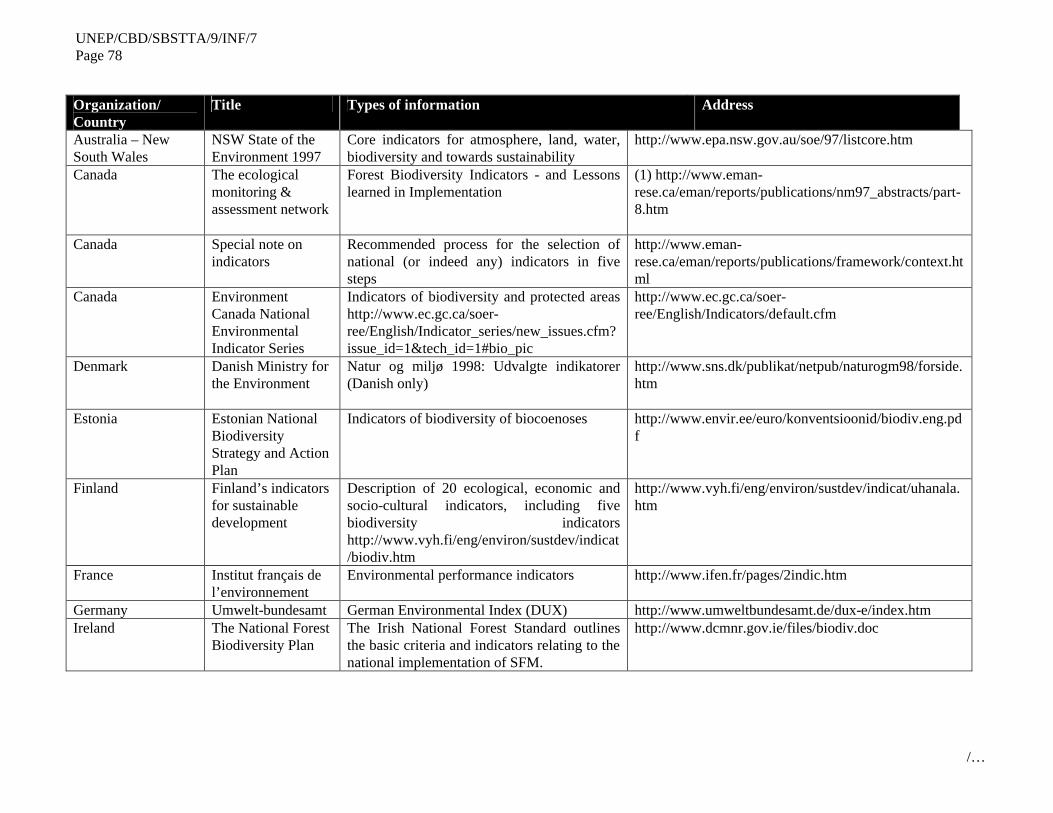
UNEP/CBD/SBSTTA/9/INF/7 Page 78
/…
Organization/ Country
Title Types of information Address
Australia – New South Wales
NSW State of the Environment 1997
Core indicators for atmosphere, land, water, biodiversity and towards sustainability
http://www.epa.nsw.gov.au/soe/97/listcore.htm
Canada The ecological monitoring & assessment network
Forest Biodiversity Indicators - and Lessons learned in Implementation
(1) http://www.eman-rese.ca/eman/reports/publications/nm97_abstracts/part-8.htm
Canada Special note on indicators
Recommended process for the selection of national (or indeed any) indicators in five steps
http://www.eman-rese.ca/eman/reports/publications/framework/context.html
Canada Environment Canada National Environmental Indicator Series
Indicators of biodiversity and protected areas http://www.ec.gc.ca/soer-ree/English/Indicator_series/new_issues.cfm?issue_id=1&tech_id=1#bio_pic
http://www.ec.gc.ca/soer-ree/English/Indicators/default.cfm
Denmark Danish Ministry for the Environment
Natur og miljø 1998: Udvalgte indikatorer (Danish only)
http://www.sns.dk/publikat/netpub/naturogm98/forside.htm
Estonia Estonian National Biodiversity Strategy and Action Plan
Indicators of biodiversity of biocoenoses http://www.envir.ee/euro/konventsioonid/biodiv.eng.pdf
Finland Finland’s indicators for sustainable development
Description of 20 ecological, economic and socio-cultural indicators, including five biodiversity indicators http://www.vyh.fi/eng/environ/sustdev/indicat/biodiv.htm
http://www.vyh.fi/eng/environ/sustdev/indicat/uhanala.htm
France Institut français de l’environnement
Environmental performance indicators http://www.ifen.fr/pages/2indic.htm
Germany Umwelt-bundesamt German Environmental Index (DUX) http://www.umweltbundesamt.de/dux-e/index.htm Ireland The National Forest
Biodiversity Plan The Irish National Forest Standard outlines the basic criteria and indicators relating to the national implementation of SFM.
http://www.dcmnr.gov.ie/files/biodiv.doc
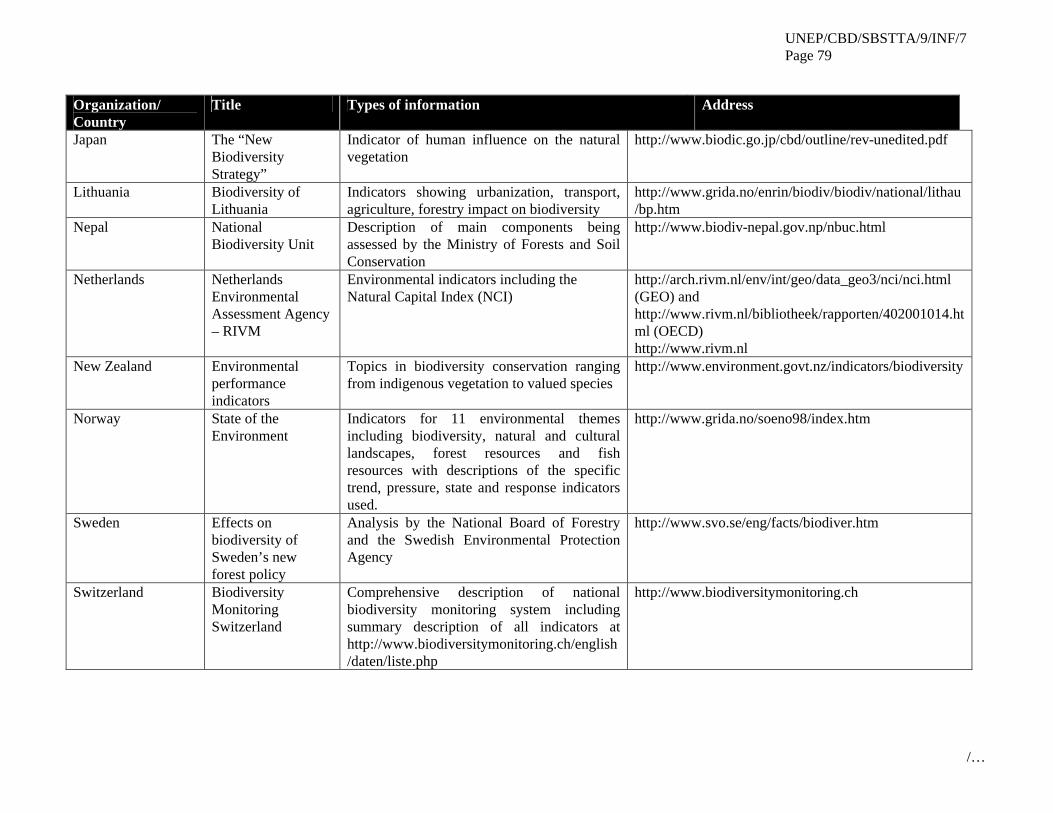
UNEP/CBD/SBSTTA/9/INF/7 Page 79
/…
Organization/ Country
Title Types of information Address
Japan The “New Biodiversity Strategy”
Indicator of human influence on the natural vegetation
http://www.biodic.go.jp/cbd/outline/rev-unedited.pdf
Lithuania Biodiversity of Lithuania
Indicators showing urbanization, transport, agriculture, forestry impact on biodiversity
http://www.grida.no/enrin/biodiv/biodiv/national/lithau/bp.htm
Nepal National Biodiversity Unit
Description of main components being assessed by the Ministry of Forests and Soil Conservation
http://www.biodiv-nepal.gov.np/nbuc.html
Netherlands Netherlands Environmental Assessment Agency – RIVM
Environmental indicators including the Natural Capital Index (NCI)
http://arch.rivm.nl/env/int/geo/data_geo3/nci/nci.html (GEO) and http://www.rivm.nl/bibliotheek/rapporten/402001014.html (OECD) http://www.rivm.nl
New Zealand Environmental performance indicators
Topics in biodiversity conservation ranging from indigenous vegetation to valued species
http://www.environment.govt.nz/indicators/biodiversity
Norway State of the Environment
Indicators for 11 environmental themes including biodiversity, natural and cultural landscapes, forest resources and fish resources with descriptions of the specific trend, pressure, state and response indicators used.
http://www.grida.no/soeno98/index.htm
Sweden Effects on biodiversity of Sweden’s new forest policy
Analysis by the National Board of Forestry and the Swedish Environmental Protection Agency
http://www.svo.se/eng/facts/biodiver.htm
Switzerland Biodiversity Monitoring Switzerland
Comprehensive description of national biodiversity monitoring system including summary description of all indicators at http://www.biodiversitymonitoring.ch/english/daten/liste.php
http://www.biodiversitymonitoring.ch
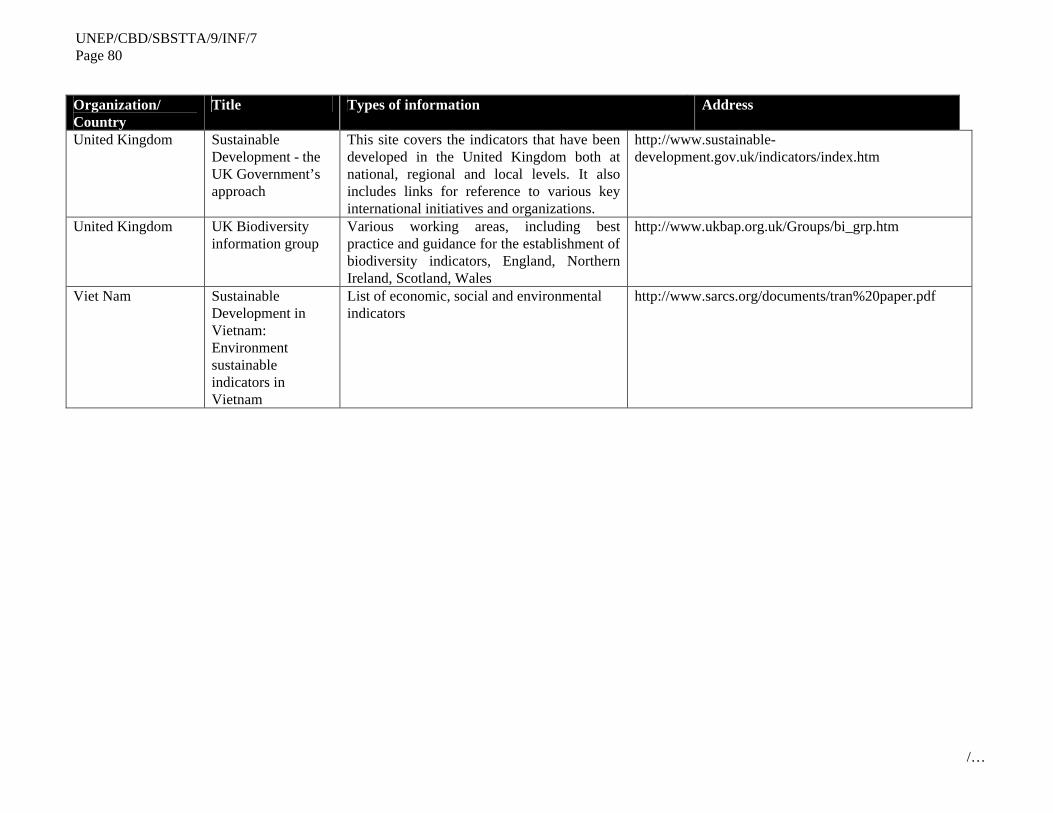
UNEP/CBD/SBSTTA/9/INF/7 Page 80
/…
Organization/ Country
Title Types of information Address
United Kingdom Sustainable Development - the UK Government’s approach
This site covers the indicators that have been developed in the United Kingdom both at national, regional and local levels. It also includes links for reference to various key international initiatives and organizations.
http://www.sustainable-development.gov.uk/indicators/index.htm
United Kingdom UK Biodiversity information group
Various working areas, including best practice and guidance for the establishment of biodiversity indicators, England, Northern Ireland, Scotland, Wales
http://www.ukbap.org.uk/Groups/bi_grp.htm
Viet Nam Sustainable Development in Vietnam: Environment sustainable indicators in Vietnam
List of economic, social and environmental indicators
http://www.sarcs.org/documents/tran%20paper.pdf
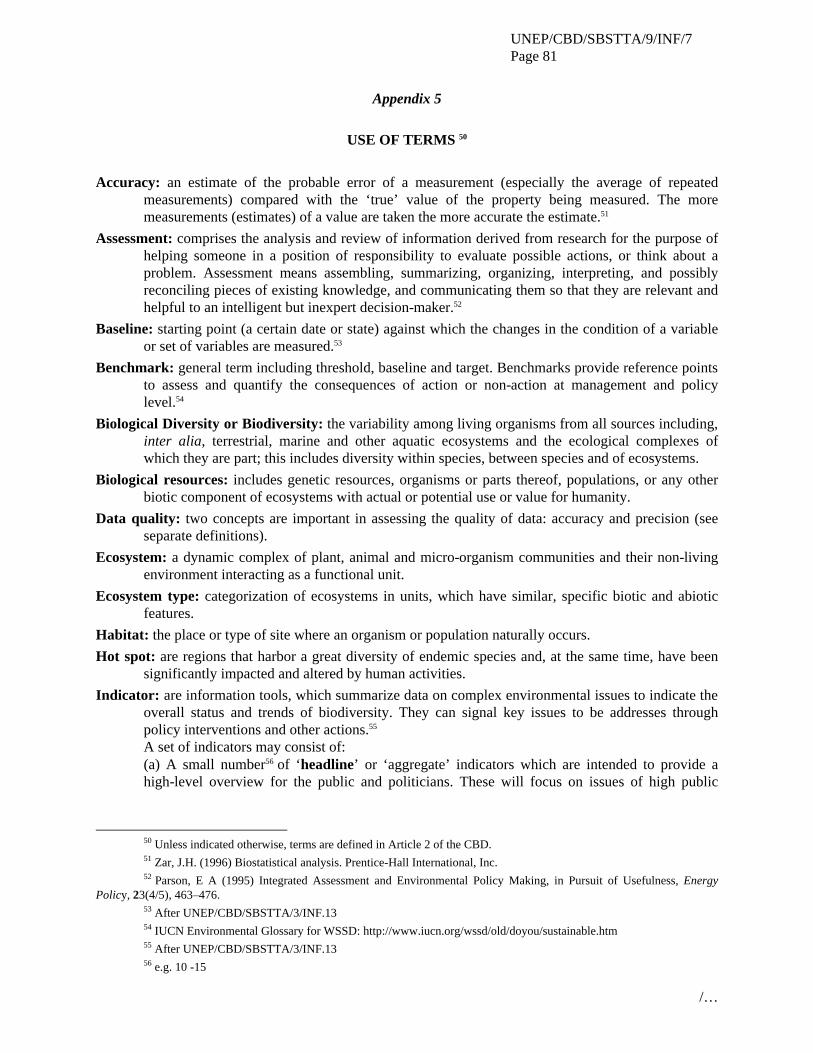
UNEP/CBD/SBSTTA/9/INF/7 Page 81
/…
Appendix 5
USE OF TERMS 50
Accuracy: an estimate of the probable error of a measurement (especially the average of repeated
measurements) compared with the ‘true’ value of the property being measured. The more measurements (estimates) of a value are taken the more accurate the estimate.51
Assessment: comprises the analysis and review of information derived from research for the purpose of helping someone in a position of responsibility to evaluate possible actions, or think about a problem. Assessment means assembling, summarizing, organizing, interpreting, and possibly reconciling pieces of existing knowledge, and communicating them so that they are relevant and helpful to an intelligent but inexpert decision-maker.52
Baseline: starting point (a certain date or state) against which the changes in the condition of a variable or set of variables are measured.53
Benchmark: general term including threshold, baseline and target. Benchmarks provide reference points to assess and quantify the consequences of action or non-action at management and policy level.54
Biological Diversity or Biodiversity: the variability among living organisms from all sources including, inter alia, terrestrial, marine and other aquatic ecosystems and the ecological complexes of which they are part; this includes diversity within species, between species and of ecosystems.
Biological resources: includes genetic resources, organisms or parts thereof, populations, or any other biotic component of ecosystems with actual or potential use or value for humanity.
Data quality: two concepts are important in assessing the quality of data: accuracy and precision (see separate definitions).
Ecosystem: a dynamic complex of plant, animal and micro-organism communities and their non-living environment interacting as a functional unit.
Ecosystem type: categorization of ecosystems in units, which have similar, specific biotic and abiotic features.
Habitat: the place or type of site where an organism or population naturally occurs. Hot spot: are regions that harbor a great diversity of endemic species and, at the same time, have been
significantly impacted and altered by human activities. Indicator: are information tools, which summarize data on complex environmental issues to indicate the
overall status and trends of biodiversity. They can signal key issues to be addresses through policy interventions and other actions.55 A set of indicators may consist of: (a) A small number56 of ‘headline’ or ‘aggregate’ indicators which are intended to provide a high-level overview for the public and politicians. These will focus on issues of high public
50 Unless indicated otherwise, terms are defined in Article 2 of the CBD. 51 Zar, J.H. (1996) Biostatistical analysis. Prentice-Hall International, Inc. 52 Parson, E A (1995) Integrated Assessment and Environmental Policy Making, in Pursuit of Usefulness, Energy
Policy, 23(4/5), 463–476. 53 After UNEP/CBD/SBSTTA/3/INF.13 54 IUCN Environmental Glossary for WSSD: http://www.iucn.org/wssd/old/doyou/sustainable.htm 55 After UNEP/CBD/SBSTTA/3/INF.13 56 e.g. 10 -15
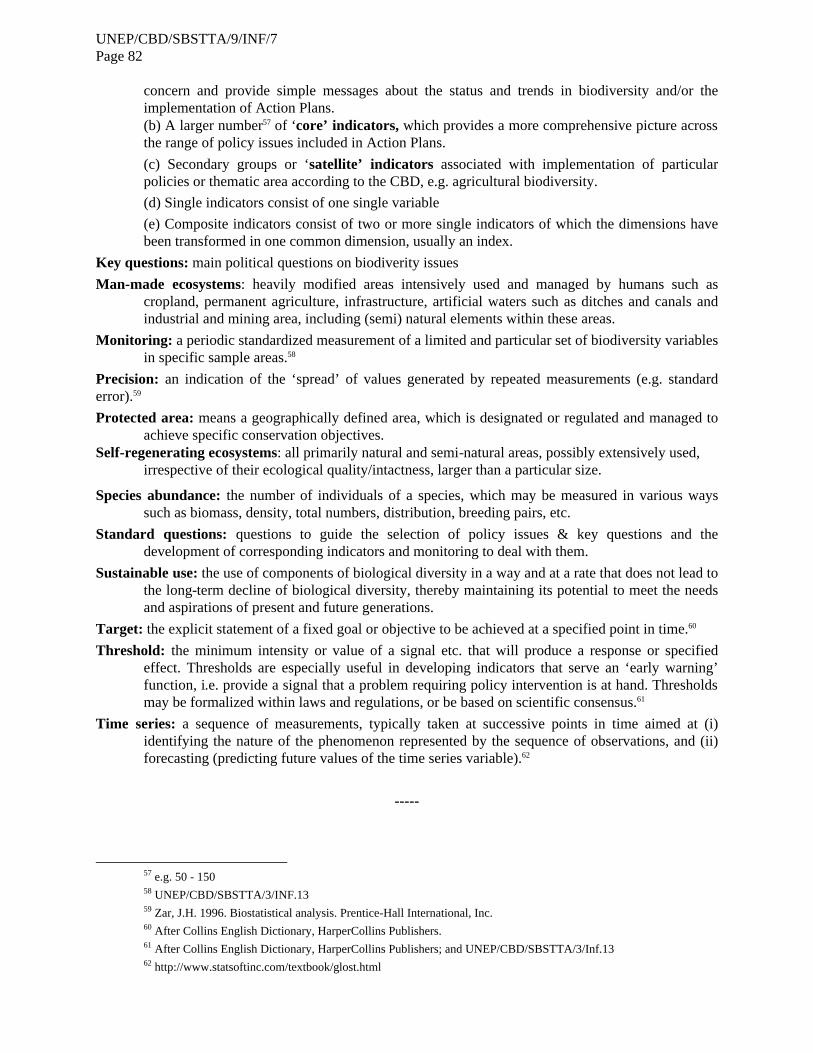
UNEP/CBD/SBSTTA/9/INF/7 Page 82
concern and provide simple messages about the status and trends in biodiversity and/or the implementation of Action Plans. (b) A larger number57 of ‘core’ indicators, which provides a more comprehensive picture across the range of policy issues included in Action Plans. (c) Secondary groups or ‘satellite’ indicators associated with implementation of particular policies or thematic area according to the CBD, e.g. agricultural biodiversity. (d) Single indicators consist of one single variable (e) Composite indicators consist of two or more single indicators of which the dimensions have been transformed in one common dimension, usually an index.
Key questions: main political questions on biodiverity issues Man-made ecosystems: heavily modified areas intensively used and managed by humans such as
cropland, permanent agriculture, infrastructure, artificial waters such as ditches and canals and industrial and mining area, including (semi) natural elements within these areas.
Monitoring: a periodic standardized measurement of a limited and particular set of biodiversity variables in specific sample areas.58
Precision: an indication of the ‘spread’ of values generated by repeated measurements (e.g. standard error).59 Protected area: means a geographically defined area, which is designated or regulated and managed to
achieve specific conservation objectives. Self-regenerating ecosystems: all primarily natural and semi-natural areas, possibly extensively used,
irrespective of their ecological quality/intactness, larger than a particular size.
Species abundance: the number of individuals of a species, which may be measured in various ways such as biomass, density, total numbers, distribution, breeding pairs, etc.
Standard questions: questions to guide the selection of policy issues & key questions and the development of corresponding indicators and monitoring to deal with them.
Sustainable use: the use of components of biological diversity in a way and at a rate that does not lead to the long-term decline of biological diversity, thereby maintaining its potential to meet the needs and aspirations of present and future generations.
Target: the explicit statement of a fixed goal or objective to be achieved at a specified point in time.60 Threshold: the minimum intensity or value of a signal etc. that will produce a response or specified
effect. Thresholds are especially useful in developing indicators that serve an ‘early warning’ function, i.e. provide a signal that a problem requiring policy intervention is at hand. Thresholds may be formalized within laws and regulations, or be based on scientific consensus.61
Time series: a sequence of measurements, typically taken at successive points in time aimed at (i) identifying the nature of the phenomenon represented by the sequence of observations, and (ii) forecasting (predicting future values of the time series variable).62
-----
57 e.g. 50 - 150 58 UNEP/CBD/SBSTTA/3/INF.13 59 Zar, J.H. 1996. Biostatistical analysis. Prentice-Hall International, Inc. 60 After Collins English Dictionary, HarperCollins Publishers. 61 After Collins English Dictionary, HarperCollins Publishers; and UNEP/CBD/SBSTTA/3/Inf.13 62 http://www.statsoftinc.com/textbook/glost.html


