Embed Size (px)
Citation preview
Brain Research, 413 (1987) 75- 86 75 Elsevier
BRE 12612
Characteristics of activation through the hippocampal trisynaptic pathway in the unanaesthetized rat
O. Herreras, J.M. Solis, R. Martin del Rio and J. Lerma* Departamento de lnvestigaci6n, Centro Ram6n y Cajal, Madrid (Spain)
(Accepted 28 October 1986)
Key words." Neuronal transmission; Trisynaptic circuit; Hippocampus; 0 Rhythm; Evoked potential
The hippocampal CA I field is activated by the entorhinal cortex mainly through the hippocampal excitatory trisynaptic circuit. Field responses of the CA~ region were evoked by ipsilateral CA 3 or perforant path volleys (mono- or trisynaptic activation, respectively) in paralyzed, locally anaesthetized rats and studied as a function of the stimulus patterns presented. The relationship of these responses with the concomitant EEG was also explored. Results showed that mono- and especially trisynaptically evoked responses were pro- gressively enhanced by increasing the stimulus frequency from 0.1 to 1.0 Hz. At specific intensities the trisynaptically evoked popula- tion spike (PS) was present only with a rather fixed frequency of stimulation (--~0.5 Hz). PS was produced in 100~4 of the responses using 0.7 Hz, indicating the existence of a threshold-like level for this stimulus parameter. The frequency of presented paired pulses differentially affected pair-pulse facilitation of mono- and trisynaptically evoked excitatory postsynaptic potentials (EPSP): higher frequency decreased the former and increased the latter. All evoked responses studied (i.e. EPSP and PS) showed steep increments and decrements in amplitude, clearly developing several clusters. Moreover, the amplitude distribution of trisynaptic PS often varied spontaneously from maximal to negligible values, showing an all-or-none distribution. Clustering was interpreted as evidence of the existence in the hippocampus of functional neuronal aggregates. All-or-none distribution of trisynaptic PS was found to be associated with the EEG pattern. PS amplitude being maximal during irregular EEG activity and minimal during 0 rhythm. Present results sug- gest that (1) the entorhinal cortex may exert modulatory actions on CA 1 by a mechanism widely based on the frequency of the input; (2) information transfer from the entorhinal cortex to other brain areas throughout the hippocampus is biased by hippocampal EEG: and (3) electrotonic coupling may be functionally predominant in the hippocampus.
INTRODUCTION
Single as well as repe t i t ive s t imula t ion of h ippo-
campal pa thways modi f ies the response of h ippocam-
pal neurons to subsequen t tes t ing with e i ther short-
or long- te rm t ime courses. Severa l types of short-
te rm monosynap t i c a l te ra t ions of neurona l t ransmis-
sion have been descr ibed in the rat h ippocampus , the
most widely s tudied be ing pair pulse faci l i tat ion 3'12" 28,40.47, f r equency facil i tation 2"3"712"18"36"47 and fre-
quency defaci l i ta t ion or hab i tua t ion- l ike changes 1'2
19.45,46. In addi t ion , changes in h ippocampa l t ransmis-
sion have recent ly been r e p o r t e d in re la t ion to the
animal ' s behav io ra l s tate and the h ippocampa l
E E G 11'22'26"~9. Sensory s t imula t ion , which genera tes
0 rhy thm in this s t ructure , abol ishes C A I popu la t ion
spikes 2~ and diminishes exci tabi l i ty t h roughou t a pe-
nici l l in- induced epi lept ic focus 25.
Previous studies have descr ibed the ana tomica l
and funct ional lamel lar o rganiza t ion of intrinsic con-
nect ions in the h ippocampus 5"3°'37, including an exci-
ta tory polysynapt ic circuit in which cort ical in forma-
t ion, en te r ing via the pe r fo ran t path, may be elab-
ora ted by the h ippocampus . These lamel lae b e c o m e
funct ional w h e n e v e r a n u m b e r of granule cells of
den ta te gyrus are ac t iva ted because their axons, the
mossy fibers, exci te C A 3 pyramidal cells, which in
turn may t r igger the discharge of CAI neurons . Since
the per fo ran t pa thway represen t s the m a j o r hippo-
campal input whe reas C A 1 may be cons idered the
* Present address: Instiluto de Neurobiologia S. Ram6n y Cajal, C.S.1.C. Vel~izquez 144, 28006-Madrid, Spain. Correspondence: O. Herreras. Depto. Investigaci6n, Ctro. Ram6n y Cajal. Ctra. Colmenar Km 9, 28034-Madrid. Spain.
0006-8993/87/$03.50 © 1987 Elsevier Science Publishers B.V. (Biomedical Division)
76
hippocampal output, it should be useful to determine to what extent the patterns of impulses incoming to
the hippocampus affect C A 1 sensitivity to these same volleys, considering that activation of CA 1 pyramidal
cells from the entorhinal cortex occurs mostly through the hippocampal trisynaptic circuit 6,17. The aims of this study were thus to characterize the poly- synaptic activation of CA 1 by the perforant pathway, and to determine this activation's degree of depen- dence on the ongoing EEG. Trisynaptic and mono-
synaptic CA I activation induced by ipsilateral stimuli were also compared.
MATERIALS AND METHODS
Thirty-four Sprague-Dawley rats weighing 250-300 g were used. Under continuous ether anaes- thesia, the animals were placed on a stereotaxic
frame and pressure points and surgical wounds infil- trated with the potent and long-acting local anaes- thetic bupivacaine. The ear bars were removed after a metal plate, fastened to the stereotaxic instrument, was fixed to the skull with dental cement. Trephine holes were drilled in the skull at preselected stereo- taxic coordinates. Stimulating electrodes were of the bipolar concentric type, formed by a 26G cannula (varnish-coated except at the cut surface) and a 100 j~m stainless steel inner wire (teflon-coated except 500 ktm at the tip), protruding 1 mm from the cannu- la. An electrolytically sharpened stainless steel, varnish-coated microelectrode (3-5 #m at the tip) was used to record CA~ evoked potentials. After
electrode implantation, animals were paralyzed with i.p, D-tubocurarine (5 mg/kg b. wt.) and ether anaes- thesia was discontinued. Mechanical ventilation was applied by means of a special nasal adaptor attached to the stereotaxic frame. The room was maintained quiet and in partial darkness to reduce uncontrolled sensory stimuli (see ref. 20). Heart rate was continu- ously monitored as an indicator of the preparation's stability and body temperature was kept constant with a heater plate. Doses of local anaesthetic were periodically infiltrated into surgical wounds in order to avoid possible distress. Control animals, main- tained under these conditions for up to 6 h, showed no signs of discomfort since they sporadically dis- played slow wave sleep episodes.
The recording electrode was connected to a field
effect transistor, the output of which was amplified and band-pass filtered at 1-30 Hz to record the EEG and at 1-3000 Hz for evoked potentials. EEG was continuously monitored on paper by an electroence- phalograph and evoked potentials were simult~- neously displayed on the storage screen of an oscillo- scope, Both EEG and evoked responses were taped for analysis.
Stimulating electrodes were positioned on CA 3 and/ or on the perforant pathway to induce the mono- or trisynaptic activation of the (?Am field, respectively. Since electrodes were usually implanted on both
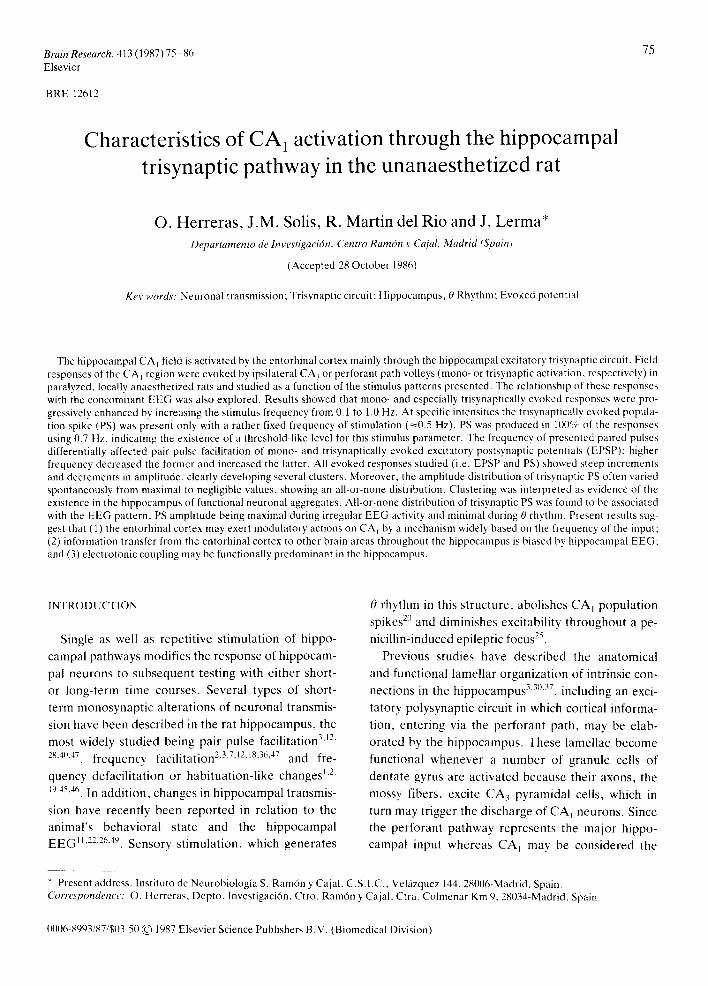
areas in each animal, it was demonstrated that the CA:~ electrode did not alter the trisynaptic ('A~ acti- vation. Fhe recording electrode was first placed in the pyramidal cell layer to study somatic potentials (i.e. population spike, PS) and subsequently lowered to the CA t stratum radiatum in order to record den- dritic potentials (i.e. field excitatory postsynaptic po- tentials, EPSP). The arrangement of stimulating and recording electrodes is shown in Fig. 1A. Typical re- sponses recorded at both somatic and dendritic lev- els, evoked by stimulating either the CA 3 or perfo- rant pathway, are presented in Fig. lB. These field potentials have been shown to correspond to the ex- tracellular current summation of synchronous uni- tary events evoked by an afferent volley 4'2v. Mono-
synaptic somatic responses (Fig. 1, R~-S 0 consisted of a sharp 4-6 ms latency negative wave (PS) pre- ceded and followed by positive waves. Dendritic re- sponses (Fig. 1, R2-S ~) appeared a~ a wider negative wave lasting 4-5 ms (EPSP). Trisynaptically evoked responses (Fig. 1, $2) showed longer latency (13-17 ms) and were preceded by a short-latency (3-4 ms) triphasic wave corresponding to the granule cell PS monosynaptically triggered by the perforant path in- put and recorded by volume conduction ¢''~7. The tri- synaptic nature of these perforant path-evoked CAj responses has been reported previously 5'¢''17. Popula- tion spike amplitude was measured as the voltage from the shoulder of the first positive wave to the peak of maximal negativity. In dendritic records, the voltage from the baseline to the inaximal negativity was taken as the EPSP amplitude. In some experi- ments, EPSP was also evaluated as the maximum rate of rise (slope) of the negative-going wave. Since similar results were obtained by both methods, the former was chosen in order to facilitate and acceler-
77
R1
S l ~-
R1
S l S2 B
R 2 J e ~
Fig. 1. A: schematic diagram of a hippocampal lamella showing the arrangement of recording and stimulating electrodes. Evoked field potentials were recorded from CA 1 stratum pyra- midale (R 0 or CA I stratum radiatum (R2). Electrical stimuli were applied on the CA3 field (S0, to evoke the monosynaptic activation of CA l, or on the perforant pathway ($2), to induce CA] response trisynaptically. B: typical averaged CA l poten- tials (n = 20) evoked by stimuli applied to either CA 3 (S 0 or perforant pathway ($2) and recorded at either pyramidal (Rp population spike) or dendritic (R2, field EPSP) layers. Stimuli are indicated by black dots. Note in records showing trisynaptic activation ($2), the presence of an additional short-latency tri- phasic wave, corresponding to the monosynaptic-evoked po- tential propagated from the dentate gyms. Calibrations: 5 ms and 4 inV.
ate EPSP measurements. At the end of each experi- ment, the exact electrode locations were histological- ly verified using the Prussian blue method (see ref. 48).
Experiment I was designed to determine the effect of the presentation pattern of afferent stimuli on both mono- and trisynaptic CA] responses. Afferent stim- uli consisted of 0.1 ms square pulses, with frequency (0.1-1.0 Hz) and intensity (0.05-1.0 mA) steeply varied. In all stimulation series, first 10-15 records
A
E
t - 2 :E
a. I W
A • • M O N O
0- - - - - -0 TRI ~ . ~ e . . . ~ - . - - ~ - - - ~ e e •
/ * .9 .~---o . . . . -0
/
0.1 0 5 0 4 0~5
ST IMULUS INTIENSITY ( m A )
B 0.1 mA 0 . 4 m A . ~ ~ @ - " ' ~ ' ~ ~
0 . 8 m A ~ ~ - ~ ~ ~
A
E
I -
3E
6 ~ e M O N O
0 - - - - - o T R I i ~ .-,-- '~'e ( 0 4 Hz )
I 111=0~1 (0 4 HI) / / 11 / //i ~11 .'~" lit I
1 y / oz 04 06 do
STIMULUS I N T E N S I T Y ( m A )
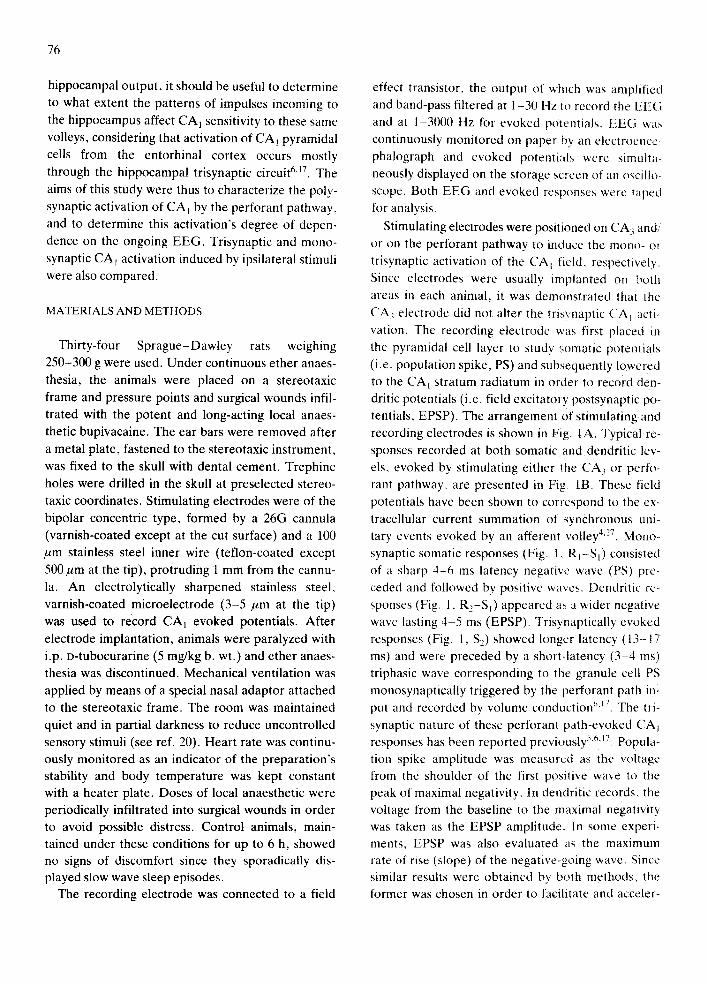
Fig. 2. Stimulus-response curves of mono- and trisynaptic acti- vation of CA 1. Variations of field-EPSP (A) and population spike (B) amplitudes were measured as a function of stimulus intensity. Stimuli were delivered at 0.1 Hz in A and as indicated in B, bottom. Examples of averaged trisynaptic responses (n = 20) depicted at the top of B correspond to those used for the 0.5 Hz curve. Calibration: 5 ms, 2 inV.
78
were excluded to allow response stabil ization (see
Fig. 3A). Taped records were acquired in a progra-
mable digital oscil loscope (Tektronix 7D20) at a sam-
pling rate of 20-50 kHz, and averages (n = 20) were
obtained and photographed . Tests were always per-
formed during continuous i rregular E E G activity
( IA) , i.e. in absence of 0 rhythm, and were discon-
t inued if a change in the E E G pat te rn was observed
(see below).
Exper iment 11 was designed to study mono- and
trisynaptic CA] activation in relat ion to different
E E G patterns. Long-last ing records (up to 40 min) of
s imultaneously taped E E G and evoked potent ials
were analyzed. In this exper iment , s t imulat ion para-
meters for studying the PS were adjus ted at an inten-
sity of 2 x threshold and a frequency of 0 .4 -0 .7 Hz,
whereas the same frequencies with subthreshold in-
tensities were used for studying thc EPSP. Sponta-
neous time course of PS ampli tude was represented~
and taped E E G was later divided into segments with
stable and similar PS ampli tudes. In order to charac-
terize the E E G segments, autocorre la t ion functions
(ACF) and power spectra (PwS) were obta ined by a
PDP-11 computer and in terpre ted as descr ibed pre-
viously 16'25. In addit ion, ampli tude histograms of
evoked responses were constructed for these long-
lasting records.
RESULTS
Experiment 1. Dependence o/'the (:A t response on the stimulation parameters
To analyze the CAI response evoked ei ther mono-
or tr isynaptically, 30-35 single pulses were appl ied at
A B C
I " • • 0.4 Hz
0 . 8 Hz
I , ,
D E 100,
~__ IIO,
q[
|O
. ~ ) i / ~
.,..-~ ~ _ .o - ! i "
o - - - o 'm~ ~ X'
o'z o~4 o:6 o~ ,'o STIMULUS FI~OUENG'Y (HI)
O / O ~ / // ~ , ( - - .o,o
t / / / / . . . . TEl : ¢
, L - " : , - i o " O~2 0.4 O~S 011
S T I M U L U S F R E Q U E N C Y ( H i )
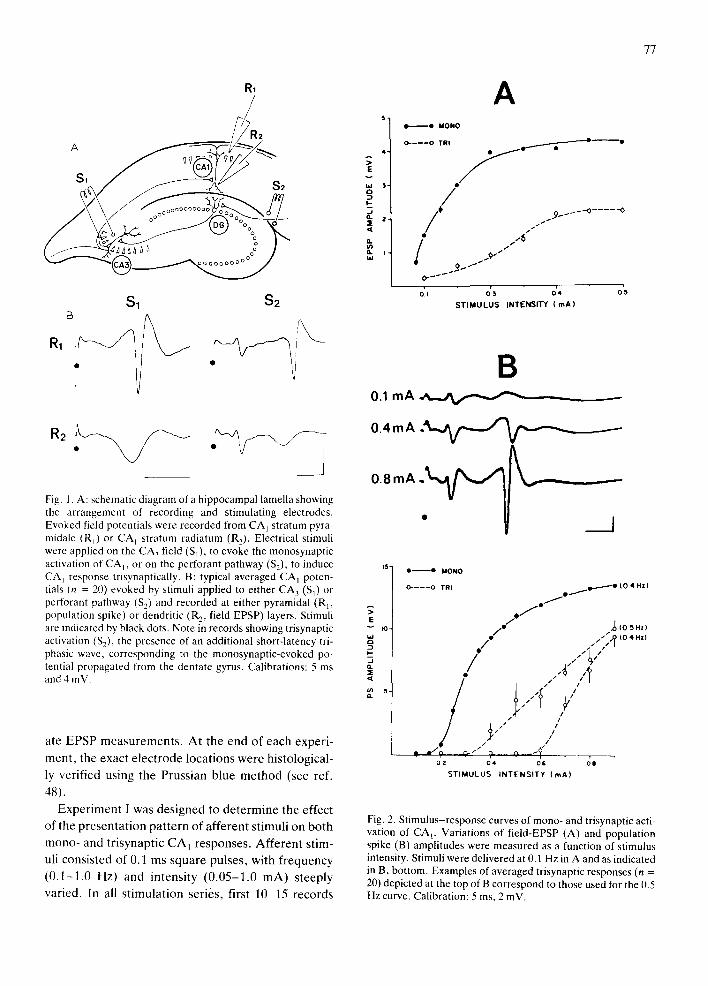
Fig. 3. Effects of the variation in the stimulus frequency on mono- and trisynaptic CA l responses. A: oscilloscope traces of the first 8 trisynaptic responses, recorded at the CA] pyramidal layer, after starting the perforant pathway stimulation at 0~6 Hz: Note the gra- dual increase of population spike. B, C: averages (n = 20) of dendritic field EPSP (B) and somatic population spike(C) both trisynap- tically evoked at different frequencies but with a constant stimulation intensity. Note that the short-latency triphasic wave showed an opposite behavior as did the trisynaptic population spike with the frequency. D: percentage of increase in field EPSP amplitude as a function of the stimulus frequency, taking as 100% that amplitude obtained at 1 Hz. E: variation of the amplitude (as percentage of the maximal population spike) and percentage of occurrence of the population spike with the frequency of stimulation. Calibrations: 5 ms, 2 mV.
each intensity and/or frequency of stimulation. Only
the last 20 responses were used for measurements be-
cause first responses showed considerable variabili-
ty, gradually increasing in ampli tude to a s teady re-
sponse, as seen clearly in tr isynaptic records (Fig.
3A).
The effect of s tronger stimulus strength on mono-
and tr isynaptically evoked potentials is presented in
Fig. 2. Monosynapt ic responses (both EPSP and PS)
saturated at lower intensities than tr isynaptic re-
sponses. The threshold for monosynapt ic PS was 2 - 5
times lower than that of tr isynaptically evoked PS,
the lat ter being highly dependent on the stimulus fre-
quency (Fig. 2B, bot tom). Examples of intensity de-
pendence of trisynaptic PS evoked at 3 different
strengths of perforant path stimulus are shown at the
top of Fig. 2B, where a concomitant enhancement in
the triphasic short- latency wave (propagated mono-
synaptic granule cell PS; see refs. 6, 17) is also evi-
dent.
Stimulus frequency greatly affected tr isynaptically
evoked responses, whereas it only slightly influenced
monosynapt ic ones. In order to determine the effect
of stimulus frequency on the EPSP, a preselected
stimulus intensity was used, which always evoked
50% of the maximal ampli tude EPSP (as de termined
at a frequency of 0.1 Hz, Fig. 2A). As seen in Fig.
3D, EPSP ampli tude increased as a function of stimu-
lus frequency. The effect of stimulus frequency on PS
ampli tude as well as on the percentage of spike oc-
currence is shown in Fig. 3E. The intensity of stimuli
selected was the same as in the EPSP study, but 0.4
Hz were used, which in most cases evoked measura-
ble PS. 100% PS was obta ined at 0.7 Hz. The mod-
ulation of the trisynaptic response by the stimulus
frequency is more evident considering that the mono-
synaptic granule cell response (the short- latency tri-
phasic wave in Fig. 3B, C; see refs. 1, 19, 45) de- creased simultaneously.
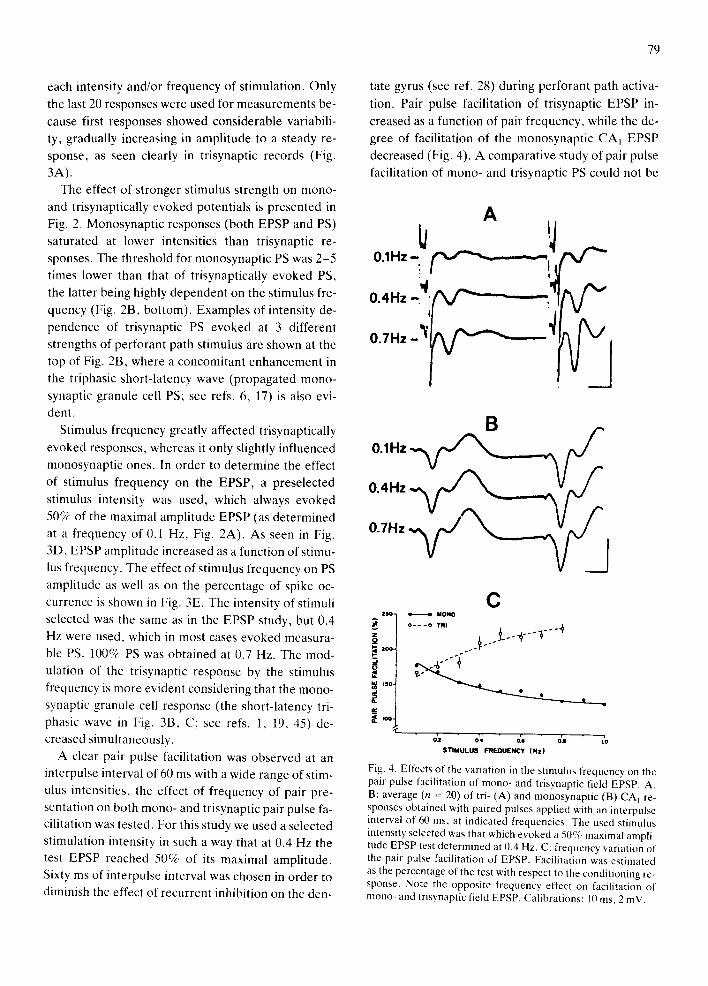
A clear pair pulse facilitation was observed at an
interpulse interval of 60 ms with a wide range of stim-
ulus intensities, the effect of frequency of pair pre-
sentation on both mono- and tr isynaptic pair pulse fa-
cilitation was tested. For this study we used a selected
stimulation intensity in such a way that at 0.4 Hz the
test EPSP reached 50% of its maximal ampli tude.
Sixty ms of interpulse interval was chosen in order to
diminish the effect of recurrent inhibition on the den-
79
tate gyrus (see ref. 28) during perforant path activa-
tion. Pair pulse facilitation of tr isynaptic EPSP in-
creased as a function of pair frequency, while the de-
gree of facilitation of the monosynapt ic C A I EPSP
decreased (Fig. 4). A comparat ive study of pair pulse
facilitation of mono- and trisynaptic PS could not be
A
o.,xz,
0.7Hz : ' ~ ~ ' 4
,x/ '"
B 0.1Hz 0.4Hz 0.7Hz
I 2SO -
i U
IsO
~ O O
C : = MONO
- "
o~, d . d . o', ~'o S T I M U L U S FRr~QUI[NCY ( H z )
Fig. 4. Effects of the variation in the stimulus frequencv on the pair pulse facilitation of mono- and trisynaptic field EF'SP. A, B: average (n = 20) of tri- (A) and monosynaptic (B) CA] re- sponses obtained with paired pulses applied with an interpulse interval of 60 ms, at indicated frequencies. The used stimulus intensity selected was that which evoked a 50% maximal ampli- tude EPSP test determined at 0.4 Hz. C: frequency variation of the pair pulse facilitation of EPSP. Facilitation was estimated as the percentage of the test with respect to the conditioning re- sponse. Note the opposite frequency effect on facilitation of mono- and trisynaptic field EPSP. Calibrations: 10 ms, 2 inV.
80
1 °d \
8 -
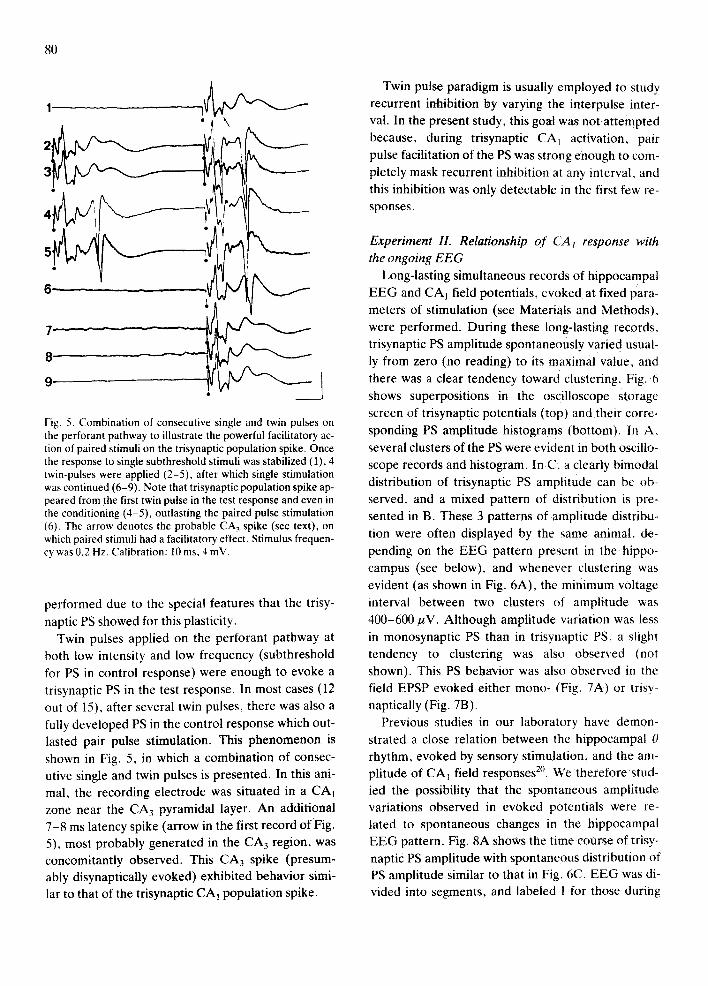
Fig. 5. Combination of consecutive single and twin pulses on the perforant pathway to illustrate the powerful facilitatory ac- tion of paired stimuli on the trisynaptic population spike. Once the response to single subthreshold stimuli was stabilized (1), 4 twin-pulses were applied (2-5), after which single stimulation was continued (6-9). Note that trisynaptic population spike ap- peared from the first twin pulse in the test response and even in the conditioning (4-5), outlasting the paired pulse stimulation (6). The arrow denotes the probable CA 3 spike (see text), on which paired stimuli had a facilitatory effect. Stimulus frequen- cy was 0.2 Hz. Calibration: 10 ms, 4 mV.
performed due to the special features that the trisy-
naptic PS showed for this plasticity. Twin pulses applied on the perforant pathway at
both low intensity and low frequency (subthreshold for PS in control response) were enough to evoke a trisynaptic PS in the test response. In most cases (12 out of t5), after several twin pulses, there was also a fully developed PS in the control response which out- lasted pair pulse stimulation. This phenomenon is
shown in Fig. 5, in which a combination of consec- utive single and twin pulses is presented. In this ani- mal, the recording electrode was situated in a CAt zone near the CA 3 pyramidal layer. An additional 7-8 ms latency spike (arrow in the first record of Fig. 5), most probably generated in the CA 3 region, was concomitantly observed. This C A 3 spike (presum- ably disynaptically evoked) exhibited behavior simi- lar to that of the trisynaptic CA1 population spike.
Twin pulse paradigm is usually employed to study recurrent inhibition by varying the interpulse inter- val. In the present study, this goal was not attempted because, during trisynaptic CA/ activation, pair pulse facilitation of the PS was strong enough to com- pletely mask recurrent inhibition at any interval, and this inhibition was only detectable in the first few re- sponses.
Experiment IL Relationship of CAt response with the ongoing EEG
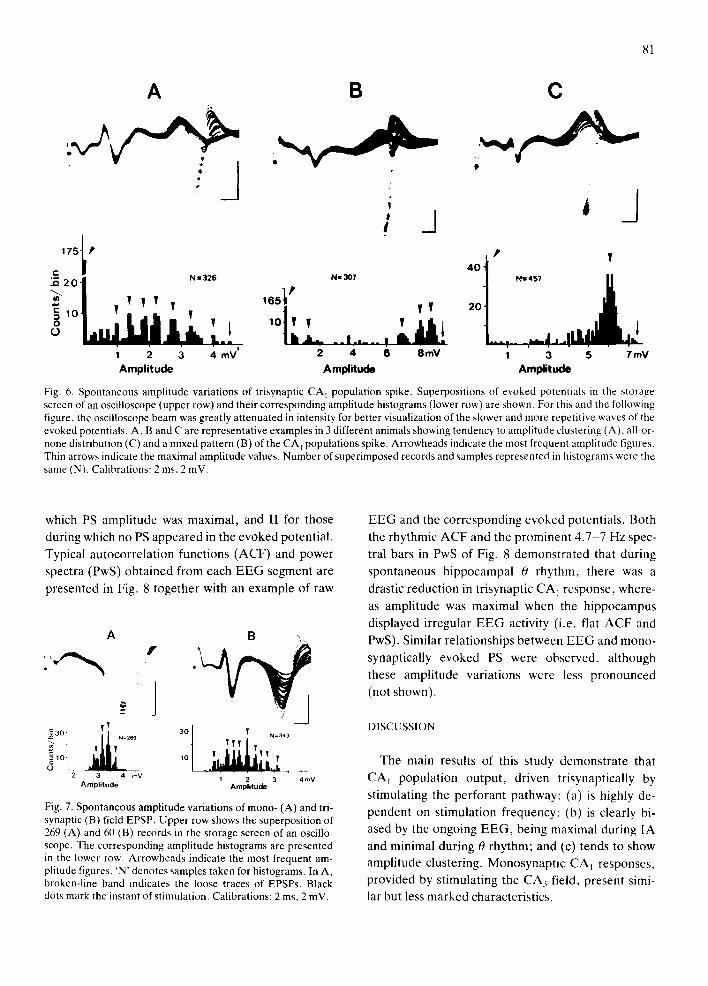
Long-lasting simultaneous records of hippocampal EEG and CA 1 field potentials, evoked at fixed para- meters of stimulation (see Materials and Methods), were performed. During these long-lasting records, trisynaptic PS amplitude spontaneously varied usual- ly from zero (no reading) to its maximal value, and there was a clear tendency toward clustering. Fig. 6 shows superpositions in the oscilloscope storage screen of trisynaptic potentials (top) and their corre- sponding PS amplitude histograms (bottom). In A, several clusters of the PS were evident in both oscillo- scope records and histogram. In C, a clearly bimodal distribution of trisynaptic PS amplitude can be ob- served, and a mixed pattern of distribution is pre- sented in B. These 3 patterns of amplitude distribu- tion were often displayed by the same animal, de- pending on the EEG pattern present in the hippo- campus (see below), and whenever clustering was
evident (as shown in Fig. 6A), the minimum voltage interval between two clusters of amplitude was 400-600 pV. Although amplitude variation was less in monosynaptic PS than in trisynaptic PS, a slight tendency to clustering was also observed (not shown). This PS behavior was also observed in the field EPSP evoked either mono- (Fig. 7A) or trisy- naptically (Fig. 7B).
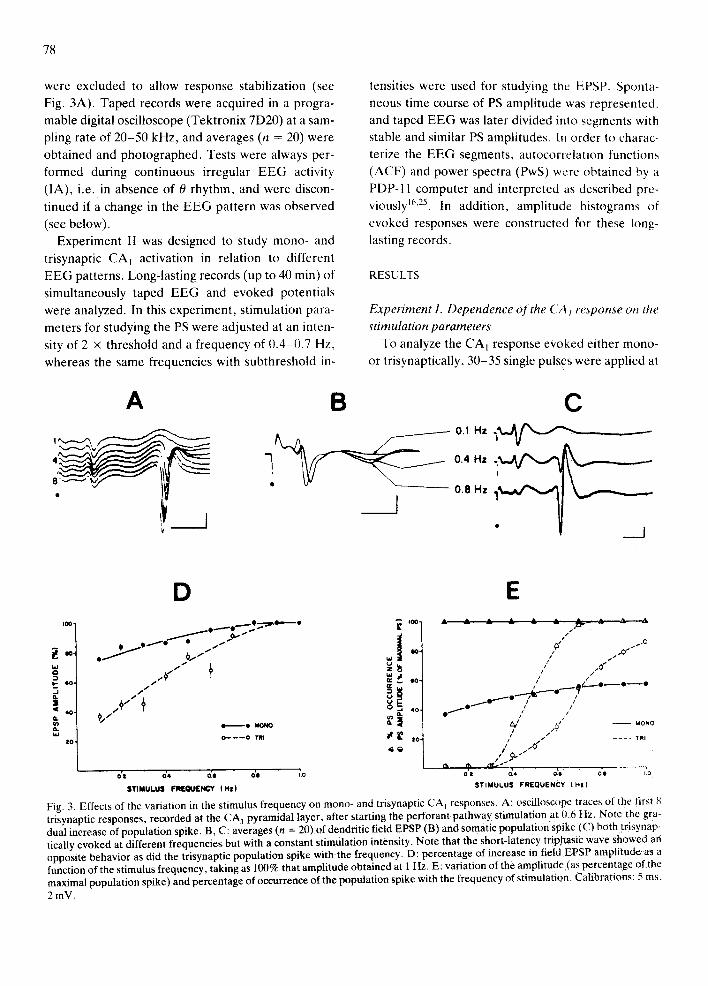
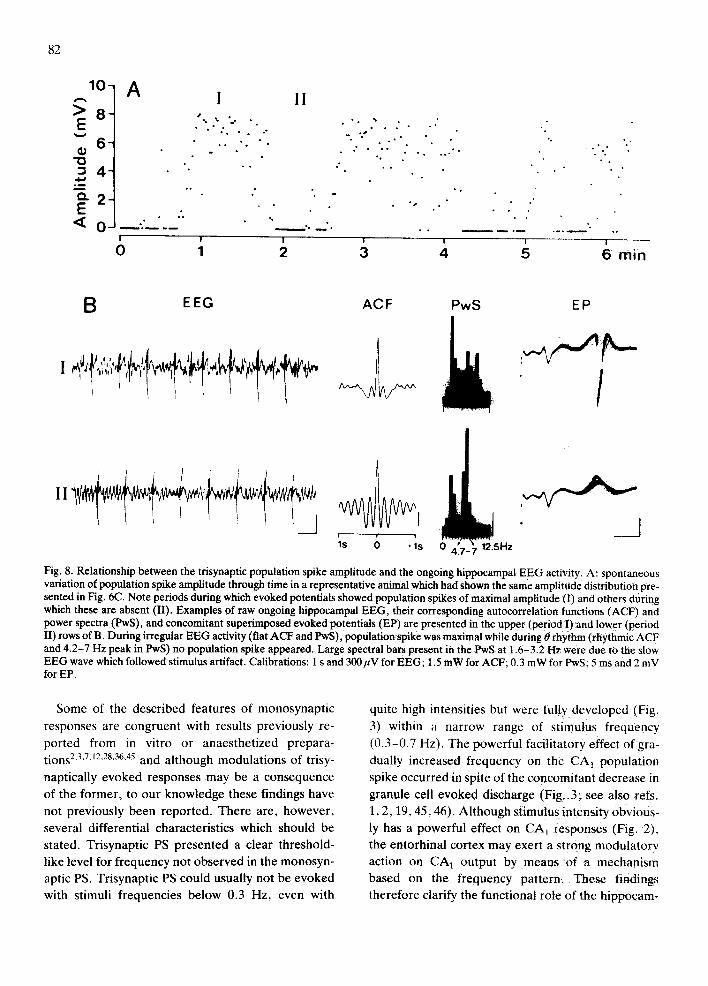
Previous studies in our laboratory have demon- strated a close relation between the hippocampal 0 rhythm, evoked by sensory stimulation, and the am- plitude of CA 1 field responses z°. We therefore stud- ied the possibility that the spontaneous amplitude variations observed in evoked potentials were re- lated to spontaneous changes in the hippocampal EEG pattern. Fig. 8A shows the time course of trisy- naptic PS amplitude with spontaneous distribution of PS amplitude similar to that in Fig. 6C. EEG was di- vided into segments, and labeled 1 for those during
81
A B C
. _ J , " _J , _] I
1751P I • l 2 0 1 N=326 N-307 4 0 N=457 i~
,,. . . . ; ~, ~ *mV' 2 4 e o.,v , s s r . ,v Amplitude Amplitude Amplitude
Fig. 6. Spontaneous amplitude variations of trisynaptic CA t population spike• Superpositions of evoked potentials in the storage screen of an oscilloscope (upper row) and their corresponding amplitude histograms (lower row) are shown. For this and the following figure, the oscilloscope beam was greatly attenuated in intensity for better visualization of the slower and more repetitive waves of the evoked potentials. A, B and C are representative examples in 3 different animals showing tendency to amplitude clustering (A), all-or- none distribution (C) and a mixed pattern (B) of the CA 1 populations spike. Arrowheads indicate the most frequent amplitude figures. Thin arrows indicate the maximal amplitude values. Number of superimposed records and samples represented in histograms were the same (N). Calibrations: 2 ms, 2 mV.
which PS amplitude was maximal, and lI for those during which no PS appeared in the evoked potential•
Typical autocorrelation functions (ACF) and power
spectra (PwS) obtained from each E E G segment are
presented in Fig. 8 together with an example of raw
= / T l ~30~ 1 I L ~ T N=269 301 l N=343 =10 10 l | I T I I I ?
2 3 4 mV Amplitude 1 2 3 4 mV Amplitude
Fig. 7. Spontaneous amplitude variations of mono- (A) and tri- synaptic (B) field EPSP. Upper row shows the superposition of 269 (A) and 60 (B) records in the storage screen of an oscillo- scope. The corresponding amplitude histograms are presented in the lower row. Arrowheads indicate the most frequent am- plitude figures. 'N' denotes samples taken for histograms. In A, broken-line band indicates the loose traces of EPSPs. Black dots mark the instant of stimulation. Calibrations: 2 ms, 2 mV.
EEG and the corresponding evoked potentials. Both
the rhythmic ACF and the prominent 4 .7-7 Hz spec- tral bars in PwS of Fig. 8 demonstrated that during
spontaneous hippocampal 0 rhythm, there was a
drastic reduction in trisynaptic CA~ response, where-
as amplitude was maximal when the hippocampus
displayed irregular E E G activity (i.e. flat ACF and
PwS). Similar relationships between E E G and mono-
synaptically evoked PS were observed, although
these amplitude variations were less pronounced (not shown).
DISCUSSION
The main results of this study demonstrate that
CA~ population output, driven trisynaptically by stimulating the perforant pathway: (a) is highly de-
pendent on stimulation frequency; (b) is clearly bi- ased by the ongoing EEG, being maximal during IA
and minimal during 0 rhythm; and (c) tends to show amplitude clustering• Monosynaptic CAI responses,
provided by stimulating the CA 3 field, present simi- lar but less marked characteristics.
82
10- A
> 8 - E
6 "O
4 -
¢Z 2 E < 0
A 1 II • , , , • . .
• , ' . . . - . . " , *
• , • , .
o , " o , • • . , . " , * , • . . • .
. • . . . . . . . * ,
° ° ° ° ° " ° ,
• ° ° ° * ° °
° , # . °
% • . • °
- - * ° o ° ° ° ° . . . : ° °
0 I 2 3 '4 5 6 min
B EEG ACF PwS EP
/
t i ' 1
- ls 0 ls 125Hz
Fig. 8. Relationship between the trisynaptic population spike amplitude and the ongoing hippocampal EEG activity. A: spontaneous variation of population spike amplitude through time in a representative animal which had shown the same amplitude distribution pre- sented in Fig. 6C. Note periods during which evoked potentials showed population spikes of maximal amplitude~l) and others during which these are absent (II). Examples of raw ongoing hippocampal EEG, their corresponding autocorrelation functions (ACF) and power spectra (PwS), and concomitant superimposed evoked potentials (EP) are presented in the upper (period I)and lower (period II) rows of B. During irregular EEG activity (fiat ACF and PwS), population spike was maximal while during O rhythm (rhythmic ACF and 4.2-7 Hz peak in PwS) no population spike appeared. Large spectral bars present in the PwS at 1.6-3.2 Hz were due to the slow EEG wave which followed stimulus artifact. Calibrations: 1 s and 300~V for EEG; 1.5 mW for ACF; 0.3 mW for PwS; 5 ms and 2 mV for EP.
Some of the descr ibed features of monosynapt ic
responses are congruent with results previously re-
por ted from in vitro or anaes thet ized prepara- t ions 2,3,7'12"28,36,45 and al though modula t ions of trisy-
naptically evoked responses may be a consequence
of the former , to our knowledge these findings have
not previously been repor ted . There are, however ,
several differential characterist ics which should be
stated. Trisynapt ic PS presented a clear threshold-
like level for f requency not observed in the monosyn-
aptic PS. Trisynaptic PS could usually not be evoked
with stimuli frequencies below 0.3 Hz, even with
quite high intensities but were fully deve loped (Fig.
3) within a narrow range of stimulus frequency
(0 .3-0 .7 Hz). The powerful facil i tatory effect of gra-
dually increased frequency on the C A t popula t ion
spike occurred in spite of the concomitant decrease in
granule cell evoked discharge (Fig, 3; see also refs.
1, 2, 19.45.46) . Al though stimulus intensity obvious-
ly has a powerful effect on CA I responses (Fig. 2},
the entorhinal cortex may exert a s trong modula tory
action on C A l output by means of a mechanism
based on the frequency pattern• These findings
therefore clarify the functional rote of the h ippocam-
pal excitatory trisynaptic circuit. While a massive synchronous discharge of granule cells evoked by
perforant path volleys would not be enough to induce the trisynaptic CA t PS, an attenuated but more fre- quent evoked discharge of granule cells would be
able to trigger the C A t .
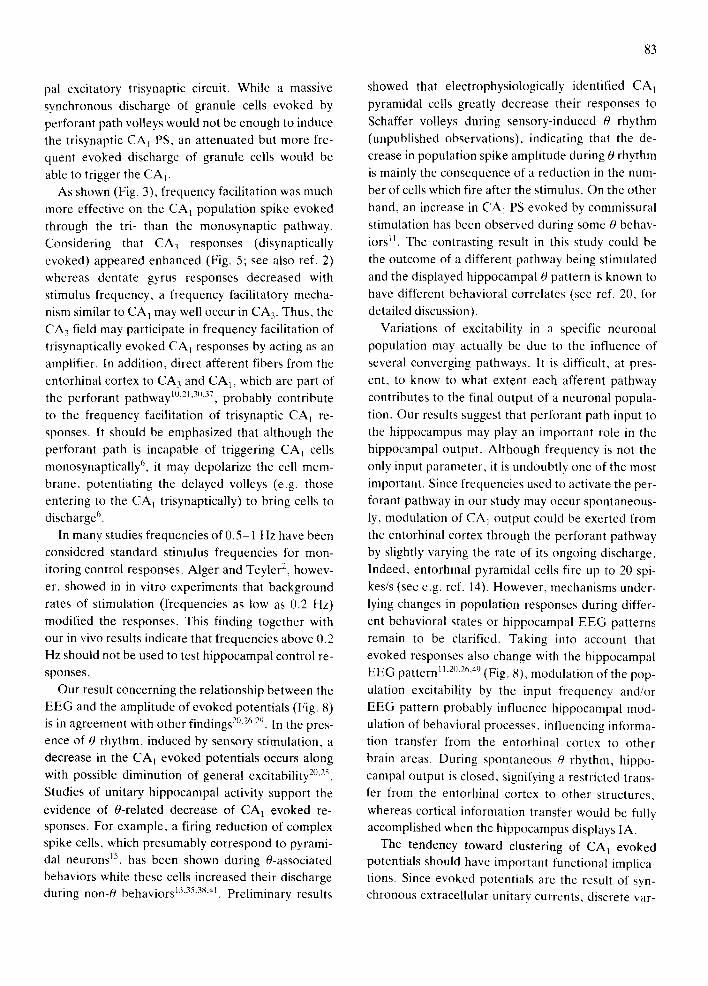
As shown (Fig. 3), frequency facilitation was much more effective on the CA 1 population spike evoked through the tri- than the monosynaptic pathway.
Considering that CA3 responses (disynaptically evoked) appeared enhanced (Fig. 5; see also ref. 2) whereas dentate gyrus responses decreased with stimulus frequency, a frequency facilitatory mecha- nism similar to CA 1 may well occur in CA 3. Thus, the CA 3 field may participate in frequency facilitation of trisynaptically evoked CA l responses by acting as an amplifier. In addition, direct afferent fibers from the
entorhinal cortex to CA 3 and CA t, which are part of the perforant pathway t°'21"3°'37, probably contribute
to the frequency facilitation of trisynaptic CA t re- sponses. It should be emphasized that although the perforant path is incapable of triggering CAt cells monosynaptically 6, it may depolarize the cell mem- brane, potentiating the delayed volleys (e.g. those entering to the CAt trisynaptically) to bring cells to discharge 6.
In many studies frequencies of 0.5-1 Hz have been considered standard stimulus frequencies for mon- itoring control responses. Alger and Teyler 2, howev-
er, showed in in vitro experiments that background rates of stimulation (frequencies as low as 0.2 Hz) modified the responses. This finding together with our in vivo results indicate that frequencies above 0.2 Hz should not be used to test hippocampal control re- sponses.
Our result concerning the relationship between the EEG and the amplitude of evoked potentials (Fig. 8) is in agreement with other f i n d i n g s 2°'26'29. I n the pres- ence of 0 rhythm, induced by sensory stimulation, a decrease in the CA1 evoked potentials occurs along with possible diminution of general excitability 2°,25.
Studies of unitary hippocampal activity support the
evidence of 0-related decrease of CA 1 evoked re- sponses. For example, a firing reduction of complex spike cells, which presumably correspond to pyrami- dal neurons iS, has been shown during 0-associated behaviors while these cells increased their discharge during non-0 behaviors 13,35,3s,at. Preliminary results
83
showed that electrophysiologically identified CA 1
pyramidal cells greatly decrease their responses to
Schaffer volleys during sensory-induced 0 rhythm (unpublished observations), indicating that the de- crease in population spike amplitude during 0 rhythm is mainly the consequence of a reduction in the num-
ber of cells which fire after the stimulus. On the other hand, an increase in CA 1 PS evoked by commissural stimulation has been observed during some 0 behav- iors L1. The contrasting result in this study could be
the outcome of a different pathway being stimulated and the displayed hippocampal 0 pattern is known to have different behavioral correlates (see ref. 20, for detailed discussion).
Variations of excitability in a specific neuronal
population may actually be due to the influence of several converging pathways. It is difficult, at pres-
ent, to know to what extent each afferent pathway contributes to the final output of a neuronal popula- tion. Our results suggest that perforant path input to the hippocampus may play an important role in the hippocampal output. Although frequency is not the only input parameter, it is undoubtly one of the most important. Since frequencies used to activate the per- forant pathway in our study may occur spontaneous- ly, modulation of CA 1 output could be exerted from the entorhinal cortex through the perforant pathway
by slightly varying the rate of its ongoing discharge. Indeed, entorhinal pyramidal cells fire up to 20 spi- kes/s (see e.g. ref. 14). However, mechanisms under- lying changes in population responses during differ- ent behavioral states or hippocampal EEG patterns remain to be clarified. Taking into account that evoked responses also change with the hippocampal EEG pattern 11,2°,26.49 (Fig. 8), modulation of the pop-
ulation excitability by the input frequency and/or EEG pattern probably influence hippocampal mod- ulation of behavioral processes, influencing informa- tion transfer from the entorhinal cortex to other brain areas. During spontaneous 0 rhythm, hippo-
campal output is closed, signifying a restricted trans- fer from the entorhinal cortex to other structures,
whereas cortical information transfer would be fully accomplished when the hippocampus displays IA.
The tendency toward clustering of CA 1 evoked potentials should have important functional implica- tions. Since evoked potentials are the result of syn- chronous extracellular unitary currents, discrete var-
84
iations in the recorded voltage are probably due to the activation of groups of cells operating as functio- nal unities. The mechanism by which a group of cells discharges as a functional unit is unclear. Several characteristics of the hippocampus, however, such as electrotonic coupling T M , ephaptic phenome- na 23'39'43'44 o r local circuit interactions, i.e. recurrent
excitation 24'3t, may account for the synchronization
of a neuronal group, Recurrent excitation is probably of minor importance in evoking clustering because it requires a relatively long time to recruit neurons 24'3~. Although electrical field effects could contribute to the neuronal synchronization 23'39'43'44, their partici-
pation in the present phenomenon is as yet uncer- tain. Measurable transmembrane depolarizations (induced by field effect) occur whenever population spikes are elicited 39"43, however, field EPSPs, ew~ked
by subthreshold stimuli, also showed clustering (Fig. 7). In addition, clustering of field EPSPs, recorded at
somatic levels, occur without any population spike in the evoked potential (Fig. 8B). Nevertheless, the net result of electric field effects would be to reinforce and amplify any mechanism that triggers and syn- chronizes action potentials in a neuronal population, as Taylor and Dudek 43 have recently stressed. Elec-
trotonic coupling of neurons T M provides the hip- pocampus with an important requisite to display such a phenomenon because inputs to the coupled cells, even though smoothly graded, induce them to fire synchronously (see ref. 9, for review) inasmuch as all
of the coupled cells would receive these inputs. On the other hand, such a neuronal group becomes less excitable when an element of the group receives a hy- pothetical inhibitory action. Consequently, an input may or may not activate an aggregate of coupled cells, causing a discrete step in the recorded voltage. It is important to note that voltage intervals between
clusters were quite similar in most animals, indicating that a limited number of neuronal units are involved in each voltage step. The amount of neurons forming such functional aggregates is at present difficult to as- certain since the extracellular current generated by every neuron induces a different voltage at the
recording electrode, depending on the relative dis- tance between them. Data from experiments corre- lating the number of firing units and the PS size indi- cate that 4 neurons firing synchronously contribute about 500 ktV to the PS amplitude a. This finding to- gether with dye-coupling results in the hippocam- pus s'32"3a may indicate that each step in clustering is
generated by the synchronous activity of 3-5 neu- rons since intervals between PS clusters were 400-
600/~V (see Fig. 6). Clustering was more evident in trisynaptic than in
monosynaptic potentials (Fig. 7). Electrotonic cou- pling has been observed in the 3 subfields forming the trisynaptic pathway (i.e. dentate gyrus, CA 3 and CAI) 8'33'34'42. Therefore, connections among the
electrotonically coupled cell populations may explain this result. Finally, if the above interpretation is cor- rect, it may be hypothesized that electrotonic cou- pling is functionally predominant in the hippocam- pus. Although most neurons are reportedly dye-cou- pled in pairs 8'32'34, it should be remembered, as dis-
cussed by Andrew et al. s, that dye-coupled cells may actually underestimate the number of electrically
coupled neurons.
ACKNOWLEDGEMENTS
We wish to thank to Ms. C. Stoddard Delgado for reviewing the English text. O.H. is recipient of a fellowship from the Spanish F.1.S.S.S, (85/632).
REFERENCES
1 Abraham, W.C. and Bliss, T.V.P., An analysis of the in- crease in granule cell excitability accompanying habitua- tion in the dentate gyrus of the anesthetized rat, Brain Re- search, 331 (1985) 303-313.
2 Alger, B.E. and Teyler, T.J., Long-term and short-term plasticity in the CA 1, CA 3 and dentate regions of the rat hippocampal slice, Brain Research, 110 (1976) 463-480.
3 Andersen, P., Interhippocampal impulses. II. Apical den- dritic activation of CA t neurons, Acta Physiol. Scand,, 48 (1960) 463-480.
4 Andersen, P., Unit analysis of hippocampal population spikes, Exp. Brain Res., 13 (1971) 208-221.
5 Andersen, P., Bliss, T.V.P. and Skrede, K.K., Lamellar organization of hippocampal excitatory pathways, Exp. Brain Res., 13 (1971) 222-238.
6 Andersen, P., Holmqvist, B. and Voorhoeve, P.E.. Excita- tory synapses on hippocampal apical dendrites activated by entorhinal stimulation, Acta Physiol. Scand.. 66 (1966) 461-472.
7 Andersen, P. and Lomo, T., Control of hippocampal out- put by afferent volley frequency, Progr, Brain Res.. 27 (1967) 400-412.
8 Andrew, R.D., Taylor, C.P., Snow, R.W. and Dudek, F.E., Coupling in rat hippocampal slices: dye transfer be- tween CA I pyramidal cells, Brain Res. Bull., 8 (1982) 211-222.
9 Bennett, M.V.L., Electrical transmission: a functional analysis and comparison with chemical transmission. In E.R. Kandel (Ed.), Handbook of Physiology, Vol. 1, Sec- tion 1, Williams and Wilkins, Baltimore, MD, 1977, pp. 357-416.
10 Blackstad, T.W., On the termination of some afferents to the hippocampus and fascia dentata, Acta Anat. (Basel), 35 (1958) 202-214.
11 Buzs'aki, G., Grasty'an, E., Czopf, J., Kell6nyi, L. and Pro- haska, O., Changes in neuronal transmission in the rat hip- pocampus during behavior. Brain Research, 225 (1981) 235-247.
12 Creager, R.. Dunwiddie, T. and Lynch, G., Paired-pulse and frequency facilitation in the CA 1 region of the in vitro rat hippocampus, J. Physiol. (London), 299 (1981)) 409-424.
13 Delacour, J., Associative and non-associative changes in unit activity of the rat hippocampus, Brain Res. Bull., 8 (1982) 367-373.
14 Finch, D.M. and Babb, T.L., Inhibition in subicular and en- torhinal principal neurons in response to electrical stimula- tion of the fornix and hippocampus, Brain Research, 196 (1980) 89-98.
15 Fox, S.E. and Ranck, Jr. J.B., Electrophysiological charac- teristics of hippocampal complex-spike and theta cells, Exp. Brain Res., 41 ( 1981 ) 399-410.
16 Fuentes, J., Bufio, Jr. W. and Garcia-Austt, E., Simulation of postsynaptic activities in hippocampal cells during theta rhythm. Brain Res. Bull., 7 (1981) 157-162.
17 Fujita, Y., Synaptic activation of dentate granule cells and its effect upon pyramidal cells in rabbit. In Physiologie de l'ttippocampe, Coll. Int. C.N.R.S.. (Paris), 1962, pp. 47-69.
18 Gloor, P., Vera, C.L. and Sperti, L., Electrophysiological studies of hippocampal neurons. III. Responses of hippo- campal neurons to repetitive perforant path volleys, Elec- troenceph. Clin. Neurophysiol., 17 (1964) 353-370.
19 Harris, E.W., Lasher, S.S. and Steward, O., Analysis of the habituation changes in transmission in the temporoden- tate pathway of the rat, Brain Research, 162 (1979) 21-32.
20 Herreras, O., Soils, J.M. and Lerma, J., Abolition of CA I population spike by sensory stimulation, Exp. Brain Res., 61 (1986) 654-657.
21 Hjort-Simonsen, A. and Jeune, B., Origin and termination of the hippocampal perforant path in the rat studied by sil- ver impregnation, J. Comp. Neurol., 144 (1972) 215-232.
22 Jeantet, Y. and Jaffard, R., Relations quantitatives entre la densit~ spectrale de l'activit6 spontan~e et I'excitabilit~ des synapses commissurales du champ CA I de l'hippocampe dorsal chez la Souris 6veill~Se, C.R. Acad. Sci. Paris, t. 293 (1981) 545-548.
23 Jefferys, J.G.R., Influence of electric fields on the excit- ability of granule cells in guinea-pig hippocampal slice, J. Phystol. (London), 319 (1981) 143-152.
24 Lebovitz. R.M., Dichter, M. and Spencer. W.A., Recur- rent excitation in the CA 3 region of cat hippocampus, Int. J. Neurosci., 2 (1971) 99-108.
25 Lerma. J., Herreras. O., Mufioz, D. and Soils, J.M., Inter- actions between hippocampal penicillin spikes and theta rhythm, Electroenceph. Clin. Neurophysiol., 57 (1984)
85
532-540. 26 Leung, L.S., Behavior-dependent evoked potentials in the
rat hippocampal CA~ region of the rat. 1. Correlation with behavior and EEG, Brain Research, 198 (1980) 95-117.
27 Lomo, T., Patterns of activation in a monosynaptic cortical pathway: the perforant path input to the dentate area of the hippocampal formation, Exp. Brain Res., 12 (1971) 18-45.
28 Lomo, T., Potentiation of monosynaptic EPSPs in the per- forant path-dentate granule cell synapse, Exp. Brain Res., 12 (1971) 46-63.
29 Lopes da Silva, F.H., Wadman, W.J., Arnolds, D.E.A.T., Veeken, C. and Holsheimer, J., Hippocampus: behavior and modulation of local circuits. In F. Reinoso-Suarez and C. Ajmone-Marsan (Eds.), Cortical Integration, Raven New York, 1984, pp. 147-170.
30 Lorente de N6, R., Studies on the structure of the cerebral cortex. II. Continuation of the study of the Ammonic sys- tem, J. Psychol. Neurol., 46 (1934) 113- 177.
31 MacVicar, B.A. and Dudek, F.E., Local synaptic circuits in rat hippocampus: interactions between pyramidal cells, Brain Research, 184 (1980) 220-223.
32 MacVicar, B.A. and Dudek, F.E., Dye-coupling between CA 3 pyramidal cells in slices of rat hippocampus, Brain Re- search, 196 (19811) 494-499.
33 MacVicar, B.A. and Dudek, F.E., Electrotonic coupling between pyramidal cells: a direct demonstration in rat hip- pocampal slices, Science, 213 (1981) 782 785.
34 MacVicar, B.A. and Dudek, F.E., Elcctrotonic coupling between granule cells of rat dentate gyrus: physiological and anatomical evidence, J. Neurophysiol.. 47 (1982) 579-592.
35 Mink, W.D., Best, P.J. and Olds, J., Neurons in paradoxi- cal sleep and motivated behavior, Science, 158 (1967) 1335-1337.
36 Racine, R.J. and Milgram, N.W., Short-term potentiation phenomena in the rat limbic forebrain, Brain Research, 260 (1983) 201-216.
37 Ram6n y Cajal, S., Histologie du Systi'me Nerveuse de l'Homme et des VertebrOs, Vol. 1I, Maloine, Paris, 1911.
38 Ranck, Jr. J.B., Studies on single neurons in dorsal hippo- campal formation and septum of unrestrained rats. I. Be- havioral correlates and firing repertoires, Exp. Neurol., 41 (1973) 461-531.
39 Richardson, T.L., Turner, R.W. and Miller, J.J., Extracel- lular fields influence transmembrane potentials and syn- chronization of hippocampal neuronal activity, Brain Re- search, 294 (1984) 255-262.
40 Steward, O., White. W.F. and Cotman, C.W., Potentiation of the excitatory synaptic action of commissural, associatio- nal and entorhinal afferents to dentate granule cells, Brain Research, 134 (1977) 551-560.
41 Suzuki, S.S. and Smith, G.K., Single-cell activity and syn- chronous bursting in the rat hippocampus during waking behavior and sleep, Exp. Neurol., 89 (1985) 71-89.
42 Taylor, C.P. and Dudek, F.E., A physiological test for electrotonic coupling between CA t pyramidal cells in rat hippocampal slices, Brain Research, 235 (1982) 351-357.
43 Taylor, C.P. and Dudek, F.E., Excitation of hippocampal pyramidal cells by an electrical field effect. J. Neurophys- iol., 52 (1984) 126-142.
44 Taylor, C.P., Krnjevic, K. and Ropert, N., Facilitation of hippocampal CA 3 pyramidal cell firing by electrical fields generated antidromically, Neuroscience, 11 (1984) 101-109.

86
45 Teyler, T.J. and Alger, B.E., Monosynaptic habituation in the vertebrate forebrain: the dentate gyrus examined in vit- ro, Brain Research, t 15 (1976) 413-425.
46 Turner, R.W, and Miller, J.J., Effects of extracellular cal- cium on low frequency induced potentiation and habitua- tion in the in vitro hippocampal slice preparation, ('an. J. Physiol., 60 (1982) 266-275.
47 Turner, R.W., Richardson, T.L. and Miller, J.J., Ephaptic interactions contribute to paired pulse and frequency po-
tentiation of hippocampal field potentials, Exp. Brain Res., 54 (1984) 467-570.
48 Winson, J., Influence of raphe nuclei on neuronal transmis- sion from perforant pathway through dentate gyrus, J? Neu- rophysiol., 44 (1980) 937-950.
49 Winson, J. and Abzug, C., Neuronal transmission through hippocampal pathways dependent on behavior. J. Neuro- physiol.. 41 (1978) 716-732.


