Embed Size (px)
Citation preview
Graduate Theses, Dissertations, and Problem Reports
2008
Characterization of nickel-substituted hexaaluminate catalysts Characterization of nickel-substituted hexaaluminate catalysts
Jason C. Hissam West Virginia University
Follow this and additional works at: https://researchrepository.wvu.edu/etd
Recommended Citation Recommended Citation Hissam, Jason C., "Characterization of nickel-substituted hexaaluminate catalysts" (2008). Graduate Theses, Dissertations, and Problem Reports. 1977. https://researchrepository.wvu.edu/etd/1977
This Thesis is protected by copyright and/or related rights. It has been brought to you by the The Research Repository @ WVU with permission from the rights-holder(s). You are free to use this Thesis in any way that is permitted by the copyright and related rights legislation that applies to your use. For other uses you must obtain permission from the rights-holder(s) directly, unless additional rights are indicated by a Creative Commons license in the record and/ or on the work itself. This Thesis has been accepted for inclusion in WVU Graduate Theses, Dissertations, and Problem Reports collection by an authorized administrator of The Research Repository @ WVU. For more information, please contact [email protected].
CHARACTERIZATION OF NICKEL-SUBSTITUTED
HEXAALUMINATE CATALYSTS
by
Jason C. Hissam
Thesis submitted to the College of Engineering and Mineral Resources
at West Virginia University
in partial fulfillment of the requirements
for the degree of
Master of Science
in
Chemical Engineering
Submitted for the approval of:
Edwin L. Kugler, Ph.D., Chair
Dady B. Dadyburjor, Ph.D.
John W. Zondlo, Ph.D.
Department of Chemical Engineering
Morgantown, West Virginia
2008
Keywords: hexaaluminate, catalyst, Unit-cell refinement (UCR), X-ray diffraction
(XRD), Fourier Transform Infrared (FT-IR) spectroscopy, nickel (Ni)
ABSTRACT
Characterization of Nickel-substituted Hexaaluminate Catalysts
Jason C. Hissam
A characterization study was performed on two series of hexaaluminate catalysts
of the form MI(MII)xAl12-xO19-δ; where MI refers to the mirror cation (MI = Ba, Sr, La) and
MII to the cation (MII = Ni) substituted into the lattice. The first series was synthesized
for comparison of different mirror cations while holding the Ni substitution level constant
at x = 0.4. The second series was developed with the same mirror cation of Ba, but
varied x, the level of Ni substitution. Experiments were conducted by means of the
following characterization techniques: scanning electron microscopy (SEM), unit-cell
refinement (UCR), in situ temperature-programmed reduction and X-ray diffraction
(TPR-XRD) and Fourier-transform infrared (FT-IR) spectroscopy.
UCR showed that Ni has been incorporated into the hexaaluminate lattice during
synthesis. Increasing the Ni substitution level results in an increase in the a and b
parameters and a decrease in the c direction. The overall volume of the unit-cell was
found to increase with higher Ni substitution level. In situ TPR-XRD studies with La and
Sr hexaaluminates have shown that Ni in the lattice upon reduction with H2 turns into
metallic Ni0 on the hexaaluminate surface of the crystal. Experiments with Ba
hexaaluminates were mostly inconclusive due to the hexaaluminate diffraction pattern
having intense peaks in the same positions as Ni0 metal so that the hexaaluminate pattern
masks the appearance of Ni0 metal peaks. Fourier-transform infrared spectroscopy of the
absorption of CO on reduced catalysts was performed to distinguish between Ni+2 ions
and Ni0 metal species on the hexaaluminate surfaces. However, the analysis of the FT-IR
spectra provided no evidence for CO adsorbed on either Ni+2 ions or metallic Ni0 on the
hexaaluminate surface. During exposure of CO, there was the appearance of multiple
peaks that indicate the presence of gas phase CO and CO2 molecules as well as the
formation of carboxylates and carbonates. Upon evacuation of the experimental
chamber, the only remaining peaks belonged to those of the appropriate mirror cation
carbonate.
iii
Acknowledgements
I would like to express my eternal gratitude toward my advisor, Dr. Kugler, for
his continued help, guidance and advice throughout the duration of this project. I would
also like to thank Dr. Dadyburjor and Dr. Zondlo for their advice and supporting roles as
members of my committee. I would also like to thank Jim Hall, Linda Rogers and Bonita
Helmick for their various levels of assistance throughout my time in the West Virginia
University Department of Chemical Engineering.
I am grateful to the U.S. Department of Energy for their financial support of this
project under DOE prime contract DE-AC26-04NT41817.606.01.06. I would like to lay
emphasis on thanks to Dr. Todd Gardner for his role of synthesizing the catalysts and
performing initial studies on them. I would also like to thank Daniel Haynes and other
researchers at the National Energy Technology Laboratory for their advice and assistance
in running experiments at NETL. Thanks are to be given to Dr. Jonathan Hanson at
Brookhaven National Laboratory for his assistance in performing X-ray diffraction
experiments at BNL.
I would like to thank my fellow graduate students in the catalysis and reaction
engineering group at WVU; Ashish Bambal, Mayuri Mukka, Ramanjaneyulu Katta and
Joshua Welshans, for their friendship, support, ideas and assistance in fabricating and
running experiments in the laboratory. I am also grateful to Adam Finniss, Steve
Markovich, Christopher Yurchick, Lloyd Ford and the rest of the graduate students for
making my time as a graduate student enjoyable.
Special thanks are to be directed to my family; Dad, Mom, Cheryl, Lisa and the
others too numerous to list, as well as my dear friends, Abha Saddawi and Matthew
Perkowski, for encouraging me to reach the next level and eagerly giving me the
occasional boost when it was desperately needed.
iv
Table of Contents Abstract ............................................................................................................................... ii Acknowledgements ............................................................................................................ iii Table of Figures .................................................................................................................. v Table of Tables ................................................................................................................. vii Chapter 1: Introduction ....................................................................................................... 1 Chapter 2: Literature Review .............................................................................................. 4
2.1 Hexaaluminate Structure and Properties ................................................................... 4 2.2 Previous Work on Hexaaluminates ........................................................................... 5 2.3 Characterization Techniques ................................................................................... 15
Chapter 3: Materials and Methodology ............................................................................ 21 3.1 Scanning Electron Microscopy (SEM) ................................................................... 21 3.2 X-ray Diffraction (XRD) ........................................................................................ 21
3.2.1 Unit-cell Refinement (UCR) ............................................................................ 22 3.2.2 In situ Temperature-programmed Reduction and X-ray Diffraction (TPR-XRD) ......................................................................................................................... 23
3.3 In Situ Fourier-transform Infrared (FT-IR) ............................................................. 24 3.4 Safety ...................................................................................................................... 30
Chapter 4: Results and Discussions .................................................................................. 31 4.1 SEM ........................................................................................................................ 31 4.2 XRD ........................................................................................................................ 41
4.2.1 UCR ................................................................................................................. 41 4.2.2 In situ TPR-XRD ............................................................................................. 52
4.3 In Situ FT-IR ........................................................................................................... 60 Chapter 5: Conclusions and Recommendations ............................................................... 71 References ......................................................................................................................... 74 Appendix ........................................................................................................................... 77
A.1 Procedure for FT-IR Experiments.......................................................................... 77
v
Table of Figures Figure 1: Ideal unit-cell structures of hexaaluminates (7) .................................................. 4 Figure 2: H2 consumption curves illustrating the reduction temperatures of ................... 12 Figure 3: Temperature programmed oxidation of CH4 over quartz (21) .......................... 13 Figure 4: Temperature programmed oxidation of CH4 over BaNi0.8Al11.2O19.6 (21) ........ 14 Figure 5: Schematic representation of the geometry of the X7B beamline experimental
setup (27) .......................................................................................................... 18 Figure 6: Experimental cell used at beamline X7B .......................................................... 22 Figure 7: Thermo Nicolet Nexus 670 infrared spectrometer setup ................................... 25 Figure 8: DRIFTS dual environmental chamber for smart collector ................................ 26 Figure 9: Process flow diagram of setup of the gas feed inlet of dual environmental
chamber cell ..................................................................................................... 28 Figure 10: Setup of the gas feed inlet of dual environmental chamber cell ..................... 29 Figure 11: SEM image of calcined LaNi0.4Al11.6O19 [35] ................................................. 32 Figure 12: SEM image of calcined SrNi0.4Al11.6O19 [52].................................................. 33 Figure 13: SEM image of calcined BaNi0.4Al11.6O18.8 [75] ............................................... 34 Figure 14: SEM image of calcined BaNi0.8Al11.2O18.6 [118B] .......................................... 35 Figure 15: SEM image of calcined BaNiAl11O18.5 [119B] ............................................... 36 Figure 16: SEM image of calcined BaAl12O19 [38C] ....................................................... 37 Figure 17: SEM image of blue particle of BaNiAl11O18.5 [119B-blue] after CH4 POx..... 39 Figure 18: SEM image of gray particle of BaNiAl11O18.5 [119B-gray] after CH4 POx .... 40 Figure 19: X-ray diffraction pattern of fresh LaNi0.4Al11.6O19 [35] .................................. 42 Figure 20: X-ray diffraction pattern of fresh SrNi0.4Al11.6O19 [52] ................................... 42 Figure 21: X-ray diffraction pattern of fresh BaNi0.4Al11.6O18.8 [75] ................................ 43 Figure 22: a and b lattice parameters of fresh Ba Ni-substituted hexaaluminates ............ 45 Figure 23: c lattice parameters of fresh Ba Ni-substituted hexaaluminates ...................... 46 Figure 24: Cell volumes of fresh Ni-substituted Ba hexaaluminates ............................... 46 Figure 25: a and b lattice parameters of used gray Ni-substituted Ba hexaaluminates .... 48 Figure 26: c lattice parameters of used gray Ni-substituted Ba hexaaluminates .............. 48 Figure 27: Cell volumes of used gray Ni-substituted Ba hexaaluminates ........................ 49 Figure 28: Compilation of a and b unit-cell refinement data of both fresh and used
samples ............................................................................................................ 50 Figure 29: Compilation of c unit-cell refinement data of both fresh and used samples ... 50 Figure 30: Compilation of unit-cell refinement of cell volume data of both fresh
and used samples............................................................................................. 51 Figure 31: TPR-XRD of LaNi0.4Al11.6O19 [35] from 25-45° in 2θ ................................... 53
vi
Figure 32: Detail of TPR-XRD of LaNi0.4Al11.6O19 [35] from 25-35° in 2θ .................... 54 Figure 33: Detail of TPR-XRD of LaNi0.4Al11.6O19 [35] from 35-45° in 2θ .................... 55 Figure 34: TPR-XRD of SrNi0.4Al11.6O19 [52] from 25-45° in 2θ .................................... 56 Figure 35: Detail of TPR-XRD of SrNi0.4Al11.6O19 [52] from 25-35° in 2θ ..................... 56 Figure 36: Detail of TPR-XRD of SrNi0.4Al11.6O19 [52] from 35-45° in 2θ ..................... 57 Figure 37: TPR-XRD of BaNi0.4Al11.6O18.8 [75] from 25-45° in 2θ ................................. 58 Figure 38: TPR-XRD of BaNiAl11O18.5 [119B] from 25-45° in 2θ .................................. 59 Figure 39: Detail of TPR-XRD of BaNiAl11O18.5 [119B] from 25-35° in 2θ ................... 59 Figure 40: FT-IR spectra of LaNi0.4Al11.6O19 [35] after CO exposure .............................. 63 Figure 41: FT-IR spectra of SrNi0.4Al11.6O19 [52] after CO exposure ............................... 64 Figure 42: FT-IR spectra of BaNi0.4Al11.6O18.8 [75] after CO exposure ........................... 65 Figure 43: FT-IR spectra of BaNi0.8Al11.2O18.6 [118B] after CO exposure ....................... 68 Figure 44: FT-IR spectra of BaAl12O19 [38C] after CO exposure .................................... 69
vii
Table of Tables
Table 1: Surface Area, Dispersion and Bulk Surface Ni Concentration of Ni-substituted Hexaaluminate Catalysts (18) .............................................................................. 8
Table 2: Ni-Substituted Hexaaluminates Synthesis Conditions ....................................... 11 Table 3: ICDD Crystal Lattice Dimensions of Baseline Patterns ..................................... 41 Table 4: Crystal Lattice Parameters of Fresh Ni-Substituted La, Sr and Ba
Hexaaluminates .................................................................................................. 44 Table 5: Crystal Lattice Parameters of Fresh Ni-substituted Ba Hexaaluminates ............ 45 Table 6: Crystal Lattice Parameters of Gray Ni-substituted Ba Hexaaluminates ............. 47 Table 7: Positions of Ni0 Metal Peaks at Wavelength of 0.9225 Å .................................. 52 Table 8: Results of CO Pulse Chemisorptions of Ni0 Metal in La, Sr and Ba Ni-
substituted Hexaaluminates ............................................................................... 60 Table 9: Position of Infrared Bands for CO on Adsorbed Ni Species .............................. 61 Table 10: Position of Infrared Bands for CO on Adsorbed Non-Ni Species .................... 61
1
Chapter 1: Introduction
Energy conservation and pollution prevention are of the utmost importance in
order to ensure the stability of future energy requirements of the United States of
America, as well as the rest of the world. One significant source of excessive fuel
consumption and emissions is a result of the idling of heavy-duty diesel engines,
particularly in long haul trucks. In order to confront this problem, the Environmental
Protection Agency (EPA) established the SmartWay Transport Partnership, a
collaborative program between the EPA and the freight industry with the goals of
increasing energy efficiency and reducing air pollution and greenhouse gases (1).
Long-haul truck drivers idle their engines during periods of rest to provide heat or
air-conditioning to the cab, to prevent the engine block from freezing in cold weather,
and to maintain battery voltage for the use of electrical appliances both inside and outside
of the truck cab. Idling engines operate at low levels of efficiency and lead to excess fuel
consumption, emissions and wear and tear on the engine. Detailed data on idling is not
available, but industry sources have provided rough estimates of its frequency (1). Truck
driver surveys have indicated periods of rest in the range of six to eight hours per day,
operating over 300 days per year. For the 500,000 to 1,000,000 trucks matching this
description, it is estimated that 30-40% of the total engine operating time is due to idling.
Over 960 million gallons of diesel fuel are consumed through long-duration truck idling
annually. The resulting emissions are an estimated 11 million tons of carbon dioxide,
180,000 tons of nitrogen oxides, and 5,000 tons of particulate matter.
There are several alternatives to idling that have been investigated and each
method has strengths and weaknesses (2; 3). The most feasible and cost-effective
technology to reduce diesel fuel consumption is to mount an auxiliary power unit (APU)
on the truck cab (2). While the main engine is disengaged, the APU supplies heating and
air-conditioning of the sleeper cab, heat for engine startup and power for electrical
appliances.
According to Stodolsky and others (2), conventional APUs consist of a small
internal combustion engine equipped with a generator to provide energy for heating and
cooling of the cab and powering appliances (2). For air-conditioning, the APU can be a
power source for the existing air-conditioning system of the truck or an additional
2
electrically powered air-conditioning unit can be installed in the sleeper area.
Comparison studies conducted at the Aberdeen Test Center and the Oak Ridge National
Laboratory indicate that the installation of an APU gives fuel savings (and CO2
reduction) on the order of 60-85%, 50-97% reductions in NOx, CO and hydrocarbons and
particulate matter ranged from a mass increase of 20% to reduction of 95% depending on
the age and model of the truck (2; 4). Although current APUs have been proven to
provide the solutions the EPA and industry are seeking, the units are heavy, noisy, costly
and require an external supply of water for cooling purposes.
A promising alternative to the conventional APU’s is the diesel-powered solid
oxide fuel cell (SOFC). The SOFC-based APU can combine the functions of existing
APU technology with the advantages of fuel cells, such as fuel flexibility, low or no
maintenance, high efficiency and silent operation. Jain et al. (3) describe a typical
SOFC-based APU as having a single air compressor that provides air for reformer
operation and cathode requirements. The anode recycle stream and water generated from
unreacted anode tail-gas captured in a tail-gas burner, supply water for the reformer and
decrease the need for an on-board supply of water.
Complementary to the SmartWay Transport Partnership of EPA mentioned
earlier, the U.S. Department of Energy (DOE) has sponsored the Solid State Energy
Conversion Alliance (SECA), forming partnerships between the U.S. government,
industry, universities, and other research organizations in order to promote the
development of environmentally friendly SOFC for a variety of energy needs (5). As
part of the SECA program, the National Energy Technology Laboratory (NETL) of the
DOE is working on the development of a new class of structural oxide catalysts based on
hexaaluminate architecture for use with diesel-fueled APUs (6). The hexaaluminate
catalysts are of the form MI(MII)xAl12-xO19-δ, where MI refers to the cation (MI = Ba, Sr,
La) and MII to the cation (MII = Ni) substituted into the lattice. The variable x refers to
the substitution level and δ is the relationship between x and the specific molecular
formula. Two series of hexaaluminate catalysts were prepared at the Morgantown, WV
site of NETL. The first series was synthesized for comparison of different elemental
mirror cations while holding the Ni substitution level constant at x = 0.4. The second
series was created with the same mirror cation of Ba, but varies x, the level of Ni
substitution.
3
The goal of this project is to obtain a fundamental understanding of the nature of
active sites present in hexaaluminate catalysts. There are two primary objectives under
consideration for this project. The first objective is to identify the phase of catalytically
active Ni that has been substituted into the lattice of hexaaluminate catalysts. The second
objective was to determine the location of Ni species in the hexaaluminate lattice during
synthesis, reduction and reaction. The aforementioned investigations have demonstrated
that the reducibility of Ni-substituted hexaaluminates depends strongly on the properties
of Ni, and is also affected by mirror cation type, ionic radius and valence level of the
cation. Although the work performed at NETL and other institutions has resulted in a
wealth of information, there are still many questions to be answered about the structure of
Ni-substituted hexaaluminates and the behavior of active Ni. How does varying the Ni
substitution level affect the hexaaluminate lattice of the Ba series of catalysts? What is
the state of the Ni before and after reduction? Upon reduction, is the Ni exchanged
within the hexaaluminate reduced to Ni0 metal or is it in the form of an oxygen-deficient
mixed-metal oxide? If Ni ions are present, what is the average oxidation state?
This project is collaboration between NETL, West Virginia University (WVU)
and Louisiana State University (LSU). Catalyst synthesis, reaction studies and initial
testing have been performed at NETL. Characterization techniques will be conducted at
WVU by means of the following methods: scanning electron microscopy (SEM), unit-
cell refinement (UCR) and Fourier-transform infrared (FT-IR) spectroscopy. Extended
X-ray absorption fine-structure (EXAFS) and X-ray absorption near edge spectroscopy
(XANES) of the samples will be simultaneously conducted by researchers at LSU.
The results from the characterization study will lead to more tailored testing and
operating conditions to take advantage of the active sites of the hexaaluminate catalysts.
After characterization, researchers at NETL will utilize the information with ongoing
tests in SOFC-based APU to assess their capability under real-time reaction conditions.
It is hoped that Ni-substituted hexaaluminates will be an inexpensive, long-lasting option
for reforming catalysts in SOFC-based APU. This will result in the conservation of
diesel fuel and a reduction in operating costs and the ensuing emission of pollutants from
fuel combustion.
4
Chapter 2: Literature Review
2.1 Hexaaluminate Structure and Properties
Hexaaluminates have been the subject of interest of a variety of research areas
due to their ability to retain moderate surface areas up to 1400°C (7; 8), and to resist
sintering, phase transformation and carbon deposition (9; 10). It is believed that these
properties originate from the hexaaluminate crystal structure (9; 11). Hexaaluminates are
hexagonal poly-aluminates having a lattice structure related to either magnetoplumbite or
β-alumina and both forms are characterized by hexagonal symmetry of space group
P63/mmc (12). Hexaaluminates are of the general form MI(MII)xAl12-xO19-δ, where MI is
the cation (MI = Ba, Sr, La) and MII refers to the metal dopant (MII = Ni) substituted for
Al within the lattice (6). The variable x refers to the substitution level and δ is the
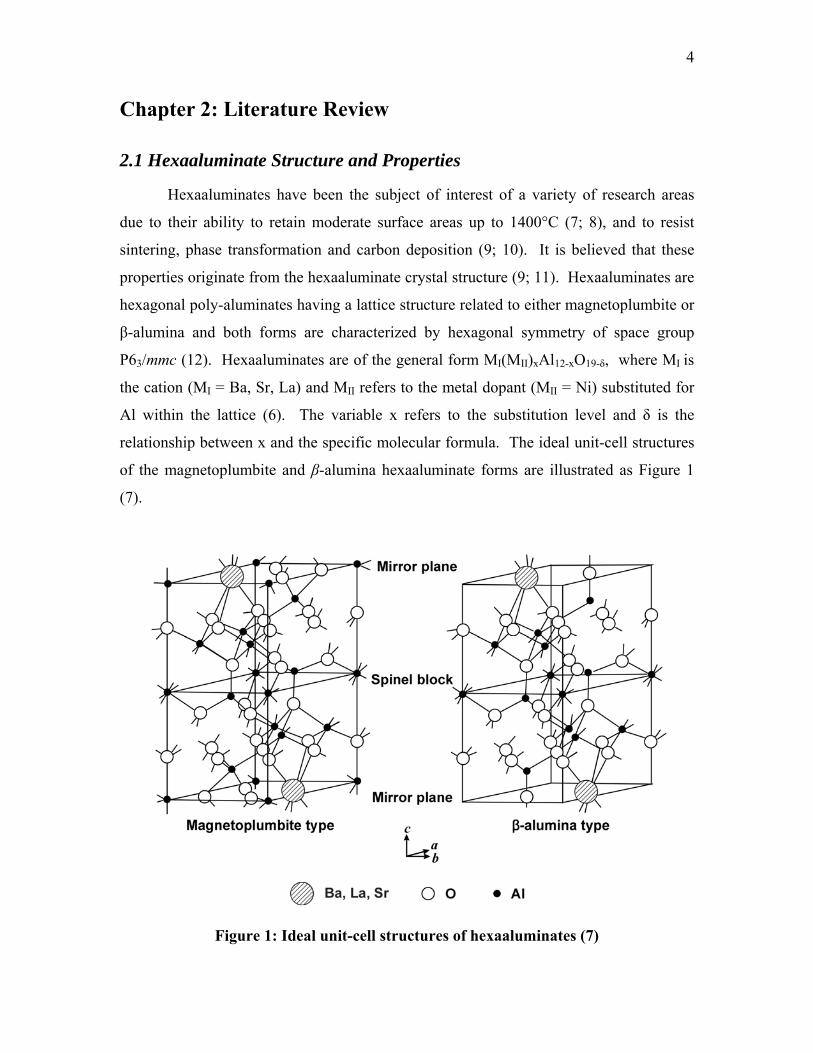
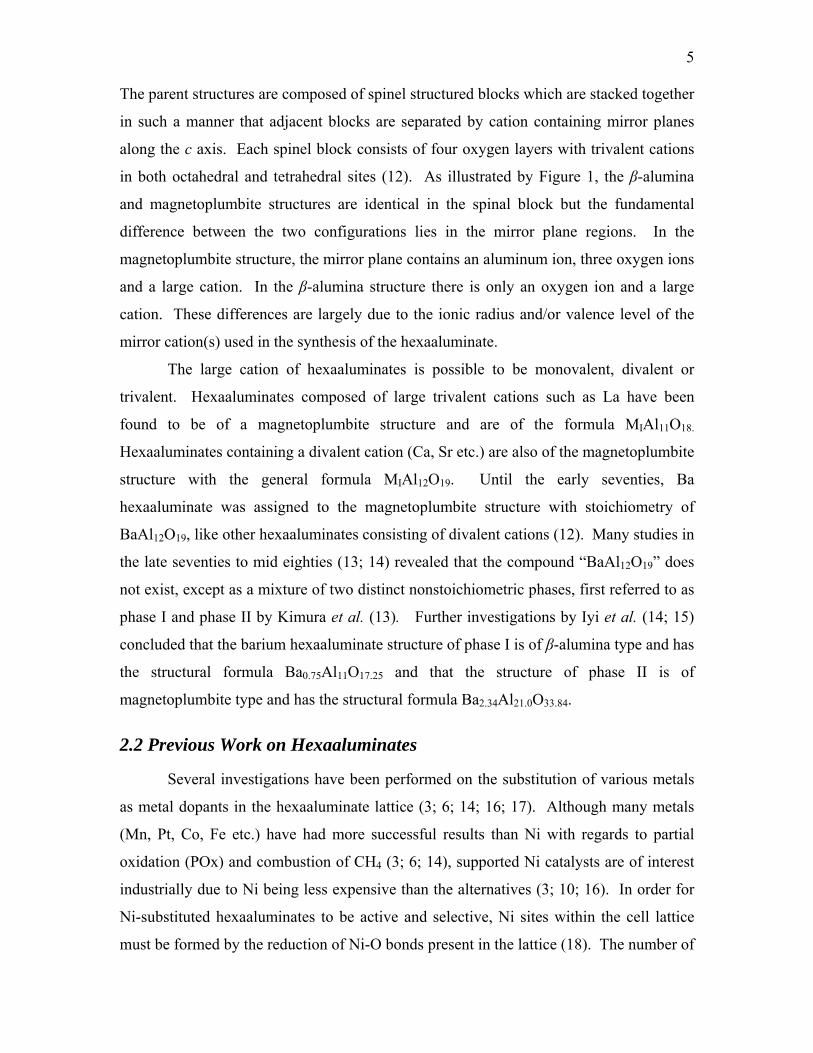
relationship between x and the specific molecular formula. The ideal unit-cell structures
of the magnetoplumbite and β-alumina hexaaluminate forms are illustrated as Figure 1
(7).
Figure 1: Ideal unit-cell structures of hexaaluminates (7)
5
The parent structures are composed of spinel structured blocks which are stacked together
in such a manner that adjacent blocks are separated by cation containing mirror planes
along the c axis. Each spinel block consists of four oxygen layers with trivalent cations
in both octahedral and tetrahedral sites (12). As illustrated by Figure 1, the β-alumina
and magnetoplumbite structures are identical in the spinal block but the fundamental
difference between the two configurations lies in the mirror plane regions. In the
magnetoplumbite structure, the mirror plane contains an aluminum ion, three oxygen ions
and a large cation. In the β-alumina structure there is only an oxygen ion and a large
cation. These differences are largely due to the ionic radius and/or valence level of the
mirror cation(s) used in the synthesis of the hexaaluminate.
The large cation of hexaaluminates is possible to be monovalent, divalent or
trivalent. Hexaaluminates composed of large trivalent cations such as La have been
found to be of a magnetoplumbite structure and are of the formula MIAl11O18.
Hexaaluminates containing a divalent cation (Ca, Sr etc.) are also of the magnetoplumbite
structure with the general formula MIAl12O19. Until the early seventies, Ba
hexaaluminate was assigned to the magnetoplumbite structure with stoichiometry of
BaAl12O19, like other hexaaluminates consisting of divalent cations (12). Many studies in
the late seventies to mid eighties (13; 14) revealed that the compound “BaAl12O19” does
not exist, except as a mixture of two distinct nonstoichiometric phases, first referred to as
phase I and phase II by Kimura et al. (13). Further investigations by Iyi et al. (14; 15)
concluded that the barium hexaaluminate structure of phase I is of β-alumina type and has
the structural formula Ba0.75Al11O17.25 and that the structure of phase II is of
magnetoplumbite type and has the structural formula Ba2.34Al21.0O33.84.
2.2 Previous Work on Hexaaluminates
Several investigations have been performed on the substitution of various metals
as metal dopants in the hexaaluminate lattice (3; 6; 14; 16; 17). Although many metals
(Mn, Pt, Co, Fe etc.) have had more successful results than Ni with regards to partial
oxidation (POx) and combustion of CH4 (3; 6; 14), supported Ni catalysts are of interest
industrially due to Ni being less expensive than the alternatives (3; 10; 16). In order for
Ni-substituted hexaaluminates to be active and selective, Ni sites within the cell lattice
must be formed by the reduction of Ni-O bonds present in the lattice (18). The number of
6
Ni sites that are reducible and their coordinative environment are properties that need to
be evaluated.
Machida and coworkers (11) used a variety of experimental techniques in an
investigation on a series of cation-substituted Ba hexaaluminates, BaMIIAl11O19-δ (MII =
Cr, Mn, Fe, Co and Ni). The crystal structure of a hexaaluminate is retained for
BaMIIAl11O19-δ in which one Al site per every double spinel block is replaced by an MII
ion. In situ thermogravimetry (TG) measurements of cation-substituted Ba
hexaaluminates concluded that the average oxidation state of nickel was determined to be
divalent. Transmission electron microscopy (TEM) observation indicated that crystal
growth along the c axis is strongly suppressed compared to that along the directions
normal to the c axis (a, b). Machida et al. (11) have also reported the same crystal
morphology in previous investigations on BaAl12O19 (19) and found the crystal growth
patterns are a common feature among hexaaluminate-related compounds. The
investigators conclude that the crystal growth suppression along the c axis is the reason
why hexaaluminates are able to retain a large surface area after calcination at 1300°C and
the reduction/oxidation behavior of the transition elements in the crystal lattice influence
the catalytic activity of the metal doped substituted hexaaluminate (11).
Xu and coworkers (10) designed a series of Ni-substituted La hexaaluminate
catalysts for CO2 reforming of methane to synthesis gas and used the characterization
methods of X-ray diffraction (XRD), X-ray photoelectron spectroscopy (XPS) and
temperature-programmed reduction (TPR). X-ray diffraction and TPR results indicated
that the basic La hexaaluminate structure showed very little change when exposed to high
temperatures and that TPR plots showed the appearance of a Ni0 phase after reduction
that indicated a large fraction of metallic Ni0 had separated from the hexaaluminate phase
to form an individual metallic phase. The reduction profiles showed higher intensities of
Ni0 peaks with increased Ni substitution. The investigators suggested that a large fraction
of metallic Ni0 is separated from Ni2+ ions in the hexaaluminate lattice to form an
individual metallic phase at 1100°C and that the metallic Ni0 is the active component for
reaction.
Another notable observation by Xu et al. (10) is that Ni-substitution in the range
of 0 < x ≤ 1 results in the formation of catalysts with hexaaluminate structure of
LaNixAl12-xO19-δ. X-ray photoelectron spectroscopy results indicated that less than 1% of
7
the Ni lies on the surface of the hexaaluminate lattice and the majority remains in the
catalyst bulk. Considering the limitations on the amount of Ni that may be substituted in
the lattice and remain hexaaluminate form, it is not expected that any Ni-substituted
hexaaluminate catalysts will have a large availability of Ni sites on the surface for
reaction.
Xu and others (9) also studied the CO2 reforming of methane to synthesis gas over
a series of Ca, Sr, Ba and La Ni-substituted catalysts and utilized the same
characterization techniques as previously mentioned: XRD, XPS and TPR. Results of
this investigation confirm that in each mirror-cation-type hexaaluminate, the Ni ions in
the lattice are stable, have only oxidation state Ni2+ and only a part of these ions are
reduced to Ni0 at 1100°C. When alkaline earth metals are doped, the reduction peak
temperature decreases with an increase in the ionic radius of the mirror cation. Overall,
the Ni-substituted La hexaaluminate gives the lowest reduction temperature. It was
observed that the catalytic activity is directly proportional to the ionic radius of the mirror
cation. The activity sequence of the reduced hexaaluminates followed the order of
LaNiAl11O19-δ > BaNiAl11O19-δ > SrNiAl11O19-δ > CaNiAl11O19-δ.
Chu and company (16; 20) studied the POx of CH4 to syngas over a series of Ni-
modified Ba hexaaluminate catalysts. Characterization techniques of XRD, FT-IR, XPS
and TPR were conducted on catalysts with the form of BaNixAl12-xO19-δ, where x = 0.3,
0.6, 0.9 and 1.0. Neither pure NiO nor BaAl12O19 showed satisfactory activity for the
methane oxidation reaction, but BaNixAl12-xO19-δ catalysts showed high levels of activity
for the same reaction conditions. The results of XPS indicated that after 100 h of testing,
the Ni/Al ratio was nearly unchanged from the level in the fresh catalyst and suffered low
levels of carbon deposition (16). It was found that catalytic activity and CO selectivity
increased with increasing levels of nickel substitution, but only when the weight of Ni is
lower than 2% (20). There was little to no change when more than 2% was present. This
behavior was attributed to decomposition of the support structure by too much of metal
dopant dispersed in the lattice or due to crystallization of the active species.
In 2007 at the NETL, Gardner et al. (18) conducted reforming studies on Ni-
substituted hexaaluminate catalysts, MINi0.4Al11.6O19-δ (MI = La, Sr and Ba), to reform
liquid hydrocarbon fuels into H2-rich synthesis gas for fuel cell applications.
Experiments with the POx of n-tetradecane, with and without dibenzothiophene, were
8
conducted to test the stability and sulfur poisoning resistance of the Ni-substituted
hexaaluminates and the results were correlated to the Ni surface concentration and the Ni
dispersion induced by the mirror cation. The divalent catalysts, SrNi0.4Al11.6O19-δ and
BaNi0.4Al11.6O19-δ, showed stable performance with reaction of n-tetradecane, whereas
LaNi0.4Al11.6O19-δ exhibited declining activity and indicated C deposition on the surface
which blocked active Ni sites. The results suggested that the different mirror cations
influenced the coordination of Ni sites within the lattice and adsorption of hydrocarbons
to the surface of the catalysts.
The catalysts were examined for the formation of metallic Ni0 after undergoing n-
tetradecane POx. The formation of metallic Ni0 peaks was observed in both
LaNi0.4Al11.6O19-δ and SrNi0.4Al11.6O19-δ indicating that some of the Ni+2 initially present
within the hexaaluminate lattice was reduced and separated to form an individual metallic
phase. There was no discernable evidence of formation of Ni peaks in BaNi0.4Al11.6O19-δ;
however this was attributed to peak overlap between the Ba hexaaluminate phase and the
metallic Ni0 phase. X-ray photoelectron spectroscopy and H2 pulse chemisorptions
techniques were utilized to determine the concentration of Ni at the surface of the catalyst
and resulted in the order of: LaNi0.4Al11.6O19-δ > SrNi0.4Al11.6O19-δ > BaNi0.4Al11.6O19-δ.
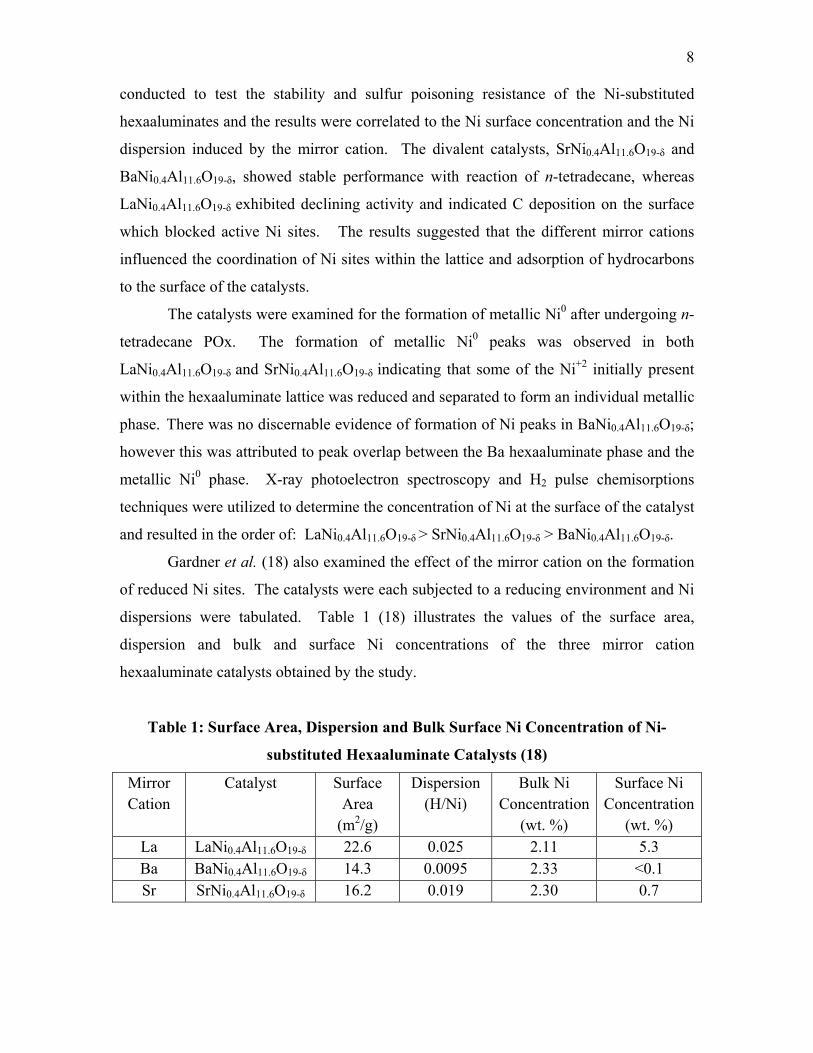
Gardner et al. (18) also examined the effect of the mirror cation on the formation
of reduced Ni sites. The catalysts were each subjected to a reducing environment and Ni
dispersions were tabulated. Table 1 (18) illustrates the values of the surface area,
dispersion and bulk and surface Ni concentrations of the three mirror cation
hexaaluminate catalysts obtained by the study.
Table 1: Surface Area, Dispersion and Bulk Surface Ni Concentration of Ni-
substituted Hexaaluminate Catalysts (18)
Mirror Cation
Catalyst Surface Area
(m2/g)
Dispersion (H/Ni)
Bulk Ni Concentration
(wt. %)
Surface Ni Concentration
(wt. %) La LaNi0.4Al11.6O19-δ 22.6 0.025 2.11 5.3 Ba BaNi0.4Al11.6O19-δ 14.3 0.0095 2.33 <0.1 Sr SrNi0.4Al11.6O19-δ 16.2 0.019 2.30 0.7
9
The Ni dispersions were determined to follow the same order as the Ni concentration at
the surface: LaNi0.4Al11.6O19-δ > SrNi0.4Al11.6O19-δ > BaNi0.4Al11.6O19-δ. Due to the Ni
dispersions for all three catalyst types being less than 3%, the results indicate that most of
the Ni remained as Ni-O within the lattice, leading the investigators to observe that only a
fraction of the Ni sites are reduced and responsible for catalytic activity (18). However,
the low dispersions may also indicate that the metal particles are large and only a portion
lies on the catalyst surface.
Gardner (6) further investigated various levels of Co, Fe and Ni-substituted La
hexaaluminate catalysts, in addition to the Ni-substituted Sr and Ba catalyst series
previously mentioned. Hydrogen consumption measurements during TPR of the
catalysts suggest that the mirror cation has a large effect on the reduction temperature,
with reduction peak temperatures of 982°C for LaNi0.4Al11.6O19-δ and 938°C for
SrNi0.4Al11.6O19-δ. BaNi0.4Al11.6O19-δ had a low-temperature peak location at 611°C and a
high-level peak at 1064°C. TPR data show that reduction occurs at temperatures above
800°C, suggesting that Ni has been incorporated into the hexaaluminate structure since
Ni-O is reduced to Ni0 metal around 300°C. Hydrogen consumption peak data correlated
with dopant substitution level led to the observation that increasing the degree of Ni
modification resulted in an increase of accessible reduced Ni-O sites. It was observed
that relative to La and Sr, the Ba mirror cation produced a stabilizing effect on the Ni-O
bond in the hexaaluminate lattice. This behavior led to the suggestion that reduced Ni
sites were located in a region near the mirror cation and reduction was influenced by the
type of mirror cation present in the lattice.
Hexaaluminate catalysts for this project were prepared by Todd Gardner and
Mark Smith at the DOE’s NETL facility in Morgantown, WV. The hexaaluminates are
of the form MI(MII)xAl12-xO19-δ, where MI is the cation (MI = Ba, Sr, La), MII refers to the
metal dopant (MII = Ni) substituted into the lattice, x is the substitution level and δ is the
relationship between x and the specific molecular formula. The catalysts include a series
of Ba hexaaluminates where the Ni substitution level was varied from x = 0.2, 0.4, 0.6,
0.8 and 1.0. An additional Ba hexaaluminate catalyst sample was included for
comparison with x = 0.0 Ni substitution. Another series of samples kept the Ni level
constant at x = 0.4 but varied the mirror cation, using Ba, Sr or La.
10
The investigators chose to employ liquid-phase coprecipitation to synthesize the
catalysts (6). The first step of preparing the catalysts was to weigh out the calculated
amount of nitrate precursor salts to create the desired hexaaluminate. The salts were
dissolved in 300 mL of de-ionized water stirred continuously at 60°C. The requisite
amount of ammonium carbonate needed to neutralize the nitrates was measured and
dissolved in a separate container of 300 mL of de-ionized water stirred continuously at
30°C. For example, synthesizing 20 g of BaNi0.4Al11.6O18.8 requires 55.39 g of
ammonium carbonate, 112.36 g of Al nitrate, 6.75 g of Ba nitrate and 3.00 g of Ni nitrate.
The pH of the solutions ranged from 8.5 to 9.0 for the ammonium carbonate and 1.0 to
2.0 for the nitrates. The nitrate solution was added drop-wise through a separatory funnel
to the ammonium carbonate solution until a combined pH of 7.5 was achieved.
The resultant gel was aged at 60°C for six hours under vigorous mixing
conditions. After aging, the gel was separated by vacuum filtration and rinsed three times
with de-ionized water to remove excess nitrates. The filter cake was dried overnight at
110°C, crushed and placed in an oven. The samples were decomposed at 425°C in air for
1 h and then calcined at 1250-1400°C for 2-6 h. Earlier samples were calcined at 1250°C
for 2 h. Samples synthesized later were calcined for one hour at each temperature with
set points of 900°C, 1000°C, 1100°C, 1200°C, 1300°C and 1400°C in a ramp-and-soak
manner. Table 2 illustrates the synthesis conditions of the catalysts to be investigated.
11
Table 2: Ni-Substituted Hexaaluminates Synthesis Conditions
Sample Name [ID#]
Mirror Cation
Ni substitution Level
Calcination Conditions
LaNi0.4Al11.6O19
[35] Lanthanum 0.4 1250°C
2 h SrNi0.4Al11.6O19
[52]
Strontium 0.4 1250°C 2 h
BaNi0.4Al11.6O18.8
[75] Barium 0.4 1300°C
4 h BaAl12O19
[38C] Barium 0.0 1300°C
6 h BaNi0.2Al11.8O18.9
[115B] Barium 0.2 900-1400°C
6 h* BaNi0.4Al11.6O18.8
[116B] Barium 0.4 900-1400°C
6 h* BaNi0.6Al11.4O18.7
[117B] Barium 0.6 900-1400°C
6 h* BaNi0.8Al11.2O18.6
[118B] Barium 0.8 900-1400°C
6 h* BaNiAl11O18.5
[119B] Barium 1.0 900-1400°C
6 h* *6 hours total calcination time, 1 hour each at 900, 1000, 1100, 1200, 1300, 1400°C
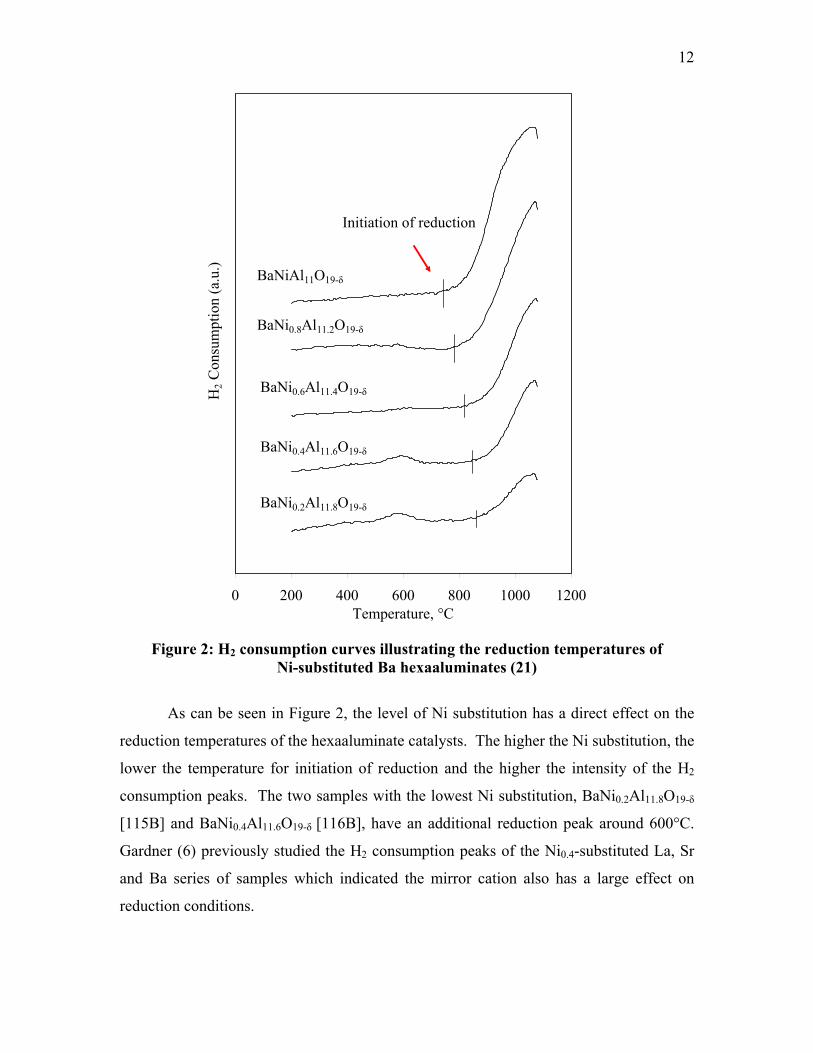
In addition to the experiments performed at NETL on various hexaaluminates,
some initial tests were conducted by Gardner et al. (6; 18) on Ni-substituted Ba
hexaaluminates (21). Figure 2 (21) illustrates the H2 consumption measurements during
temperature programmed reduction of the Ni-substituted Ba series.
12
0 200 400 600 800 1000 1200Temperature, °C
H2 C
onsu
mpt
ion
(a.u
.)
BaNi0.2Al11.8O19-δ
BaNi0.4Al11.6O19-δ
BaNi0.6Al11.4O19-δ
BaNi0.8Al11.2O19-δ
BaNiAl11O19-δ
Initiation of reduction
Figure 2: H2 consumption curves illustrating the reduction temperatures of
Ni-substituted Ba hexaaluminates (21)
As can be seen in Figure 2, the level of Ni substitution has a direct effect on the
reduction temperatures of the hexaaluminate catalysts. The higher the Ni substitution, the
lower the temperature for initiation of reduction and the higher the intensity of the H2
consumption peaks. The two samples with the lowest Ni substitution, BaNi0.2Al11.8O19-δ
[115B] and BaNi0.4Al11.6O19-δ [116B], have an additional reduction peak around 600°C.
Gardner (6) previously studied the H2 consumption peaks of the Ni0.4-substituted La, Sr
and Ba series of samples which indicated the mirror cation also has a large effect on
reduction conditions.
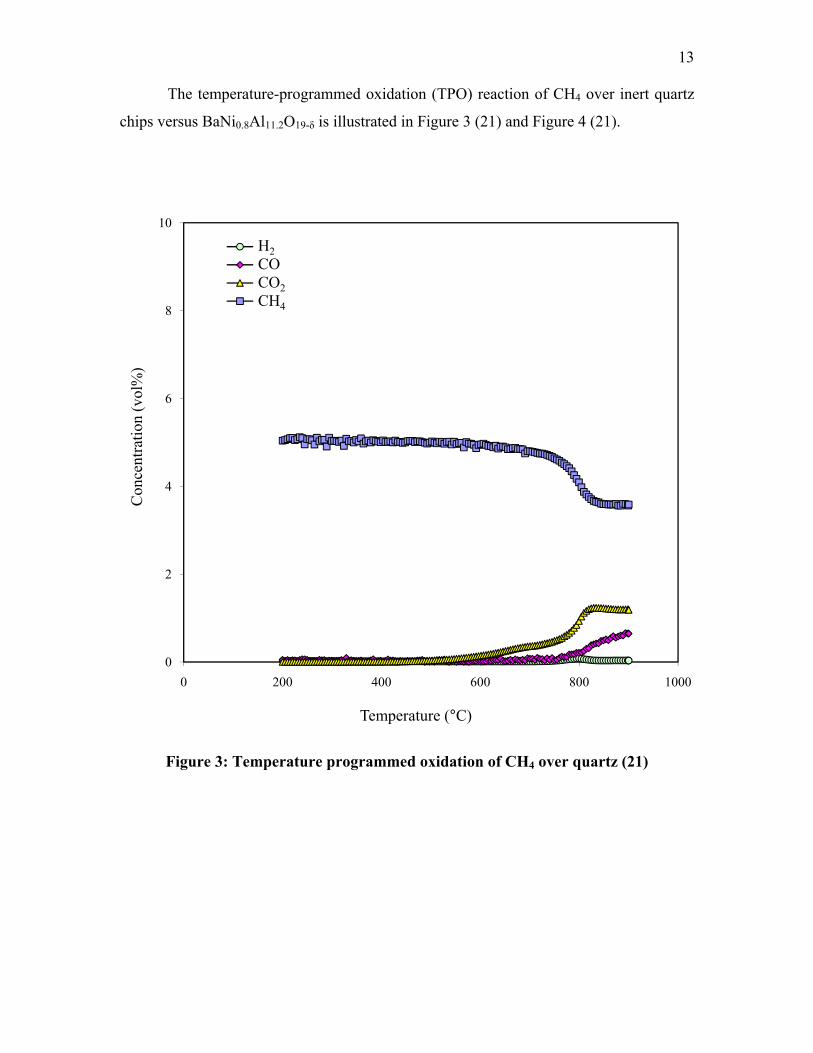
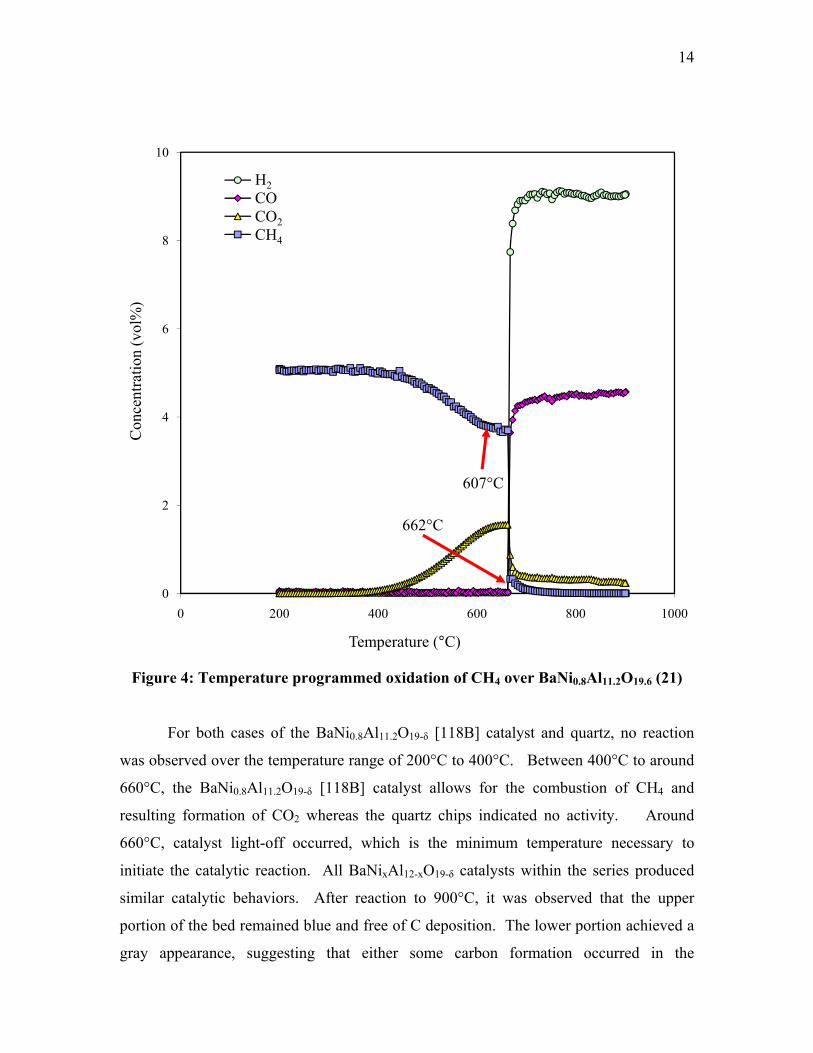
13
The temperature-programmed oxidation (TPO) reaction of CH4 over inert quartz
chips versus BaNi0.8Al11.2O19-δ is illustrated in Figure 3 (21) and Figure 4 (21).
0
2
4
6
8
10
0 200 400 600 800 1000
Con
cent
ratio
n (v
ol%
)
Temperature (°C)
H2COCO2CH4
H2COCO2CH4
Figure 3: Temperature programmed oxidation of CH4 over quartz (21)
14
0
2
4
6
8
10
0 200 400 600 800 1000
Con
cent
ratio
n (v
ol%
)
Temperature (°C)
H2COCO2CH4
607°C
662°C
H2COCO2CH4
Figure 4: Temperature programmed oxidation of CH4 over BaNi0.8Al11.2O19.6 (21)
For both cases of the BaNi0.8Al11.2O19-δ [118B] catalyst and quartz, no reaction
was observed over the temperature range of 200°C to 400°C. Between 400°C to around
660°C, the BaNi0.8Al11.2O19-δ [118B] catalyst allows for the combustion of CH4 and
resulting formation of CO2 whereas the quartz chips indicated no activity. Around
660°C, catalyst light-off occurred, which is the minimum temperature necessary to
initiate the catalytic reaction. All BaNixAl12-xO19-δ catalysts within the series produced
similar catalytic behaviors. After reaction to 900°C, it was observed that the upper
portion of the bed remained blue and free of C deposition. The lower portion achieved a
gray appearance, suggesting that either some carbon formation occurred in the
15
downstream portion of the bed (21) or that Ni+2 ions, with characteristic blue color, have
been reduced to Ni0 metal and turned from blue to gray.
In a similar characterization study to this project, Bukhtiyarova et al. (22)
performed XRD and FTIR spectroscopy of adsorbed probe molecules (CO and CDCl3)
on SrAl12O19, BaAl12O19 and LaAl11O18. The Bukhtiyarova samples were created via the
coprecipitation method under similar conditions to the samples synthesized at NETL by
Gardner (6; 22). The XRD profiles were recorded with Cu Kα (λ = 1.5418 Å) radiation
and in both continuous and step-by-step scanning modes at 0.05 – 0.1° in 2θ and dwell
time of 20-30 sec depending on the crystallinity of the sample (22). X-ray diffraction
confirmed the formation of single-phase hexaaluminates in the SrAl12O19 and BaAl12O19
samples; however the LaAl11O18 sample contained an additional LaAlO3 phase. It was
also observed that the cell parameters changed with increasing temperature during
calcination: a, b directions increased for all three of the samples, while the c direction
decreased for all the samples except for BaAl12O19.
2.3 Characterization Techniques
Several characterization techniques will be applied to investigate the two series of
catalysts. Characterization techniques will be conducted at WVU by means of the
following methods: scanning electron microscopy (SEM), unit-cell refinement (UCR),
simultaneous temperature-programmed reduction and X-ray diffraction (TPR-XRD) and
Fourier-transform infrared (FT-IR) spectroscopy. Scanning electron microscopy will be
used to determine differences in catalyst surface morphology. Unit-cell refinement will
confirm that Ni is incorporated into hexaaluminate lattice. Temperature-programmed
reduction and X-ray diffraction will allow the monitoring of changes in structure and the
formation of metal-oxygen species during reduction conditions. Temperature
programmed reduction under H2 followed by CO pulse chemisorption will also be
performed on the samples to determine reduction temperatures and level of Ni0 on the
catalyst surface to optimize FT-IR measurement conditions. Fourier-transform infrared
spectroscopy will detect surface species adsorbed on reduced catalyst and distinguish
between Ni+2 ions and Ni0 metal. The results obtained from each of the techniques will
be analyzed and combined in order to gather a clearer understanding of the activity of Ni
16
on the hexaaluminate catalysts surfaces and what effect varying the cations and Ni
substitution level have on the hexaaluminate structure.
The first characterization technique to be performed on the hexaaluminate
catalysts will be SEM. Scanning electron microscopy images of magnification levels up
to 10k will be taken on equipment available at WVU. These images illustrate any
differences in surface morphology between samples of varying composition as well as
fresh versus spent catalysts.
Temperature-programmed reduction is a technique used to indicate the relative
strength of metal-oxygen bonds present in the lattice. For Ni substituted into the
hexaaluminate lattice to become catalytically active, the Ni-O bond within the lattice
must be reduced (18). The reduced Ni sites form either metallic Ni0 or remain as a defect
site within the lattice as a Ni ion. If metallic Ni0 sites form, either the active sites exist as
nano-dispersed Ni sites embedded at the surface, or metallic Ni0 clusters may form if the
reduced sites are in a high concentration. Temperature-programmed reduction shows the
energy required to reduce Ni within the hexaaluminate lattice as well as the temperature
range in which reduction occurs.
Unit-cell refinement (UCR) (23) is a technique commonly utilized in
mineralogical and petrological research to determine lattice parameters of materials from
XRD diffraction patterns of actual observed data. The lattice parameters are calculated
via non-linear least-squares refinement of the whole diffraction pattern and also
incorporate regression diagnostics to detect and dismiss outliers that may skew results. In
this study, the XRD software Jade was utilized to calculate the lattice parameters of the
samples and the results are given in the form of a, b and c parameters, the overall lattice
cell volume and the respective standard error of each measurement.
In situ time-resolved studies of the formation of catalysts are important in order to
understand the synthesis mechanisms. Using time-resolved XRD, it is possible to follow
structural changes during TPR and temperature-programmed oxidation (TPO). It has
been shown that O2 diffusion is preferred to occur via the O-2 ions within the monatomic
layer of the mirror plane rather than those present in the spinel block (24). Under TPR it
is anticipated that O-2 ions within the mirror plane of Ni-substituted hexaaluminates will
reduce and expose active Ni0 sites. In situ observation also enables detection of
intermediate phases, helps in establishing optimal synthesis conditions and makes it
17
possible to investigate the kinetics of phase transitions and to determine the changes of
crystallite size as a function of time and reaction conditions (25). In situ time-resolved
XRD will be executed by simultaneously performing TPR and TPO while scanning the
samples via XRD under high intensity synchrotron radiation. Synchrotron measurements
provide high positional accuracy and excellent signal-to-noise ratio.
As previously mentioned in Section 2.2, Xu and coworkers (9; 10) performed
TPR with catalyst embedded in a fixed-bed quartz tube, although XRD measurements
were not simultaneously taken during the procedure. Before reaction, the samples were
treated at 300°C under Ar for 30 min and cooled to room temperature. The samples were
then heated to 1200°C at 20°C/min under 10% H2/Ar gas mixture at a flow rate of 30
ml/min. Chu et al. (16) chose similar conditions for TPR studies but used 5% H2/Ar and
the sample was heated to 1250°C.
Unit-cell refinement and in situ time-resolved XRD characterization will be
conducted at the X7B beam line of the National Synchrotron Light Source (NSLS)
facility at Brookhaven National Laboratory (BNL) in Upton, NY. Investigations
conducted at the NSLS facility at BNL as well as other institutions have resulted in the
practicality of conducting subminute, time-resolved XRD experiments under a wide
variety of temperature (-190°C to 900°C) and pressure (< 45 atm) conditions (25; 26).
Poul Norby, a BNL chemist, and Jonathan Hanson, beam line scientist of the X7B beam
line, have both helped to develop in situ diffraction techniques that are available for
researchers who visit BNL.
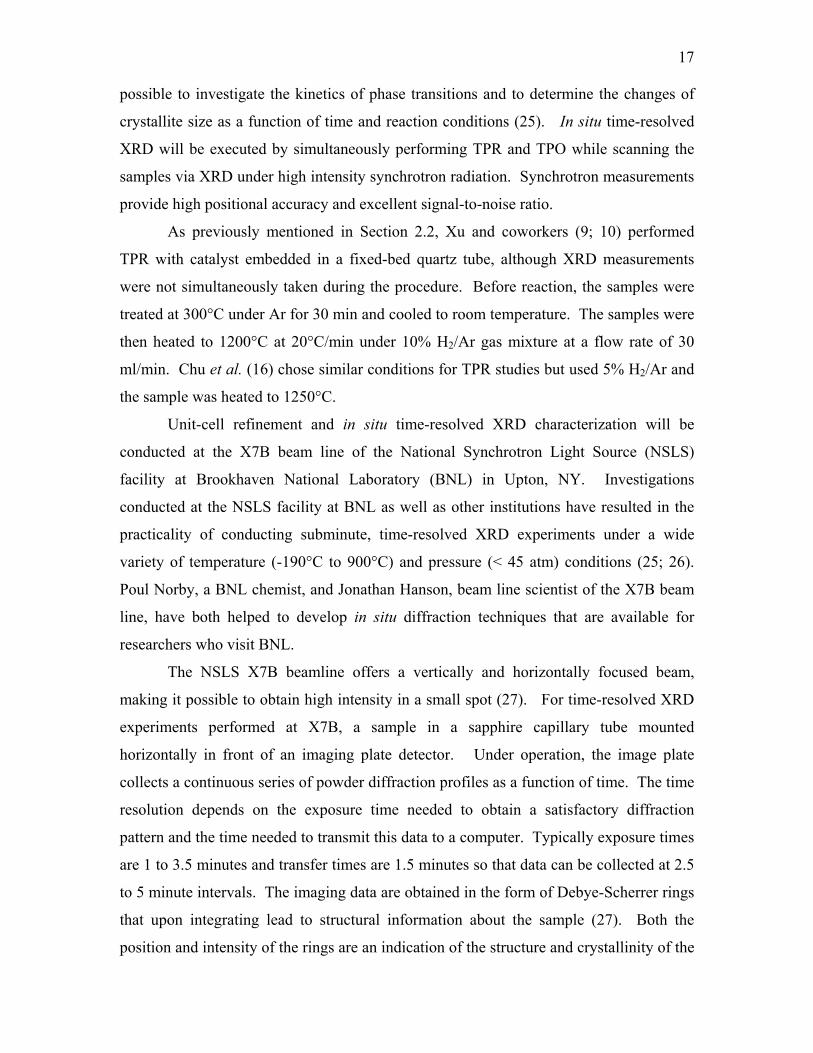
The NSLS X7B beamline offers a vertically and horizontally focused beam,
making it possible to obtain high intensity in a small spot (27). For time-resolved XRD
experiments performed at X7B, a sample in a sapphire capillary tube mounted
horizontally in front of an imaging plate detector. Under operation, the image plate
collects a continuous series of powder diffraction profiles as a function of time. The time
resolution depends on the exposure time needed to obtain a satisfactory diffraction
pattern and the time needed to transmit this data to a computer. Typically exposure times
are 1 to 3.5 minutes and transfer times are 1.5 minutes so that data can be collected at 2.5
to 5 minute intervals. The imaging data are obtained in the form of Debye-Scherrer rings
that upon integrating lead to structural information about the sample (27). Both the
position and intensity of the rings are an indication of the structure and crystallinity of the
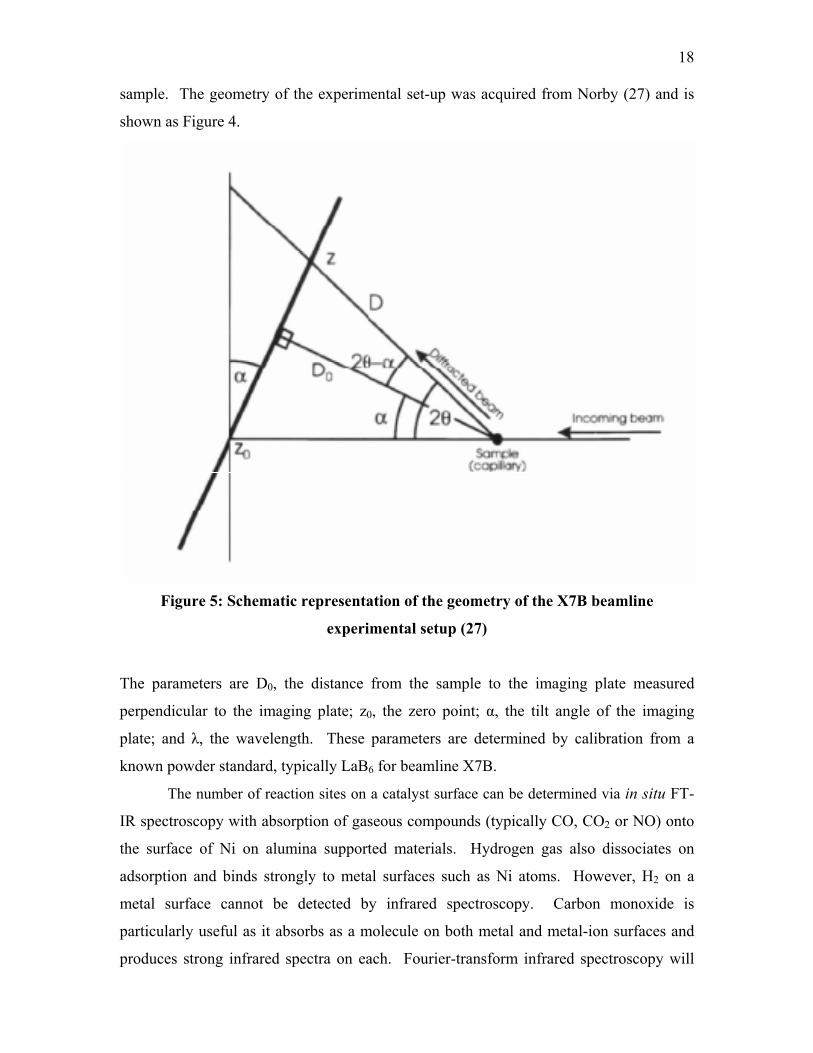
18
sample. The geometry of the experimental set-up was acquired from Norby (27) and is
shown as Figure 4.
Figure 5: Schematic representation of the geometry of the X7B beamline
experimental setup (27)
The parameters are D0, the distance from the sample to the imaging plate measured
perpendicular to the imaging plate; z0, the zero point; α, the tilt angle of the imaging
plate; and λ, the wavelength. These parameters are determined by calibration from a
known powder standard, typically LaB6 for beamline X7B.
The number of reaction sites on a catalyst surface can be determined via in situ FT-
IR spectroscopy with absorption of gaseous compounds (typically CO, CO2 or NO) onto
the surface of Ni on alumina supported materials. Hydrogen gas also dissociates on
adsorption and binds strongly to metal surfaces such as Ni atoms. However, H2 on a
metal surface cannot be detected by infrared spectroscopy. Carbon monoxide is
particularly useful as it absorbs as a molecule on both metal and metal-ion surfaces and
produces strong infrared spectra on each. Fourier-transform infrared spectroscopy will
19
show how CO probe molecules bind to Ni-exchanged hexaaluminates after reduction.
There have been extensive investigations that have been performed using these probe
molecules, however, there is little information regarding in situ FT-IR analysis of
hexaaluminates, particularly on Ni-substituted hexaaluminates.
Galuszka et al. (28) performed an infrared study of the adsorption of CO as well
as the coadsorption of CO and H2 on alumina-supported Ni catalysts and discovered that
a total of six different IR bands were found in the spectral region of 2250-1800 cm-1 due
to adsorbed CO. The experimenters adsorbed CO on alumina supported 5% Ni for 7
hours at 10 Torr and 150°C and then allowed the sample to cool to room temperature.
The system was then evacuated and then the intensity and frequency of the bands were
monitored. The intensity of some of the six bands was found to be influenced by the
presence of H2. There were two bands that were found to occur higher than gaseous CO.
One of these bands at a wavelength of 2250 cm-1 was only present when the temperature
was above 100°C. When the same conditions were applied to an alumina supported 1%
Ni sample, only one weak peak at 2050 cm-1 with accompanying shoulder appeared. This
band was found to be easily removed during evacuation and only the wider shoulder peak
at 2080 cm-1 remained on the surface up to 200°C.
In a 2002 study, Bengaard and others (29) utilized Ni catalysts for steam
reforming and studied graphite formation and methods to block the active sites. The
researchers proposed that CO binds on Ni(111) and/or Ni(211) with a preference for three
fold site on the planar Ni(111) surface. The investigators also stated that CO is usually
adsorbed at temperatures below 300 K on the low-index Ni surfaces and by CO
desorption when the temperature is increased to about 450 K and no C or O2 is left on the
surface.
In the Bukhtiyarova et al. (22) study previously mentioned in Section 2.2, FTIR
spectra of adsorbed probe molecules (CO and CDCl3) on SrAl12O19, BaAl12O19 and
LaAl11O18 were recorded in the region of 4000 – 1200 cm-1 and a resolution of 4 cm-1.
The samples were pressed to self-supporting disks (10-20 mg·cm-2), transferred to an IR
cell and then evacuated at 500°C for 1.5 h to a residual pressure of less than 10-4 Torr.
Carbon monoxide was adsorbed at -196°C at pressures from 0.1 to 10 Torr.
A similar study by Kantcheva et al. (30) characterized LaMnAl11O19 by XRD and
in situ FT-IR spectroscopy with NO and NO/O2 probe molecules. Fourier transform
20
infrared measurements were recorded with a spectrometer equipped with a liquid-
nitrogen cooled Mercury Cadmium Telluride (MCT) detector at a resolution of 4 cm-1.
The in situ FT-IR measurements consisted of a sample of the hexaaluminate calcined at
1000°C for 1 h. Self-supporting discs were created and activated in the IR cell by heating
for 1 h in vacuum at 500°C and in O2 followed by evacuation for 1 h at 500°C. The
spectrum of the sample at ambient temperature was used as a background reference and
then a flow of 99.9% pure NO gas was applied. After the subtraction of the spectrum of
gaseous NO, two bands at 1861 and 1827 cm-1 were observed, and were attributed to
coordinatively unsaturated Mn+3-NO species. The coadsorption of NO and O2 at room
temperature leads to the formation of various nitro-nitrato structures, and the species
were found to decompose at 350°C directly to N2 and O2.
Hu et al. (31) performed a temperature-programmed FT-IR study of the
adsorption of CO and co-adsorption of CO and H2 on Ni on supported Al2O3. Although
the samples were not hexaaluminates, the variety of methods utilized in the investigation
of the samples is of interest. The first method was low-partial-pressure desorption of CO
on the samples under vacuum in which the system was exposed to CO at 22 Torr for a
specified time, then the system was evacuated and spectrum was recorded. The second
method was temperature-programmed heating in a CO atmosphere at 18 Torr and spectra
were recorded at different temperatures. The third technique was temperature-
programmed-reaction in a CO and H2 atmosphere and performed three different ways:
exposure of CO then H2 both at 20 Torr; exposure of H2 (15 Torr) then CO (20 Torr); and
finally, premixed CO (25 Torr) and H2 (45 Torr) were introduced to the samples and
spectra were recorded at different temperatures.
21
Chapter 3: Materials and Methodology
3.1 Scanning Electron Microscopy (SEM)
The SEM images of the hexaaluminate catalysts were taken on a Hitachi S4700
Field Emission Scanning Electron Microscope located at WVU. The catalysts in the
calcined state were ground with an agate mortar and pestle. However, in order to view
more of the external surface area, the catalysts obtained from the reactor bed experiments
by Gardner (6) were only crushed. The samples were spread onto double-sided carbon
tape and then placed on an Al sample stub. The tape and stubs were supplied by Ted
Pella, Inc. Upon initial capturing of the images, it was determined that the catalysts were
charging badly and needed to be coated to enhance the picture quality. The samples were
treated with approximately 10 nm of gold sputter coating. However, the morphology of
the catalysts prevented a uniform coating and some charging remained. The pictures
were taken under the following conditions: an accelerating voltage of 1.0kV, a working
distance of 11.9-12.4mm, and magnification levels at 400, 5k, and 10k.
3.2 X-ray Diffraction (XRD)
Unit-cell refinement and TPR-XRD pattern measurements were conducted at the
X7B beam line (λ = 0.9225 Å) of the NSLS facility at BNL in Upton, NY. The X-ray
diffraction patterns of the hexaaluminate catalysts were measured during TPR and during
TPO with the POx of CH4. The diffraction patterns were measured at specific time
intervals to determine if any changes in the crystal structure occur as a function of time
and temperature.
The first step of XRD sample preparation was to obtain a new single-crystal
sapphire capillary tube or to clean out a previously used tube using pressurized air. Each
sapphire tube was open at both ends and was 50 mm in length with a 1.1 mm outer
diameter and a 0.8 mm inner diameter. A small piece of quartz wool was spun into a
small cylindrical roll and stuffed about ¼ of the distance inside the capillary tube to serve
as a plug. The sample to be studied was ground to a fine powder in an agate mortar and
pestle. Using a quartz capillary tube with a funnel on one end as a scoop, the sample was
loaded into the sapphire tube until it filled about 2 cm of the length of the tube. Another
quartz wool plug was placed on the other end to secure the sample in place. The sapphire
22
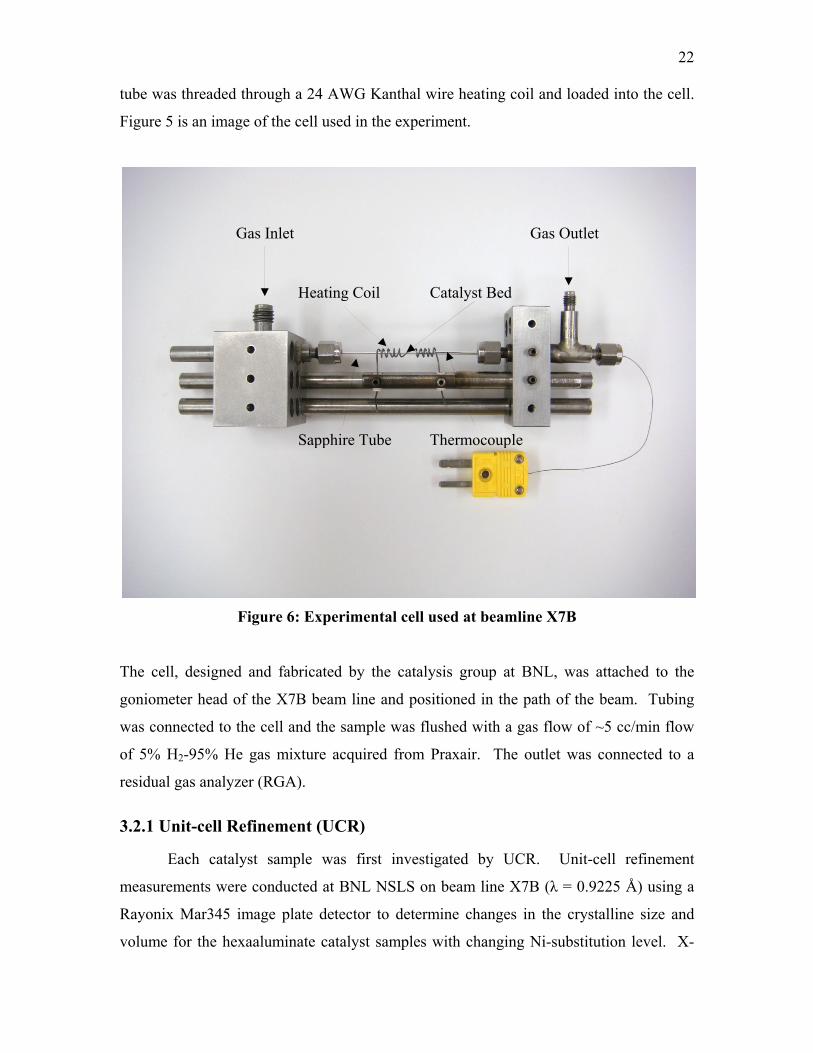
tube was threaded through a 24 AWG Kanthal wire heating coil and loaded into the cell.
Figure 5 is an image of the cell used in the experiment.
Gas Inlet Gas Outlet
Heating Coil Catalyst Bed
Sapphire Tube Thermocouple
Figure 6: Experimental cell used at beamline X7B
The cell, designed and fabricated by the catalysis group at BNL, was attached to the
goniometer head of the X7B beam line and positioned in the path of the beam. Tubing
was connected to the cell and the sample was flushed with a gas flow of ~5 cc/min flow
of 5% H2-95% He gas mixture acquired from Praxair. The outlet was connected to a
residual gas analyzer (RGA).
3.2.1 Unit-cell Refinement (UCR)
Each catalyst sample was first investigated by UCR. Unit-cell refinement
measurements were conducted at BNL NSLS on beam line X7B (λ = 0.9225 Å) using a
Rayonix Mar345 image plate detector to determine changes in the crystalline size and
volume for the hexaaluminate catalyst samples with changing Ni-substitution level. X-
23
ray diffraction patterns were taken at 25°C under He over a scanned region of 0 to 50° in
2θ.
The original Debye-Scherrer powder rings were integrated with FIT2D code, a
dimensional data analysis software created by the European Synchrotron Research
Facility, to provide conventional diffraction angle and intensity data. The FIT2D
parameters for the integration of the raw synchrotron data were obtained with lanthanum
hexaboride, LaB6, being used as an external calibration standard. LaB6 is also used to
determine the proper tilt angle, sample-to-detector distance, wavelength, and tilting angle
of the image plate. A three-dimensional chart document was obtained with a Fortran
CHITOUXDS code, written by BNL X7B beamline researcher Jonathan Hanson. The
time-resolved XRD pattern files were analyzed using Jade Plus 7.5, a XRD pattern
processing and search-and-match software created by Materials Data Incorporated. The
diffraction-pattern database used with Jade is PDF-4+ 2006 from the International Centre
for Diffraction Data (ICDD). Calculation of crystal dimensions required basic symmetry
information that is obtained from the PDF-4+ database.
3.2.2 In situ Temperature-programmed Reduction and X-ray Diffraction
(TPR-XRD)
In the TPR-XRD procedure, the first temperature ramping step was to hold at
25°C for 2 minutes, followed by heating at a rate of 10°C/min to 625°C and then at the
rate of 5°C/min until 925°C. The temperature was held at 925°C for 30 minutes, and
then the sample was allowed to cool to room temperature. The 5% H2-95% He gas
mixture continued to flush through sample during the entire run. Diffraction
measurements were collected every 5 minutes using synchrotron radiation with a
wavelength of 0.9225 Å and a residual gas analyzer (RGA) was utilized to follow the
composition of product gases. The run with SrNi0.4Al11.6O19 [52] had small variations in
the heating rate in that the sample was not held at specific temperatures between
heating/cooling steps. Time-resolved or in situ XRD measurements were also conducted at BNL NSLS
on beam line X7B. The entire range that was measured was of the region of 0 to 50° in
2θ. Measurements were taken every 5 minutes, which consisted of the time needed to
scan the sample and transfer the data from the imaging plate to a computer. The same
24
computer programs utilized in the UCR experiments were also required for TPR-XRD
data acquisition and analysis.
3.3 In Situ Fourier-transform Infrared (FT-IR)
To optimize the FT-IR measurement conditions characterization techniques of
TPR with 5% H2 followed by CO pulse chemisorption were conducted on the samples.
Temperature-programmed reduction experiments, where the gas effluent is measured
using a mass spectrometer, were conducted at NETL utilizing TPR under H2 to determine
bond strength and reduction temperatures. This was followed by a CO pulse-absorption
technique used on the reduced catalysts to determine the amount of Ni species on the
catalyst surface. The catalyst characterization group at the NETL has the resources of a
Micromeritics Autochem 2920 Catalyst Characterization System with the sample off-gas
analyzed by a ThermoONIX Prima δβ magnetic sector mass spectrometer. These
experiments are typically carried out under 5% H2-95% Ar, 10% CO-90% He and UHP
Ar gases. Pulses of CO are sent to the reduced catalysts until surface saturation was
reached. The amount of gas adsorbed is obtained by calculating the difference between
the volume of each pulse and the fraction of CO not adsorbed.
Fourier-transform Infrared Spectroscopy was conducted at WVU with a Thermo
Nicolet Nexus 670 spectrometer loaned by NETL. The spectrometer setup is shown in
Figure 6.
25
Temperature Controller Nexus 670 Spectrometer
MFC Controller and Read Out Smart Collector
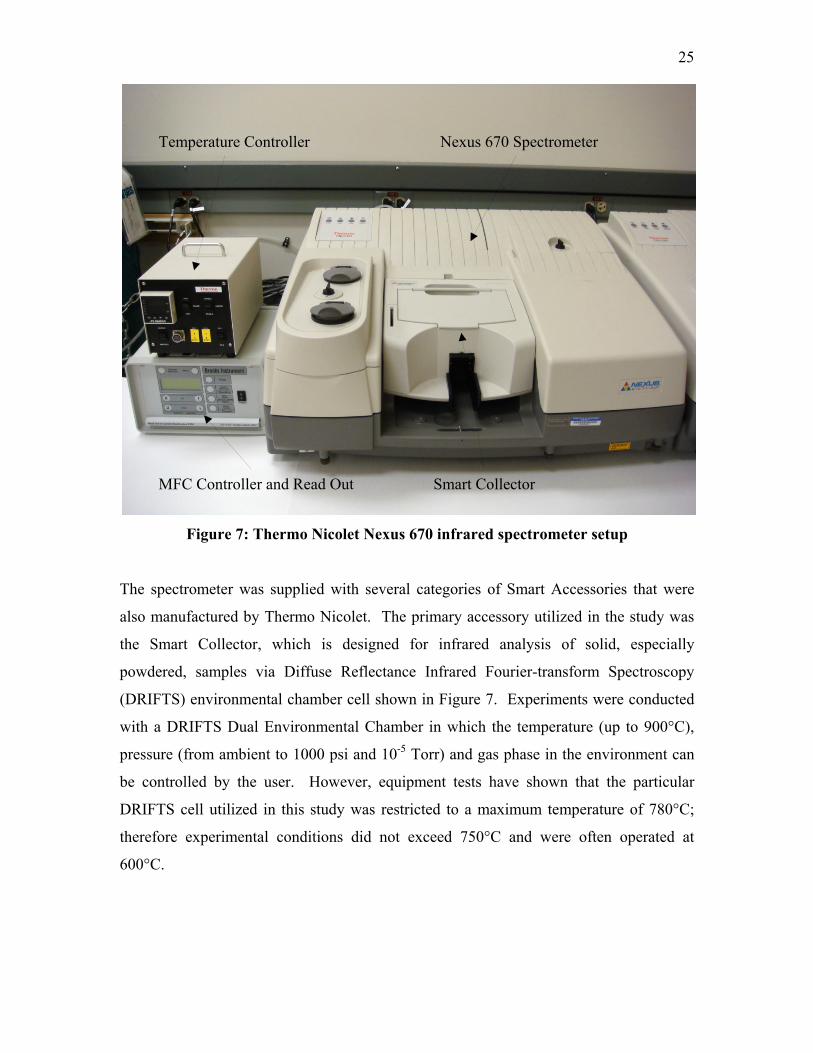
Figure 7: Thermo Nicolet Nexus 670 infrared spectrometer setup
The spectrometer was supplied with several categories of Smart Accessories that were
also manufactured by Thermo Nicolet. The primary accessory utilized in the study was
the Smart Collector, which is designed for infrared analysis of solid, especially
powdered, samples via Diffuse Reflectance Infrared Fourier-transform Spectroscopy
(DRIFTS) environmental chamber cell shown in Figure 7. Experiments were conducted
with a DRIFTS Dual Environmental Chamber in which the temperature (up to 900°C),
pressure (from ambient to 1000 psi and 10-5 Torr) and gas phase in the environment can
be controlled by the user. However, equipment tests have shown that the particular
DRIFTS cell utilized in this study was restricted to a maximum temperature of 780°C;
therefore experimental conditions did not exceed 750°C and were often operated at
600°C.
26
Gas Outlet Chamber 2 Chamber 1
Water Inlet
Gas Inlet Water Outlet
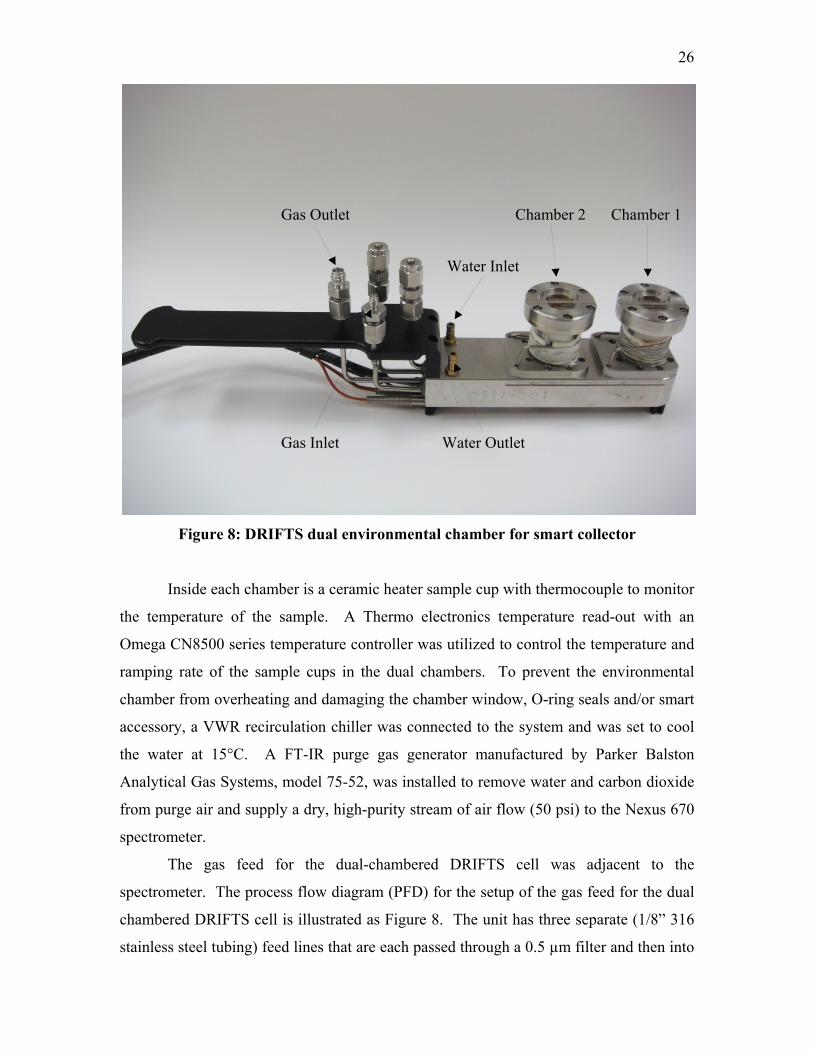
Figure 8: DRIFTS dual environmental chamber for smart collector
Inside each chamber is a ceramic heater sample cup with thermocouple to monitor
the temperature of the sample. A Thermo electronics temperature read-out with an
Omega CN8500 series temperature controller was utilized to control the temperature and
ramping rate of the sample cups in the dual chambers. To prevent the environmental
chamber from overheating and damaging the chamber window, O-ring seals and/or smart
accessory, a VWR recirculation chiller was connected to the system and was set to cool
the water at 15°C. A FT-IR purge gas generator manufactured by Parker Balston
Analytical Gas Systems, model 75-52, was installed to remove water and carbon dioxide
from purge air and supply a dry, high-purity stream of air flow (50 psi) to the Nexus 670
spectrometer.
The gas feed for the dual-chambered DRIFTS cell was adjacent to the
spectrometer. The process flow diagram (PFD) for the setup of the gas feed for the dual
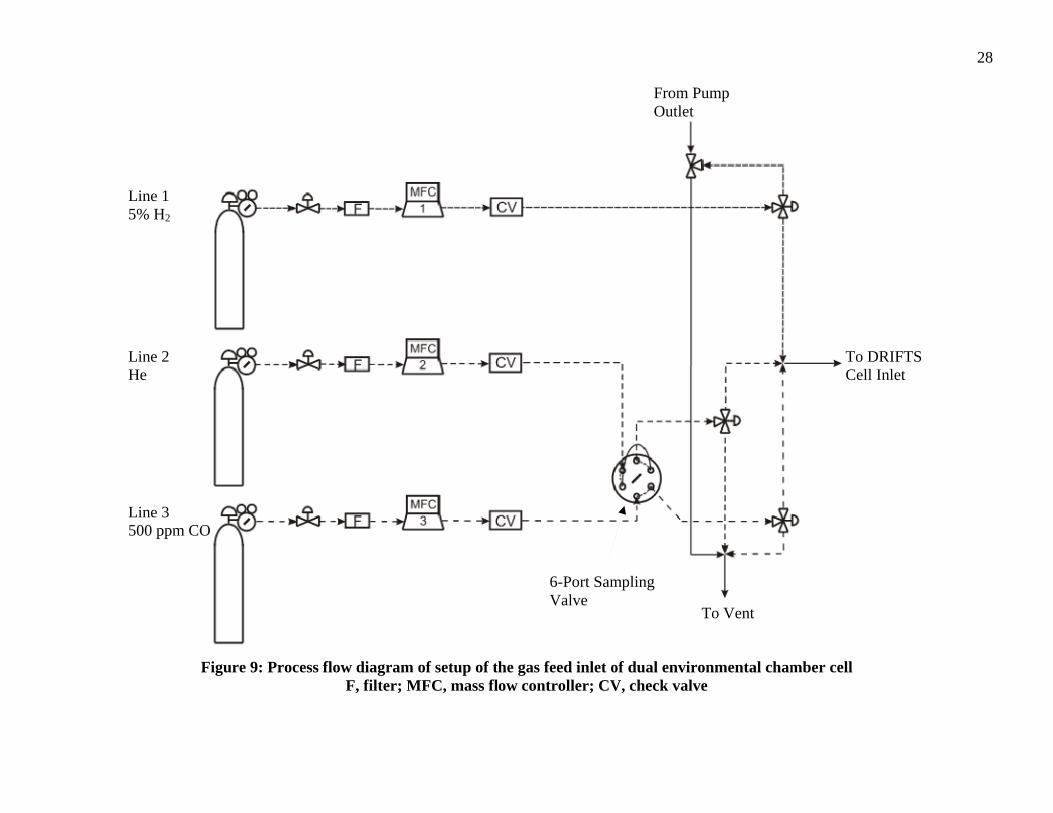
chambered DRIFTS cell is illustrated as Figure 8. The unit has three separate (1/8” 316
stainless steel tubing) feed lines that are each passed through a 0.5 µm filter and then into
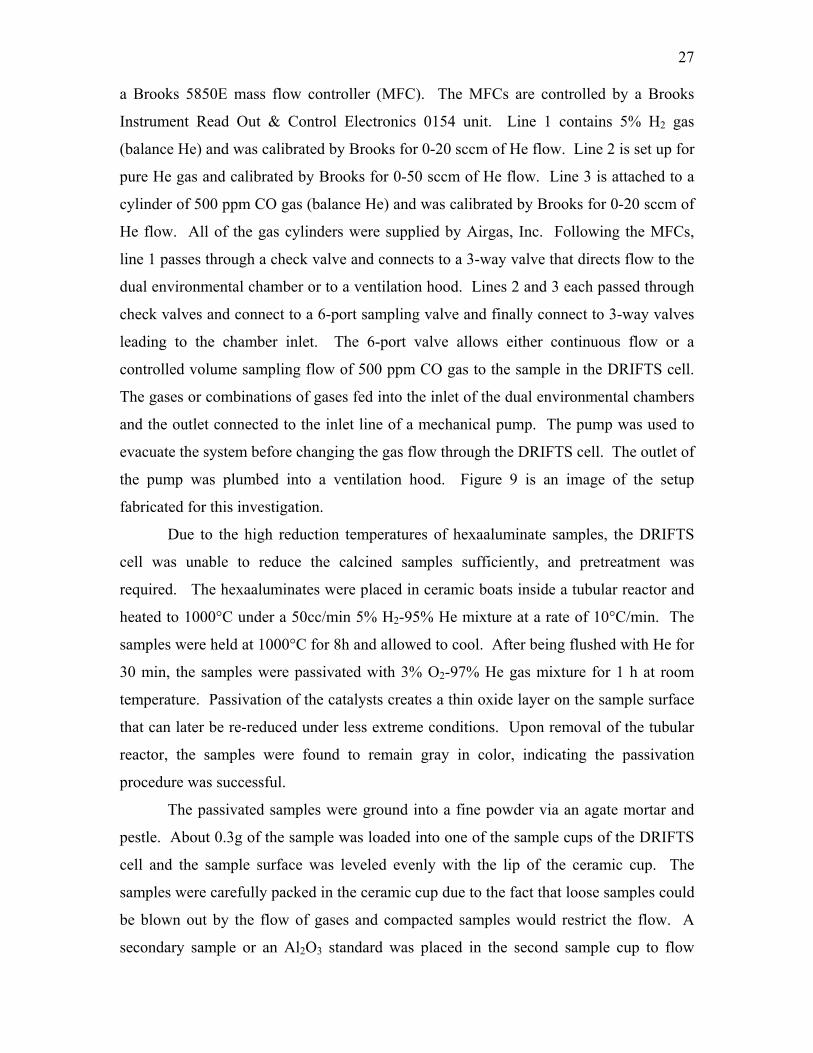
27
a Brooks 5850E mass flow controller (MFC). The MFCs are controlled by a Brooks
Instrument Read Out & Control Electronics 0154 unit. Line 1 contains 5% H2 gas
(balance He) and was calibrated by Brooks for 0-20 sccm of He flow. Line 2 is set up for
pure He gas and calibrated by Brooks for 0-50 sccm of He flow. Line 3 is attached to a
cylinder of 500 ppm CO gas (balance He) and was calibrated by Brooks for 0-20 sccm of
He flow. All of the gas cylinders were supplied by Airgas, Inc. Following the MFCs,
line 1 passes through a check valve and connects to a 3-way valve that directs flow to the
dual environmental chamber or to a ventilation hood. Lines 2 and 3 each passed through
check valves and connect to a 6-port sampling valve and finally connect to 3-way valves
leading to the chamber inlet. The 6-port valve allows either continuous flow or a
controlled volume sampling flow of 500 ppm CO gas to the sample in the DRIFTS cell.
The gases or combinations of gases fed into the inlet of the dual environmental chambers
and the outlet connected to the inlet line of a mechanical pump. The pump was used to
evacuate the system before changing the gas flow through the DRIFTS cell. The outlet of
the pump was plumbed into a ventilation hood. Figure 9 is an image of the setup
fabricated for this investigation.
Due to the high reduction temperatures of hexaaluminate samples, the DRIFTS
cell was unable to reduce the calcined samples sufficiently, and pretreatment was
required. The hexaaluminates were placed in ceramic boats inside a tubular reactor and
heated to 1000°C under a 50cc/min 5% H2-95% He mixture at a rate of 10°C/min. The
samples were held at 1000°C for 8h and allowed to cool. After being flushed with He for
30 min, the samples were passivated with 3% O2-97% He gas mixture for 1 h at room
temperature. Passivation of the catalysts creates a thin oxide layer on the sample surface
that can later be re-reduced under less extreme conditions. Upon removal of the tubular
reactor, the samples were found to remain gray in color, indicating the passivation
procedure was successful.
The passivated samples were ground into a fine powder via an agate mortar and
pestle. About 0.3g of the sample was loaded into one of the sample cups of the DRIFTS
cell and the sample surface was leveled evenly with the lip of the ceramic cup. The
samples were carefully packed in the ceramic cup due to the fact that loose samples could
be blown out by the flow of gases and compacted samples would restrict the flow. A
secondary sample or an Al2O3 standard was placed in the second sample cup to flow
28
Figure 9: Process flow diagram of setup of the gas feed inlet of dual environmental chamber cell
F, filter; MFC, mass flow controller; CV, check valve
Line 3 500 ppm CO
Line 2 He
Line 1 5% H2
To Vent
6-Port Sampling Valve
From Pump Outlet
To DRIFTS Cell Inlet
29
Line 1
Line 2
Line 3
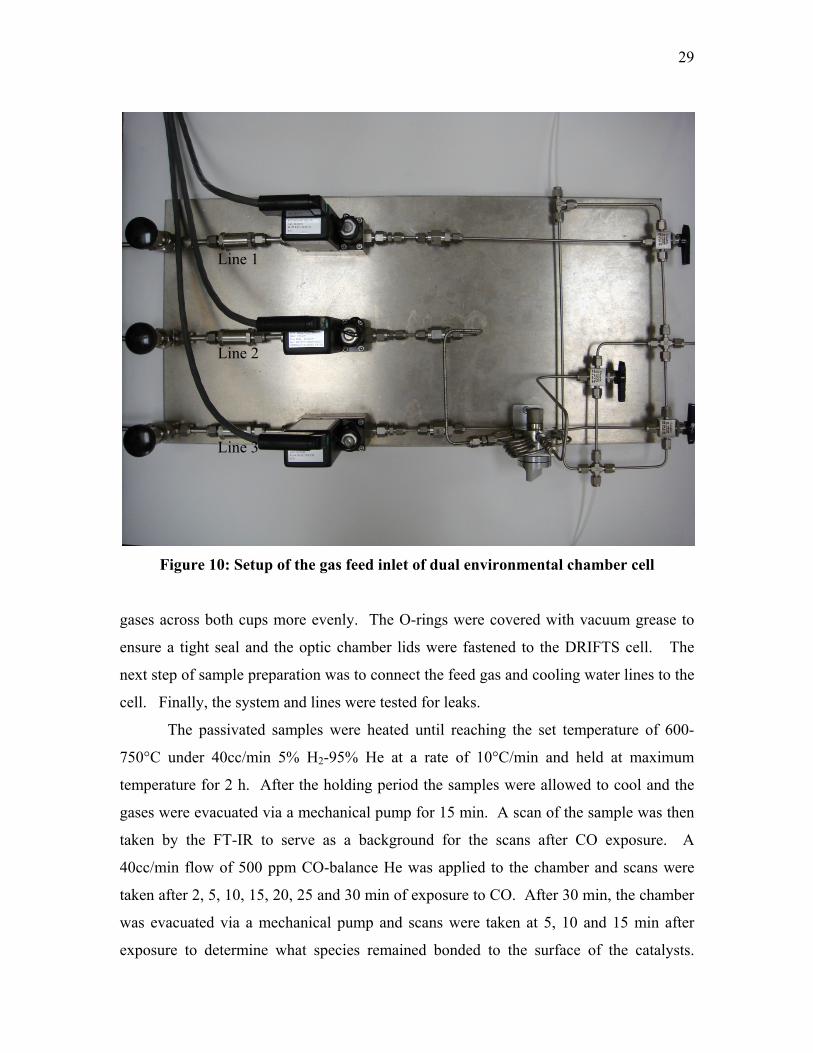
Figure 10: Setup of the gas feed inlet of dual environmental chamber cell
gases across both cups more evenly. The O-rings were covered with vacuum grease to
ensure a tight seal and the optic chamber lids were fastened to the DRIFTS cell. The
next step of sample preparation was to connect the feed gas and cooling water lines to the
cell. Finally, the system and lines were tested for leaks.
The passivated samples were heated until reaching the set temperature of 600-
750°C under 40cc/min 5% H2-95% He at a rate of 10°C/min and held at maximum
temperature for 2 h. After the holding period the samples were allowed to cool and the
gases were evacuated via a mechanical pump for 15 min. A scan of the sample was then
taken by the FT-IR to serve as a background for the scans after CO exposure. A
40cc/min flow of 500 ppm CO-balance He was applied to the chamber and scans were
taken after 2, 5, 10, 15, 20, 25 and 30 min of exposure to CO. After 30 min, the chamber
was evacuated via a mechanical pump and scans were taken at 5, 10 and 15 min after
exposure to determine what species remained bonded to the surface of the catalysts.
30
Additional instructions for FT-IR operations are located in the Section A.1 of the
Appendix.
3.4 Safety
The chemicals used in this study are 5% H2 gas (balance He), 500 ppm CO gas
(balance He), 5% CH4-2.5% O2-92.5% (balance He) gas, He gas, and liquid nitrogen.
Material safety data sheets (MSDS) were obtained for each of the chemicals used in this
study. Helium and H2 can act as simple asphyxiants and H2 is widely known to be highly
flammable. Carbon monoxide is toxic upon inhalation and has warnings regarding its
flammability. Although the concentrations of H2 and CO utilized in this investigation are
below minimum flammability levels and cannot burn, special care was taken to keep
them away from flames and other ignition sources. Exit lines are plumbed into the
ventilation hood. Liquid N2 can be an asphyxiant and may cause frostbite upon contact
with skin. Liquid N2 transport requires the use of a Dewar. All cylinders contain gases
and/or liquids under high pressure and must be handled with care. Detailed MSDS data
on hexaaluminates is not readily available, however like most powders, the
hexaaluminates are assumed to be irritants to the eyes, skin and respiratory system; thus
all handling of the samples was conducted in a ventilation hood with proper safety attire.
Safety apparatus including laboratory coats, glasses, goggles, masks, latex gloves
and thermal gloves were worn as necessary or as required by safety rules when operating
equipment, handling chemicals and/or performing experiments. The laboratory is
equipped with ventilation hoods, fire extinguishers and blankets, chemical safety
showers, eye-wash stations and first aid kits. Material safety data sheets for all chemicals
utilized and/or stored in the laboratory in addition to a contact list for emergency
response is posted at each entrance of the laboratory.
31
Chapter 4: Results and Discussions
4.1 SEM
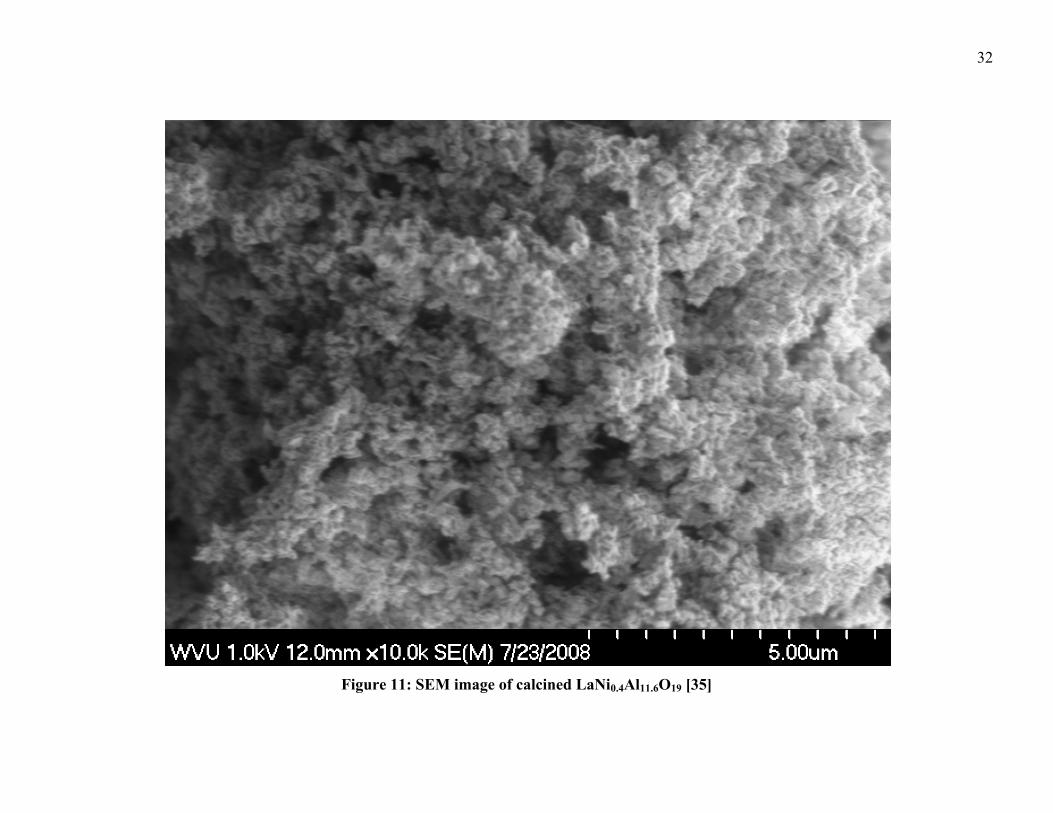
The hexaaluminate catalysts prepared at NETL were examined by scanning
electron microscopy at WVU. Both series were investigated via the procedure and
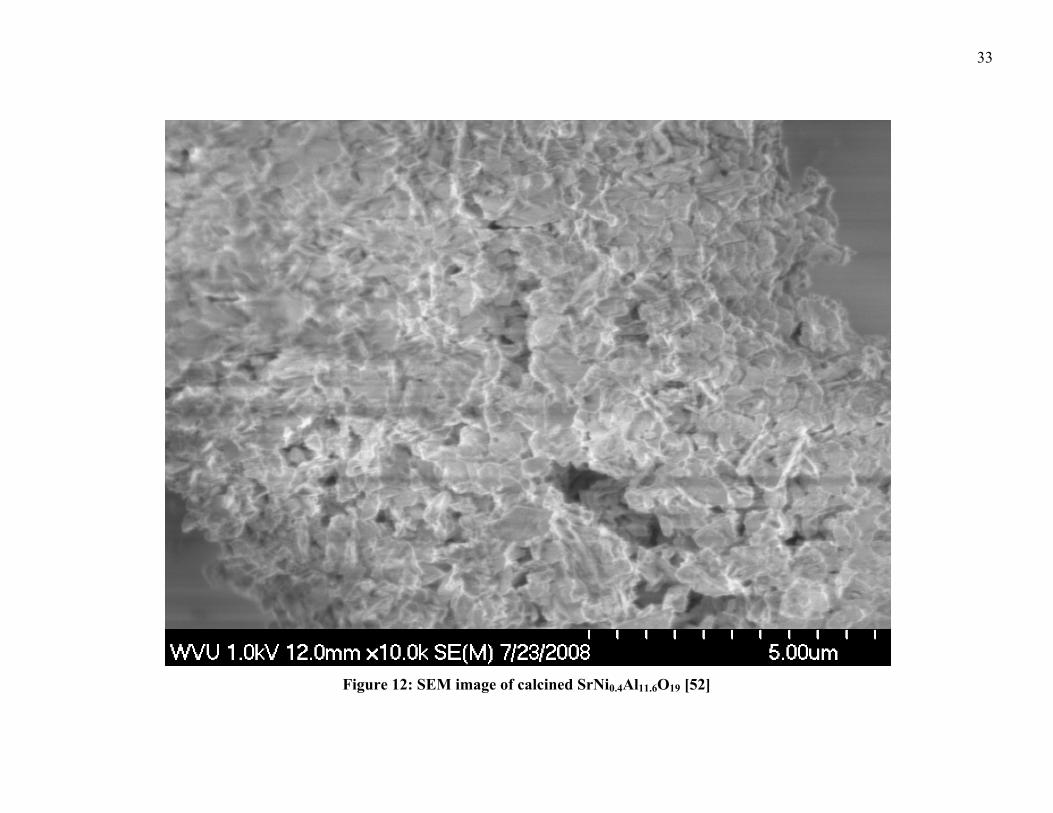
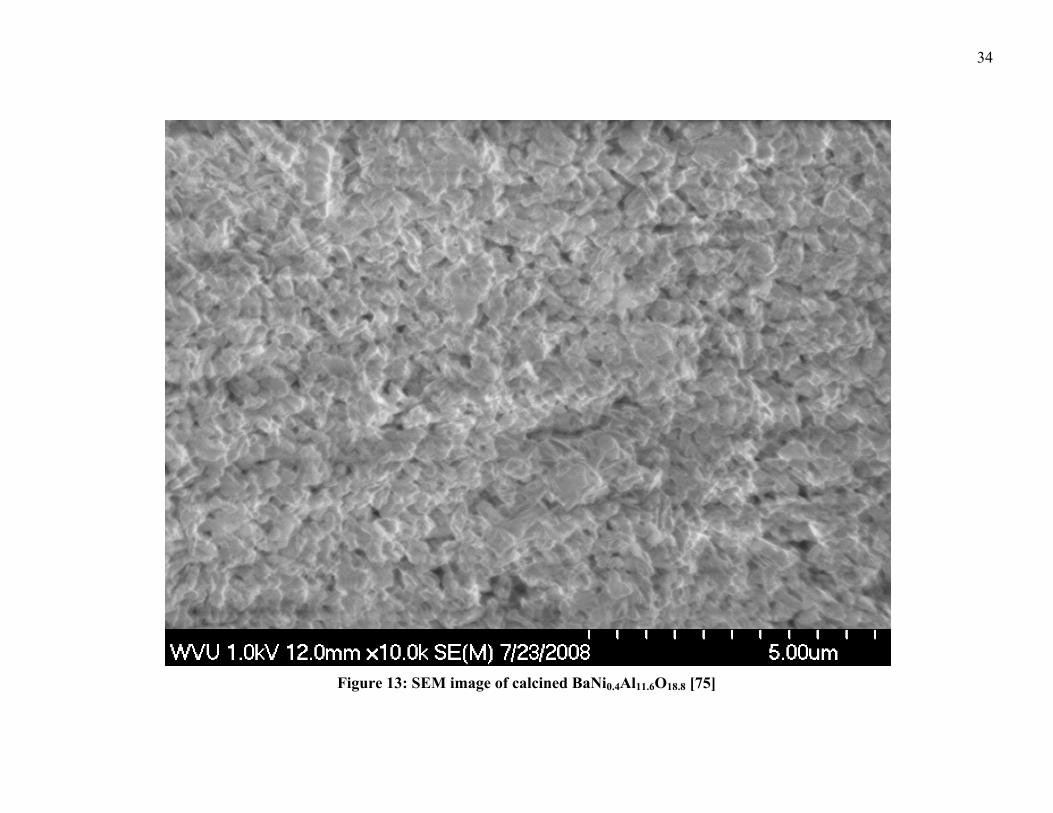
conditions as described in Section 3.1. Figures 10, 11 and 12 illustrate the
LaNi0.4Al11.6O19 [35], SrNi0.4Al11.6O19 [52] and BaNi0.4Al11.6O18.8 [75] samples
respectively, each at a magnification level of 10,000x. There does not seem to be a
uniform shape to describe all of the samples and all appear to be a cluster of
hexaaluminate particles. The SEM images of the mirror-cation-varied samples are very
similar to each other; however there seems to be slight differences on how the particles
agglomerate. The LaNi0.4Al11.6O19 [35] sample seems to have morphology similar to a
coral reef. The SrNi0.4Al11.6O19 [52] sample appears to be more like a collection of
breakfast-cereal flakes. BaNi0.4Al11.6O18.8 [75] has particles that might be described as
having the appearance of steamed rice.
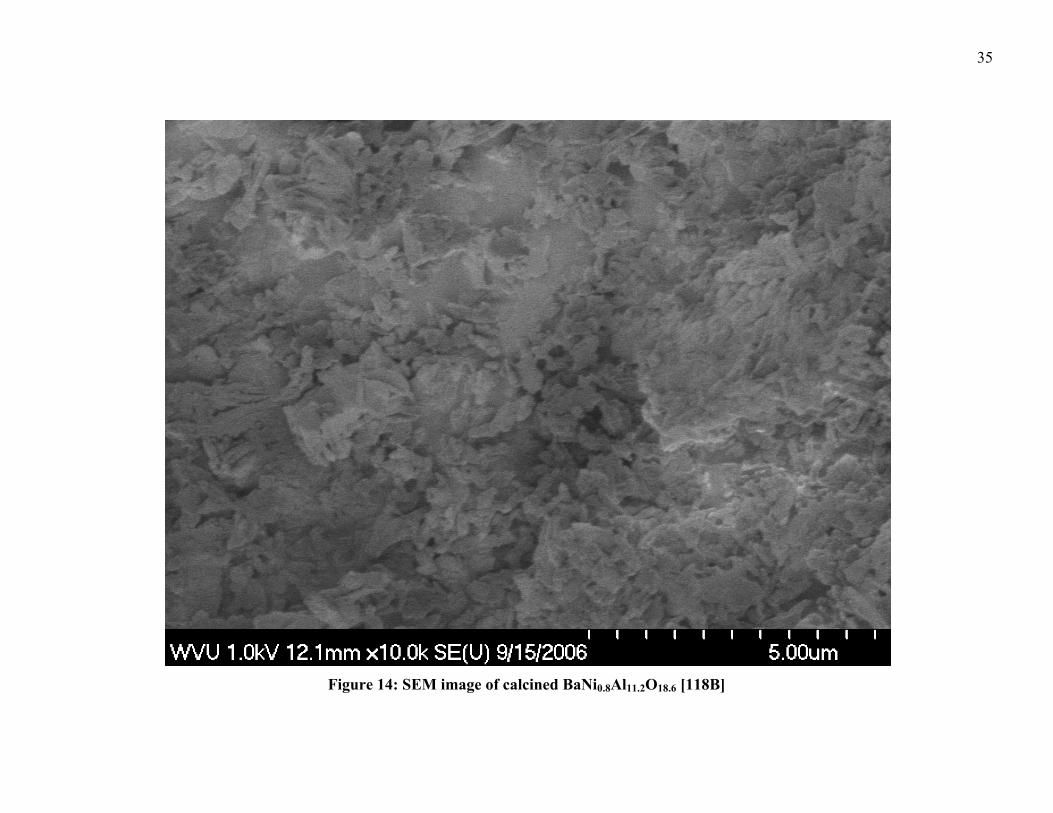
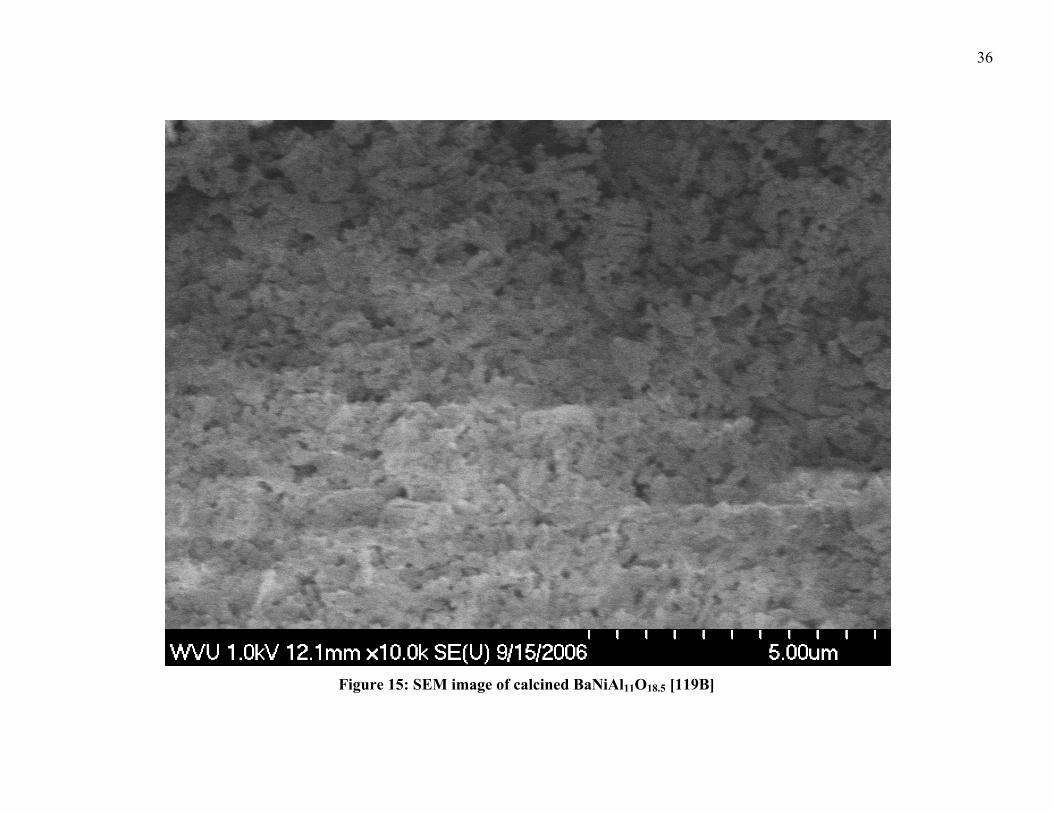
The series of Ni-substituted Ba hexaaluminates was also examined by SEM and
the images of BaNi0.8Al11.2O18.6 [118B] and BaNiAl11O18.5 [119B] are provided in Figures
13 and 14 respectively. There appears to be little to no difference between the
morphology of the different Ni-substituted Ba catalysts. The similarity between samples
indicates that the percentage of Ni is low enough that variations do not have a substantial
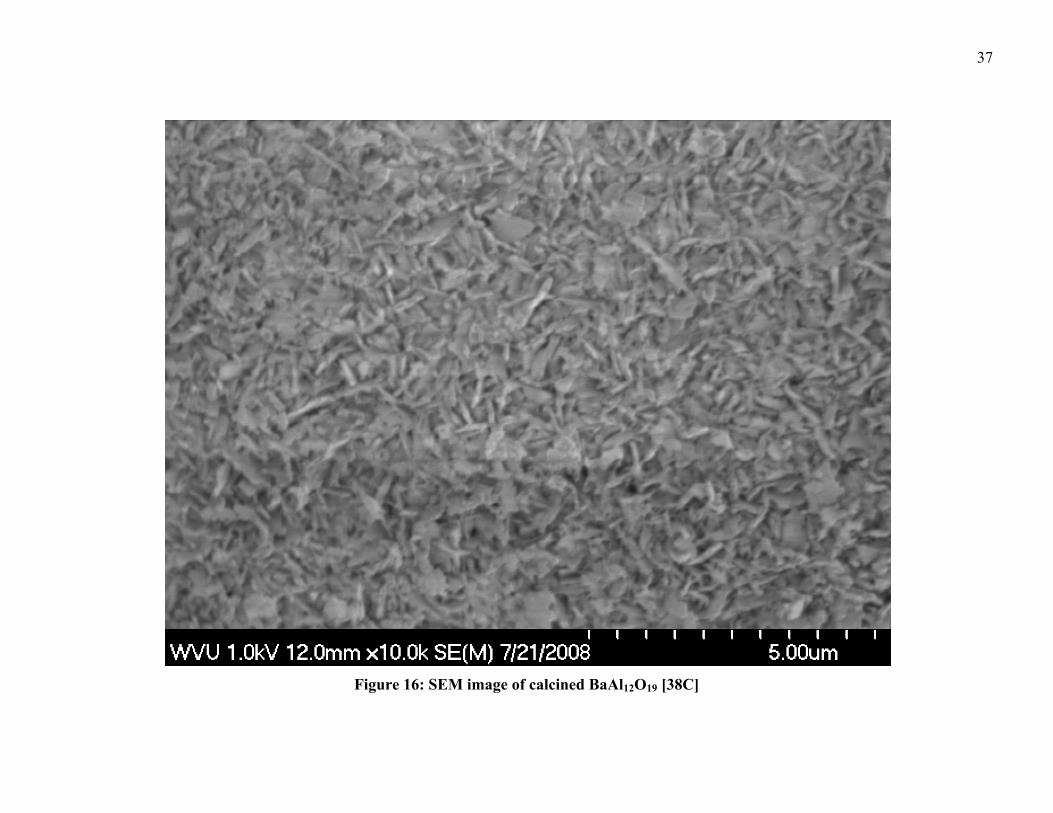
effect on surface morphology. Figure 15 is an image of BaAl12O19 [38C] which does not
contain any Ni. The BaAl12O19 [38C] sample appears to have thinner flaky, sometimes
needle-like architecture and has a different morphology than the other hexaaluminates
that contain Ni.
32
Figure 11: SEM image of calcined LaNi0.4Al11.6O19 [35]
33
Figure 12: SEM image of calcined SrNi0.4Al11.6O19 [52]
34
Figure 13: SEM image of calcined BaNi0.4Al11.6O18.8 [75]
35
Figure 14: SEM image of calcined BaNi0.8Al11.2O18.6 [118B]
36
Figure 15: SEM image of calcined BaNiAl11O18.5 [119B]
37
Figure 16: SEM image of calcined BaAl12O19 [38C]
38
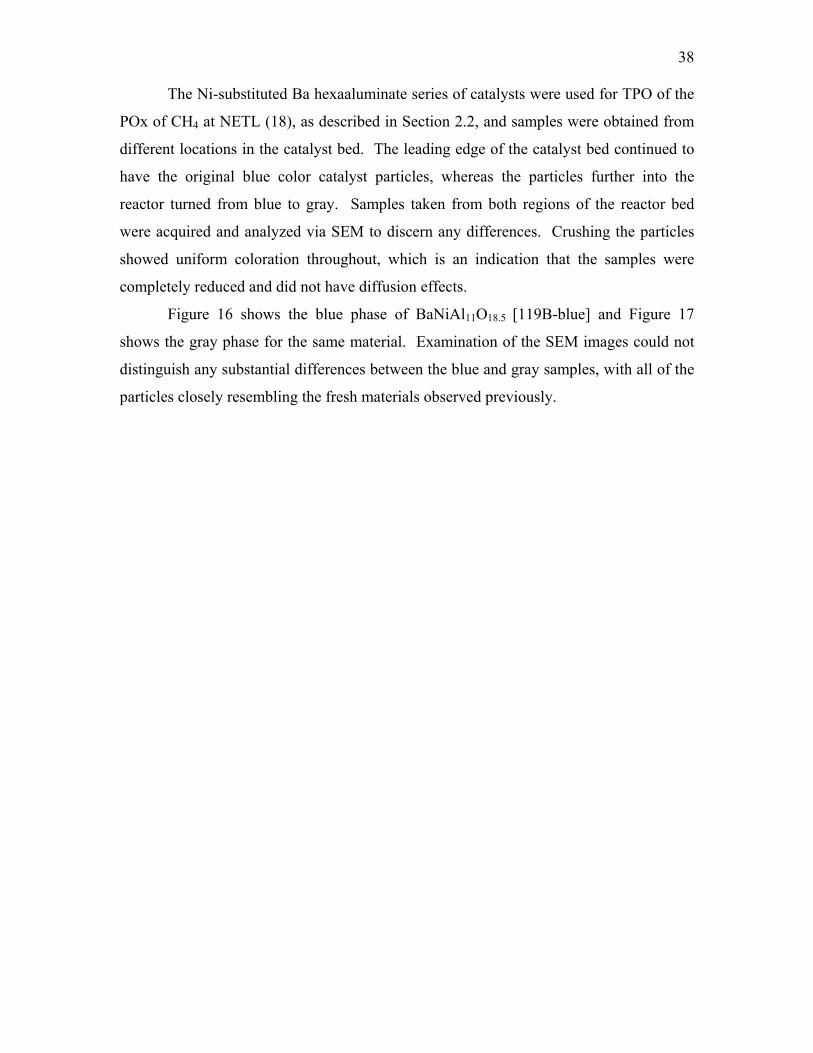
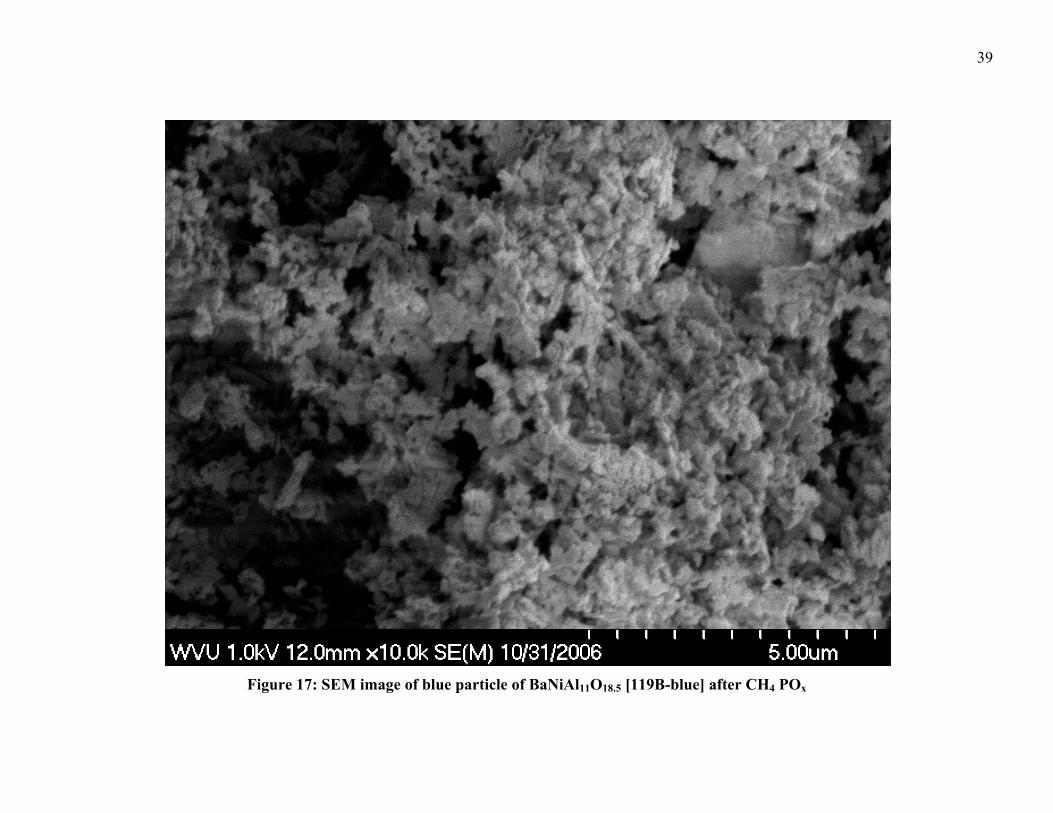
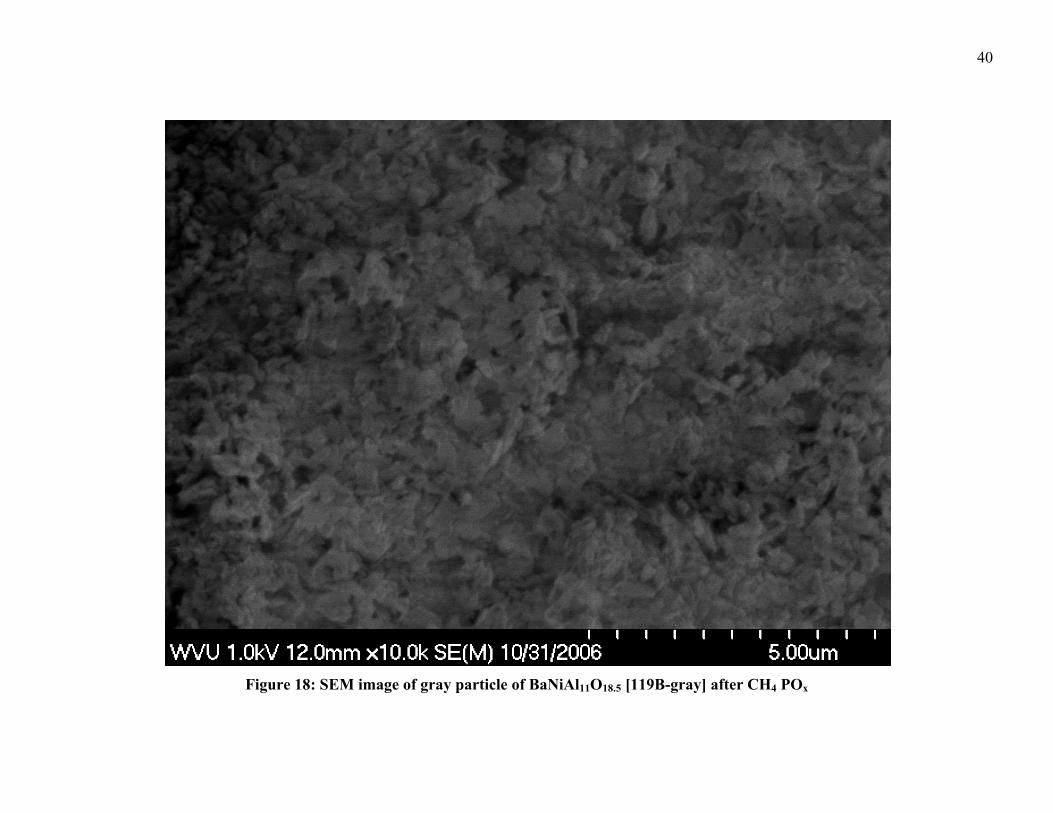
The Ni-substituted Ba hexaaluminate series of catalysts were used for TPO of the
POx of CH4 at NETL (18), as described in Section 2.2, and samples were obtained from
different locations in the catalyst bed. The leading edge of the catalyst bed continued to
have the original blue color catalyst particles, whereas the particles further into the
reactor turned from blue to gray. Samples taken from both regions of the reactor bed
were acquired and analyzed via SEM to discern any differences. Crushing the particles
showed uniform coloration throughout, which is an indication that the samples were
completely reduced and did not have diffusion effects.
Figure 16 shows the blue phase of BaNiAl11O18.5 [119B-blue] and Figure 17
shows the gray phase for the same material. Examination of the SEM images could not
distinguish any substantial differences between the blue and gray samples, with all of the
particles closely resembling the fresh materials observed previously.
39
Figure 17: SEM image of blue particle of BaNiAl11O18.5 [119B-blue] after CH4 POx
40
Figure 18: SEM image of gray particle of BaNiAl11O18.5 [119B-gray] after CH4 POx
41
4.2 XRD
4.2.1 UCR
Unit-cell refinement was performed on all of the fresh hexaaluminate catalyst
samples with the XRD scan taken at 25°C. These samples were run in 0.5 mm quartz
capillary tubes. The wavelength of the beamline was calculated using LaB6 external
standards and determined to be 0.9209 Å for this series of measurements. The image
plate data of the scans were evaluated via Fit2D and imported into Jade to determine the
crystal lattice parameters of the samples. There are no Ni-substituted hexaaluminates
located in the ICDD database so non-substituted hexaaluminate formulas were used. The
XRD diffraction patterns for each of the three cation hexaaluminate samples types were
chosen from the best results of the search and match analysis in Jade using the ICDD
database. The ICDD crystal lattice parameters of the chosen patterns are displayed in
Table 3.
Table 3: ICDD Crystal Lattice Dimensions of Baseline Patterns
Name [ICDD#]
a,b (Å) c (Å) Volume (Å3)
LaAl11O18
[00-033-0699] 5.561 22.041 590.29
LaAlO3
[00-031-0022] 5.364 13.110 326.67
SrAl12O19
[04-007-6069] 5.562 21.972 588.66
Ba0.75Al11O17.25
[04-010-2927] 5.582 22.715 612.95
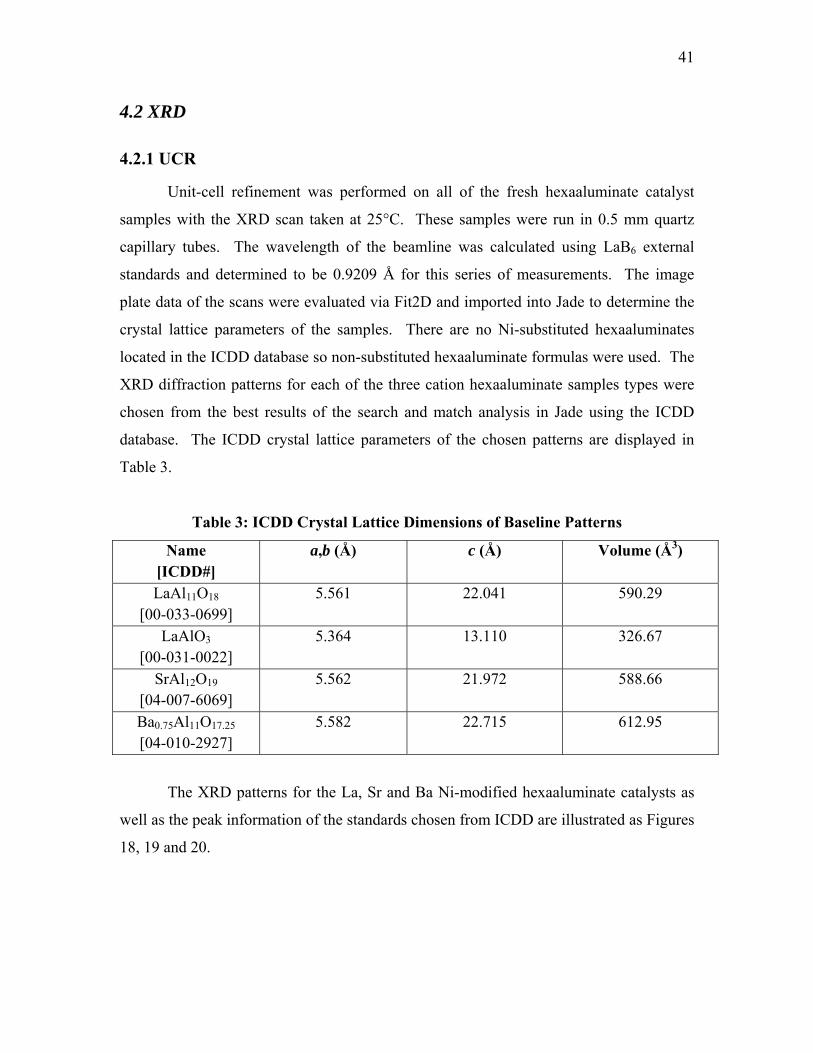
The XRD patterns for the La, Sr and Ba Ni-modified hexaaluminate catalysts as
well as the peak information of the standards chosen from ICDD are illustrated as Figures
18, 19 and 20.
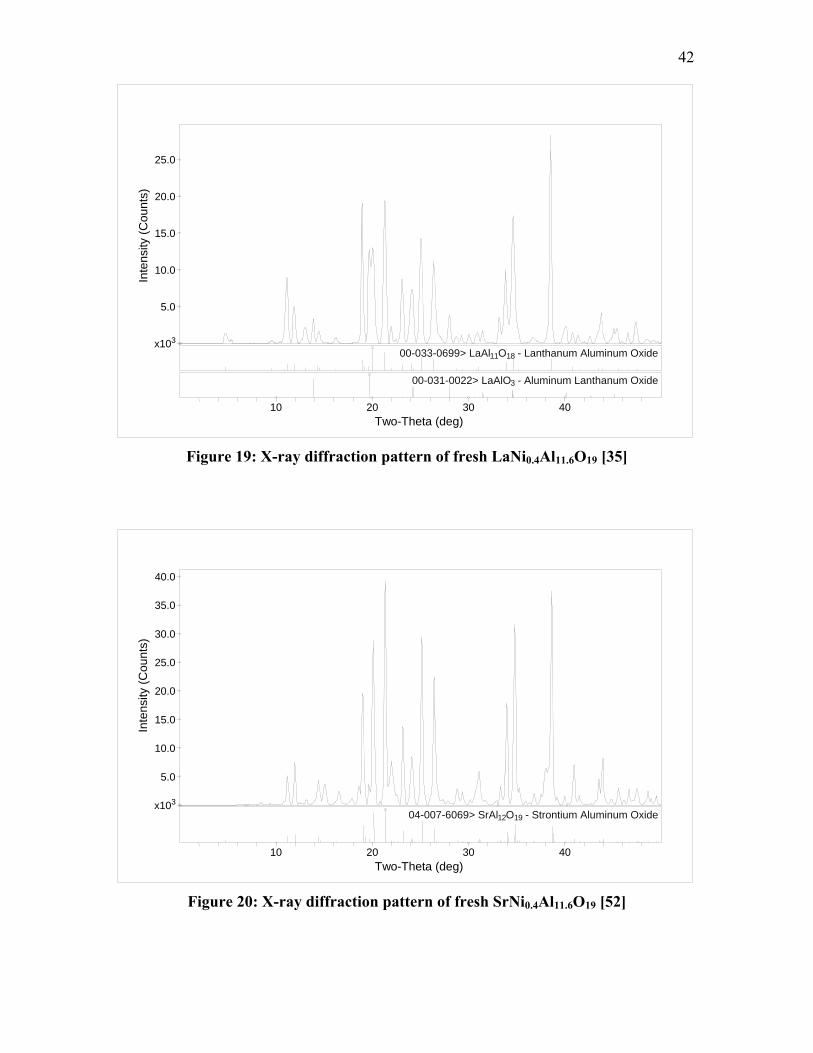
42
4020 30Two-Theta (deg)
10
00-031-0022> LaAlO3 - Aluminum Lanthanum Oxide
O18 - Lanthanum Aluminum Oxide00-033-0699> LaAl11
Inte
nsity
(Cou
nts)
25.0
20.0
15.0
10.0
5.0
3x10
Figure 19: X-ray diffraction pattern of fresh LaNi0.4Al11.6O19 [35]
Inte
nsity
(Cou
nts)
4020 30Two-Theta (deg)
10
- Strontium Aluminum Oxide19O04-007-6069> SrAl12
40.0
35.0
30.0
25.0
20.0
15.0
10.0
5.0 3x10
Figure 20: X-ray diffraction pattern of fresh SrNi0.4Al11.6O19 [52]
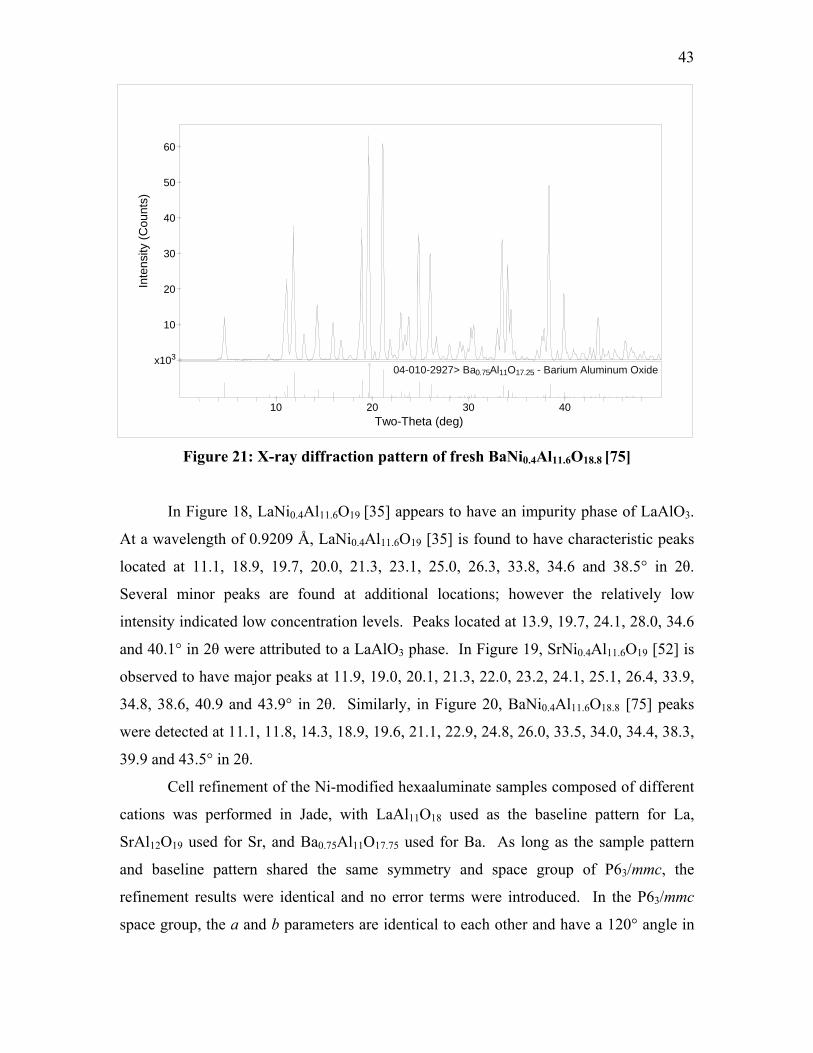
43
In Figure 18, LaNi0.4Al11.6O19 [35] appears to have an impurity phase of LaAlO3.
At a w
of the Ni-modified hexaaluminate samples composed of different
cations
Figure 21: X-ray diffraction sh BaNi0.4Al11.6O18.8 [75]
x1
60
50
nts)
40
Inte
nsity
(Cou
30
20
10
03
04-010-2927> Ba0.75Al11O17.25 - Barium Aluminum Oxide
10 20 30 40Two-Theta (deg)
pattern of fre
avelength of 0.9209 Å, LaNi0.4Al11.6O19 [35] is found to have characteristic peaks
located at 11.1, 18.9, 19.7, 20.0, 21.3, 23.1, 25.0, 26.3, 33.8, 34.6 and 38.5° in 2θ.
Several minor peaks are found at additional locations; however the relatively low
intensity indicated low concentration levels. Peaks located at 13.9, 19.7, 24.1, 28.0, 34.6
and 40.1° in 2θ were attributed to a LaAlO3 phase. In Figure 19, SrNi0.4Al11.6O19 [52] is
observed to have major peaks at 11.9, 19.0, 20.1, 21.3, 22.0, 23.2, 24.1, 25.1, 26.4, 33.9,
34.8, 38.6, 40.9 and 43.9° in 2θ. Similarly, in Figure 20, BaNi0.4Al11.6O18.8 [75] peaks
were detected at 11.1, 11.8, 14.3, 18.9, 19.6, 21.1, 22.9, 24.8, 26.0, 33.5, 34.0, 34.4, 38.3,
39.9 and 43.5° in 2θ.
Cell refinement
was performed in Jade, with LaAl11O18 used as the baseline pattern for La,
SrAl12O19 used for Sr, and Ba0.75Al11O17.75 used for Ba. As long as the sample pattern
and baseline pattern shared the same symmetry and space group of P63/mmc, the
refinement results were identical and no error terms were introduced. In the P63/mmc
space group, the a and b parameters are identical to each other and have a 120° angle in
44
relation to each other. The c parameter is arranged with an angle 90° to the direction of
both a and b.
The crystal lattice parameters that were calculated from the cell refinement of
fresh, unreacted samples are presented in Table 4.
Table 4: Crystal Lattice Parameters of Fresh Ni-Substituted La, Sr and Ba
Hexaaluminates
Sample Name [ID#]
a,b (Å) c (Å) Volume (Å3)
LaNi0.4Al11.6O19
[35] 5.575 ± 0.014
22.034 ± 0.009
592.98 ± 2.095
SrNi0.4Al11.6O19
[52] 5.560 ± 0.021
21.971 ± 0.007
588.13 ± 3.160
BaNi0.4Al11.6O18.8
[75] 5.596 ± 0.021
22.684 ± 0.005
615.17 ± 3.211
The data obtained from the cell refinements in Table 4 are comparable to the ICDD
database values for the baseline patterns presented in Table 3. There are a few extra
peaks in the spectra of the diffraction patterns are attributed to the presence of an
impurity, as in the case of LaNi0.4Al11.6O19 [35].
Cell refinement of the fresh Ba hexaaluminate samples with varying Ni
substitution was also performed via Jade with Ba0.75Al11O17.25 used as the baseline
pattern. Other than some minor differences in intensity, when compared to Figure 20,
there are not any significant differences observed in the X-ray patterns over the
remaining Ba series of catalysts. The crystal lattice parameters that were calculated from
the cell refinement are presented in Table 5.
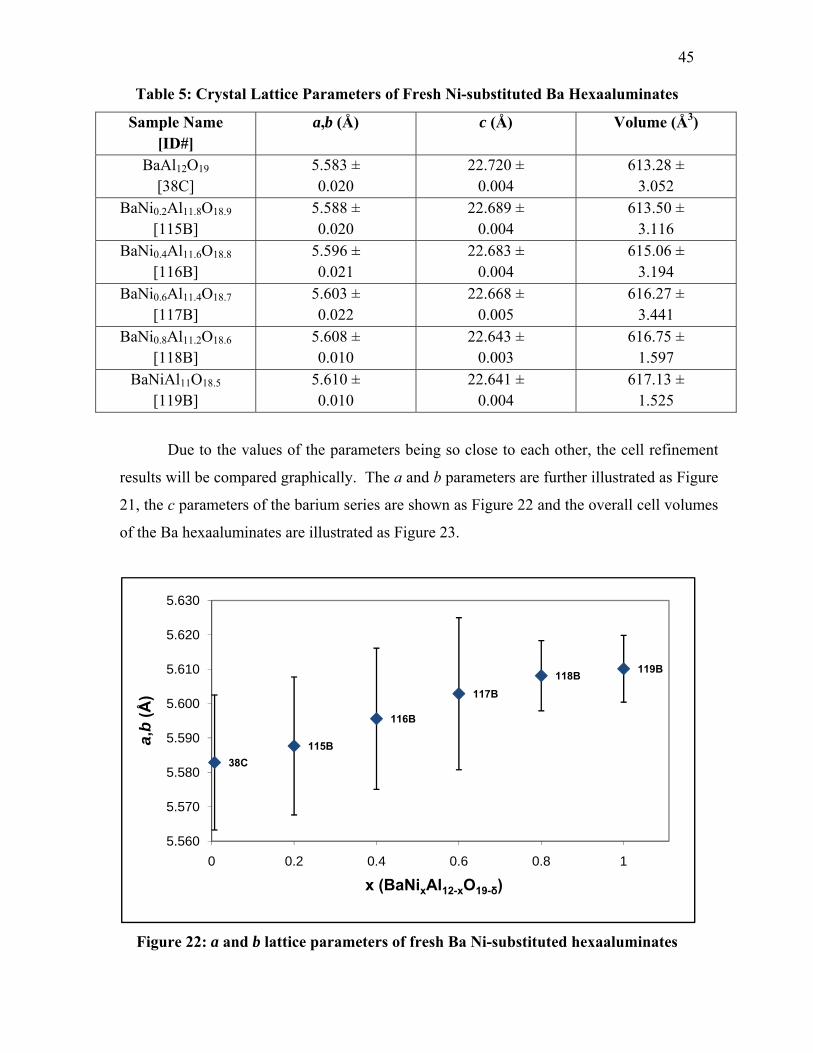
45
Table 5: Crystal Lattice Parameters of Fresh Ni-substituted Ba Hexaaluminates
Sample Name [ID#]
a,b (Å) c (Å) Volume (Å3)
BaAl12O19
[38C] 5.583 ± 0.020
22.720 ± 0.004
613.28 ± 3.052
BaNi0.2Al11.8O18.9
[115B] 5.588 ± 0.020
22.689 ± 0.004
613.50 ± 3.116
BaNi0.4Al11.6O18.8
[116B] 5.596 ± 0.021
22.683 ± 0.004
615.06 ± 3.194
BaNi0.6Al11.4O18.7
[117B] 5.603 ± 0.022
22.668 ± 0.005
616.27 ± 3.441
BaNi0.8Al11.2O18.6
[118B] 5.608 ± 0.010
22.643 ± 0.003
616.75 ± 1.597
BaNiAl11O18.5
[119B] 5.610 ± 0.010
22.641 ± 0.004
617.13 ± 1.525
Due to the values of the parameters being so close to each other, the cell refinement
results will be compared graphically. The a and b parameters are further illustrated as Figure
21, the c parameters of the barium series are shown as Figure 22 and the overall cell volumes
of the Ba hexaaluminates are illustrated as Figure 23.
115B
116B
117B118B 119B
38C
5.560
5.570
5.580
5.590
5.600
5.610
5.620
5.630
0 0.2 0.4 0.6 0.8 1
a,b
(Å)
x (BaNixAl12-xO19-δ)
Figure 22: a and b lattice parameters of fresh Ba Ni-substituted hexaaluminates
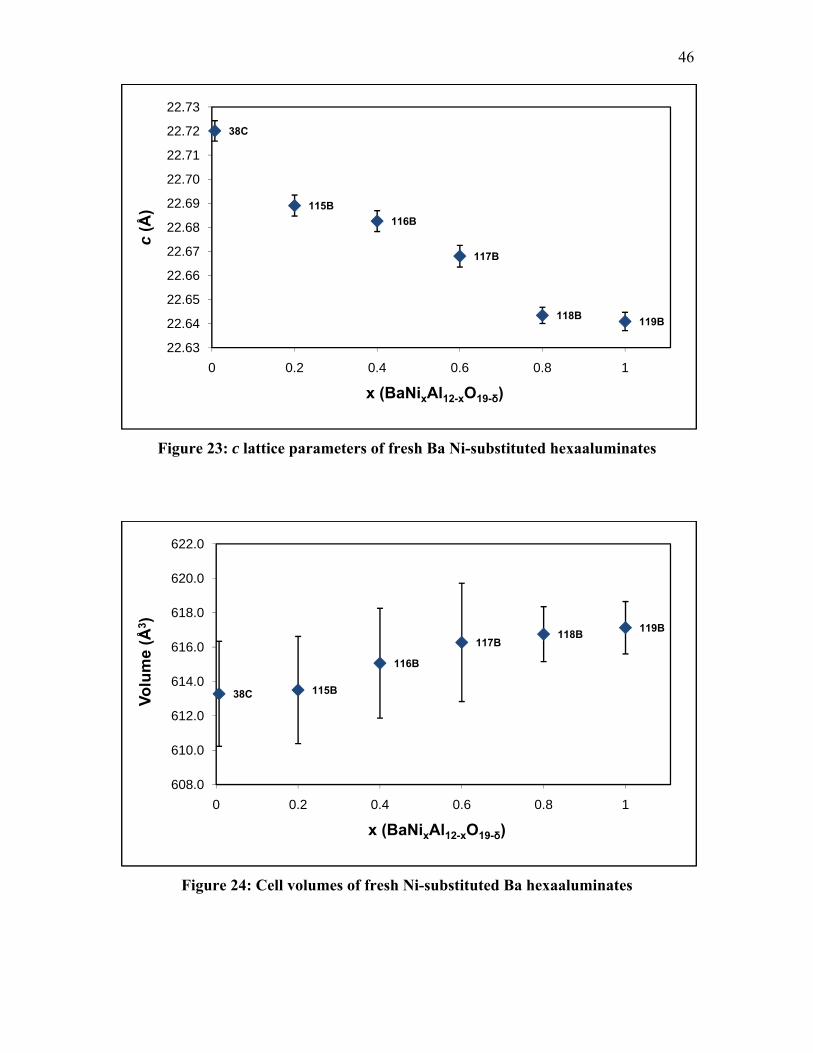
46
115B116B
117B
118B 119B
38C
22.63
22.64
22.65
22.66
22.67
22.68
22.69
22.70
22.71
22.72
22.73
0 0.2 0.4 0.6 0.8 1
c(Å
)
x (BaNixAl12-xO19-δ)
Figure 23: c lattice parameters of fresh Ba Ni-substituted hexaaluminates
38C 115B
116B
117B118B 119B
608.0
610.0
612.0
614.0
616.0
618.0
620.0
622.0
0 0.2 0.4 0.6 0.8 1
Volu
me
(Å3 )
x (BaNixAl12-xO19-δ)
Figure 24: Cell volumes of fresh Ni-substituted Ba hexaaluminates
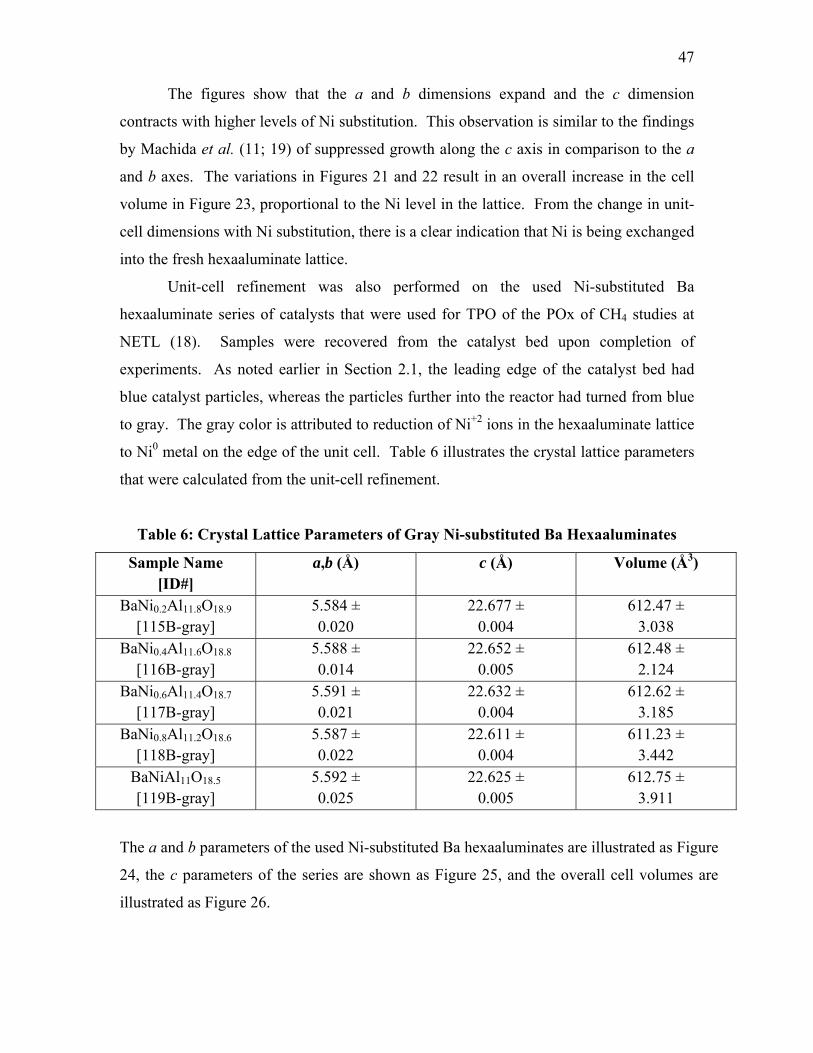
47
The figures show that the a and b dimensions expand and the c dimension
contracts with higher levels of Ni substitution. This observation is similar to the findings
by Machida et al. (11; 19) of suppressed growth along the c axis in comparison to the a
and b axes. The variations in Figures 21 and 22 result in an overall increase in the cell
volume in Figure 23, proportional to the Ni level in the lattice. From the change in unit-
cell dimensions with Ni substitution, there is a clear indication that Ni is being exchanged
into the fresh hexaaluminate lattice.
Unit-cell refinement was also performed on the used Ni-substituted Ba
hexaaluminate series of catalysts that were used for TPO of the POx of CH4 studies at
NETL (18). Samples were recovered from the catalyst bed upon completion of
experiments. As noted earlier in Section 2.1, the leading edge of the catalyst bed had
blue catalyst particles, whereas the particles further into the reactor had turned from blue
to gray. The gray color is attributed to reduction of Ni+2 ions in the hexaaluminate lattice
to Ni0 metal on the edge of the unit cell. Table 6 illustrates the crystal lattice parameters
that were calculated from the unit-cell refinement.
Table 6: Crystal Lattice Parameters of Gray Ni-substituted Ba Hexaaluminates
Sample Name [ID#]
a,b (Å) c (Å) Volume (Å3)
BaNi0.2Al11.8O18.9
[115B-gray] 5.584 ± 0.020
22.677 ± 0.004
612.47 ± 3.038
BaNi0.4Al11.6O18.8
[116B-gray] 5.588 ± 0.014
22.652 ± 0.005
612.48 ± 2.124
BaNi0.6Al11.4O18.7
[117B-gray] 5.591 ± 0.021
22.632 ± 0.004
612.62 ± 3.185
BaNi0.8Al11.2O18.6
[118B-gray] 5.587 ± 0.022
22.611 ± 0.004
611.23 ± 3.442
BaNiAl11O18.5
[119B-gray] 5.592 ± 0.025
22.625 ± 0.005
612.75 ± 3.911
The a and b parameters of the used Ni-substituted Ba hexaaluminates are illustrated as Figure
24, the c parameters of the series are shown as Figure 25, and the overall cell volumes are
illustrated as Figure 26.
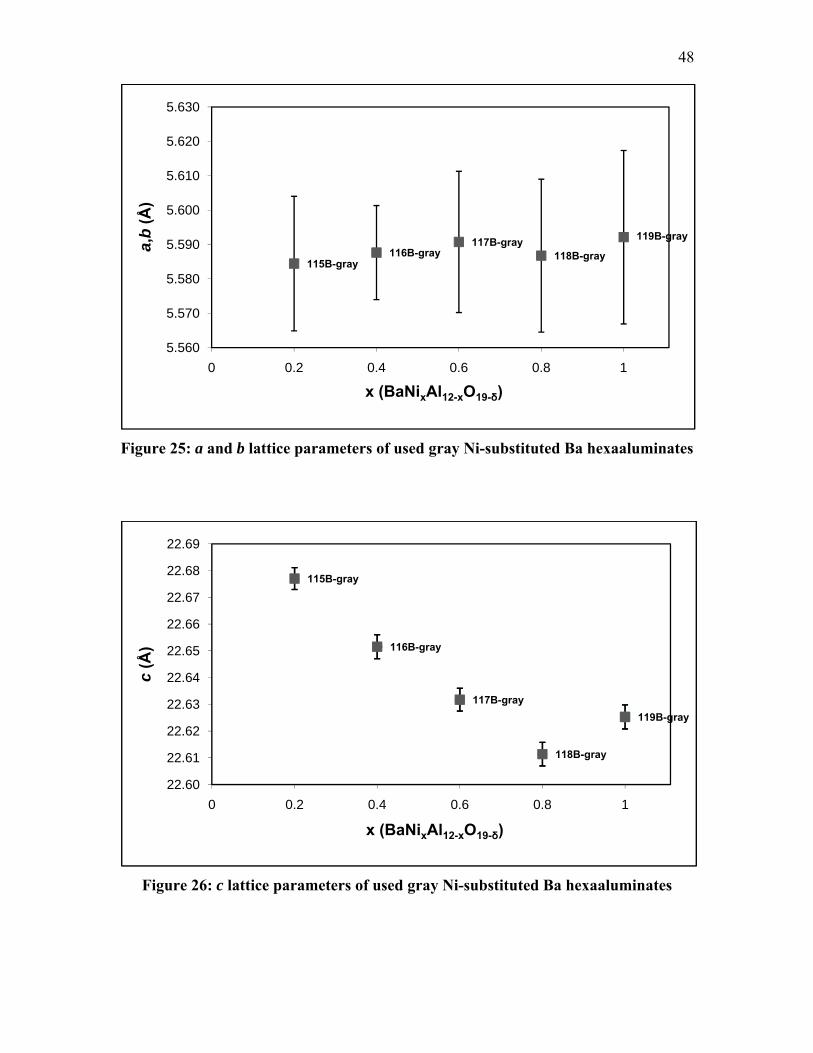
48
115B-gray116B-gray
117B-gray118B-gray
119B-gray
5.560
5.570
5.580
5.590
5.600
5.610
5.620
5.630
0 0.2 0.4 0.6 0.8 1
a,b
(Å)
x (BaNixAl12-xO19-δ)
Figure 25: a and b lattice parameters of used gray Ni-substituted Ba hexaaluminates
115B-gray
116B-gray
117B-gray
118B-gray
119B-gray
22.60
22.61
22.62
22.63
22.64
22.65
22.66
22.67
22.68
22.69
0 0.2 0.4 0.6 0.8 1
c(Å
)
x (BaNixAl12-xO19-δ)
Figure 26: c lattice parameters of used gray Ni-substituted Ba hexaaluminates
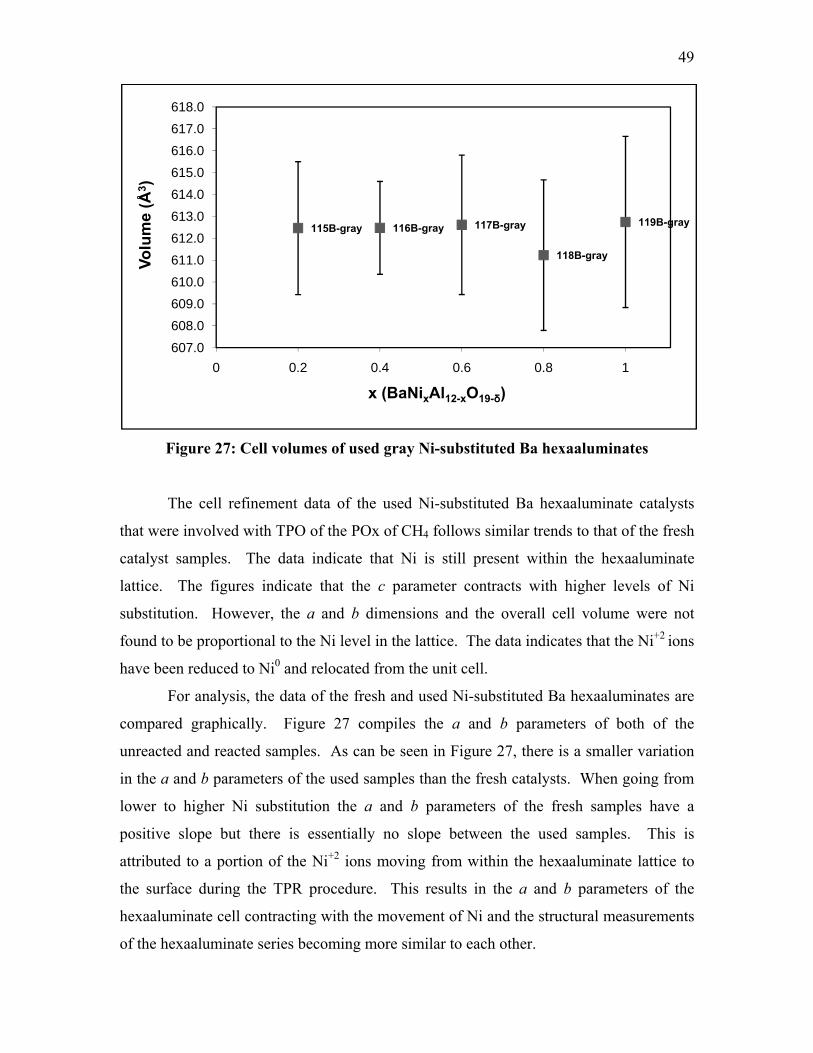
49
115B-gray 116B-gray 117B-gray
118B-gray
119B-gray
607.0608.0609.0610.0611.0612.0613.0614.0615.0616.0617.0618.0
0 0.2 0.4 0.6 0.8 1
Volu
me
(Å3 )
x (BaNixAl12-xO19-δ)
Figure 27: Cell volumes of used gray Ni-substituted Ba hexaaluminates
The cell refinement data of the used Ni-substituted Ba hexaaluminate catalysts
that were involved with TPO of the POx of CH4 follows similar trends to that of the fresh
catalyst samples. The data indicate that Ni is still present within the hexaaluminate
lattice. The figures indicate that the c parameter contracts with higher levels of Ni
substitution. However, the a and b dimensions and the overall cell volume were not
found to be proportional to the Ni level in the lattice. The data indicates that the Ni+2 ions
have been reduced to Ni0 and relocated from the unit cell.
For analysis, the data of the fresh and used Ni-substituted Ba hexaaluminates are
compared graphically. Figure 27 compiles the a and b parameters of both of the
unreacted and reacted samples. As can be seen in Figure 27, there is a smaller variation
in the a and b parameters of the used samples than the fresh catalysts. When going from
lower to higher Ni substitution the a and b parameters of the fresh samples have a
positive slope but there is essentially no slope between the used samples. This is
attributed to a portion of the Ni+2 ions moving from within the hexaaluminate lattice to
the surface during the TPR procedure. This results in the a and b parameters of the
hexaaluminate cell contracting with the movement of Ni and the structural measurements
of the hexaaluminate series becoming more similar to each other.
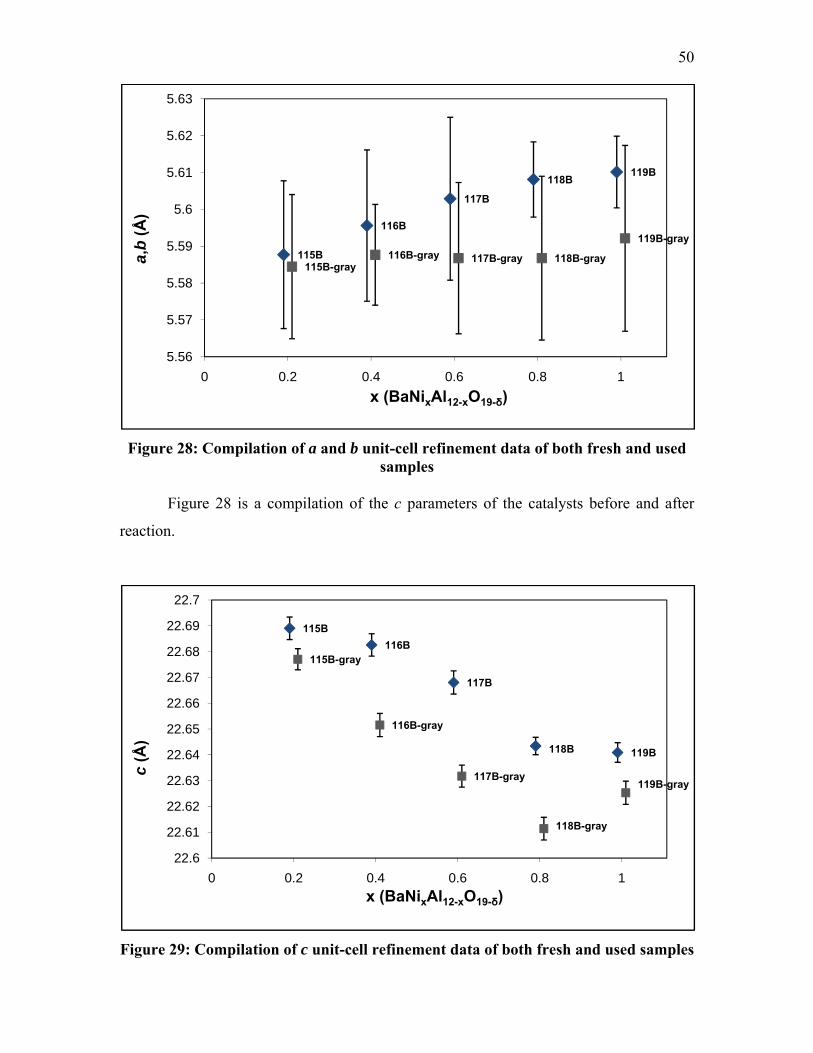
50
115B
116B
117B
118B119B
115B-gray116B-gray 117B-gray 118B-gray
119B-gray
5.56
5.57
5.58
5.59
5.6
5.61
5.62
5.63
0 0.2 0.4 0.6 0.8 1
a,b
(Å)
x (BaNixAl12-xO19-δ)
Figure 28: Compilation of a and b unit-cell refinement data of both fresh and used samples
Figure 28 is a compilation of the c parameters of the catalysts before and after
reaction.
115B116B
117B
118B 119B
115B-gray
116B-gray
117B-gray
118B-gray
119B-gray
22.6
22.61
22.62
22.63
22.64
22.65
22.66
22.67
22.68
22.69
22.7
0 0.2 0.4 0.6 0.8 1
c(Å
)
x (BaNixAl12-xO19-δ)
Figure 29: Compilation of c unit-cell refinement data of both fresh and used samples
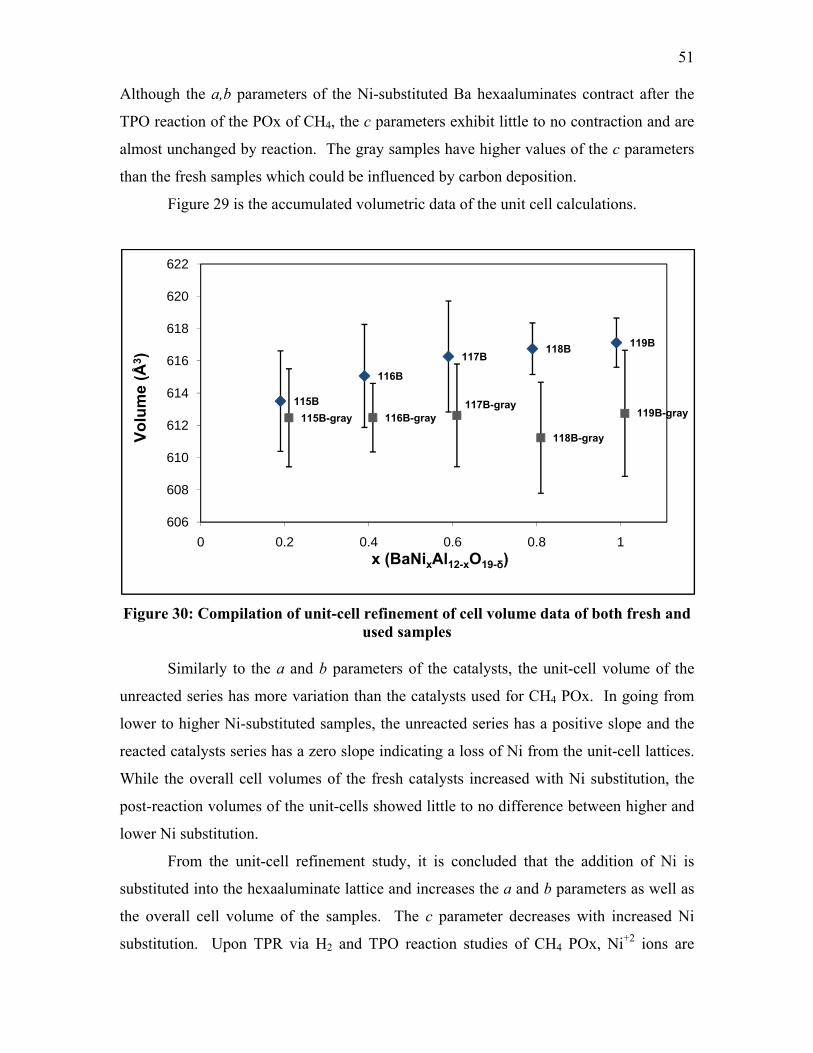
51
Although the a,b parameters of the Ni-substituted Ba hexaaluminates contract after the
TPO reaction of the POx of CH4, the c parameters exhibit little to no contraction and are
almost unchanged by reaction. The gray samples have higher values of the c parameters
than the fresh samples which could be influenced by carbon deposition.
Figure 29 is the accumulated volumetric data of the unit cell calculations.
115B
116B
117B118B 119B
115B-gray 116B-gray117B-gray
118B-gray
119B-gray
606
608
610
612
614
616
618
620
622
0 0.2 0.4 0.6 0.8 1
Volu
me
(Å3 )
x (BaNixAl12-xO19-δ)
Figure 30: Compilation of unit-cell refinement of cell volume data of both fresh and
used samples
Similarly to the a and b parameters of the catalysts, the unit-cell volume of the
unreacted series has more variation than the catalysts used for CH4 POx. In going from
lower to higher Ni-substituted samples, the unreacted series has a positive slope and the
reacted catalysts series has a zero slope indicating a loss of Ni from the unit-cell lattices.
While the overall cell volumes of the fresh catalysts increased with Ni substitution, the
post-reaction volumes of the unit-cells showed little to no difference between higher and
lower Ni substitution.
From the unit-cell refinement study, it is concluded that the addition of Ni is
substituted into the hexaaluminate lattice and increases the a and b parameters as well as
the overall cell volume of the samples. The c parameter decreases with increased Ni
substitution. Upon TPR via H2 and TPO reaction studies of CH4 POx, Ni+2 ions are
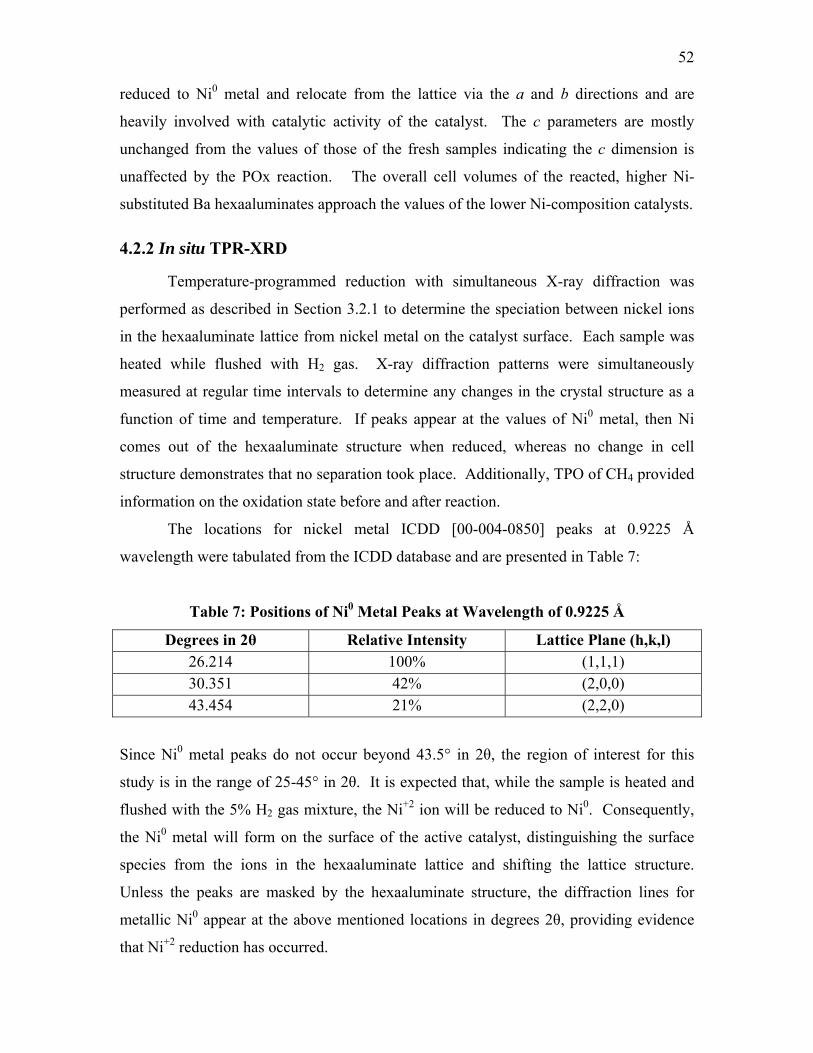
52
reduced to Ni0 metal and relocate from the lattice via the a and b directions and are
heavily involved with catalytic activity of the catalyst. The c parameters are mostly
unchanged from the values of those of the fresh samples indicating the c dimension is
unaffected by the POx reaction. The overall cell volumes of the reacted, higher Ni-
substituted Ba hexaaluminates approach the values of the lower Ni-composition catalysts.
4.2.2 In situ TPR-XRD
Temperature-programmed reduction with simultaneous X-ray diffraction was
performed as described in Section 3.2.1 to determine the speciation between nickel ions
in the hexaaluminate lattice from nickel metal on the catalyst surface. Each sample was
heated while flushed with H2 gas. X-ray diffraction patterns were simultaneously
measured at regular time intervals to determine any changes in the crystal structure as a
function of time and temperature. If peaks appear at the values of Ni0 metal, then Ni
comes out of the hexaaluminate structure when reduced, whereas no change in cell
structure demonstrates that no separation took place. Additionally, TPO of CH4 provided
information on the oxidation state before and after reaction.
The locations for nickel metal ICDD [00-004-0850] peaks at 0.9225 Å
wavelength were tabulated from the ICDD database and are presented in Table 7:
Table 7: Positions of Ni0 Metal Peaks at Wavelength of 0.9225 Å
Degrees in 2θ Relative Intensity Lattice Plane (h,k,l) 26.214 100% (1,1,1) 30.351 42% (2,0,0) 43.454 21% (2,2,0)
Since Ni0 metal peaks do not occur beyond 43.5° in 2θ, the region of interest for this
study is in the range of 25-45° in 2θ. It is expected that, while the sample is heated and
flushed with the 5% H2 gas mixture, the Ni+2 ion will be reduced to Ni0. Consequently,
the Ni0 metal will form on the surface of the active catalyst, distinguishing the surface
species from the ions in the hexaaluminate lattice and shifting the lattice structure.
Unless the peaks are masked by the hexaaluminate structure, the diffraction lines for
metallic Ni0 appear at the above mentioned locations in degrees 2θ, providing evidence
that Ni+2 reduction has occurred.
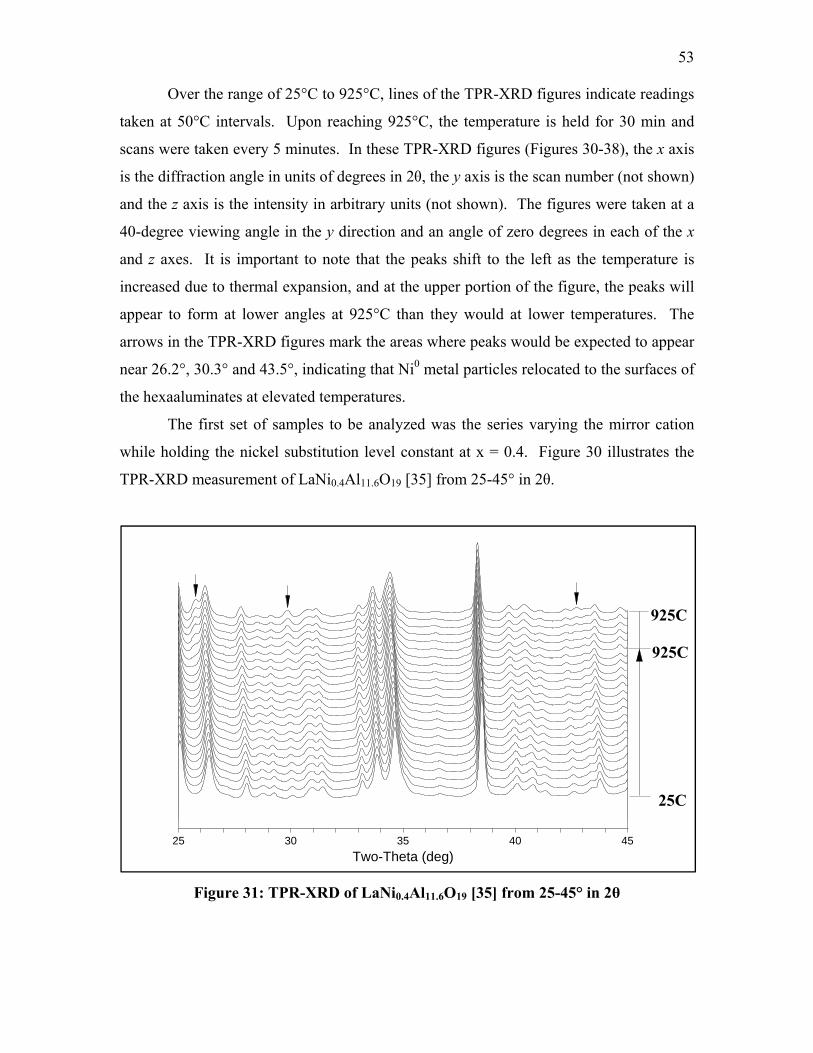
53
Over the range of 25°C to 925°C, lines of the TPR-XRD figures indicate readings
taken at 50°C intervals. Upon reaching 925°C, the temperature is held for 30 min and
scans were taken every 5 minutes. In these TPR-XRD figures (Figures 30-38), the x axis
is the diffraction angle in units of degrees in 2θ, the y axis is the scan number (not shown)
and the z axis is the intensity in arbitrary units (not shown). The figures were taken at a
40-degree viewing angle in the y direction and an angle of zero degrees in each of the x
and z axes. It is important to note that the peaks shift to the left as the temperature is
increased due to thermal expansion, and at the upper portion of the figure, the peaks will
appear to form at lower angles at 925°C than they would at lower temperatures. The
arrows in the TPR-XRD figures mark the areas where peaks would be expected to appear
near 26.2°, 30.3° and 43.5°, indicating that Ni0 metal particles relocated to the surfaces of
the hexaaluminates at elevated temperatures.
The first set of samples to be analyzed was the series varying the mirror cation
while holding the nickel substitution level constant at x = 0.4. Figure 30 illustrates the
TPR-XRD measurement of LaNi0.4Al11.6O19 [35] from 25-45° in 2θ.
Figure 31: TPR-XRD of LaNi0.4Al11.6O19 [35] from 25-45° in 2θ
25 30 35 40 45Two-Theta (deg)
25C
925C
925C
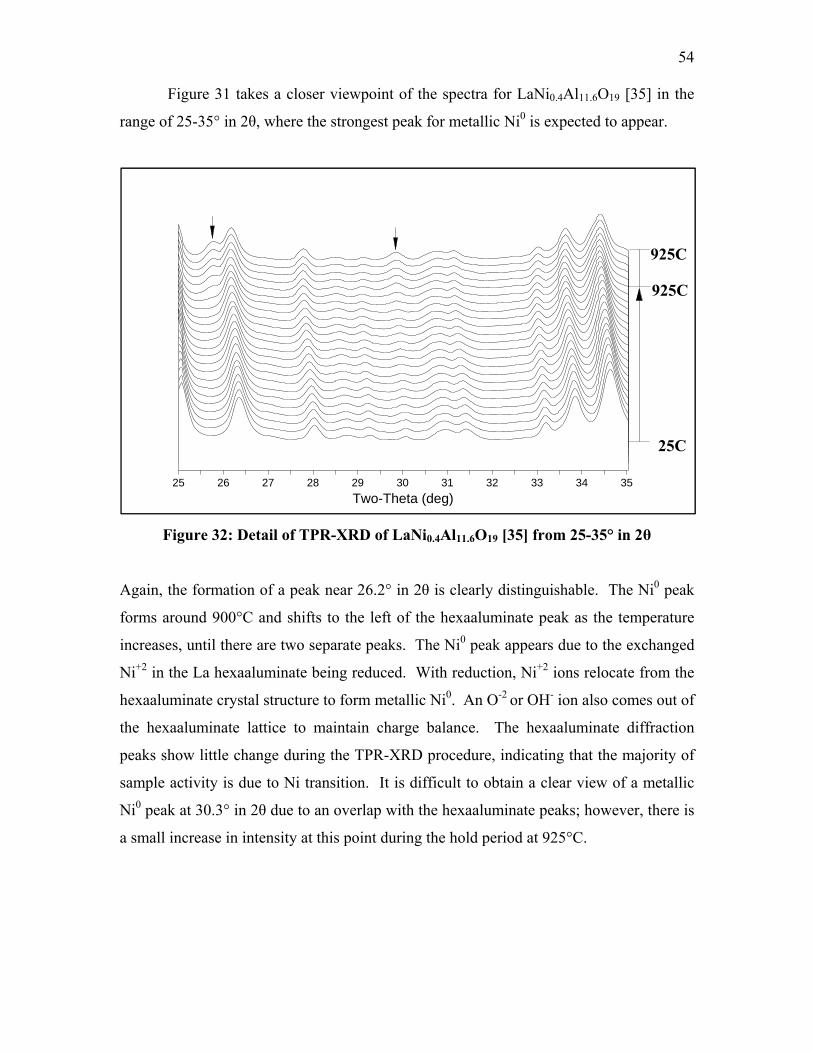
54
Figure 31 takes a closer viewpoint of the spectra for LaNi0.4Al11.6O19 [35] in the
range of 25-35° in 2θ, where the strongest peak for metallic Ni0 is expected to appear.
Figure 32: Detail of TPR-XRD of LaNi0.4Al11.6O19 [35] from 25-35° in 2θ
25 26 27 28 29 30 31 32 33 34 35Two-Theta (deg)
25C
925C
925C
Again, the formation of a peak near 26.2° in 2θ is clearly distinguishable. The Ni0 peak
forms around 900°C and shifts to the left of the hexaaluminate peak as the temperature
increases, until there are two separate peaks. The Ni0 peak appears due to the exchanged
Ni+2 in the La hexaaluminate being reduced. With reduction, Ni+2 ions relocate from the
hexaaluminate crystal structure to form metallic Ni0. An O-2 or OH- ion also comes out of
the hexaaluminate lattice to maintain charge balance. The hexaaluminate diffraction
peaks show little change during the TPR-XRD procedure, indicating that the majority of
sample activity is due to Ni transition. It is difficult to obtain a clear view of a metallic
Ni0 peak at 30.3° in 2θ due to an overlap with the hexaaluminate peaks; however, there is
a small increase in intensity at this point during the hold period at 925°C.
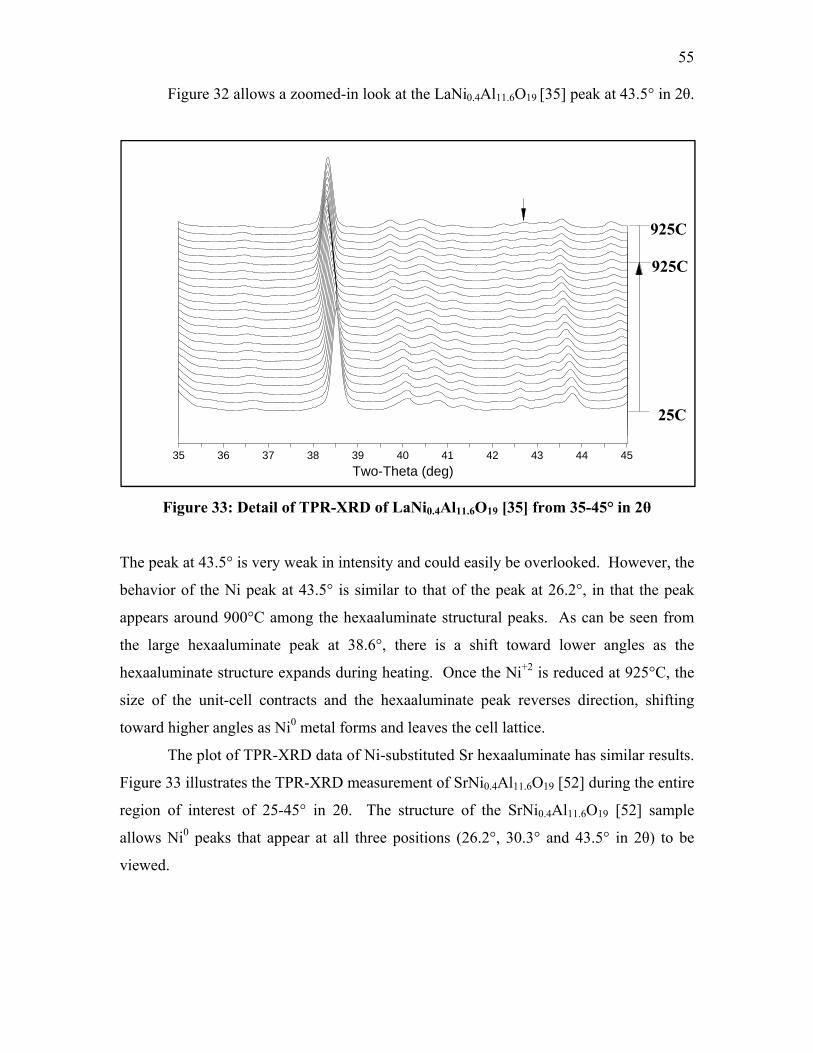
55
Figure 32 allows a zoomed-in look at the LaNi0.4Al11.6O19 [35] peak at 43.5° in 2θ.
Figure 33: Detail of TPR-XRD of LaNi0.4Al11.6O19 [35] from 35-45° in 2θ
35 36 37 38 39 40 41 42 43 44 45Two-Theta (deg)
25C
925C
925C
The peak at 43.5° is very weak in intensity and could easily be overlooked. However, the
behavior of the Ni peak at 43.5° is similar to that of the peak at 26.2°, in that the peak
appears around 900°C among the hexaaluminate structural peaks. As can be seen from
the large hexaaluminate peak at 38.6°, there is a shift toward lower angles as the
hexaaluminate structure expands during heating. Once the Ni+2 is reduced at 925°C, the
size of the unit-cell contracts and the hexaaluminate peak reverses direction, shifting
toward higher angles as Ni0 metal forms and leaves the cell lattice. The plot of TPR-XRD data of Ni-substituted Sr hexaaluminate has similar results.
Figure 33 illustrates the TPR-XRD measurement of SrNi0.4Al11.6O19 [52] during the entire
region of interest of 25-45° in 2θ. The structure of the SrNi0.4Al11.6O19 [52] sample
allows Ni0 peaks that appear at all three positions (26.2°, 30.3° and 43.5° in 2θ) to be
viewed.
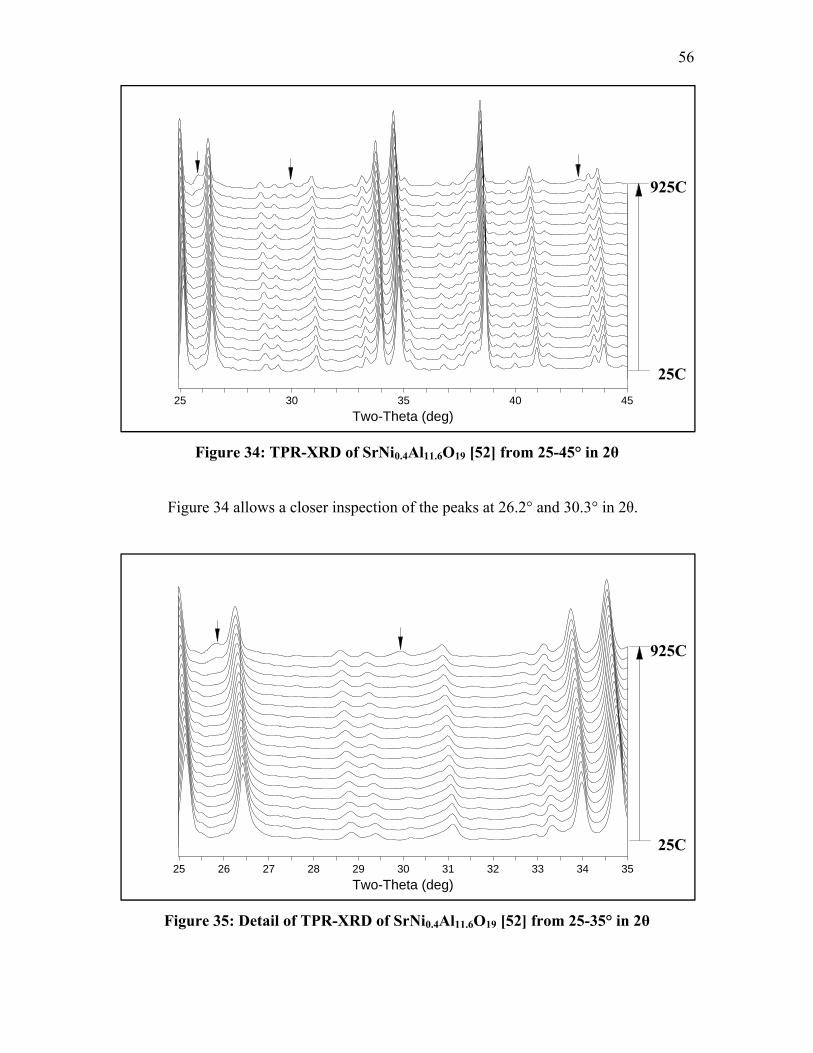
56
Figure 34: TPR-XRD of SrNi0.4Al11.6O19 [52] from 25-45° in 2θ
25 30 35 40 45Two-Theta (deg)
25C
925C
Figure 34 allows a closer inspection of the peaks at 26.2° and 30.3° in 2θ.
Figure 35: Detail of TPR-XRD of SrNi0.4Al11.6O19 [52] from 25-35° in 2θ
25 26 27 28 29 30 31 32 33 34 35Two-Theta (deg)
25C
925C
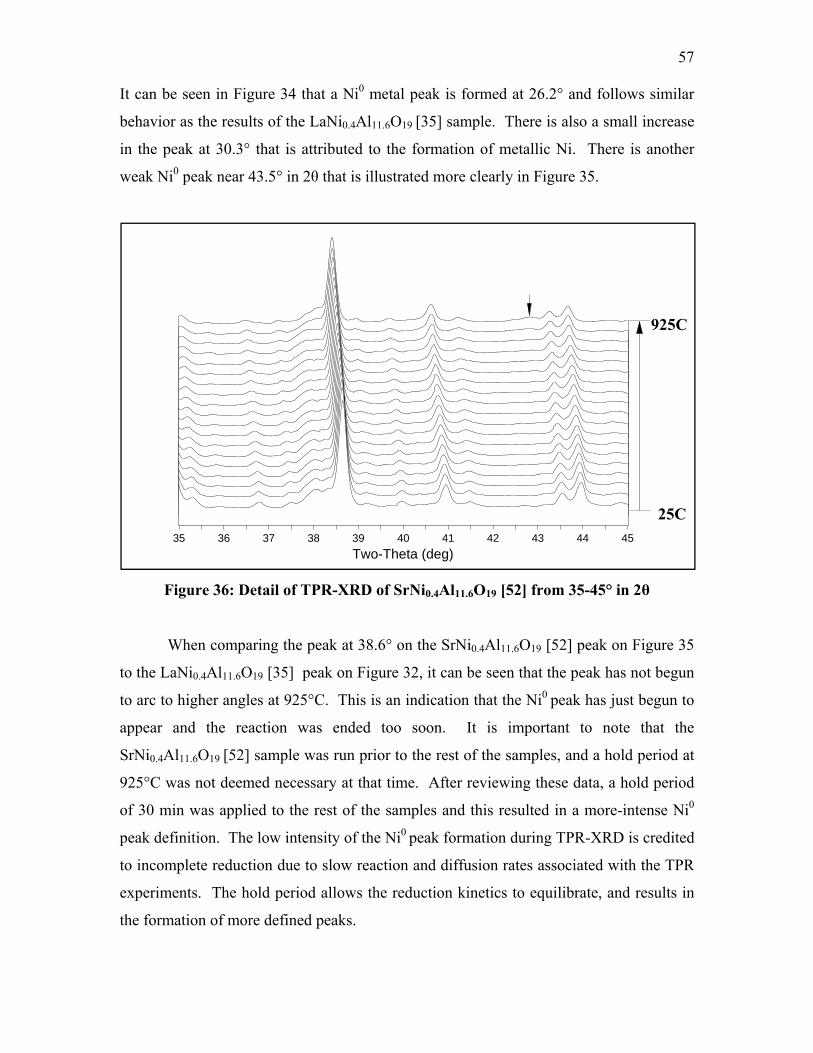
57
It can be seen in Figure 34 that a Ni0 metal peak is formed at 26.2° and follows similar
behavior as the results of the LaNi0.4Al11.6O19 [35] sample. There is also a small increase
in the peak at 30.3° that is attributed to the formation of metallic Ni. There is another
weak Ni0 peak near 43.5° in 2θ that is illustrated more clearly in Figure 35.
Figure 36: Detail of TPR-XRD of SrNi0.4Al11.6O19 [52] from 35-45° in 2θ
35 36 37 38 39 40 41 42 43 44 45Two-Theta (deg)
25C
925C
When comparing the peak at 38.6° on the SrNi0.4Al11.6O19 [52] peak on Figure 35
to the LaNi0.4Al11.6O19 [35] peak on Figure 32, it can be seen that the peak has not begun
to arc to higher angles at 925°C. This is an indication that the Ni0 peak has just begun to
appear and the reaction was ended too soon. It is important to note that the
SrNi0.4Al11.6O19 [52] sample was run prior to the rest of the samples, and a hold period at
925°C was not deemed necessary at that time. After reviewing these data, a hold period
of 30 min was applied to the rest of the samples and this resulted in a more-intense Ni0
peak definition. The low intensity of the Ni0 peak formation during TPR-XRD is credited
to incomplete reduction due to slow reaction and diffusion rates associated with the TPR
experiments. The hold period allows the reduction kinetics to equilibrate, and results in
the formation of more defined peaks.
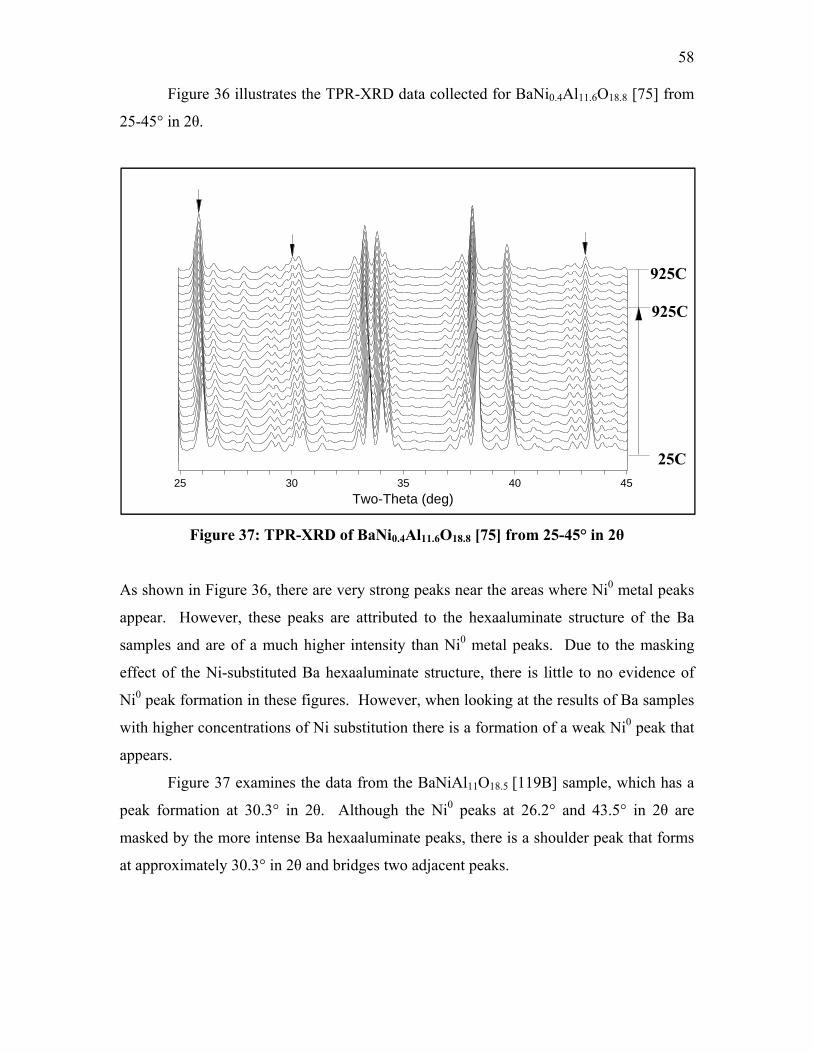
58
Figure 36 illustrates the TPR-XRD data collected for BaNi0.4Al11.6O18.8 [75] from
25-45° in 2θ.
Figure 37: TPR-XRD of BaNi0.4Al11.6O18.8 [75] from 25-45° in 2θ
25 30 35 40 45Two-Theta (deg)
25C
925C
925C
As shown in Figure 36, there are very strong peaks near the areas where Ni0 metal peaks
appear. However, these peaks are attributed to the hexaaluminate structure of the Ba
samples and are of a much higher intensity than Ni0 metal peaks. Due to the masking
effect of the Ni-substituted Ba hexaaluminate structure, there is little to no evidence of
Ni0 peak formation in these figures. However, when looking at the results of Ba samples
with higher concentrations of Ni substitution there is a formation of a weak Ni0 peak that
appears.
Figure 37 examines the data from the BaNiAl11O18.5 [119B] sample, which has a
peak formation at 30.3° in 2θ. Although the Ni0 peaks at 26.2° and 43.5° in 2θ are
masked by the more intense Ba hexaaluminate peaks, there is a shoulder peak that forms
at approximately 30.3° in 2θ and bridges two adjacent peaks.
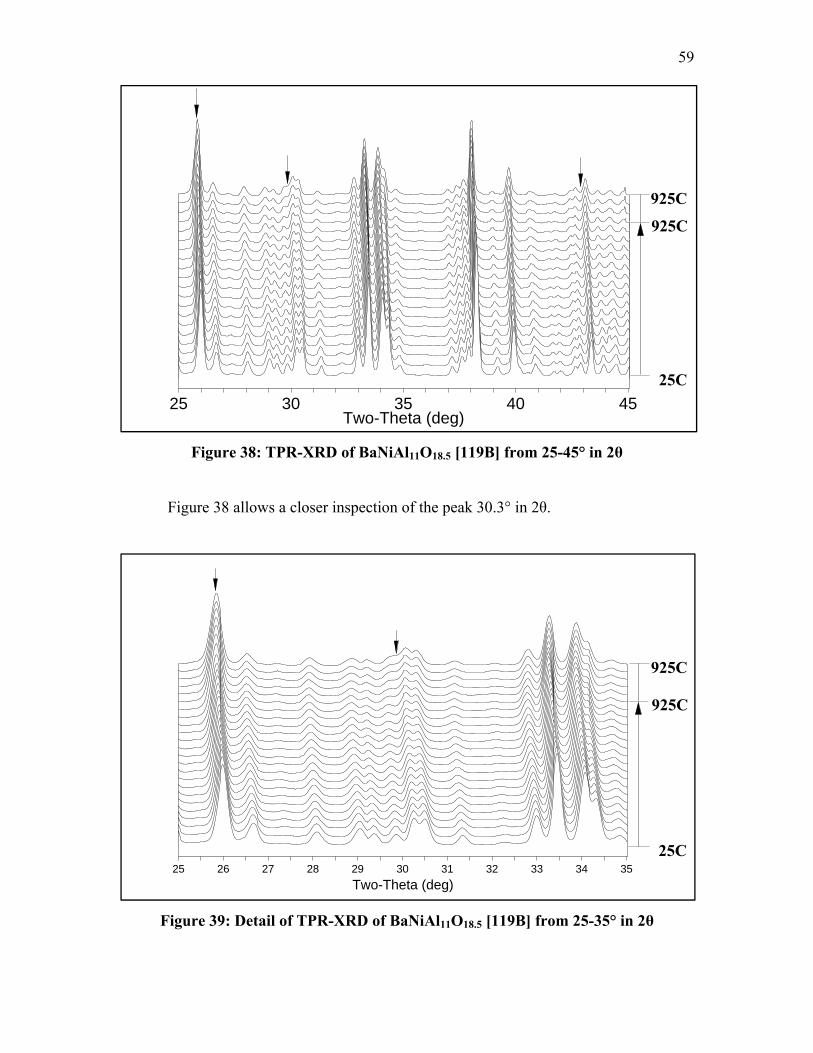
59
Figure 38: TPR-XRD of BaNiAl11O18.5 [119B] from 25-45° in 2θ
25 30 35 40 45Two-Theta (deg)
925C
25C
925C
Figure 38 allows a closer inspection of the peak 30.3° in 2θ.
Figure 39: Detail of TPR-XRD of BaNiAl11O18.5 [119B] from 25-35° in 2θ
25 26 27 28 29 30 31 32 33 34 35Two-Theta (deg)
25C
925C
925C
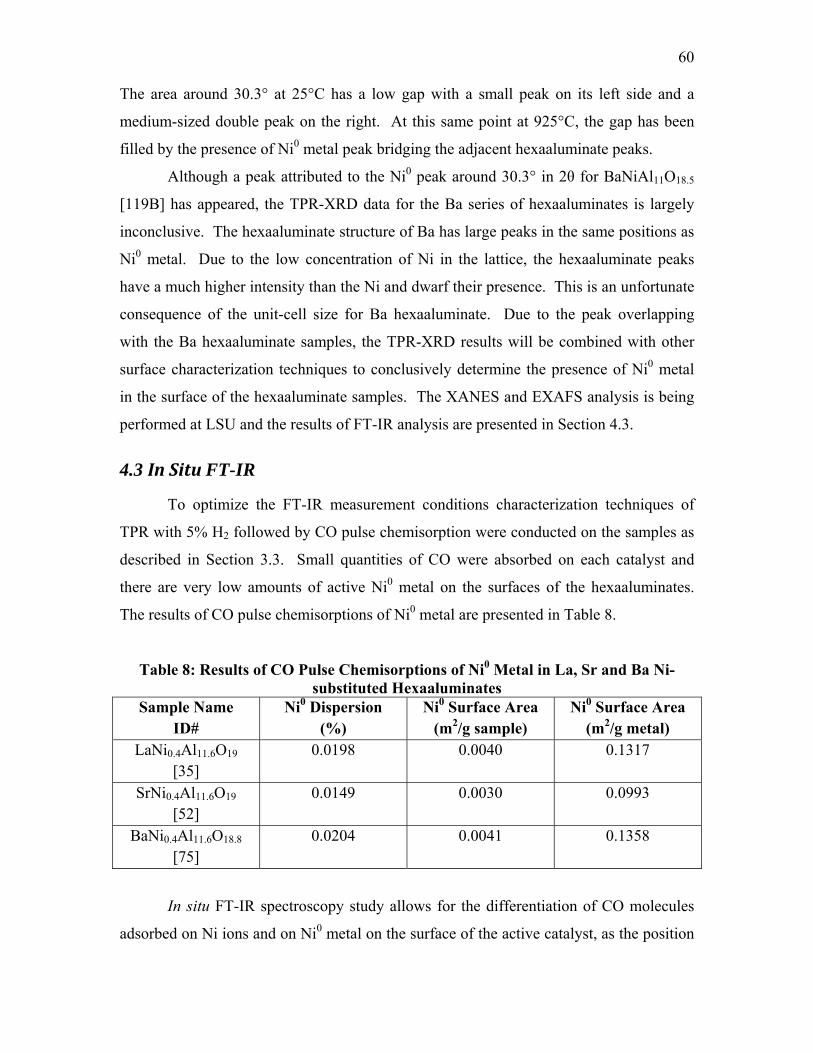
60
The area around 30.3° at 25°C has a low gap with a small peak on its left side and a
medium-sized double peak on the right. At this same point at 925°C, the gap has been
filled by the presence of Ni0 metal peak bridging the adjacent hexaaluminate peaks.
Although a peak attributed to the Ni0 peak around 30.3° in 2θ for BaNiAl11O18.5
[119B] has appeared, the TPR-XRD data for the Ba series of hexaaluminates is largely
inconclusive. The hexaaluminate structure of Ba has large peaks in the same positions as
Ni0 metal. Due to the low concentration of Ni in the lattice, the hexaaluminate peaks
have a much higher intensity than the Ni and dwarf their presence. This is an unfortunate
consequence of the unit-cell size for Ba hexaaluminate. Due to the peak overlapping
with the Ba hexaaluminate samples, the TPR-XRD results will be combined with other
surface characterization techniques to conclusively determine the presence of Ni0 metal
in the surface of the hexaaluminate samples. The XANES and EXAFS analysis is being
performed at LSU and the results of FT-IR analysis are presented in Section 4.3.
4.3 In Situ FT-IR
To optimize the FT-IR measurement conditions characterization techniques of
TPR with 5% H2 followed by CO pulse chemisorption were conducted on the samples as
described in Section 3.3. Small quantities of CO were absorbed on each catalyst and
there are very low amounts of active Ni0 metal on the surfaces of the hexaaluminates.
The results of CO pulse chemisorptions of Ni0 metal are presented in Table 8.
Table 8: Results of CO Pulse Chemisorptions of Ni0 Metal in La, Sr and Ba Ni-substituted Hexaaluminates
Sample Name ID#
Ni0 Dispersion (%)
Ni0 Surface Area (m2/g sample)
Ni0 Surface Area (m2/g metal)
LaNi0.4Al11.6O19
[35] 0.0198 0.0040 0.1317
SrNi0.4Al11.6O19
[52] 0.0149 0.0030 0.0993
BaNi0.4Al11.6O18.8
[75] 0.0204 0.0041 0.1358
In situ FT-IR spectroscopy study allows for the differentiation of CO molecules
adsorbed on Ni ions and on Ni0 metal on the surface of the active catalyst, as the position
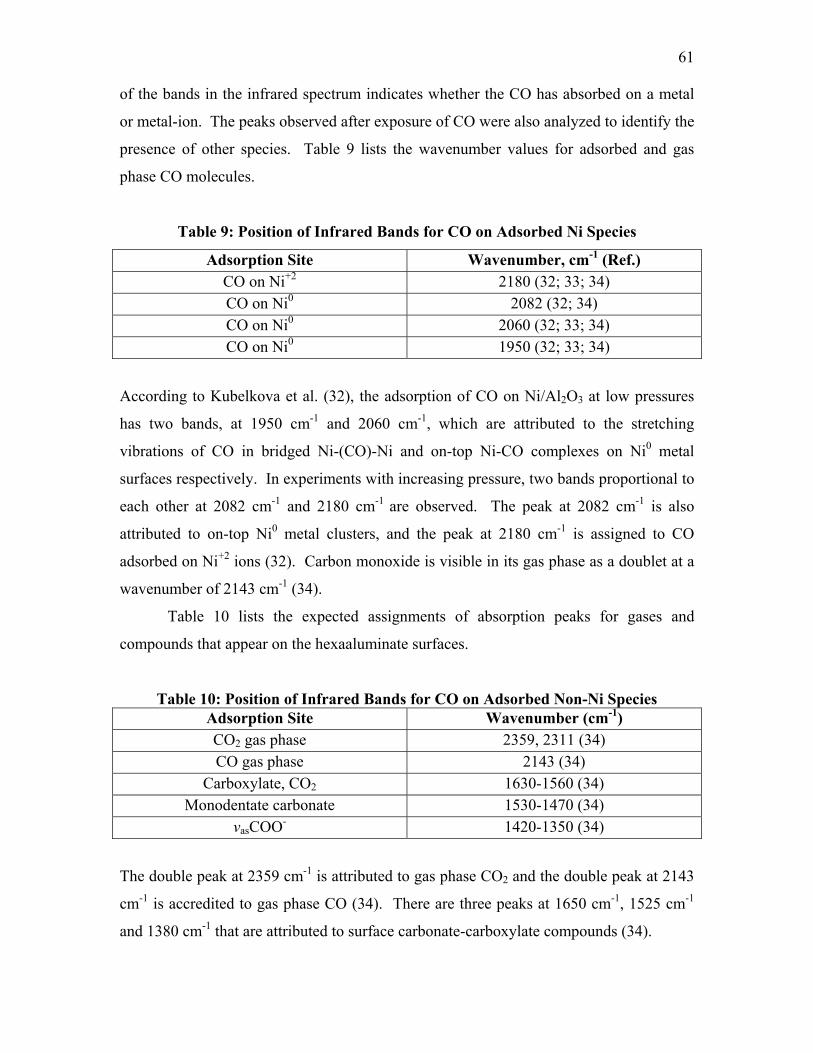
61
of the bands in the infrared spectrum indicates whether the CO has absorbed on a metal
or metal-ion. The peaks observed after exposure of CO were also analyzed to identify the
presence of other species. Table 9 lists the wavenumber values for adsorbed and gas
phase CO molecules.
Table 9: Position of Infrared Bands for CO on Adsorbed Ni Species
Adsorption Site Wavenumber, cm-1 (Ref.) CO on Ni+2 2180 (32; 33; 34) CO on Ni0 2082 (32; 34) CO on Ni0 2060 (32; 33; 34) CO on Ni0 1950 (32; 33; 34)
According to Kubelkova et al. (32), the adsorption of CO on Ni/Al2O3 at low pressures
has two bands, at 1950 cm-1 and 2060 cm-1, which are attributed to the stretching
vibrations of CO in bridged Ni-(CO)-Ni and on-top Ni-CO complexes on Ni0 metal
surfaces respectively. In experiments with increasing pressure, two bands proportional to
each other at 2082 cm-1 and 2180 cm-1 are observed. The peak at 2082 cm-1 is also
attributed to on-top Ni0 metal clusters, and the peak at 2180 cm-1 is assigned to CO
adsorbed on Ni+2 ions (32). Carbon monoxide is visible in its gas phase as a doublet at a
wavenumber of 2143 cm-1 (34).
Table 10 lists the expected assignments of absorption peaks for gases and
compounds that appear on the hexaaluminate surfaces.
Table 10: Position of Infrared Bands for CO on Adsorbed Non-Ni Species Adsorption Site Wavenumber (cm-1) CO2 gas phase 2359, 2311 (34) CO gas phase 2143 (34)
Carboxylate, CO2 1630-1560 (34) Monodentate carbonate 1530-1470 (34)
vasCOO- 1420-1350 (34)
The double peak at 2359 cm-1 is attributed to gas phase CO2 and the double peak at 2143
cm-1 is accredited to gas phase CO (34). There are three peaks at 1650 cm-1, 1525 cm-1
and 1380 cm-1 that are attributed to surface carbonate-carboxylate compounds (34).
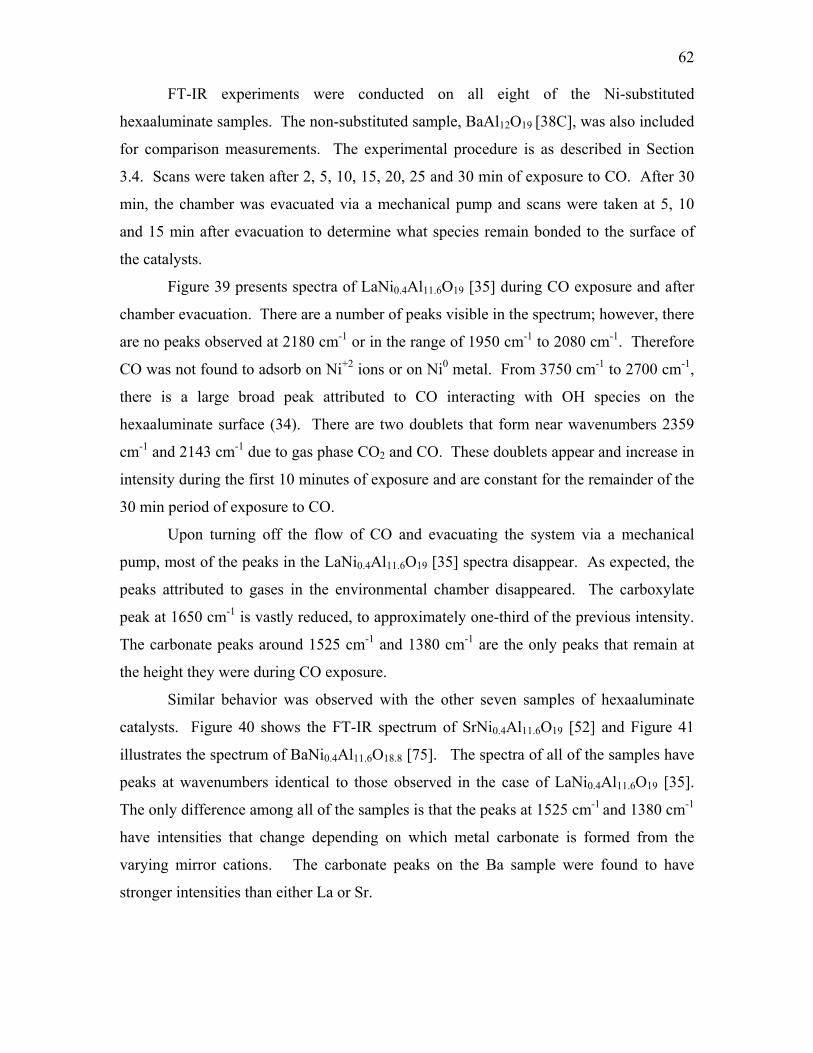
62
FT-IR experiments were conducted on all eight of the Ni-substituted
hexaaluminate samples. The non-substituted sample, BaAl12O19 [38C], was also included
for comparison measurements. The experimental procedure is as described in Section
3.4. Scans were taken after 2, 5, 10, 15, 20, 25 and 30 min of exposure to CO. After 30
min, the chamber was evacuated via a mechanical pump and scans were taken at 5, 10
and 15 min after evacuation to determine what species remain bonded to the surface of
the catalysts.
Figure 39 presents spectra of LaNi0.4Al11.6O19 [35] during CO exposure and after
chamber evacuation. There are a number of peaks visible in the spectrum; however, there
are no peaks observed at 2180 cm-1 or in the range of 1950 cm-1 to 2080 cm-1. Therefore
CO was not found to adsorb on Ni+2 ions or on Ni0 metal. From 3750 cm-1 to 2700 cm-1,
there is a large broad peak attributed to CO interacting with OH species on the
hexaaluminate surface (34). There are two doublets that form near wavenumbers 2359
cm-1 and 2143 cm-1 due to gas phase CO2 and CO. These doublets appear and increase in
intensity during the first 10 minutes of exposure and are constant for the remainder of the
30 min period of exposure to CO.
Upon turning off the flow of CO and evacuating the system via a mechanical
pump, most of the peaks in the LaNi0.4Al11.6O19 [35] spectra disappear. As expected, the
peaks attributed to gases in the environmental chamber disappeared. The carboxylate
peak at 1650 cm-1 is vastly reduced, to approximately one-third of the previous intensity.
The carbonate peaks around 1525 cm-1 and 1380 cm-1 are the only peaks that remain at
the height they were during CO exposure.
Similar behavior was observed with the other seven samples of hexaaluminate
catalysts. Figure 40 shows the FT-IR spectrum of SrNi0.4Al11.6O19 [52] and Figure 41
illustrates the spectrum of BaNi0.4Al11.6O18.8 [75]. The spectra of all of the samples have
peaks at wavenumbers identical to those observed in the case of LaNi0.4Al11.6O19 [35].
The only difference among all of the samples is that the peaks at 1525 cm-1 and 1380 cm-1
have intensities that change depending on which metal carbonate is formed from the
varying mirror cations. The carbonate peaks on the Ba sample were found to have
stronger intensities than either La or Sr.
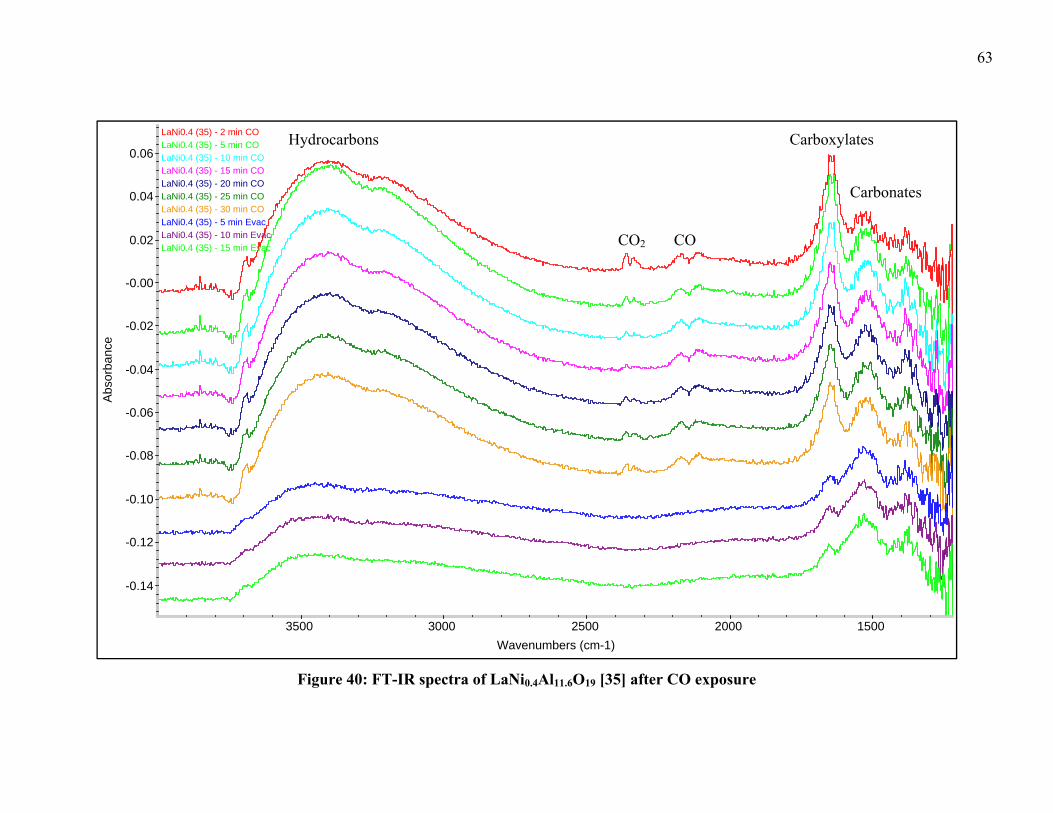
63
Figure 40: FT-IR spectra of LaNi0.4Al11.6O19 [35] after CO exposure
LaNi0.4 (35) - 2 min COLaNi0.4 (35) - 5 min COLaNi0.4 (35) - 10 min COLaNi0.4 (35) - 15 min COLaNi0.4 (35) - 20 min COLaNi0.4 (35) - 25 min COLaNi0.4 (35) - 30 min COLaNi0.4 (35) - 5 min EvacLaNi0.4 (35) - 10 min EvacLaNi0.4 (35) - 15 min Evac
-0.14
-0.12
-0.10
-0.08
-0.06
-0.04
-0.02
-0.00
0.02
0.04
0.06
Abs
orba
nce
3500 3000 2500 2000 1500 Wavenumbers (cm-1)
Hydrocarbons
Carbonates
Carboxylates
CO2 CO
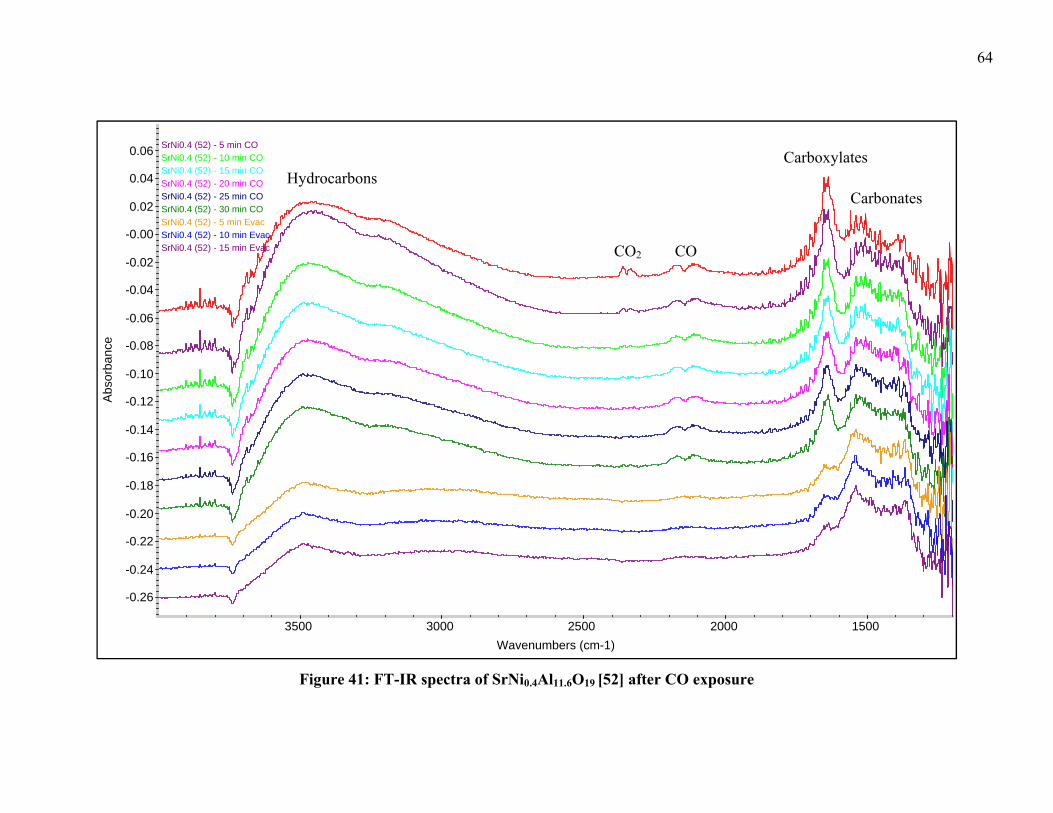
64
Figure 41: FT-IR spectra of SrNi0.4Al11.6O19 [52] after CO exposure
SrNi0.4 (52) - 5 min COSrNi0.4 (52) - 10 min COSrNi0.4 (52) - 15 min COSrNi0.4 (52) - 20 min COSrNi0.4 (52) - 25 min COSrNi0.4 (52) - 30 min COSrNi0.4 (52) - 5 min EvacSrNi0.4 (52) - 10 min EvacSrNi0.4 (52) - 15 min Evac
-0.26
-0.24
-0.22
-0.20
-0.18
-0.16
-0.14
-0.12
-0.10
-0.08
-0.06
-0.04
-0.02
-0.00
0.02
0.04
0.06
Abs
orba
nce
3500 3000 2500 2000 1500 Wavenumbers (cm-1)
HydrocarbonsCarboxylates
Carbonates
COCO2
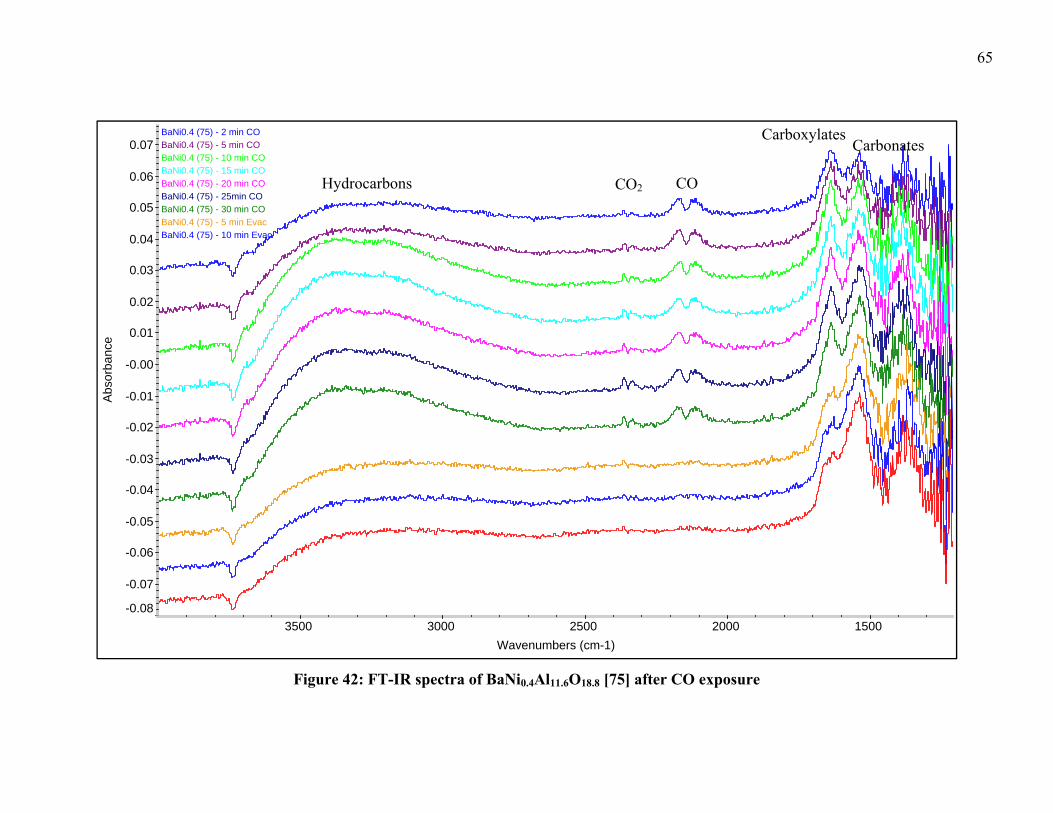
65
BaNi0.4 (75) - 2 min COBaNi0.4 (75) - 5 min COBaNi0.4 (75) - 10 min COBaNi0.4 (75) - 15 min COBaNi0.4 (75) - 20 min COBaNi0.4 (75) - 25min COBaNi0.4 (75) - 30 min COBaNi0.4 (75) - 5 min EvacBaNi0.4 (75) - 10 min Evac
Figure 42: FT-IR spectra of BaNi0.4Al11.6O18.8 [75] after CO exposure
-0.08
-0.07
-0.06
-0.05
-0.04
-0.03
-0.02
-0.01
-0.00
0.01
0.02
0.03
0.04
0.05
0.06
0.07
Abs
orba
nce
3500 3000 2500 2000 1500 Wavenumbers (cm-1)
Hydrocarbons
CarboxylatesCarbonates
COCO2
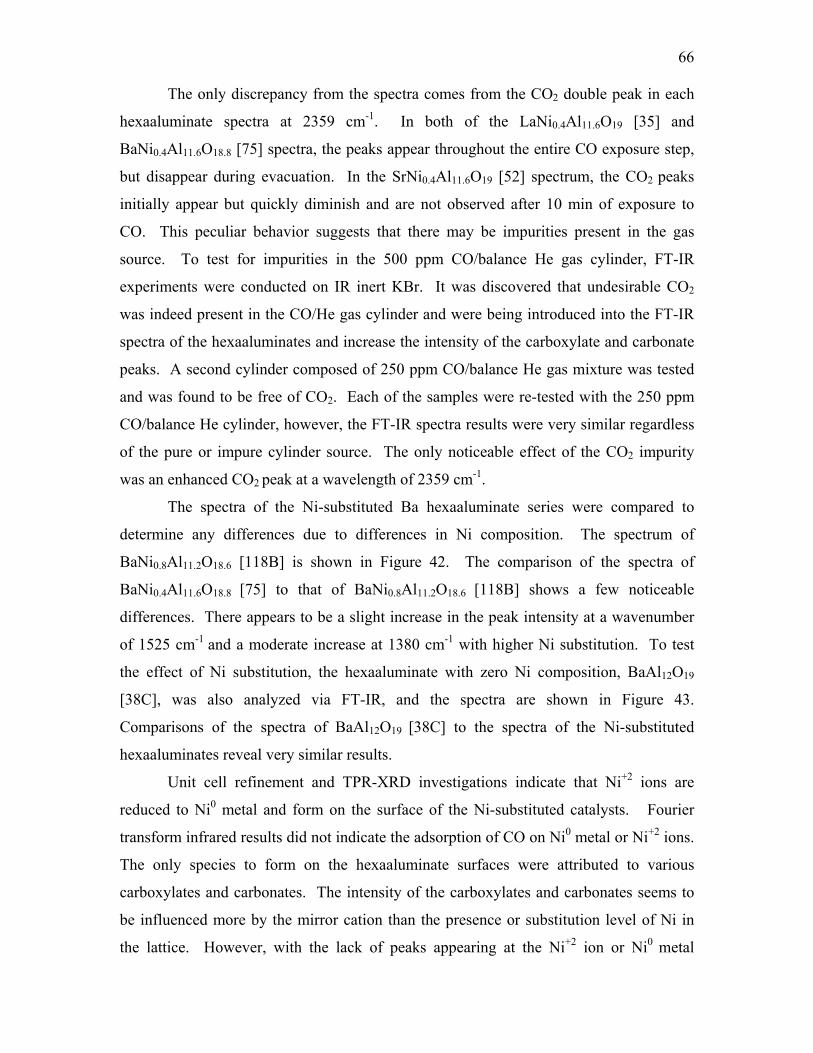
66
The only discrepancy from the spectra comes from the CO2 double peak in each
hexaaluminate spectra at 2359 cm-1. In both of the LaNi0.4Al11.6O19 [35] and
BaNi0.4Al11.6O18.8 [75] spectra, the peaks appear throughout the entire CO exposure step,
but disappear during evacuation. In the SrNi0.4Al11.6O19 [52] spectrum, the CO2 peaks
initially appear but quickly diminish and are not observed after 10 min of exposure to
CO. This peculiar behavior suggests that there may be impurities present in the gas
source. To test for impurities in the 500 ppm CO/balance He gas cylinder, FT-IR
experiments were conducted on IR inert KBr. It was discovered that undesirable CO2
was indeed present in the CO/He gas cylinder and were being introduced into the FT-IR
spectra of the hexaaluminates and increase the intensity of the carboxylate and carbonate
peaks. A second cylinder composed of 250 ppm CO/balance He gas mixture was tested
and was found to be free of CO2. Each of the samples were re-tested with the 250 ppm
CO/balance He cylinder, however, the FT-IR spectra results were very similar regardless
of the pure or impure cylinder source. The only noticeable effect of the CO2 impurity
was an enhanced CO2 peak at a wavelength of 2359 cm-1.
The spectra of the Ni-substituted Ba hexaaluminate series were compared to
determine any differences due to differences in Ni composition. The spectrum of
BaNi0.8Al11.2O18.6 [118B] is shown in Figure 42. The comparison of the spectra of
BaNi0.4Al11.6O18.8 [75] to that of BaNi0.8Al11.2O18.6 [118B] shows a few noticeable
differences. There appears to be a slight increase in the peak intensity at a wavenumber
of 1525 cm-1 and a moderate increase at 1380 cm-1 with higher Ni substitution. To test
the effect of Ni substitution, the hexaaluminate with zero Ni composition, BaAl12O19
[38C], was also analyzed via FT-IR, and the spectra are shown in Figure 43.
Comparisons of the spectra of BaAl12O19 [38C] to the spectra of the Ni-substituted
hexaaluminates reveal very similar results.
Unit cell refinement and TPR-XRD investigations indicate that Ni+2 ions are
reduced to Ni0 metal and form on the surface of the Ni-substituted catalysts. Fourier
transform infrared results did not indicate the adsorption of CO on Ni0 metal or Ni+2 ions.
The only species to form on the hexaaluminate surfaces were attributed to various
carboxylates and carbonates. The intensity of the carboxylates and carbonates seems to
be influenced more by the mirror cation than the presence or substitution level of Ni in
the lattice. However, with the lack of peaks appearing at the Ni+2 ion or Ni0 metal

67
wavenumbers, it is difficult to draw any concrete conclusions. There may be other
factors that prevent active Ni sites from being receptive to CO adsorption on
hexaaluminate materials. From reviewing literature and performing the FT-IR
experiments, a few potentially flawed reasons are suggested.
68
BaNi0.8 (118B) - 2 min COBaNi0.8 (118B) - 5 min COBaNi0.8 (118B) - 10 min COBaNi0.8 (118B) - 15 min COBaNi0.8 (118B) - 20 min COBaNi0.8 (118B) - 25 min COBaNi0.8 (118B) - 30 min COBaNi0.8 (118B) - 5 min EvacBaNi0.8 (118B) - 10 min Evac
Figure 43: FT-IR spectra of BaNi0.8Al11.2O18.6 [118B] after CO exposure
BaNi0.8 (118B) - 15 min Evac
-0.05
-0.04
-0.03
-0.02
-0.01
0.00
0.01
0.02
0.03
0.04
0.05
0.06
0.07
0.08
0.09
0.10
Abs
orba
nce
3500 3000 2500 2000 1500 Wavenumbers (cm-1)
Hydrocarbons
CarboxylatesCarbonates
COCO2

69
Figure 44: FT-IR spectra of BaAl12O19 [38C] after CO exposure
Ba (38C) - 2 min COBa (38C) - 5 min COBa (38C) - 10 min COBa (38C) - 15 min COBa (38C) - 20 min COBa (38C) - 25 min COBa (38C) - 30 min COBa (38C) - 5 min EvacBa (38C) - 10 min EvacBa (38C) - 15 min Evac
-0.06
-0.04
-0.02
0.00
0.02
0.04
0.06
0.08
0.10
0.12
0.14
0.16
0.18A
bsor
banc
e
3500 3000 2500 2000 1500 Wavenumbers (cm-1)
CO2 CO
HydrocarbonsCarboxylates
Carbonates
70
First, strong-metal support interactions (SMSIs) have been shown to suppress the
chemisorptive properties of the dispersed metal (35). Traditionally, SMSI occurs in
systems where the transition metal oxides have d-orbital electrons or is partially reducible
(35). Although alumina does not follow these generalities, Raupp et al. (36) have
suggested that, under certain conditions, supports such as alumina could exhibit SMSI-
type behavior. These interactions may be the reason for the lack of peaks that correspond
to CO molecules adsorbed on either Ni2+ or Ni0.
Second, the DRIFTS environmental chamber cell had several irregularities that
made reaching and maintaining the desired temperature difficult. According to the
manufacturer’s specifications, the cell is capable of reaching temperatures up to 900°C,
which would be ideal for the high reduction temperatures of hexaaluminates. However,
the particular unit utilized in this study, even after repairs by the manufacturer, could not
consistently reach temperatures above 700°C, and so experiments were restricted to
600°C. A passivation technique was implemented in an attempt to circumvent the
DRIFTS cell’s limitations, but the data did not show any indication of CO bonding to
Ni+2 ions or Ni0 metal. Perhaps new DRIFTS cell or different equipment with no
temperature limitations would result in appearances of these desired peaks.
71
Chapter 5: Conclusions and Recommendations
There were two primary objectives under consideration for this project. The first
objective was to identify the phase of catalytically active Ni that has been substituted into
the lattice of hexaaluminate catalysts. The second objective was to determine the
location of Ni species in the hexaaluminate lattice after synthesis, reduction and reaction.
In order to satisfy these objectives, several characterization techniques were applied to
investigate the two series of catalysts. Experiments were conducted by means of the
following methods: scanning electron microscopy (SEM), unit-cell refinement (UCR), in
situ temperature-programmed reduction and X-ray diffraction (TPR-XRD) and Fourier-
transform infrared (FT-IR) spectroscopy.
Scanning electron microscopy was used to determine differences in catalyst
surface morphology. The SEM images of the mirror-cation-varied samples were found to
be very similar in morphology; however there seems to be slight differences on how the
particles agglomerate. The LaNi0.4Al11.6O19 [35] sample seems to have morphology
similar to a coral reef. The SrNi0.4Al11.6O19 [52] sample appears to be more like a
collection of breakfast-cereal flakes. BaNi0.4Al11.6O18.8 [75] has particles that might be
described as having the appearance of steamed rice. There appears to be little to no
difference between the morphologies of the different Ni-substituted Ba catalysts. They
all appear to have agglomerates of hexaaluminate particles, and there is an indication that
the percentage of nickel is low enough that variations do not have a substantial effect on
surface morphology. Examination of the SEM images could not distinguish any
substantial differences between the blue and gray particles of samples taken from TPO
experiments with the POx of CH4.
Unit-cell refinement demonstrates that Ni has been incorporated into the
hexaaluminate lattice during synthesis. Increasing the Ni substitution level results in an
increase in the a and b parameters and a decrease in the c direction. The overall volume
of the unit-cell was found to increase with higher Ni modification. Upon TPR via H2 and
TPO reaction studies of CH4 POx, it was determined that Ni+2 ions are reduced to Ni0
metal and relocate from the lattice via the a and b directions and are heavily involved
with catalytic activity of the catalyst. When going from lower to higher Ni substitution
the a and b parameters of the fresh samples have a positive slope but there is essentially
72
zero slope between the used samples indicating a loss of Ni from the unit-cell lattices.
The c parameters are mostly unchanged from the values of those of the fresh samples and
the c dimension is unaffected by the POx reaction. Similar to the behavior of the a and b
parameters, while the overall cell volumes of the fresh catalysts increase with Ni
substitution, the post-reaction volumes of the unit-cells shows little to no difference
between higher and lower Ni substitution.
In situ TPR-XRD studies with La and Sr hexaaluminates show that, upon
reduction with H2, Ni in the lattice turns into metallic Ni0 on the hexaaluminate surface of
the crystal. This allows the Ni-substituted hexaaluminate to be an active catalyst for POx
of CH4. Experiments with XRD of Ba hexaaluminates are mostly inconclusive, due to
the hexaaluminate diffraction pattern having intense peaks in the same positions as Ni0
metal so that the hexaaluminate peaks mask the appearance of Ni0 peaks. This is an
unfortunate consequence of the unit-cell size for Ba hexaaluminate.
Fourier-transform infrared spectroscopy of the absorption of CO on reduced
catalysts was performed to distinguish between Ni+2 ions and Ni0 metal species on the
hexaaluminate surfaces. The analysis of the FT-IR spectra leaves no indication of the
presence of Ni in any form on the surface. Chemisorption of CO supports the results of
FT-IR, in that very low quantities of CO were adsorbed due to low Ni dispersion on the
hexaaluminate surfaces. The appearance of multiple peaks indicates the presence of CO
and CO2 gas molecules as well as the formation of La, Sr and Ba carboxylates and
carbonates. Upon evacuation of the DRIFTS chamber, the only remaining peaks belong
to those of the appropriate mirror cation carboxylate-carbonates near 1525 cm-1 and 1380
cm-1.
It is possible that the passivation procedure was not sufficient to keep the catalysts
in their reduced state for the FT-IR procedure. It is recommended that future FT-IR
investigations should be repeated with a DRIFTS cell or similar apparatus with operating
conditions in the 900°C to 1100°C range to allow for complete reducing conditions. In
addition to probing the samples with CO, it is suggested that adsorption of another probe
gas, NO, be attempted as well to support or counter the results obtained in this
experiment. Other probe gases that are found to be prevalently used in literature include
NO/O2 and CO/H2 mixtures, but great care should be given if operated at elevated
temperatures to avoid the formation of dangerous compounds.
73
Additional experimentation in the techniques of XANES and EXAFS are required
to obtain a more complete understanding of the nature of active sites present in
hexaaluminate catalysts. As part of collaboration with NETL, WVU and LSU, detailed
XANES analysis will simultaneously be conducted at LSU by Andrew Campos as part of
his PhD dissertation project. However, this information will be published after the
completion of this work and is unavailable at this time. The combination of results from
SEM, TPR-XRD, TPR-EXAFS, TPR-XANES and FT-IR characterization techniques
will satisfy the goals and objectives of this investigation.
Future work should include further characterization techniques such as in situ
electron spectroscopy for chemical analysis (ESCA), scanning tunneling microscopy
(STM) and electron-energy loss spectroscopy (EELS). In situ ESCA should be used to
examine the possibility of SMSI on hexaaluminate catalysts. Scanning tunneling
microscopy can be used to study the atomic surface morphology of oxides as a function
of temperature and under reaction conditions (26). Although the images obtained by
STM are not a full visual representation of the catalyst surface, information can be
determined about the atomic structure at the Fermi energy level. Electron-energy loss
spectroscopy can be used in conjunction with XANES and EXAFS techniques to provide
information about elemental information, bonding and next nearest neighbor distribution.
Due to the success of TPR-XRD with the La and Sr samples, series of La and Sr
hexaaluminates with varying Ni-substitution level could be synthesized. Experiments via
UCR and FT-IR could be repeated on these samples to support and/or improve upon the
results obtained on the Ba hexaaluminate series. Alternatively, a series of Ba
hexaaluminates could be created with a different metal dopant than Ni (Co, Fe, Mg, etc.),
and the same characterization techniques performed in this study could be repeated on
those samples.
74
References 1. http://www.epa.gov/smartwaylogistics/idle-questions.htm. 2. Stodolsky, F., Gaines, L. and Vyas, A., “Analysis of Technology Options to Reduce
the Fuel Consumption of Idling Trucks,” Center for Transportation Research, Argonne National Laboratory, U.S. Department of Energy, (2000) P. 1-28.
3. Jain, S., Chen, H-Y. and Schwank, J., s.l. “Techno-economic analysis of fuel cell
auziliary power units as alternative to idling,” Elsevier, Journal of Power Sources, (2006) Vol. 160, P. 474-484.
4. Storey, J. M., Thomas, J. F., Lewis, S. A., Dam, T. Q., Edwards, K. D., DeVault, G.
L., Retrossa, D. J., “Particulate Matter and Aldehyde Emissions From Idling Heavy-Duty Diesel Trucks,” Department of Energy, Oak Ridge National Laboratory, Society of Automotive Engineers, (2003) P. 1-10.
5. http://www.netl.doe.gov/technologies/coalpower/fuelcells/seca/.
6. Gardner, T. H., Hexaaluminate Catalysts for the Partial Oxidation of Middle
Distillate Fuels, Dissertation, Morgantown, West Virginia University, (2007) P. 1-138.
7. Machida, M., Eguchi, K., Arai, H., “Effect of Additives on the Surface-Area of
Oxide Supports for Catalytic Combustion,” Journal of Catalysis, (1987) Vol. 103, P. 385-393.
8. Machida, M., Eguchi, K., Arai, H., “Preparation and Characterization of Large-
Surface-Area BaO*6Al2O3,” Bulletin of the Chemical Society of Japan, (1988) Vol. 61, P. 3659-3665.
9. Xu, Z., Zhen, M., Bi, Y., Zhen, K., “Carbon Dioxide Reforming of Methane to
Synthesis Gas Over Hexaaluminate ANiAl11O19-δ (A = Ca, Sr, Ba and La) Catalysts,” Catalysis Letters, (2000) Vol. 64, P. 157-161.
10. Xu, Z., Zhen, M., Bi, Y., Zhen, K., “Catalytic Properties of Ni Modified
Hexaaluminates LaNiyAl12-yO19-δ for CO2 Reforming of Methane to Synthesis Gas,” Applied Catalysis A: General, (2000) Vol. 198, P. 267-273.
11. Machida, M., Eguchi, K., Arai, H., “Catalytic Properties of BaMAl11O19-α (M = Cr,
Mn, Fe, Co, and Ni) for High-Temperature Catalytic Combustion,” Journal of Catalysis, (1989) Vol. 120, P. 377-386.
12. Park, J-G., Cormack, A. N., “Crystal/Defect Structures and Phase Stability in Ba
Hexaaluminates,” Journal of Solid State Chemistry, (1996) Vol. 121, P. 278-290.
75
13. Kimura, S., Banai, E., Shindo, I., “Phase Relations Relevant to Hexagonal Barium Aluminates,” Materials Research Bulletin, (1981)Vol. 17, P. 209-215.
14. Iyi, N, Takekawa, S. and Bando, Y., Kimura, S., “Electron Microscopic Study of
Barium Hexaaluminates,” Journal of Solid State Chemistry, (1983)Vol. 47, P. 34-40.
15. Iyi, N., Inoue, Z., Takekawa, S., Kimura, S., “The Crystal Structure of Barium Hexaaluminate Phase I (Barium β-Alumina),” Journal of Solid State Chemistry, (1983) Vol. 52, P. 66-72.
16. Chu, W., Yang, W., Lin, L., “The Partial Oxidation of Methane to Syngas Over the
Nickel-Modified Hexaaluminate Catalysts BaNiyAl12-yO19-δ,” Applied Catalysis A: General, (2002) Vol. 235, P. 39-45.
17. Lietti, L., Cristiani, C., Groppi, G., Forzatti, P., “Preparation, Characterization and
Reactivity of Me-Hexaaluminate (Me=Mn, Co, Fe, Ni, Cr) Catalysts in the Catalytic Combustion of NH3-Containing Gasified Biomasses,” Catalysis Today, (2000) Vol. 59, P. 191-204.
18. Gardner, T. H., Shekhuwat, D., Berry, D. A., Smith, M. W., Salazar, M., Kugler, E.
L., “Effect of Nickel Hexaaluminate Mirror Cation on Structure-Sensitive Reactions During n-tetradecane Parial Oxidation,” Applied Catalysis A: General, (2007) Vol. 323, P. 1-8.
19. Machida, M., Eguchi, K., Arai, H., “Analytical Electron Microscope Analysis of the
Formation of BaO*6Al2O3,” Journal of American Cermaic Society, (1988) Vol. 71, P. 1142-1147.
20. Chu, W., Yang, W., Lin, L., “Selective Oxidation of Methane to Syngas Over
NiO/Barium Hexaaluminate,” Catalysis Letters, (2001) Vol. 74, P. 139-144.
21. Gardner, T., Kugler, E., and Spivey, J., “Hexaaluminates as Efficient Partial Oxidation Catalysts,” May 2007 Monthly Report, (2007), P. 1-19.
22. Bukhtiyarova, M. V., Ivanova, A. S., Plyasova, L., Litvak, G. S., Budneva, A. A.,
Paukshtis, E. A., “Structure and Acid-Base Properties of Hexaaluminates,” Reaction Kinetics Catalysis Letters (2008) Vol. 93, Iss. 2, P. 375-387.
23. Holland, T.J.B., and Redfern, S.A.T., “Unit Cell Refinement from Powder
Diffraction Data: The Use of Regression Diagnostics,” Mineralogical Magazine (1997) Vol. 61, P. 65-77.
24. Norby, P., Hanson, J.C., “Hydrothermal Synthesis of the Microporous Aluminophosphate CoAPO-5; In Situ Time-Resolved Synchrotron X-ray Powder Diffraction Studies,” Catalysis Today, (1998) Vol. 39, P. 301-309.
76
25. Machida, M., Shiomitsu, T., Eguchi, K., Arai, H., Shimizu, Y., “Observation of Anisotropic Oxygen Diffusion in Hexaaluminate,” Journal of Solid State Chemistry, (1991) Vol. 95, P. 220-223
26. Fernandez-Garcia, M., Martinez-Arias, A., Hanson, J.C., and Rodriguez, J.A.,
“Nanostructured Oxides in Chemistry; Characterization and Properties,” Chemistry Review, (2004) Vol. 104, P. 4063-4104.
27. Norby, P., “Synchrotron Powder Diffraction using Imaging Plates: Crystal Structure
Determination and Rietveld Refinement,” Journal of Applied Crystallography, (1997) Vol. 30, P. 21-30.
28. Galuszka, J., and Amenomiya, Y., “Infrared Study of Coadsorption of CO and H2 on
Alumina-supported Nickel Catalysts,” Catalysis on the Energy Scene, (1984) Vol. unknown, P. 63-70.
29. Bengaard, H. S., Norskov, J. K., Sehested, J., Clausen, B. S., Nielsen, L. P.,
Molenbroek, A. M., Rostrup-Nielsen, J. R., “Steam Reforming and Graphite Formation on Ni Catalysts,” Journal of Catalysis, (2002) Vol. 209, P. 365-384.
30. Kantcheva, M., Agiral, A, Samarskaya, O., Stranzenbach, M., and Saruhan, B.,
“Characterization of LaMnAl11O19 by FT-IR Spectroscopy of Adsorbed NO and NO/O2,” Applied Surface Science, (2005) Vol. 252, P. 1481-1491.
31. Hu, C., Chen, Y., Li, P., Min, H., Chen, Y., and Tian, A., “Temperature-
Programmed FT-IR Study of the Adsorption of CO and Co-adsorption of CO and H2 on Ni/Al2O3,” Journal of Molecular Catalysis A: Chemical, (1996) Vol. 110, P. 163-169.
32. Kubelkova, L., and Novakova, J., “Characterization of Nickel Species at Ni/γ-Al2O2
and Ni/faujasite Catalysts by Carbon Monoxide Adsorption,” Applied Catalysis A: General, (1993) Vol. 95, P. 87-101.
33. Peri, J.B., “Infrared Studies of Ni Held at Low Concentrations on Alumina
Supports,” Journal of Catalysis, (1984) Vol. 86, P. 84-94.
34. Davydov, A., Molecular Spectroscopy of Oxide Catalyst Surfaces, Chichester, West Sussex, England, John Wiley & Sons, (2003) P. 135, 271.
35. Huang, Y.J., and Baltrus, J.P., “Effect of Catalyst Preparation on Catalytic Activity
VII. The Chemical Structures on Nickel/Alumina Catalysts: Their Impact on the Formation of Metal-Support Interactions,” Applied Catalysis, (1988) Vol. 37, P. 229-245.
36. Raupp, G.B., Dumesic, J.A., “Effect of Varying Titania Surface Coverage of the
Chemisorptive Behavior of Nickel,” Journal of Catalysis, (1985) Vol. 95, P. 587-601.
77
Appendix
A.1 Procedure for FTIR Experiments 1. Grind sample in mortar and pestle to fine powder. Load sample into ceramic cup of
DRIFTS Chamber #2 until there is a flat surface even to the lip of the cup.
2. Using vacuum grease, rub a very thin layer around large O-ring and place in designated groove around the cup. Place lid on the chamber and tighten the screws in place to seal the chamber.
3. Repeat Steps 1,2 in DRIFTS Chamber #1 with separate sample or KBr standard to
ensure even flow across both chambers.
4. Take DRIFTS cell and attach inlet and outlet lines of water cooling system and test for leaking. If leaking occurs, repeat previous Step 2 on leaky chamber until no leaks occur.
5. Place DRIFTS cell into Smart Collector and slide to chosen position (scanning Chamber 1 or 2).
6. Attach gas inlet and outlet lines to DRIFTS cell.
7. Turn on control system for mass flow controllers and set desired flow of 5% H2-95% He gas. Test gas lines for leaks with leak detection bubble solution.
8. Attach heater cable and thermocouple lines of DRIFTS cell to heater controller.
Turn on heater control system and set desired program.
9. Run program to reduce samples and monitor system until program is completed.
10. If using MCT/A detector (CaF2), the detector reservoir needs to be filled with liquid N2 30 min prior to the end of the program. Refill liquid N2 as needed to keep detector cool.
11. Allow sample to cool to 25°C. Turn off flow of 5% H2-95% He gas. Turn on
mechanical pump to evacuate system.
12. Enable power to the Nexus spectrometer.
13. After spectrometer is running, turn on power to computer.
14. Open Omnic software on computer.
15. Allow software to perform diagnostic tests on spectrometer and accessories.
78
16. Select Nexus Smart Collector Experiment program. Click on Collect » Experiment Setup to view/change scanning parameters.
a. No. of scans: 128 b. Resolution: 4 cm-1 c. Detector: MCT/A d. Max range limit: 4000 cm-1 e. Min range limit: 1200 cm-1 f. Gain: Autogain g. Velocity: 1.8988 h. Aperture: 32
17. Click icon to Collect Background to take background scan of sample.
18. Turn off mechanical pump. Turn on flow of 500 ppm CO-balance He gas.
19. Click icon to Collect Sample to take scans at 2, 5, 10, 15, 20, 25 and 30 min
intervals.
20. Upon 30 min of exposure to CO, turn off flow of gas. Turn on mechanical pump to evacuate system.
21. Click icon to Collect Sample to take scans at 5, 10 and 15 min intervals. 22. End the experiment. Turn off control systems for heating, cooling and mass flow
controllers.
23. Shut down computer THEN power down spectrometer.
24. Detach gas, water and heating/thermocouple lines from DRIFTS cell.
25. Open DRIFTS cell chambers and recover samples.
26. Begin preparations for new experiment.


