Embed Size (px)
Citation preview
CLEAN ENERGY SOLUTION
JHARKHAND
2021
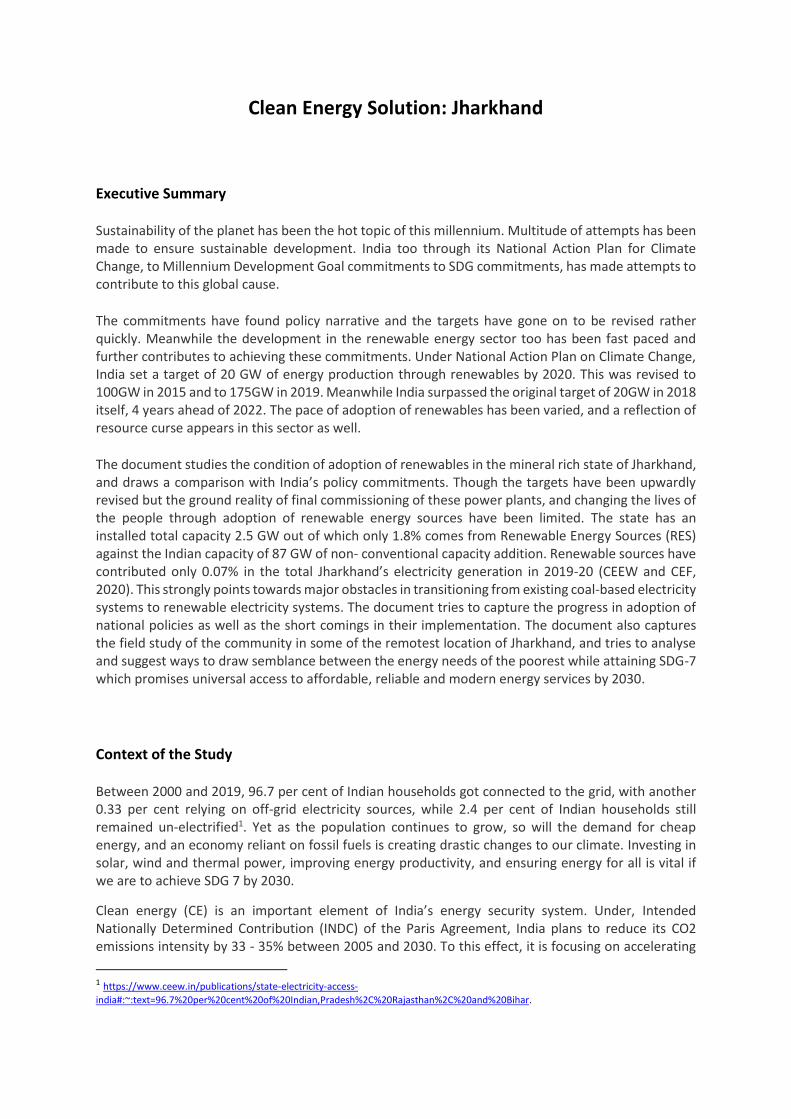
Clean Energy Solution: Jharkhand
Executive Summary
Sustainability of the planet has been the hot topic of this millennium. Multitude of attempts has been made to ensure sustainable development. India too through its National Action Plan for Climate Change, to Millennium Development Goal commitments to SDG commitments, has made attempts to contribute to this global cause.
The commitments have found policy narrative and the targets have gone on to be revised rather quickly. Meanwhile the development in the renewable energy sector too has been fast paced and further contributes to achieving these commitments. Under National Action Plan on Climate Change, India set a target of 20 GW of energy production through renewables by 2020. This was revised to 100GW in 2015 and to 175GW in 2019. Meanwhile India surpassed the original target of 20GW in 2018 itself, 4 years ahead of 2022. The pace of adoption of renewables has been varied, and a reflection of resource curse appears in this sector as well.
The document studies the condition of adoption of renewables in the mineral rich state of Jharkhand, and draws a comparison with India’s policy commitments. Though the targets have been upwardly revised but the ground reality of final commissioning of these power plants, and changing the lives of the people through adoption of renewable energy sources have been limited. The state has an installed total capacity 2.5 GW out of which only 1.8% comes from Renewable Energy Sources (RES) against the Indian capacity of 87 GW of non- conventional capacity addition. Renewable sources have contributed only 0.07% in the total Jharkhand’s electricity generation in 2019-20 (CEEW and CEF, 2020). This strongly points towards major obstacles in transitioning from existing coal-based electricity systems to renewable electricity systems. The document tries to capture the progress in adoption of national policies as well as the short comings in their implementation. The document also captures the field study of the community in some of the remotest location of Jharkhand, and tries to analyse and suggest ways to draw semblance between the energy needs of the poorest while attaining SDG-7 which promises universal access to affordable, reliable and modern energy services by 2030.
Context of the Study
Between 2000 and 2019, 96.7 per cent of Indian households got connected to the grid, with another 0.33 per cent relying on off-grid electricity sources, while 2.4 per cent of Indian households still remained un-electrified1. Yet as the population continues to grow, so will the demand for cheap energy, and an economy reliant on fossil fuels is creating drastic changes to our climate. Investing in solar, wind and thermal power, improving energy productivity, and ensuring energy for all is vital if we are to achieve SDG 7 by 2030.
Clean energy (CE) is an important element of India’s energy security system. Under, Intended Nationally Determined Contribution (INDC) of the Paris Agreement, India plans to reduce its CO2 emissions intensity by 33 - 35% between 2005 and 2030. To this effect, it is focusing on accelerating
1 https://www.ceew.in/publications/state-electricity-access-
india#:~:text=96.7%20per%20cent%20of%20Indian,Pradesh%2C%20Rajasthan%2C%20and%20Bihar.
the use of clean and renewable energy by 40% by 2030. The Government of India has also set an ambitious target of generating 175 GW of renewable energy by 2022. Its leadership on the International Solar Alliance (along with France) signals its commitment.
In the context of the COVID-19 crisis, reducing pollution and emissions assumes even greater importance. Air pollution contributes to heart and lung diseases, including Covid-19. India has 14 of the world’s 20 most polluted cities (by particulate matter PM 2.5), so a greater focus on people’s health and well-being should include efforts to curb air pollution. Reducing air pollution and emissions by strengthening green stimulus policies – with a focus on energy efficiency and renewable energy – will aid economic recovery in the short-term by creating jobs.
Backdrop of the Study
Since the time of 1970s energy crisis, India has been stressing upon alternative sources of energy to
ensure energy security, increase share of clean energy, energy availability and access, energy
affordability and energy equity for which various government initiatives likes Green Energy Corridor,
Renewable Purchase Obligations, Net Metering Policy, Repowering of Wind power projects,
International Solar Alliance, Surya Mitra Scheme etc. have been launched. These initiatives of the
government are in tune to the global commitments of India to attain 175 GW of renewable energy
which would consist of 100 GW from solar energy, 10 GW from bio-power, 60 GW from wind power,
and 5 GW from small hydropower plants by the year 2022.
The study aims to estimate the position of these initiatives of the government against their
commitments. The study targets the policies on clean energy of the national government and of the
state government of Jharkhand.
Scope and Purpose of the Study
India’s development imperatives revolve around the Sustainable Development Goals and its targets.
The study tries to analyse the progress in SDG-7 which aims to ensure universal access to affordable,
reliable and modern energy services by 2030. The study is centred on the progress in adoption of
renewable energy and the changing policy narratives in India and the eastern state of Jharkhand.
In order to develop a suitable roadmap to achieve the desired target, it is imperative to analyse and
evaluate the current renewable energy (RE) scenario against its policy & regulatory measures
undertaken and technical challenges at the state level and assess its impact. The outcome of the
assessment will enable the readers to understand the renewable energy developments in these states
and the country as a whole as well as advocate with policy makes to suitably respond to mitigation
actions in order to abate the further challenges/roadblocks envisaged. Study of Jharkhand and its
neighbouring and other states policies has been done for finding ways to enrich from the learning;
field reality is analysed for drafting better recommendations for the state.
The study will come out as an advocacy document which will then be used at different level of action
advocacy for assessing the existing space for rights of children of indigenous community.
Methodology
❖ Review policies, regulatory and technical documentations and the existing market
mechanisms that drive that Renewable market
❖ Online Study of the documents of India and the eastern state of Jharkhand.
❖ Study of Jharkhand and India in relation to Renewable Energy
❖ Field research in view of utilization and convenience
❖ Review the state’s RE potential and conduct a situational analysis of the state’s driven
initiatives in response to National RE plan
❖ Stating the Outcome of Analysis by identifying the deficits
Clean Energy Solutions
Growing environmental concern about fossil fuel-based electricity generation has turned the tide in
favour of producing electricity using eco-friendly energy sources worldwide. The sources of electricity
production such as coal, oil, and natural gas have contributed to one-third of global greenhouse gas
emissions. It is essential to raise the standard of living by providing cleaner and more reliable
electricity. India has an increasing energy demand to fulfil the economic development plans that are
being implemented. According to the World Resource Institute Report 2017, India is responsible for
nearly 6.65% of total global carbon emissions, ranked fourth next to China (26.83%), the USA (14.36%),
and the EU (9.66%). Climate change might also change the ecological balance in the world. Intended
Nationally Determined Contributions (INDCs) have been submitted to the United Nations Framework
Convention on Climate Change (UNFCCC) and the Paris Agreement. The latter has hoped to achieve
the goal of limiting the rise in global temperature to well below 2 °C. According to a report from the
Centre for Monitoring Indian economy, the country imported 171 million tons of coal in 2013–2014,
215 million tons in 2014–2015, 207 million tons in 2015–2016, 195 million tons in 2016–2017, and 213
million tons in 2017–2018.
Pollution emanating from these sources is strongly linked to poverty. Nearly 92% of pollution-related
deaths occur in low- and middle-income countries. Children face the highest risks and are the most
vulnerable victims of pollution because small exposures to chemicals in utero and early childhood can
result in lifelong disease, disability, premature death, as well as reduced learning and earning
potential. The health impact of pollution is likely to be much larger than can accurately be quantified
today because of insufficient data collection and scientific research from many pollutants. Pollution is
costly. Pollution-related illnesses result in direct medical costs, costs to healthcare systems and
opportunity costs resulting from lost productivity and economic growth. Welfare losses due to
pollution are estimated at $4.6 trillion per year, 6.2% of global economic output. The claim that
pollution control stifles economic growth and that poor countries must pollute in order to grow is
false. Therefore, there is an urgent need to find alternate sources for energy for realising demographic
dividend while growing sustainably.
The country needs to have a rapid transition to renewable energy technologies to achieve sustainable
growth and avoid catastrophic climate change. In recent years, the country has developed a
sustainable path for its energy supply. Awareness of saving energy has been promoted among citizens
to increase the use of solar, wind, biomass, waste, and hydropower energies. It is evident that clean
energy is less harmful and often cheaper. India is aiming to attain 175 GW of renewable energy which
would consist of 100 GW from solar energy, 10 GW from bio-power, 60 GW from wind power, and 5
GW from small hydropower plants by the year 2022. Recent estimates show that in 2047, solar
potential will be more than 750 GW and wind potential will be 410 GW.
Given the enormous potential of renewables in the country, coherent policy measures must be
developed to ensure development of the country while ensuring sustainability.
Study Covered in four districts of Jharkhand (Ranchi, Khunti, Gumla and Simdega)
Demographic Details
The surveyed area in Khunti and Simdega mainly consists of nuclear families, with Khunti having 71.5%
of families as nuclear and Simdega with 69.5% families. Women headed families are miniscule with
just 2.8% and 5.2% respectively.
The two districts have mostly the tribal population with 76.1% of the population being tribal in Khunti
and 65 % in Simdega. Being tribal dominant districts, percentage of below poverty line (BPL) too is
quite high, with 85% in Khunti and 62.7% in Simdega. Thus, the two districts are economically
backward.
The population is mostly young in the district with nearly 40% of population being below 19 in Khunti
and the same number being 28% in Gumla.
Both the districts record dismal performance in their educational attainment. While 18.1% males in
Khunti are illiterate, the percentage of women being illiterate is 27%. Simdega performs even worse
as the percentage of illiterate men and women there is 21.4% and 32.5% respectively. For heigher
education the numbers are shocking with just 0.3% males in Khunti district were found to have done
post-graduation and only 0.1% females had post-graduation degree in Khunti district. The percentages
for the same in Simdega are 0.16% and 0.25% respectively. Percentage of graduates in for males and
females is just 1.9% and 1.5% in Khunti and 4.08% and 2.86% in Simdega district.
Agriculture constitutes the primary source of livelihood in these two districts with 58.9% population
of Khunti dependent on it and 52.8% in Simdega. Labour is next in the list of source of livelihood with
36.9% dependent on labour in Khunti to earn a living and 43.9% in Simdega.
Electricity Availability
Penetration of electricity has improved in the
recent times. But the electricity has been
intermittent or the services are not inadequate.
These are reflected in the data and of baseline
survey. The graphs below represent the data
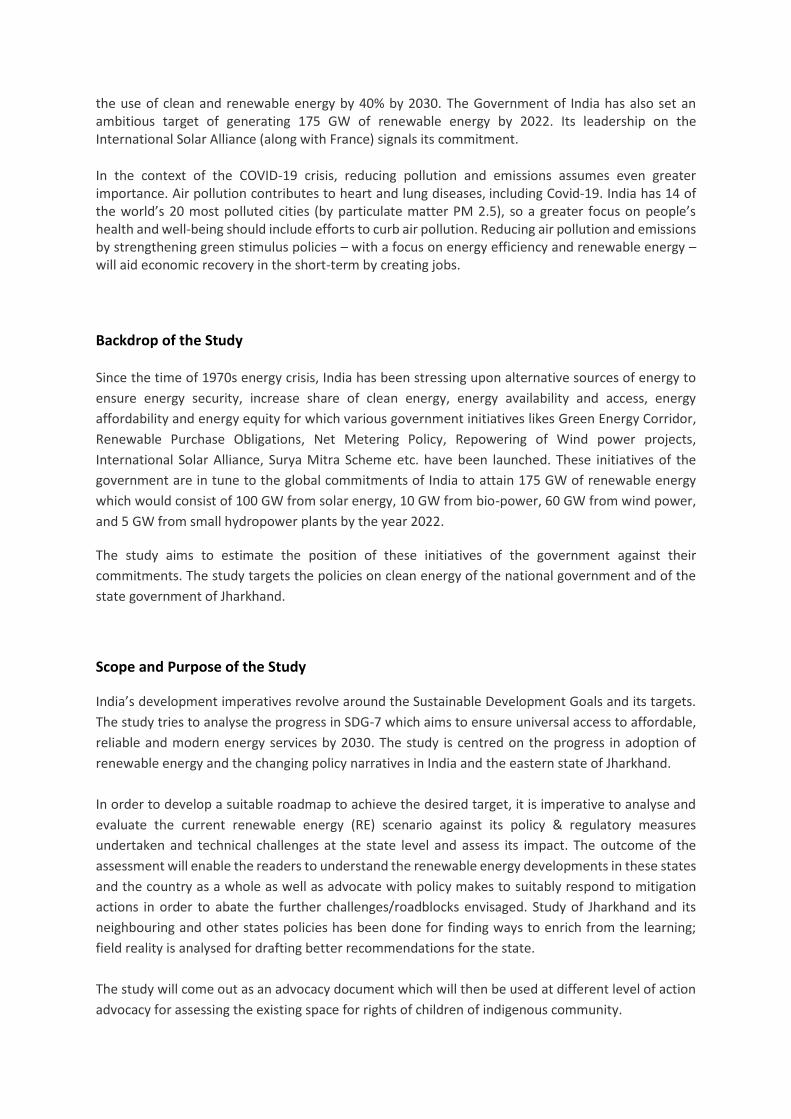
collected. 81% of the households in Khunti district
are connected to grid while 73.93% households in
Simdega are connected to the grid. Thus a
significant proportion of households still don’t have electricity connection. The number being more
than a quarter in Simdega and nearly one-fifth in Khunti.
The hours of electricity presents a new picture altogether in the surveyed area. Just 0.4% households
in Khunti have electricity for more than 12 hours and none of the households enjoy more than 12
hours of electricity in Simdega district. 45.9% of households in Khunti have electricity for less than 5
hours in a day and the number for the same in Simdega is 83.82%.
Thus, the condition of electricity connectivity as well as electricity supply is poor in the surveyed area
of the two districts.
Alternate Sources of Energy for Lighting:
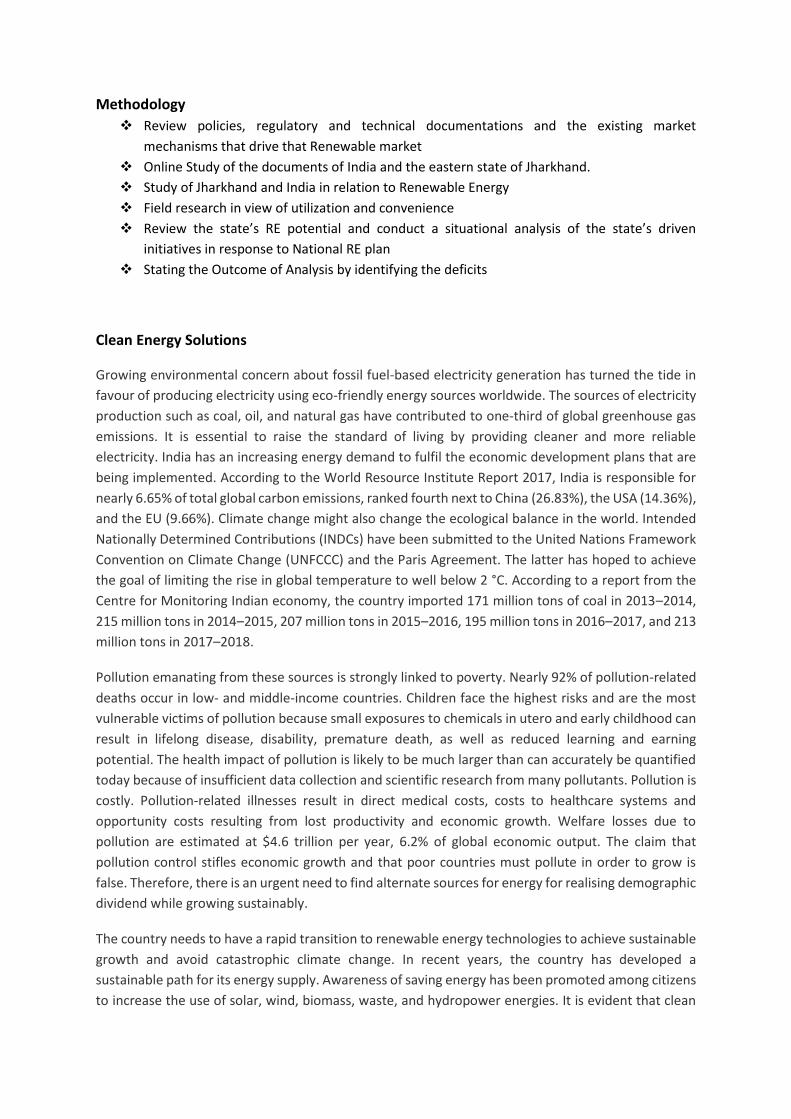
When electricity has not reached in true
sense to the remote areas people are
forced to use alternate sources of energy
for lightening purposes in the dark and
for their other energy needs. 73.6% of
the households surveyed used
lantern/dhibri for lighting purpose in
Khunti while 86.6% households use
lantern/dhibri in Simdega for lighting.
Charing lamps and inverters are getting popular lately. 24.1% of household’s employ charging lamps
for lighting in Khunti while the number for the same in Simdega is 13.15.
Thus, a lot of fossil fuel gets consumed because in unavailability of electricity and its poor supply in
the area under study.
0.0
20.0
40.0
60.0
80.0
100.0
1-5 hrs. 6-11 hrs. More than12 hrs
Notavailable
Electricity Availability
Khunti
Simdega
Ranchi
Gumla
0.0
20.0
40.0
60.0
80.0
100.0
Lantern/Dibri Charging Lamp Inverter Others
Alternate Sources for Lighting
Khunti
Simdega
Ranchi
Gumla
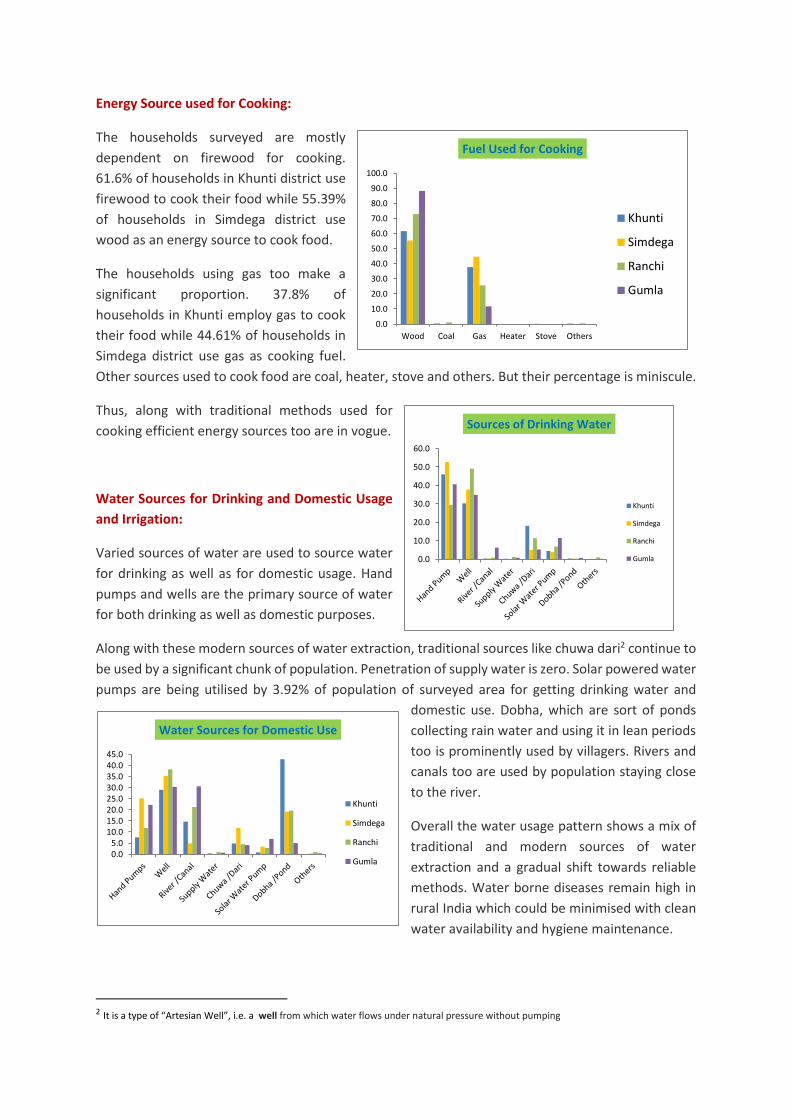
Energy Source used for Cooking:
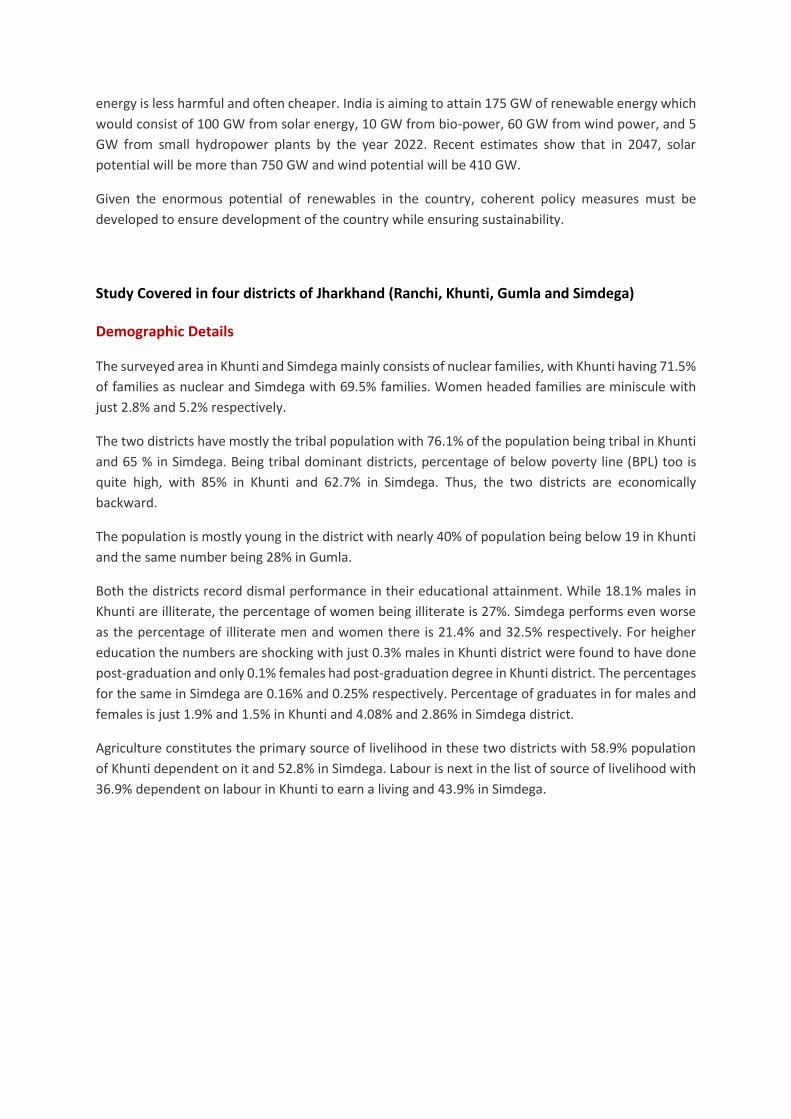
The households surveyed are mostly
dependent on firewood for cooking.
61.6% of households in Khunti district use
firewood to cook their food while 55.39%
of households in Simdega district use
wood as an energy source to cook food.
The households using gas too make a
significant proportion. 37.8% of
households in Khunti employ gas to cook
their food while 44.61% of households in
Simdega district use gas as cooking fuel.
Other sources used to cook food are coal, heater, stove and others. But their percentage is miniscule.
Thus, along with traditional methods used for
cooking efficient energy sources too are in vogue.
Water Sources for Drinking and Domestic Usage
and Irrigation:
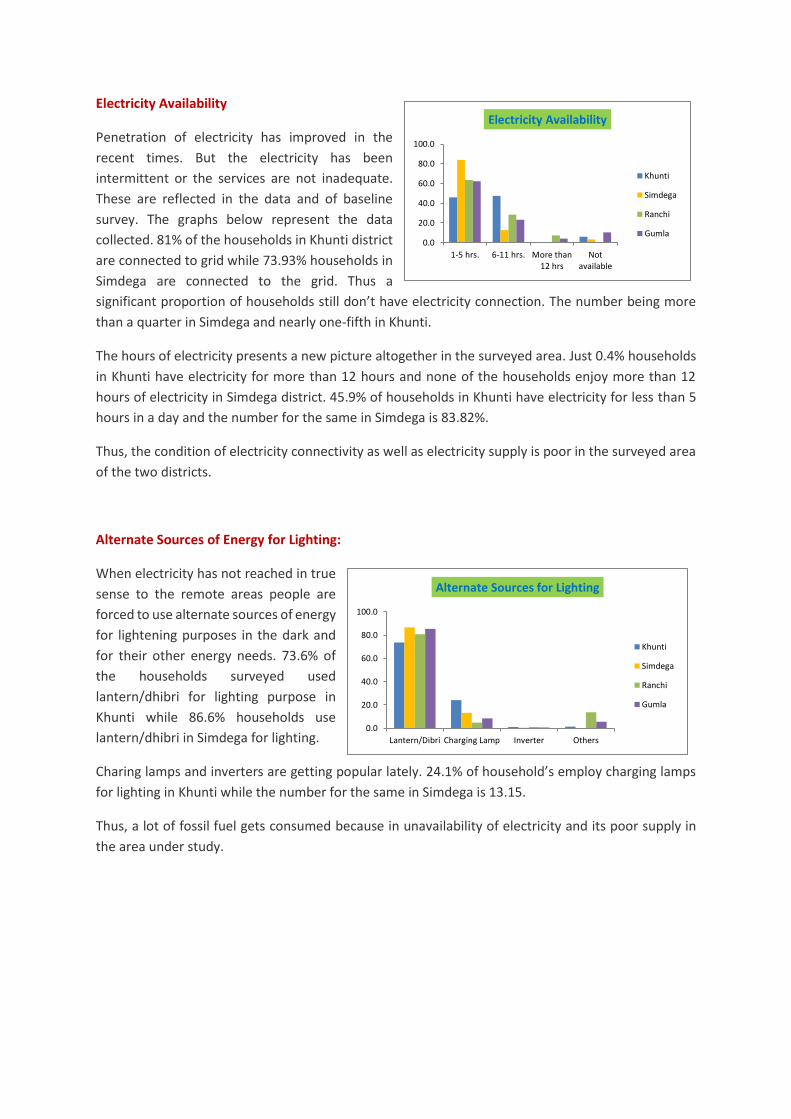
Varied sources of water are used to source water
for drinking as well as for domestic usage. Hand
pumps and wells are the primary source of water
for both drinking as well as domestic purposes.
Along with these modern sources of water extraction, traditional sources like chuwa dari2 continue to
be used by a significant chunk of population. Penetration of supply water is zero. Solar powered water
pumps are being utilised by 3.92% of population of surveyed area for getting drinking water and
domestic use. Dobha, which are sort of ponds
collecting rain water and using it in lean periods
too is prominently used by villagers. Rivers and
canals too are used by population staying close
to the river.
Overall the water usage pattern shows a mix of
traditional and modern sources of water
extraction and a gradual shift towards reliable
methods. Water borne diseases remain high in
rural India which could be minimised with clean
water availability and hygiene maintenance.
2 It is a type of “Artesian Well”, i.e. a well from which water flows under natural pressure without pumping
0.0
10.0
20.0
30.0
40.0
50.0
60.0
Sources of Drinking Water
Khunti
Simdega
Ranchi
Gumla
0.05.0
10.015.020.025.030.035.040.045.0
Water Sources for Domestic Use
Khunti
Simdega
Ranchi
Gumla
0.0
10.0
20.0
30.0
40.0
50.0
60.0
70.0
80.0
90.0
100.0
Wood Coal Gas Heater Stove Others
Fuel Used for Cooking
Khunti
Simdega
Ranchi
Gumla
Water source for irrigation vary between the most traditional like dang latta to the most modern like
drip. A significant proportion of surveyed population i.e. 42.4% of the population used dang/latta for
irrigating their farms, signifying that the population are follow rain-fed agriculture. Tullu pumps,
submersible pumps and diesel pumps too is used by a chunk of population. Solar pumps are gradually
gaining popularity is being used by 2.2% of the population. The government’s assistance for lift
irrigation is utilised by 9.4% of the populace. Thus, government’s schemes are gradually finding
penetration in the remotest region but still significant population use traditional methods for irrigating
their farms.
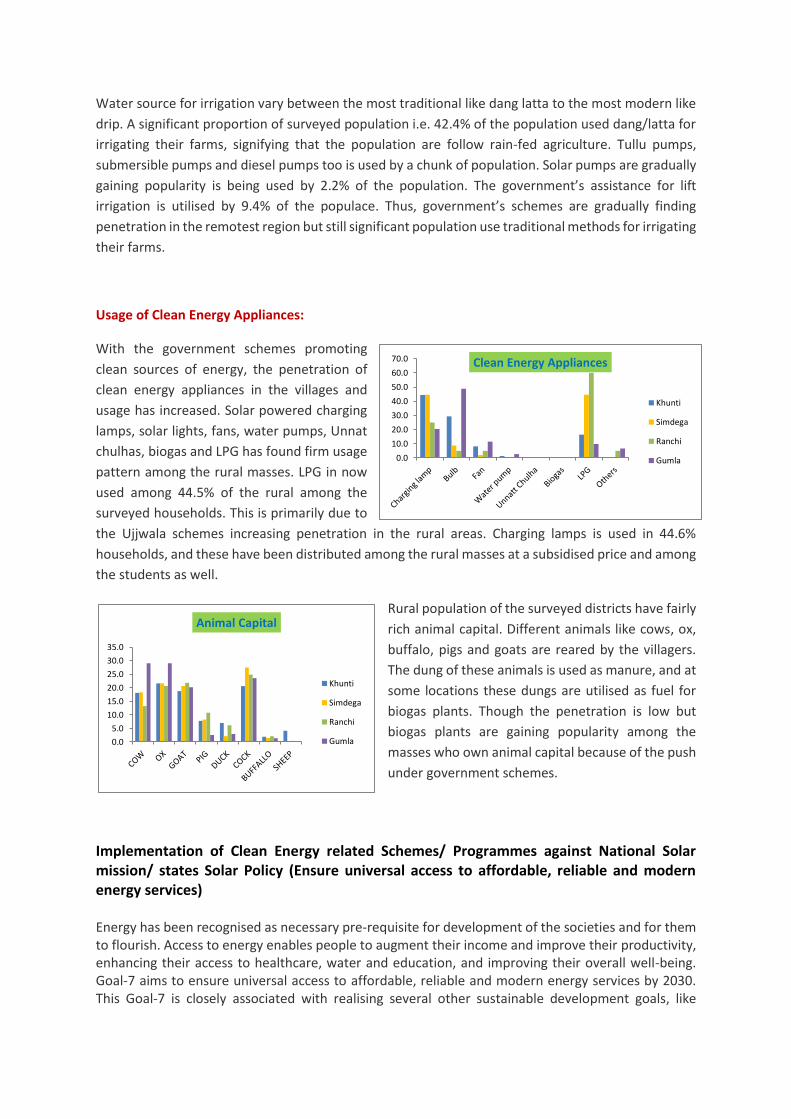
Usage of Clean Energy Appliances:
With the government schemes promoting
clean sources of energy, the penetration of
clean energy appliances in the villages and
usage has increased. Solar powered charging
lamps, solar lights, fans, water pumps, Unnat
chulhas, biogas and LPG has found firm usage
pattern among the rural masses. LPG in now
used among 44.5% of the rural among the
surveyed households. This is primarily due to
the Ujjwala schemes increasing penetration in the rural areas. Charging lamps is used in 44.6%
households, and these have been distributed among the rural masses at a subsidised price and among
the students as well.
Rural population of the surveyed districts have fairly
rich animal capital. Different animals like cows, ox,
buffalo, pigs and goats are reared by the villagers.
The dung of these animals is used as manure, and at
some locations these dungs are utilised as fuel for
biogas plants. Though the penetration is low but
biogas plants are gaining popularity among the
masses who own animal capital because of the push
under government schemes.
Implementation of Clean Energy related Schemes/ Programmes against National Solar mission/ states Solar Policy (Ensure universal access to affordable, reliable and modern energy services)
Energy has been recognised as necessary pre-requisite for development of the societies and for them to flourish. Access to energy enables people to augment their income and improve their productivity, enhancing their access to healthcare, water and education, and improving their overall well-being. Goal-7 aims to ensure universal access to affordable, reliable and modern energy services by 2030. This Goal-7 is closely associated with realising several other sustainable development goals, like
0.0
10.0
20.0
30.0
40.0
50.0
60.0
70.0 Clean Energy Appliances
Khunti
Simdega
Ranchi
Gumla
0.0
5.0
10.0
15.0
20.0
25.0
30.0
35.0
Animal Capital
Khunti
Simdega
Ranchi
Gumla
eliminating poverty (goal-1), good health and well-being(goal -3), industry, innovation and infrastructure( goal-10), reducing inequality(goal-11), sustainable cities and communities( goal-12), responsible consumption and production( goal – 13), climate action ( goal -14), and partnerships for goals( goal – 17) directly and indirectly.
The SDG-7 covers following targets
1. By 2030, ensure universal access to affordable, reliable and modern energy services. 2. By 2030, increase substantially the share of renewable energy in the global energy mix. 3. By 2030, double the global rate of improvement in energy efficiency. 4. By 2030, enhance international cooperation to facilitate access to clean energy research and
technology, including renewable energy, energy efficiency and advanced and cleaner fossil-fuel technology, and promote investment in energy infrastructure and clean energy technology.
5. By 2030, expand infrastructure and upgrade technology for supplying modern and sustainable energy services for all in developing countries, in particular least developed countries, small island developing States, and land-locked developing countries, in accordance with their respective programmes of support.
To achieve these targets, the Ministry of Petroleum and Natural Gas aimed to reduce oil imports by 10% from 2014-15 to 2021-2022. Additionally, according to Nationally Determined Contributions (NDCs) targets, India aims to:
(i) Reduce emissions intensity by 33-35% over 2005 to 2030, (ii) Achieve a 175GW renewable energy capacity by 2022, which includes 100 GW from solar power,
60 GW from wind power, 10 GW from biomass power, and 5 MW from small hydro–power, while committing to have 40 percent of non-fossil fuel sources by 2030, as a measure towards energy security and meeting the NDCs, and
(iii) Increase the share of non-fossil fuel-based capacity in the electricity mix to above 40% by 2030.
In 2018, this target has been ramped up to 225 GW of renewable energy capacity by 2022 and 275 GW by 2027. The National Electricity Plan 2018 also reinforces the government's commitment to transforming the Indian electricity sector with a target of 275 GW of renewable energy by 2027. India's renewable energy installed capacity grew to 82.58 GW as on 31st October 2019, more than doubling from 39 GW on 31st March 2015. In pursuit of the policy objective of increasing access at affordable prices, renewable energy tariff in the country has significantly slumped to make it cost-competitive with coal-fired generation. India's renewable energy cost has become the lowest in the Asia Pacific as Levelized Cost Of Electricity (LCOE) using solar photovoltaic (PV) has fallen to about INR 2700 (USD 38) per megawatt-hour (MWh) in 2019, 14 per cent cheaper than coal-fired power, traditionally the cheap India is also the 4th most attractive country in the world in 2019 for renewable energy investment. India has remained within the top five in the ranking over the past several years, indicating new opportunities for resource mobilisation and infrastructural growth.
Energy- efficiency is one of the most significant tools towards sustainability. The promulgation of the Environmental Conservation Act in 2001 and the initiation of the National Mission for Enhanced Energy Efficiency (NMEEE) in 2008 have heralded India's long-held concern on energy efficiency. The focus on lowering energy intensity and CO2 emission has also got further institutional shape with the setting up the Bureau of Energy Efficiency (BEE). In the residential and commercial sector, enforcing standards and labelling has adequately targeted the household appliances to promote energy efficiency. Distribution of about 360 million LED appliances so far across the country has led to saving of 46.8 billion KWh energy and reduction of CO 2 emission to the tune of 37.9 million tons per year. The wide distribution of LPG to low-income households under the Pradhan Mantri Ujjwala Yojana has
led to a significant reduction in CO2 emission and burning of solid fuel in millions of households. With increasing urbanisation and development of smart cities by the government, the energy efficiency in the building sector has to be improved. The application of the Energy Conservation Building Code (ECBC) and the voluntary star rating programme for buildings support a transition towards green buildings. Other initiatives like the promotion of energy efficiency in micro, small and medium enterprises; capacity building of DISCOMs; development of the institutional capacity of States; among others, widen the compass of energy efficiency. India has facilitated the establishment of the International Solar Alliance jointly with France, which provides a common platform for 121 countries to work on innovative policies, financial instruments and capacity-building measures to undertake more ambitious solar energy programmes.
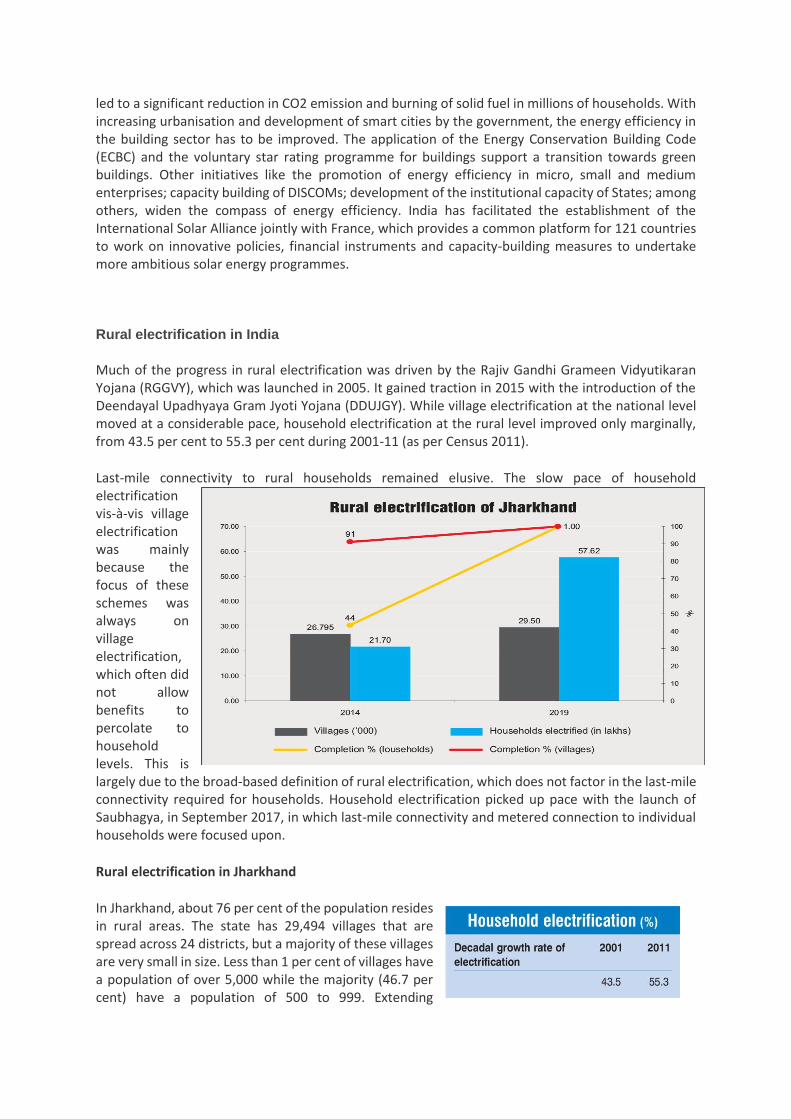
Rural electrification in India
Much of the progress in rural electrification was driven by the Rajiv Gandhi Grameen Vidyutikaran Yojana (RGGVY), which was launched in 2005. It gained traction in 2015 with the introduction of the Deendayal Upadhyaya Gram Jyoti Yojana (DDUJGY). While village electrification at the national level moved at a considerable pace, household electrification at the rural level improved only marginally, from 43.5 per cent to 55.3 per cent during 2001-11 (as per Census 2011).
Last-mile connectivity to rural households remained elusive. The slow pace of household electrification vis-à-vis village electrification was mainly because the focus of these schemes was always on village electrification, which often did not allow benefits to percolate to household levels. This is largely due to the broad-based definition of rural electrification, which does not factor in the last-mile connectivity required for households. Household electrification picked up pace with the launch of Saubhagya, in September 2017, in which last-mile connectivity and metered connection to individual households were focused upon.
Rural electrification in Jharkhand
In Jharkhand, about 76 per cent of the population resides in rural areas. The state has 29,494 villages that are spread across 24 districts, but a majority of these villages are very small in size. Less than 1 per cent of villages have a population of over 5,000 while the majority (46.7 per cent) have a population of 500 to 999. Extending
infrastructure to such sparsely populated villages presents logistical as well as manpower-related challenges and is also financially unviable.
Village electrification was at around 91 per cent in 2014 while household electrification lagged behind, recording a marginal improvement in the percentage of households electrified (from 32.3 per cent in 2011 to 44 per cent in 2014).
Saubhagya focused on intensive village electrification by ensuring electricity connection to rural households. Although the scheme was centrally funded, the responsibility of providing last-mile connectivity to un-electrified households was allocated to state discoms.
In Jharkhand, state electricity discom Jharkhand Bijli Vitran Nigam Limited (JBVNL) was tasked with the coverage of close to 1.3 million un-electrified households (as on 10th October, 2017) in order to achieve 100 per cent household electrification.
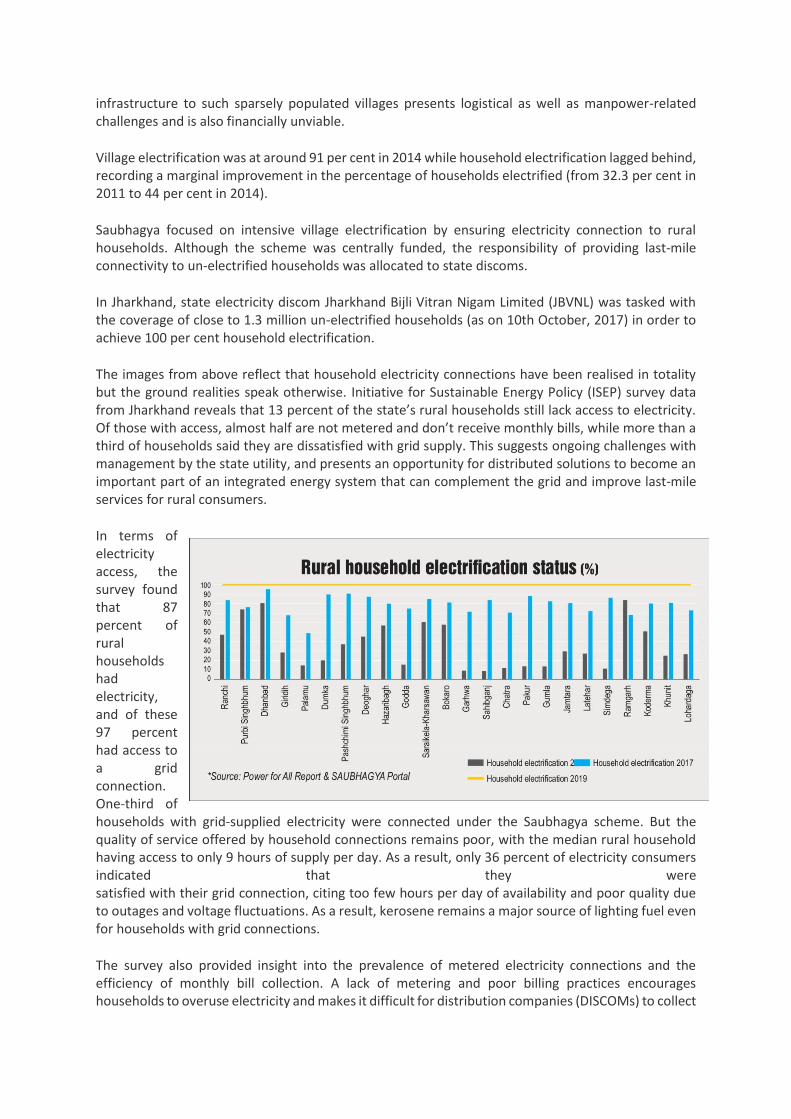
The images from above reflect that household electricity connections have been realised in totality but the ground realities speak otherwise. Initiative for Sustainable Energy Policy (ISEP) survey data from Jharkhand reveals that 13 percent of the state’s rural households still lack access to electricity. Of those with access, almost half are not metered and don’t receive monthly bills, while more than a third of households said they are dissatisfied with grid supply. This suggests ongoing challenges with management by the state utility, and presents an opportunity for distributed solutions to become an important part of an integrated energy system that can complement the grid and improve last-mile services for rural consumers.
In terms of electricity access, the survey found that 87 percent of rural households had electricity, and of these 97 percent had access to a grid connection. One-third of households with grid-supplied electricity were connected under the Saubhagya scheme. But the quality of service offered by household connections remains poor, with the median rural household having access to only 9 hours of supply per day. As a result, only 36 percent of electricity consumers indicated that they were satisfied with their grid connection, citing too few hours per day of availability and poor quality due to outages and voltage fluctuations. As a result, kerosene remains a major source of lighting fuel even for households with grid connections.
The survey also provided insight into the prevalence of metered electricity connections and the efficiency of monthly bill collection. A lack of metering and poor billing practices encourages households to overuse electricity and makes it difficult for distribution companies (DISCOMs) to collect
revenue, resulting in poorer service. According to the report, only 54 percent of rural households in the state received electricity bills, and only 51 percent had metered connections. Among households that had been connected under Saubhagya, 73 percent had meters but only 45 percent received any electricity bill. Overall, only 9 percent of households that have the grid were metered, received a bill, and paid it on time, suggesting that non-payment of bills, poor billing practices, and late payments exerts a substantial negative effect on DISCOM revenue.
As for clean cooking fuel, the survey showed that 53 percent of households have an LPG connection, and that 76 percent of these were connected thanks to the PMUY scheme. Moreover, although satisfaction with LPG is higher compared with grid electricity satisfaction – about 77 percent of households were satisfied with their LPG connection – usage remains quite low. Only 17 percent of households used LPG as their primary cooking fuel, with the vast majority (71 percent) using wood. This gap is largely the result of the high monthly cost of refills, coupled with the considerable distance households had to travel to secure an LPG cylinder; the median households reported having to travel 5 kilometres each way for a refill.
To achieve these targets, the Ministry of Petroleum and Natural Gas aimed to reduce oil imports by 10% from 2014-15 to 2021-2022. Additionally, according to Nationally Determined Contributions(NDCs) targets, India aims to (i) reduce emissions intensity by 33-35% over 2005 to 2030, (ii) achieve a 175GW renewable energy capacity by 2022, which includes 100 GW from solar power, 60 GW from wind power, 10 GW from biomass power, and 5 MW from small hydro–power, while committing to have 40 percent of non-fossil fuel sources by 2030, as a measure towards energy security and meeting the NDCs, and (iii) increase the share of non-fossil fuel-based capacity in the electricity mix to above 40% by 2030. In 2018, this target has been ramped up to 225 GW of renewable energy capacity by 2022 and 275 GW by 2027. The National Electricity Plan 2018 also reinforces the government's commitment to transforming the Indian electricity sector with a target of 275 GW of renewable energy by 2027. India's renewable energy installed capacity grew to 82.58 GW as on 31st October 2019, more than doubling from 39 GW on 31st March 2015. In pursuit of the policy objective of increasing access at affordable prices, renewable energy tariff in the country has significantly slumped to make it cost-competitive with coal-fired generation. India's renewable energy cost has become the lowest in the Asia Pacific as Levelized Cost Of Electricity (LCOE) using solar photovoltaic (PV) has fallen to about INR 2700 (USD 38) per megawatt-hour (MWh) in 2019, 14 per cent cheaper than coal-fired power, traditionally the cheap - est.37 India is also the 4th most attractive country in the world in 2019 for renewable energy investment. India has remained within the top five in the ranking over the past several years, indicating new opportunities for resource mobilisation and infrastructural growth.
Energy- efficiency is one of the most significant tools towards sustainability. The promulgation of the Environmental Conservation Act in 2001 and the initiation of the National Mission for Enhanced Energy Efficiency (NMEEE) in 2008 have heralded India's long-held concern on energy efficiency. The focus on lowering energy intensity and CO2 emission has also got further institutional shape with the setting up the Bureau of Energy Efficiency (BEE). In the residential and commercial sector, enforcing standards and labelling has adequately targeted the household appliances to promote energy efficiency. Distribution of about 360 million LED appliances so far across the country has led to saving of 46.8 billion KWh energy and reduction of CO 2 emission to the tune of 37.9 million tons per year. The wide distribution of LPG to low-income households under the Pradhan Mantri Ujjwala Yojana has led to a significant reduction in CO2 emission and burning of solid fuel in millions of households. With increasing urbanisation and development of smart cities by the government, the energy efficiency in the building sector has to be improved. The application of the Energy Conservation Building Code (ECBC) and the voluntary star rating programme for buildings support a transition towards green buildings. Other initiatives like the promotion of energy efficiency in micro, small and medium
enterprises; capacity building of DISCOMs; development of the institutional capacity of States; among others, widen the compass of energy efficiency. India has facilitated the establishment of the International Solar Alliance jointly with France, which provides a common platform for 121 countries to work on innovative policies, financial instruments and capacity-building measures to undertake more ambitious solar energy programmes.
Renewable Purchasing Obligation Status
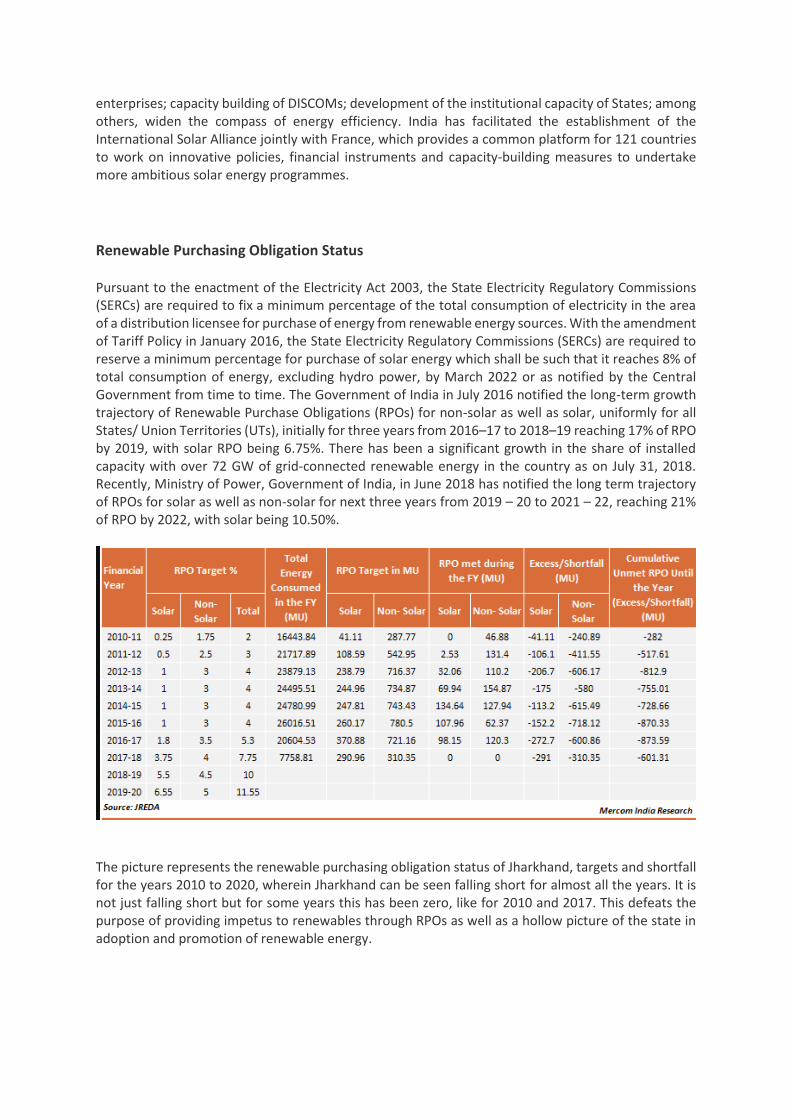
Pursuant to the enactment of the Electricity Act 2003, the State Electricity Regulatory Commissions (SERCs) are required to fix a minimum percentage of the total consumption of electricity in the area of a distribution licensee for purchase of energy from renewable energy sources. With the amendment of Tariff Policy in January 2016, the State Electricity Regulatory Commissions (SERCs) are required to reserve a minimum percentage for purchase of solar energy which shall be such that it reaches 8% of total consumption of energy, excluding hydro power, by March 2022 or as notified by the Central Government from time to time. The Government of India in July 2016 notified the long-term growth trajectory of Renewable Purchase Obligations (RPOs) for non-solar as well as solar, uniformly for all States/ Union Territories (UTs), initially for three years from 2016–17 to 2018–19 reaching 17% of RPO by 2019, with solar RPO being 6.75%. There has been a significant growth in the share of installed capacity with over 72 GW of grid-connected renewable energy in the country as on July 31, 2018. Recently, Ministry of Power, Government of India, in June 2018 has notified the long term trajectory of RPOs for solar as well as non-solar for next three years from 2019 – 20 to 2021 – 22, reaching 21% of RPO by 2022, with solar being 10.50%.
The picture represents the renewable purchasing obligation status of Jharkhand, targets and shortfall for the years 2010 to 2020, wherein Jharkhand can be seen falling short for almost all the years. It is not just falling short but for some years this has been zero, like for 2010 and 2017. This defeats the purpose of providing impetus to renewables through RPOs as well as a hollow picture of the state in adoption and promotion of renewable energy.
Extent of Implementation of SDG- 7
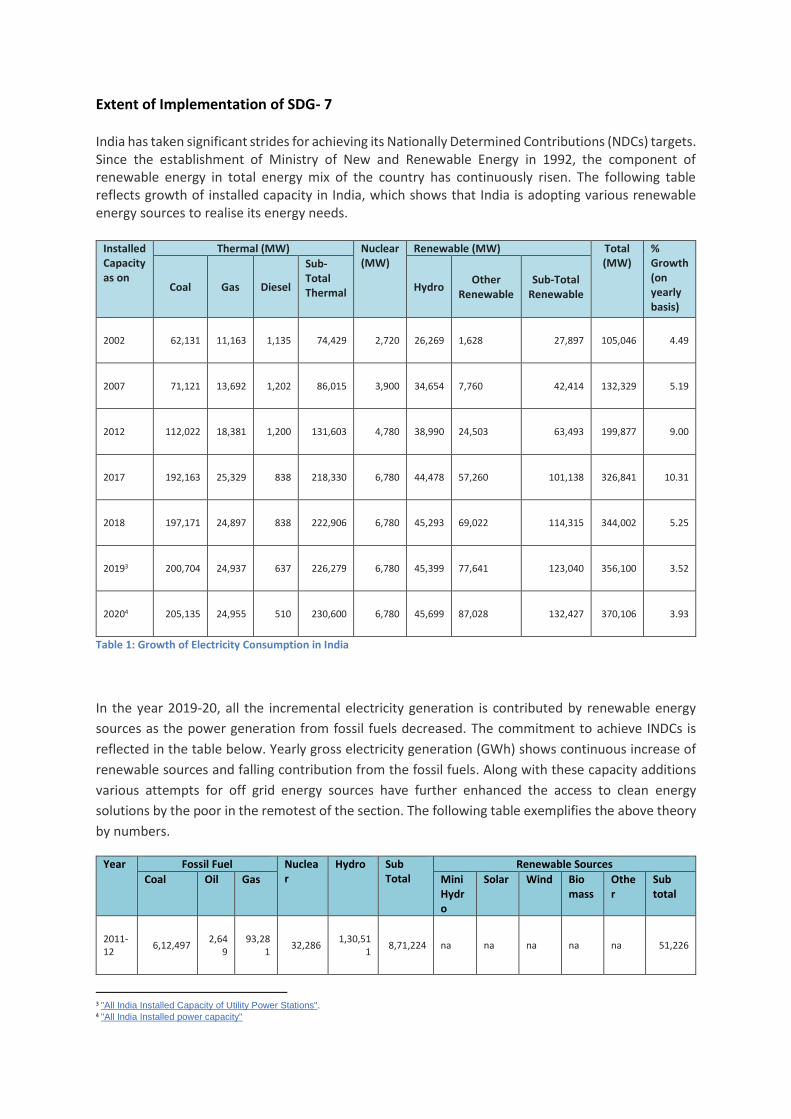
India has taken significant strides for achieving its Nationally Determined Contributions (NDCs) targets. Since the establishment of Ministry of New and Renewable Energy in 1992, the component of renewable energy in total energy mix of the country has continuously risen. The following table reflects growth of installed capacity in India, which shows that India is adopting various renewable energy sources to realise its energy needs.
Installed Capacity as on
Thermal (MW) Nuclear (MW)
Renewable (MW) Total (MW)
% Growth (on yearly basis)
Coal Gas Diesel
Sub-Total Thermal Hydro
Other Renewable
Sub-Total Renewable
2002 62,131 11,163 1,135 74,429 2,720 26,269 1,628 27,897 105,046 4.49
2007 71,121 13,692 1,202 86,015 3,900 34,654 7,760 42,414 132,329 5.19
2012 112,022 18,381 1,200 131,603 4,780 38,990 24,503 63,493 199,877 9.00
2017 192,163 25,329 838 218,330 6,780 44,478 57,260 101,138 326,841 10.31
2018 197,171 24,897 838 222,906 6,780 45,293 69,022 114,315 344,002 5.25
20193 200,704 24,937 637 226,279 6,780 45,399 77,641 123,040 356,100 3.52
20204 205,135 24,955 510 230,600 6,780 45,699 87,028 132,427 370,106 3.93
Table 1: Growth of Electricity Consumption in India
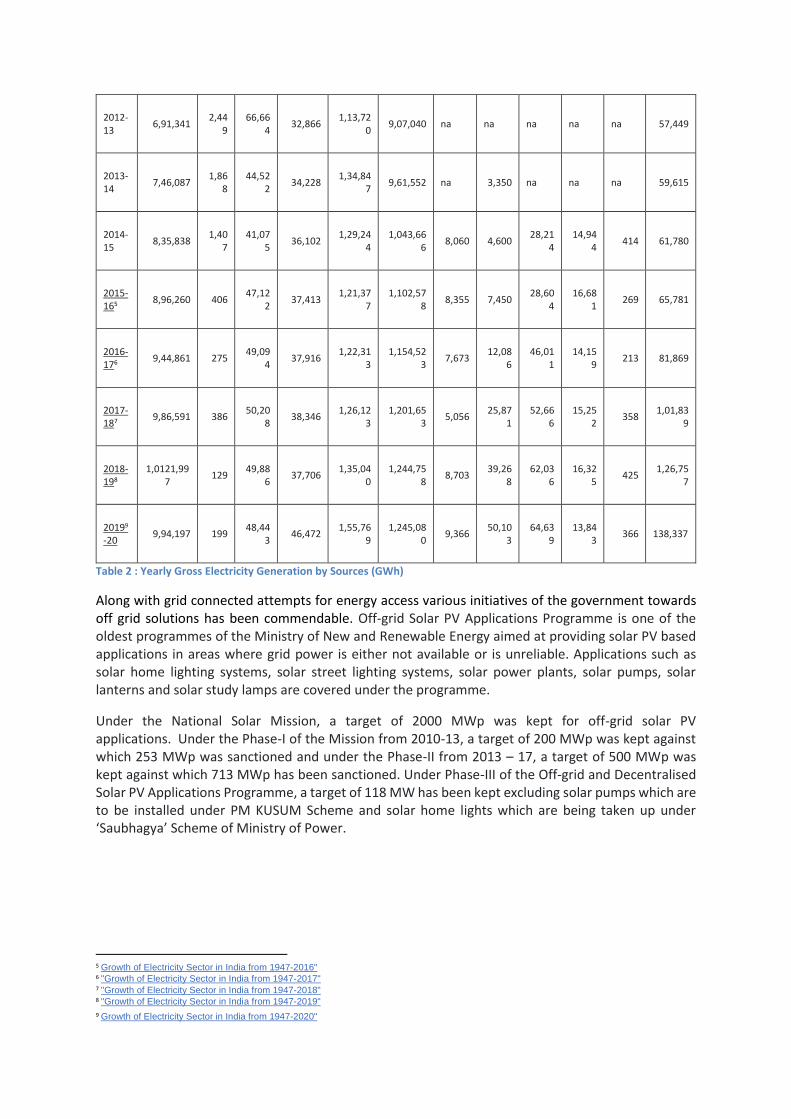
In the year 2019-20, all the incremental electricity generation is contributed by renewable energy
sources as the power generation from fossil fuels decreased. The commitment to achieve INDCs is
reflected in the table below. Yearly gross electricity generation (GWh) shows continuous increase of
renewable sources and falling contribution from the fossil fuels. Along with these capacity additions
various attempts for off grid energy sources have further enhanced the access to clean energy
solutions by the poor in the remotest of the section. The following table exemplifies the above theory
by numbers.
Year Fossil Fuel Nuclear
Hydro Sub Total
Renewable Sources
Coal Oil Gas Mini Hydro
Solar Wind Bio mass
Other
Sub total
2011-12
6,12,497 2,64
9 93,28
1 32,286
1,30,511
8,71,224 na na na na na 51,226
3 "All India Installed Capacity of Utility Power Stations". 4 "All India Installed power capacity"
2012-13
6,91,341 2,44
9 66,66
4 32,866
1,13,720
9,07,040 na na na na na 57,449
2013-14
7,46,087 1,86
8 44,52
2 34,228
1,34,847
9,61,552 na 3,350 na na na 59,615
2014-15
8,35,838 1,40
7 41,07
5 36,102
1,29,244
1,043,666
8,060 4,600 28,21
4 14,94
4 414 61,780
2015-165
8,96,260 406 47,12
2 37,413
1,21,377
1,102,578
8,355 7,450 28,60
4 16,68
1 269 65,781
2016-176
9,44,861 275 49,09
4 37,916
1,22,313
1,154,523
7,673 12,08
6 46,01
1 14,15
9 213 81,869
2017-187
9,86,591 386 50,20
8 38,346
1,26,123
1,201,653
5,056 25,87
1 52,66
6 15,25
2 358
1,01,839
2018-198
1,0121,997
129 49,88
6 37,706
1,35,040
1,244,758
8,703 39,26
8 62,03
6 16,32
5 425
1,26,757
20199
-20
9,94,197 199 48,44
3 46,472
1,55,769
1,245,080
9,366 50,10
3 64,63
9 13,84
3 366 138,337
Table 2 : Yearly Gross Electricity Generation by Sources (GWh)
Along with grid connected attempts for energy access various initiatives of the government towards off grid solutions has been commendable. Off-grid Solar PV Applications Programme is one of the oldest programmes of the Ministry of New and Renewable Energy aimed at providing solar PV based applications in areas where grid power is either not available or is unreliable. Applications such as solar home lighting systems, solar street lighting systems, solar power plants, solar pumps, solar lanterns and solar study lamps are covered under the programme.
Under the National Solar Mission, a target of 2000 MWp was kept for off-grid solar PV applications. Under the Phase-I of the Mission from 2010-13, a target of 200 MWp was kept against which 253 MWp was sanctioned and under the Phase-II from 2013 – 17, a target of 500 MWp was kept against which 713 MWp has been sanctioned. Under Phase-III of the Off-grid and Decentralised Solar PV Applications Programme, a target of 118 MW has been kept excluding solar pumps which are to be installed under PM KUSUM Scheme and solar home lights which are being taken up under ‘Saubhagya’ Scheme of Ministry of Power.
5 Growth of Electricity Sector in India from 1947-2016" 6 "Growth of Electricity Sector in India from 1947-2017" 7 "Growth of Electricity Sector in India from 1947-2018" 8 "Growth of Electricity Sector in India from 1947-2019"
9 Growth of Electricity Sector in India from 1947-2020"
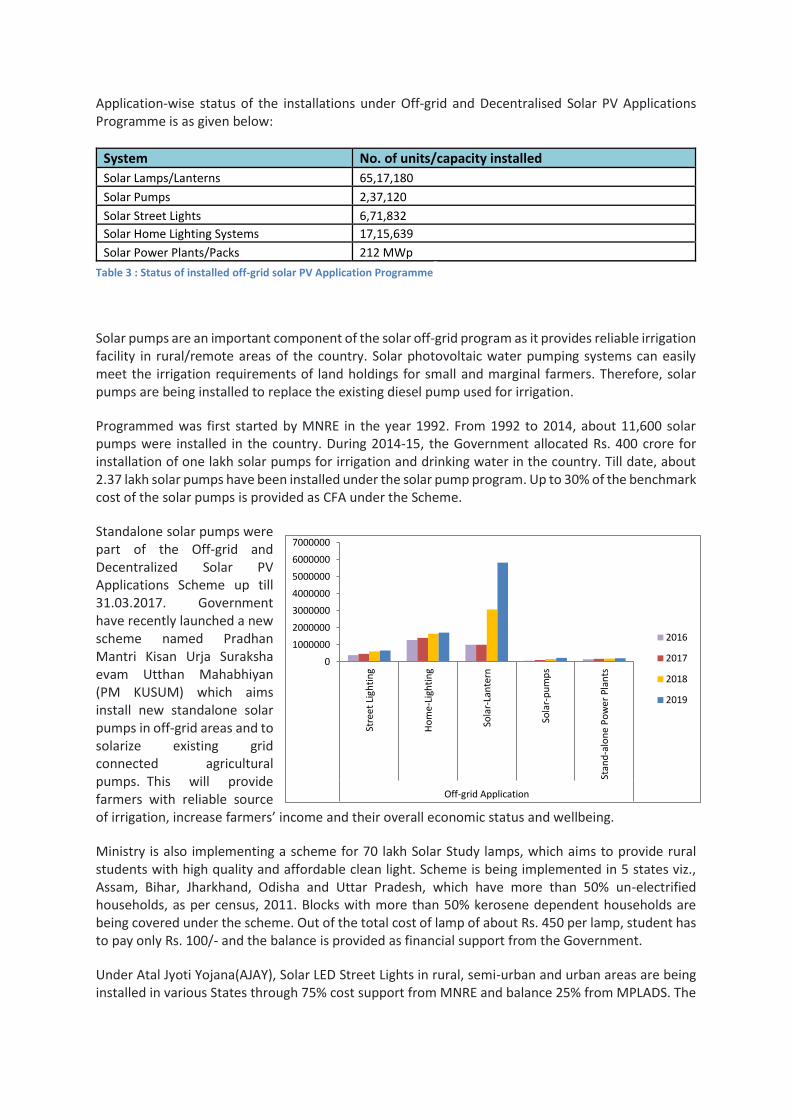
Application-wise status of the installations under Off-grid and Decentralised Solar PV Applications Programme is as given below:
System No. of units/capacity installed
Solar Lamps/Lanterns 65,17,180
Solar Pumps 2,37,120
Solar Street Lights 6,71,832
Solar Home Lighting Systems 17,15,639
Solar Power Plants/Packs 212 MWp
Table 3 : Status of installed off-grid solar PV Application Programme
Solar pumps are an important component of the solar off-grid program as it provides reliable irrigation facility in rural/remote areas of the country. Solar photovoltaic water pumping systems can easily meet the irrigation requirements of land holdings for small and marginal farmers. Therefore, solar pumps are being installed to replace the existing diesel pump used for irrigation.
Programmed was first started by MNRE in the year 1992. From 1992 to 2014, about 11,600 solar pumps were installed in the country. During 2014-15, the Government allocated Rs. 400 crore for installation of one lakh solar pumps for irrigation and drinking water in the country. Till date, about 2.37 lakh solar pumps have been installed under the solar pump program. Up to 30% of the benchmark cost of the solar pumps is provided as CFA under the Scheme.
Standalone solar pumps were part of the Off-grid and Decentralized Solar PV Applications Scheme up till 31.03.2017. Government have recently launched a new scheme named Pradhan Mantri Kisan Urja Suraksha evam Utthan Mahabhiyan (PM KUSUM) which aims install new standalone solar pumps in off-grid areas and to solarize existing grid connected agricultural pumps. This will provide farmers with reliable source of irrigation, increase farmers’ income and their overall economic status and wellbeing.
Ministry is also implementing a scheme for 70 lakh Solar Study lamps, which aims to provide rural students with high quality and affordable clean light. Scheme is being implemented in 5 states viz., Assam, Bihar, Jharkhand, Odisha and Uttar Pradesh, which have more than 50% un-electrified households, as per census, 2011. Blocks with more than 50% kerosene dependent households are being covered under the scheme. Out of the total cost of lamp of about Rs. 450 per lamp, student has to pay only Rs. 100/- and the balance is provided as financial support from the Government.
Under Atal Jyoti Yojana(AJAY), Solar LED Street Lights in rural, semi-urban and urban areas are being installed in various States through 75% cost support from MNRE and balance 25% from MPLADS. The
0
1000000
2000000
3000000
4000000
5000000
6000000
7000000
Stre
et
Ligh
tin
g
Ho
me-
Ligh
tin
g
Sola
r-La
nte
rn
Sola
r-p
um
ps
Stan
d-a
lon
e P
ow
er
Pla
nts
Off-grid Application
2016
2017
2018
2019
installation of Solar LED Street Lights ensure ample light in major roads, markets, public conveniences etc. in remote areas and would help the citizens of our country lead a safe and secure life. Followings are some of the unintended collaterals of push for RE and its grid integration:
• Additional energy availability from generation of Solar & Wind exceeds the growth in energy demand thereby is causing backing down of conventional power plants to accommodate “Must Run” RE. As we are adding more and more RE Sources, average Plant Load Factor (PLF) of Thermal Power Plants is reducing. Currently, the average PLF of thermal PPs is hovering around technical minimum of 55% whereas around 10 years ago, it was a healthy 75%.
• While cost of RE generation appears to be less than thermal as discovered in tariff based competitive biddings, the associated balancing costs in form of higher transmission charges (due to lower utilization of green corridors etc.) has been camouflaged by exempting inter-state transmission charge on RE and loading it on others.
• Discoms continue to pay for the fixed charges to the generation companies (Gencos) for the stranded thermal capacity caused due to backing down because of their long-term capacity contracts or PPAs.
• Average Power Purchase Cost (APPC) and Average cost of supply (ACoS) are increasing and adversely affecting the affordability of consumers to pay for expensive power. This in turn is increasing the financial stress of discoms and contagion is being passed on through defaults by Discoms to Gencos and thereafter to the banks NPAs & economy.
State-wise target reflection as per area covered
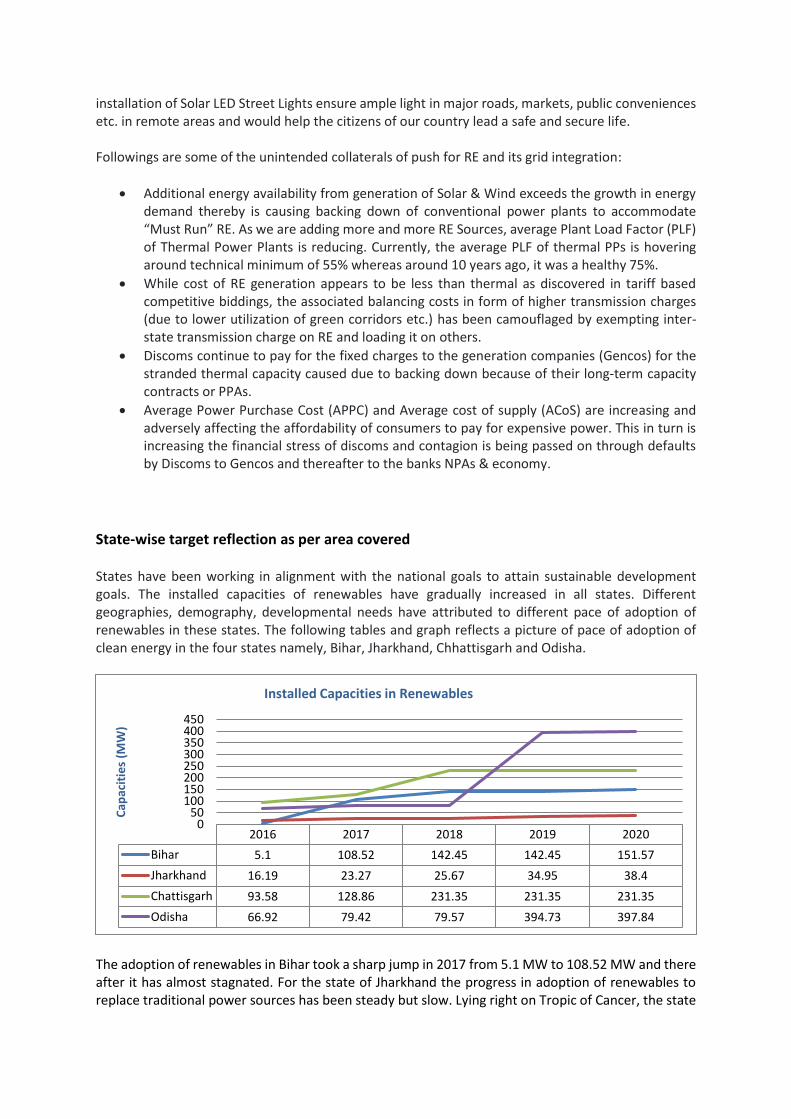
States have been working in alignment with the national goals to attain sustainable development goals. The installed capacities of renewables have gradually increased in all states. Different geographies, demography, developmental needs have attributed to different pace of adoption of renewables in these states. The following tables and graph reflects a picture of pace of adoption of clean energy in the four states namely, Bihar, Jharkhand, Chhattisgarh and Odisha.
The adoption of renewables in Bihar took a sharp jump in 2017 from 5.1 MW to 108.52 MW and there after it has almost stagnated. For the state of Jharkhand the progress in adoption of renewables to replace traditional power sources has been steady but slow. Lying right on Tropic of Cancer, the state
2016 2017 2018 2019 2020
Bihar 5.1 108.52 142.45 142.45 151.57
Jharkhand 16.19 23.27 25.67 34.95 38.4
Chattisgarh 93.58 128.86 231.35 231.35 231.35
Odisha 66.92 79.42 79.57 394.73 397.84
050
100150200250300350400450
Cap
acit
ies
(MW
)
Installed Capacities in Renewables
receives ample amount of sunny days, still grid connected solar power in the state has not even reached 50 MW by 2020. Chhattisgarh hasn’t added any installed capacity since 2018. The state of Odisha has showed significant improvement from its initial 3 years of slow adoption to reach nearly 400MW of installed renewable capacity.
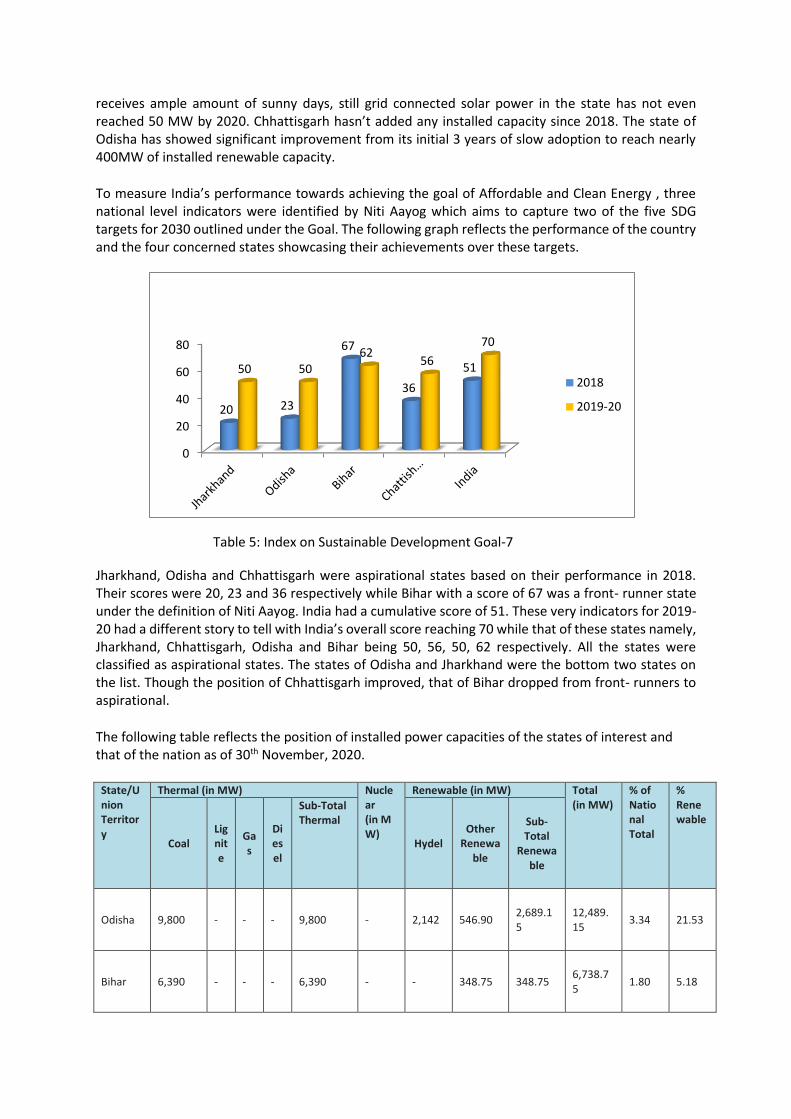
To measure India’s performance towards achieving the goal of Affordable and Clean Energy , three national level indicators were identified by Niti Aayog which aims to capture two of the five SDG targets for 2030 outlined under the Goal. The following graph reflects the performance of the country and the four concerned states showcasing their achievements over these targets.
Jharkhand, Odisha and Chhattisgarh were aspirational states based on their performance in 2018. Their scores were 20, 23 and 36 respectively while Bihar with a score of 67 was a front- runner state under the definition of Niti Aayog. India had a cumulative score of 51. These very indicators for 2019-20 had a different story to tell with India’s overall score reaching 70 while that of these states namely, Jharkhand, Chhattisgarh, Odisha and Bihar being 50, 56, 50, 62 respectively. All the states were classified as aspirational states. The states of Odisha and Jharkhand were the bottom two states on the list. Though the position of Chhattisgarh improved, that of Bihar dropped from front- runners to aspirational.
The following table reflects the position of installed power capacities of the states of interest and that of the nation as of 30th November, 2020.
State/Union Territory
Thermal (in MW) Nuclear (in MW)
Renewable (in MW) Total (in MW)
% of National Total
% Renewable
Coal Lignite
Gas
Diesel
Sub-Total Thermal
Hydel Other
Renewable
Sub-Total
Renewable
Odisha 9,800 - - - 9,800 - 2,142 546.90 2,689.15
12,489.15
3.34 21.53
Bihar 6,390 - - - 6,390 - - 348.75 348.75 6,738.75
1.80 5.18
0
20
40
60
80
20 23
67
36
5150 5062
56
70
2018
2019-20
Table 5: Index on Sustainable Development Goal-7
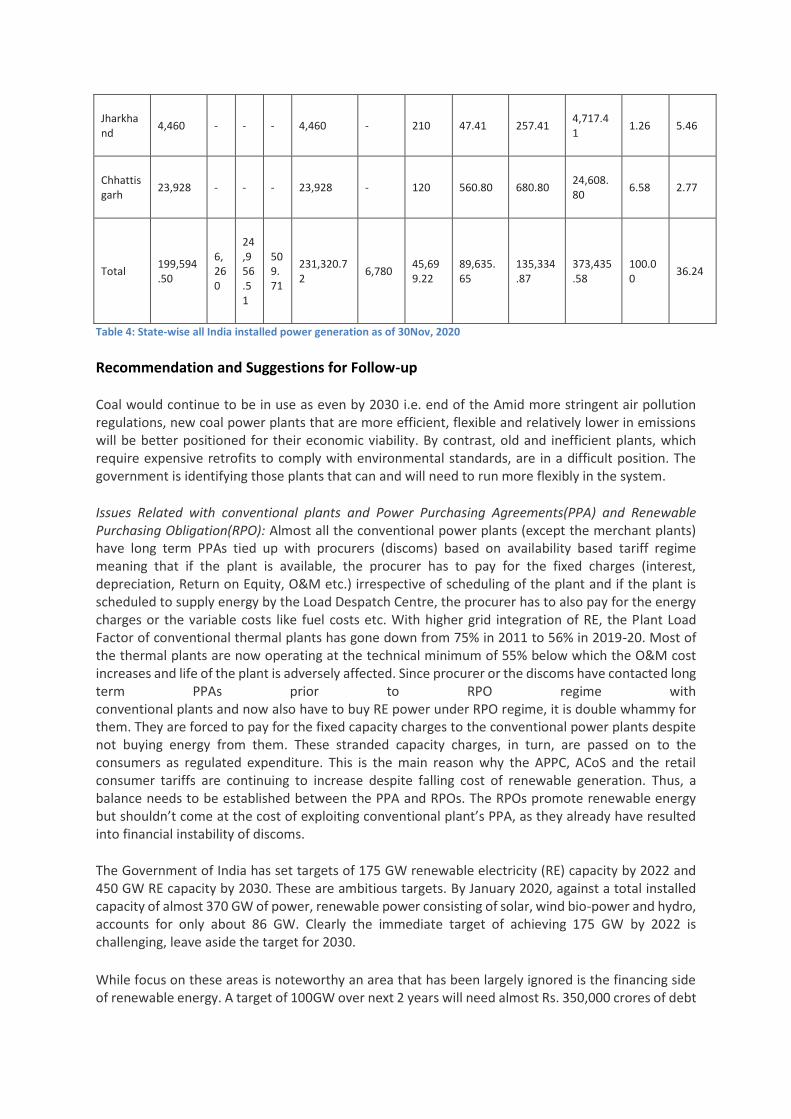
Jharkhand
4,460 - - - 4,460 - 210 47.41 257.41 4,717.41
1.26 5.46
Chhattisgarh
23,928 - - - 23,928 - 120 560.80 680.80 24,608.80
6.58 2.77
Total 199,594.50
6,260
24,956.51
509.71
231,320.72
6,780 45,699.22
89,635.65
135,334.87
373,435.58
100.00
36.24
Table 4: State-wise all India installed power generation as of 30Nov, 2020
Recommendation and Suggestions for Follow-up
Coal would continue to be in use as even by 2030 i.e. end of the Amid more stringent air pollution regulations, new coal power plants that are more efficient, flexible and relatively lower in emissions will be better positioned for their economic viability. By contrast, old and inefficient plants, which require expensive retrofits to comply with environmental standards, are in a difficult position. The government is identifying those plants that can and will need to run more flexibly in the system.
Issues Related with conventional plants and Power Purchasing Agreements(PPA) and Renewable Purchasing Obligation(RPO): Almost all the conventional power plants (except the merchant plants) have long term PPAs tied up with procurers (discoms) based on availability based tariff regime meaning that if the plant is available, the procurer has to pay for the fixed charges (interest, depreciation, Return on Equity, O&M etc.) irrespective of scheduling of the plant and if the plant is scheduled to supply energy by the Load Despatch Centre, the procurer has to also pay for the energy charges or the variable costs like fuel costs etc. With higher grid integration of RE, the Plant Load Factor of conventional thermal plants has gone down from 75% in 2011 to 56% in 2019-20. Most of the thermal plants are now operating at the technical minimum of 55% below which the O&M cost increases and life of the plant is adversely affected. Since procurer or the discoms have contacted long term PPAs prior to RPO regime with conventional plants and now also have to buy RE power under RPO regime, it is double whammy for them. They are forced to pay for the fixed capacity charges to the conventional power plants despite not buying energy from them. These stranded capacity charges, in turn, are passed on to the consumers as regulated expenditure. This is the main reason why the APPC, ACoS and the retail consumer tariffs are continuing to increase despite falling cost of renewable generation. Thus, a balance needs to be established between the PPA and RPOs. The RPOs promote renewable energy but shouldn’t come at the cost of exploiting conventional plant’s PPA, as they already have resulted into financial instability of discoms.
The Government of India has set targets of 175 GW renewable electricity (RE) capacity by 2022 and 450 GW RE capacity by 2030. These are ambitious targets. By January 2020, against a total installed capacity of almost 370 GW of power, renewable power consisting of solar, wind bio-power and hydro, accounts for only about 86 GW. Clearly the immediate target of achieving 175 GW by 2022 is challenging, leave aside the target for 2030.
While focus on these areas is noteworthy an area that has been largely ignored is the financing side of renewable energy. A target of 100GW over next 2 years will need almost Rs. 350,000 crores of debt
and Rs. 120,000 crores of equity, which needs to be explored when the present annual budget provision of the ministry of MNRE is just around 5000 crore.
Associated cost of present full throttle “one size fits all” RE Policy on the consumers and the economy shall be kept in mind to ensure financial viability of the power sector.
The four of the most resource rich states are laggards in adoption of renewable energy. Enough stress is being laid out on the capacity building and utilisation of the renewable resources, but the ground reality is that the state governments don’t still have renewables in their priority, for instance, one of the most ambitious schemes to promote off-grid solar power pumps for agriculture, PM KUSUM scheme in Jharkhand has not yet fulfilled the target for 2019-20. There remains stagnation in development of solar power in the states. Most of the achieved targets are in the government sector, i.e. government buildings, and its adoption among the masses have still been lacklustre. Thus, the drive shall be such tuned that the adoption of solar power or other renewables become attractive to general masses.