Embed Size (px)
Citation preview
Clean energy technologies in coal
regions: Opportunities for jobs
and growth Deployment potential
and impacts
Kapetaki, Z., Ruiz, P. et al.
2020
EUR 29895 EN
This publication is a Science for Policy report by the Joint Research Centre (JRC), the European Commission’s science and knowledge service. It aims to provide evidence-based scientific support to the European policymaking process. The scientific output expressed does not imply a policy position of the European Commission. Neither the European Commission nor any person acting on behalf of the Commission is
responsible for the use that might be made of this publication. For information on the methodology and quality underlying the data used in this publication for which the source is neither Eurostat nor other Commission services, users should contact the referenced source. The designations employed and the presentation of material on the maps do not imply the expression of any opinion whatsoever on the part of the European Union concerning the legal status of any country, territory, city or area or of its authorities, or concerning the delimitation of its frontiers or boundaries.
Contact information Name: Jose Moya Address: European Commission, Joint Research Centre, P.O. Box 2, NL-1755 ZG Petten, The Netherlands Email: [email protected] Tel.:+31 224 56 5244
EU Science Hub https://ec.europa.eu/jrc
JRC117938
EUR 29895 EN
PDF ISBN 978-92-76-12330-9 ISSN 1831-9424 doi:10.2760/063496
Print ISBN 978-92-76-10356-1 ISSN 1018-5593 doi:10.2760/384605
Luxembourg: Publications Office of the European Union, 2020
© European Union, 2020
The reuse policy of the European Commission is implemented by the Commission Decision 2011/833/EU of 12 December 2011 on the reuse of Commission documents (OJ L 330, 14.12.2011, p. 39). Except otherwise noted, the reuse of this document is authorised under the Creative Commons Attribution 4.0 International (CC BY 4.0) licence (https://creativecommons.org/licenses/by/4.0/). This means that reuse is allowed provided appropriate credit is given and any changes are indicated. For any use or reproduction of photos or other material that is not owned by the EU, permission must be sought directly from the copyright holders.
All content © European Union, 2020, except: -Cover image: ©vectomart – stock.adobe.com-Factsheets country logo, globe icon:All maps have been created with ArcGIS 10.1 using the ‘NUTS 2016’ and ‘Countries 2016‘ datasets from GISCO- Eurostat (European Commission): © EuroGeographics for the administrative boundaries(https://ec.europa.eu/eurostat/web/gisco/geodata/reference-data/administrative-units-statistical-units).
How to cite this report: Kapetaki, Z., Ruiz, P. et al., Clean energy technologies in coal regions: Opportunities for
jobs and growth: Deployment potential and impacts, Kapetaki, Z. (editor), EUR 29895 EN, Publications Office
of the European Union, Luxembourg, 2020, ISBN 978-92-76-12330-9, doi:10.2760/063496, JRC117938.
i
Contents
Abstract ............................................................................................................... 1
Acknowledgements ................................................................................................ 2
Executive summary ............................................................................................... 3
1 Introduction ...................................................................................................... 7
2 Clean energy technologies .................................................................................. 9
2.1 Wind ........................................................................................................ 10
2.2 Solar photovoltaics .................................................................................... 12
2.3 Coal mine reclamation ................................................................................ 14
2.4 Bioenergy ................................................................................................. 17
2.5 Geothermal energy .................................................................................... 22
2.6 Carbon capture.......................................................................................... 24
2.7 Energy efficiency in residential buildings ....................................................... 28
2.8 A glance on batteries ................................................................................. 36
3 Developing value chains ................................................................................... 39
4 Regional transition ........................................................................................... 45
4.1 Clean energy production technologies .......................................................... 45
4.1.1 Foresight scenario - EUCO3232.5 ......................................................... 45
4.1.2 Regional distribution .......................................................................... 46
4.1.3 Cost trends and EUCO3232.5 .............................................................. 48
4.1.4 Estimated investment needs for deploying clean energy technologies ....... 55
4.2 Energy Efficiency ....................................................................................... 57
5 Employment foresight ...................................................................................... 59
5.1.1 Induced employment assessment ........................................................ 59
5.1.1.1 Wind energy ................................................................................ 59
5.1.1.2 Solar PV ..................................................................................... 60
5.1.1.3 Bioenergy ................................................................................... 62
5.1.1.4 Geothermal ................................................................................. 63
5.1.2 Regional foresight and transition groups ............................................... 65
6 Summary of key findings .................................................................................. 89
References ......................................................................................................... 90
List of abbreviations ............................................................................................. 98
List of figures .................................................................................................... 100
List of tables ..................................................................................................... 104
Annexes ....................................................................................................... 106
1. European Coal Regions in Transition (CRiT) by 2016 NUTS 2 classification ...... 106
2. Regional fact sheets ................................................................................. 107
3. Technical potential per region .................................................................... 150

ii
4. Technical capacity and potential in coal mines (NUTS 2) ............................... 160
5. Methodology for defining the technical potential .......................................... 162
7. Methodology for estimating the wind and solar PV technical potential in coal mines
173
8. Battery-related activities in the 42 European coal regions considered ............. 179
9. Wind and solar value chains ...................................................................... 181
10. Employment and investment estimations and methodology ........................... 184
1
Abstract
In this report, we analyze the opportunities in coal regions stemming from the
deployment of power generation technologies from wind, solar photovoltaics, bioenergy
and geothermal sources, as well as on coal-fired power plants with carbon capture. In
this context, we also address energy demand technologies and specifically assess the
opportunities arising from energy efficiency in buildings. Starting from an existing
scenario (EURCO3232.5), we find that in total by 2030, between 106 681 and 314 416
jobs can be created in the coal regions from the deployment of clean energy
technologies, reaching 460 000 by 2050. Toward meeting the agreed 2030 targets and
objectives, the jobs created by clean energy technologies in the coal regions would be
comparable to the nearly 200 000 direct jobs relevant to coal related activities. By 2050,
job creation can more than double that figure. We identify a range of potential for the
different regions regarding job creation and resilience to coal related employment. We
estimate a technical potential of 1 516 GW from clean energy technologies in the coal
regions. Fully tapped, it would be enough to contribute to more than half of the
deployment required in achieving Europe’s ambitious vision for carbon neutrality by
2050.
2
Acknowledgements
We gratefully acknowledge Aleksandra Tomczak, Brieuc Posnic, Marc Steen and Berg
Olav for their review and valuable comments, as well as Efstathios Peteves and
Evangelos Tzimas for editing and reviewing this work. This work benefited from valuable
inputs from Jose Moya, Maria Ruehringer, Patricia Alves Dias, Wouter Nijs, Ioannis
Tsiropoulos and Dalius Tarvydas.
Authors (in alphabetical order by section)
Section 2 Focus on clean energy technologies
Armani, R., Politecnico di Milano
Bodis, K., JRC
Fahl, F., JRC
Gonzalez Aparicio, I., JRC
Jaeger-Waldau, A., JRC
Kapetaki, Z., JRC
Lebedeva, N., JRC
Pinedo, I., JRC
Scarlat, N., JRC
Taylor, N., JRC
Telsnig, T., JRC
Uihlein, A., JRC
Vázquez Hernández, C., JRC
Zangheri, P., JRC
Section 3 Developing value chains
Jaeger-Waldau, A., JRC
Ruiz Castello, P., JRC
Taylor, N., JRC
Telsnig, T., JRC
Vázquez Hernández, C., JRC
Section 4 Clean energy related employment and investments
Gonzalez Aparicio, I., JRC
Kapetaki, Z., JRC
Ruiz Castello, P., JRC
Telsnig, T., JRC
Vázquez Hernández, C., JRC
3
Executive summary
Policy context
To implement the Energy Union and the EU's commitments under the Paris Agreement
signed in December 2015, the European Commission proposed in 2016 the "Clean Energy
for All Europeans" package. This legislative package is supported by a number of
measures also considering initiatives for coal mining regions in transition. These include
the launch of the Coal and Carbon Intensive Regions in Transition Platform, which this
work particularly aims to support.
Over the past few decades the production and consumption of coal in the EU has been in
steady decline, due to coal mines closure and coal use phasing out for power generation.
At the same time, with Europe embarking on an energy transition within an Energy Union
based on clean energy, efficiency and innovation, regions face a number of challenges. In
our previous work,1 we identified the regions that rely on coal mining for employment
and economic activity. We estimated that the EU coal sector employs nearly half a million
people. Around half of the relevant direct jobs could be lost by 2030 representing a
major challenge in the transformation of coal regions. Moreover, by 2030, approximately
two thirds of the current coal-fired power generation capacity could retire, posing a
challenge on energy sufficiency too. This study adopts a forward-looking approach to
focus on and quantify the opportunities of such transition for these coal regions.
In November 2018, the European Parliament’s budgets committee signed off on a
proposal to allocate funds to help regions undergo the transition. Members of the
European Parliament (MEP) have called on the European Commission (EC) for a proposal
establishing this fund. The Just Transition Fund, is now included in the political guidelines
of the next European Commission (2019-2024). In light of these developments, this work
is particularly relevant in providing information to support such a proposal.
This work has been undertaken under an Administrative Arrangement with the European
Commission's Directorate General for Energy, focusing on the potential impact of specific
clean energy technologies to coal regions.
Key conclusions
The European coal regions do not have to stay behind in the frame of a continued
economic and social evolution. On the contrary, these regions can play an active role in
the European energy transition. While the transition is already happening, the clean
energy potential in coal regions can enable them to be active participants in the energy
transition and move, in many cases, from a single- to a multi-industry model. The
deployment of this potential would contribute to energy security and provide economic
value and jobs to post-mining communities. The development of clean energy projects
benefits from the availability of infrastructure, land, skills and industrial heritage already
in place.
According to our estimations, there is a range of potential for renewable energy and jobs
creation across the coal regions. Close cooperation in EU, national and regional levels
between companies, regulators, investors, land-use planners and local communities is
essential to identify the most sustainable options, exploit regional potential and maximize
social and economic development.
Moving away from coal mining activities is largely about alleviating impacts on people
and communities. With a forward-looking approach, this study shows the different
degrees of available resources and employment potentials to achieve this goal.
In taking policy decisions, it is very important to reconcile the key factors driving the
transition. We propose analyzing each region considering their comparative
1 Alves Dias, P. et al., EU coal regions: opportunities and challenges ahead,
EUR 29292 EN, Publications Office of the European Union, Luxembourg, 2018, ISBN 978-92-79-89884-6,
doi:10.2760/064809, JRC112593
4
decarbonizing employment potential that takes into account the technical potential
available per clean energy resource as well as their competitiveness and their
contribution to the optimal achievement of the current and future policy targets.
Main findings
In this study, we have estimated the technical potential on a regional level for the coal
regions identified. The focus is on energy technologies from wind, solar photovoltaics and
geothermal sources, bioenergy and power plants with carbon capture. We find the
highest onshore wind potential (228 GW) in Castilla y León (ES41). The United Kingdom,
Germany and Poland appear as the leading countries on offshore wind potential.
Germany also hosts the coal region with the highest potentially induced employment for
wind energy (Brandenburg (DE40), ~16 300 jobs).
For ground-mounted solar PV systems, we again identify Castilla y León (ES41) as the
region with the highest potential (~80 GW), while for rooftop-mounted solar PV systems
that is the case in Düsseldorf (DEA1, ~ 5 GW). Spain and Germany are also the coal
region-hosting countries where the higher induced employment is calculated, particularly
for Castilla y León (ES41 with 4 170 employees) and Brandenburg (DE40 with 2 840
jobs). These regions largely coincide with those identified with the highest technical
potential for solar PV systems in their respective countries.
The technical potential helps to identify options that regions might have in their transition
from coal and could indicate routes for further development in the regions. Castilla y
Leon, for example, the region with the highest estimated onshore wind potential, is
already leading in the number of wind component manufacturing facilities. In the case of
solar PV, we find that the coal regions in countries that have incentivised the technology
over the last ten years (for example Germany, UK and Italy) have a significant PV
industry sector. In terms of numbers this is 857, 815 and 63 of companies for Germany,
the UK and Italy in the coal regions alone.
Coal mines located in the coal regions in transition could become attractive locations for
conversion into wind and solar PV sites and facilitate the regional transition. The highest
total technical potential for wind and solar PV systems combinations on mine sites is
estimated for Dytiki Makedonia (EL53, 983.2 MW).
For bioenergy we estimated potentials from difference sources, i.e. from crop residues,
municipal solid waste, livestock methane as well as forest bioenergy. We find Castilla y
León (ES41) to be the region with the highest bioenergy potential from crop residues and
from livestock methane (730 MW and 110 MW, respectively). Municipal solid waste
estimates indicate the highest potential for Silesia (PL22, 97 MW), Poland. Brandenburg
(DE40, 1270 MW; 700 MW; 530 MW) is the region where we estimate the highest
potential throughout the scenarios on forest bioenergy.
For geothermal energy, we find Castilla y León (ES41, 500 MW) to be the region with a
high sustainable potential. For coal-fired power plants with carbon capture, the highest
technical potential to retrofit CO2 separation technologies in existing plants is found in
Bulgaria, namely the Yugoiztochen (BG34, 3 960 MW) region.
Regarding energy efficiency in buildings, Germany, namely, Düsseldorf (DEA1, 18.76-
49.02 TWh), Köln (DEA2, 18.76-49.02 TWh), Brandenburg (DE40, 10.40-26.72 TWh),
Münster (DEA3, 10.18-26.06 TWh) and Saxony-Anhalt (DEE0, 8.76-22.65 TWh) show the
highest potential in energy savings.
According to the in-depth analysis accompanying the European long-term strategic vision
for a prosperous, modern, competitive and climate neutral economy (European
Commission, 2018b) nearly 2 500 GW of power generation capacity will need to come
from wind, solar, and other renewable energy sources (mostly hydro and biomass) to
achieve an ambitious target of carbon neutrality by 20502. We estimate the technical
2 Scenario 1.5TECH. For more information please refer to (European Commission, 2018b).
5
potential at the coal regions alone, enough to satisfy 60% of this technology deployment
projection.
In this study, we have mapped activities related to Li-ion batteries in the coal regions. A
number of announced investments include projects in the 42 coal regions with substantial
industrial developments in Poland and in Germany. There are a very limited number of
activities related to raw materials for Li-ion batteries in the European coal regions but
recycling is increasing in volume and is expected to grow substantially in the next few
years.
Based on the EUCO3232.5 scenario projections at national level 3 , we derive the
associated plausible employment evolution and the investments required to deploy the
projected technology capacity at regional level. Toward 2030, we find that the projected
capacity deployment will translate to regional investments ranging from EUR 5 million for
Západné Slovensko (SK02) to EUR 3.17 billion for Castilla y León (ES41). By 2050, these
range from almost EUR 50 million for Yugozapaden (BG41) to EUR 3.52 billion for
Wielkopolskie (PL41). When it comes to employment, we estimate a broad range up to
nearly 30 000 in Koln (DEA2).
In our previous work (Alves Dias et al., 2018) we estimated that there are more than
200 000 direct coal related activity jobs in the coal regions. Coal related jobs are not
necessarily directly substituted by clean energy technology jobs and precisely locating
where a job will be created is also a limitation. In absolute numbers, we find that by
2030, up to 315 000 jobs can be created in total by deploying clean energy production
technologies as projected in EUCO3232.5, reaching more than 460 000 by 2050.
To contextualize the foreseen development of the coal regions, we have analysed their
potential resilience considering their starting point of reliance on the coal sector in terms
of jobs. By comparing the size of the regional coal sector and the expected growth in
clean energy technologies and energy efficiency in terms of employment, we cluster
regions to:
Regions with a High Decarbonizing Employment Potential (HDEP), i.e. jobs
plausibly derived by 2030 from the regional impact of EUCO3232.5 scenario, can
account for at least 90% of current coal related jobs by those, reaching 100% by
2050.
Regions that show Slow Decarbonizing Employment Potential (SDEP). This means
that they have significant decarbonisation potential, but by 2030 jobs created
would be below 90% of the coal related ones. This potential could only be fully
realized by 2050.
Regions that show Restricted Decarbonizing Employment Potential (RDEP). That
implies that the foreseen EUCO3232.5 derived regional employment potential may
not suffice to fully account for the associated coal related jobs.
HDEP regions SDEP regions RDEP regions
Aragon (ES24),
Brandenburg (DE40),
Castilla-La Mancha (ES42),
Castilla y Leon (ES41),
Derbyshire and
Nottinghamshire (UKF1),
Dolnoslaskie (PL51),
Dresden (DED2),
Dusseldorf (DEA1), East
Észak-Magyarország
(HU31), Lodzkie (PL71),
Lubelskie (PL81),
Małopolskie (PL21),
Munster (DEA3), Saarland
(DEC0) and Vest (RO42)
Dytiki Makedonia (EL53),
Moravskoslezsko (CZ08),
Severozápad (CZ04),
Silesia (PL22), Sud-Vest
Oltenia (RO41), and
Yugoiztochen (BG34)
3 The EUCO3232.5 scenario is part of a group of EUCO scenarios used in EU energy and climate policy
development. The EUCO3232.5 scenario is designed to achieve a 32% share of renewable energy in gross
final energy consumption and a 32.5% energy efficiency target in the EU. See:
https://ec.europa.eu/energy/en/data-analysis/energy-modelling/euco-scenarios for the public release of
the latest EUCO3232.5 scenario.
6
Wales (UKL2), Eastern
Scotland (UKM7), Koln
(DEA2), Leipzig (DED5),
North Yorkshire (UKE2),
Northumberland and Tyne
and Wear (UKC2),
Peloponnisos (EL65),
Principado de Asturias
(ES12), Sardegna (ITG2),
Saxony-Anhalt (DEE0),
Shropshire and
Staffordshire (UKG2),
South Yorkshire (UKE3),
Southern Scotland (UKM9),
Vzhodna Slovenija (Sl03),
West Central Scotland
(UKM8), West Yorkshire
(UKE4), West Wales and
The Valleys (UKL1),
Wielkopolskie (PL41),
Yugozapaden (BG41) and
Západné Slovensko (SK02)
As such, support mechanisms for coal regions should take into account the diversity
of circumstances by:
Ensuring the realization of potential for HDEP regions.
Facilitating faster or more intense mobilization of existing resources for the SDEP
regions
Enabling adaptation schemes and mobilization of additional resources for the
RDEP regions, to ensure their fair transition.
7
1 Introduction
In 2018, the Joint Research Centre (JRC) identified the European regions that will be
affected by the decline of coal mining and coal power-plant activities, and assessing the
impact on regional jobs (Alves Dias, et al., 2018).
In this report, the approach is forward-looking: we identify options for each region to not
only cope with the transition but also harness the opportunities available for growth and
job creation. The energy technologies of focus are from wind, solar photovoltaics (free
standing and rooftop) and geothermal sources, bioenergy and coal-fired power plants
with carbon capture. The potential for energy efficiency refurbishments in residential
buildings is also analysed. Where identified, activities concerning Li-ion batteries are
addressed giving a concise insight concerning planned or ongoing activities in coal
regions, set against the general backdrop of initiatives to develop a European battery
industry.
The report presents a concise overview of the role that clean energy technologies can
play in the path to decarbonisation for the identified regions with coal mining activity.
One detailed fact sheet per region summarises the main findings (Annex 2). We present
estimates on the renewable energy and clean energy technical potential in each region
and in addition present assessments on the potential impact this could have on job
creation and regional economic development in terms of potential investments.
Many European regions are already examining or have started implementing activities to
support their transition. The Platform on coal regions in transition 4 launched by the
European Commission (EC) in December 2017 is where working groups meet regularly to
discuss projects and best practices and where many EU coal regions have presented their
approaches. Different initiatives are identified in coal regions such as hydrogen
production from coking process waste gases or the use of fossil plants' sites for energy
storage purposes. The region of Silesia, Poland's main coal region already examines the
prospect of hydrogen separation in one of Jastrzębska Spółka Węglowa (JSW) Group
coking plants. The high purity hydrogen obtained is expected to facilitate the
implementation and development of a zero-emission urban transport plan in the region.
In the German region of Lusatia, Brandenburg, Germany, LEAG (the joint brand of
Lausitz Energie Bergbau AG and Lausitz Energie Kraftwerke AG) is embarking on building
a battery storage facility with a utilisation capacity of 53 megawatt hours (MWh) at the
Schwarze Pumpe power plant industrial site.5 At Hamburg-Altenwerder, electric thermal
storage (ETES) is an option tested as an alternative form of energy storage.6 The project
developers claim offering a second life for thermal power plants by transforming them to
energy storage plants, reusing existing equipment in combination with new technology.
Transitions are already happening in the region of Visonta, HU as well as in Klettwitz, DE
where 72 500 photovoltaic (PV) panels and five wind farms have been installed in a coal
mine sites, respectively.
While coal regions are also looking at projects such as repurposing land and
infrastructure for recreation such as and touristic development, this report will focus only
on "mainstream" low carbon energy technologies and energy efficiency. Renewable
energy potential and clean energy technology options are presented as an alternative to
the continuation of the current model for economic development, power generation and
job creation in each region. The objective is to identify options for the coal regions for
their transition to a low carbon economy so that no region is left behind.
In Chapter 2, we estimate the potential7 for each technology taking into account the
specificities of each region (e.g. land cover/availability/use, meteorological aspects; wind
4 https://ec.europa.eu/energy/en/topics/oil-gas-and-coal/coal-regions-in-transition 5 https://www.leag.de/en/business-fields/bigbattery-lausitz/ 6 https://www.siemensgamesa.com/en-int/newsroom/2018/09/20180926-sgre-storage-hamburg-etes 7 Referring to the technical potential that takes into account geographic constraints and system performance,
but not economics (see section 2).
8
speeds, solar irradiation etc.) as described in Annex 5. Additionally, we have made a
distinction between the technologies that are used in power generation (wind, solar PV,
bioenergy, geothermal and coal fired power plants with carbon capture) and energy
demand, i.e. energy efficiency in residential buildings.
Chapter 3 presents analysis taking into account the value chain of the regionally
prominent technologies, i.e. wind and solar, mapping of manufacturing or processing
facilities, the supply of resources as input into these technologies or the provision of
services in relation to these.
The technical potential available is not the only driver guiding the actual site selection for
investment decisions. As such, in Chapter 4 we present technology deployment
projections that start from existing scenarios in line with current climate and energy
framework policies in place. Based on modelling results, these projections inherently
consider technology cost efficiency. We estimate the regional job creation from the clean
energy technology deployment as projected in the EUCO3232.5 scenario, disaggregated
for the coal regions we focus on. The regional disaggregation of national capacity needs
is driven by a wider set of indicators which are analysed by scientific fields presented in
the Chapter. For each region the range of resulting assigned capacities is considered,
distributing the related investments and jobs accordingly, offering a plausible range of
jobs and investments as final output of the assessment. In Chapter 4 we present cost
trends based on literature as well as the underlying cost data of the EUCO32325
scenario. In line with this scenario choice, the related investments are estimated and
analysed following the cost assumptions as proposed by the project (De Vita et al.,
2018), which provided the underlying data for the EUCO3232.5 modelling exercise. For
all estimations, our calibration year is 2015, so at the time of conducting this analysis,
any values referring to 2020 are based on our estimations.
Our approach allows ranking technologies as to their impact on job creation as well as in
terms of associated investments needs, taking into account their cost efficiency and
deployment potential, and projected reductions of energy technology costs. A
prioritisation for potential investments is enabled making estimates of the total
investment needs relative to the number of jobs created to support the transition of the
regions.
Our analysis is based primarily on modelling results and not on regional/local data and
information. In this study, we present estimated investments needs and not investment
projections or forecasts as in for example studies presenting market potential of
technologies for specific countries and regions. Our results represent potential
investments within a context in line with current policies as set in Europe, accounting for
incentives only as included in the original modelling exercise, i.e. within the EUCO3232.5
scenario.
9
2 Clean energy technologies
In this section we focus on energy technologies from wind, solar photovoltaics (free
standing and roof-top) and geothermal sources, bioenergy and power plants with carbon
capture, providing key operational characteristics of these technologies. To facilitate
comparison with conventional power generation, in each of the tables we also provide the
corresponding values for the pulverised coal (PC) fired power plant.8 The potential for
energy efficiency refurbishments in buildings and activities regarding batteries are also
presented in this chapter.
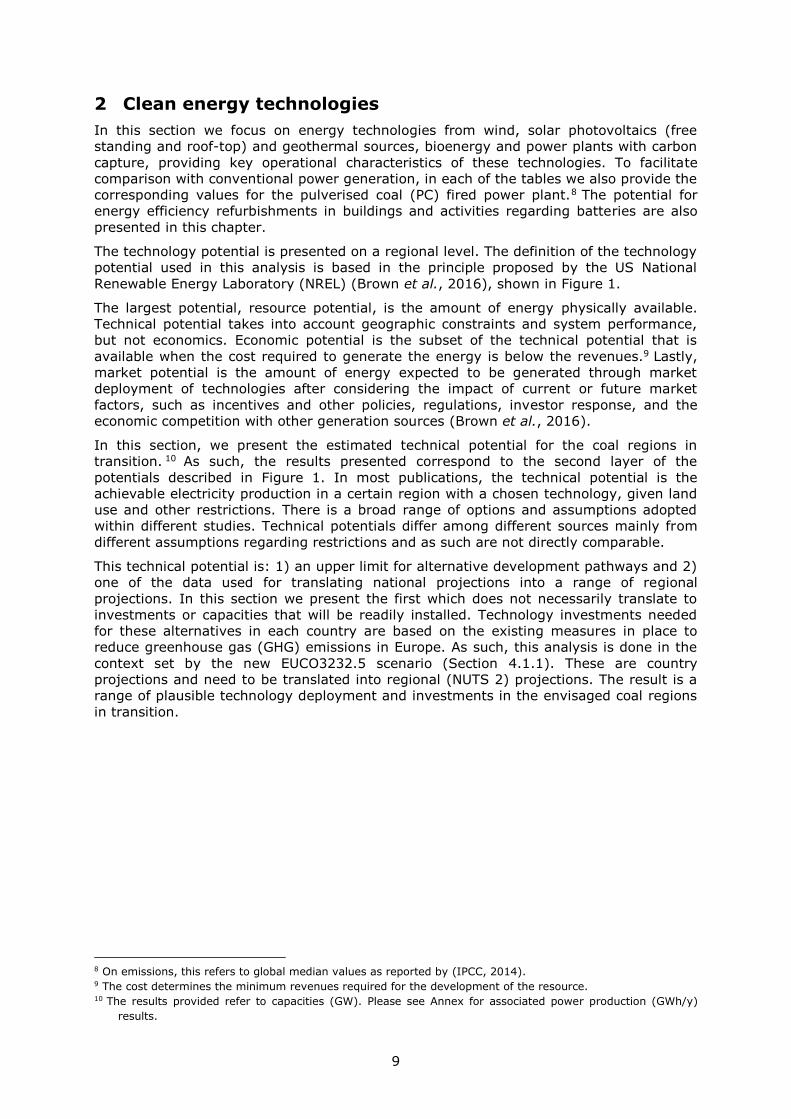
The technology potential is presented on a regional level. The definition of the technology
potential used in this analysis is based in the principle proposed by the US National
Renewable Energy Laboratory (NREL) (Brown et al., 2016), shown in Figure 1.
The largest potential, resource potential, is the amount of energy physically available.
Technical potential takes into account geographic constraints and system performance,
but not economics. Economic potential is the subset of the technical potential that is
available when the cost required to generate the energy is below the revenues.9 Lastly,
market potential is the amount of energy expected to be generated through market
deployment of technologies after considering the impact of current or future market
factors, such as incentives and other policies, regulations, investor response, and the
economic competition with other generation sources (Brown et al., 2016).
In this section, we present the estimated technical potential for the coal regions in
transition. 10 As such, the results presented correspond to the second layer of the
potentials described in Figure 1. In most publications, the technical potential is the
achievable electricity production in a certain region with a chosen technology, given land
use and other restrictions. There is a broad range of options and assumptions adopted
within different studies. Technical potentials differ among different sources mainly from
different assumptions regarding restrictions and as such are not directly comparable.
This technical potential is: 1) an upper limit for alternative development pathways and 2)
one of the data used for translating national projections into a range of regional
projections. In this section we present the first which does not necessarily translate to
investments or capacities that will be readily installed. Technology investments needed
for these alternatives in each country are based on the existing measures in place to
reduce greenhouse gas (GHG) emissions in Europe. As such, this analysis is done in the
context set by the new EUCO3232.5 scenario (Section 4.1.1). These are country
projections and need to be translated into regional (NUTS 2) projections. The result is a
range of plausible technology deployment and investments in the envisaged coal regions
in transition.
8 On emissions, this refers to global median values as reported by (IPCC, 2014). 9 The cost determines the minimum revenues required for the development of the resource. 10 The results provided refer to capacities (GW). Please see Annex for associated power production (GWh/y)
results.
10
Figure 1. Resource, technical, economic and market potentials schematic (adapted from (Brown et al., 2016))
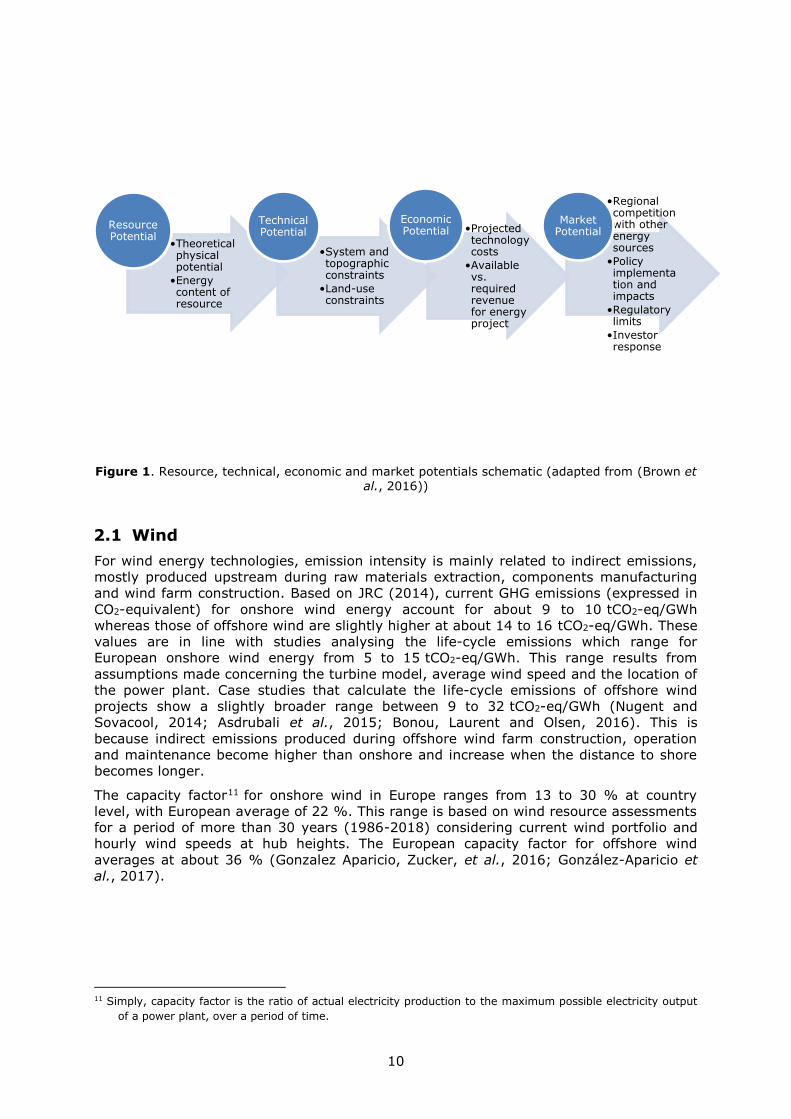
2.1 Wind
For wind energy technologies, emission intensity is mainly related to indirect emissions,
mostly produced upstream during raw materials extraction, components manufacturing
and wind farm construction. Based on JRC (2014), current GHG emissions (expressed in
CO2-equivalent) for onshore wind energy account for about 9 to 10 tCO2-eq/GWh
whereas those of offshore wind are slightly higher at about 14 to 16 tCO2-eq/GWh. These
values are in line with studies analysing the life-cycle emissions which range for
European onshore wind energy from 5 to 15 tCO2-eq/GWh. This range results from
assumptions made concerning the turbine model, average wind speed and the location of
the power plant. Case studies that calculate the life-cycle emissions of offshore wind
projects show a slightly broader range between 9 to 32 tCO2-eq/GWh (Nugent and
Sovacool, 2014; Asdrubali et al., 2015; Bonou, Laurent and Olsen, 2016). This is
because indirect emissions produced during offshore wind farm construction, operation
and maintenance become higher than onshore and increase when the distance to shore
becomes longer.
The capacity factor11 for onshore wind in Europe ranges from 13 to 30 % at country
level, with European average of 22 %. This range is based on wind resource assessments
for a period of more than 30 years (1986-2018) considering current wind portfolio and
hourly wind speeds at hub heights. The European capacity factor for offshore wind
averages at about 36 % (Gonzalez Aparicio, Zucker, et al., 2016; González-Aparicio et
al., 2017).
11 Simply, capacity factor is the ratio of actual electricity production to the maximum possible electricity output
of a power plant, over a period of time.
•Theoretical physical potential
•Energy content of resource
Resource Potential
•System and topographic constraints
•Land-use constraints
Technical Potential •Projected
technology costs
•Available vs. required revenue for energy project
Economic Potential
•Regional competition with other energy sources
•Policy implementation and impacts
•Regulatory limits
•Investor response
Market Potential
11
Table 1. Key operational characteristics of the investigated energy technologies based on
(European Commission, 2014a; Gonzalez Aparicio, Zucker, Andreas Careri, Francesco Monforti, et
al., 2016; González-Aparicio et al., 2017) and on (Tsiropoulos, Tarvydas and Zucker, 2018b). PC fired plant characteristics based on (IPCC, 2014) and (European Commission, 2014a).
Technology Emission intensity
(tCO2-eq/GWh)
Average capacity
factor (%)
Technical lifetime
(years)
Onshore Wind 9-10 (indirect) 22 25
Offshore Wind 14-16 (indirect) 36 30
PC fired plant 880 (direct) 85 40
95 (indirect)
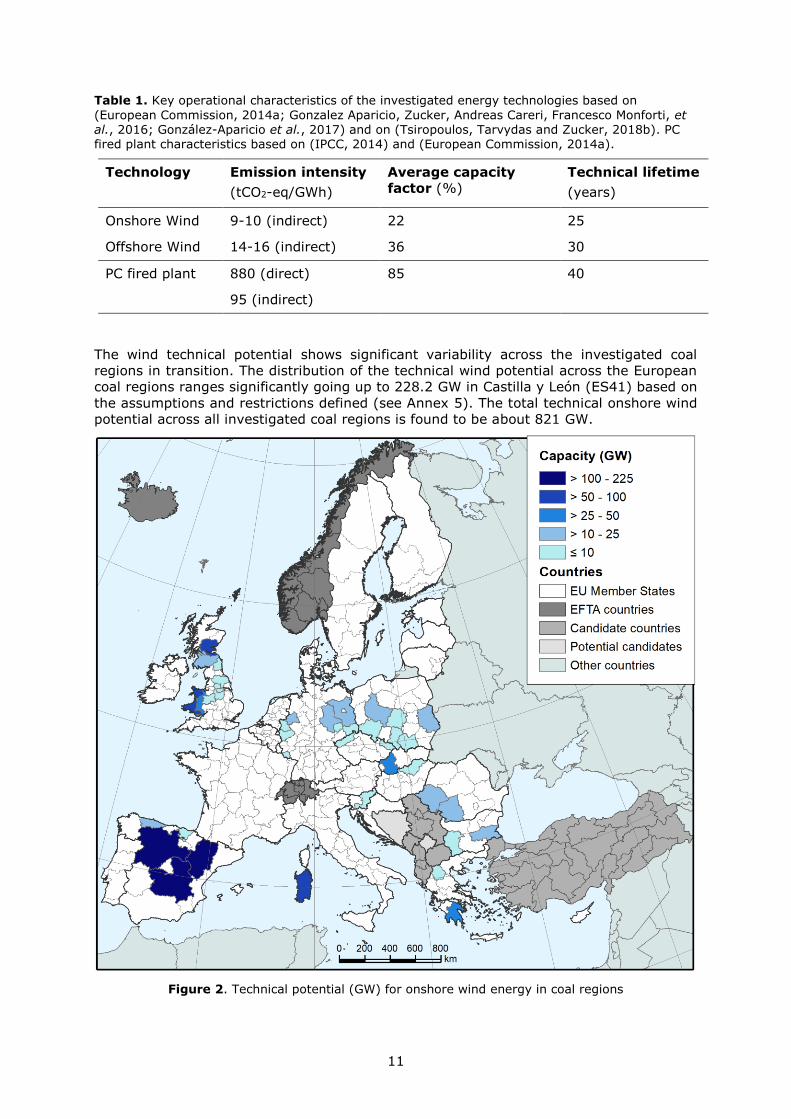
The wind technical potential shows significant variability across the investigated coal
regions in transition. The distribution of the technical wind potential across the European
coal regions ranges significantly going up to 228.2 GW in Castilla y León (ES41) based on
the assumptions and restrictions defined (see Annex 5). The total technical onshore wind
potential across all investigated coal regions is found to be about 821 GW.
Figure 2. Technical potential (GW) for onshore wind energy in coal regions
12
The top 5 regions with high onshore wind potential are in Spain, Italy and Greece,
namely Castilla y León (ES41), Castilla-La Mancha (ES42), Aragón (ES24), Sardegna
(ITG2) and Peloponnisos (EL65). It is worth noting that some regions have a good wind
resource but they show insignificant technical potential (for example Észak-Magyarország
(HU31),12 Saarland, (DEC0)) due to regionally imposed restrictions to install wind arrays.
Some of the investigated countries hosting the coal regions show a significant offshore
wind potential. These potentials cannot be directly allocated to a particular coal region,
as offshore territories cannot be classified on a NUTS 2 level. Offshore potential could
affect the expansion of the wind industry in the respective country. Therefore, we report
the offshore potentials on a country level. The total offshore wind potential on a country
level hosting coal regions accounts for about 159 GW. The United Kingdom (104 GW),
Germany (28 GW) and Poland (12GW) are the leading countries (see Annex 3) in terms
of potential.
In 2017, the installed capacity in EU-28 reached nearly 169 GW (Eurostat, 2019b). The
potential we estimate for the coal regions alone is nearly six times this capacity.
2.2 Solar photovoltaics
For PV systems, GHG emissions depend significantly on the energy-mix in the production
process of the PV cells, on the geographic location, the system efficiency and the system
lifetime. The values quoted in Table 2 refer to the average of results reported in literature
(Wetzel and Borchers, 2015) for crystalline silicon technology manufacturers in Europe.
These averages are with respect to a northern location (1 000 kWh/m2/y), e.g. northern
Germany, and at a southern one (1 700 kWh/m2/y), e.g. southern Italy/Spain. Regarding
technologies, thin-film modules have the lowest emissions, followed by poly-crystalline
silicon and then mono-crystalline silicon.
PV systems capacity factor depends on the nominal yield ratio (kWh/kWp) at a given
location and the installation conditions. The Product Environmental Footprint Category
Rules for PV (European Commission, 2018c) assumes an average annual energy yield for
EU-installed systems of 975 kWh/kWp (including the effects of degradation over the
lifetime), implying a capacity factor of 0.11. If the degradation effects are excluded, the
yield is 1 090 kWh/kWp and the capacity factor is 0.12. Values of annual system energy
yield at NUTS level are provided using the JRC's PV-GIS methodology (see Annex 3). The
corresponding capacity factors range from 0.09 in south-western Scotland (UKM8) to
0.19 in Castilla-La Mancha (ES42).
The Product Environmental Footprint Category Rules for PV (European Commission,
2018c) states an expected lifetime of the PV system of 30 years, with correspondingly an
annual degradation rate 0.7% per year with respect to the initial power rating.13
12 In HU31, the potential is insignificant due to low capacity factors observed in the region. As such, it is
considered zero for simplification purposes. 13 N.B. The manufacturer warranties of the main components (PV modules and inverters) typically use lower
values.
13
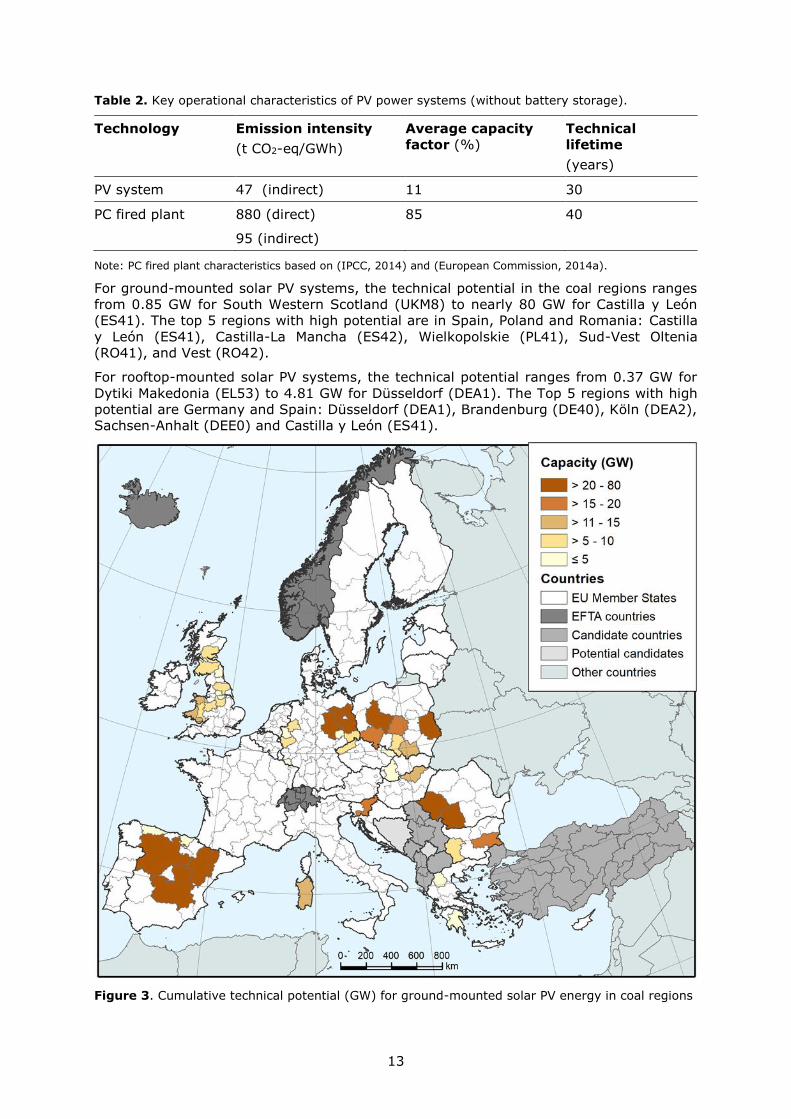
Table 2. Key operational characteristics of PV power systems (without battery storage).
Technology Emission intensity
(t CO2-eq/GWh)
Average capacity
factor (%)
Technical
lifetime
(years)
PV system 47 (indirect) 11 30
PC fired plant 880 (direct) 85 40
95 (indirect)
Note: PC fired plant characteristics based on (IPCC, 2014) and (European Commission, 2014a).
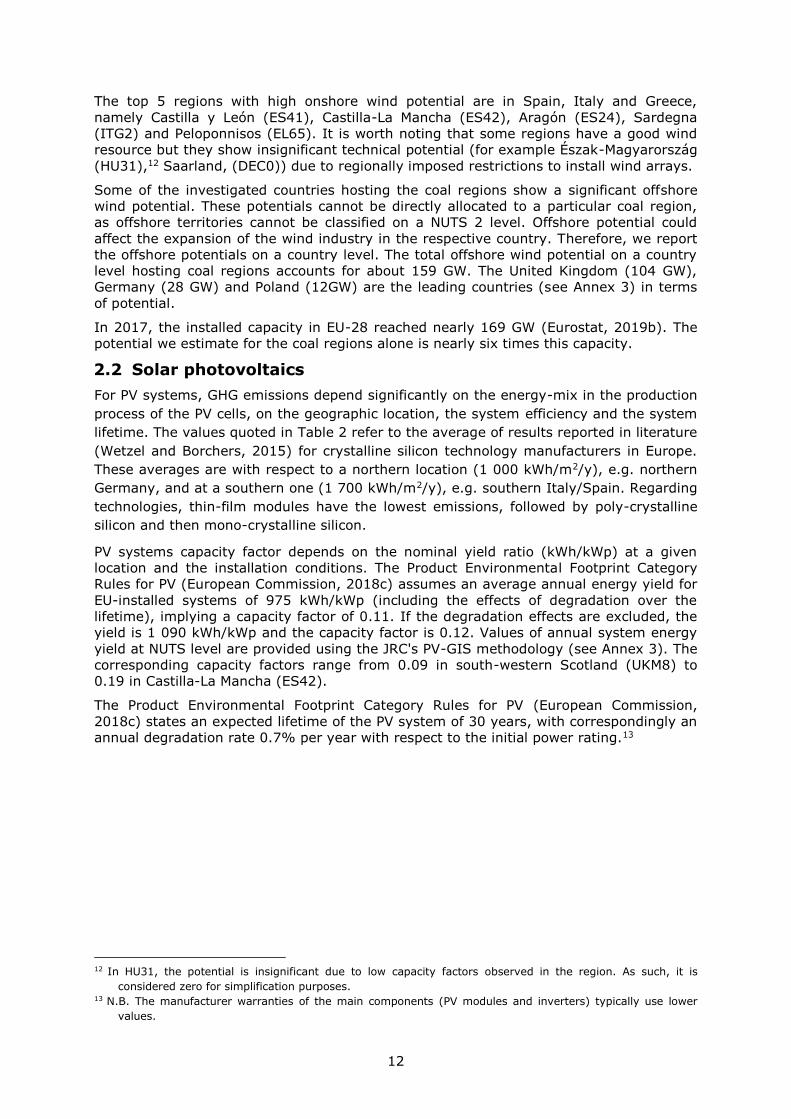
For ground-mounted solar PV systems, the technical potential in the coal regions ranges
from 0.85 GW for South Western Scotland (UKM8) to nearly 80 GW for Castilla y León
(ES41). The top 5 regions with high potential are in Spain, Poland and Romania: Castilla
y León (ES41), Castilla-La Mancha (ES42), Wielkopolskie (PL41), Sud-Vest Oltenia
(RO41), and Vest (RO42).
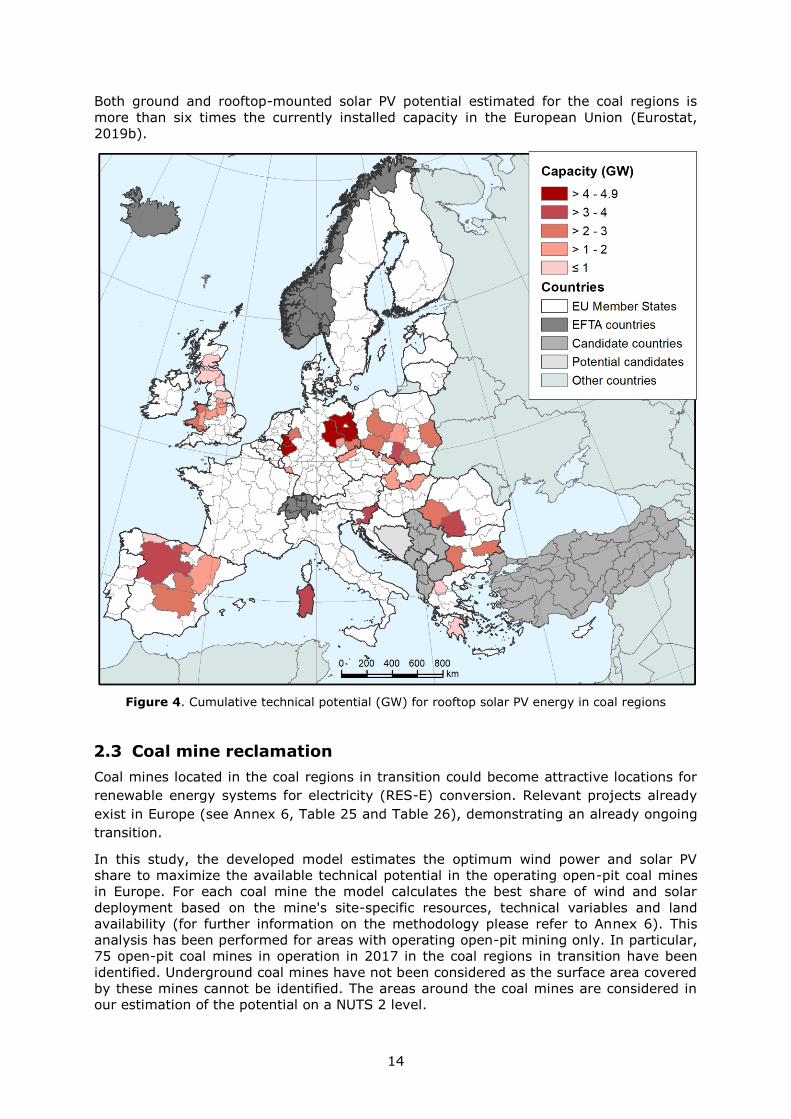
For rooftop-mounted solar PV systems, the technical potential ranges from 0.37 GW for
Dytiki Makedonia (EL53) to 4.81 GW for Düsseldorf (DEA1). The Top 5 regions with high
potential are Germany and Spain: Düsseldorf (DEA1), Brandenburg (DE40), Köln (DEA2),
Sachsen-Anhalt (DEE0) and Castilla y León (ES41).
Figure 3. Cumulative technical potential (GW) for ground-mounted solar PV energy in coal regions
14
Both ground and rooftop-mounted solar PV potential estimated for the coal regions is
more than six times the currently installed capacity in the European Union (Eurostat,
2019b).
Figure 4. Cumulative technical potential (GW) for rooftop solar PV energy in coal regions
2.3 Coal mine reclamation
Coal mines located in the coal regions in transition could become attractive locations for
renewable energy systems for electricity (RES-E) conversion. Relevant projects already
exist in Europe (see Annex 6, Table 25 and Table 26), demonstrating an already ongoing
transition.
In this study, the developed model estimates the optimum wind power and solar PV
share to maximize the available technical potential in the operating open-pit coal mines
in Europe. For each coal mine the model calculates the best share of wind and solar
deployment based on the mine's site-specific resources, technical variables and land
availability (for further information on the methodology please refer to Annex 6). This
analysis has been performed for areas with operating open-pit mining only. In particular,
75 open-pit coal mines in operation in 2017 in the coal regions in transition have been
identified. Underground coal mines have not been considered as the surface area covered
by these mines cannot be identified. The areas around the coal mines are considered in
our estimation of the potential on a NUTS 2 level.
15
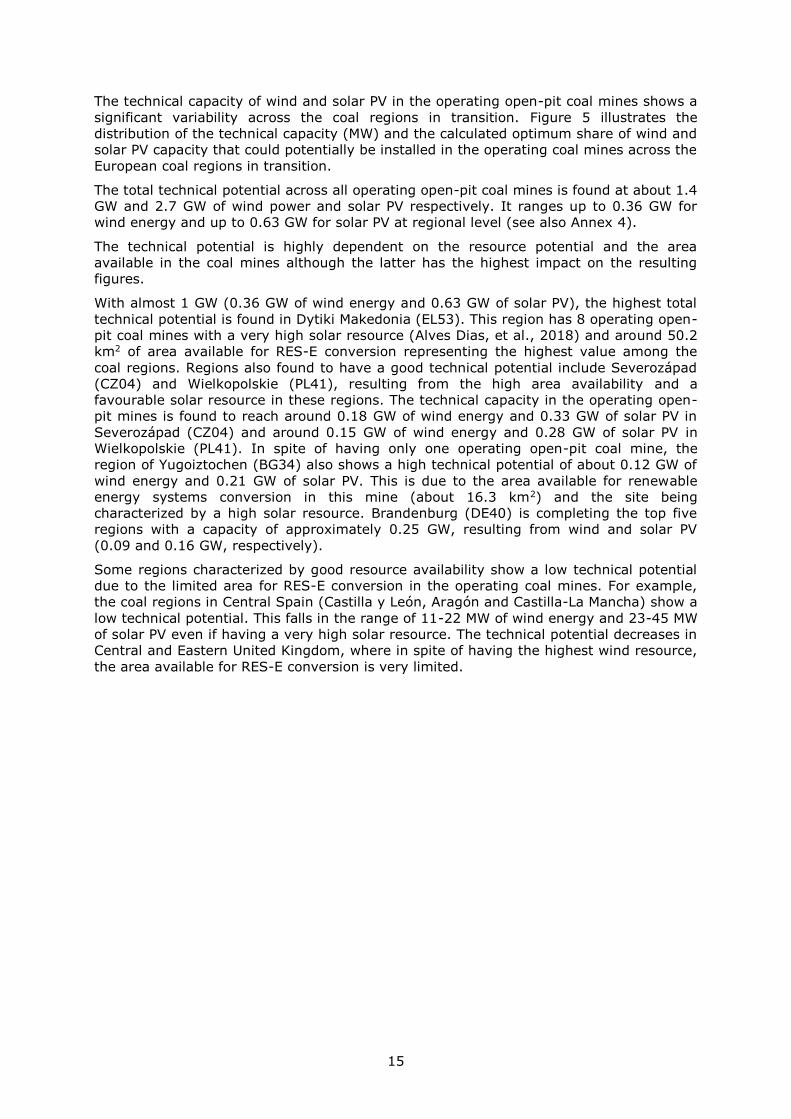
The technical capacity of wind and solar PV in the operating open-pit coal mines shows a
significant variability across the coal regions in transition. Figure 5 illustrates the
distribution of the technical capacity (MW) and the calculated optimum share of wind and
solar PV capacity that could potentially be installed in the operating coal mines across the
European coal regions in transition.
The total technical potential across all operating open-pit coal mines is found at about 1.4
GW and 2.7 GW of wind power and solar PV respectively. It ranges up to 0.36 GW for
wind energy and up to 0.63 GW for solar PV at regional level (see also Annex 4).
The technical potential is highly dependent on the resource potential and the area
available in the coal mines although the latter has the highest impact on the resulting
figures.
With almost 1 GW (0.36 GW of wind energy and 0.63 GW of solar PV), the highest total
technical potential is found in Dytiki Makedonia (EL53). This region has 8 operating open-
pit coal mines with a very high solar resource (Alves Dias, et al., 2018) and around 50.2
km2 of area available for RES-E conversion representing the highest value among the
coal regions. Regions also found to have a good technical potential include Severozápad
(CZ04) and Wielkopolskie (PL41), resulting from the high area availability and a
favourable solar resource in these regions. The technical capacity in the operating open-
pit mines is found to reach around 0.18 GW of wind energy and 0.33 GW of solar PV in
Severozápad (CZ04) and around 0.15 GW of wind energy and 0.28 GW of solar PV in
Wielkopolskie (PL41). In spite of having only one operating open-pit coal mine, the
region of Yugoiztochen (BG34) also shows a high technical potential of about 0.12 GW of
wind energy and 0.21 GW of solar PV. This is due to the area available for renewable
energy systems conversion in this mine (about 16.3 km2) and the site being
characterized by a high solar resource. Brandenburg (DE40) is completing the top five
regions with a capacity of approximately 0.25 GW, resulting from wind and solar PV
(0.09 and 0.16 GW, respectively).
Some regions characterized by good resource availability show a low technical potential
due to the limited area for RES-E conversion in the operating coal mines. For example,
the coal regions in Central Spain (Castilla y León, Aragón and Castilla-La Mancha) show a
low technical potential. This falls in the range of 11-22 MW of wind energy and 23-45 MW
of solar PV even if having a very high solar resource. The technical potential decreases in
Central and Eastern United Kingdom, where in spite of having the highest wind resource,
the area available for RES-E conversion is very limited.
16
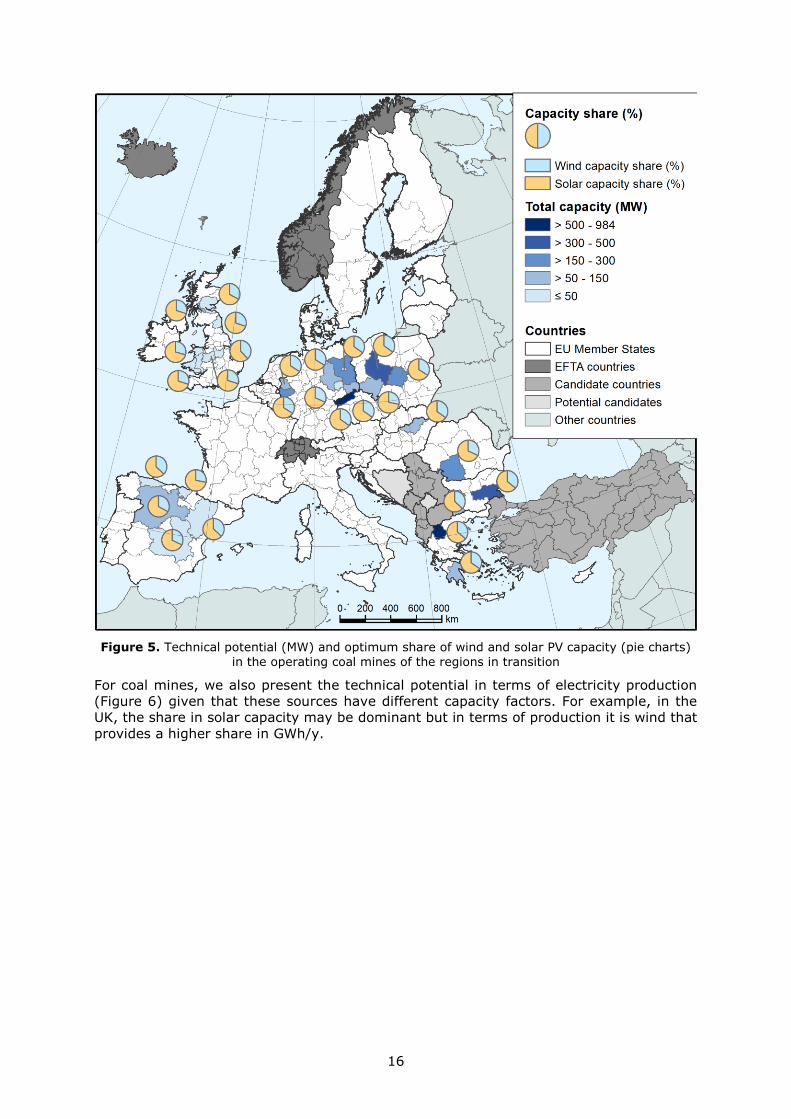
Figure 5. Technical potential (MW) and optimum share of wind and solar PV capacity (pie charts)
in the operating coal mines of the regions in transition
For coal mines, we also present the technical potential in terms of electricity production
(Figure 6) given that these sources have different capacity factors. For example, in the
UK, the share in solar capacity may be dominant but in terms of production it is wind that
provides a higher share in GWh/y.
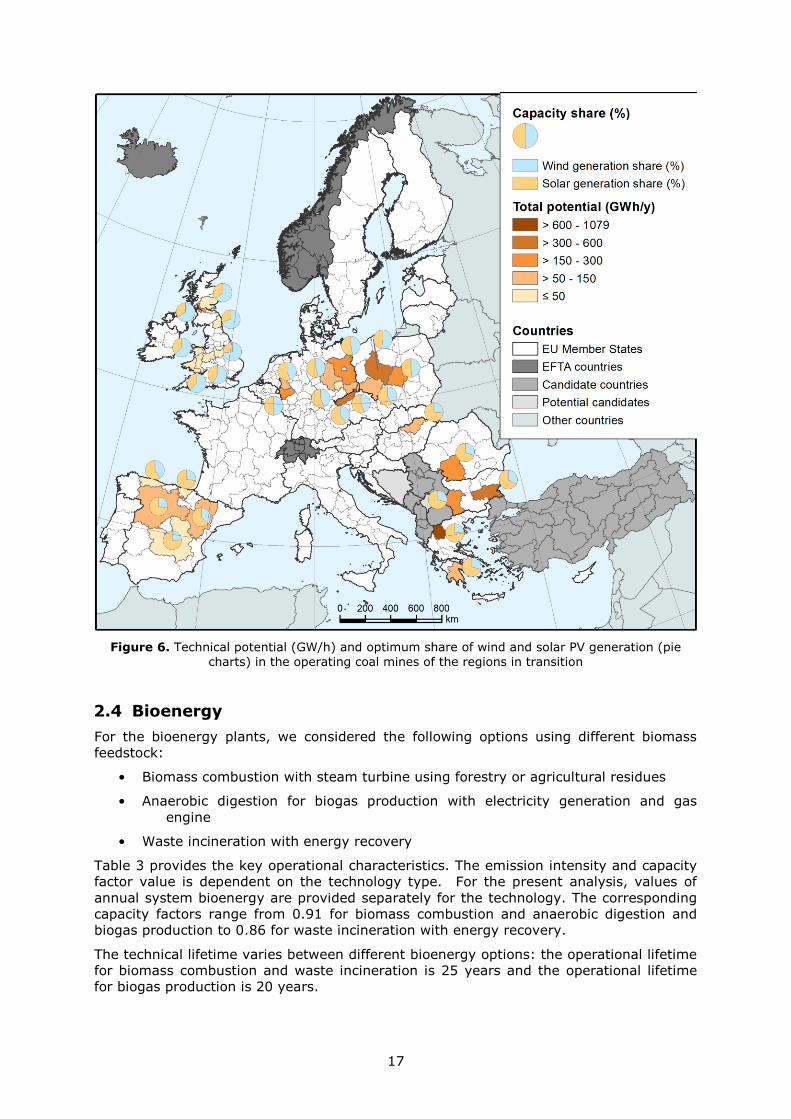
17
Figure 6. Technical potential (GW/h) and optimum share of wind and solar PV generation (pie
charts) in the operating coal mines of the regions in transition
2.4 Bioenergy
For the bioenergy plants, we considered the following options using different biomass
feedstock:
• Biomass combustion with steam turbine using forestry or agricultural residues
• Anaerobic digestion for biogas production with electricity generation and gas
engine
• Waste incineration with energy recovery
Table 3 provides the key operational characteristics. The emission intensity and capacity
factor value is dependent on the technology type. For the present analysis, values of
annual system bioenergy are provided separately for the technology. The corresponding
capacity factors range from 0.91 for biomass combustion and anaerobic digestion and
biogas production to 0.86 for waste incineration with energy recovery.
The technical lifetime varies between different bioenergy options: the operational lifetime
for biomass combustion and waste incineration is 25 years and the operational lifetime
for biogas production is 20 years.
18
Table 3. Key operational characteristics of bioenergy systems.
Technology Emission intensity
(t CO2 /GWh)
Average capacity
factor (%)
Technical
Lifetime
(years)
Biomass combustion 45 91 25
Anaerobic digestion -302.4 91 20
Waste incineration 106 86 25
PC fired plant 880 (direct) 85 40
95 (indirect)
Note: PC fired plant characteristics based on (IPCC, 2014) and (European Commission, 2014a).
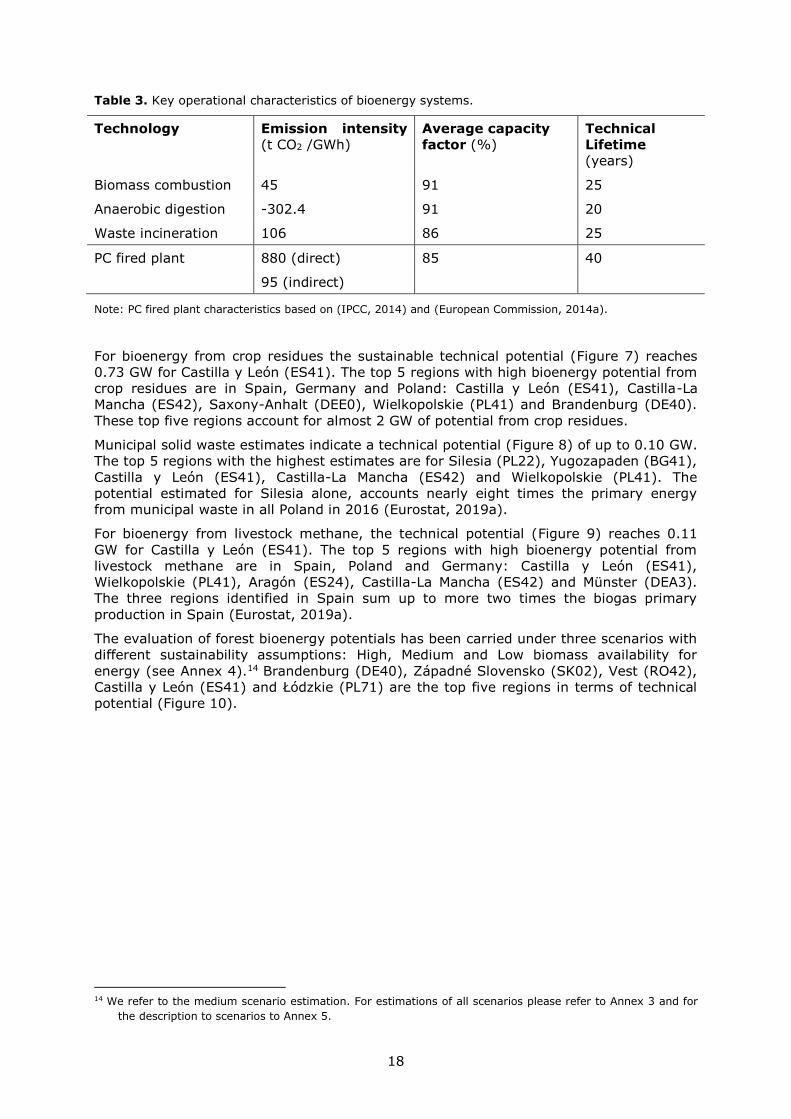
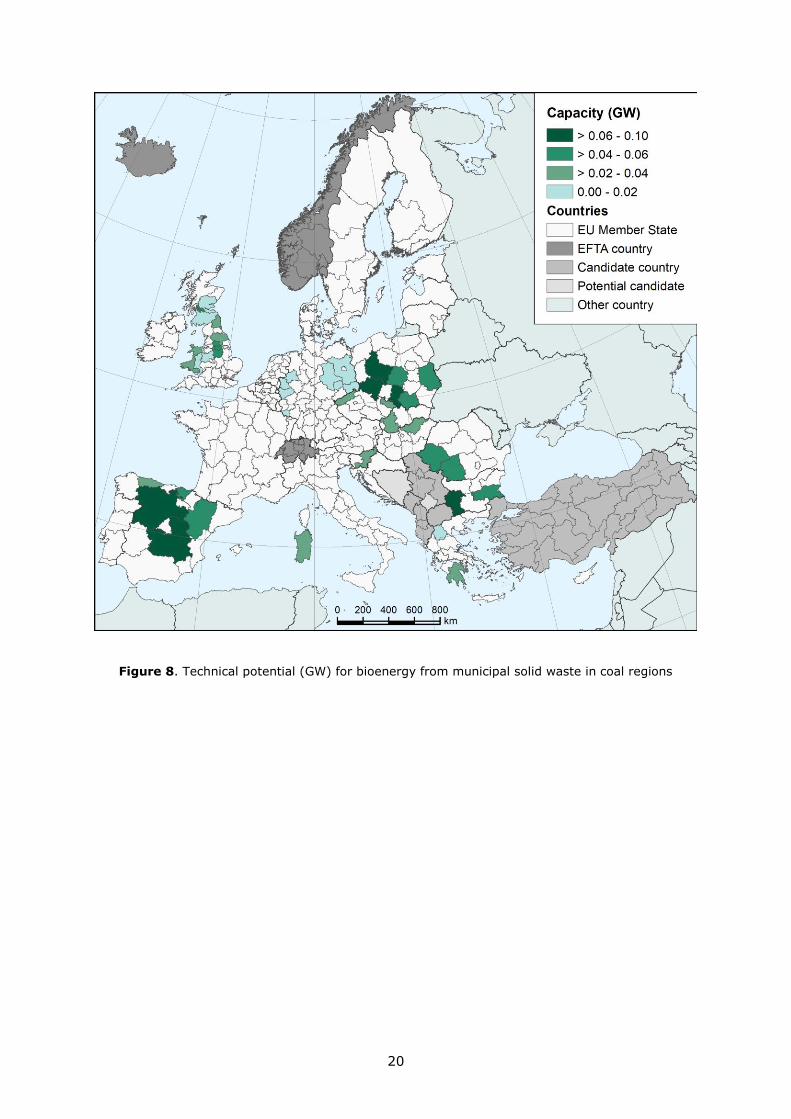
For bioenergy from crop residues the sustainable technical potential (Figure 7) reaches
0.73 GW for Castilla y León (ES41). The top 5 regions with high bioenergy potential from
crop residues are in Spain, Germany and Poland: Castilla y León (ES41), Castilla-La
Mancha (ES42), Saxony-Anhalt (DEE0), Wielkopolskie (PL41) and Brandenburg (DE40).
These top five regions account for almost 2 GW of potential from crop residues.
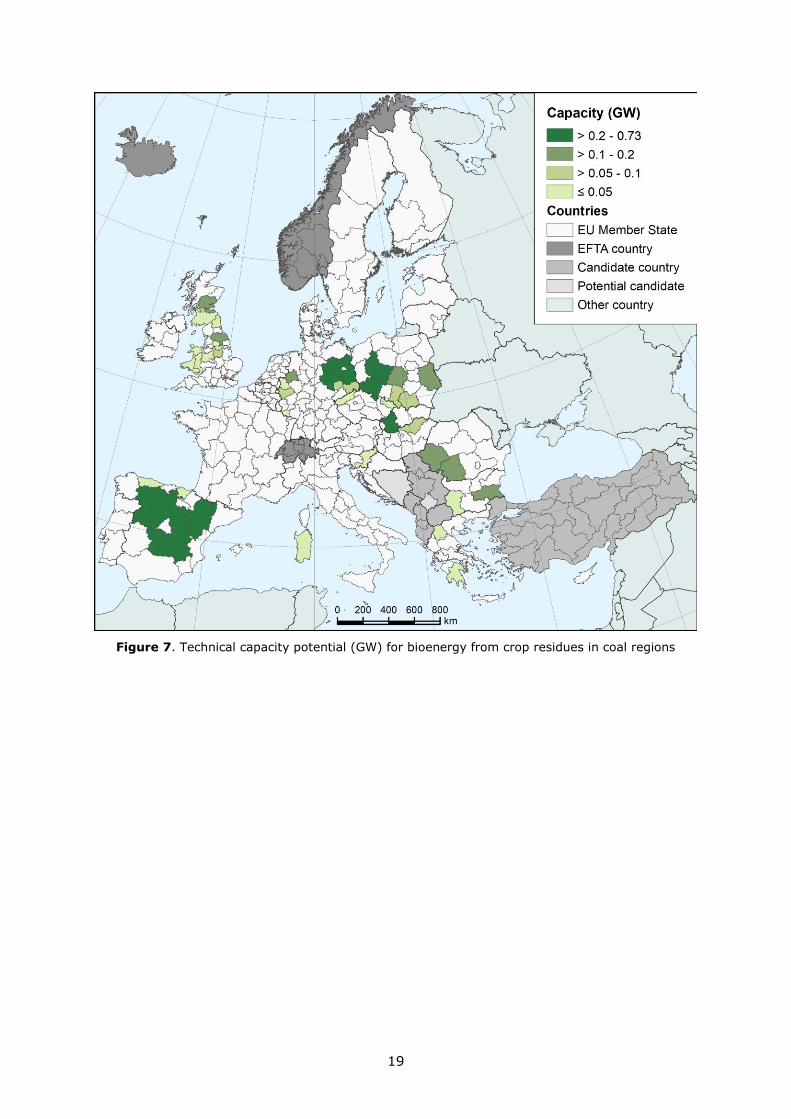
Municipal solid waste estimates indicate a technical potential (Figure 8) of up to 0.10 GW.
The top 5 regions with the highest estimates are for Silesia (PL22), Yugozapaden (BG41),
Castilla y León (ES41), Castilla-La Mancha (ES42) and Wielkopolskie (PL41). The
potential estimated for Silesia alone, accounts nearly eight times the primary energy
from municipal waste in all Poland in 2016 (Eurostat, 2019a).
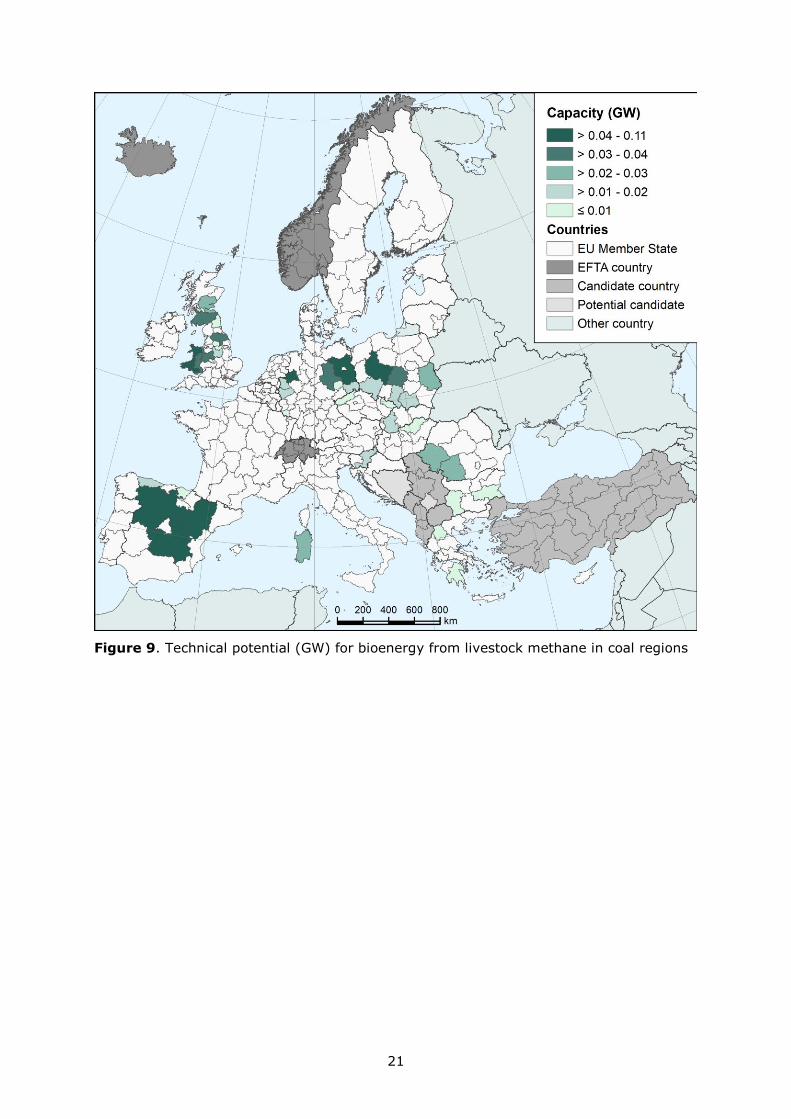
For bioenergy from livestock methane, the technical potential (Figure 9) reaches 0.11
GW for Castilla y León (ES41). The top 5 regions with high bioenergy potential from
livestock methane are in Spain, Poland and Germany: Castilla y León (ES41),
Wielkopolskie (PL41), Aragón (ES24), Castilla-La Mancha (ES42) and Münster (DEA3).
The three regions identified in Spain sum up to more two times the biogas primary
production in Spain (Eurostat, 2019a).
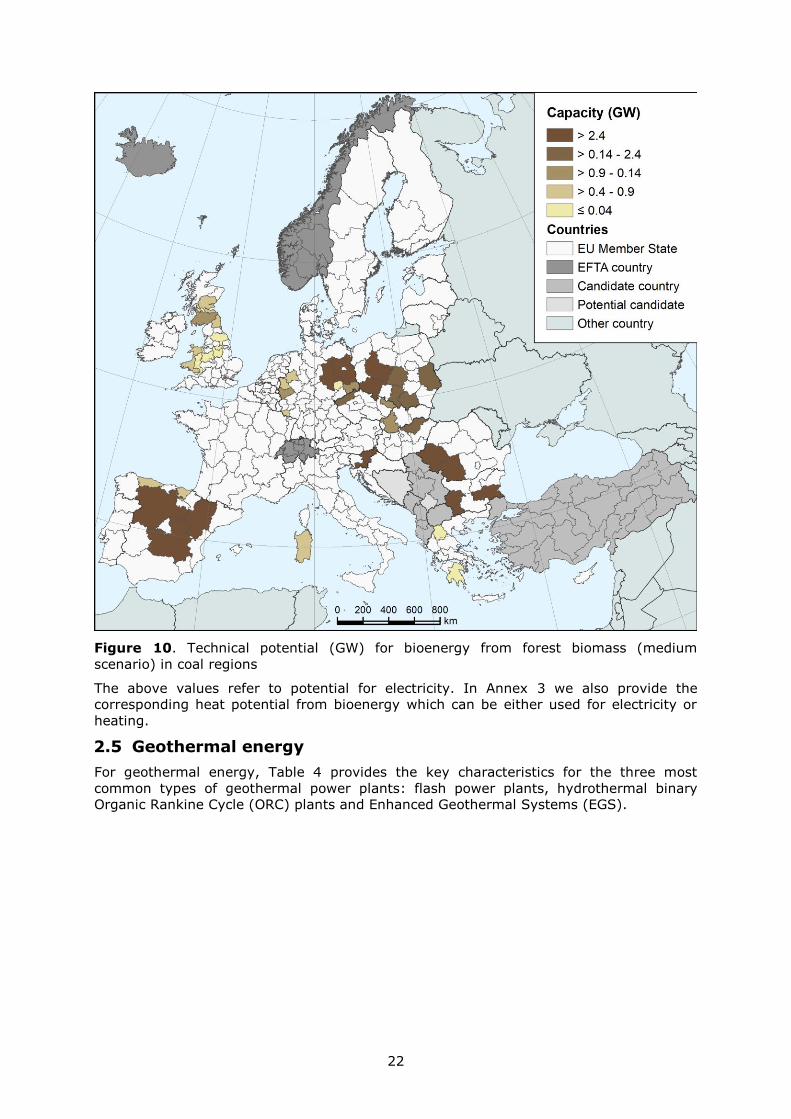
The evaluation of forest bioenergy potentials has been carried under three scenarios with
different sustainability assumptions: High, Medium and Low biomass availability for
energy (see Annex 4).14 Brandenburg (DE40), Západné Slovensko (SK02), Vest (RO42),
Castilla y León (ES41) and Łódzkie (PL71) are the top five regions in terms of technical
potential (Figure 10).
14 We refer to the medium scenario estimation. For estimations of all scenarios please refer to Annex 3 and for
the description to scenarios to Annex 5.
19
Figure 7. Technical capacity potential (GW) for bioenergy from crop residues in coal regions
20
Figure 8. Technical potential (GW) for bioenergy from municipal solid waste in coal regions
21
Figure 9. Technical potential (GW) for bioenergy from livestock methane in coal regions
22
Figure 10. Technical potential (GW) for bioenergy from forest biomass (medium
scenario) in coal regions
The above values refer to potential for electricity. In Annex 3 we also provide the
corresponding heat potential from bioenergy which can be either used for electricity or
heating.
2.5 Geothermal energy
For geothermal energy, Table 4 provides the key characteristics for the three most
common types of geothermal power plants: flash power plants, hydrothermal binary
Organic Rankine Cycle (ORC) plants and Enhanced Geothermal Systems (EGS).
23
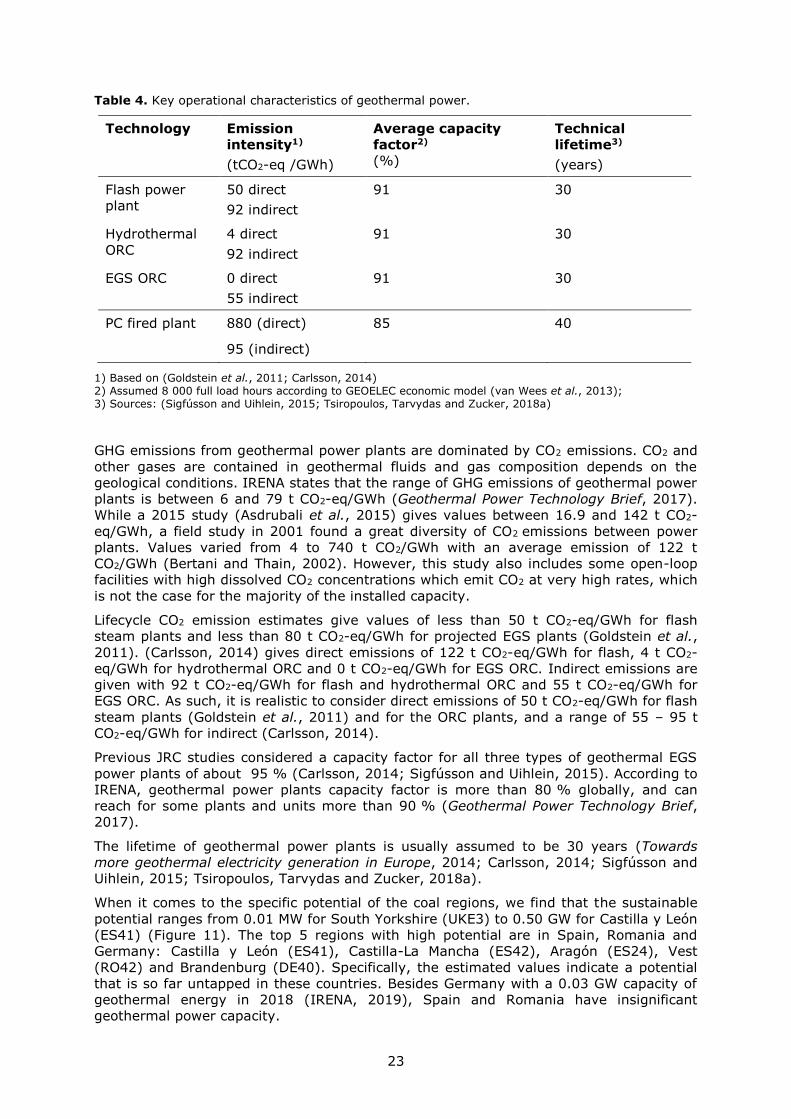
Table 4. Key operational characteristics of geothermal power.
Technology Emission
intensity1)
(tCO2-eq /GWh)
Average capacity
factor2)
(%)
Technical
lifetime3)
(years)
Flash power
plant
50 direct
92 indirect
91 30
Hydrothermal
ORC
4 direct
92 indirect
91 30
EGS ORC 0 direct
55 indirect
91 30
PC fired plant 880 (direct) 85 40
95 (indirect)
1) Based on (Goldstein et al., 2011; Carlsson, 2014) 2) Assumed 8 000 full load hours according to GEOELEC economic model (van Wees et al., 2013); 3) Sources: (Sigfusson and Uihlein, 2015; Tsiropoulos, Tarvydas and Zucker, 2018a)
GHG emissions from geothermal power plants are dominated by CO2 emissions. CO2 and
other gases are contained in geothermal fluids and gas composition depends on the
geological conditions. IRENA states that the range of GHG emissions of geothermal power
plants is between 6 and 79 t CO2-eq/GWh (Geothermal Power Technology Brief, 2017).
While a 2015 study (Asdrubali et al., 2015) gives values between 16.9 and 142 t CO2-
eq/GWh, a field study in 2001 found a great diversity of CO2 emissions between power
plants. Values varied from 4 to 740 t CO2/GWh with an average emission of 122 t
CO2/GWh (Bertani and Thain, 2002). However, this study also includes some open-loop
facilities with high dissolved CO2 concentrations which emit CO2 at very high rates, which
is not the case for the majority of the installed capacity.
Lifecycle CO2 emission estimates give values of less than 50 t CO2-eq/GWh for flash
steam plants and less than 80 t CO2-eq/GWh for projected EGS plants (Goldstein et al.,
2011). (Carlsson, 2014) gives direct emissions of 122 t CO2-eq/GWh for flash, 4 t CO2-
eq/GWh for hydrothermal ORC and 0 t CO2-eq/GWh for EGS ORC. Indirect emissions are
given with 92 t CO2-eq/GWh for flash and hydrothermal ORC and 55 t CO2-eq/GWh for
EGS ORC. As such, it is realistic to consider direct emissions of 50 t CO2-eq/GWh for flash
steam plants (Goldstein et al., 2011) and for the ORC plants, and a range of 55 – 95 t
CO2-eq/GWh for indirect (Carlsson, 2014).
Previous JRC studies considered a capacity factor for all three types of geothermal EGS
power plants of about 95 % (Carlsson, 2014; Sigfusson and Uihlein, 2015). According to
IRENA, geothermal power plants capacity factor is more than 80 % globally, and can
reach for some plants and units more than 90 % (Geothermal Power Technology Brief,
2017).
The lifetime of geothermal power plants is usually assumed to be 30 years (Towards
more geothermal electricity generation in Europe, 2014; Carlsson, 2014; Sigfusson and
Uihlein, 2015; Tsiropoulos, Tarvydas and Zucker, 2018a).
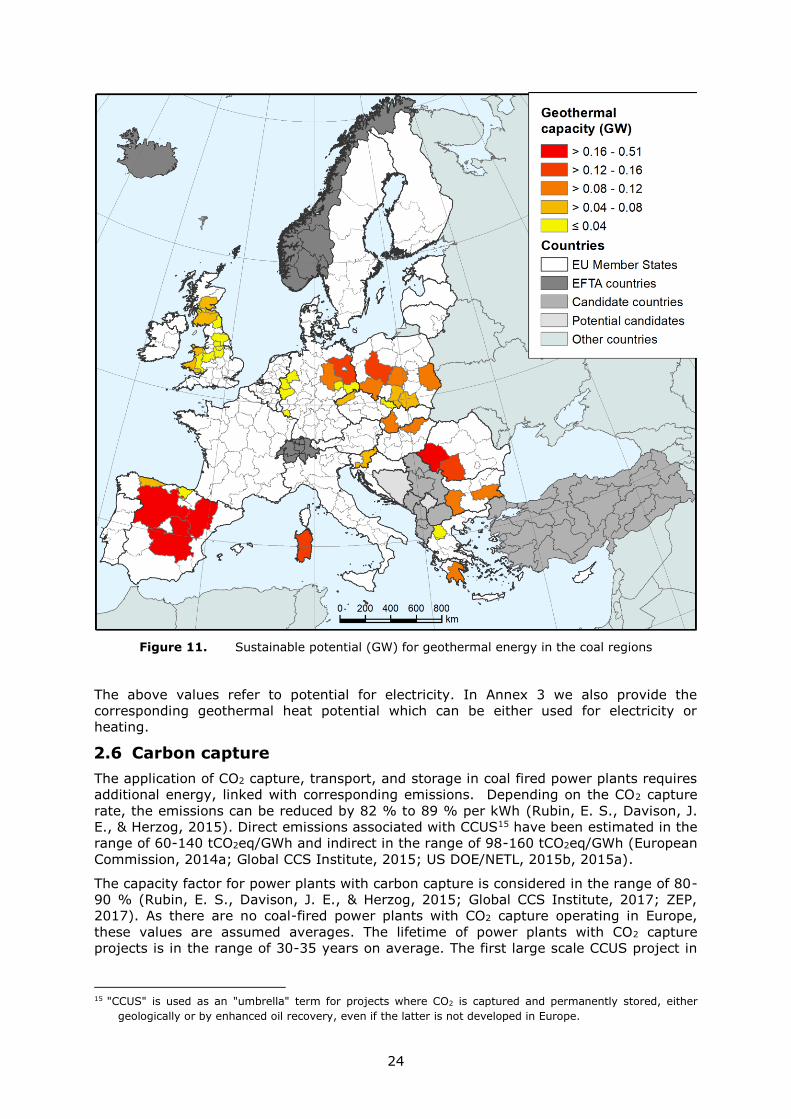
When it comes to the specific potential of the coal regions, we find that the sustainable
potential ranges from 0.01 MW for South Yorkshire (UKE3) to 0.50 GW for Castilla y León
(ES41) (Figure 11). The top 5 regions with high potential are in Spain, Romania and
Germany: Castilla y León (ES41), Castilla-La Mancha (ES42), Aragón (ES24), Vest
(RO42) and Brandenburg (DE40). Specifically, the estimated values indicate a potential
that is so far untapped in these countries. Besides Germany with a 0.03 GW capacity of
geothermal energy in 2018 (IRENA, 2019), Spain and Romania have insignificant
geothermal power capacity.
24
Figure 11. Sustainable potential (GW) for geothermal energy in the coal regions
The above values refer to potential for electricity. In Annex 3 we also provide the
corresponding geothermal heat potential which can be either used for electricity or
heating.
2.6 Carbon capture
The application of CO2 capture, transport, and storage in coal fired power plants requires
additional energy, linked with corresponding emissions. Depending on the CO2 capture
rate, the emissions can be reduced by 82 % to 89 % per kWh (Rubin, E. S., Davison, J.
E., & Herzog, 2015). Direct emissions associated with CCUS15 have been estimated in the
range of 60-140 tCO2eq/GWh and indirect in the range of 98-160 tCO2eq/GWh (European
Commission, 2014a; Global CCS Institute, 2015; US DOE/NETL, 2015b, 2015a).
The capacity factor for power plants with carbon capture is considered in the range of 80-
90 % (Rubin, E. S., Davison, J. E., & Herzog, 2015; Global CCS Institute, 2017; ZEP,
2017). As there are no coal-fired power plants with CO2 capture operating in Europe,
these values are assumed averages. The lifetime of power plants with CO2 capture
projects is in the range of 30-35 years on average. The first large scale CCUS project in
15 "CCUS" is used as an "umbrella" term for projects where CO2 is captured and permanently stored, either
geologically or by enhanced oil recovery, even if the latter is not developed in Europe.
25
power generation operating since 2014 in Canada, is considering a lifetime of 30 years
(IEAGHG, 2015).
Table 5. Key operational characteristics of Pulverised Coal (PC) plants.
Technology Emission intensity
(tCO2eq/GWh)
Average capacity
factor (%)
Technical lifetime
(years)
Pulverised
coal/lignite
plants
890-1 010 (direct)
95- 110 (indirect)
85-90 35-40
Pulverised
coal plants,
post-
combustion
105 (direct)
120 (indirect)
85-90 35-40
Sources: (Spisto et al., 2014; Tsiropoulos, Tarvydas and Zucker, 2018b)
For carbon capture, we estimate the technical potential deployment primarily based on
the carbon capture readiness of existing plants. The criteria are based on what is
prescribed within the CCS Directive (please see Annex 5 for methodology). Based on
existing publically available CO2 storage data (Poulsen et al., 2014; BGR, 2019) we
assume that there is enough storage capacity nationally16 to accommodate the captured
CO2. Currently, there is no transportation network routing CO2 to storage locations. In
the UK for example, the assumptions that some developers have made in the permitting
process with regard to feasible CO2 transport pipe routes, place some doubt on the
realism of any future CO2 capture for some of the plants (Triple-e, Ricardo-AEA and TNO,
2015). However, the potential developments regarding CO2 networks in Europe within
the Projects of Common Interest (PCI) instrument may unlock an associated potential.
Nevertheless, a detailed and focused analysis would be required to accurately match the
associated CO2 sources and sinks.
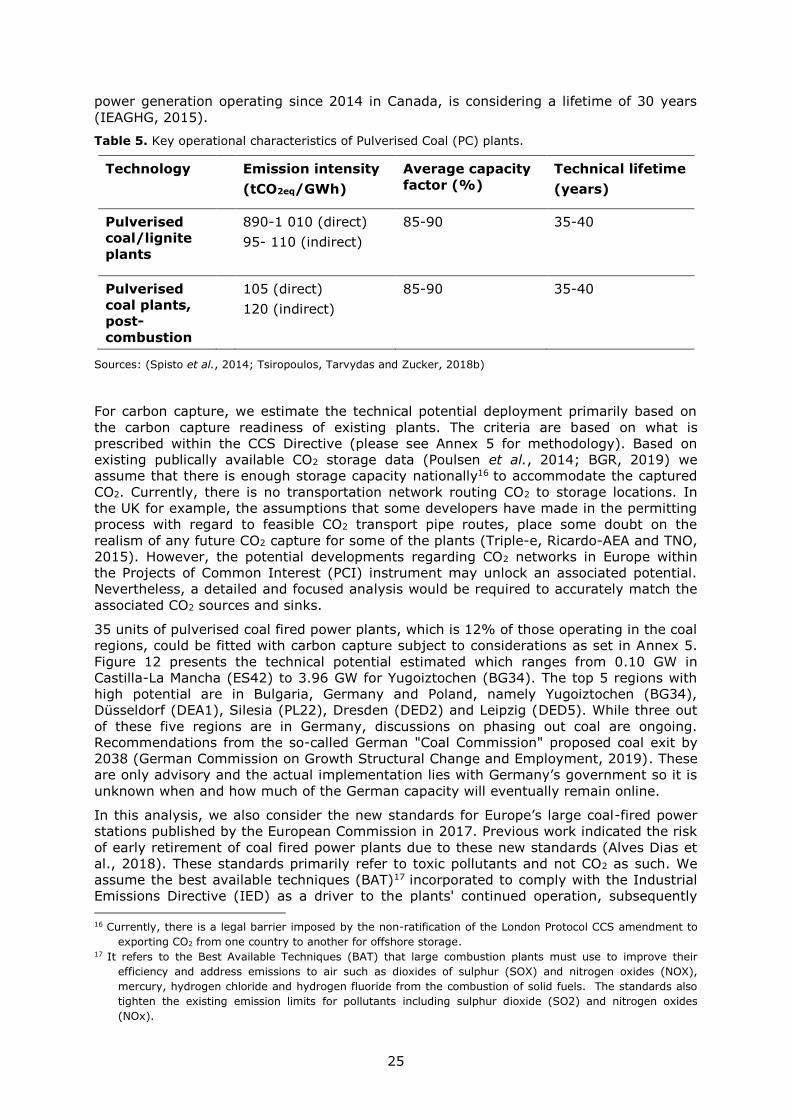
35 units of pulverised coal fired power plants, which is 12% of those operating in the coal
regions, could be fitted with carbon capture subject to considerations as set in Annex 5.
Figure 12 presents the technical potential estimated which ranges from 0.10 GW in
Castilla-La Mancha (ES42) to 3.96 GW for Yugoiztochen (BG34). The top 5 regions with
high potential are in Bulgaria, Germany and Poland, namely Yugoiztochen (BG34),
Düsseldorf (DEA1), Silesia (PL22), Dresden (DED2) and Leipzig (DED5). While three out
of these five regions are in Germany, discussions on phasing out coal are ongoing.
Recommendations from the so-called German "Coal Commission" proposed coal exit by
2038 (German Commission on Growth Structural Change and Employment, 2019). These
are only advisory and the actual implementation lies with Germany’s government so it is
unknown when and how much of the German capacity will eventually remain online.
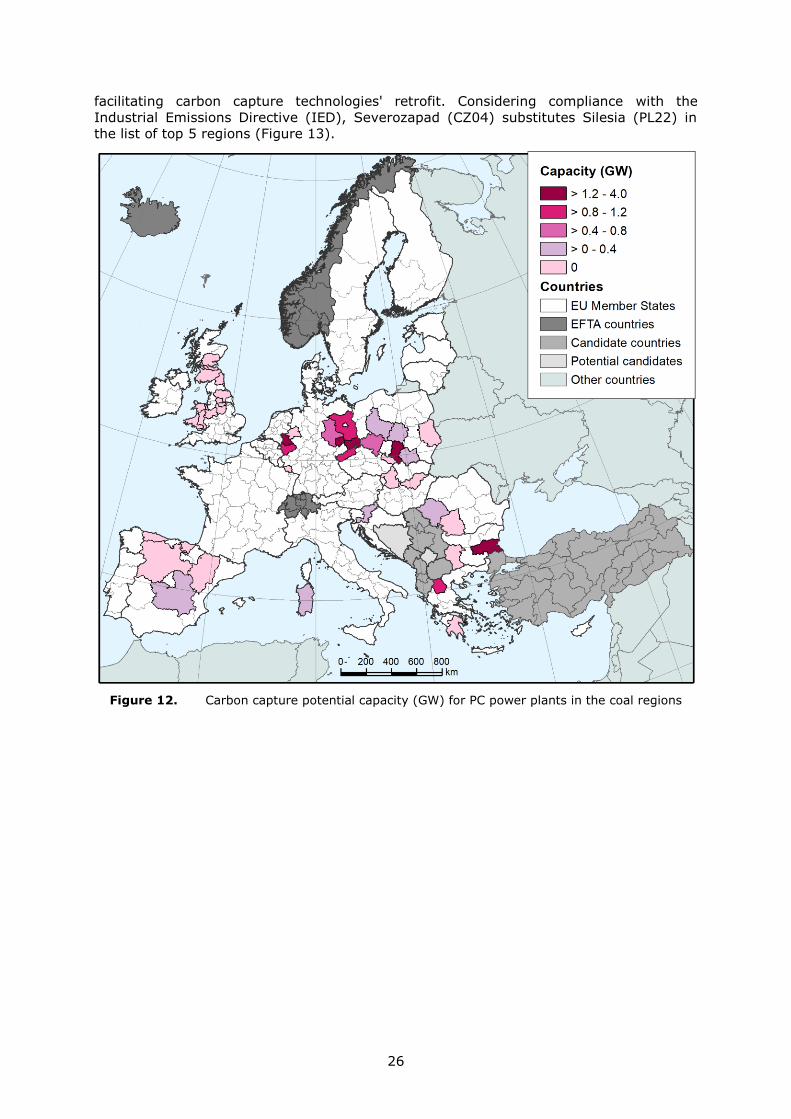
In this analysis, we also consider the new standards for Europe’s large coal-fired power
stations published by the European Commission in 2017. Previous work indicated the risk
of early retirement of coal fired power plants due to these new standards (Alves Dias et
al., 2018). These standards primarily refer to toxic pollutants and not CO2 as such. We
assume the best available techniques (BAT)17 incorporated to comply with the Industrial
Emissions Directive (IED) as a driver to the plants' continued operation, subsequently
16 Currently, there is a legal barrier imposed by the non-ratification of the London Protocol CCS amendment to
exporting CO2 from one country to another for offshore storage. 17 It refers to the Best Available Techniques (BAT) that large combustion plants must use to improve their
efficiency and address emissions to air such as dioxides of sulphur (SOX) and nitrogen oxides (NOX),
mercury, hydrogen chloride and hydrogen fluoride from the combustion of solid fuels. The standards also
tighten the existing emission limits for pollutants including sulphur dioxide (SO2) and nitrogen oxides
(NOx).
26
facilitating carbon capture technologies' retrofit. Considering compliance with the
Industrial Emissions Directive (IED), Severozapad (CZ04) substitutes Silesia (PL22) in
the list of top 5 regions (Figure 13).
Figure 12. Carbon capture potential capacity (GW) for PC power plants in the coal regions
27
Figure 13. Carbon capture potential capacity (GW) for PC power plants in the coal regions considering IED BAT
28
2.7 Energy efficiency in residential buildings
In the frame of the implementation of the Energy Performance of Buildings Directive
(EPBD) recast (2010/31/EU) (European Parliament & Council, 2009), the EU Member
States were asked to develop policies appropriate to their national situations and provide
the necessary financing to foster the transition to Nearly Zero-Energy Buildings (NZEB).
However, acknowledging the variety in building culture and climate throughout Europe,
the EPBD does not prescribe a uniform approach for implementing NZEB. Member States
were required to draw up National Plans for increasing the number of NZEBs, with targets
that may be different for different building categories. According to paragraph 3 of Article
9, these plans shall include NZEB definitions reflecting national, regional or local
conditions, and numerical indicators of primary energy use and ratio covered by
Renewable Energy Systems (RES) (D’Agostino et al., 2016).
The EPBD recast asked Member States to calculate cost-optimal levels of minimum
energy performance requirements for new and existing buildings by using the
comparative methodology framework established by the European Commission. This
cost-optimal calculation framework involves the following steps: i) definition of national
reference buildings representing the national building stock; ii) identification of energy
efficiency measures and packages to be evaluated; iii) calculation of primary energy
demand of the reference buildings with the identified energy efficiency measures; iv)
calculation of global costs related to each of the energy efficiency measure and package
considering long term expenditures and savings during the calculations period; v)
sensitivity analysis for input data; vi) derivation of cost-optimal levels of energy
performance requirements.
While the Member States are updating their plans and calculations (Boermans et al.,
2015) in line with the regulatory background, a recent research project (ENTRANZE18)
provided primary energy levels and benchmarks for building renovation which may
represent the cost-optimal and NZEB targets across Europe (Zangheri et al., 2018).
According to this study, the NZEB area appears characterized by medium-high and high
recurrences of efficiency and RES technologies in all countries. For instance, a typical
NZEB building has a well-insulated envelope19 (including insulation layers of 10-30 cm
and double or triple low-e windows), efficient generators (e.g. condensing boiler or
ground source heat pump or district heating) in some case assisted by heat recovery
strategies, and installed renewable solar systems (normally both thermal and
photovoltaic). Otherwise the cost-optimal benchmarks are more heterogonous. Various
are the retrofit solutions able to reach this target, that overall is characterized by the
competition between the deepest actions regarding envelope, thermal systems and solar
renewable systems. As expected, it is difficult to minimize the global costs applying a
high-performance envelope, very efficient generators, a heat recovery strategy and a PV
plant at the same time. This occurs only in some particular locations.
The data included in Table 6 can be used as key operational characteristics of the
technical renovation solutions reaching the cost-optimal and NZEB energy levels.
18 https://www.entranze.eu/ 19 the physical barrier between the exterior and interior environments enclosing a structure (Hagentoft, 2001).
29
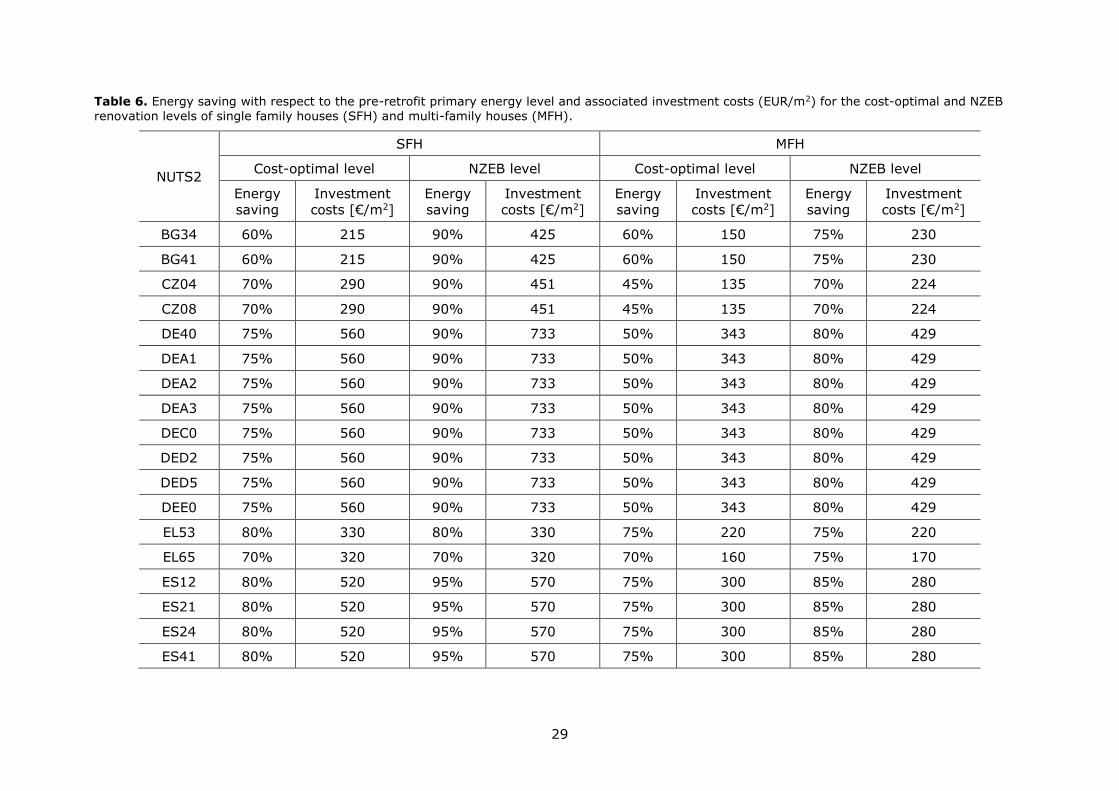
Table 6. Energy saving with respect to the pre-retrofit primary energy level and associated investment costs (EUR/m2) for the cost-optimal and NZEB
renovation levels of single family houses (SFH) and multi-family houses (MFH).
NUTS2
SFH MFH
Cost-optimal level NZEB level Cost-optimal level NZEB level
Energy
saving
Investment
costs [€/m2]
Energy
saving
Investment
costs [€/m2]
Energy
saving
Investment
costs [€/m2]
Energy
saving
Investment
costs [€/m2]
BG34 60% 215 90% 425 60% 150 75% 230
BG41 60% 215 90% 425 60% 150 75% 230
CZ04 70% 290 90% 451 45% 135 70% 224
CZ08 70% 290 90% 451 45% 135 70% 224
DE40 75% 560 90% 733 50% 343 80% 429
DEA1 75% 560 90% 733 50% 343 80% 429
DEA2 75% 560 90% 733 50% 343 80% 429
DEA3 75% 560 90% 733 50% 343 80% 429
DEC0 75% 560 90% 733 50% 343 80% 429
DED2 75% 560 90% 733 50% 343 80% 429
DED5 75% 560 90% 733 50% 343 80% 429
DEE0 75% 560 90% 733 50% 343 80% 429
EL53 80% 330 80% 330 75% 220 75% 220
EL65 70% 320 70% 320 70% 160 75% 170
ES12 80% 520 95% 570 75% 300 85% 280
ES21 80% 520 95% 570 75% 300 85% 280
ES24 80% 520 95% 570 75% 300 85% 280
ES41 80% 520 95% 570 75% 300 85% 280
30
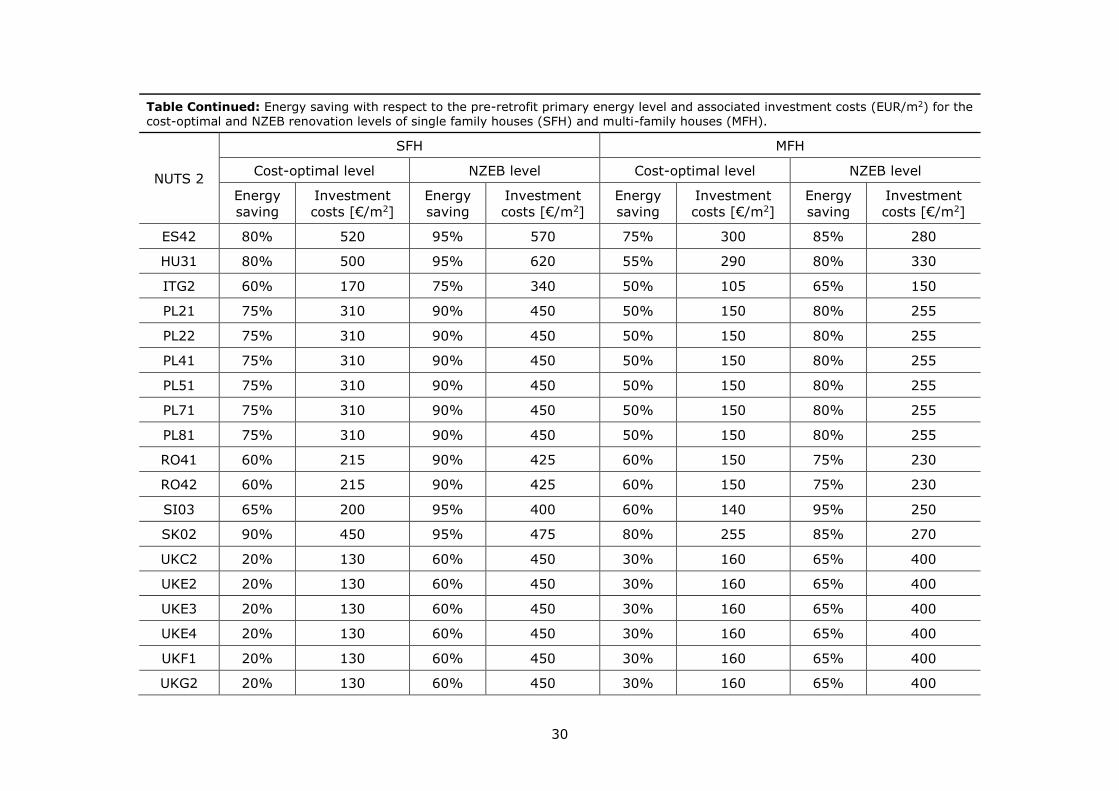
Table Continued: Energy saving with respect to the pre-retrofit primary energy level and associated investment costs (EUR/m2) for the cost-optimal and NZEB renovation levels of single family houses (SFH) and multi-family houses (MFH).
NUTS 2
SFH MFH
Cost-optimal level NZEB level Cost-optimal level NZEB level
Energy
saving
Investment
costs [€/m2]
Energy
saving
Investment
costs [€/m2]
Energy
saving
Investment
costs [€/m2]
Energy
saving
Investment
costs [€/m2]
ES42 80% 520 95% 570 75% 300 85% 280
HU31 80% 500 95% 620 55% 290 80% 330
ITG2 60% 170 75% 340 50% 105 65% 150
PL21 75% 310 90% 450 50% 150 80% 255
PL22 75% 310 90% 450 50% 150 80% 255
PL41 75% 310 90% 450 50% 150 80% 255
PL51 75% 310 90% 450 50% 150 80% 255
PL71 75% 310 90% 450 50% 150 80% 255
PL81 75% 310 90% 450 50% 150 80% 255
RO41 60% 215 90% 425 60% 150 75% 230
RO42 60% 215 90% 425 60% 150 75% 230
SI03 65% 200 95% 400 60% 140 95% 250
SK02 90% 450 95% 475 80% 255 85% 270
UKC2 20% 130 60% 450 30% 160 65% 400
UKE2 20% 130 60% 450 30% 160 65% 400
UKE3 20% 130 60% 450 30% 160 65% 400
UKE4 20% 130 60% 450 30% 160 65% 400
UKF1 20% 130 60% 450 30% 160 65% 400
UKG2 20% 130 60% 450 30% 160 65% 400
31
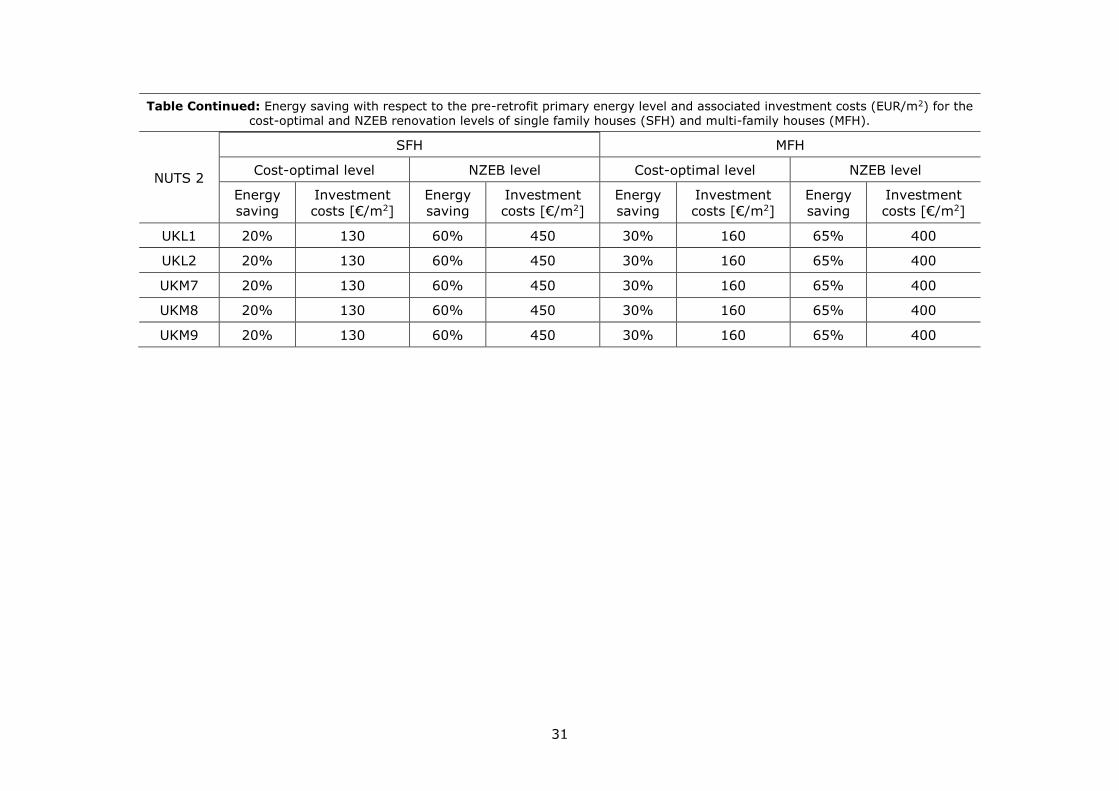
Table Continued: Energy saving with respect to the pre-retrofit primary energy level and associated investment costs (EUR/m2) for the cost-optimal and NZEB renovation levels of single family houses (SFH) and multi-family houses (MFH).
NUTS 2
SFH MFH
Cost-optimal level NZEB level Cost-optimal level NZEB level
Energy
saving
Investment
costs [€/m2]
Energy
saving
Investment
costs [€/m2]
Energy
saving
Investment
costs [€/m2]
Energy
saving
Investment
costs [€/m2]
UKL1 20% 130 60% 450 30% 160 65% 400
UKL2 20% 130 60% 450 30% 160 65% 400
UKM7 20% 130 60% 450 30% 160 65% 400
UKM8 20% 130 60% 450 30% 160 65% 400
UKM9 20% 130 60% 450 30% 160 65% 400
32
The investment costs are considered constant over a period of 30-40 years, as generally
assumed by Member States for their cost-optimal calculations (Boermans et al., 2015).
When it comes to technology deployment projections, a direct comparison to the data
supporting the EC Reference Scenario (De Vita et al., 2018), is not trivial. This is because
the type of renovation measures used are not described in detail and it is not clear how
the geographical regions (Centre/West, North, South and East) were defined. However
the investment costs used in (De Vita et al., 2018) seem lower that those collected for
this study. The main reason for these discrepancies likely is the technological packages
associated to our renovation levels. Usually, these also include energy efficiency
measures regarding the thermal building systems (e.g. condensing boilers, heat pumps,
heat recovery, etc.) and renewable technologies (i.e. thermal solar and photovoltaic).
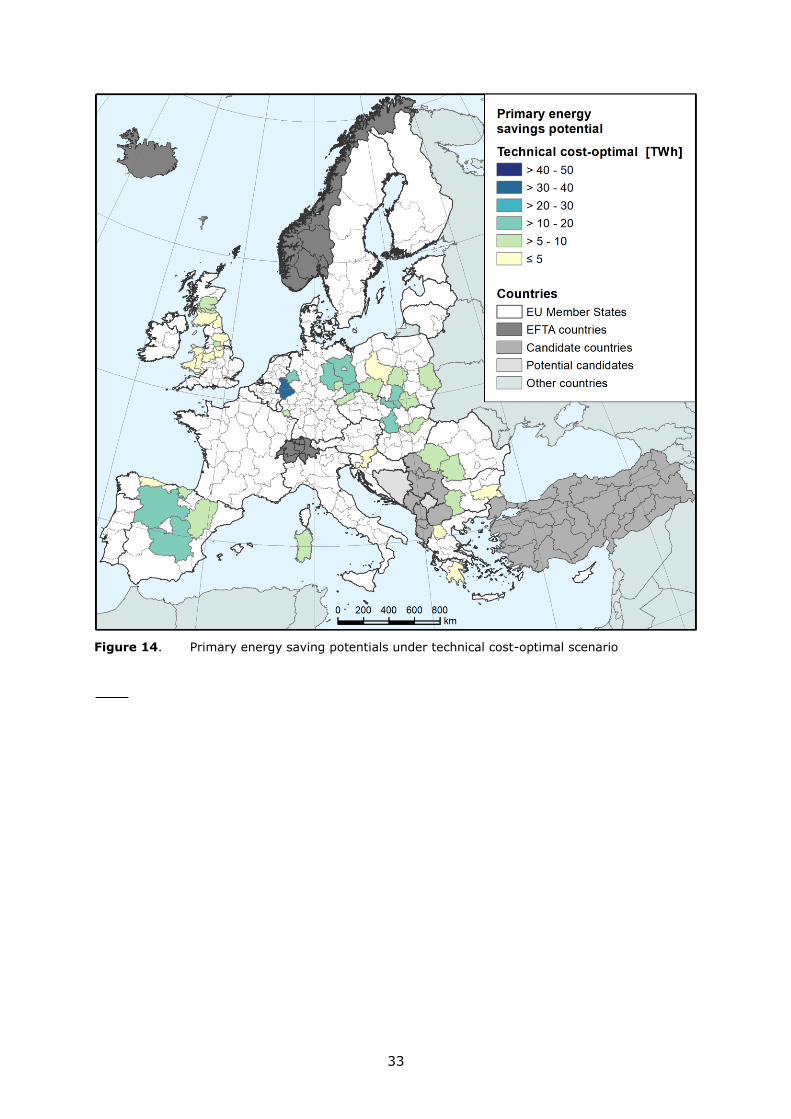
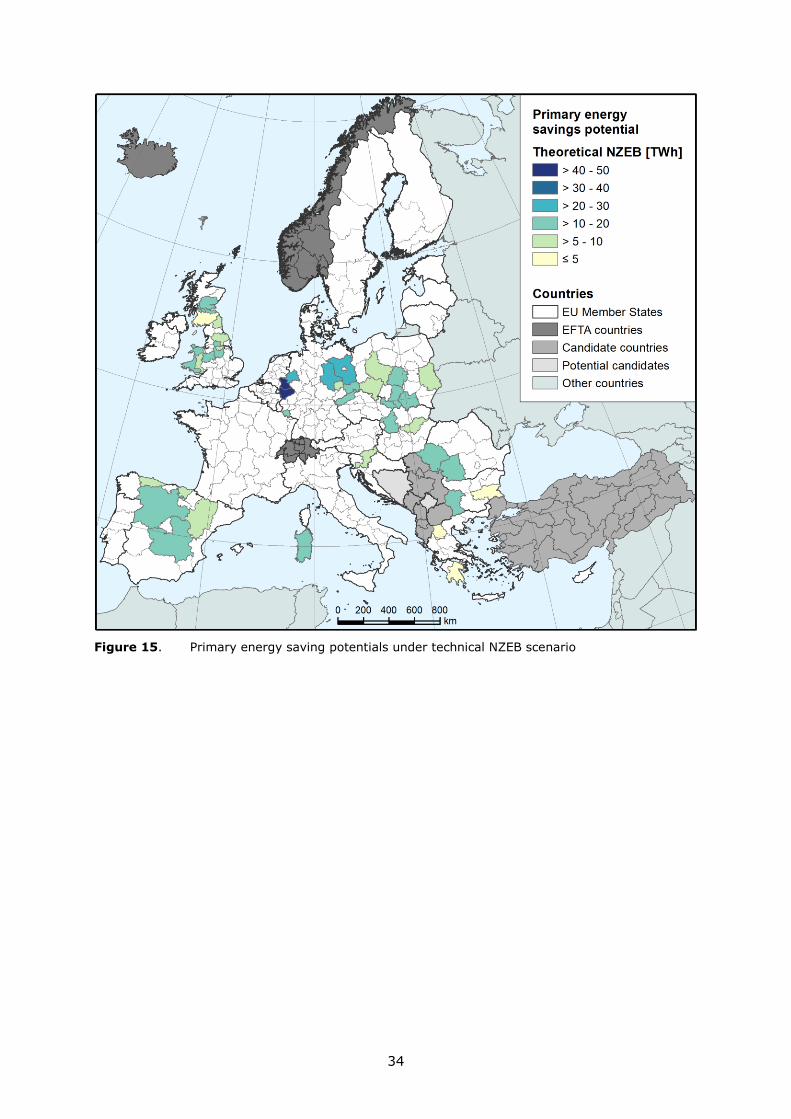
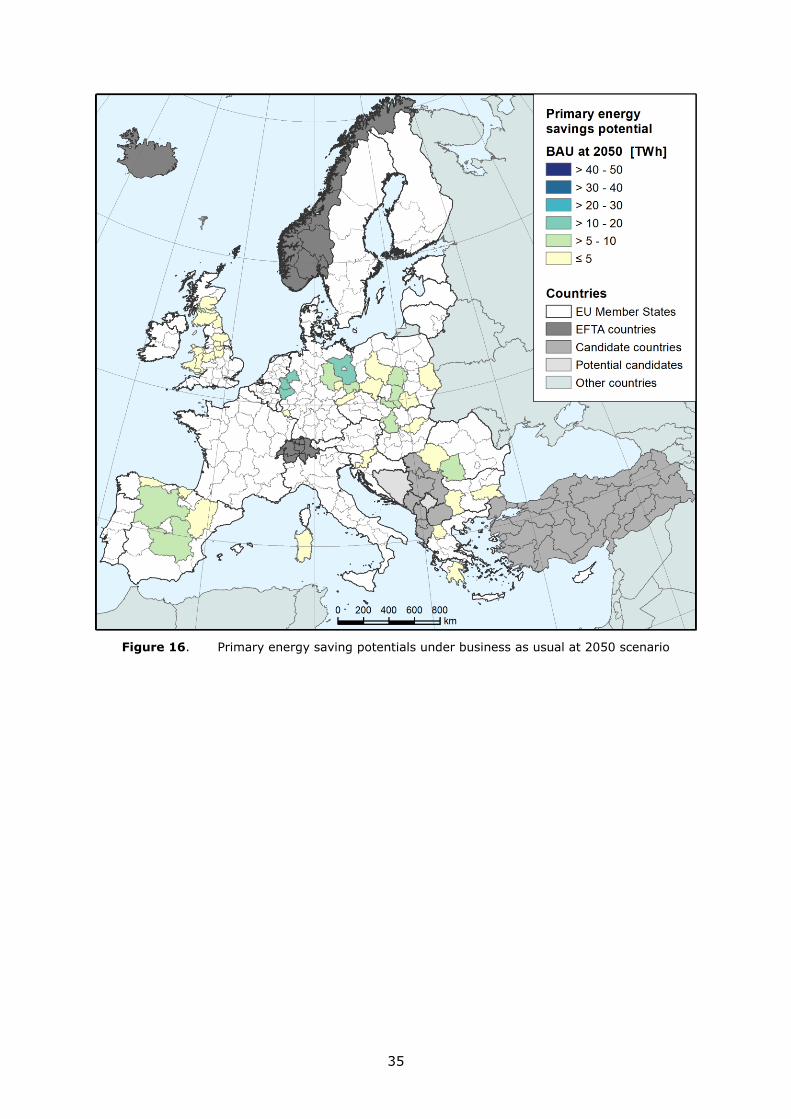
The obtained primary energy saving potential is presented in the following figures. These
map the final results obtained by considering 3 scenarios:
"Theoretical NZEB" refers to the total technical potential related to the renovation
of all occupied existing dwellings to the NZEB level. We consider it as the
theoretical maximum amount of energy that could be saved with energy efficiency
measures, disregarding all non-engineering constraints such as economic or
market barriers. It takes into account the size and the current characteristics of
the building stock and the technical factors associated to the renovation
measures.
With "Theoretical cost-optimal" we refer to a more realistic technical potential
related to the renovation of all occupied existing dwellings to the cost-optimal
level, which minimise the global cost of the building over a period of 30 years.
And "Business As Usual at 2050", which considers a realistic dynamic of
renovations (rate of 1.5% yearly) and an equal distribution between cost-optimal
and NZEB refurbishments.
Due to the high number of occupied dwellings, the top five coal regions with the highest
potential in energy savings for all scenarios are in Germany. Namely, Düsseldorf (DEA1,
34.34, 49.02 and 18.76 TWh), Köln (DEA2 31.92, 44.02 and 17.09 TWh), Brandenburg
(DE40 19.52, 26.72 and 10.4 TWh), Münster (DEA3 19.2, 26.06 and 10.18 TWh) and
Saxony-Anhalt (DEE0 16.28, 22.65 and 8.76 TWh), respectively to the three scenarios
considered. The maximum energy saving potential (associated with the "Theoretical
NZEB" scenario) resulting in all the German regions under investigation represents 5.9%
of the national primary energy consumption in 2017. This ratio increases up to 9.2% for
Slovenia, while the lowest potential (0.6%) is observed in Italy (represented by only one
region, ITG2, Sardegna).
33
Figure 14. Primary energy saving potentials under technical cost-optimal scenario
34
Figure 15. Primary energy saving potentials under technical NZEB scenario
35
Figure 16. Primary energy saving potentials under business as usual at 2050 scenario
36
2.8 A glance on batteries
Driven by the EU's transition to a clean, secure, sustainable and competitive energy
system, where batteries are recognised as a key enabling technology for decarbonisation
of transport and accelerated deployment of intermittent renewable energy such as wind
and solar, demand for batteries is expected to grow very rapidly in the coming years
(Tsiropoulos, Tarvydas and Lebedeva, 2018; European Commission, 2019a). Li-ion
batteries are presently the technology of choice for electric vehicles and are quickly
gaining ground in energy storage applications (Tsiropoulos, Tarvydas and Lebedeva,
2018). For this reason, the present analysis focuses on Li-ion battery technology and
describes recent developments within the Li-ion battery value chain in the coal regions
considered in this study.
The Partnership on Advanced Materials for Batteries for Electro-mobility and Stationary
Energy Storage 20 was launched in October 2018 in the framework of the Smart
Specialisation Platform on industrial modernisation. This partnership aims to develop
joint R&D&I projects on topics of advanced materials, their characterisation, durability,
suitable for extreme working conditions with the goal to deploy them in the field of
batteries. 3 out of the 42 coal regions (Basque Country (ES21), Aragón (ES24) and
Castilla y León (ES41)) are within the regions involved.
Recognising the strategic importance of establishing a globally competitive, sustainable
and integrated European battery value chain (European Commission, 2017), the
European Commission launched an industry-led initiative - the European Battery Alliance
(EBA)21 - and adopted the Strategic Action Plan on Batteries as part of the third ‘Europe
on the Move’ mobility package (European Commission, 2018a). The main objective
behind these initiatives is to support the scaling up of innovative solutions for battery
manufacturing in Europe and to foster cooperation between industries and other actors
across the value chain, with support at both the EU-level and from EU Member States
(European Commission, 2019a).
Significant progress in establishing a European Li-ion battery value chain has
subsequently been made and industry has announced several major investments
(European Commission, 2019a).22 A number of these include projects in the 42 coal
regions this study focuses on (please see Annex 8 for a list of identified industrial
battery-related activities). Substantial developments take place in Poland and in
Germany and some noteworthy examples of facilities being set up and/or expanded for
domestic production of various battery functional materials, battery cells, modules and
packs include:
Functional battery materials (cathode, anode, electrolyte and separator):
o Konin (PL, Wielkopolskie, PL41), where construction of a large factory for
novel cathode material (eLNO) is announced by Johnson Matthey (HQ in UK)
with the start of manufacturing envisaged in 2021-2022.
o Wrocław (PL, Dolnośląskie, PL51), where Capchem Poland (HQ in CN) will be
producing electrolyte for Li-ion batteries (after acquisition of the former BASF
business).
Battery cells, modules and packs:
o Kobierzyce (PL, Dolnośląskie, PL51) hosts currently the biggest factory in the
EU for production of Li-ion battery cells, and is owned by LG Chem (HQ in KR).
Its manufacturing capacity is planned to be expanded from 10 GWh today to
70 GWh by 2022.
20 http://s3platform.jrc.ec.europa.eu/batteries 21 https://ec.europa.eu/growth/industry/policy/european-battery-alliance_en 22 http://europa.eu/rapid/press-release_IP-18-6114_en.htm

37
o Bitterfeld-Wolfen (DE, Sachsen-Anhalt, DEE0), where Farasis Energy Europe
(HQ in CN) plans to establish production of Li-ion battery cells, modules and
packs for automotive traction applications by 2022 with initial manufacturing
capacity of 6 GWh.
o Jawor (PL, Dolnośląskie, PL51), where Mercedes-Benz Cars (HQ in DE) will
start manufacturing battery packs for automotive traction applications at the
beginning of the next decade.
o Kamenz (DE, Dresden, DED2), Deutsche Accumotive (HQ in DE) further
expands its manufacturing capacity of Li-ion battery packs for e-mobility.
o Lutherstadt Wittenberg (DE, Sachsen-Anhalt, DEE0), will see this year a start
of operations of Tesvolt (HQ in DE) facility for production of battery packs and
systems for stationary energy storage with annual capacity of >1 GWh.
Due to geology, there are a very limited number of activities related to raw materials for
Li-ion batteries in the European coal regions (P. Alves Dias et al., 2018) (please also see
Annex 8). Recycling, on the other hand, continues increasing in volume and is expected
to grow substantially in the next few years (P. Alves Dias et al., 2018) (please also see
Annex 8).
In establishing the above-mentioned activities, proximity to the clients (mainly European
automotive industry and their suppliers) is often named among the most important
considerations.23 This is to ensure short transport distances, allow quick response time
and improved flexibility and to minimise safety hazards related to handling and transport.
As setting up a battery-related activity often requires a multi-million-euro investment,
favourable investment aid conditions in the EU for such activities24 stimulate and already
support major initiatives such as the Nissan facility in Sunderland (UK, Northumberland
and Tyne and Wear, UKC2),25 LG Chem factory in Kobierzyce (PL, Dolnośląskie, PL51)26
and Northvolt in Sweden.27
Brown-field investments, i.e. re-profiling of existing facilities to launch a new production
activity, offer a significant advantage due to lower capital costs compared to green-field
investments.28 The access to skilled workers, who may become available upon phasing
out of existing activities, also plays a major role. This approach was successfully used by
e.g. Samsung SDI in setting up their facility in Göd (HU)29 (albeit not one of the regions
of focus) and to some extent by Farasis Energy Europe in Bitterfeld-Wolfen (DE,
Sachsen-Anhalt, DEE0)30 for the production of Li-ion battery cells.
Fully in line with priorities of the EBA, considerations on manufacturing and use
sustainability, such as reduction of the carbon footprint and "greening", gain
progressively more attention from the new battery-related initiatives. The Battery pack
manufacturing facility of Tesvolt in Lutherstadt Wittenberg (DE, Sachsen-Anhalt, DEE0)
will operate exclusively on solar power to achieve "full carbon neutrality".31 Also battery
23 See, for example, https://www.electrive.com/2019/05/09/farasis-energy-plans-battery-plant-in-germany/;
https://matthey.com/news/2019/johnson-matthey-achieves-two-major-milestones-in-commercialisation-
of-elno 24 https://www.ft.com/content/097ff758-cec3-11e8-a9f2-7574db66bcd5 25 https://uk.nissannews.com/en-GB/releases/release-85686-european-investment-bank-to-provide-eur-220m-
to-nissan 26 LG Chem investment aid: https://www.electrive.com/2019/01/29/poland-lg-chem-factory-plans-take-shape/ 27 https://www.bestmag.co.uk/content/northvolt-set-€400m-swedish-gigafactory-loan 28 https://www.investopedia.com/terms/b/brownfield.asp 29 http://www.samsungsdi.com/sdi-news/1642.html 30 https://www.mdr.de/sachsen-anhalt/dessau/bitterfeld/video-299012_zc-b509df00_zs-978d5271.html 31 https://www.bestmag.co.uk/content/tesvolt-races-claim-european-gigafactory-
first?utm_source=ESPL+contacts+010215&utm_campaign=57ff8bbf2d-
EMAIL_CAMPAIGN_2019_05_12_12_09&utm_medium=email&utm_term=0_26465d901f-57ff8bbf2d-
406291157
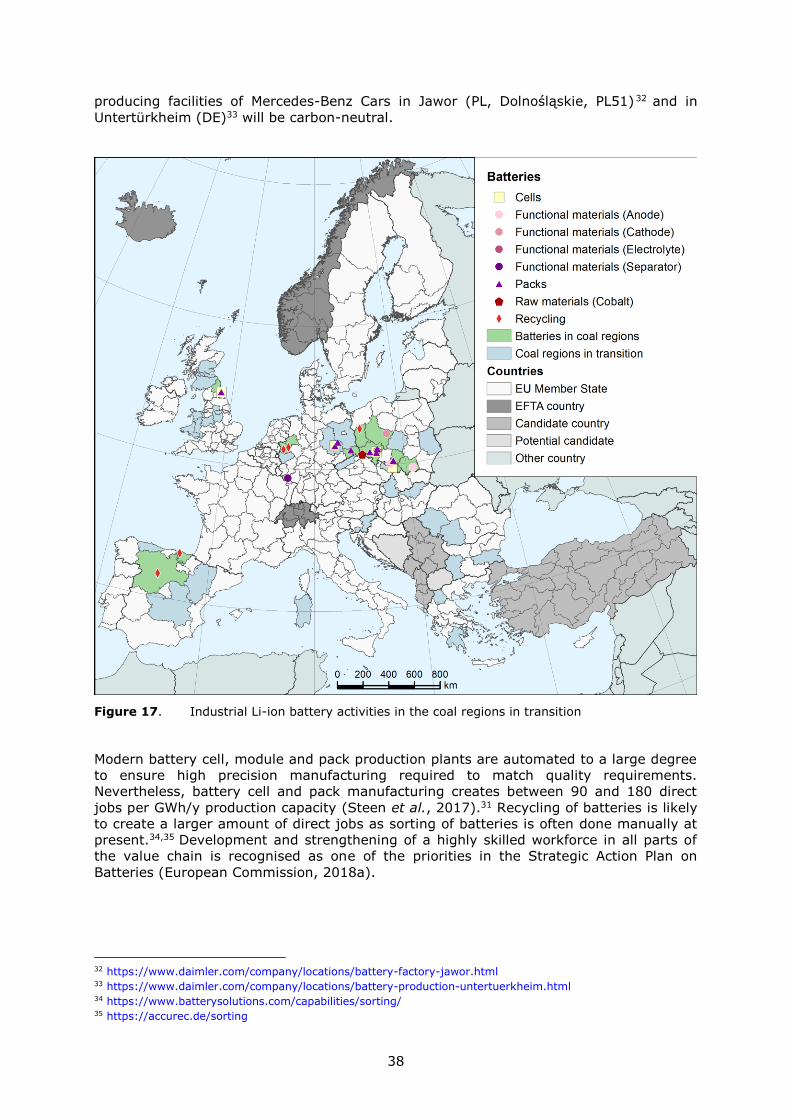
38
producing facilities of Mercedes-Benz Cars in Jawor (PL, Dolnośląskie, PL51) 32 and in
Untertürkheim (DE)33 will be carbon-neutral.
Figure 17. Industrial Li-ion battery activities in the coal regions in transition
Modern battery cell, module and pack production plants are automated to a large degree
to ensure high precision manufacturing required to match quality requirements.
Nevertheless, battery cell and pack manufacturing creates between 90 and 180 direct
jobs per GWh/y production capacity (Steen et al., 2017).31 Recycling of batteries is likely
to create a larger amount of direct jobs as sorting of batteries is often done manually at
present.34,35 Development and strengthening of a highly skilled workforce in all parts of
the value chain is recognised as one of the priorities in the Strategic Action Plan on
Batteries (European Commission, 2018a).
32 https://www.daimler.com/company/locations/battery-factory-jawor.html 33 https://www.daimler.com/company/locations/battery-production-untertuerkheim.html 34 https://www.batterysolutions.com/capabilities/sorting/ 35 https://accurec.de/sorting
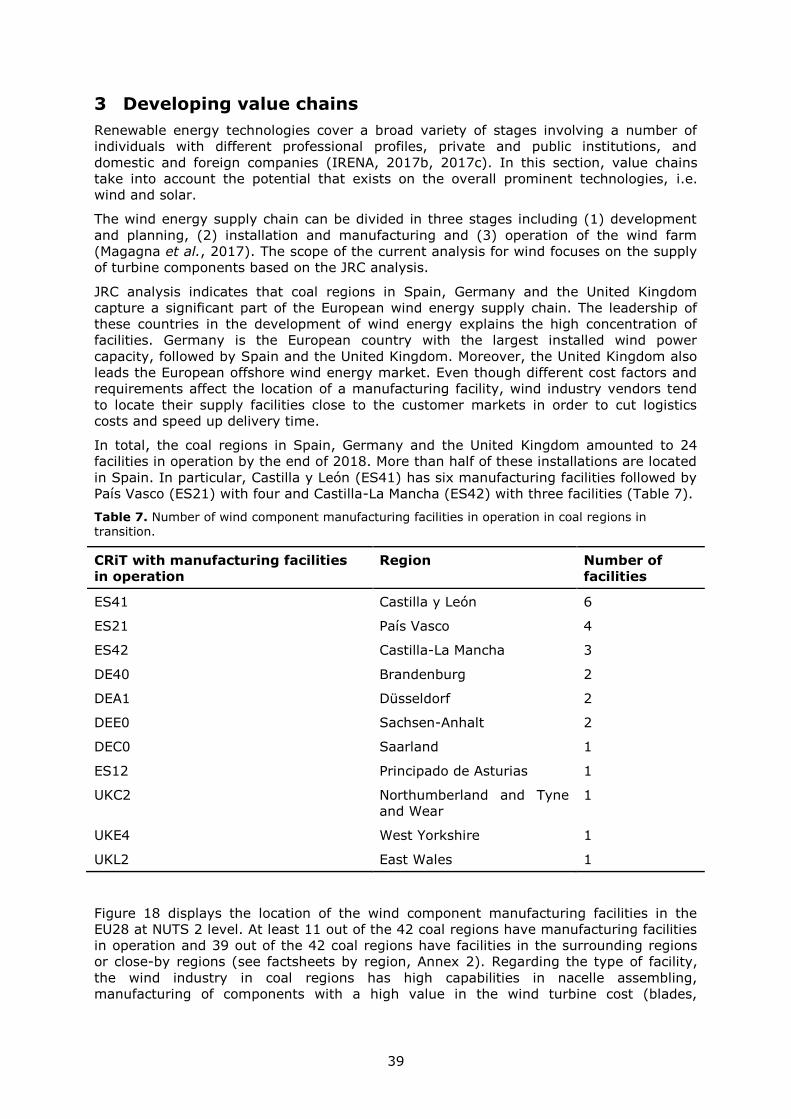
39
3 Developing value chains
Renewable energy technologies cover a broad variety of stages involving a number of
individuals with different professional profiles, private and public institutions, and
domestic and foreign companies (IRENA, 2017b, 2017c). In this section, value chains
take into account the potential that exists on the overall prominent technologies, i.e.
wind and solar.
The wind energy supply chain can be divided in three stages including (1) development
and planning, (2) installation and manufacturing and (3) operation of the wind farm
(Magagna et al., 2017). The scope of the current analysis for wind focuses on the supply
of turbine components based on the JRC analysis.
JRC analysis indicates that coal regions in Spain, Germany and the United Kingdom
capture a significant part of the European wind energy supply chain. The leadership of
these countries in the development of wind energy explains the high concentration of
facilities. Germany is the European country with the largest installed wind power
capacity, followed by Spain and the United Kingdom. Moreover, the United Kingdom also
leads the European offshore wind energy market. Even though different cost factors and
requirements affect the location of a manufacturing facility, wind industry vendors tend
to locate their supply facilities close to the customer markets in order to cut logistics
costs and speed up delivery time.
In total, the coal regions in Spain, Germany and the United Kingdom amounted to 24
facilities in operation by the end of 2018. More than half of these installations are located
in Spain. In particular, Castilla y León (ES41) has six manufacturing facilities followed by
País Vasco (ES21) with four and Castilla-La Mancha (ES42) with three facilities (Table 7).
Table 7. Number of wind component manufacturing facilities in operation in coal regions in transition.
CRiT with manufacturing facilities
in operation
Region Number of
facilities
ES41 Castilla y León 6
ES21 País Vasco 4
ES42 Castilla-La Mancha 3
DE40 Brandenburg 2
DEA1 Düsseldorf 2
DEE0 Sachsen-Anhalt 2
DEC0 Saarland 1
ES12 Principado de Asturias 1
UKC2 Northumberland and Tyne
and Wear
1
UKE4 West Yorkshire 1
UKL2 East Wales 1
Figure 18 displays the location of the wind component manufacturing facilities in the
EU28 at NUTS 2 level. At least 11 out of the 42 coal regions have manufacturing facilities
in operation and 39 out of the 42 coal regions have facilities in the surrounding regions
or close-by regions (see factsheets by region, Annex 2). Regarding the type of facility,
the wind industry in coal regions has high capabilities in nacelle assembling,
manufacturing of components with a high value in the wind turbine cost (blades,
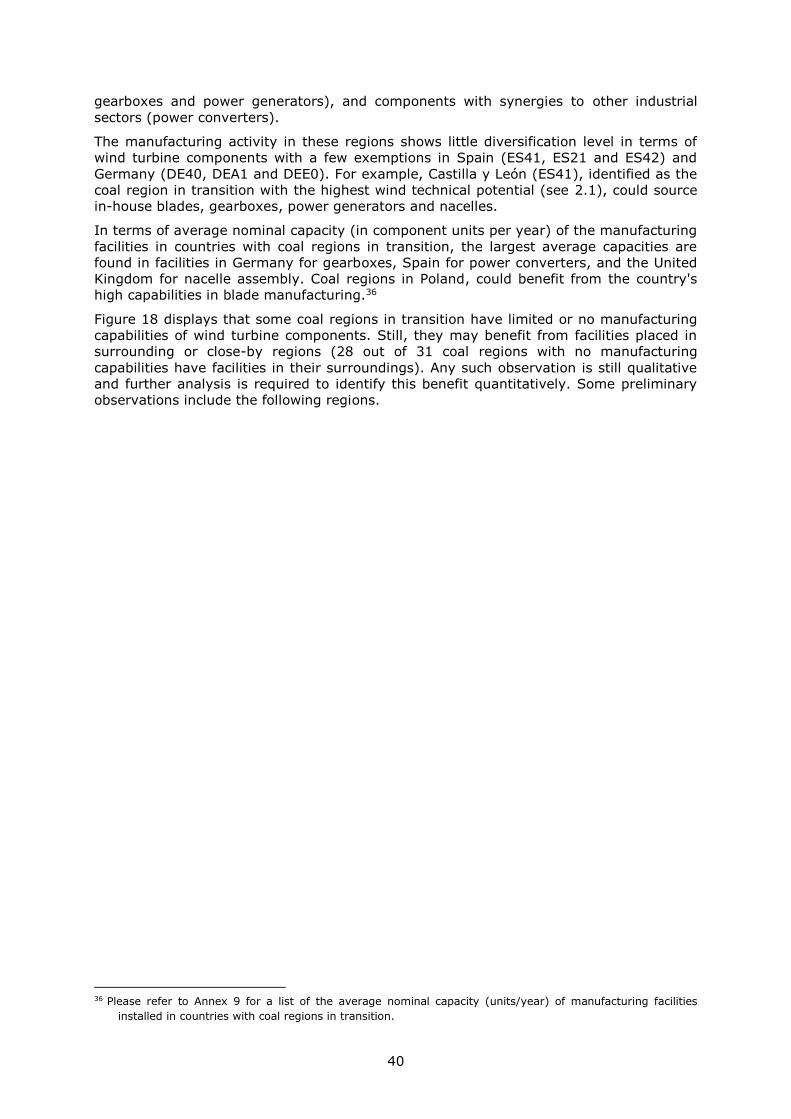
40
gearboxes and power generators), and components with synergies to other industrial
sectors (power converters).
The manufacturing activity in these regions shows little diversification level in terms of
wind turbine components with a few exemptions in Spain (ES41, ES21 and ES42) and
Germany (DE40, DEA1 and DEE0). For example, Castilla y León (ES41), identified as the
coal region in transition with the highest wind technical potential (see 2.1), could source
in-house blades, gearboxes, power generators and nacelles.
In terms of average nominal capacity (in component units per year) of the manufacturing
facilities in countries with coal regions in transition, the largest average capacities are
found in facilities in Germany for gearboxes, Spain for power converters, and the United
Kingdom for nacelle assembly. Coal regions in Poland, could benefit from the country's
high capabilities in blade manufacturing.36
Figure 18 displays that some coal regions in transition have limited or no manufacturing
capabilities of wind turbine components. Still, they may benefit from facilities placed in
surrounding or close-by regions (28 out of 31 coal regions with no manufacturing
capabilities have facilities in their surroundings). Any such observation is still qualitative
and further analysis is required to identify this benefit quantitatively. Some preliminary
observations include the following regions.
36 Please refer to Annex 9 for a list of the average nominal capacity (units/year) of manufacturing facilities
installed in countries with coal regions in transition.
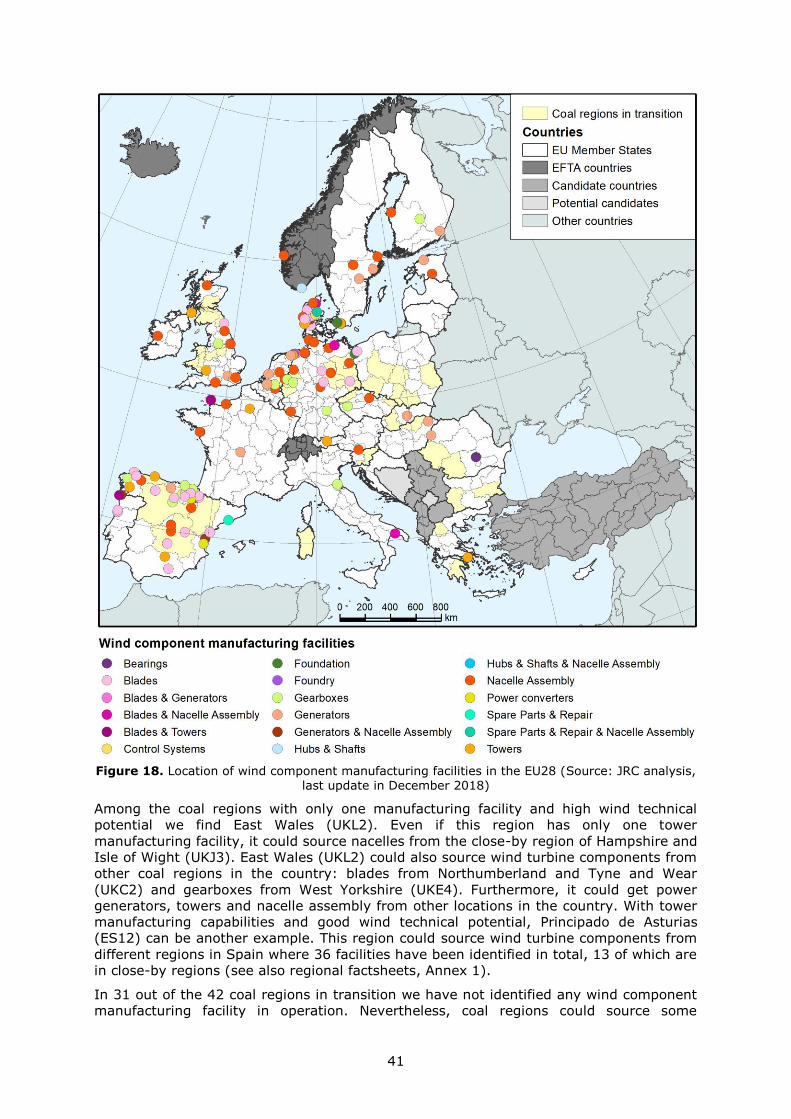
41
Figure 18. Location of wind component manufacturing facilities in the EU28 (Source: JRC analysis, last update in December 2018)
Among the coal regions with only one manufacturing facility and high wind technical
potential we find East Wales (UKL2). Even if this region has only one tower
manufacturing facility, it could source nacelles from the close-by region of Hampshire and
Isle of Wight (UKJ3). East Wales (UKL2) could also source wind turbine components from
other coal regions in the country: blades from Northumberland and Tyne and Wear
(UKC2) and gearboxes from West Yorkshire (UKE4). Furthermore, it could get power
generators, towers and nacelle assembly from other locations in the country. With tower
manufacturing capabilities and good wind technical potential, Principado de Asturias
(ES12) can be another example. This region could source wind turbine components from
different regions in Spain where 36 facilities have been identified in total, 13 of which are
in close-by regions (see also regional factsheets, Annex 1).
In 31 out of the 42 coal regions in transition we have not identified any wind component
manufacturing facility in operation. Nevertheless, coal regions could source some
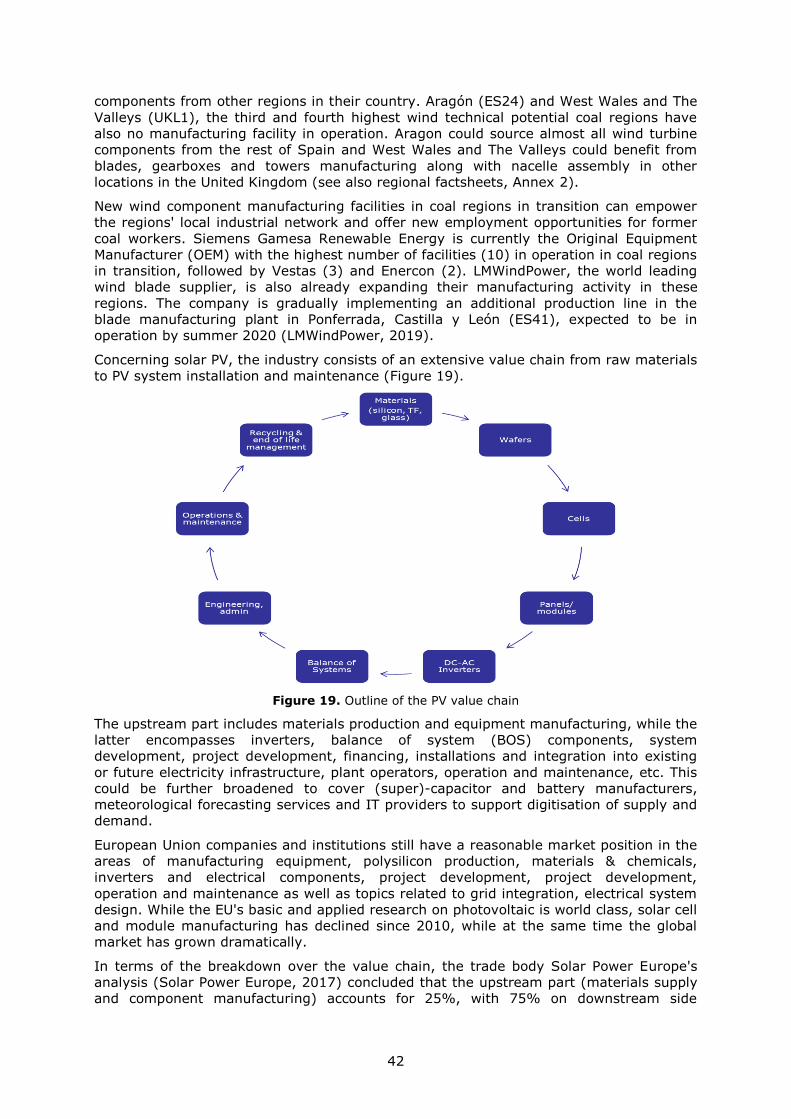
42
components from other regions in their country. Aragón (ES24) and West Wales and The
Valleys (UKL1), the third and fourth highest wind technical potential coal regions have
also no manufacturing facility in operation. Aragon could source almost all wind turbine
components from the rest of Spain and West Wales and The Valleys could benefit from
blades, gearboxes and towers manufacturing along with nacelle assembly in other
locations in the United Kingdom (see also regional factsheets, Annex 2).
New wind component manufacturing facilities in coal regions in transition can empower
the regions' local industrial network and offer new employment opportunities for former
coal workers. Siemens Gamesa Renewable Energy is currently the Original Equipment
Manufacturer (OEM) with the highest number of facilities (10) in operation in coal regions
in transition, followed by Vestas (3) and Enercon (2). LMWindPower, the world leading
wind blade supplier, is also already expanding their manufacturing activity in these
regions. The company is gradually implementing an additional production line in the
blade manufacturing plant in Ponferrada, Castilla y León (ES41), expected to be in
operation by summer 2020 (LMWindPower, 2019).
Concerning solar PV, the industry consists of an extensive value chain from raw materials
to PV system installation and maintenance (Figure 19).
Figure 19. Outline of the PV value chain
The upstream part includes materials production and equipment manufacturing, while the
latter encompasses inverters, balance of system (BOS) components, system
development, project development, financing, installations and integration into existing
or future electricity infrastructure, plant operators, operation and maintenance, etc. This
could be further broadened to cover (super)-capacitor and battery manufacturers,
meteorological forecasting services and IT providers to support digitisation of supply and
demand.
European Union companies and institutions still have a reasonable market position in the
areas of manufacturing equipment, polysilicon production, materials & chemicals,
inverters and electrical components, project development, project development,
operation and maintenance as well as topics related to grid integration, electrical system
design. While the EU's basic and applied research on photovoltaic is world class, solar cell
and module manufacturing has declined since 2010, while at the same time the global
market has grown dramatically.
In terms of the breakdown over the value chain, the trade body Solar Power Europe's
analysis (Solar Power Europe, 2017) concluded that the upstream part (materials supply
and component manufacturing) accounts for 25%, with 75% on downstream side
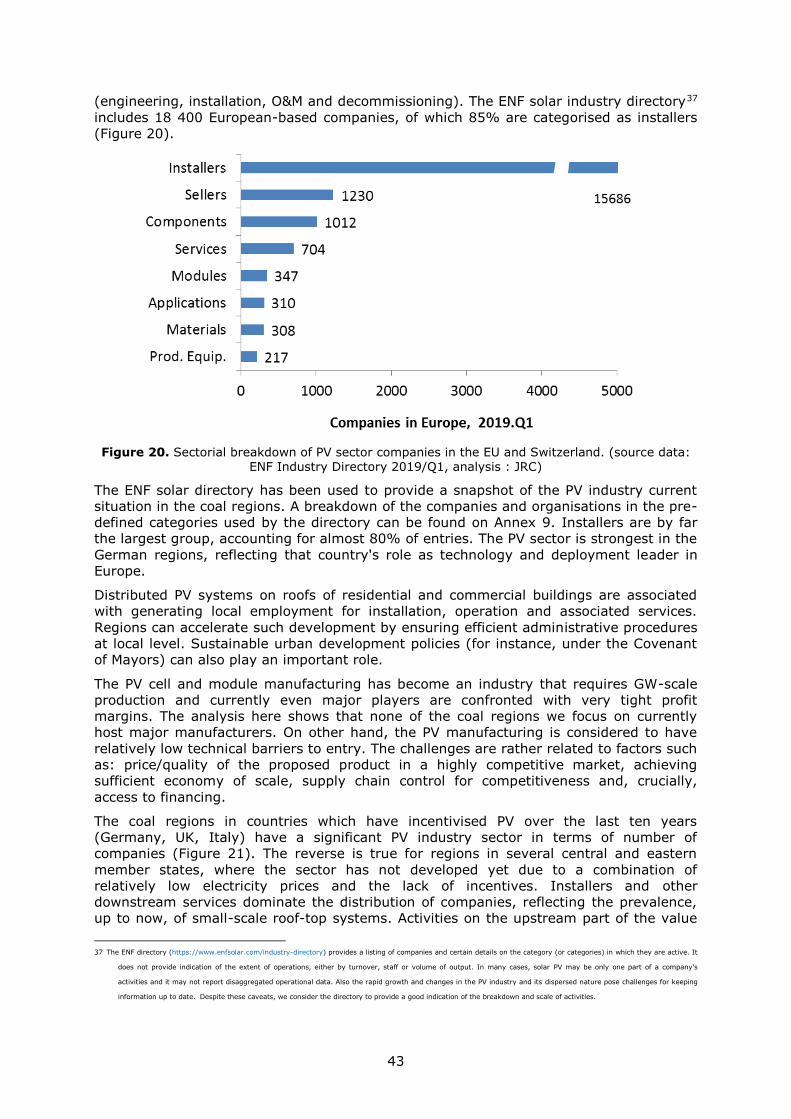
43
(engineering, installation, O&M and decommissioning). The ENF solar industry directory37
includes 18 400 European-based companies, of which 85% are categorised as installers
(Figure 20).
Figure 20. Sectorial breakdown of PV sector companies in the EU and Switzerland. (source data: ENF Industry Directory 2019/Q1, analysis : JRC)
The ENF solar directory has been used to provide a snapshot of the PV industry current
situation in the coal regions. A breakdown of the companies and organisations in the pre-
defined categories used by the directory can be found on Annex 9. Installers are by far
the largest group, accounting for almost 80% of entries. The PV sector is strongest in the
German regions, reflecting that country's role as technology and deployment leader in
Europe.
Distributed PV systems on roofs of residential and commercial buildings are associated
with generating local employment for installation, operation and associated services.
Regions can accelerate such development by ensuring efficient administrative procedures
at local level. Sustainable urban development policies (for instance, under the Covenant
of Mayors) can also play an important role.
The PV cell and module manufacturing has become an industry that requires GW-scale
production and currently even major players are confronted with very tight profit
margins. The analysis here shows that none of the coal regions we focus on currently
host major manufacturers. On other hand, the PV manufacturing is considered to have
relatively low technical barriers to entry. The challenges are rather related to factors such
as: price/quality of the proposed product in a highly competitive market, achieving
sufficient economy of scale, supply chain control for competitiveness and, crucially,
access to financing.
The coal regions in countries which have incentivised PV over the last ten years
(Germany, UK, Italy) have a significant PV industry sector in terms of number of
companies (Figure 21). The reverse is true for regions in several central and eastern
member states, where the sector has not developed yet due to a combination of
relatively low electricity prices and the lack of incentives. Installers and other
downstream services dominate the distribution of companies, reflecting the prevalence,
up to now, of small-scale roof-top systems. Activities on the upstream part of the value
37 The ENF directory (https://www.enfsolar.com/industry-directory) provides a listing of companies and certain details on the category (or categories) in which they are active. It
does not provide indication of the extent of operations, either by turnover, staff or volume of output. In many cases, solar PV may be only one part of a company's
activities and it may not report disaggregated operational data. Also the rapid growth and changes in the PV industry and its dispersed nature pose challenges for keeping information up to date. Despite these caveats, we consider the directory to provide a good indication of the breakdown and scale of activities.
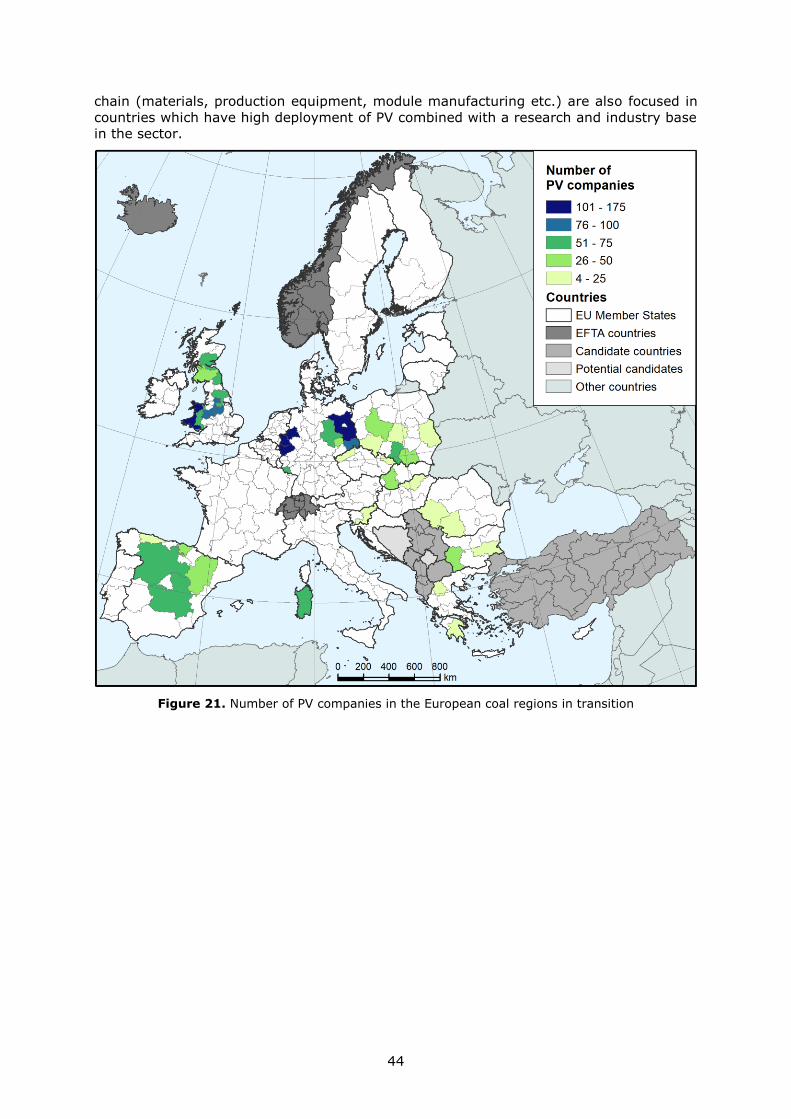
44
chain (materials, production equipment, module manufacturing etc.) are also focused in
countries which have high deployment of PV combined with a research and industry base
in the sector.
Figure 21. Number of PV companies in the European coal regions in transition
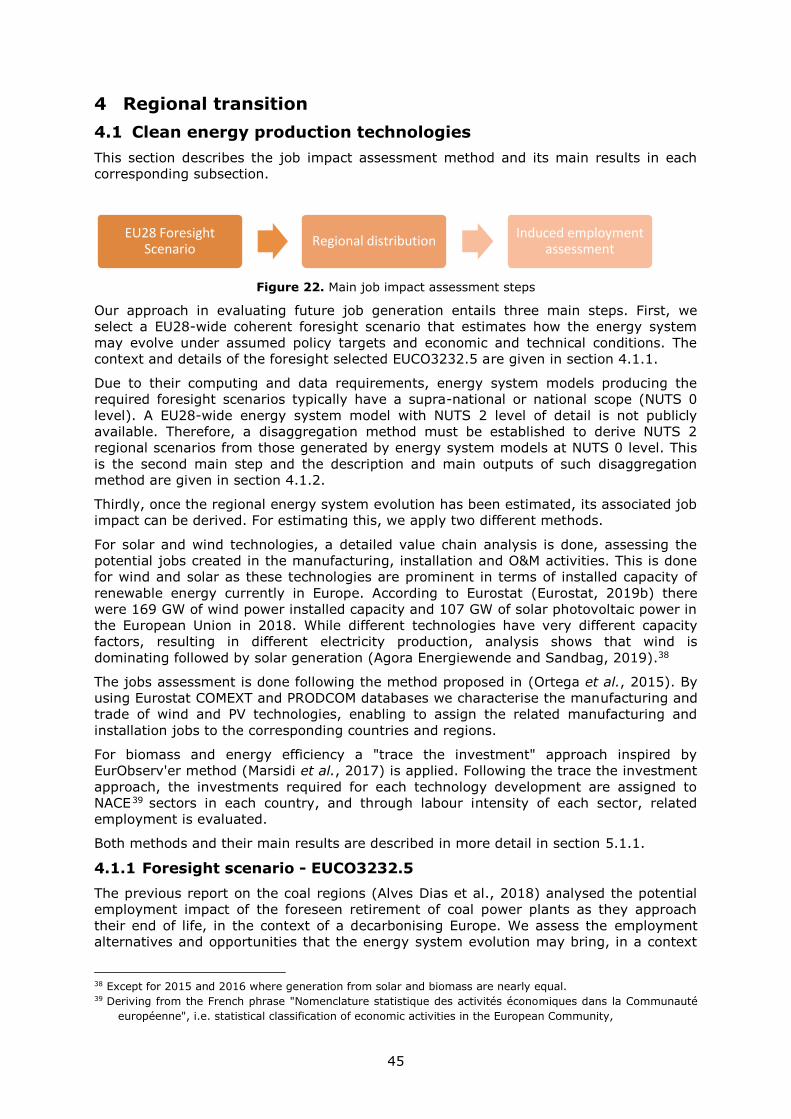
45
4 Regional transition
4.1 Clean energy production technologies
This section describes the job impact assessment method and its main results in each
corresponding subsection.
Figure 22. Main job impact assessment steps
Our approach in evaluating future job generation entails three main steps. First, we
select a EU28-wide coherent foresight scenario that estimates how the energy system
may evolve under assumed policy targets and economic and technical conditions. The
context and details of the foresight selected EUCO3232.5 are given in section 4.1.1.
Due to their computing and data requirements, energy system models producing the
required foresight scenarios typically have a supra-national or national scope (NUTS 0
level). A EU28-wide energy system model with NUTS 2 level of detail is not publicly
available. Therefore, a disaggregation method must be established to derive NUTS 2
regional scenarios from those generated by energy system models at NUTS 0 level. This
is the second main step and the description and main outputs of such disaggregation
method are given in section 4.1.2.
Thirdly, once the regional energy system evolution has been estimated, its associated job
impact can be derived. For estimating this, we apply two different methods.
For solar and wind technologies, a detailed value chain analysis is done, assessing the
potential jobs created in the manufacturing, installation and O&M activities. This is done
for wind and solar as these technologies are prominent in terms of installed capacity of
renewable energy currently in Europe. According to Eurostat (Eurostat, 2019b) there
were 169 GW of wind power installed capacity and 107 GW of solar photovoltaic power in
the European Union in 2018. While different technologies have very different capacity
factors, resulting in different electricity production, analysis shows that wind is
dominating followed by solar generation (Agora Energiewende and Sandbag, 2019).38
The jobs assessment is done following the method proposed in (Ortega et al., 2015). By
using Eurostat COMEXT and PRODCOM databases we characterise the manufacturing and
trade of wind and PV technologies, enabling to assign the related manufacturing and
installation jobs to the corresponding countries and regions.
For biomass and energy efficiency a "trace the investment" approach inspired by
EurObserv'er method (Marsidi et al., 2017) is applied. Following the trace the investment
approach, the investments required for each technology development are assigned to
NACE39 sectors in each country, and through labour intensity of each sector, related
employment is evaluated.
Both methods and their main results are described in more detail in section 5.1.1.
4.1.1 Foresight scenario - EUCO3232.5
The previous report on the coal regions (Alves Dias et al., 2018) analysed the potential
employment impact of the foreseen retirement of coal power plants as they approach
their end of life, in the context of a decarbonising Europe. We assess the employment
alternatives and opportunities that the energy system evolution may bring, in a context
38 Except for 2015 and 2016 where generation from solar and biomass are nearly equal. 39 Deriving from the French phrase "Nomenclature statistique des activités économiques dans la Communauté
européenne", i.e. statistical classification of economic activities in the European Community,
EU28 Foresight Scenario
Regional distributionInduced employment
assessment
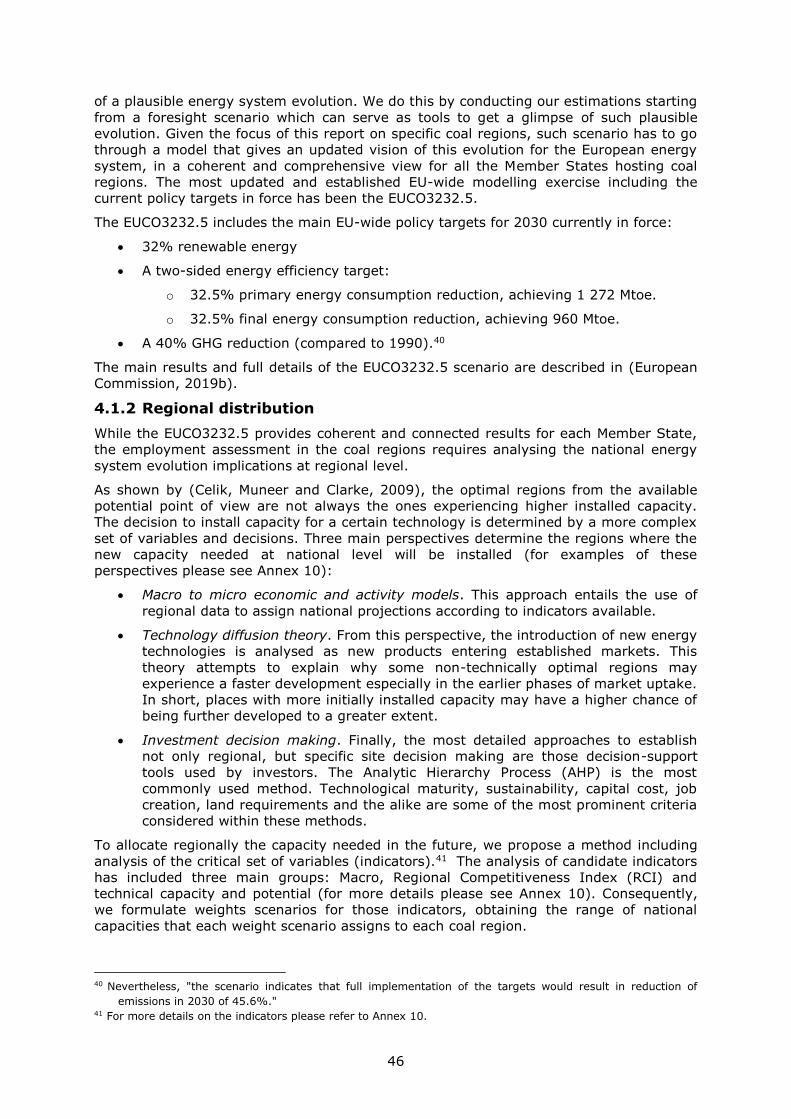
46
of a plausible energy system evolution. We do this by conducting our estimations starting
from a foresight scenario which can serve as tools to get a glimpse of such plausible
evolution. Given the focus of this report on specific coal regions, such scenario has to go
through a model that gives an updated vision of this evolution for the European energy
system, in a coherent and comprehensive view for all the Member States hosting coal
regions. The most updated and established EU-wide modelling exercise including the
current policy targets in force has been the EUCO3232.5.
The EUCO3232.5 includes the main EU-wide policy targets for 2030 currently in force:
32% renewable energy
A two-sided energy efficiency target:
o 32.5% primary energy consumption reduction, achieving 1 272 Mtoe.
o 32.5% final energy consumption reduction, achieving 960 Mtoe.
A 40% GHG reduction (compared to 1990).40
The main results and full details of the EUCO3232.5 scenario are described in (European
Commission, 2019b).
4.1.2 Regional distribution
While the EUCO3232.5 provides coherent and connected results for each Member State,
the employment assessment in the coal regions requires analysing the national energy
system evolution implications at regional level.
As shown by (Celik, Muneer and Clarke, 2009), the optimal regions from the available
potential point of view are not always the ones experiencing higher installed capacity.
The decision to install capacity for a certain technology is determined by a more complex
set of variables and decisions. Three main perspectives determine the regions where the
new capacity needed at national level will be installed (for examples of these
perspectives please see Annex 10):
Macro to micro economic and activity models. This approach entails the use of
regional data to assign national projections according to indicators available.
Technology diffusion theory. From this perspective, the introduction of new energy
technologies is analysed as new products entering established markets. This
theory attempts to explain why some non-technically optimal regions may
experience a faster development especially in the earlier phases of market uptake.
In short, places with more initially installed capacity may have a higher chance of
being further developed to a greater extent.
Investment decision making. Finally, the most detailed approaches to establish
not only regional, but specific site decision making are those decision-support
tools used by investors. The Analytic Hierarchy Process (AHP) is the most
commonly used method. Technological maturity, sustainability, capital cost, job
creation, land requirements and the alike are some of the most prominent criteria
considered within these methods.
To allocate regionally the capacity needed in the future, we propose a method including
analysis of the critical set of variables (indicators).41 The analysis of candidate indicators
has included three main groups: Macro, Regional Competitiveness Index (RCI) and
technical capacity and potential (for more details please see Annex 10). Consequently,
we formulate weights scenarios for those indicators, obtaining the range of national
capacities that each weight scenario assigns to each coal region.
40 Nevertheless, "the scenario indicates that full implementation of the targets would result in reduction of
emissions in 2030 of 45.6%." 41 For more details on the indicators please refer to Annex 10.
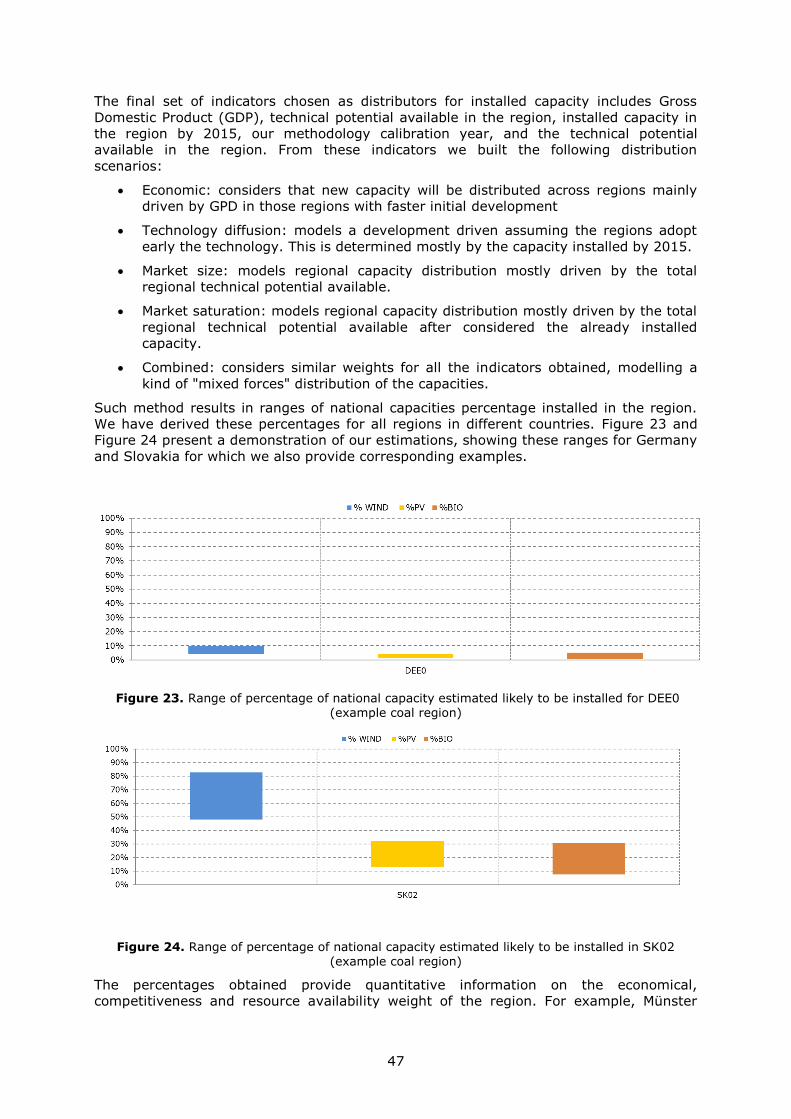
47
The final set of indicators chosen as distributors for installed capacity includes Gross
Domestic Product (GDP), technical potential available in the region, installed capacity in
the region by 2015, our methodology calibration year, and the technical potential
available in the region. From these indicators we built the following distribution
scenarios:
Economic: considers that new capacity will be distributed across regions mainly
driven by GPD in those regions with faster initial development
Technology diffusion: models a development driven assuming the regions adopt
early the technology. This is determined mostly by the capacity installed by 2015.
Market size: models regional capacity distribution mostly driven by the total
regional technical potential available.
Market saturation: models regional capacity distribution mostly driven by the total
regional technical potential available after considered the already installed
capacity.
Combined: considers similar weights for all the indicators obtained, modelling a
kind of "mixed forces" distribution of the capacities.
Such method results in ranges of national capacities percentage installed in the region.
We have derived these percentages for all regions in different countries. Figure 23 and
Figure 24 present a demonstration of our estimations, showing these ranges for Germany
and Slovakia for which we also provide corresponding examples.
Figure 23. Range of percentage of national capacity estimated likely to be installed for DEE0 (example coal region)
Figure 24. Range of percentage of national capacity estimated likely to be installed in SK02 (example coal region)
The percentages obtained provide quantitative information on the economical,
competitiveness and resource availability weight of the region. For example, Münster
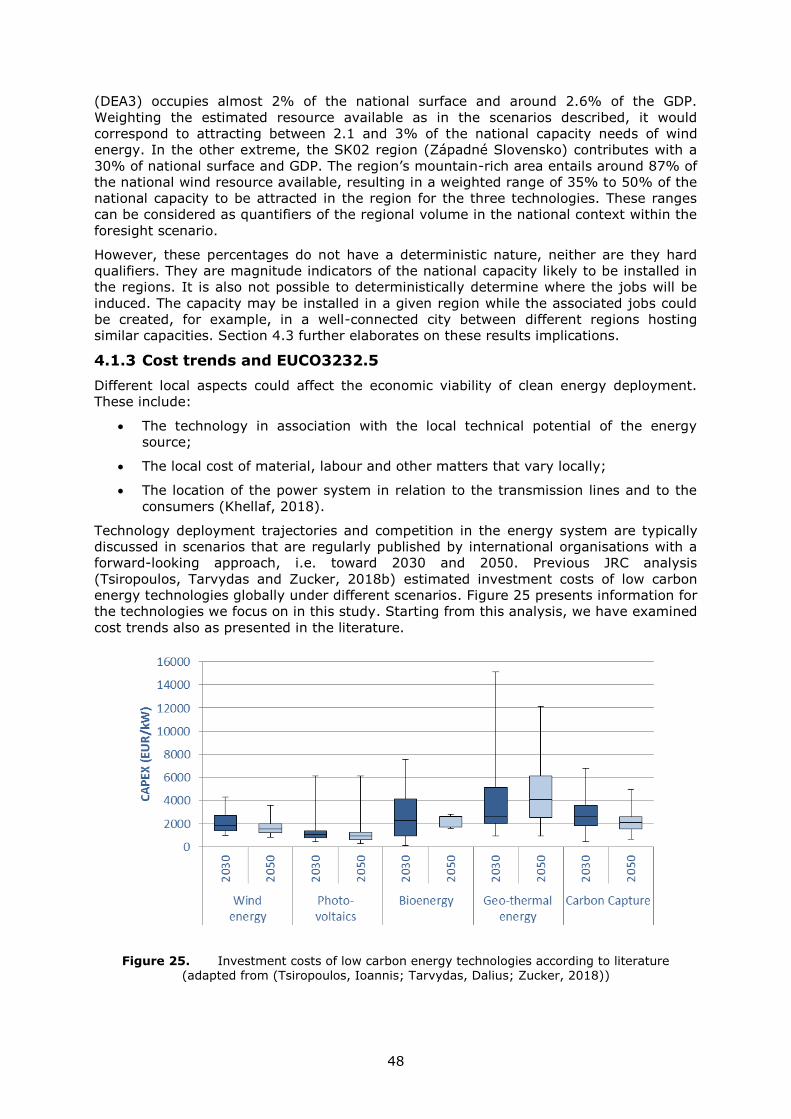
48
(DEA3) occupies almost 2% of the national surface and around 2.6% of the GDP.
Weighting the estimated resource available as in the scenarios described, it would
correspond to attracting between 2.1 and 3% of the national capacity needs of wind
energy. In the other extreme, the SK02 region (Západné Slovensko) contributes with a
30% of national surface and GDP. The region’s mountain-rich area entails around 87% of
the national wind resource available, resulting in a weighted range of 35% to 50% of the
national capacity to be attracted in the region for the three technologies. These ranges
can be considered as quantifiers of the regional volume in the national context within the
foresight scenario.
However, these percentages do not have a deterministic nature, neither are they hard
qualifiers. They are magnitude indicators of the national capacity likely to be installed in
the regions. It is also not possible to deterministically determine where the jobs will be
induced. The capacity may be installed in a given region while the associated jobs could
be created, for example, in a well-connected city between different regions hosting
similar capacities. Section 4.3 further elaborates on these results implications.
4.1.3 Cost trends and EUCO3232.5
Different local aspects could affect the economic viability of clean energy deployment.
These include:
The technology in association with the local technical potential of the energy
source;
The local cost of material, labour and other matters that vary locally;
The location of the power system in relation to the transmission lines and to the
consumers (Khellaf, 2018).
Technology deployment trajectories and competition in the energy system are typically
discussed in scenarios that are regularly published by international organisations with a
forward-looking approach, i.e. toward 2030 and 2050. Previous JRC analysis
(Tsiropoulos, Tarvydas and Zucker, 2018b) estimated investment costs of low carbon
energy technologies globally under different scenarios. Figure 25 presents information for
the technologies we focus on in this study. Starting from this analysis, we have examined
cost trends also as presented in the literature.
Figure 25. Investment costs of low carbon energy technologies according to literature (adapted from (Tsiropoulos, Ioannis; Tarvydas, Dalius; Zucker, 2018))
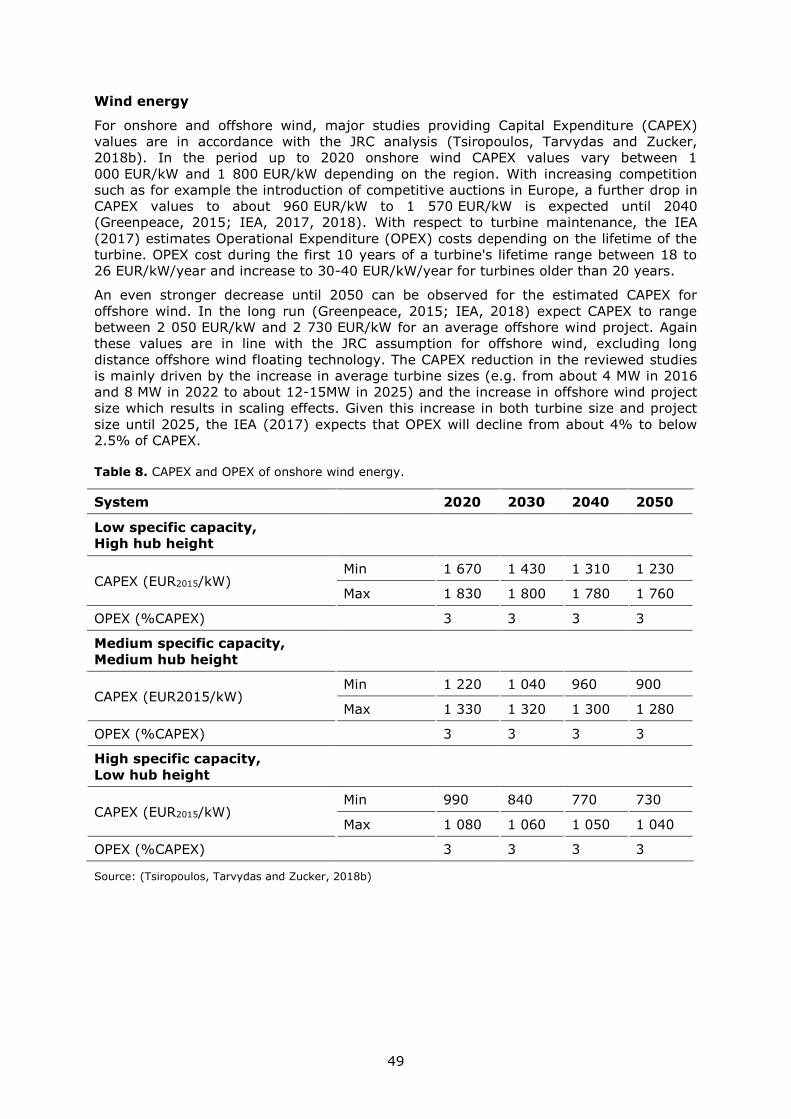
49
Wind energy
For onshore and offshore wind, major studies providing Capital Expenditure (CAPEX)
values are in accordance with the JRC analysis (Tsiropoulos, Tarvydas and Zucker,
2018b). In the period up to 2020 onshore wind CAPEX values vary between 1
000 EUR/kW and 1 800 EUR/kW depending on the region. With increasing competition
such as for example the introduction of competitive auctions in Europe, a further drop in
CAPEX values to about 960 EUR/kW to 1 570 EUR/kW is expected until 2040
(Greenpeace, 2015; IEA, 2017, 2018). With respect to turbine maintenance, the IEA
(2017) estimates Operational Expenditure (OPEX) costs depending on the lifetime of the
turbine. OPEX cost during the first 10 years of a turbine's lifetime range between 18 to
26 EUR/kW/year and increase to 30-40 EUR/kW/year for turbines older than 20 years.
An even stronger decrease until 2050 can be observed for the estimated CAPEX for
offshore wind. In the long run (Greenpeace, 2015; IEA, 2018) expect CAPEX to range
between 2 050 EUR/kW and 2 730 EUR/kW for an average offshore wind project. Again
these values are in line with the JRC assumption for offshore wind, excluding long
distance offshore wind floating technology. The CAPEX reduction in the reviewed studies
is mainly driven by the increase in average turbine sizes (e.g. from about 4 MW in 2016
and 8 MW in 2022 to about 12-15MW in 2025) and the increase in offshore wind project
size which results in scaling effects. Given this increase in both turbine size and project
size until 2025, the IEA (2017) expects that OPEX will decline from about 4% to below
2.5% of CAPEX.
Table 8. CAPEX and OPEX of onshore wind energy.
System 2020 2030 2040 2050
Low specific capacity,
High hub height
CAPEX (EUR2015/kW) Min 1 670 1 430 1 310 1 230
Max 1 830 1 800 1 780 1 760
OPEX (%CAPEX) 3 3 3 3
Medium specific capacity,
Medium hub height
CAPEX (EUR2015/kW) Min 1 220 1 040 960 900
Max 1 330 1 320 1 300 1 280
OPEX (%CAPEX) 3 3 3 3
High specific capacity,
Low hub height
CAPEX (EUR2015/kW) Min 990 840 770 730
Max 1 080 1 060 1 050 1 040
OPEX (%CAPEX) 3 3 3 3
Source: (Tsiropoulos, Tarvydas and Zucker, 2018b)
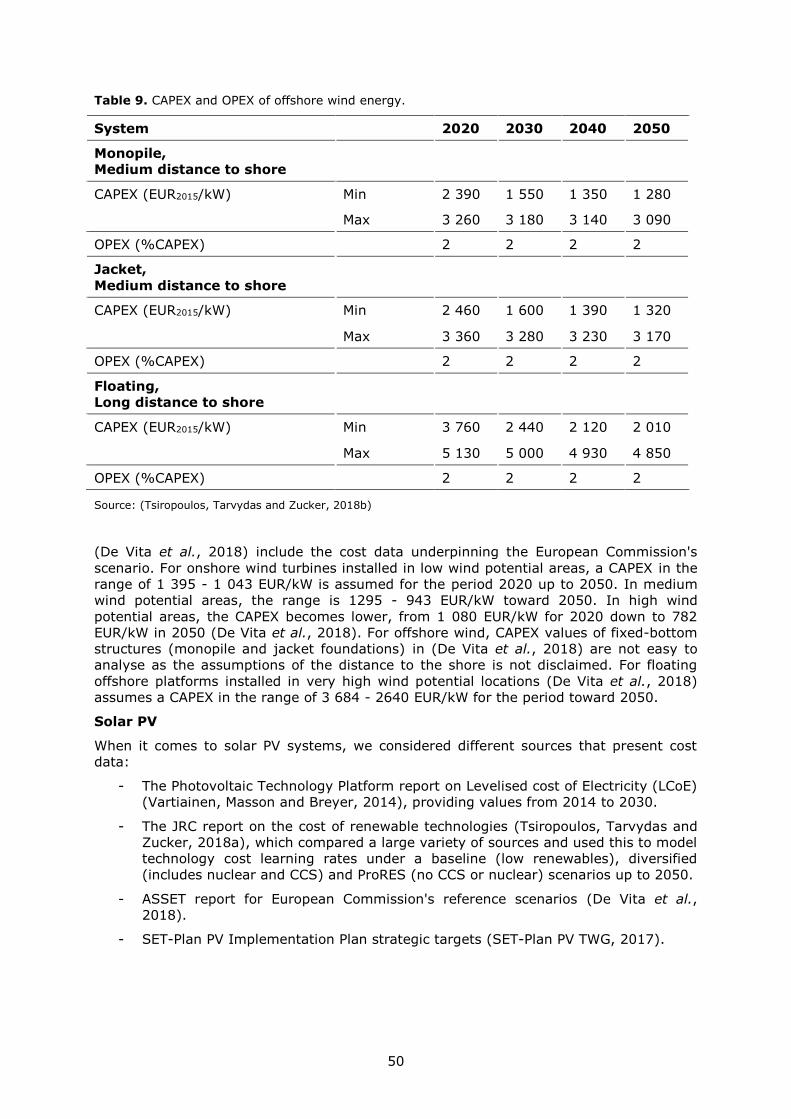
50
Table 9. CAPEX and OPEX of offshore wind energy.
System 2020 2030 2040 2050
Monopile,
Medium distance to shore
CAPEX (EUR2015/kW) Min 2 390 1 550 1 350 1 280
Max 3 260 3 180 3 140 3 090
OPEX (%CAPEX) 2 2 2 2
Jacket,
Medium distance to shore
CAPEX (EUR2015/kW) Min 2 460 1 600 1 390 1 320
Max 3 360 3 280 3 230 3 170
OPEX (%CAPEX) 2 2 2 2
Floating,
Long distance to shore
CAPEX (EUR2015/kW) Min 3 760 2 440 2 120 2 010
Max 5 130 5 000 4 930 4 850
OPEX (%CAPEX) 2 2 2 2
Source: (Tsiropoulos, Tarvydas and Zucker, 2018b)
(De Vita et al., 2018) include the cost data underpinning the European Commission's
scenario. For onshore wind turbines installed in low wind potential areas, a CAPEX in the
range of 1 395 - 1 043 EUR/kW is assumed for the period 2020 up to 2050. In medium
wind potential areas, the range is 1295 - 943 EUR/kW toward 2050. In high wind
potential areas, the CAPEX becomes lower, from 1 080 EUR/kW for 2020 down to 782
EUR/kW in 2050 (De Vita et al., 2018). For offshore wind, CAPEX values of fixed-bottom
structures (monopile and jacket foundations) in (De Vita et al., 2018) are not easy to
analyse as the assumptions of the distance to the shore is not disclaimed. For floating
offshore platforms installed in very high wind potential locations (De Vita et al., 2018)
assumes a CAPEX in the range of 3 684 - 2640 EUR/kW for the period toward 2050.
Solar PV
When it comes to solar PV systems, we considered different sources that present cost
data:
- The Photovoltaic Technology Platform report on Levelised cost of Electricity (LCoE)
(Vartiainen, Masson and Breyer, 2014), providing values from 2014 to 2030.
- The JRC report on the cost of renewable technologies (Tsiropoulos, Tarvydas and
Zucker, 2018a), which compared a large variety of sources and used this to model
technology cost learning rates under a baseline (low renewables), diversified
(includes nuclear and CCS) and ProRES (no CCS or nuclear) scenarios up to 2050.
- ASSET report for European Commission's reference scenarios (De Vita et al.,
2018).
- SET-Plan PV Implementation Plan strategic targets (SET-Plan PV TWG, 2017).
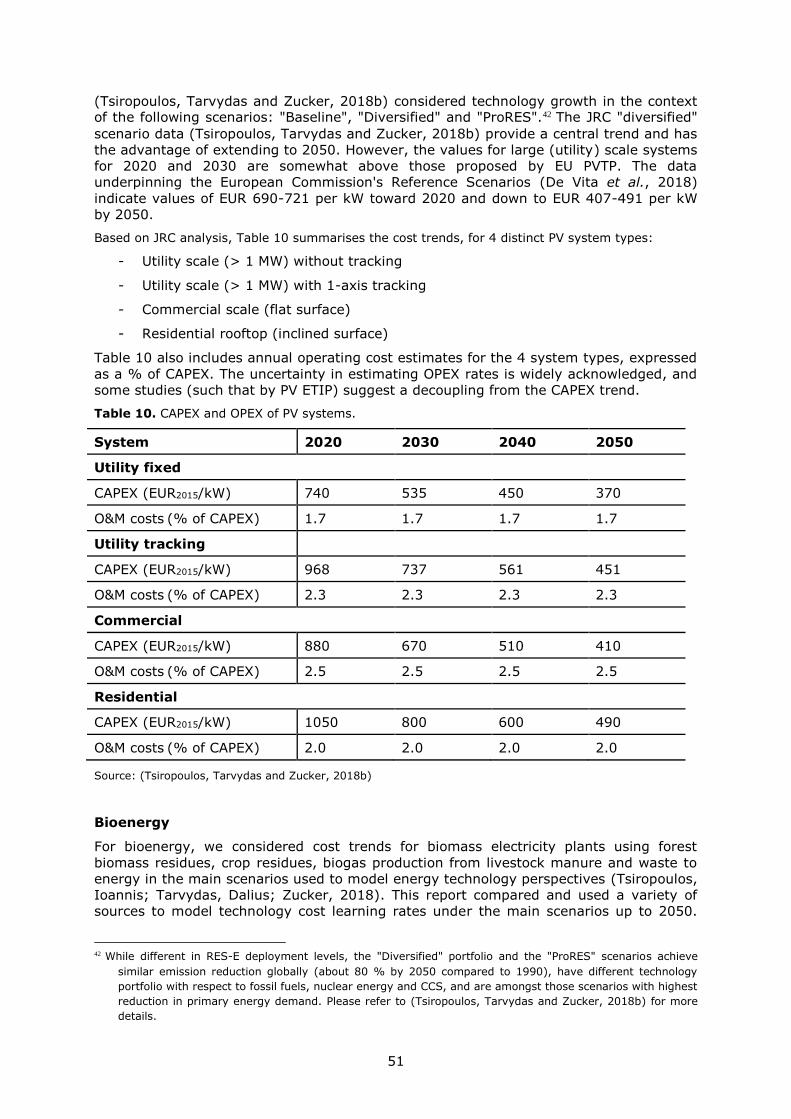
51
(Tsiropoulos, Tarvydas and Zucker, 2018b) considered technology growth in the context of the following scenarios: "Baseline", "Diversified" and "ProRES".42 The JRC "diversified"
scenario data (Tsiropoulos, Tarvydas and Zucker, 2018b) provide a central trend and has
the advantage of extending to 2050. However, the values for large (utility) scale systems
for 2020 and 2030 are somewhat above those proposed by EU PVTP. The data
underpinning the European Commission's Reference Scenarios (De Vita et al., 2018)
indicate values of EUR 690-721 per kW toward 2020 and down to EUR 407-491 per kW
by 2050.
Based on JRC analysis, Table 10 summarises the cost trends, for 4 distinct PV system types:
- Utility scale (> 1 MW) without tracking
- Utility scale (> 1 MW) with 1-axis tracking
- Commercial scale (flat surface)
- Residential rooftop (inclined surface)
Table 10 also includes annual operating cost estimates for the 4 system types, expressed
as a % of CAPEX. The uncertainty in estimating OPEX rates is widely acknowledged, and
some studies (such that by PV ETIP) suggest a decoupling from the CAPEX trend.
Table 10. CAPEX and OPEX of PV systems.
System 2020 2030 2040 2050
Utility fixed
CAPEX (EUR2015/kW) 740 535 450 370
O&M costs (% of CAPEX) 1.7 1.7 1.7 1.7
Utility tracking
CAPEX (EUR2015/kW) 968 737 561 451
O&M costs (% of CAPEX) 2.3 2.3 2.3 2.3
Commercial
CAPEX (EUR2015/kW) 880 670 510 410
O&M costs (% of CAPEX) 2.5 2.5 2.5 2.5
Residential
CAPEX (EUR2015/kW) 1050 800 600 490
O&M costs (% of CAPEX) 2.0 2.0 2.0 2.0
Source: (Tsiropoulos, Tarvydas and Zucker, 2018b)
Bioenergy
For bioenergy, we considered cost trends for biomass electricity plants using forest
biomass residues, crop residues, biogas production from livestock manure and waste to
energy in the main scenarios used to model energy technology perspectives (Tsiropoulos,
Ioannis; Tarvydas, Dalius; Zucker, 2018). This report compared and used a variety of
sources to model technology cost learning rates under the main scenarios up to 2050.
42 While different in RES-E deployment levels, the "Diversified" portfolio and the "ProRES" scenarios achieve
similar emission reduction globally (about 80 % by 2050 compared to 1990), have different technology
portfolio with respect to fossil fuels, nuclear energy and CCS, and are amongst those scenarios with highest
reduction in primary energy demand. Please refer to (Tsiropoulos, Tarvydas and Zucker, 2018b) for more
details.
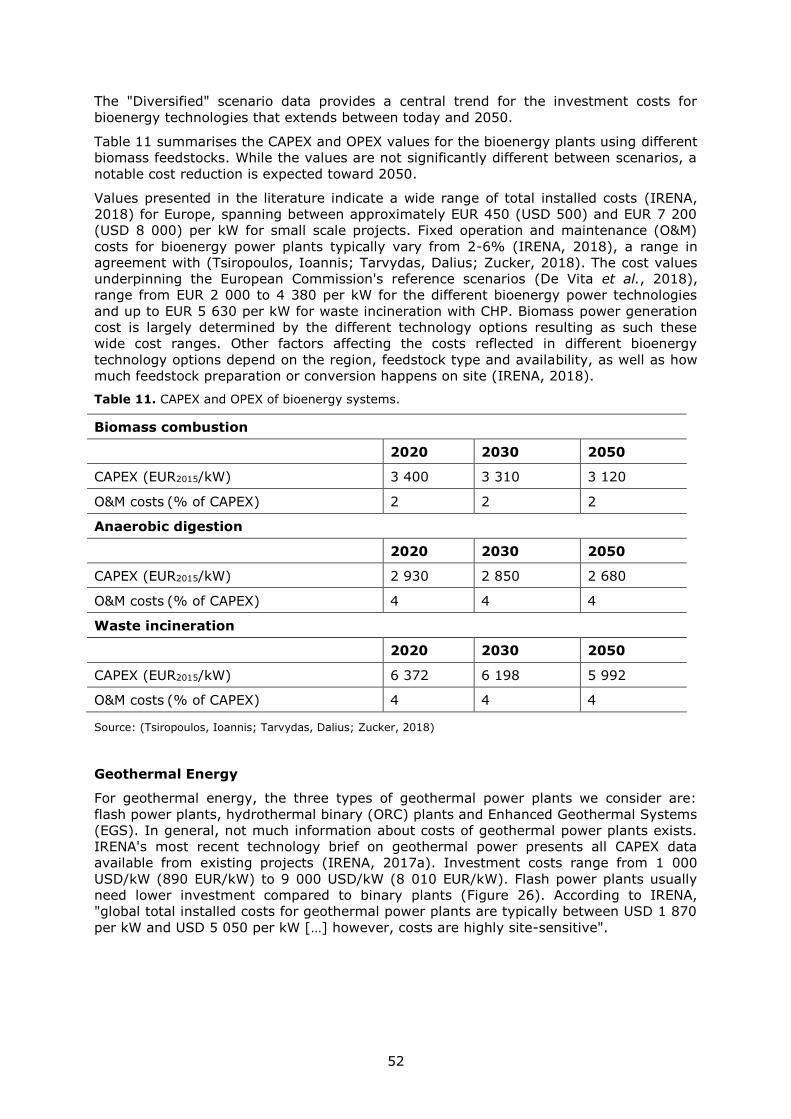
52
The "Diversified" scenario data provides a central trend for the investment costs for
bioenergy technologies that extends between today and 2050.
Table 11 summarises the CAPEX and OPEX values for the bioenergy plants using different
biomass feedstocks. While the values are not significantly different between scenarios, a
notable cost reduction is expected toward 2050.
Values presented in the literature indicate a wide range of total installed costs (IRENA,
2018) for Europe, spanning between approximately EUR 450 (USD 500) and EUR 7 200
(USD 8 000) per kW for small scale projects. Fixed operation and maintenance (O&M)
costs for bioenergy power plants typically vary from 2-6% (IRENA, 2018), a range in
agreement with (Tsiropoulos, Ioannis; Tarvydas, Dalius; Zucker, 2018). The cost values
underpinning the European Commission's reference scenarios (De Vita et al., 2018),
range from EUR 2 000 to 4 380 per kW for the different bioenergy power technologies
and up to EUR 5 630 per kW for waste incineration with CHP. Biomass power generation
cost is largely determined by the different technology options resulting as such these
wide cost ranges. Other factors affecting the costs reflected in different bioenergy
technology options depend on the region, feedstock type and availability, as well as how
much feedstock preparation or conversion happens on site (IRENA, 2018).
Table 11. CAPEX and OPEX of bioenergy systems.
Biomass combustion
2020 2030 2050
CAPEX (EUR2015/kW) 3 400 3 310 3 120
O&M costs (% of CAPEX) 2 2 2
Anaerobic digestion
2020 2030 2050
CAPEX (EUR2015/kW) 2 930 2 850 2 680
O&M costs (% of CAPEX) 4 4 4
Waste incineration
2020 2030 2050
CAPEX (EUR2015/kW) 6 372 6 198 5 992
O&M costs (% of CAPEX) 4 4 4
Source: (Tsiropoulos, Ioannis; Tarvydas, Dalius; Zucker, 2018)
Geothermal Energy
For geothermal energy, the three types of geothermal power plants we consider are:
flash power plants, hydrothermal binary (ORC) plants and Enhanced Geothermal Systems
(EGS). In general, not much information about costs of geothermal power plants exists.
IRENA's most recent technology brief on geothermal power presents all CAPEX data
available from existing projects (IRENA, 2017a). Investment costs range from 1 000
USD/kW (890 EUR/kW) to 9 000 USD/kW (8 010 EUR/kW). Flash power plants usually
need lower investment compared to binary plants (Figure 26). According to IRENA,
"global total installed costs for geothermal power plants are typically between USD 1 870
per kW and USD 5 050 per kW […] however, costs are highly site-sensitive".
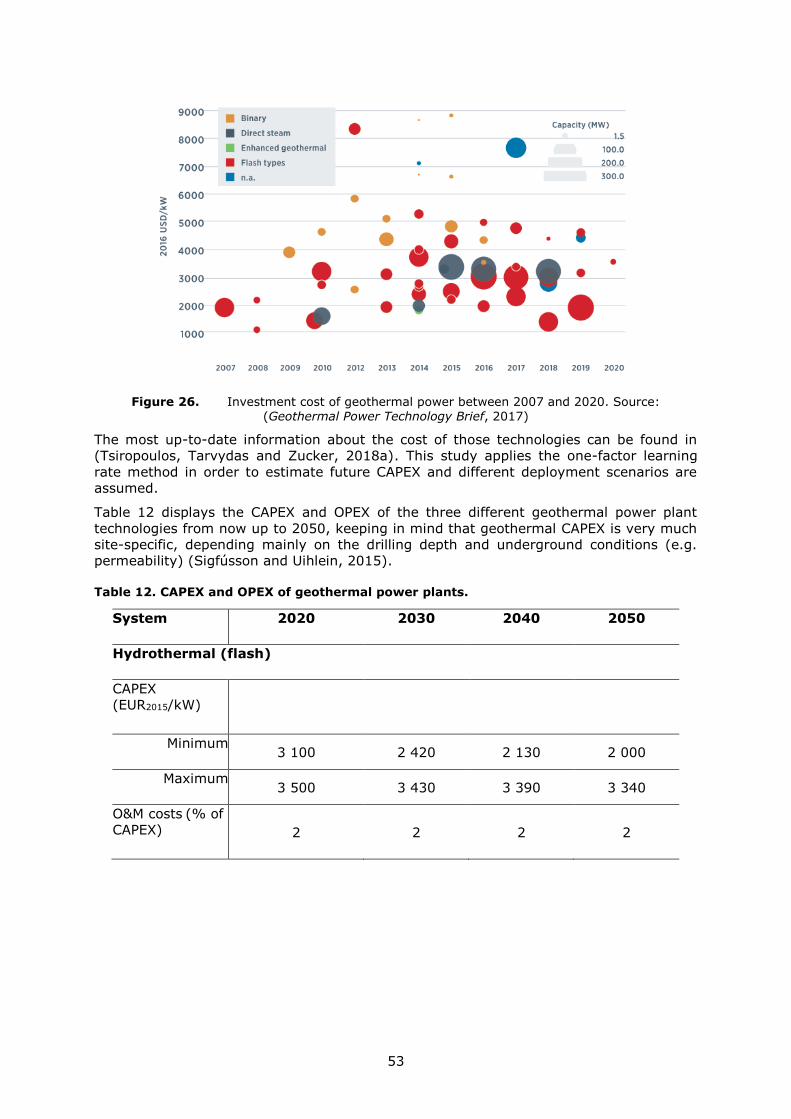
53
Figure 26. Investment cost of geothermal power between 2007 and 2020. Source: (Geothermal Power Technology Brief, 2017)
The most up-to-date information about the cost of those technologies can be found in
(Tsiropoulos, Tarvydas and Zucker, 2018a). This study applies the one-factor learning
rate method in order to estimate future CAPEX and different deployment scenarios are
assumed.
Table 12 displays the CAPEX and OPEX of the three different geothermal power plant
technologies from now up to 2050, keeping in mind that geothermal CAPEX is very much
site-specific, depending mainly on the drilling depth and underground conditions (e.g.
permeability) (Sigfússon and Uihlein, 2015).
Table 12. CAPEX and OPEX of geothermal power plants.
System 2020 2030 2040 2050
Hydrothermal (flash)
CAPEX
(EUR2015/kW)
Minimum 3 100 2 420 2 130 2 000
Maximum 3 500 3 430 3 390 3 340
O&M costs (% of
CAPEX) 2 2 2 2
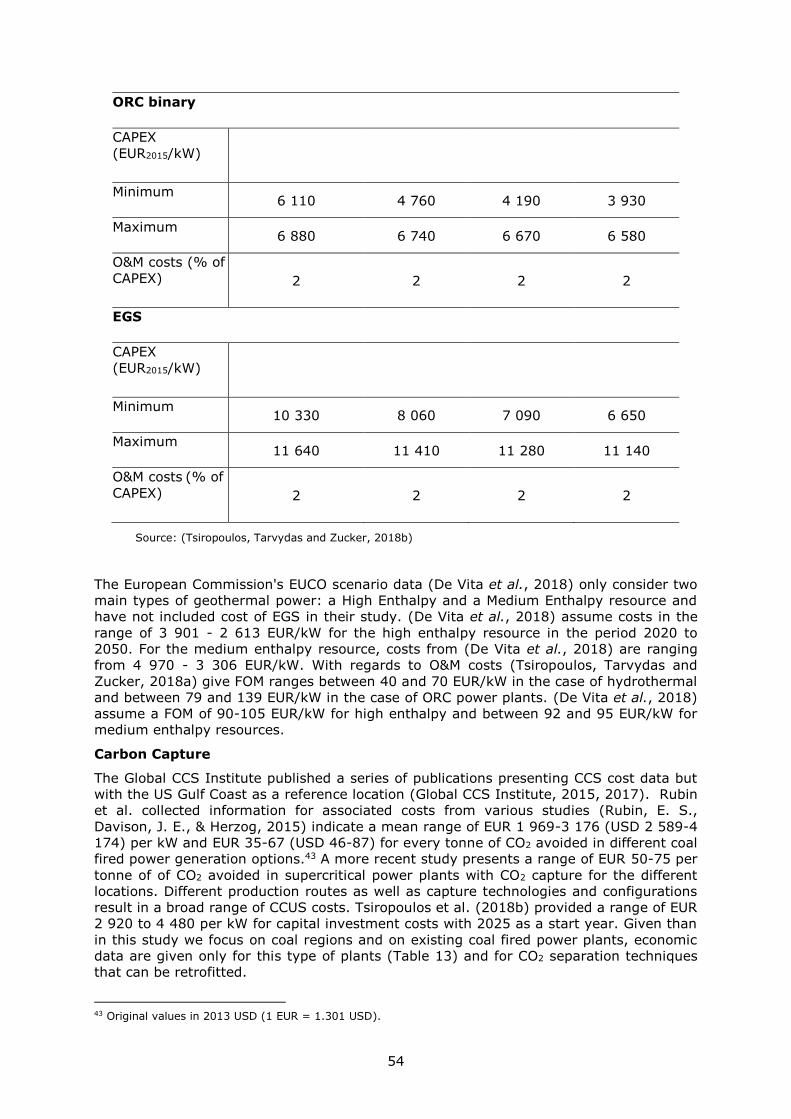
54
ORC binary
CAPEX
(EUR2015/kW)
Minimum 6 110 4 760 4 190 3 930
Maximum 6 880 6 740 6 670 6 580
O&M costs (% of
CAPEX) 2 2 2 2
EGS
CAPEX
(EUR2015/kW)
Minimum 10 330 8 060 7 090 6 650
Maximum 11 640 11 410 11 280 11 140
O&M costs (% of
CAPEX) 2 2 2 2
Source: (Tsiropoulos, Tarvydas and Zucker, 2018b)
The European Commission's EUCO scenario data (De Vita et al., 2018) only consider two
main types of geothermal power: a High Enthalpy and a Medium Enthalpy resource and
have not included cost of EGS in their study. (De Vita et al., 2018) assume costs in the
range of 3 901 - 2 613 EUR/kW for the high enthalpy resource in the period 2020 to
2050. For the medium enthalpy resource, costs from (De Vita et al., 2018) are ranging
from 4 970 - 3 306 EUR/kW. With regards to O&M costs (Tsiropoulos, Tarvydas and
Zucker, 2018a) give FOM ranges between 40 and 70 EUR/kW in the case of hydrothermal
and between 79 and 139 EUR/kW in the case of ORC power plants. (De Vita et al., 2018)
assume a FOM of 90-105 EUR/kW for high enthalpy and between 92 and 95 EUR/kW for
medium enthalpy resources.
Carbon Capture
The Global CCS Institute published a series of publications presenting CCS cost data but
with the US Gulf Coast as a reference location (Global CCS Institute, 2015, 2017). Rubin
et al. collected information for associated costs from various studies (Rubin, E. S.,
Davison, J. E., & Herzog, 2015) indicate a mean range of EUR 1 969-3 176 (USD 2 589-4
174) per kW and EUR 35-67 (USD 46-87) for every tonne of CO2 avoided in different coal
fired power generation options.43 A more recent study presents a range of EUR 50-75 per
tonne of of CO2 avoided in supercritical power plants with CO2 capture for the different
locations. Different production routes as well as capture technologies and configurations
result in a broad range of CCUS costs. Tsiropoulos et al. (2018b) provided a range of EUR
2 920 to 4 480 per kW for capital investment costs with 2025 as a start year. Given than
in this study we focus on coal regions and on existing coal fired power plants, economic
data are given only for this type of plants (Table 13) and for CO2 separation techniques
that can be retrofitted.
43 Original values in 2013 USD (1 EUR = 1.301 USD).
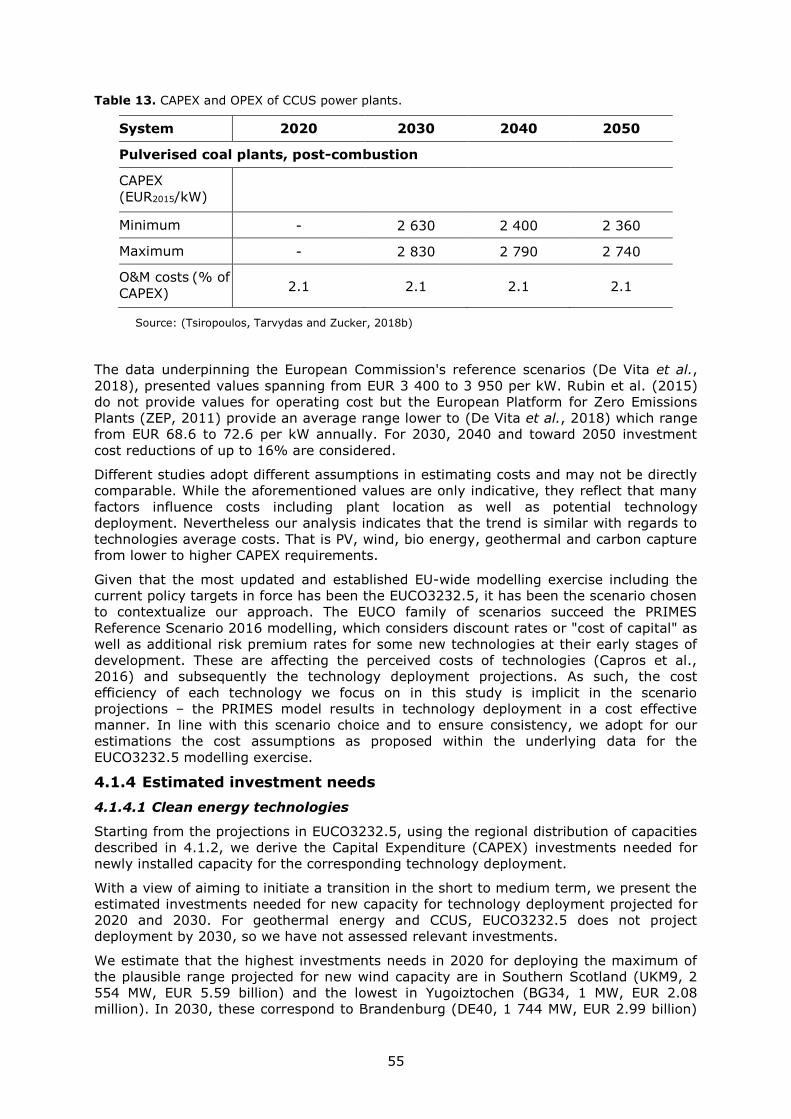
55
Table 13. CAPEX and OPEX of CCUS power plants.
System 2020 2030 2040 2050
Pulverised coal plants, post-combustion
CAPEX
(EUR2015/kW)
Minimum - 2 630 2 400 2 360
Maximum - 2 830 2 790 2 740
O&M costs (% of
CAPEX) 2.1 2.1 2.1 2.1
Source: (Tsiropoulos, Tarvydas and Zucker, 2018b)
The data underpinning the European Commission's reference scenarios (De Vita et al.,
2018), presented values spanning from EUR 3 400 to 3 950 per kW. Rubin et al. (2015)
do not provide values for operating cost but the European Platform for Zero Emissions
Plants (ZEP, 2011) provide an average range lower to (De Vita et al., 2018) which range
from EUR 68.6 to 72.6 per kW annually. For 2030, 2040 and toward 2050 investment
cost reductions of up to 16% are considered.
Different studies adopt different assumptions in estimating costs and may not be directly
comparable. While the aforementioned values are only indicative, they reflect that many
factors influence costs including plant location as well as potential technology
deployment. Nevertheless our analysis indicates that the trend is similar with regards to
technologies average costs. That is PV, wind, bio energy, geothermal and carbon capture
from lower to higher CAPEX requirements.
Given that the most updated and established EU-wide modelling exercise including the
current policy targets in force has been the EUCO3232.5, it has been the scenario chosen
to contextualize our approach. The EUCO family of scenarios succeed the PRIMES
Reference Scenario 2016 modelling, which considers discount rates or "cost of capital" as
well as additional risk premium rates for some new technologies at their early stages of
development. These are affecting the perceived costs of technologies (Capros et al.,
2016) and subsequently the technology deployment projections. As such, the cost
efficiency of each technology we focus on in this study is implicit in the scenario
projections – the PRIMES model results in technology deployment in a cost effective
manner. In line with this scenario choice and to ensure consistency, we adopt for our
estimations the cost assumptions as proposed within the underlying data for the
EUCO3232.5 modelling exercise.
4.1.4 Estimated investment needs
4.1.4.1 Clean energy technologies
Starting from the projections in EUCO3232.5, using the regional distribution of capacities
described in 4.1.2, we derive the Capital Expenditure (CAPEX) investments needed for
newly installed capacity for the corresponding technology deployment.
With a view of aiming to initiate a transition in the short to medium term, we present the
estimated investments needed for new capacity for technology deployment projected for
2020 and 2030. For geothermal energy and CCUS, EUCO3232.5 does not project
deployment by 2030, so we have not assessed relevant investments.
We estimate that the highest investments needs in 2020 for deploying the maximum of
the plausible range projected for new wind capacity are in Southern Scotland (UKM9, 2
554 MW, EUR 5.59 billion) and the lowest in Yugoiztochen (BG34, 1 MW, EUR 2.08
million). In 2030, these correspond to Brandenburg (DE40, 1 744 MW, EUR 2.99 billion)
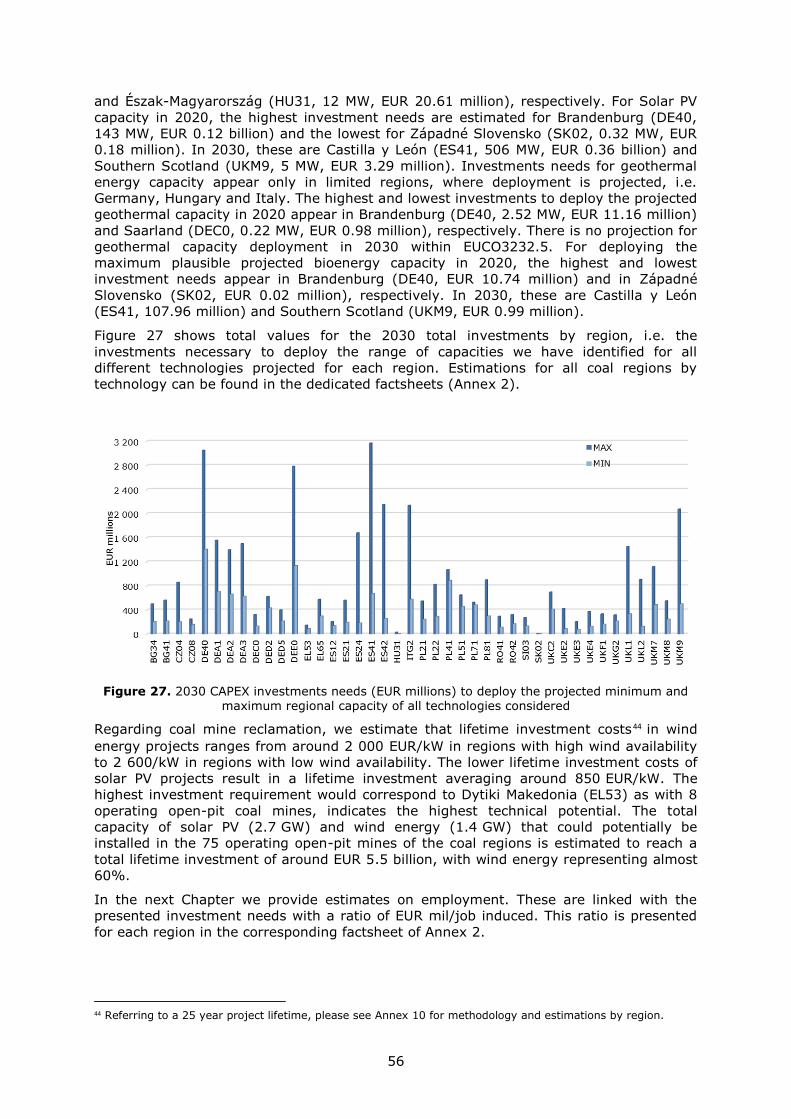
56
and Észak-Magyarország (HU31, 12 MW, EUR 20.61 million), respectively. For Solar PV
capacity in 2020, the highest investment needs are estimated for Brandenburg (DE40,
143 MW, EUR 0.12 billion) and the lowest for Západné Slovensko (SK02, 0.32 MW, EUR
0.18 million). In 2030, these are Castilla y León (ES41, 506 MW, EUR 0.36 billion) and
Southern Scotland (UKM9, 5 MW, EUR 3.29 million). Investments needs for geothermal
energy capacity appear only in limited regions, where deployment is projected, i.e.
Germany, Hungary and Italy. The highest and lowest investments to deploy the projected
geothermal capacity in 2020 appear in Brandenburg (DE40, 2.52 MW, EUR 11.16 million)
and Saarland (DEC0, 0.22 MW, EUR 0.98 million), respectively. There is no projection for
geothermal capacity deployment in 2030 within EUCO3232.5. For deploying the
maximum plausible projected bioenergy capacity in 2020, the highest and lowest
investment needs appear in Brandenburg (DE40, EUR 10.74 million) and in Západné
Slovensko (SK02, EUR 0.02 million), respectively. In 2030, these are Castilla y León
(ES41, 107.96 million) and Southern Scotland (UKM9, EUR 0.99 million).
Figure 27 shows total values for the 2030 total investments by region, i.e. the
investments necessary to deploy the range of capacities we have identified for all
different technologies projected for each region. Estimations for all coal regions by
technology can be found in the dedicated factsheets (Annex 2).
Figure 27. 2030 CAPEX investments needs (EUR millions) to deploy the projected minimum and maximum regional capacity of all technologies considered
Regarding coal mine reclamation, we estimate that lifetime investment costs44 in wind
energy projects ranges from around 2 000 EUR/kW in regions with high wind availability
to 2 600/kW in regions with low wind availability. The lower lifetime investment costs of
solar PV projects result in a lifetime investment averaging around 850 EUR/kW. The
highest investment requirement would correspond to Dytiki Makedonia (EL53) as with 8
operating open-pit coal mines, indicates the highest technical potential. The total
capacity of solar PV (2.7 GW) and wind energy (1.4 GW) that could potentially be
installed in the 75 operating open-pit mines of the coal regions is estimated to reach a
total lifetime investment of around EUR 5.5 billion, with wind energy representing almost
60%.
In the next Chapter we provide estimates on employment. These are linked with the
presented investment needs with a ratio of EUR mil/job induced. This ratio is presented
for each region in the corresponding factsheet of Annex 2.
44 Referring to a 25 year project lifetime, please see Annex 10 for methodology and estimations by region.
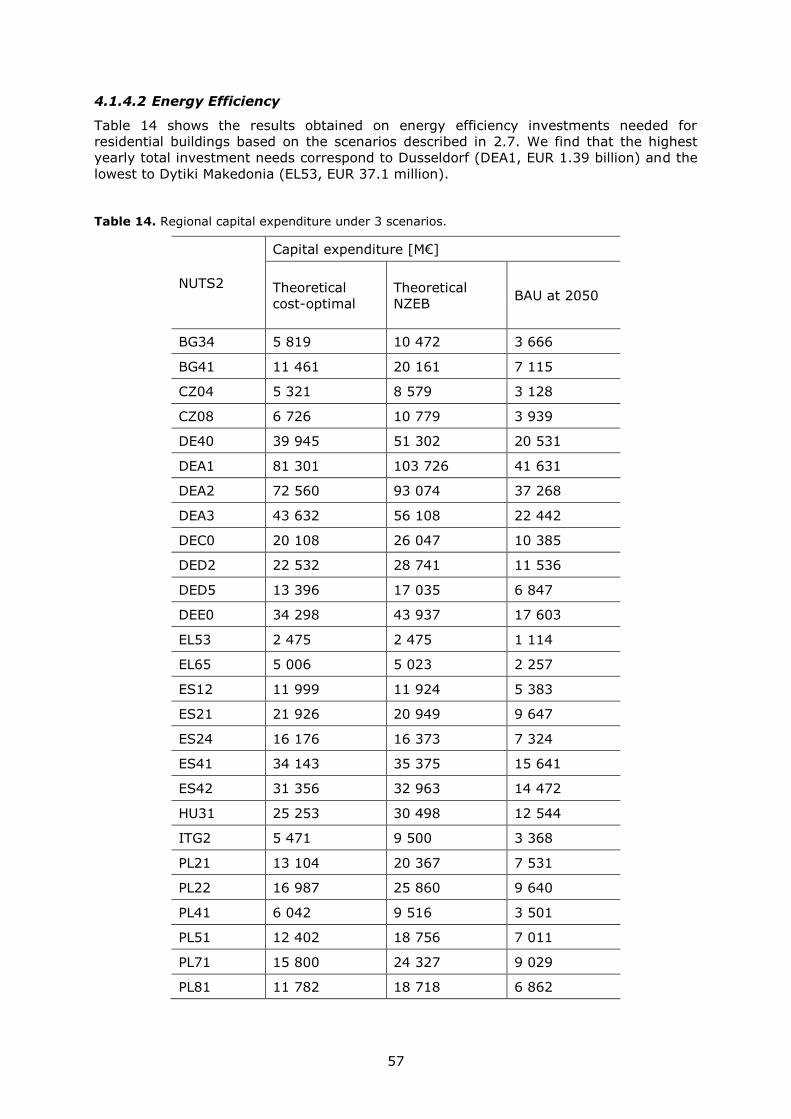
57
4.1.4.2 Energy Efficiency
Table 14 shows the results obtained on energy efficiency investments needed for
residential buildings based on the scenarios described in 2.7. We find that the highest
yearly total investment needs correspond to Dusseldorf (DEA1, EUR 1.39 billion) and the
lowest to Dytiki Makedonia (EL53, EUR 37.1 million).
Table 14. Regional capital expenditure under 3 scenarios.
NUTS2
Capital expenditure [M€]
Theoretical
cost-optimal
Theoretical
NZEB BAU at 2050
BG34 5 819 10 472 3 666
BG41 11 461 20 161 7 115
CZ04 5 321 8 579 3 128
CZ08 6 726 10 779 3 939
DE40 39 945 51 302 20 531
DEA1 81 301 103 726 41 631
DEA2 72 560 93 074 37 268
DEA3 43 632 56 108 22 442
DEC0 20 108 26 047 10 385
DED2 22 532 28 741 11 536
DED5 13 396 17 035 6 847
DEE0 34 298 43 937 17 603
EL53 2 475 2 475 1 114
EL65 5 006 5 023 2 257
ES12 11 999 11 924 5 383
ES21 21 926 20 949 9 647
ES24 16 176 16 373 7 324
ES41 34 143 35 375 15 641
ES42 31 356 32 963 14 472
HU31 25 253 30 498 12 544
ITG2 5 471 9 500 3 368
PL21 13 104 20 367 7 531
PL22 16 987 25 860 9 640
PL41 6 042 9 516 3 501
PL51 12 402 18 756 7 011
PL71 15 800 24 327 9 029
PL81 11 782 18 718 6 862
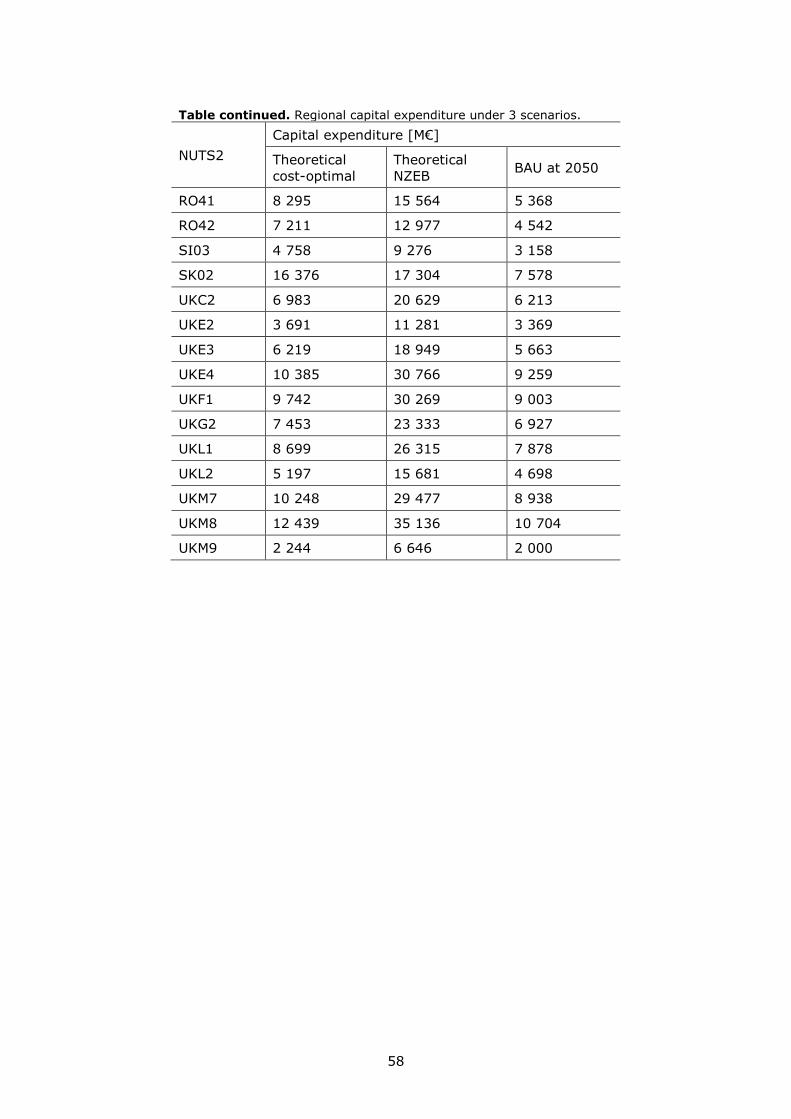
58
Table continued. Regional capital expenditure under 3 scenarios.
NUTS2
Capital expenditure [M€]
Theoretical
cost-optimal
Theoretical
NZEB BAU at 2050
RO41 8 295 15 564 5 368
RO42 7 211 12 977 4 542
SI03 4 758 9 276 3 158
SK02 16 376 17 304 7 578
UKC2 6 983 20 629 6 213
UKE2 3 691 11 281 3 369
UKE3 6 219 18 949 5 663
UKE4 10 385 30 766 9 259
UKF1 9 742 30 269 9 003
UKG2 7 453 23 333 6 927
UKL1 8 699 26 315 7 878
UKL2 5 197 15 681 4 698
UKM7 10 248 29 477 8 938
UKM8 12 439 35 136 10 704
UKM9 2 244 6 646 2 000
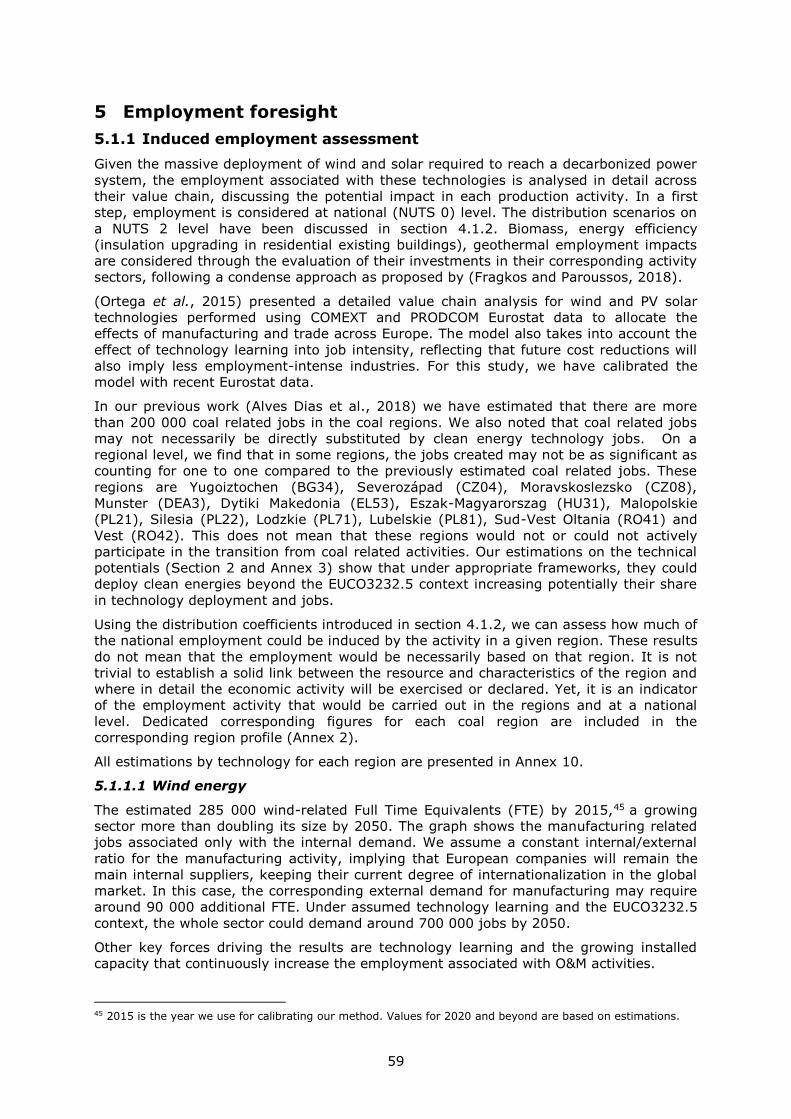
59
5 Employment foresight
5.1.1 Induced employment assessment
Given the massive deployment of wind and solar required to reach a decarbonized power
system, the employment associated with these technologies is analysed in detail across
their value chain, discussing the potential impact in each production activity. In a first
step, employment is considered at national (NUTS 0) level. The distribution scenarios on
a NUTS 2 level have been discussed in section 4.1.2. Biomass, energy efficiency
(insulation upgrading in residential existing buildings), geothermal employment impacts
are considered through the evaluation of their investments in their corresponding activity
sectors, following a condense approach as proposed by (Fragkos and Paroussos, 2018).
(Ortega et al., 2015) presented a detailed value chain analysis for wind and PV solar
technologies performed using COMEXT and PRODCOM Eurostat data to allocate the
effects of manufacturing and trade across Europe. The model also takes into account the
effect of technology learning into job intensity, reflecting that future cost reductions will
also imply less employment-intense industries. For this study, we have calibrated the
model with recent Eurostat data.
In our previous work (Alves Dias et al., 2018) we have estimated that there are more
than 200 000 coal related jobs in the coal regions. We also noted that coal related jobs
may not necessarily be directly substituted by clean energy technology jobs. On a
regional level, we find that in some regions, the jobs created may not be as significant as
counting for one to one compared to the previously estimated coal related jobs. These
regions are Yugoiztochen (BG34), Severozápad (CZ04), Moravskoslezsko (CZ08),
Munster (DEA3), Dytiki Makedonia (EL53), Eszak-Magyarorszag (HU31), Malopolskie
(PL21), Silesia (PL22), Lodzkie (PL71), Lubelskie (PL81), Sud-Vest Oltania (RO41) and
Vest (RO42). This does not mean that these regions would not or could not actively
participate in the transition from coal related activities. Our estimations on the technical
potentials (Section 2 and Annex 3) show that under appropriate frameworks, they could
deploy clean energies beyond the EUCO3232.5 context increasing potentially their share
in technology deployment and jobs.
Using the distribution coefficients introduced in section 4.1.2, we can assess how much of
the national employment could be induced by the activity in a given region. These results
do not mean that the employment would be necessarily based on that region. It is not
trivial to establish a solid link between the resource and characteristics of the region and
where in detail the economic activity will be exercised or declared. Yet, it is an indicator
of the employment activity that would be carried out in the regions and at a national
level. Dedicated corresponding figures for each coal region are included in the
corresponding region profile (Annex 2).
All estimations by technology for each region are presented in Annex 10.
5.1.1.1 Wind energy
The estimated 285 000 wind-related Full Time Equivalents (FTE) by 2015,45 a growing
sector more than doubling its size by 2050. The graph shows the manufacturing related
jobs associated only with the internal demand. We assume a constant internal/external
ratio for the manufacturing activity, implying that European companies will remain the
main internal suppliers, keeping their current degree of internationalization in the global
market. In this case, the corresponding external demand for manufacturing may require
around 90 000 additional FTE. Under assumed technology learning and the EUCO3232.5
context, the whole sector could demand around 700 000 jobs by 2050.
Other key forces driving the results are technology learning and the growing installed
capacity that continuously increase the employment associated with O&M activities.
45 2015 is the year we use for calibrating our method. Values for 2020 and beyond are based on estimations.
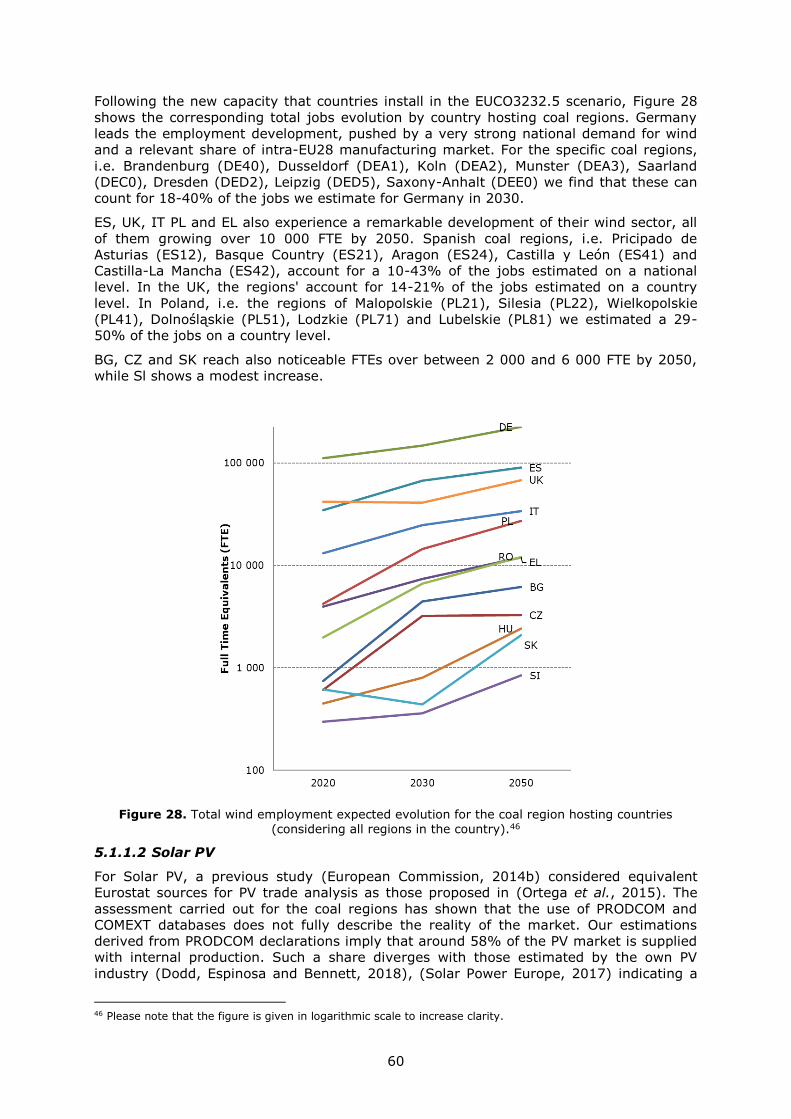
60
Following the new capacity that countries install in the EUCO3232.5 scenario, Figure 28
shows the corresponding total jobs evolution by country hosting coal regions. Germany
leads the employment development, pushed by a very strong national demand for wind
and a relevant share of intra-EU28 manufacturing market. For the specific coal regions,
i.e. Brandenburg (DE40), Dusseldorf (DEA1), Koln (DEA2), Munster (DEA3), Saarland
(DEC0), Dresden (DED2), Leipzig (DED5), Saxony-Anhalt (DEE0) we find that these can
count for 18-40% of the jobs we estimate for Germany in 2030.
ES, UK, IT PL and EL also experience a remarkable development of their wind sector, all
of them growing over 10 000 FTE by 2050. Spanish coal regions, i.e. Pricipado de
Asturias (ES12), Basque Country (ES21), Aragon (ES24), Castilla y León (ES41) and
Castilla-La Mancha (ES42), account for a 10-43% of the jobs estimated on a national
level. In the UK, the regions' account for 14-21% of the jobs estimated on a country
level. In Poland, i.e. the regions of Malopolskie (PL21), Silesia (PL22), Wielkopolskie
(PL41), Dolnośląskie (PL51), Lodzkie (PL71) and Lubelskie (PL81) we estimated a 29-
50% of the jobs on a country level.
BG, CZ and SK reach also noticeable FTEs over between 2 000 and 6 000 FTE by 2050,
while Sl shows a modest increase.
Figure 28. Total wind employment expected evolution for the coal region hosting countries
(considering all regions in the country).46
5.1.1.2 Solar PV
For Solar PV, a previous study (European Commission, 2014b) considered equivalent
Eurostat sources for PV trade analysis as those proposed in (Ortega et al., 2015). The
assessment carried out for the coal regions has shown that the use of PRODCOM and
COMEXT databases does not fully describe the reality of the market. Our estimations
derived from PRODCOM declarations imply that around 58% of the PV market is supplied
with internal production. Such a share diverges with those estimated by the own PV
industry (Dodd, Espinosa and Bennett, 2018), (Solar Power Europe, 2017) indicating a
46 Please note that the figure is given in logarithmic scale to increase clarity.
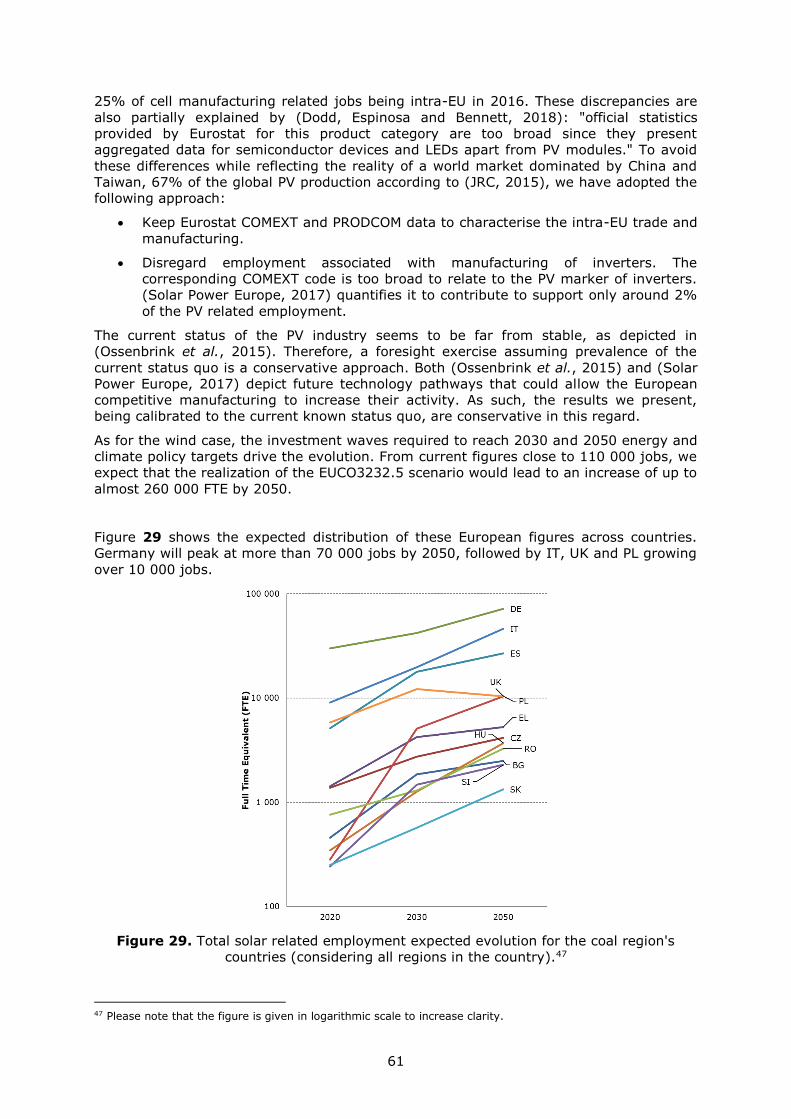
61
25% of cell manufacturing related jobs being intra-EU in 2016. These discrepancies are
also partially explained by (Dodd, Espinosa and Bennett, 2018): "official statistics
provided by Eurostat for this product category are too broad since they present
aggregated data for semiconductor devices and LEDs apart from PV modules." To avoid
these differences while reflecting the reality of a world market dominated by China and
Taiwan, 67% of the global PV production according to (JRC, 2015), we have adopted the
following approach:
Keep Eurostat COMEXT and PRODCOM data to characterise the intra-EU trade and
manufacturing.
Disregard employment associated with manufacturing of inverters. The
corresponding COMEXT code is too broad to relate to the PV marker of inverters.
(Solar Power Europe, 2017) quantifies it to contribute to support only around 2%
of the PV related employment.
The current status of the PV industry seems to be far from stable, as depicted in
(Ossenbrink et al., 2015). Therefore, a foresight exercise assuming prevalence of the
current status quo is a conservative approach. Both (Ossenbrink et al., 2015) and (Solar
Power Europe, 2017) depict future technology pathways that could allow the European
competitive manufacturing to increase their activity. As such, the results we present,
being calibrated to the current known status quo, are conservative in this regard.
As for the wind case, the investment waves required to reach 2030 and 2050 energy and
climate policy targets drive the evolution. From current figures close to 110 000 jobs, we
expect that the realization of the EUCO3232.5 scenario would lead to an increase of up to
almost 260 000 FTE by 2050.
Figure 29 shows the expected distribution of these European figures across countries.
Germany will peak at more than 70 000 jobs by 2050, followed by IT, UK and PL growing
over 10 000 jobs.
Figure 29. Total solar related employment expected evolution for the coal region's
countries (considering all regions in the country).47
47 Please note that the figure is given in logarithmic scale to increase clarity.
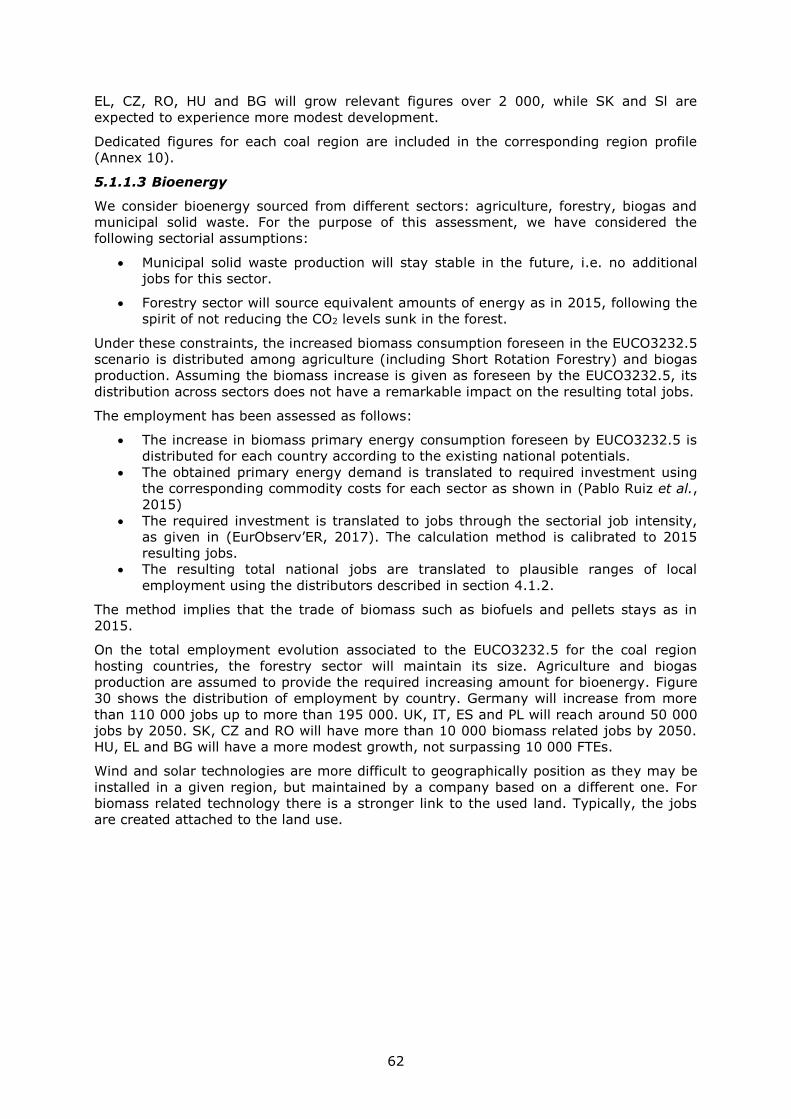
62
EL, CZ, RO, HU and BG will grow relevant figures over 2 000, while SK and Sl are
expected to experience more modest development.
Dedicated figures for each coal region are included in the corresponding region profile
(Annex 10).
5.1.1.3 Bioenergy
We consider bioenergy sourced from different sectors: agriculture, forestry, biogas and
municipal solid waste. For the purpose of this assessment, we have considered the
following sectorial assumptions:
Municipal solid waste production will stay stable in the future, i.e. no additional
jobs for this sector.
Forestry sector will source equivalent amounts of energy as in 2015, following the
spirit of not reducing the CO2 levels sunk in the forest.
Under these constraints, the increased biomass consumption foreseen in the EUCO3232.5
scenario is distributed among agriculture (including Short Rotation Forestry) and biogas
production. Assuming the biomass increase is given as foreseen by the EUCO3232.5, its
distribution across sectors does not have a remarkable impact on the resulting total jobs.
The employment has been assessed as follows:
The increase in biomass primary energy consumption foreseen by EUCO3232.5 is
distributed for each country according to the existing national potentials.
The obtained primary energy demand is translated to required investment using
the corresponding commodity costs for each sector as shown in (Pablo Ruiz et al.,
2015)
The required investment is translated to jobs through the sectorial job intensity,
as given in (EurObserv’ER, 2017). The calculation method is calibrated to 2015
resulting jobs.
The resulting total national jobs are translated to plausible ranges of local
employment using the distributors described in section 4.1.2.
The method implies that the trade of biomass such as biofuels and pellets stays as in
2015.
On the total employment evolution associated to the EUCO3232.5 for the coal region
hosting countries, the forestry sector will maintain its size. Agriculture and biogas
production are assumed to provide the required increasing amount for bioenergy. Figure
30 shows the distribution of employment by country. Germany will increase from more
than 110 000 jobs up to more than 195 000. UK, IT, ES and PL will reach around 50 000
jobs by 2050. SK, CZ and RO will have more than 10 000 biomass related jobs by 2050.
HU, EL and BG will have a more modest growth, not surpassing 10 000 FTEs.
Wind and solar technologies are more difficult to geographically position as they may be
installed in a given region, but maintained by a company based on a different one. For
biomass related technology there is a stronger link to the used land. Typically, the jobs
are created attached to the land use.
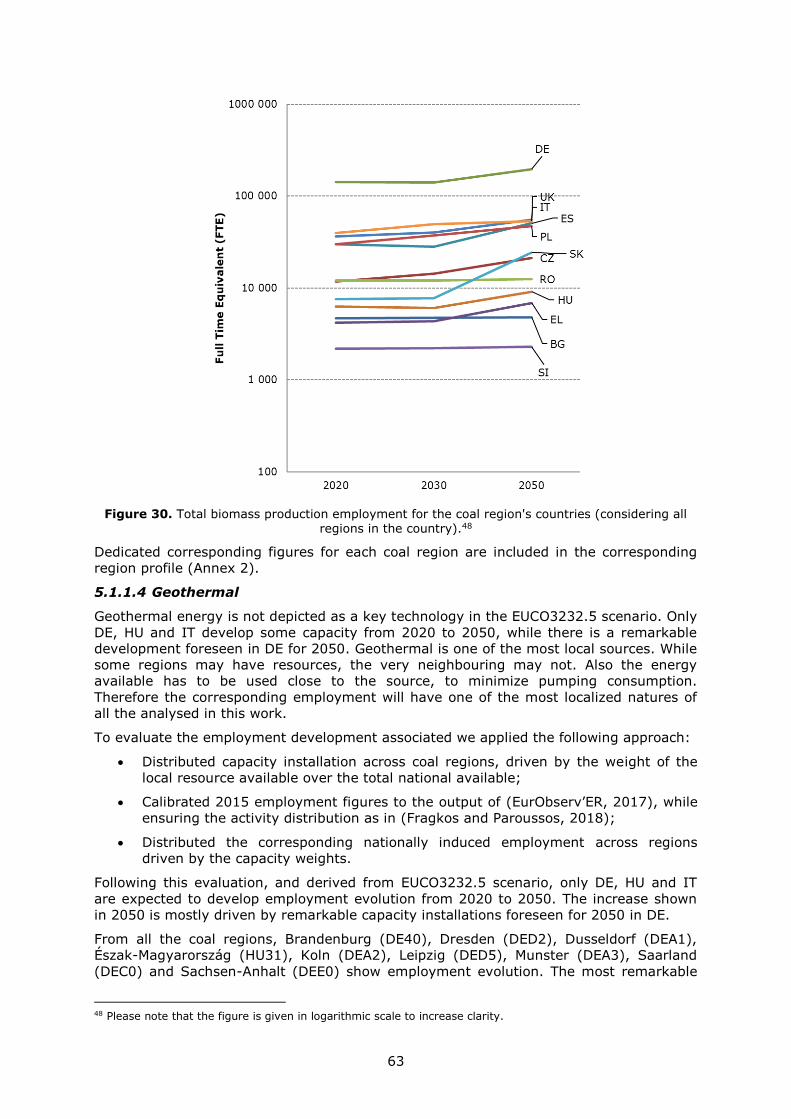
63
Figure 30. Total biomass production employment for the coal region's countries (considering all regions in the country).48
Dedicated corresponding figures for each coal region are included in the corresponding
region profile (Annex 2).
5.1.1.4 Geothermal
Geothermal energy is not depicted as a key technology in the EUCO3232.5 scenario. Only
DE, HU and IT develop some capacity from 2020 to 2050, while there is a remarkable
development foreseen in DE for 2050. Geothermal is one of the most local sources. While
some regions may have resources, the very neighbouring may not. Also the energy
available has to be used close to the source, to minimize pumping consumption.
Therefore the corresponding employment will have one of the most localized natures of
all the analysed in this work.
To evaluate the employment development associated we applied the following approach:
Distributed capacity installation across coal regions, driven by the weight of the
local resource available over the total national available;
Calibrated 2015 employment figures to the output of (EurObserv’ER, 2017), while
ensuring the activity distribution as in (Fragkos and Paroussos, 2018);
Distributed the corresponding nationally induced employment across regions
driven by the capacity weights.
Following this evaluation, and derived from EUCO3232.5 scenario, only DE, HU and IT
are expected to develop employment evolution from 2020 to 2050. The increase shown
in 2050 is mostly driven by remarkable capacity installations foreseen for 2050 in DE.
From all the coal regions, Brandenburg (DE40), Dresden (DED2), Dusseldorf (DEA1),
Észak-Magyarország (HU31), Koln (DEA2), Leipzig (DED5), Munster (DEA3), Saarland
(DEC0) and Sachsen-Anhalt (DEE0) show employment evolution. The most remarkable
48 Please note that the figure is given in logarithmic scale to increase clarity.
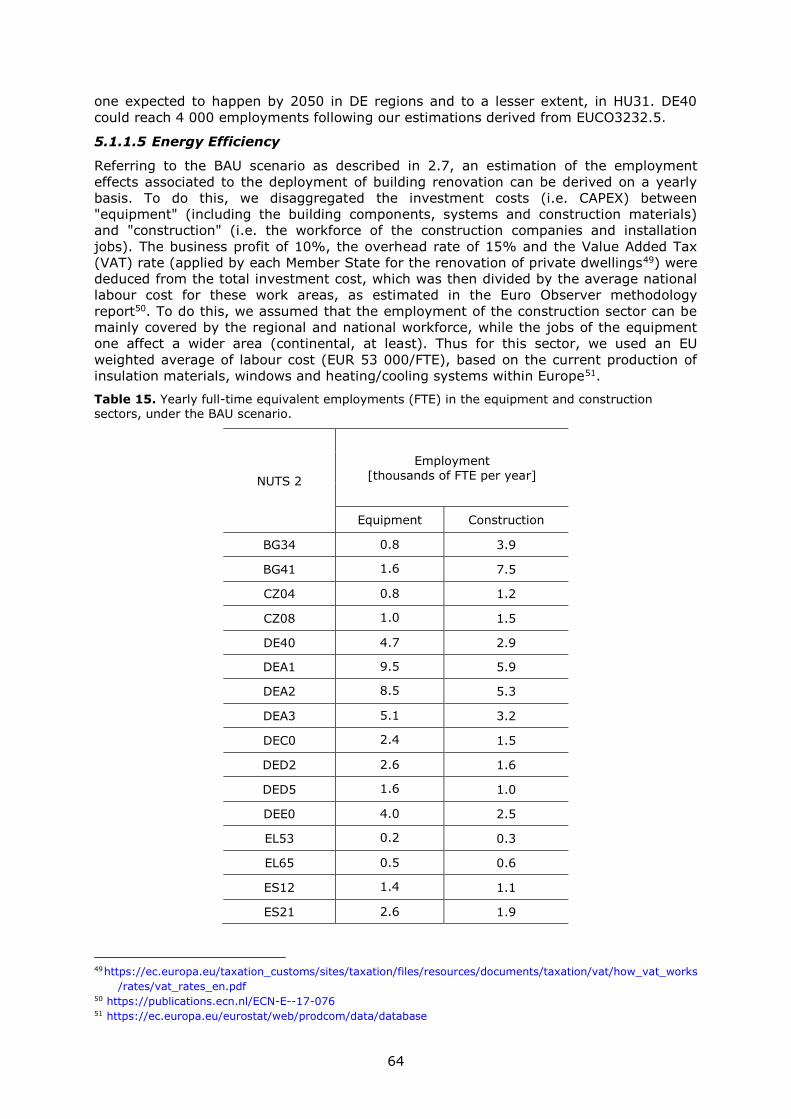
64
one expected to happen by 2050 in DE regions and to a lesser extent, in HU31. DE40
could reach 4 000 employments following our estimations derived from EUCO3232.5.
5.1.1.5 Energy Efficiency
Referring to the BAU scenario as described in 2.7, an estimation of the employment
effects associated to the deployment of building renovation can be derived on a yearly
basis. To do this, we disaggregated the investment costs (i.e. CAPEX) between
"equipment" (including the building components, systems and construction materials)
and "construction" (i.e. the workforce of the construction companies and installation
jobs). The business profit of 10%, the overhead rate of 15% and the Value Added Tax
(VAT) rate (applied by each Member State for the renovation of private dwellings49) were
deduced from the total investment cost, which was then divided by the average national
labour cost for these work areas, as estimated in the Euro Observer methodology
report50. To do this, we assumed that the employment of the construction sector can be
mainly covered by the regional and national workforce, while the jobs of the equipment
one affect a wider area (continental, at least). Thus for this sector, we used an EU
weighted average of labour cost (EUR 53 000/FTE), based on the current production of
insulation materials, windows and heating/cooling systems within Europe51.
Table 15. Yearly full-time equivalent employments (FTE) in the equipment and construction sectors, under the BAU scenario.
NUTS 2
Employment
[thousands of FTE per year]
Equipment Construction
BG34 0.8 3.9
BG41 1.6 7.5
CZ04 0.8 1.2
CZ08 1.0 1.5
DE40 4.7 2.9
DEA1 9.5 5.9
DEA2 8.5 5.3
DEA3 5.1 3.2
DEC0 2.4 1.5
DED2 2.6 1.6
DED5 1.6 1.0
DEE0 4.0 2.5
EL53 0.2 0.3
EL65 0.5 0.6
ES12 1.4 1.1
ES21 2.6 1.9
49https://ec.europa.eu/taxation_customs/sites/taxation/files/resources/documents/taxation/vat/how_vat_works
/rates/vat_rates_en.pdf 50 https://publications.ecn.nl/ECN-E--17-076 51 https://ec.europa.eu/eurostat/web/prodcom/data/database
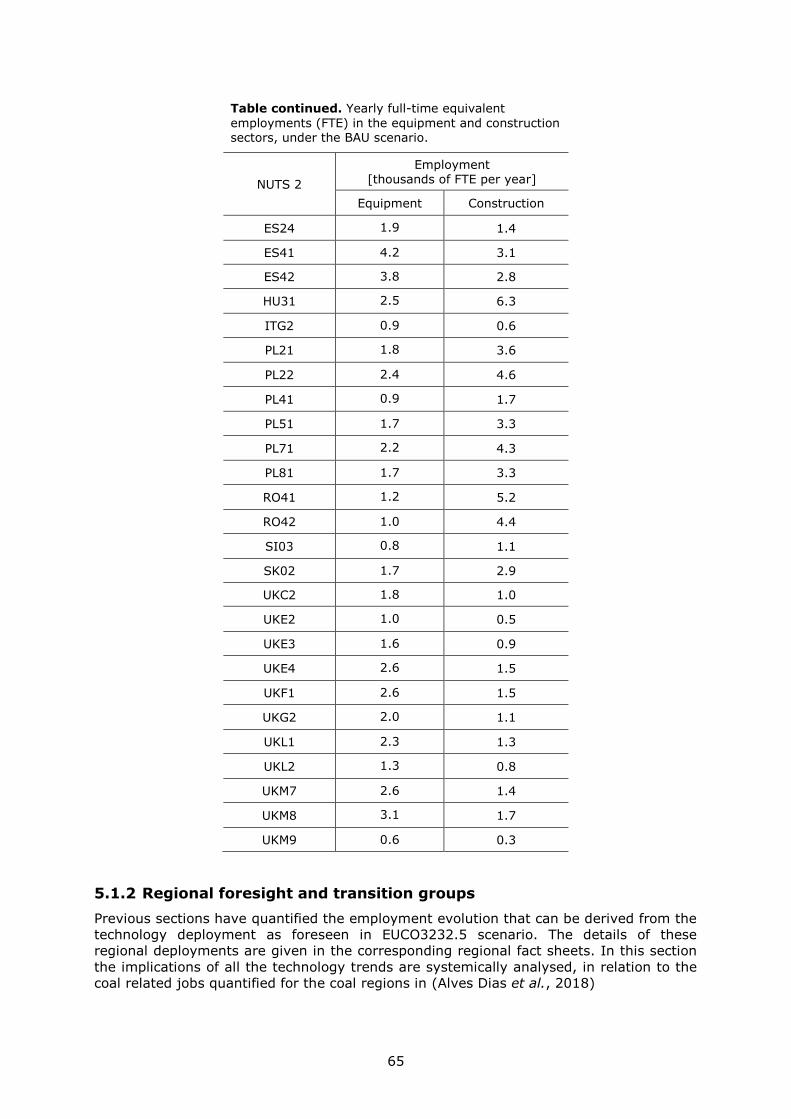
65
Table continued. Yearly full-time equivalent
employments (FTE) in the equipment and construction sectors, under the BAU scenario.
NUTS 2
Employment [thousands of FTE per year]
Equipment Construction
ES24 1.9 1.4
ES41 4.2 3.1
ES42 3.8 2.8
HU31 2.5 6.3
ITG2 0.9 0.6
PL21 1.8 3.6
PL22 2.4 4.6
PL41 0.9 1.7
PL51 1.7 3.3
PL71 2.2 4.3
PL81 1.7 3.3
RO41 1.2 5.2
RO42 1.0 4.4
SI03 0.8 1.1
SK02 1.7 2.9
UKC2 1.8 1.0
UKE2 1.0 0.5
UKE3 1.6 0.9
UKE4 2.6 1.5
UKF1 2.6 1.5
UKG2 2.0 1.1
UKL1 2.3 1.3
UKL2 1.3 0.8
UKM7 2.6 1.4
UKM8 3.1 1.7
UKM9 0.6 0.3
5.1.2 Regional foresight and transition groups
Previous sections have quantified the employment evolution that can be derived from the
technology deployment as foreseen in EUCO3232.5 scenario. The details of these
regional deployments are given in the corresponding regional fact sheets. In this section
the implications of all the technology trends are systemically analysed, in relation to the
coal related jobs quantified for the coal regions in (Alves Dias et al., 2018)
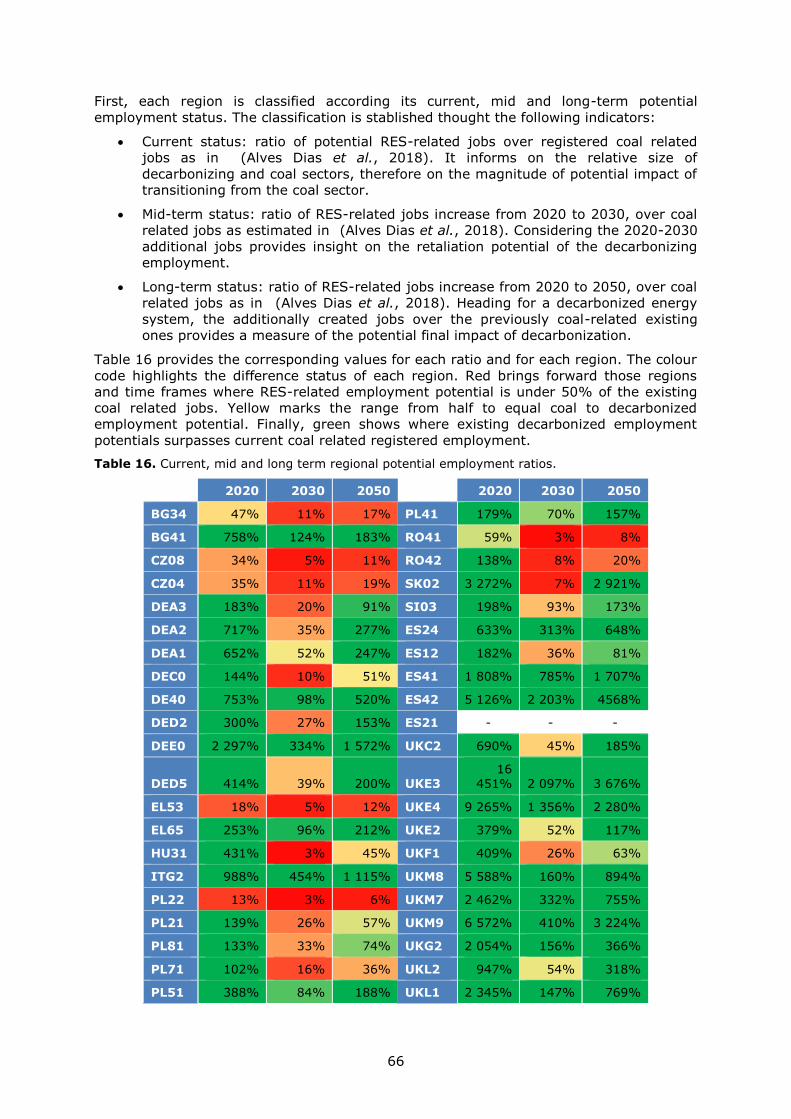
66
First, each region is classified according its current, mid and long-term potential
employment status. The classification is stablished thought the following indicators:
Current status: ratio of potential RES-related jobs over registered coal related
jobs as in (Alves Dias et al., 2018). It informs on the relative size of
decarbonizing and coal sectors, therefore on the magnitude of potential impact of
transitioning from the coal sector.
Mid-term status: ratio of RES-related jobs increase from 2020 to 2030, over coal
related jobs as estimated in (Alves Dias et al., 2018). Considering the 2020-2030
additional jobs provides insight on the retaliation potential of the decarbonizing
employment.
Long-term status: ratio of RES-related jobs increase from 2020 to 2050, over coal
related jobs as in (Alves Dias et al., 2018). Heading for a decarbonized energy
system, the additionally created jobs over the previously coal-related existing
ones provides a measure of the potential final impact of decarbonization.
Table 16 provides the corresponding values for each ratio and for each region. The colour
code highlights the difference status of each region. Red brings forward those regions
and time frames where RES-related employment potential is under 50% of the existing
coal related jobs. Yellow marks the range from half to equal coal to decarbonized
employment potential. Finally, green shows where existing decarbonized employment
potentials surpasses current coal related registered employment.
Table 16. Current, mid and long term regional potential employment ratios.
2020 2030 2050 2020 2030 2050
BG34 47% 11% 17% PL41 179% 70% 157%
BG41 758% 124% 183% RO41 59% 3% 8%
CZ08 34% 5% 11% RO42 138% 8% 20%
CZ04 35% 11% 19% SK02 3 272% 7% 2 921%
DEA3 183% 20% 91% SI03 198% 93% 173%
DEA2 717% 35% 277% ES24 633% 313% 648%
DEA1 652% 52% 247% ES12 182% 36% 81%
DEC0 144% 10% 51% ES41 1 808% 785% 1 707%
DE40 753% 98% 520% ES42 5 126% 2 203% 4568%
DED2 300% 27% 153% ES21 - - -
DEE0 2 297% 334% 1 572% UKC2 690% 45% 185%
DED5 414% 39% 200% UKE3 16
451% 2 097% 3 676%
EL53 18% 5% 12% UKE4 9 265% 1 356% 2 280%
EL65 253% 96% 212% UKE2 379% 52% 117%
HU31 431% 3% 45% UKF1 409% 26% 63%
ITG2 988% 454% 1 115% UKM8 5 588% 160% 894%
PL22 13% 3% 6% UKM7 2 462% 332% 755%
PL21 139% 26% 57% UKM9 6 572% 410% 3 224%
PL81 133% 33% 74% UKG2 2 054% 156% 366%
PL71 102% 16% 36% UKL2 947% 54% 318%
PL51 388% 84% 188% UKL1 2 345% 147% 769%
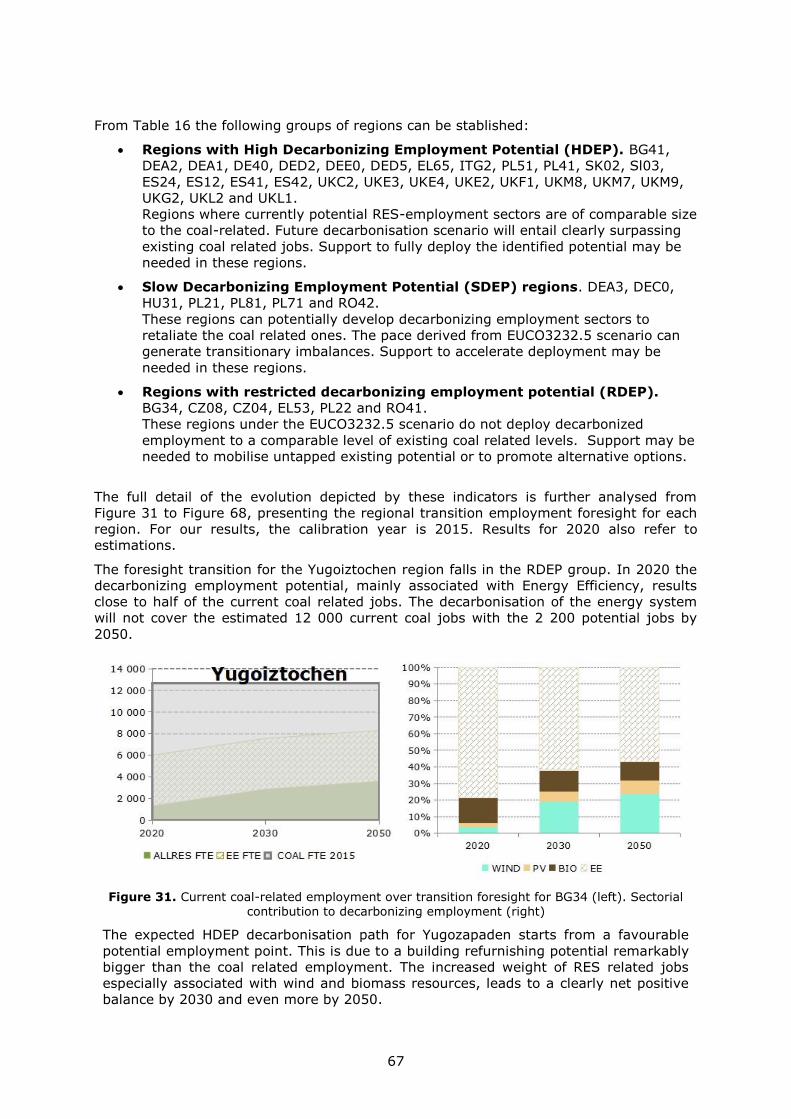
67
From Table 16 the following groups of regions can be stablished:
Regions with High Decarbonizing Employment Potential (HDEP). BG41,
DEA2, DEA1, DE40, DED2, DEE0, DED5, EL65, ITG2, PL51, PL41, SK02, Sl03,
ES24, ES12, ES41, ES42, UKC2, UKE3, UKE4, UKE2, UKF1, UKM8, UKM7, UKM9,
UKG2, UKL2 and UKL1.
Regions where currently potential RES-employment sectors are of comparable size
to the coal-related. Future decarbonisation scenario will entail clearly surpassing
existing coal related jobs. Support to fully deploy the identified potential may be
needed in these regions.
Slow Decarbonizing Employment Potential (SDEP) regions. DEA3, DEC0,
HU31, PL21, PL81, PL71 and RO42.
These regions can potentially develop decarbonizing employment sectors to
retaliate the coal related ones. The pace derived from EUCO3232.5 scenario can
generate transitionary imbalances. Support to accelerate deployment may be
needed in these regions.
Regions with restricted decarbonizing employment potential (RDEP).
BG34, CZ08, CZ04, EL53, PL22 and RO41.
These regions under the EUCO3232.5 scenario do not deploy decarbonized
employment to a comparable level of existing coal related levels. Support may be
needed to mobilise untapped existing potential or to promote alternative options.
The full detail of the evolution depicted by these indicators is further analysed from
Figure 31 to Figure 68, presenting the regional transition employment foresight for each
region. For our results, the calibration year is 2015. Results for 2020 also refer to
estimations.
The foresight transition for the Yugoiztochen region falls in the RDEP group. In 2020 the
decarbonizing employment potential, mainly associated with Energy Efficiency, results
close to half of the current coal related jobs. The decarbonisation of the energy system
will not cover the estimated 12 000 current coal jobs with the 2 200 potential jobs by
2050.
Figure 31. Current coal-related employment over transition foresight for BG34 (left). Sectorial contribution to decarbonizing employment (right)
The expected HDEP decarbonisation path for Yugozapaden starts from a favourable
potential employment point. This is due to a building refurnishing potential remarkably
bigger than the coal related employment. The increased weight of RES related jobs
especially associated with wind and biomass resources, leads to a clearly net positive
balance by 2030 and even more by 2050.
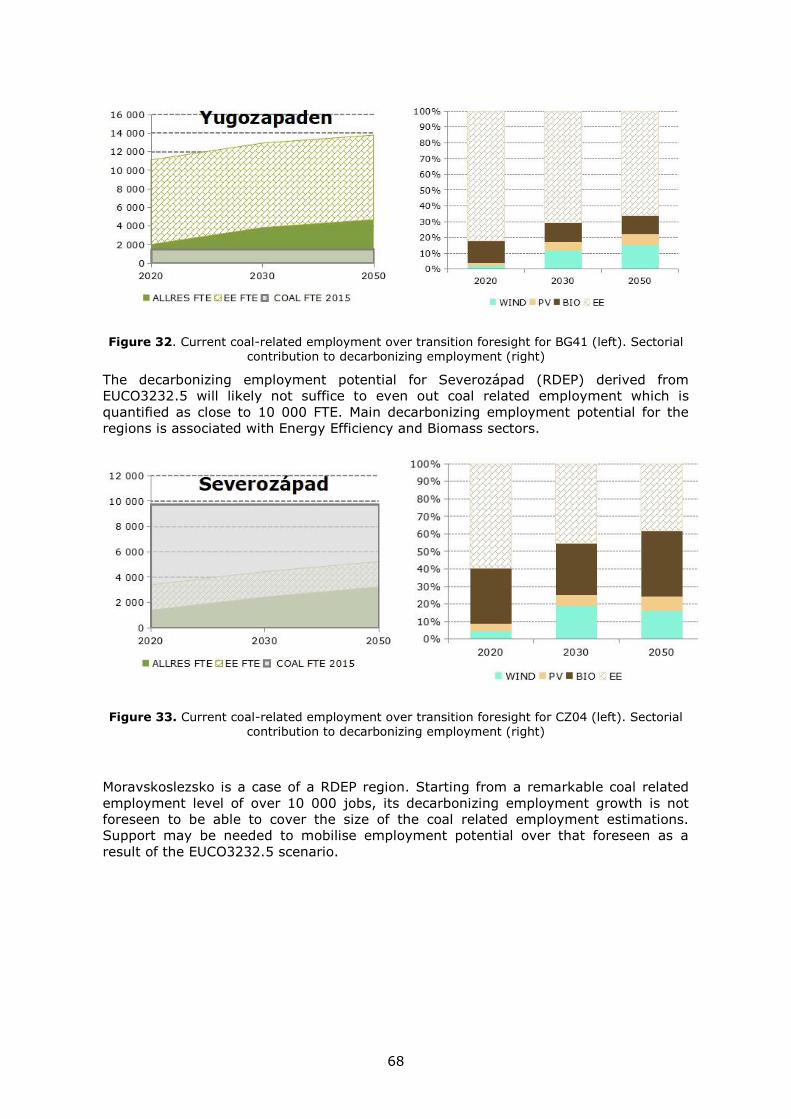
68
Figure 32. Current coal-related employment over transition foresight for BG41 (left). Sectorial contribution to decarbonizing employment (right)
The decarbonizing employment potential for Severozápad (RDEP) derived from
EUCO3232.5 will likely not suffice to even out coal related employment which is
quantified as close to 10 000 FTE. Main decarbonizing employment potential for the
regions is associated with Energy Efficiency and Biomass sectors.
Figure 33. Current coal-related employment over transition foresight for CZ04 (left). Sectorial contribution to decarbonizing employment (right)
Moravskoslezsko is a case of a RDEP region. Starting from a remarkable coal related
employment level of over 10 000 jobs, its decarbonizing employment growth is not
foreseen to be able to cover the size of the coal related employment estimations.
Support may be needed to mobilise employment potential over that foreseen as a
result of the EUCO3232.5 scenario.
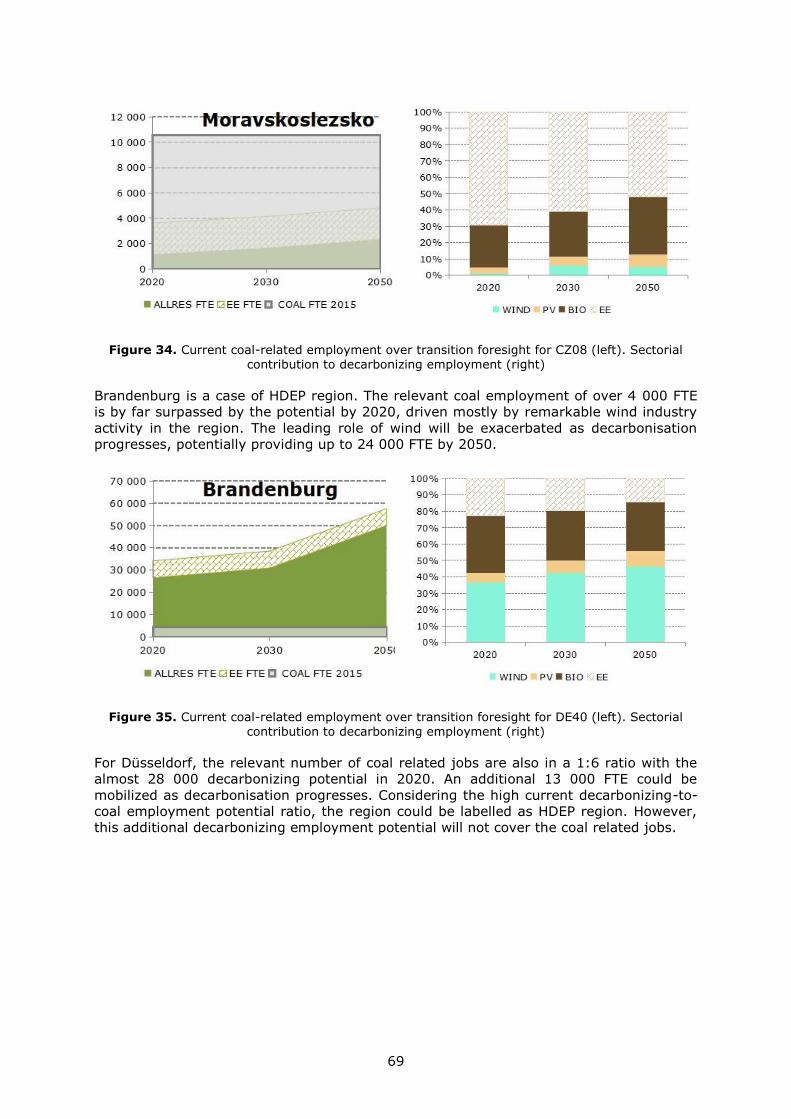
69
Figure 34. Current coal-related employment over transition foresight for CZ08 (left). Sectorial contribution to decarbonizing employment (right)
Brandenburg is a case of HDEP region. The relevant coal employment of over 4 000 FTE
is by far surpassed by the potential by 2020, driven mostly by remarkable wind industry
activity in the region. The leading role of wind will be exacerbated as decarbonisation
progresses, potentially providing up to 24 000 FTE by 2050.
Figure 35. Current coal-related employment over transition foresight for DE40 (left). Sectorial contribution to decarbonizing employment (right)
For Düsseldorf, the relevant number of coal related jobs are also in a 1:6 ratio with the
almost 28 000 decarbonizing potential in 2020. An additional 13 000 FTE could be
mobilized as decarbonisation progresses. Considering the high current decarbonizing-to-
coal employment potential ratio, the region could be labelled as HDEP region. However,
this additional decarbonizing employment potential will not cover the coal related jobs.
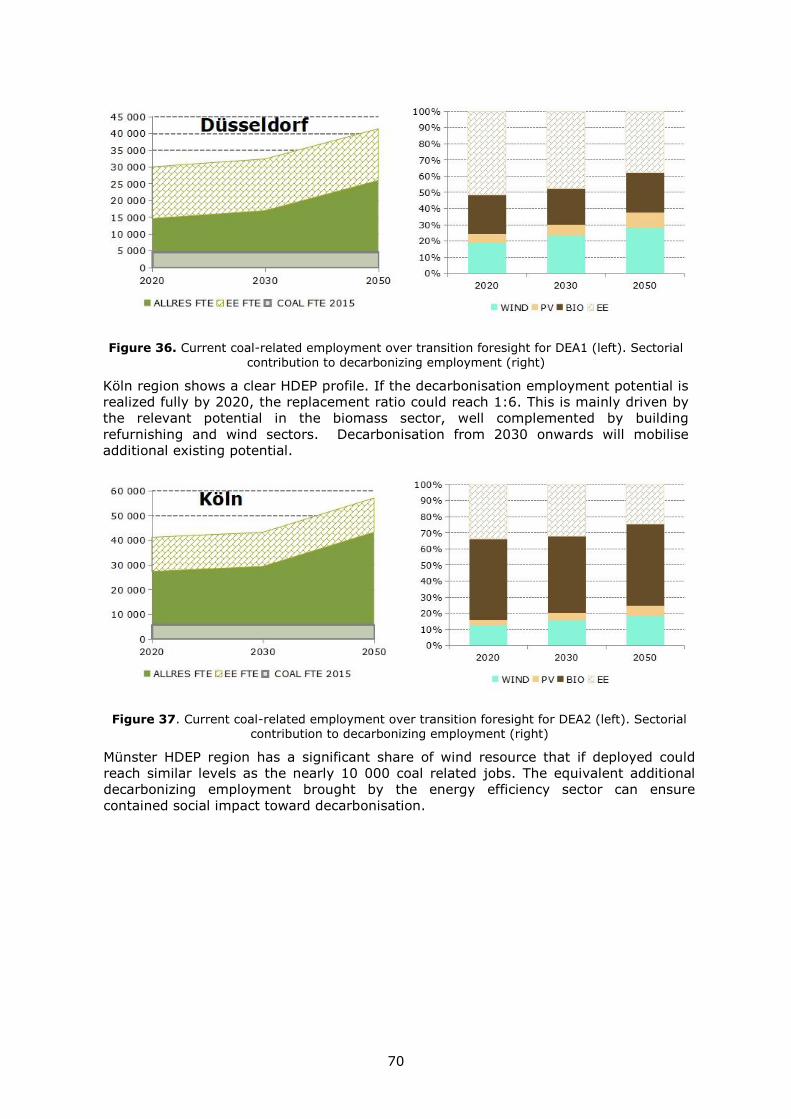
70
Figure 36. Current coal-related employment over transition foresight for DEA1 (left). Sectorial
contribution to decarbonizing employment (right)
Köln region shows a clear HDEP profile. If the decarbonisation employment potential is
realized fully by 2020, the replacement ratio could reach 1:6. This is mainly driven by
the relevant potential in the biomass sector, well complemented by building
refurnishing and wind sectors. Decarbonisation from 2030 onwards will mobilise
additional existing potential.
Figure 37. Current coal-related employment over transition foresight for DEA2 (left). Sectorial contribution to decarbonizing employment (right)
Münster HDEP region has a significant share of wind resource that if deployed could
reach similar levels as the nearly 10 000 coal related jobs. The equivalent additional
decarbonizing employment brought by the energy efficiency sector can ensure
contained social impact toward decarbonisation.
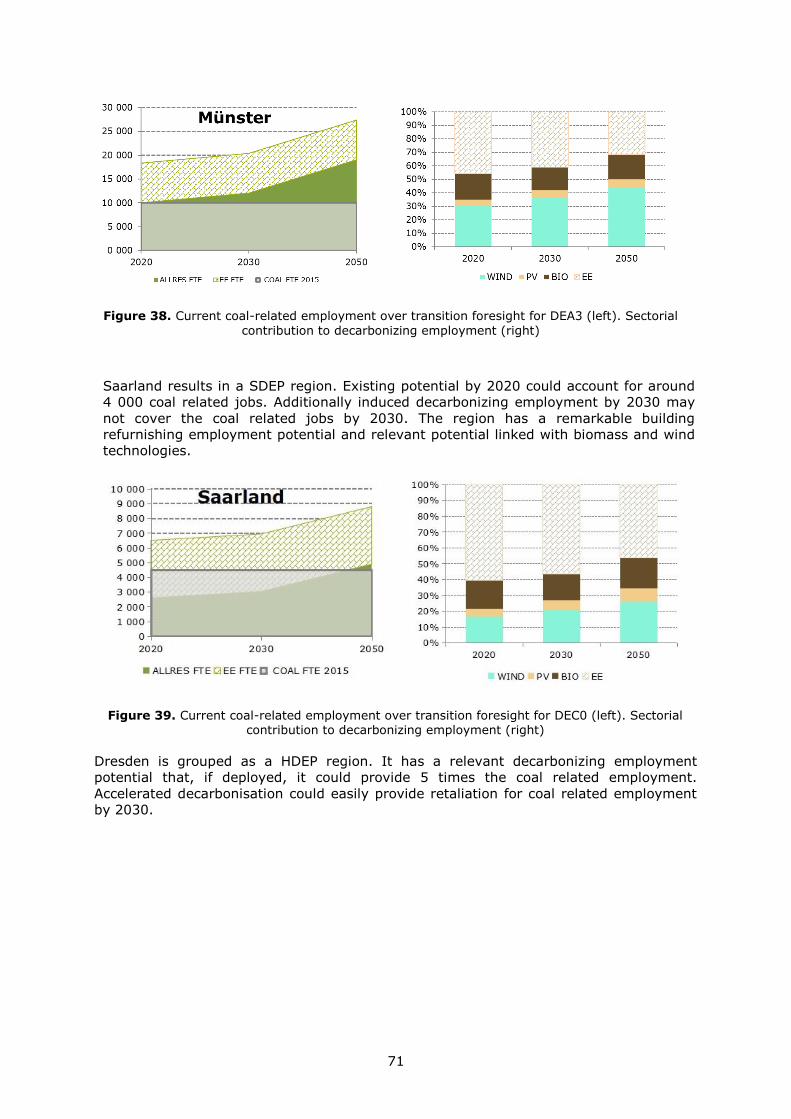
71
Figure 38. Current coal-related employment over transition foresight for DEA3 (left). Sectorial
contribution to decarbonizing employment (right)
Saarland results in a SDEP region. Existing potential by 2020 could account for around
4 000 coal related jobs. Additionally induced decarbonizing employment by 2030 may
not cover the coal related jobs by 2030. The region has a remarkable building
refurnishing employment potential and relevant potential linked with biomass and wind
technologies.
Figure 39. Current coal-related employment over transition foresight for DEC0 (left). Sectorial contribution to decarbonizing employment (right)
Dresden is grouped as a HDEP region. It has a relevant decarbonizing employment
potential that, if deployed, it could provide 5 times the coal related employment.
Accelerated decarbonisation could easily provide retaliation for coal related employment
by 2030.
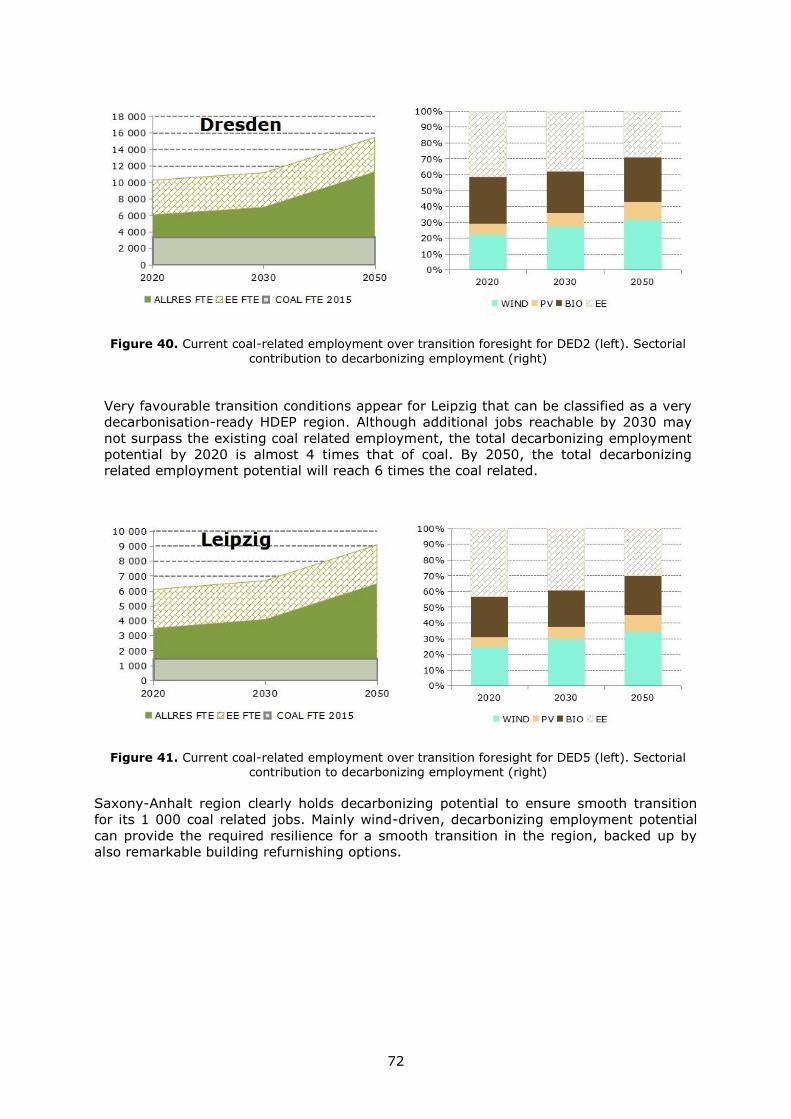
72
Figure 40. Current coal-related employment over transition foresight for DED2 (left). Sectorial
contribution to decarbonizing employment (right)
Very favourable transition conditions appear for Leipzig that can be classified as a very
decarbonisation-ready HDEP region. Although additional jobs reachable by 2030 may
not surpass the existing coal related employment, the total decarbonizing employment
potential by 2020 is almost 4 times that of coal. By 2050, the total decarbonizing
related employment potential will reach 6 times the coal related.
Figure 41. Current coal-related employment over transition foresight for DED5 (left). Sectorial contribution to decarbonizing employment (right)
Saxony-Anhalt region clearly holds decarbonizing potential to ensure smooth transition
for its 1 000 coal related jobs. Mainly wind-driven, decarbonizing employment potential
can provide the required resilience for a smooth transition in the region, backed up by
also remarkable building refurnishing options.
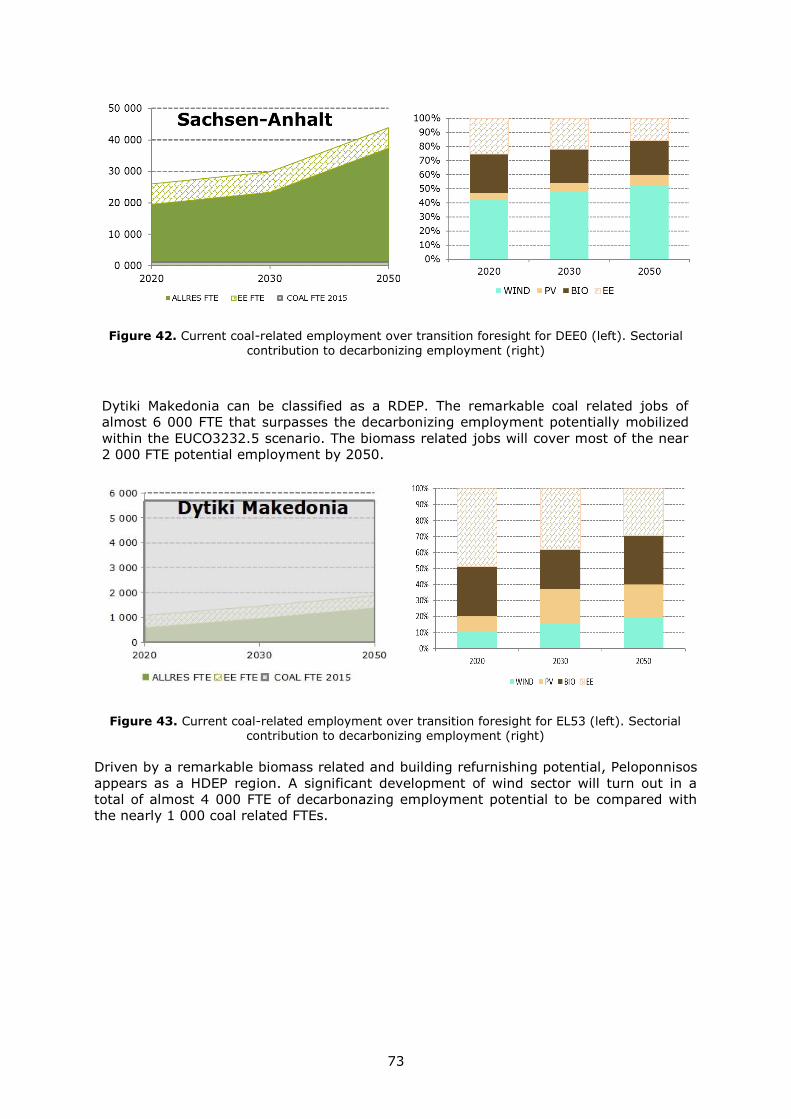
73
Figure 42. Current coal-related employment over transition foresight for DEE0 (left). Sectorial
contribution to decarbonizing employment (right)
Dytiki Makedonia can be classified as a RDEP. The remarkable coal related jobs of
almost 6 000 FTE that surpasses the decarbonizing employment potentially mobilized
within the EUCO3232.5 scenario. The biomass related jobs will cover most of the near
2 000 FTE potential employment by 2050.
Figure 43. Current coal-related employment over transition foresight for EL53 (left). Sectorial contribution to decarbonizing employment (right)
Driven by a remarkable biomass related and building refurnishing potential, Peloponnisos
appears as a HDEP region. A significant development of wind sector will turn out in a
total of almost 4 000 FTE of decarbonazing employment potential to be compared with
the nearly 1 000 coal related FTEs.
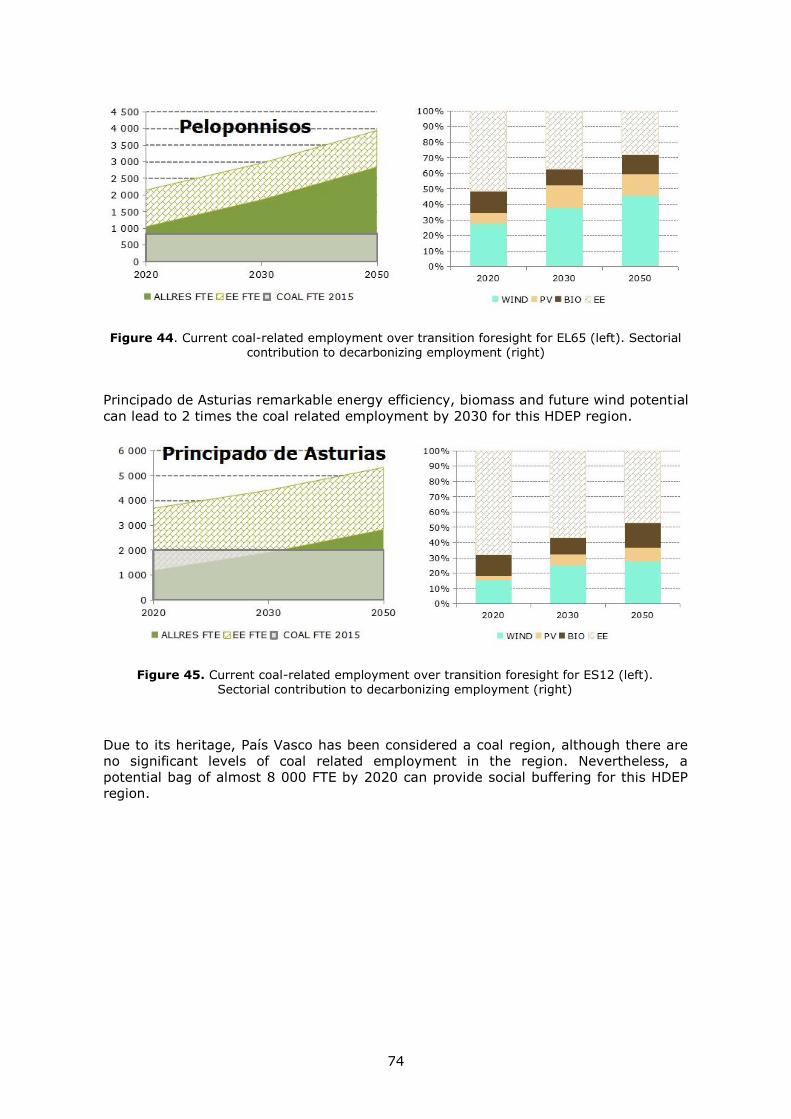
74
Figure 44. Current coal-related employment over transition foresight for EL65 (left). Sectorial contribution to decarbonizing employment (right)
Principado de Asturias remarkable energy efficiency, biomass and future wind potential
can lead to 2 times the coal related employment by 2030 for this HDEP region.
Figure 45. Current coal-related employment over transition foresight for ES12 (left). Sectorial contribution to decarbonizing employment (right)
Due to its heritage, País Vasco has been considered a coal region, although there are
no significant levels of coal related employment in the region. Nevertheless, a
potential bag of almost 8 000 FTE by 2020 can provide social buffering for this HDEP
region.
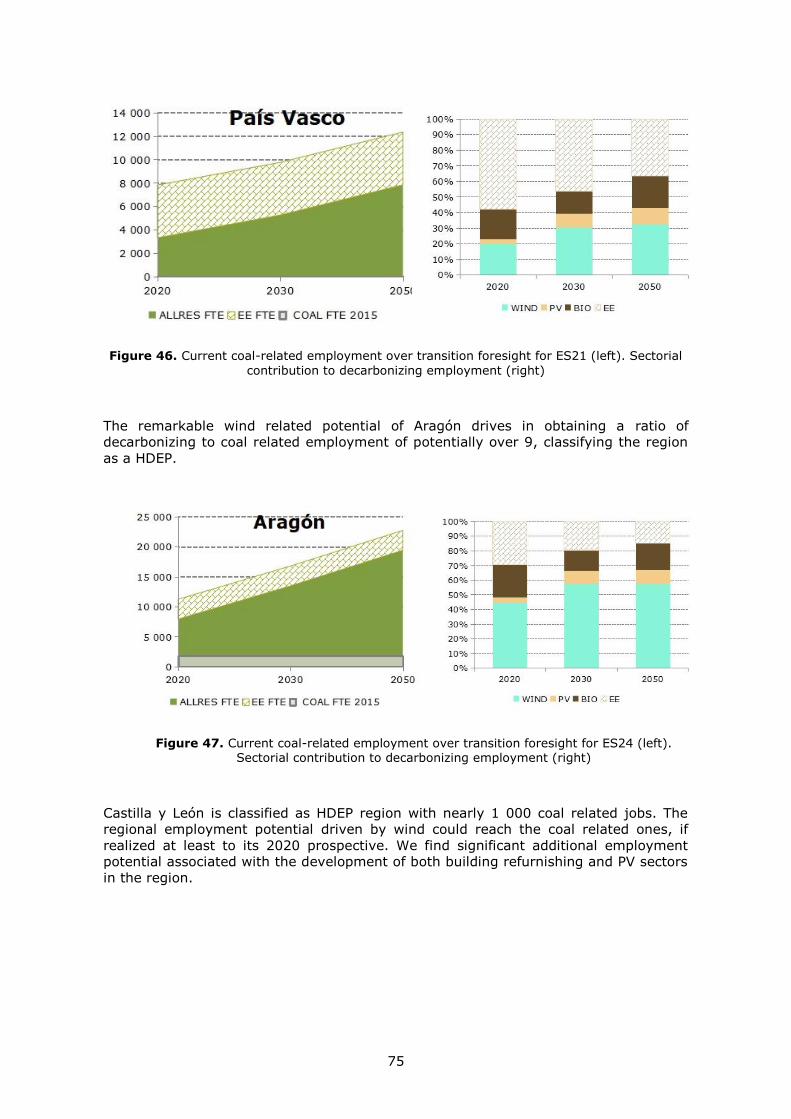
75
Figure 46. Current coal-related employment over transition foresight for ES21 (left). Sectorial
contribution to decarbonizing employment (right)
The remarkable wind related potential of Aragón drives in obtaining a ratio of
decarbonizing to coal related employment of potentially over 9, classifying the region
as a HDEP.
Figure 47. Current coal-related employment over transition foresight for ES24 (left). Sectorial contribution to decarbonizing employment (right)
Castilla y León is classified as HDEP region with nearly 1 000 coal related jobs. The
regional employment potential driven by wind could reach the coal related ones, if
realized at least to its 2020 prospective. We find significant additional employment
potential associated with the development of both building refurnishing and PV sectors
in the region.
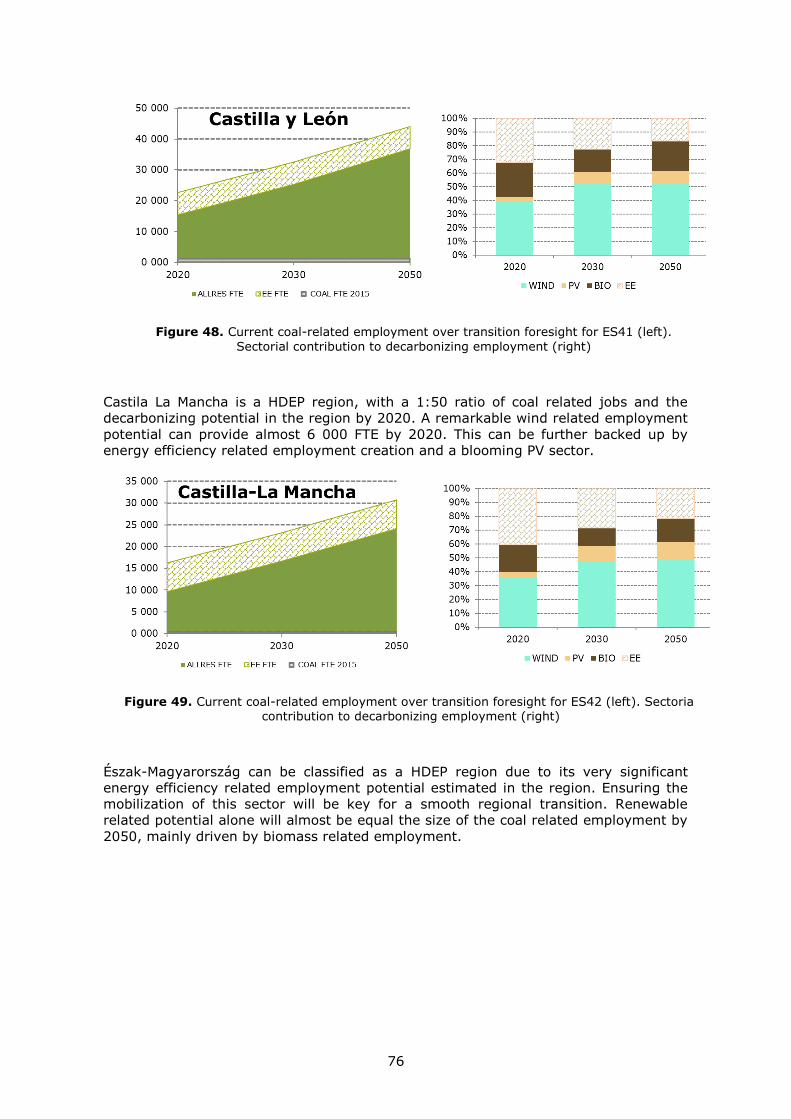
76
Figure 48. Current coal-related employment over transition foresight for ES41 (left).
Sectorial contribution to decarbonizing employment (right)
Castila La Mancha is a HDEP region, with a 1:50 ratio of coal related jobs and the
decarbonizing potential in the region by 2020. A remarkable wind related employment
potential can provide almost 6 000 FTE by 2020. This can be further backed up by
energy efficiency related employment creation and a blooming PV sector.
Figure 49. Current coal-related employment over transition foresight for ES42 (left). Sectorial contribution to decarbonizing employment (right)
Észak-Magyarország can be classified as a HDEP region due to its very significant
energy efficiency related employment potential estimated in the region. Ensuring the
mobilization of this sector will be key for a smooth regional transition. Renewable
related potential alone will almost be equal the size of the coal related employment by
2050, mainly driven by biomass related employment.
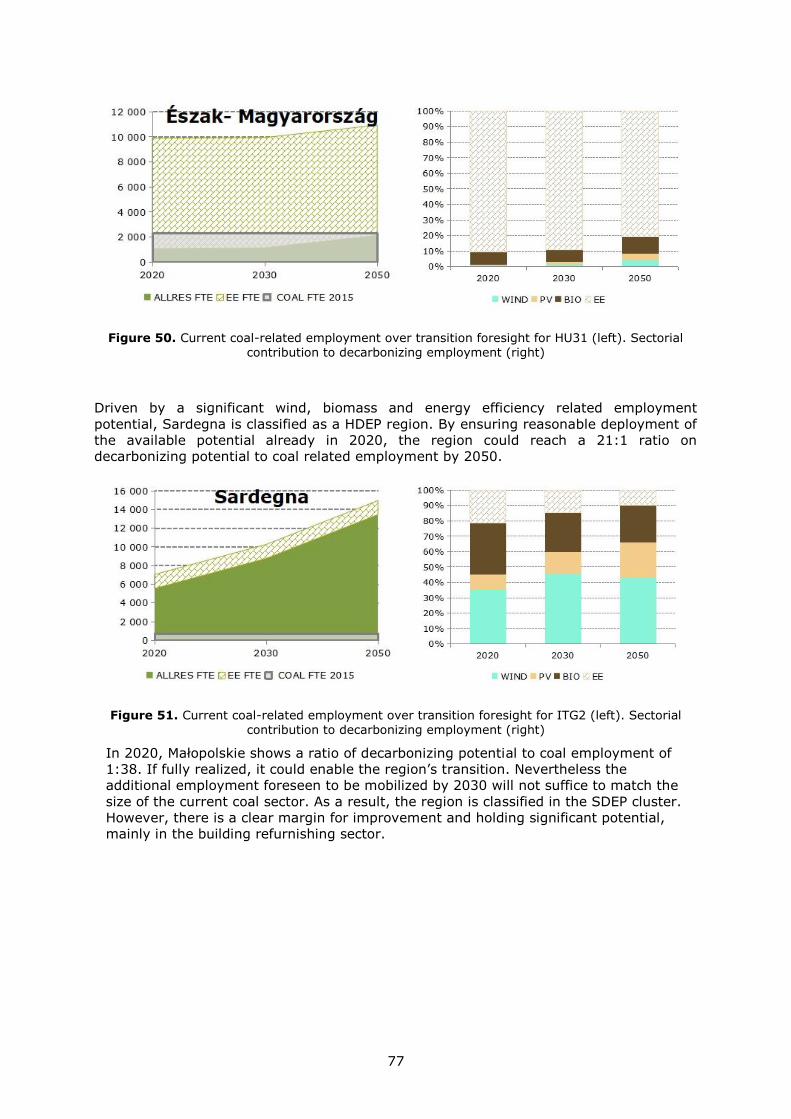
77
Figure 50. Current coal-related employment over transition foresight for HU31 (left). Sectorial contribution to decarbonizing employment (right)
Driven by a significant wind, biomass and energy efficiency related employment
potential, Sardegna is classified as a HDEP region. By ensuring reasonable deployment of
the available potential already in 2020, the region could reach a 21:1 ratio on
decarbonizing potential to coal related employment by 2050.
Figure 51. Current coal-related employment over transition foresight for ITG2 (left). Sectorial contribution to decarbonizing employment (right)
In 2020, Małopolskie shows a ratio of decarbonizing potential to coal employment of
1:38. If fully realized, it could enable the region’s transition. Nevertheless the
additional employment foreseen to be mobilized by 2030 will not suffice to match the
size of the current coal sector. As a result, the region is classified in the SDEP cluster.
However, there is a clear margin for improvement and holding significant potential,
mainly in the building refurnishing sector.
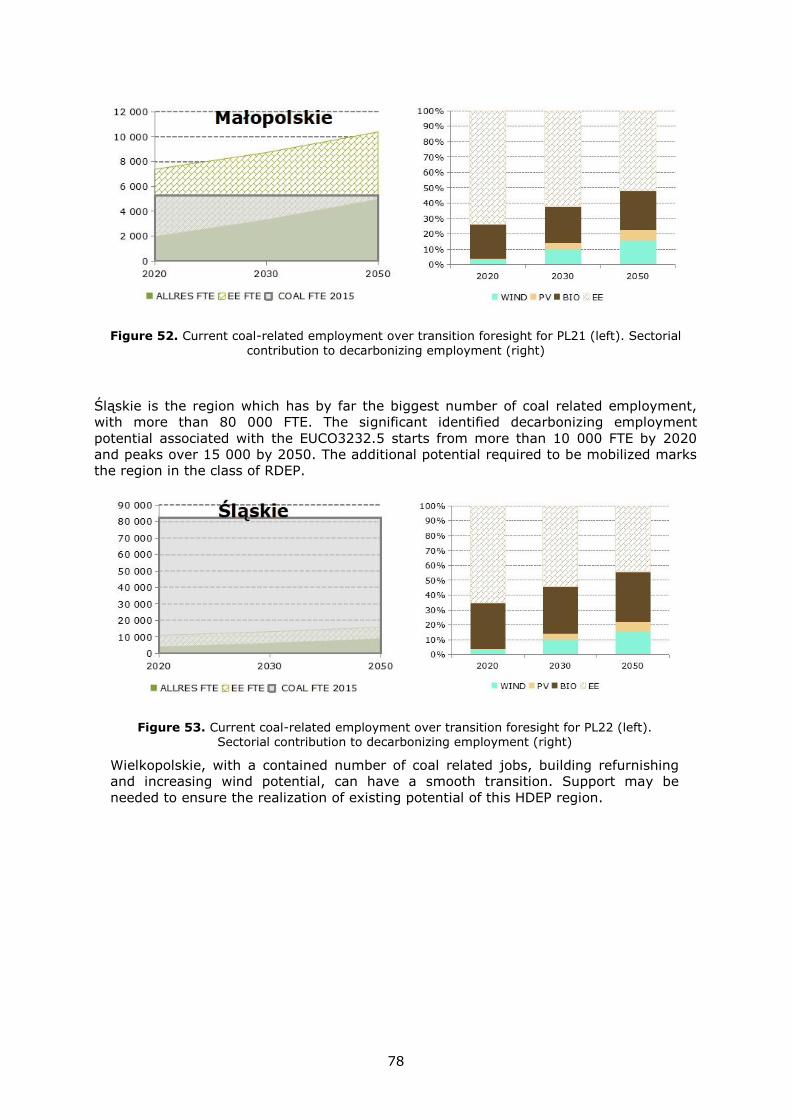
78
Figure 52. Current coal-related employment over transition foresight for PL21 (left). Sectorial
contribution to decarbonizing employment (right)
Śląskie is the region which has by far the biggest number of coal related employment,
with more than 80 000 FTE. The significant identified decarbonizing employment
potential associated with the EUCO3232.5 starts from more than 10 000 FTE by 2020
and peaks over 15 000 by 2050. The additional potential required to be mobilized marks
the region in the class of RDEP.
Figure 53. Current coal-related employment over transition foresight for PL22 (left). Sectorial contribution to decarbonizing employment (right)
Wielkopolskie, with a contained number of coal related jobs, building refurnishing
and increasing wind potential, can have a smooth transition. Support may be
needed to ensure the realization of existing potential of this HDEP region.
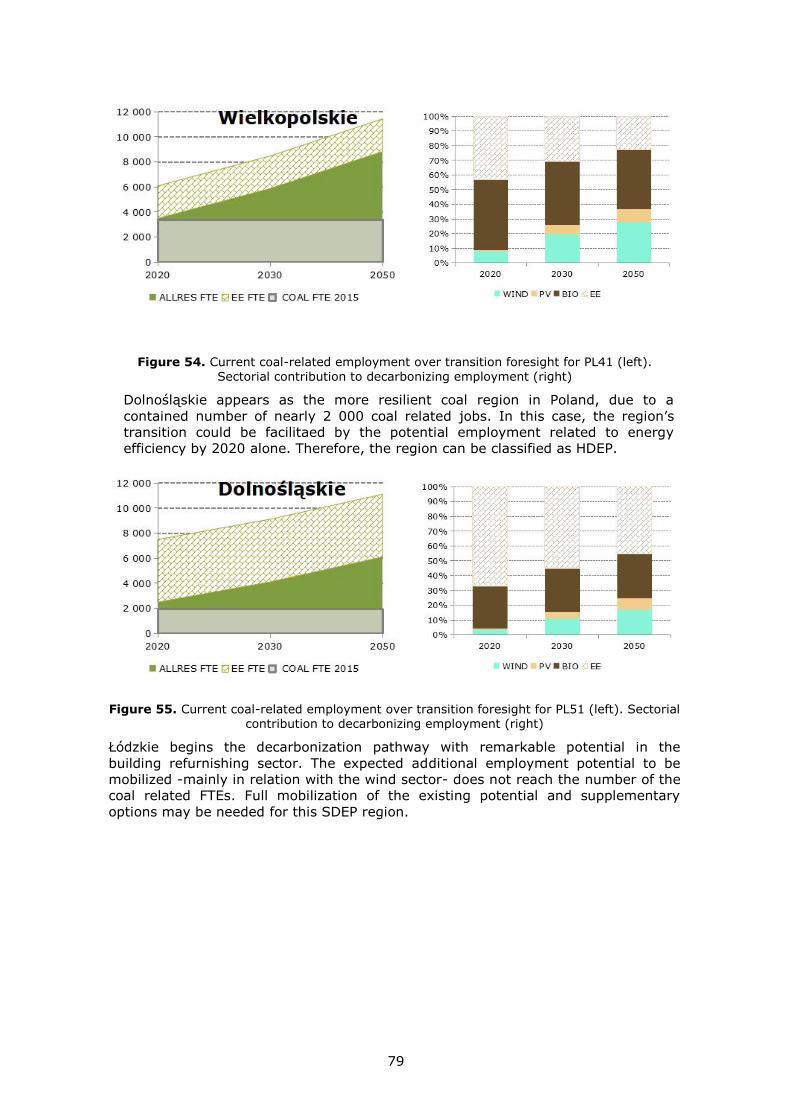
79
Figure 54. Current coal-related employment over transition foresight for PL41 (left).
Sectorial contribution to decarbonizing employment (right)
Dolnośląskie appears as the more resilient coal region in Poland, due to a
contained number of nearly 2 000 coal related jobs. In this case, the region’s
transition could be facilitaed by the potential employment related to energy
efficiency by 2020 alone. Therefore, the region can be classified as HDEP.
Figure 55. Current coal-related employment over transition foresight for PL51 (left). Sectorial contribution to decarbonizing employment (right)
Łódzkie begins the decarbonization pathway with remarkable potential in the
building refurnishing sector. The expected additional employment potential to be
mobilized -mainly in relation with the wind sector- does not reach the number of the
coal related FTEs. Full mobilization of the existing potential and supplementary
options may be needed for this SDEP region.
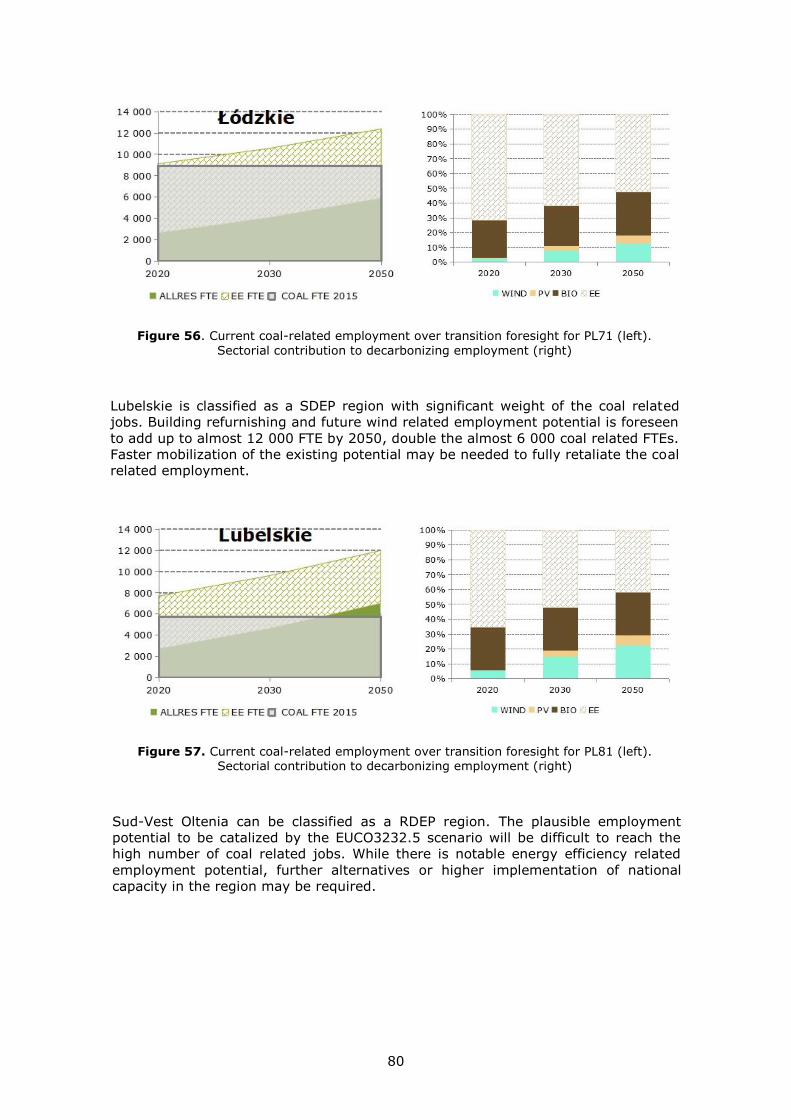
80
Figure 56. Current coal-related employment over transition foresight for PL71 (left).
Sectorial contribution to decarbonizing employment (right)
Lubelskie is classified as a SDEP region with significant weight of the coal related
jobs. Building refurnishing and future wind related employment potential is foreseen
to add up to almost 12 000 FTE by 2050, double the almost 6 000 coal related FTEs.
Faster mobilization of the existing potential may be needed to fully retaliate the coal
related employment.
Figure 57. Current coal-related employment over transition foresight for PL81 (left). Sectorial contribution to decarbonizing employment (right)
Sud-Vest Oltenia can be classified as a RDEP region. The plausible employment
potential to be catalized by the EUCO3232.5 scenario will be difficult to reach the
high number of coal related jobs. While there is notable energy efficiency related
employment potential, further alternatives or higher implementation of national
capacity in the region may be required.
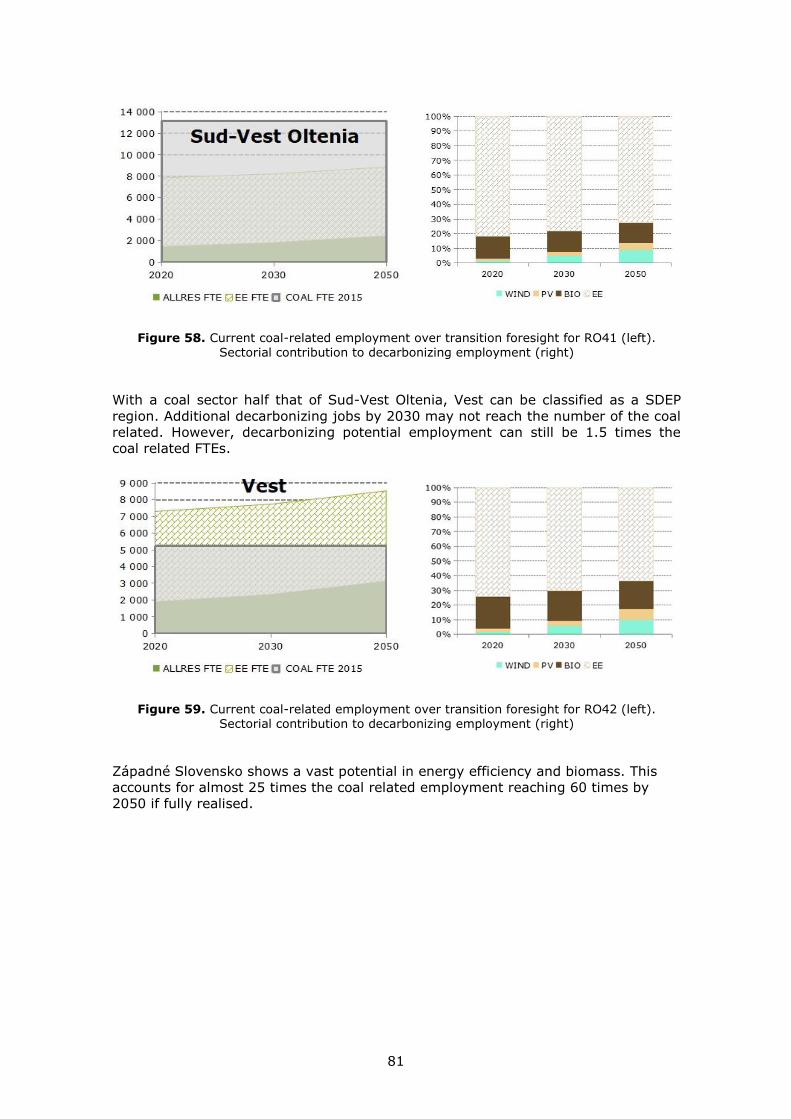
81
Figure 58. Current coal-related employment over transition foresight for RO41 (left). Sectorial contribution to decarbonizing employment (right)
With a coal sector half that of Sud-Vest Oltenia, Vest can be classified as a SDEP
region. Additional decarbonizing jobs by 2030 may not reach the number of the coal
related. However, decarbonizing potential employment can still be 1.5 times the
coal related FTEs.
Figure 59. Current coal-related employment over transition foresight for RO42 (left). Sectorial contribution to decarbonizing employment (right)
Západné Slovensko shows a vast potential in energy efficiency and biomass. This
accounts for almost 25 times the coal related employment reaching 60 times by
2050 if fully realised.
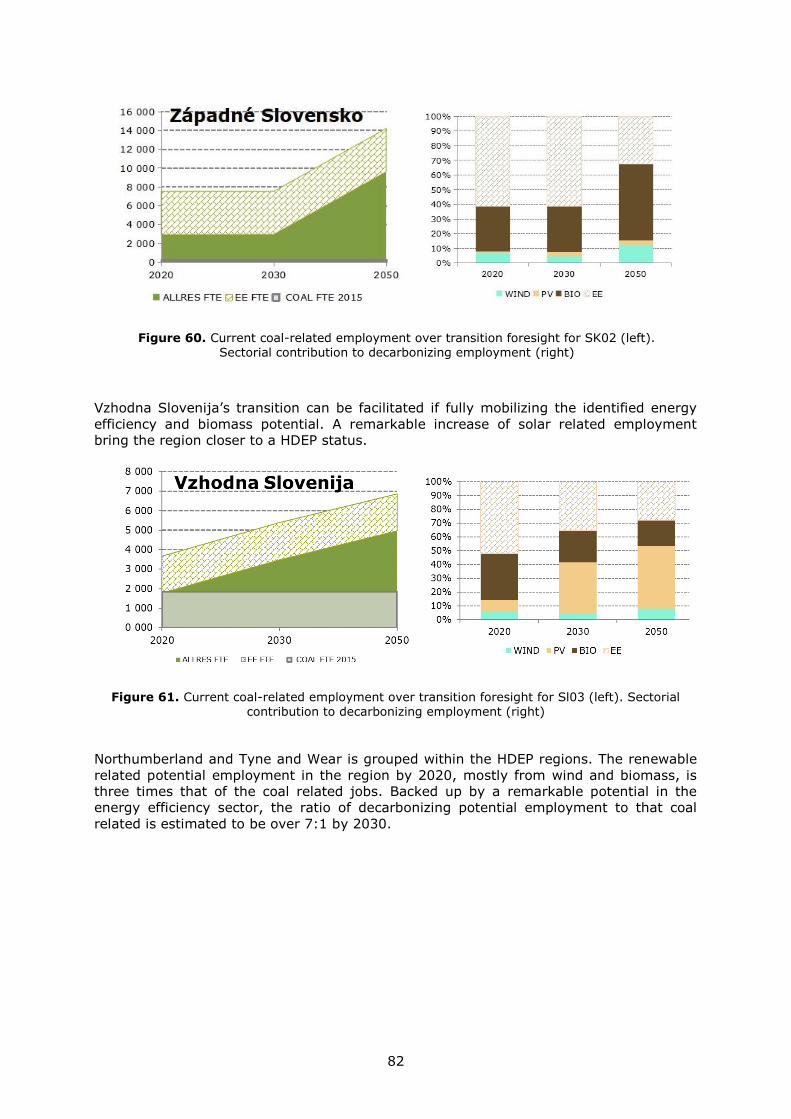
82
Figure 60. Current coal-related employment over transition foresight for SK02 (left). Sectorial contribution to decarbonizing employment (right)
Vzhodna Slovenija’s transition can be facilitated if fully mobilizing the identified energy
efficiency and biomass potential. A remarkable increase of solar related employment
bring the region closer to a HDEP status.
Figure 61. Current coal-related employment over transition foresight for Sl03 (left). Sectorial contribution to decarbonizing employment (right)
Northumberland and Tyne and Wear is grouped within the HDEP regions. The renewable
related potential employment in the region by 2020, mostly from wind and biomass, is
three times that of the coal related jobs. Backed up by a remarkable potential in the
energy efficiency sector, the ratio of decarbonizing potential employment to that coal
related is estimated to be over 7:1 by 2030.
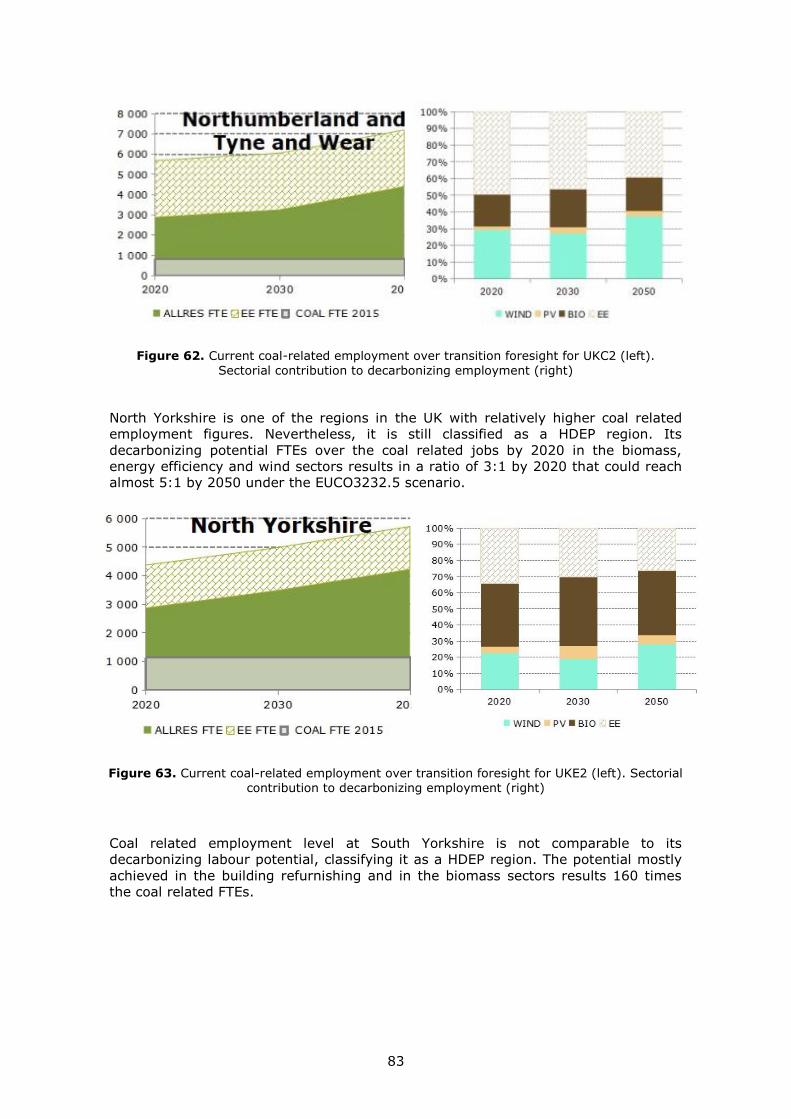
83
Figure 62. Current coal-related employment over transition foresight for UKC2 (left).
Sectorial contribution to decarbonizing employment (right)
North Yorkshire is one of the regions in the UK with relatively higher coal related
employment figures. Nevertheless, it is still classified as a HDEP region. Its
decarbonizing potential FTEs over the coal related jobs by 2020 in the biomass,
energy efficiency and wind sectors results in a ratio of 3:1 by 2020 that could reach
almost 5:1 by 2050 under the EUCO3232.5 scenario.
Figure 63. Current coal-related employment over transition foresight for UKE2 (left). Sectorial
contribution to decarbonizing employment (right)
Coal related employment level at South Yorkshire is not comparable to its
decarbonizing labour potential, classifying it as a HDEP region. The potential mostly
achieved in the building refurnishing and in the biomass sectors results 160 times
the coal related FTEs.
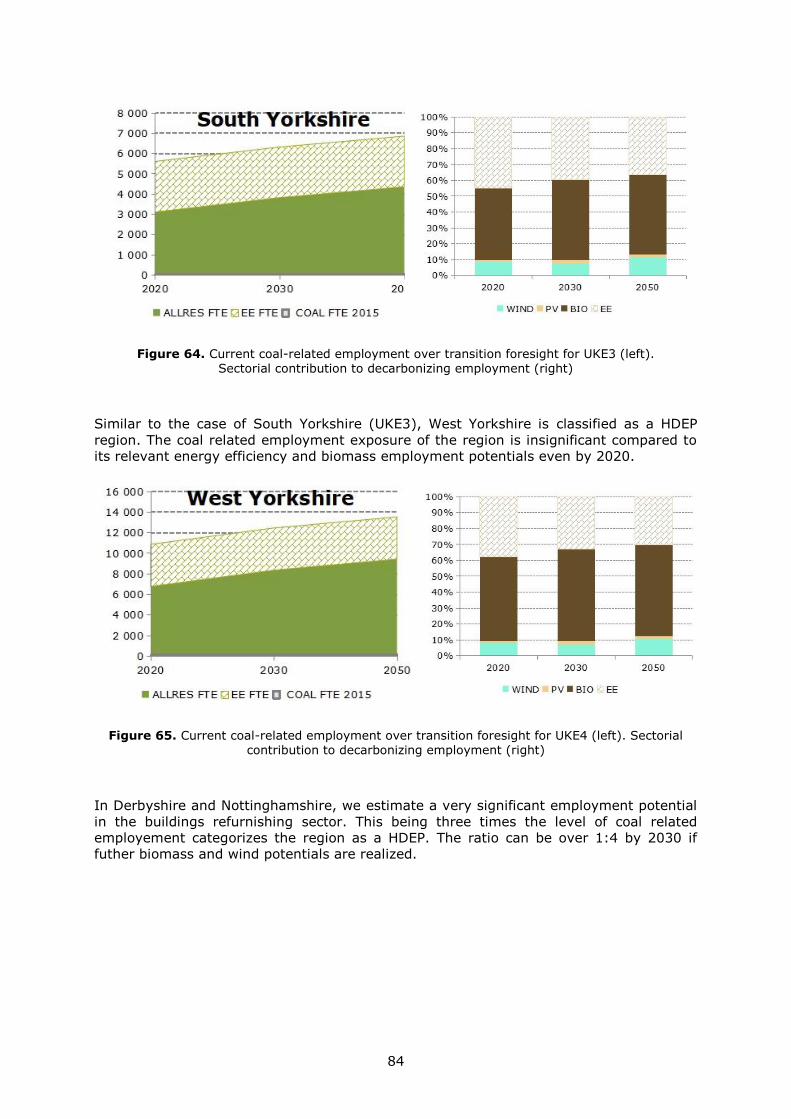
84
Figure 64. Current coal-related employment over transition foresight for UKE3 (left).
Sectorial contribution to decarbonizing employment (right)
Similar to the case of South Yorkshire (UKE3), West Yorkshire is classified as a HDEP
region. The coal related employment exposure of the region is insignificant compared to
its relevant energy efficiency and biomass employment potentials even by 2020.
Figure 65. Current coal-related employment over transition foresight for UKE4 (left). Sectorial contribution to decarbonizing employment (right)
In Derbyshire and Nottinghamshire, we estimate a very significant employment potential
in the buildings refurnishing sector. This being three times the level of coal related
employement categorizes the region as a HDEP. The ratio can be over 1:4 by 2030 if
futher biomass and wind potentials are realized.
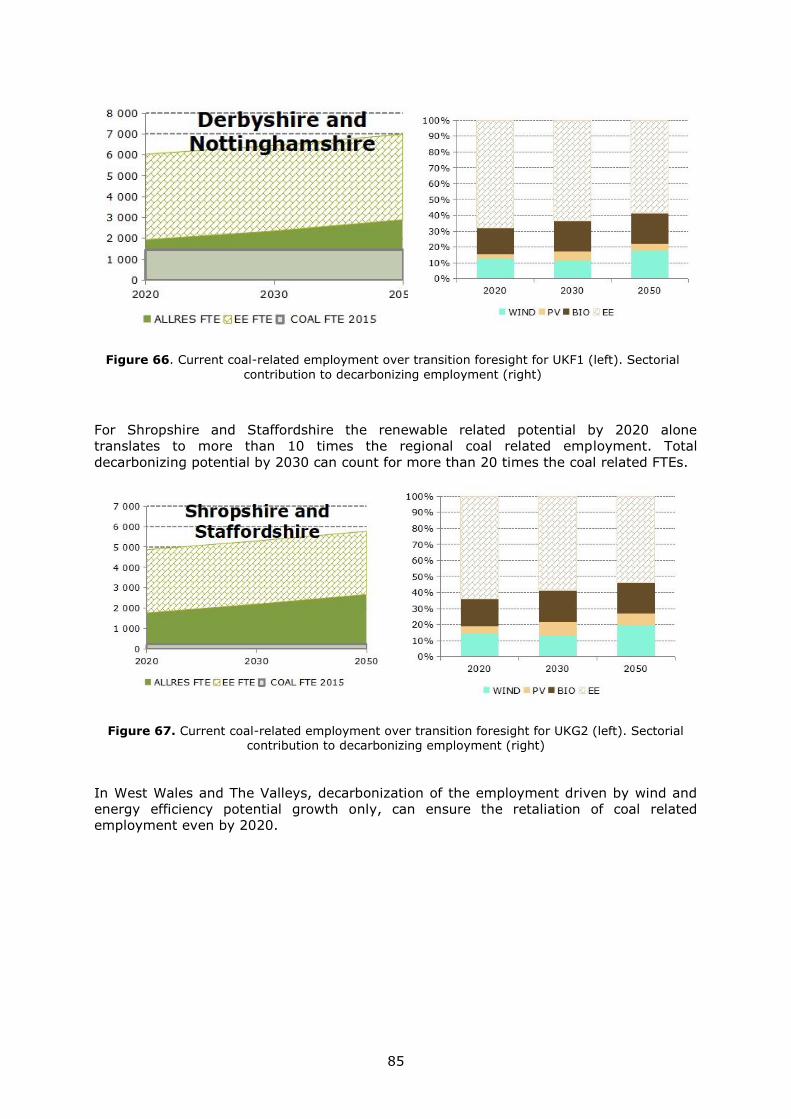
85
Figure 66. Current coal-related employment over transition foresight for UKF1 (left). Sectorial
contribution to decarbonizing employment (right)
For Shropshire and Staffordshire the renewable related potential by 2020 alone
translates to more than 10 times the regional coal related employment. Total
decarbonizing potential by 2030 can count for more than 20 times the coal related FTEs.
Figure 67. Current coal-related employment over transition foresight for UKG2 (left). Sectorial contribution to decarbonizing employment (right)
In West Wales and The Valleys, decarbonization of the employment driven by wind and
energy efficiency potential growth only, can ensure the retaliation of coal related
employment even by 2020.
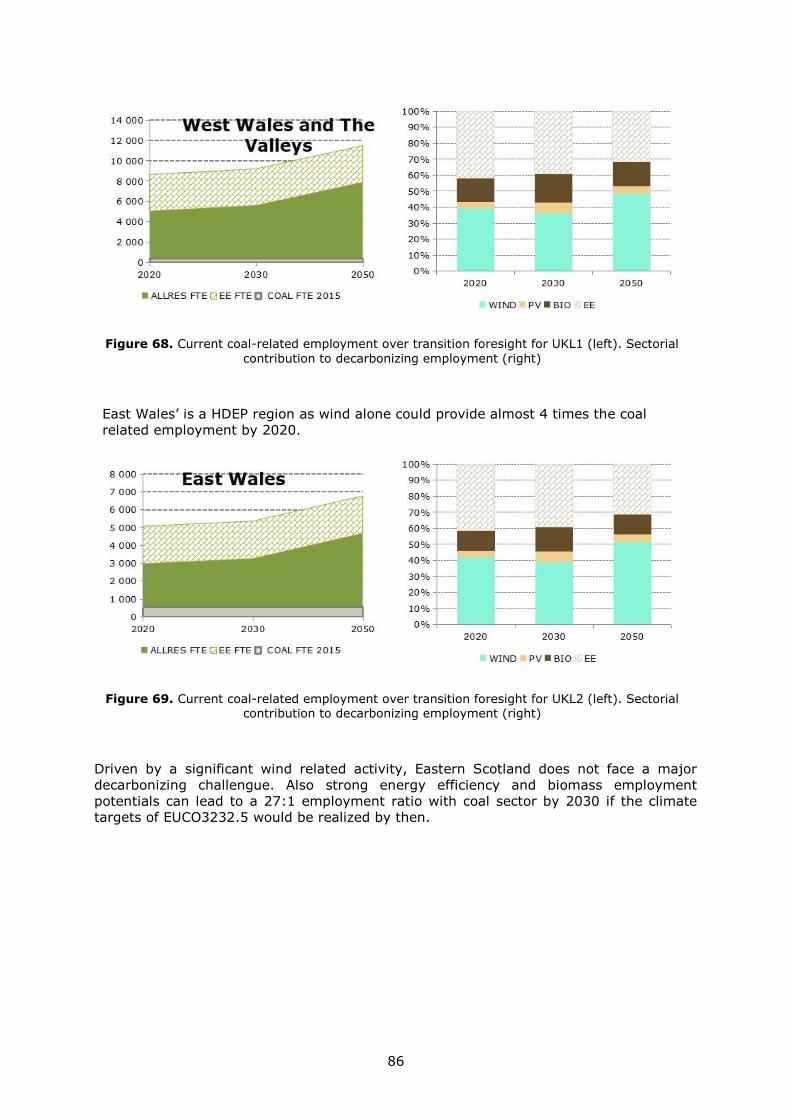
86
Figure 68. Current coal-related employment over transition foresight for UKL1 (left). Sectorial
contribution to decarbonizing employment (right)
East Wales’ is a HDEP region as wind alone could provide almost 4 times the coal
related employment by 2020.
Figure 69. Current coal-related employment over transition foresight for UKL2 (left). Sectorial contribution to decarbonizing employment (right)
Driven by a significant wind related activity, Eastern Scotland does not face a major
decarbonizing challengue. Also strong energy efficiency and biomass employment
potentials can lead to a 27:1 employment ratio with coal sector by 2030 if the climate
targets of EUCO3232.5 would be realized by then.
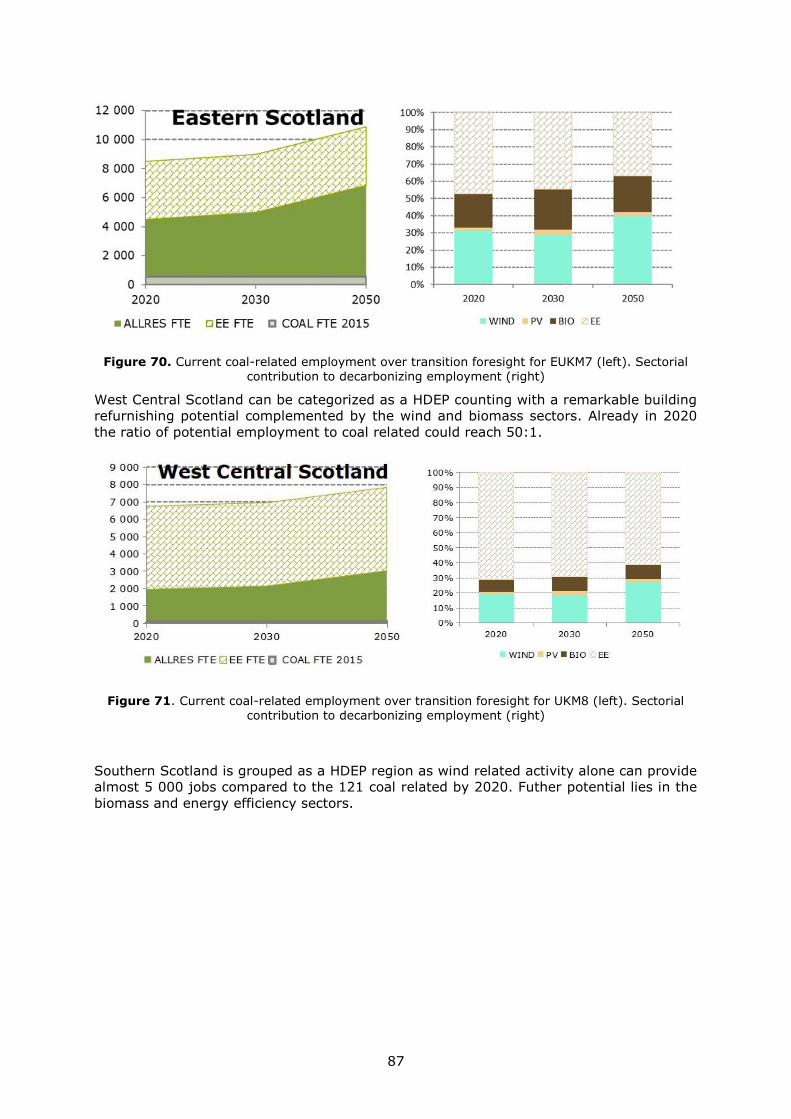
87
Figure 70. Current coal-related employment over transition foresight for EUKM7 (left). Sectorial
contribution to decarbonizing employment (right)
West Central Scotland can be categorized as a HDEP counting with a remarkable building
refurnishing potential complemented by the wind and biomass sectors. Already in 2020
the ratio of potential employment to coal related could reach 50:1.
Figure 71. Current coal-related employment over transition foresight for UKM8 (left). Sectorial contribution to decarbonizing employment (right)
Southern Scotland is grouped as a HDEP region as wind related activity alone can provide
almost 5 000 jobs compared to the 121 coal related by 2020. Futher potential lies in the
biomass and energy efficiency sectors.
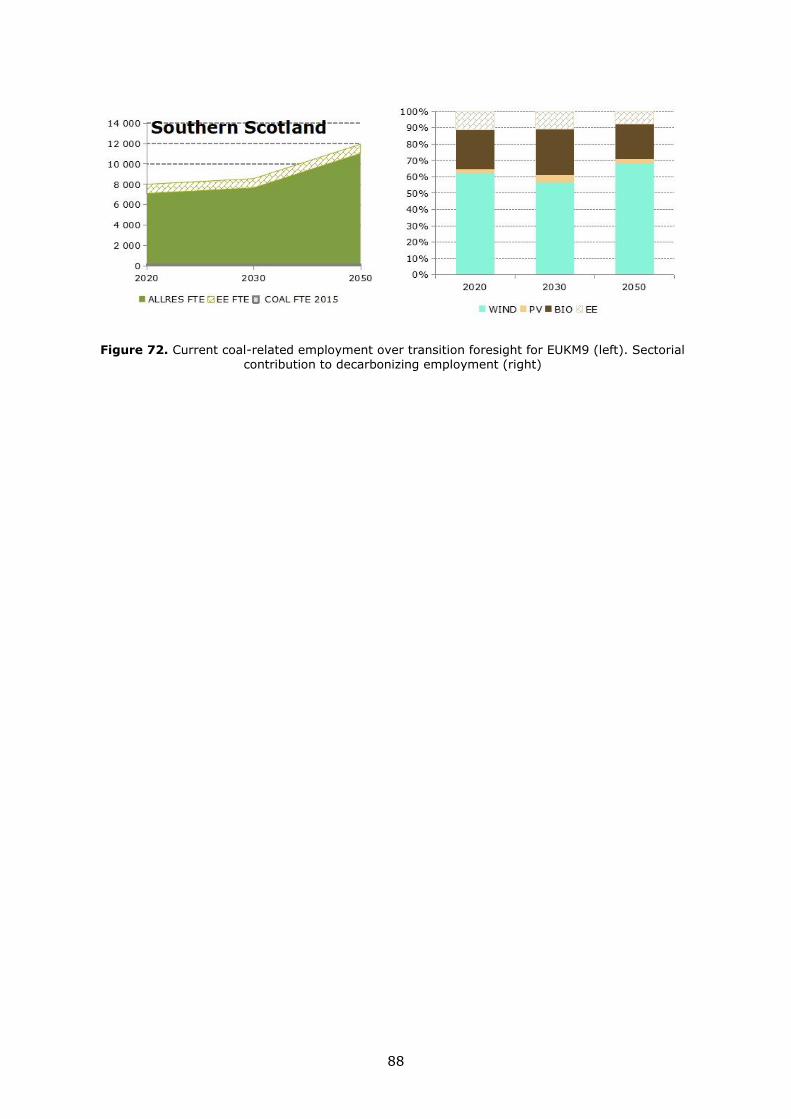
88
Figure 72. Current coal-related employment over transition foresight for EUKM9 (left). Sectorial contribution to decarbonizing employment (right)
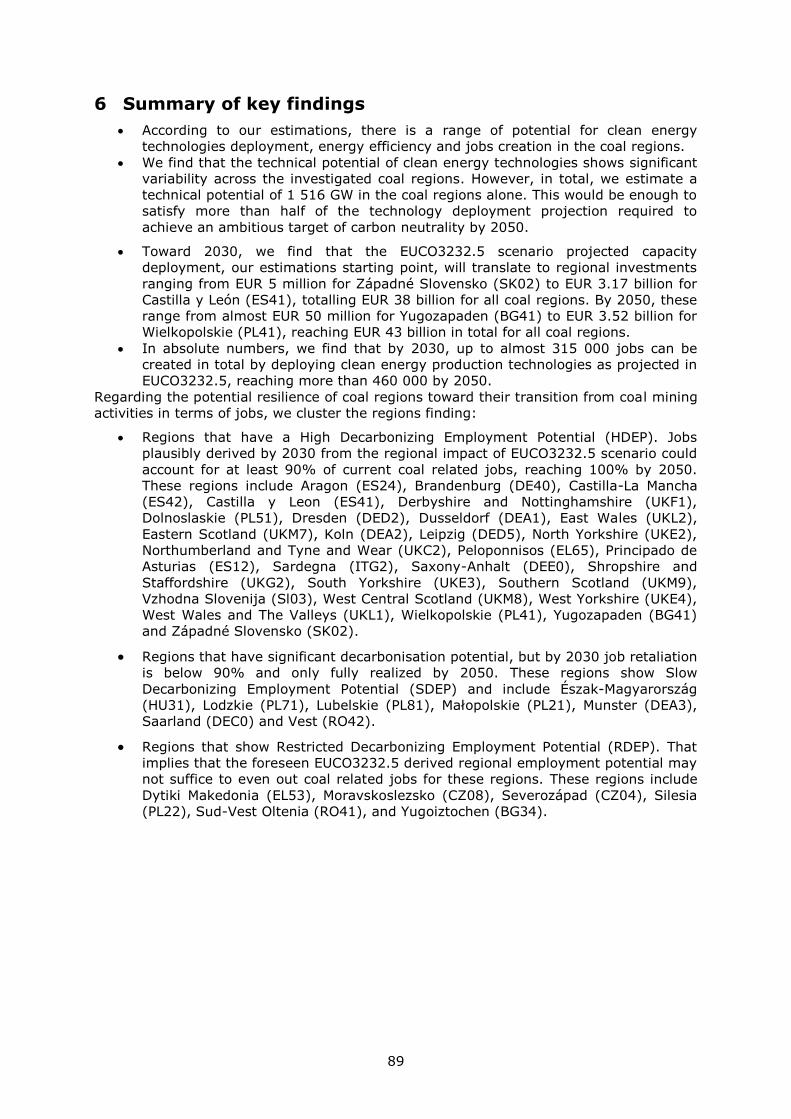
89
6 Summary of key findings
According to our estimations, there is a range of potential for clean energy
technologies deployment, energy efficiency and jobs creation in the coal regions.
We find that the technical potential of clean energy technologies shows significant
variability across the investigated coal regions. However, in total, we estimate a
technical potential of 1 516 GW in the coal regions alone. This would be enough to
satisfy more than half of the technology deployment projection required to
achieve an ambitious target of carbon neutrality by 2050.
Toward 2030, we find that the EUCO3232.5 scenario projected capacity
deployment, our estimations starting point, will translate to regional investments
ranging from EUR 5 million for Západné Slovensko (SK02) to EUR 3.17 billion for
Castilla y León (ES41), totalling EUR 38 billion for all coal regions. By 2050, these
range from almost EUR 50 million for Yugozapaden (BG41) to EUR 3.52 billion for
Wielkopolskie (PL41), reaching EUR 43 billion in total for all coal regions.
In absolute numbers, we find that by 2030, up to almost 315 000 jobs can be
created in total by deploying clean energy production technologies as projected in
EUCO3232.5, reaching more than 460 000 by 2050.
Regarding the potential resilience of coal regions toward their transition from coal mining
activities in terms of jobs, we cluster the regions finding:
Regions that have a High Decarbonizing Employment Potential (HDEP). Jobs
plausibly derived by 2030 from the regional impact of EUCO3232.5 scenario could
account for at least 90% of current coal related jobs, reaching 100% by 2050.
These regions include Aragon (ES24), Brandenburg (DE40), Castilla-La Mancha
(ES42), Castilla y Leon (ES41), Derbyshire and Nottinghamshire (UKF1),
Dolnoslaskie (PL51), Dresden (DED2), Dusseldorf (DEA1), East Wales (UKL2),
Eastern Scotland (UKM7), Koln (DEA2), Leipzig (DED5), North Yorkshire (UKE2),
Northumberland and Tyne and Wear (UKC2), Peloponnisos (EL65), Principado de
Asturias (ES12), Sardegna (ITG2), Saxony-Anhalt (DEE0), Shropshire and
Staffordshire (UKG2), South Yorkshire (UKE3), Southern Scotland (UKM9),
Vzhodna Slovenija (Sl03), West Central Scotland (UKM8), West Yorkshire (UKE4),
West Wales and The Valleys (UKL1), Wielkopolskie (PL41), Yugozapaden (BG41)
and Západné Slovensko (SK02).
Regions that have significant decarbonisation potential, but by 2030 job retaliation
is below 90% and only fully realized by 2050. These regions show Slow
Decarbonizing Employment Potential (SDEP) and include Észak-Magyarország
(HU31), Lodzkie (PL71), Lubelskie (PL81), Małopolskie (PL21), Munster (DEA3),
Saarland (DEC0) and Vest (RO42).
Regions that show Restricted Decarbonizing Employment Potential (RDEP). That
implies that the foreseen EUCO3232.5 derived regional employment potential may
not suffice to even out coal related jobs for these regions. These regions include
Dytiki Makedonia (EL53), Moravskoslezsko (CZ08), Severozápad (CZ04), Silesia
(PL22), Sud-Vest Oltenia (RO41), and Yugoiztochen (BG34).
90
References
Agora Energiewende and Sandbag (2019) The European Power Sector in 2018. Up-to-
date analysis on the electricity transition. Available at: https://sandbag.org.uk/wp-
content/uploads/2019/01/The-European-Power-Sector-in-2018-1.pdf.
Alves Dias et al. (2018) EU coal regions: Opportunities and Challenges Ahead
(JRC112593 EUR 29292 EN). doi: 10.2760/064809.
Alves Dias, P. et al. (2018) Cobalt: demand-supply balances in the transition to electric
mobility. Available at:
http://publications.jrc.ec.europa.eu/repository/bitstream/JRC112285/jrc112285_cobalt.p
df.
Annoni, P., Dijkstra, L. and Gargano, N. (2017) ‘The EU Regional Competitiveness Index
2016’.
Asdrubali, F. et al. (2015) ‘Life cycle assessment of electricity production from renewable
energies: Review and results harmonization’, Renewable and Sustainable Energy
Reviews. Elsevier, 42, pp. 1113–1122. doi: 10.1016/j.rser.2014.10.082.
Baranzelli, C. et al. (2016) Regional patterns of energy production and consumption
factors in Europe.
Bertani, R. and Thain, I. (2002) ‘Geothermal power generating plant CO2 emission
survey’, International Geothermal Association (IGA) News, 49, pp. 1–3. Available at:
www.geothermal-energy.org/308,iga_newsletter.html.
BGR (2019) Subsurface use/CO2 Storage, Is there enough storage capacity? Available
at:
https://www.bgr.bund.de/EN/Themen/Nutzung_tieferer_Untergrund_CO2Speicherung/C
O2Speicherung/FAQ/faq_inhalt_en.html?nn=7981658 (Accessed: 19 September 2003).
Bódis, K. et al. (2019) ‘Quantifying the potential role of rooftop solar photovoltaics: an
EU-wide assessment’, Energy (Submitted).
Boermans, T. et al. (2015) Assessment of cost optimal calculations in the context of the
EPBD. Final report of the tender ENER/C3/2013-414.
Bonou, A., Laurent, A. and Olsen, S. I. (2016) ‘Life cycle assessment of onshore and
offshore wind energy-from theory to application’, Applied Energy, 180, pp. 327–337. doi:
http://dx.doi.org/10.1016/j.apenergy.2016.07.058.
Brown, A. et al. (2016) Estimating Renewable Energy Economic Potential in the United
States: Methodology and Initial Results, Technical Report NREL/TP-6A20-64503, 2016.
Available at: https://www.nrel.gov/docs/fy15osti/64503.pdf.
Bundesnetzagentur (2018) Publication of the installations register, Database -
Installations register. Available at:
https://www.bundesnetzagentur.de/DE/Sachgebiete/ElektrizitaetundGas/Unternehmen_I
nstitutionen/ErneuerbareEnergien/ZahlenDatenInformationen/EEG_Registerdaten/EEG_R
egisterdaten_node.html (Accessed: 15 February 2018).
Carlsson, J. (2014) Energy Technology Reference Indicator (ETRI) Projections for 2010-
2050. EUR 26950 EN. Luxembourg: Publications Office of the European Union. Available
at: http://setis.ec.europa.eu/system/files/ETRI 2014.pdf.
Celik, A. N., Muneer, T. and Clarke, P. (2009) ‘A review of installed solar photovoltaic and
thermal collector capacities in relation to solar potential for the EU-15’, Renewable
Energy. Elsevier Ltd, 34(3), pp. 849–856. doi: 10.1016/j.renene.2008.05.025.
Chamorro, C. R. et al. (2014) ‘Enhanced geothermal systems in Europe: An estimation
and comparison of the technical and sustainable potentials’, Energy, 65, pp. 250–263.
doi: 10.1016/j.energy.2013.11.078.
‘Corine Land Cover (CLC) 2018, Version 20b2’ (2018). European Environment Agency.
91
D’Agostino, D. et al. (2016) Synthesis Report on the National Plans for Nearly Zero
Energy Buildings (NZEBs). doi: doi: 10.2790/659611.
Dalla Longa, F. et al. (2018) Wind potentials for EU and neighbouring countries: Input
datasets for the JRC-EU-TIMES Model, EUR 29083 EN. Luxembourg. doi:
10.2760/041705.
Danish Wind Industry Association (2003) Park effect. Available at:
http://drømstørre.dk/wp-content/wind/miller/windpower web/en/tour/wres/park.htm
(Accessed: 21 February 2019).
Dodd, N., Espinosa, N. and Bennett, M. (2018) ‘Preparatory study for solar photovoltaic
modules , inverters and systems’, JRC Technical Reports, (June), p. 75.
Ecofys (2008) The potential role of Carbon Capture and Storage, under different policy
options.
Energiebauern-gmbh (2018) Freilandprojekte - Photovoltaik-Kraftwerk Haselbach,
Website. Available at: http://energiebauern-
gmbh.de/deutsch/referenzen/freilandprojekte.htm (Accessed: 15 February 2018).
Envalue (2018) Solarparks - Hochkippe. Available at:
http://www.envalue.de/de/referenzen/solarparks.php?page=2 (Accessed: 15 February
2018).
EurObserv’ER (2017) ‘The State of Renewable Energies in Europe. 16th EurObserv’ER
Report’, 33(December 2011), pp. 4–7.
European Commission (2014a) Energy Technology Reference Indicator (ETRI) Projections
for 2010-2050. EUR 26950 EN. Luxembourg: Publications Office of the European Union.
European Commission (2014b) Renewables: Energy and Equipment Trade Developments
in the EU. Directorate-General for Economic and Financial Affair. doi: 10.2765/72195.
European Commission (2017) COMMUNICATION FROM THE COMMISSION TO THE
EUROPEAN PARLIAMENT, THE EUROPEAN COUNCIL, THE COUNCIL, THE EUROPEAN
ECONOMIC AND SOCIAL COMMITTEE, THE COMMITTEE OF THE REGIONS AND THE
EUROPEAN INVESTMENT BANK - Investing in a smart, innovative and sustainable I.
Available at: https://ec.europa.eu/transparency/regdoc/rep/1/2017/EN/COM-2017-479-
F1-EN-MAIN-PART-1.PDF.
European Commission (2018a) COMMUNICATION FROM THE COMMISSION TO THE
EUROPEAN PARLIAMENT, THE COUNCIL, THE EUROPEAN ECONOMIC AND SOCIAL
COMMITTEE AND THE COMMITTEE OF THE REGIONS - EUROPE ON THE MOVE -
Sustainable Mobility for Europe: safe, connected, and clean. Available at:
http://ec.europa.eu/transparency/regdoc/rep/1/2018/EN/COM-2018-293-F1-EN-MAIN-
PART-1.PDF.
European Commission (2018b) IN-DEPTH ANALYSIS IN SUPPORT OF THE COMMISSION
COMMUNICATION COM ( 2018 ) 773 A Clean Planet for all A European long-term
strategic vision for a prosperous , modern , competitive and Table of Contents.
European Commission (2018c) ‘Product Environmental Footprint Category Rules (PEFCR):
Photovoltaic Modules used in Photovoltaic Power Systems for Electricity Generation’.
European Commission (2019a) REPORT FROM THE COMMISSION TO THE EUROPEAN
PARLIAMENT, THE COUNCIL, THE EUROPEAN ECONOMIC AND SOCIAL COMMITTEE, THE
COMMITTEE OF THE REGIONS AND THE EUROPEAN INVESTMENT BANK - on the
Implementation of the Strategic Action Plan on Batteries: Building a Str. Available at:
http://ec.europa.eu/transparency/regdoc/rep/1/2019/EN/COM-2019-176-F1-EN-MAIN-
PART-1.PDF.
European Commission (2019b) Technical report on Member State results of the
EUCO3232.5 policy scenarios.
92
European Commission - Joint Research Centre - Unit C.7 Knowledge for the Energy Union
(2018) ‘JRC Wind Energy Database’. Unpublished.
European Environment Agency (2017) CORINE Land Cover Copernicus Land Monitoring
Service. Available at: http://land.copernicus.eu/pan-european/corine-land-cover.
European Parliament & Council (2009) Directive 2009/31/EC of the European Parliament
and of the Council of 23 April 2009 on the geological storage of carbon dioxide and
amending Council Directive 85/337/EEC, European Parliament and Council Directives
2000/60/EC, 2001/80/EC, 2004/35/EC, 2006/. Available at: https://eur-
lex.europa.eu/legal-content/EN/TXT/?uri=CELEX:32009L0031#document1.
European Parliament & Council (2010) Directive 2010/75/EU of the European Parliament
and of the Council of 24 November 2010 on industrial emissions (integrated pollution
prevention and control). Available at: https://eur-lex.europa.eu/legal-
content/EN/TXT/?uri=CELEX:32010L0075.
European Spatial Agency (2015) 300 m annual global land cover time series from 1992
to 2015. CCI Land Cover Project. Available at: https://www.esa-landcover-
cci.org/?q=node/175.
Eurostat (2019a) Energy from Biomass. Available at:
https://ec.europa.eu/eurostat/web/environmental-data-centre-on-natural-resources-
old/natural-resources/energy-resources/energy-from-biomass.
Eurostat (2019b) Maximum electrical capacity, EU-28, 2000-2017. Available at:
https://ec.europa.eu/eurostat/statistics-
explained/index.php?title=File:Maximum_electrical_capacity,_EU-28,_2000-
2017_(MW).png.
EUROSTAT (2016) Animal populations by NUTS 2 regions. Available at:
https://ec.europa.eu/eurostat/web/products-datasets/product?code=tgs00045.
EUROSTAT (2017) European Statistics. Available at: http://ec.europa.eu/eurostat.
Fragkos, P. and Paroussos, L. (2018) ‘Employment creation in EU related to renewables
expansion’, Applied Energy. Elsevier, 230(August), pp. 935–945. doi:
10.1016/j.apenergy.2018.09.032.
Geothermal Power Technology Brief (2017). Abu Dhabi: International Renewable Energy
Agency (IRENA).
German Commission on Growth Structural Change and Employment (2019) Kommission
„Wachstum, Strukturwandel und Beschäftigung“. Available at:
https://www.handelsblatt.com/downloads/23912864/3/190126_abschlussbericht_kommi
ssion-wachstum-strukturwandel-und-beschaeftigung_beschluss.pdf?ticket=ST-9628737-
9wLDzAkOT3PlPi6gcpJH-ap6.
Global CCS Institute (2015) The costs of CCS and other low-carbon technologies in the
united states - 2015 update. Available at:
https://hub.globalccsinstitute.com/sites/default/files/publications/195008/costs-ccs-
other-low-carbon-technologies-united-states-2015-update.pdf.
Global CCS Institute (2017) Global Costs of Carbon Capture and Storage. Available at:
https://hub.globalccsinstitute.com/sites/default/files/publications/201688/global-ccs-
cost-updatev4.pdf.
Goldstein, B. et al. (2011) ‘Geothermal Energy’, in Edenhofer, O. et al. (eds) IPCC
Special Report on Renewable Energy Sources and Climate Change Mitigation.
Cambridge/New York: Cambridge University Press.
González-Aparicio, I. et al. (2017) ‘Simulating European wind power generation applying
statistical downscaling to reanalysis data’, Applied Energy. Elsevier, 199, pp. 155–168.
doi: 10.1016/J.APENERGY.2017.04.066.
93
Gonzalez Aparicio, I., Zucker, A., et al. (2016) EMHIRES dataset: Wind power
generation. European Meteorological derived HIgh resolution RES generation time series
for present and future scenarios. (2016) EUR 28171 EN; 10.2790/831549. doi:
10.2790/831549.
Gonzalez Aparicio, I., Zucker, Andreas Careri, Francesco Monforti, F., et al. (2016)
EMHIRES dataset. Part I: Wind power generation European Meteorological derived HIgh
resolution RES generation time series for present and future scenarios; EUR 28171 EN;
10.2790/83154.
Google Inc. (2019) ‘Google Earth Pro, 2019. Google.’
Graus, W. et al. (2011) ‘The promise of carbon capture and storage: evaluating the
capture-readiness of new EU fossil fuel power plants.’, Climate Policy, pp. 789–812.
Greenpeace (2015) Energy [ R ] Evolution - A sustainable world energy outlook 2015.
Available at: https://elib.dlr.de/98314/.
Guidolin, M. and Alpcan, T. (2019) ‘Transition to sustainable energy generation in
Australia: Interplay between coal, gas and renewables’, Renewable Energy. Elsevier Ltd,
139, pp. 359–367. doi: 10.1016/j.renene.2019.02.045.
Guidolin, M. and Guseo, R. (2016) ‘The German energy transition: Modeling competition
and substitution between nuclear power and Renewable Energy Technologies’, Renewable
and Sustainable Energy Reviews. Elsevier, 60, pp. 1498–1504. doi:
10.1016/j.rser.2016.03.022.
Hagentoft, C. E. (2001) An Introduction to Building Physics. 1st edn. Studentlitteratur
AB.
Hermelink, A. et al. (2013) Towards nearly zero energy buildings, Definition of common
principles under the EPBD. Final report of project number: BESDE10788. Available at:
https://ec.europa.eu/energy/sites/ener/files/documents/nzeb_full_report.pdf.
IEA (2017) ‘Renewables 2017: Analysis and Forecasts to 2022’, p. 188. doi:
10.1787/re_mar-2017-en.
IEA (2018) World Energy Outlook 2018. Paris. Available at: https://www.iea.org/weo/.
IEAGHG (2015) Integrated Carbon Capture and Storage Project at SaskPower’s Boundary
Dam Station. Available at: https://ieaghg.org/docs/General_Docs/Reports/2015-06.pdf.
Ilbahar, E., Cebi, S. and Kahraman, C. (2019) ‘A state-of-the-art review on multi-
attribute renewable energy decision making’, Energy Strategy Reviews. Elsevier,
25(September 2018), pp. 18–33. doi: 10.1016/j.esr.2019.04.014.
IPCC (2014) Annex II: Metrics & Methodology. In: Climate Change 2014: Mitigation of
Climate Change. Contribution of Working Group III to the Fifth Assessment Report of the
Intergovernmental Panel on Climate Change. Cambridge, United Kingdom and New York,
NY, USA. Available at:
https://www.ipcc.ch/site/assets/uploads/2018/02/ipcc_wg3_ar5_annex-ii.pdf.
IRENA (2017a) Geothermal Power Technology Brief. Abu Dhabi: International Renewable
Energy Agency (IRENA).
IRENA (2017b) Renewable energy benefits: Leveraging local capacity for onshore wind.
Abu Dhabi. Available at: https://www.irena.org/-
/media/Files/IRENA/Agency/Publication/2017/Jun/IRENA_Leveraging_for_Onshore_Wind
_Executive_Summary_2017.pdf?la=en&hash=9E05D357E39A1E054583A3F3FB8820927C
68233A.
IRENA (2017c) Renewable energy benefits: Leveraging local capacity for solar PV. Abu
Dhabi. Available at: https://www.irena.org/-
/media/Files/IRENA/Agency/Publication/2017/Jun/IRENA_Leveraging_for_Solar_PV_2017
.pdf?la=en&hash=8F7696966CF492DE832EA83024021B98E37A0260.
94
IRENA (2018) Renewable power generation costs in 2017. Abu Dhabi. Available at:
file:///C:/Users/kapetzo/Downloads/IRENA_2017_Power_Costs_2018 (1).pdf.
IRENA (2019) Renewable capacity statistics 2019. Abu Dhabi. Available at:
https://www.irena.org/publications/2019/Mar/Renewable-Capacity-Statistics-2019.
Joint Research Centre (2019) ENSPRESO - an open data, EU-28 wide, transparent and
coherent database of wind, solar and biomass energy potentials. Available at:
http://publications.jrc.ec.europa.eu/repository/handle/JRC116900.
Kanellopoulos, K. et al. (2017) The Joint Research Centre Power Plant Database (JRC-
PPDB) - A European Power Plant Database for energy modelling,. doi: 10.2760/329310.
Khellaf, A. (2018) ‘Overview of Economic Viability and Social Impact of Renewable
Energy Deployment in Africa’, in Mpholo, M., Steuerwald, D., and Kukeera, T. (eds)
Africa-EU Renewable Energy Research and Innovation Symposium 2018 (RERIS 2018).
Cham: Springer International Publishing, pp. 59–70.
Limberger, J. et al. (2014) ‘Assessing the prospective resource base for enhanced
geothermal systems in Europe’, Geothermal Energy Science, 2, pp. 55–71. doi:
10.5194/gtes-2-55-2014.
LMBV (2015) LMBV Lausitzer und Mitteldeutschen Bergbau-Verwaltungsgesellschaft -
Meuro - Kleinleipisch / Klettwitz / Klettwitz-Nord. Senftenberg. Available at:
https://www.lmbv.de/index.php/Wandlungen_Perspektiven_Lausitz.html?file=files/LMBV/
Publikationen/Publikationen Lausitz/Wandlungen und Perspektiven L/doku
04_Klettwitz.pdf.
LMBV (2016) LMBV Lausitzer und Mitteldeutschen Bergbau-Verwaltungsgesellschaft -
Meuro. Senftenberg. Available at:
https://www.lmbv.de/index.php/Wandlungen_Perspektiven_Lausitz.html?file=files/LMBV/
Publikationen/Publikationen Lausitz/Wandlungen und Perspektiven L/doku 10_Meuro.pdf.
LMWindPower (2019) Ponferrada plant boosts blade production, LMWindPower. Available
at: https://www.lmwindpower.com/en/stories-and-press/stories/news-from-lm-
places/ponferrada-plant-boosts-blade-production.
Lugato, E. et al. (2014) ‘A new baseline of organic carbon stock in European agricultural
soils using a modelling approach’, Global Change Biology, 20(1), pp. 313–326. doi:
10.1111/gcb.12292.
Magagna, D. et al. (2017) Supply chain of renewable energy technologies in Europe : An
analysis for wind , geothermal and ocean energy Supply chain of renewable energy
technologies in Europe. Publications Office of the European Union. doi: 10.2760/271949.
Marsidi, M. et al. (2017) Renewable energy employment effects in the EU and the
Member States - Methodology Report.
Mining Atlas (2019) Mining atlas. Available at: https://mining-atlas.com/.
Monfreda, C., Ramankutty, N. and Foley, J. A. (2008) ‘Farming the planet: 2. Geographic
distribution of crop areas, yields, physiological types, and net primary production in the
year 2000’, Global Biogeochemical Cycles, 22(1). doi: 10.1029/2007GB002947.
Nationally designated areas (CDDA) (2018). European Environment Agency. Available at:
https://www.eea.europa.eu/data-and-maps/data/nationally-designated-areas-national-
cdda-13.
‘Nomenclature of Territorial Units for Statistics (NUTS) 2016 - Statistical Units - Data set’
(2018). European Commission, Eurostat (ESTAT), GISCO. Available at:
https://webgate.ec.europa.eu/fpfis/wikis/x/vQXOB.
Nugent, D. and Sovacool, B. K. (2014) ‘Assessing the lifecycle greenhouse gas emissions
from solar PV and wind energy: A critical meta-survey’, Energy Policy. Elsevier, 65, pp.
229–244. doi: 10.1016/j.enpol.2013.10.048.
95
Ortega, M. et al. (2015) ‘Employment effects of renewable electricity deployment . A
novel methodology’, Energy, 91(October), pp. 940–951. doi:
10.1016/j.energy.2015.08.061.
Ossenbrink, H. et al. (2015) ‘Perspectives on Future Large-Scale Manufacturing of PV in
Europe’, p. 39.
Poulsen, N. et al. (2014) CO2StoP Final Report Assessment of CO2 storage potential in
Europe. Available at: https://ec.europa.eu/energy/sites/ener/files/documents/56-2014
Final report.pdf.
PVGIS (2019) PVGIS. Available at: http://re.jrc.ec.europa.eu/pvgis.html (Accessed: 19
March 2019).
Robinson, T. P. et al. (2014) ‘Mapping the Global Distribution of Livestock’, PLOS ONE.
Public Library of Science, 9(5), pp. 1–13. doi: 10.1371/journal.pone.0096084.
Rubin, E. S., Davison, J. E., & Herzog, H. J. (2015) ‘The cost of CO2 capture and
storage’, International Journal of Greenhouse Gas Control.
Ruiz, P. et al. (2015) The JRC-EU-TIMES model. Bioenergy potentials for EU and
neighbouring countries. JRC 98626 Report. doi: 10.2790/01017.
Ruiz, Pablo et al. (2015) The JRC-EU-TIMES model. Bioenergy potentials for EU and
neighbouring countries. doi: 10.2790/39014.
Scarlat, N. et al. (2018) ‘A spatial analysis of biogas potential from manure in Europe’,
Renewable and Sustainable Energy Reviews. Pergamon, 94, pp. 915–930. doi:
10.1016/J.RSER.2018.06.035.
Scarlat, N. et al. (2019) ‘Integrated and spatially explicit assessment of sustainable crop
residues potential in Europe’, Biomass and Bioenergy. Pergamon, 122, pp. 257–269. doi:
10.1016/J.BIOMBIOE.2019.01.021.
Scarlat, N., Fahl, F. and Dallemand, J.-F. (2018) ‘Status and Opportunities for Energy
Recovery from Municipal Solid Waste in Europe’, Waste and Biomass Valorization. doi:
10.1007/s12649-018-0297-7.
Scarlat, N., Martinov, M. and Dallemand, J.-F. (2010) ‘Assessment of the availability of
agricultural crop residues in the European Union: Potential and limitations for bioenergy
use’, Waste Management. Pergamon, 30(10), pp. 1889–1897. doi:
10.1016/J.WASMAN.2010.04.016.
SET-Plan PV TWG (2017) ‘SET-Plan TWP PV Implementation Plan’. Available at:
https://setis.ec.europa.eu/system/files/set_plan_pv_implmentation_plan.pdf.
Sievers, L. et al. (2019) ‘Macroeconomic impact of the German energy transition and its
distribution by sectors and regions’, Ecological Economics. Elsevier, 160(March), pp.
191–204. doi: 10.1016/j.ecolecon.2019.02.017.
Sigfússon, B. and Uihlein, A. (2015) 2014 JRC Geothermal Energy Status Report. EUR
26985. Luxembourg: Publications Office of the European Union. doi: 10.2790/460251.
Sigfusson, B. and Uihlein, A. (2015) 2015 JRC Geothermal Energy Status Report. EUR
27623. Luxembourg: Publications Office of the European Union. doi: 10.2790/959587.
Solar-konzept GmbH (2018a) List of references - Geiseltalsee, Website. Available at:
https://www.solar-konzept.de/referenzen?lightbox=dataItem-iu8jotch2 (Accessed: 15
February 2018).
Solar-konzept GmbH (2018b) List of references - Schwarzheide, Website. Available at:
https://www.solar-konzept.de/referenzen?lightbox=dataItem-itek483k (Accessed: 15
February 2018).
Solar Power Europe (2017) Solar PV Jobs & Value Added in Europe. Available at:
http://www.solarpowereurope.org/solar-pv-jobs-value-added-in-europe/.
96
Spisto, A. et al. (2014) ETRI 2014 - Energy Technology Reference Indicator (ETRI)
projections for 2010-2050, Science for Policy Report. Luxembourg. doi: 10.2790/057687.
SRTM (2019) SRTM Data. Available at: http://srtm.csi.cgiar.org/srtmdata/ (Accessed: 19
March 2019).
Steen, M. et al. (2017) EU competitiveness in advanced Li-ion batteries for e-mobility
and stationary storage application – opportunities and actions. Available at:
http://publications.jrc.ec.europa.eu/repository/bitstream/JRC108043/kjna28837enn.pdf.
Towards more geothermal electricity generation in Europe (2014). Brussels: Geoelec.
Available at: http://www.geoelec.eu/wp-content/uploads/2014/01/GEOELEC-report-
web.pdf.
Triple-e, Ricardo-AEA and TNO (2015) Study to support the review and evaluation of
Directive 2009/31/EC on the geological storage of carbon dioxide (CCS Directive).
Available at: https://publications.europa.eu/en/publication-detail/-/publication/3f0867e1-
8e88-11e5-b8b7-01aa75ed71a1.
Tsiropoulos, Ioannis; Tarvydas, Dalius; Zucker, A. (2018) Cost development of low
carbon energy technologies. doi: 10.2760/23266.
Tsiropoulos, I., Tarvydas, D. and Lebedeva, N. (2018) Li-ion batteries for mobility and
stationary storage applications. doi: 10.2760/87175.
Tsiropoulos, I., Tarvydas, D. and Zucker, A. (2018a) ‘Cost development of low carbon
energy technologies. [Dataset] PID: http://data.europa.eu/89h/jrc-etri-10003’. Petten:
European Commission, Joint Research Centre (JRC). Available at:
https://data.jrc.ec.europa.eu/dataset/jrc-etri-10003.
Tsiropoulos, I., Tarvydas, D. and Zucker, A. (2018b) Cost development of low carbon
energy technologies - Scenario-based cost trajectories to 2050, 2017 Edition, EUR 29034
EN, JRC109894. Luxembourg. doi: 10.2760/490059.
US DOE/NETL (2015a) Cost and Performance Baseline for Fossil Energy Plants Volume
1a: Bituminous Coal (PC) and Natural Gas to Electricity Revision 3.
US DOE/NETL (2015b) Cost and Performance Baseline for Fossil Energy Plants Volume
1b: Revision 2b. Available at:
https://www.netl.doe.gov/projects/files/CostandPerformanceBaselineforFEPlantsVol1bBit
CoalIGCCtoElecRev2bYearDollarUpdate_073115.pdf.
Vartiainen, E., Masson, G. and Breyer, C. (2014) PV LCoE in Europe 2014-30, Final
Report.
Verkerk, P. J. et al. (2011) ‘The realisable potential supply of woody biomass from forests
in the European Union’, Forest Ecology and Management. Elsevier, 261(11), pp. 2007–
2015. doi: 10.1016/J.FORECO.2011.02.027.
De Vita, A. et al. (2018) ‘Technology pathways in decarbonisation scenarios’, p. 62.
Available at:
https://ec.europa.eu/energy/sites/ener/files/documents/2018_06_27_technology_pathw
ays_-_finalreportmain2.pdf.
van Wees, J.-D. et al. (2013) A prospective study on the geothermal potential in the EU.
Geoelec. Available at: http://www.geoelec.eu/wp-content/uploads/2011/09/D-2.5-
GEOELEC-prospective-study.pdf.
Wetzel, T. and Borchers, S. (2015) ‘Update of energy payback time and greenhouse gas
emission data for crystalline silicon photovoltaic modules’, Progress in Photovoltaics:
Research and Applications, 23(10), pp. 1429–1435. doi: 10.1002/pip.2548.
WEV (2014) Westsächsische Entsorgungs- und Verwertungsgesellschaft mbH -
Photovoltaikanlage WEV Cröbern, Website. Available at: http://www.wev-
sachsen.de/aktuell/2014-07-21-inbetriebnahme-der-photovoltaikanlage.html (Accessed:

97
15 February 2018).
Willemsen, A., Heller, R. and Wees, J. D. van (2011) Diepe geothermie 2050. Een visie
voor 20% duurzame energie voor Nederland Opdrachtgever. Arnhem: IF WEB.
Windindustry (2008) Sitting guidelines. Available at:
http://www.windustry.org/community_wind_toolbox_5_siting_guidelines.
Zangheri, P. et al. (2018) ‘Identification of cost-optimal and NZEB refurbishment levels
for representative climates and building typologies across Europe.’, Energy Efficiency,
11(2), pp. 337–369. doi: 10.1007/s12053-017-9566-8.
ZEP (2011) The costs of CO2 capture.
ZEP (2017) Future CCS Technologies. Available at:
http://www.zeroemissionsplatform.eu/news/news/1665-zep-publishes-future-ccs-
technologies-report.html.
98
List of abbreviations
BAT Best Available Techniques
BOS Balance Of System
CAPEX Capital Expenditure
CCR Carbon Capture Ready
CCUS Carbon Capture, Utilisation and Storage
CHP Combined Heat and Power
CRiT Coal Regions in Transition
EBA European Battery Alliance
EC European Commission
EGS Enhanced Geothermal Systems
EPBD Energy Performance of Buildings Directive
ETES Electric Thermal Storage
ETIP Energy Technology and Innovation Platform
EU European Union
FTE Full Time Equivalents
FOM Fixed Operation and Maintenance
GDP Gross Domestic Product
GHG Greenhouse Gas
GIS Geographic Information System
GW Gigawatt
GWh Gigawatt hours
HDD Heating Degree Days
HHH High Hub Height
HQ Head Quarters
IEA International Energy Agency
IED Industrial Emissions Directive
IRENA International Renewable Energy Agency
IT Information Technology
JRC Joint Research Centre
LCoE Levelised cost of Electricity
LSP Low Specific Power
MFH Multi-Family Houses
MWh Megawatt hours
NREL National Renewable Energy Laboratory
NUTS Nomenclature of territorial units for statistics (from the French version
Nomenclature des Unités territoriales statistiques)
NZEB Nearly Zero-Energy Buildings
OEM Original Equipment Manufacturer
99
OP Open pit or opencast mine
OPEX Operational Expenditure
PC Pulverised Coal
PCI Projects of Common Interest
PV Photovoltaic
RES Renewable Energy Systems
SET Strategic Energy Technology
SFH Single Family Houses
UG Underground mine
VAT Value Added Tax
ZEP European Platform for Zero Emissions Plants
100
List of figures
Figure 1. Resource, technical, economic and market potentials schematic (adapted from
(Brown et al., 2016)) ............................................................................................10
Figure 2. Technical potential (GW) for onshore wind energy in coal regions ................11
Figure 3. Cumulative technical potential (GW) for ground-mounted solar PV energy in
coal regions .........................................................................................................13
Figure 4. Cumulative technical potential (GW) for rooftop solar PV energy in coal regions
..........................................................................................................................14
Figure 5. Technical potential (MW) and optimum share of wind and solar PV capacity
(pie charts) in the operating coal mines of the regions in transition.............................16
Figure 6. Technical potential (GW/h) and optimum share of wind and solar PV
generation (pie charts) in the operating coal mines of the regions in transition .............17
Figure 7. Technical capacity potential (GW) for bioenergy from crop residues in coal
regions ................................................................................................................19
Figure 8. Technical potential (GW) for bioenergy from municipal solid waste in coal
regions ................................................................................................................20
Figure 11. Sustainable potential (GW) for geothermal energy in the coal regions ....24
Figure 12. Carbon capture potential capacity (GW) for PC power plants in the coal
regions 26
Figure 13. Carbon capture potential capacity (GW) for PC power plants in the coal
regions considering IED BAT ..................................................................................27
Figure 14. Primary energy saving potentials under technical cost-optimal scenario .33
Figure 15. Primary energy saving potentials under technical NZEB scenario ...........34
Figure 16. Primary energy saving potentials under business as usual at 2050
scenario 35
Figure 17. Industrial Li-ion battery activities in the coal regions in transition ..........38
Figure 18. Location of wind component manufacturing facilities in the EU28 (Source:
JRC analysis, last update in December 2018) ...........................................................41
Figure 19. Outline of the PV value chain .................................................................42
Figure 20. Sectorial breakdown of PV sector companies in the EU and Switzerland.
(source data: ENF Industry Directory 2019/Q1, analysis : JRC) ..................................43
Figure 21. Number of PV companies in the European coal regions in transition ...........44
Figure 22. Main job impact assessment steps .........................................................45
Figure 23. Range of percentage of national capacity estimated likely to be installed for
DEE0 (example coal region) ...................................................................................47
Figure 24. Range of percentage of national capacity estimated likely to be installed in
SK02 (example coal region) ...................................................................................47
Figure 25. Investment costs of low carbon energy technologies according to
literature (adapted from (Tsiropoulos, Ioannis; Tarvydas, Dalius; Zucker, 2018)) .........48
101
Figure 26. Investment cost of geothermal power between 2007 and 2020. Source:
(Geothermal Power Technology Brief, 2017) ............................................................53
Figure 27. 2030 CAPEX investments needs (EUR millions) to deploy the projected
minimum and maximum regional capacity of all technologies considered .....................56
Figure 28. Total wind employment expected evolution for the coal region hosting
countries (considering all regions in the country). .....................................................60
Figure 29. Total solar related employment expected evolution for the coal region's
countries (considering all regions in the country). .....................................................61
Figure 30. Total biomass production employment for the coal region's countries
(considering all regions in the country). ..................................................................63
Figure 31. Current coal-related employment over transition foresight for BG34 (left).
Sectorial contribution to decarbonizing employment (right)........................................67
Figure 32. Current coal-related employment over transition foresight for BG41 (left).
Sectorial contribution to decarbonizing employment (right)........................................68
Figure 33. Current coal-related employment over transition foresight for CZ04 (left).
Sectorial contribution to decarbonizing employment (right)........................................68
Figure 34. Current coal-related employment over transition foresight for CZ08 (left).
Sectorial contribution to decarbonizing employment (right)........................................69
Figure 35. Current coal-related employment over transition foresight for DE40 (left).
Sectorial contribution to decarbonizing employment (right)........................................69
Figure 36. Current coal-related employment over transition foresight for DEA1 (left).
Sectorial contribution to decarbonizing employment (right)........................................70
Figure 37. Current coal-related employment over transition foresight for DEA2 (left).
Sectorial contribution to decarbonizing employment (right)........................................70
Figure 38. Current coal-related employment over transition foresight for DEA3 (left).
Sectorial contribution to decarbonizing employment (right)........................................71
Figure 39. Current coal-related employment over transition foresight for DEC0 (left).
Sectorial contribution to decarbonizing employment (right)........................................71
Figure 40. Current coal-related employment over transition foresight for DED2 (left).
Sectorial contribution to decarbonizing employment (right)........................................72
Figure 41. Current coal-related employment over transition foresight for DED5 (left).
Sectorial contribution to decarbonizing employment (right)........................................72
Figure 42. Current coal-related employment over transition foresight for DEE0 (left).
Sectorial contribution to decarbonizing employment (right)........................................73
Figure 43. Current coal-related employment over transition foresight for EL53 (left).
Sectorial contribution to decarbonizing employment (right)........................................73
Figure 44. Current coal-related employment over transition foresight for EL65 (left).
Sectorial contribution to decarbonizing employment (right)........................................74
Figure 45. Current coal-related employment over transition foresight for ES12 (left).
Sectorial contribution to decarbonizing employment (right)........................................74
102
Figure 46. Current coal-related employment over transition foresight for ES21 (left).
Sectorial contribution to decarbonizing employment (right)........................................75
Figure 47. Current coal-related employment over transition foresight for ES24 (left).
Sectorial contribution to decarbonizing employment (right)........................................75
Figure 48. Current coal-related employment over transition foresight for ES41 (left).
Sectorial contribution to decarbonizing employment (right)........................................76
Figure 49. Current coal-related employment over transition foresight for ES42 (left).
Sectorial contribution to decarbonizing employment (right)........................................76
Figure 50. Current coal-related employment over transition foresight for HU31 (left).
Sectorial contribution to decarbonizing employment (right)........................................77
Figure 51. Current coal-related employment over transition foresight for ITG2 (left).
Sectorial contribution to decarbonizing employment (right)........................................77
Figure 52. Current coal-related employment over transition foresight for PL21 (left).
Sectorial contribution to decarbonizing employment (right)........................................78
Figure 53. Current coal-related employment over transition foresight for PL22 (left).
Sectorial contribution to decarbonizing employment (right)........................................78
Figure 54. Current coal-related employment over transition foresight for PL41 (left).
Sectorial contribution to decarbonizing employment (right)........................................79
Figure 55. Current coal-related employment over transition foresight for PL51 (left).
Sectorial contribution to decarbonizing employment (right)........................................79
Figure 56. Current coal-related employment over transition foresight for PL71 (left).
Sectorial contribution to decarbonizing employment (right)........................................80
Figure 57. Current coal-related employment over transition foresight for PL81 (left).
Sectorial contribution to decarbonizing employment (right)........................................80
Figure 58. Current coal-related employment over transition foresight for RO41 (left).
Sectorial contribution to decarbonizing employment (right)........................................81
Figure 59. Current coal-related employment over transition foresight for RO42 (left).
Sectorial contribution to decarbonizing employment (right)........................................81
Figure 60. Current coal-related employment over transition foresight for SK02 (left).
Sectorial contribution to decarbonizing employment (right)........................................82
Figure 61. Current coal-related employment over transition foresight for Sl03 (left).
Sectorial contribution to decarbonizing employment (right)........................................82
Figure 62. Current coal-related employment over transition foresight for UKC2 (left).
Sectorial contribution to decarbonizing employment (right)........................................83
Figure 63. Current coal-related employment over transition foresight for UKE2 (left).
Sectorial contribution to decarbonizing employment (right)........................................83
Figure 64. Current coal-related employment over transition foresight for UKE3 (left).
Sectorial contribution to decarbonizing employment (right)........................................84
Figure 65. Current coal-related employment over transition foresight for UKE4 (left).
Sectorial contribution to decarbonizing employment (right)........................................84
103
Figure 66. Current coal-related employment over transition foresight for UKF1 (left).
Sectorial contribution to decarbonizing employment (right)........................................85
Figure 67. Current coal-related employment over transition foresight for UKG2 (left).
Sectorial contribution to decarbonizing employment (right)........................................85
Figure 68. Current coal-related employment over transition foresight for UKL1 (left).
Sectorial contribution to decarbonizing employment (right)........................................86
Figure 69. Current coal-related employment over transition foresight for UKL2 (left).
Sectorial contribution to decarbonizing employment (right)........................................86
Figure 70. Current coal-related employment over transition foresight for EUKM7 (left).
Sectorial contribution to decarbonizing employment (right)........................................87
Figure 71. Current coal-related employment over transition foresight for UKM8 (left).
Sectorial contribution to decarbonizing employment (right)........................................87
Figure 72. Current coal-related employment over transition foresight for EUKM9 (left).
Sectorial contribution to decarbonizing employment (right)........................................88
Figure 73. Calculation scheme........................................................................ 170
Figure 74. Capacity density of the onshore wind farms installed in the EU28 in the
period 2000-2017 ............................................................................................... 178
104
List of tables
Table 1. Key operational characteristics of the investigated energy technologies based on
(European Commission, 2014a; Gonzalez Aparicio, Zucker, Andreas Careri, Francesco
Monforti, et al., 2016; González-Aparicio et al., 2017) and on (Tsiropoulos, Tarvydas and
Zucker, 2018b). PC fired plant characteristics based on (IPCC, 2014) and (European
Commission, 2014a). ............................................................................................11
Table 2. Key operational characteristics of PV power systems (without battery storage).
..........................................................................................................................13
Table 3. Key operational characteristics of bioenergy systems. ...................................18
Table 4. Key operational characteristics of geothermal power. ....................................23
Table 5. Key operational characteristics of Pulverised Coal (PC) plants. .......................25
Table 6. Energy saving with respect to the pre-retrofit primary energy level and
associated investment costs (EUR/m2) for the cost-optimal and NZEB renovation levels of
single family houses (SFH) and multi-family houses (MFH). .......................................29
Table 7. Number of wind component manufacturing facilities in operation in coal regions
in transition. ........................................................................................................39
Table 8. CAPEX and OPEX of onshore wind energy. ...................................................49
Table 9. CAPEX and OPEX of offshore wind energy. ...................................................50
Based on JRC analysis, Table 10 summarises the cost trends, for 4 distinct PV system
types: .................................................................................................................51
Table 10. CAPEX and OPEX of PV systems. ..............................................................51
Table 11. CAPEX and OPEX of bioenergy systems. ....................................................52
Table 12. CAPEX and OPEX of geothermal power plants. ............................................53
Table 13. CAPEX and OPEX of CCUS power plants. ....................................................55
Table 14. Regional capital expenditure under 3 scenarios. .........................................57
Table 15. Yearly full-time equivalent employments (FTE) in the equipment and
construction sectors, under the BAU scenario. ..........................................................64
Table continued. Yearly full-time equivalent employments (FTE) in the equipment and
construction sectors, under the BAU scenario. ..........................................................65
Table 16. Current, mid and long term regional potential employment ratios. ................66
Table 17. Estimated potential for onshore wind and solar energy in the coal regions. .. 150
Table 18. Estimated potential for offshore wind in countries hosting the coal regions. . 152
Table 19. Estimated potential for bioenergy (crop residues, livestock methane, and
municipal solid waste) in the coal regions. ............................................................. 153
Table 20. Estimated potential for bioenergy (forest biomass, high, medium, low
scenarios) in the coal regions. .............................................................................. 155
Table 21. Estimated potential for geothermal energy (maximum, realistic and
sustainable) in the coal regions. ........................................................................... 157
105
Table 22. Estimated potential for carbon capture and carbon capture with BAT
implementation in the coal regions. ...................................................................... 159
Table 23. Estimated coal mine reclamation potential for wind and solar energy in the coal
regions. ............................................................................................................. 160
The main data sources used for this study are summarised in .................................. 171
Table 24. Main data sources. ................................................................................ 172
Table 25. Characteristics of closed open-pit mines with existing wind energy projects. 175
Table 26. Characteristics of closed open-pit mines with existing solar PV energy projects.
........................................................................................................................ 176
Table 28. Average nominal capacity (units/year) of manufacturing facilities installed in
countries with coal regions in transition. ................................................................ 181
Table 29. Solar PV companies and organisations in the coal regions (NUTS 2). Source
data: ENF Industry Directory 2019/Q1, analysis: JRC. ............................................. 182
Table 30. 2030 estimated range of employment induced by activity in the region and
capital expenditure (CAPEX) by technology. ........................................................... 187
Table continued. 2030 estimated range of employment induced by activity in the region
and capital expenditure (CAPEX) by technology. ..................................................... 190
Figure 75. Ratio of investments over plausible jobs created (EUR million/job) for the coal
regions. ............................................................................................................. 191
Table 31. 2030 total employment induced by activity in the regions and ratio of
investments (CAPEX+OPEX) per job induced. ......................................................... 192
Table 32. 2030 total employment induced by activity in the regions and ratio of
investments (CAPEX+OPEX) per job induced. ......................................................... 193
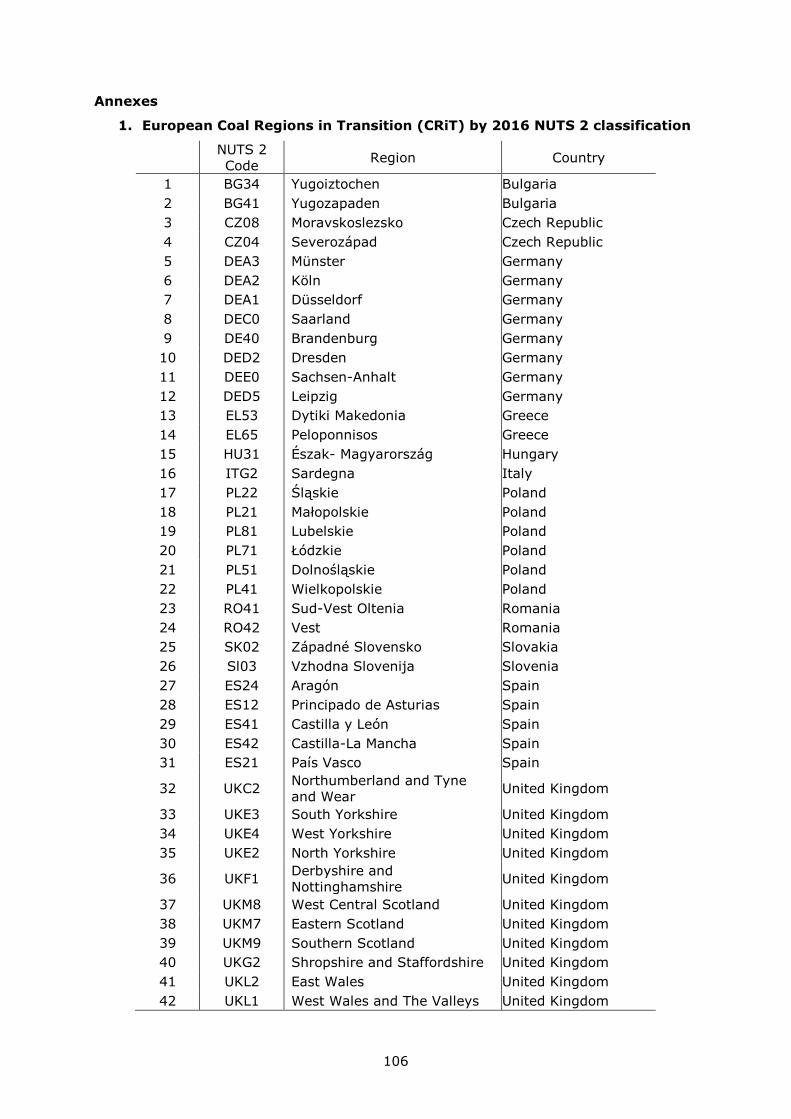
106
Annexes
1. European Coal Regions in Transition (CRiT) by 2016 NUTS 2 classification
NUTS 2
Code Region Country
1 BG34 Yugoiztochen Bulgaria
2 BG41 Yugozapaden Bulgaria
3 CZ08 Moravskoslezsko Czech Republic
4 CZ04 Severozápad Czech Republic
5 DEA3 Münster Germany
6 DEA2 Köln Germany
7 DEA1 Düsseldorf Germany
8 DEC0 Saarland Germany
9 DE40 Brandenburg Germany
10 DED2 Dresden Germany
11 DEE0 Sachsen-Anhalt Germany
12 DED5 Leipzig Germany
13 EL53 Dytiki Makedonia Greece
14 EL65 Peloponnisos Greece
15 HU31 Észak- Magyarország Hungary
16 ITG2 Sardegna Italy
17 PL22 Śląskie Poland
18 PL21 Małopolskie Poland
19 PL81 Lubelskie Poland
20 PL71 Łódzkie Poland
21 PL51 Dolnośląskie Poland
22 PL41 Wielkopolskie Poland
23 RO41 Sud-Vest Oltenia Romania
24 RO42 Vest Romania
25 SK02 Západné Slovensko Slovakia
26 Sl03 Vzhodna Slovenija Slovenia
27 ES24 Aragón Spain
28 ES12 Principado de Asturias Spain
29 ES41 Castilla y León Spain
30 ES42 Castilla-La Mancha Spain
31 ES21 País Vasco Spain
32 UKC2 Northumberland and Tyne
and Wear United Kingdom
33 UKE3 South Yorkshire United Kingdom
34 UKE4 West Yorkshire United Kingdom
35 UKE2 North Yorkshire United Kingdom
36 UKF1 Derbyshire and
Nottinghamshire United Kingdom
37 UKM8 West Central Scotland United Kingdom
38 UKM7 Eastern Scotland United Kingdom
39 UKM9 Southern Scotland United Kingdom
40 UKG2 Shropshire and Staffordshire United Kingdom
41 UKL2 East Wales United Kingdom
42 UKL1 West Wales and The Valleys United Kingdom
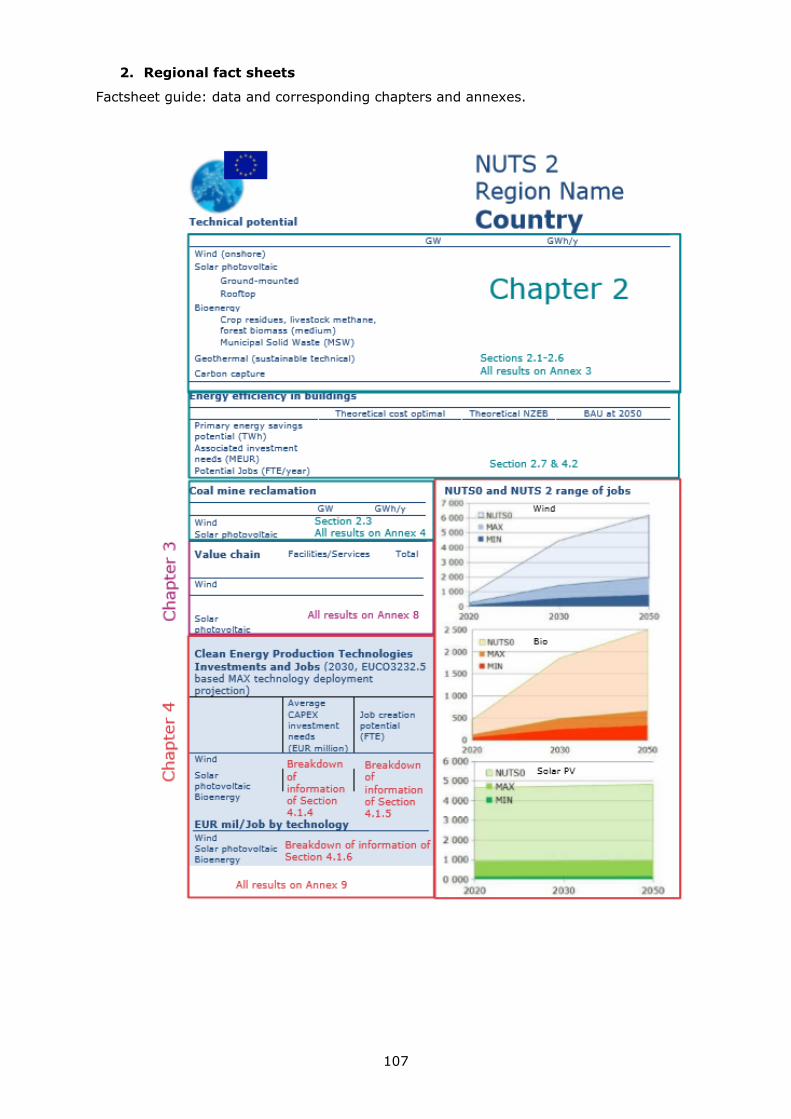
107
2. Regional fact sheets
Factsheet guide: data and corresponding chapters and annexes.
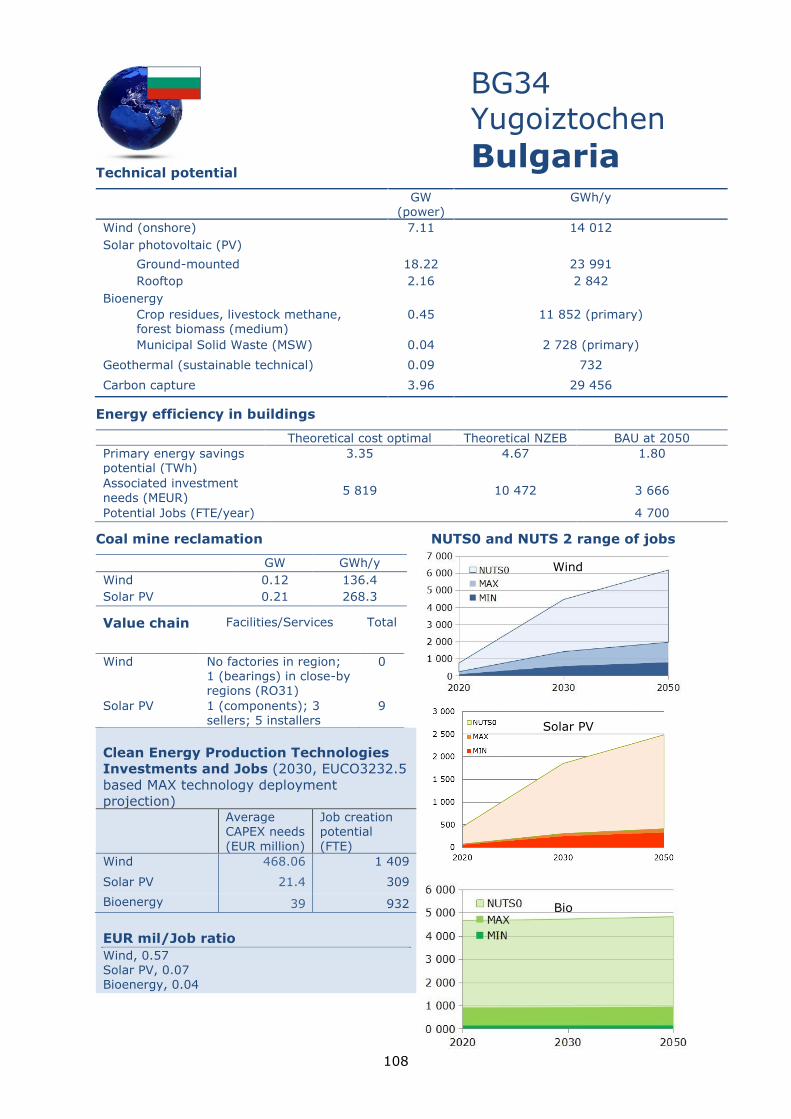
108
Technical potential
BG34
Yugoiztochen
Bulgaria
GW (power)
GWh/y
Wind (onshore) 7.11 14 012
Solar photovoltaic (PV)
Ground-mounted 18.22 23 991
Rooftop 2.16 2 842
Bioenergy
Crop residues, livestock methane, forest biomass (medium)
0.45 11 852 (primary)
Municipal Solid Waste (MSW) 0.04 2 728 (primary)
Geothermal (sustainable technical) 0.09 732
Carbon capture 3.96 29 456
Energy efficiency in buildings
Theoretical cost optimal Theoretical NZEB BAU at 2050
Primary energy savings potential (TWh)
3.35 4.67 1.80
Associated investment
needs (MEUR) 5 819 10 472 3 666
Potential Jobs (FTE/year) 4 700
Coal mine reclamation NUTS0 and NUTS 2 range of jobs
GW GWh/y
Wind 0.12 136.4
Solar PV 0.21 268.3
Value chain
Facilities/Services Total
Wind No factories in region; 1 (bearings) in close-by regions (RO31)
0
Solar PV 1 (components); 3 sellers; 5 installers
9
Clean Energy Production Technologies
Investments and Jobs (2030, EUCO3232.5
based MAX technology deployment
projection)
Average CAPEX needs
(EUR million)
Job creation potential
(FTE)
Wind 468.06 1 409
Solar PV 21.4 309
Bioenergy 39 932
EUR mil/Job ratio
Wind, 0.57 Solar PV, 0.07 Bioenergy, 0.04
Wind
Solar PV
Bio
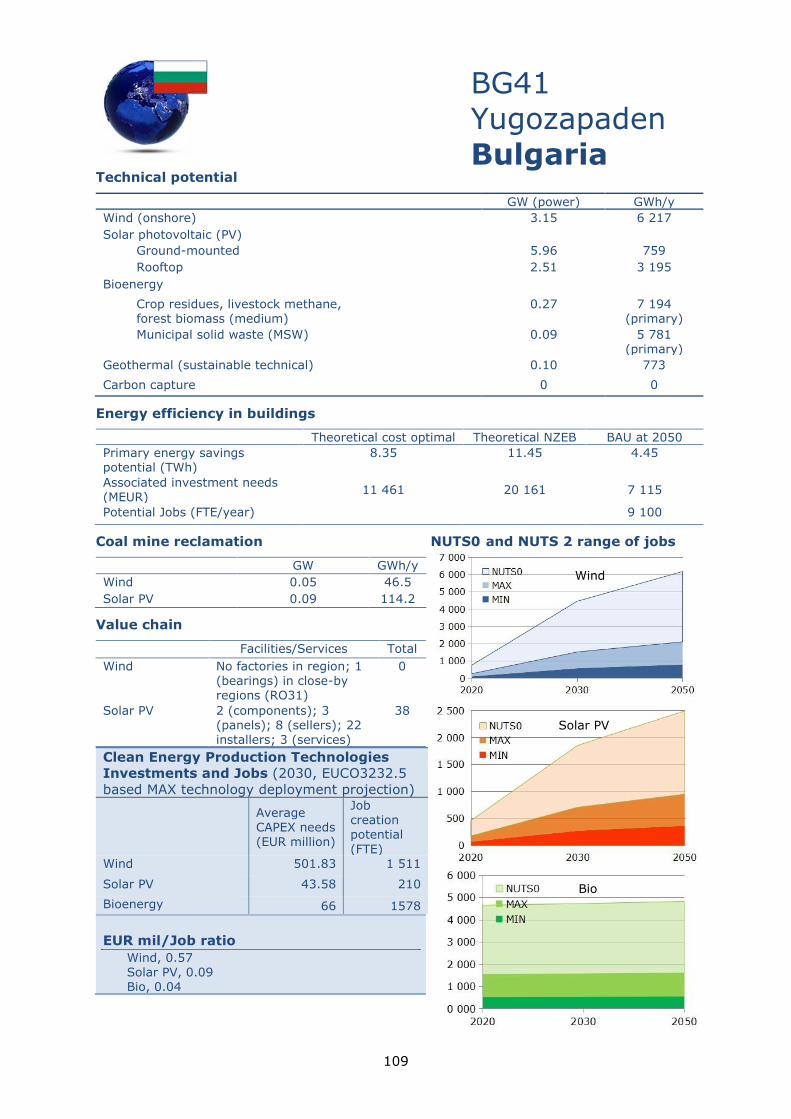
109
Technical potential
BG41
Yugozapaden
Bulgaria
GW (power) GWh/y
Wind (onshore) 3.15 6 217
Solar photovoltaic (PV)
Ground-mounted 5.96 759
Rooftop 2.51 3 195
Bioenergy
Crop residues, livestock methane, forest biomass (medium)
0.27 7 194 (primary)
Municipal solid waste (MSW) 0.09 5 781 (primary)
Geothermal (sustainable technical) 0.10 773
Carbon capture 0 0
Energy efficiency in buildings
Theoretical cost optimal Theoretical NZEB BAU at 2050
Primary energy savings potential (TWh)
8.35 11.45 4.45
Associated investment needs (MEUR)
11 461 20 161 7 115
Potential Jobs (FTE/year) 9 100
Coal mine reclamation NUTS0 and NUTS 2 range of jobs
GW GWh/y
Wind 0.05 46.5
Solar PV 0.09 114.2
Value chain
Facilities/Services Total
Wind No factories in region; 1 (bearings) in close-by regions (RO31)
0
Solar PV 2 (components); 3 (panels); 8 (sellers); 22 installers; 3 (services)
38
EUR mil/Job ratio
Wind, 0.57 Solar PV, 0.09 Bio, 0.04
Clean Energy Production Technologies
Investments and Jobs (2030, EUCO3232.5
based MAX technology deployment projection)
Average CAPEX needs (EUR million)
Job creation potential
(FTE)
Wind 501.83 1 511
Solar PV 43.58 210
Bioenergy 66 1578
Bio
Wind
Solar PV
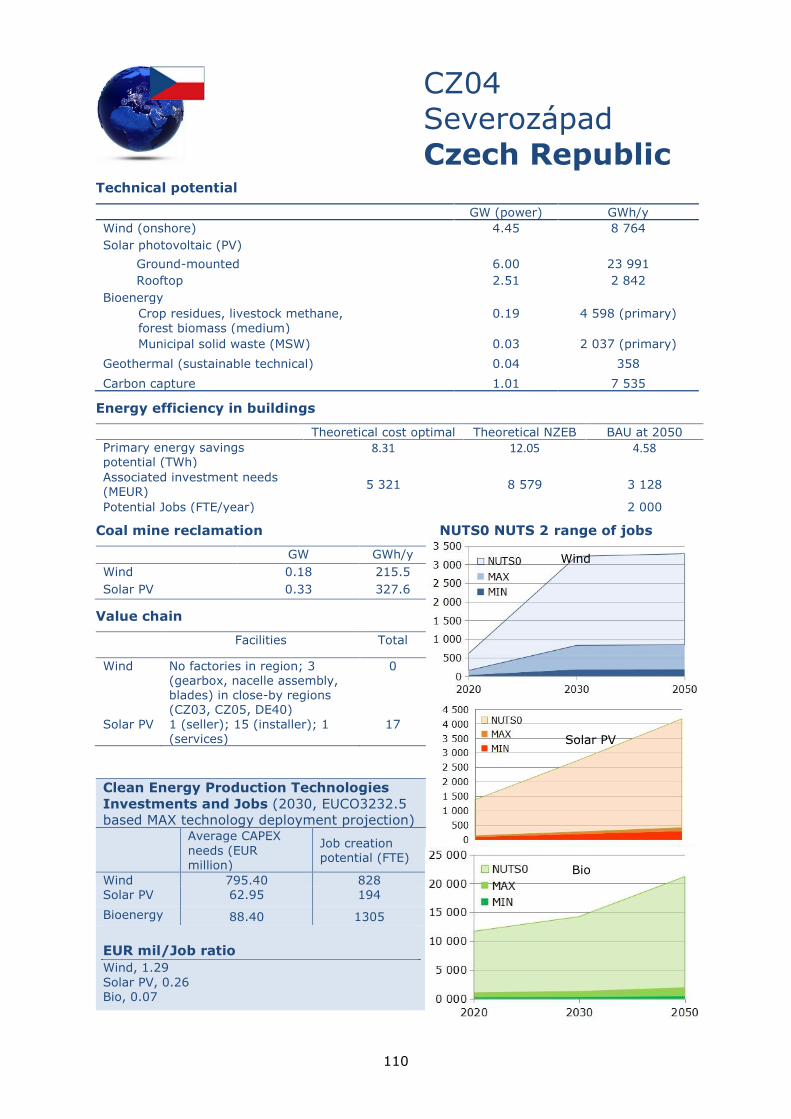
110
Technical potential
CZ04
Severozápad
Czech Republic
GW (power) GWh/y
Wind (onshore) 4.45 8 764
Solar photovoltaic (PV)
Ground-mounted 6.00 23 991
Rooftop 2.51 2 842
Bioenergy
Crop residues, livestock methane,
forest biomass (medium)
0.19 4 598 (primary)
Municipal solid waste (MSW)
0.03 2 037 (primary)
Geothermal (sustainable technical) 0.04 358
Carbon capture 1.01 7 535
Energy efficiency in buildings
Theoretical cost optimal Theoretical NZEB BAU at 2050
Primary energy savings potential (TWh)
8.31 12.05 4.58
Associated investment needs (MEUR)
5 321 8 579 3 128
Potential Jobs (FTE/year) 2 000
Coal mine reclamation NUTS0 NUTS 2 range of jobs
GW GWh/y
Wind 0.18 215.5
Solar PV 0.33 327.6
Value chain
Facilities Total
Wind No factories in region; 3 (gearbox, nacelle assembly, blades) in close-by regions (CZ03, CZ05, DE40)
0
Solar PV 1 (seller); 15 (installer); 1 (services)
17
Clean Energy Production Technologies
Investments and Jobs (2030, EUCO3232.5
based MAX technology deployment projection)
Average CAPEX
needs (EUR
million)
Job creation potential (FTE)
Wind 795.40 828 Solar PV 62.95 194
Bioenergy 88.40 1305
EUR mil/Job ratio
Wind, 1.29
Solar PV, 0.26 Bio, 0.07
Wind
Solar PV
Bio
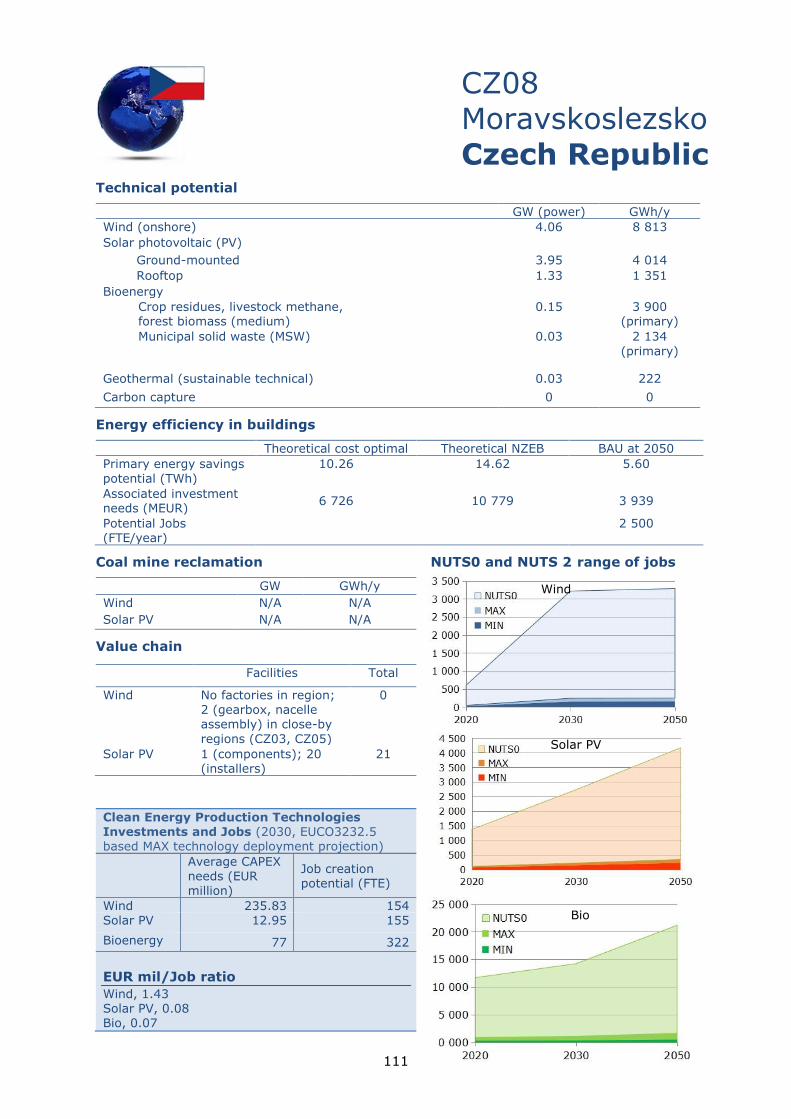
111
Technical potential
CZ08
Moravskoslezsko
Czech Republic
GW (power) GWh/y
Wind (onshore) 4.06 8 813
Solar photovoltaic (PV)
Ground-mounted 3.95 4 014
Rooftop 1.33 1 351
Bioenergy
Crop residues, livestock methane, forest biomass (medium)
0.15 3 900 (primary)
Municipal solid waste (MSW)
0.03 2 134
(primary)
Geothermal (sustainable technical) 0.03 222
Carbon capture 0 0
Energy efficiency in buildings
Theoretical cost optimal Theoretical NZEB BAU at 2050
Primary energy savings
potential (TWh)
10.26 14.62 5.60
Associated investment needs (MEUR)
6 726 10 779 3 939
Potential Jobs (FTE/year)
2 500
Coal mine reclamation NUTS0 and NUTS 2 range of jobs
GW GWh/y
Wind N/A N/A
Solar PV N/A N/A
Value chain
Facilities Total
Wind No factories in region; 2 (gearbox, nacelle assembly) in close-by
regions (CZ03, CZ05)
0
Solar PV 1 (components); 20 (installers)
21
Clean Energy Production Technologies Investments and Jobs (2030, EUCO3232.5 based MAX technology deployment projection)
Average CAPEX
needs (EUR million)
Job creation potential (FTE)
Wind 235.83 154 Solar PV 12.95 155
Bioenergy 77 322
EUR mil/Job ratio
Wind, 1.43 Solar PV, 0.08 Bio, 0.07
Solar PV
Bio
Wind
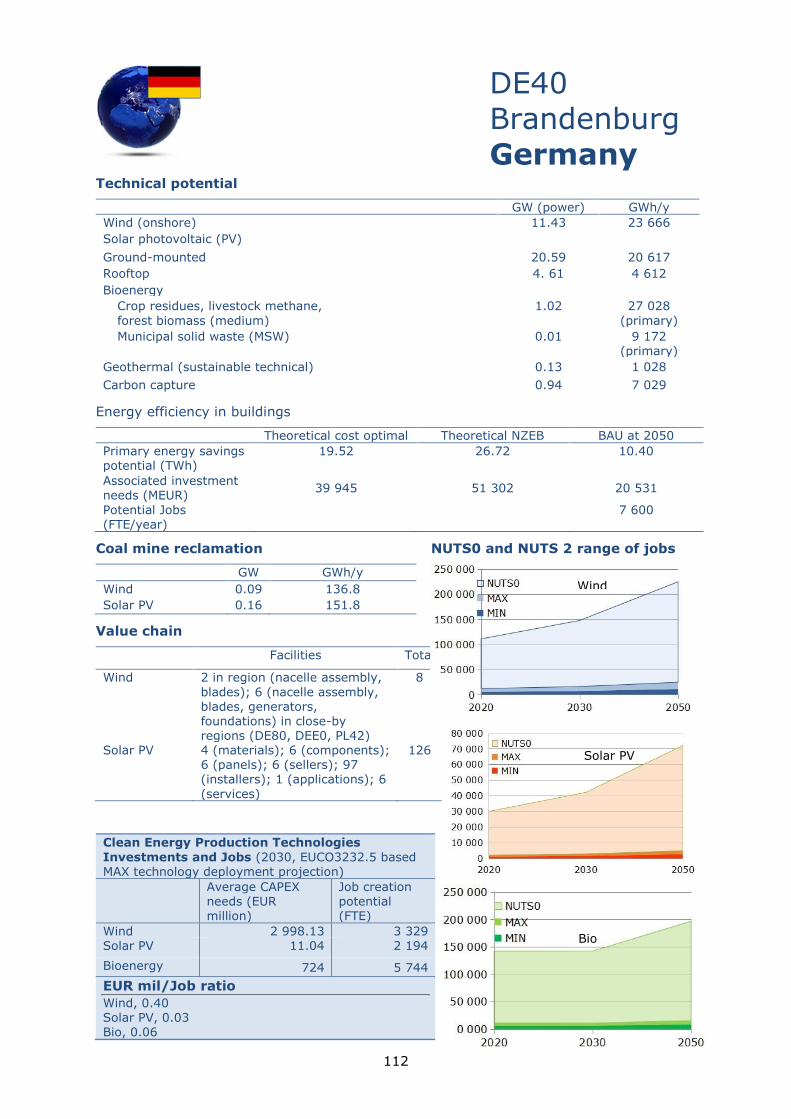
112
Technical potential
DE40
Brandenburg
Germany
GW (power) GWh/y
Wind (onshore) 11.43 23 666
Solar photovoltaic (PV)
Ground-mounted 20.59 20 617
Rooftop 4. 61 4 612
Bioenergy
Crop residues, livestock methane,
forest biomass (medium)
1.02 27 028
(primary)
Municipal solid waste (MSW)
0.01 9 172 (primary)
Geothermal (sustainable technical) 0.13 1 028
Carbon capture 0.94 7 029
Energy efficiency in buildings
Theoretical cost optimal Theoretical NZEB BAU at 2050
Primary energy savings potential (TWh)
19.52 26.72 10.40
Associated investment needs (MEUR)
39 945 51 302 20 531
Potential Jobs (FTE/year)
7 600
Coal mine reclamation NUTS0 and NUTS 2 range of jobs
GW GWh/y
Wind 0.09 136.8
Solar PV 0.16 151.8
Value chain
Facilities Total
Wind 2 in region (nacelle assembly,
blades); 6 (nacelle assembly, blades, generators, foundations) in close-by regions (DE80, DEE0, PL42)
8
Solar PV 4 (materials); 6 (components); 6 (panels); 6 (sellers); 97 (installers); 1 (applications); 6
(services)
126
Clean Energy Production Technologies
Investments and Jobs (2030, EUCO3232.5 based
MAX technology deployment projection)
Average CAPEX needs (EUR million)
Job creation potential (FTE)
Wind 2 998.13 3 329 Solar PV 11.04 2 194
Bioenergy 724 5 744
EUR mil/Job ratio
Wind, 0.40 Solar PV, 0.03 Bio, 0.06
Solar PV
Wind
Bio
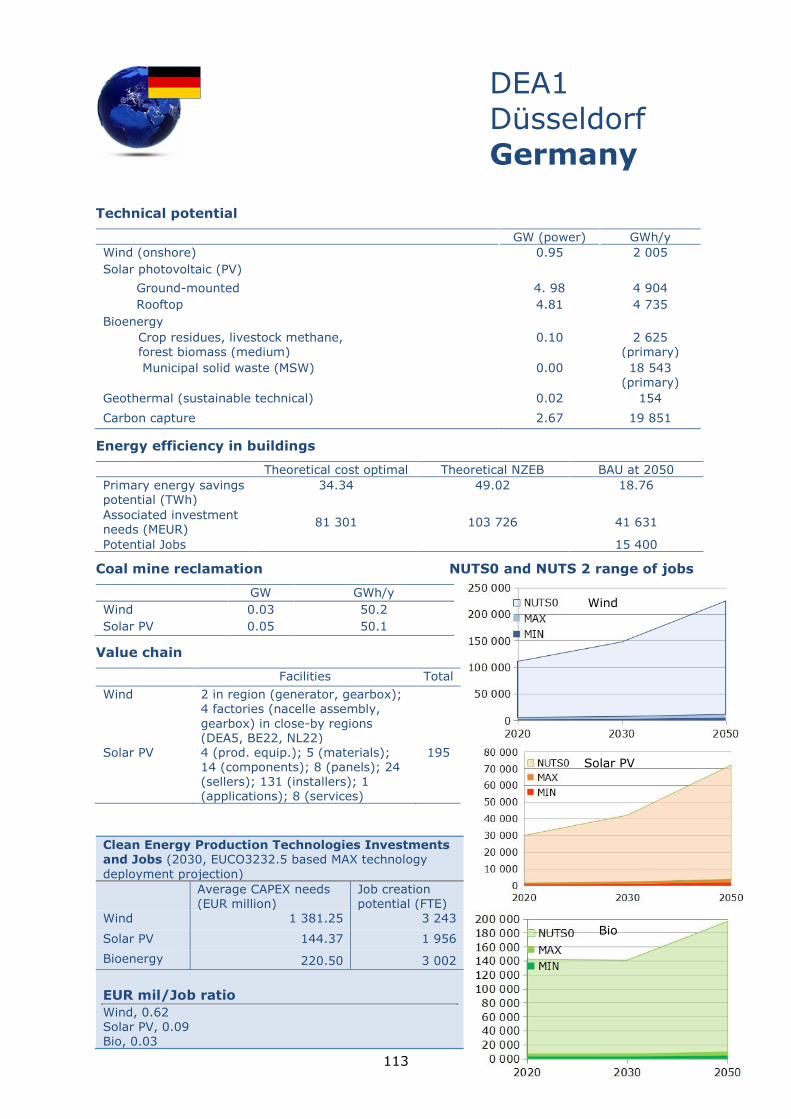
113
Technical potential
DEA1
Düsseldorf
Germany
GW (power) GWh/y
Wind (onshore) 0.95 2 005
Solar photovoltaic (PV)
Ground-mounted 4. 98 4 904
Rooftop 4.81 4 735
Bioenergy
Crop residues, livestock methane, forest biomass (medium)
0.10 2 625 (primary)
Municipal solid waste (MSW)
0.00 18 543 (primary)
Geothermal (sustainable technical) 0.02 154
Carbon capture 2.67 19 851
Energy efficiency in buildings
Theoretical cost optimal Theoretical NZEB BAU at 2050
Primary energy savings potential (TWh)
34.34 49.02 18.76
Associated investment needs (MEUR)
81 301 103 726 41 631
Potential Jobs 15 400
Coal mine reclamation NUTS0 and NUTS 2 range of jobs
GW GWh/y
Wind 0.03 50.2
Solar PV 0.05 50.1
Value chain
Facilities Total
Wind 2 in region (generator, gearbox); 4 factories (nacelle assembly,
gearbox) in close-by regions (DEA5, BE22, NL22)
Solar PV 4 (prod. equip.); 5 (materials); 14 (components); 8 (panels); 24 (sellers); 131 (installers); 1 (applications); 8 (services)
195
Clean Energy Production Technologies Investments and Jobs (2030, EUCO3232.5 based MAX technology
deployment projection)
Average CAPEX needs (EUR million)
Job creation potential (FTE)
Wind 1 381.25 3 243
Solar PV 144.37 1 956
Bioenergy 220.50 3 002
EUR mil/Job ratio
Wind, 0.62 Solar PV, 0.09 Bio, 0.03
Solar PV
Wind
Bio

114
Technical potential
DEA2 Köln Germany
GW (power) GWh/y
Wind (onshore) 1.23 2 569
Solar photovoltaic (PV)
Ground-mounted 6.69 66
Rooftop 4.34 4 279
Bioenergy
Crop residues, livestock methane,
forest biomass (medium)
0.18 4 742 (primary)
Municipal solid waste (MSW) 0.00 15 985 (primary)
Geothermal (sustainable technical) 0.02 180
Carbon capture 0.91 6 754
Energy efficiency in buildings
Theoretical cost optimal Theoretical NZEB BAU at 2050
Primary energy savings
potential (TWh)
31.92 44.02 17.09
Associated investment needs (MEUR)
72 560 93 074 37 268
Potential Jobs (FTE/year) 13 800
Coal mine reclamation NUTS0 and NUTS 2 range of jobs
GW GWh/y
Wind 0.06 89.6
Solar PV 0.11 108.8
Value chain
Facilities Total
Wind No factories in region; 5 (nacelle assembly, gearbox, generator) in close-by regions (DEA1,
DEA5, BE22)
0
Solar PV 5 (prod. equip.); 3 (materials); 8 (components); 3 (panels); 6 (sellers); 97 (installers); 1 (applications); 9 (services)
160
Clean Energy Production Technologies Investments and Jobs (2030, EUCO3232.5 based MAX technology deployment projection)
Average CAPEX
needs (EUR million)
Job creation potential (FTE)
Wind 1 259.49 3 107
Solar PV 111.43 752
Bioenergy 454 3 781
EUR mil/Job ratio
Wind, 0.48
Solar PV, 0.08
Bio, 0.02
Solar PV
Bio
Wind
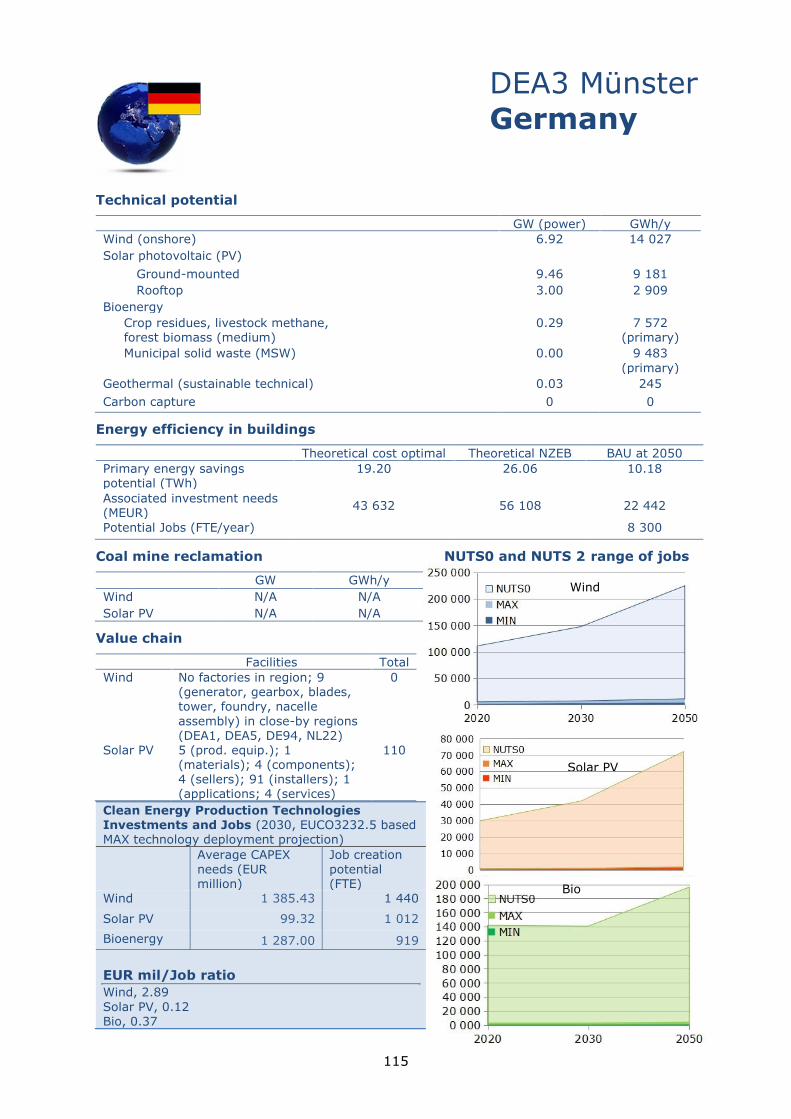
115
Technical potential
DEA3 Münster
Germany
GW (power) GWh/y
Wind (onshore) 6.92 14 027
Solar photovoltaic (PV)
Ground-mounted 9.46 9 181
Rooftop 3.00 2 909
Bioenergy
Crop residues, livestock methane, forest biomass (medium)
0.29 7 572 (primary)
Municipal solid waste (MSW) 0.00 9 483
(primary)
Geothermal (sustainable technical) 0.03 245
Carbon capture 0 0
Energy efficiency in buildings
Theoretical cost optimal Theoretical NZEB BAU at 2050
Primary energy savings potential (TWh)
19.20 26.06 10.18
Associated investment needs (MEUR)
43 632 56 108 22 442
Potential Jobs (FTE/year) 8 300
Coal mine reclamation NUTS0 and NUTS 2 range of jobs
GW GWh/y
Wind N/A N/A
Solar PV N/A N/A
Value chain
Facilities Total
Wind No factories in region; 9 (generator, gearbox, blades, tower, foundry, nacelle
assembly) in close-by regions (DEA1, DEA5, DE94, NL22)
0
Solar PV 5 (prod. equip.); 1 (materials); 4 (components); 4 (sellers); 91 (installers); 1 (applications; 4 (services)
110
Clean Energy Production Technologies Investments and Jobs (2030, EUCO3232.5 based MAX technology deployment projection)
Average CAPEX
needs (EUR million)
Job creation
potential (FTE)
Wind 1 385.43 1 440
Solar PV 99.32 1 012
Bioenergy 1 287.00 919
EUR mil/Job ratio
Wind, 2.89
Solar PV, 0.12 Bio, 0.37
Wind
Bio
Solar PV
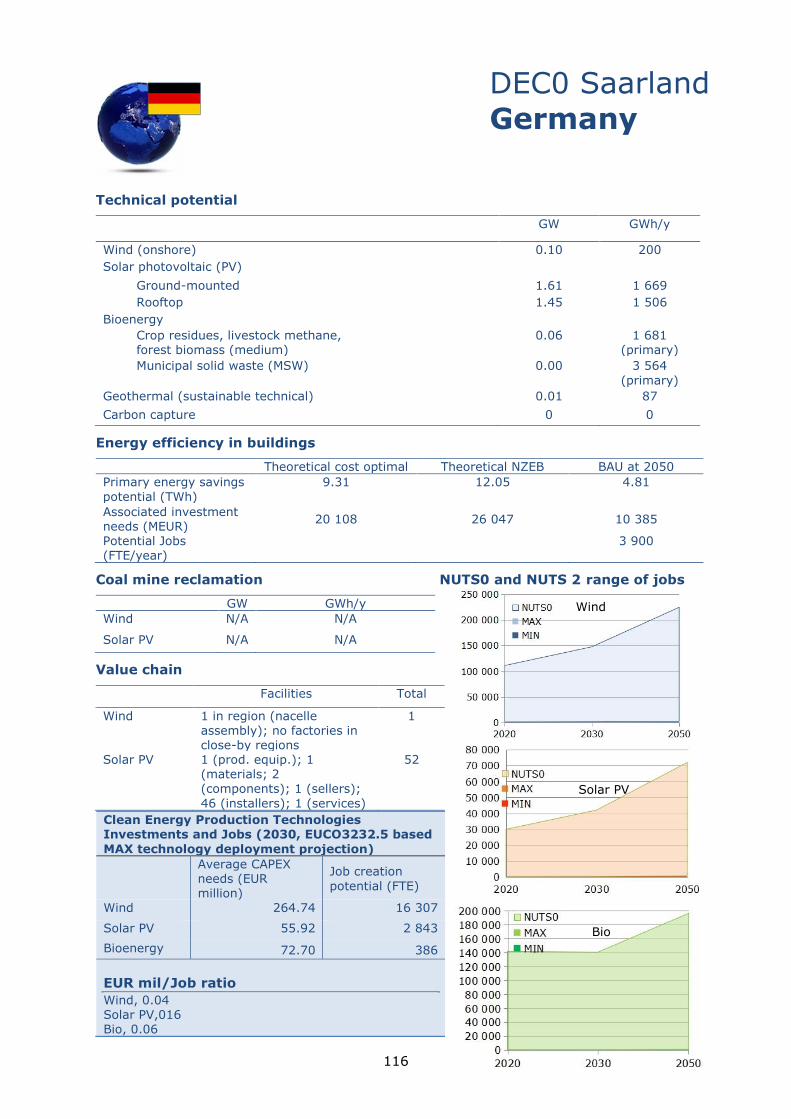
116
Technical potential
DEC0 Saarland
Germany
GW GWh/y
Wind (onshore) 0.10 200
Solar photovoltaic (PV)
Ground-mounted 1.61 1 669
Rooftop 1.45 1 506
Bioenergy
Crop residues, livestock methane, forest biomass (medium)
0.06 1 681 (primary)
Municipal solid waste (MSW) 0.00 3 564
(primary)
Geothermal (sustainable technical) 0.01 87
Carbon capture 0 0
Energy efficiency in buildings
Theoretical cost optimal Theoretical NZEB BAU at 2050
Primary energy savings
potential (TWh)
9.31 12.05 4.81
Associated investment needs (MEUR)
20 108 26 047 10 385
Potential Jobs (FTE/year)
3 900
Coal mine reclamation NUTS0 and NUTS 2 range of jobs
GW GWh/y
Wind N/A N/A
Solar PV N/A N/A
Value chain
Facilities Total
Wind 1 in region (nacelle assembly); no factories in close-by regions
1
Solar PV 1 (prod. equip.); 1 (materials; 2 (components); 1 (sellers);
46 (installers); 1 (services)
52
Clean Energy Production Technologies Investments and Jobs (2030, EUCO3232.5 based
MAX technology deployment projection)
Average CAPEX needs (EUR million)
Job creation
potential (FTE)
Wind 264.74 16 307
Solar PV 55.92 2 843
Bioenergy 72.70 386
EUR mil/Job ratio
Wind, 0.04 Solar PV,016 Bio, 0.06
Bio
Wind
Solar PV
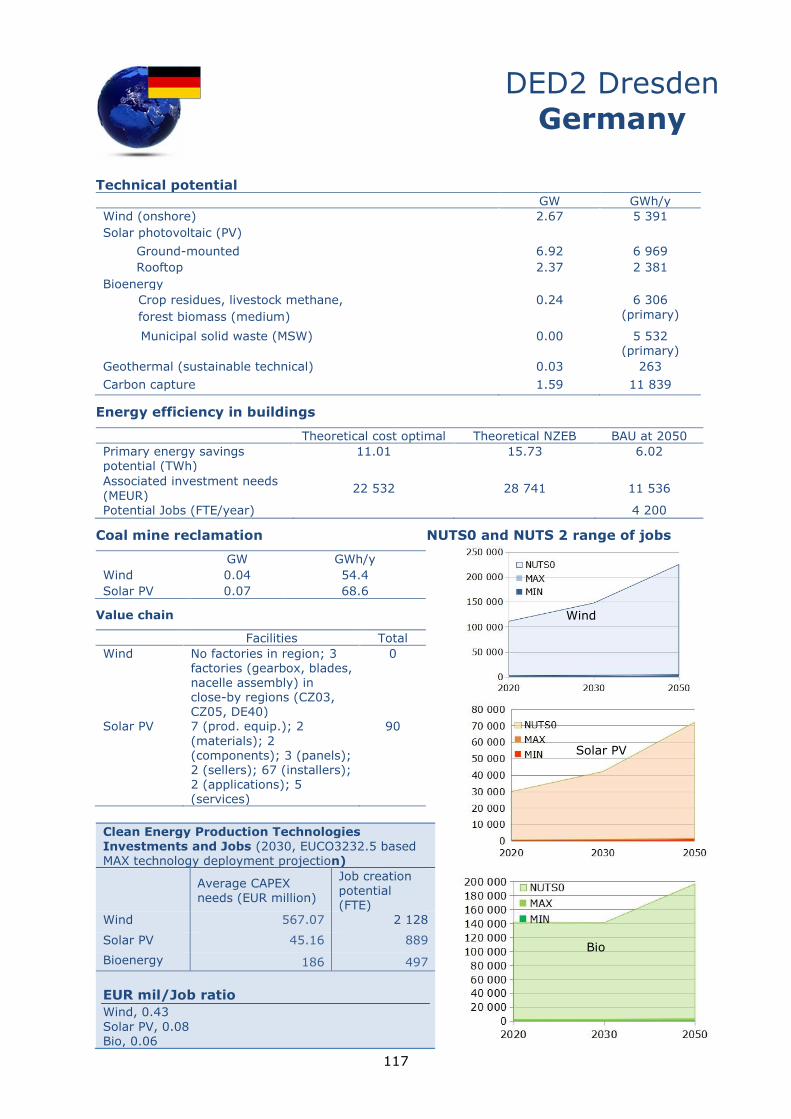
117
Technical potential
DED2 Dresden
Germany
GW GWh/y
Wind (onshore) 2.67 5 391
Solar photovoltaic (PV)
Ground-mounted 6.92 6 969
Rooftop 2.37 2 381
Bioenergy
Crop residues, livestock methane,
forest biomass (medium)
0.24 6 306
(primary)
Municipal solid waste (MSW) 0.00 5 532 (primary)
Geothermal (sustainable technical) 0.03 263
Carbon capture 1.59 11 839
Energy efficiency in buildings
Theoretical cost optimal Theoretical NZEB BAU at 2050
Primary energy savings potential (TWh)
11.01 15.73 6.02
Associated investment needs
(MEUR) 22 532 28 741 11 536
Potential Jobs (FTE/year) 4 200
Coal mine reclamation NUTS0 and NUTS 2 range of jobs
GW GWh/y
Wind 0.04 54.4
Solar PV 0.07 68.6
Value chain
Facilities Total
Wind No factories in region; 3 factories (gearbox, blades, nacelle assembly) in close-by regions (CZ03, CZ05, DE40)
0
Solar PV 7 (prod. equip.); 2
(materials); 2 (components); 3 (panels); 2 (sellers); 67 (installers); 2 (applications); 5 (services)
90
Clean Energy Production Technologies Investments and Jobs (2030, EUCO3232.5 based MAX technology deployment projection)
Average CAPEX needs (EUR million)
Job creation potential (FTE)
Wind 567.07 2 128
Solar PV 45.16 889
Bioenergy 186 497
EUR mil/Job ratio
Wind, 0.43
Solar PV, 0.08 Bio, 0.06
Wind
Solar PV
Bio
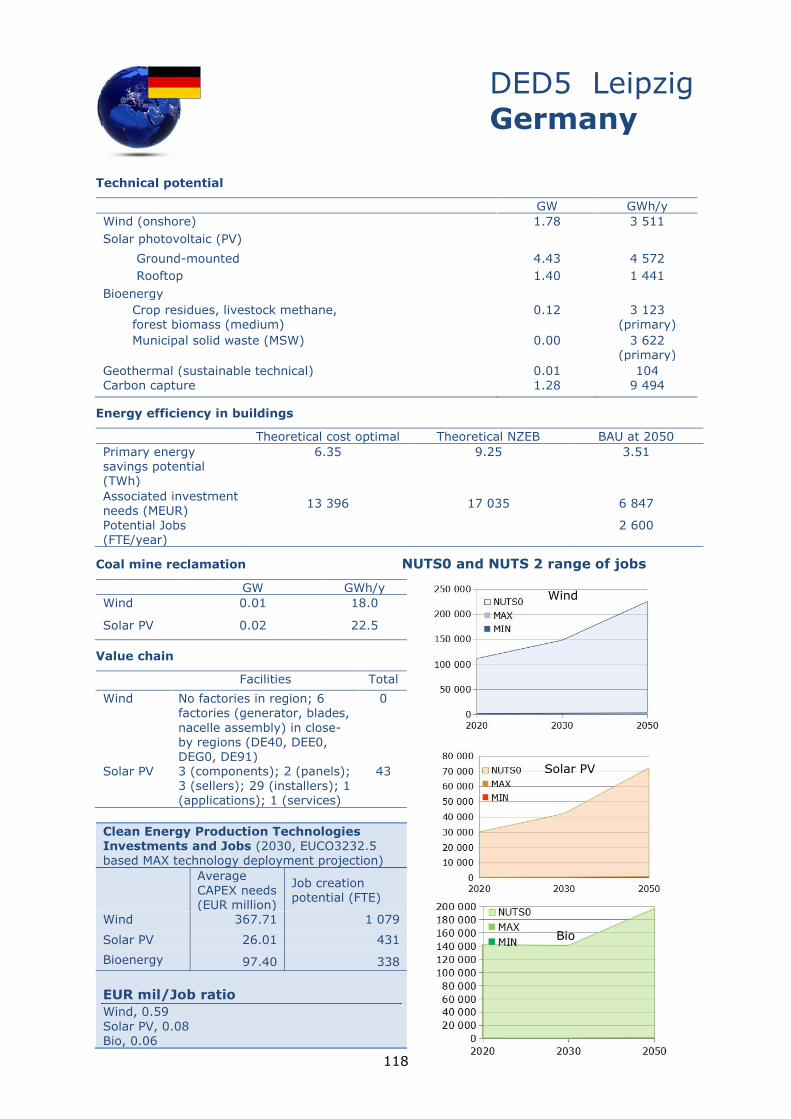
118
Technical potential
DED5 Leipzig
Germany
GW GWh/y
Wind (onshore) 1.78 3 511
Solar photovoltaic (PV)
Ground-mounted 4.43 4 572
Rooftop 1.40 1 441
Bioenergy
Crop residues, livestock methane, forest biomass (medium)
0.12 3 123 (primary)
Municipal solid waste (MSW) 0.00 3 622 (primary)
Geothermal (sustainable technical) 0.01 104 Carbon capture 1.28 9 494
Energy efficiency in buildings
Theoretical cost optimal Theoretical NZEB BAU at 2050
Primary energy savings potential (TWh)
6.35 9.25 3.51
Associated investment needs (MEUR)
13 396 17 035 6 847
Potential Jobs (FTE/year)
2 600
Coal mine reclamation NUTS0 and NUTS 2 range of jobs
GW GWh/y
Wind 0.01 18.0
Solar PV 0.02 22.5
Value chain
Facilities Total
Wind No factories in region; 6 factories (generator, blades,
nacelle assembly) in close-by regions (DE40, DEE0, DEG0, DE91)
0
Solar PV 3 (components); 2 (panels); 3 (sellers); 29 (installers); 1 (applications); 1 (services)
43
Clean Energy Production Technologies Investments and Jobs (2030, EUCO3232.5 based MAX technology deployment projection)
Average CAPEX needs (EUR million)
Job creation potential (FTE)
Wind 367.71 1 079
Solar PV 26.01 431
Bioenergy 97.40 338
EUR mil/Job ratio
Wind, 0.59
Solar PV, 0.08 Bio, 0.06
Bio
Wind
Solar PV
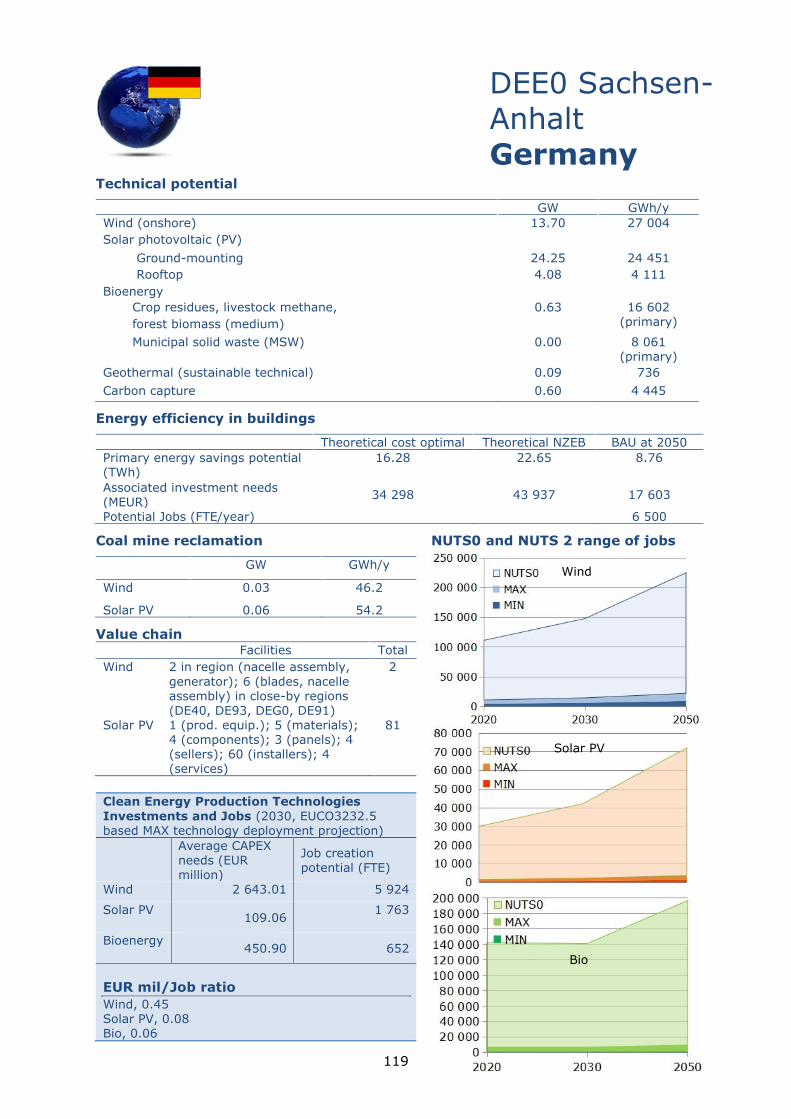
119
Technical potential
DEE0 Sachsen-
Anhalt
Germany
GW GWh/y
Wind (onshore) 13.70 27 004
Solar photovoltaic (PV)
Ground-mounting 24.25 24 451
Rooftop 4.08 4 111
Bioenergy
Crop residues, livestock methane,
forest biomass (medium)
0.63 16 602 (primary)
Municipal solid waste (MSW) 0.00 8 061 (primary)
Geothermal (sustainable technical) 0.09 736
Carbon capture 0.60 4 445
Energy efficiency in buildings
Theoretical cost optimal Theoretical NZEB BAU at 2050
Primary energy savings potential (TWh)
16.28 22.65 8.76
Associated investment needs (MEUR)
34 298 43 937 17 603
Potential Jobs (FTE/year) 6 500
Coal mine reclamation NUTS0 and NUTS 2 range of jobs
GW GWh/y
Wind 0.03 46.2
Solar PV 0.06 54.2
Value chain Facilities Total
Wind 2 in region (nacelle assembly,
generator); 6 (blades, nacelle assembly) in close-by regions (DE40, DE93, DEG0, DE91)
2
Solar PV 1 (prod. equip.); 5 (materials); 4 (components); 3 (panels); 4 (sellers); 60 (installers); 4 (services)
81
Clean Energy Production Technologies
Investments and Jobs (2030, EUCO3232.5 based MAX technology deployment projection)
Average CAPEX needs (EUR
million)
Job creation
potential (FTE)
Wind 2 643.01 5 924
Solar PV 109.06
1 763
Bioenergy 450.90 652
EUR mil/Job ratio
Wind, 0.45 Solar PV, 0.08 Bio, 0.06
Wind
Bio
Solar PV
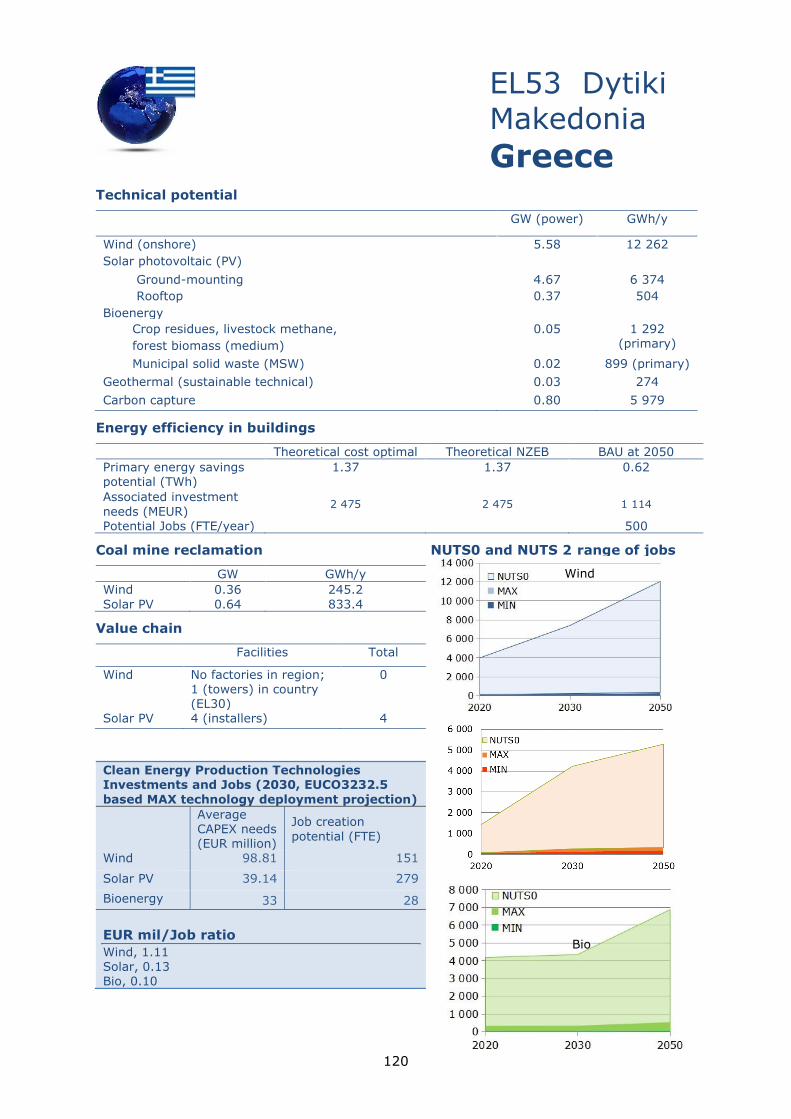
120
Technical potential
EL53 Dytiki
Makedonia
Greece
GW (power) GWh/y
Wind (onshore) 5.58 12 262
Solar photovoltaic (PV)
Ground-mounting 4.67 6 374
Rooftop 0.37 504
Bioenergy
Crop residues, livestock methane,
forest biomass (medium)
0.05 1 292 (primary)
Municipal solid waste (MSW) 0.02 899 (primary)
Geothermal (sustainable technical) 0.03 274
Carbon capture 0.80 5 979
Energy efficiency in buildings
Theoretical cost optimal Theoretical NZEB BAU at 2050
Primary energy savings potential (TWh)
1.37 1.37 0.62
Associated investment
needs (MEUR) 2 475 2 475 1 114
Potential Jobs (FTE/year) 500
Coal mine reclamation NUTS0 and NUTS 2 range of jobs
GW GWh/y
Wind 0.36 245.2
Solar PV 0.64 833.4
Value chain
Facilities Total
Wind No factories in region; 1 (towers) in country (EL30)
0
Solar PV 4 (installers) 4
Clean Energy Production Technologies Investments and Jobs (2030, EUCO3232.5
based MAX technology deployment projection)
Average CAPEX needs (EUR million)
Job creation
potential (FTE)
Wind 98.81 151
Solar PV 39.14 279
Bioenergy 33 28
EUR mil/Job ratio
Wind, 1.11 Solar, 0.13 Bio, 0.10
Solar PV
Bio
Wind
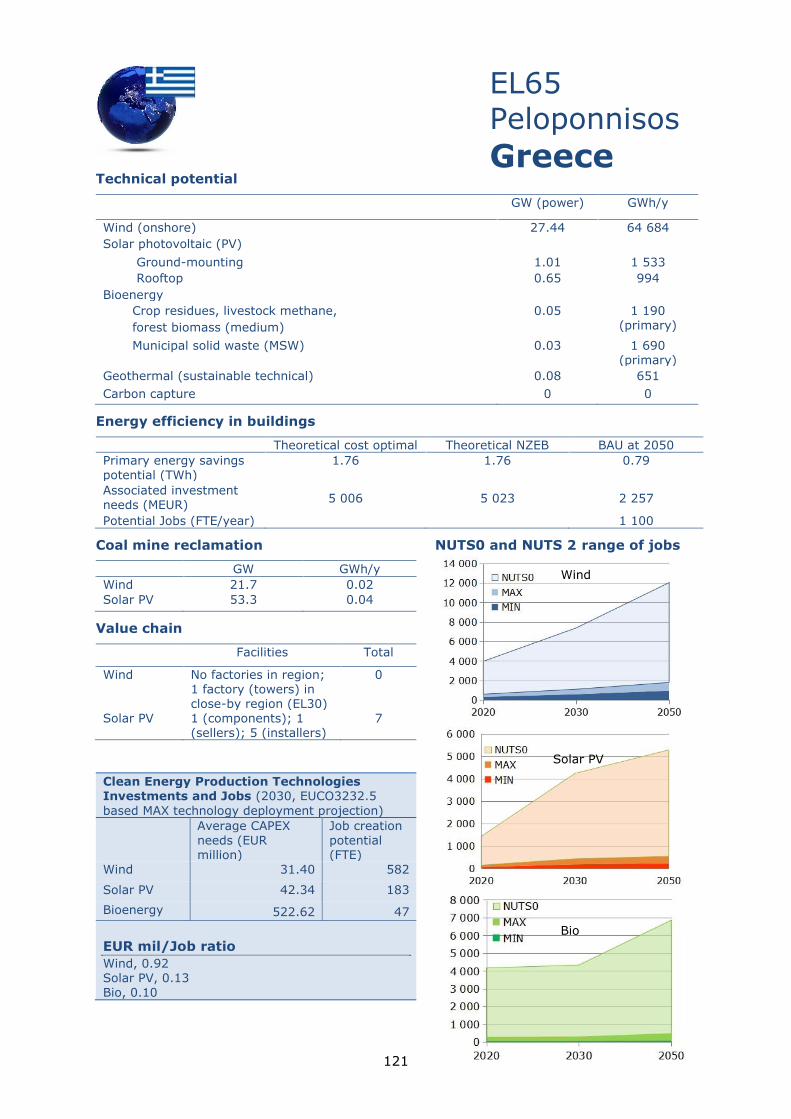
121
Technical potential
EL65
Peloponnisos
Greece
GW (power) GWh/y
Wind (onshore) 27.44 64 684
Solar photovoltaic (PV)
Ground-mounting 1.01 1 533
Rooftop 0.65 994
Bioenergy
Crop residues, livestock methane,
forest biomass (medium)
0.05 1 190 (primary)
Municipal solid waste (MSW) 0.03 1 690 (primary)
Geothermal (sustainable technical) 0.08 651
Carbon capture 0 0
Energy efficiency in buildings
Theoretical cost optimal Theoretical NZEB BAU at 2050
Primary energy savings potential (TWh)
1.76 1.76 0.79
Associated investment needs (MEUR)
5 006 5 023 2 257
Potential Jobs (FTE/year) 1 100
Coal mine reclamation NUTS0 and NUTS 2 range of jobs
GW GWh/y
Wind 21.7 0.02
Solar PV 53.3 0.04
Value chain
Facilities Total
Wind No factories in region; 1 factory (towers) in close-by region (EL30)
0
Solar PV 1 (components); 1 (sellers); 5 (installers)
7
Clean Energy Production Technologies Investments and Jobs (2030, EUCO3232.5
based MAX technology deployment projection)
Average CAPEX needs (EUR million)
Job creation potential (FTE)
Wind 31.40 582
Solar PV 42.34 183
Bioenergy 522.62 47
EUR mil/Job ratio
Wind, 0.92 Solar PV, 0.13 Bio, 0.10
Solar PV
Bio
Wind
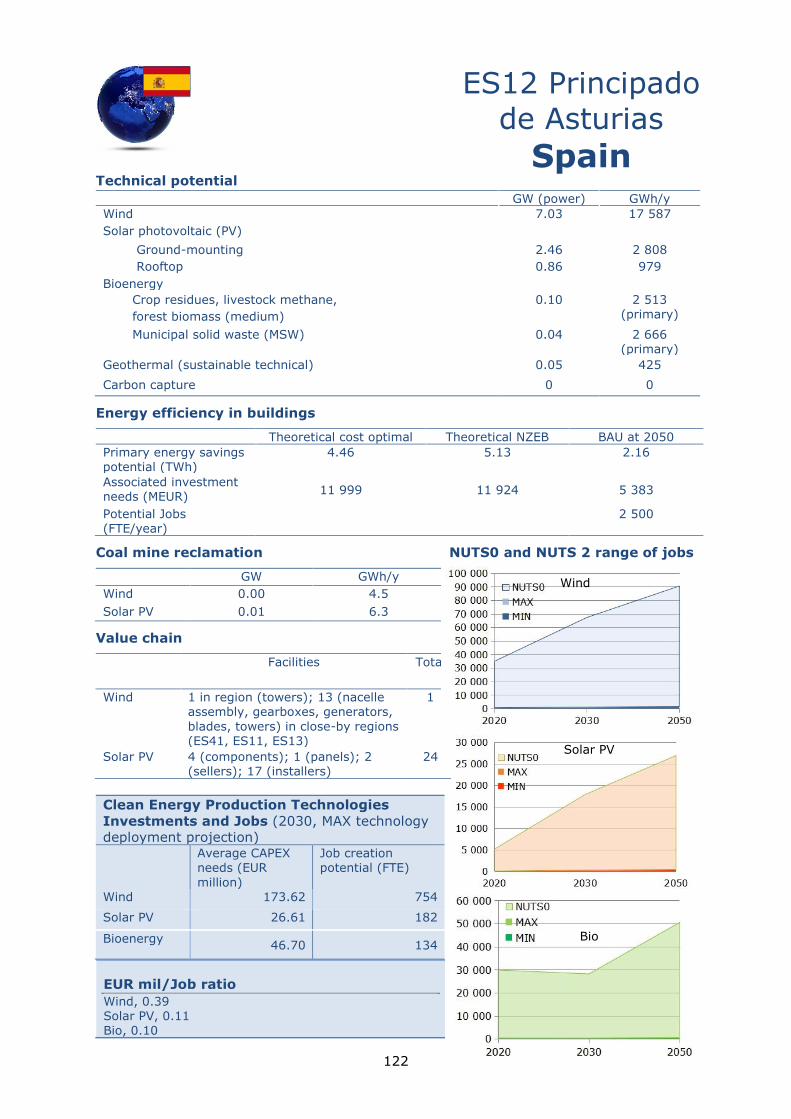
122
Technical potential
ES12 Principado
de Asturias
Spain
GW (power) GWh/y
Wind 7.03 17 587
Solar photovoltaic (PV)
Ground-mounting 2.46 2 808
Rooftop 0.86 979
Bioenergy
Crop residues, livestock methane,
forest biomass (medium)
0.10 2 513 (primary)
Municipal solid waste (MSW) 0.04 2 666 (primary)
Geothermal (sustainable technical) 0.05 425
Carbon capture 0 0
Energy efficiency in buildings
Theoretical cost optimal Theoretical NZEB BAU at 2050
Primary energy savings potential (TWh)
4.46 5.13 2.16
Associated investment needs (MEUR)
11 999 11 924 5 383
Potential Jobs (FTE/year)
2 500
Coal mine reclamation NUTS0 and NUTS 2 range of jobs
GW GWh/y
Wind 0.00 4.5
Solar PV 0.01 6.3
Value chain
Facilities Total
Wind 1 in region (towers); 13 (nacelle assembly, gearboxes, generators,
blades, towers) in close-by regions (ES41, ES11, ES13)
1
Solar PV 4 (components); 1 (panels); 2 (sellers); 17 (installers)
24
Clean Energy Production Technologies
Investments and Jobs (2030, MAX technology
deployment projection)
Average CAPEX
needs (EUR
million)
Job creation
potential (FTE)
Wind 173.62 754
Solar PV 26.61 182
Bioenergy 46.70 134
EUR mil/Job ratio
Wind, 0.39 Solar PV, 0.11 Bio, 0.10
Solar PV
Wind
Bio
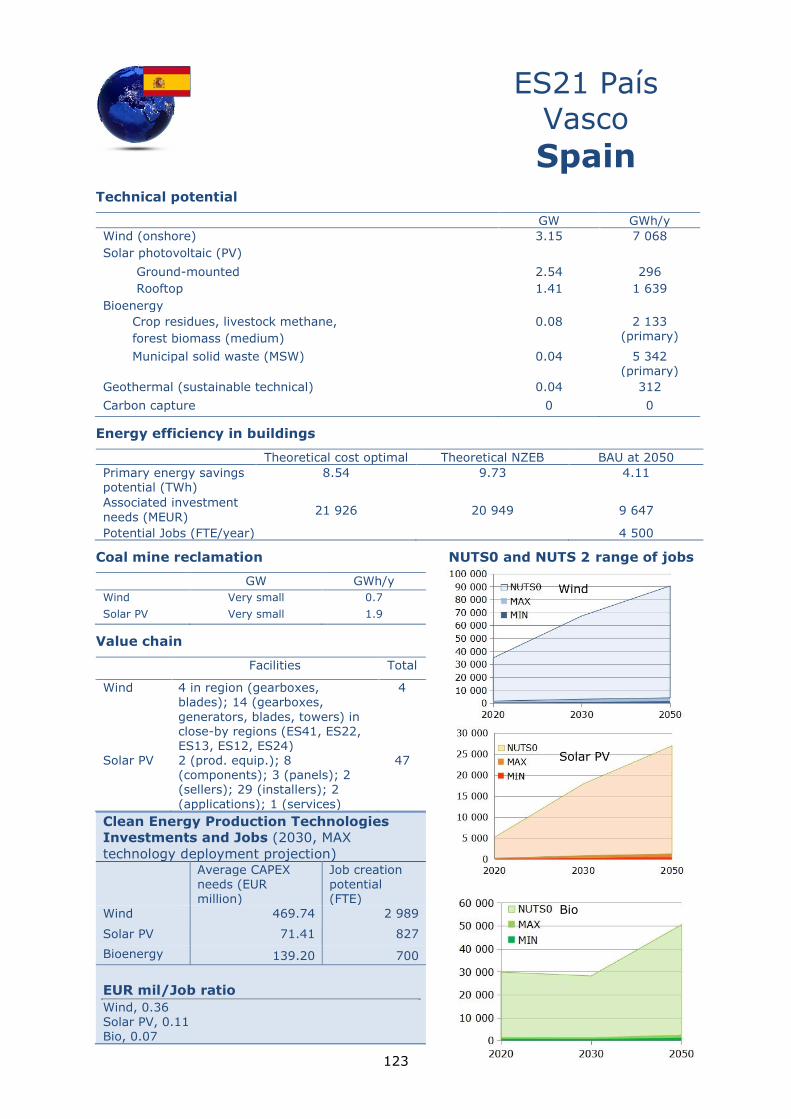
123
Technical potential
ES21 País
Vasco
Spain
GW GWh/y
Wind (onshore) 3.15 7 068
Solar photovoltaic (PV)
Ground-mounted 2.54 296
Rooftop 1.41 1 639
Bioenergy
Crop residues, livestock methane,
forest biomass (medium)
0.08 2 133 (primary)
Municipal solid waste (MSW) 0.04 5 342
(primary)
Geothermal (sustainable technical) 0.04 312
Carbon capture 0 0
Energy efficiency in buildings
Theoretical cost optimal Theoretical NZEB BAU at 2050
Primary energy savings potential (TWh)
8.54 9.73 4.11
Associated investment
needs (MEUR) 21 926 20 949 9 647
Potential Jobs (FTE/year) 4 500
Coal mine reclamation NUTS0 and NUTS 2 range of jobs
GW GWh/y
Wind Very small 0.7
Solar PV Very small 1.9
Value chain
Facilities Total
Wind 4 in region (gearboxes, blades); 14 (gearboxes,
generators, blades, towers) in close-by regions (ES41, ES22, ES13, ES12, ES24)
4
Solar PV 2 (prod. equip.); 8 (components); 3 (panels); 2 (sellers); 29 (installers); 2
(applications); 1 (services)
47
Clean Energy Production Technologies
Investments and Jobs (2030, MAX
technology deployment projection)
Average CAPEX needs (EUR million)
Job creation potential (FTE)
Wind 469.74 2 989
Solar PV 71.41 827
Bioenergy 139.20 700
EUR mil/Job ratio
Wind, 0.36 Solar PV, 0.11 Bio, 0.07
Bio
Wind
Solar PV
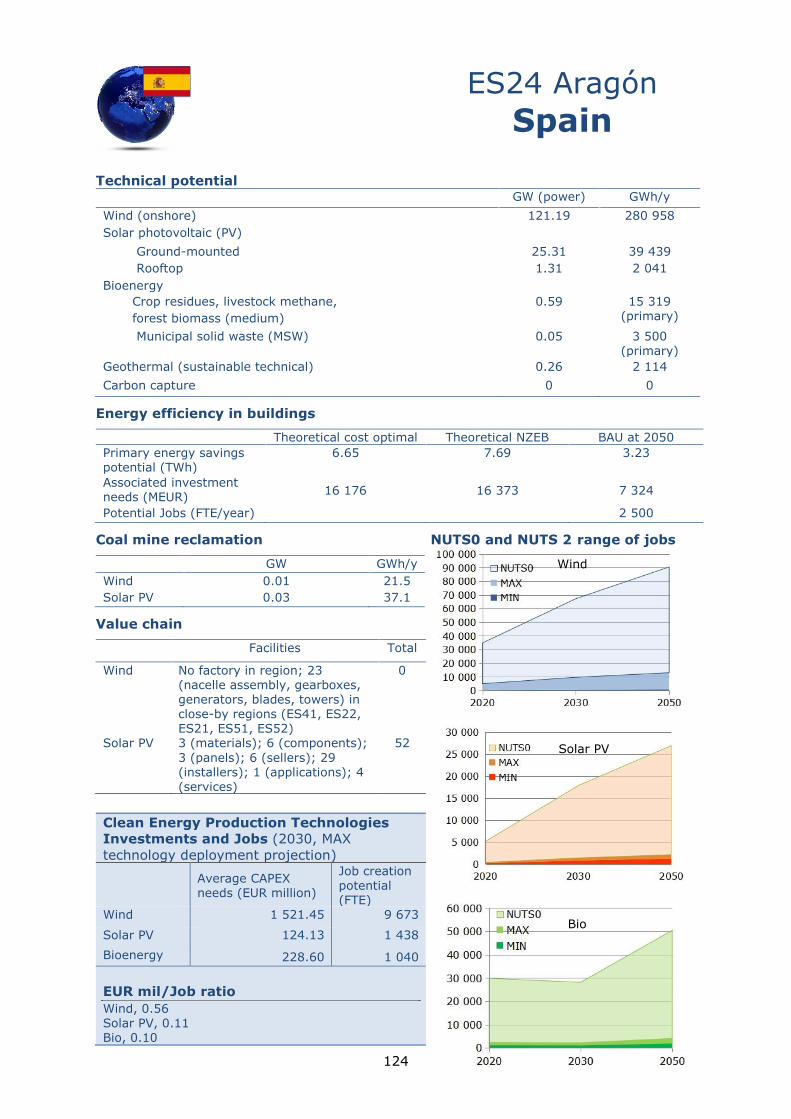
124
Technical potential
ES24 Aragón
Spain
GW (power) GWh/y
Wind (onshore) 121.19 280 958
Solar photovoltaic (PV)
Ground-mounted 25.31 39 439
Rooftop 1.31 2 041
Bioenergy
Crop residues, livestock methane,
forest biomass (medium)
0.59 15 319 (primary)
Municipal solid waste (MSW) 0.05 3 500 (primary)
Geothermal (sustainable technical) 0.26 2 114
Carbon capture 0 0
Energy efficiency in buildings
Theoretical cost optimal Theoretical NZEB BAU at 2050
Primary energy savings potential (TWh)
6.65 7.69 3.23
Associated investment needs (MEUR)
16 176 16 373 7 324
Potential Jobs (FTE/year) 2 500
Coal mine reclamation NUTS0 and NUTS 2 range of jobs
GW GWh/y
Wind 0.01 21.5
Solar PV 0.03 37.1
Value chain
Facilities Total
Wind No factory in region; 23 (nacelle assembly, gearboxes, generators, blades, towers) in close-by regions (ES41, ES22, ES21, ES51, ES52)
0
Solar PV 3 (materials); 6 (components);
3 (panels); 6 (sellers); 29 (installers); 1 (applications); 4 (services)
52
Clean Energy Production Technologies
Investments and Jobs (2030, MAX
technology deployment projection)
Average CAPEX needs (EUR million)
Job creation potential (FTE)
Wind 1 521.45 9 673
Solar PV 124.13 1 438
Bioenergy 228.60 1 040
EUR mil/Job ratio
Wind, 0.56 Solar PV, 0.11 Bio, 0.10
Solar PV
Wind
Bio
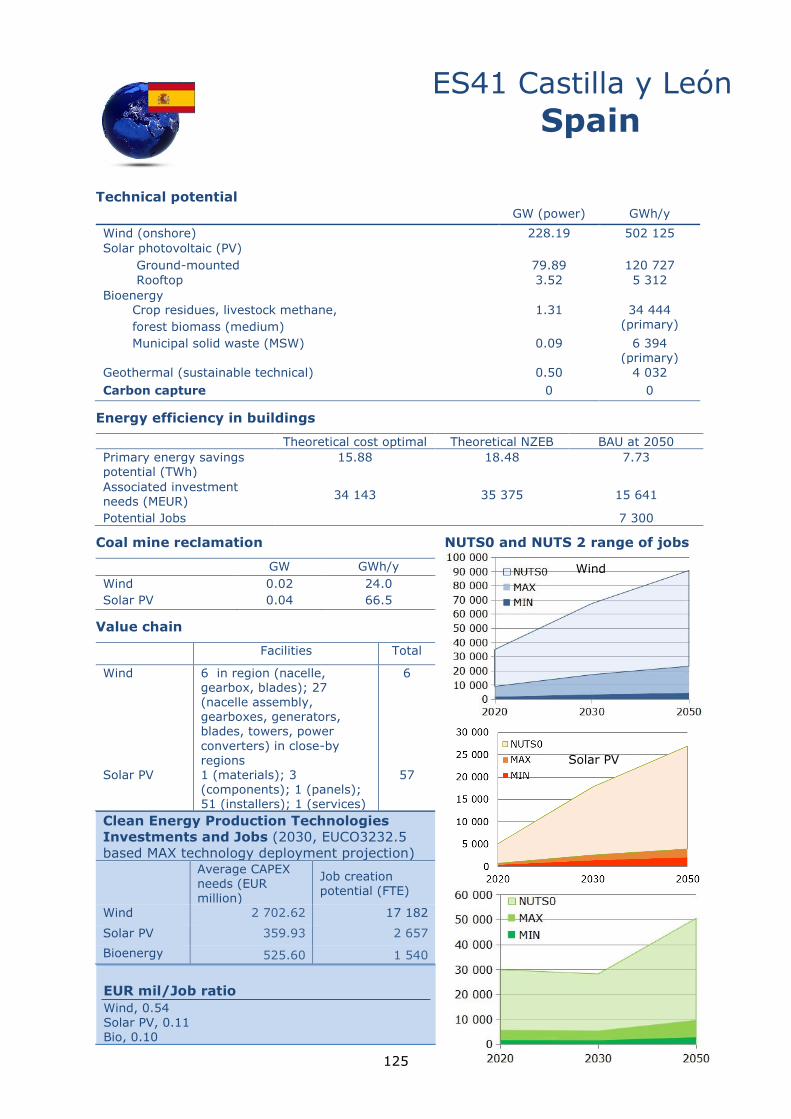
125
Technical potential
ES41 Castilla y León
Spain
GW (power) GWh/y
Wind (onshore) 228.19 502 125
Solar photovoltaic (PV)
Ground-mounted 79.89 120 727
Rooftop 3.52 5 312
Bioenergy Crop residues, livestock methane,
forest biomass (medium)
1.31 34 444 (primary)
Municipal solid waste (MSW) 0.09 6 394 (primary)
Geothermal (sustainable technical) 0.50 4 032
Carbon capture 0 0
Energy efficiency in buildings
Theoretical cost optimal Theoretical NZEB BAU at 2050
Primary energy savings potential (TWh)
15.88 18.48 7.73
Associated investment needs (MEUR)
34 143 35 375 15 641
Potential Jobs 7 300
Coal mine reclamation NUTS0 and NUTS 2 range of jobs
GW GWh/y
Wind 0.02 24.0
Solar PV 0.04 66.5
Value chain
Facilities Total
Wind 6 in region (nacelle, gearbox, blades); 27 (nacelle assembly, gearboxes, generators, blades, towers, power
converters) in close-by regions
6
Solar PV 1 (materials); 3 (components); 1 (panels); 51 (installers); 1 (services)
57
Clean Energy Production Technologies
Investments and Jobs (2030, EUCO3232.5
based MAX technology deployment projection)
Average CAPEX needs (EUR million)
Job creation potential (FTE)
Wind 2 702.62 17 182
Solar PV 359.93 2 657
Bioenergy 525.60 1 540
EUR mil/Job ratio
Wind, 0.54 Solar PV, 0.11 Bio, 0.10
Solar PV
Bio
Wind
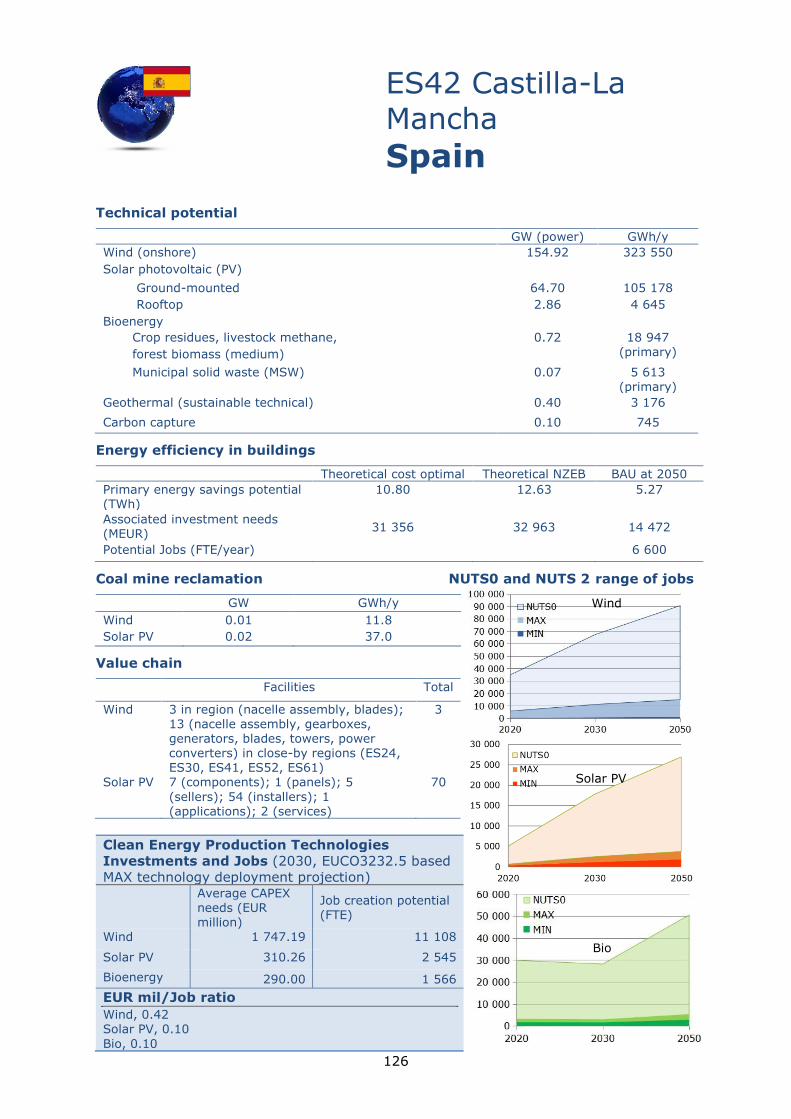
126
Technical potential
ES42 Castilla-La
Mancha
Spain
GW (power) GWh/y
Wind (onshore) 154.92 323 550
Solar photovoltaic (PV)
Ground-mounted 64.70 105 178
Rooftop 2.86 4 645
Bioenergy
Crop residues, livestock methane,
forest biomass (medium)
0.72 18 947 (primary)
Municipal solid waste (MSW) 0.07 5 613 (primary)
Geothermal (sustainable technical) 0.40 3 176
Carbon capture 0.10 745
Energy efficiency in buildings
Theoretical cost optimal Theoretical NZEB BAU at 2050
Primary energy savings potential (TWh)
10.80 12.63 5.27
Associated investment needs (MEUR)
31 356 32 963 14 472
Potential Jobs (FTE/year) 6 600
Coal mine reclamation NUTS0 and NUTS 2 range of jobs
GW GWh/y
Wind 0.01 11.8
Solar PV 0.02 37.0
Value chain
Facilities Total
Wind 3 in region (nacelle assembly, blades); 13 (nacelle assembly, gearboxes, generators, blades, towers, power converters) in close-by regions (ES24, ES30, ES41, ES52, ES61)
3
Solar PV 7 (components); 1 (panels); 5
(sellers); 54 (installers); 1 (applications); 2 (services)
70
Clean Energy Production Technologies
Investments and Jobs (2030, EUCO3232.5 based
MAX technology deployment projection)
Average CAPEX needs (EUR million)
Job creation potential (FTE)
Wind 1 747.19 11 108
Solar PV 310.26 2 545
Bioenergy 290.00 1 566
EUR mil/Job ratio
Wind, 0.42 Solar PV, 0.10
Bio, 0.10
Solar PV
Wind
Bio
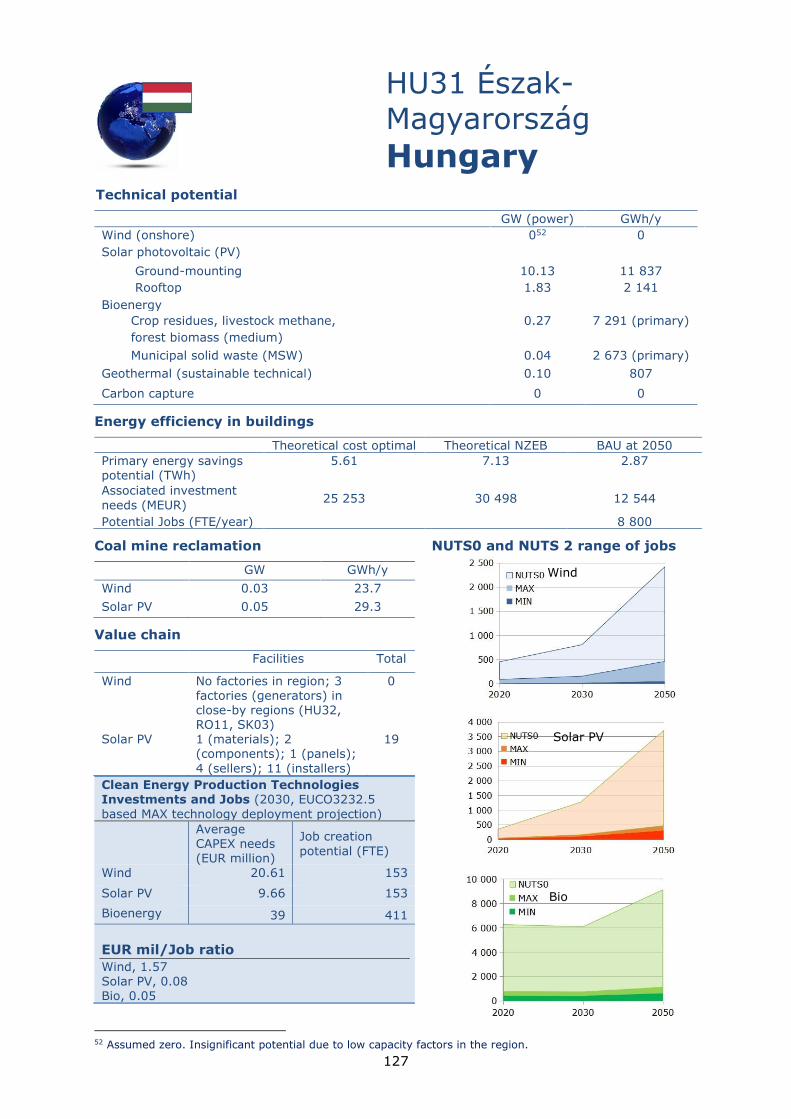
127
Technical potential
HU31 Észak-
Magyarország
Hungary
GW (power) GWh/y
Wind (onshore) 052 0
Solar photovoltaic (PV)
Ground-mounting 10.13 11 837
Rooftop 1.83 2 141
Bioenergy
Crop residues, livestock methane,
forest biomass (medium)
0.27 7 291 (primary)
Municipal solid waste (MSW) 0.04 2 673 (primary)
Geothermal (sustainable technical) 0.10 807
Carbon capture 0 0
Energy efficiency in buildings
Theoretical cost optimal Theoretical NZEB BAU at 2050
Primary energy savings potential (TWh)
5.61 7.13 2.87
Associated investment
needs (MEUR) 25 253 30 498 12 544
Potential Jobs (FTE/year) 8 800
Coal mine reclamation NUTS0 and NUTS 2 range of jobs
GW GWh/y
Wind 0.03 23.7
Solar PV 0.05 29.3
Value chain
Facilities Total
Wind No factories in region; 3 factories (generators) in close-by regions (HU32, RO11, SK03)
0
Solar PV 1 (materials); 2 (components); 1 (panels);
4 (sellers); 11 (installers)
19
Clean Energy Production Technologies Investments and Jobs (2030, EUCO3232.5
based MAX technology deployment projection)
Average CAPEX needs (EUR million)
Job creation
potential (FTE)
Wind 20.61 153
Solar PV 9.66 153
Bioenergy 39 411
EUR mil/Job ratio
Wind, 1.57 Solar PV, 0.08 Bio, 0.05
52 Assumed zero. Insignificant potential due to low capacity factors in the region.
Wind
Solar PV
Bio
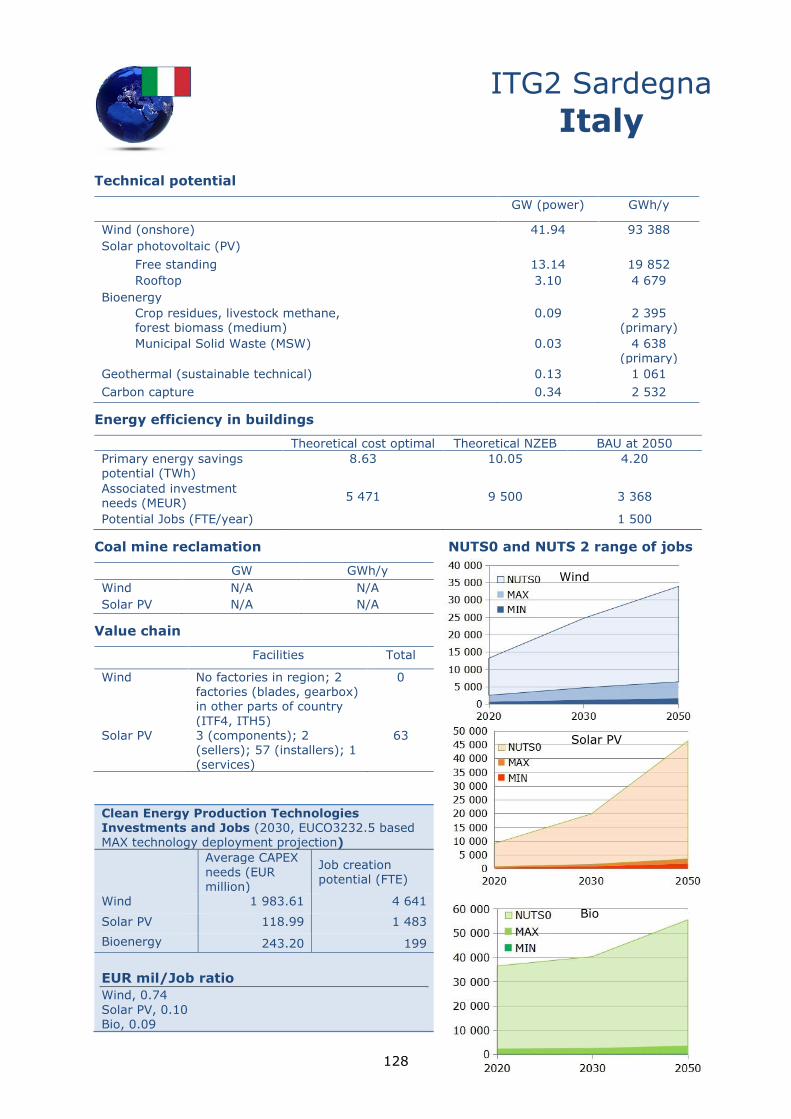
128
Technical potential
ITG2 Sardegna
Italy
GW (power) GWh/y
Wind (onshore) 41.94 93 388
Solar photovoltaic (PV)
Free standing 13.14 19 852
Rooftop 3.10 4 679
Bioenergy
Crop residues, livestock methane, forest biomass (medium)
0.09 2 395 (primary)
Municipal Solid Waste (MSW) 0.03 4 638 (primary)
Geothermal (sustainable technical) 0.13 1 061
Carbon capture 0.34 2 532
Energy efficiency in buildings
Theoretical cost optimal Theoretical NZEB BAU at 2050
Primary energy savings potential (TWh)
8.63 10.05 4.20
Associated investment needs (MEUR)
5 471 9 500 3 368
Potential Jobs (FTE/year) 1 500
Coal mine reclamation NUTS0 and NUTS 2 range of jobs
GW GWh/y
Wind N/A N/A
Solar PV N/A N/A
Value chain
Facilities Total
Wind No factories in region; 2 factories (blades, gearbox) in other parts of country
(ITF4, ITH5)
0
Solar PV 3 (components); 2 (sellers); 57 (installers); 1 (services)
63
Clean Energy Production Technologies Investments and Jobs (2030, EUCO3232.5 based MAX technology deployment projection)
Average CAPEX
needs (EUR million)
Job creation potential (FTE)
Wind 1 983.61 4 641
Solar PV 118.99 1 483
Bioenergy 243.20 199
EUR mil/Job ratio
Wind, 0.74
Solar PV, 0.10 Bio, 0.09
Bio
Solar PV
Wind
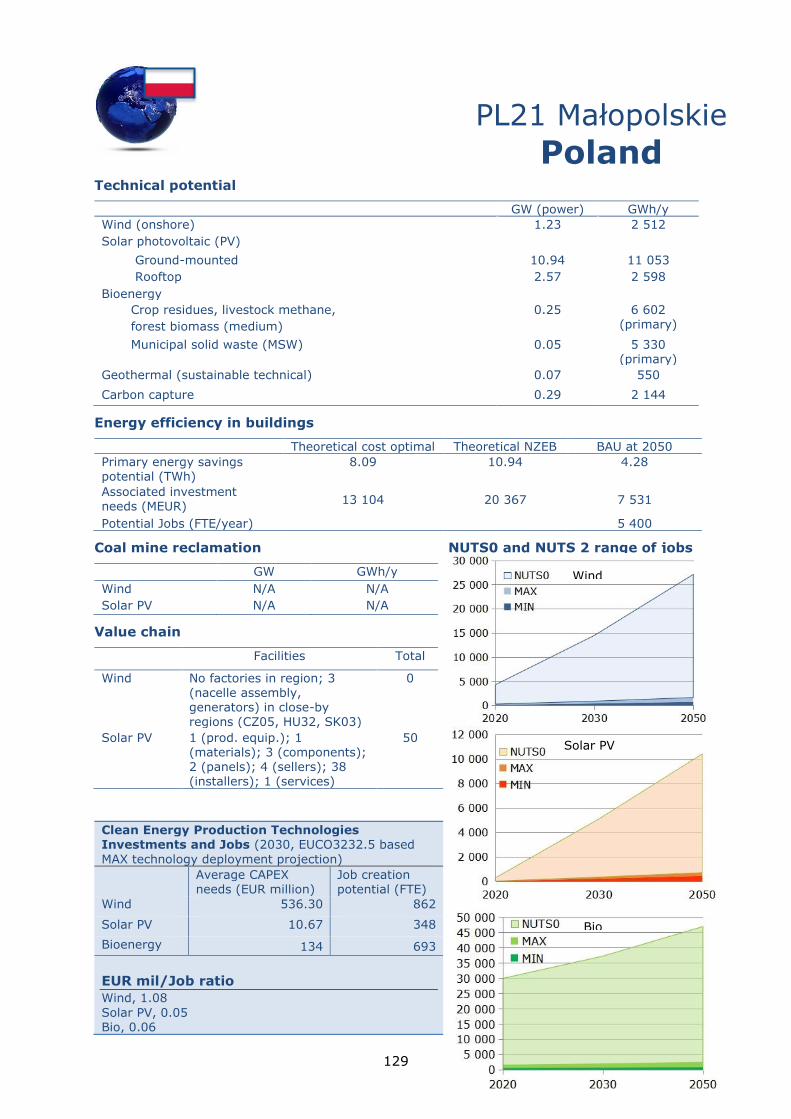
129
Technical potential
PL21 Małopolskie
Poland
GW (power) GWh/y
Wind (onshore) 1.23 2 512
Solar photovoltaic (PV)
Ground-mounted 10.94 11 053
Rooftop 2.57 2 598
Bioenergy
Crop residues, livestock methane,
forest biomass (medium)
0.25 6 602 (primary)
Municipal solid waste (MSW) 0.05 5 330 (primary)
Geothermal (sustainable technical) 0.07 550
Carbon capture 0.29 2 144
Energy efficiency in buildings
Theoretical cost optimal Theoretical NZEB BAU at 2050
Primary energy savings potential (TWh)
8.09 10.94 4.28
Associated investment needs (MEUR)
13 104 20 367 7 531
Potential Jobs (FTE/year) 5 400
Coal mine reclamation NUTS0 and NUTS 2 range of jobs
GW GWh/y
Wind N/A N/A
Solar PV N/A N/A
Value chain
Facilities Total
Wind No factories in region; 3 (nacelle assembly, generators) in close-by regions (CZ05, HU32, SK03)
0
Solar PV 1 (prod. equip.); 1 (materials); 3 (components); 2 (panels); 4 (sellers); 38 (installers); 1 (services)
50
Clean Energy Production Technologies Investments and Jobs (2030, EUCO3232.5 based
MAX technology deployment projection)
Average CAPEX needs (EUR million)
Job creation potential (FTE)
Wind 536.30 862
Solar PV 10.67 348
Bioenergy 134 693
EUR mil/Job ratio
Wind, 1.08
Solar PV, 0.05 Bio, 0.06
Wind
Solar PV
Bio
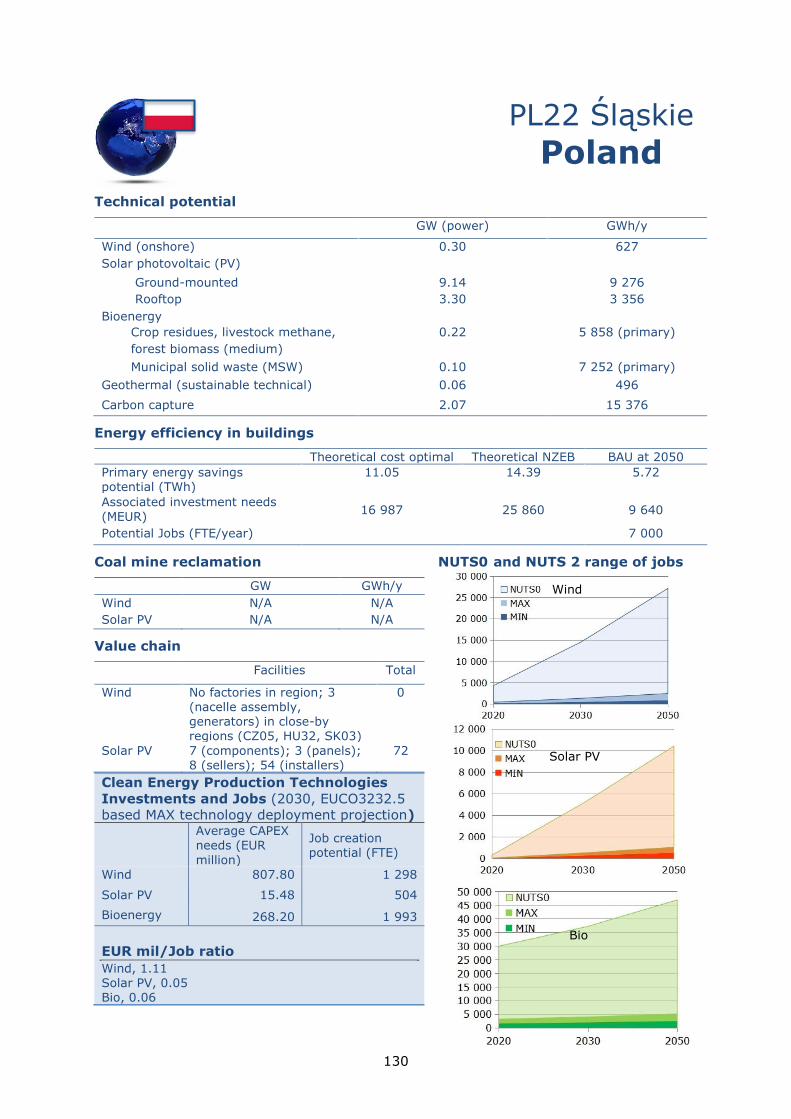
130
Technical potential
PL22 Śląskie
Poland
GW (power) GWh/y
Wind (onshore) 0.30 627
Solar photovoltaic (PV)
Ground-mounted 9.14 9 276
Rooftop 3.30 3 356
Bioenergy
Crop residues, livestock methane,
forest biomass (medium)
0.22 5 858 (primary)
Municipal solid waste (MSW) 0.10 7 252 (primary)
Geothermal (sustainable technical) 0.06 496
Carbon capture 2.07 15 376
Energy efficiency in buildings
Theoretical cost optimal Theoretical NZEB BAU at 2050
Primary energy savings potential (TWh)
11.05 14.39 5.72
Associated investment needs
(MEUR) 16 987 25 860 9 640
Potential Jobs (FTE/year) 7 000
Coal mine reclamation NUTS0 and NUTS 2 range of jobs
GW GWh/y
Wind N/A N/A
Solar PV N/A N/A
Value chain
Facilities Total
Wind No factories in region; 3 (nacelle assembly, generators) in close-by regions (CZ05, HU32, SK03)
0
Solar PV 7 (components); 3 (panels); 8 (sellers); 54 (installers)
72
Clean Energy Production Technologies
Investments and Jobs (2030, EUCO3232.5
based MAX technology deployment projection)
Average CAPEX needs (EUR
million)
Job creation potential (FTE)
Wind 807.80 1 298
Solar PV 15.48 504
Bioenergy 268.20 1 993
EUR mil/Job ratio
Wind, 1.11 Solar PV, 0.05 Bio, 0.06
Solar PV
Wind
Bio
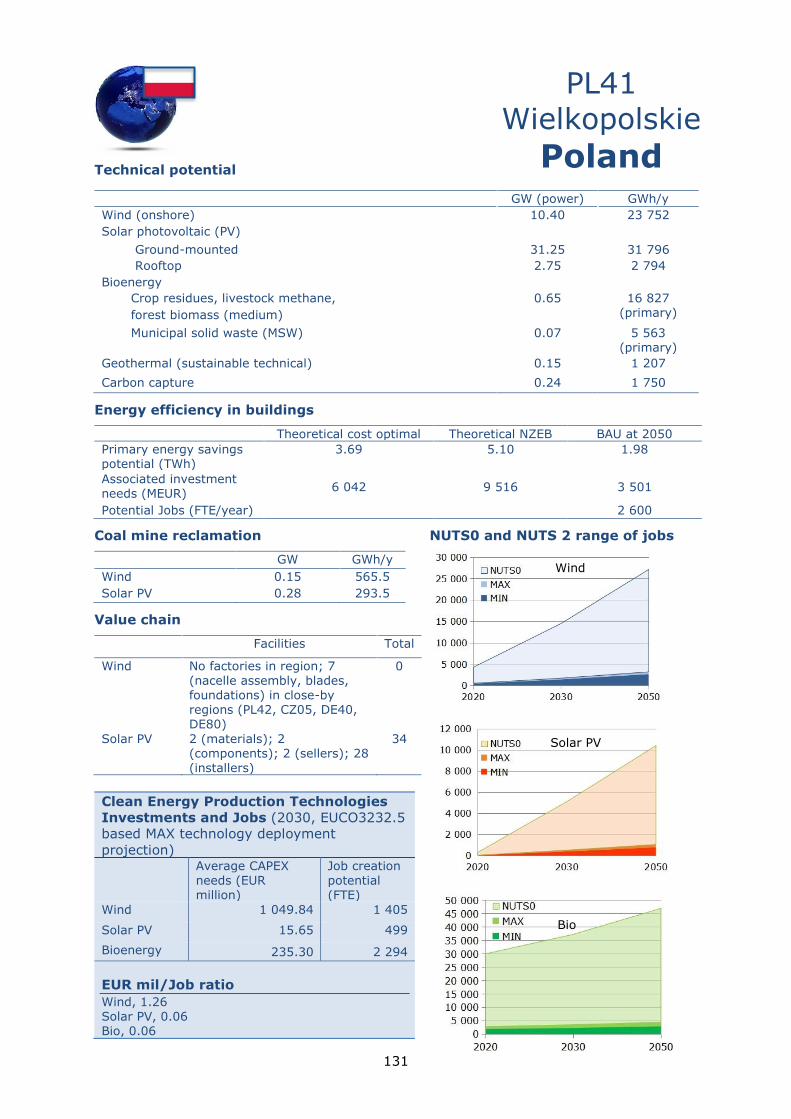
131
Technical potential
PL41
Wielkopolskie
Poland
GW (power) GWh/y
Wind (onshore) 10.40 23 752
Solar photovoltaic (PV)
Ground-mounted 31.25 31 796
Rooftop 2.75 2 794
Bioenergy
Crop residues, livestock methane,
forest biomass (medium)
0.65 16 827 (primary)
Municipal solid waste (MSW) 0.07 5 563 (primary)
Geothermal (sustainable technical) 0.15 1 207
Carbon capture 0.24 1 750
Energy efficiency in buildings
Theoretical cost optimal Theoretical NZEB BAU at 2050
Primary energy savings potential (TWh)
3.69 5.10 1.98
Associated investment needs (MEUR)
6 042 9 516 3 501
Potential Jobs (FTE/year) 2 600
Coal mine reclamation NUTS0 and NUTS 2 range of jobs
GW GWh/y
Wind 0.15 565.5
Solar PV 0.28 293.5
Value chain
Facilities Total
Wind No factories in region; 7 (nacelle assembly, blades, foundations) in close-by regions (PL42, CZ05, DE40, DE80)
0
Solar PV 2 (materials); 2 (components); 2 (sellers); 28 (installers)
34
Clean Energy Production Technologies
Investments and Jobs (2030, EUCO3232.5
based MAX technology deployment
projection)
Average CAPEX needs (EUR million)
Job creation potential (FTE)
Wind 1 049.84 1 405
Solar PV 15.65 499
Bioenergy 235.30 2 294
EUR mil/Job ratio
Wind, 1.26 Solar PV, 0.06 Bio, 0.06
Solar PV
Bio
Wind
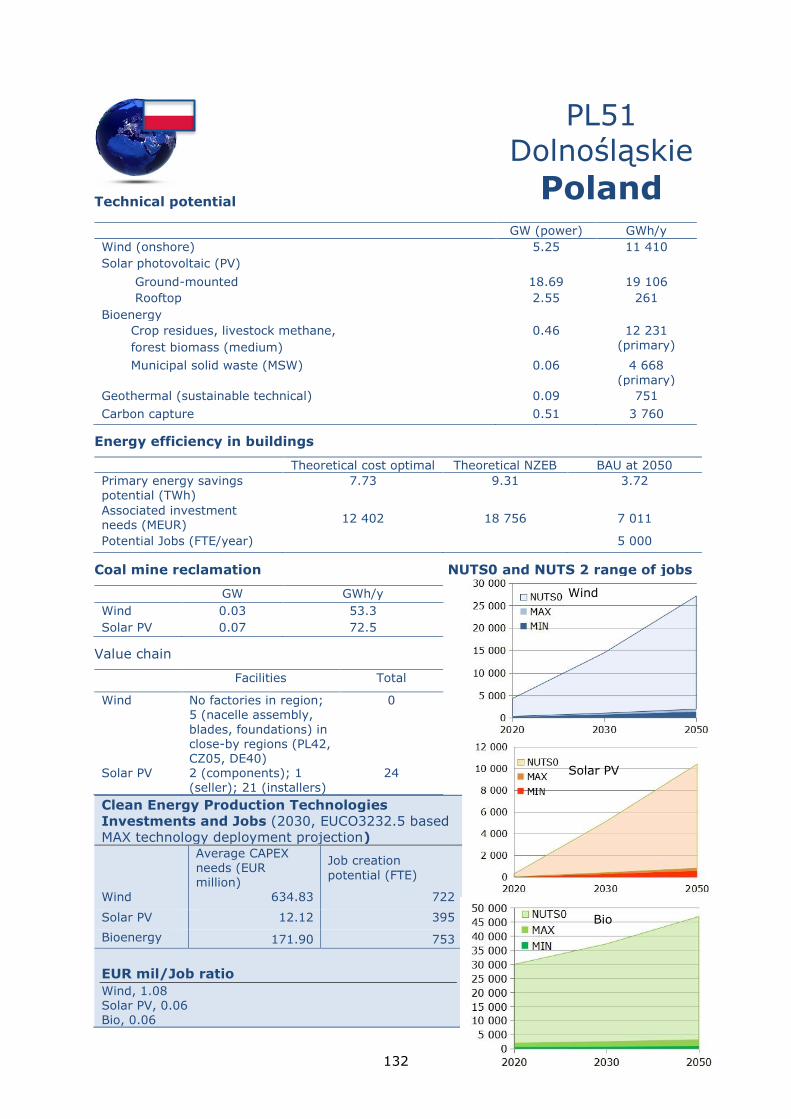
132
Technical potential
PL51
Dolnośląskie
Poland
GW (power) GWh/y
Wind (onshore) 5.25 11 410
Solar photovoltaic (PV)
Ground-mounted 18.69 19 106
Rooftop 2.55 261
Bioenergy
Crop residues, livestock methane,
forest biomass (medium)
0.46 12 231
(primary)
Municipal solid waste (MSW) 0.06 4 668
(primary)
Geothermal (sustainable technical) 0.09 751
Carbon capture 0.51 3 760
Energy efficiency in buildings
Theoretical cost optimal Theoretical NZEB BAU at 2050
Primary energy savings potential (TWh)
7.73 9.31 3.72
Associated investment needs (MEUR)
12 402 18 756 7 011
Potential Jobs (FTE/year) 5 000
Coal mine reclamation NUTS0 and NUTS 2 range of jobs
GW GWh/y
Wind 0.03 53.3
Solar PV 0.07 72.5
Value chain
Facilities Total
Wind No factories in region; 5 (nacelle assembly,
blades, foundations) in close-by regions (PL42, CZ05, DE40)
0
Solar PV 2 (components); 1 (seller); 21 (installers)
24
Clean Energy Production Technologies
Investments and Jobs (2030, EUCO3232.5 based
MAX technology deployment projection)
Average CAPEX
needs (EUR million)
Job creation
potential (FTE)
Wind 634.83 722
Solar PV 12.12 395
Bioenergy 171.90 753
EUR mil/Job ratio
Wind, 1.08 Solar PV, 0.06 Bio, 0.06
Bio
Solar PV
Wind
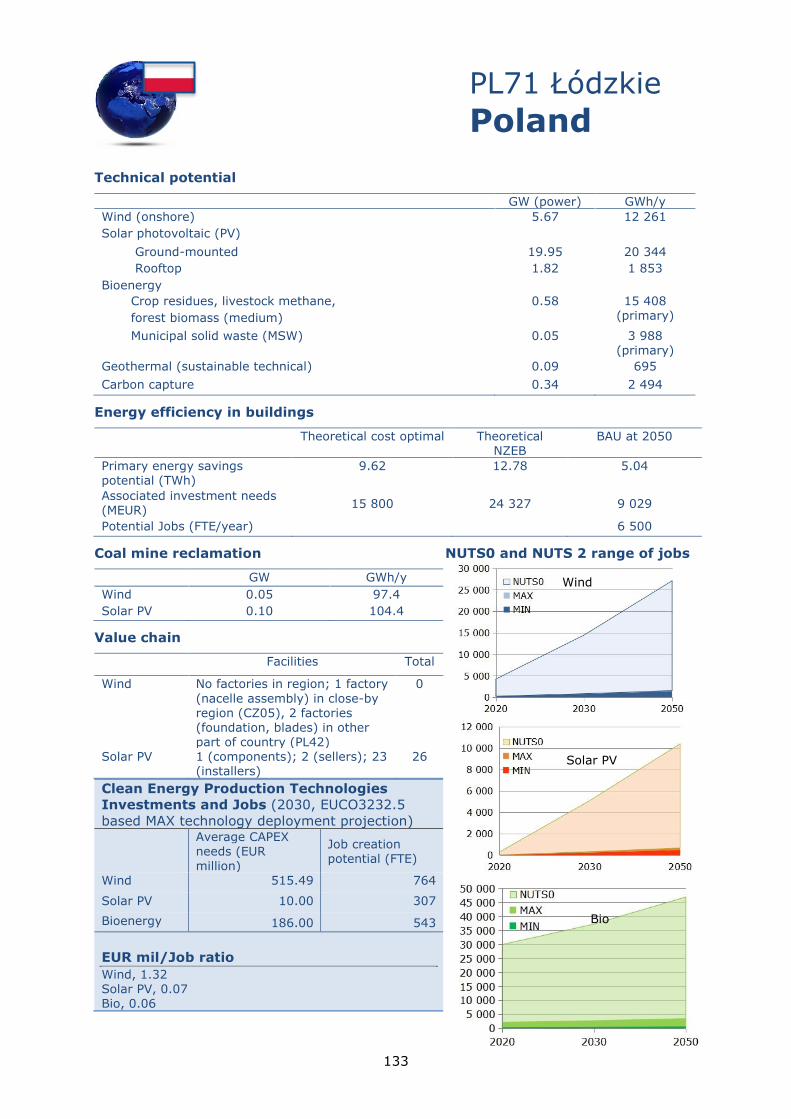
133
Technical potential
PL71 Łódzkie
Poland
GW (power) GWh/y
Wind (onshore) 5.67 12 261
Solar photovoltaic (PV)
Ground-mounted 19.95 20 344
Rooftop 1.82 1 853
Bioenergy
Crop residues, livestock methane,
forest biomass (medium)
0.58 15 408 (primary)
Municipal solid waste (MSW) 0.05 3 988 (primary)
Geothermal (sustainable technical) 0.09 695
Carbon capture 0.34 2 494
Energy efficiency in buildings
Theoretical cost optimal Theoretical NZEB
BAU at 2050
Primary energy savings potential (TWh)
9.62 12.78 5.04
Associated investment needs (MEUR)
15 800 24 327 9 029
Potential Jobs (FTE/year) 6 500
Coal mine reclamation NUTS0 and NUTS 2 range of jobs
GW GWh/y
Wind 0.05 97.4
Solar PV 0.10 104.4
Value chain
Facilities Total
Wind No factories in region; 1 factory
(nacelle assembly) in close-by region (CZ05), 2 factories (foundation, blades) in other part of country (PL42)
0
Solar PV 1 (components); 2 (sellers); 23 (installers)
26
Clean Energy Production Technologies
Investments and Jobs (2030, EUCO3232.5
based MAX technology deployment projection)
Average CAPEX needs (EUR
million)
Job creation potential (FTE)
Wind 515.49 764
Solar PV 10.00 307
Bioenergy 186.00 543
EUR mil/Job ratio
Wind, 1.32 Solar PV, 0.07 Bio, 0.06
Solar PV
Bio
Wind
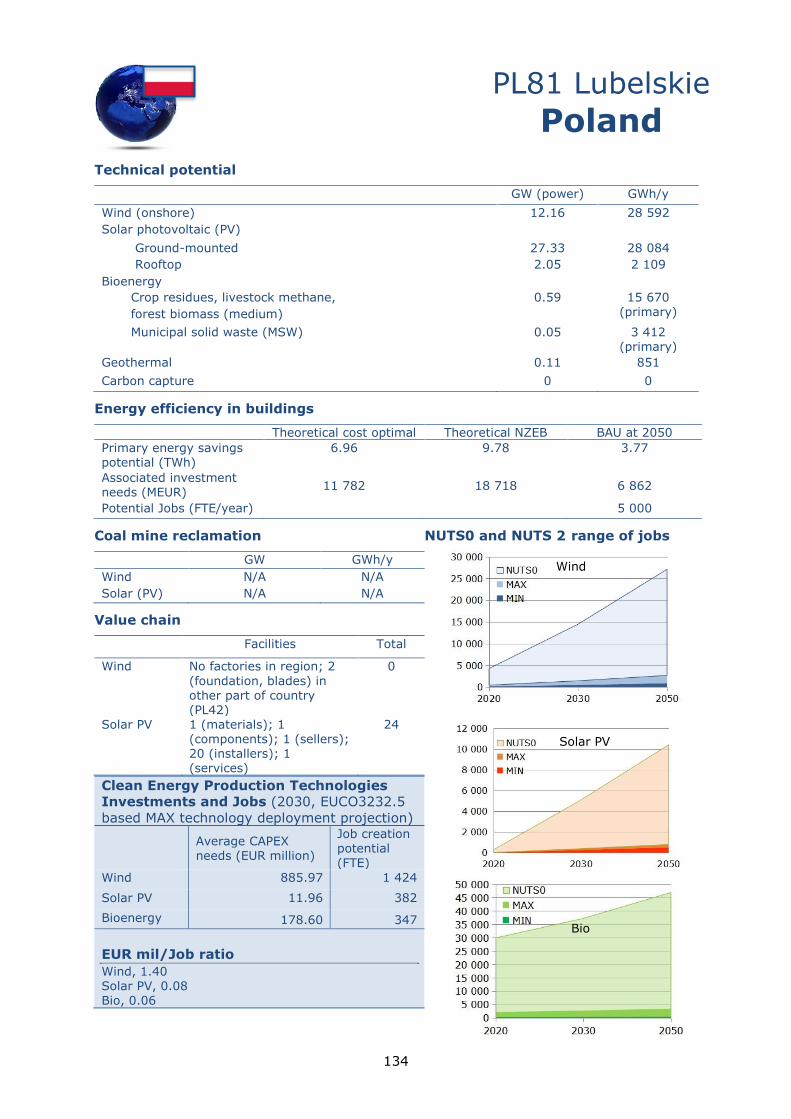
134
Technical potential
PL81 Lubelskie
Poland
GW (power) GWh/y
Wind (onshore) 12.16 28 592
Solar photovoltaic (PV)
Ground-mounted 27.33 28 084
Rooftop 2.05 2 109
Bioenergy
Crop residues, livestock methane,
forest biomass (medium)
0.59 15 670 (primary)
Municipal solid waste (MSW) 0.05 3 412 (primary)
Geothermal 0.11 851
Carbon capture 0 0
Energy efficiency in buildings
Theoretical cost optimal Theoretical NZEB BAU at 2050
Primary energy savings potential (TWh)
6.96 9.78 3.77
Associated investment needs (MEUR)
11 782 18 718 6 862
Potential Jobs (FTE/year) 5 000
Coal mine reclamation NUTS0 and NUTS 2 range of jobs
GW GWh/y
Wind N/A N/A
Solar (PV) N/A N/A
Value chain
Facilities Total
Wind No factories in region; 2
(foundation, blades) in other part of country (PL42)
0
Solar PV 1 (materials); 1 (components); 1 (sellers); 20 (installers); 1 (services)
24
Clean Energy Production Technologies
Investments and Jobs (2030, EUCO3232.5
based MAX technology deployment projection)
Average CAPEX needs (EUR million)
Job creation potential
(FTE)
Wind 885.97 1 424
Solar PV 11.96 382
Bioenergy 178.60 347
EUR mil/Job ratio
Wind, 1.40 Solar PV, 0.08 Bio, 0.06
Bio
Solar PV
Wind
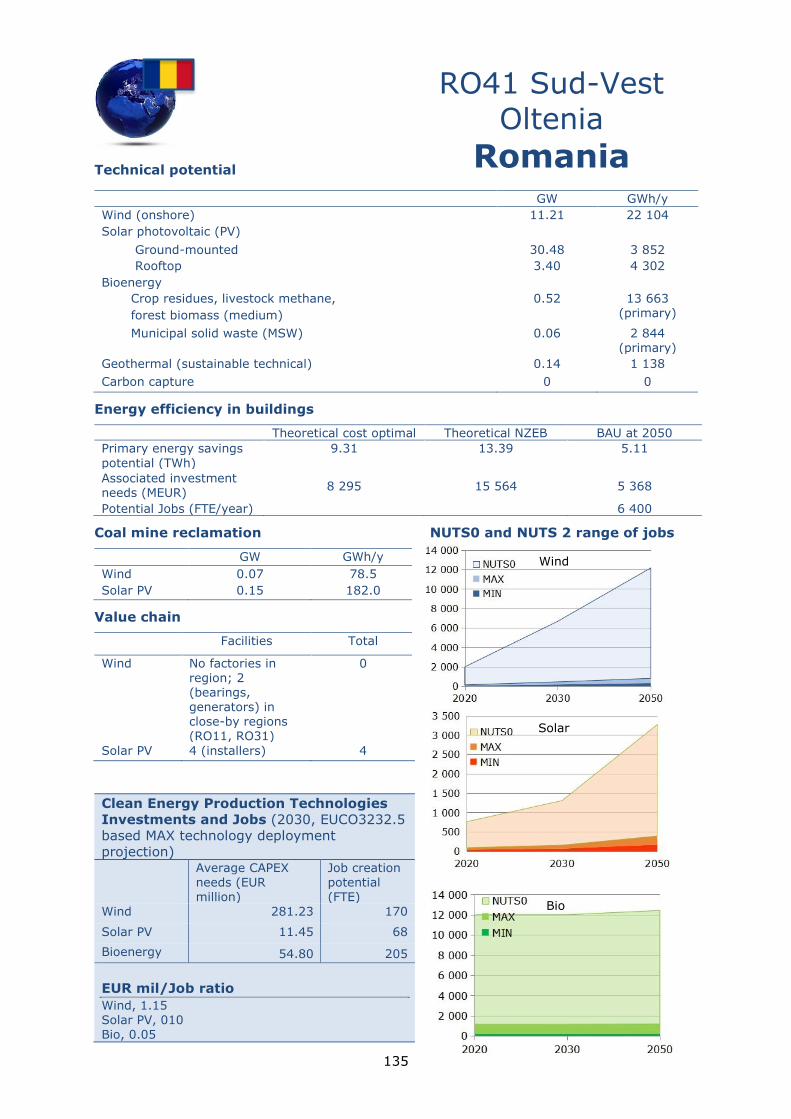
135
Technical potential
RO41 Sud-Vest
Oltenia
Romania
GW GWh/y
Wind (onshore) 11.21 22 104
Solar photovoltaic (PV)
Ground-mounted 30.48 3 852
Rooftop 3.40 4 302
Bioenergy
Crop residues, livestock methane,
forest biomass (medium)
0.52 13 663 (primary)
Municipal solid waste (MSW) 0.06 2 844 (primary)
Geothermal (sustainable technical) 0.14 1 138
Carbon capture 0 0
Energy efficiency in buildings
Theoretical cost optimal Theoretical NZEB BAU at 2050
Primary energy savings
potential (TWh)
9.31 13.39 5.11
Associated investment needs (MEUR)
8 295 15 564 5 368
Potential Jobs (FTE/year) 6 400
Coal mine reclamation NUTS0 and NUTS 2 range of jobs
GW GWh/y
Wind 0.07 78.5
Solar PV 0.15 182.0
Value chain
Facilities Total
Wind No factories in region; 2 (bearings, generators) in close-by regions (RO11, RO31)
0
Solar PV 4 (installers) 4
Clean Energy Production Technologies
Investments and Jobs (2030, EUCO3232.5
based MAX technology deployment
projection)
Average CAPEX needs (EUR million)
Job creation potential (FTE)
Wind 281.23 170
Solar PV 11.45 68
Bioenergy 54.80 205
EUR mil/Job ratio
Wind, 1.15 Solar PV, 010 Bio, 0.05
Bio
Wind
Solar
PV
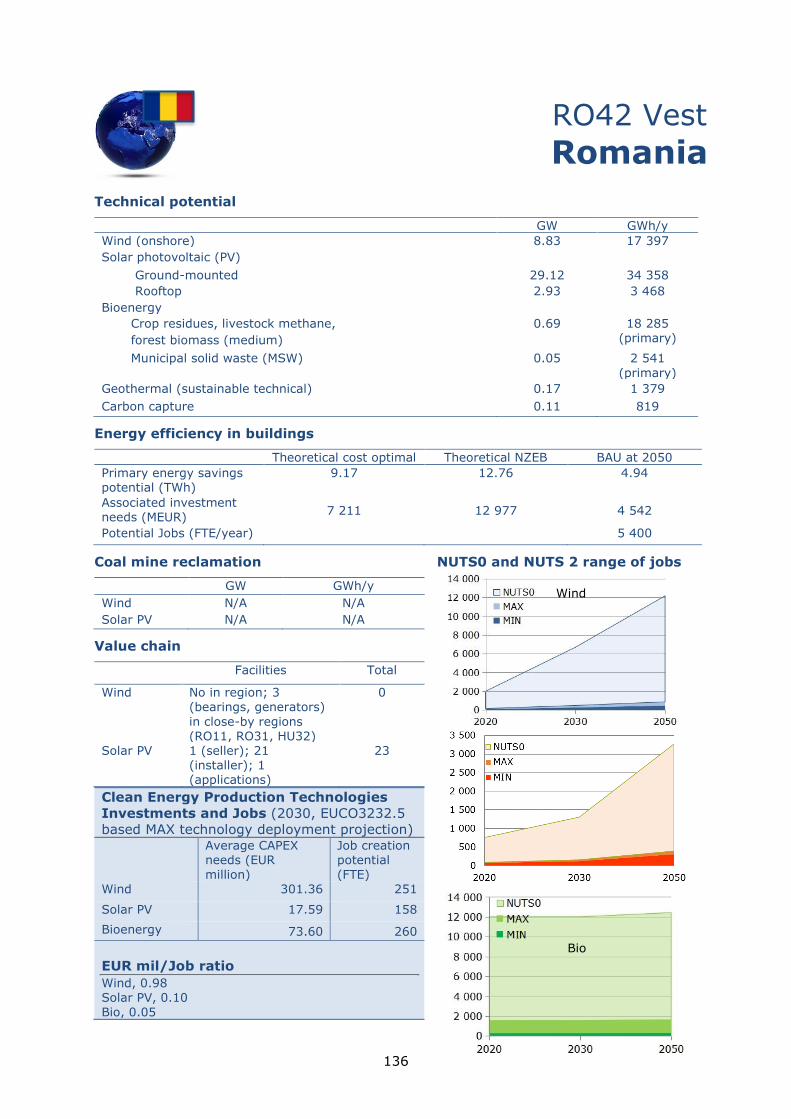
136
Technical potential
RO42 Vest
Romania
GW GWh/y
Wind (onshore) 8.83 17 397
Solar photovoltaic (PV)
Ground-mounted 29.12 34 358
Rooftop 2.93 3 468
Bioenergy
Crop residues, livestock methane,
forest biomass (medium)
0.69 18 285 (primary)
Municipal solid waste (MSW) 0.05 2 541
(primary)
Geothermal (sustainable technical) 0.17 1 379
Carbon capture 0.11 819
Energy efficiency in buildings
Theoretical cost optimal Theoretical NZEB BAU at 2050
Primary energy savings potential (TWh)
9.17 12.76 4.94
Associated investment needs (MEUR)
7 211 12 977 4 542
Potential Jobs (FTE/year) 5 400
Coal mine reclamation NUTS0 and NUTS 2 range of jobs
GW GWh/y
Wind N/A N/A
Solar PV N/A N/A
Value chain
Facilities Total
Wind No in region; 3 (bearings, generators)
in close-by regions (RO11, RO31, HU32)
0
Solar PV 1 (seller); 21 (installer); 1 (applications)
23
Clean Energy Production Technologies
Investments and Jobs (2030, EUCO3232.5
based MAX technology deployment projection)
Average CAPEX needs (EUR
million)
Job creation potential
(FTE) Wind 301.36 251
Solar PV 17.59 158
Bioenergy 73.60 260
EUR mil/Job ratio
Wind, 0.98 Solar PV, 0.10 Bio, 0.05
Solar PV
Bio
Wind
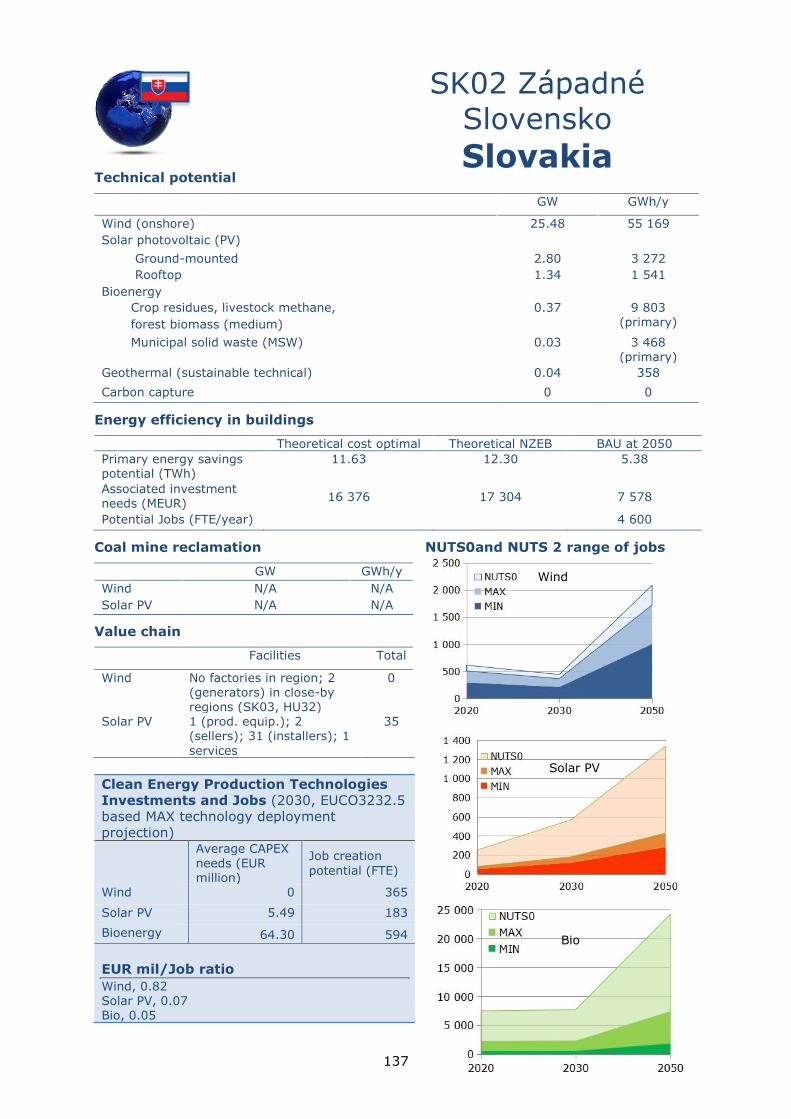
137
Technical potential
SK02 Západné
Slovensko
Slovakia
GW GWh/y
Wind (onshore) 25.48 55 169
Solar photovoltaic (PV)
Ground-mounted 2.80 3 272
Rooftop 1.34 1 541
Bioenergy
Crop residues, livestock methane,
forest biomass (medium)
0.37 9 803 (primary)
Municipal solid waste (MSW) 0.03 3 468 (primary)
Geothermal (sustainable technical) 0.04 358
Carbon capture 0 0
Energy efficiency in buildings
Theoretical cost optimal Theoretical NZEB BAU at 2050
Primary energy savings potential (TWh)
11.63 12.30 5.38
Associated investment needs (MEUR)
16 376 17 304 7 578
Potential Jobs (FTE/year) 4 600
Coal mine reclamation NUTS0and NUTS 2 range of jobs
GW GWh/y
Wind N/A N/A
Solar PV N/A N/A
Value chain
Facilities Total
Wind No factories in region; 2 (generators) in close-by regions (SK03, HU32)
0
Solar PV 1 (prod. equip.); 2 (sellers); 31 (installers); 1
services
35
Clean Energy Production Technologies
Investments and Jobs (2030, EUCO3232.5
based MAX technology deployment
projection)
Average CAPEX
needs (EUR million)
Job creation
potential (FTE)
Wind 0 365
Solar PV 5.49 183
Bioenergy 64.30 594
EUR mil/Job ratio
Wind, 0.82 Solar PV, 0.07 Bio, 0.05
Bio
Solar PV
Wind
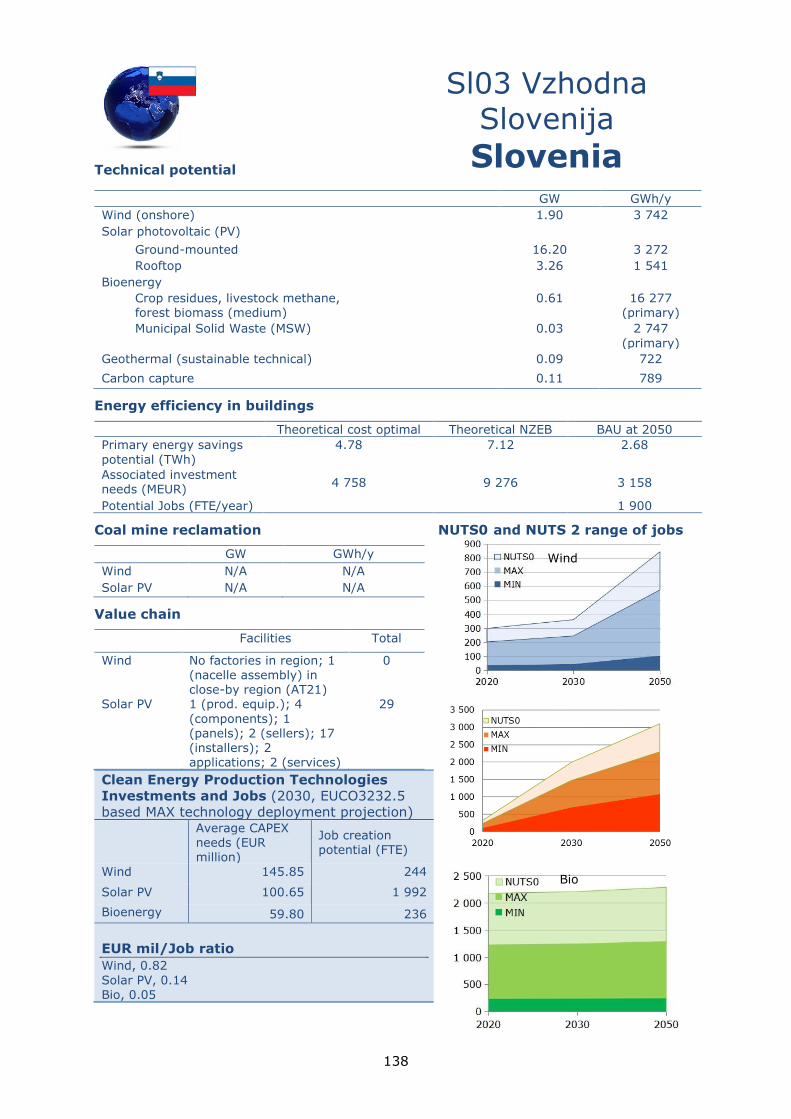
138
Technical potential
Sl03 Vzhodna
Slovenija
Slovenia
GW GWh/y
Wind (onshore) 1.90 3 742
Solar photovoltaic (PV)
Ground-mounted 16.20 3 272
Rooftop 3.26 1 541
Bioenergy
Crop residues, livestock methane, forest biomass (medium)
0.61 16 277 (primary)
Municipal Solid Waste (MSW) 0.03 2 747
(primary)
Geothermal (sustainable technical) 0.09 722
Carbon capture 0.11 789
Energy efficiency in buildings
Theoretical cost optimal Theoretical NZEB BAU at 2050
Primary energy savings
potential (TWh)
4.78 7.12 2.68
Associated investment needs (MEUR)
4 758 9 276 3 158
Potential Jobs (FTE/year) 1 900
Coal mine reclamation NUTS0 and NUTS 2 range of jobs
GW GWh/y
Wind N/A N/A
Solar PV N/A N/A
Value chain
Facilities Total
Wind No factories in region; 1 (nacelle assembly) in close-by region (AT21)
0
Solar PV 1 (prod. equip.); 4
(components); 1 (panels); 2 (sellers); 17 (installers); 2 applications; 2 (services)
29
Clean Energy Production Technologies
Investments and Jobs (2030, EUCO3232.5
based MAX technology deployment projection)
Average CAPEX needs (EUR million)
Job creation potential (FTE)
Wind 145.85 244
Solar PV 100.65 1 992
Bioenergy 59.80 236
EUR mil/Job ratio
Wind, 0.82
Solar PV, 0.14 Bio, 0.05
Solar PV
Bio
Wind
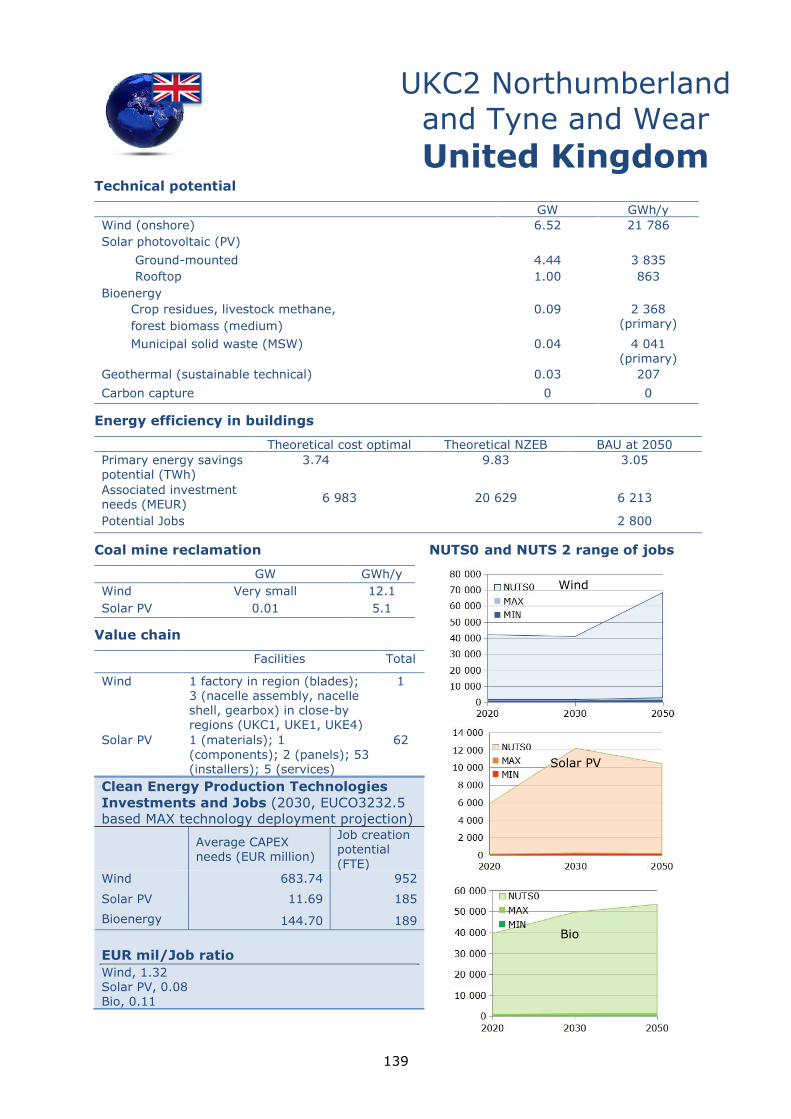
139
Technical potential
UKC2 Northumberland
and Tyne and Wear
United Kingdom
GW GWh/y
Wind (onshore) 6.52 21 786
Solar photovoltaic (PV)
Ground-mounted 4.44 3 835
Rooftop 1.00 863
Bioenergy
Crop residues, livestock methane,
forest biomass (medium)
0.09 2 368 (primary)
Municipal solid waste (MSW) 0.04 4 041 (primary)
Geothermal (sustainable technical) 0.03 207
Carbon capture 0 0
Energy efficiency in buildings
Theoretical cost optimal Theoretical NZEB BAU at 2050
Primary energy savings potential (TWh)
3.74 9.83 3.05
Associated investment needs (MEUR)
6 983 20 629 6 213
Potential Jobs 2 800
Coal mine reclamation NUTS0 and NUTS 2 range of jobs
GW GWh/y
Wind Very small 12.1
Solar PV 0.01 5.1
Value chain
Facilities Total
Wind 1 factory in region (blades); 3 (nacelle assembly, nacelle shell, gearbox) in close-by regions (UKC1, UKE1, UKE4)
1
Solar PV 1 (materials); 1
(components); 2 (panels); 53 (installers); 5 (services)
62
Clean Energy Production Technologies
Investments and Jobs (2030, EUCO3232.5
based MAX technology deployment projection)
Average CAPEX needs (EUR million)
Job creation potential
(FTE) Wind 683.74 952
Solar PV 11.69 185
Bioenergy 144.70 189
EUR mil/Job ratio
Wind, 1.32 Solar PV, 0.08 Bio, 0.11
Bio
Solar PV
Wind
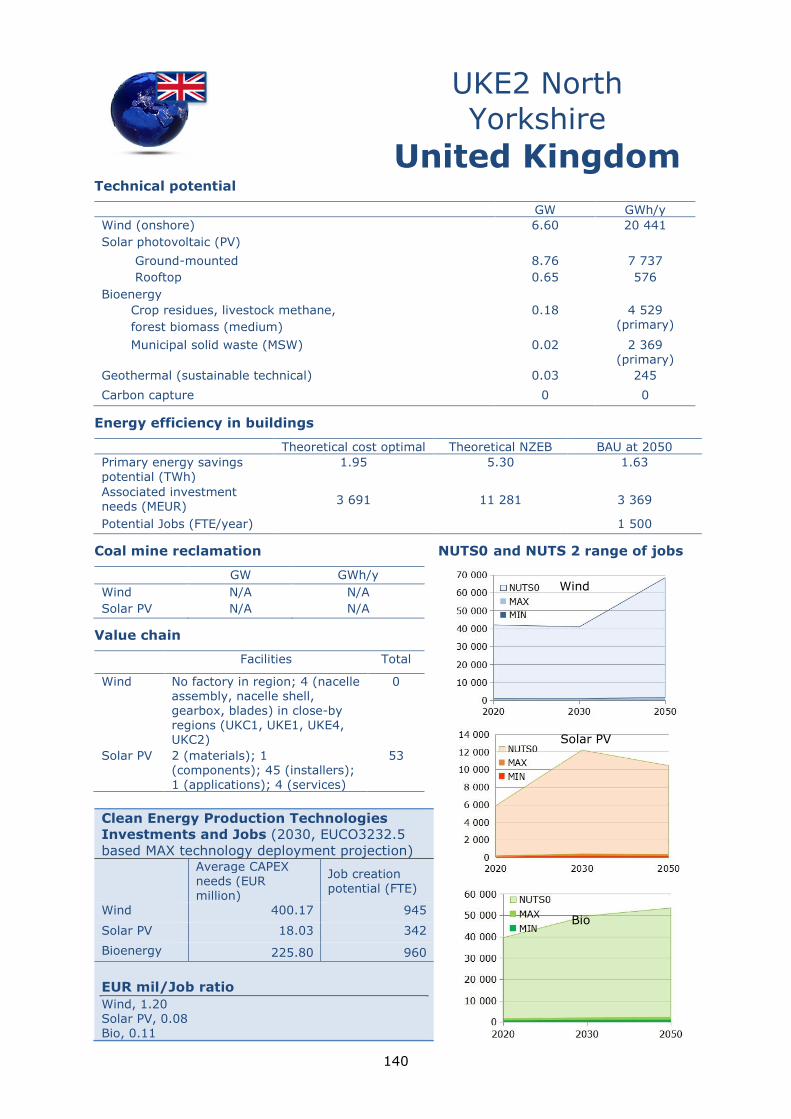
140
Technical potential
UKE2 North
Yorkshire
United Kingdom
GW GWh/y
Wind (onshore) 6.60 20 441
Solar photovoltaic (PV)
Ground-mounted 8.76 7 737
Rooftop 0.65 576
Bioenergy
Crop residues, livestock methane,
forest biomass (medium)
0.18 4 529 (primary)
Municipal solid waste (MSW) 0.02 2 369 (primary)
Geothermal (sustainable technical) 0.03 245
Carbon capture 0 0
Energy efficiency in buildings
Theoretical cost optimal Theoretical NZEB BAU at 2050
Primary energy savings potential (TWh)
1.95 5.30 1.63
Associated investment needs (MEUR)
3 691 11 281 3 369
Potential Jobs (FTE/year) 1 500
Coal mine reclamation NUTS0 and NUTS 2 range of jobs
GW GWh/y
Wind N/A N/A
Solar PV N/A N/A
Value chain
Facilities Total
Wind No factory in region; 4 (nacelle assembly, nacelle shell, gearbox, blades) in close-by regions (UKC1, UKE1, UKE4, UKC2)
0
Solar PV 2 (materials); 1 (components); 45 (installers); 1 (applications); 4 (services)
53
Clean Energy Production Technologies
Investments and Jobs (2030, EUCO3232.5
based MAX technology deployment projection)
Average CAPEX needs (EUR million)
Job creation potential (FTE)
Wind 400.17 945
Solar PV 18.03 342
Bioenergy 225.80 960
EUR mil/Job ratio
Wind, 1.20 Solar PV, 0.08 Bio, 0.11
Wind
Solar PV
Bio
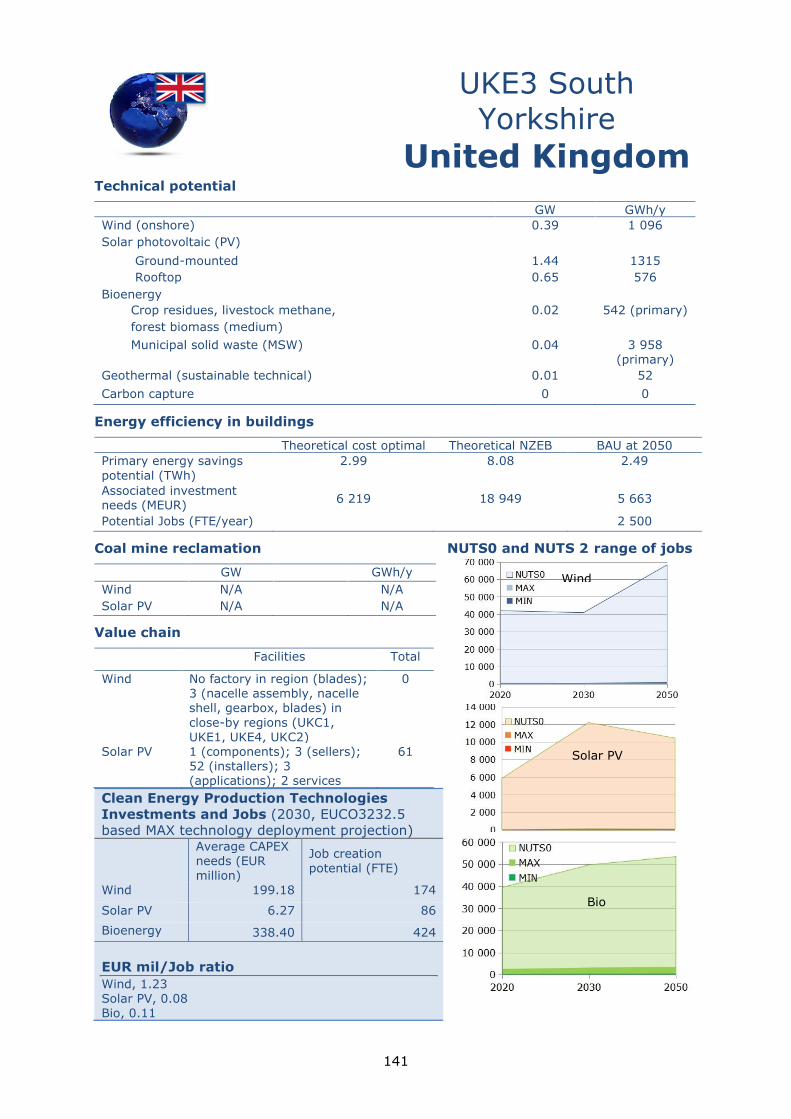
141
Technical potential
UKE3 South
Yorkshire
United Kingdom
GW GWh/y
Wind (onshore) 0.39 1 096
Solar photovoltaic (PV)
Ground-mounted 1.44 1315
Rooftop 0.65 576
Bioenergy
Crop residues, livestock methane,
forest biomass (medium)
0.02 542 (primary)
Municipal solid waste (MSW) 0.04 3 958 (primary)
Geothermal (sustainable technical) 0.01 52
Carbon capture 0 0
Energy efficiency in buildings
Theoretical cost optimal Theoretical NZEB BAU at 2050
Primary energy savings
potential (TWh)
2.99 8.08 2.49
Associated investment needs (MEUR)
6 219 18 949 5 663
Potential Jobs (FTE/year) 2 500
Coal mine reclamation NUTS0 and NUTS 2 range of jobs
GW GWh/y
Wind N/A N/A
Solar PV N/A N/A
Value chain
Facilities Total
Wind No factory in region (blades); 3 (nacelle assembly, nacelle shell, gearbox, blades) in
close-by regions (UKC1, UKE1, UKE4, UKC2)
0
Solar PV 1 (components); 3 (sellers); 52 (installers); 3 (applications); 2 services
61
Clean Energy Production Technologies
Investments and Jobs (2030, EUCO3232.5
based MAX technology deployment projection)
Average CAPEX needs (EUR
million)
Job creation
potential (FTE)
Wind 199.18 174
Solar PV 6.27 86
Bioenergy 338.40 424
EUR mil/Job ratio
Wind, 1.23 Solar PV, 0.08 Bio, 0.11
Solar PV
Bio
Wind
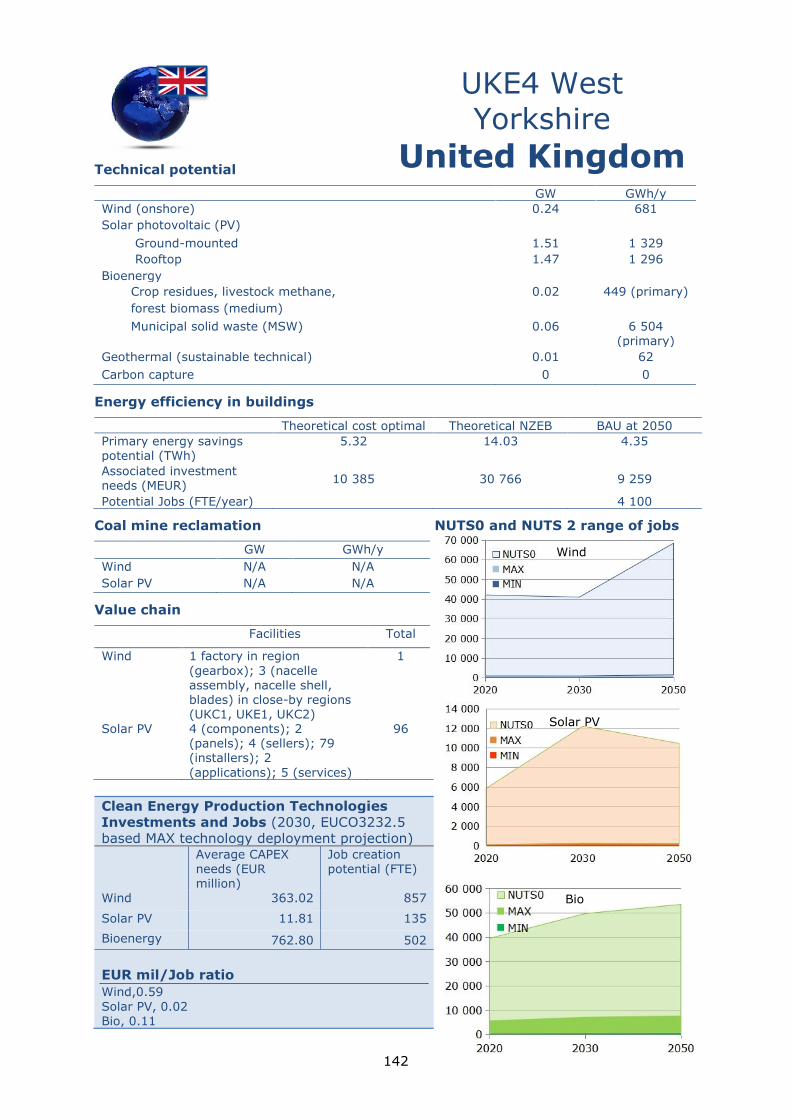
142
Technical potential
UKE4 West
Yorkshire
United Kingdom
GW GWh/y
Wind (onshore) 0.24 681
Solar photovoltaic (PV)
Ground-mounted 1.51 1 329
Rooftop 1.47 1 296
Bioenergy
Crop residues, livestock methane,
forest biomass (medium)
0.02 449 (primary)
Municipal solid waste (MSW) 0.06 6 504 (primary)
Geothermal (sustainable technical) 0.01 62
Carbon capture 0 0
Energy efficiency in buildings
Theoretical cost optimal Theoretical NZEB BAU at 2050
Primary energy savings potential (TWh)
5.32 14.03 4.35
Associated investment needs (MEUR)
10 385 30 766 9 259
Potential Jobs (FTE/year) 4 100
Coal mine reclamation NUTS0 and NUTS 2 range of jobs
GW GWh/y
Wind N/A N/A
Solar PV N/A N/A
Value chain
Facilities Total
Wind 1 factory in region
(gearbox); 3 (nacelle assembly, nacelle shell, blades) in close-by regions (UKC1, UKE1, UKC2)
1
Solar PV 4 (components); 2 (panels); 4 (sellers); 79 (installers); 2
(applications); 5 (services)
96
Clean Energy Production Technologies
Investments and Jobs (2030, EUCO3232.5
based MAX technology deployment projection)
Average CAPEX
needs (EUR million)
Job creation
potential (FTE)
Wind 363.02 857
Solar PV 11.81 135
Bioenergy 762.80 502
EUR mil/Job ratio
Wind,0.59
Solar PV, 0.02 Bio, 0.11
Solar PV
Bio
Wind
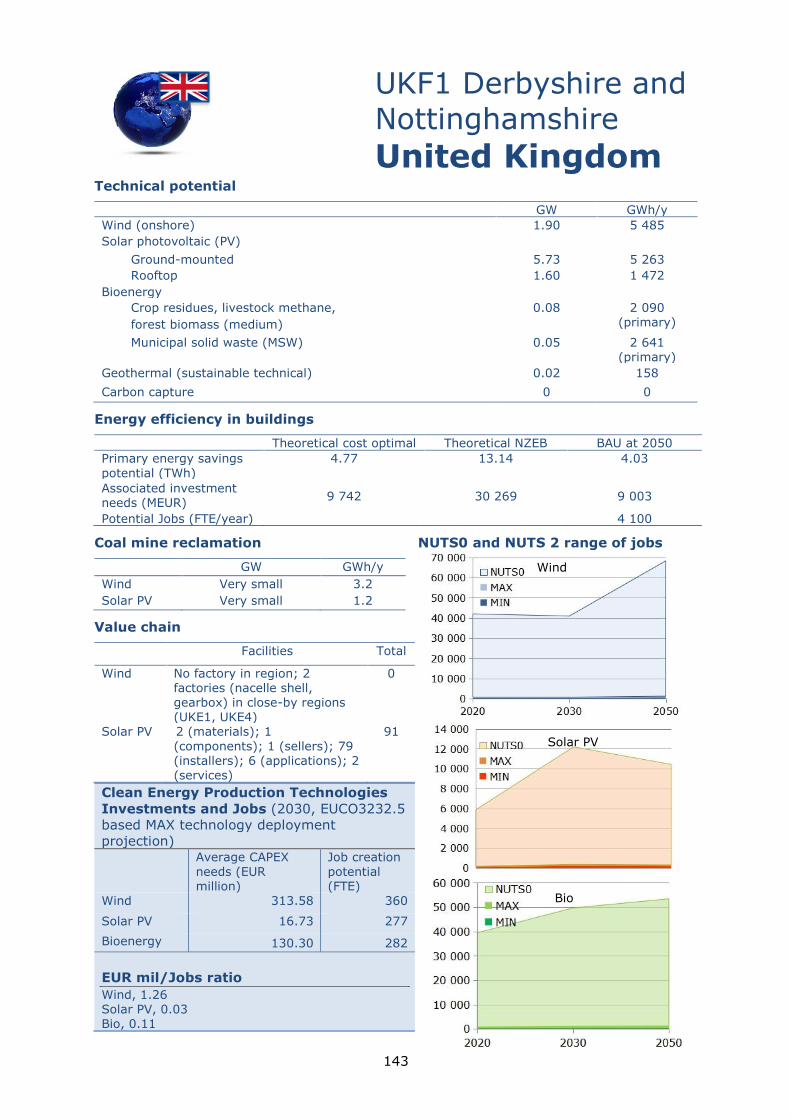
143
Technical potential
UKF1 Derbyshire and
Nottinghamshire
United Kingdom
GW GWh/y
Wind (onshore) 1.90 5 485
Solar photovoltaic (PV)
Ground-mounted 5.73 5 263
Rooftop 1.60 1 472
Bioenergy
Crop residues, livestock methane,
forest biomass (medium)
0.08 2 090 (primary)
Municipal solid waste (MSW) 0.05 2 641 (primary)
Geothermal (sustainable technical) 0.02 158
Carbon capture 0 0
Energy efficiency in buildings
Theoretical cost optimal Theoretical NZEB BAU at 2050
Primary energy savings
potential (TWh)
4.77 13.14 4.03
Associated investment needs (MEUR)
9 742 30 269 9 003
Potential Jobs (FTE/year) 4 100
Coal mine reclamation NUTS0 and NUTS 2 range of jobs
GW GWh/y
Wind Very small 3.2
Solar PV Very small 1.2
Value chain
Facilities Total
Wind No factory in region; 2 factories (nacelle shell, gearbox) in close-by regions (UKE1, UKE4)
0
Solar PV 2 (materials); 1
(components); 1 (sellers); 79 (installers); 6 (applications); 2 (services)
91
Clean Energy Production Technologies
Investments and Jobs (2030, EUCO3232.5
based MAX technology deployment
projection)
Average CAPEX
needs (EUR million)
Job creation
potential (FTE)
Wind 313.58 360
Solar PV 16.73 277
Bioenergy 130.30 282
EUR mil/Jobs ratio
Wind, 1.26 Solar PV, 0.03 Bio, 0.11
Solar PV
Wind
Bio
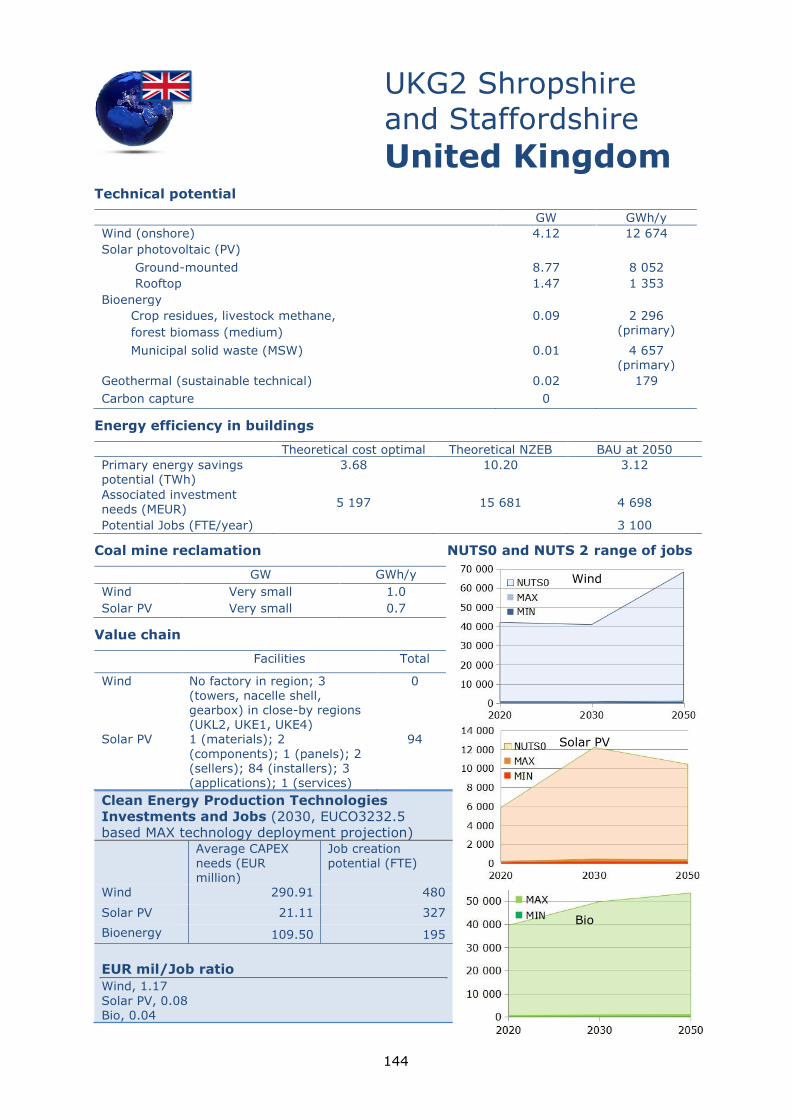
144
Technical potential
UKG2 Shropshire
and Staffordshire
United Kingdom
GW GWh/y
Wind (onshore) 4.12 12 674
Solar photovoltaic (PV)
Ground-mounted 8.77 8 052
Rooftop 1.47 1 353
Bioenergy
Crop residues, livestock methane,
forest biomass (medium)
0.09 2 296 (primary)
Municipal solid waste (MSW) 0.01 4 657 (primary)
Geothermal (sustainable technical) 0.02 179
Carbon capture 0
Energy efficiency in buildings
Theoretical cost optimal Theoretical NZEB BAU at 2050
Primary energy savings potential (TWh)
3.68 10.20 3.12
Associated investment
needs (MEUR) 5 197 15 681 4 698
Potential Jobs (FTE/year) 3 100
Coal mine reclamation NUTS0 and NUTS 2 range of jobs
GW GWh/y
Wind Very small 1.0
Solar PV Very small 0.7
Value chain
Facilities Total
Wind No factory in region; 3 (towers, nacelle shell, gearbox) in close-by regions (UKL2, UKE1, UKE4)
0
Solar PV 1 (materials); 2
(components); 1 (panels); 2 (sellers); 84 (installers); 3 (applications); 1 (services)
94
Clean Energy Production Technologies
Investments and Jobs (2030, EUCO3232.5
based MAX technology deployment projection)
Average CAPEX
needs (EUR million)
Job creation
potential (FTE)
Wind 290.91 480
Solar PV 21.11 327
Bioenergy 109.50 195
EUR mil/Job ratio
Wind, 1.17
Solar PV, 0.08 Bio, 0.04
Wind
Bio
Solar PV
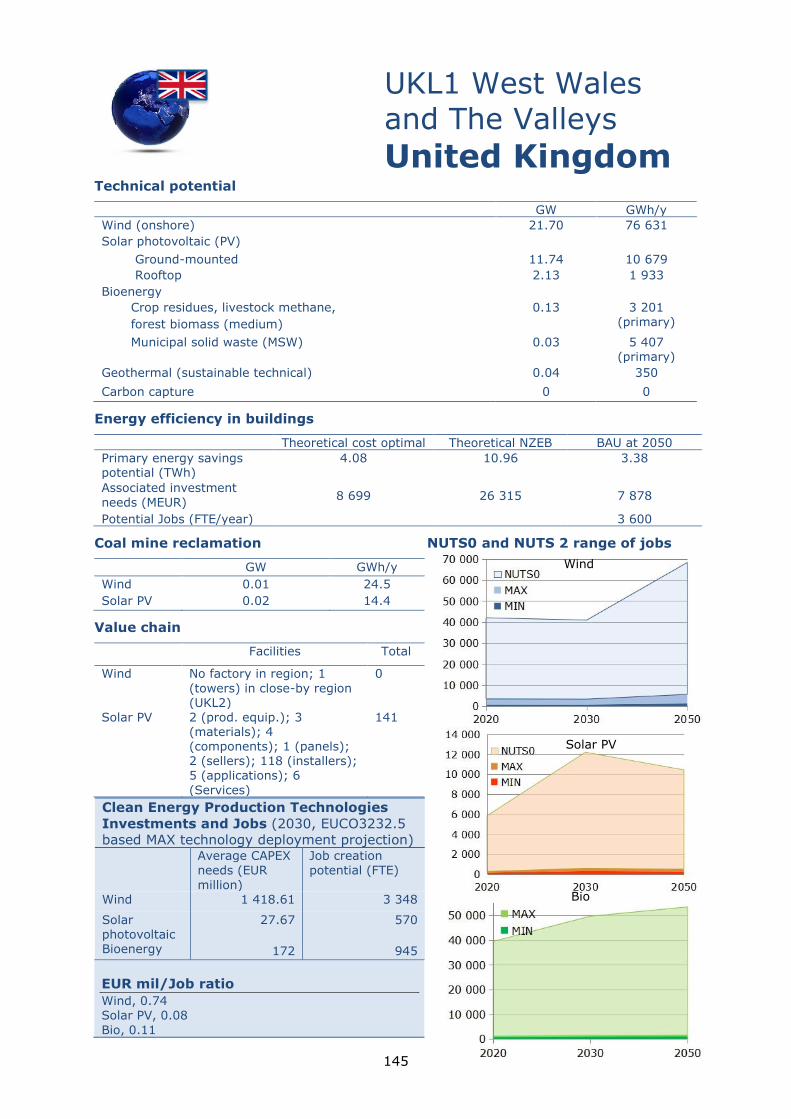
145
Technical potential
UKL1 West Wales
and The Valleys
United Kingdom
GW GWh/y
Wind (onshore) 21.70 76 631
Solar photovoltaic (PV)
Ground-mounted 11.74 10 679
Rooftop 2.13 1 933
Bioenergy
Crop residues, livestock methane,
forest biomass (medium)
0.13 3 201 (primary)
Municipal solid waste (MSW) 0.03 5 407 (primary)
Geothermal (sustainable technical) 0.04 350
Carbon capture 0 0
Energy efficiency in buildings
Theoretical cost optimal Theoretical NZEB BAU at 2050
Primary energy savings potential (TWh)
4.08 10.96 3.38
Associated investment
needs (MEUR) 8 699 26 315 7 878
Potential Jobs (FTE/year) 3 600
Coal mine reclamation NUTS0 and NUTS 2 range of jobs
GW GWh/y
Wind 0.01 24.5
Solar PV 0.02 14.4
Value chain
Facilities Total
Wind No factory in region; 1
(towers) in close-by region (UKL2)
0
Solar PV 2 (prod. equip.); 3 (materials); 4 (components); 1 (panels); 2 (sellers); 118 (installers); 5 (applications); 6
(Services)
141
Clean Energy Production Technologies
Investments and Jobs (2030, EUCO3232.5
based MAX technology deployment projection)
Average CAPEX
needs (EUR
million)
Job creation
potential (FTE)
Wind 1 418.61 3 348
Solar photovoltaic
27.67 570
Bioenergy 172 945
EUR mil/Job ratio
Wind, 0.74 Solar PV, 0.08
Bio, 0.11
Wind
Solar PV
Bio
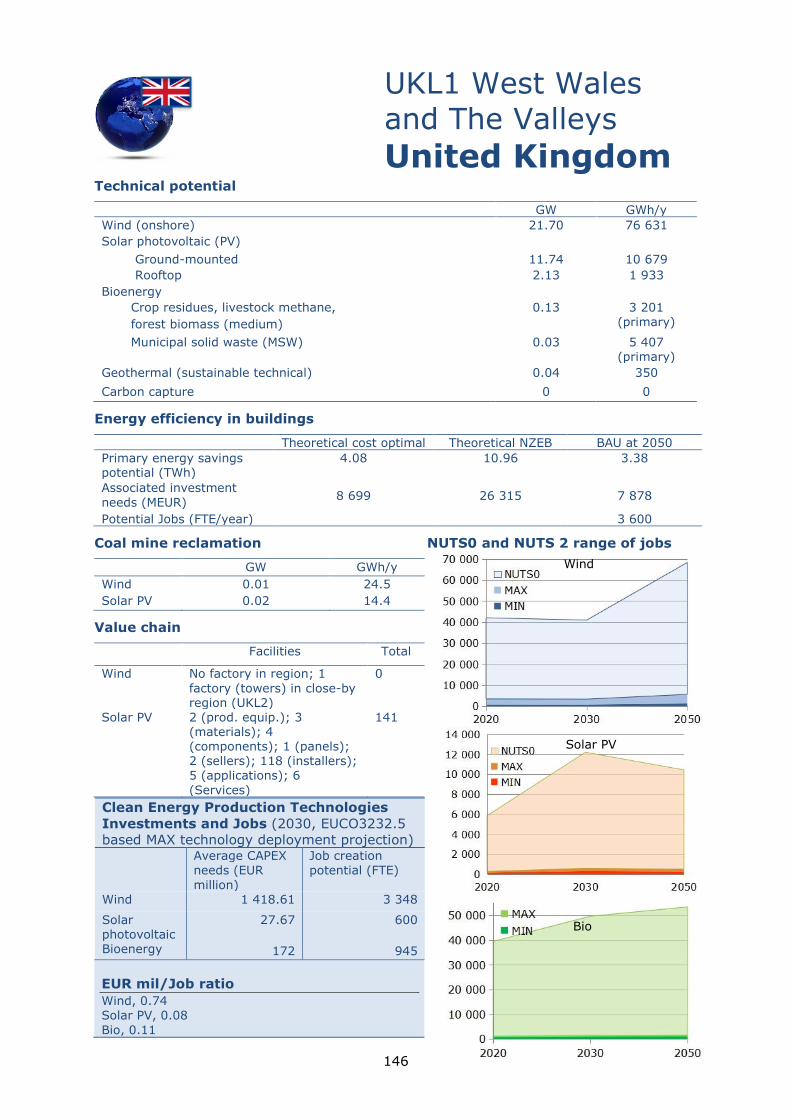
146
Technical potential
UKL1 West Wales
and The Valleys
United Kingdom
GW GWh/y
Wind (onshore) 21.70 76 631
Solar photovoltaic (PV)
Ground-mounted 11.74 10 679
Rooftop 2.13 1 933
Bioenergy
Crop residues, livestock methane,
forest biomass (medium)
0.13 3 201 (primary)
Municipal solid waste (MSW) 0.03 5 407 (primary)
Geothermal (sustainable technical) 0.04 350
Carbon capture 0 0
Energy efficiency in buildings
Theoretical cost optimal Theoretical NZEB BAU at 2050
Primary energy savings potential (TWh)
4.08 10.96 3.38
Associated investment
needs (MEUR) 8 699 26 315 7 878
Potential Jobs (FTE/year) 3 600
Coal mine reclamation NUTS0 and NUTS 2 range of jobs
GW GWh/y
Wind 0.01 24.5
Solar PV 0.02 14.4
Value chain
Facilities Total
Wind No factory in region; 1
factory (towers) in close-by region (UKL2)
0
Solar PV 2 (prod. equip.); 3 (materials); 4 (components); 1 (panels); 2 (sellers); 118 (installers); 5 (applications); 6
(Services)
141
Clean Energy Production Technologies
Investments and Jobs (2030, EUCO3232.5
based MAX technology deployment projection)
Average CAPEX
needs (EUR
million)
Job creation
potential (FTE)
Wind 1 418.61 3 348
Solar photovoltaic
27.67 600
Bioenergy 172 945
EUR mil/Job ratio
Wind, 0.74 Solar PV, 0.08
Bio, 0.11
Wind
Solar PV
Bio
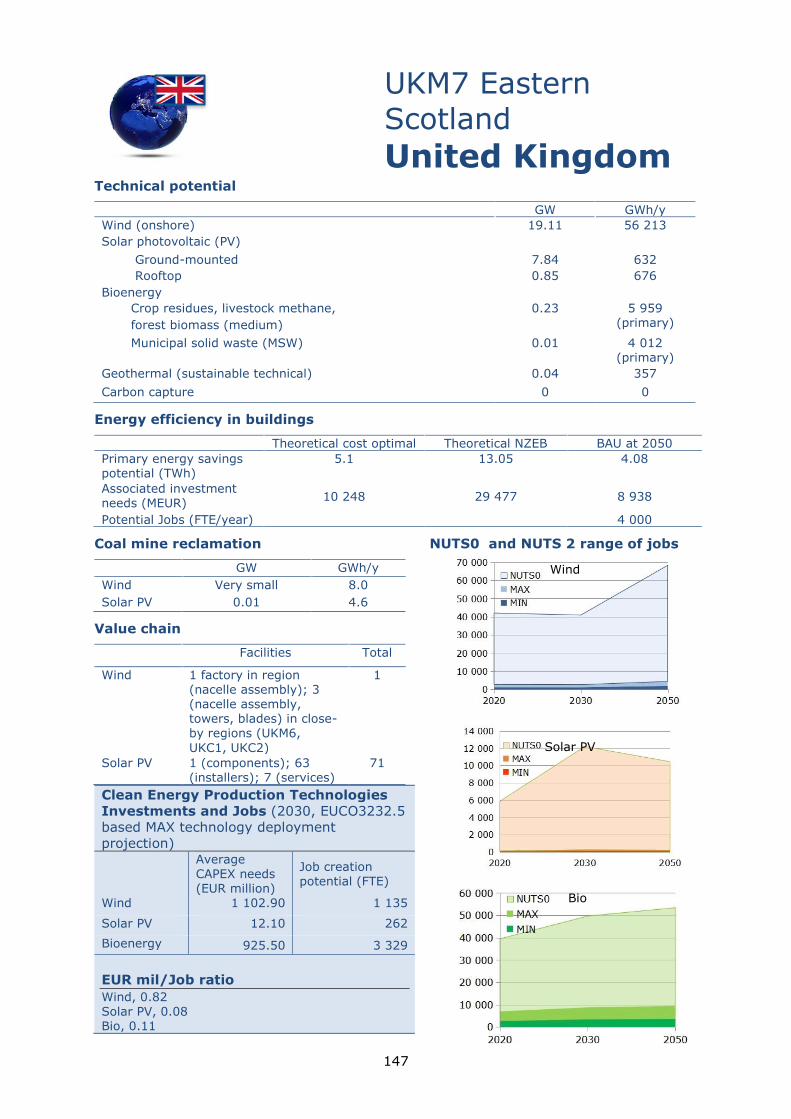
147
Technical potential
UKM7 Eastern
Scotland
United Kingdom
GW GWh/y
Wind (onshore) 19.11 56 213
Solar photovoltaic (PV)
Ground-mounted 7.84 632
Rooftop 0.85 676
Bioenergy
Crop residues, livestock methane,
forest biomass (medium)
0.23 5 959 (primary)
Municipal solid waste (MSW) 0.01 4 012 (primary)
Geothermal (sustainable technical) 0.04 357
Carbon capture 0 0
Energy efficiency in buildings
Theoretical cost optimal Theoretical NZEB BAU at 2050
Primary energy savings potential (TWh)
5.1 13.05 4.08
Associated investment needs (MEUR)
10 248 29 477 8 938
Potential Jobs (FTE/year) 4 000
Coal mine reclamation NUTS0 and NUTS 2 range of jobs
GW GWh/y
Wind Very small 8.0
Solar PV 0.01 4.6
Value chain
Facilities Total
Wind 1 factory in region (nacelle assembly); 3 (nacelle assembly, towers, blades) in close-by regions (UKM6,
UKC1, UKC2)
1
Solar PV 1 (components); 63 (installers); 7 (services)
71
Clean Energy Production Technologies
Investments and Jobs (2030, EUCO3232.5
based MAX technology deployment
projection)
Average
CAPEX needs (EUR million)
Job creation potential (FTE)
Wind 1 102.90 1 135
Solar PV 12.10 262
Bioenergy 925.50 3 329
EUR mil/Job ratio
Wind, 0.82 Solar PV, 0.08 Bio, 0.11
Solar PV
Wind
Bio
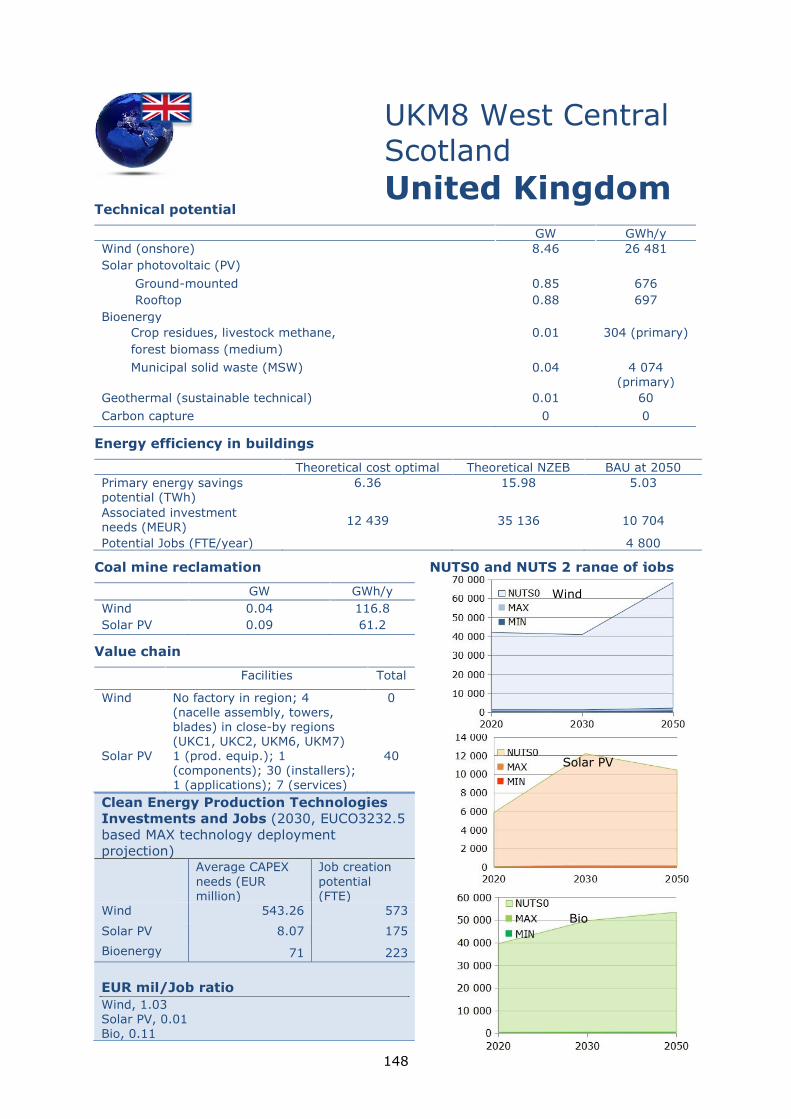
148
Technical potential
UKM8 West Central
Scotland
United Kingdom
GW GWh/y
Wind (onshore) 8.46 26 481
Solar photovoltaic (PV)
Ground-mounted 0.85 676
Rooftop 0.88 697
Bioenergy
Crop residues, livestock methane,
forest biomass (medium)
0.01 304 (primary)
Municipal solid waste (MSW) 0.04 4 074 (primary)
Geothermal (sustainable technical) 0.01 60
Carbon capture 0 0
Energy efficiency in buildings
Theoretical cost optimal Theoretical NZEB BAU at 2050
Primary energy savings potential (TWh)
6.36 15.98 5.03
Associated investment needs (MEUR)
12 439 35 136 10 704
Potential Jobs (FTE/year) 4 800
Coal mine reclamation NUTS0 and NUTS 2 range of jobs
GW GWh/y
Wind 0.04 116.8
Solar PV 0.09 61.2
Value chain
Facilities Total
Wind No factory in region; 4 (nacelle assembly, towers, blades) in close-by regions (UKC1, UKC2, UKM6, UKM7)
0
Solar PV 1 (prod. equip.); 1 (components); 30 (installers); 1 (applications); 7 (services)
40
Clean Energy Production Technologies
Investments and Jobs (2030, EUCO3232.5
based MAX technology deployment
projection)
Average CAPEX
needs (EUR million)
Job creation
potential (FTE)
Wind 543.26 573
Solar PV 8.07 175
Bioenergy 71 223
EUR mil/Job ratio
Wind, 1.03 Solar PV, 0.01 Bio, 0.11
Solar PV
Bio
Wind
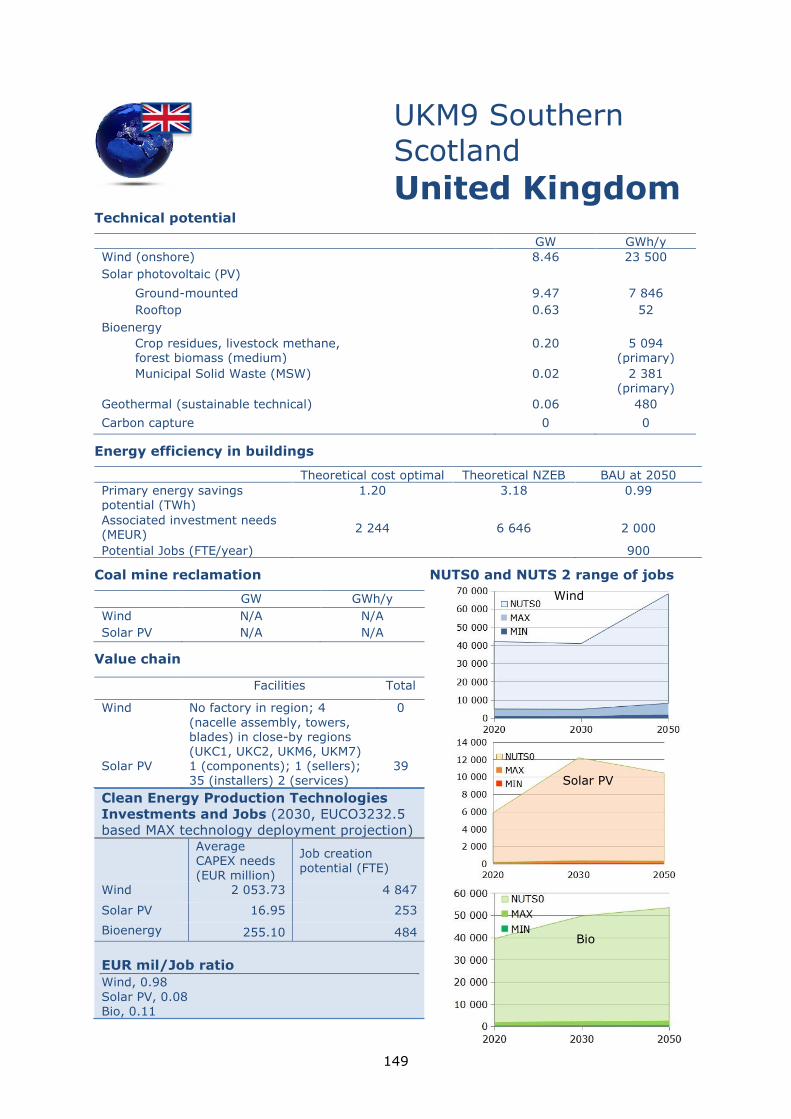
149
Technical potential
UKM9 Southern
Scotland
United Kingdom
GW GWh/y
Wind (onshore) 8.46 23 500
Solar photovoltaic (PV)
Ground-mounted 9.47 7 846
Rooftop 0.63 52
Bioenergy
Crop residues, livestock methane, forest biomass (medium)
0.20 5 094 (primary)
Municipal Solid Waste (MSW) 0.02 2 381 (primary)
Geothermal (sustainable technical) 0.06 480
Carbon capture 0 0
Energy efficiency in buildings
Theoretical cost optimal Theoretical NZEB BAU at 2050
Primary energy savings potential (TWh)
1.20 3.18 0.99
Associated investment needs (MEUR)
2 244 6 646 2 000
Potential Jobs (FTE/year) 900
Coal mine reclamation NUTS0 and NUTS 2 range of jobs
GW GWh/y
Wind N/A N/A
Solar PV N/A N/A
Value chain
Facilities Total
Wind No factory in region; 4
(nacelle assembly, towers, blades) in close-by regions (UKC1, UKC2, UKM6, UKM7)
0
Solar PV 1 (components); 1 (sellers); 35 (installers) 2 (services)
39
Clean Energy Production Technologies
Investments and Jobs (2030, EUCO3232.5
based MAX technology deployment projection)
Average CAPEX needs
(EUR million)
Job creation
potential (FTE)
Wind 2 053.73 4 847
Solar PV 16.95 253
Bioenergy 255.10 484
EUR mil/Job ratio
Wind, 0.98
Solar PV, 0.08 Bio, 0.11
Bio
Wind
Solar PV
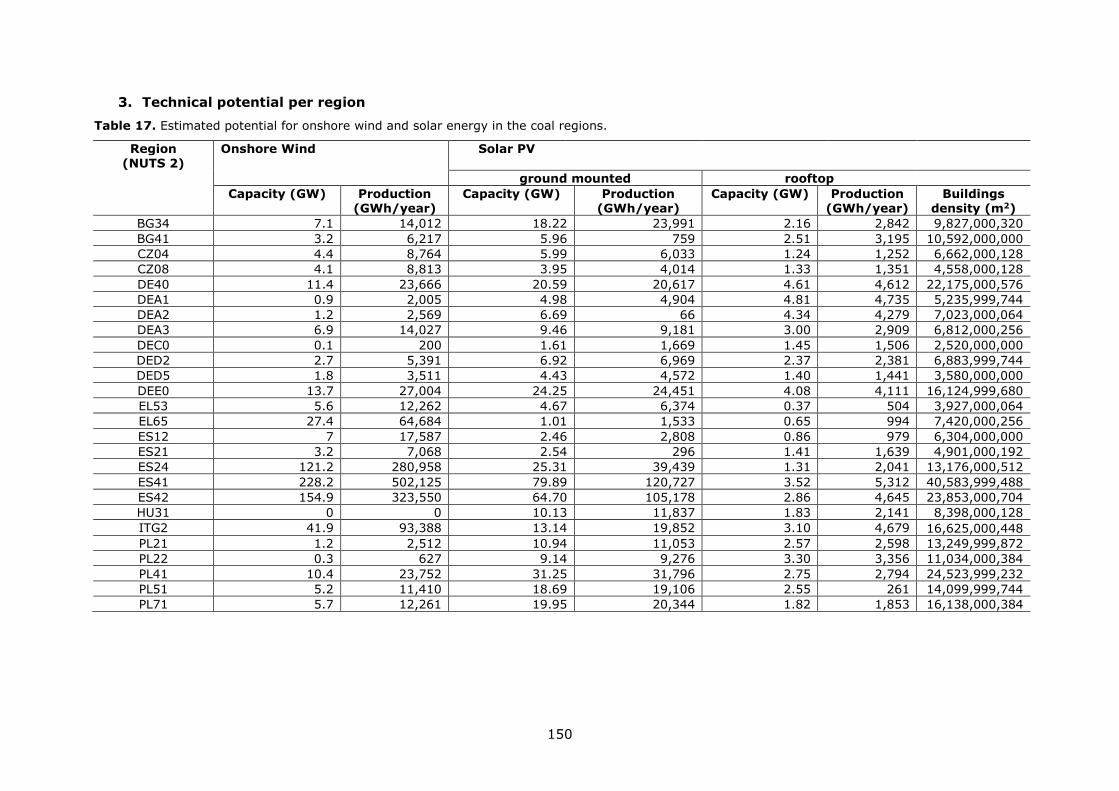
150
3. Technical potential per region
Table 17. Estimated potential for onshore wind and solar energy in the coal regions.
Region (NUTS 2)
Onshore Wind Solar PV
ground mounted rooftop
Capacity (GW) Production (GWh/year)
Capacity (GW) Production (GWh/year)
Capacity (GW) Production (GWh/year)
Buildings density (m2)
BG34 7.1 14,012 18.22 23,991 2.16 2,842 9,827,000,320
BG41 3.2 6,217 5.96 759 2.51 3,195 10,592,000,000
CZ04 4.4 8,764 5.99 6,033 1.24 1,252 6,662,000,128
CZ08 4.1 8,813 3.95 4,014 1.33 1,351 4,558,000,128
DE40 11.4 23,666 20.59 20,617 4.61 4,612 22,175,000,576
DEA1 0.9 2,005 4.98 4,904 4.81 4,735 5,235,999,744
DEA2 1.2 2,569 6.69 66 4.34 4,279 7,023,000,064
DEA3 6.9 14,027 9.46 9,181 3.00 2,909 6,812,000,256
DEC0 0.1 200 1.61 1,669 1.45 1,506 2,520,000,000
DED2 2.7 5,391 6.92 6,969 2.37 2,381 6,883,999,744
DED5 1.8 3,511 4.43 4,572 1.40 1,441 3,580,000,000
DEE0 13.7 27,004 24.25 24,451 4.08 4,111 16,124,999,680
EL53 5.6 12,262 4.67 6,374 0.37 504 3,927,000,064
EL65 27.4 64,684 1.01 1,533 0.65 994 7,420,000,256
ES12 7 17,587 2.46 2,808 0.86 979 6,304,000,000
ES21 3.2 7,068 2.54 296 1.41 1,639 4,901,000,192
ES24 121.2 280,958 25.31 39,439 1.31 2,041 13,176,000,512
ES41 228.2 502,125 79.89 120,727 3.52 5,312 40,583,999,488
ES42 154.9 323,550 64.70 105,178 2.86 4,645 23,853,000,704
HU31 0 0 10.13 11,837 1.83 2,141 8,398,000,128
ITG2 41.9 93,388 13.14 19,852 3.10 4,679 16,625,000,448
PL21 1.2 2,512 10.94 11,053 2.57 2,598 13,249,999,872
PL22 0.3 627 9.14 9,276 3.30 3,356 11,034,000,384
PL41 10.4 23,752 31.25 31,796 2.75 2,794 24,523,999,232
PL51 5.2 11,410 18.69 19,106 2.55 261 14,099,999,744
PL71 5.7 12,261 19.95 20,344 1.82 1,853 16,138,000,384
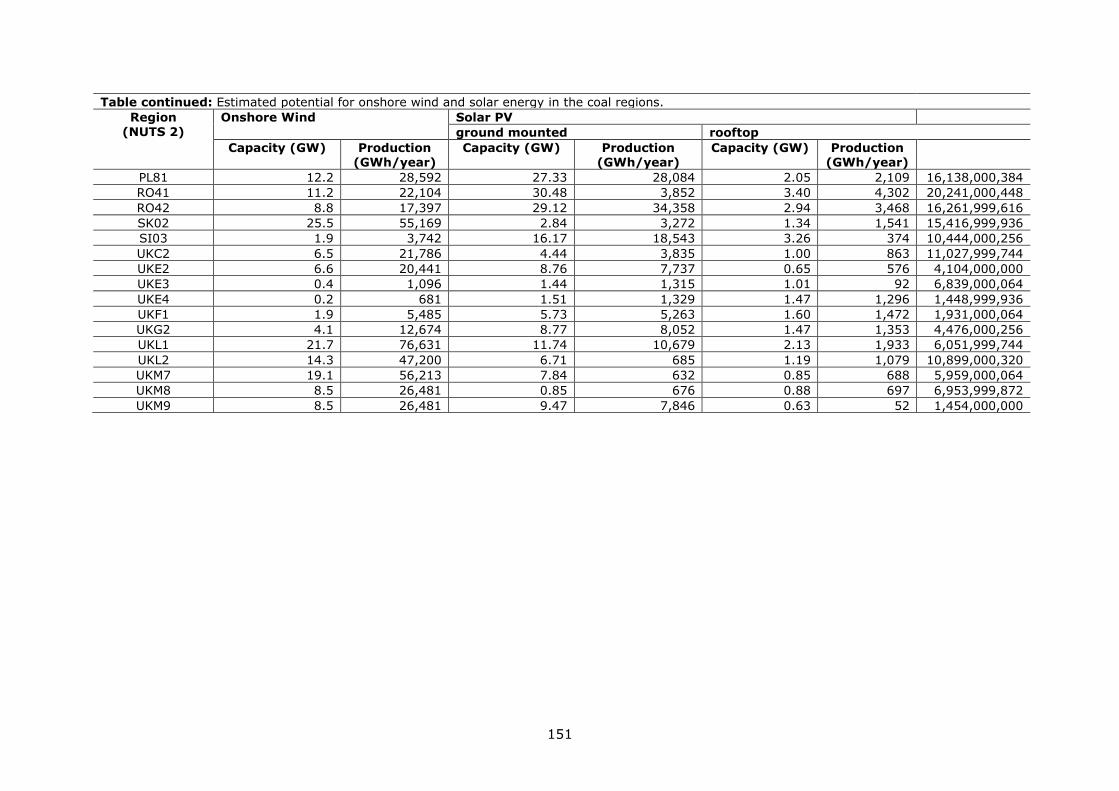
151
Table continued: Estimated potential for onshore wind and solar energy in the coal regions.
Region (NUTS 2)
Onshore Wind Solar PV
ground mounted rooftop
Capacity (GW) Production (GWh/year)
Capacity (GW) Production (GWh/year)
Capacity (GW) Production (GWh/year)
PL81 12.2 28,592 27.33 28,084 2.05 2,109 16,138,000,384
RO41 11.2 22,104 30.48 3,852 3.40 4,302 20,241,000,448
RO42 8.8 17,397 29.12 34,358 2.94 3,468 16,261,999,616
SK02 25.5 55,169 2.84 3,272 1.34 1,541 15,416,999,936
SI03 1.9 3,742 16.17 18,543 3.26 374 10,444,000,256
UKC2 6.5 21,786 4.44 3,835 1.00 863 11,027,999,744
UKE2 6.6 20,441 8.76 7,737 0.65 576 4,104,000,000
UKE3 0.4 1,096 1.44 1,315 1.01 92 6,839,000,064
UKE4 0.2 681 1.51 1,329 1.47 1,296 1,448,999,936
UKF1 1.9 5,485 5.73 5,263 1.60 1,472 1,931,000,064
UKG2 4.1 12,674 8.77 8,052 1.47 1,353 4,476,000,256
UKL1 21.7 76,631 11.74 10,679 2.13 1,933 6,051,999,744
UKL2 14.3 47,200 6.71 685 1.19 1,079 10,899,000,320
UKM7 19.1 56,213 7.84 632 0.85 688 5,959,000,064
UKM8 8.5 26,481 0.85 676 0.88 697 6,953,999,872
UKM9 8.5 26,481 9.47 7,846 0.63 52 1,454,000,000
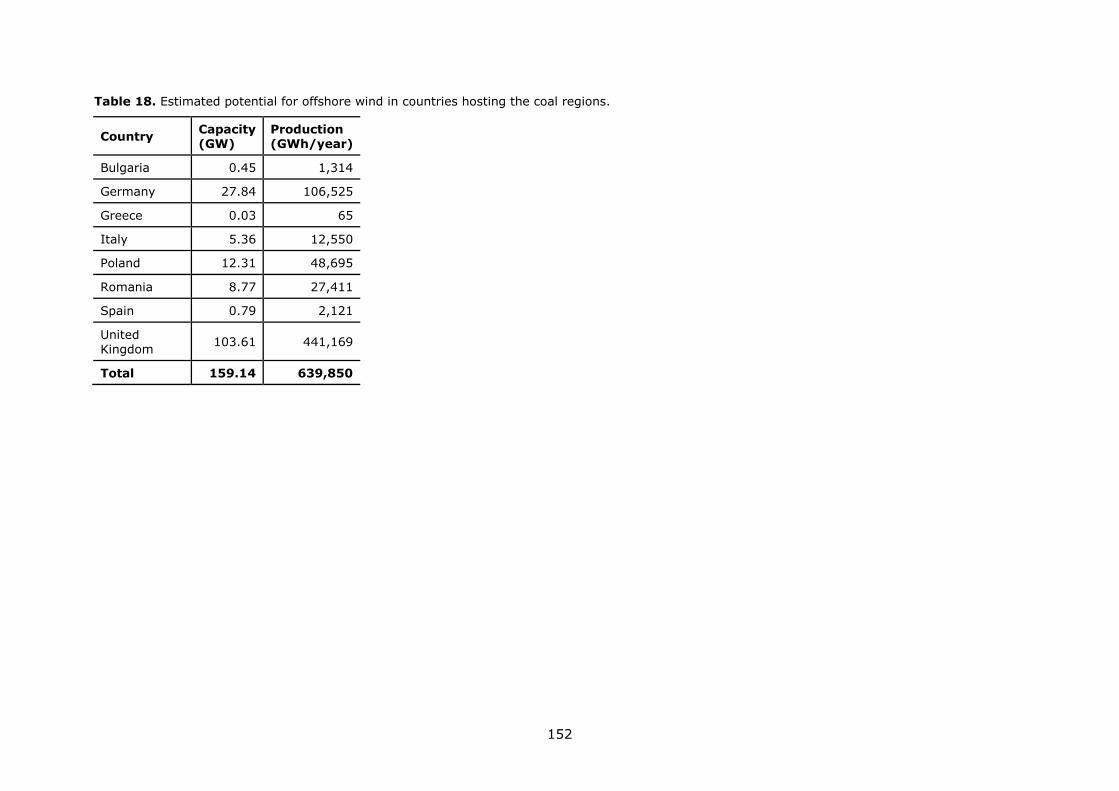
152
Table 18. Estimated potential for offshore wind in countries hosting the coal regions.
Country Capacity (GW)
Production (GWh/year)
Bulgaria 0.45 1,314
Germany 27.84 106,525
Greece 0.03 65
Italy 5.36 12,550
Poland 12.31 48,695
Romania 8.77 27,411
Spain 0.79 2,121
United Kingdom
103.61 441,169
Total 159.14 639,850
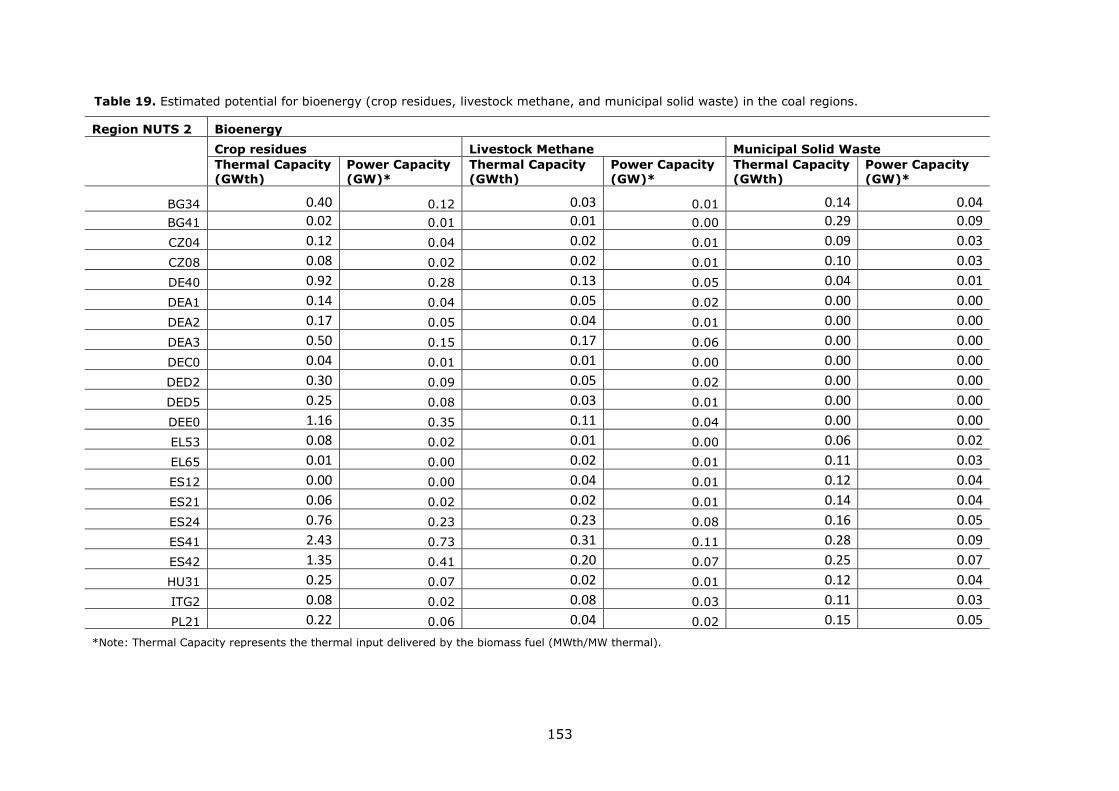
153
Table 19. Estimated potential for bioenergy (crop residues, livestock methane, and municipal solid waste) in the coal regions.
Region NUTS 2 Bioenergy
Crop residues Livestock Methane Municipal Solid Waste
Thermal Capacity (GWth)
Power Capacity (GW)*
Thermal Capacity (GWth)
Power Capacity (GW)*
Thermal Capacity (GWth)
Power Capacity (GW)*
BG34 0.40 0.12 0.03 0.01 0.14 0.04
BG41 0.02 0.01 0.01 0.00 0.29 0.09
CZ04 0.12 0.04 0.02 0.01 0.09 0.03
CZ08 0.08 0.02 0.02 0.01 0.10 0.03
DE40 0.92 0.28 0.13 0.05 0.04 0.01
DEA1 0.14 0.04 0.05 0.02 0.00 0.00
DEA2 0.17 0.05 0.04 0.01 0.00 0.00
DEA3 0.50 0.15 0.17 0.06 0.00 0.00
DEC0 0.04 0.01 0.01 0.00 0.00 0.00
DED2 0.30 0.09 0.05 0.02 0.00 0.00
DED5 0.25 0.08 0.03 0.01 0.00 0.00
DEE0 1.16 0.35 0.11 0.04 0.00 0.00
EL53 0.08 0.02 0.01 0.00 0.06 0.02
EL65 0.01 0.00 0.02 0.01 0.11 0.03
ES12 0.00 0.00 0.04 0.01 0.12 0.04
ES21 0.06 0.02 0.02 0.01 0.14 0.04
ES24 0.76 0.23 0.23 0.08 0.16 0.05
ES41 2.43 0.73 0.31 0.11 0.28 0.09
ES42 1.35 0.41 0.20 0.07 0.25 0.07
HU31 0.25 0.07 0.02 0.01 0.12 0.04
ITG2 0.08 0.02 0.08 0.03 0.11 0.03
PL21 0.22 0.06 0.04 0.02 0.15 0.05
*Note: Thermal Capacity represents the thermal input delivered by the biomass fuel (MWth/MW thermal).
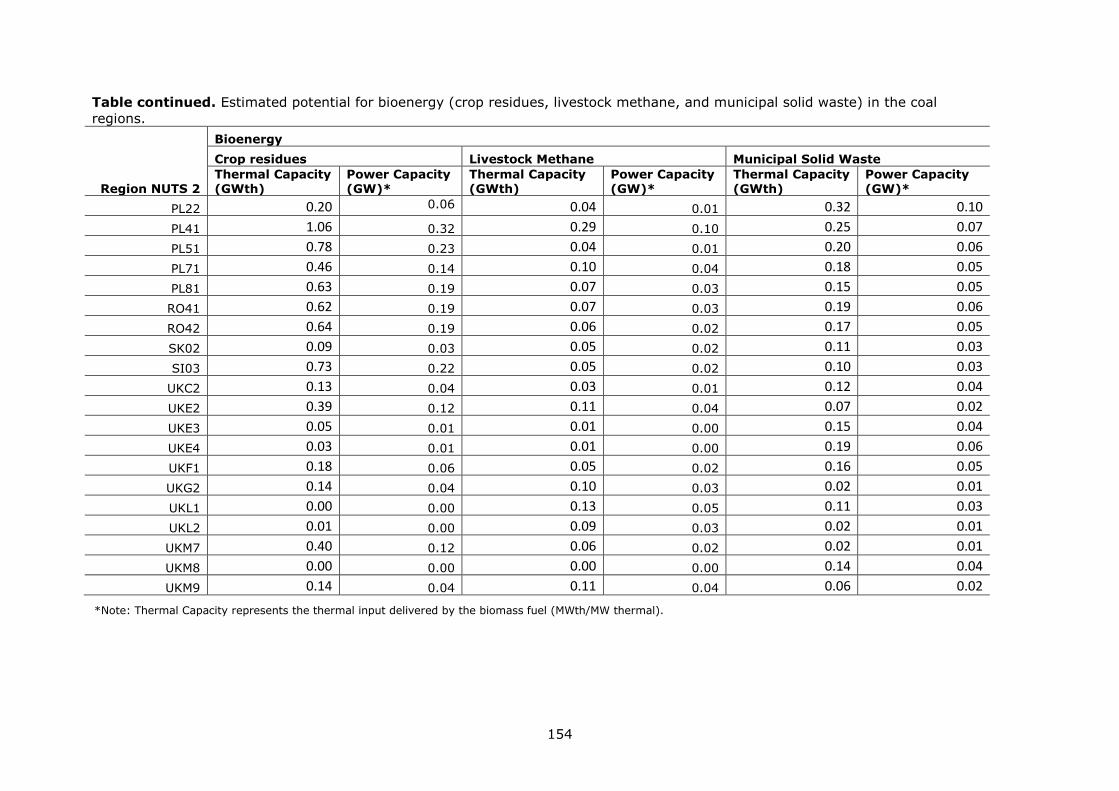
154
Table continued. Estimated potential for bioenergy (crop residues, livestock methane, and municipal solid waste) in the coal
regions.
Region NUTS 2
Bioenergy
Crop residues Livestock Methane Municipal Solid Waste
Thermal Capacity (GWth)
Power Capacity (GW)*
Thermal Capacity (GWth)
Power Capacity (GW)*
Thermal Capacity (GWth)
Power Capacity (GW)*
PL22 0.20 0.06 0.04 0.01 0.32 0.10
PL41 1.06 0.32 0.29 0.10 0.25 0.07
PL51 0.78 0.23 0.04 0.01 0.20 0.06
PL71 0.46 0.14 0.10 0.04 0.18 0.05
PL81 0.63 0.19 0.07 0.03 0.15 0.05
RO41 0.62 0.19 0.07 0.03 0.19 0.06
RO42 0.64 0.19 0.06 0.02 0.17 0.05
SK02 0.09 0.03 0.05 0.02 0.11 0.03
SI03 0.73 0.22 0.05 0.02 0.10 0.03
UKC2 0.13 0.04 0.03 0.01 0.12 0.04
UKE2 0.39 0.12 0.11 0.04 0.07 0.02
UKE3 0.05 0.01 0.01 0.00 0.15 0.04
UKE4 0.03 0.01 0.01 0.00 0.19 0.06
UKF1 0.18 0.06 0.05 0.02 0.16 0.05
UKG2 0.14 0.04 0.10 0.03 0.02 0.01
UKL1 0.00 0.00 0.13 0.05 0.11 0.03
UKL2 0.01 0.00 0.09 0.03 0.02 0.01
UKM7 0.40 0.12 0.06 0.02 0.02 0.01
UKM8 0.00 0.00 0.00 0.00 0.14 0.04
UKM9 0.14 0.04 0.11 0.04 0.06 0.02
*Note: Thermal Capacity represents the thermal input delivered by the biomass fuel (MWth/MW thermal).
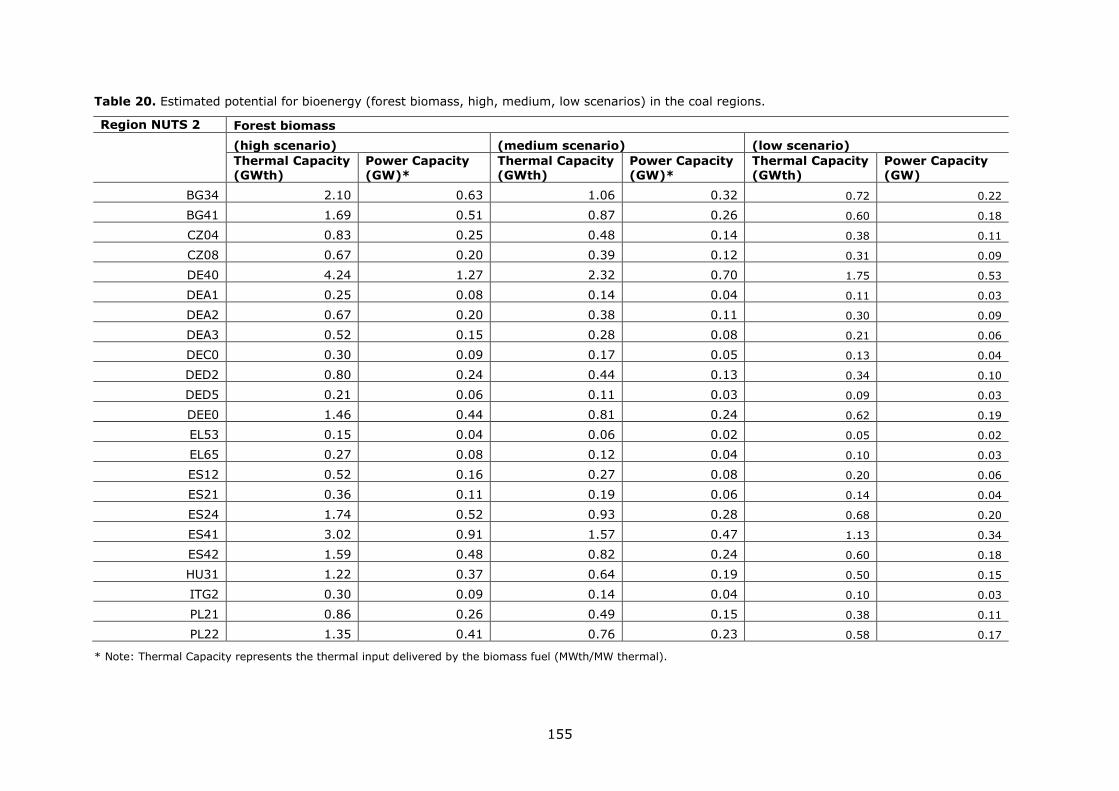
155
Table 20. Estimated potential for bioenergy (forest biomass, high, medium, low scenarios) in the coal regions.
Region NUTS 2 Forest biomass
(high scenario) (medium scenario) (low scenario)
Thermal Capacity (GWth)
Power Capacity (GW)*
Thermal Capacity (GWth)
Power Capacity (GW)*
Thermal Capacity (GWth)
Power Capacity (GW)
BG34 2.10 0.63 1.06 0.32 0.72 0.22
BG41 1.69 0.51 0.87 0.26 0.60 0.18
CZ04 0.83 0.25 0.48 0.14 0.38 0.11
CZ08 0.67 0.20 0.39 0.12 0.31 0.09
DE40 4.24 1.27 2.32 0.70 1.75 0.53
DEA1 0.25 0.08 0.14 0.04 0.11 0.03
DEA2 0.67 0.20 0.38 0.11 0.30 0.09
DEA3 0.52 0.15 0.28 0.08 0.21 0.06
DEC0 0.30 0.09 0.17 0.05 0.13 0.04
DED2 0.80 0.24 0.44 0.13 0.34 0.10
DED5 0.21 0.06 0.11 0.03 0.09 0.03
DEE0 1.46 0.44 0.81 0.24 0.62 0.19
EL53 0.15 0.04 0.06 0.02 0.05 0.02
EL65 0.27 0.08 0.12 0.04 0.10 0.03
ES12 0.52 0.16 0.27 0.08 0.20 0.06
ES21 0.36 0.11 0.19 0.06 0.14 0.04
ES24 1.74 0.52 0.93 0.28 0.68 0.20
ES41 3.02 0.91 1.57 0.47 1.13 0.34
ES42 1.59 0.48 0.82 0.24 0.60 0.18
HU31 1.22 0.37 0.64 0.19 0.50 0.15
ITG2 0.30 0.09 0.14 0.04 0.10 0.03
PL21 0.86 0.26 0.49 0.15 0.38 0.11
PL22 1.35 0.41 0.76 0.23 0.58 0.17
* Note: Thermal Capacity represents the thermal input delivered by the biomass fuel (MWth/MW thermal).
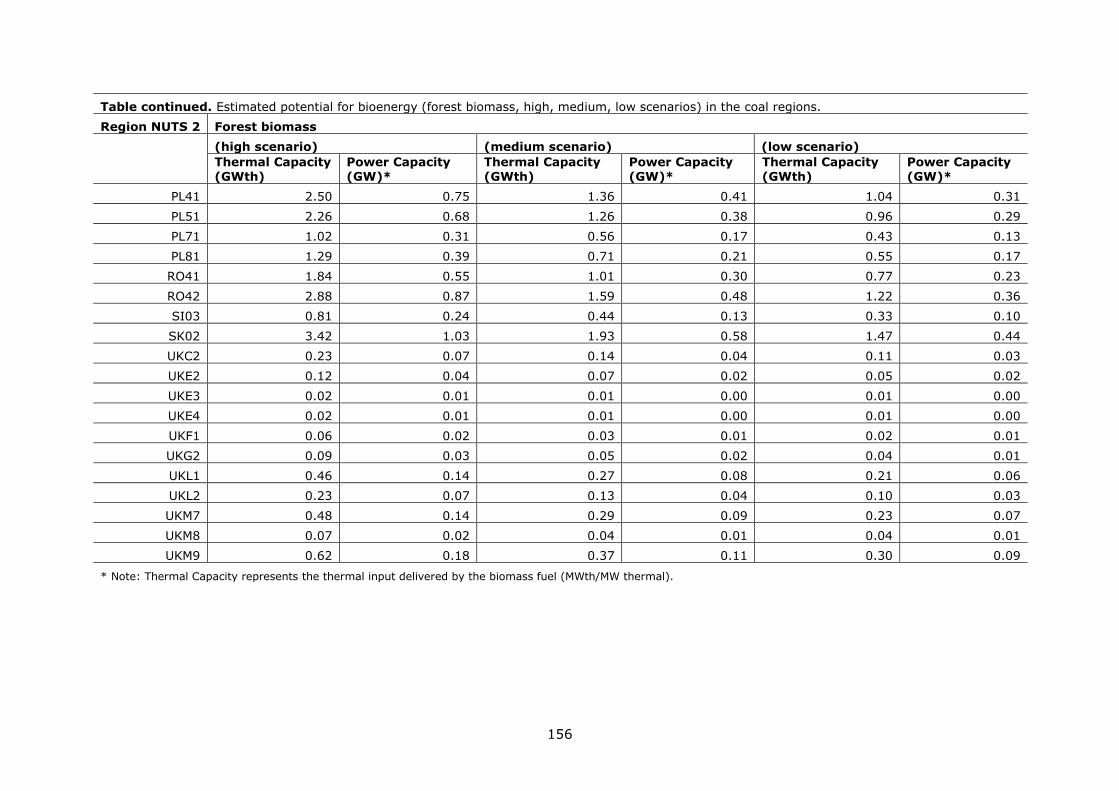
156
Table continued. Estimated potential for bioenergy (forest biomass, high, medium, low scenarios) in the coal regions.
Region NUTS 2 Forest biomass
(high scenario) (medium scenario) (low scenario)
Thermal Capacity (GWth)
Power Capacity (GW)*
Thermal Capacity (GWth)
Power Capacity (GW)*
Thermal Capacity (GWth)
Power Capacity (GW)*
PL41 2.50 0.75 1.36 0.41 1.04 0.31
PL51 2.26 0.68 1.26 0.38 0.96 0.29
PL71 1.02 0.31 0.56 0.17 0.43 0.13
PL81 1.29 0.39 0.71 0.21 0.55 0.17
RO41 1.84 0.55 1.01 0.30 0.77 0.23
RO42 2.88 0.87 1.59 0.48 1.22 0.36
SI03 0.81 0.24 0.44 0.13 0.33 0.10
SK02 3.42 1.03 1.93 0.58 1.47 0.44
UKC2 0.23 0.07 0.14 0.04 0.11 0.03
UKE2 0.12 0.04 0.07 0.02 0.05 0.02
UKE3 0.02 0.01 0.01 0.00 0.01 0.00
UKE4 0.02 0.01 0.01 0.00 0.01 0.00
UKF1 0.06 0.02 0.03 0.01 0.02 0.01
UKG2 0.09 0.03 0.05 0.02 0.04 0.01
UKL1 0.46 0.14 0.27 0.08 0.21 0.06
UKL2 0.23 0.07 0.13 0.04 0.10 0.03
UKM7 0.48 0.14 0.29 0.09 0.23 0.07
UKM8 0.07 0.02 0.04 0.01 0.04 0.01
UKM9 0.62 0.18 0.37 0.11 0.30 0.09
* Note: Thermal Capacity represents the thermal input delivered by the biomass fuel (MWth/MW thermal).
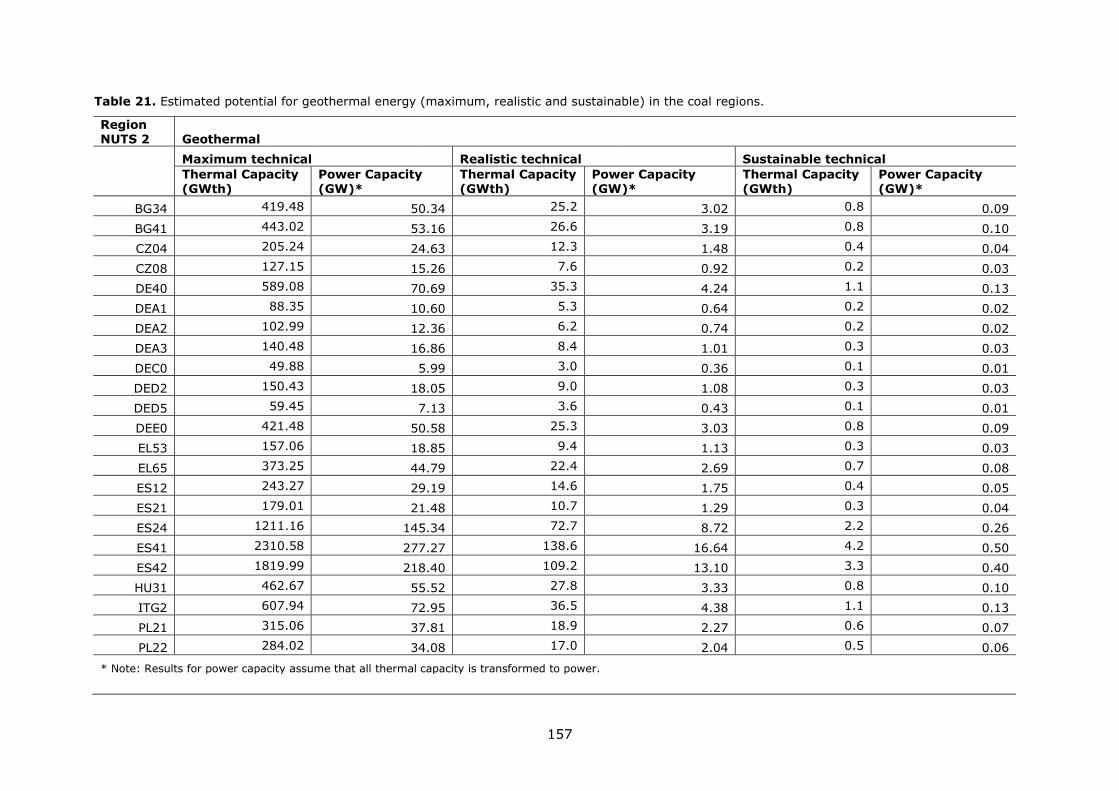
157
Table 21. Estimated potential for geothermal energy (maximum, realistic and sustainable) in the coal regions.
Region NUTS 2 Geothermal
Maximum technical Realistic technical Sustainable technical
Thermal Capacity (GWth)
Power Capacity (GW)*
Thermal Capacity (GWth)
Power Capacity (GW)*
Thermal Capacity (GWth)
Power Capacity (GW)*
BG34 419.48 50.34 25.2 3.02 0.8 0.09
BG41 443.02 53.16 26.6 3.19 0.8 0.10
CZ04 205.24 24.63 12.3 1.48 0.4 0.04
CZ08 127.15 15.26 7.6 0.92 0.2 0.03
DE40 589.08 70.69 35.3 4.24 1.1 0.13
DEA1 88.35 10.60 5.3 0.64 0.2 0.02
DEA2 102.99 12.36 6.2 0.74 0.2 0.02
DEA3 140.48 16.86 8.4 1.01 0.3 0.03
DEC0 49.88 5.99 3.0 0.36 0.1 0.01
DED2 150.43 18.05 9.0 1.08 0.3 0.03
DED5 59.45 7.13 3.6 0.43 0.1 0.01
DEE0 421.48 50.58 25.3 3.03 0.8 0.09
EL53 157.06 18.85 9.4 1.13 0.3 0.03
EL65 373.25 44.79 22.4 2.69 0.7 0.08
ES12 243.27 29.19 14.6 1.75 0.4 0.05
ES21 179.01 21.48 10.7 1.29 0.3 0.04
ES24 1211.16 145.34 72.7 8.72 2.2 0.26
ES41 2310.58 277.27 138.6 16.64 4.2 0.50
ES42 1819.99 218.40 109.2 13.10 3.3 0.40
HU31 462.67 55.52 27.8 3.33 0.8 0.10
ITG2 607.94 72.95 36.5 4.38 1.1 0.13
PL21 315.06 37.81 18.9 2.27 0.6 0.07
PL22 284.02 34.08 17.0 2.04 0.5 0.06
* Note: Results for power capacity assume that all thermal capacity is transformed to power.
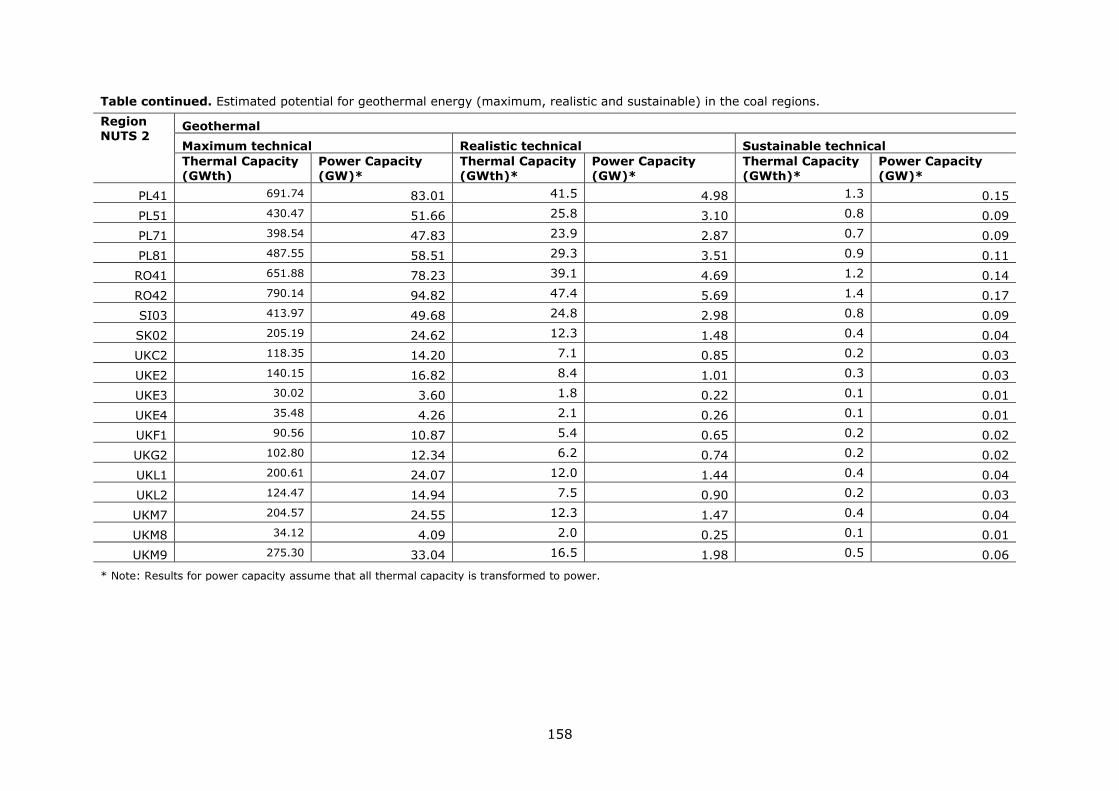
158
Table continued. Estimated potential for geothermal energy (maximum, realistic and sustainable) in the coal regions.
Region
NUTS 2 Geothermal
Maximum technical Realistic technical Sustainable technical
Thermal Capacity
(GWth)
Power Capacity
(GW)*
Thermal Capacity
(GWth)*
Power Capacity
(GW)*
Thermal Capacity
(GWth)*
Power Capacity
(GW)*
PL41 691.74 83.01 41.5 4.98 1.3 0.15
PL51 430.47 51.66 25.8 3.10 0.8 0.09
PL71 398.54 47.83 23.9 2.87 0.7 0.09
PL81 487.55 58.51 29.3 3.51 0.9 0.11
RO41 651.88 78.23 39.1 4.69 1.2 0.14
RO42 790.14 94.82 47.4 5.69 1.4 0.17
SI03 413.97 49.68 24.8 2.98 0.8 0.09
SK02 205.19 24.62 12.3 1.48 0.4 0.04
UKC2 118.35 14.20 7.1 0.85 0.2 0.03
UKE2 140.15 16.82 8.4 1.01 0.3 0.03
UKE3 30.02 3.60 1.8 0.22 0.1 0.01
UKE4 35.48 4.26 2.1 0.26 0.1 0.01
UKF1 90.56 10.87 5.4 0.65 0.2 0.02
UKG2 102.80 12.34 6.2 0.74 0.2 0.02
UKL1 200.61 24.07 12.0 1.44 0.4 0.04
UKL2 124.47 14.94 7.5 0.90 0.2 0.03
UKM7 204.57 24.55 12.3 1.47 0.4 0.04
UKM8 34.12 4.09 2.0 0.25 0.1 0.01
UKM9 275.30 33.04 16.5 1.98 0.5 0.06
* Note: Results for power capacity assume that all thermal capacity is transformed to power.
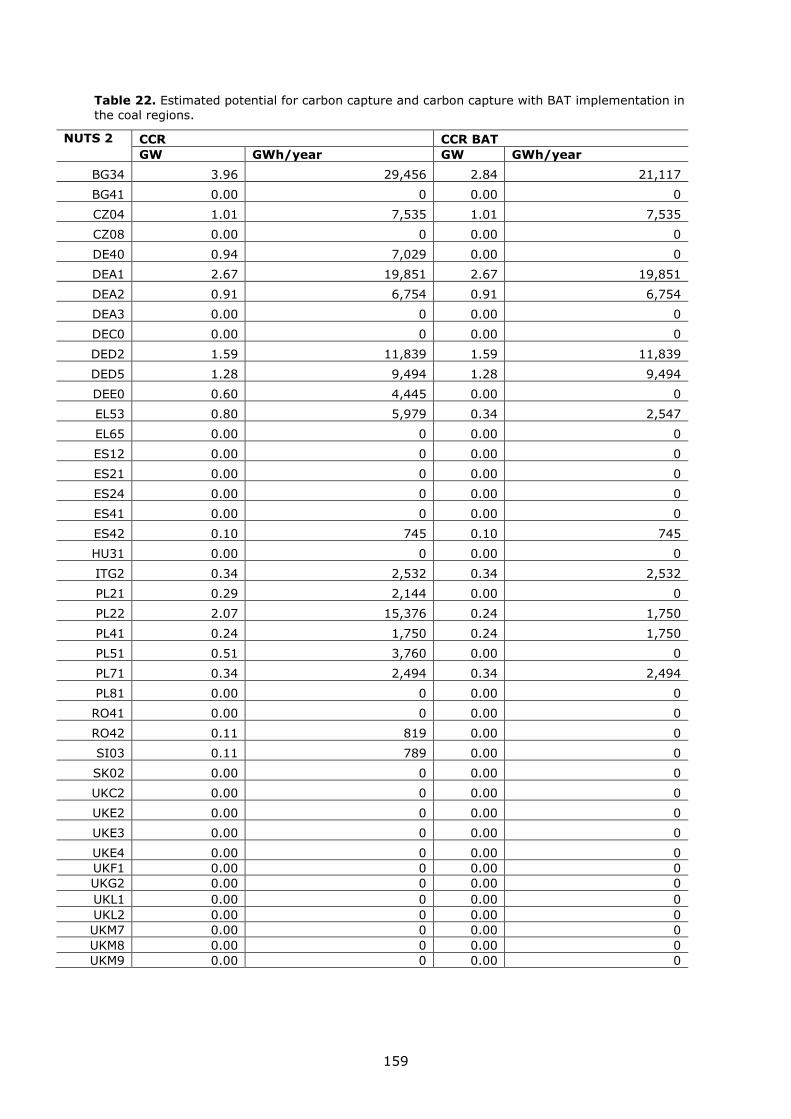
159
Table 22. Estimated potential for carbon capture and carbon capture with BAT implementation in
the coal regions.
NUTS 2 CCR CCR BAT
GW GWh/year GW GWh/year
BG34 3.96 29,456 2.84 21,117
BG41 0.00 0 0.00 0
CZ04 1.01 7,535 1.01 7,535
CZ08 0.00 0 0.00 0
DE40 0.94 7,029 0.00 0
DEA1 2.67 19,851 2.67 19,851
DEA2 0.91 6,754 0.91 6,754
DEA3 0.00 0 0.00 0
DEC0 0.00 0 0.00 0
DED2 1.59 11,839 1.59 11,839
DED5 1.28 9,494 1.28 9,494
DEE0 0.60 4,445 0.00 0
EL53 0.80 5,979 0.34 2,547
EL65 0.00 0 0.00 0
ES12 0.00 0 0.00 0
ES21 0.00 0 0.00 0
ES24 0.00 0 0.00 0
ES41 0.00 0 0.00 0
ES42 0.10 745 0.10 745
HU31 0.00 0 0.00 0
ITG2 0.34 2,532 0.34 2,532
PL21 0.29 2,144 0.00 0
PL22 2.07 15,376 0.24 1,750
PL41 0.24 1,750 0.24 1,750
PL51 0.51 3,760 0.00 0
PL71 0.34 2,494 0.34 2,494
PL81 0.00 0 0.00 0
RO41 0.00 0 0.00 0
RO42 0.11 819 0.00 0
SI03 0.11 789 0.00 0
SK02 0.00 0 0.00 0
UKC2 0.00 0 0.00 0
UKE2 0.00 0 0.00 0
UKE3 0.00 0 0.00 0
UKE4 0.00 0 0.00 0
UKF1 0.00 0 0.00 0
UKG2 0.00 0 0.00 0
UKL1 0.00 0 0.00 0
UKL2 0.00 0 0.00 0
UKM7 0.00 0 0.00 0
UKM8 0.00 0 0.00 0
UKM9 0.00 0 0.00 0
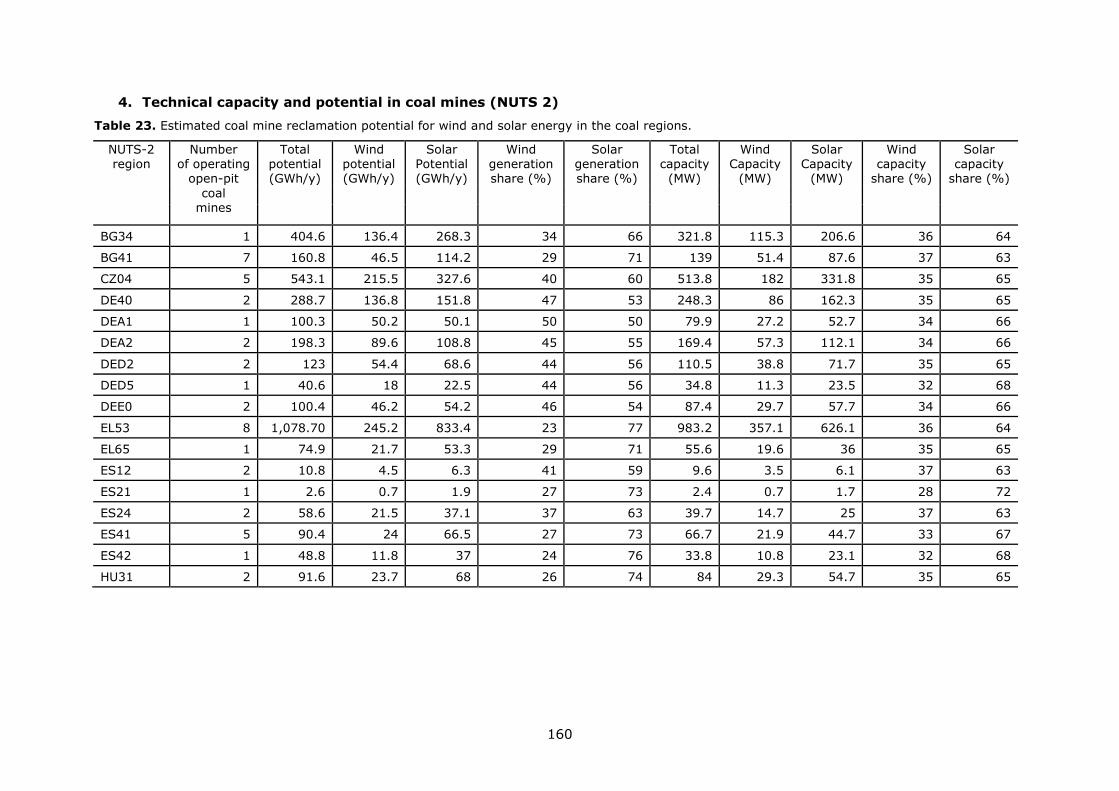
160
4. Technical capacity and potential in coal mines (NUTS 2)
Table 23. Estimated coal mine reclamation potential for wind and solar energy in the coal regions.
NUTS-2 region
Number of operating
open-pit
coal mines
Total potential (GWh/y)
Wind potential (GWh/y)
Solar Potential (GWh/y)
Wind generation share (%)
Solar generation share (%)
Total capacity (MW)
Wind Capacity
(MW)
Solar Capacity
(MW)
Wind capacity
share (%)
Solar capacity
share (%)
BG34 1 404.6 136.4 268.3 34 66 321.8 115.3 206.6 36 64
BG41 7 160.8 46.5 114.2 29 71 139 51.4 87.6 37 63
CZ04 5 543.1 215.5 327.6 40 60 513.8 182 331.8 35 65
DE40 2 288.7 136.8 151.8 47 53 248.3 86 162.3 35 65
DEA1 1 100.3 50.2 50.1 50 50 79.9 27.2 52.7 34 66
DEA2 2 198.3 89.6 108.8 45 55 169.4 57.3 112.1 34 66
DED2 2 123 54.4 68.6 44 56 110.5 38.8 71.7 35 65
DED5 1 40.6 18 22.5 44 56 34.8 11.3 23.5 32 68
DEE0 2 100.4 46.2 54.2 46 54 87.4 29.7 57.7 34 66
EL53 8 1,078.70 245.2 833.4 23 77 983.2 357.1 626.1 36 64
EL65 1 74.9 21.7 53.3 29 71 55.6 19.6 36 35 65
ES12 2 10.8 4.5 6.3 41 59 9.6 3.5 6.1 37 63
ES21 1 2.6 0.7 1.9 27 73 2.4 0.7 1.7 28 72
ES24 2 58.6 21.5 37.1 37 63 39.7 14.7 25 37 63
ES41 5 90.4 24 66.5 27 73 66.7 21.9 44.7 33 67
ES42 1 48.8 11.8 37 24 76 33.8 10.8 23.1 32 68
HU31 2 91.6 23.7 68 26 74 84 29.3 54.7 35 65
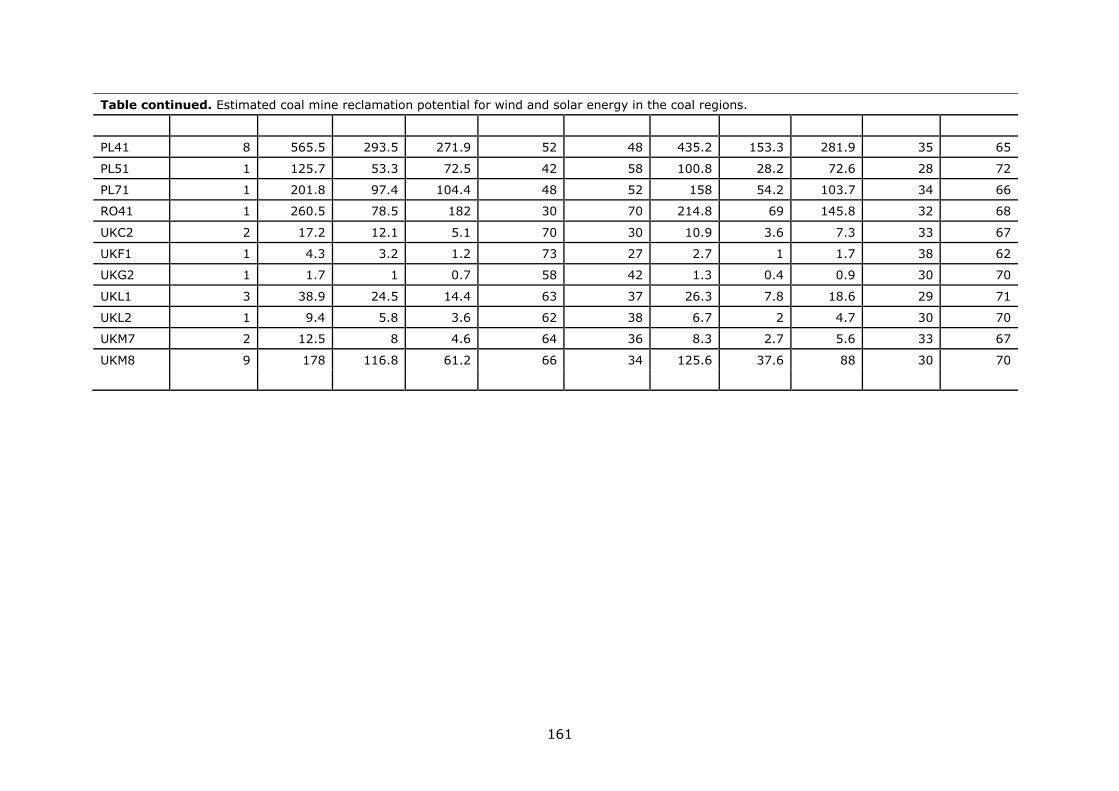
161
Table continued. Estimated coal mine reclamation potential for wind and solar energy in the coal regions.
PL41 8 565.5 293.5 271.9 52 48 435.2 153.3 281.9 35 65
PL51 1 125.7 53.3 72.5 42 58 100.8 28.2 72.6 28 72
PL71 1 201.8 97.4 104.4 48 52 158 54.2 103.7 34 66
RO41 1 260.5 78.5 182 30 70 214.8 69 145.8 32 68
UKC2 2 17.2 12.1 5.1 70 30 10.9 3.6 7.3 33 67
UKF1 1 4.3 3.2 1.2 73 27 2.7 1 1.7 38 62
UKG2 1 1.7 1 0.7 58 42 1.3 0.4 0.9 30 70
UKL1 3 38.9 24.5 14.4 63 37 26.3 7.8 18.6 29 71
UKL2 1 9.4 5.8 3.6 62 38 6.7 2 4.7 30 70
UKM7 2 12.5 8 4.6 64 36 8.3 2.7 5.6 33 67
UKM8 9 178 116.8 61.2 66 34 125.6 37.6 88 30 70
162
5. Methodology for defining the technical potential
The definition of the technology potential is based in the principle shown below similarly
to what has been proposed by the US National Renewable Energy Laboratory (NREL)
(Brown et al., 2016) and customised to the specific technologies. The following sections
indicate the exact aspects of the followed approach for each technology.
The renewable energy potentials have been estimated using an approach that can be
described by the generic form:
𝑇𝑒𝑐ℎ𝑛𝑖𝑐𝑎𝑙 𝑝𝑜𝑡𝑒𝑛𝑡𝑖𝑎𝑙 [𝑀𝑊ℎ
𝑦] = 𝐴𝑟𝑒𝑎 𝐴𝑣𝑎𝑖𝑙𝑎𝑏𝑙𝑒 [𝑘𝑚2] × 𝑆𝑦𝑠𝑡𝑒𝑚 𝑌𝑖𝑒𝑙𝑑 [
𝑀𝑊
𝑘𝑚2] × 𝐶𝑎𝑝𝑎𝑐𝑖𝑡𝑦 𝐹𝑎𝑐𝑡𝑜𝑟 [
ℎ
𝑦]
or also
= 𝐴𝑟𝑒𝑎 𝐴𝑣𝑎𝑖𝑙𝑎𝑏𝑙𝑒 [𝑘𝑚2] × 𝑆𝑦𝑠𝑡𝑒𝑚 𝑌𝑖𝑒𝑙𝑑 [𝑀𝑊
𝑘𝑚2] × 𝐶𝑎𝑝𝑎𝑐𝑖𝑡𝑦 𝐹𝑎𝑐𝑡𝑜𝑟 [%] × 8760
and also
= 𝑅𝑒𝑠𝑜𝑢𝑟𝑐𝑒 𝑜𝑟 𝑡ℎ𝑒𝑜𝑟𝑒𝑡𝑖𝑐𝑎𝑙 𝑝𝑜𝑡𝑒𝑛𝑡𝑖𝑎𝑙 [𝑀𝑊ℎ
𝑦] × Technology efficiency [
𝑀𝑊ℎ
𝑀𝑊ℎ] ×
Area Available[𝑘𝑚2]
Total Area [𝑘𝑚2]
We consider the capacity factor to reflect the regional differences in resource, even if this
results in more conservative estimation of capacity.
Wind
The technical potential for wind power at NUTS 2 level in the coal regions in transition
has been based on (Dalla Longa et al., 2018) with associated data from ENergy Systems
Potential Renewable Energy Sources (ENSPRESO) dataset (Joint Research Centre, 2019).
For estimating this potential, it is important to firstly consider several categories that
require different assumptions and methodological approaches as follows:
The theoretical or resource potential which is the available amount of wind
resource that can produce energy and depends on the estimation of wind speeds
and directions reaching the area.
The geographical potential which is determined by the suitable and usable areas
for wind deployment depending on an appropriate set of exclusion criteria (e.g.
sloped areas, minimum setback distances of wind farm installations to
settlements, distances to the grid, water bodies, and natural protected areas,
etc.).
Definition of the specific technology for wind array installation in each unit of
available area, i.e. the (array power density).
Therefore, the wind technical potential capacity as well as the assumptions considered are as follows:
Onshore wind potentials are shown at NUTS 2 level while offshore wind potentials
are given at country level.53
Technological characteristics: the areas selected are dominated by wind
conditions higher than 20% of the theoretical potential, for a wind turbine with
300 W/m2 of specific power at 100 m of hub height.
53 The data presented refer to a reference scenario with capacity factors > 20%. For more information on
scenarios and underlying assumptions please see
http://publications.jrc.ec.europa.eu/repository/handle/JRC116900
163
Legal requirements: The assumptions met in (Dalla Longa et al., 2018) and
sources considered therein, follow the current (last update in 2015) legal
requirements for exclusion zones and setback distances. Particularly, offshore
arrays can only be installed in zones with a sea depth of 50 meters or more.
Restrictions of available area: The area classification is based on different
datasets including the LUISA database54 and World Data for Protected Areas, 2010.55
Particularly, the areas excluded are:
Post-flooding or irrigated croplands (or aquatic)
Forests:
Closed to open (>15%) broadleaved evergreen or semi-deciduous
forest (>5m)
Closed (>40%) broadleaved deciduous forest (>5m)
Open (15-40%) broadleaved deciduous forest/woodland (>5m)
Closed (>40%) needle leaved evergreen forest (>5m)
Open (15-40%) needle leaved deciduous or evergreen forest (>5m)
Closed to open (>15%) mixed broadleaved and needle leaved forest
(>5m)
Transitional woodland-shrub:
Closed to open (>15%) (Broadleaved or needle leaved, evergreen or
deciduous) shrubland (<5m)
Closed to open (>15%) broadleaved forest
Closed (>40%) broadleaved forest or shrubland permanently flooded
- Saline or brackish water
Closed to open (>15%) grassland or woody vegetation on regularly
flooded or waterlogged soil - Fresh, brackish or saline water
Urban areas:
Artificial surfaces and associated areas (Urban areas >50%)
Artificial surfaces, Urban fabric, Continuous and discontinuous urban
fabric
Industrial, commercial and transport units
Road and rail networks and associated land, Port areas and Airports
Other type of land-uses: Green urban areas, sport and leisure facilities;
Water bodies, permanent snow and ice, infrastructures, nature, wetlands,
urban green leisure, protected areas and slopes< 2.1 degrees and minimum
distances to settlements specifically from each MS.
Solar PV
Ground mounted systems
The analysis starts from the CORINE Land Cover data set (‘Corine Land Cover (CLC)
2018, Version 20b2’, 2018), which provides data on the type of land cover for the EU and
candidate countries at a resolution of 100 m and is divided into four overall classes:
54 https://data.jrc.ec.europa.eu/collection/luisa 55 https://protectedplanet.net/
164
- Artificial surfaces (urban areas, buildings, road and rail networks, ports, airports,
mineral extraction sites, sports facilities etc.);
- Agricultural areas (arable lands, rice fields, vineyards, pastures, agro-forestry
areas etc.);
- Forest and semi-natural areas (scrub and/or herbaceous vegetation, bare rocks,
dunes etc.);
- Glaciers, wetlands and water bodies.
Class 1 is excluded since the building rooftop area is calculated separately (see below).
Other artificial surfaces or inland water bodies could also be exploited e.g. parking areas,
roads, waste sites, lakes, reservoirs, and location-specific analyses are needed to
systematically address these. Classes 3 and 4 are also excluded.
Only two sub-classes are considered from CLC Class 2 (agricultural areas): arable lands
(CLC 211) and pastures (CLC 231). These are then subject to two further restrictions:
- Protected areas according to the Natura 2000 database are excluded (on
average this accounts for 6% of arable land and 16% of pastures);
- Land forms where slopes are steeper than 20 degrees or north-facing and
steeper than 5 degrees, are excluded based on the SRTM digital elevation model
(SRTM, 2019). On average, the natural constraints exclude 12% of arable lands
and 30% of pastures;
- 3% of the remaining land area is considered; this corresponds to the EU average
for set-aside land. It is used here as a proxy for agricultural areas potentially
available for non-agricultural purposes. It is also noted that PV is suitable for
dual-use approaches combining electricity and agricultural production.
To estimate the PV energy productivity, the instantaneous PV power at a specific location
is calculated taking into account the in-plane irradiance, spectral content of the sunlight,
and the module temperature which again depends on air temperature, wind speed and
irradiance. The PV system mounting configuration is assumed to be free-standing racks
facing south at an inclination angle of 20 degrees (40 degrees for locations north of 60
deg. N). The area required is calculated assuming 5.5 m2 per kWp of PV modules, i.e.
18.2 % efficiency. The distance between the module racks is calculated so the shadows
of one rack will just avoid hitting the modules on the rack behind at noon at winter
solstice. The PV energy yield calculation has been performed using the JRC's PVGIS
methodology (PVGIS, 2019), using hourly solar radiation data for the period 2005-2016.
The calculation assumes crystalline silicon modules, with balance-of-system losses of
10%. The annual energy yield per unit area of land varies from about 45 kWh/m2 in
northern regions to 160 kWh/m2 in southern regions. A year to year variability of the
order of 5% is expected.
Rooftop-Mounted Systems
Buildings offer considerable potential for deployment of PV and can allow better
geographic correlation of supply and demand. A harmonized database on the EU building
stock with the required level of detail is lacking. To overcome this, a multi-layer approach
(Bódis et al., 2019) is applied to determine the total detectable building footprint area,
using the land cover dataset and the European Urban Atlas to validate information on EU
built-up areas (to resolution of 10 m x 10 m and 2.5 m x 2.5 m) derived by the European
Settlement Map. The results are then refined using correction factors derived from
comparisons with cadastre data as well as analysis of building-by-building LIDAR digital
elevation models for a limited number of benchmark locations.
The PV energy productivity is calculated for the rooftop locations following the
methodology described above for ground-mounted systems. While the assumption of
array spacing may be conservative for rooftop installations, it can compensate for not
addressing other factors such as non-optimal orientation and shading effects.
165
Bioenergy
Forest biomass potentials
The energy potentials of biomass from forest (stemwood forest residues fuelwood) have
been estimated using the EFISCEN model that considers the competition between the use
of forest biomass for energy and material conversion (Verkerk et al., 2011). The model
uses data from the national forest inventory providing information on forest available for
wood supply, including area, growing stock volume and net annual increment. It is
assumed that both stemwood and residues available for energy can be used either as
traditional fuelwood, or as forest residues for electricity and heat generation. The
stemwood and residues not used for material products are then available for energy
production. The fuelwood use is calculated as a regional and scenario specific percentage
of the wood available for energy based on the statistical data for the fuelwood use (P.
Ruiz et al., 2015).
The evaluation of forest bioenergy potentials has been carried under three scenarios with
different sustainability assumptions: High, Medium and Low biomass availability for
energy. The High bioenergy scenario considers support measures that stimulate the use
of biomass and lead to high demand for biomass and enhances the mobilisation of
biomass. The Medium (reference) bioenergy scenario suggests a continuation of current
trends and indicates the future development of bioenergy with stimulation and policy
measures for biomass use for energy in line with currently agreed policies and targets.
This implies that the use of biomass for bioenergy use is avoided if high sustainability
risks are involved. In the Low bioenergy scenario biomass use for energy is not a key
priority, while resource efficient use of biomass is a priority. In this case fewer
stimulation measures in place for mobilisation of domestic biomass supply and
sustainability criteria are strict limiting the use of biomass from forests. Competing uses
for material production have higher priority than the use of biomass for energy due to
stricter policy guided by overall resource efficiency (P. Ruiz et al., 2015).
Biogas potential from manure
Anaerobic digestion of farm manure can provide renewable energy (electricity, heat or
fuels) for local farm use or delivered to the grids (electricity, heat or natural gas), and
also produce improved organic fertilisers. Biogas potential from manure has been
estimated considering the manure produced from livestock farming that includes cattle
(calves, bovine, male bovine, dairy cows, other cows), pigs (piglets, other pigs, sows),
sheep/goats and poultry (broilers, laying hens, other poultry). The amount of manure
(slurry) was calculated on the basis of actual animal populations for each livestock and
poultry type and different age groups and the amount of manure produced per head each
year using statistical data at regional level (EUROSTAT, 2016). The total amount of
manure produced was calculated as the sum of manure produced by all animal types
(Scarlat et al., 2018).
The theoretical biogas potential from manure was calculated as the sum of the biogas
amount produced by for each livestock and poultry type considering Total Solids (TS)
content, Volatile Solids (VS) content in Total Solids, and the biogas yield for each
feedstock type. The actual methane potential is less than the theoretical potential due to
the lower capability of collecting manure and anaerobic conversion of the feedstock in the
biogas plant and a realistic potential was estimated considering the availability of manure
for being used for biogas production (Scarlat et al., 2018). Detailed information about the
spatial location of livestock and poultry was used to determine the amount and the
spatial location of biogas feedstock using the revised and updated global maps of Gridded
Livestock of the World (FAO) at a spatial resolution of 1 km (Robinson et al., 2014). Geo-
referenced data on the location of farms and livestock and poultry population might be
available at local level through terrestrial surveys. The availability fraction of manure,
which represents the amount of feedstock that could be actually collected, strongly
depends on species, current farming system and disposal practices. The average
166
livestock density per holdings across Europe was assessed at regional level and the
number of animals per holding was combined in an availability indicator for manure
collection (Scarlat et al., 2018).
Crop residues
The potential of crop residues in the EU has been estimated using a spatially explicit
approach at European level at 1 km spatial resolution, based on an improved
methodology that assess theoretical, technical, environmental and sustainable potentials
of crop residues. The distribution of crop areas was based on the EarthStats project,
(Monfreda, Ramankutty and Foley, 2008) which provides geospatial information of
harvested areas, production and yields of 175 distinct crops on a 5 minute
latitude/longitude grid. The Land Use / Land Cover (LULC) data originated from the
harmonised data from the Corine Land Cover (CLC) (European Environment Agency,
2017) dataset and from the Land Cover CCI project (European Spatial Agency, 2015).
The theoretical potential of crop residue represents the crop residues production and has
been estimated by using the Residues-to-Product-Ratio depending on the crop yield for
the most relevant crops in Europe (wheat, barley, oat, rye, maize, rapeseed, rice, and
sunflower) (Scarlat, Martinov and Dallemand, 2010). The statistical data of crop
production at regional and national levels has been obtained from the EU Statistical
Office (EUROSTAT, 2017). Additional data was collected from national statistics for
countries not covered by Eurostat. The collected data includes harvested area, crop yield
and total production for the crops considered for the period between 2000 and 2015. The
calculation of the technical potential was based on the harvestable biomass factors that
consider the amount of crop residues that could be harvested and collected from the
field, with current technologies and equipment. The estimation of the technical limitations
for collection was based on a comprehensive analysis of the literature that considers the
vertical distribution of biomass along the stem for the cutting height, together with
biomass and harvesting losses associated with existing harvesting machinery (Scarlat et
al., 2019).
The environmental potential has been estimated as the amount of residues that could be
collected from land without affecting soil fertility. For this purpose, the agro-ecosystem
CENTURY model has been used to calculate the removal rates at 1x1 km grid which
allows maintaining Soil Organic Carbon (SOC) at the level of the reference year
(2015)(Lugato et al., 2014). The model simulates the relation between crop residues
removal and the dynamics of SOC stocks considering biomass production, soil properties
(type, texture, moisture), climate data (precipitations, temperature), and the cultivation
practices (tillage, crop rotation, nutrients input, etc.). Running different scenarios of
straw removal an Optimal Collection Index (OCI) indicates the maximum amount of
material that can be collected at a pixel level based on the SOC output. Finally, the
sustainable potential provides the amount of the crop residues that could be mobilized
considering both technical and environmental constraints in each location. It is defined as
the minimum value obtained in each grid cell of the technical and environmental
potentials previously determined. At the end, each value represents the most restrictive
condition for removal of crop residues in each location.
Waste potential
The analysis of the energy potential of waste reviewed waste management practices
(composting, recycling, incineration, landfilling) in European countries and provided the
estimation of the amounts of waste which could be available, according to waste
hierarchy (Scarlat, Fahl and Dallemand, 2018). This evaluation considered the spatial
location of the waste generation, the various treatment options applied and the current
waste incineration in existing waste to energy plants. Country specific data on waste
generation, recycling, and incineration from statistics (EUROSTAT, 2016) has been used
to identify the amounts of waste which might be potentially available for energy recovery
through incineration and which are currently sent to landfills. The amount of municipal
167
waste generation has been estimated according to waste generation per capita and
spatial distribution of population density at 1 km spatial resolution. The study provided a
survey of existing waste-to-energy plants that identified the capacity, type (electricity
heat of Combined Heat and Power) of plants and location. The analysis revealed some
important waste resources that are still not used for energy recovery in many regions
and countries. A suitability analysis has been performed to identify the potential location
and capacity for waste-to-energy plants based on the waste potential resources. An
algorithm was developed to examine the whole map area in order to locate hot-spot
areas with highest density of this resource and establish the optimal location for new
potential waste to energy plants and their capacity (Scarlat, Fahl and Dallemand, 2018).
Geothermal energy
The potential for geothermal power at NUTS 2 level has been derived based on
(Limberger et al., 2014) who estimated the resource base for Enhanced Geothermal
Systems (EGS) in Europe in the framework of the GEOELEC project (Towards more
geothermal electricity generation in Europe, 2014) and based on (Chamorro et al.,
2014). (Limberger et al., 2014) calculated then the heat in place depending on the
temperature difference available for geothermal, the rock density and the heat capacity
of rock. Based on the heat in place, we have estimated the theoretical potential for
geothermal power which means the power that could be theoretically produced during
the expected lifetime of a geothermal system which was assumed 30 years. This
theoretical potential marks the upper limit of the theoretically realizable power output.56
We have used the NUTS 2 dataset from Eurostat GISCO to obtain the geographical
boundaries of the EU NUTS 2 regions (‘Nomenclature of Territorial Units for Statistics
(NUTS) 2016 - Statistical Units - Data set’, 2018). We have then used ESRI ArcMap to
calculate the mean value of heat in place (PJ/km2) based on (Limberger et al., 2014)
according to NUTS 2 region. The theoretical potential for heat was then obtained by
multiplying the heat in place with the area (in km2). In addition, we assumed that a
geothermal project will use only a 5 % share of the underground volume. 57 For the
conversion of heat potential to electricity potential, a conversion factor of 0.12 according
to (Limberger et al., 2014) was used. Based on the theoretical potential, the technical
potential can be calculated. The theoretical potential can be limited by a number of
geological factors, such as heat recovery in the network of fractures, or temperature
drawdown effects. According to (Limberger et al., 2014), the average technical potential
taking those issues into account is 12.6 % of the theoretical potential.
The maximum technical potential represents the upper limit of the geothermal potential
assuming all the heat in place is extracted within 30 years. We have also calculated a
more conservative technical ('realistic technical potential') potential assuming heat
extraction over a period of 500 years.
Both approaches do not account for the actual replenishment of the resource. (Chamorro
et al., 2014) propose a methodology to calculate the sustainable potential of geothermal
resources assuming that the energy extracted is equal to the heat generated in the
underground. In the study of (Chamorro et al., 2014), on average, the sustainable
potential is about 0.5% of the technical potential. In order to calculate the sustainable
geothermal potential for the CRIT regions, we have repeated the calculations above but
56 It has to be noted that (Limberger et al., 2014) have assumed a maximum depth of 7 km for
EGS in 2020 and 2030 and 10 km for 2050. Furthermore, the injection temperature was
assumed 80 °C in 2020 and 2030 and 50 °C in 2050. 57 The heat in place (PJ/km2) according to (Limberger et al., 2014) is calculated for a depth of 10 km. We
assumed that a geothermal project would utilise a rock layer of 500 m depth according to (Willemsen,
Heller and Wees, 2011) which corresponds to 5 %.
168
we have set the number of years to such a value that the total potential matches the
Chamorro sustainable potential.58
In addition, political restrictions such as land availability can play a role. For example, the
exploitation of geothermal resources is not allowed in nature reserves or densely
populated areas, and there might be other (legal) constraints for underground activity.
(Limberger et al., 2014) estimate that overall 25 % of land is restricted.
In contrast, we look more in detail at the restrictions at NUTS 2 level. For our analysis,
we have used land cover data from the CORINE inventory (‘Corine Land Cover (CLC)
2018, Version 20b2’, 2018). The following land cover classes have been excluded (see
Annex II):
Industrial, commercial and transport units;
Mine, dump and construction sites;
Wetlands;
Water bodies.
In total, the areas that were excluded account for between 0.9 % and 8.6 % of the land
area in the CRiT regions. Excluded areas from wetlands can reach up to 7.8 %, followed
by industry & transport (up to 5.9 %), and water bodies (up to 2.0 %).
In addition to the Corine exclusion areas, we have also excluded protected areas. Data
for nature reserves are made available through the European inventory of Nationally
designated areas (Nationally designated areas (CDDA), 2018). The technical potential in
this assessment is thus derived by excluding the respective areas for each CRiT region.
CCUS
Under article 33 of the CCS Directive, Member States have to ensure that operators of all
combustion plants with a rated electrical output of 300 MW or more have assessed
whether the conditions of 1) availability of suitable storage sites; 2) economic and
technical feasibility of transport facilities and of 3) retrofit for CO2 capture are met
(European Parliament & Council, 2009).
The analysis conducted for this report is based on data from the JRC-PPDB68 59 and
extending the methodology developed in house previously (Alves Dias et al., 2018). The
results indicate existing capacity that could be "capture ready" in support of the
transition to a low carbon future. As such, we present the indicative capacity (GW) of
existing units in the coal regions that could be retrofitted with carbon dioxide capture
technology.
Although the CCS Directive does not make a distinction on the age of the facility, we
have only considered facilities of up to 20 years old even if this may be a fairly
conservative assumption. In the literature, "recently" built fossil fuel-fired power plants
have been considered these commissioned after 1997 (Ecofys, 2008; Graus et al., 2011).
This does not imply that older power plants cannot be retrofitted with carbon capture –
see Boundary Dam CCS project where carbon capture was retrofitted to a renovated unit,
commissioned originally in the 1970s. However, the increasingly important share of
renewables, the anticipated restrictions on coal eligibility to participate in future capacity
remuneration mechanisms, the post 2020 emission requirements of the Industrial
Emissions Directive (2010/75/EU) (European Parliament & Council, 2010), as well as
uncertainty over prevailing CO2 prices are a few of the factors that the plant operator of a
coal plant needs to consider before proceeding with any life-extension investment. Here
we assume that owners/operators of power plants of the considered age band could be
more likely to implement carbon capture to avoid early retirement.
58 This corresponds to using the sustainable potential from (Chamorro et al., 2014) and disaggregating it by the
heat in place to NUTS 2 regions. 59 JRC-PPDB is the comprehensive database of power plants in Europe (Kanellopoulos et al., 2017).
169
We also consider the new standards for Europe’s large coal-fired power stations
published by the European Commission in 2017. Previous analysis indicated the risk of
early retirement of coal fired power plants due to these new standards (Alves Dias et al.,
2018) on which we further elaborate to evaluate carbon capture potential. We assume
that the best available techniques (BAT) are incorporated to comply with the Industrial
Emissions Directive (IED).
Other criteria to determine a "capture ready" facility and assumptions include but are not
limited to:
• The facility is technically capable of being fully retrofitted for CO2 capture and related
units, and adequate space is available;
• Combustion plants with a rated electrical output of 300 MW or more are CO2 capture
ready;
• One or more choices of capture technology which are proven or whose performance can
be reliably estimated as being suitable are available;
• Retrofitted capture equipment can be connected to the existing facilities effectively and
without an excessive outage period;
• Pipeline or other route(s) such as shipping, to storage of CO2 can be available;
• One or more potential storage areas which have been appropriately assessed and found
likely to be suitable for safe geological storage of projected full lifetime volumes and
rates of captured CO2 are available;
• Additional water requirements have been identified and credible ways exist, in which
these requirements could be overcome;
• The costs of retrofitting capture, transport and storage can be incurred;
• The public and local communities are engaged and consent;
• Consideration of health, safety and environmental issues has been taken and relevant
approvals are in place, including a CO2 monitoring plan.
Energy Efficiency in buildings
The estimation of the technical energy saving potential associated to the renovation of
the regional building stocks was focused only on the residential sector, due to the lack of
information about the number of non-residential buildings at regional level. Within the
residential sector we have distinguished between single family houses (SFH) and multi-
family houses (MFH).
In accordance with the EPBD recast, we refer to the cost-optimal and NZEB renovation
levels, taking into account mainly the references provided by Member States and the
ENTRANZE project,60 about the investment costs for the renovation works and the energy
consumptions before and after the refurbishment. Because these last are normally
expressed in terms of primary energy, we express the final regional energy saving
potentials at this energy level.
It should be noted that the energy values presented are available only at national level
(or for a specific location selected as a representative of the national average). To obtain
regional values we applied a climatic factor, calculated as the ratio of the regional
Heating Degree Days (HDD) and the national or local ones.
Figure 73 provides the scheme of calculation, including the input data and the indicators
calculated for each region.
60 https://www.entranze.eu/
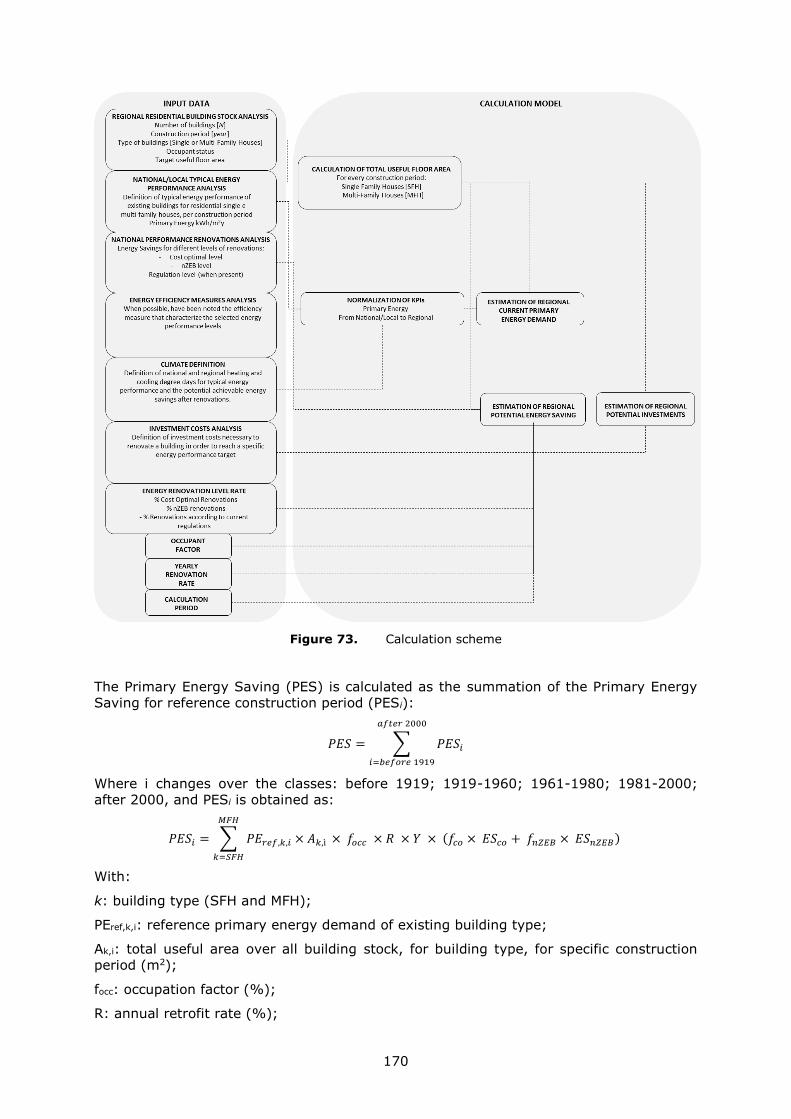
170
Figure 73. Calculation scheme
The Primary Energy Saving (PES) is calculated as the summation of the Primary Energy
Saving for reference construction period (PESi):
𝑃𝐸𝑆 = ∑ 𝑃𝐸𝑆𝑖
𝑎𝑓𝑡𝑒𝑟 2000
𝑖=𝑏𝑒𝑓𝑜𝑟𝑒 1919
Where i changes over the classes: before 1919; 1919-1960; 1961-1980; 1981-2000;
after 2000, and PESi is obtained as:
𝑃𝐸𝑆𝑖 = ∑ 𝑃𝐸𝑟𝑒𝑓,𝑘,𝑖 × 𝐴𝑘,ì × 𝑓𝑜𝑐𝑐 × 𝑅 × 𝑌 × (𝑓𝑐𝑜 × 𝐸𝑆𝑐𝑜 + 𝑓𝑛𝑍𝐸𝐵 × 𝐸𝑆𝑛𝑍𝐸𝐵)
𝑀𝐹𝐻
𝑘=𝑆𝐹𝐻
With:
k: building type (SFH and MFH);
PEref,k,i: reference primary energy demand of existing building type;
Ak,i: total useful area over all building stock, for building type, for specific construction
period (m2);
focc: occupation factor (%);
R: annual retrofit rate (%);
171
Y: number of years of the calculation period;
fco: percentage of building retrofitted in compliance with the cost optimal level (%);
fnZEB: percentage of building retrofitted in compliance with the NZEB level (%)(fco+fnZEB
=1);
ESco: cost-optimal energy saving respect to reference primary energy (%);
ESnZEB: nZEB energy saving with respect to reference primary energy (%).
The total useful area Ak,i is obtained as a function of the areas associated to different size
categories (j: under 30 m2, less than 40 m2, less than 50 m2, less than 60 m2, less than
80 m2, less than 100 m2, less than 120 m2, less than 150 m2, 150 m2 and over):
𝐴𝑘,𝑖 = ∑ 𝑁𝑏𝑢𝑖𝑙𝑑𝑖𝑛𝑔𝑠,𝑘,𝑖 × 𝐹𝑗 × 𝑆𝑗
𝑜𝑣𝑒𝑟 150 𝑚2
𝑗=𝑢𝑛𝑑𝑒𝑟 30 𝑚2
Where Nbuildings,k,i is number of buildings, built in a specific construction period, for the
type of building; Fj is the percentage of building within a certain size category (%) and Sj
is the target useful area for every size category.
Similarly the capitals associated to the renovation works (RC) are calculated as:
𝑅𝐶 = ∑ 𝑅𝐶𝑖
𝑎𝑓𝑡𝑒𝑟 2000
𝑖=𝑏𝑒𝑓𝑜𝑟𝑒 1919
Where RCi is:
𝑅𝐶𝑖 = ∑ 𝐴𝑘,ì × 𝑓𝑜𝑐𝑐 × 𝑅 × 𝑌 × (𝑓𝑐𝑜 × 𝐼𝐶𝑐𝑜 + 𝑓𝑛𝑍𝐸𝐵 × 𝐼𝐶𝑛𝑍𝐸𝐵)
𝑀𝐹𝐻
𝑘=𝑆𝐹𝐻
With:
k: building type (SFH and MFH);
Ak,i: total useful area over all building stock, for the building type, for specific
construction period;
focc: occupation factor;
R: total annual retrofit rate (%);
Y: number of years of the calculation period;
fco: percentage of building retrofitted in compliance with the cost-optimal level (%);
fnZEB: percentage of building retrofitted in compliance with the nZEB level (%);
ICco: investment costs for cost-optimal renovation (€/m2);
ICnZEB: investment costs for nZEB renovation (€/m2).
The main data sources used for this study are summarised in Table 24 (sources' links are
given in the body of the report).
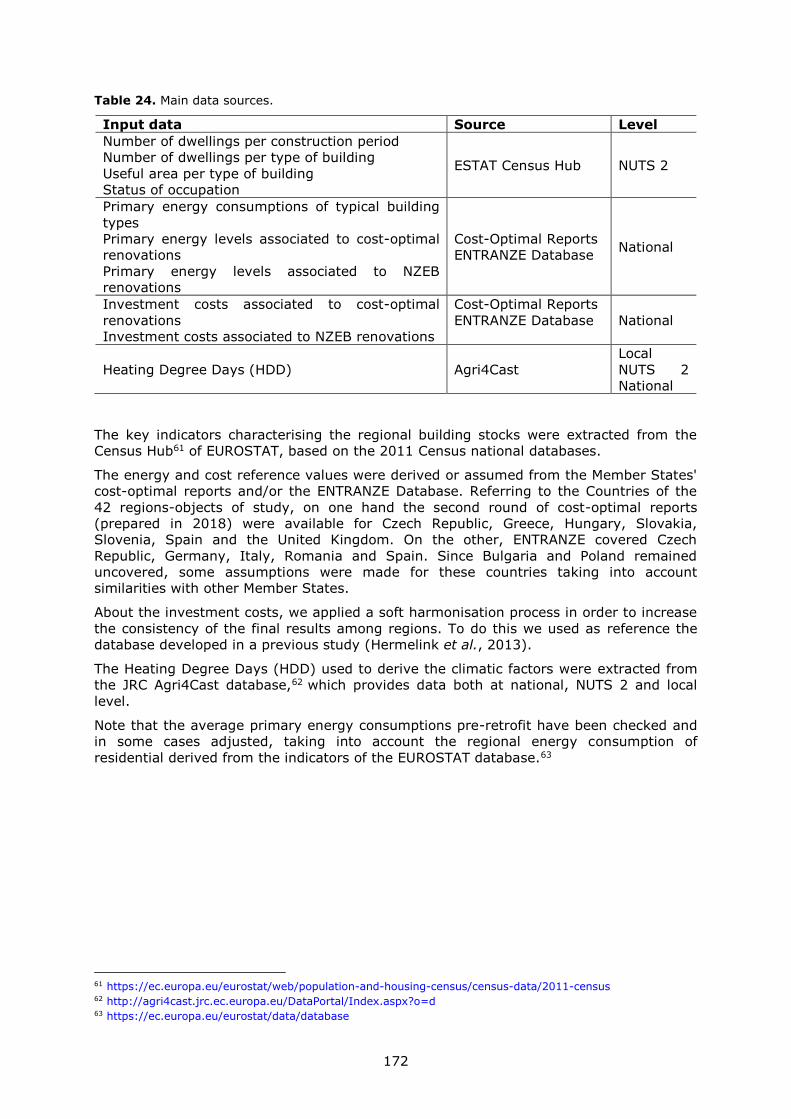
172
Table 24. Main data sources.
Input data Source Level
Number of dwellings per construction period
Number of dwellings per type of building
Useful area per type of building
Status of occupation
ESTAT Census Hub NUTS 2
Primary energy consumptions of typical building
types
Primary energy levels associated to cost-optimal
renovations
Primary energy levels associated to NZEB
renovations
Cost-Optimal Reports
ENTRANZE Database National
Investment costs associated to cost-optimal
renovations
Investment costs associated to NZEB renovations
Cost-Optimal Reports
ENTRANZE Database
National
Heating Degree Days (HDD) Agri4Cast
Local
NUTS 2
National
The key indicators characterising the regional building stocks were extracted from the
Census Hub61 of EUROSTAT, based on the 2011 Census national databases.
The energy and cost reference values were derived or assumed from the Member States'
cost-optimal reports and/or the ENTRANZE Database. Referring to the Countries of the
42 regions-objects of study, on one hand the second round of cost-optimal reports
(prepared in 2018) were available for Czech Republic, Greece, Hungary, Slovakia,
Slovenia, Spain and the United Kingdom. On the other, ENTRANZE covered Czech
Republic, Germany, Italy, Romania and Spain. Since Bulgaria and Poland remained
uncovered, some assumptions were made for these countries taking into account
similarities with other Member States.
About the investment costs, we applied a soft harmonisation process in order to increase
the consistency of the final results among regions. To do this we used as reference the
database developed in a previous study (Hermelink et al., 2013).
The Heating Degree Days (HDD) used to derive the climatic factors were extracted from
the JRC Agri4Cast database,62 which provides data both at national, NUTS 2 and local
level.
Note that the average primary energy consumptions pre-retrofit have been checked and
in some cases adjusted, taking into account the regional energy consumption of
residential derived from the indicators of the EUROSTAT database.63
61 https://ec.europa.eu/eurostat/web/population-and-housing-census/census-data/2011-census 62 http://agri4cast.jrc.ec.europa.eu/DataPortal/Index.aspx?o=d 63 https://ec.europa.eu/eurostat/data/database
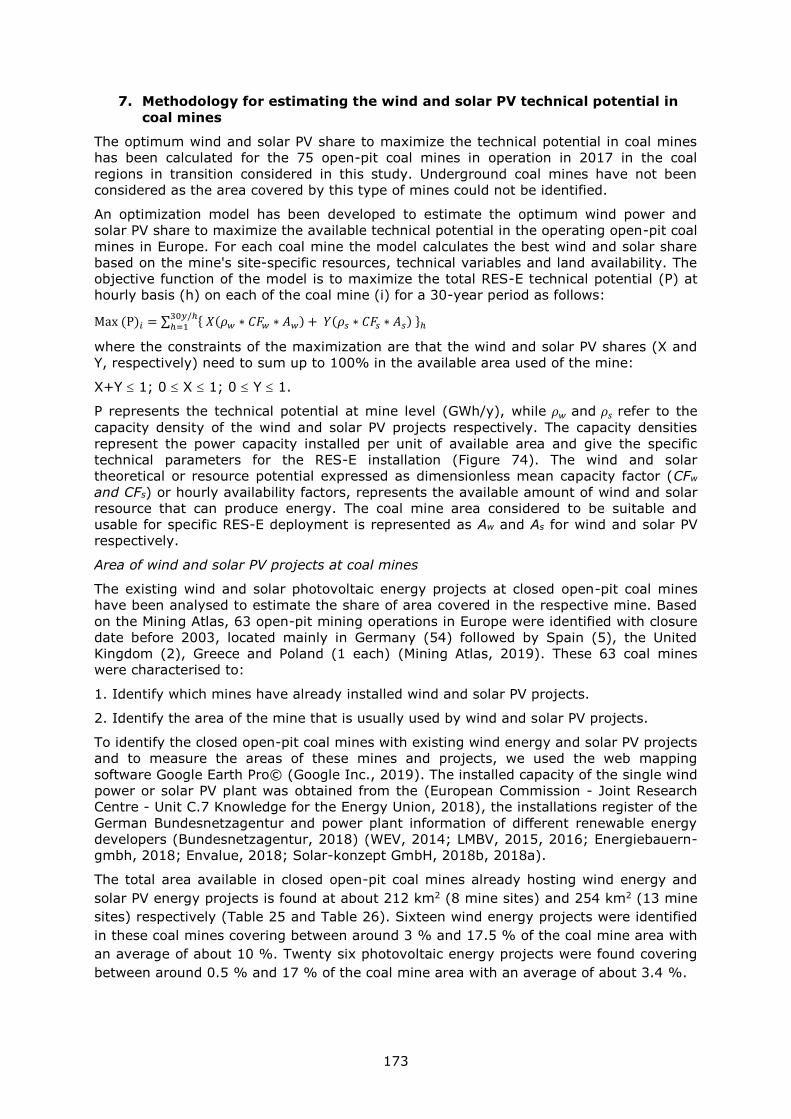
173
7. Methodology for estimating the wind and solar PV technical potential in
coal mines
The optimum wind and solar PV share to maximize the technical potential in coal mines
has been calculated for the 75 open-pit coal mines in operation in 2017 in the coal
regions in transition considered in this study. Underground coal mines have not been
considered as the area covered by this type of mines could not be identified.
An optimization model has been developed to estimate the optimum wind power and
solar PV share to maximize the available technical potential in the operating open-pit coal
mines in Europe. For each coal mine the model calculates the best wind and solar share
based on the mine's site-specific resources, technical variables and land availability. The
objective function of the model is to maximize the total RES-E technical potential (P) at
hourly basis (h) on each of the coal mine (i) for a 30-year period as follows:
Max (P)𝑖 = ∑ { 𝑋(𝜌𝑤 ∗ 𝐶𝐹𝑤 ∗ 𝐴𝑤) + 𝑌(𝜌𝑠 ∗ 𝐶𝐹𝑠 ∗ 𝐴𝑠) }ℎ30𝑦/ℎℎ=1
where the constraints of the maximization are that the wind and solar PV shares (X and
Y, respectively) need to sum up to 100% in the available area used of the mine:
X+Y 1; 0 X 1; 0 Y 1.
P represents the technical potential at mine level (GWh/y), while 𝜌𝑤 and 𝜌𝑠 refer to the
capacity density of the wind and solar PV projects respectively. The capacity densities
represent the power capacity installed per unit of available area and give the specific
technical parameters for the RES-E installation (Figure 74). The wind and solar
theoretical or resource potential expressed as dimensionless mean capacity factor (CFw
and CFs) or hourly availability factors, represents the available amount of wind and solar
resource that can produce energy. The coal mine area considered to be suitable and
usable for specific RES-E deployment is represented as Aw and As for wind and solar PV
respectively.
Area of wind and solar PV projects at coal mines
The existing wind and solar photovoltaic energy projects at closed open-pit coal mines
have been analysed to estimate the share of area covered in the respective mine. Based
on the Mining Atlas, 63 open-pit mining operations in Europe were identified with closure
date before 2003, located mainly in Germany (54) followed by Spain (5), the United
Kingdom (2), Greece and Poland (1 each) (Mining Atlas, 2019). These 63 coal mines
were characterised to:
1. Identify which mines have already installed wind and solar PV projects.
2. Identify the area of the mine that is usually used by wind and solar PV projects.
To identify the closed open-pit coal mines with existing wind energy and solar PV projects
and to measure the areas of these mines and projects, we used the web mapping
software Google Earth Pro© (Google Inc., 2019). The installed capacity of the single wind
power or solar PV plant was obtained from the (European Commission - Joint Research
Centre - Unit C.7 Knowledge for the Energy Union, 2018), the installations register of the
German Bundesnetzagentur and power plant information of different renewable energy
developers (Bundesnetzagentur, 2018) (WEV, 2014; LMBV, 2015, 2016; Energiebauern-
gmbh, 2018; Envalue, 2018; Solar-konzept GmbH, 2018b, 2018a).
The total area available in closed open-pit coal mines already hosting wind energy and
solar PV energy projects is found at about 212 km2 (8 mine sites) and 254 km2 (13 mine
sites) respectively (Table 25 and Table 26). Sixteen wind energy projects were identified
in these coal mines covering between around 3 % and 17.5 % of the coal mine area with
an average of about 10 %. Twenty six photovoltaic energy projects were found covering
between around 0.5 % and 17 % of the coal mine area with an average of about 3.4 %.

174
The average values (9.8% and 3.4% of the coal mine area covered by wind energy and
solar PV projects respectively) was used in the optimisation to estimate the technical
potential in operating open-pit coal mines.
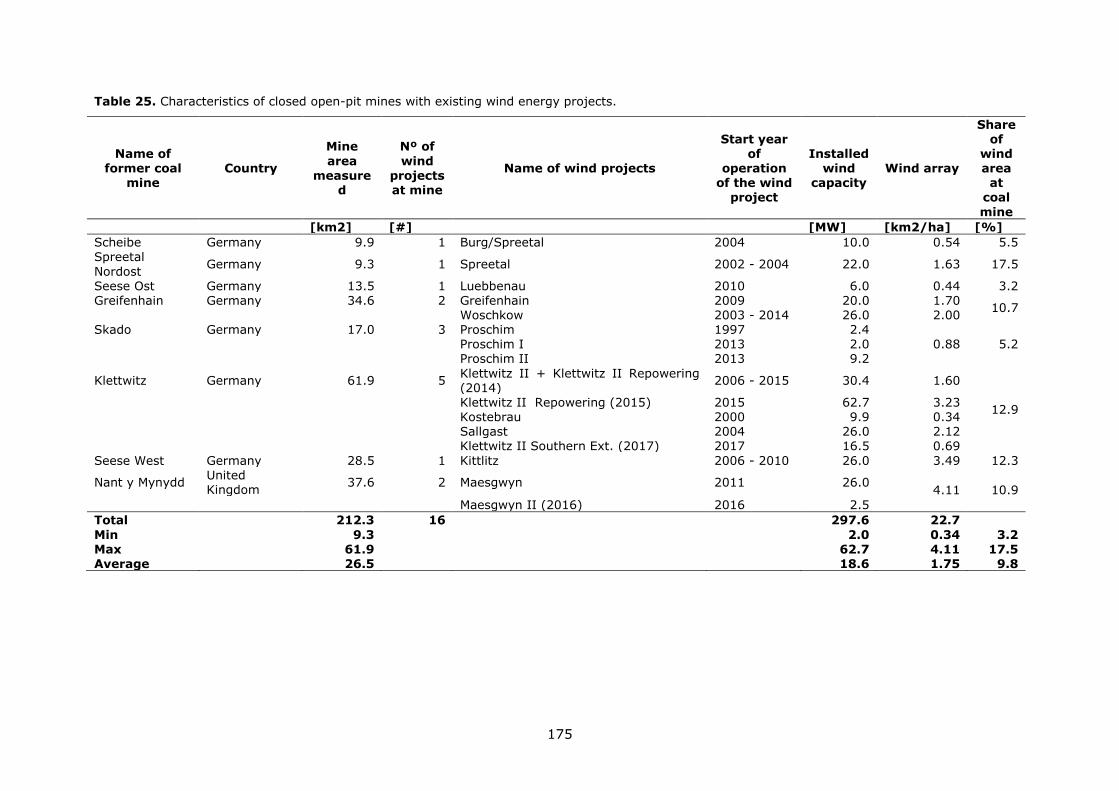
175
Table 25. Characteristics of closed open-pit mines with existing wind energy projects.
Name of former coal
mine Country
Mine
area measure
d
Nº of
wind projects at mine
Name of wind projects
Start year of
operation of the wind
project
Installed wind
capacity Wind array
Share of
wind area at
coal
mine
[km2] [#] [MW] [km2/ha] [%]
Scheibe Germany 9.9 1 Burg/Spreetal 2004 10.0 0.54 5.5 Spreetal
Nordost Germany 9.3 1 Spreetal 2002 - 2004 22.0 1.63 17.5
Seese Ost Germany 13.5 1 Luebbenau 2010 6.0 0.44 3.2 Greifenhain Germany 34.6 2 Greifenhain 2009 20.0 1.70
10.7 Woschkow 2003 - 2014 26.0 2.00 Skado Germany 17.0 3 Proschim 1997 2.4
0.88 5.2 Proschim I 2013 2.0 Proschim II 2013 9.2
Klettwitz Germany 61.9 5 Klettwitz II + Klettwitz II Repowering (2014)
2006 - 2015 30.4 1.60
12.9 Klettwitz II Repowering (2015) 2015 62.7 3.23 Kostebrau 2000 9.9 0.34 Sallgast 2004 26.0 2.12 Klettwitz II Southern Ext. (2017) 2017 16.5 0.69
Seese West Germany 28.5 1 Kittlitz 2006 - 2010 26.0 3.49 12.3
Nant y Mynydd United Kingdom
37.6 2 Maesgwyn 2011 26.0 4.11 10.9
Maesgwyn II (2016) 2016 2.5
Total 212.3 16 297.6 22.7
Min 9.3 2.0 0.34 3.2 Max 61.9 62.7 4.11 17.5 Average 26.5 18.6 1.75 9.8
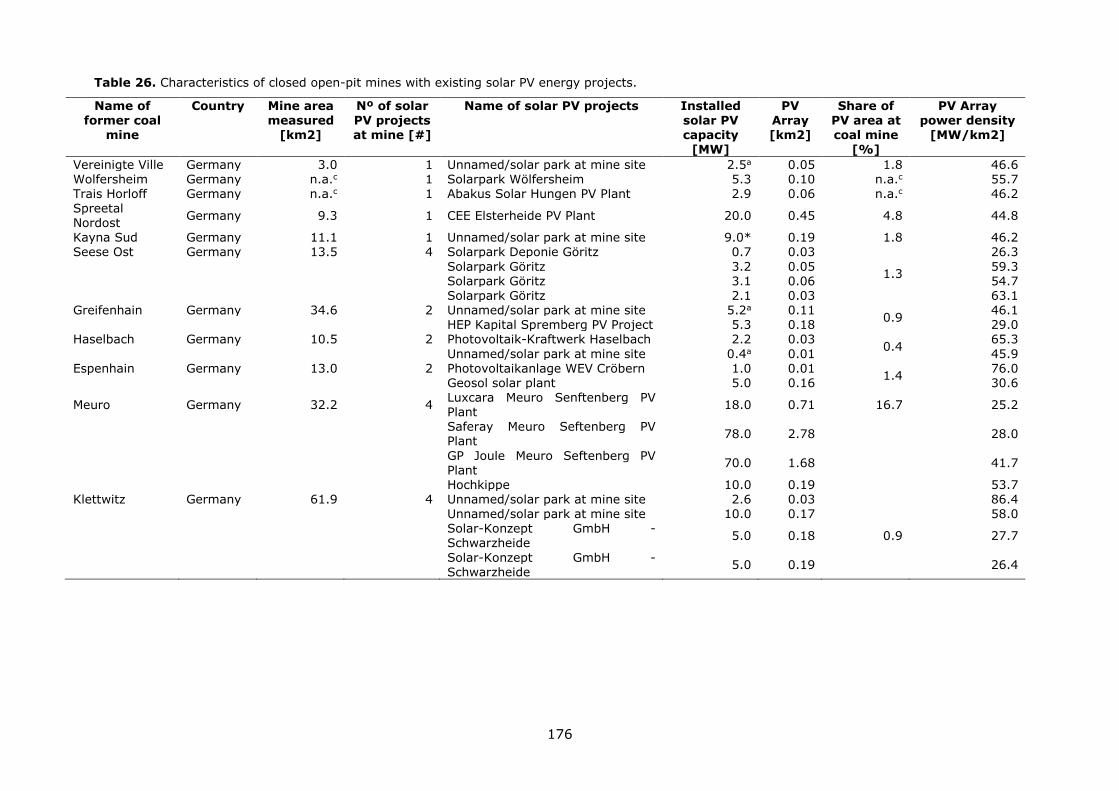
176
Table 26. Characteristics of closed open-pit mines with existing solar PV energy projects.
Name of former coal
mine
Country Mine area measured
[km2]
Nº of solar PV projects at mine [#]
Name of solar PV projects Installed solar PV capacity
[MW]
PV Array [km2]
Share of PV area at coal mine
[%]
PV Array power density
[MW/km2]
Vereinigte Ville Germany 3.0 1 Unnamed/solar park at mine site 2.5a 0.05 1.8 46.6 Wolfersheim Germany n.a.c 1 Solarpark Wölfersheim 5.3 0.10 n.a.c 55.7 Trais Horloff Germany n.a.c 1 Abakus Solar Hungen PV Plant 2.9 0.06 n.a.c 46.2 Spreetal
Nordost Germany 9.3 1 CEE Elsterheide PV Plant 20.0 0.45 4.8 44.8
Kayna Sud Germany 11.1 1 Unnamed/solar park at mine site 9.0* 0.19 1.8 46.2 Seese Ost Germany 13.5 4 Solarpark Deponie Göritz 0.7 0.03
1.3
26.3
Solarpark Göritz 3.2 0.05 59.3 Solarpark Göritz 3.1 0.06 54.7 Solarpark Göritz 2.1 0.03 63.1 Greifenhain Germany 34.6 2 Unnamed/solar park at mine site 5.2a 0.11
0.9 46.1
HEP Kapital Spremberg PV Project 5.3 0.18 29.0 Haselbach Germany 10.5 2 Photovoltaik-Kraftwerk Haselbach 2.2 0.03
0.4 65.3
Unnamed/solar park at mine site 0.4a 0.01 45.9
Espenhain Germany 13.0 2 Photovoltaikanlage WEV Cröbern 1.0 0.01 1.4
76.0 Geosol solar plant 5.0 0.16 30.6
Meuro Germany 32.2 4 Luxcara Meuro Senftenberg PV Plant
18.0 0.71 16.7 25.2
Saferay Meuro Seftenberg PV Plant
78.0 2.78 28.0
GP Joule Meuro Seftenberg PV Plant
70.0 1.68 41.7
Hochkippe 10.0 0.19 53.7 Klettwitz Germany 61.9 4 Unnamed/solar park at mine site 2.6 0.03 86.4
Unnamed/solar park at mine site 10.0 0.17 58.0
Solar-Konzept GmbH - Schwarzheide
5.0 0.18 0.9 27.7
Solar-Konzept GmbH - Schwarzheide
5.0 0.19 26.4
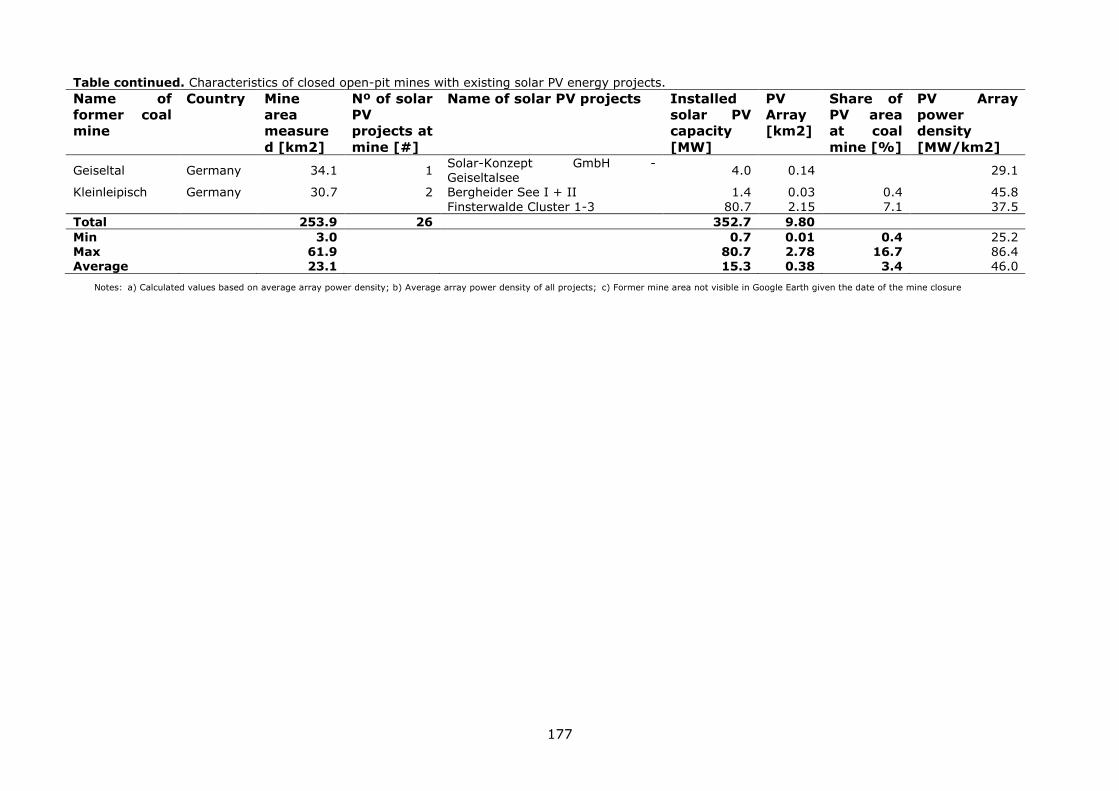
177
Table continued. Characteristics of closed open-pit mines with existing solar PV energy projects.
Name of
former coal
mine
Country Mine
area
measure
d [km2]
Nº of solar
PV
projects at
mine [#]
Name of solar PV projects Installed
solar PV
capacity
[MW]
PV
Array
[km2]
Share of
PV area
at coal
mine [%]
PV Array
power
density
[MW/km2]
Geiseltal Germany 34.1 1 Solar-Konzept GmbH - Geiseltalsee
4.0 0.14 29.1
Kleinleipisch Germany 30.7 2 Bergheider See I + II 1.4 0.03 0.4 45.8
Finsterwalde Cluster 1-3 80.7 2.15 7.1 37.5
Total 253.9 26 352.7 9.80
Min 3.0 0.7 0.01 0.4 25.2 Max 61.9 80.7 2.78 16.7 86.4 Average 23.1 15.3 0.38 3.4 46.0
Notes: a) Calculated values based on average array power density; b) Average array power density of all projects; c) Former mine area not visible in Google Earth given the date of the mine closure
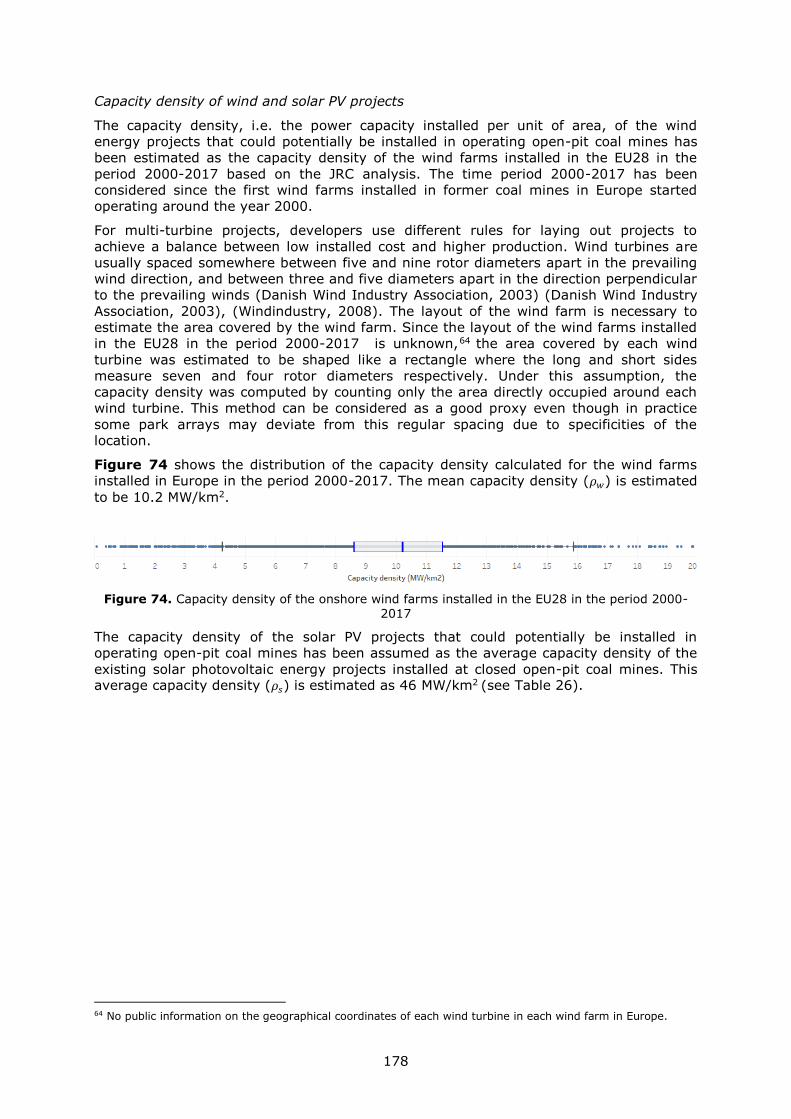
178
Capacity density of wind and solar PV projects
The capacity density, i.e. the power capacity installed per unit of area, of the wind
energy projects that could potentially be installed in operating open-pit coal mines has
been estimated as the capacity density of the wind farms installed in the EU28 in the
period 2000-2017 based on the JRC analysis. The time period 2000-2017 has been
considered since the first wind farms installed in former coal mines in Europe started
operating around the year 2000.
For multi-turbine projects, developers use different rules for laying out projects to
achieve a balance between low installed cost and higher production. Wind turbines are
usually spaced somewhere between five and nine rotor diameters apart in the prevailing
wind direction, and between three and five diameters apart in the direction perpendicular
to the prevailing winds (Danish Wind Industry Association, 2003) (Danish Wind Industry
Association, 2003), (Windindustry, 2008). The layout of the wind farm is necessary to
estimate the area covered by the wind farm. Since the layout of the wind farms installed
in the EU28 in the period 2000-2017 is unknown,64 the area covered by each wind
turbine was estimated to be shaped like a rectangle where the long and short sides
measure seven and four rotor diameters respectively. Under this assumption, the
capacity density was computed by counting only the area directly occupied around each
wind turbine. This method can be considered as a good proxy even though in practice
some park arrays may deviate from this regular spacing due to specificities of the
location.
Figure 74 shows the distribution of the capacity density calculated for the wind farms
installed in Europe in the period 2000-2017. The mean capacity density (𝜌𝑤) is estimated
to be 10.2 MW/km2.
Figure 74. Capacity density of the onshore wind farms installed in the EU28 in the period 2000-2017
The capacity density of the solar PV projects that could potentially be installed in
operating open-pit coal mines has been assumed as the average capacity density of the
existing solar photovoltaic energy projects installed at closed open-pit coal mines. This average capacity density (𝜌𝑠) is estimated as 46 MW/km2 (see Table 26).
64 No public information on the geographical coordinates of each wind turbine in each wind farm in Europe.
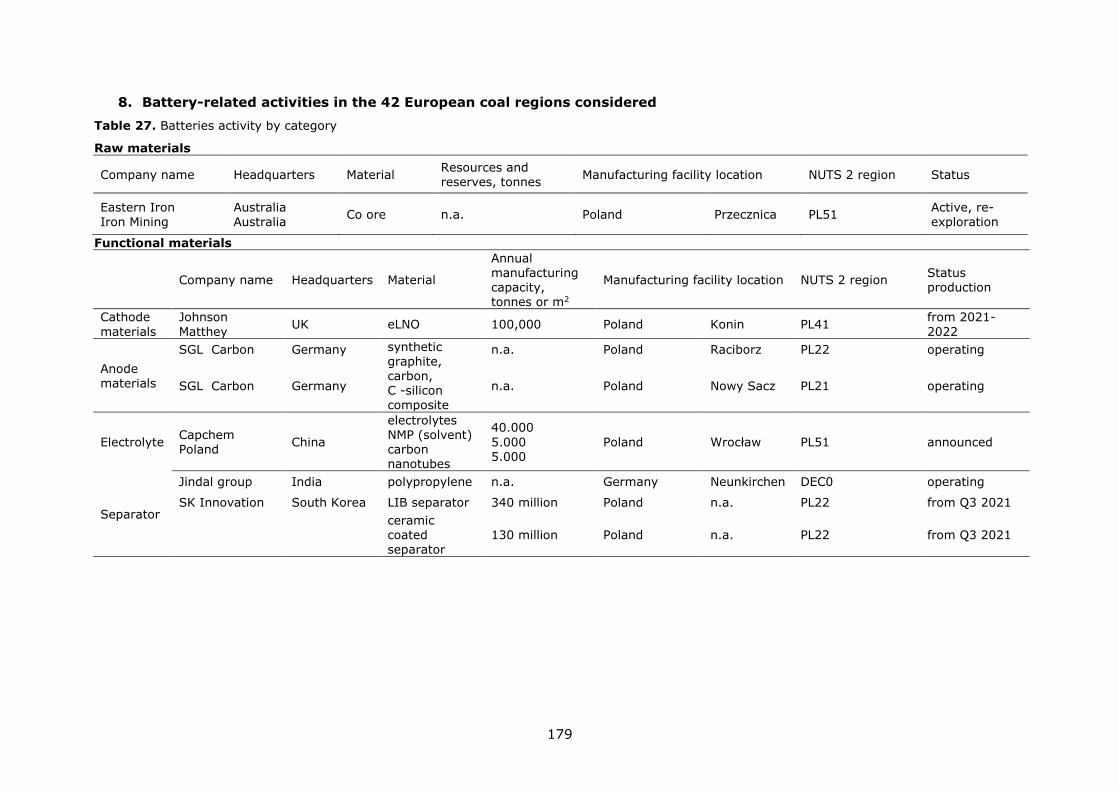
179
8. Battery-related activities in the 42 European coal regions considered
Table 27. Batteries activity by category
Raw materials
Company name Headquarters Material Resources and reserves, tonnes
Manufacturing facility location NUTS 2 region Status
Eastern Iron
Iron Mining
Australia
Australia Co ore n.a. Poland Przecznica PL51
Active, re-
exploration
Functional materials
Company name Headquarters Material
Annual manufacturing capacity, tonnes or m2
Manufacturing facility location NUTS 2 region Status production
Cathode
materials
Johnson
Matthey UK eLNO 100,000 Poland Konin PL41
from 2021-
2022
Anode materials
SGL Carbon Germany synthetic
graphite, carbon, C -silicon composite
n.a. Poland Raciborz PL22 operating
SGL Carbon Germany n.a. Poland Nowy Sacz PL21 operating
Electrolyte Capchem Poland
China
electrolytes NMP (solvent) carbon nanotubes
40.000
5.000 5.000
Poland Wrocław PL51 announced
Separator
Jindal group India polypropylene n.a. Germany Neunkirchen DEC0 operating
SK Innovation South Korea LIB separator 340 million Poland n.a. PL22 from Q3 2021
ceramic coated separator
130 million Poland n.a. PL22 from Q3 2021
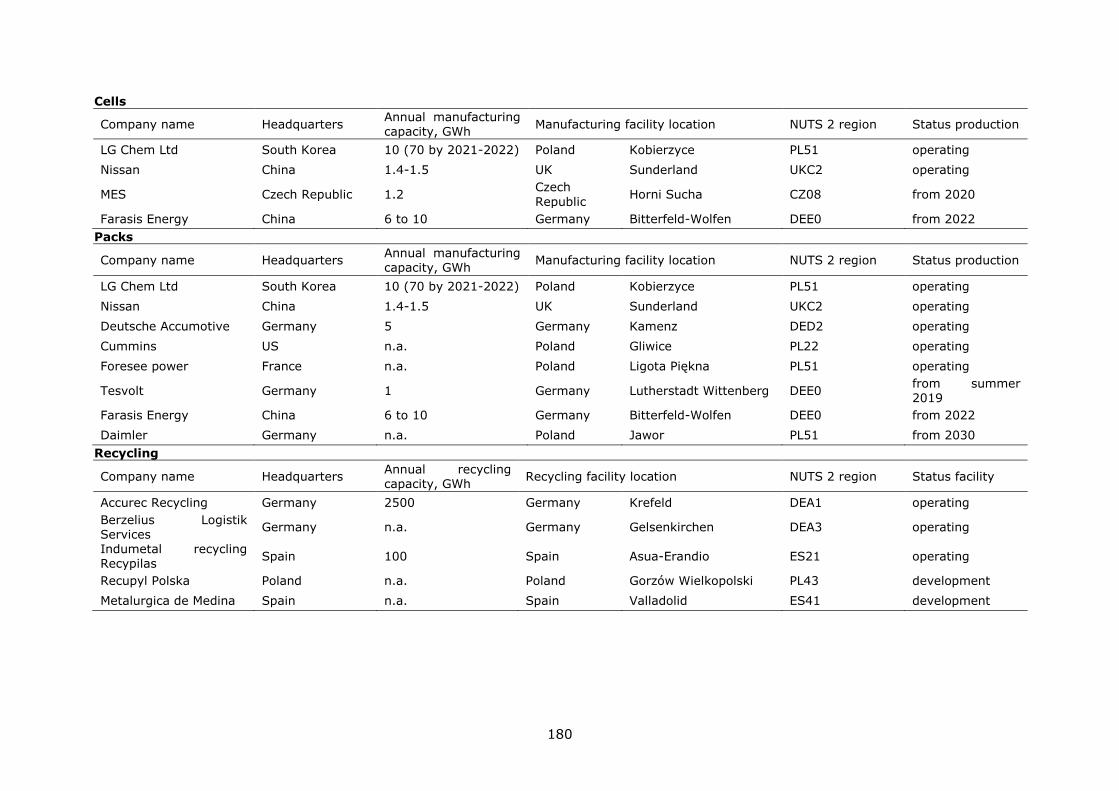
180
Cells
Company name Headquarters Annual manufacturing capacity, GWh
Manufacturing facility location NUTS 2 region Status production
LG Chem Ltd South Korea 10 (70 by 2021-2022) Poland Kobierzyce PL51 operating
Nissan China 1.4-1.5 UK Sunderland UKC2 operating
MES Czech Republic 1.2 Czech
Republic Horni Sucha CZ08 from 2020
Farasis Energy China 6 to 10 Germany Bitterfeld-Wolfen DEE0 from 2022
Packs
Company name Headquarters Annual manufacturing capacity, GWh
Manufacturing facility location NUTS 2 region Status production
LG Chem Ltd South Korea 10 (70 by 2021-2022) Poland Kobierzyce PL51 operating
Nissan China 1.4-1.5 UK Sunderland UKC2 operating
Deutsche Accumotive Germany 5 Germany Kamenz DED2 operating
Cummins US n.a. Poland Gliwice PL22 operating
Foresee power France n.a. Poland Ligota Piękna PL51 operating
Tesvolt Germany 1 Germany Lutherstadt Wittenberg DEE0 from summer 2019
Farasis Energy China 6 to 10 Germany Bitterfeld-Wolfen DEE0 from 2022
Daimler Germany n.a. Poland Jawor PL51 from 2030
Recycling
Company name Headquarters Annual recycling capacity, GWh
Recycling facility location NUTS 2 region Status facility
Accurec Recycling Germany 2500 Germany Krefeld DEA1 operating
Berzelius Logistik Services
Germany n.a. Germany Gelsenkirchen DEA3 operating
Indumetal recycling Recypilas
Spain 100 Spain Asua-Erandio ES21 operating
Recupyl Polska Poland n.a. Poland Gorzów Wielkopolski PL43 development
Metalurgica de Medina Spain n.a. Spain Valladolid ES41 development
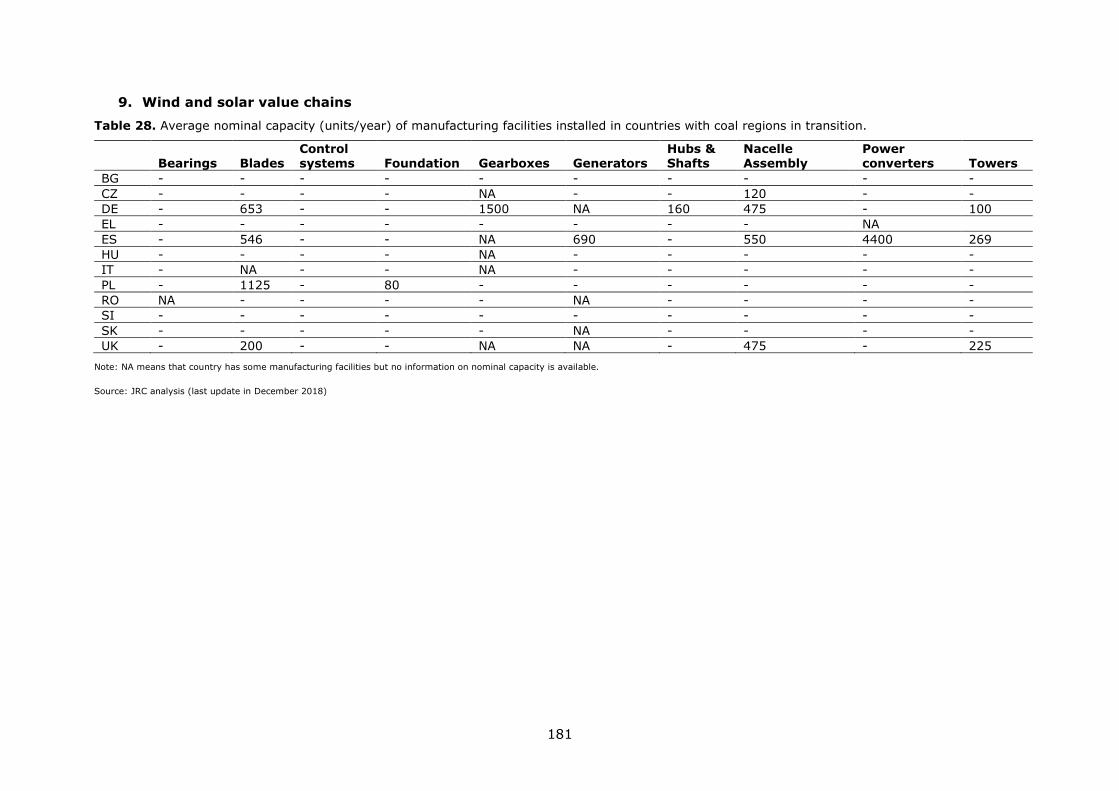
181
9. Wind and solar value chains
Table 28. Average nominal capacity (units/year) of manufacturing facilities installed in countries with coal regions in transition.
Bearings Blades Control systems Foundation Gearboxes Generators
Hubs & Shafts
Nacelle Assembly
Power converters Towers
BG - - - - - - - - - -
CZ - - - - NA - - 120 - -
DE - 653 - - 1500 NA 160 475 - 100
EL - - - - - - - - NA
ES - 546 - - NA 690 - 550 4400 269
HU - - - - NA - - - - -
IT - NA - - NA - - - - -
PL - 1125 - 80 - - - - - -
RO NA - - - - NA - - - -
SI - - - - - - - - - -
SK - - - - - NA - - - -
UK - 200 - - NA NA - 475 - 225
Note: NA means that country has some manufacturing facilities but no information on nominal capacity is available.
Source: JRC analysis (last update in December 2018)
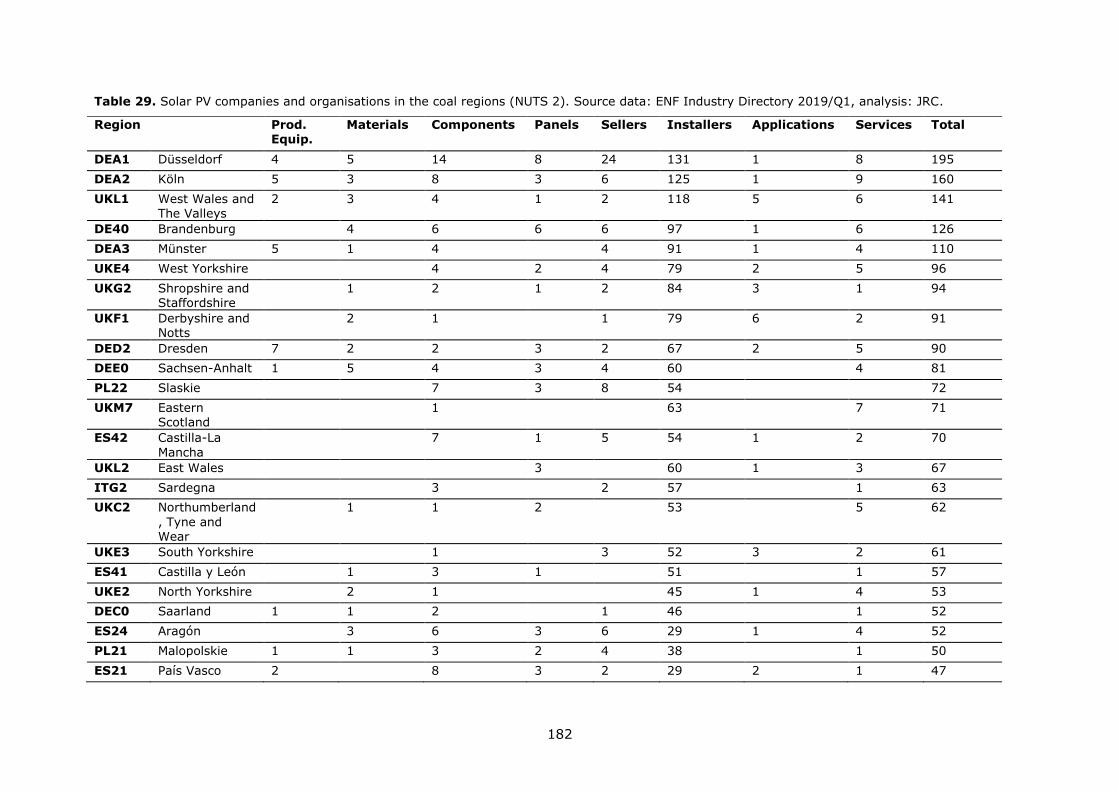
182
Table 29. Solar PV companies and organisations in the coal regions (NUTS 2). Source data: ENF Industry Directory 2019/Q1, analysis: JRC.
Region Prod. Equip.
Materials Components Panels Sellers Installers Applications Services Total
DEA1 Düsseldorf 4 5 14 8 24 131 1 8 195
DEA2 Köln 5 3 8 3 6 125 1 9 160
UKL1 West Wales and The Valleys
2 3 4 1 2 118 5 6 141
DE40 Brandenburg 4 6 6 6 97 1 6 126
DEA3 Münster 5 1 4 4 91 1 4 110
UKE4 West Yorkshire 4 2 4 79 2 5 96
UKG2 Shropshire and Staffordshire
1 2 1 2 84 3 1 94
UKF1 Derbyshire and Notts
2 1 1 79 6 2 91
DED2 Dresden 7 2 2 3 2 67 2 5 90
DEE0 Sachsen-Anhalt 1 5 4 3 4 60 4 81
PL22 Slaskie 7 3 8 54 72
UKM7 Eastern Scotland
1 63 7 71
ES42 Castilla-La
Mancha
7 1 5 54 1 2 70
UKL2 East Wales 3 60 1 3 67
ITG2 Sardegna 3 2 57 1 63
UKC2 Northumberland
, Tyne and Wear
1 1 2 53 5 62
UKE3 South Yorkshire 1 3 52 3 2 61
ES41 Castilla y León 1 3 1 51 1 57
UKE2 North Yorkshire 2 1 45 1 4 53
DEC0 Saarland 1 1 2 1 46 1 52
ES24 Aragón 3 6 3 6 29 1 4 52
PL21 Malopolskie 1 1 3 2 4 38 1 50
ES21 País Vasco 2 8 3 2 29 2 1 47
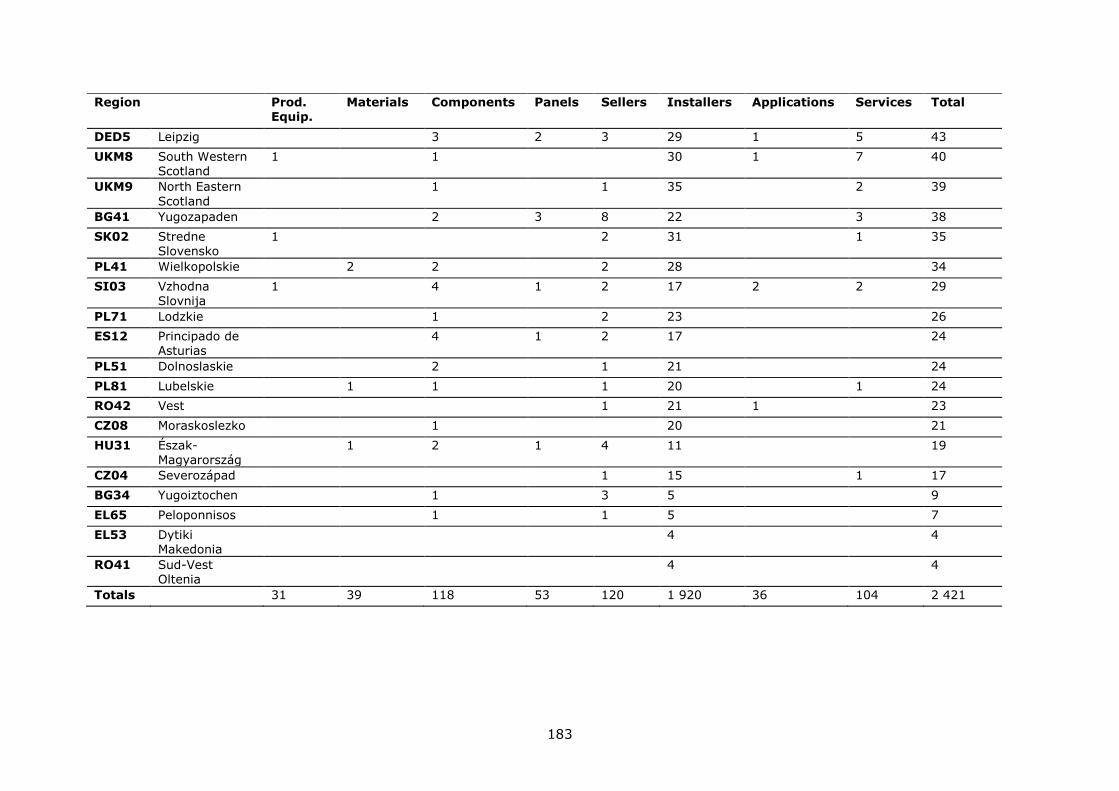
183
Region Prod. Equip.
Materials Components Panels Sellers Installers Applications Services Total
DED5 Leipzig 3 2 3 29 1 5 43
UKM8 South Western Scotland
1 1 30 1 7 40
UKM9 North Eastern
Scotland
1 1 35 2 39
BG41 Yugozapaden 2 3 8 22 3 38
SK02 Stredne Slovensko
1 2 31 1 35
PL41 Wielkopolskie 2 2 2 28 34
SI03 Vzhodna Slovnija
1 4 1 2 17 2 2 29
PL71 Lodzkie 1 2 23 26
ES12 Principado de Asturias
4 1 2 17 24
PL51 Dolnoslaskie 2 1 21 24
PL81 Lubelskie 1 1 1 20 1 24
RO42 Vest 1 21 1 23
CZ08 Moraskoslezko 1 20 21
HU31 Észak-Magyarország
1 2 1 4 11 19
CZ04 Severozápad 1 15 1 17
BG34 Yugoiztochen 1 3 5 9
EL65 Peloponnisos 1 1 5 7
EL53 Dytiki Makedonia
4 4
RO41 Sud-Vest Oltenia
4 4
Totals 31 39 118 53 120 1 920 36 104 2 421
184
10. Employment and investment estimations and methodology
Regional distribution
Establishing in which region the new capacity needed at national level will be installed is
formulated from three main perspectives:
Macro to micro economic and activity models.
The EREBILAND project (Baranzelli et al., 2016) is one example of this approach,
in which regional production and consumption patterns are inferred from national
results by analysing "structural characteristics of the regions, among which:
population density and urbanisation trends, development of different economic
sectors, availability of resources and technological infrastructure".
Technology diffusion theory.
An example of this approach can be seen in (Guidolin and Alpcan, 2019) where a
diffusion model is set to study the transition to sustainable energy generation in
Australia, or in (Guidolin and Guseo, 2016), where the competition and
substitution between nuclear power and renewable energy technologies is
modelled. (Sievers et al., 2019) analyses the regional spill-over effects for
renewable energy technologies. From the diffusion theory point of view, as said in
(Guidolin and Alpcan, 2019), "a central role is played by learning, spread of
knowledge and imitation among consumers, that are considered as the real
drivers of change".
Investment decision making.
A state of the art review on multi-attribute decision making (MADM) methods
applied to renewable technologies can be seen at (Ilbahar, Cebi and Kahraman,
2019). The authors find that "Analytic Hierarchy Process (AHP), one of the
additive weighting methods, is the most commonly used MADM method to
address renewable and sustainable energy problems." It also provides a listing of
the most prominent criteria considered in the studies.
The problem of regional allocation of future capacity needs is not of deterministic nature
so, the method proposed for the current approach proceeds as it follows:
1. Analyse the critical set of variables (indicators) considered influential by each field of
the previously related.
2. Consider for which of those indicators coherent data sets EU-wide and coal regions-
wide are available.
3. Analyse the selected data sets, their interdependencies and their redundancy
4. Propose a set of key coherent, independent and available indicators.
5. Formulate weights scenarios for those indicators, following the findings of each of the
main perspectives (economic, diffusion and investment decision making)
6. Obtain the range of national capacities that each weight scenario assigns to each coal
region.
7. Analyse the implications of the resulting maximum and minimum regional capacity
installation.
The analysis of candidate indicators has included three main groups:
Macro. Regional surface, Gross Domestic Product (GDP), Gross added value and
number of technology related employments.
Regional Competitiveness Index (RCI). Indicators elaborated within the European
Regional Competitiveness Index initiative (Annoni, Dijkstra and Gargano, 2017).
The RCI is a compound indicator obtained from other KPIs. Special detail has been
considered for the (Labour market) Efficiency and Innovation sub-indexes.
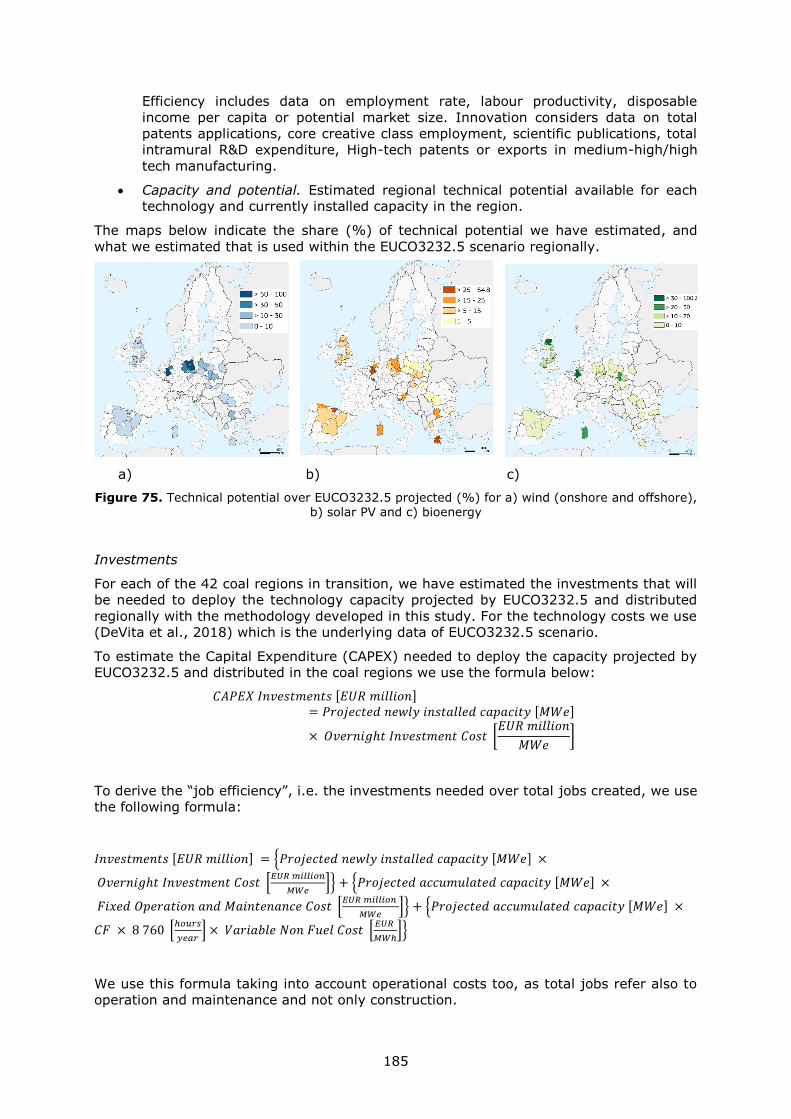
185
Efficiency includes data on employment rate, labour productivity, disposable
income per capita or potential market size. Innovation considers data on total
patents applications, core creative class employment, scientific publications, total
intramural R&D expenditure, High-tech patents or exports in medium-high/high
tech manufacturing.
Capacity and potential. Estimated regional technical potential available for each
technology and currently installed capacity in the region.
The maps below indicate the share (%) of technical potential we have estimated, and
what we estimated that is used within the EUCO3232.5 scenario regionally.
a) b) c)
Figure 75. Technical potential over EUCO3232.5 projected (%) for a) wind (onshore and offshore), b) solar PV and c) bioenergy
Investments
For each of the 42 coal regions in transition, we have estimated the investments that will
be needed to deploy the technology capacity projected by EUCO3232.5 and distributed
regionally with the methodology developed in this study. For the technology costs we use
(DeVita et al., 2018) which is the underlying data of EUCO3232.5 scenario.
To estimate the Capital Expenditure (CAPEX) needed to deploy the capacity projected by
EUCO3232.5 and distributed in the coal regions we use the formula below:
𝐶𝐴𝑃𝐸𝑋 𝐼𝑛𝑣𝑒𝑠𝑡𝑚𝑒𝑛𝑡𝑠 [𝐸𝑈𝑅 𝑚𝑖𝑙𝑙𝑖𝑜𝑛] = 𝑃𝑟𝑜𝑗𝑒𝑐𝑡𝑒𝑑 𝑛𝑒𝑤𝑙𝑦 𝑖𝑛𝑠𝑡𝑎𝑙𝑙𝑒𝑑 𝑐𝑎𝑝𝑎𝑐𝑖𝑡𝑦 [𝑀𝑊𝑒]
× 𝑂𝑣𝑒𝑟𝑛𝑖𝑔ℎ𝑡 𝐼𝑛𝑣𝑒𝑠𝑡𝑚𝑒𝑛𝑡 𝐶𝑜𝑠𝑡 [𝐸𝑈𝑅 𝑚𝑖𝑙𝑙𝑖𝑜𝑛
𝑀𝑊𝑒]
To derive the “job efficiency”, i.e. the investments needed over total jobs created, we use
the following formula:
𝐼𝑛𝑣𝑒𝑠𝑡𝑚𝑒𝑛𝑡𝑠 [𝐸𝑈𝑅 𝑚𝑖𝑙𝑙𝑖𝑜𝑛] = {𝑃𝑟𝑜𝑗𝑒𝑐𝑡𝑒𝑑 𝑛𝑒𝑤𝑙𝑦 𝑖𝑛𝑠𝑡𝑎𝑙𝑙𝑒𝑑 𝑐𝑎𝑝𝑎𝑐𝑖𝑡𝑦 [𝑀𝑊𝑒] ×
𝑂𝑣𝑒𝑟𝑛𝑖𝑔ℎ𝑡 𝐼𝑛𝑣𝑒𝑠𝑡𝑚𝑒𝑛𝑡 𝐶𝑜𝑠𝑡 [𝐸𝑈𝑅 𝑚𝑖𝑙𝑙𝑖𝑜𝑛
𝑀𝑊𝑒]} + {𝑃𝑟𝑜𝑗𝑒𝑐𝑡𝑒𝑑 𝑎𝑐𝑐𝑢𝑚𝑢𝑙𝑎𝑡𝑒𝑑 𝑐𝑎𝑝𝑎𝑐𝑖𝑡𝑦 [𝑀𝑊𝑒] ×
𝐹𝑖𝑥𝑒𝑑 𝑂𝑝𝑒𝑟𝑎𝑡𝑖𝑜𝑛 𝑎𝑛𝑑 𝑀𝑎𝑖𝑛𝑡𝑒𝑛𝑎𝑛𝑐𝑒 𝐶𝑜𝑠𝑡 [𝐸𝑈𝑅 𝑚𝑖𝑙𝑙𝑖𝑜𝑛
𝑀𝑊𝑒]} + {𝑃𝑟𝑜𝑗𝑒𝑐𝑡𝑒𝑑 𝑎𝑐𝑐𝑢𝑚𝑢𝑙𝑎𝑡𝑒𝑑 𝑐𝑎𝑝𝑎𝑐𝑖𝑡𝑦 [𝑀𝑊𝑒] ×
𝐶𝐹 × 8 760 [ℎ𝑜𝑢𝑟𝑠
𝑦𝑒𝑎𝑟] × 𝑉𝑎𝑟𝑖𝑎𝑏𝑙𝑒 𝑁𝑜𝑛 𝐹𝑢𝑒𝑙 𝐶𝑜𝑠𝑡 [
𝐸𝑈𝑅
𝑀𝑊ℎ]}
We use this formula taking into account operational costs too, as total jobs refer also to
operation and maintenance and not only construction.

186
For bioenergy we estimate investments for electricity production capacity starting from
EUCO3232.5 projections. As these refer to both heat and power, we derive the share of
electricity using an electrical efficiency of ~ 30% and adopting the cost values as
indicated in (De Vita et al., 2018). Investments refer to expenditure for bioenergy
facilities and not for the production of biomass. For geothermal energy, the investment
estimation uses capacities derived using an estimated NUTS 2 regions' share in the
country. These shares do not take into account further land restrictions (e.g. protected
areas).
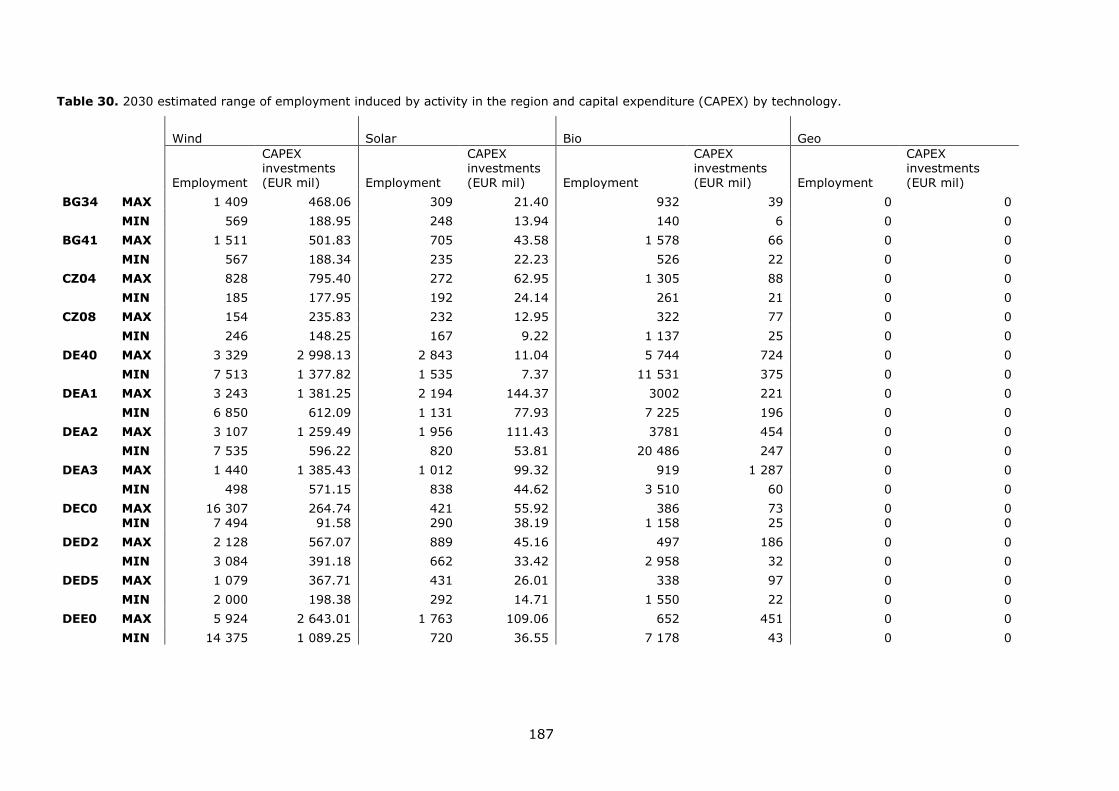
187
Table 30. 2030 estimated range of employment induced by activity in the region and capital expenditure (CAPEX) by technology.
Wind Solar Bio Geo
Employment
CAPEX investments (EUR mil) Employment
CAPEX investments (EUR mil) Employment
CAPEX investments (EUR mil) Employment
CAPEX investments (EUR mil)
BG34 MAX 1 409 468.06 309 21.40 932 39 0 0
MIN 569 188.95 248 13.94 140 6 0 0
BG41 MAX 1 511 501.83 705 43.58 1 578 66 0 0
MIN 567 188.34 235 22.23 526 22 0 0
CZ04 MAX 828 795.40 272 62.95 1 305 88 0 0
MIN 185 177.95 192 24.14 261 21 0 0
CZ08 MAX 154 235.83 232 12.95 322 77 0 0
MIN 246 148.25 167 9.22 1 137 25 0 0
DE40 MAX 3 329 2 998.13 2 843 11.04 5 744 724 0 0
MIN 7 513 1 377.82 1 535 7.37 11 531 375 0 0
DEA1 MAX 3 243 1 381.25 2 194 144.37 3002 221 0 0
MIN 6 850 612.09 1 131 77.93 7 225 196 0 0
DEA2 MAX 3 107 1 259.49 1 956 111.43 3781 454 0 0
MIN 7 535 596.22 820 53.81 20 486 247 0 0
DEA3 MAX 1 440 1 385.43 1 012 99.32 919 1 287 0 0
MIN 498 571.15 838 44.62 3 510 60 0 0
DEC0 MAX 16 307 264.74 421 55.92 386 73 0 0 MIN 7 494 91.58 290 38.19 1 158 25 0 0
DED2 MAX 2 128 567.07 889 45.16 497 186 0 0
MIN 3 084 391.18 662 33.42 2 958 32 0 0
DED5 MAX 1 079 367.71 431 26.01 338 97 0 0
MIN 2 000 198.38 292 14.71 1 550 22 0 0
DEE0 MAX 5 924 2 643.01 1 763 109.06 652 451 0 0
MIN 14 375 1 089.25 720 36.55 7 178 43 0 0
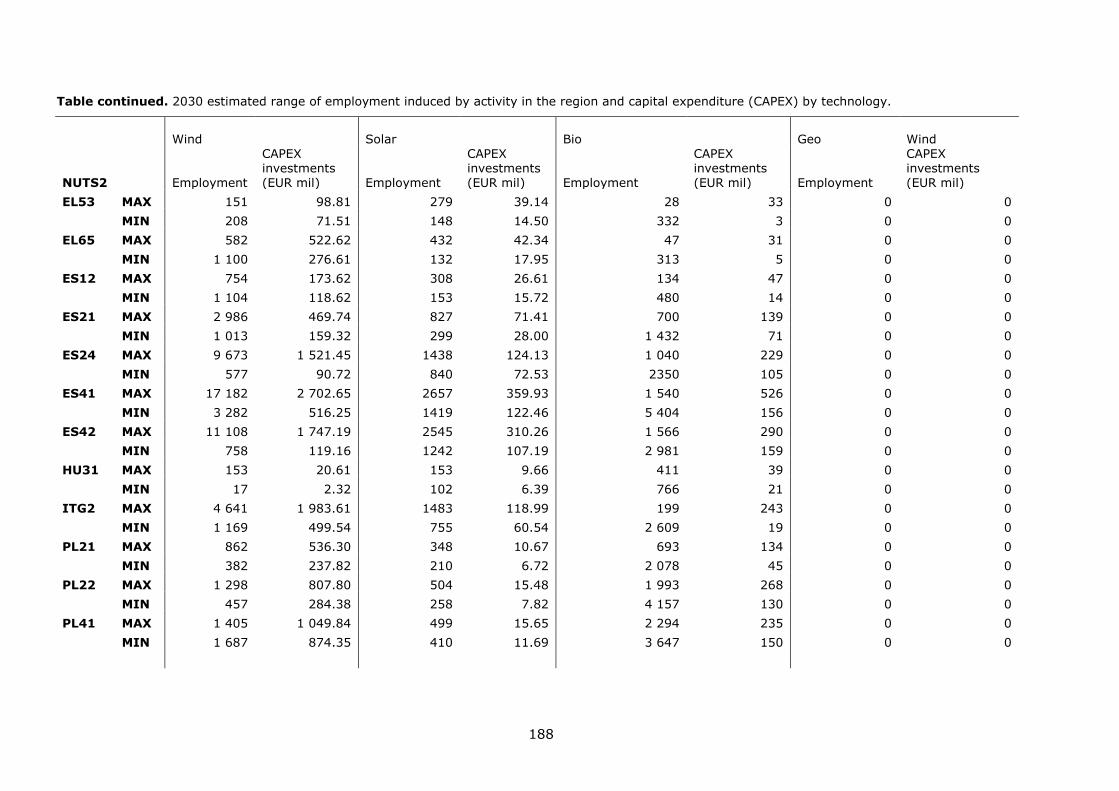
188
Table continued. 2030 estimated range of employment induced by activity in the region and capital expenditure (CAPEX) by technology.
NUTS2
Wind Solar Bio Geo Wind
Employment
CAPEX investments (EUR mil) Employment
CAPEX investments (EUR mil) Employment
CAPEX investments (EUR mil) Employment
CAPEX investments (EUR mil)
EL53 MAX 151 98.81 279 39.14 28 33 0 0
MIN 208 71.51 148 14.50 332 3 0 0
EL65 MAX 582 522.62 432 42.34 47 31 0 0
MIN 1 100 276.61 132 17.95 313 5 0 0
ES12 MAX 754 173.62 308 26.61 134 47 0 0
MIN 1 104 118.62 153 15.72 480 14 0 0
ES21 MAX 2 986 469.74 827 71.41 700 139 0 0
MIN 1 013 159.32 299 28.00 1 432 71 0 0
ES24 MAX 9 673 1 521.45 1438 124.13 1 040 229 0 0
MIN 577 90.72 840 72.53 2350 105 0 0
ES41 MAX 17 182 2 702.65 2657 359.93 1 540 526 0 0
MIN 3 282 516.25 1419 122.46 5 404 156 0 0
ES42 MAX 11 108 1 747.19 2545 310.26 1 566 290 0 0
MIN 758 119.16 1242 107.19 2 981 159 0 0
HU31 MAX 153 20.61 153 9.66 411 39 0 0
MIN 17 2.32 102 6.39 766 21 0 0
ITG2 MAX 4 641 1 983.61 1483 118.99 199 243 0 0
MIN 1 169 499.54 755 60.54 2 609 19 0 0
PL21 MAX 862 536.30 348 10.67 693 134 0 0
MIN 382 237.82 210 6.72 2 078 45 0 0
PL22 MAX 1 298 807.80 504 15.48 1 993 268 0 0
MIN 457 284.38 258 7.82 4 157 130 0 0
PL41 MAX 1 405 1 049.84 499 15.65 2 294 235 0 0
MIN 1 687 874.35 410 11.69 3 647 150 0 0
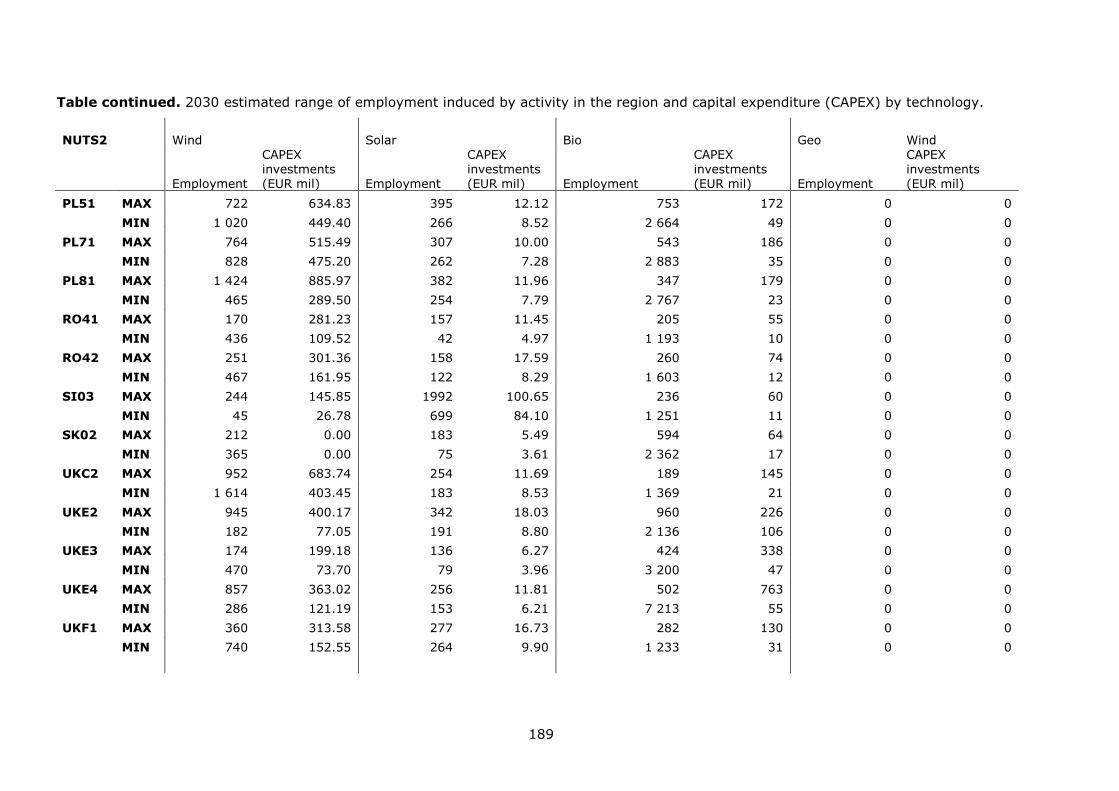
189
Table continued. 2030 estimated range of employment induced by activity in the region and capital expenditure (CAPEX) by technology.
NUTS2 Wind Solar Bio Geo Wind
Employment
CAPEX investments (EUR mil) Employment
CAPEX investments (EUR mil) Employment
CAPEX investments (EUR mil) Employment
CAPEX investments (EUR mil)
PL51 MAX 722 634.83 395 12.12 753 172 0 0
MIN 1 020 449.40 266 8.52 2 664 49 0 0
PL71 MAX 764 515.49 307 10.00 543 186 0 0
MIN 828 475.20 262 7.28 2 883 35 0 0
PL81 MAX 1 424 885.97 382 11.96 347 179 0 0
MIN 465 289.50 254 7.79 2 767 23 0 0
RO41 MAX 170 281.23 157 11.45 205 55 0 0
MIN 436 109.52 42 4.97 1 193 10 0 0
RO42 MAX 251 301.36 158 17.59 260 74 0 0
MIN 467 161.95 122 8.29 1 603 12 0 0
SI03 MAX 244 145.85 1992 100.65 236 60 0 0
MIN 45 26.78 699 84.10 1 251 11 0 0
SK02 MAX 212 0.00 183 5.49 594 64 0 0
MIN 365 0.00 75 3.61 2 362 17 0 0
UKC2 MAX 952 683.74 254 11.69 189 145 0 0
MIN 1 614 403.45 183 8.53 1 369 21 0 0
UKE2 MAX 945 400.17 342 18.03 960 226 0 0
MIN 182 77.05 191 8.80 2 136 106 0 0
UKE3 MAX 174 199.18 136 6.27 424 338 0 0
MIN 470 73.70 79 3.96 3 200 47 0 0
UKE4 MAX 857 363.02 256 11.81 502 763 0 0
MIN 286 121.19 153 6.21 7 213 55 0 0
UKF1 MAX 360 313.58 277 16.73 282 130 0 0
MIN 740 152.55 264 9.90 1 233 31 0 0
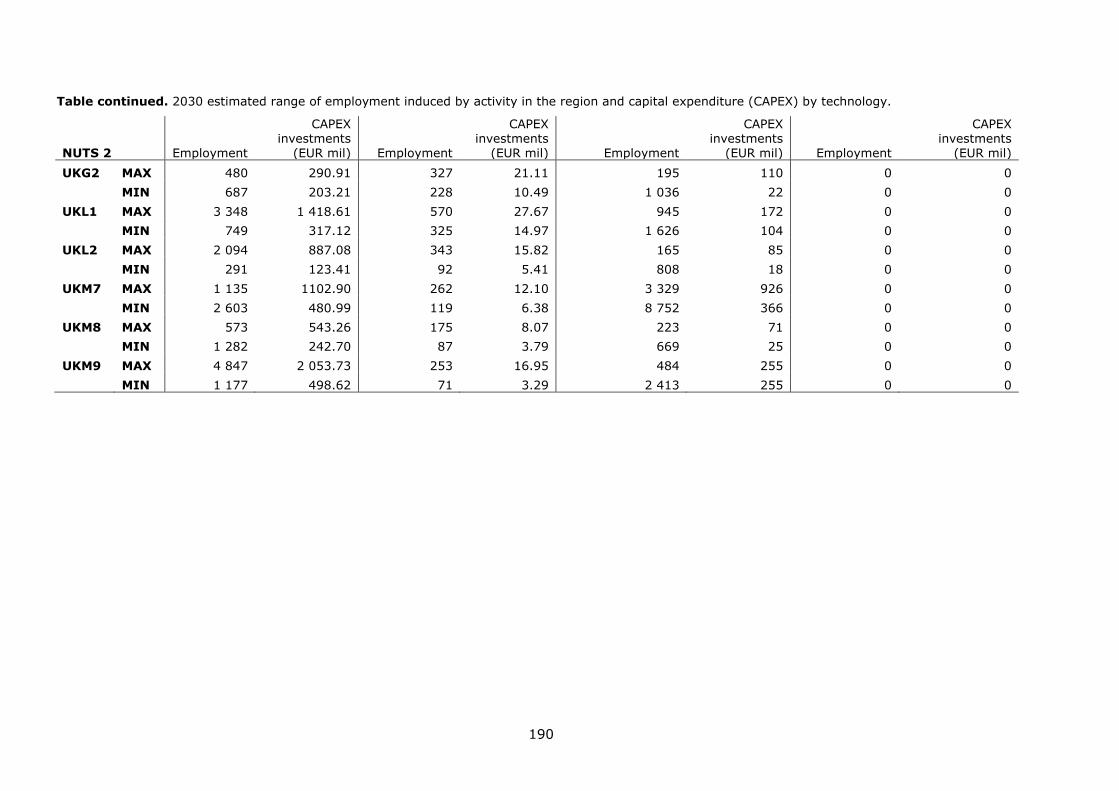
190
Table continued. 2030 estimated range of employment induced by activity in the region and capital expenditure (CAPEX) by technology.
NUTS 2 Employment
CAPEX investments
(EUR mil) Employment
CAPEX investments
(EUR mil) Employment
CAPEX investments
(EUR mil) Employment
CAPEX investments
(EUR mil)
UKG2 MAX 480 290.91 327 21.11 195 110 0 0
MIN 687 203.21 228 10.49 1 036 22 0 0
UKL1 MAX 3 348 1 418.61 570 27.67 945 172 0 0
MIN 749 317.12 325 14.97 1 626 104 0 0
UKL2 MAX 2 094 887.08 343 15.82 165 85 0 0
MIN 291 123.41 92 5.41 808 18 0 0
UKM7 MAX 1 135 1102.90 262 12.10 3 329 926 0 0
MIN 2 603 480.99 119 6.38 8 752 366 0 0
UKM8 MAX 573 543.26 175 8.07 223 71 0 0
MIN 1 282 242.70 87 3.79 669 25 0 0
UKM9 MAX 4 847 2 053.73 253 16.95 484 255 0 0
MIN 1 177 498.62 71 3.29 2 413 255 0 0
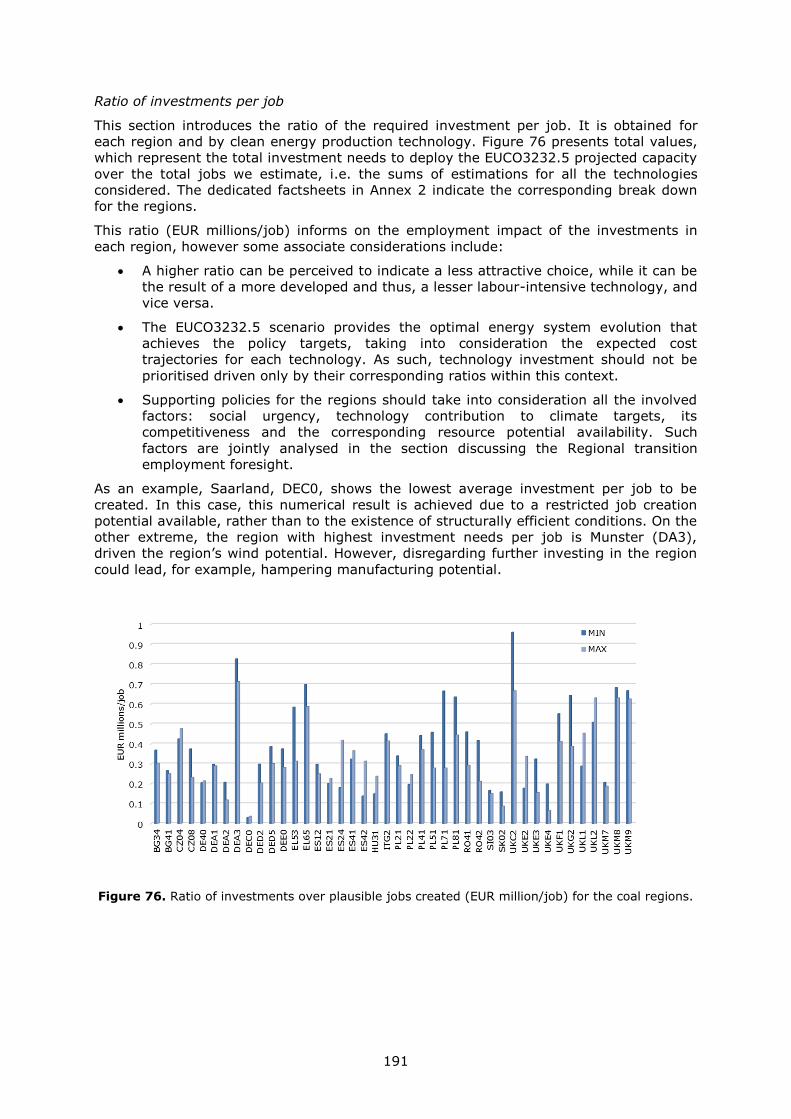
191
Ratio of investments per job
This section introduces the ratio of the required investment per job. It is obtained for
each region and by clean energy production technology. Figure 76 presents total values,
which represent the total investment needs to deploy the EUCO3232.5 projected capacity
over the total jobs we estimate, i.e. the sums of estimations for all the technologies
considered. The dedicated factsheets in Annex 2 indicate the corresponding break down
for the regions.
This ratio (EUR millions/job) informs on the employment impact of the investments in
each region, however some associate considerations include:
A higher ratio can be perceived to indicate a less attractive choice, while it can be
the result of a more developed and thus, a lesser labour-intensive technology, and
vice versa.
The EUCO3232.5 scenario provides the optimal energy system evolution that
achieves the policy targets, taking into consideration the expected cost
trajectories for each technology. As such, technology investment should not be
prioritised driven only by their corresponding ratios within this context.
Supporting policies for the regions should take into consideration all the involved
factors: social urgency, technology contribution to climate targets, its
competitiveness and the corresponding resource potential availability. Such
factors are jointly analysed in the section discussing the Regional transition
employment foresight.
As an example, Saarland, DEC0, shows the lowest average investment per job to be
created. In this case, this numerical result is achieved due to a restricted job creation
potential available, rather than to the existence of structurally efficient conditions. On the
other extreme, the region with highest investment needs per job is Munster (DA3),
driven the region’s wind potential. However, disregarding further investing in the region
could lead, for example, hampering manufacturing potential.
Figure 76. Ratio of investments over plausible jobs created (EUR million/job) for the coal regions.
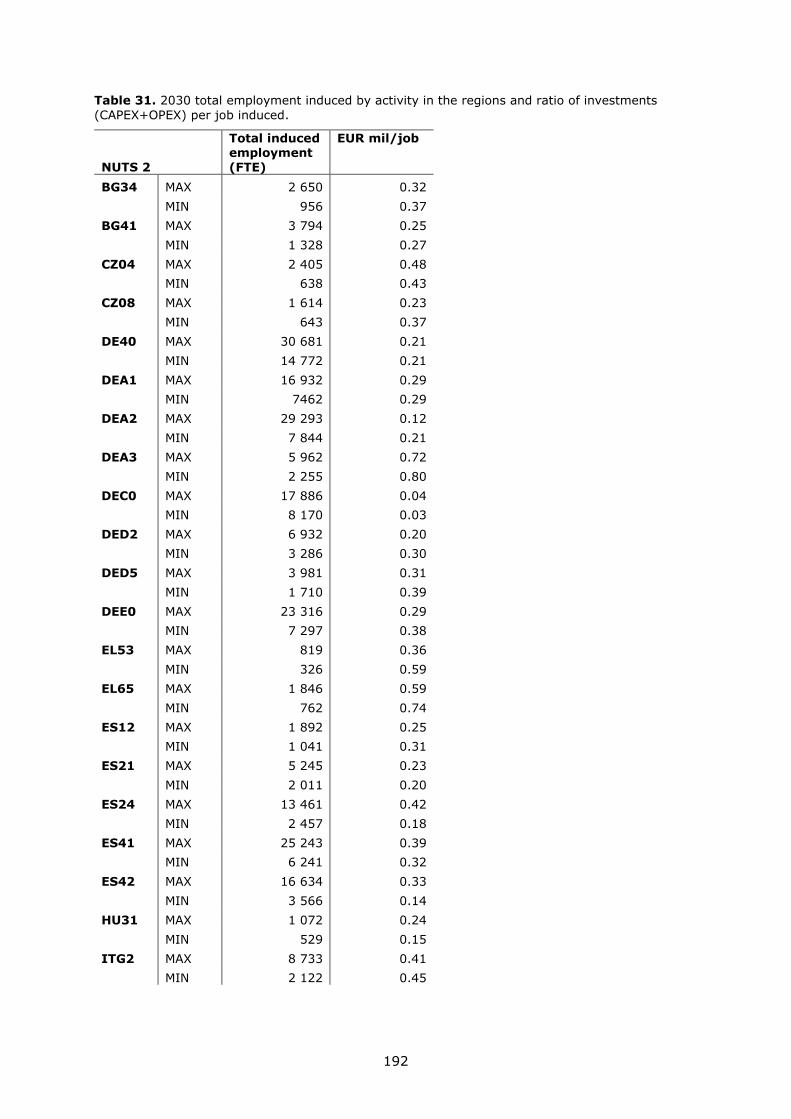
192
Table 31. 2030 total employment induced by activity in the regions and ratio of investments
(CAPEX+OPEX) per job induced.
NUTS 2
Total induced employment (FTE)
EUR mil/job
BG34 MAX 2 650 0.32
MIN 956 0.37
BG41 MAX 3 794 0.25
MIN 1 328 0.27
CZ04 MAX 2 405 0.48
MIN 638 0.43
CZ08 MAX 1 614 0.23
MIN 643 0.37
DE40 MAX 30 681 0.21
MIN 14 772 0.21
DEA1 MAX 16 932 0.29
MIN 7462 0.29
DEA2 MAX 29 293 0.12
MIN 7 844 0.21
DEA3 MAX 5 962 0.72
MIN 2 255 0.80
DEC0 MAX 17 886 0.04
MIN 8 170 0.03
DED2 MAX 6 932 0.20
MIN 3 286 0.30
DED5 MAX 3 981 0.31
MIN 1 710 0.39
DEE0 MAX 23 316 0.29
MIN 7 297 0.38
EL53 MAX 819 0.36
MIN 326 0.59
EL65 MAX 1 846 0.59
MIN 762 0.74
ES12 MAX 1 892 0.25
MIN 1 041 0.31
ES21 MAX 5 245 0.23
MIN 2 011 0.20
ES24 MAX 13 461 0.42
MIN 2 457 0.18
ES41 MAX 25 243 0.39
MIN 6 241 0.32
ES42 MAX 16 634 0.33
MIN 3 566 0.14
HU31 MAX 1 072 0.24
MIN 529 0.15
ITG2 MAX 8 733 0.41
MIN 2 122 0.45
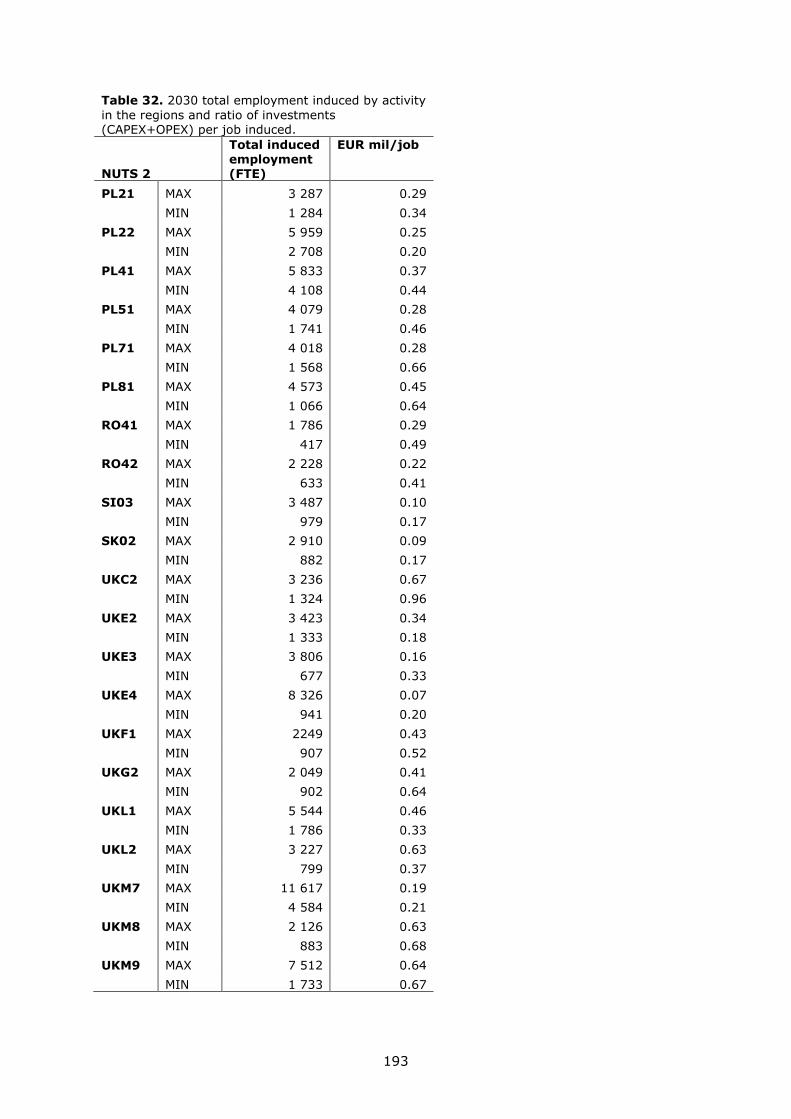
193
Table 32. 2030 total employment induced by activity
in the regions and ratio of investments
(CAPEX+OPEX) per job induced.
NUTS 2
Total induced employment (FTE)
EUR mil/job
PL21 MAX 3 287 0.29
MIN 1 284 0.34
PL22 MAX 5 959 0.25
MIN 2 708 0.20
PL41 MAX 5 833 0.37
MIN 4 108 0.44
PL51 MAX 4 079 0.28
MIN 1 741 0.46
PL71 MAX 4 018 0.28
MIN 1 568 0.66
PL81 MAX 4 573 0.45
MIN 1 066 0.64
RO41 MAX 1 786 0.29
MIN 417 0.49
RO42 MAX 2 228 0.22
MIN 633 0.41
SI03 MAX 3 487 0.10
MIN 979 0.17
SK02 MAX 2 910 0.09
MIN 882 0.17
UKC2 MAX 3 236 0.67
MIN 1 324 0.96
UKE2 MAX 3 423 0.34
MIN 1 333 0.18
UKE3 MAX 3 806 0.16
MIN 677 0.33
UKE4 MAX 8 326 0.07
MIN 941 0.20
UKF1 MAX 2249 0.43
MIN 907 0.52
UKG2 MAX 2 049 0.41
MIN 902 0.64
UKL1 MAX 5 544 0.46
MIN 1 786 0.33
UKL2 MAX 3 227 0.63
MIN 799 0.37
UKM7 MAX 11 617 0.19
MIN 4 584 0.21
UKM8 MAX 2 126 0.63
MIN 883 0.68
UKM9 MAX 7 512 0.64
MIN 1 733 0.67
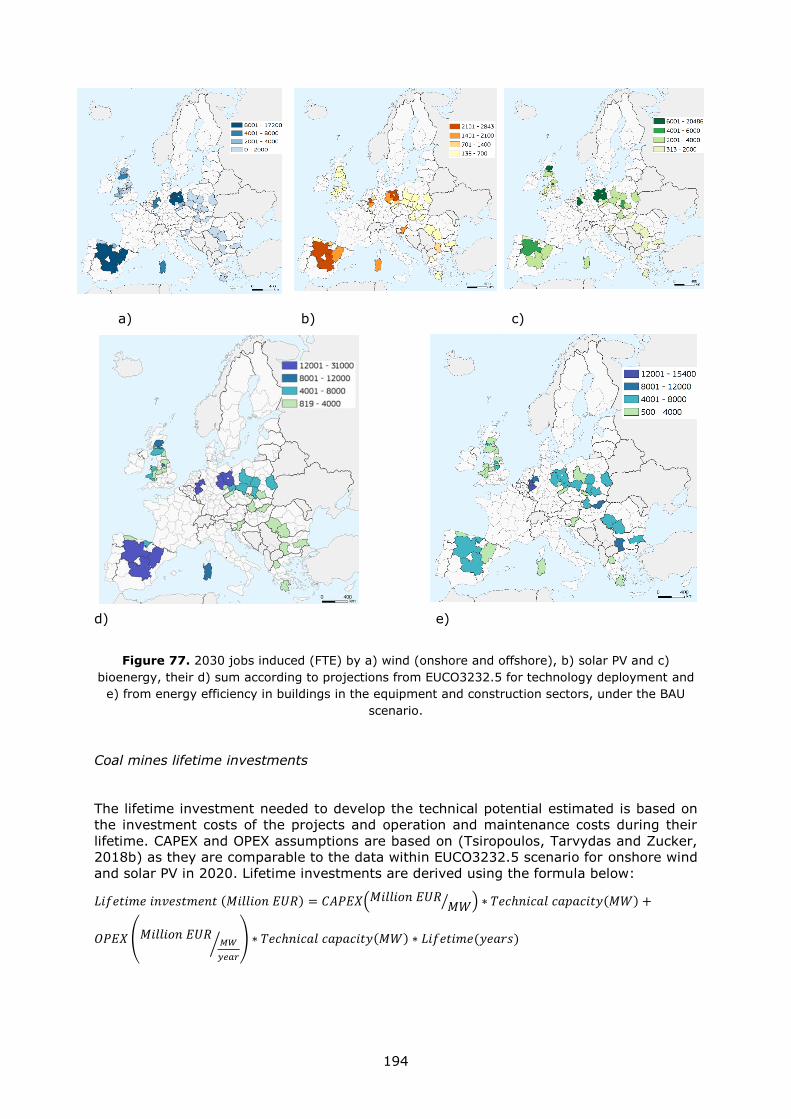
194
a) b) c)
d) e)
Figure 77. 2030 jobs induced (FTE) by a) wind (onshore and offshore), b) solar PV and c)
bioenergy, their d) sum according to projections from EUCO3232.5 for technology deployment and
e) from energy efficiency in buildings in the equipment and construction sectors, under the BAU
scenario.
Coal mines lifetime investments
The lifetime investment needed to develop the technical potential estimated is based on
the investment costs of the projects and operation and maintenance costs during their
lifetime. CAPEX and OPEX assumptions are based on (Tsiropoulos, Tarvydas and Zucker,
2018b) as they are comparable to the data within EUCO3232.5 scenario for onshore wind
and solar PV in 2020. Lifetime investments are derived using the formula below:
𝐿𝑖𝑓𝑒𝑡𝑖𝑚𝑒 𝑖𝑛𝑣𝑒𝑠𝑡𝑚𝑒𝑛𝑡 (𝑀𝑖𝑙𝑙𝑖𝑜𝑛 𝐸𝑈𝑅) = 𝐶𝐴𝑃𝐸𝑋(𝑀𝑖𝑙𝑙𝑖𝑜𝑛 𝐸𝑈𝑅𝑀𝑊⁄ ) ∗ 𝑇𝑒𝑐ℎ𝑛𝑖𝑐𝑎𝑙 𝑐𝑎𝑝𝑎𝑐𝑖𝑡𝑦(𝑀𝑊) +
𝑂𝑃𝐸𝑋 (𝑀𝑖𝑙𝑙𝑖𝑜𝑛 𝐸𝑈𝑅𝑀𝑊
𝑦𝑒𝑎𝑟
⁄ ) ∗ 𝑇𝑒𝑐ℎ𝑛𝑖𝑐𝑎𝑙 𝑐𝑎𝑝𝑎𝑐𝑖𝑡𝑦(𝑀𝑊) ∗ 𝐿𝑖𝑓𝑒𝑡𝑖𝑚𝑒(𝑦𝑒𝑎𝑟𝑠)
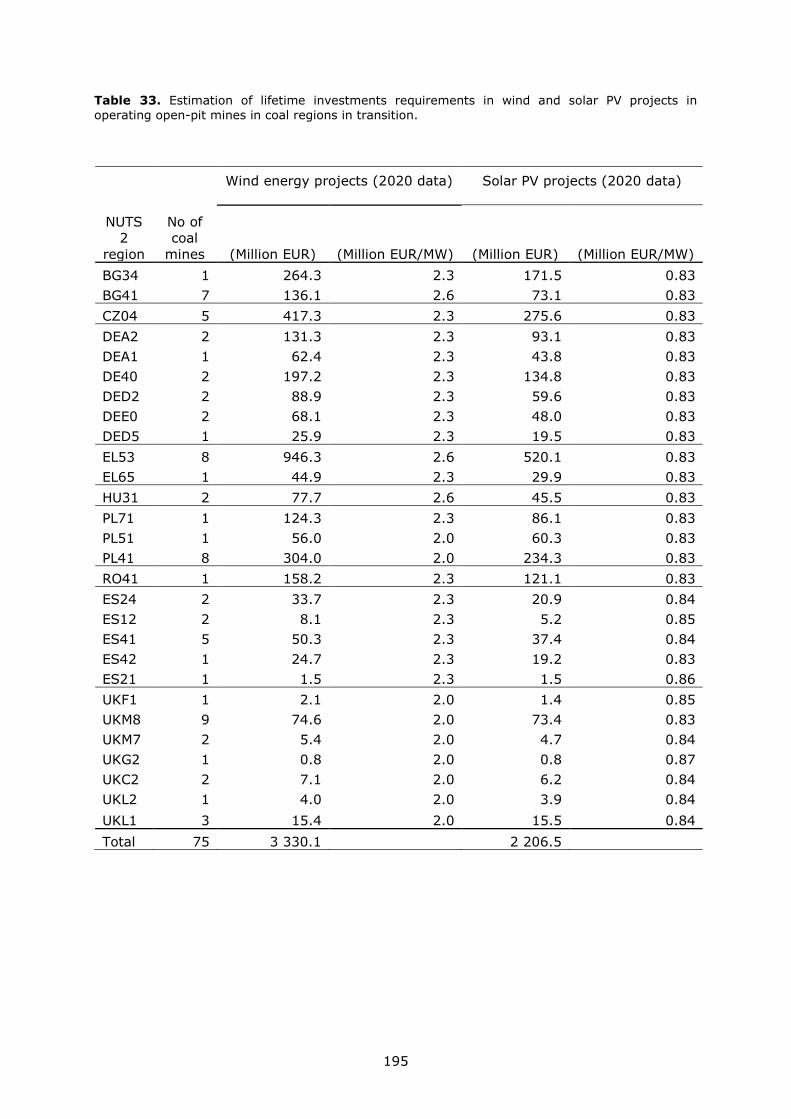
195
Table 33. Estimation of lifetime investments requirements in wind and solar PV projects in
operating open-pit mines in coal regions in transition.
NUTS
2
region
No of
coal
mines
Wind energy projects (2020 data)
Solar PV projects (2020 data)
(Million EUR) (Million EUR/MW) (Million EUR) (Million EUR/MW)
BG34 1 264.3 2.3 171.5 0.83
BG41 7 136.1 2.6 73.1 0.83
CZ04 5 417.3 2.3 275.6 0.83
DEA2 2 131.3 2.3 93.1 0.83
DEA1 1 62.4 2.3 43.8 0.83
DE40 2 197.2 2.3 134.8 0.83
DED2 2 88.9 2.3 59.6 0.83
DEE0 2 68.1 2.3 48.0 0.83
DED5 1 25.9 2.3 19.5 0.83
EL53 8 946.3 2.6 520.1 0.83
EL65 1 44.9 2.3 29.9 0.83
HU31 2 77.7 2.6 45.5 0.83
PL71 1 124.3 2.3 86.1 0.83
PL51 1 56.0 2.0 60.3 0.83
PL41 8 304.0 2.0 234.3 0.83
RO41 1 158.2 2.3 121.1 0.83
ES24 2 33.7 2.3 20.9 0.84
ES12 2 8.1 2.3 5.2 0.85
ES41 5 50.3 2.3 37.4 0.84
ES42 1 24.7 2.3 19.2 0.83
ES21 1 1.5 2.3 1.5 0.86
UKF1 1 2.1 2.0 1.4 0.85
UKM8 9 74.6 2.0 73.4 0.83
UKM7 2 5.4 2.0 4.7 0.84
UKG2 1 0.8 2.0 0.8 0.87
UKC2 2 7.1 2.0 6.2 0.84
UKL2 1 4.0 2.0 3.9 0.84
UKL1 3 15.4 2.0 15.5 0.84
Total 75 3 330.1 2 206.5

GETTING IN TOUCH WITH THE EU
In person
All over the European Union there are hundreds of Europe Direct information centres. You can find the
address of the centre nearest you at: https://europa.eu/european-union/contact_en
On the phone or by email
Europe Direct is a service that answers your questions about the European Union. You can contact this
service:
- by freephone: 00 800 6 7 8 9 10 11 (certain operators may charge for these calls),
- at the following standard number: +32 22999696, or
- by electronic mail via: https://europa.eu/european-union/contact_en
FINDING INFORMATION ABOUT THE EU
Online
Information about the European Union in all the official languages of the EU is available on the Europa
website at: https://europa.eu/european-union/index_en
EU publications
You can download or order free and priced EU publications from EU Bookshop at:
https://publications.europa.eu/en/publications. Multiple copies of free publications may be obtained by
contacting Europe Direct or your local information centre (see https://europa.eu/european-
union/contact_en).
KJ-N
A-2
9895-E
N-N
doi:10.2760/063496
ISBN 978-92-76-12330-9