Embed Size (px)
Citation preview

University
AndreSchoo
Georgia StateUniversity
International Studies Program
Efficiency Effects of Mexico's Tax Reform onCorporate Capital Investment
Duanjie ChenJorge Martinez-Vazquez
Working Paper 03-08March 2003
w Youngl of Policy Studies


International Studies Program Andrew Young School of Policy Studies Georgia State University Atlanta, Georgia 30303 United States of America Phone: (404) 651-1144 Fax: (404) 651-3996 Email: [email protected] Internet: http://isp-aysps.gsu.edu Copyright 2001, the Andrew Young School of Policy Studies, Georgia State University. No part of the material protected by this copyright notice may be reproduced or utilized in any form or by any means without prior written permission from the copyright owner.
Efficiency Effects of Mexico’s Tax Reform on Corporate Capital Investment Working Paper 03-08 Duanjie Chen Jorge Martinez-Vazquez March 2003

International Studies Program Andrew Young School of Policy Studies The Andrew Young School of Policy Studies was established at Georgia State University with the objective of promoting excellence in the design, implementation, and evaluation of public policy. In addition to two academic departments (economics and public administration), the Andrew Young School houses seven leading research centers and policy programs, including the International Studies Program. The mission of the International Studies Program is to provide academic and professional training, applied research, and technical assistance in support of sound public policy and sustainable economic growth in developing and transitional economies. The International Studies Program at the Andrew Young School of Policy Studies is recognized worldwide for its efforts in support of economic and public policy reforms through technical assistance and training around the world. This reputation has been built serving a diverse client base, including the World Bank, the U.S. Agency for International Development (USAID), the United Nations Development Programme (UNDP), finance ministries, government organizations, legislative bodies and private sector institutions. The success of the International Studies Program reflects the breadth and depth of the in-house technical expertise that the International Studies Program can draw upon. The Andrew Young School's faculty are leading experts in economics and public policy and have authored books, published in major academic and technical journals, and have extensive experience in designing and implementing technical assistance and training programs. Andrew Young School faculty have been active in policy reform in over 40countries around the world. Our technical assistance strategy is not to merely provide technical prescriptions for policy reform, but to engage in a collaborative effort with the host government and donor agency to identify and analyze the issues at hand, arrive at policy solutions and implement reforms. The International Studies Program specializes in four broad policy areas:
Fiscal policy, including tax reforms, public expenditure reviews, tax administration reform Fiscal decentralization, including fiscal decentralization reforms, design of intergovernmental
transfer systems, urban government finance Budgeting and fiscal management, including local government budgeting, performance-based
budgeting, capital budgeting, multi-year budgeting Economic analysis and revenue forecasting, including micro-simulation, time series
forecasting, For more information about our technical assistance activities and training programs, please visit our website at http://isp-aysps.gsu.edu or contact us by email at [email protected].

1
Efficiency Effects of Mexico’s Tax Reform On
Corporate Capital Investment
Duanjie Chen and Jorge Martinez-Vazquez On January 1 2002 the Mexican Congress approved the 2002 budget, ratifying a US $ 7.5 billion tax package, which included a new Income Tax Law. This tax package reflected a second attempt by President Vicente Fox’s government at comprehensive tax reform in Mexico during 2001. The first tax reform package presented to Congress in April 2001 had a more ambitious revenue goal of US $13 billion.
Besides increasing the efficiency of the tax system, the goal of the tax reform packages was to generate sufficient revenues to expand the provision of social services to protect the poor and for investment in basic infrastructure. The original, April 2001, package had several main components. These included lower personal and corporate income tax rates, elimination of special treatments and loopholes in the income tax and VAT, higher excise taxes, and removal of the exemptions for food and medicine, which would be taxed at the regular rate of 15 percent. The package, especially the proposal to tax food and medicines, led to significant political turmoil and it was rejected by the opposition parties in Congress for being unfair to the poor.
Although the core of the reform proposals to the VAT proposed by the Fox Administration in April 2001 were omitted from the approved version, the important reforms proposed regarding corporate income were included in the final version approved 1 January 2002. These reforms to the corporate income tax covered a variety of issues (rate reduction, elimination of special regimes, spending for new investments outside the large cities, and so on). The main objective behind the reform of the corporate income tax was to introduce a more neutral tax and therefore enhance the overall efficiency of the tax system. The reform of the corporate income tax was not expected to yield significant changes in either revenue collections or the distribution of tax burdens.
International Studies Program Working Paper Series 2
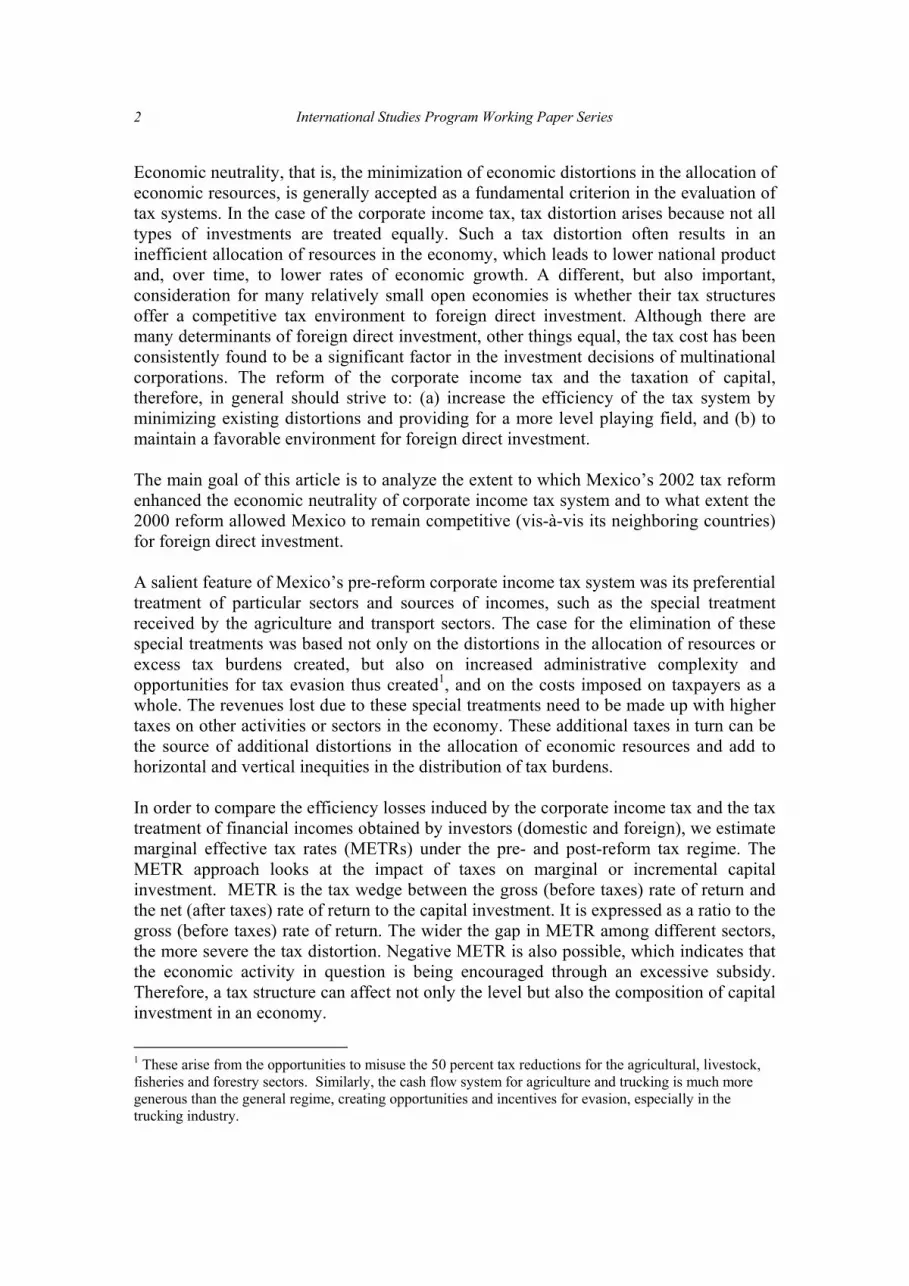
Economic neutrality, that is, the minimization of economic distortions in the allocation of economic resources, is generally accepted as a fundamental criterion in the evaluation of tax systems. In the case of the corporate income tax, tax distortion arises because not all types of investments are treated equally. Such a tax distortion often results in an inefficient allocation of resources in the economy, which leads to lower national product and, over time, to lower rates of economic growth. A different, but also important, consideration for many relatively small open economies is whether their tax structures offer a competitive tax environment to foreign direct investment. Although there are many determinants of foreign direct investment, other things equal, the tax cost has been consistently found to be a significant factor in the investment decisions of multinational corporations. The reform of the corporate income tax and the taxation of capital, therefore, in general should strive to: (a) increase the efficiency of the tax system by minimizing existing distortions and providing for a more level playing field, and (b) to maintain a favorable environment for foreign direct investment. The main goal of this article is to analyze the extent to which Mexico’s 2002 tax reform enhanced the economic neutrality of corporate income tax system and to what extent the 2000 reform allowed Mexico to remain competitive (vis-à-vis its neighboring countries) for foreign direct investment. A salient feature of Mexico’s pre-reform corporate income tax system was its preferential treatment of particular sectors and sources of incomes, such as the special treatment received by the agriculture and transport sectors. The case for the elimination of these special treatments was based not only on the distortions in the allocation of resources or excess tax burdens created, but also on increased administrative complexity and opportunities for tax evasion thus created1, and on the costs imposed on taxpayers as a whole. The revenues lost due to these special treatments need to be made up with higher taxes on other activities or sectors in the economy. These additional taxes in turn can be the source of additional distortions in the allocation of economic resources and add to horizontal and vertical inequities in the distribution of tax burdens. In order to compare the efficiency losses induced by the corporate income tax and the tax treatment of financial incomes obtained by investors (domestic and foreign), we estimate marginal effective tax rates (METRs) under the pre- and post-reform tax regime. The METR approach looks at the impact of taxes on marginal or incremental capital investment. METR is the tax wedge between the gross (before taxes) rate of return and the net (after taxes) rate of return to the capital investment. It is expressed as a ratio to the gross (before taxes) rate of return. The wider the gap in METR among different sectors, the more severe the tax distortion. Negative METR is also possible, which indicates that the economic activity in question is being encouraged through an excessive subsidy. Therefore, a tax structure can affect not only the level but also the composition of capital investment in an economy.
1 These arise from the opportunities to misuse the 50 percent tax reductions for the agricultural, livestock, fisheries and forestry sectors. Similarly, the cash flow system for agriculture and trucking is much more generous than the general regime, creating opportunities and incentives for evasion, especially in the trucking industry.

Efficiency Effects of Mexico’s Tax Reform on Corporate Capital Investment
3
The marginal effective tax rate (METR) analysis in our study has two focuses. First, we ask the question of whether or not Mexico’s tax reform reduces the cross-sector tax distortions under the pre-reform tax system. For this purpose, a METR comparison between the pre- and post-reform tax structure is presented for domestic firms. Second, we examine Mexico’s tax competitiveness vis-à-vis four other Latin American countries in attracting foreign investment, mainly those from the US.2 The four other Latin American countries include Argentina, Brazil, Chile and Peru. For the analysis focusing on the domestic cross-sector tax distortion, METR simulations are conducted for a broad range of industries including agriculture, manufacturing, construction, transportation and storage, communication, public utility, wholesale trade, retail trade and the other services sectors. The simulations also reveal the impact of alleviation of preferential treatments for primary sectors and changes in taxing small- to medium-sized owner-operated firms, both of which are brought up by the tax reform. For the analysis focusing on the cross-border tax competitiveness, the METR simulations cover only the manufacturing and service sectors, because these are the main destination of foreign direct investment. Assuming that multinational firms in these sectors are generally large and located in major industrial areas, these simulations do not include any special tax treatment for small to medium taxpayers or any tax provisions for underdeveloped regions. Because debt-financed investments and equity-financed investments are treated differently in the tax laws, METR simulations are sensitive to the assumptions on the financial structure of investments. To focus on the cross-sector and cross-border tax comparison, the financing structure for all simulations, unless otherwise noted, will be assumed to be a combination of 40 percent debt and 60 percent equity. I. A comparison of tax impact on domestic capital investment under the pre- and post-reform tax regimes The recent tax reform relating to corporate capital investment is focused on improving both the efficiency and simplicity of Mexico’s tax system. The most important reforms incorporated into our METRs calculations include the following:
• The elimination of 5-percentage point deferral (for profit distribution) in corporate income tax collection.
• The elimination of withholding tax on dividends and the gross-up taxing scheme. • The elimination of preferential cash-flow tax regime for the primary sector,
mainly agriculture and ground transportation industries. • The replacement of the progressive scheme of presumptive tax applied to small
owner-operated taxpayers by a single rate of 1%. In the meantime, the maximum revenue for defining small taxpayers is reduced to 1 million pesos of annual gross income.
2 The international comparison builds on Bird and Chen (2000).

International Studies Program Working Paper Series 4
• The creation of a new category of corporate taxpayers identified as medium owner-operated taxpayers with up to 4 million pesos of annual gross income. The cash-flow regime currently applied to the primary sector is now available to this category of taxpayers.
• The new authority given to the states in taxing small to medium owner-operated taxpayers. More specifically, the state governments are allowed to levy an additional presumptive tax up to 2 percent on small owner-operated taxpayers; they may also collect a surtax of up to 5 percent on the CIT payable by the medium owner-operated taxpayers.
• The two major changes in personal income taxes (PIT) on financial investment. First, the 24 percent withholding tax on interest income, which acts as a final tax under the current system, will become a true withholding part of a global PIT, where interest income is added to all other types of income to compute the taxpayer’s final liability. Thus, under the post-reform regime, interest income is now taxed as regular income and subject to the progressive PIT rate structure (3% - 35%). Second, under the pre-reform system, gains from selling publicly traded stocks are exempted. The reform eliminates this exemption. For our METR simulation, the 35 percent PIT rate is used for both capital gains and interest income under the post-reform tax system with the assumption that all of the financial investments are made by upper-income people and, hence, subject to the highest marginal PIT rate.
Our METR simulations for domestic capital investment start with the general corporate METR. The goal is to illustrate the impact of tax reform at the firm’s level (Table 1, 2a and 2b). Then we present a simulation for integrated METR that combines taxes on capital at both firm level and personal level (Table 3a and 3b). Finally, we present the corporate METRs for the tax regimes for small to medium owner-operated firms (Table 4). 1. A general comparison by industry: the current vs. the proposed tax structures The computed general corporate METRs on domestic capital investment are presented in Table 1. These computations exclude the small to medium owner-operated firms. The simulations for the pre-reform tax structure take into account the cash-flow tax regime for the primary sectors including agriculture and the ground transportation sectors. In contrast, the simulations for the post-reform tax regime eliminate the cash flow provision for these sectors. For the agricultural and publishing sectors, however, the computations for the pre- and post-reform tax structure also take into account the 50 percent reduction in the CIT rate. Furthermore, as mentioned above, with the proposed elimination of the CIT deferral for dividends distribution, corporate taxpayers will have to pay the standard CIT rate of 35 percent regardless of their decision on the distribution of profits. In contrast, under the pre-reform tax system, the actual CIT rate may be well below 35

Efficiency Effects of Mexico’s Tax Reform on Corporate Capital Investment
5
percent as long as there is no full distribution.3 However, due to the disallowance for the mandatory employee profit sharing (which we assumed to be at the minimum 10 percent)4, the effective CIT rate on taxable income net of profit shared with employees could be higher than 35 percent. Therefore, the CIT rate used for simulating the pre- and post-reform system will be 35.6 percent and 38.9 percent respectively. 5 Three important observations can be drawn form Table 1.
• First, the METRs are roughly the same between the pre- and post-reform tax system. The only exceptions are for the agricultural and transportation industries for which post-reform METR is significantly higher than the pre-reform one. This is mainly a result of the elimination of cash-flow regime for both industries.
• Second, it is noteworthy that METR for the transportation industry under the pre-
reform system is negative, which implies an excessive tax subsidy for this industry. This is mainly because depreciable assets such as buildings, machinery and equipment (e.g. motor vehicles) account for almost 90 percent of the total capital invested in the transportation industry. Under the cash-flow regime, depreciable assets can be fully written off before calculating any income tax, which, combined with other tax allowance (e.g. interest deduction), may entail a total write off for the transportation industry well above 100 percent of income generated from capital investment for a long period.
• Third, the most important result is that the inter-sector tax distortion, as measured
by the inter-sector METR dispersion, will be significantly reduced by the tax reform.6 This is mainly a result of eliminating the cash-flow regime favoring only the primary sectors including agriculture and the ground transportation sector.
In summary, the recent tax reform in Mexico will substantially alleviate the tax distortion which existed within the previous tax regime. As a result, the tax reform will help increase efficiency in the allocation of resources and the prospects for growth in the Mexican economy.
3 Assuming that the average rate for profit distribution is 40%, a 32% (=30%+5% x 40%) CIT rate is used in our simulation for the pre-reform system. Of course, the actual CIT rate may differ across taxpayers depending on the distribution portion. 4 Actually, the tax deductability of the profit-sharing distribution to workers was made conditional on favorable macro-economic outcomes, including economic growth. Since the favorable macro-economic outcomes never happened in 2002, deductability has not taken effect yet. 5 Refer to footnote 3. By applying 32% CIT on the taxable income net of the 10% profit shared with the employees, which is not deductible for tax purposes, the effective CIT rate is 35.6% (=32%/(1-10%)) for the pre-reform METR simulation. Similarly, the effective CIT rate is 38.9% (=35%/(1-10%)) for the post-reform METR simulation. 6 The inter-sector METR dispersion coefficient is the weighted average of the standard deviation of METR by type of assets across industry. It is estimated as
σ = Σj wj {Σi wij (tij - tj )2}1/2 where tij is the effective tax rate on asset j for industry i, and tj is the average effective tax rate for asset j across all industries.

International Studies Program Working Paper Series 6
2. A more detailed comparison across industries by type of assets The computations for the METRs by economic sector can hide significant differences in the tax treatment of different types of assets within each sector. Table 2a and 2b (detailed breakdowns of Table 1) provide corporate METR simulation by industry and by asset type. There are three major findings from Tables 2a and 2b.
• First, on average, machinery is the lowest taxed asset, followed by buildings, while land is the highest taxed asset, followed by inventory. This is mainly because the tax law entitles enterprises to a general tax depreciation allowance for machinery that surpasses its economic depreciation rate. In contrast, land, as a non-depreciable asset, incurs financing cost indefinitely and is subject to both property transfer tax and property tax. It should be also noted that the tax adjustment for inflation may benefit investment in depreciable assets more than investment on non-depreciable ones. There are two offsetting effects here. First, due to the inflation adjustment, only real interest cost rather than nominal interest cost is deductible for the income tax purpose. This makes the interest deduction less generous, which may affect non-depreciable assets more than depreciable assets. Second, the ability to recognize the inflationary impact on the value of depreciable assets implies a more generous tax depreciation allowance than that without the inflation adjustment. Overall, the investment in depreciable assets may gain more tax benefits than investment in non-depreciable assets.
• Second, while METRs for non-depreciable assets (inventory and land) are the
same across industries, METRs for depreciable assets (buildings and machinery) vary significantly across industries. This is because the only non-tax cost for non-depreciable assets is the financing cost, and the tax wedge between the before- and after-tax financing cost of capital is the same across industries. For depreciable assets, there is an additional non-tax cost, i.e. economic depreciation cost. This economic depreciation cost (and the tax depreciation allowance) varies by industry. As a result, the tax wedge between the before- and the after-tax cost of capital for depreciable assets varies by industry.
• Third, METRs for all types of assets would be slightly different between the pre-
and post-reform tax system. The exceptions are the agricultural and transportation industries. This observation is consistent with that from Table 1, where METRs by industry, without a breakdown by type of asset, are compared.
In summary, although the differential treatment of different types of assets within industries will remain under the post-reform tax system, the METRs for all types of assets would be generally lower under the post-reform system compared to the previous one. This, combined with the elimination of the cash-flow regime favoring only the primary sectors, should also help to reduce distortions in investment decisions and improved efficiency in the allocation of resources.

Efficiency Effects of Mexico’s Tax Reform on Corporate Capital Investment
7
3. The impact of financing structure Debt-financed and equity-financed investments are not treated the same by the tax laws. The impacts of varying financing structures on METRs are illustrated in Tables 3a and 3b. The METRs in these two tables integrate taxes on capital income payable at both the corporate and the personal level. As mentioned above, the tax deductibility of borrowing costs may benefit firms with higher levels of borrowing. However, this imbalance in the tax treatment of debt and equity financing may be alleviated by properly taxing interest and equity income at the personal level. As table 3a shows, under the pre-reform tax system, the gap in METR between pure debt financing (at 100 percent debt) and pure equity financing (at 100 percent equity) is about 12 percentage points (19 percent versus 31 percent). In contrast, as shown in Table 3b, the imbalance in taxing debt financing and equity financing will be largely eliminated after the tax reform. This is mainly because interest income under the pre-reform tax system was taxed at 24 percent, which was much lower than the PIT rate (up to 40 percent) applicable to high-income taxpayers. Under the post- reform system, the interest income is taxed as regular income and subject to the much higher PIT rate for high-income taxpayers. In summary, the distortions in investment decisions under the pre-reform tax regime associated with the differentiated tax treatment of interest and equity income are largely eliminated by the tax reform. This again should contribute significantly to improving efficiency in the allocation of resources and investment decisions by investors, leading to better prospects for growth in the Mexican economy. 4. METRs for small to medium owner-operated taxpayers Both pre- and post-reform tax regimes make special provisions for small taxpayers. Table 4 provides METR simulations for the pre- and post-reform tax structures applicable for small to medium owner-operated firms. It should be borne in mind that although our simulations are conducted for all industries, the computations might not be relevant for some industries that have very few owner-operated firms (e.g. manufacturing, communication, and public utilities). Therefore, direct observations from the table should not be taken at face value without further checking out the relevance of the results to actual practice. The five cases presented in the table are all for owner-operated firms. A simplified categorization for these five cases, by total revenue and by tax provisions, is as follows:7 7 Under the pre-reform tax system, corporate taxpayers with an annual gross income below 2.2 million pesos are subject to a simplified presumptive tax with a progressive rate scheme between 0.25 - 2.5%. Our simulation is conducted for only the lowest (0.25%) and the highest (2.5%) rate. For the post-reform tax system, our simulation is conducted for small and medium owner-operated firms respectively. For small firms, a 1% presumptive tax would be levied at the national level and up to 2% additional levy would be allowed at the state level. For medium owner-operated firms with gross revenue between 1 and 4 million pesos, the cash-flow regime would be applied as a simplified tax provision, and states would be allowed to add up to a 5% surcharge on the federal income tax.

International Studies Program Working Paper Series 8
Total revenue Tax regime Pre-reform small (1): under 1 million pesos Presumptive tax of 0.25% Pre-reform small (2): 1-2.2 million pesos Presumptive tax of 2.5% Post-reform small: under 1 million pesos Presumptive tax of 1%+2% surcharge Pre-reform medium: above 2.2 million pesos General tax regime Post-reform medium: between 1 – 4 million pesos Cash-flow/35% CIT + 5% surcharge
Considering some overlapping between the small and the medium cases because of the changing classification included in the tax reform package, we present both small cases and medium cases in Table 4. More specifically, firms with total revenue between 1 and 2.2 million pesos taxed as small firms under the pre-reform system are now taxed as medium firms under the post-reform tax system. Furthermore, under the pre-reform tax system, firms with total revenue above 2.2 million pesos are taxed under the general tax regime. Under the post-reform tax regime, the latter firms would be taxed on a cash-flow basis but subject to a higher CIT rate due to the state surcharge. Three main observations may be drawn from Table 4.
• First, the reforms, including those made for the state levies, would certainly
increase METR on small sized firms. On average, should the states levy a full 2 percent presumptive tax, firms with total revenue under 1 million pesos could be taxed 6 percentage points higher at the margin compared to that under the pre-reform tax system.
• Second, owner-operated taxpayers with total revenue between 1-2.2 million pesos will be better off under the post-reform tax system. More specifically, this group of taxpayers, defined as small taxpayers by the pre-reform tax code, will be better off by being qualified as medium firms under the post-reform system to enjoy the cash-flow tax treatment. The estimated reduction in METR for this group of firms is up to 5.5 percentage points in METR (10.7 percent versus 5.6 percent).
• Third, owner-operated firms with total revenue under 4 million but above 2.2 million pesos will also be better off under the post-reform system. This group of taxpayers was previously taxed under the general tax regime and is now taxed under the cash-flow regime. As a result, METR incurred by this group could drop by about 11 percentage points (16.3 percent versus 5.6 percent).
The above observations require some further consideration. Small firms with total revenue under 1 million pesos will face a significant tax disadvantage compared with other owner-operated firms with higher revenues. To simplify the tax administration and improve the economic efficiency, it might be more appropriate to treat all the small- and medium-sized owner-operated firms equally in terms of taxing method and tax rate. One of the options could be taxing all these firms by levying a standardized presumptive tax rate (e.g. 1 percent at the federal level and up to 2 percent at the state level). Under this option the METR for all the small- to medium-sized owner-operated firms would be the same, at about 12 percent, which would be slightly higher than the current high-end METR for small firms (10.7 percent) and significantly lower than METR resulting from the current general tax regime (16.3 percent).

Efficiency Effects of Mexico’s Tax Reform on Corporate Capital Investment
9
II. Tax impact on foreign capital investment: Will Mexico remain internationally competitive?
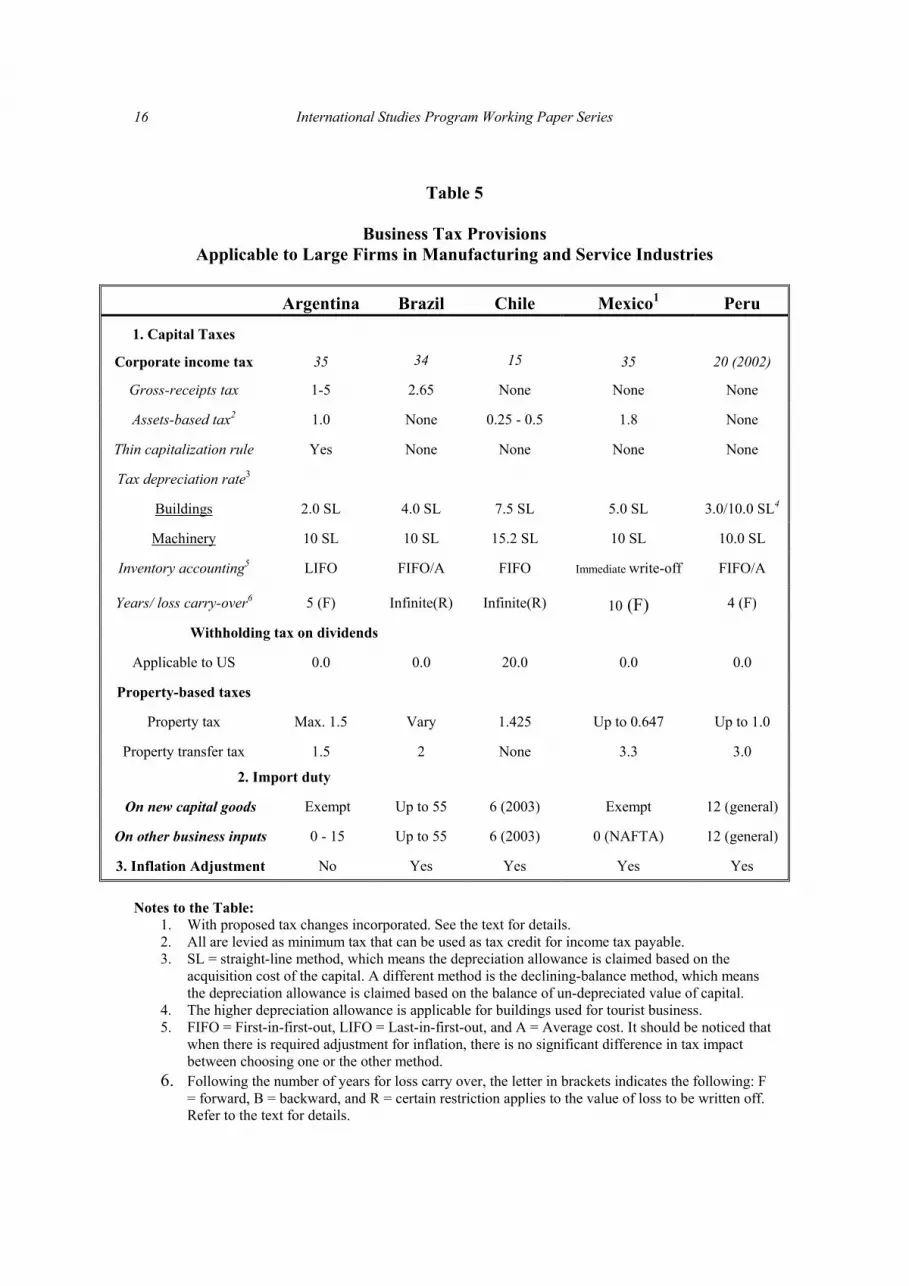
An important question on the tax reform is how it will affect Mexico’s competitiveness to attract foreign direct investment, in particular from the United States. To answer this question we simulate METRs for foreign capital investment in Mexico and in four other Latin American countries, Argentina, Brazil, Chile and Peru. Each of these countries, of course, has its different tax system. Table 5 provides a summarized comparison in statutory tax provisions in the five countries (including Mexico) that may affect foreign capital investment. It should be noticed that the information provided in the table has incorporated the post-reform tax system in Mexico as well as planned tax changes in Chile and Peru. For example, Chile started lowering its import duty since 1999 by 1 percentage point per year. As a result, its import duty has been lowered to 6% in 2003 from 11% in 1998. In the case of Peru, the CIT has been lowered from 30 percent to 20 percent in 20028. As Table 5 shows, Mexico’s CIT rate is the same as that of Argentina and higher than those of other countries under comparison. However, unlike Argentina and Brazil, Mexico does not impose any gross receipts tax. Furthermore, Mexico is more generous in the tax allowance for building depreciation than Argentina and Brazil. Mexico also appears to have the lowest property tax rate compared to all the other countries. In addition, Mexico, along with Argentina, exempts new capital goods from import duty. Finally, with NAFTA, Mexico has no import duty on any production input imported from the US and Canada.9 It is interesting to note that Chile has the lowest CIT rate among the five countries and is the only country that does not impose any tax on property transfers. However, Chile is also the only country that collects withholding tax on dividends distributed to US residents. Another noteworthy fact is Peru’s on-going reforms. As mentioned, the CIT rate in Peru has been lowered to 20 percent in 2002, which is the second lowest among the five countries. The most burdensome tax systems appear to be in Argentina and Brazil, with the relatively high CIT rate, the rather high gross-receipts tax, the least generous tax depreciation allowance, and the relatively high property taxes. Due to the lack of data, we have to make several assumptions for our cross-country METR calculations. First, except for Chile where property tax is levied by the central government at a standard rate, the maximum property tax rate shown in Table 5 is used for our calculation. In the case of Brazil, there is no estimate available for maximum or average property tax rate; an arbitrary rate of 1.5% is used for our calculations. Second, import duty often varies across commodities; there is no estimate of precise rate for any countries. Therefore, 50% of the upper end rate shown in Table 5 is used for all countries but Brazil. The rate is applied to machinery and equipment as well as inventory assuming that only half of capital and materials (inventory) inputs for carrying out any business are imported. In the case of Brazil, an arbitrary rate of 5.5% is used for our calculation. 8 Before 2002, the lower CIT rate of 20 percent was applicable to profits reinvested in domestic productive activities. 9 Actually, the liberalization of tariffs started in 1994 and will not be completed until 2009. There are some items that will never be fully liberalized.
International Studies Program Working Paper Series 10
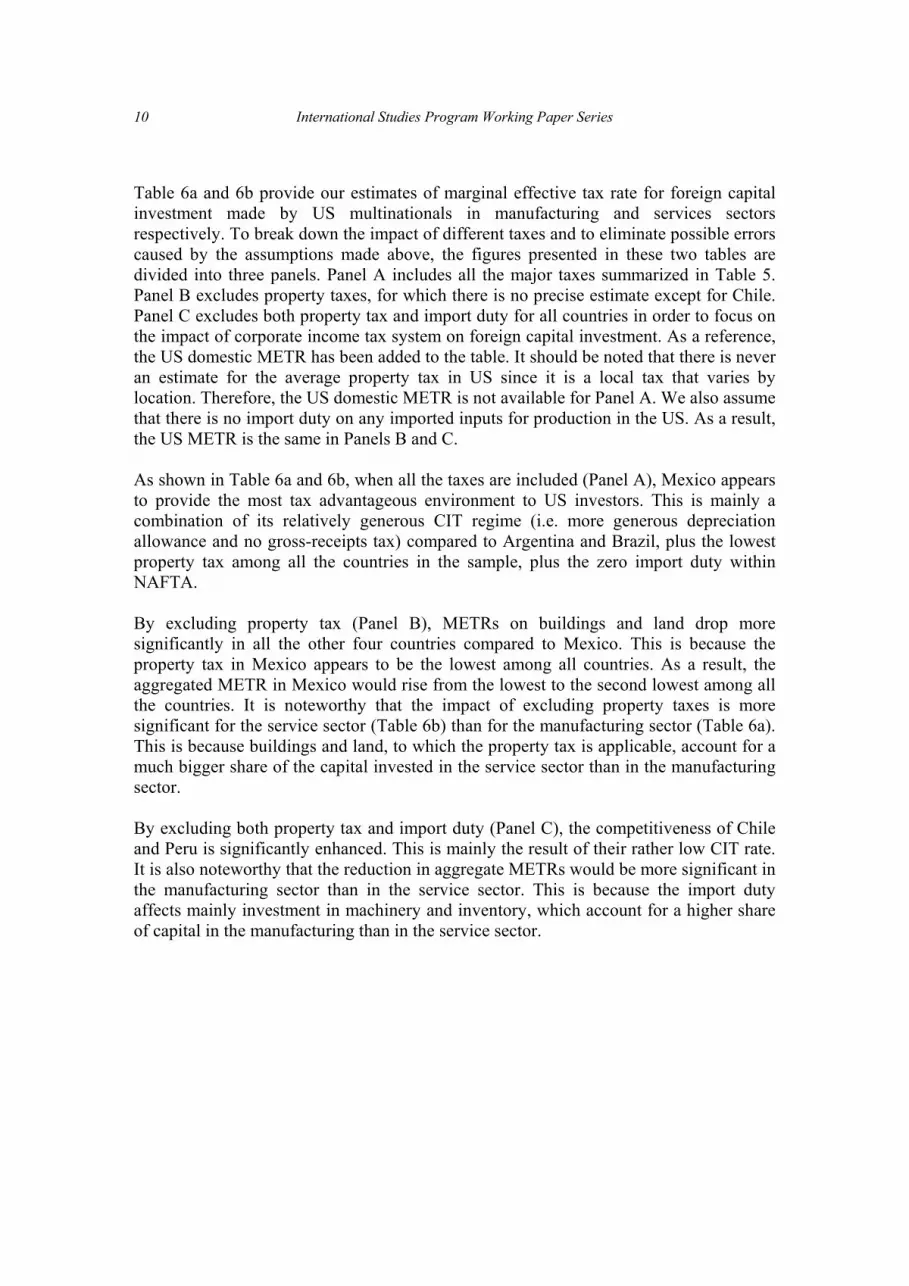
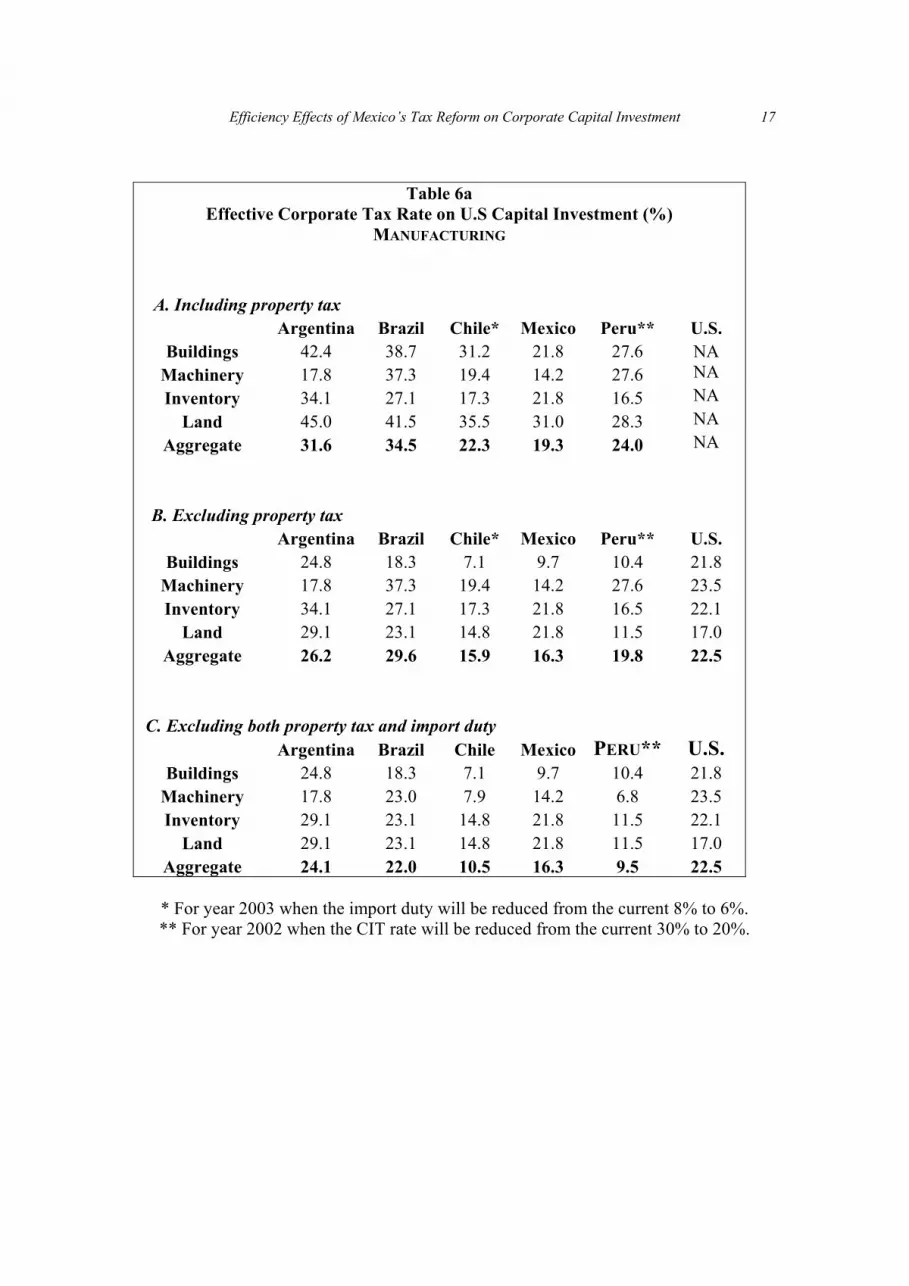
Table 6a and 6b provide our estimates of marginal effective tax rate for foreign capital investment made by US multinationals in manufacturing and services sectors respectively. To break down the impact of different taxes and to eliminate possible errors caused by the assumptions made above, the figures presented in these two tables are divided into three panels. Panel A includes all the major taxes summarized in Table 5. Panel B excludes property taxes, for which there is no precise estimate except for Chile. Panel C excludes both property tax and import duty for all countries in order to focus on the impact of corporate income tax system on foreign capital investment. As a reference, the US domestic METR has been added to the table. It should be noted that there is never an estimate for the average property tax in US since it is a local tax that varies by location. Therefore, the US domestic METR is not available for Panel A. We also assume that there is no import duty on any imported inputs for production in the US. As a result, the US METR is the same in Panels B and C. As shown in Table 6a and 6b, when all the taxes are included (Panel A), Mexico appears to provide the most tax advantageous environment to US investors. This is mainly a combination of its relatively generous CIT regime (i.e. more generous depreciation allowance and no gross-receipts tax) compared to Argentina and Brazil, plus the lowest property tax among all the countries in the sample, plus the zero import duty within NAFTA. By excluding property tax (Panel B), METRs on buildings and land drop more significantly in all the other four countries compared to Mexico. This is because the property tax in Mexico appears to be the lowest among all countries. As a result, the aggregated METR in Mexico would rise from the lowest to the second lowest among all the countries. It is noteworthy that the impact of excluding property taxes is more significant for the service sector (Table 6b) than for the manufacturing sector (Table 6a). This is because buildings and land, to which the property tax is applicable, account for a much bigger share of the capital invested in the service sector than in the manufacturing sector. By excluding both property tax and import duty (Panel C), the competitiveness of Chile and Peru is significantly enhanced. This is mainly the result of their rather low CIT rate. It is also noteworthy that the reduction in aggregate METRs would be more significant in the manufacturing sector than in the service sector. This is because the import duty affects mainly investment in machinery and inventory, which account for a higher share of capital in the manufacturing than in the service sector.

Efficiency Effects of Mexico’s Tax Reform on Corporate Capital Investment
11
III. Conclusion In summary, the recent tax reform in Mexico, when fully implemented, will significantly reduce the inter-sector tax distortion for domestic firms. The previous imbalance between taxing debt financing and equity financing will also be largely eliminated. The major concern arising from our simulations is for the tax treatment of small and medium size owner-operated firms. In several sectors the medium-sized firms can now enjoy more favorable treatment than the small firms. Since small firms have the option to take the medium-size regime, some might do so despite the extra expense to keep the basic accounting data required to enjoy the cash-flow tax treatment. For foreign investors, particularly multinational firms from the US, tax reform in Mexico does not seem to weaken its tax competitiveness vis-à-vis four other major Latin America countries.

International Studies Program Working Paper Series 12
Table 1 Effective Corporate Tax Rate on the Domestic Capital Investment
For General Tax Regime, pre-reform vs. post-reform With 40% debt and 60% equity financing
Difference Pre-reform Post-reform (In % points)
Agriculture*† 8.8 12.0 3.2 Manufacturing 20.1 20.3 0.1 Construction 22.8 23.2 0.4
Transportation* -8.9 15.0 23.9 Communications 16.7 16.1 -0.7
Public Utility 19.7 19.4 -0.3 Wholesale Trade 21.9 22.3 0.4
Retail Trade 22.9 23.4 0.5 Other Services 22.4 22.5 0.1
Inter-sector dispersion 5.5 2.7 -2.9 * Entitled to the cash-flow tax within the current tax structure. † Entitled to the 50% of CIT rate within both the current and the proposed tax structures.

Efficiency Effects of Mexico’s Tax Reform on Corporate Capital Investment
13
Table 2a
METR Simulation by Industry and by Asset Type On domestic capital investment under the pre-reform general tax regime
With 40% debt and 60% equity financing Buildings Machinery Inventory Land Aggregate
Agriculture*† 6.6 -9.0 10.4 19.6 8.8 Manufacturing 19.8 16.7 22.8 30.0 20.1 Construction 24.0 -3.4 22.8 30.0 22.8
Transportation* -2.1 -19.7 22.8 30.0 -8.9 Communications 20.0 3.6 22.8 30.0 16.7
Public Utility 17.9 21.0 22.8 30.0 19.7 Wholesale Trade 18.9 17.6 22.8 30.0 21.9
Retail Trade 19.5 23.8 22.8 30.0 22.9 Other Services 18.9 25.8 22.8 30.0 22.4 Simple Average 15.9 8.5 21.5 28.9 16.3
Table 2b METR Simulation by Industry and by Asset Type
On domestic capital investment under the post-reform general tax regime With 40% debt and 60% equity financing
Buildings Machinery Inventory Land Aggregate
Agriculture† 16.8 -5.9 11.7 21.3 12.0 Manufacturing 19.3 16.5 23.5 31.1 20.3 Construction 24.1 -6.2 23.5 31.1 23.2
Transportation 18.1 12.3 23.5 31.1 15.0 Communications 11.3 1.9 23.5 31.1 16.1
Public Utility 17.1 21.4 23.5 31.1 19.4 Wholesale Trade 18.2 17.6 23.5 31.1 22.3
Retail Trade 19.0 24.5 23.5 31.1 23.4 Other Services 18.2 26.6 23.5 31.1 22.5 Simple Average 18.9 12.1 22.2 30.0 19.4
* Entitled to the cash-flow tax within the current tax structure. † Entitled to the 50% of CIT rate within both the current and the proposed tax structures.

International Studies Program Working Paper Series 14
Table 3a Estimate of Integrated METR for Various Financing Structure
On domestic capital investment under the pre-reform general tax regime 100% debt 40% equity 60% equity 100% equity
Agriculture*† 22.6 20.8 19.8 17.9 Manufacturing 21.4 27.2 29.8 34.5 Construction 24.2 29.7 32.2 36.6
Transportation* -7.0 0.8 4.3 10.6 Communications 18.3 24.2 26.8 31.6
Public Utility 21.1 26.8 29.4 34.1 Wholesale Trade 23.1 28.8 31.3 35.9
Retail Trade 24.1 29.7 32.2 36.7 Other Services 23.9 29.4 31.8 36.3 Simple average 19.1 24.2 26.4 30.5
Table 3b Estimate of Integrated METR for Various Financing Structure
On domestic capital investment under the post-reform general tax regime 100% debt 40% equity 60% equity 100% equity
Agriculture† 40.0 34.7 31.8 24.9 Manufacturing 37.5 37.9 38.2 38.6 Construction 39.8 40.2 40.5 40.9
Transportation 33.4 33.9 34.1 34.6 Communications 34.2 34.7 34.9 35.4
Public Utility 36.8 37.3 37.5 38.0 Wholesale Trade 39.0 39.5 39.7 40.2
Retail Trade 39.9 40.4 40.6 41.0 Other Services 39.2 39.7 39.9 40.3 Simple average 37.8 37.6 37.5 37.1
* Entitled to the cash-flow tax within the current tax structure. † Entitled to the 50% of CIT rate within both the current and the proposed tax structures.

Efficiency Effects of Mexico’s Tax Reform on Corporate Capital Investment
15
Table 4 Tax regimes for small to medium owner-operated firms*
With 40% debt and 60% equity financing Pre-reform Pre-reform Post-reform Pre-reform Post-reform Small (1) Small (2) Small Medium Medium
Agriculture 5.0 8.4 9.2 8.8† 9.0† Manufacturing 4.1 9.3 10.5 20.1 5.5 Construction 6.6 9.9 10.7 22.8 15.2
Transportation 3.5 11.0 12.7 -8.9 -9.2 Communications 10.6 15.5 16.6 16.7 -5.4
Public Utility 8.7 13.1 14.1 19.7 1.1 Wholesale Trade 2.8 6.4 7.2 21.9 16.5
Retail Trade 3.5 8.9 10.1 22.9 10.3 Other Services 10.1 14.0 14.9 22.4 7.6 Simple average 6.1 10.7 11.8 16.3 5.6
*Refer to the text for the classification of firms simulated in this table. † Entitled to the 50% of CIT rate within both the current and the proposed tax structures.
International Studies Program Working Paper Series 16
Table 5
Business Tax Provisions
Applicable to Large Firms in Manufacturing and Service Industries
Argentina Brazil Chile Mexico1 Peru
1. Capital Taxes
Corporate income tax 35 34 15 35 20 (2002)
Gross-receipts tax 1-5 2.65 None None None
Assets-based tax2 1.0 None 0.25 - 0.5 1.8 None
Thin capitalization rule Yes None None None None
Tax depreciation rate3
Buildings 2.0 SL 4.0 SL 7.5 SL 5.0 SL 3.0/10.0 SL4
Machinery 10 SL 10 SL 15.2 SL 10 SL 10.0 SL
Inventory accounting5 LIFO FIFO/A FIFO Immediate write-off FIFO/A
Years/ loss carry-over6 5 (F) Infinite(R) Infinite(R) 10 (F) 4 (F)
Withholding tax on dividends
Applicable to US 0.0 0.0 20.0 0.0 0.0
Property-based taxes
Property tax Max. 1.5 Vary 1.425 Up to 0.647 Up to 1.0
Property transfer tax 1.5 2 None 3.3 3.0
2. Import duty
On new capital goods Exempt Up to 55 6 (2003) Exempt 12 (general)
On other business inputs 0 - 15 Up to 55 6 (2003) 0 (NAFTA) 12 (general)
3. Inflation Adjustment No Yes Yes Yes Yes
Notes to the Table:
1. With proposed tax changes incorporated. See the text for details. 2. All are levied as minimum tax that can be used as tax credit for income tax payable. 3. SL = straight-line method, which means the depreciation allowance is claimed based on the
acquisition cost of the capital. A different method is the declining-balance method, which means the depreciation allowance is claimed based on the balance of un-depreciated value of capital.
4. The higher depreciation allowance is applicable for buildings used for tourist business. 5. FIFO = First-in-first-out, LIFO = Last-in-first-out, and A = Average cost. It should be noticed that
when there is required adjustment for inflation, there is no significant difference in tax impact between choosing one or the other method.
6. Following the number of years for loss carry over, the letter in brackets indicates the following: F = forward, B = backward, and R = certain restriction applies to the value of loss to be written off. Refer to the text for details.
Efficiency Effects of Mexico’s Tax Reform on Corporate Capital Investment
17
Table 6a
Effective Corporate Tax Rate on U.S Capital Investment (%) MANUFACTURING
A. Including property tax Argentina Brazil Chile* Mexico Peru** U.S.
Buildings 42.4 38.7 31.2 21.8 27.6 NA Machinery 17.8 37.3 19.4 14.2 27.6 NA Inventory 34.1 27.1 17.3 21.8 16.5 NA
Land 45.0 41.5 35.5 31.0 28.3 NA Aggregate 31.6 34.5 22.3 19.3 24.0 NA
B. Excluding property tax Argentina Brazil Chile* Mexico Peru** U.S.
Buildings 24.8 18.3 7.1 9.7 10.4 21.8 Machinery 17.8 37.3 19.4 14.2 27.6 23.5 Inventory 34.1 27.1 17.3 21.8 16.5 22.1
Land 29.1 23.1 14.8 21.8 11.5 17.0 Aggregate 26.2 29.6 15.9 16.3 19.8 22.5
C. Excluding both property tax and import duty Argentina Brazil Chile Mexico PERU** U.S.
Buildings 24.8 18.3 7.1 9.7 10.4 21.8 Machinery 17.8 23.0 7.9 14.2 6.8 23.5 Inventory 29.1 23.1 14.8 21.8 11.5 22.1
Land 29.1 23.1 14.8 21.8 11.5 17.0 Aggregate 24.1 22.0 10.5 16.3 9.5 22.5
* For year 2003 when the import duty will be reduced from the current 8% to 6%. ** For year 2002 when the CIT rate will be reduced from the current 30% to 20%.

International Studies Program Working Paper Series 18
TABLE 6b
Effective Corporate Tax Rate on Foreign Capital Investment (%) SERVICES
A. Including property tax Argentina Brazil Chile* Mexico Peru** U.S.
Buildings 46.3 40.3 31.8 20.1 28.7 NA Machinery 38.2 54.3 28.8 39.5 41.6 NA Inventory 34.1 27.1 17.3 24.8 16.5 NA
Land 45.0 41.5 35.5 31.0 28.3 NA Aggregate 44.2 41.6 31.0 24.0 29.5 NA
B. Excluding property tax Argentina Brazil Chile* Mexico Peru** U.S.
Buildings 31.3 21.2 8.3 7.4 12.1 20.1 Machinery 38.2 54.3 28.8 39.5 41.6 34.5 Inventory 34.1 27.1 17.3 24.8 16.5 22.1
Land 29.1 23.1 14.8 24.8 11.5 17.0 Aggregate 32.1 28.2 13.3 17.8 17.3 21.8
C. Excluding both property tax and import duty Argentina Brazil Chile Mexico Peru** U.S.
Buildings 31.3 21.2 8.3 7.4 12.1 20.1 Machinery 38.2 42.6 15.2 39.5 20.5 34.5 Inventory 29.1 23.1 14.8 24.8 11.5 22.1
Land 29.1 23.1 14.8 24.8 11.5 17.0 Aggregate 31.6 25.0 11.0 17.8 13.0 21.8
* For year 2003 when the import duty will be reduced from the current 8% to 6%. ** For year 2002 when the CIT rate will be reduced from the current 30% to 20%.