Embed Size (px)
Citation preview
The effects of the personal income tax reform on taxable income in Uganda
Maria Jousste1,2, Tina Kaidu3, Joseph Okello3, Jukka Pirttilä2,4,5, and Pia Rattenhuber2
1Department of Economics, University of Turku, Turku, Finland 2UNU-WIDER, Helsinki, Finland
3Uganda Revenue Authority, Kampala, Uganda 4 University of Helsinki, Helsinki, Finland 5VATT Institute for Economic Research
This is a work in progress. Do not cite without permission.
Abstract:
We evaluate a major personal income tax reform in Uganda that came into effect in 2012/13. The reform increased the tax-free lower threshold, increased tax rates for higher incomes and introduced an additional highest tax band. Using the full universe of administrative Pay-as-you-earn (PAYE) data submitted by employers in the formal sector we specifically analyze the impact of the introduction of an additional top tax band on chargeable income. Preliminary results show a positive elasticity of taxable income similar in magnitude to earlier results from developed countries. As intended by policy makers the share of tax payers in the lower tax-free tax bracket decreased after the reform. We contribute to the very scarce literature on effects of personal income tax reform on employee income in a low-income country in Africa.
Keywords: Personal income tax, Uganda, administrative data, evaluation of tax reform
JEL classification: H24, C31, O23
Acknowledgements: This work is part of a larger research and capacity building initiative between the Uganda Revenue Authority and UNU-WIDER. Financing of the Finnish Ministry of Foreign Affairs is gratefully acknowledged, as well as support to Jouste by the Kone Foundation (grant no. 80-42327). We thank colleagues at the Uganda Revenue Authority, specifically Milly Nalukwago, Nicholas Musoke, Dorothy Nakyambadde and Ronald Waiswa, and Caroline Schimanski for their comments and ongoing support of this work. We thank workshop participants at the Aboa Centre for Economics (ACE) at the University of Turku and School of Business and Economics at Åbo Akademi University for their comments. The results and their interpretation presented here are solely the authors’ responsibility.
2
1. Introduction
Developing countries are increasingly aiming to raise their own revenues. Apart from growing less dependent on foreign aid an improved domestic revenue mobilization (DRM) is also key to finance and improve domestically owned social protection programs and avoid increasing inequality. The expansion of DRM and social protection and containing inequality are therefore also key elements of the Sustainable Development Goals.
While developing countries’ tax receipt traditionally relied mainly on taxes on (multinational) firms, trade taxes and more recently increasingly on personal income taxes, personal income taxation has often received less attention. Yet, personal income tax holds not only potential to boost DRM but at the same time personal income tax policy can be a highly equitable tax tool addressing inequality concerns and social protection goals at the same time. The increased use of digital technologies by revenue authorities together with tax payer awareness campaigns has further leveraged the potential of personal income tax collection.
For an equitable personal income tax policy understanding the tax payer behavior in response to tax rate changes and a sensible estimate of tax revenue under an alternative tax schedule are key. In this paper we analyze a major personal income tax reform in Uganda that came into effect in 2013 to understand these questions better in a low-income country setting. The reform consisted of two major changes. First, it hiked the threshold of the tax-free tax band at the bottom of the schedule up by nearly 81%, and of the second tax band by nearly 40%; and second, it introduced an additional top tax bracket with a marginal tax rate of 40% which used to be 30%.
In this paper we evaluate the impact of the introduction of the additional top income tax band on employee’s incomes as reported by their employers. Specifically, we estimate the elasticity of taxable income (ETI) in response to the reform. We follow methodological approaches used in developed countries (see for example Blomquist and Selin, 2010; Gruber and Saez, 2002) and middle-income countries (for South Africa Kemp, 2017). We use administrative income tax data as collected by the Uganda Revenue Authority (URA) for the fiscal years before and after the reform took place through the pay-as-you-earn (PAYE) system. We further compare simulated revenue changes using pre-reform and post-reform revenue changes.
Our work contributes in several ways to the literature: To our knowledge this is the first study to evaluate the effects of personal income tax reform on employee income in a low-income country in Africa. Furthermore, we use the universe of thoroughly cleaned and checked administrative data on employees in the formal sector.
In the following we will first review the literature (Section 2), before explaining the institutional background of income tax in Uganda (Section 3). Next we turn to the data and descriptive evidence (Section 4), before moving on to the revenue simulations (Section 5). Section 6 discusses the methods used and results are presented in Section 7. Section 8 concludes.
2. Related literature
The pioneering study on taxpayers’ responses to tax rate changes by Feldstein (1995) forms the cornerstone of literature on the elasticity of taxable income and the field has been ever growing since. Typically, the
3
elasticity of taxable income is estimated using micro level tax register data (also referred to as administrative tax records or administrative tax data). The majority of work in the area is however focused on developed countries since in developing countries access to administrative tax data has been challenging.
Overall, the ETI estimates for developed countries vary across countries and time. Most papers assess the 1980s and 1990s tax reforms in the United States. For instance, Gruber & Saez (2002) estimate uncompensated ETI to be 0.4 based on the 1980s US tax reforms. They use a difference-in-differences approach on a panel of administrative tax data. The estimated income effect is insignificant and the authors conclude that the uncompensated and compensated ETI are the same.
In European countries, ETI has been estimated for example for Denmark, Sweden, Finland, Germany, Poland, Russia and UK using administrative tax records. Blomquist & Selin (2010) estimate uncompensated taxable income elasticities of 0.19-0.21 for married males and 0.96-1.44 for married females using Swedish tax register data. They calculate the income effect to estimate the compensated taxable income elasticity which they find to be 5 percentage point higher than the uncompensated elasticity. The estimate is significant only for males.
In recent years, the literature has produced first evidence for ETI for select developing countries. Kleven and Waseem (2013) use Pakistani tax administrative data to analyze ETI for wage earners and self-employed.
3. Institutional background
3.1 Taxation of individual income in Uganda
Income tax in Uganda is governed by the Income Tax Act (ITA) drawn from Article 189 of the Constitution of Uganda of 1995 which outlines the functions of the central government. By law it is the duty of every Ugandan who earns income to pay an annual tax on his or her income for each year and the fiscal year runs from 1st July to 30th June. Income tax is defined as a tax charged on income of any person who has chargeable income for each year of income.1 The term income includes any gains, profits, interest, dividends and also non-monetary benefit, advantages or facility obtained by a person through employment. The Income Tax Act defines a person to include an individual, a partnership, a trust, a company, retirement fund, a government, political sub-division of a government and an institution listed in the First Schedule to the Act. Each of these persons may be assessed for income tax if he or she or it earns taxable income. The URA, which was established in 1991 by the URA Statute, is responsible for the enforcement and implementation of the income tax.
PAYE is a form of individual tax charged on employment income in the scope of income taxation. The tax is deducted from the employment emoluments before the last payment for the period (normally a month) is made to the employee. PAYE is therefore a source (withholding) tax because the money is collected before it reaches the employee. The employer remits the total tax deducted directly to URA accounting to the employee how much tax has been actually paid to government.
PAYE is also levied on income earned by an individual such as a sole trader. This term is usually applied to persons who are self-employed in business. However, individual income tax is not limited to business income 1 ITA Chapter 340 of the Laws of Uganda, Section 5 (1).
4
alone. It includes all income earned by an individual from all sources except that income which is assessable separately.2 PAYE tax rates differ between resident and non-resident tax payers. Anyone residing for less than a period of 183 days of a year in Uganda is considered a non-resident is subject to the higher, non-resident tax schedule (Uganda Revenue Authority, 2015). Employees with a second job can opt for a flat rate scheme which subjects their income to a tax rate at 30%.
In the 2016/2017 fiscal year PAYE levied UGX 2.1 trillion of the UGX 12.9 trillion of total tax revenue collected thus constituting about 16.4% of total tax revenue. For comparison, value added taxes contributed similarly to gross revenues at 15.7%; corporate and withholding taxes, the other main contributors to direct taxes constituted 5.9% and 5.3% respectively. Overall, domestic tax (direct and indirect taxes) make up 58% of gross revenues with taxes on international trade contributing the rest.
PAYE revenue has thus increased tremendously from a meagre UGX 825.6 billion in the 2010/11 fiscal year.3 The growth in PAYE revenue was enhanced by several reforms including the adaptation of an electronic filing system for PAYE (e-tax system) that substantially simplified the filing procedure. Furthermore, all employers are required to have Tax Identification Numbers (TINs) since the introduction of the e-tax system. For employees it is not mandatory to have a TIN.
Apart from income tax any employed or self-employed Ugandan is subject to the Local Service Tax (LST) which is levied on wealth and income. Whether one is held to pay LST and the amount of LST ultimately to be paid depends on the type of (self) employment and income earned. For employees LST on wages is also deducted by the employer.
3.2 The income tax reform of 2012
With the fiscal year 2012/13, a major income tax reform came into effect. The government’s stated motivation for the reform was to take into account inflationary effects as the tax schedule had been the same for over ten years. Due to bracket creep an increasing number of low-income earners such as teachers had thus become subject to tax. Given that such reform obviously entailed a significant revenue loss the government decided to tax higher incomes more to recoup the lost revenue.
The reform consisted of two major changes. First, the threshold of the tax-free lower band increased from UGX 130,000 (or US$ 57) per month to UGX 235,000 per month, thus pushing it up by nearly 80%. The upper threshold of the second tax band was accordingly lifted by nearly 40%. Second, the reform introduced an additional top tax bracket with a marginal tax rate of 40% for incomes exceeding UGX 10,000,000 per month. Until then the top marginal tax rate had been at 30%.4
The income tax schedules in Table 1 and Chart 1 illustrate the PAYE rates applicable to resident individuals before and after the reform. The reform basically exempted some of the lowest-earning tax payers from paying taxes at all; it reduced marginal and average tax rates for those tax payers that used to fall into the second tax band; it reduced marginal tax rates but kept average tax rates the same for the next highest group of tax payers; and it increased the marginal and average tax rates for those in the newly introduced top tax band. The reform did not affect marginal and average taxes for those situated just below the top tax band.
2 See Part I of Schedule 3 of the ITA on how the assessment is done. 3 Revenue Tables, Uganda Revenue Authority. 4 Ibid, ITA section 7.
5
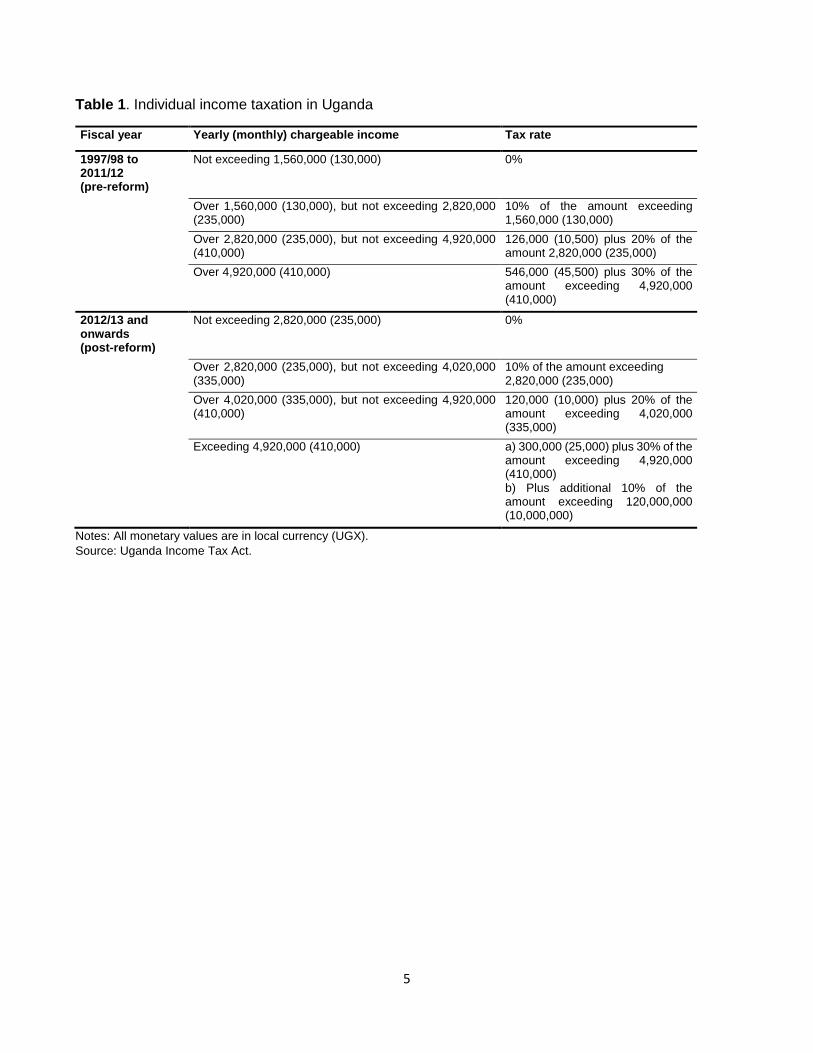
Table 1. Individual income taxation in Uganda
Fiscal year Yearly (monthly) chargeable income Tax rate
1997/98 to 2011/12 (pre-reform)
Not exceeding 1,560,000 (130,000) 0%
Over 1,560,000 (130,000), but not exceeding 2,820,000 (235,000)
10% of the amount exceeding 1,560,000 (130,000)
Over 2,820,000 (235,000), but not exceeding 4,920,000 (410,000)
126,000 (10,500) plus 20% of the amount 2,820,000 (235,000)
Over 4,920,000 (410,000) 546,000 (45,500) plus 30% of the amount exceeding 4,920,000 (410,000)
2012/13 and onwards (post-reform)
Not exceeding 2,820,000 (235,000) 0%
Over 2,820,000 (235,000), but not exceeding 4,020,000 (335,000)
10% of the amount exceeding 2,820,000 (235,000)
Over 4,020,000 (335,000), but not exceeding 4,920,000 (410,000)
120,000 (10,000) plus 20% of the amount exceeding 4,020,000 (335,000)
Exceeding 4,920,000 (410,000) a) 300,000 (25,000) plus 30% of the amount exceeding 4,920,000 (410,000) b) Plus additional 10% of the amount exceeding 120,000,000 (10,000,000)
Notes: All monetary values are in local currency (UGX). Source: Uganda Income Tax Act.
6
Figure 1. The marginal and average tax rates of the individual income tax by yearly taxable income
Notes: ‘Pre-reform’ refers to fiscal years before the 2012/13 fiscal year. ‘Post-reform’ refers to fiscal year 2012/13 and onwards. All monetary values are in local currency (UGX). Source: Authors’ own calculations based on Ugandan Income Tax Act.
4. Data and descriptive evidence
We use the universe of PAYE data extracted from URA data bases. The data includes information as submitted by the employer through the e-filing system such as gross pay, allowable deductions, taxable income and payable tax for each employee. It also includes indicators whether the tax payer is subject to the resident tax schedule and whether the taxable income is subject to the flat rate tax for income from a secondary job. The data range from fiscal year 2010/11 to fiscal year 2014/15. Due to firm’s TINs it is also possible to produce a panel spanning the reform period. Data is available on a monthly basis. Some data is available for some of the employees falling in the lowest tax-free band if the employer shared the information with URA.
Non-resident tax-payers represent a negligible share of observations in our data set and we therefore drop them from our analysis. We also exclude records of employees who hold a secondary job and are taxed at the flat rate tax rate for income from that secondary job as this represents only few observations and is not our main interest of analysis.
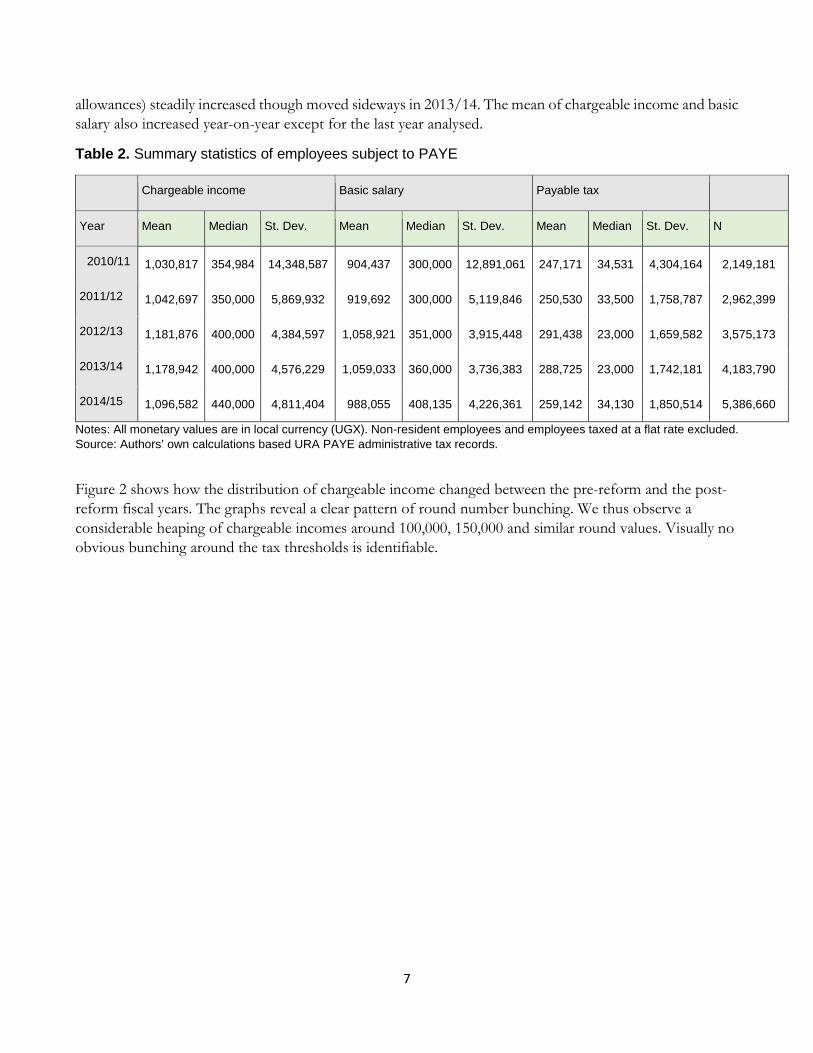
The overall number of employees subject to PAYE more than doubled between 2010/11 and 2014/15 (see Table 2). While the median of basic salaries and chargeable income (thus the basic salary less any applicable
0%
10%
20%
30%
40%
50%
500,000 1,500,000 2,300,000 3,100,000 4,020,000 4,820,000 4,920,000 84,930,000 170,000,000
Marginal tax rate pre-reform Marginal tax rate post-reformAverage tax rate pre-reform Average tax rate post-reform
7
allowances) steadily increased though moved sideways in 2013/14. The mean of chargeable income and basic salary also increased year-on-year except for the last year analysed.
Table 2. Summary statistics of employees subject to PAYE
Chargeable income Basic salary Payable tax
Year Mean Median St. Dev. Mean Median St. Dev. Mean Median St. Dev. N
2010/11 1,030,817 354,984 14,348,587 904,437 300,000 12,891,061 247,171 34,531 4,304,164 2,149,181
2011/12 1,042,697 350,000 5,869,932 919,692 300,000 5,119,846 250,530 33,500 1,758,787 2,962,399
2012/13 1,181,876 400,000 4,384,597 1,058,921 351,000 3,915,448 291,438 23,000 1,659,582 3,575,173
2013/14 1,178,942 400,000 4,576,229 1,059,033 360,000 3,736,383 288,725 23,000 1,742,181 4,183,790
2014/15 1,096,582 440,000 4,811,404 988,055 408,135 4,226,361 259,142 34,130 1,850,514 5,386,660
Notes: All monetary values are in local currency (UGX). Non-resident employees and employees taxed at a flat rate excluded. Source: Authors’ own calculations based URA PAYE administrative tax records.
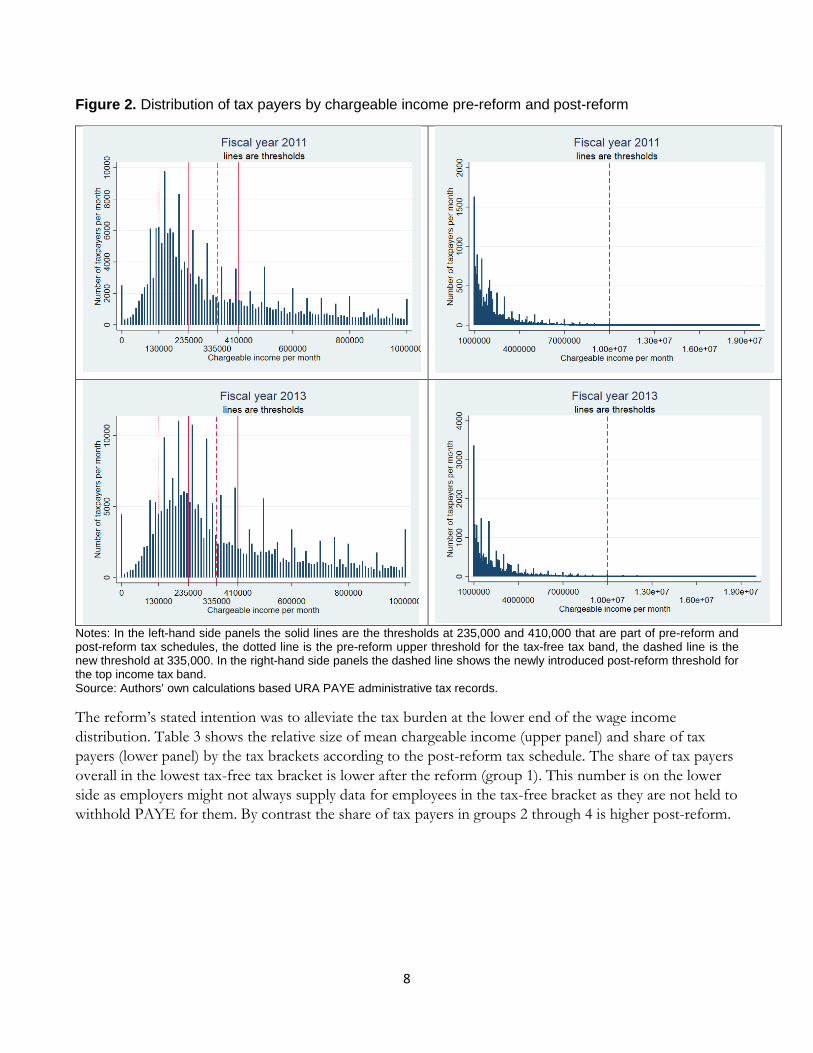
Figure 2 shows how the distribution of chargeable income changed between the pre-reform and the post-reform fiscal years. The graphs reveal a clear pattern of round number bunching. We thus observe a considerable heaping of chargeable incomes around 100,000, 150,000 and similar round values. Visually no obvious bunching around the tax thresholds is identifiable.
8
Figure 2. Distribution of tax payers by chargeable income pre-reform and post-reform
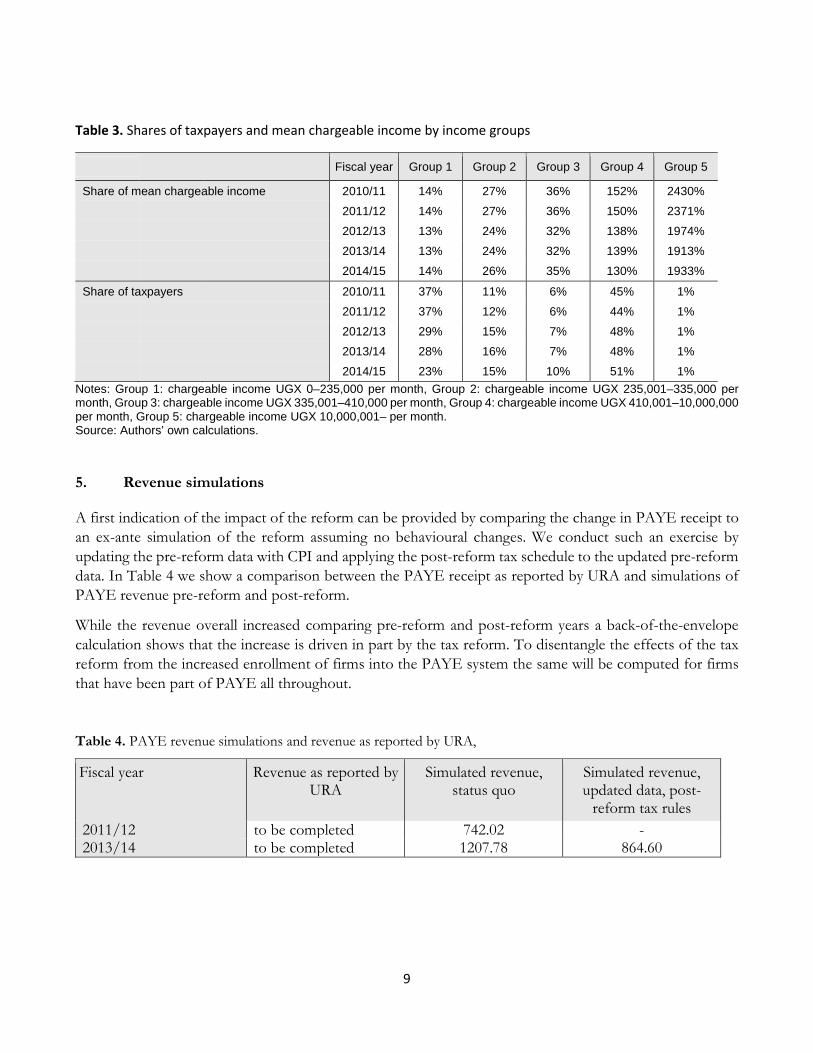
Notes: In the left-hand side panels the solid lines are the thresholds at 235,000 and 410,000 that are part of pre-reform and post-reform tax schedules, the dotted line is the pre-reform upper threshold for the tax-free tax band, the dashed line is the new threshold at 335,000. In the right-hand side panels the dashed line shows the newly introduced post-reform threshold for the top income tax band. Source: Authors’ own calculations based URA PAYE administrative tax records. The reform’s stated intention was to alleviate the tax burden at the lower end of the wage income distribution. Table 3 shows the relative size of mean chargeable income (upper panel) and share of tax payers (lower panel) by the tax brackets according to the post-reform tax schedule. The share of tax payers overall in the lowest tax-free tax bracket is lower after the reform (group 1). This number is on the lower side as employers might not always supply data for employees in the tax-free bracket as they are not held to withhold PAYE for them. By contrast the share of tax payers in groups 2 through 4 is higher post-reform.
9
Table 3. Shares of taxpayers and mean chargeable income by income groups
Fiscal year Group 1 Group 2 Group 3 Group 4 Group 5
Share of mean chargeable income 2010/11 14% 27% 36% 152% 2430% 2011/12 14% 27% 36% 150% 2371% 2012/13 13% 24% 32% 138% 1974% 2013/14 13% 24% 32% 139% 1913% 2014/15 14% 26% 35% 130% 1933%
Share of taxpayers 2010/11 37% 11% 6% 45% 1% 2011/12 37% 12% 6% 44% 1% 2012/13 29% 15% 7% 48% 1% 2013/14 28% 16% 7% 48% 1% 2014/15 23% 15% 10% 51% 1%
Notes: Group 1: chargeable income UGX 0–235,000 per month, Group 2: chargeable income UGX 235,001–335,000 per month, Group 3: chargeable income UGX 335,001–410,000 per month, Group 4: chargeable income UGX 410,001–10,000,000 per month, Group 5: chargeable income UGX 10,000,001– per month. Source: Authors’ own calculations.
5. Revenue simulations
A first indication of the impact of the reform can be provided by comparing the change in PAYE receipt to an ex-ante simulation of the reform assuming no behavioural changes. We conduct such an exercise by updating the pre-reform data with CPI and applying the post-reform tax schedule to the updated pre-reform data. In Table 4 we show a comparison between the PAYE receipt as reported by URA and simulations of PAYE revenue pre-reform and post-reform.
While the revenue overall increased comparing pre-reform and post-reform years a back-of-the-envelope calculation shows that the increase is driven in part by the tax reform. To disentangle the effects of the tax reform from the increased enrollment of firms into the PAYE system the same will be computed for firms that have been part of PAYE all throughout.
Table 4. PAYE revenue simulations and revenue as reported by URA,
Fiscal year Revenue as reported by URA
Simulated revenue, status quo
Simulated revenue, updated data, post-
reform tax rules 2011/12 to be completed 742.02 - 2013/14 to be completed 1207.78 864.60
10
. ethods
The main objective of this study is to examine in how far and if so by how much taxpayers reacted to the increase in the top marginal tax rate. It could be that employees and employers collude report lower income than they would have done in the absence of the reform. Such response is captured by the ETI, i.e. the percentage change of taxable income with respect to a percentage change in (1-marginal tax rate).
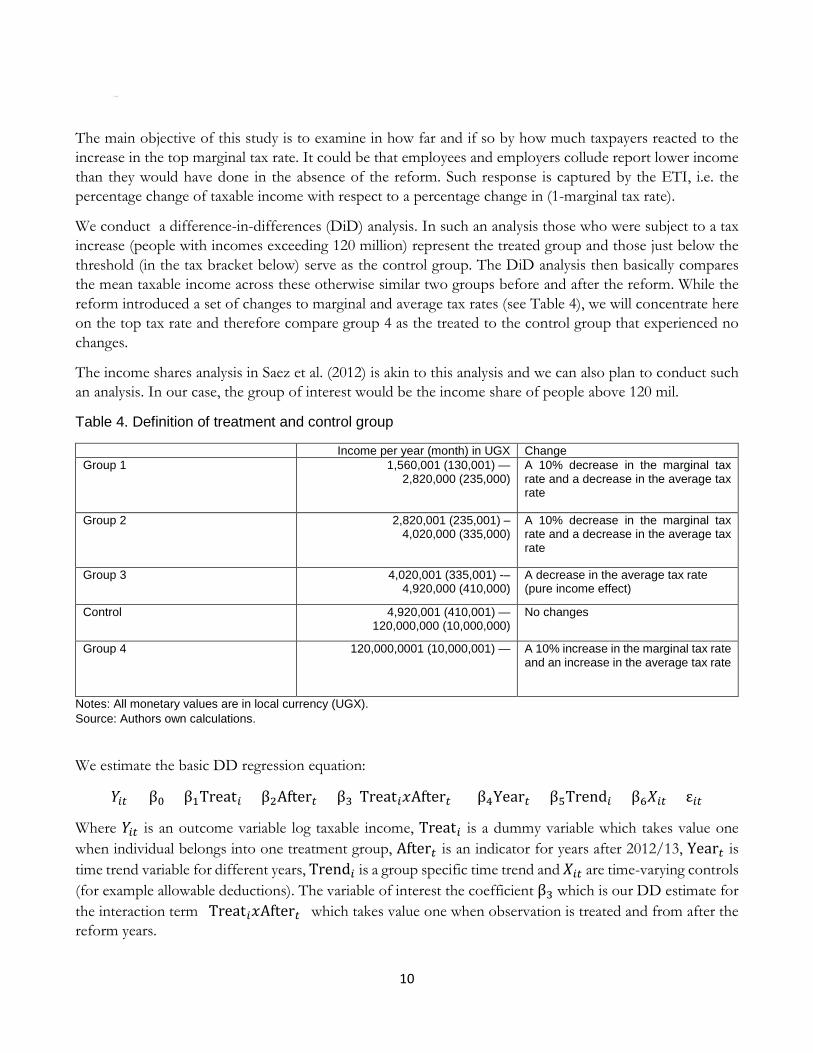
We conduct a difference-in-differences (DiD) analysis. In such an analysis those who were subject to a tax increase (people with incomes exceeding 120 million) represent the treated group and those just below the threshold (in the tax bracket below) serve as the control group. The DiD analysis then basically compares the mean taxable income across these otherwise similar two groups before and after the reform. While the reform introduced a set of changes to marginal and average tax rates (see Table 4), we will concentrate here on the top tax rate and therefore compare group 4 as the treated to the control group that experienced no changes.
The income shares analysis in Saez et al. (2012) is akin to this analysis and we can also plan to conduct such an analysis. In our case, the group of interest would be the income share of people above 120 mil.
Table 4. Definition of treatment and control group
Income per year (month) in UGX Change Group 1 1,560,001 (130,001) —
2,820,000 (235,000) A 10% decrease in the marginal tax rate and a decrease in the average tax rate
Group 2 2,820,001 (235,001) – 4,020,000 (335,000)
A 10% decrease in the marginal tax rate and a decrease in the average tax rate
Group 3 4,020,001 (335,001) -– 4,920,000 (410,000)
A decrease in the average tax rate (pure income effect)
Control 4,920,001 (410,001) — 120,000,000 (10,000,000)
No changes
Group 4 120,000,0001 (10,000,001) — A 10% increase in the marginal tax rate and an increase in the average tax rate
Notes: All monetary values are in local currency (UGX). Source: Authors own calculations.
We estimate the basic DD regression equation:
𝑌𝑌𝑖𝑖𝑖𝑖 = β0 + β1Treat𝑖𝑖 + β2After𝑖𝑖 + β3(Treat𝑖𝑖𝑥𝑥After𝑖𝑖) + β4Year𝑖𝑖 + β5Trend𝑖𝑖 + β6𝑋𝑋𝑖𝑖𝑖𝑖 + ε𝑖𝑖𝑖𝑖
Where 𝑌𝑌𝑖𝑖𝑖𝑖 is an outcome variable log taxable income, Treat𝑖𝑖 is a dummy variable which takes value one when individual belongs into one treatment group, After𝑖𝑖 is an indicator for years after 2012/13, Year𝑖𝑖 is time trend variable for different years, Trend𝑖𝑖 is a group specific time trend and 𝑋𝑋𝑖𝑖𝑖𝑖 are time-varying controls (for example allowable deductions). The variable of interest the coefficient β3 which is our DD estimate for the interaction term (Treat𝑖𝑖𝑥𝑥After𝑖𝑖) which takes value one when observation is treated and from after the reform years.
11
We use the DD estimate to calculate the uncompensated ETI using the following equation:
𝑒𝑒 =𝐷𝐷𝐷𝐷 𝑒𝑒𝑒𝑒𝑒𝑒𝑒𝑒𝑒𝑒𝑒𝑒𝑒𝑒𝑒𝑒
𝑑𝑑(1 − 𝜏𝜏)/(1 − 𝜏𝜏)
7. Results
Very preliminary - to be amended and completed.
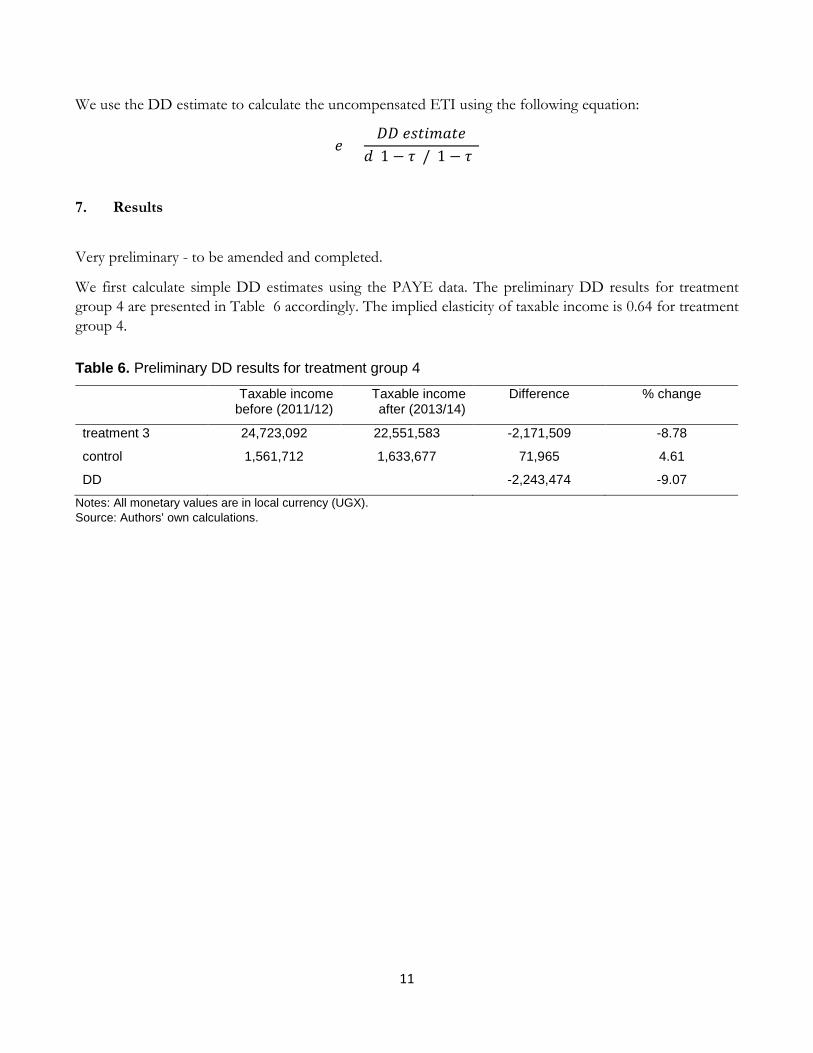
We first calculate simple DD estimates using the PAYE data. The preliminary DD results for treatment group 4 are presented in Table 6 accordingly. The implied elasticity of taxable income is 0.64 for treatment group 4. Table 6. Preliminary DD results for treatment group 4
Taxable income before (2011/12)
Taxable income after (2013/14)
Difference % change
treatment 3 24,723,092 22,551,583 -2,171,509 -8.78
control 1,561,712 1,633,677 71,965 4.61
DD -2,243,474 -9.07
Notes: All monetary values are in local currency (UGX). Source: Authors’ own calculations.
12
8. Conclusion
Personal income tax has often not been the prime focus of tax analysis in developing countries due to data access restrictions and because traditionally other sources of tax have made up the bulk of government revenue. Yet in the age of DRM and with the onset of electronic tax-filing systems the design and evaluation of personal income tax are due to receive more scrutiny by policy makers and researchers alike.
In this study we analyze the impact of a major tax reform in Uganda that took place in 2012/13. The reform shifted the lower threshold of the tax schedule and subsequent thresholds upwards and introduced an additional top tax rate to the schedule. We use the universe of Ugandan administrative tax data from the PAYE system from 2011 through 2015 to assess the impacts of this reform on employee wage and/or chargeable income using evaluation methods. We also provide back-of-the-envelope simulations to assess the reform’s impact on revenue performance.
As intended by policy makers the share of tax payers in the lower tax-free tax bracket decreased after the reform. Preliminary results show a positive elasticity of taxable income in response to the increase in the top marginal tax rate similar in magnitude to earlier results from developed countries.
13
References
Blomquist, S., & Selin, H. (2010). Hourly wage rate and taxable labor income responsiveness to changes in marginal tax rates. Journal of Public Economics, 94(11), 878–889. Retrieved from http://www.sciencedirect.com/science/article/pii/S0047272710001076
Feldstein, M. (1995). The Effect of Marginal Tax Rates on Taxable Income: A Panel Study of the 1986 Tax Reform Act. Journal of Political Economy, 103(3), 551–572.
Gruber, J., & Saez, E. (2002). The elasticity of taxable income: evidence and implications. Journal of Public Economics, 84(1), 1–32. Retrieved from https://econpapers.repec.org/RePEc:eee:pubeco:v:84:y:2002:i:1:p:1-32
Kleven, H. J., & Waseem, M. (2013). Using Notches to Uncover Optimization Frictions and Structural Elasticities: Theory and Evidence from Pakistan. The Quarterly Journal of Economics, 128, 669–723.
Saez, E., Slemrod, J., & Giertz, S. H. (2012). The Elasticity of Taxable Income with Respect to Marginal Tax Rates: A Critical Review. Journal of Economic Literature, 50(1), 3–50. Retrieved from https://ideas.repec.org/a/aea/jeclit/v50y2012i1p3-50.html
Uganda Revenue Authority. (2015). Taxation Handbook.