Embed Size (px)
Citation preview

Computational Fluid Dynamics of Fish Gill Rakers
during Crossflow Filtration
Angela Cheer ∙ Samson Cheung ∙ Tien-Chieh Hung ∙
Raul H. Piedrahita ∙ S. Laurie Sanderson
A. Cheer ∙ S. Cheung
Department of Mathematics, University of California, One Shields Avenue, Davis,
CA 95616, USA
T.C. Hung ∙ R.H. Piedrahita
Department of Biological and Agricultural Engineering, University of California, One
Shields Avenue, Davis, CA 95616, USA
S. Laurie Sanderson (corresponding author)
Department of Biology, College of William & Mary, P.O. Box 8795, Williamsburg, VA
23187-8795, USA
e-mail: [email protected]

2
Abstract We study crossflow filtration mechanisms in suspension-feeding fishes using
computational fluid dynamics to model fluid flow and food particle movement in the
vicinity of the gill rakers. During industrial and biological crossflow filtration, particles
are retained when they remain suspended in the mainstream flow traveling across the
filter surface rather than traveling perpendicularly to the filter. Here we identify physical
parameters and hydrodynamic processes that determine food particle movement and
retention inside the fish oral cavity. We demonstrate how five variables affect flow
patterns and particle trajectories: (1) flow speed inside the fish oral cavity, (2) incident
angle of the flow approaching the filter, (3) dimensions of filter structures, (4) particle
size, and (5) particle density. Our study indicates that empirical experiments are needed to
quantify flow parameters inside the oral cavity, and morphological research is needed to
quantify dimensions of the filter apparatus such as gill rakers, the gaps between rakers,
and downstream barriers. Ecological studies on suspension-feeding fishes are also
needed to quantify food particle size and density, as these variables can affect particle
retention due to hydrodynamic processes during crossflow filtration.
Keywords Crossflow filtration ∙ Suspension-feeding fishes ∙ Gill rakers ∙ Fish feeding

3
1. Introduction
Suspension-feeding fishes consume small food particles such as detritus and
phytoplankton by removing them from enormous volumes of water that enter the mouth.
Belonging to 21 families in 12 orders, suspension-feeding fishes such as herring and
tilapia are vital components of many ecological communities [1, 2] and comprise
approximately 25% of the annual world fish catch [3]. During suspension feeding, food
particles enter the oral cavity with water but are retained inside the oral cavity while the
filtered water (filtrate) exits via branchial slits between the gill arches on both sides of the
head. Gill arches are cartilaginous arches to which the gill filaments and protruding gill
rakers are attached. Although the gill rakers have been assumed to serve as the filtering
structures, the sites and mechanisms of food particle retention have received little study.
Hoogenboezem et al. [4] have used X-ray cinematography and Sanderson et al. [5]
have used a fiberoptic endoscope to investigate particle retention mechanisms inside the
oral cavity of suspension-feeding fishes. Three major mechanisms have been identified:
dead-end sieving [6, 7] , mucus entrapment [8], and crossflow filtration [9]. Gill rakers
have been assumed to function either as a dead-end sieve with pore sizes equal to the
distance between rakers or as a sticky surface to which small particles can adhere [2, 10].
However, Sanderson et al. [9] have observed that in three fish species belonging to

4
different orders, more than 95% of food particles do not come into contact with the gill
rakers but remain suspended in the flow and become more concentrated as they travel
towards the esophagus.
In these species (goldfish, gizzard shad, and ngege tilapia), the gill rakers act like a
modern industrial crossflow filtration mechanism [11, 12], in which the particle-laden
fluid flows across (tangential to) the filter surface, rather than perpendicular to the filter
surface as in dead-end sieving. The filtrate passes through the filter, but the particles
remain suspended in the mainstream flow that is tangential to the filtering structures.
Therefore, the particles are concentrated in suspension as the mainstream flow moves
along the filter surface. Contrary to dead-end sieving, it is possible in crossflow filtration
to retain particles smaller than the filter mesh size, and the filtering structures do not
become clogged as quickly as in dead-end filtration [13]. In recent decades, crossflow
filtration has become the primary method of industrial filtration for many beverages,
biotechnology applications, and wastewater treatment processes [11].
Particle transport during fish crossflow filtration is not yet understood. In contrast to
industrial crossflow filtration mechanisms, particles do not accumulate on the filter
structures in fish. This is significant because the major part of the operating cost in
industrial crossflow filtration is fouling of the filter surface by particles [14]. Sanderson

5
et al. [9] concluded that particle transport mechanisms theorized to operate during
industrial crossflow filtration, such as radial inertial migration, shear-induced diffusion,
concentrated flowing layers, and surface transport could not account fully for the lack of
particle contact with the gill rakers during crossflow filtration in suspension-feeding
fishes. Preliminary simulations by Cheer et al. [15] indicated that computational fluid
dynamics studies should focus at the level of the gill rakers.
This study investigates the underlying mechanisms of crossflow filtration in
suspension-feeding fishes using computational fluid dynamics (CFD) to simulate particle
movements in the flow field around the gill rakers. The objective of this study is to
identify the physical parameters and the hydrodynamic processes in the region of the gill
rakers that affect particle movement and retention inside the oral cavity. This information
is critical for future comparisons of crossflow filtration mechanisms between and within
fish species and for guiding researchers who collect functional, morphological, and
ecological data on suspension feeding in fish.
2. Methods
A 3-D Navier-Stokes (N-S) flow solver and a software package, FluentTM
, were used to
calculate the flow field around the elliptic cylinders representing the gill rakers. Small

6
spherical particles were released into the flow field for the purpose of quantifying particle
trajectories. Several variables were tested to understand their effects on the flow and
particle movement patterns inside the oral cavity of the fish. The flow in simulations is
assumed to be Newtonian, since the particles are small enough that they do not
significantly influence the flow field.
2.1. Particle traces algorithm
The trajectories of food particles that enter the oral cavity of suspension-feeding fish were
traced by using the following algorithm. The particle path x(t) can be obtained by solving
the following equation with a given initial position x(0)
d𝐱
dt= 𝐯(𝐱) (1)
where v(x) is the velocity field. Applying the second-order Runge-Kutta integration
scheme with adaptive step sizing [16] to Eq. (1), we obtain
𝐱∗ = 𝐱k + dt 𝐯(𝐱k) (2)
𝐱k+1 = 𝐱k + dt1
2(𝐯(𝐱k) + 𝐯(𝐱∗)) (2)
where xk is the particle position at the k
th step, x
* is the particle position determined by x
k
and v(xk) using Euler’s method, and dt is given by
dt = c max(vx, vy, vz)⁄ . (3)

7
Here vx, vy, and vz are the three components of the velocity vector v, and c is a constant
used for adaptive step sizing, with 0 < c < 1. The constant c controls the number of steps
that x advances in each grid cell. The adaptive step sizing is required when the velocity
changes rapidly in some regions of the grid. The algorithm described above is based on
the assumption that the flow is time-independent (steady flow). The steady state
approximation was used to focus on the predominant flow field experienced at the level
of the gill rakers during suspension feeding.
Additional formulas are needed for the particles with finite mass due to Newton’s
Second Law, which states that
d𝐯
dt=
1
m𝐅(𝐯) (4)
where m is the mass of the particle and F(v) is the force applied on the particle. Using the
second-order Runge-Kutta integration scheme again leads to
𝐯∗ = 𝐯k−1 + dt 𝐅(𝐯k−1) m⁄ (6)
𝐯k = 𝐯k−1 + dt1
2(𝐅(𝐯k−1) + 𝐅(𝐯∗)) m⁄ . (5)
The trajectories of particles with finite mass are then obtained by combining Eqs. (2) and
(5) by replacing the values of v(xk) and v(x
*) in Eq.(2) with v
k and v
* in Eq. (5),
respectively.
The force working on a moving particle with a velocity of v at a given instant is the

8
sum of buoyancy, gravitation, and drag (D). Thus, F(v) can be expressed as
𝐅(𝐯) = −Vρwg�̂� + Vρpg�̂� + CD1
2ρwS|𝐰|
2�̂� (6)
where V is the volume of the particle, ρw is the water density, g�̂� is the gravitation acting
in the z direction, �̂� is the unit vector, ρp is the particle density, CD is the drag coefficient
of the particle in water, S is the particle wetted area, w is the traveling velocity, and �̂� is
the unit vector of this velocity. The particle volume and wetted area used for the
calculation are (4/3)πr3 and πr
2, respectively, and r is the radius of the particles. The
traveling velocity is obtained by subtracting the particle velocity from the flow velocity.
The mass of the particle can be shown as the product of particle volume and particle
density (Vρp), thus Eq. (6) can be written as
𝐅(𝐯)
m= (1 −
ρw
ρp)g�̂� +
CD1
2ρwS|𝐰|
2�̂�
m . (7)
Note that if the particle density is the same as the water density, the buoyancy and
gravitation terms are canceled, and the first term in Eq. (7) is zero.
The drag coefficient, CD, is associated with many variables including particle shape,
surface area, and speed relative to the flow. In order to obtain CD, we first determine the
particle Reynolds number (Rep), where:
Rep =ρw|𝐰|dp
μ . (8)
Here dp is the diameter of the particle and μ is the dynamic viscosity of the fluid. In this

9
study, the value for Rep is within the range of 1 and 1000. Therefore, CD can be
accurately expressed by a famous empirical equation proposed by Putnam [17]:
CD =24
Rep(1 +
(Re𝑝)2 3⁄
6) . (9)
With this calculated value of CD, the drag applied on the particle can be obtained from the
last term of Eq. (6) for an understanding of how the flow affects the movement of
particles.
2.2. Tools for simulation
2.2.1. OVERFLOW
The OVERFLOW code developed by NASA was used to solve the N-S equations for
structured Chimera overset grid systems. This code is an outgrowth of the ARC3D [18]
and F3D [19] codes with various numerical algorithmic options in solving the matrix
equations. Both time-accurate mode and local time step scaling are available for the
acceleration to the steady state, and grid sequencing is implemented as well as multi-grid
for convergence acceleration. The calculations also require the Low-Mach number
preconditioning technique. The Pulliam-Chaussee diagonalized (scalar pentadiagonal)
scheme [20] and Roe upwind scheme [21] were used to solve the resulting matrix
equations.

10
2.2.2. FluentTM
The commercial software, FluentTM
, was used to verify the simulation results obtained
from the OVERFLOW code and calculate detailed flow information such as mass flow
rates through the gap between adjacent gill rakers. A software package, GambitTM
,
generated computational grids by partitioning the volume of the oral cavity in the vicinity
of the rakers into many small control volumes. These grids were then exported to
FluentTM
, which approximates the solution to the governing equations for fluid and
particle flow in each of the control volumes. A finite volume method (FVM) was used for
the calculations.
2.3. Model construction
The geometric structure used for the simulations is shown in Figure 1. The filtering
structures in the oral cavity of suspension-feeding fish consist of repeating elements.
Rows of gill rakers are attached to a series of gill arches. The arrows represent water
flows entering and exiting the system. Water flows past a row of gill rakers and exits
from the oral cavity by passing through either the branchial slit between the first gill arch
and the lateral wall of the oral cavity or the branchial slits between successive gill arches.

11
The model in this study uses one set of these repeating elements (Fig. 1). Elliptic
cylinders represent the gill rakers in the fish oral cavity. Flow enters the system from two
faces (A and B) with given speed and incident angles to the cylinders. The bottom of the
system is composed of two sections: (1) a free outflow boundary representing the
branchial slit between the first gill arch and the lateral wall of the oral cavity, and (2) a
solid surface 937.5 μm wide to which the cylinders are attached, representing the gill arch
surface. Flow can also exit the system via the continuation of the branchial slit on face C.
The other 50% of Face C is blocked by a solid wall representing the tissue in the posterior
oral cavity. Face D is a solid wall 1000 μm high, located 937.5 μm downstream of the gill
arch surface. Face D represents the bony cover that forms the lateral wall of the oral
cavity.
The water and particles passing over the tops of the cylinders are retained in the oral
cavity, whereas the flow and particles exiting from the branchial slit via the bottom of the
system or via face C leave the fish oral cavity. The top of the system is a continuity
boundary. The model used for the actual simulations has eight cylinders in total instead of
the four shown. A no-slip boundary condition was placed on all solid surfaces.
2.4. Variables altered in simulations

12
An array of elliptic cylinders was used to simulate the gill rakers of a generalized
suspension-feeding fish with knob-like gill rakers, such as tilapia (family Cichlidae).
Each elliptic cylinder has dimensions of 375 μm in the major axis, 250 μm in the minor
axis, and 650 μm in height (Fig. 1). The gap distance between adjacent rakers is 250 μm.
Five variables are altered in the simulations to explore their effects on flow patterns and
particle trajectories: (1) flow speed, (2) incident angle of the flow approaching the elliptic
cylinders, (3) dimensions of elliptic cylinders, (4) particle size, and (5) particle density.
Previous studies have shown that the oral flow speed of suspension-feeding fish is
higher during suspension feeding than during ventilation [22, 23]. This change in flow
speed and the accompanying change in flow pattern around the gill rakers have been
hypothesized to affect the movement of food particles. Therefore, two oral flow speeds,
10 cm/s and 60 cm/s, are examined in this study.
As the gill arches move away from and towards the midline of the oral cavity during
pump suspension feeding, there are changes in the angle at which flow approaches the
rakers. There have been no systematic investigations of the effects of incident angle on
the flow field and particle trajectories in the vicinity of the rakers. Thus, the effects of two
incident angles of the flow approaching the rakers, 60° and 75° from the positive x-axis
[9], are investigated.

13
Gill raker size varies between and within species. The effects of gill raker size on
water flow and particle trajectories are explored by increasing raker size to 675 μm in the
major axis and 450 μm in the minor axis.
Particle size and particle density are important variables that influence the physical
mechanisms of particle capture by suspension-feeding animals [24, 25, 26]. For crossflow
filtration in fish, particle sizes of interest include those that are slightly smaller than the
gap distance between rakers, much smaller than the raker dimensions , and substantially
smaller than the size of the oral cavity, but not so small (e.g., 5-10 μm bacteria) that a
different filtration mechanism is utilized. For this study, particle sizes and densities are
selected to be realistic biologically and to be representative of the particle characteristics
used for laboratory experiments in progress on live suspension-feeding fish. Therefore,
particles with two different diameters (82.5 μm and 165 μm) and two different densities
(1050 kg/m3 and 1190 kg/m
3) are used in the simulations to reveal the effects of particle
characteristics on crossflow filtering performance.
The concentration of particles suspended in the fluid varies considerably in nature
and is generally very low. In laboratory experiments, when a high concentration of
particles is introduced into the flow, endoscopic snapshots of the volume of fluid
corresponding to the size of our computational domain inside the oral cavity display

14
approximately 3-10 particles across all 8 rakers [9]. Even at these high concentration
levels, particle -to-particle interactions occur rarely in the endoscopic views and are thus
neglected in the simulations. Other operational parameters used include water density of
1000 kg/m3, water viscosity of 0.001 kg/ms, gravitational constant of 9.81 m/s
2, and
angle of attack of 75° from the positive z-axis [9].
3. Computational results and discussion
3.1. Flow patterns around the gill rakers
To examine the differences in flow patterns along the height of the cylinders, three
horizontal cross-sections are plotted at 200, 400, and 600 μm from the bottom of the
cylinders where the rakers are attached to the no-slip boundary of the arch surface. The
flow patterns are presented as path lines and as velocity vectors color coded to the flow
normal to the gaps (Fig. 2). At an approaching flow speed of 60 cm/s, the Reynolds
number is 225. At the Reynolds numbers relevant to this study, the system exhibits
laminar flow.
In each horizontal cross-section, the first gap between two adjacent cylinders is
blocked almost completely by a large recirculating vortex, and fast flow is forced through
the last gap (Gap 7, Fig. 2). In contrast, the flow patterns in gaps 2 through 6 exhibit

15
essentially a periodic solution, with an almost uniform vortex generated inside each gap.
This region of slower recirculating flow inside gaps 2 through six is generated
immediately downstream of each cylinder, whereas a narrow region of slightly higher
speed relative to the mainstream flow is generated inside the gap immediately upstream
of each cylinder. The vortex produced in the gap immediately downstream of each
cylinder acts like an additional barrier and reduces the available gap space for water
exiting between the cylinders. The 250 μm gap between adjacent cylinders becomes an
effective gap of approximately half that size.
The velocity vectors at different heights show the fastest flow passing through the
middle part of the gap (400 μm height) relative to the upper or lower cross sections. The
path lines show that, at a height of 600 μm, some flow passes over the cylinders instead
of through the gaps between them. Figure 3 shows the velocity vectors on a vertical plane
halfway between two cylinders (Gap 5) and presents a clear view of the direction of flow
at different heights. The velocity vectors show that faster flow enters the upper part of the
gap compared to the lower part of the gap, but the amount of water going through the
very top of the gap (around 600 μm from the base) decreases as the result of a
recirculating vortex that develops along the top downstream half-length of the rakers (Fig.
3). Since water is incompressible, the water that does not go over the rakers is forced to

16
go between the rakers, further increasing the flow speed through the middle height of the
gap (around 400 μm from the base).
3.2. Flow patterns under different flow conditions
The effects of flow conditions, including flow speeds and incident angles, on the flow
patterns are also examined. When the flow speed is reduced to 10 cm/s, the vortices in the
gaps are almost eliminated and more path lines travel over the cylinders rather than
between them (Fig. 4a compared to 4b). In this case, the Reynolds number is 37.5, based
on the major axis of the cylinder and the maximum total magnitude of the flow entering
the system.
When the incident angle is reduced to 60°, the velocity component in the direction
between the rakers is increased (Fig. 4c compared to 4b). The increased amount of water
flowing through the gaps washes the vortices downstream of the cylinders, illustrating the
significance of the angle at which the mainstream flow approaches the rakers during
crossflow filtration.
These findings emphasize the importance of devising methods to accurately measure
the speed and angle of the approaching flow at the level of the gill rakers, as these flow
parameters change during growth (ontogeny) of the fish and during movement of the gill

17
arches (abduction/adduction) while the fish feeds. There have been no quantitative
intraspecific or interspecific comparisons of these flow parameters. Our simulations
indicate that such parameters could have marked effects on particle movement and
retention inside fish oral cavities.
3.3. Leakiness of the gap between adjacent rakers
To quantify the effects of the gill rakers on the flow, each gap between adjacent cylinders
is divided into upper and lower halves for calculation of the leakiness. Leakiness is
defined as the ratio of the volume of water flowing through the gap divided by the
volume of water that would pass through the same area if the rakers were not present [27].
The rakers are less leaky at lower Reynolds numbers compared to higher Reynolds
numbers (Table 1). As the Reynolds number decreases from 225 to 37.5 (i.e., as the flow
speed decreases from 60 cm/s to 10 cm/s), the leakiness is reduced by about 50%. The
angle at which the flow approaches the rakers also affects the leakiness. Reducing the
incident angle from 75° to 60° causes the leakiness of the upper gaps and the lower gaps
to increase by approximately 40% and 100%, respectively (Table 1).
In all of the simulations, the upper part of the gap is leakier than the lower part. Even
at the slower flow speed of 10 cm/s, comparable to the peak flow speed of 7 cm/s

18
recorded by Smith and Sanderson [23] using a thermistor flow probe during suspension
feeding in blue tilapia, the row of rakers was leaky rather than acting as a solid wall. This
result is consistent with the model of crossflow filtration developed for species such as
ngege tilapia and blue tilapia, in which the gill rakers serve as a porous tangential filter
rather than as a dead-end sieve or as a sticky filter [9, 29].
3.4. Particle trajectories
3.4.1. Line injection
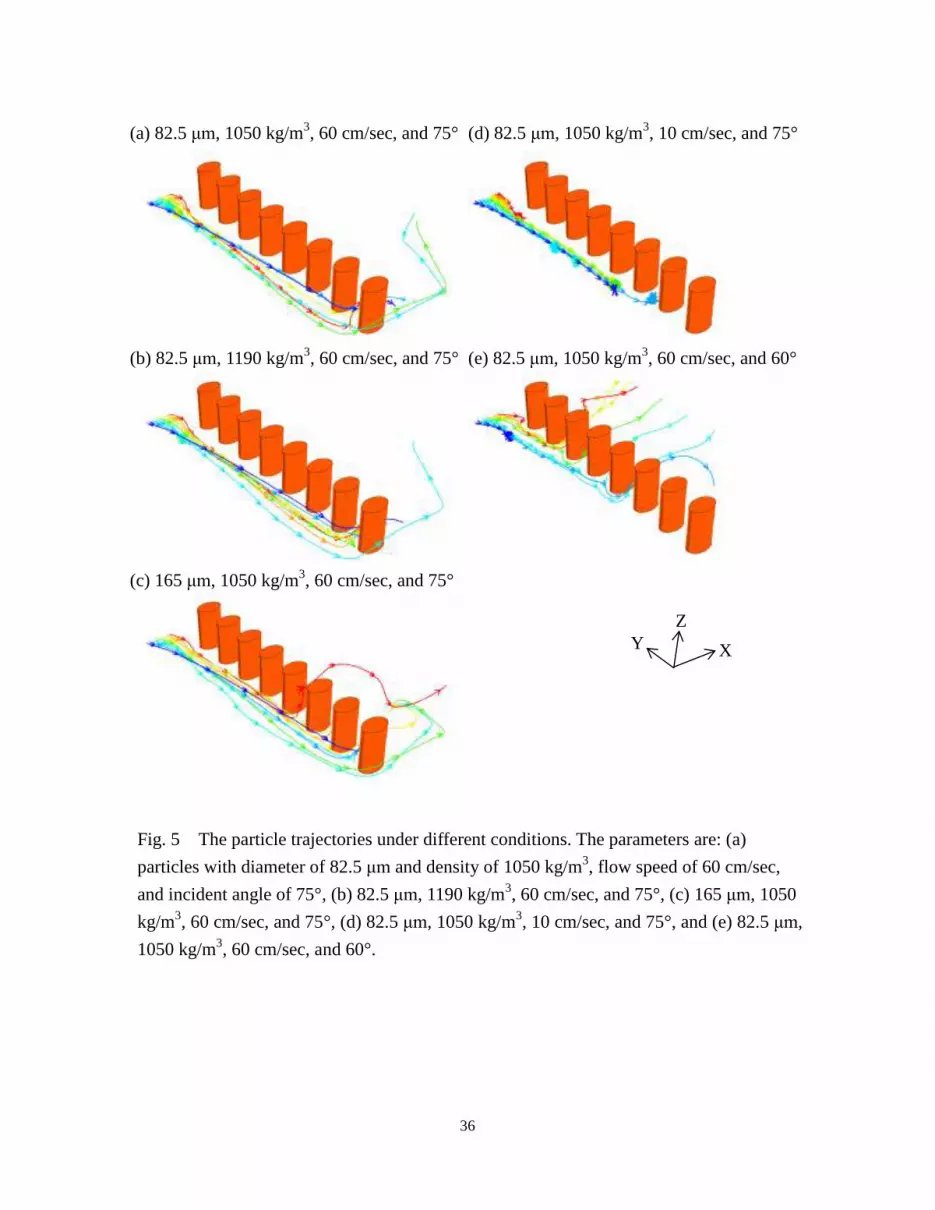
The particle trajectories in the flow field under different conditions are examined by
releasing a row of particles at the bottom of the inflow surface as shown in Figure 5. The
results show that for flow speed of 60 cm/s and incident angle of 75°, the particles are
retained in the flow until the last gap (Fig. 5a). This is consistent with the process of
crossflow filtration, in which particles are retained by the mainstream flow inside the oral
cavity as water exits between the gill rakers.
Particle passage through the gaps is restricted because the vortices in the gaps
between the rakers prevent flow from exiting immediately downstream of each raker (Fig.
2). Under these flow conditions, the particle trajectories are not influenced substantially
by particle size or density as shown in Figure 5a-5c. This function of vortices to block

19
flow is comparable to that found in suspension-feeding bivalve molluscs. Beating of the
laterofrontal cilia on the bivalve’s ctenidial filaments generates vortices that redirect the
movement of food particles away from the gaps between the filaments [30]. However, in
the case of fish crossflow filtration, the vortices can be generated passively by gill raker
structures, without the beating of cilia.
At a flow speed of 10 cm/s, the particles stop travelling due to the no-slip boundary
condition of the arch surface (Fig. 5d). This might explain the recorded increase in
swimming speed of paddlefish during ram suspension feeding compared to typical ram
ventilation [22]. With higher oral flow speed, vortices that are produced between gill
rakers (Figs. 2-4) alter the amount and pattern of flow inside the oral cavity versus exiting
from the branchial slits. In addition, higher flow speed reduces clogging of the filter
caused by settling of particles on the gill arches (Fig. 5a vs. 5d). On the other hand, when
the incident angle is changed to 60°, the results show that the particles pass more readily
through the gaps while traveling upwards (Fig. 5e vs. 5a). This dramatic difference
between Figure 5a and 5e further demonstrates that the incident angle of the flow is
important in determining the interaction of particles with the filtering structures.
3.4.2. Face injection

20
The particle trajectories inside the fish oral cavity are also examined by following 466
point particles uniformly distributed on a square surface upstream of the rakers (i.e., Face
A) as shown in Figure 6 and Table 2. These trajectories determine whether particles
entering the flow domain from these positions will be retained. Of the 466 point
particles, most are retained in the oral cavity by travelling upwards over the top or
through the upper parts of the rakers (Fig. 6). This is comparable to the channeling of
suspended particles observed by Callan and Sanderson [31] during crossflow filtration in
carp. Of the approximately 34% of the point particles that pass through the gaps (Table 2),
approximately half pass through the lower part of the gaps. However, only about 11% of
the particles are lost from the oral cavity by exiting downwards via the branchial slit (Fig.
6). The reason why the percentage of particles passing through the lower part of the gaps
(17.17%, Table 2) is larger than that lost from the system by passing downwards via the
branchial slit (11.2%, Fig. 6) is because some of the particles passing through the lower
part of the gaps travel upwards and are retained in the oral cavity (Fig. 6). This result
emphasizes the important effects of downstream barriers, such as the lateral and posterior
walls of the oral cavity, on flow patterns and particle movements in the region of the gill
rakers.

21
3.5. Drag applied on particles
To understand the trajectories of food particles inside the fish oral cavity, the drag applied
on the particles is studied when they are near the gill rakers. Particles with different
characteristics are injected into the system from Face A at one location on the gill arch
surface at t = 0 sec and are monitored over time (Fig. 7). The flow parameters are velocity
of 60 cm/s and incident angle of 75°. Since the particle is entering the oral cavity at a free
stream velocity, the drag on the particle is initially high because the particle is moving
faster than the flow field. The rakers act to slow and redirect the particle, thus imparting
drag to it. Then, when the particle and the flow move at the same speed, the drag on the
particle resulting from the flow is very small (0). This also indicates that the effect of
gravity is very small based on the particle size and density.
The drag on the particle then increases when the particle and the flow deviate in
direction as the water passes between the gill rakers but the particle is retained in the
mainstream flow inside the oral cavity (e.g., dotted curve at 0.04 s in Fig. 7a). The reason
for the increased drag is that, when the water turns to pass between the rakers, the inertial
force of the particles causes them to move against the flow. This inertial force and the
consequent drag can result in the retention of particles inside the oral cavity because,
when water turns to exit between the rakers, particles can deviate from these streamlines

22
and continue to travel with the mainstream flow towards the posterior oral cavity.
The effects of particle density and size on drag are also quantified. Figure 7a shows
that, initially, there is no substantial difference between the drag on particles of the same
size with different densities. However, after the particles start to move with the ambient
flow, particles that are more dense and therefore have a larger inertial force tend to not
follow the flow as closely, which causes those particles to experience a higher drag.
Additionally, the results show that particle size has substantially greater effects on
particle drag than does particle density (Fig. 7b vs. 7a), which means that particle size has
a greater potential influence on particle retention than does particle density under the
conditions in this study. Size-selective particle retention in suspension-feeding fish has
often been associated with dead-end sieving, during which particles that are too large to
pass through the gaps between gill rakers are retained on the raker surfaces [1]. The
results illustrated in Figure 7 demonstrate that hydrodynamic processes could be
responsible for size-selective particle retention during crossflow filtration in
suspension-feeding fish, and that particle density could also play a role in determining
which particles are retained inside the oral cavity. In particular, the results indicate that
the fluid dynamics of particles with larger sizes and/or higher densities warrant further
study in suspension-feeding fishes.
23
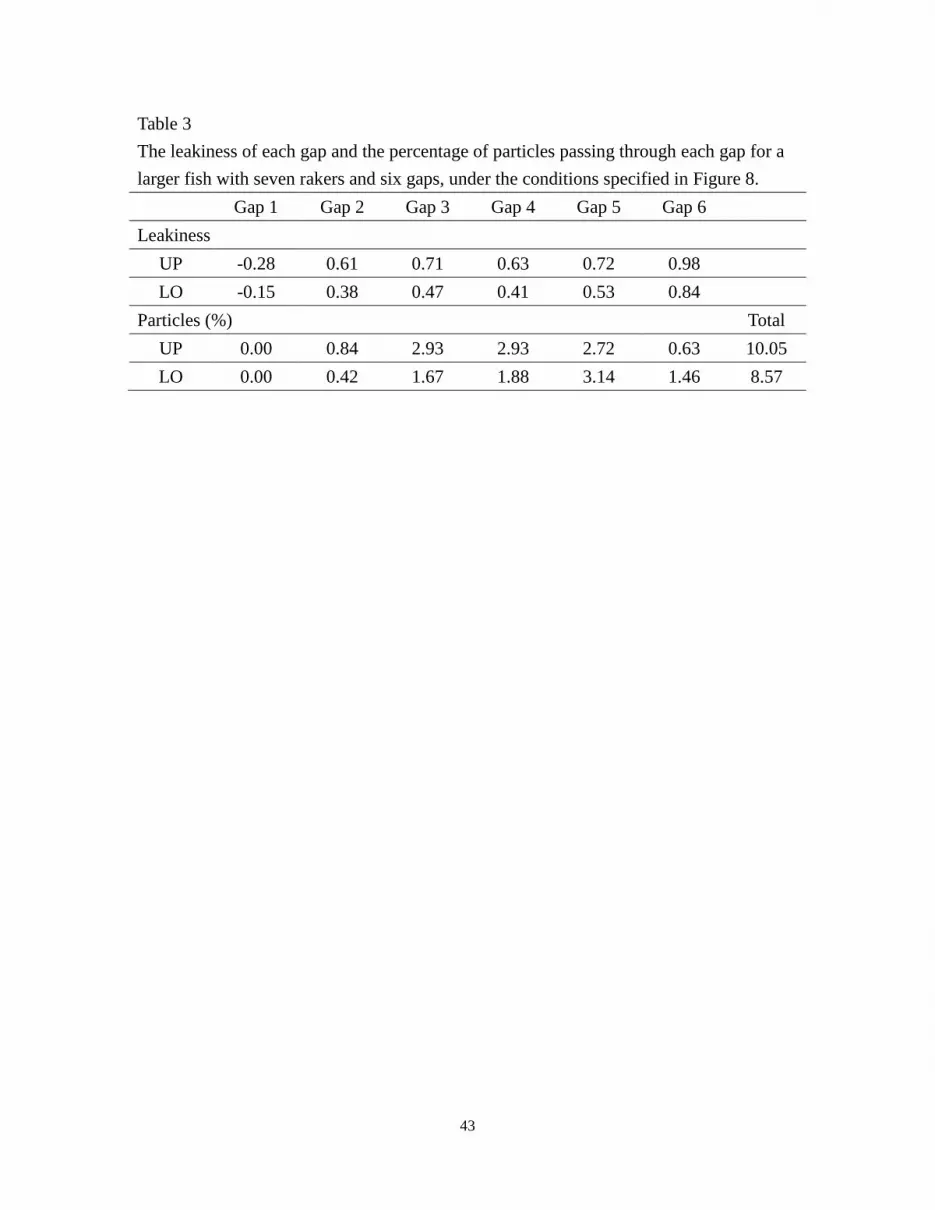
3.6. Simulation of larger fishes
The effects of larger gill rakers are investigated by using cylinders that are 80% longer
and 80% wider (675 μm in the major axis, 450 μm in the minor axis), with the same
height and gap distance (Fig. 8). In Table 3, the negative value of leakiness at Gap 1
indicates that a reverse flow occurs in that gap. In general, the leakiness is greater for
larger gill rakers than for smaller rakers, with more fluid exiting through gaps 2-6 of the
larger rakers (Tables 2 and 3).
In the simulations of the larger rakers, almost all of the particles that pass through
the upper and lower parts of the gaps exit from the oral cavity. The reason for this is
that particles passing through the gaps are washed downstream toward the lateral wall of
the oral cavity with a larger flow component in that direction, and are then forced down
through the branchial slit (Fig. 9). There is almost no upward flow component between or
behind the larger rakers until further downstream, giving the particles little opportunity to
move upward. However, the percentage of particles retained inside the oral cavity of fish
with larger rakers is only slightly lower than that of fish with smaller rakers (83% and
89% respectively, Figs. 6 and 8). This result indicates that CFD studies of changes in
raker size, gap size, and particle sizes retained as the fish grows will be needed to

24
understand the hydrodynamic factors determining the retention of food particles with
growth of the fish.
4. Conclusion
In crossflow filtration, the mainstream flow travels across (tangential to) the filter surface,
rather than traveling perpendicularly through the filter as in a colander or gravy strainer.
Filtered fluid (filtrate) passes through the filter, but the mainstream flow across the filter
reduces the accumulation of particles on the filter surface and thereby minimizes
clogging of the filter pores. During crossflow filtration in suspension-feeding fishes, most
food particles remain suspended in the mainstream flow and travel towards the posterior
oral cavity without contacting oral surfaces. Although the fluid dynamics of industrial
crossflow filtration have been studied extensively, biological crossflow filtration remains
relatively unexamined.
Our studies of fish oral structures using computational fluid dynamics (CFD)
provide insights into the mechanisms of crossflow filtration in suspension-feeding fishes
by identifying physical parameters that affect flow patterns which, in turn, determine
particle movement and retention inside the oral cavity. These CFD studies are consistent
with reports of endoscopic experiments in suspension-feeding fishes, during which the

25
majority of food particles have been observed to travel suspended in the mainstream flow
towards the posterior oral cavity [9, 27, 31].
A significant finding from our study is that the velocity and incident angle of the
approaching flow are important in generating vortices that partially block the flow of
water between and over the gill rakers. In our simulations, these vortices reduce the
effective size of the gap between rakers by approximately 50%. This result has significant
ecological implications because this hydrodynamic mechanism could explain the reported
ingestion of food particles that are otherwise small enough to be lost through
unobstructed gaps between rakers [32].
Our simulations also indicate that size-selective particle retention inside the oral
cavity could occur due to the effects of drag on particles in the region of the gill rakers,
and that particle density could also play a role in determining which particles are retained
inside the oral cavity for subsequent swallowing. Our results demonstrate how particle
density and particle size affect the inertial force and therefore the drag on particles as they
deviate in direction from the water that turns to pass between the rakers (Fig. 7). The role
of particle size is well understood in the context of models of dead-end sieving, in which
particles that are too large to pass between filter elements are retained on the filter surface
[33, 34]. However, the potential importance of particle size and particle density in

26
influencing particle retention due to hydrodynamic processes during crossflow filtration
in fishes has not been elucidated previously. This discovery has substantial implications
for ecological studies of suspension-feeding fishes, as particle size and density could
affect hydrodynamic processes resulting in the retention of particles that would otherwise
be small enough to pass between filter elements.
Given the impacts of the speed and approaching angle of the flow, our study
emphasizes the importance of devising methods to accurately measure flow parameters at
the level of the gill rakers. Such characteristics of the flow change during gill arch
abduction/adduction and during ontogeny. These results also illustrate the importance of
downstream barriers, such as the lateral and posterior walls of the oral cavity, on flow
patterns and particle movements in the region of the gill rakers.
Thus, our computational fluid dynamics studies demonstrate the value of future
empirical experiments to quantify flow parameters inside the oral cavity, as well as the
value of future morphological research to quantify dimensions of the filter apparatus such
as gill rakers, the gaps between rakers, and downstream barriers. Ecological studies on
feeding selectivity and gut contents of suspension-feeding fishes are also needed to
quantify food particle size and density, as these variables can affect particle retention due
to hydrodynamic processes.

27
Acknowledgements This work was supported by NSF grant IOS-0444554 and NSF
grant DMS-0532308 (A. Cheer, Co-PI), and NSF grant IBN-0131293 (S.L. Sanderson,
PI).
References
1. S. D. Gerking (1994) Feeding Ecology of Fish, Academic Press, New York.
2. S. L. Sanderson and R. Wassersug (1993) in J. Hanken and B. K. Hall (Eds.), The
Skull, Vol 3, Functional and Evolutionary Mechanisms, The University of Chicago
Press, Chicago, pp. 37-112.
3. FAO (Food and Agriculture Organization of the United Nations) (2000) Yearbook of
Fishery Statistics, Vol 86, 1998 Capture Production, FAO, Rome.
4. W. Hoogenboezem, F. A. Sibbing, J. W. M. Osse, J. G. M. van den Boogaart, E. H. R.
R. Lammens, and A. Terlouw (1990) X-ray measurements of gill-arch movements in
filter feeding bream, (Abramis brama, Cyprinidae), J. Fish Biol. 36, 47-58.
5. S. L. Sanderson, J. J. Cech, Jr., and M. R. Patterson (1991) Fluid dynamics in
suspension-feeding blackfish, Science 251,1346-1348.
6. W. Hoogenboezem, E. H. R. R. Lammens, P. J. MacGillavry, and F. A. Sibbing (1993)
Prey retention and sieve adjustment in filter-feeding bream (Abramis brama)
(Cyprinidae), Can. J. Fish. Aquat. Sci. 50, 465-471.
7. C. van den Berg, G. R. M. Van Snik, J. G. M. van den Boogaart, F. A. Sibbing, and J.
W. M. Osse (1994) Comparative microanatomy of the branchial sieve in three
sympatric cyprinid species, related to filter-feeding mechanisms, J. Morph.
219,73-87.
8. S. L. Sanderson, M. C. Stebar, K. L. Ackermann, S. H. Jones, I. E. Batjakas, and L.
Kaufman (1996) Mucus entrapment of particles by a suspension-feeding tilapia
(Pisces: Cichlidae). J. Exp. Biol. 199,1743-1756.
9. S. L. Sanderson, A. Y. Cheer, J. S. Goodrich, J. D. Graziano, and W. T. Callan (2001)
Crossflow filtration in suspension-feeding fishes, Nature 412, 439-441.

28
10. S. L. Sanderson and R. Wassersug (1990) Suspension-feeding vertebrates, Sci. Amer.
262, 96-101.
11. L. J. Zeman and A. L. Zydney (1996) Microfiltration and Ultrafiltration: Principles
and Applications, Dekker, New York.
12. E. L. Brainerd (2001) Caught in the crossflow, Nature 412, 387-388.
13. P. Bacchin, D. Si-Hassen, V. Starov, M. J. Clifton, and P. Aimar (2002) A unifying
model for concentration polarization, gel-layer formation and particle deposition in
cross-flow membrane filtration of colloidal suspensions, Chem. Eng. Sci. 57, 77-91.
14. B. Espinasse, P. Bacchin, and P. Aimar (2002) On an experimental method to
measure critical flux in ultrafiltration, Desalination 146, 91-96.
15. A. Y. Cheer, S. Cheung, and S. L. Sanderson (2004) Computational fluid dynamics of
crossflow filtration in suspension-feeding fishes, Proceedings of the Third
International Conference on Computational Fluid Dynamics (ICCFD3), 3: 81-87.
16. D. Lane (1994) in D. Bergeron and A. Kaufman (Eds.) Proceedings of Visualization
'94, IEEE, Washington, D.C.
17. A. Putnam (1961) Integratable form of droplet drag coefficient, ARS J.
31,1467-1468.
18. T. H. Pulliam and J. L. Steger (1980) Implicit finite-difference simulations of
3-dimensional compressible flow. AIAA J. 18, 159-167.
19. J. L. Steger, S. X. Ying, and L. B. Schiff (1986) A partially flux split algorithm for
numerical simulation of compressible inviscid and viscous flow, Proceedings of
Workshop on Computational Fluid Dynamics, University of California, Davis, CA.
20. T. H. Pulliam and D. S. Chaussee (1981) A diagonal form of an implicit
approximate-factorization algorithm. J. Comput. Phys. 39, 347-363.
21. P. L. Roe (1981) Approximate Riemann solvers, parameter vectors, and
difference-schemes. J. Comput. Phys. 43, 357-372.
22. S. L. Sanderson, J. J. Cech, Jr., and A. Y. Cheer (1994) Paddlefish buccal flow
velocity during ram suspension feeding and ram ventilation. J. Exp. Biol.
186,145-156.
23. J. C. Smith and S. L. Sanderson (2008) Intra-oral flow patterns and speeds in a
suspension-feeding fish with gill rakers removed versus intact, Biol. Bull. 215,
309-318.
24. D. I. Rubenstein and M. A. R. Koehl (1977) The mechanisms of filter feeding: some
theoretical considerations, Am. Nat. 111, 981-994.
25. M. LaBarbera (1984) Feeding currents and particle capture mechanisms in suspension
feeding animals, Am. Zool. 24, 71-84.

29
26. J. Shimeta and P. A. Jumars (1991) Physical mechanisms and rates of particle capture
by suspension-feeders, Oceanogr. Mar. Biol. Annu. Rev. 29, 191-257.
27. A. Y. L. Cheer and M. A. R. Koehl (1987) Paddles and rakes: fluid flow through
bristled appendages of small organisms, J. Theor. Biol. 129, 17-39.
29. J. C. Smith and S. L. Sanderson (2007) Mucus function and crossflow filtration in a
fish with gill rakers removed versus intact, J. Exp. Biol. 210, 2706-2713.
30. J. E. Ward, L. P. Sanford, R. I. E. Newell, and B. A. MacDonald (1998) A new
explanation of particle capture in suspension-feeding bivalve molluscs, Limnol.
Oceanogr. 43,741-752.
31. W. T. Callan and S. L. Sanderson (2003) Feeding mechanisms in carp: crossflow
filtration, palatal protrusions and flow reversals, J. Exp. Biol. 206, 883-892.
32. A. Langeland and T. Nst (1995) Gill raker structure and selective predation on
zooplankton by particulate feeding fish, J. Fish Biol., 47, 719-732.
33. J. R. Mummert and R. W. Drenner (1986) Effect of fish size on the filtering
efficiency and selective particle ingestion of a filter-feeding clupeid, Trans. Am. Fish.
Soc. 115, 522-528.
34. K. D. Friedland, D. W. Ahrenholz, J. W. Smith, M. Manning, and J. Ryan (2006)
Sieving functional morphology of the gill raker feeding apparatus of Atlantic
menhaden, J. Exp. Zool. 305A, 974-985.

30
Fig. 1 The geometric structure used for the simulation of the oral cavity of a
suspension-feeding fish. The model used for actual simulation has eight cylinders rather
than four. Water and particles that exit from the branchial slit or via Face C leave the oral
cavity; otherwise they are retained. (Fish on left modified from [10].)
Branchial Slit
Gill Arch
Gill Raker
Bony Cover
B
C
D
A
X Y
Z

31
Gap 7
Gap 6
Gap 5
Gap 4
Gap 3
Gap 2
Gap 1
(a) (b) (c) Face C
Face A
β
Y
X
(d)

32
Fig. 2 The velocity vectors on three horizontal cross-sections, (a) 200 μm, (b) 400 μm,
and (c) 600 μm from the base of the cylinders. Gap 4 and Gap 5 are replaced by the path
lines of the flow to have a clearer view of the flow patterns. The parameters are elliptic
cylinders (375 μm major axis, 250 μm minor axis, 650 μm height, gap distance of 250
μm), flow speed of 60 cm/s, incident angle of 75° from the positive x-axis (), and angle
of attack of 75° from the positive z-axis. The color is coded to the magnitude of the
velocity component in the x direction (normal direction through the gap). (d) is an
enlarged view of the velocity vectors at Gap 4 in each case.

33
Fig. 3 The velocity vectors on a vertical plane between two cylinders (Gap 5). The
cylinders are outlined in white. The color is coded to the magnitude of the velocity
component in the z direction.
Face D

34
(c) (b) (a)
β
Y
X
Face C
Face A
(d)

35
Fig. 4 The velocity vectors on the horizontal cross-sections measured 400 μm from the
base of the cylinders. The conditions are (a) flow speed of 10 cm/s and incident angle β
of 75°, (b) 60 cm/s and 75°, and (c) 60 cm/s and 60°, The color is coded to the
magnitude of the velocity component in the x direction, and Gap 4 and Gap 5 are
replaced by path lines for flow at a height of 400 μm. (d) is an enlarged view of the
velocity vectors at Gap 4 in each case.
36
Fig. 5 The particle trajectories under different conditions. The parameters are: (a)
particles with diameter of 82.5 μm and density of 1050 kg/m3, flow speed of 60 cm/sec,
and incident angle of 75°, (b) 82.5 μm, 1190 kg/m3, 60 cm/sec, and 75°, (c) 165 μm, 1050
kg/m3, 60 cm/sec, and 75°, (d) 82.5 μm, 1050 kg/m
3, 10 cm/sec, and 75°, and (e) 82.5 μm,
1050 kg/m3, 60 cm/sec, and 60°.
(a) 82.5 μm, 1050 kg/m3, 60 cm/sec, and 75° (d) 82.5 μm, 1050 kg/m
3, 10 cm/sec, and 75°
(e) 82.5 μm, 1050 kg/m3, 60 cm/sec, and 60° (b) 82.5 μm, 1190 kg/m
3, 60 cm/sec, and 75°
(c) 165 μm, 1050 kg/m3, 60 cm/sec, and 75°
X Y
Z

37
Fig. 6 The particle trajectories of 466 uniformly distributed particles. The parameters
are elliptic cylinders with 375 μm in length and 250 μm in width, gap distance of 250 μm,
flow speed of 60 cm/s, particle diameter of 82.5 μm, particle density of 1050 kg/m3,
incident angle of 75°, and angle of attack 15°. The large arrows show the directions that
particles travel and the percentage in each direction. Note that the particles travelling in
the positive z direction are retained in the oral cavity.
0.0%
86.9%
1.5%
11.2% C
A
B
D
Z Y X

38
Fig. 7 The comparisons of drag between particles released at the same location (a) with
different densities and (b) with different sizes.
(a)
(b)

39
Fig. 8 The particle trajectories of 478 uniformly distributed particles in the oral cavity
of a larger fish with seven rakers. The parameters are elliptic cylinders with 675 μm in
length and 450 μm in width, gap distance of 250 μm, flow speed of 60 cm/s, particle
diameter of 165 μm, particle density of 1050 kg/m3, incident angle of 75°, and angle of
attack 15°. The large arrows show the directions that particles travel and the percentage in
each direction.
0.0%
82.6%
2.1%
14.9%
Y Z
X
B
C
D
A

40
Fig. 9 The velocity vectors on a vertical plane between two larger cylinders (Gap 4).
The cylinders are outlined in white. The color is coded to the magnitude of the velocity
component in the z direction.
Face D

41
Table 1
The mass flow rate and leakiness of each gap between rakers under different conditions. Shaded columns indicate gaps that
approximate a periodic solution.
Gap # 1 2 3 4 5 6 7
UP** LO** UP LO UP LO UP LO UP LO UP LO UP LO
v = 60 cm/s, β = 75°, Re*** = 225
MFR* 0.08 0.57 6.73 2.80 6.47 3.80 5.81 3.68 6.11 4.15 6.57 5.49 10.11 9.80
Leakiness 0.01 0.05 0.55 0.23 0.53 0.31 0.48 0.30 0.50 0.34 0.54 0.45 0.83 0.80
v = 10 cm/s, β = 75°, Re = 37.5
MFR 0.67 0.44 0.59 0.39 0.49 0.33 0.47 0.31 0.51 0.34 0.67 0.46 1.00 0.76
Leakiness 0.33 0.21 0.29 0.19 0.24 0.16 0.23 0.15 0.25 0.17 0.33 0.22 0.49 0.37
v = 60 cm/s, β = 60°, Re = 225
MFR 16.96 16.13 16.70 15.25 16.45 14.72 16.57 14.57 16.81 15.02 17.37 15.88 22.78 19.73
Leakiness 0.72 0.68 0.71 0.65 0.70 0.62 0.70 0.62 0.71 0.64 0.74 0.67 0.97 0.84
* MFR = Mass flow rate (kg/sec) × 10-6
** UP = upper part of the gap; LO = lower part of the gap
*** The Reynolds numbers were calculated using the major axis of the rakers and the assigned flow speeds (v) entering the system

42
Table 2
The leakiness of each gap and the percentage of particles passing through each gap under
the conditions specified in Figure 6 (82.5 μm particle diameter, 1050 kg/m3
particle
density, 60 cm/s flow speed, and 75° incident angle).
Gap 1 Gap 2 Gap 3 Gap 4 Gap 5 Gap 6 Gap 7
Leakiness
UP 0.01 0.55 0.53 0.47 0.50 0.54 0.83
LO 0.05 0.23 0.31 0.30 0.34 0.45 0.80
Particles (%) Total
UP 1.72 4.94 2.15 2.15 3.65 1.72 0.21 16.54
LO 0.43 4.72 2.36 1.93 2.15 3.00 2.58 17.17
43
Table 3
The leakiness of each gap and the percentage of particles passing through each gap for a
larger fish with seven rakers and six gaps, under the conditions specified in Figure 8.
Gap 1 Gap 2 Gap 3 Gap 4 Gap 5 Gap 6
Leakiness
UP -0.28 0.61 0.71 0.63 0.72 0.98
LO -0.15 0.38 0.47 0.41 0.53 0.84
Particles (%) Total
UP 0.00 0.84 2.93 2.93 2.72 0.63 10.05
LO 0.00 0.42 1.67 1.88 3.14 1.46 8.57


![[IJCST-V3I4P38]:Chisty, Jasmeen Gill](https://img.pdfslide.net/doc/110x75/6341301551b74a16bf0bdb43/ijcst-v3i4p38chisty-jasmeen-gill.jpg)


