Embed Size (px)
Citation preview
Computer-Assisted Behavioral Assessmentof Pavlovian Fear Conditioning in MiceStephan G. Anagnostaras, Sheena A. Josselyn, Paul W. Frankland, andAlcino J. Silva1
Departments of Neurobiology, Psychiatry, and PsychologyBrain Research InstituteUniversity of CaliforniaLos Angeles, California 90095 USA
Abstract
In Pavlovian fear conditioning, aconditional stimulus (CS, usually a tone) ispaired with an aversive unconditionalstimulus (US, usually a foot shock) in anovel context. After even a single pairing,the animal comes to exhibit a long-lastingfear to the CS and the conditioning context,which can be measured as freezing, anadaptive defense reaction in mice. Bothcontext and tone conditioning depend onthe integrity of the amygdala, and contextconditioning further depends on thehippocampus. The reliability and efficiencyof the fear conditioning assay makes it anexcellent candidate for the screening oflearning and memory deficits in mutantmice. One obstacle is that freezing in micehas been accurately quantified only byhuman observers, using a tedious methodthat can be subject to bias. In the presentstudy we generated a simple, high-speed,and highly accurate algorithm that scoresfreezing of four mice simultaneously usingNIH Image on an ordinary Macintoshcomputer. The algorithm yielded a highcorrelation and excellent linear fit betweencomputer and human scores across a broadrange of conditions. This included theability to score low pretraining baselinescores and accurately mimic the effects oftwo independent variables (shock intensityand test modality) on fear. Because we useda computer and digital video, we were ableto acquire a secondary index of fear, activity
suppression, as well as baseline activityscores. Moreover, we measured theunconditional response to shock. Theseadditional measures can enhance thesensitivity of the assay to detect interestingmemory phenotypes and control forpossible confounds. Thus, thiscomputer-assisted system for measuringbehavior during fear conditioning allows forthe standardized and carefully controlledassessment of multiple aspects of the fearconditioning experience.
In Pavlovian fear conditioning, a conditionalstimulus (CS, usually a tone) is paired with an aver-sive unconditional stimulus (US, usually a shock) ina novel conditioning chamber. After even a singlepairing, the animal comes to exhibit a long-lastingfear to the CS, which can be measured as freezing,an adaptive defense reaction, in rats and mice(Bolles 1970; Fanselow and Bolles 1979; Fanselow1990; Bourtchuladze et al. 1994). Animals will alsoexhibit fear to the conditioning chamber and othercircumstances surrounding the conditioning epi-sode; this phenomenon has come to be known ascontext conditioning (Nadel 1980; Kim andFanselow 1992; Phillips and LeDoux 1992;Bourtchuladze et al. 1994; Paylor et al. 1994).
In recent years, considerable progress hasbeen made concerning the molecular, cellular, andneuroanatomical substrates of fear conditioning(Silva et al. 1998). For example, the amygdala hasbeen found to play an essential role in fear condi-tioning, because lesions of this structure produce ageneral disruption of conditioned fear (Phillips andLeDoux 1992; Lee et al. 1996; Maren and Fanselow1996; Maren et al. 1996b; McNish et al. 1997). More-over, blockage of N-methyl-D-aspartate (NMDA)receptors in the amygdala, which disrupts the in-1Corresponding author.
LEARNING & MEMORY 7:58–72 © 2000 by Cold Spring Harbor Laboratory Press ISSN1072-0502/00 $5.00
&L E A R N I N G M E M O R Y
58
Cold Spring Harbor Laboratory Press on August 25, 2016 - Published by learnmem.cshlp.orgDownloaded from
duction of long-term potentiation (LTP), blocks theacquisition of fear conditioning (Collingridge et al.1983; Kim et al. 1991; Campeau et al. 1992; Marenet al. 1996a; Rogan et al. 1997; Lee and Kim 1998).In contrast, the hippocampus plays a more selec-tive role in fear conditioning, because lesions ofthe hippocampus (or NMDA receptor disruption)produce a more selective deficit in contextual fearrather than tone fear (Phillips and LeDoux 1992;Chen et al. 1996; Logue et al. 1997; Maren andFanselow 1997; Frankland et al. 1998; Gerlai 1998;see also Cho et al. 1999). Furthermore, post-train-ing hippocampal lesions produce a temporallygraded retrograde amnesia (RA) of contextual fear,in a manner analogous to the RA of declarativememory in humans (Scoville and Milner 1957; Kimand Fanselow 1992; Squire 1992; Maren et al. 1997;Anagnostaras et al. 1999). Thus, evidence hasamassed that contextual fear conditioning may bean assay of function of the same memory systemthat mediates declarative learning in humans andthat fear conditioning is dependent on the induc-tion of LTP, a prominent synaptic model of learn-ing.
Advances in mouse molecular biology and ge-netics have generated many new tools that may beused to examine the molecular and cellular mecha-nisms that subserve learning and memory. Fearconditioning is an excellent candidate for the ge-netic analysis of learning and memory for severalreasons: (1) Mice exhibit robust conditioned freez-ing even after a single training trial; (2) the assay isnot labor intensive and for this reason may be use-ful in large screening studies; (3) fear conditioningis a form of Pavlovian conditioning that has beenthoroughly characterized psychologically; (4) theequipment required is relatively standardized andwidely available; (5) the learning episode is punc-tate and brief potentially allowing memory phasesto be dissociated; (6) there is extensive informa-tion regarding the neuroanatomical substrates offear; and (7) fear conditioning has already beenused extensively in studies of mutant mice.
One limitation of fear conditioning has beenthat the measurement of freezing behavior de-pends on the direct observation by an experimen-tally blind human observer. Freezing is defined asthe absence of any movement and is usuallysampled every 5–10 sec or measured continuouslyusing a stopwatch (Fanselow and Bolles 1979;Phillips and LeDoux 1992; Bourtchuladze et al.1994; Paylor et al. 1994; Anagnostaras et al. 1999).Although freezing has proven to be a reliable index
of fear, direct observation of freezing is quite te-dious and may be susceptible to observer bias.Moreover, it would be useful to have other indicesof fear because it is possible that the freezing re-sponse, rather than conditioned fear, may be com-promised by any particular experimental manipu-lation (Good and Honey 1997; McNish et al. 1997;Maren 1998; Anagnostaras et al. 1999).
In the present study, we first report an auto-mated technique for the measurement of freezingand discuss criteria we believe that any computer-ized system should meet. Second, the use of anautomated system allows us to measure a second-ary index of fear, activity suppression, that ex-pands the ability of this assay to detect deficits infear. Third, we examine the unconditional re-sponse (UR) to shock in mice using the techniquedescribed more extensively in a forthcoming paperusing rats (see B.P. Godsil, J.R. Spooner, S.G. An-agnostaras, G.D. Gale, and M.S. Fanselow, un-publ.). Finally, we verify the retrograde amnesia ofcontextual fear produced by dorsal hippocampallesions using the new computerized system.
Materials and Methods
CONDITIONING CHAMBERS
Each conditioning chamber (32 cm wide × 25cm high × 25 cm deep; Med-Associates Inc., ENV-008VP) was equipped with a speaker (ENV-224AM) in the side wall of the chamber and a stain-less steel grid floor designed for mice (ENV-005AX;36 rods, each rod 2-mm diameter, 8-mm center tocenter; the front and back anchoring walls werecustom ordered as clear acrylic). The grid floor wasover a stainless steel drop-pan (ENV-007A3), whichwas lightly cleaned with 95% ethyl alcohol to pro-vide a background odor. The front, top, and backof the chamber were made of clear acrylic and thetwo sides were made of modular aluminum (ENV-008FP). The conditioning chambers were arrangedin a 2 × 2 configuration on a steel rack. The rackwas in an isolated room; the room walls werepainted white, and, in particular, the wall behindthe chambers was matte white. The room was litby one overhead 100-W incandescent bulb in atranslucent fixture and two tall 300-W halogentorch lamps, which were to the sides of the rack.Background noise (65-dB) was supplied by a HEPAair cleaner set to medium position (CFM-52500;Honeywell Inc.). The rack was directly in front ofa wall-mounted color camera (Sony SSC-S20),
COMPUTERIZED ASSESSMENT OF FEAR
&L E A R N I N G M E M O R Y
59
Cold Spring Harbor Laboratory Press on August 25, 2016 - Published by learnmem.cshlp.orgDownloaded from
which captured all four chambers in its view andwas connected to a computer and video equip-ment in an adjacent room (see below). Each cham-ber was connected (ENV-407A) to a solid-statescrambler (ENV-412) and an audio stimulus genera-tor (ANL-926) located in a cabinet (SG-6500; SG-220; connected to power source SG-501) in theadjacent room. Each scrambler was connected (SG-219) to an electronic constant current shocksource (ENV-413) located in 2 cabinets (SG-6080C), and all stimuli were controlled via an in-terface (DIG-729; DIG-700P1) connected to a Gate-way Windows 98 computer running WindowsMed-PC (v. 3.1) and Borland Turbo Pascal software(SOF-700W; SOF-303W).
VIDEO/COMPUTER EQUIPMENT
The camera was connected via an S videocable to an inexpensive Iomega Buz video digitizer(Iomega Inc.) in a Power Macintosh G3/266(Apple Computer Inc.) equipped with 288 MB ofRAM. The software used was NIH Image (v. 1.62),Microsoft Excel (Office 98), and Quickeys (v. 3.52;CE Software Inc., West Des Moines, IA; Quickeysmacros were used for convenience; we have sub-sequently rewritten them into NIH Image). Oneimportant note is that at the time of this writing,NIH Image is incompatible with the Macintosh G3series built-in digitizer supplied by Apple (non-G3digitizers will work). However, we achieved satis-factory compatibility and performance using theIomega Buz and NIH should be consulted regard-ing compatibility with other digitizers. The camerawas also connected via an RCA cable to a standardVHS VCR (Sony SLV-788HF) and displayed on a20-inch video display for human observers. TheVCR output was also connected to the digitizer viaan RCA cable. For activity burst analyses (see be-low), a Turbomouse trackball (Kensington Micro-ware Limited, San Mateo, CA) with four program-mable buttons was particularly useful.
SUBJECTS
In the pilot experiment, eight female C57BL/6J mice (8 months old at the time of testing) pur-chased from the Jackson Laboratory (Bar Harbor,ME) were used. For Figure 1 four female C57BL/6NTacfBr mice (4–5 months old) purchased fromTaconic Farms (Germantown, NY) were used. Inexperiments 1 and 2, 40 and 20 female C57BL/
6NTacfBr mice (4–5 months old), respectively,purchased from Taconic Farms were used. All micewere housed in groups of four, were maintainedon a 14:10 light/dark cycle, and had unrestrictedaccess to food and water. All testing was done dur-ing the mid-light cycle.
OBSERVER SCORING
Two blind observers scored freezing by view-ing a video monitor in a room separate from themice during the test period. Freezing was definedas the absence of visible movement except thatrequired for respiration (fluctuation in the volumeof the thorax) and was scored according to an8-sec instantaneous time-sampling procedure(Fanselow and Bolles 1979). Every 2 sec a 250-msec computer-generated beep signaled the ob-server to score; the observer scored the animal asfreezing or not at that instant and then proceededto the next chamber when the next beep oc-curred; after chamber 4, the observer started againwith chamber 1. Thus each animal was scored ev-ery 8-sec, yielding eight observations for eachmouse for each minute of each test. These wereconverted into percent time freezing scores by di-viding the number of freezing observations by thetotal number of observations for each mouse. Thetwo observers (S.A. and S.J.) had many years ofexperience quantifying behavior in animals.
COMPUTER SCORED-FREEZING
The principle feature of any computerizedfreezing system is simple: Because freezing is de-fined as the absence of any visible movement,movement must be measured, and then near-zeromovement can be equated with freezing. Themovement threshold required to yield good freez-ing scores can be determined empirically by exam-ining the correspondence (correlation and linearfit) between computerized and observer-basedscoring. One problem is that the movement indexmust be sensitive enough to detect small move-ments such as grooming that are clearly not scoredas freezing by human observers. Moreover, themovement scores provided by the computer forthese small movements need to be substantiallygreater than the normal noise that occurs in allanalog signals. That is, the freezing threshold mustbe both below the signal for small movements butwell above that of the normal video noise. Finally,
Anagnostaras et al.
&L E A R N I N G M E M O R Y
60
Cold Spring Harbor Laboratory Press on August 25, 2016 - Published by learnmem.cshlp.orgDownloaded from
the movement index must not be particularly com-puting intensive, to allow the assessment of 5 minof freezing data from a squad of four mice in apractical amount of time (1 or 2 min).
Baseline noise data from our video system wascollected by digitizing 122 sec of full-screen livevideo of the empty conditioning chambers (here-after referred to as the “noise video”) at 1 Hz in8-bit greyscale using NIH Image with the IomegaBuz operating as a Quicktime digitizer. This videowas separated into four separate stacks cropped tothe portions of the chambers where a mouse couldbe found (we have subsequently developed soft-ware to skip this step, using the NIH Image regionof interest (ROI) techique). Three candidate-de-pendent variables were taken to index movementfrom frame-to-frame. First, we could directly com-pare frame-to-frame by thresholding each frame toa 1-bit image, taking the pixels that differed withthe next frame (exclusive of function), and thencounting them. This computing-intensive tech-nique has been used previously by Kim et al.(1993). Second, activity could be indexed simplyby taking some measure of each frame and com-paring with the same measure in the next frame.Two measures were taken, which are both auto-mated and high speed in NIH Image: mean 8-bitgrayscale optical density of the picture and stan-dard deviation of the optical density. The variabil-ity of these measures was examined for severalnoise videos; to reduce noise overall, several modi-fications were made, including reducing the reflec-tive surfaces in the room (reducing the amount ofgloss paint behind the chambers and reducingmetal surfaces), altering the camera angle and digi-tized space to reduce visible metal surfaces, andimproving the evenness of lighting by reducing di-rect lighting and increasing brightness overall.However, modifications were not exhaustive inthis respect, in that, for example, a single camerawas not restricted to a single conditioning cham-ber (which would increase the cost) and a moreexpensive digitizer was not used. This placed somechambers at a disadvantage because of the cameraangle and lighting (the lower chambers in particu-lar), but this was used to test the resiliency of thesystem rather than altering the conditioning set-upany further.
After examination of the noise data it was im-mediately apparent that the “number-of-pixels”method was not fast enough to be practical. It took> 10 min to obtain measures of a single squad (fourmice) of 5-min data (even on the high-end comput-
ing equipment), whereas the other two dependentmeasures could be computed in <60 sec. There-fore, we primarily concentrated on these morepractical measures of digital video movement.
After this, two squads of four mice each wereplaced into a simple conditioning paradigm so thatwe could obtain pilot data (Pilot experiment).Prior to placement of the mice, a final 122-secnoise video was digitized (as above) and was usedin all further noise analyses. Mice were then placedinto the chambers and after 122 sec they receiveda single 2-sec, 1-mA scrambled footshock. Sixty seclater they were returned to their home cages, and30 min later we placed them back in the chambersfor a 122-sec contextual freezing test. Freezing wasscored by human observers for both the 122-secbaseline (BL) and 122-sec context (test) periods asis shown in Table 1A. Human measurementsshowed that these mice exhibited the characteris-tically near-zero baseline freezing (0.4%) that isusually observed in a novel context and typicalaverage freezing (32.1%) for the test period. Livefull-screen 8-bit greyscale video during both peri-ods was also digitized at 1 Hz using NIH Image.This video was cropped into four separate stacks(this step was subsequently eliminated). Mean den-sity and standard deviation of the density (distur-bance) were measured (to eight decimal places toincrease sensitivity) for every frame of all fourstacks using a Quickeys macro (subsequently re-placed with an Image macro) and NIH Image; thisgenerated 122 density and 122 disturbance valuesfor each mouse for each test. We pasted these val-ues into Microsoft Excel to process them into freez-ing scores using several algorithms to determinewhich method could yield accurate freezing esti-mates.
In all cases, the basic strategy was the same:We used the change in the density or disturbanceas an index of movement from frame to frame andset a low threshold (above video noise); any obser-vations below this threshold are defined as freez-ing. These freezing observations were computedinto a percent time freezing for each mouse bydividing them over the total number of observa-tions. These percent time freezing scores werecompared with human observers for validity andcalibration.
Retrospectively, several criteria were impor-tant. (1) The algorithm should use identical thresh-olds for every test, every chamber, and everymouse, as having many user-defined free param-eters could actually increase subjective bias in the
COMPUTERIZED ASSESSMENT OF FEAR
&L E A R N I N G M E M O R Y
61
Cold Spring Harbor Laboratory Press on August 25, 2016 - Published by learnmem.cshlp.orgDownloaded from
measurement of freezing rather than decrease it.(2) The method should score low baseline freezingusing the exact same criteria that it scores contexttest freezing equivalent to human observers. Highbaseline freezing reflects a movement thresholdthat is set too high and is scoring small movements(such as grooming) as freezing; this high baselinewould “clip” the overall dynamic range of thefreezing assay by introducing an artificial floor(e.g., Valentinuzzi et al. 1998). (3) The methodshould score all video noise as nonmovement. Thatis, if there is no mouse in the chamber, or if amouse shows 100% freezing, the computer shouldconsider this freezing as nothing is moving insidethe chamber. We refer to this as noise rejection. Ifany noise is accepted as nonfreezing movementthe method would be incapable of scoring veryhigh freezing, because some proportion of videonoise is interpreted by the computer as animalmovement. This would clip the dynamic range ofthe freezing assay by introducing an artificial ceil-ing. That is, the dynamic range of human-observedfreezing is 0–100%; the dynamic range of an auto-mated system will be defined by the baseline (de-
termined primarily by the ability to detect smallmovements) to the ceiling (determined by the abil-ity to reject noise).
We used these criteria to evaluate several algo-rithms for scoring freezing from density and distur-bance data. In each case, a particular frame-to-frame comparison was made. Then, a globalthreshold value was set (to 2 decimal points) thatyielded the best fit (estimated by the differencebetween computer and human means) betweenthe computerized measurement and the freezingdata obtained during the context test by humanobservers. This measurement was the average ofboth human observers. Then, baseline and noisevideo data were examined using this same thresh-old value and algorithm. These are shown in Table1B,C. An acceptable automated system should ac-curately score both freezing during the contexttest, during baseline, and during episodes of 100%freezing. That is, the video noise should not bescored as movement. After going through an evo-lutionary series of algorithms that systematicallyimproved their ability to meet these criteria (Table1), we examined the overall correspondence be-
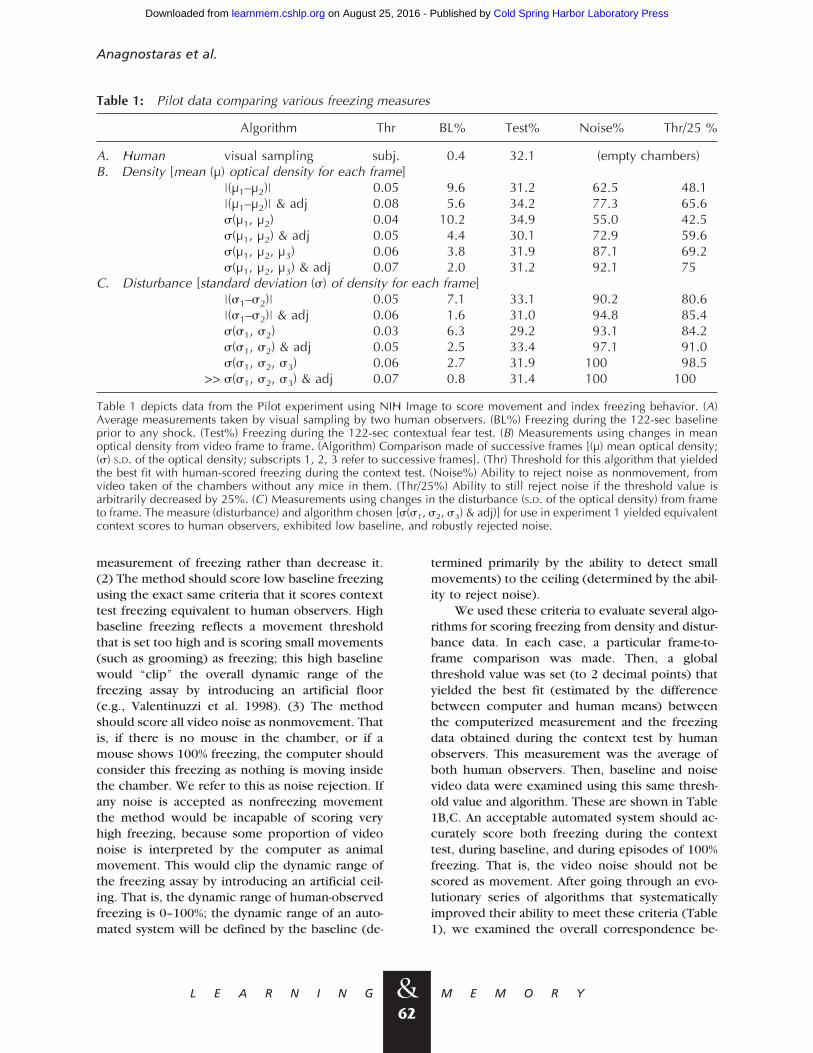
Table 1: Pilot data comparing various freezing measures
Algorithm Thr BL% Test% Noise% Thr/25 %
A. Human visual sampling subj. 0.4 32.1 (empty chambers)B. Density [mean (µ) optical density for each frame]
|(µ1–µ2)| 0.05 9.6 31.2 62.5 48.1|(µ1–µ2)| & adj 0.08 5.6 34.2 77.3 65.6s(µ1, µ2) 0.04 10.2 34.9 55.0 42.5s(µ1, µ2) & adj 0.05 4.4 30.1 72.9 59.6s(µ1, µ2, µ3) 0.06 3.8 31.9 87.1 69.2s(µ1, µ2, µ3) & adj 0.07 2.0 31.2 92.1 75
C. Disturbance [standard deviation (s) of density for each frame]|(s1–s2)| 0.05 7.1 33.1 90.2 80.6|(s1–s2)| & adj 0.06 1.6 31.0 94.8 85.4s(s1, s2) 0.03 6.3 29.2 93.1 84.2s(s1, s2) & adj 0.05 2.5 33.4 97.1 91.0s(s1, s2, s3) 0.06 2.7 31.9 100 98.5
>> s(s1, s2, s3) & adj 0.07 0.8 31.4 100 100
Table 1 depicts data from the Pilot experiment using NIH Image to score movement and index freezing behavior. (A)Average measurements taken by visual sampling by two human observers. (BL%) Freezing during the 122-sec baselineprior to any shock. (Test%) Freezing during the 122-sec contextual fear test. (B) Measurements using changes in meanoptical density from video frame to frame. (Algorithm) Comparison made of successive frames [(µ) mean optical density;(s) S.D. of the optical density; subscripts 1, 2, 3 refer to successive frames]. (Thr) Threshold for this algorithm that yieldedthe best fit with human-scored freezing during the context test. (Noise%) Ability to reject noise as nonmovement, fromvideo taken of the chambers without any mice in them. (Thr/25%) Ability to still reject noise if the threshold value isarbitrarily decreased by 25%. (C) Measurements using changes in the disturbance (S.D. of the optical density) from frameto frame. The measure (disturbance) and algorithm chosen [s(s1, s2, s3) & adj)] for use in experiment 1 yielded equivalentcontext scores to human observers, exhibited low baseline, and robustly rejected noise.
Anagnostaras et al.
&L E A R N I N G M E M O R Y
62
Cold Spring Harbor Laboratory Press on August 25, 2016 - Published by learnmem.cshlp.orgDownloaded from
tween human and automated freezing and thenperformed additional calibration using a larger andmore systematic set of data (Experiment 1). Wewere aware that there may have been a need toadjust the threshold value for freezing. Therefore,we subjected video noise data to an artificial de-crease in threshold of 25%.
We began by using the changes in mean den-sity as our measure of freezing (Table 1B) (Maren etal. 1996; Richmond et al. 1998). The first compari-son that we evaluated was the absolute differencein mean density from one frame to the next[|(µ1 − µ2)|]. Although it could score freezing dur-ing the context test, this algorithm yielded a highbaseline freezing and did not reject video noisewell. To reduce baseline, we introduced the crite-rion that two adjacent nonmoving (below thresh-old) observations needed to be made before freez-ing was scored [|(µ1 − µ2)|] & adj; hereafter re-ferred to as the adjacent observations criteria). Thiscould reduce false baseline freezing scores byeliminating instantaneous momentary inactivitythat may not reflect fear (Maren 1998; Richmond etal. 1998). This reduced baseline and improvednoise rejection, but not to acceptable levels. Thus,a simple difference in mean density is not an ac-ceptable index of freezing because the thresholdrequired to score accurate context freezing is bothabove the signal given by small movements (yield-ing a false high baseline) and below the normalvariability of the noise signal (yielding poor videonoise rejection). Because the poor signal-to-noiseratio, under conditions of small movement,seemed to be the primary problem, we began tofocus our efforts on how to control for it.
We changed the frame-to-frame comparisonfrom a simple difference score of mean densities tothe standard deviation of the mean density valuesfor adjacent frames. This change allowed us to ex-pand the comparison to more than two frames.First, we examined the standard deviation of meandensities between two frames [s(µ1,µ2)]. Thisyielded similar results to the difference score ofmean densities. Therefore, we then used this samealgorithm with the adjacent observations criteriaadded. This modification, however, resulted onlyin minor improvements. Finally, we determinedwhether an algorithm that incorporate the stan-dard deviation of three adjacent frames would im-prove the measure of freezing [s(µ1,µ2,µ3)]. Forexample, observation 1 was s(µ1,µ2,µ3) and obser-vation 2 was s(µ2,µ3,µ4). These changes improvednoise rejection, but not to acceptable levels. Add-
ing the adjacent observations criteria improvedboth baseline and video noise rejection. Neverthe-less, it was apparent that frame-to-frame compari-sons of mean density could not be used to scorefreezing accurately in mice. Although this ap-proach could yield a high correlation with humanscoring within certain ranges of freezing (abovethe baseline and below the video noise level), itwould randomly introduce noise in the measure-ment. This noise is especially problematic at lowand high levels of freezing.
These problems led us to change our strategy.We decided to use a strategy in which the noise ismeasured rather than the actual signal itself. Forexample, a similar strategy has been used to mea-sure miniature excitatory post-synaptic potentials(minis). The signal from these minis is smaller thanthe electric noise recorded. We assumed that thevideo noise is relatively constant and that changesin the video noise could be used to measure move-ment by the animal. To implement this idea, wemeasured the standard deviation of the density foreach video frame (Table 1C). This measure resultedin lower baselines and much better video noiserejection. The algorithm finally chosen used thestandard deviation of the disturbance values fromthree successive frames, as well as the adjacent-observations criterion [s(s1,s2,s3) & adj]. Theimplementation of this algorithm resulted in a near-zero baseline and 100% noise rejection under thesame criteria that it accurately scored contextfreezing. Importantly, it also completely rejectedvideo noise when subjected to large (up to 50%)decrease in threshold (Table 1). This is importantbecause it shows that the system can tolerate awide variety of noise conditions.
Compared with human measurements, this al-gorithm [s(s1,s2,s3) & adj] yielded accurate base-line (Wilcoxon nonparametric paired comparison,P = 0.6) and context [univariate ANOVA,F(1,14) = 0.001, P > 0.99] measurements of freez-ing data that were not significantly different fromhuman-scored freezing. Therefore, this algorithmwas used in all subsequent experiments to scorefreezing.
One important additional note is two addi-tional frames of video were added at the end ofeach captured movie. This allows the system togenerate, for example, 120 comparisons for 122frames of data.
An exact example of how this final algorithmwas used to score freezing is depicted in Figure 1.Figure 1A shows one frame of four mice in four
COMPUTERIZED ASSESSMENT OF FEAR
&L E A R N I N G M E M O R Y
63
Cold Spring Harbor Laboratory Press on August 25, 2016 - Published by learnmem.cshlp.orgDownloaded from
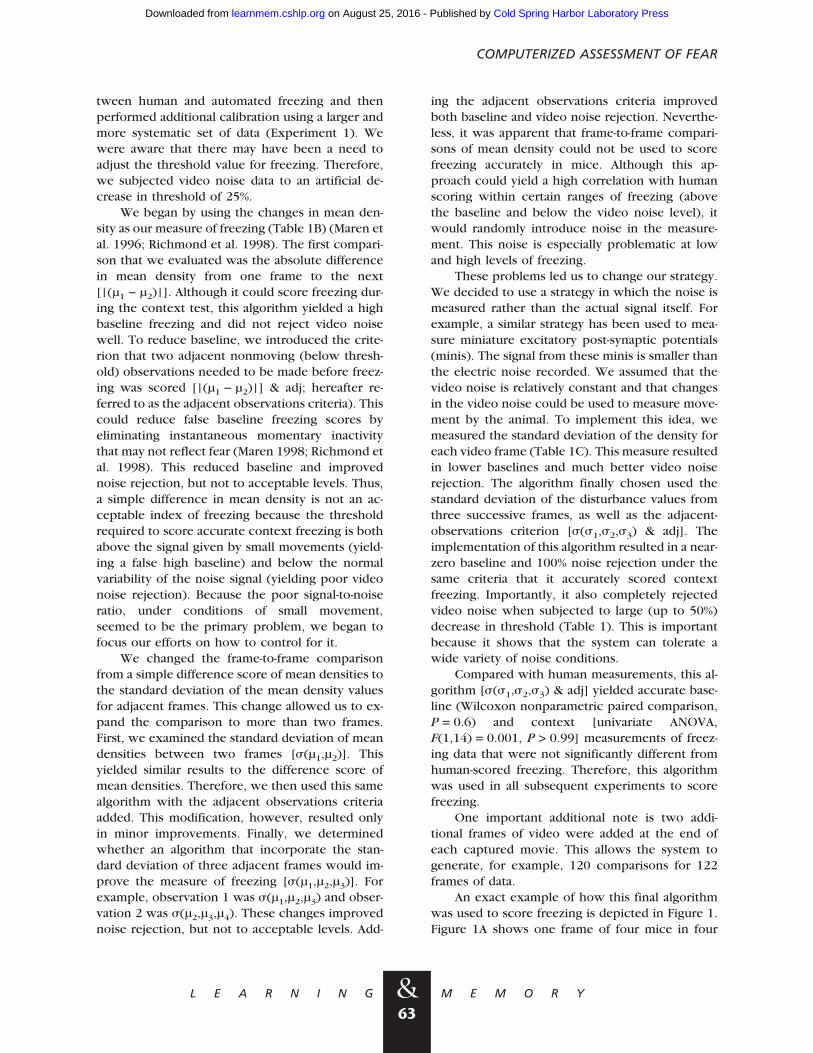
chambers captured simultaneously for 5 min, dur-ing which a 2-sec 0.5-mA shock was delivered at150 sec. Figure 1B shows seconds 20–25 from themouse in the upper-left chamber, during which itwas quite active. Figure 1C shows this mouse dur-ing seconds 234–239 when it was exhibiting post-shock freezing. Figure 1D shows standard devia-tion of optical density reported from Image forthese frames and how it was used to computefreezing.
Experiment 1: The Effects of ShockIntensity and Test Modality
To examine the validity of the algorithm usedto score freezing in the Pilot experiment, we de-
cided to systematically vary fear by examining theeffects of shock intensity (0.25, 0.50, 0.75, or 1.0mA; between-groups variable) and the effects oftest modality (context or tone; within-subjects vari-able). This allowed us to examine several criteriaimportant for any automated measure of freezing.(1) The system should accurately reflect the lowbaseline freezing observed in a novel context. Miceand rats do not freeze on placement into a novelcontext (e.g., Frankland et al. 1998; Anagnostaraset al. 1999). (2) The system should accuratelymimic the effects of independent variables knownto manipulate fear (such as shock intensity or testmodality). (3) The system should exhibit a highcorrelation with human observer-based scoring, in-dicating that it robustly captures the variance in
Figure 1: Visual depiction of the technique. (A) Full-screen video of all four chambers was captured at 1 Hz by NIHImage. The mice shown here were recorded for 302 sec and given a shock at 150 sec. The full-screen frame shown is from20 sec (black numbers indicate time). (B) Video was analyzed by separating the video in four ROIs corresponding to theinside of the chambers. Shown here is an example of a naive mouse, 20–25 sec after being placed in the chamber. (C)Shown here is the same mouse exhibiting post-shock freezing during seconds 234–239. (D) Values and processingrequired to compute freezing from the video frames shown in B and C. The standard deviation of the optical density fromthe region of interest (chamber) for each frame (second) was obtained from NIH Image (shown in column E). The standarddeviation of this value from three adjacent seconds was then computed as a movement score (F). This value (F) was usedas the activity measure itself. It was determined if this was below the threshold for freezing (G), set just above the noisevideo signal (T). Then a freezing observation was only made if there was also an adjacent observation (i.e., the next orprevious observation was also freezing; H). Finally, this was converted to a 1 for freezing and 0 for nonfreezing so thesecould be counted (I).
Anagnostaras et al.
&L E A R N I N G M E M O R Y
64
Cold Spring Harbor Laboratory Press on August 25, 2016 - Published by learnmem.cshlp.orgDownloaded from
human-scored freezing. (4) The system measuringfreezing should exhibit a nearly perfect linear fitwith human-scored freezing such that qualitativelyhigh or low values can be compared with labora-tory norms in previously obtained (human-scored)data. Moreover, we sought to exploit the additionalcapabilities of the computer to score movement,by examining whether activity could be a usefulsecondary index of fear. Finally, we also used theUR to the shock as an index of pain reactivity inmice.
CONDITIONING
Forty mice were placed into the conditioningchambers (see above) and after a 120-sec baselineperiod were given a 30-sec tone (2.8-kHz, 85-dB/A-scale) that coterminated with a 2-sec scrambledfootshock. Mice were randomly assigned to one offour shock intensities: 0.25, 0.50, 0.75, or 1.0 mA(n = 10/group). The animals were returned totheir home cages 150 sec after the shock.
CONTEXT TEST
One day after conditioning, all of the micewere returned to the same conditioning chambersfor a contextual fear test. They were placed intothe conditioning chambers and, 5 min later, re-turned to their home cages.
TONE TEST
One day after the context test, the animalswere returned to the conditioning chambers for anon-baseline contextual fear test. After a 2-min base-line period, the training tone was presented con-tinuously for 3 min. Freezing was scored by humanobservers for both 5-min tests; their scores wereconverted to 80 percent time freezing observationsfor each mouse (40 context and 40 tone) for each5-min test period.
UR MEASUREMENT
This measure will be described in more detailelsewhere (see B.P. Godsil, J.R. Spooner, S.G. An-agnostaras, G.D. Gale, and M.S. Fanselow, un-publ.). Briefly, full-screen video for the 2-sec pe-riod immediately before the shock (baseline) and2-sec period during the shock were digitized at 10Hz using NIH Image. X–Y coordinates were ob-
tained for each frame for each mouse by a blindobserver using the wand auto-measure tool; thesewere imported into Microsoft Excel. Distance trav-eled measured in pixels between successive frameswas computed using the distance formula[v((xn − xn+1)2 + (yn − yn+1)2)]; these values wereconverted into real distance in centimeters usingknown landmark distances in the video frame. Thiswas then converted into velocity in cm/sec by di-viding by time.
Results
THRESHOLD ADJUSTMENTS
To optimize the fit between automated andhuman freezing measurements, we adjusted themovement threshold below which freezing wasscored. Threshold adjustment was performed byexamining the analyses below under a number ofthreshold values that were systematically variedfrom that obtained from pilot data (the originalthreshold was 0.07; Table 1). Although the originalvalue provided excellent results, we were able toobtain qualitatively superior data through minoradjustment, because in the pilot experimentthresholds were only adjusted to 2 decimal points.The final threshold value used for all analyses be-low was 0.065. This value still rejected 100% of thenoise video from the Pilot experiment.
BASELINE FREEZING
As with our pilot data, we also examined base-line freezing data in the 120 sec prior to the firsttone–shock pairing on the conditioning day. Com-puter-scored data yielded a low and typical base-line (n = 40; mean = 1.4 ± 0.4%; range = 0–10%)indicating that our system accurately scored thenear-zero freezing baseline that is typically ob-served prior to conditioning (see, e.g., Table 1; Fig6A; Bourtchuladze et al. 1994; Frankland et al.1998; Anagnostaras et al. 1999).
CORRELATIVE ANALYSIS
To determine what level of correspondencewe could expect between the computer and hu-man observers, we first examined the correlationbetween two human observers. The correlation forall 80 observations (40 context and 40 tone scoresfor the 5-min tests from each observer) was exam-ined first (Fig. 2). Scores recorded by S.A. and S.J.correlated to a high and typical degree (r = 0.90,P < 0.0001) and yielded an excellent linear fit
COMPUTERIZED ASSESSMENT OF FEAR
&L E A R N I N G M E M O R Y
65
Cold Spring Harbor Laboratory Press on August 25, 2016 - Published by learnmem.cshlp.orgDownloaded from
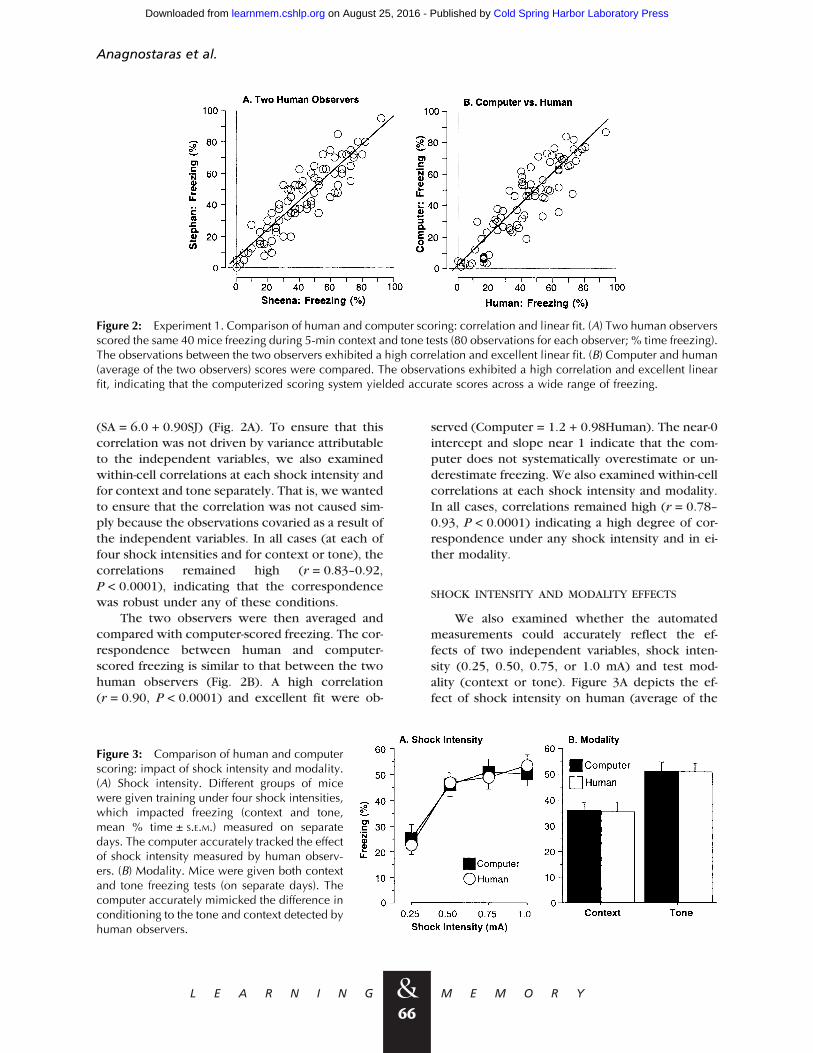
(SA = 6.0 + 0.90SJ) (Fig. 2A). To ensure that thiscorrelation was not driven by variance attributableto the independent variables, we also examinedwithin-cell correlations at each shock intensity andfor context and tone separately. That is, we wantedto ensure that the correlation was not caused sim-ply because the observations covaried as a result ofthe independent variables. In all cases (at each offour shock intensities and for context or tone), thecorrelations remained high (r = 0.83–0.92,P < 0.0001), indicating that the correspondencewas robust under any of these conditions.
The two observers were then averaged andcompared with computer-scored freezing. The cor-respondence between human and computer-scored freezing is similar to that between the twohuman observers (Fig. 2B). A high correlation(r = 0.90, P < 0.0001) and excellent fit were ob-
served (Computer = 1.2 + 0.98Human). The near-0intercept and slope near 1 indicate that the com-puter does not systematically overestimate or un-derestimate freezing. We also examined within-cellcorrelations at each shock intensity and modality.In all cases, correlations remained high (r = 0.78–0.93, P < 0.0001) indicating a high degree of cor-respondence under any shock intensity and in ei-ther modality.
SHOCK INTENSITY AND MODALITY EFFECTS
We also examined whether the automatedmeasurements could accurately reflect the ef-fects of two independent variables, shock inten-sity (0.25, 0.50, 0.75, or 1.0 mA) and test mod-ality (context or tone). Figure 3A depicts the ef-fect of shock intensity on human (average of the
Figure 2: Experiment 1. Comparison of human and computer scoring: correlation and linear fit. (A) Two human observersscored the same 40 mice freezing during 5-min context and tone tests (80 observations for each observer; % time freezing).The observations between the two observers exhibited a high correlation and excellent linear fit. (B) Computer and human(average of the two observers) scores were compared. The observations exhibited a high correlation and excellent linearfit, indicating that the computerized scoring system yielded accurate scores across a wide range of freezing.
Figure 3: Comparison of human and computerscoring: impact of shock intensity and modality.(A) Shock intensity. Different groups of micewere given training under four shock intensities,which impacted freezing (context and tone,mean % time ± S.E.M.) measured on separatedays. The computer accurately tracked the effectof shock intensity measured by human observ-ers. (B) Modality. Mice were given both contextand tone freezing tests (on separate days). Thecomputer accurately mimicked the difference inconditioning to the tone and context detected byhuman observers.
Anagnostaras et al.
&L E A R N I N G M E M O R Y
66
Cold Spring Harbor Laboratory Press on August 25, 2016 - Published by learnmem.cshlp.orgDownloaded from
two observers) and computer-scored freezing,whereas Figure 3B depicts the effect of modality.This figure shows that the computer producedmean scores equivalent to the human observers.For shock intensity, we performed a 4 (shock in-tensity) × 2 (observer: computer or human)ANOVA. There was a significant main effect ofshock [F(3,152) = 16, P < 0.0001; power = 1.0],no effect of observer type [F(1,152) = 0.003,P > 0.9], and no shock × observer interaction[F(3,152) = 0.17, P > 0.9], indicating that the meanscores the computer produced were equivalent tothose produced by human observers at everyshock intensity. For modality, we performed a 2(modality) × 2 (observer: computer or human)ANOVA. There was a significant main effect ofmodality [F(1,156) = 20, P < 0.0001; power = 1.0],no effect of observer type [F(1,156) = 0.002,P > 0.9], and no modality × observer interaction[F(1,156) = 0.0002, P > 0.9], indicating that themean scores the computer produced were equiva-lent to human scores under either modality.
Combined with the correlative analyses, thesedata show that our computerized system producesfreezing scores that are quantitatively and qualita-tively equivalent to those produced by human ob-servers.
ACTIVITY AND ACTIVITY SUPPRESSION
One additional benefit of the automated sys-tem is that activity scores are collected in parallelwith freezing. These scores can be useful in mea-suring baseline activity before the first tone–shockpairing (on the conditioning day) as this may be aneasy way to measure generalized activity. For ex-ample, rats with hippocampal lesions and GABA-Aknockout mice are hyperactive during this period
of time (DeLorey et al. 1998; Maren et al. 1998).Second, we wanted to examine whether activityduring the context test might be a useful secondaryindex of fear. This could be useful because, onoccasion, we have observed mice that do notfreeze but appear to be afraid because they exhibitlittle activity during testing. Activity suppression isknown to be an index of fear and anxiety in manyorganisms (Estes and Skinner 1941).
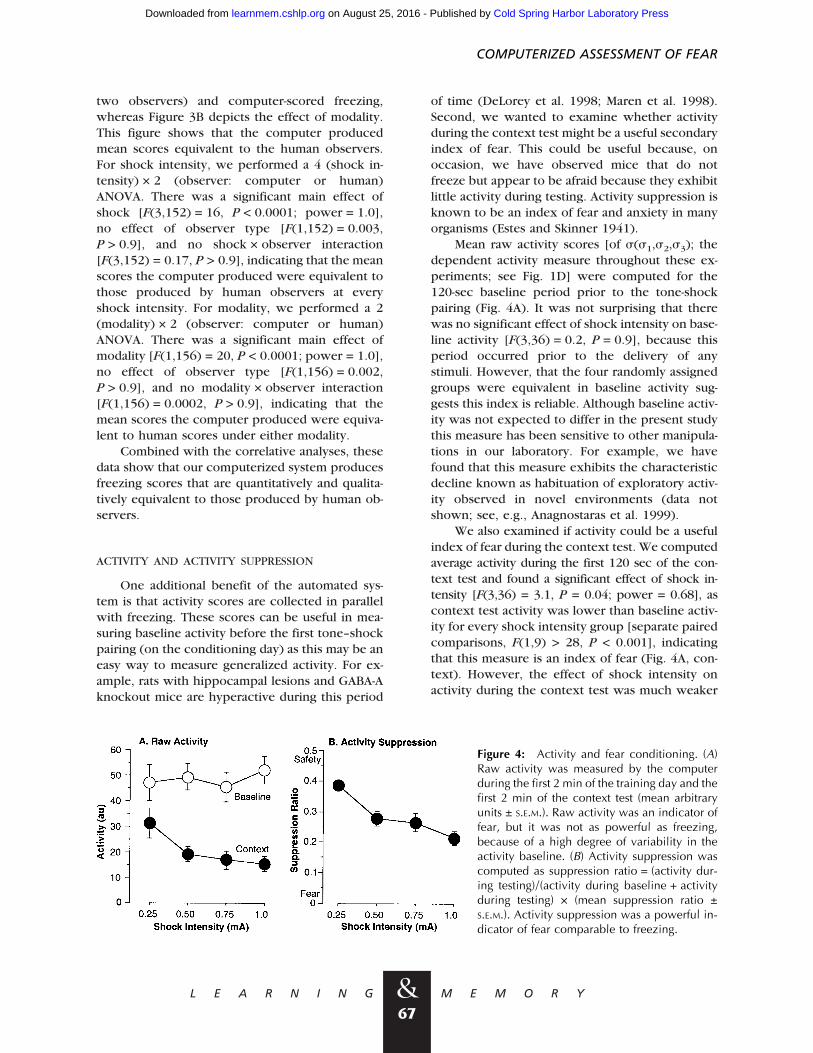
Mean raw activity scores [of s(s1,s2,s3); thedependent activity measure throughout these ex-periments; see Fig. 1D] were computed for the120-sec baseline period prior to the tone-shockpairing (Fig. 4A). It was not surprising that therewas no significant effect of shock intensity on base-line activity [F(3,36) = 0.2, P = 0.9], because thisperiod occurred prior to the delivery of anystimuli. However, that the four randomly assignedgroups were equivalent in baseline activity sug-gests this index is reliable. Although baseline activ-ity was not expected to differ in the present studythis measure has been sensitive to other manipula-tions in our laboratory. For example, we havefound that this measure exhibits the characteristicdecline known as habituation of exploratory activ-ity observed in novel environments (data notshown; see, e.g., Anagnostaras et al. 1999).
We also examined if activity could be a usefulindex of fear during the context test. We computedaverage activity during the first 120 sec of the con-text test and found a significant effect of shock in-tensity [F(3,36) = 3.1, P = 0.04; power = 0.68], ascontext test activity was lower than baseline activ-ity for every shock intensity group [separate pairedcomparisons, F(1,9) > 28, P < 0.001], indicatingthat this measure is an index of fear (Fig. 4A, con-text). However, the effect of shock intensity onactivity during the context test was much weaker
Figure 4: Activity and fear conditioning. (A)Raw activity was measured by the computerduring the first 2 min of the training day and thefirst 2 min of the context test (mean arbitraryunits ± S.E.M.). Raw activity was an indicator offear, but it was not as powerful as freezing,because of a high degree of variability in theactivity baseline. (B) Activity suppression wascomputed as suppression ratio = (activity dur-ing testing)/(activity during baseline + activityduring testing) × (mean suppression ratio ±S.E.M.). Activity suppression was a powerful in-dicator of fear comparable to freezing.
COMPUTERIZED ASSESSMENT OF FEAR
&L E A R N I N G M E M O R Y
67
Cold Spring Harbor Laboratory Press on August 25, 2016 - Published by learnmem.cshlp.orgDownloaded from
than that on freezing (see above), indicating thatraw activity is not a particularly powerful index offear. This appeared to be due to a high degree ofvariability in baseline activity. This variability is notdue to genetic heterogeneity because the subjectswere inbred C57BL6 mice. To determine whethernatural tendencies in baseline activity were con-tributing to the noisiness of context test activity asan index of fear, we examined the correlations be-tween baseline activity, context test activity, andfreezing. Context test activity was correlated withcontext freezing (r = −0.65, P < 0.0001), but it wasalso strongly correlated with baseline activity(r = 0.64, P < 0.0001), whereas freezing was notcorrelated with baseline activity (r = −0.03,P > 0.8). Thus, it appears that activity during thecontext test is heavily contaminated by themouse’s own baseline activity even before it is con-ditioned, whereas freezing is not. For this reasonraw activity is probably not a useful index of fear inmice, because it would be heavily confoundedwith any manipulation that affects baseline activity;these effects are quite common in studies of mu-tant, drugged, or lesioned animals.
To control for this we generated a suppressionratio for activity. This standard technique has beenused in many paradigms where baseline is variable.For example it has been used to score conditionedsuppression of bar-pressing behavior during fearconditioning (e.g., Rescorla 1968). The suppres-sion ratio (SR) was defined as (activity during test)/(activity during test + activity during baseline).Very low values indicate a high level of fear, 0.5indicates no fear, and values greater than 0.5 canindicate conditioned safety (Annau and Kamin1961). Activity suppression proved to be a power-ful measure of context fear (Fig. 4B), yielding alarge main effect of shock intensity [F(3,36) = 9.3,P = 0.0001; power = 1.0]. It was also well corre-lated with freezing (r = −0.85, P < 0.0001) and ac-tivity during the context test (r = 0.73,P < 0.0001), but importantly not with baseline ac-tivity (r = −0.03, P > 0.8). Measurements of activitysuppression should compare a baseline and testperiod of equal lengths because there are changesin activity over time. Moreover, as with contextualfreezing, it has been found previously that activitysuppression during a contextual fear test is im-paired by hippocampal lesions (Maren et al. 1998;Maren 1999). There is also evidence that suppres-sion behavior may be dissociable from freezing andrepresent a separate response (Amorapanth et al.1999).
UNCONDITIONAL RESPONSE
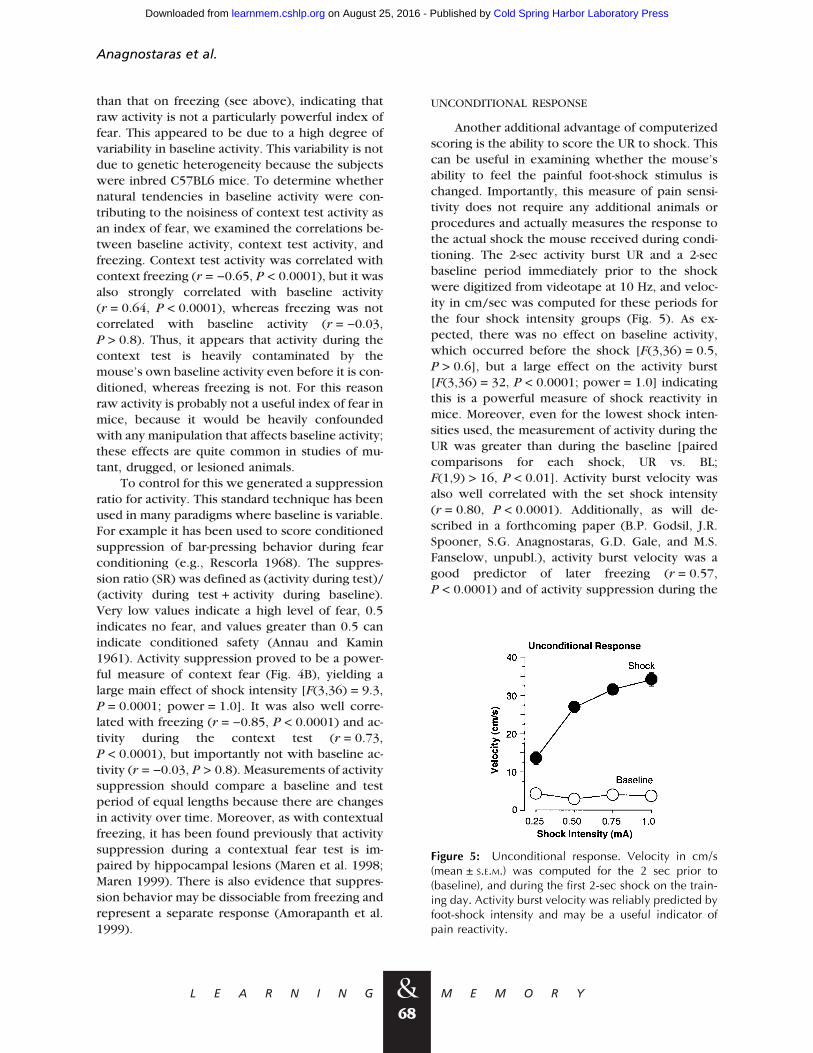
Another additional advantage of computerizedscoring is the ability to score the UR to shock. Thiscan be useful in examining whether the mouse’sability to feel the painful foot-shock stimulus ischanged. Importantly, this measure of pain sensi-tivity does not require any additional animals orprocedures and actually measures the response tothe actual shock the mouse received during condi-tioning. The 2-sec activity burst UR and a 2-secbaseline period immediately prior to the shockwere digitized from videotape at 10 Hz, and veloc-ity in cm/sec was computed for these periods forthe four shock intensity groups (Fig. 5). As ex-pected, there was no effect on baseline activity,which occurred before the shock [F(3,36) = 0.5,P > 0.6], but a large effect on the activity burst[F(3,36) = 32, P < 0.0001; power = 1.0] indicatingthis is a powerful measure of shock reactivity inmice. Moreover, even for the lowest shock inten-sities used, the measurement of activity during theUR was greater than during the baseline [pairedcomparisons for each shock, UR vs. BL;F(1,9) > 16, P < 0.01]. Activity burst velocity wasalso well correlated with the set shock intensity(r = 0.80, P < 0.0001). Additionally, as will de-scribed in a forthcoming paper (B.P. Godsil, J.R.Spooner, S.G. Anagnostaras, G.D. Gale, and M.S.Fanselow, unpubl.), activity burst velocity was agood predictor of later freezing (r = 0.57,P < 0.0001) and of activity suppression during the
Figure 5: Unconditional response. Velocity in cm/s(mean ± S.E.M.) was computed for the 2 sec prior to(baseline), and during the first 2-sec shock on the train-ing day. Activity burst velocity was reliably predicted byfoot-shock intensity and may be a useful indicator ofpain reactivity.
Anagnostaras et al.
&L E A R N I N G M E M O R Y
68
Cold Spring Harbor Laboratory Press on August 25, 2016 - Published by learnmem.cshlp.orgDownloaded from
context test (r = −0.63, P < 0.0001). These corre-lations indicate that this measure of shock reactiv-ity is well associated with the level of fear condi-tioning. It was also not correlated with baselinemeasures of activity (activity during 2-min baselineperiod, r = 0.08, P > 0.63; or the 2-sec baseline forthe activity burst, r = −0.17, P > 0.3).
Experiment 2: Retrograde Amnesiaof Contextual Fear After ElectrolyticDorsal Hippocampal Lesions
To verify the robust retrograde amnesia of con-textual fear observed by human observers afterelectrolytic dorsal hippocampal (DH) lesions inrats and mice (Kim and Fanselow 1992; Franklandet al. 1998; Anagnostaras et al. 1999), Experiment2 was performed. Freezing was scored by the com-puter, as described in Experiment 1.
TRAINING
Prior to receiving any lesion, 20 mice weregiven three unsignaled shocks (2-sec, 0.5 mA, eachshock 1 min apart) 2 min after placement in thechambers.
SURGERY
One day after training, mice received electro-lytic DH (n = 11) or sham lesions (n = 9), as de-scribed in Frankland et al. (1998). Briefly, micewere given anesthesia (chloral hydrate, 400 mg/kg, i.p.), mounted in a stereotaxic apparatus andthen an insulated (except for the tip) electrode waslowered into the dorsal hippocampus bilaterally(from bregma, −1.8 posterior, ±1.9–2.0 lateral,−2.1–2.2 ventral). Anodal constant current (3.0mA, 5 sec) was passed, the wound was closed andmice were allowed to recover for 1 week. Shamlesions were similar but no current was passed.
TESTING
One week after surgery, mice were returned tothe original training context for a 3-min contextualfreezing test.
HISTOLOGY
Post-mortem histological verification with thi-onin stain was performed as described previously
(Frankland et al. 1998). Three mice were excludedfrom the DH group; one had only a cortical lesionplaced too dorsally, and two others had only uni-lateral DH lesions. Exclusion of these mice did notaffect the statistical conclusions below.
Results
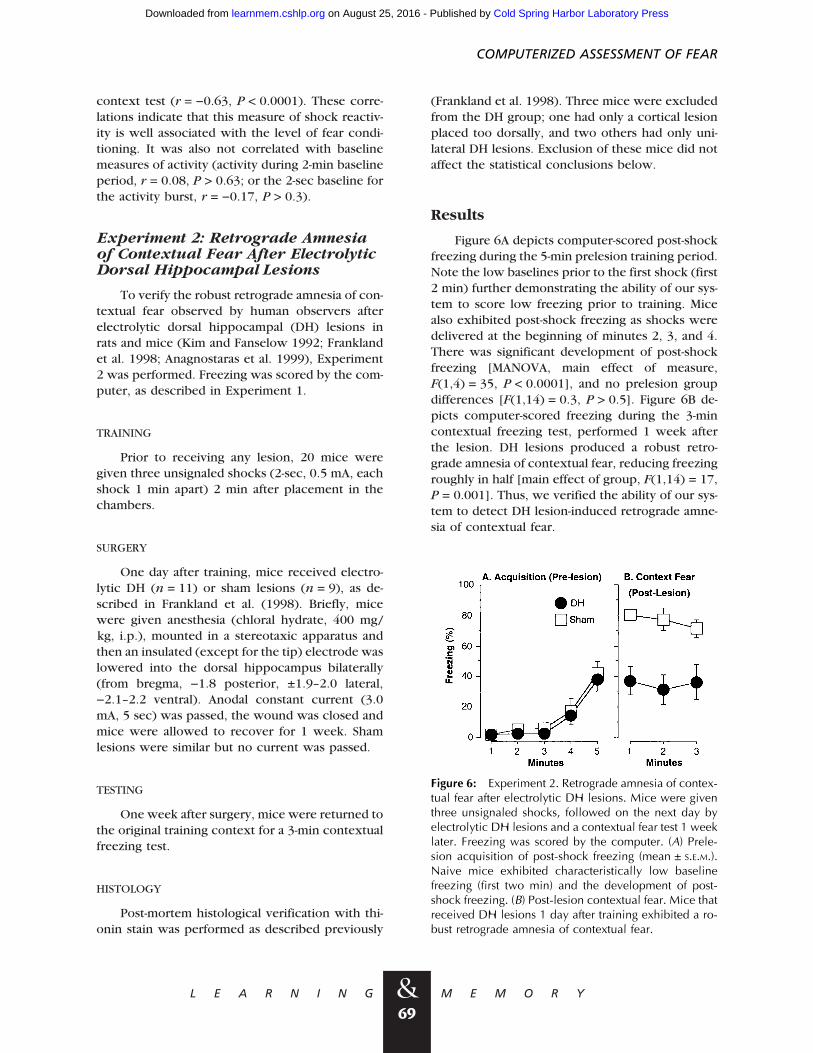
Figure 6A depicts computer-scored post-shockfreezing during the 5-min prelesion training period.Note the low baselines prior to the first shock (first2 min) further demonstrating the ability of our sys-tem to score low freezing prior to training. Micealso exhibited post-shock freezing as shocks weredelivered at the beginning of minutes 2, 3, and 4.There was significant development of post-shockfreezing [MANOVA, main effect of measure,F(1,4) = 35, P < 0.0001], and no prelesion groupdifferences [F(1,14) = 0.3, P > 0.5]. Figure 6B de-picts computer-scored freezing during the 3-mincontextual freezing test, performed 1 week afterthe lesion. DH lesions produced a robust retro-grade amnesia of contextual fear, reducing freezingroughly in half [main effect of group, F(1,14) = 17,P = 0.001]. Thus, we verified the ability of our sys-tem to detect DH lesion-induced retrograde amne-sia of contextual fear.
Figure 6: Experiment 2. Retrograde amnesia of contex-tual fear after electrolytic DH lesions. Mice were giventhree unsignaled shocks, followed on the next day byelectrolytic DH lesions and a contextual fear test 1 weeklater. Freezing was scored by the computer. (A) Prele-sion acquisition of post-shock freezing (mean ± S.E.M.).Naive mice exhibited characteristically low baselinefreezing (first two min) and the development of post-shock freezing. (B) Post-lesion contextual fear. Mice thatreceived DH lesions 1 day after training exhibited a ro-bust retrograde amnesia of contextual fear.
COMPUTERIZED ASSESSMENT OF FEAR
&L E A R N I N G M E M O R Y
69
Cold Spring Harbor Laboratory Press on August 25, 2016 - Published by learnmem.cshlp.orgDownloaded from
Discussion
Pavlovian fear conditioning provides a high-efficiency and well-controlled assay for the assess-ment of learning deficits in mice. The automationof the scoring of freezing behavior promises a sub-stantial improvement over observer-scored freez-ing primarily because of a reduction in workloadand possible subjective bias. We were able to ac-curately measure freezing behavior, as well as mea-sure a number of other aspects of fear conditioningthat would be difficult to measure without a com-puter. These included (1) the assessment of base-line activity, which could be a useful index of gen-eralized activity and exploration of the contextualCS, (2) the measurement of activity suppression asa secondary index of fear, which could be useful inanimals for which the freezing response is sus-pected to be impaired, and (3) the measurement ofthe foot-shock-elicited activity burst, which can beused to ensure that differences in shock reactivitydo not account for apparent impairments in con-ditioning. We believe the measurement of thesebehaviors should be the essential parts of the fearconditioning assay.
Our examination of digital video-based scoringof mice freezing can be viewed as an indicator ofpotential problems in the automated measurementof freezing. It was difficult, for example, to accu-rately score the near-zero baseline freezing becauseof the relatively weak signal (compared with noise)when mice were only slightly active. Although wehave not systematically examined it, we suspectthis is a more severe problem in video-scoring ofmice, rather than rats, because mice provide apoorer signal because of both their color and size(S.G. Anagnostaras, A.J. Silva, and M.S. Fanselow,unpubl.). For example, Maren (1998) and othershave successfully used startle platforms to indexactivity and freezing in rats, but this method maynot work nearly as well for mice because of therelatively smaller movement signals (S. Maren,pers. comm.).
Moreover, our examination of computer-scored automated freezing is supported not onlyby a correlative analysis but also by evidence of anexcellent linear fit, robust noise rejection, and ac-curate baseline freezing. These latter three criteriahave not, to our knowledge, been systematicallyexamined in other studies (e.g., Richmond et al.1998; Valentinuzzi et al. 1998). Although anymovement index can potentially be used to indexfreezing, we believe any new measure should ex-
hibit all four of these properties. Moreover, themeasurement of an activity suppression ratio in ad-dition to freezing is likely to increase the sensitivityof this assay in detecting interesting phenotypes.The addition of baseline activity measurement andreactivity to shock as standard components of aprotocol for fear conditioning also enhance the in-terpretability of the results.
The development of high-efficiency automatedprotocols for assaying learning and memory defi-cits has become imperative because of several re-cent developments in genetics. First, investigatorsusing traditional “reverse” genetics to make mu-tants have now generated several thousand mu-tants, most of which have not been screened forlearning/memory phenotypes. Just the addition ofthese to our knowledge base would be a substan-tial contribution. However, it is likely that many ofthe genes that influence memory are still notknown. For this reason, techniques using “for-ward” genetics, identifying genes from the pheno-types they confer, will become particularly impor-tant. One such method is to use a chemical agentsuch as N-ethyl-N-nitrosourea (ENU) to mutagenizemice and then screen the progeny for the alteredphenotype of interest. This endeavor will requirehigh-throughput automated systems that canscreen thousands of animals and generate precisedata.
Given the large growth of the field of behav-ioral genetics, the importance of standardized dataand protocols must be emphasized. Observerswith only limited behavioral experience may pro-duce less reliable behavioral scores and any ob-server can be subject to bias. Therefore, an auto-mated system should enhance reliability and repro-ducibility of findings. The taking of two parallelmeasures of fear, freezing and activity suppression,will further improve the interpretability of the find-ings.
However, some caution should be exercisedwhen converting to an automated system for themeasurement of behavior. Automated systems de-tach the experimenter from the actual behavior ofthe animal. These systems can be subject to arti-facts generated by the algorithm that is used to givebehavioral scores. For example, in automatingfreezing we found that any number of algorithmsthat might have a high correlation with human-scored freezing could still generate artifacts such ashigh baselines, low ceilings, and non-linear fit be-tween computed and human scores. As such, con-siderable vigilance should be taken in ensuring that
Anagnostaras et al.
&L E A R N I N G M E M O R Y
70
Cold Spring Harbor Laboratory Press on August 25, 2016 - Published by learnmem.cshlp.orgDownloaded from
an automated system produces accurate scores, be-cause once committed to a particular system, prob-lems will not unlikely be noticed later when ob-servers are no longer actually watching the mice.
Nonetheless, we found that an ordinary Macin-tosh computer using an regular color camera couldsimultaneously score four freezing chambers accu-rately and quickly, using our adaptation to NIH’sfree Image software. Aside from a reduction inworkload and experimenter bias, the use of digitalvideo also allowed us to easily use activity suppres-sion as a secondary index of fear, as well as scoreboth baseline activity and the unconditional re-sponse to footshock. With some further improve-ments we believe this system for measuring fearconditioning deficits in mice can be used as a high-efficiency screen for learning and memory prob-lems in mutant mice.
AcknowledgmentsWe thank Michael Fanselow and Geoff Murphy for their
valuable advice and assistance. S.G.A. was supported byindividual NIH NRSA (F32NS10932). S.A.J. was supported bya NARSAD fellowship. P.W.F. was supported by a FRAXAfellowship. A.J.S. is the UCLA Dorothy and Leonard StraussScholar. This research was supported by NIH grant (no.AG13622) to A.J.S. NIH Image is available on the worldwide web at http://rsb.info.nih.gov/nih-image/.
ReferencesAmorapanth, P., K. Nader, and J.E. LeDoux. 1999. Lesions ofperiaquaductal gray dissociate conditioned freezing fromconditioned suppression behavior in rats. Learn. & Mem.6: 491–499.
Anagnostaras, S.G., S. Maren, and M.S. Fanselow. 1999.Temporally graded retrograde amnesia of contextual fear afterhippocampal damage in rats: Within-subjects examination. J.Neurosci. 19: 1106–1114.
Annau, Z. and L.J. Kamin. 1961. The conditioned emotionalresponse as a function of intensity of the US. J. Comp.Physiol. Psychol. 54: 428–432.
Bolles, R.C. 1970. Species-specific defense reactions andavoidance learning. Psych. Rev. 72: 32–48.
Bourtchuladze, R., B. Frenguelli, J. Blendy, D. Ciofi, G.Schutz, and A.J. Silva. 1994. Deficient long-term memory inmice with a targeted mutation of the cAMP-responsiveelement-binding protein. Cell 79: 59–68.
Campeau, S., M.J. Miserendino, and M. Davis. 1992.Intra-amygdala infusion of the N-methyl-D-aspartate receptorantagonist AP5 blocks acquisition but not expression offear-potentiated startle to an auditory conditioned stimulus.Behav. Neurosci. 106: 569–574.
Chen, C., J.J. Kim, R.F. Thompson, and S. Tonegawa. 1996.Hippocampal lesions impair contextual fear conditioning intwo strains of mice. Behav. Neurosci. 110: 1177–1180.
Cho, Y.H., E. Friedman, and A.J. Silva. 1999. Ibotenatelesions of the hippocampus impair spatial learning but notcontextual fear conditioning in mice. Behav. Brain Res.98: 77–87.
Collingridge, G.L., S.J. Kehl, and H. McLennan. 1983.Excitatory amino acids in synaptic transmission in theSchaffer collateral-commissural pathway of the rathippocampus. J. Physiol. 334: 33–46.
DeLorey, T.M., A. Handforth, S.G. Anagnostaras, G.E.Homanics, B.A. Minassian, A. Astourian, M.S. Fanselow, A.Delgado-Escueta, G.D. Ellison, and R.W. Olsen. 1998. Micelacking the beta3 subunit of the GABAA receptor have theepilepsy phenotype and many of the behavioralcharacteristics of Angelman syndrome. J. Neurosci.18: 8505–8514.
Estes, W.K. and B.F. Skinner. 1941. Some quantitativeproperties of anxiety. J. Exp. Psychol. 29: 390–400.
Fanselow, M.S. 1990. Factors governing one-trial contextualconditioning. Anim. Learn. Behav. 18: 264–270.
Fanselow, M.S. and R.C. Bolles. 1979. Naloxone andshock-elicited freezing. J. Comp. Physiol. Psychol.93: 736–744.
Frankland, P.W., V. Cestari, R.K. Filipkowski, R.J. McDonald,and A.J. Silva. 1998. The dorsal hippocampus is essential forcontext discrimination but not for contextual conditioning.Behav. Neurosci. 112(4): 863–874.
Gerlai, R. 1998. Contextual learning and cue association infear conditioning in mice: A strain comparison and a lesionstudy. Behav. Brain Res. 95: 191–203.
Good, M. and R.C. Honey. 1997. Dissociable effects ofselective lesions to hippocampal subsystems on exploratorybehavior, contextual learning, and spatial learning. Behav.Neurosci. 111: 487–493.
Kim, J.J. and M.S. Fanselow. 1992. Modality-specificretrograde amnesia of fear. Science 256: 675–677.
Kim, J.J., J.P. DeCola, J. Landeira-Fernandez, and M.S.Fanselow. 1991. N-methyl-D-aspartate receptor antagonistAPV blocks acquisition but not expression of fearconditioning. Behav. Neurosci. 105: 126–133.
Kim, J.K., R.A. Rison, and M.S. Fanselow. 1993. Effects ofamygdala, hippocampus, and periaqueductal gray lesions onshort- and long-term contextual fear. Behav. Neurosci.107: 1093–1098.
Lee, H. and J.J. Kim. 1998. Amygdalar NMDA receptors arecritical for new fear learning in previously fear-conditionedrats. J. Neurosci. 18: 8444–8454.
COMPUTERIZED ASSESSMENT OF FEAR
&L E A R N I N G M E M O R Y
71
Cold Spring Harbor Laboratory Press on August 25, 2016 - Published by learnmem.cshlp.orgDownloaded from
Lee, Y., D. Walker, and M. Davis. 1996. Lack of a temporalgradient of retrograde amnesia following NMDA-inducedlesions of the basolateral amygdala assessed with thefear-potentiated startle paradigm. Behav. Neurosci.110: 836–839.
Logue, S.F., R. Paylor, and J.M. Wehner. 1997. Hippocampallesions cause learning deficits in inbred mice in the Morriswater maze and conditioned-fear task. Behav. Neurosci.111: 104–113.
Maren, S. 1998. Overtraining does not mitigate contextualfear conditioning deficits produced by neurotoxic lesions ofthe basolateral amygdala. J. Neurosci. 18: 3088–3097.
———. 1999. Neurotoxic or electrolytic lesions of the ventralsubiculum produce deficits in the acquisition and expressionof Pavlovian fear conditioning in rats. Behav. Neurosci.113: 283–290.
Maren, S. and M.S. Fanselow. 1996. The amygdala and fearconditioning: Has the nut been cracked? Neuron16: 237–240.
———. 1997. Electrolytic lesions of the fimbria/fornix, dorsalhippocampus, or entorhinal cortex produce anterogradedeficits in contextual fear conditioning in rats. Neurobiol.Learn. Mem. 67(2): 142–149.
Maren, S., G. Aharonov, D.L. Stote, and M.S. Fanselow.1996a. N-methyl-D-aspartate receptors in the basolateralamygdala are required for both acquisition and expression ofconditional fear in rats. Behav. Neurosci. 110(6): 1365–1374.
Maren, S., G. Aharonov, and M.S. Fanselow. 1996b.Retrograde abolition of conditional fear after excitotoxiclesions in the basolateral amygdala of rats: Absence of atemporal gradient. Behav. Neurosci. 110: 718–726.
Maren, S., G. Aharonov, and M.S. Fanselow. 1997.Neurotoxic lesions of the dorsal hippocampus and Pavlovianfear conditioning in rats. Behav. Brain Res. 88: 261–274.
Maren, S., S.G. Anagnostaras, and M.S. Fanselow. 1998. Thestartled seahorse: Is the hippocampus necessary forcontextual fear conditioning? Trends Cog. Sci. 2: 39–42.
McNish, K.A., J.C. Gewirtz, and M. Davis. 1997. Evidence ofcontextual fear after lesions of the hippocampus: A disruptionof freezing but not fear-potentiated startle. J. Neurosci.17: 9353–9360.
Nadel, L. and J. Wilner. 1980. Context and conditioning: aplace for space. Physiol. Psychol. 8: 218–228.
Paylor, R., R. Tracy, J. Wehner, and R. Rudy. 1994. DBA/2and C57BL/6 mice differ in contextual fear but not auditoryfear conditioning. Behav. Neurosci. 108(4): 810–817.
Phillips, R.G. and J.E. LeDoux. 1992. Differential contributionof amygdala and hippocampus to cued and contextual fearconditioning. Behav. Neurosci. 106: 274–285.
Rescorla, R.A. 1968. Probability of shock in the presence andabsence of CS in fear conditioning. J. Comp. Physiol.Psychol. 66: 1–5.
Richmond, M.A., C.A. Murphy, B. Pouzet, P. Schmid, J.N.Rawlins, and J. Feldon. 1998. A computer controlled analysisof freezing behaviour. J. Neurosci. Methods 86: 91–99.
Rogan, M.T., U.V. Staubli, and J.E. LeDoux. 1997. Fearconditioning induces associative long-term potentiation in theamygdal. Nature 390: 604–607.
Scoville, W.B. and B. Milner 1957. Loss of recent memoryafter hippocampal bilateral lesions. J. Neurol. Neurosurg.Psych. 20: 11–12.
Silva, A.J., K.P. Giese, N.B. Fedorov, P.W. Frankland, andJ.H. Kogan. 1998. Molecular, cellular, and neuroanatomicalsubstrates of place learning. Neurobiol. Learn. Mem.70: 44–61.
Squire, L.R. 1992. Memory and the hippocampus; A synthesisfrom findings with rat, monkeys, and humans. Psychol. Rev.99: 195–231.
Valentinuzzi, V.S., D.E. Kolker, M.H. Vitaterna, S. Kazuhiro,A. Whitely, S. Low-Zeddies, F.W. Turek, E.A.M. Ferrari, R.Paylor, and J.S. Takahashi. 1998. Automated measurement ofmouse freezing behavior and its use for quantitative traitlocus analysis of contextual fear conditioning in (BALB/cJ xC57BL/6J)F2 mice. Learn. & Mem. 5: 391–403.
Received August 25, 1999; accepted in revised formNovember 17, 1999.
Anagnostaras et al.
&L E A R N I N G M E M O R Y
72
Cold Spring Harbor Laboratory Press on August 25, 2016 - Published by learnmem.cshlp.orgDownloaded from
10.1101/lm.7.1.58Access the most recent version at doi: 2000 7: 58-72 Learn. Mem.
Stephan G. Anagnostaras, Sheena A. Josselyn, Paul W. Frankland, et al. Conditioning in MiceComputer-Assisted Behavioral Assessment of Pavlovian Fear
References
http://learnmem.cshlp.org/content/7/1/58.full.html#ref-list-1
This article cites 39 articles, 8 of which can be accessed free at:
ServiceEmail Alerting
click here.top right corner of the article or
Receive free email alerts when new articles cite this article - sign up in the box at the
http://learnmem.cshlp.org/subscriptionsgo to: Learning & Memory To subscribe to
Cold Spring Harbor Laboratory Press
Cold Spring Harbor Laboratory Press on August 25, 2016 - Published by learnmem.cshlp.orgDownloaded from


