Embed Size (px)
Citation preview

Full Terms & Conditions of access and use can be found athttp://www.tandfonline.com/action/journalInformation?journalCode=tcag20
Download by: [Universitat Salzburg] Date: 04 January 2016, At: 07:36
Cartography and Geographic Information Science
ISSN: 1523-0406 (Print) 1545-0465 (Online) Journal homepage: http://www.tandfonline.com/loi/tcag20
Monitoring recovery after earthquakes throughthe integration of remote sensing, GIS, and groundobservations: the case of L’Aquila (Italy)
Diana Contreras, Thomas Blaschke, Dirk Tiede & Marianne Jilge
To cite this article: Diana Contreras, Thomas Blaschke, Dirk Tiede & Marianne Jilge (2016)Monitoring recovery after earthquakes through the integration of remote sensing, GIS, andground observations: the case of L’Aquila (Italy), Cartography and Geographic InformationScience, 43:2, 115-133, DOI: 10.1080/15230406.2015.1029520
To link to this article: http://dx.doi.org/10.1080/15230406.2015.1029520
Published online: 15 Apr 2015.
Submit your article to this journal
Article views: 159
View related articles
View Crossmark data

Monitoring recovery after earthquakes through the integration of remotesensing, GIS, and ground observations: the case of L’Aquila (Italy)Diana Contreras, Thomas Blaschke, Dirk Tiede and Marianne Jilge
Department of Geoinformatics – Z_GIS, University of Salzburg, Schillerstraße 30, Salzburg 5020, Austria
ABSTRACTThe usefulness of remote sensing (RS), geographical information systems, and ground observa-tions for monitoring changes in urban areas has been demonstrated through many examplesover the last two decades. Research has generally focused on the relief phase following a disaster,but we have instead investigated the subsequent phases involving early recovery, recovery, anddevelopment. Our aim was to determine to what extent integration of the available tools,techniques, and methods can be used to efficiently monitor the progress of recovery followingan earthquake. Changes in buildings within the Italian city of L’Aquila following the 2009 earth-quake were identified from Earth observation data and are used as indicators of progress in therecovery process. These changes were identified through (1) visual analysis, (2) automatedchange detection using a set of decision rules formulated within an object-based image analysisframework, and (3) validation based on a combination of visual and semiautomated interpreta-tions. An accuracy assessment of the automated analysis showed a producer accuracy of 81%(error of omission: 19%) and a user accuracy of 55% (error of commission: 45%). The use of RSmade it possible for the identification of changes to be spatially exhaustive, and also to increasethe number of categories used for a recovery index. In addition, using RS allowed the arearequiring extensive fieldwork (to monitor the progress of the recovery process) to be reduced.
ARTICLE HISTORYReceived 29 August 2014Accepted 31 January 2015
KEYWORDSDisaster recovery; remotesensing; GIS; ground obser-vations; monitoring
Introduction
On 6 April 2009, an earthquake with a magnitude of6.3 MW struck the Italian city of L’Aquila (populationof 72,800). The epicenter was located 3.4 km to thesouthwest of the city at a depth of 10 km. L’Aquila isthe capital of the province with the same name, and thecapital of the Abruzzo region. Its location and a map ofground motion intensity during the earthquake areshown in Figure 1.
The historical city was badly damaged, 308 peoplelost their lives, 1500 people were injured (202 of themseriously), 67,500 people were made homeless(Alexander 2010), and around 100,000 buildings weredamaged (UNIFI 2011). Some academic sources statedthat between 1.5 and 3 million tons of waste were gen-erated as a result of this earthquake, of which 70–80%consisted of aggregate, masonry, and concrete (Brown,Milke, and Seville 2011; UNDP 2012), while othersources quoted figures of between four and five milliontons (Díez 2010). The cost of the damage was estimatedto be 16 billion euros (UNIFI 2009).
After the earthquake, the city center was declared ared zone. It was cordoned off and guarded by the army
and the police in order to prevent the former inhabi-tants from accessing the buildings. During fieldwork in2010, it was only possible to walk along the main axes(Viale Crispi, Corso Federico II, Vittorio Emanuele II,and Via Castello), and the streets around the city center(Via XX Settembre, Viale Duca Degli Abruzzi, andGiovanni XXIII) from which only heavily proppedbuildings could be observed. Nevertheless, no recon-struction work had begun, and the recovery of the citycenter seemed to have totally stagnated. New settle-ments (5722 apartments) to accommodate the 14,405people left homeless by the earthquake had alreadybeen built outside the city. In 2012, the access to thered zone was a bit more flexible, and the recovery of thecity center had partially begun (Contreras et al. 2014).Five years after the earthquake, there is no red zoneanymore and the reconstruction activities are continu-ing, but this time at an accelerated rate. It is one of thelargest construction sites in Europe today.
Unfortunately the recovery of L’Aquila has beensurrounded by political intrigues and scandals. Severaldiscussions took place within the government withrespect to the recovery of L’Aquila, which includedthe idea of relocating the whole city. A major
CONTACT Diana Contreras [email protected]
CARTOGRAPHY AND GEOGRAPHIC INFORMATION SCIENCE, 2016VOL. 43, NO. 2, 115–133http://dx.doi.org/10.1080/15230406.2015.1029520
© 2015 Cartography and Geographic Information Society
Dow
nloa
ded
by [
Uni
vers
itat S
alzb
urg]
at 0
7:36
04
Janu
ary
2016

reconstruction of L’Aquila was eventually agreed uponby the government. This is still underway. The newmayor announced that the city will receive 1.2 billioneuros next year, and another billion in 2017.
In 2012, six Italian scientists faced a manslaughterconviction with 6 years in prison for failing to predictthe deadly earthquake and for giving incomplete andcontradictory information to the residents. The courtstated that they were not able to accurately commu-nicate the risk in 2009. Additionally, the court alsoordered Italian authorities to pay 7.8 million euros($10 million) in damages (Mullen 2012).
All these circumstances have delayed the recoveryprocess, which seemed slow and almost stagnated3 years after the earthquake, and only accelerated in2014. These facts illustrate the importance of identify-ing and quantifying changes. Since some of thosechanges cannot be measured directly, they areexpressed through proxies or indicators, respectively.Those indicators may then be aggregated into morecomplex spatial indicators. Ultimately, such spatialindicators are expressed through maps that spatiallydifferentiate the progress of recovery. Ordinal or metricvalues are used for these maps as the recovery progressis also quantitatively described and mapped to supporttasks like predicting the return of the investment spenton the reconstruction.
The approach used to detect changes in a built-upenvironment during the early recovery, recovery, and/or development phases differs from the approach used
to detect changes during a relief phase because of theirdifferent priorities and indicators, as well as differencesin data availability. During the relief phase, the priorityis to identify the most affected areas as soon as possiblein order to save as many lives as possible. During laterphases, the priority is to detect changes in order toascertain the progress being made in the recovery pro-cess, and also to determine the nature of that progress.
The data that we used for the city of L’Aquila wascollected by remote sensing (RS) and ground observa-tions (GOs), and geographical information system(GIS) was then used to integrate the collected data.GOs pointed out by information on social, economic,institutional, and cultural aspects and at the same timewere useful to validate the observations in the physicaland environmental dimensions. The integration of thisinformation from different sources allowed the authorsto determine the recovery hotspots or areas with thebest rates of recovery. The information extracted wasdependent on the type of data available. The lack of up-to-date satellite images covering areas affected byearthquakes or other disasters has been in the past anobstacle to monitoring recovery processes and toaccumulating information concerning recoverymechanisms operating in different populations andcommunities, as has been previously pointed out byKaratani and Hayashi (2007).
The reminder of this paper is organized into eightsections. The section “Literature review” starts with theconcept of recovery and the presentation of the
Figure 1. Case study area: L’Aquila (Italy). (a) Location. Source: Google Earth – QuickBird/DigitalGlobe, distributed by European SpaceImaging on 11 September 2011. (b) Map of the ground motion intensity during the earthquake in L’Aquila. Source: USGS.
116 D. CONTRERAS ET AL.
Dow
nloa
ded
by [
Uni
vers
itat S
alzb
urg]
at 0
7:36
04
Janu
ary
2016

postdisaster phases; then it continues with the spatialcomponent of recovery and finishes with the role of RSand change detection using object-based image analysis(OBIA) to monitor recovery of an area after an earth-quake and tools used by other authors to collect GOsduring a process of recovery. The next sectiondescribes the research objectives and hypothesis. Thesection “Methodology” combines RS, GO, and GIS tomonitor the recovery of L’Aquila (Italy) after the emer-gency phase based on a monitoring schedule (2010–2012–2014) adjusted according to the availability of themeans, resources, and data. The number of changesdetected, user and producer accuracy, error of omis-sion and commission, as well as the new spatial vari-ables detected through the use of RS, are described inthe section “Results.” In the section “Discussion,” othervariables and indicators that could have been includedin the analysis are discussed, along with the advantagesand disadvantages of using satellite images for detect-ing changes during a recovery process, problems withfalse positives, integration of visual and semiautomatedanalysis, the characteristics of the satellite images to beuseful for detecting changes during a recovery process,and the methods for GOs. The number of changesobserved, their categories, their significance in the fra-mework of the recovery process after an earthquake,the problems to detect changes, the difference betweenthe changes detected through visual and semiauto-mated analysis, the advantages and disadvantages ofeach method, the conclusions about the validation onfieldwork of the changes detected through RS, are pre-sented in the section “Conclusions.” Further applica-tions of RS to monitor recovery after an earthquake arepresented in the section “Recommendations.”
Literature review
Recovery is considered as a “unique time” in whichpre-actions can be undertaken in order to prevent andmitigate the long-term risks due to natural phenomenain the physical, economic, and social dimensions(Ozcevik et al. 2009). Recovery goes beyond the recon-struction of buildings and infrastructure; it implies therebuilding of people’s lives and livelihoods (Chang2009). According to Telford and Cosgrave (2007), it isa period of moving toward development, and it isdescribed by Chamber (1997) as “good change.”Rather than a strictly defined phase, it is more contextand location specific, defined by the actions of theaffected community. Recovery following an earthquakeis a complex multidimensional long-term processinvolving planning, financing, decision making andreconstruction, aimed at restoring sustainable living
conditions to a community or an area strongly influ-enced by vulnerable conditions in the physical, social,economic, institutional, cultural, and ecological dimen-sions that existed prior to the event (Contreras et al.2011). This process is usually divided into four phasesaccording to the United Nations DevelopmentProgramme, namely the “relief,” “early recovery,”“recovery,” and “development” phases (UNDP 2008).
While several indices have been developed to mea-sure vulnerability, only relatively few authors haveconsidered a recovery index (Karatani and Hayashi2007). Noteworthy is the work of Shohei (2007),Chang (2009), and particularly, Brown, Platt, andBevington (2010), who used spatial indicators to mea-sure the recovery progress in Ban Nam Kem(Thailand), which was struck by the 2004 IndianOcean tsunami, as well as Chella Bandi Muzaffarabad,Pakistan, which was hit by the 2005 Kashmir earth-quake. Measuring the spatial component of recovery isimportant since both disastrous events and the subse-quent recovery processes take place in well-definedspatial contexts. Spatial indicators are visible measure-ments of the stage reached in the recovery process,making it easier to design a recovery plan during theearly stages and to make subsequent evaluations of theprogress. Monitoring a recovery process allows us tokeep any emerging causal factors of vulnerability undercontrol and thus to avoid reproducing the preexistingconditions that may have contributed to the originaldisaster. It also provides data that can be used to assessthe resilience of a community, and can also encouragethe formulation of preimpact recovery plans (or theimprovement of existing recovery plans) for other loca-tions around the world.
The usefulness of RS imagery in developing damageindication maps for urban areas during the relief phasefollowing earthquakes has already been demonstratedin, for example, central Java, Indonesia (Kerle 2010;Miura, Midorikawa, and Kerle 2010), L’Aquila, Italy(Tiede 2010; Uprety and Yamazaki 2010), Haiti(Tiede et al. 2011; Voigt et al. 2011), Iran (Vu,Matsuoka, and Yamazaki 2005), and Fukushima,Japan (Sanz 2012, 2013). This has been achievedthrough the derivation of physical indicators duringthe relief or early recovery phases following a disaster.Advances in RS technologies have turned satelliteimages into valuable tools for collecting data onurban change during a postdisaster phase (Liu andYamazaki 2010).
In May 2010, Bevington et al. (2010) made anattempt to monitor progress during the early recoveryphase following the January 2010 earthquake in Haiti,combining RS observations with GOs collected through
CARTOGRAPHY AND GEOGRAPHIC INFORMATION SCIENCE 117
Dow
nloa
ded
by [
Uni
vers
itat S
alzb
urg]
at 0
7:36
04
Janu
ary
2016

a variety of methods (including interviews and com-munity meetings) in order to test the correlationbetween socioeconomic disruption and the degree ofphysical damage. These authors found that the limita-tions of RS in explaining the changes in a postdisasterlandscape could be overcome by using informationcollected through GOs.
High-resolution satellite imagery was considered byBrown, Platt, and Bevington (2010) to be a useful toolfor the direct observation of recovery following a dis-aster. The main advantage is the accuracy and reliabil-ity of the data collected, while the main disadvantage isthat some aspects of recovery are not evident in satel-lite images. This disadvantage can, however, be over-come by combining imagery analysis with GOs(Brown, Platt, and Bevington 2010). This requires thesatellite imagery to be transformed into informationthat can be combined with other data sets, which isachieved using GIS (Blaschke 2010).
The EU Services and Applications for EmergencyResponse project analyzed the ground deformation inItaly’s Abruzzo region due to the L’Aquila earthquake.The objective was to achieve a thorough understandingof the seismic activity and to identify areas prone tolandslides as a secondary consequence of the earth-quake. These objectives were achieved usingENVISAT images (Goudarzi, Woldai, and Tolpekin2011). The results yielded millimetric measurementsof the ground deformation produced by the L’Aquilaearthquake. Synthetic aperture radar interferometryand the sub-pixel correlation technique were alsoused by Goudarzi, Woldai, and Tolpekin (2011) tomeasure ground surface deformation within the satel-lite’s line of sight following the L’Aquila earthquake.
Brown, Platt, and Bevington (2010) applied a pixel-based approach and the maximum likelihood algo-rithm to classify impervious surfaces and extract infor-mation concerning the demolition and removal ofbadly damaged buildings and the erection of newones. The same authors applied a series of semiauto-mated methods for identifying changes in land covertypes and green spaces using the normalized differ-enced vegetation index (NDVI) and a maximum like-lihood supervised classification. The land coverindicators studied were erosion and degradation, defor-estation, and construction. Brown, Platt, and Bevington(2010) argued that monitoring environmental recoveryor degradation should include nonurban land coverclasses such as vegetation-based habitats (sparse vege-tation, thick vegetation) and water bodies, as well asurban classes such as bare ground, impervious surfaces,and buildings.
Urban analysis using RS imagery has, in the past,mainly followed a pixel-based approach. This approachhas several limitations (especially when analyzing veryhigh-geometrical resolution (VHR) images) and doesnot provide the broad context that is required whenextracting proxy indicators for social and economicdimensions. Blaschke et al. (2014) suggested that thepixel paradigm was coming to an end and that OBIAor geographic object-based image analysis methods arebecoming increasingly important in the context of spa-tially explicit information extraction workflows, which,according to the authors, are also the most suitable forspatial planning and monitoring programs.
Discussions concerning the advantages of an OBIAapproach over a pixel analysis approach started severalyears ago. Blaschke and Strobl (2001) pointed that,while pixel-based analysis is based on the spectralvalues of the pixels, OBIA also takes into accountspatial concepts or relationships between the objectsunder analysis, such as their locations and separations,topological connectivity, directional characteristics,neighborhood context, multiple scales, spatial patterns,shape, compactness, boundaries, and so on.
Change detection analysis using OBIA provides theopportunity to consider object-based features such asgeometry, neighborhood, statistics, and context infor-mation. Furthermore, recent studies have suggestedthat OBIA using VHR imagery can yield greater accu-racy than pixel-based change detection analysis (Chenget al. 2013).
OBIA makes use of concepts that have already beenemployed in RS image analysis for several years, suchas segmentation, edge detection, feature extraction, andclassification concepts (Blaschke 2010). Its offers abridge between spatial concepts applied in landscapeanalysis, GIS, and GIScience, providing synergybetween image objects and their radiometric character-istics and analyses in Earth observation data. In orderto detect damage to buildings in L’Aquila, Uprety andYamazaki (2010) used high-resolution synthetic radaraperture imagery from the TerraSAR-X satellite (X-band, wave length 3.1 cm) together with high-resolu-tion QuickBird optical images (Uprety and Yamazaki2010). They used two sets of data: one pre-seismic andthe other post-seismic. Their concept for damagedetection using microwave radar technology wasbased on the hypothesis that damaged buildingswould give a weaker backscatter return to the satellitereceiver than undamaged buildings (Uprety andYamazaki 2010). They also estimated the NDVI fromthe postevent QuickBird image (multispectral, fourbands).
118 D. CONTRERAS ET AL.
Dow
nloa
ded
by [
Uni
vers
itat S
alzb
urg]
at 0
7:36
04
Janu
ary
2016

An OBIA-based automated approach for derivingindications of damaged buildings in L’Aquila hasbeen applied by Tiede (2010). His change detectionanalysis was based on differences between shadowscast by buildings before and after the earthquake, andwas mainly oriented toward the detection of partiallyor totally collapsed buildings using an algorithm pub-lished in Tiede et al. (2011). This methodology requirespre- and postdisaster images with similar recordingangles. The change detection analysis was carried outthrough rule sets for information extraction written inCognition Network Language, in the eCognition soft-ware (Trimble Geospatial). An automated spatial com-parison (size, shape, etc.) was conducted of “shadowobjects” extracted from pre- and postearthquakeimages; the size and shape of missing or changedshadow objects served as an additional indicator ofdamage impact. The likely damaged buildings werevisualized by applying Kernel density methods andweighted according to the difference in size of theshadow objects in the postdisaster image, as shown inFigure 2. The red tones in the figure highlight damagehot spots and the sizes of the circles are proportional tothe changes in shadow, and hence to the probablemagnitude of the damage (Tiede 2010).
Global positioning system (GPS) or geospatialvideos were also used by Mills et al. (2010) to studythe recovery process at a neighborhood scale followingthe 2007 wildfires in southern California, and to docu-ment cultural resources in the Holy Cross
neighborhood of New Orleans after HurricaneKatrina. These authors used spatial videos, based onlinking videos with coordinates obtained by a GPSreceiver. This approach increases the efficiency of thedata collection during fieldwork, potentially for multi-ple time periods, because the houses in the neighbor-hood can be categorized according to their buildingconditions in each interval of the monitoring processand allows recording comments from members of thecommunity concerning their satisfaction levels with thepostdisaster recovery process (Mills et al. 2010). Due tothe reasons mentioned, geospatial video was consid-ered by these authors to be the most suitable tool forcollecting detailed qualitative and quantitative, spatialand temporal data in a dynamic postdisaster environ-ment (Mills et al. 2010).
A combination of direct observations (RS and GOs)and social audits (focus group meetings, householdsurveys, and key informant interviews) was used byBrown, Platt, and Bevington (2010) to monitor andevaluate recovery following the 2004 Indian Oceantsunami and the 2005 Pakistan earthquake. Theauthors suggested that GOs could serve as part of thedirect observations through ground surveys using GPSvideos or as part of the social audit tool for measuringrecovery through focus meetings, household surveys,and key informant semistructured interviews, and thatmethods that complement each other in this wayshould be combined. These tools allow the collectionof accurate qualitative data concerning subjective per-ceptions and the factors affecting the satisfaction levelsof the population. In addition, these tools offer insightsinto the occupancy and maintenance levels of thebuildings, the progress and quality of the reconstruc-tion work, the prosperity and attractiveness of an area,and the functionality of local shops, hospitals,churches, and commemorative features, and they caneven allow estimates to be made of how long thereconstruction will take. GOs contribute by helping tovalidate results from satellite imagery and to answerany queries concerning building use or the degree ofdamage. Brown, Platt, and Bevington (2010) used geo-coded imagery, photographs taken by a GPS camera,and videos linked to the VIEWS™ (VisualizingEarthquakes with Satellites) system.
The ability to carry out GOs also provides an oppor-tunity to collect official reports, publications, and sta-tistics (Brown, Platt, and Bevington 2010), as well as toexperience at first hand the progress and difficulties ofthe different postdisaster phases. However, any docu-ments collected need to be carefully checked becausethey may have a political bias and because sometimesvery little of the information contained in them is
Figure 2. Damage indication following the earthquake inL’Aquila. From Tiede (2010, p.6).
CARTOGRAPHY AND GEOGRAPHIC INFORMATION SCIENCE 119
Dow
nloa
ded
by [
Uni
vers
itat S
alzb
urg]
at 0
7:36
04
Janu
ary
2016

relevant and/or useful or at the required scale (Brown,Platt, and Bevington 2010). The main disadvantage ofground surveys is that they can be expensive, timeconsuming, and even dangerous in some cases.
Research objectives and hypothesis
This paper presents a methodology based on spatialindicators for monitoring a disaster recovery processfollowing an earthquake by integrating RS techniques,GIS, and GO methods. The methodology integratesspatial indicators that can be monitored not only dur-ing the relief phase but also during the early recovery,recovery, and development phases (if they occur). Theintegration of these methods and techniques providesindicators in the physical dimension, from which it ispossible to derive proxy indicators in the social andeconomic dimensions. The specific objectives of thepresented research were to demonstrate the potentialof integrated RS, GIS, and GOs for monitoring post-disaster recovery processes beyond the relief phase andto design a model for monitoring each recovery phaseusing specific indicators, together with suitable toolsand techniques with which to carry out this task.
The usefulness of RS, GIS, and GOs for monitoringchanges in urban areas has been previously demon-strated as it was presented in the literature review.Our research has, however, focused on the extent towhich the integration of these tools, techniques, andmethods can be used to efficiently monitor the recov-ery process not only during the relief phase but alsoduring the subsequent phases of early recovery, recov-ery, and development.
Monitoring the progress of recovery is an integratedprocess that requires an understanding of the vulner-abilities that existed before the earthquake; it involvesthe extraction of indicators in the physical, social, eco-nomic, institutional, cultural, and ecological dimen-sions in order to avoid impending vulnerability andassessing resilience.
Previous research has established spatial variables forrecoveries following earthquakes that could be integratedto form indicators, as well as an index of progress for everyrecovery phase in the physical and socioeconomic dimen-sions (Contreras et al. 2014). Having identified the vari-ables and indicators for each recovery phase, it was thennecessary to design a methodology based on geospatialtools and techniques that could be used to combine thesevariables and indicators, and then integrate them into arecovery index, which in turn could be used to measurethe recovery progress (from 2 to 5 years following theevent) and the development progress (from 3 to 10 years
following the event) during the later postdisaster phases inan affected urban area.
We had previously combined GO, GIS, and RS datafrom between 2009 and 2013 in order to compile a mapindicating the degree of damage and to monitor thechanges in land use in L’Aquila following the earth-quake (Contreras et al. 2013, 2014). In this study, wehave further explored the ability of geospatial tools andtechniques focusing on additional spatial indicators ofrecovery at a finer scale.
We used an OBIA approach for automated damageindication and compared the results with visual inter-pretations. The object-based analysis technique can beuseful for deriving physical indicators and proxy socio-economic indicators in a spatial context and at a locallevel from VHR imagery, with a greater accuracy thanis possible using pixel-based approaches (Gamba,Dell’Acqua, and Dasarathy 2005; Blaschke 2010; Kerle2010; Mills et al. 2010). OBIA also attempts to bridgethe gap between RS and GIS, allowing the aggregationof information and multiscale representation of theresults, thus offering the possibility of a more compre-hensive assessment of the recovery progress duringeach phase. GOs provide detailed data that are usedto validate the information derived from RS and can beintegrated through GIS.
RS tools (satellite imagery and/or aerial photogra-phy) allow rapid identification of the most affectedareas in a city following an earthquake (within thelimits of the bird’s eye view of the imagery and thespatial and spectral resolutions). During an emergency,GO methods such as field surveys are carried out todetermine the degree of safety of buildings in a city andto develop a map indicating the degree of damage(Contreras 2009). However, it may not be possible torepeat this exercise 3, 5, or 10 years later to provide arecord of progress in the postdisaster phases and tomonitor the achievements of the recovery process,mainly because of the costs involved. Our researchhas yielded a method that can be used to monitor thedifferent phases of a city’s recovery, based on spatialindicators derived by geospatial techniques; such a taskwould otherwise be both time consuming and expen-sive, and the observations would be difficult todocument.
Methodology
We define monitoring as the observation of a processover a period of time in order to discover the rules thatregulate the process. In disaster management, the rulesthat control the postdisaster recovery process vary fromone society to another, depending on their levels of
120 D. CONTRERAS ET AL.
Dow
nloa
ded
by [
Uni
vers
itat S
alzb
urg]
at 0
7:36
04
Janu
ary
2016
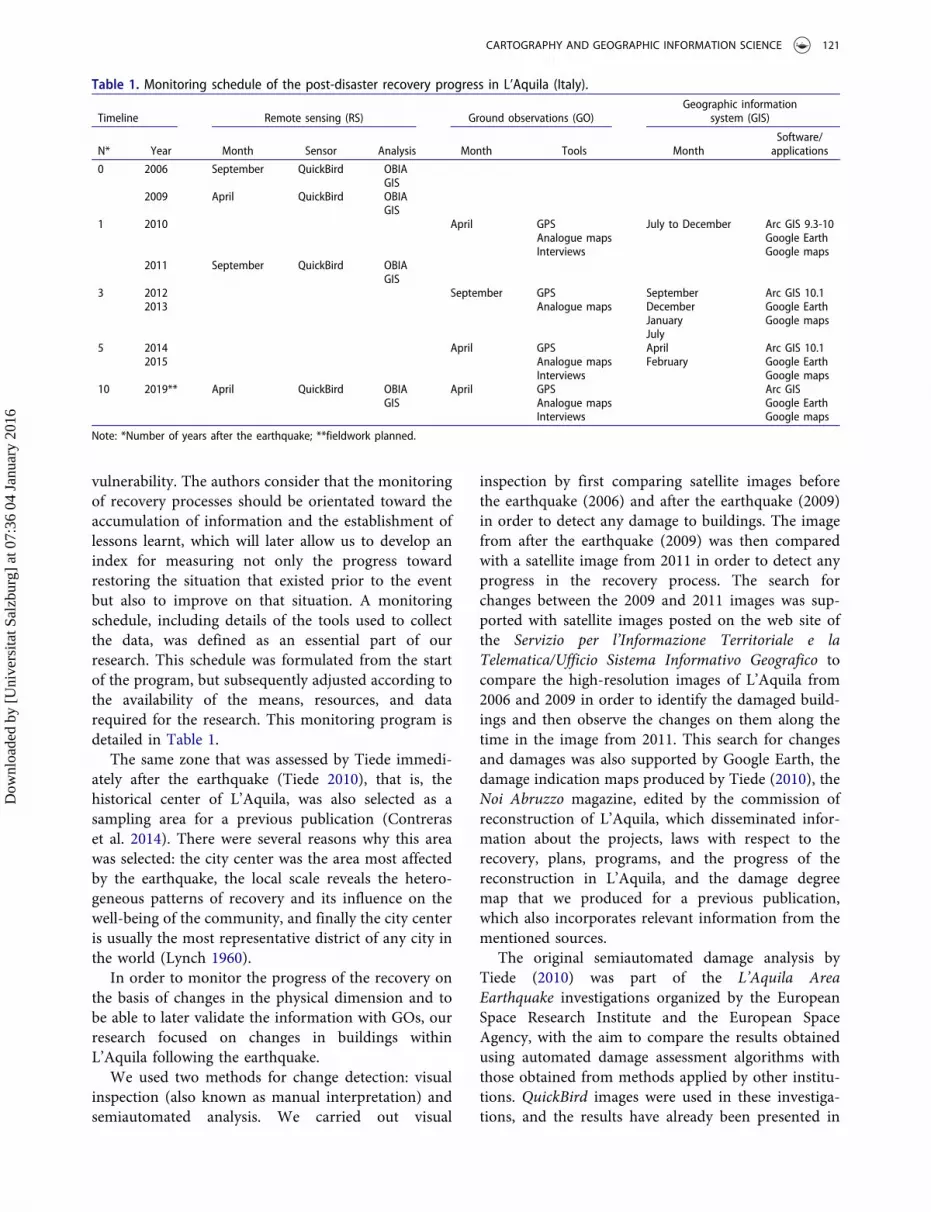
vulnerability. The authors consider that the monitoringof recovery processes should be orientated toward theaccumulation of information and the establishment oflessons learnt, which will later allow us to develop anindex for measuring not only the progress towardrestoring the situation that existed prior to the eventbut also to improve on that situation. A monitoringschedule, including details of the tools used to collectthe data, was defined as an essential part of ourresearch. This schedule was formulated from the startof the program, but subsequently adjusted according tothe availability of the means, resources, and datarequired for the research. This monitoring program isdetailed in Table 1.
The same zone that was assessed by Tiede immedi-ately after the earthquake (Tiede 2010), that is, thehistorical center of L’Aquila, was also selected as asampling area for a previous publication (Contreraset al. 2014). There were several reasons why this areawas selected: the city center was the area most affectedby the earthquake, the local scale reveals the hetero-geneous patterns of recovery and its influence on thewell-being of the community, and finally the city centeris usually the most representative district of any city inthe world (Lynch 1960).
In order to monitor the progress of the recovery onthe basis of changes in the physical dimension and tobe able to later validate the information with GOs, ourresearch focused on changes in buildings withinL’Aquila following the earthquake.
We used two methods for change detection: visualinspection (also known as manual interpretation) andsemiautomated analysis. We carried out visual
inspection by first comparing satellite images beforethe earthquake (2006) and after the earthquake (2009)in order to detect any damage to buildings. The imagefrom after the earthquake (2009) was then comparedwith a satellite image from 2011 in order to detect anyprogress in the recovery process. The search forchanges between the 2009 and 2011 images was sup-ported with satellite images posted on the web site ofthe Servizio per l’Informazione Territoriale e laTelematica/Ufficio Sistema Informativo Geografico tocompare the high-resolution images of L’Aquila from2006 and 2009 in order to identify the damaged build-ings and then observe the changes on them along thetime in the image from 2011. This search for changesand damages was also supported by Google Earth, thedamage indication maps produced by Tiede (2010), theNoi Abruzzo magazine, edited by the commission ofreconstruction of L’Aquila, which disseminated infor-mation about the projects, laws with respect to therecovery, plans, programs, and the progress of thereconstruction in L’Aquila, and the damage degreemap that we produced for a previous publication,which also incorporates relevant information from thementioned sources.
The original semiautomated damage analysis byTiede (2010) was part of the L’Aquila AreaEarthquake investigations organized by the EuropeanSpace Research Institute and the European SpaceAgency, with the aim to compare the results obtainedusing automated damage assessment algorithms withthose obtained from methods applied by other institu-tions. QuickBird images were used in these investiga-tions, and the results have already been presented in
Table 1. Monitoring schedule of the post-disaster recovery progress in L’Aquila (Italy).
Timeline Remote sensing (RS) Ground observations (GO)Geographic information
system (GIS)
N* Year Month Sensor Analysis Month Tools MonthSoftware/applications
0 2006 September QuickBird OBIAGIS
2009 April QuickBird OBIAGIS
1 2010 April GPSAnalogue mapsInterviews
July to December Arc GIS 9.3-10Google EarthGoogle maps
2011 September QuickBird OBIAGIS
3 20122013
September GPSAnalogue maps
SeptemberDecemberJanuaryJuly
Arc GIS 10.1Google EarthGoogle maps
5 20142015
April GPSAnalogue mapsInterviews
AprilFebruary
Arc GIS 10.1Google EarthGoogle maps
10 2019** April QuickBird OBIAGIS
April GPSAnalogue mapsInterviews
Arc GISGoogle EarthGoogle maps
Note: *Number of years after the earthquake; **fieldwork planned.
CARTOGRAPHY AND GEOGRAPHIC INFORMATION SCIENCE 121
Dow
nloa
ded
by [
Uni
vers
itat S
alzb
urg]
at 0
7:36
04
Janu
ary
2016

Figure 2. The analysis was designated a semiautomaticanalysis due to the integration of expert knowledge intothe decision rule set in order to assist in the changedetection and refine the results and tailor the methodto the specific data available. In order to be able todetect changes in L’Aquila during the early recoveryand recovery stages, we acquired an additionalQuickBird image from 2011.
Change detection analysis following an earthquakeidentifies changes in the ground/earth surface as wellas the man-made structures such as buildings, irre-spective of whether the changes reflect damage due tothe earthquake or are due to either reconstruction ordemolition. An easy, time-effective way to detectbuildings is through the integration of ancillary spatialinformation, such as the outlines of buildings from,for example, a cadastral map, which in the case ofL’Aquila is dated from 2006. Such additional informa-tion has therefore been incorporated into our analysis.This “parcel-based” segmentation approach was com-pleted with two segmentations based on the 2011image prior to the multiscale classification.
The classification of buildings in the 2011 image wasbased on these initial image segmentations, as well ason further object refinement processes, the classifica-tion of objects, and the detection of changes betweenobjects. Our change detection approach was based onan initial classification of the 2011 image and a com-parison of the resulting classes (and objects) with thespectral information from the 2009 image, within anintegrated environment.
The main features used to distinguish changes inbuildings between 2009 and 2011 were
● Spectral features: Objects that showed significantchanges in their spectral information between2009 and 2011. They were identified as initialcandidate objects.
● Textural features: Features based on the texturesof objects, such as differences in the gray-leveldifference vector mean and the gray-level co-occurrence matrix, were mainly useful for detect-ing changes in roof textures, focusing on built-upareas only (as determined from the incorporatedcadastral map).
● Geometric features (describing the form of anobject) such as, for example, roundness, wereused to differentiate compact or regular (man-made) objects from natural objects.
The preliminary results were further analyzed to reducethe number of false positives and improve the overallaccuracy. This was achieved by investigating class-
related spatial features such as the neighborhoodbetween objects identified in the preliminary classifica-tion as having changed in order to identify otherobjects with a high probability of also being affectedby changes, for additional analyses. Form descriptorsand object sizes were used to reject any large elongatefeatures that were likely to have been incorrectly clas-sified due to changes in shadow between the twoimages.
The change detection analysis of buildings involvedcomparing the previously classified areas and objects(on coarse and fine scale) with the same areas andobjects in the 2009 image. Debris from demolishedbuildings was easily detected due to differences in inten-sity, texture, and brightness. Spatial similarity in neigh-boring pixels, which is the concept of texturemeasurements, was useful for identifying similar objectclasses that did not exhibit any changes. The semiauto-mated analysis deliberately considered only changes inexisting buildings and did not recognize new buildingsas changes; apart from that, it was implemented with theobjective of providing a rapid identification of changeswithout taking into account any different categories ofchange. A visual inspection of the change indicationswas in any case necessary in order to identify recoveryindicators and categorize the automatically identifiedchanges according to their indicator classes.
The GOs were made during three field visits toL’Aquila between 2009 and 2014: one in 2010 (1 yearafter the earthquake), another in 2012 (3 years after theearthquake), and the third in 2014 (exactly 5 years afterthe earthquake). The main activities during fieldworkcomprised (1) visits around, and to the former red zone,whereby the main goals of these visits were to take geo-tagged pictures and to record the condition and use ofbuildings; (2) visits to the new settlements aroundL’Aquila; (3) the collection of spatial data sets for integra-tion in GIS; and (4) interviews with community membersliving in the new settlements, and with members of theDepartment of Civil Protection and the L’Aquila CityCouncil (Settore Ricostruzione Pubblica – ufficioProgettazione). During the 2012 visit, it was necessary tospend more time in the city center than originallyplanned as the size of the restricted area had been reducedand the controls on access were less strict, which meantthat we had the opportunity to observe the conditions ofbuildings that we were not able to observe in 2010. Themain objective of the fieldwork carried out in 2014 was tovalidate the changes detected using RS techniques, whichwas possible because the access restrictions had by thenlargely been lifted. Only access to certain particular build-ings was prohibited, either due to the level of damage orbecause of internal reconstruction work.
122 D. CONTRERAS ET AL.
Dow
nloa
ded
by [
Uni
vers
itat S
alzb
urg]
at 0
7:36
04
Janu
ary
2016

GIS was used to integrate the GOs from 2010 and2012, as well as information obtained from documentsabout the reconstruction such as the Noi Abruzzo pub-lication collected during fieldwork, the report on theEuropean Commission-funded MICRODIS project(UNIFI 2011), and the results from the automatedanalysis carried out by Tiede (2010). The integrationof this information made it possible to create a geos-patial database of the degree of damage, land userestrictions, building conditions, and building use clas-sifications in L’Aquila. This database was later used tomonitor the changes in these features in 2010 and2012, with respect to 2009. We reconstructed a mapshowing the building use in L’Aquila before the earth-quake by integrating the information available inGoogle Maps for 2010 with the 3D model of the cityof L’Aquila in Google Earth, which includes images ofL’Aquila before and after the earthquake. Anothersource of information regarding the building use wasthe observation of the commercial announcements onthe top of the doors, or next to them in the GPS-taggedphotographs taken during the fieldwork (Contreraset al. 2014). The integration of the information col-lected and its subsequent analysis was carried outthrough GIS, as depicted in Figure 3.
Each category of change to buildings identifiedthrough the visual and semiautomated analysis wasthen integrated as a variable into the framework ofspatial recovery indicators. Each category of changewas allocated a value (in a process involving expertjudgment) according to its contribution to the progressof the postdisaster recovery process, as proposed in themethodology formulated by Contreras et al. (2014).
A schematic representation of the entire monitoringmethodology applied in the research presented hereincan be found in Figure 4.
Results
Visual analysis of the 2011 satellite image identified 43changes in buildings, as shown in Figure 5. Thirty newbuildings were also detected by this method. In con-trast, semiautomated analysis identified 148 changes inbuildings, as shown in Figure 6.
The number of changes per category considered asvariables identified through both manual interpretationand semiautomated analysis is presented in Table 2,together with accuracy assessment results. The first lineof the table is empty because the semiautomatedmethod did not search for new buildings and these
Figure 3. Integrated monitoring scheme for assessing recovery in L’Aquila.
CARTOGRAPHY AND GEOGRAPHIC INFORMATION SCIENCE 123
Dow
nloa
ded
by [
Uni
vers
itat S
alzb
urg]
at 0
7:36
04
Janu
ary
2016

Figure 4. Integrated methodology for monitoring the progress of recovery in L’Aquila.
Figure 5. Results from visual analysis of changes in L’Aquila between 2009 and 2011.
124 D. CONTRERAS ET AL.
Dow
nloa
ded
by [
Uni
vers
itat S
alzb
urg]
at 0
7:36
04
Janu
ary
2016

results can therefore not be compared or included inthe accuracy assessment.
In summary, 43 changes in buildings were identifiedusing purely visual analysis and 148 using semiautomatedanalysis. However, only 81 of the total changes in buildingsdetected through semiautomated analysis were confirmedas true positives by GO, which corresponds to a useraccuracy of 55%, a producer accuracy of 81%, and an
error of omission of 19%. The remaining 67 changeswere false positives, which mean an error of commissionof 45%. The changes identified through visual and manualinterpretation were validated during fieldwork, as shownin Figures 7 and 8.
The change categories identified through visual andsemiautomated analysis of the satellite images overL’Aquila were integrated as variables into an indicatorof building condition. Such an indicator was previouslyproposed by Contreras et al. (2014) as a means ofdetecting the progress of recovery after an earthquakein the physical dimension. The new spatial variablesintegrated into the building condition indicator areshown in Table 3.
The proposed monitoring process, which integratesRS, GIS, and GOs, is plotted in Figure 9. The indica-tors, tools, and techniques, particularly those high-lighted in red, were addressed in this research. Thismonitoring process, including indicators, tools, andtechniques, can be used to monitor any recovery pro-cess following an earthquake anywhere in the world,and with some variations to monitor recovery pro-cesses following other phenomena.
Discussion
The major goal of this article was to develop a centralspatial indicator of recovery that is based on buildingconditions that can be used at a finer scale.
One indicator considered by Brown, Platt, andBevington (2010) to be a sign of recovery was the pre-sence of vehicles because their presence on the roadsmeans that the road conditions are suitable and thatthere are urban facilities open. We also considered thepossibility of including this indicator, but the availablesatellite data was not suited to this task. The different days
Figure 6. Location of changes in buildings between 2009 and2011, following the earthquake in L’Aquila (heat map). Source:Based on QuickBird/DigitalGlobe, European Space Imaging on11 September 2011.
Table 2. Number of changes in buildings detected through the visual analysis versus semiautomated analysis.
Indicator VariablesVisualanalysis
Semiautomatedanalysis
Combined recognitionrate (visual analysis +
semiautomated) References
Changes detectedby the initial visual
analysis (%)
Changes detectedby the automated
analysis (%)
Changes inbuildings
New buildings**Buildings reconstructed* 3 5 5 5 60 100Buildings demolished 6 6 6 6 100 100Debris removed 13 10 14 14 93 71Earthworks* 6 4 6 9 67 44New roof* 2 21 23 23 9 91Changes in roof* 4 2 6 6 67 33Roof under repair* 7 16 16 19 37 84Roof deteriorated* 1 14 15 15 7 93Bleachers painted* 0 1 1 1 0 100Roof disassembled* 1 2 2 2 50 100Subtotal 43 81 94 100 43 81
False positives 0 67 67 0Total changes 43 148 161 100
Notes: *The semiautomated method did not look for new buildings. Category detected by visual analysis.**New categories detected by the semiautomated analysis.
CARTOGRAPHY AND GEOGRAPHIC INFORMATION SCIENCE 125
Dow
nloa
ded
by [
Uni
vers
itat S
alzb
urg]
at 0
7:36
04
Janu
ary
2016

of acquisition would be a problem for this kind of indi-cator since it is not possible to compare the peak hourtraffic on a working day with, for example, traffic on a
Sunday afternoon. The total reduction in the number ofcars in the areas surrounding the L’Aquila city center canbe seen from the differences between Figure 10a and b,
Figure 7. Changes in buildings between 2009 and 2011 following the earthquake in L’Aquila. (a) Changes detected through manualinterpretation. Source: Based on QuickBird/DigitalGlobe, European Space Imaging on 11 September 2011. (b) Changes validatedduring fieldwork in 2014. Source: Adapted from Servizio per l’Informazione Territoriale e la Telematica - Ufficio Sistema InformativoGeografico-Regione Abruzzo.
Figure 8. Changes in buildings between 2009 and 2011 following the earthquake in L’Aquila. (a) Changes detected throughsemiautomated analysis. Source: Based on QuickBird/DigitalGlobe, European Space Imaging on 11 September 2011. (b) Changesvalidated during fieldwork in 2014. Source: Adapted from Servizio per l’Informazione Territoriale e la Telematica - Ufficio SistemaInformativo Geografico-Regione Abruzzo.
126 D. CONTRERAS ET AL.
Dow
nloa
ded
by [
Uni
vers
itat S
alzb
urg]
at 0
7:36
04
Janu
ary
2016

and the gradual return to normality in Figure 10c and d.The reduction in the numbers of cars in L’Aquila was notrelated to the condition of the roads but to the fact thataccess to some of the streets was restricted between 2009and 2012. The L’Aquila city center is now busy withmachinery and with trucks carrying material for buildingreconstruction.
In 2010, Brown et al. cast doubt on the effectiveness ofusing high-resolution imagery to collect data on otherdimensions besides the physical and the environmentalones (Brown, Platt, and Bevington 2010). Another
disadvantage is the cost of the images, although theseare still less expensive than deploying a ground surveyin an affected area after 1, 3, 5, or 10 years to collect dataon the progress of the recovery process. Recovery mon-itoring with high-resolution imagery is an effective way toaccumulate information and experience concerning thiskind of process because the data collection is one of thebiggest obstacles for the analysis of a recovery process.One disadvantage that we encountered related to theavailability of high-resolution images of L’Aquila, almost5 years after the earthquake. No up-to-date image from atleast 2013 was available from the archive, which meantthat any image from that time would need to be taskedand costs for tasking a cloud-free image are relativelyhigh. This was the main reason for selecting the latestavailable cloud-free image of L’Aquila, which was fromSeptember 2011.
Our research has demonstrated how change detectionusing EO data can be incorporated into the recoveryprocess. However, the variable viewing angle of multi-temporal VHR images not only affects the accuracy butalso leads to false positives in the change detectionanalysis. For instance, partly illuminated facades in onescene would increase the intensity and brightness values,which could be mistakenly detected as changes. This wasthe likely reason that 67 false positives were obtained(error of commission 45% and a user accuracy of 55%).The images should therefore preferably be acquired atnadir, and with similar sun angles. This was not the case
Table 3. Spatial variables of the recovery indicator: buildingcondition.Dimension Indicator Variables
Physical Building condition New buildings*Construction ongoingPartially enabledReconstructed*Reconstruction ongoingEarthworks*Reconstruction projectedRepaired New roof*
Changes in roof*Roof under repair*Roof disassembled*
Debris removed*Propped Roof deteriorated*InhabitedRestricted useDemolished
Note: *New spatial variables identified through the combination of RS, GIS,and GOs.
Figure 9. Integrated monitoring model of RS-GIS-GO to assess postdisaster recovery.
CARTOGRAPHY AND GEOGRAPHIC INFORMATION SCIENCE 127
Dow
nloa
ded
by [
Uni
vers
itat S
alzb
urg]
at 0
7:36
04
Janu
ary
2016

for the available images and, because of the varyingviewing angles and sun angles of the images, a largenumber of features had to be tested on the ground andstrict rules put in place followed, not only to avoid falsepositives but also to improve the accuracy of the changedetection.
The RS classification rule sets applied in thisresearch are more or less standard nowadays inOBIA, and we did not elaborate on them in detail.Instead, we investigated how these rule sets can beused to detect changes in the spatial dimension duringthe postdisaster phase. These changes are later inte-grated as variables into the spatial indicator “buildingcondition,” which is one of the indicators used tomonitor and evaluate the progress of a recovery pro-cess after an earthquake.
On the basis of these results (the relatively low error ofomission but high error of commission, and a higherdetection rate than the initial visual analysis), the authorsrecommend an initial automated processing followed bydetailed visual inspection of the detected changes. Thetime-consuming and costly visual inspections can thusbe focused on specific areas, concentrating on thematicclassifications and on identifying false positives indicatedby the automated approach.
The visual analysis is required in order to aggregatethe semiautomated analysis results into the specificindicator categories, and then to check within eachcategory for any false positives from the automatedanalysis. Conversely, the semiautomated analysis can
support the visual inspection not only by detectingchanges more rapidly (since the error of omission islow, i.e., below 20%) but also by helping to make thevisual inspection more accurate (through a higherdetection rate of changes in buildings) and more effi-cient (by allowing it to focus on the complex task ofidentifying and classifying the changes).
The season in which an image was acquired canalso be critical for change detection in both buildingsand vegetation. The seasonal difference between theQuickBird data from 2006 (acquired in September)and the QuickBird data from 2009 (acquired inApril) caused some problems when using a semiau-tomated method for shadow change detection todetermine the location of collapsed buildings duringthe relief phase (Tiede 2010). The difference in folia-tion between the seasons can be appreciated inFigure 11.
One of the problems with the visual and automatedanalysis of changes using QuickBird images is that onlybuildings with damage or changes in the roof can becounted as a change. It would be necessary to have datafrom digital aerial images (Maruyama, Tashiro, andYamazaki 2010) or lidar and/or radar data (Bakkeret al. 2004) to detect differences between the heightsof buildings before and after the event, but even withthese data sets we would not be able to detect damageto the structure or façade of a building that has notresulted in a (partial or total) collapse of the building orthe building roof.
Figure 10. Vehicles in Via Fontesecco, L’Aquila, in 2008, 2010, 2012, and 2014. (a) August 2008 (before the earthquake). Source:Photo from Google Earth. (b) 2010, 1 year after the earthquake. (c) 2012, 3 years after the earthquake. (d) 2014, 5 years after theearthquake. Source: Photos (b) to (d) by Diana M. Contreras M.
128 D. CONTRERAS ET AL.
Dow
nloa
ded
by [
Uni
vers
itat S
alzb
urg]
at 0
7:36
04
Janu
ary
2016

The advantage of using QuickBird and/or Worldviewsatellite imagery is that the satellite can be programmedto a required location (such as to the area affected byan earthquake), and the images obtained are of a veryhigh resolution that is suitable for detecting changes inbuildings, in impervious areas, and in vegetation.
Since the use and occupation of buildings in theL’Aquila city center changed dramatically immediatelyafter the earthquake, another proposed indicator wasthe land surface temperature (LST), previously used byFeizizadeh and Blaschke to identify urban heat islands,and to establish their relationships to land use/landcover and air pollution (Feizizadeh and Blaschke2013). However, we decided not to use this indicatorsince it is likely to be most significant in very crowdedcentral business districts, which was not the case forthe L’Aquila city center even before the earthquake.However, in other case study areas for postdisasterrecovery the LST could be an indicator worth monitor-ing over the long term.
Other possible indicators for monitoring progress in apostdisaster recovery process are the visible near-infrared(VNRI) radiance (Mesev 2007) and the nighttime lightradiance intensity and duration (Brown, Platt, andBevington 2010). These are used to monitor the disrup-tion and reconnection of power supplies, economic activ-ity, and CO2 emissions (Brown, Platt, and Bevington2010). The VNRI radiance (Mesev 2007) or nighttimelight (Brown, Platt, and Bevington 2010) indicators forL’Aquila would have been interesting to monitor, parti-cularly with respect to the city center. It should have beenpossible to observe the drop in economic activity in thispart of L’Aquila following the earthquake in April 2009,and the subsequent gradual increase in activity from 2009to 2014. However, civilian nighttime data is unfortunatelyonly available at resolutions of 0.5–2.7 km (Brown, Platt,and Bevington 2010), and in order to monitor theL’Aquila city center we would require a much higherresolution.
The use of the satellite images to detect changes andthus to assess progress in postdisaster recovery is lessexpensive than deploying several survey teams to thewhole study area 1, 3, 5, and 10 years after the event.However, using RS is also an expensive process(although not as expensive as ground surveys) notonly because of the cost of the images but also becauseof the time required for processing and interpreting thedata, and for programming rule sets for automatedfeature extraction.
For the GOs, we used a similar method to thatapplied by Mills et al. (2010), but instead of usinggeospatial video we used geotagged photographsthrough the support of an external GPS receiver con-nected to the camera via Bluetooth. This allowed us tocompare the changes in the physical condition of thebuildings in the two intervals of the fieldwork visits(2010–2012 and 2012–2014). The comparison betweenthe conditions of the buildings before the earthquakeand in 2010 was done using the street photographs ofL’Aquila before the earthquake available in GoogleEarth, and the pictures taken around the red zoneduring the first visit to the area in 2010.
Conclusions
Changes were detected in buildings right across theL’Aquila city center. A visual analysis detected 43changes in existing buildings and a further 30 newbuildings. The changes noted were categorized (inorder of decreasing abundance) as debris removed,roof under repair, earthworks, buildings demolished,changes in roofs, building reconstructed, new roof, roofdisassembled, or roof deteriorated. Most of the changeswere related to activities belonging to the early recov-ery and recovery stages, but not to the developmentphase. The small number of reconstructed or newbuildings in 2011 was discouraging, considering thatthis was 2 years after the earthquake.
Figure 11. Foliage next to buildings on via XX Settembre, L’Aquila: (a) April 2010; (b) September 2012.
CARTOGRAPHY AND GEOGRAPHIC INFORMATION SCIENCE 129
Dow
nloa
ded
by [
Uni
vers
itat S
alzb
urg]
at 0
7:36
04
Janu
ary
2016

The 81 changes identified by the semiautomatedanalysis were categorized (in order of decreasing abun-dance) as new roof, roof under repair, roof deterio-rated, debris removed, buildings demolished, buildingreconstructed, earthworks, changes in roof, roof disas-sembled, and grandstands painted. As was the case inthe visual analysis, most of the changes correspondedto activities in the early recovery and recovery phasesfollowing the disaster. During our research, weencountered two problems detecting changes in build-ings: the first was the absence of any up-to-date cadas-tral map for the city of L’Aquila, it was necessary to usethe cadastral map from 2006 in the classification pro-cess, and the second was the difference in viewing andillumination angles between the images from 2009 and2011. Despite the strict decision rules that we formu-lated to try and avoid errors due to these differences inviewing and illumination angles, we consider that theywere the main reason for the 67 false positives in thesemiautomated analysis. The semiautomated methodrecognized 81% of the changes, whereas the initialvisual inspection identified only 43%, and a combina-tion of both methods is therefore recommended inwhich the initial semiautomated inspection is followedby visual inspection and the categorization of the iden-tified changes.
Since the new buildings and temporary structures(such as temporary shelters) were not included in thecadastral map used for the initial classification, theycould not be detected through the approach selectedfor the semiautomated analysis in this study. The algo-rithms used to detect changes in buildings weredesigned to only detect changes in buildings that werein existence prior to the event, and not to detect newbuildings erected after the event. However, earthworksaround new buildings and temporary structures for useas parking areas, or for pedestrian access, gardens, etc.,were sometimes detectable in the semiautomated ana-lysis as changes in impervious surfaces.
Other differences between results from the manualinterpretation and those from the semiautomated ana-lysis in the new roof, roof deteriorated, and buildingsreconstructed categories could be explained by the per-son responsible for the visual analysis making use offirsthand knowledge of the area and personal experience(e.g., knowing where to look for changes in the area)and/or by the difficulty that the human eye experiencesin detecting certain categories of change.
Detecting changes in buildings thus requires theintegration of semiautomated analysis and visual (man-ual) interpretation. The semiautomated analysis iden-tifies the location and spatial distribution of changes,while the visual analysis allows the categories of the
changes to be determined and new buildings to beidentified. Both sets of results require validation byfieldwork.
The validation by fieldwork revealed that changesdetected in buildings did not necessarily indicate posi-tive progress in every instance. Where changes inbuildings were detected through the semiautomatedanalysis, and where any changes in the façades ofbuildings were observed on the ground during the2014 fieldwork, we concluded that the change detectedwas related to deterioration rather than to any repair orreconstruction. This revealed the importance of vali-dating RS results through GOs in order to determine inwhich areas the changes detected did not indicate anypositive progress but were instead the result of furtherdeterioration in structures that had been damaged bythe earthquake and not subsequently repaired orreconstructed.
By integrating the data collected using both visualand semiautomated analysis of satellite images coveringL’Aquila, it was possible to increase the number ofvariables used for change detection and to makesome of them more detailed in order to completethe building condition indicator of the postearthquakerecovery index. One of the main contributions of thesemiautomated analysis was to make it easier to detectfine-scale changes such as a new roof, changes in aroof, a roof under repair, a disassembled roof,removed debris, and a deteriorated roof. Thesechanges would be detectable neither in a first-passvisual inspection nor through GOs.
The limitations in RS with respect to satelliteimagery resolution and the use of semiautomatedanalysis to extract the number of vehicles on thestreets in a postdisaster area can be resolved throughobservations from fieldwork, as demonstrated by thephotos in Figure 10. These images illustrate the gra-dual return of cars to the L’Aquila city center with-out having to resort to counting the number ofvehicles circulating in each of the streets.
The use of RS offers the possibility to reduce ordelimit more efficiently the area to be covered by field-work. It allows changes to be located and, followingvalidation by fieldwork, control points to be generatedfor the subsequent phases without the need to inspectthe entire area affected on a year-by-year basis.
The high level of reliability in the changes detectedusing semiautomated analysis means that it is possibleto use this tool to monitor changes within specificareas, using them a control points for the recoveryprogress. If the budget and available time are limited,the fieldwork can be replaced by the detection ofchanges using satellite images.
130 D. CONTRERAS ET AL.
Dow
nloa
ded
by [
Uni
vers
itat S
alzb
urg]
at 0
7:36
04
Janu
ary
2016

To monitor a recovery process, it is necessary tocombine GIS, GOs, and RS for a more holistic datacollection and in order to evaluate the progress of thepostdisaster recovery.
The use of geospatial video and/or geotagged photo-graphs increases not only the efficiency of the datacollection during fieldwork but also the mapping accu-racy in GIS of the condition of the buildings over time.Therefore, geospatial video and geotagged photographsconstitute an essential tool for the GOs. This methodallows accumulating knowledge and experience of eachrecovery process after a disaster in order to later com-pare them and discover the common and the particulardrivers of the recovery in each case.
Recommendations
Damage indication maps based on very high-resolu-tion imagery are a valuable tool for the emergency/disaster management professionals, helping them todecide where to deploy search and rescue task forces,as well as building inspection teams, during the post-disaster relief phase. Researchers will also benefitfrom available earthquake damage scenarios (DPAE2006) for the affected area because the damage indi-cation maps will be a tool to validate the model todevelop these damage scenarios. In the case of urbanplanners, the damage indication maps will allowthem to focus on the vulnerability conditions thatmade the disaster possible in some specific areas ofthe city, and elaborate on them in order to end upwith a more resilient city after the recovery process.
● RS is an efficient tool during the relief phasefollowing a disaster and can be used to identifyareas with a high degree of damage, which canthen be displayed in a damage indication map.However, during the early recovery, recovery, anddevelopment phases, where a high level of detail isrequired in order to monitor progress in thesocial, economic, institutional, and culturaldimensions, ground surveys may be a betteroption as they are able to ensure a high degreeof reliability in the information collected,although it may still be possible to derive relevantinformation from high-resolution images throughthe use of proxy indicators.
● We suggest combining a rapid semiautomatedchange identification method with a subsequentvisual inspection of the results. Our automatedanalysis yielded a higher detection rate than thevisual inspection, especially for small-scalechanges, with a reasonably low error of omission.
The subsequent visual inspection is able to focuson the indicated changes in order to remove falsepositives and to categorize the changes. The detec-tion of new buildings could in future also besupported by an automated routine, if required.
● Semiautomated analysis is also important foridentifying changes in impervious surfaces(such as new roads, sidewalks, parking lots),gardens, parks, football grounds, swimmingpools, earthworks, and so on, and also toobserve, for example, whether or not temporaryshelters have been removed, and to monitor theprogress of infrastructure repair following theevent. Changes in impervious surfaces mayreflect variables that can subsequently be inte-grated into a physical indicator of infrastructurecondition as part of a recovery index followingan earthquake.
● The satellite images that are compared in order todetect changes in the built-up environment or tocount vehicles (by either visual or automated ana-lysis) should be acquired between the end ofautumn and early spring, when there is no foliageon the trees. Conversely, images used to detectchanges in vegetation should be acquired betweenthe end of spring and the beginning of autumn,when the trees are in full leaf.
● During the early recovery, recovery, and develop-ment phases, the indication maps can continue toprovide valuable assistance for the urban planningdepartments in charge of the recovery process todecide which areas require continued monitored,which areas require a special focus, and whichareas to target for ground surveys 5 or 10 yearsafter the emergency, thus avoiding wastingresources by unnecessarily monitoring the entireaffected area.
● Although an earthquake may not have any effecton vegetation, we consider that detecting changesin vegetation can assist in identifying progress inthe development phase (5 and 10 years after theearthquake), reflected in an increase or decreasein urban green areas, urban open spaces, or treeswithin the affected area. Green areas providehabitats for biodiversity, clean air and water,help to regulate the temperature, contribute tothe well-being of inhabitants, and contribute tothe attractiveness of an area (with consequentincreases in house prices).
● It is important for countries, cities, and towns tokeep their cadastral data up-to-date. This data,combined with satellite imagery, is essential forthe production of accurate damage indication
CARTOGRAPHY AND GEOGRAPHIC INFORMATION SCIENCE 131
Dow
nloa
ded
by [
Uni
vers
itat S
alzb
urg]
at 0
7:36
04
Janu
ary
2016
maps during the relief phase and for the produc-tion of change detection maps during the earlyrecovery, recovery, and development phases.
● Another form of data that can be used for visualanalysis is time series data, available for free inGoogle Earth (where data is available). Time ser-ies can provide a useful indication of both changesand progress in a postdisaster recovery process.
● The proposed methodology based on the integra-tion of RS, GIS, and GOs to monitor and evaluatethe progress of the recovery after earthquakes canalso be applied to monitor the recovery processafter other kinds of phenomena, based on otherkinds of spatial indicators. For instance, changes invegetation could be a spatial indicator for assessingthe ecological impact of wildfires, hurricanes, tor-nadoes (Curtis and Mills 2012), floods, and then tomonitor the recovery of the territories affected bythem (Brown, Platt, and Bevington 2010).
Acknowledgments
We gratefully acknowledge Dr. Salvatore Stramondo from theIstituto Nazionale di Geofisica e Vulcanologia, Italian NationalEarthquake Center (INGV), for providing data within the fra-mework of the Image Information Mining Virtual Laboratory(IIMvLAB) experiment focusing on the L’Aquila area earth-quake. We extend our most sincere thanks for the researchgrant awarded in 2013 by the Earthquake Engineering FieldInvestigation Team (EEFIT) and the Institute of StructuralEngineers (ISE) to monitor the progress of the postdisasterrecovery process in L’Aquila, 5 years after the earthquake. Wethank the Afro-Asiatisches Institut – Salzburg (AAI Salzburg)for complementary financial support toward this research, andthe COLFUTURO foundation for the promotion of this scien-tific work. We gratefully acknowledge the support of PetraFüreder MSc and Srirama Bhamidipati MSc, and thank themfor their advice during the early stages of the proposal writingfor the research grant awarded by EEFIT.We would also like tothank Dr. Guillermo Aldama for his advice regarding the voca-bulary, and Ed Manning, Helena Merschdorf, and IsabellaMerschdorf for English-language corrections. Last but notleast, thanks to the editor and anonymous reviewers for theircontributions to this paper.
Disclosure statement
No potential conflict of interest was reported by the authors.
Funding
This work was supported by the Earthquake EngineeringField Investigation Team (EEFIT), the Institute ofStructural Engineers (ISE) [EEFIT Research Grant 2013],the Afro-Asian institute (AAI), and the Austrian Science
Fund (FWF) through the GIScience Doctoral College [DKW 1237-N23].
References
Alexander, D. 2010. “The L’Aquila Earthquake of 6 April2009 and Italian Government Policy on DisasterResponse.” Journal of Natural Resources Policy Research2: 325–342. doi:10.1080/19390459.2010.511450.
Bakker, W. H., K. A. Grabmaier, G. C. Huurneman, F. D. v.d. Meer, A. Prakash, K. Tempfli, A. S. M. Gieske, et al.2004. Principles of Remote Sensing. Enschede: ITC.
Bevington, J., S. Pyatt, A. Hill, M. Honey, B. Adams, R.Davidson, S. Brink, et al. 2010. “Uncovering CommunityDisruption Using Remote Sensing: An Assessment ofEarly Recovery in Post-Earthquake Haiti.” 8thInternational Workshop on Remote Sensing for DisasterManagement, Tokyo, Tokio Institute of Technology, 6.
Blaschke, T. 2010. “Object Based Image Analysis for RemoteSensing.” ISPRS Journal of Photogrammetry and RemoteSensing 65 (1): 2–16. doi:10.1016/j.isprsjprs.2009.06.004.
Blaschke, T., G. J. Hay, M. Kelly, S. Lang, P. Hofmann, E.Addink, R. Queiroz Feitosa, et al. 2014. “GeographicObject-Based Image Analysis – Towards a NewParadigm.” ISPRS Journal of Photogrammetry andRemote Sensing 87 (0): 180–191. doi:10.1016/j.isprsjprs.2013.09.014.
Blaschke, T., and J. Strobl. 2001. “What’s Wrong withPixels?” Interfacing Remote Sensing and GIS 6.
Brown, C., M. Milke, and E. Seville. 2011. “Disaster WasteManagement: A Review Article.” Waste Management31 (6): 1085–1098. doi:10.1016/j.wasman.2011.01.027.
Brown, D., S. Platt, and J. Bevington. 2010. Disaster RecoveryIndicators: Guidelines for Monitoring and Evaluation.Cambridge: Cambridge University Centre for Risk in theBuilt Environment (CURBE), University of Cambridge.
Chang, S. E. 2009. “Urban Disaster Recovery: AMeasurement Framework and Its Application to the1995 Kobe Earthquake.” Disasters 34 (2): 303–327.doi:10.1111/j.1467-7717.2009.01130.x.
Cheng, G., J. Han, L. Guo, X. Qian, P. Zhou, X. Yao, and X.Hu. 2013. “Object Detection in Remote Sensing ImageryUsing a Discriminatively Trained Mixture Model.” ISPRSJournal of Photogrammetry and Remote Sensing 85 (0): 32–43. doi:10.1016/j.isprsjprs.2013.08.001.
Contreras, D. 2009. Designing a Spatial Planning SupportSystem for Rapid Building Damage Survey after anEarthquake: The Case of Bogotá D.C. Colombia: Masterof Science, University of Twente.
Contreras, D., T. Blaschke, S. Kienberger, and P. Zeil. 2011.“Spatial Vulnerability Indicators: Measuring RecoveryProcesses After Earthquakes.” 8th International confer-ence on Information systems for crisis response and man-agement, Lisbon, ISCRAM.
Contreras, D., T. Blaschke, S. Kienberger, and P. Zeil. 2013.“Spatial Connectivity as a Recovery Process Indicator:The L’aquila Earthquake.” Technological Forecasting andSocial Change 80 (9): 1782–1803. doi:10.1016/j.techfore.2012.12.001.
Contreras, D., T. Blaschke, S. Kienberger, and P. Zeil. 2014.“Myths and Realities about the Recovery of L׳Aquila after
132 D. CONTRERAS ET AL.
Dow
nloa
ded
by [
Uni
vers
itat S
alzb
urg]
at 0
7:36
04
Janu
ary
2016

the Earthquake.” International Journal of Disaster RiskReduction 8 (8): 125–142. doi:10.1016/j.ijdrr.2014.02.001.
Curtis, A., and J. W. Mills. 2012. “Spatial Video DataCollection in a Post-Disaster Landscape: The TuscaloosaTornado of April 27th 2011.” Applied Geography 32 (2):393–400. doi:10.1016/j.apgeog.2011.06.002.
Díez, I. 2010. “L’aquila Languidece Un Año Después de LaTragedia.” Noticias≥Mundo≥Italia. Accessed March 15,2013. http://www.rtve.es/noticias/20100405/laquila-languidece-ano-despues-tragedia/326423.shtml
DPAE. 2006. Documento Síntesis sobre el Estudio de Escenariosde Riesgo Y Pérdidas por terremoto para Bogotá D.C. DPAE,53. Bogotá, DC: Universidad de Los Andes.
Feizizadeh, B., and T. Blaschke. 2013. “Examining UrbanHeat Island Relations to Land Use and Air Pollution:Multiple Endmember Spectral Mixture Analysis forThermal Remote Sensing.” IEEE Journal of SelectedTopics in Applied Earth Observations and Remote Sensing6 (3): 1749–1756. doi:10.1109/JSTARS.2013.2263425.
Gamba, P., F. Dell’Acqua, and B. V. Dasarathy. 2005. “UrbanRemote Sensing Using Multiple Data Sets: Past, Present,and Future.” Information Fusion 6 (4): 319–326.doi:10.1016/j.inffus.2005.02.007.
Goudarzi, M. A., T. Woldai, and V. A. Tolpekin. 2011. “SurfaceDeformation Caused by April 6th 2009 Earthquake inL’aquila (Italy): A Comparative Analysis from ENVISATASAR, ALOS PALSAR and ASTER.” International Journalof Applied Earth Observation and Geoinformation 13 (5):801–811. doi:10.1016/j.jag.2011.05.014.
Karatani, Y., and H. Hayashi. 2007. “Quantitative Evaluationof Recovery Process in Disaster-Stricken Areas UsingStatistical Data.” Journal of Disaster Research 2 (6): 453–464.
Kerle, N. 2010. “Satellite-Based Damage Mapping followingthe 2006 Indonesia Earthquake—How Accurate Was It?”International Journal of Applied Earth Observation andGeoinformation 12 (6): 466–476. doi:10.1016/j.jag.2010.07.004.
Liu,W., and F. Yamazaki 2010. “UrbanMonitoring andChangeDetection of Central Tokyo Using Terrasar-X Images.” 8thInternational Workshop on Remote Sensing for DisasterManagement, Tokyo, Tokio Institute of Technology.
Lynch, K. 1960. The Image of the CityMassachusetts. Cambridge,MA: The MIT Press.
Maruyama, Y., A. Tashiro, and F. Yamazaki. 2010.“Construction of Digital Surface Model Using DigitalAerial Images to Detect Collapsed Buildings Due to theEarhquake.” 8th International workshop on remote sen-sing for disaster management, Tokyo, Tokio Institute ofTechnology.
Mesev, V. 2007. Integration of GIS and Remote SensingFlorida. USA: Wiley.
Mills, J. W., A. Curtis, B. Kennedy, S. W. Kennedy, and J.D. Edwards. 2010. “Geospatial Video for Field DataCollection.” Applied Geography 30 (4): 533–547.doi:10.1016/j.apgeog.2010.03.008.
Miura, H., S. Midorikawa, and N. Kerle 2010. “BuildingDamage Distribution of the 2006 Central Java,Indonesia, Earthquake Detected from Satellite OpticalImages.” 8th International workshop on remote sensingfor disaster management, Tokyo, Tokio Institute ofTechnology, 9.
Mullen, J. 2012. Italian Scientists Resign over L’Aquila QuakeVerdicts. http://edition.cnn.com/2012/10/23/world/europe/italy-quake-scientists-guilty/index.html
Ozlem Ozcevik, S. T., E. Tas, H. Yaman, and C. Beygo. 2009.“Flagship Regeneration Project as a Tool for Post-DisasterRecovery Planning: The Zeytinburnu Case.” Disasters 33(2): 180–202.
Sanz, D. 2012, 2013. “Google Actualiza Sus Imágenesde Fukushima.” Medioambientales. Accessed October11, 2013. http://medioambientales.com/google-actualiza-sus-imagenes-de-fukushima/
Shohei, B. 2007. “The Evaluation of the Status of DisasterAreas by Using Recovery Indicators (In the Case of theGreat Hanshin-Awaji Earthquake).” The 2nd. interna-tional conference on urban disaster reduction, Taipei.
Telford, J., and J. Cosgrave. 2007. “The InternationalHumanitarian System and the 2004 Indian OceanEarthquake and Tsunamis.” Disasters 31 (1): 1–28.doi:10.1111/j.1467-7717.2007.00337.x.
Tiede. 2010. Experiment on the “L’aquila Area Earthquake”,with VHR Images before and after the Date of the Event(April 6, 2009), Salzburg: Centre for Geoinformatics(Z_GIS), Salzburg University. 6.
Tiede, S., P. Lang, D. Hölbling, and P. Zeil. 2011.“Automated Damage Indication for Rapid GeospatialReporting.” Photogrammetric Engineering & RemoteSensing 77 (9): 933–942. doi:10.14358/PERS.77.9.933.
UNDP. 2008. “UNDP Policy on Early Recovery.” UnitedNations Development Programme, 35.
UNDP. 2012. Disaster risk reduction and recovery. 2.UNIFI. 2009. “Integrated Health, Social and Economic
Impacts of Extreme Events: Evidence.” Methods andTools. Annex 2 - Proposal Part B, 19.
UNIFI. 2011. “MICRODIS - Key Findings.” UNIFI, 6.Uprety, P., and F. Yamazaki. 2010. “Damage Detection using
High Resolution TerraSAR-X Imagery in the 2009 L’AquilaEarthquake.” 8th International workshop on remote sensingfor disaster management, Tokyo, Tokio Institute ofTechnology, 9.
Voigt, S., T. Schneiderhan, A. Twele, M. Gähler, E. Stein, andH. Mehl. 2011. “Rapid Damage Assessment and SituationMapping: Learning from the 2010 Haiti Earthquake.”Photogrammetric Engineering and Remote Sensing 77 (9):923–931. doi:10.14358/PERS.77.9.923.
Vu, T. T., M. Matsuoka, and F. Yamazaki. 2005. “Detectionand Animation of Damage Using Very-High-ResolutionSatellite Data following the 2003 Bam, Iran, Earthquake.”Earthquake Spectra 21 (S1): 319–327. doi:10.1193/1.2101127.
CARTOGRAPHY AND GEOGRAPHIC INFORMATION SCIENCE 133
Dow
nloa
ded
by [
Uni
vers
itat S
alzb
urg]
at 0
7:36
04
Janu
ary
2016


