Embed Size (px)
Citation preview

©Copyright 2013
Arthur P. Tomasino

The Use of Complexity Theory and Strange
Attractors to Understand and Explain Information
System Development ------------------------------------------------------------------------------------------------------------
Arthur P. Tomasino
A dissertation
submitted in partial fulfillment of the
requirements for the degree of
Doctor of Philosophy in Business
2013
Program Authorized to Offer Degree:
Information and Process Management, Bentley University

All rights reserved
INFORMATION TO ALL USERSThe quality of this reproduction is dependent upon the quality of the copy submitted.
In the unlikely event that the author did not send a complete manuscriptand there are missing pages, these will be noted. Also, if material had to be removed,
a note will indicate the deletion.
Microform Edition © ProQuest LLC.All rights reserved. This work is protected against
unauthorized copying under Title 17, United States Code
ProQuest LLC.789 East Eisenhower Parkway
P.O. Box 1346Ann Arbor, MI 48106 - 1346
UMI 3563436
Published by ProQuest LLC (2013). Copyright in the Dissertation held by the Author.
UMI Number: 3563436

In presenting this dissertation in partial fulfillment of the requirements for the doctoral degree
at Bentley University, I agree that the Library shall make its copies freely available for inspection.
I further agree that extensive copying of the dissertation is allowable only for scholarly
purposes, consistent with “fair use” as prescribed in the U.S. Copyright Law.
Requests for copying or reproduction of this dissertation may be referred to ProQuest
Information and Learning Author Relations Team at (800) 521-0600 ext. 7020, to whom the
author has granted “the right to reproduce and sell (a) copies of the manuscript in microform
and /or (b) printed copies of the manuscript made from microform.”
Signature ____ _______
Date ________________May 9, 2013____________

v
DEDICATION
This dissertation is lovingly dedicated to my immediate family members: my wife, Robin, and
children, Elizabeth and Michael. To my wife Robin, I could not have completed my PhD without
your help and support, and to my children Elizabeth and Michael, thank you for your
encouragement and reminding me to squeeze in some time for “fun”!

vi
ACKNOWLEDGEMENTS
I wish to express my sincere thanks to my committee for their support throughout the
development of this dissertation. My advisor and committee chair, Jane Fedorowicz provided
tireless support throughout my four years at Bentley and was the major force behind a
surprisingly difficult, but successful, transition for me, from an industry career to academia. Her
knowledge, experience, and patience set the standard for PhD advisors. Christine Williams was
always quick to remind me that she was not experienced in complexity theory and would then
follow up with some of the most insightful and difficult questions regarding my work! I learned
a great deal from her and particularly appreciate her interviewing support in both my case
studies. Gurpreet Dhillon was instrumental in validating this dissertation’s contribution to
complexity studies. Knowing he supported my research provided me with the confidence to
pursue and complete this dissertation.
I would also like to express my thanks to the PhD faculty at Bentley. I was very lucky to be
able to work with such distinguished and supportive professors. Their expertise and willingness
to share their knowledge was truly amazing.
Lastly, I would like to express my special thanks to my colleagues, the PhD students at
Bentley. In particular, to my cohort and fellow researchers on the Public Safety Networks
Project; thank you for your help, your support, and your friendship!
In addition, this research was supported in part by the National Science Foundation (NSF)
(Public Safety Networks Study, Projects # IIS-0534877 & IIS-0534889). Also, special thanks go to
the participants in both my case studies.

vii
Abstract
The Use of Complexity Theory and Strange Attractors to Understand and Explain
Information System Development
Arthur P. Tomasino
Chair of the Supervisory Committee:
Jane Fedorowicz, Chester B. Slade Professor of Accounting and Information Systems
Joint appointment in Accountancy and Information & Process Management Departments
In spite of the best efforts of researchers and practitioners, Information Systems (IS)
developers are having problems “getting it right”. IS developments are challenged by the
emergence of unanticipated IS characteristics undermining managers ability to predict and
manage IS change. Because IS are complex, development formulas, best practices or
development guides simply will not work. The difficulties in these system developments stem
from the complexity of IS arising from the inter-relationship, interaction, and interconnectivity
of the elements in the system and its environment. This research uses complexity concepts to
help solve the problem with IS development and explain why so many IS developments fail. It
uses Complexity Theory to understand and explain IS development as an emergent
phenomenon where the system is “attracted” to certain configurations.
This research derives and validates a detailed IS change model and method enabling IS
developers to understand the unpredictable and unanticipated outcomes of information
systems and avoid failures. The model uses Complex Adaptive Systems concepts, the Chaos
Theory strange attractor, and state space analysis to identify when IS states are susceptible to
failure rather than trying to identify the myriad causes that may or may not contribute to failure.
The method uses structured case study analysis and grounded theory techniques fitting a
general model to specific IS producing the best possible model for the system.

viii
This research extends previous work in the application of Complexity Theory to IS and is the
first to apply these theories to Public Safety Network information systems. In practice this
research can help managers understand the impact and temporal validity of their decisions on IS
development and their organization. Findings generalize to a broad range of cross-agency
intergovernmental collaborations employing IS. This research should spur further studies
utilizing Complexity Theory for both public and private sector IS and lead to improvements and
better understanding of the development and evolution of Public Safety Networks, an
increasingly common and important component of homeland security and emergency
management.
ix
Table of Contents
List of Figures ................................................................................................................................... x
List of Tables ....................................................................................................................................xi
1. Introduction ............................................................................................................................ 15
1.1. The Complexity Challenge – Why Do IS Developments Fail? .......................................... 16
1.2. Complexity and Information Systems ............................................................................. 18
1.3. The Complexity of Information System Change .............................................................. 19
1.4. Research Questions ......................................................................................................... 20
2. Literature Review ................................................................................................................... 22
2.1. Complexity Theory ........................................................................................................... 23
2.2. Chaotic Systems ............................................................................................................... 27
2.2.1. Sensitivity to Initial Conditions ................................................................................ 29
2.2.2. State Space .............................................................................................................. 29
2.2.3. Strange Attractors .................................................................................................... 30
2.3. Complex Adaptive Systems ............................................................................................. 32
2.3.1. Adaptation ............................................................................................................... 33
2.3.2. Time Horizons .......................................................................................................... 33
2.3.3. The “Edge of Chaos” ................................................................................................ 34
2.4. Information Systems, Collaborative Networks, Inter-Organizational Systems, and
Complexity Theory ........................................................................................................... 36
2.4.1. IS Change Research using Complexity Concepts ..................................................... 36
2.4.2. IS Change Research using Chaos Theory ................................................................. 38
2.5. Complex Adaptive Systems Based IS Research ............................................................... 39
2.6. A Chaos and Chaos Theory View of Inter-Organizational Systems ................................. 41
2.7. The Public Sector and Complexity Theory ....................................................................... 42
2.7.1. Examples of Complexity Theory Concepts used in the Public Sector ...................... 42
2.7.2. Examples of Complexity Theory Concepts applied to the Public Sector ................. 43
2.8. Public Safety Networks .................................................................................................... 45
2.9. Research Contribution ..................................................................................................... 47
3. Study 1: A PSN State Space Process Model ........................................................................... 51
3.1. Introduction ..................................................................................................................... 51
3.2. The PSN State Space CAS Model ..................................................................................... 55
3.2.1. Environmental Rules and Factors ............................................................................ 55
3.2.2. Interactions as Processes ......................................................................................... 56
3.3. IS Outcomes ..................................................................................................................... 57
3.3.1. Configuration: Mapping the IS Model to Public Safety Networks ........................... 59
3.3.2. Customization: Modifying the PSN State Space CAS Model .................................... 63
3.4. The PSN State Space Process Model ............................................................................... 64
3.5. Method ............................................................................................................................ 67
x
3.5.1. Case Study: The Winnebago Court and Case Management System ....................... 73
3.5.2. Case Study Data ....................................................................................................... 76
3.5.3. Coding ...................................................................................................................... 77
3.5.3.1. Narrative Construction .................................................................................. 77
3.5.3.2. Coding 1 (Narrative Construction): Coding by CCMS Development Phase... 78
3.5.3.3. Coding 2 (Narrative Construction): Structural Analysis ................................ 85
3.5.3.4. Coding 3 (Narrative Construction): Creating the WCCMS Development
Narrative .................................................................................................................... 90
3.5.3.5. Coding 4 (Narrative Analysis): Extracting the States and Variables – Axial
Coding ......................................................................................................................... 94
3.5.3.6. Coding 5 (Narrative Analysis): Synthetic Case Description ........................... 98
3.6. Findings ............................................................................................................................ 99
3.6.1. Modification of the PSN State Variables and PSN State Space CAS Model ............. 99
3.6.1.1. The WCCMS State Space CAS Model .......................................................... 100
3.6.1.2. WCCMS State Variables .............................................................................. 101
3.6.1.3. CCMS Project Level Factors ......................................................................... 106
3.7. The Resulting WCCMS State Variables .......................................................................... 109
3.7.1. The WCCMS State Space Description – Synthetic Case Description (SCD) ............ 111
3.7.2. Analysis and Interpretation of the WCCMS Synthetic Case Description ............... 112
3.8. Discussion ...................................................................................................................... 118
3.8.1. The WCCMS Strange Attractor .............................................................................. 119
3.8.2. Alternate Explanations for the WCCMS Development ......................................... 122
3.8.2.1. Are WCCMS State Changes Following a Chaotic Trajectory? ...................... 122
3.8.2.2. Do WCCMS State Changes Exhibit Scale? ................................................... 123
3.8.2.3. Do WCCMS Agents Adapt to Increase their Fitness? .................................. 124
3.9. Conclusions .................................................................................................................... 127
3.9.1. Predictive Capabilities of the PSN State Space Models ......................................... 127
3.9.2. Study Limitations ................................................................................................... 128
3.9.3. Contributions to Research ..................................................................................... 129
4. Study 2: Derivation of PSN Configurations Using Complexity Theory ................................ 131
4.1. Introduction ................................................................................................................... 131
4.2. Traditional Configuration Analysis ................................................................................. 132
4.3. Configuration Analysis Using Fuzzy-sets ........................................................................ 134
4.4. Research Questions and Contribution of this Study ...................................................... 137
4.5. Method ........................................................................................................................... 137
4.5.1. Data ........................................................................................................................ 138
4.5.2. Fuzzy-set Analysis – fuzzy-set Qualitative Comparative Analysis (fsQCA) ............. 138
4.5.3. Assignment of Survey Questions to PSN Variables ................................................ 139
4.5.4. Calibrations – Measuring Membership ................................................................. 141
4.5.5. Construction of Configurations using Fuzzy-set Operators ................................... 144
4.5.6. Interpretation – Fuzzy-sets as Configurations ....................................................... 145
4.6. Findings .......................................................................................................................... 146
xi
4.6.1. Court and Police-oriented PSNs ............................................................................. 146
4.6.2. Configurations Resulting from Maturity Analysis .................................................. 147
4.6.3. Configurations Resulting from Multiple Output Analysis ...................................... 148
4.7. Discussion ....................................................................................................................... 151
4.7.1. Implications of Inconsistent Configurations for NOT Maturity PSNs .................... 152
4.7.2. Implications of Consistent Configurations for PSN Output Analysis ..................... 154
4.8. Conclusions .................................................................................................................... 157
4.8.1. Study Limitations ................................................................................................... 158
4.8.2. Implications for Practice ........................................................................................ 159
4.8.3. Areas for Future Research ..................................................................................... 160
5. Study 3: Mandated and Emergent IOS Development: Application of Strange Attractors to
Information Systems in the Public Sector ............................................................................ 162
5.1. Introduction ................................................................................................................... 162
5.2. Mandated and Emergent IOS Development – A Review ............................................... 165
5.3. Expected Contribution to Research on Public Sector Consolidations ............................ 167
5.4. Method ........................................................................................................................... 169
5.4.1. Narrative Analysis and Coding ............................................................................... 170
5.4.2. Case study .............................................................................................................. 171
5.4.2.1. Public Safety Networks ............................................................................... 171
5.4.2.2. The Clermont County Division of Public Safety Services ............................. 171
5.4.2.3. Data ............................................................................................................. 172
5.4.3. Coding .................................................................................................................... 173
5.4.3.1. Coding 1: Coding by DPSS Development Phase .......................................... 174
5.4.3.2. Coding 2: Structural Analysis ....................................................................... 175
5.4.3.3. Coding 3: Creating the DPSS Development Narrative ................................. 177
5.4.3.4. Coding 4: Extracting States and Variables – Axial Coding ........................... 178
5.4.3.5. Coding 5: Assignment of Coded Values and Time Sequences to Narrative
Clauses ...................................................................................................................... 180
5.4.3.6. Coding 6: Synthetic Case Description.......................................................... 181
5.5. Findings .......................................................................................................................... 181
5.5.1. The Mandated and Emergent Development of DPSS ............................................ 182
5.5.2. Findings from the Synthetic Case Description for DPSS ........................................ 183
5.6. Discussion ....................................................................................................................... 185
5.6.1. Events Defining Mandated and Emergent DPSS Development ............................. 186
5.6.2. Patterns of State Change for IOS Development .................................................... 192
5.6.3. Alternate Views on IOS Development ................................................................... 198
5.7. Conclusion ...................................................................................................................... 201
5.7.1. Research Limitations .............................................................................................. 202
5.7.2. Contribution to Practice ........................................................................................ 203
6. Contributions and Futures..................................................................................................... 208
6.1. Contribution to Information Systems Research ............................................................. 208
6.1.1. Academic Contributions ........................................................................................ 208
xii
6.1.2. Contributions to Practice ....................................................................................... 213
6.2. A Research Agenda ......................................................................................................... 215
Figures and Tables ....................................................................................................................... 223
Appendix A - Glossary .................................................................................................................. 294
Appendix B – Example System Analysis Using Chaos Theory ...................................................... 298
Appendix C – A Summary of Chaos Theory Mathematics ........................................................... 305
Appendix D – Winnebago County Court and Case Management System Narrative ................... 328
Appendix E – Clermont County Division of Public Safety Services Narrative .............................. 373
Appendix F – Public Safety Networks Project Survey .................................................................. 392
Appendix G – Fuzzy-set Qualitative Comparative Analysis .......................................................... 407
References ................................................................................................................................... 418
Vita ............................................................................................................................................... 433
xiii
List of Figures
Figure 1.1 - Standish Group CHAOS Report Results for IT Software Projects ……………..…………...218
Figure 1.2 - Assumptions and Models for Dirrerent System Models ........................................... 218
Figure 2.2 - The Lorenz Strange Attractor .................................................................................... 219
Figure 3.1 - The General Process Model ...................................................................................... 219
Figure 3.2 - The General State Space Process Model .................................................................. 220
Figure 3.3 - The General CAS Model and IS Model ...................................................................... 220
Figure 3.4 - The PSN State Space CAS Model ............................................................................... 221
Figure 3.5 - The PSIC Model ......................................................................................................... 221
Figure 3.6 - The PSN State Space Process Model ......................................................................... 221
Figure 3.7 - WCCMS Development Timeline ................................................................................ 222
Figure 3.8 - WCCMS Development Phases Compared to EWS Development Phases ................. 222
Figure 3.9 - WCCMS State Space CAS Model ............................................................................... 223
Figure 3.10 - Elaborated SCD for WCCMS .................................................................................... 224
Figure 3.11 - Minimized SCD for WCCMS .................................................................................... 225
Figure 3.12 - Analyzed SCD for WCCMS ....................................................................................... 226
Figure 3.13 - The WCCMS Strange Attractor ............................................................................... 227
Figure 4.1 - Lorenz Strange Attractor Outcome Basins ............................................................... 227
Figure 4.2 - Example of Correspondence Analysis ....................................................................... 228
Figure 4.3 - Set Membership Example ......................................................................................... 228
Figure 5.1 - SCD for Development of DPSS .................................................................................. 229
Figure 5.2 - DPSS Connectivity Diagram....................................................................................... 230
xiv
List of Tables Table 1.1 – Examples of IS and Organizational Research Using Complexity Concepts................ 231
Table 2.1 – Definition of Chaos Theory ........................................................................................ 233
Table 2.2 – Attractor Networks.................................................................................................... 234
Table 2.3 – Organizational Characteristics of Complex Adaptive Systems .................................. 235
Table 2.4 – Notable Publications for IS and CT ............................................................................ 236
Table 2.5 – Influential Factors for PSNs ....................................................................................... 237
Table 3.1 – IS Model Core Elements ............................................................................................ 238
Table 3.2 – Collaborative Network Influential Factors ................................................................ 239
Table 3.3 – Mapping of CN Factors to IS Model Core Elements .................................................. 240
Table 3.4 – Initial PSN State Variables ......................................................................................... 241
Table 3.5 – WCCMS Interviews .................................................................................................... 242
Table 3.6 – Archival Data Used in Research ................................................................................. 243
Table 3.7 – Guidelines for the Qualitative Research Interview ................................................... 244
Table 3.8 – WCCMS Interview Protocol ....................................................................................... 245
Table 3.9 – CAS and Chaos Theory Metaphors ............................................................................ 249
Table 3.10 – Classification Categories for Interviews and Narratives ......................................... 249
Table 3.11 – Structural Analysis by Agency and Development Phase ......................................... 250
Table 3.12 – Structural Analysis of the County Chairman’s Narrative ......................................... 250
Table 3.13 – Court-level Endogenous Environmental Factors ..................................................... 253
Table 3.14 – Project-Level Coding Definitions & Mapping to Diffusion of Innovations .............. 254
Table 3.15 – Axial 5 Coding Protocol with SCD Synbol Definitions .............................................. 255
Table 3.16 – Narrative Quotations Supporting WCCMS State Factor Value Coding ................... 262
Table 3.17 - WCCMS Narrative Complexity Metaphors………………………………………………………….. 266
Table 4.1 – Calibration of PSN Survey Questions ........................................................................ 267
Table 4.2 – PSN Variable Categories ............................................................................................ 275
Table 4.3 – FsQCA Results for Maturity Configurations .............................................................. 277
Table 4.4 – FsQCA Results for NOT Maturity Configurations ...................................................... 277
Table 4.5 – FsQCA Output Analysis Input Factors ........................................................................ 277
Table 4.6 – Results fo fsQCA Outputs Analysis ............................................................................ 278
Table 4.7 – Configurations for Court-Oriented and Police-Oriented PSNs .................................. 279
Table 4.8 – Possible “Plain-Text” Descriptions for PSN COnfigurations ...................................... 280
Table 5.1 – DPSS Informants ........................................................................................................ 281
Table 5.2 – Interview Protocol for Manager, Information Systems Division ............................... 281
Table 5.3 – PSN Variables Used in Study 3................................................................................... 286
Table 5.4 – DPSS Key Historical Milestones ................................................................................. 287
Table 5.5 – Example Structural Analysis for Study 3 .................................................................... 288
Table 5.6 – Final Axial Coding Protocol for Study 3 (including SCD Definitions) ......................... 289
Table 6.1 – Complexity Terminology ........................................................................................... 293
15
1 Introduction
After decades of research and development, information system (IS) developers are still
having a hard time “getting it right” (Feld & Stoddard, 2004; Markus & Keil, 1994). A 2005
KPMG report indicated that over 49% of organizations surveyed experienced at least one IS
project failure and only 2% achieved targeted benefits (Zarrella, Tims, Carr, & Palk, 2005). The
Standish Group’s CHAOS 2009 report showed project success declining from 35% in 2006 to 25%
in 2009, with failed IS projects reaching 24% (Figure 1.1) and a recent study by McKinsey &
Company, Inc. and Oxford University reported, on average, large IT projects1 run 45% over
budget,7% over schedule, and delivered 56% less value than predicted (Bloch, Blumberg, &
Laartz, 2012). Although the scientific rigor and accuracy of these reports can been questioned,
they nonetheless show that a disturbing number of IS projects fail to meet targeted goals (Glass,
2006; von Wurtemberg, Franke, Lagerstrom, Ericsson, & Lillieskold, 2011).
Many times, IS fail or are abandoned because they misalign with business objectives or
stray from intended functionality. The continuing high incidences of IS development failures
indicates mismatches between planned IS and realized IS contradicting the numerous IS success
stories (Alter & Wright, 2010; Lyytinen & Newman, 2008; Lyytinen & Robey, 1999; Wagner,
Newell, & Piccoli, 2010). Studies reveal no formula for IS success. What makes an IS
development successful in one organizational setting does not necessarily translate to another
similar setting. Unanticipated problems emerge. Despite the proliferation of IS studies,
management techniques, and guides for successful IS projects the emergence of unanticipated
IS characteristics seems to undermine managers’ ability to “get it right” in IS development (Lim,
Sia, & Yeow, 2011; Zarrella, et al., 2005).
1 McKinsey-Oxford surveyed over 5400 companies with IT projects budgets over $15M. Data is from June
2012.
16
This research proposes that the inability of organizations to get IS developments “right”
stems from their failure to understand the complexity of IS development. They focus on finding
distinct and well-defined causes for development problems instead of recognizing that the
complexity of IS development makes direct links from causes to outcomes almost impossible.
Such problems are considered wicked and, by definition, are unsolvable (Churchman, 1967;
Ritchey, 2008) but can be dealt with by understanding problem complexities.
This research perceives IS as complex and uses Complexity Theory to model the dynamic
interactions between the IS elements and their environment as a sequence of IS state changes
(as the IS develops). Interactions cause the IS to be attracted to certain state configurations
representing degrees of success or failure of the IS. The IS state progresses along trajectories
defined as attractors and only by understanding the attractors can organizations hope to predict
the outcome and meet targeted goals for their IS developments. In particular, this research
studies the applicability of a certain type of attractor, the strange attractor, to solve “wicked” IS
development problems and help organizations understand IS complexity. Therefore, this
research contributes to addressing the inadequacies in IS developments by using Complexity
Theory concepts to create an IS development model that helps organization deal with their
“wicked” IS problems.
1.1 The Complexity Challenge – Why Do IS Developments Fail?
A preponderance of IS research articles focus on technological aspects of the IS, in
particular the “IT artifact”2 (Merali & Allen, 2011). IS development researchers and practitioners
need to change their thinking and focus on the complex aspects of IS, such as processes,
emergence, network interaction, environmental context, and non-linear causalities in addition
2 There are numerous journal articles on this topic. The author suggests the following as examples,
(Benbasat & Zmud, 2003; Galliers, 2003; Lyytinen & King, 2004; Markus, 1999; Orlikowski & Lacono, 2001)
17
to the “IT artifact” (Boisot & McKelvey, 2010; Tsoukas & Dooley, 2011; Weick, 1977). IS
developments ignoring complexity are more likely to fail3.
Ignoring complexity has historical origins exemplified in the Newtonian Style of systems
thinking. The Newtonian Style views IS as an organization with a “system of laws with
equilibrium”, where moral, social, and political order can be expressed in terms of an “all
embracing harmony” ((Prigogine, Stengers, & Toffler, 1984)p29). Such a view is exemplified in
Frederick Taylor’s (1995) principles of scientific management and Max Weber’s (2005) rational
bureaucratic organizations where organizations are fixed in time and space, have simple causal
relationships with clear lines of authority and rule-based procedures allowing for accurate
prediction of results and outcomes. Systems thinking in the Newtonian style, oversimplifies IS
development leading to a narrow technology focus (Wastell & White, 2010).
In the second half of the 20th century, researchers realized the limits of conventional
centralized, hierarchical organization descriptions encapsulated in the Newtonian style.
Noteworthy influential studies that helped shift thinking from this style included Simon’s (1959,
1978) view of managers as bounded rational agents, Mintzberg’s (1978) concept of emergent
strategies, March’s (1991) work on exploitation and exploration and Weick’s (1977, 1979)
general works on organizing calling for “complication” to replace “simplification” (Merali &
Allen, 2011; Tsoukas & Dooley, 2011). Just as the need to understand organizational complexity
has shifted system thinking away from the Newtonian style, the need for more successful IS
developments is shifting IS research to Complexity concepts.
3 There are numerous studies tying IS failure and success related to complexity. The following each
provide an interesting perspective (Conboy, 2010; Merali & McKelvey, 2006; Mitleton-Kelly & Mitleton, 2004; Pardo & Scholl, 2002; Williamson, 2011)
18
1.2 Complexity and Information Systems
The growing number of research studies using complexity concepts or Complexity
Theory exemplifies the shift in system thinking from the Newtonian style to the complexity
perspective. For example, DeSanctis and Poole (1994) introduce Adaptive Structuration Theory
(AST) as a blend of decision-making and institutional theory. AST describes the complex process
of organizational (and IS) change by differentiating between the organizational structures
provided by technology and the actual structures that emerge as people interact with the
technology. They describe AST using complexity concepts such as emergence, adaptation, agent
level interaction, and context, and detail emergent organizational structures resulting from the
interaction of human agency and technology. Just as DeSanctis and Poole have abandoned the
Newtonian style for complexity perceptions, so have other researchers. Table 1.1 lists a
sampling of recent research using complexity concepts.
In IS research over the past decade, increasing use of Complexity concepts in IS has led
to increasing use of Complexity Theories. More and more, IS and organization studies reference
Complexity Theory, Complex Adaptive Systems, or Chaos Theory. Indicative of this trend are
four recent IS journals with special issues devoted to Complexity Theory; namely
Communications of the ACM (Desai, 2005), Information Technology and People (Jacucci,
Hanseth, & Lyytinen, 2006), Journal of Information Technology (Merali & McKelvey, 2006) and
Organization Studies (Tsoukas & Dooley, 2011).
In research using Complexity Theories, emergence and evolution of system
characteristics are common themes. Complex systems consist of populations of diverse,
interconnected agents, influencing (both linearly and non-linearly) each other but maintaining
independent behaviors and actions. Over time the agents adapt to their local environment
19
causing changes in the aggregate behavior of the system (Page, 2009). Therefore complexity
perspectives of IS involves the study of complex IS change and evolution, and the emergence of
new IS forms.
1.3 The Complexity of Information System Change
Complexity perspectives of IS are inherently systematic and model the emergence of
unique macro-level system characteristics from micro-level behaviors ((Byrne, 1998),p51). IS
developments require trade-off in priorities, costs, benefits and consequences and IS
configurations emerge from the interaction of technology developments, social trends,
government policies, and management strategies. Complexity perspectives can be used to
explain the emergence of IS configurations by analyzing how the IS changes and evolves and
how it is attracted to certain configurations, over other configurations, based on its agents,
environment, and network of interactions (Markus, 2005; Markus & Robey, 1988; Orlikowski,
1992). IS development models detail how micro-level agent interactions lead to macro-level
system behavior resulting in detailed, but limited, explanations of IS (Lyytinen & Newman,
2008).
Identification of the significant events that contribute to IS change limits these models.
Because non-linear feedback characterizes complex systems, almost any event can trigger large
or small changes in the state of the system. Therefore, identification of cause-effect
relationships is very difficult. This research, removes the problem of critical event identification
by explaining and understanding IS change based on analysis of IS states in state space4. In
particular, this research derives and applies a model for IS change and emergent configurations
4 Chapter 2 details Complexity terms and concepts. Appendix A includes a comprehensive and detailed
glossary of all complexity terms used in this research.
20
using the strange attractor Complexity concept. Strange attractors help determine when an IS
changes, by how much, and the probable outcomes.
1.4 Research Questions
The goal of this research is to add to the knowledge about IS change models by using a
Complexity perspective to understand and explain both planned and unplanned IS change and
the emergence of IS configurations. To meet this goal, the research includes a progression of
studies on one type of IS, with each study building on the results of another. To set the
background for the studies, Chapter 2 includes a literature review of Complexity Theory and
interorganizational systems (a type of IS) and details the research domain, United States Public
Safety Networks (PSNs). The first study (Chapter 3) analyzes the applicability of Complexity
Theory to PSNs developing a strange attractor process model for PSNs and illustrates the model
with a PSN case study. The second study (Chapter 4) utilizes fuzzy set qualitative comparative
analysis to explore the different PSN configurations (known as outcome basins) and the third
study (Chapter 4) applies the results of the first two studies and the derived model to another
PSN case study showing how it changes and evolves into different configurations. Each study
answers research questions as follows:
Study 1: How can PSNs be modeled using concepts from Complexity Theory?
o Does the state of a PSN evolve through its state space in a bounded, chaotic
trajectory?
o If so, does the trajectory conform to the Chaos Theory concept of a strange
attractor?
Study 2: What configuration of states results from PSN evolution, if any?

21
o Do the PSN configurations conform to the Chaos Theory concept of outcome
basins of a strange attractor?
o Can PSN strange attractors and outcome basins be identified using fuzzy-set
social science?
Study 3: How can using the strange attractor concept from Chaos Theory and Complex
Adaptive Systems help PSN developments meet their goals?
Each study ends with a discussion of its contribution to theory and practice and limitations.
Chapter 5 includes conclusions developed across all three studies and suggests areas for further
research.
22
2 Literature Review
“The very complexity that has made a theory of decision-making process
essential has made its construction exceedingly difficult. Most approaches have
been piecemeal – now focused on the criteria of choice, now on conflict of
interest, now on formation of expectations…The sketchiness and incompleteness
of the newer proposals has been urged as a compelling reason for clinging to
older theories, however inadequate they are admitted to be” ((Simon, 1959),
p28).
“People must look at organizations in a different way and begin to value
features of it they used to disparage…arbitrary, sometimes even random
elements are added to portions of old designs and in the interaction between
them new forms are generated” ((Weick, 1977), p8)
This chapter reviews important research literature for understanding and explaining IS
development using Complexity concepts. Each section introduces more detailed descriptions of
Complexity and IS concepts and focuses descriptions on modeling a specific domain of IS. The
review not only details the state of current complexity based IS research but also tells a story
about how Complexity Theory can be applied and used for the development of IS.
After introducing Complexity Theory the chapter describes two categories of complex
systems (Chaotic and Complex Adaptive) followed by a specific complex system domain, namely
IS. A review of collaborative networks and interorganizational systems reveals and describes the
complexity of IS. Literature from the public sector further describes IS complexity culminating in
a review and description of a specific public sector complex IS in public safety (the domain of
this research). Since this research develops and applies a Complexity Theory based IS model the
review also provides the theoretical background and foundations for the model (and studies 1,
2, and 3).
Additionally the chapter exposes the limitations in existing complexity based IS theories and
models and the need for this research model. Unlike the model introduced in this research,
23
existing models do not fully exploit the three keys aspects of Complexity Theory, sensitivity to
existing conditions, state space, and strange attractors, and those of Complex Adaptive System
(CAS) Theory, adaptation, time horizons, and the “edge of Chaos”. As a result existing models
are unable to predict the emergence of undesired IS states and avert IS development failures.
The literature review concludes with an overview of the model for this research, its potential to
address the limitations of current research and ultimately answers why so many IS
developments fail.
2.1 Complexity Theory5
There is no single unified theory of complexity. Complexity theory (CT) is derived from
several theories on the study of complex systems in the natural sciences such as biology,
chemistry, computer science, artificial intelligence, evolution, mathematics and physics
(Mitleton-Kelly & Land, 2004). It involves quantitative measurement and the development of
mathematical models to understand the dynamics of natural systems ((Byrne, 1998), p55), but
through the use of metaphor and models it can be applied to the social sciences. Emergence,
adaption, self-organization, chaos and other complex social system phenomena are understood
through CT based research (Merali, 2004).
The lack of a unified social sciences CT theory causes confusion among researchers applying
CT to the social sciences. Much of this confusion results from the lack of direct links from
theories to models and the difficulty in isolating and studying social systems as opposed to
natural science laboratory experiments (McKelvey, 1999). Some social systems researchers
5 Within the literature review there are many CT, Chaos Theory, and CAS concepts discussed. The sources
of specific and important concepts are cited but referencing every concept would be difficult and make for an unreadable text. Texts used for many of the CT concepts discussed include (Byrne, 1998; Gidea & Niculescu, 2002; Glieck, 1987; Kellert, 1993; Morin, 2008; Page, 2009; Rhodes, Murphy, Muir, & Murray, 2011).
24
have classified CT as a methodology or even a fad, but classification as a conceptual framework,
a way of thinking, or a way of seeing the world is more accurate (Mitleton-Kelly, 2003).
Lacking one unified theory, Mitleton-Kelly and Land (2004) instead define six main areas for
CT study.
Complex adaptive systems (CAS): As defined by the Santa Fe Institute (USA) and studied
by others in Europe (Gell-Mann, 1994; Holland, 1992; Kauffman, 1993), they study the
emergent macro-level system behaviors resulting from the aggregation of micro-level
interactions of system agents among themselves and their environment. Agents adapt
their behaviors based on the interactions.
Chaos Theory: Chaos Theory explains complex behaviors resulting from the interactions
of simple agents. It has numerous historical roots in physics, thermodynamics, and
mathematics. In contrast to CAS, chaotic systems are not adaptive. Much of the current
application in the social sciences has resulted from recent discoveries by Lorenz (1963)
and Mandlebrot (1983) (See Crutchfield, et.al for a description of Chaos Theory in the
natural sciences (Crutchfield, Farmer, Packard, & Shaw, 1986)).
Far-from equilibrium conditions and dissipative structures: This area of research
involves the study of open systems moving in and out of equilibrium exchanging energy
with their environment (dissipative). The original work was in the field of
thermodynamics (Prigogine, Stengers, & Toffler, 1984).
Autopoiesis: Autopoiesis describes types of systems consisting of networks of processes
creating components reproducing those processes (Luhmann, 1986; Maturana & Varela,
1980). It derives from the biological sciences.
25
Increasing returns and path dependency: This research area is used in economics to
understand the accumulations of effects (path dependence) leading to unexpected gains
(increasing returns) (Arthur, 1996).
Systems theory, cybernetics, social theory: These theories include works in social
systems and operations management (See Mingers and White (2010) for a review of
systems theory in operations and management.).
IS research predominantly uses CAS and Chaos Theory when adopting a complexity
perspective. This research also predominantly (and almost exclusively) uses CAS and Chaos
Theory. CAS provides theoretical perspectives on open systems, non-linearity and dynamics of
IS. Chaos Theory considers less complex systems but provides a framework for mathematical
analysis of IS (Merali, 2006). When combined, the two theories provide a framework for IS
analysis as a system consisting of the aggregation of short-term, micro-level actions to long-
term, macro-level, system behavior. Sections describing Chaos and CAS Theory (2.2, 2.3) and
their application to IS (2.4, 2.5, 2.6) discuss this in more detail.
Many times these two theories are confused and inappropriately applied by IS researchers.
For example, mathematical concepts of Chaos Theory are applied CAS and adaptive properties
of CAS attributed to Chaos Theory without consideration of appropriateness to the system
under study (McKelvey, 1999).
Appropriately applying CAS and Chaos Theories requires clear definition of IS assumptions
and simplifications or epistemological problems result. If IS epistemologies are considered
across a continuum of simplifying assumptions and system complexity then different types of IS
models can be applied to the appropriate CAS and/or Chaos Theory. Based on research by Allen
and Varga (2006), Figure 2.1 illustrates IS models as a function of complexity and simplifications
26
and shows which models are applicable to CAS and Chaos Theories. The following describes
each model, ordered by complexity.
Structure-less reality represents the highest complexity model with no simplifying
assumptions. The lack of structure or assumptions makes this reality impossible to
model.
An evolutionary model results when structure-less reality has boundaries added to it.
Over time, the creation of boundaries modifies and creates system structures. Entities
and dimensions emerge defining a system that evolves.
The addition of interacting agents to an evolutionary model results in a self-organizing
model. In this model, interactions consisting of linear and non-linear feedback6 cause
the system to move dynamically in and out of different configurations. As the system
evolves the number and type of configurations changes, but based on the interactions
of the agents the system may be attracted to certain configurations. The system jumps
from one configuration to another because of fluctuations within the system. This
“jumping” is considered “self-organization” because the system can spontaneously
move from one configuration to another. CAS theory is most appropriate to the study
of “self-organizing” systems because it helps explain the dynamics and non-linearity of
the system. Chaos Theory is not applicable to these models because the dynamics of
the system make it impossible to model, mathematically, but concepts from Chaos
Theory, such as the attraction of the system to configurations, have metaphorical
applications in the social sciences (Byrne, 1998).
6 In a system with linear feedback, a change in output is proportional to a change in inputs. In non-linear
feedback, change is not proportional. In particular, small changes in inputs can cause large changes in outputs.
27
Limiting interactions to “most likely to occur” events and configurations to average
types resulting in a mechanistic model. These models have some level of predictability
and causality. Behavior consists of “if-then” relationships occurring at a micro-level that
aggregates to complex macro-level behavior. Predictability is limited as the aggregation
of predictive “if-then” relationships may yield hard to predict macro-level behavior.
Chaos Theory best describes these systems because well-defined micro-level “if-then”
relationships can be mathematically described.
Equilibrium models result if all interactions are linear relationships under negative
feedback. These systems are not complex and are not modeled base on CT. Many
times these systems are very complicated and consist of many parts but they do not
exhibit the properties of complex systems.
In this research a CAS framework is used to model an IS as a self-organizing system.
Additionally, from Chaos Theory the mathematical concepts of state spaces and attractors
describe the change or evolution of such systems. Extension of these mathematical concepts to
more complex CAS is through qualitative analysis and metaphor. The following sections provide
brief descriptions of both Chaotic and Complex Adaptive Systems applicable to the study of an
IS.
2.2 Chaotic Systems Chaotic systems occur many times in natural sciences, thus the popularity of Chaos Theory in
the natural sciences7 (Glieck, 1987), but in the social sciences the added complexity derived
from the interaction of human agents and technology precludes its direct use. Producing
7 Chaotic system studies use Chaos Theory. Chaos theory is the qualitative study of unstable aperiodic
behavior in deterministic nonlinear dynamical systems (Kellert, 1993). Table 2.1 provides a deconstruction of each term in the definition providing a good understanding of such systems. This is a definition derived from the natural sciences. “Qualitative” in this sense refers to the long-term behavior characteristics of the system. Unless otherwise noted, description of characteristics of Chaotic Systems is based on (Kellert, 1993).
28
complex behavior from the interaction of simple agents is an important feature of chaotic
systems. Human agents are not simple therefore systems exhibiting socio-technical
interactions, like IS (Sawyer, Allen, & Lee, 2003), are more aptly modeled by Chaos Theory’s
more complex counterpart, the CAS (H. Benbya & B. McKelvey, 2006). Interactions and
adaptation make a mathematical Chaos Theory model computationally impossible in the long
term (Dhillon & Ward, 2002), but considering agents as non-adapting, in the short term, makes
the Theory applicable.
In chaotic systems, agent’s behavior is simple and unchanging but interactions are still non-
linear. Non-linearity makes the system very sensitive to small disturbances and very dependent
on initial conditions (Kellert, 1993; Lorenz, 1963). For example, a detailed and precise model of
a chaotic system shows very different behavior based on very small differences in the assumed
initial state (conditions) of the system. Non-linear interactions magnify small state differences
and they sum to large differences over time. Even initial condition differences as small as the
precision of numbers in computer systems cause significant inaccuracies in modeling system
behavior. Tsoukas (1998) eloquently describes the analytical limitation in such systems,
“Chaos theory highlights the impossibility of long-term prediction for nonlinear systems,
since the tasks of prediction would require knowledge of initial conditions of impossible
accuracy. Such a limitation stems from our inherent finitude as human beings”.
An additional characteristic resulting from non-linearity of Chaotic Systems is seemingly
random state changes. Disturbances causing state changes are imperceptibly small so the
system appears to change randomly. State changes are not random (Chaotic Systems are
deterministic) but the regularity of the changes cannot be seen when examining them over
time. Non-linearity causes IS change, over time (or in the time-domain), to appear erratic and
unpredictable. For an IS development project manager non-linearity can manifest itself as a
bewildering and unanticipated change in the IS.
29
Analysis using Chaos Theory concepts accounts for non-linearity and the resulting
impossibility of long-term prediction and randomness of system behavior. The following
sections detail these concepts. In the view of this research they define the three key aspects of
Chaos theory for IS; namely sensitivity to initial conditions, state space, and strange attractors.
2.2.1 Sensitivity to Initial Conditions
The impossibility of long-term prediction Chaotic System behavior, known as sensitivity to
initial conditions, defines the first key aspect of Chaos Theory for IS. It is a key aspect because it
can cause successful IS development formulas to fail when applied across organizations. For
example, imperceptibly small organizational differences at the initiation of two identical IS
development projects (initial conditions) are sufficient to result in success for one and failure for
the other. Even within the same organization back-to-back IS projects may have different
outcomes because the organization has imperceptibly changed from the start of one project to
the other.
Although defined for initial conditions, the effect can occur any time in a chaotic system.
Any small change in a chaotic system can have very large system level effects and is the reason
the identification of causal effects is impossible (as discussed). In this research, sensitivity to
initial conditions refers these types of effects and is a key aspect of chaotic systems for IS
developments.
2.2.2 State Space
Representation of the system variables in state space is the second key aspect of Chaos
Theory for IS developments. Chaos Theory describes chaotic systems by reference to state
space. In state space, each space dimension corresponds to one variable of the system. At any
time, an IS resides at one point in the state space defined by the value of each variable

30
described in the system. Plots, over time, of the changing chaotic system variables (representing
the state of the system) appear almost random, but plotting the same system states in state
space always results in smooth and regular state changes. Therefore, systems impossible to
analyze in the time domain are readily analyzable in state space8.
This is a key aspect for IS because it implies if IS development project managers track the
changes in the state of the IS (not specific events) they can predict when the IS may jump to an
unanticipated or undesired state. As the system evolves, or changes, its state changes. State
change manifests itself as the tracing out of a path, or trajectory, in the state space. In chaotic
systems, these trajectories appear to be random but confined to a region in the state space.
This region defines a strange attractor, the third key aspect of Chaos Theory for IS.
2.2.3 Strange Attractors
There are three types of attractors in dynamical systems, point, periodic, and strange
(Dhillon & Ward, 2002; Kellert, 1993; Merali, 2006). Point and periodic attractors are associated
with non-chaotic systems or systems that do not exhibit nonlinear, unstable, aperiodic behavior.
Strange attractors are associated with chaotic systems. Table 2.2 summarizes each type of
attractor.
Mathematically, models of chaotic systems use strange attractors. It is a trajectory in
state space tracing the behavior of the chaotic system, over time, and reveals the system’s
attraction to a few ideal states. Over time the state of the chaotic system revolves around its
strange attractor ((Chorafas, 1994) p30). Therefore, the strange attractor does not define the
state of the system at a particular time, but rather describes the rate of change of the state at
8 Appendix B details an example of a system exhibiting a seemingly random dispersion of state variables in
the time domain and a very regular trajectory of the variables in state Space.

31
any particular state of the system. Knowing the strange attractor and the state of the system
approximates the quickness and magnitude of the possible system changes.
Within a strange attractor, there are two conflicting effects of convergence and
divergence of the system variables in state space. Nearby trajectories converge onto the strange
attractor and at the same time they exhibit extreme sensitivity to initial conditions, which
means initially close trajectories rapidly diverge ((Kellert, 1993), p13). Therefore, two systems
that appear very similar can quickly evolve to very different states contained within a region of
state space9.
Depending on the characteristics of the chaotic system, it is possible that the strange
attractor will trace the evolutionary trajectory of the system to more than one area in the state
space. The strange attractor defines scenarios where two systems that appear very similar
evolve to very different states. The different evolutionary states are areas in the strange
attractor, referred to as outcome basins. The most cited and illustrated strange attractor, the
Lorenz attractor, has two outcome basins (see Figure 2.2). Each basin represents a state space
in which the system tends to exist, but under certain conditions, the system may quickly move
from one basin to the other. The outcome basin is a configuration in which the system tends to
exist. The rapid movement of the system from one basin to another is referred to as bifurcation
and the point at which bifurcation may occur is known as the tripping point (also referred to as
the “edge of chaos”(Kauffman & Johnsen, 1991)).
Strange attractors, tripping points, and bifurcation are important characteristics of
chaotic systems for IS. Chaotically evolving IS may quickly diverge to different states leaving
planners and managers bewildered as to what happened. When systems evolve and operate at
9 The shape of a strange attractor is also fractal, meaning that it maintains a self-similarity at all levels.
This characteristic of chaotic systems is not addressed in this research but represents an area for future research.
32
the tripping point a small and rather insignificant change in the system can cause it to quickly
move into a completely different state (Byrne, 1998). This may mean the difference between
successful or failed status. Whereas chaotic system behaviors cause unanticipated changes in IS
states, strange attractors, tripping points, and bifurcation concepts can be used to predict when
this may occur.
It is important to remember that chaotic systems represent a mathematical system
description with a significant assumption that the rules of behavior for each agent in the system
do not change. The next section describes the type of system resulting from the removal of this
constraint. In these systems, agents change and adapt as they evolve. These systems are
known as Complex Adaptive Systems.
2.3 Complex Adaptive Systems
Complex adaptive systems (CAS) are a special case of complex systems consisting of
many components that learn as they simultaneously interact.
“Complex adaptive systems form and use internal models to anticipate the future, basing
current actions on expected outcomes. It is this attribute that distinguishes complex
adaptive systems from other kinds of complex systems; it is also this attribute that
makes the emergent behavior of complex adaptive systems intricate and difficult to
understand” ((Holland, 1992),p24)
They exhibit very complex system behaviors and have applicability to many areas of
research including (to name only a few) innovation, trade, markets, ecosystems, the Internet,
and biological systems. They are self-organizing systems and have the properties described in
Section 2.1. Similar to Chaos theory this research emphasizes three key aspects of CAS Theory
for IS, adaptation, time horizons, and operations at the “edge of chaos”.
33
2.3.1 Adaptation
Whereas chaotic systems follow a fixed strange attractor through state space as they
evolve, CAS evolution is determined by selection processes (feedback) that emphasize or select
certain agent’s schema (rules or model of behavior) increasing the fitness of the entire CAS. As
each agent or group of agents selects schema to maximize its local fitness the CAS goes through
a process of “hill climbing on a landscape” where the landscape represents evolution of fitness
and height of each hill the extent of fitness (Gell-Mann, 1994).
Evolution of the CAS entails changes, or adaptations, in the agents10, therefore the
strange attractor traces the evolutionary changes of agents as they adapt. As the CAS evolves,
we can think of it as progressing through different strange attractors11, each determined by the
current state of the CAS and local optimizations by each agent. The progression of the CAS
through different strange attractors has important implications for the system. The system
exhibits the characteristics of a chaotic system for some short time periods when the agents
exhibit unchanging behavior.
Therefore analysis of IS change using Chaos and CAS theory involves short-term analysis
of IS state using Chaos Theory concepts followed by a long-term analysis using CAS Theory. This
results in the perception of IS change as a sequence of state changes (short-term) over time
(long-term). It also means IS models need to address both the current state of the system as
well as the progression of state changes over time.
2.3.2 Time Horizons
Research shows Chaotic systems are sensitive to initial conditions (Kellert, 1993). Non-linear
behavior causes small disturbances to be amplified causing large system level effects. This
10
In Chaos Theory, agents do not adapt. 11
Strictly speaking, the CAS could transition through any type of attractor, but we have limited our study to IS that exhibit chaotic behavior thus resulting in strange attractors.
34
occurs even if agents do not adapt. When agents adapt, as in a CAS, the systems becomes
increasing complex. Adaptation of agents introduces a time horizon to the cause-and-effect
relationships in a CAS.
As previously discussed sensitivity to initial conditions results in the near impossibility to look
back and identify causes of system changes. Similarly, when agents adapt, it may be very
difficult to look forward and identify the effect of the adaptation. Therefore, decisions to cause
adaptive change of a CAS agency have a time horizon. In IS developments this is very important
because it defines for IS project manages the types of decisions and actions they take to
promote adaptive change of the IS development based on how long it might take the adaptation
to take effect. Some decisions may cause a jolt to the system (and equally may die out as the
system returns to an outcome basin) and others may have a cumulative effect (“snowball”
effect).
The concept of a time horizon is not exclusive to CAS. In Chaos Theory, the impact of the
external environment also has a time horizon, exactly as described above. The ability of agents
to adapt and make changes to improve their fitness makes time horizons a key aspect of CAS for
IS because it determines how decisions may be made to control the IS and keep it from evolving
to an undesired state.
2.3.3 The “Edge of Chaos”
Although the system is adapting as it evolves, it does not necessarily evolve to an
optimum state. The system may become stuck in non-optimum fitness states as it gets
attracted into different outcome basins (Merali & McKelvey, 2006). What is distinctive about
the adaptation of the system is that it must operate at or close to tripping points so that it can
“jump” to different outcome basins, and learn and adapt. It can bifurcate into different states
and potentially be guided into an optimal state (Kauffman & Johnsen, 1991). Characteristics of
35
the attractor are used to maintain the system in an optimal state or to make it bifurcate to a
new state as the environment changes. Therefore, knowing the variables, or influential factors,
and how they change is used to understand how the system evolves and influence its evolution.
Additionally, not only is the optimal operating point for a CAS near a tripping point but it
has been shown that CAS will only exist at such points. Changes in the CAS cause its
environment to co-evolve. When the CAS changes it causes a corresponding change in its
environment and the system will never exist in a completely stable state but always require
small changes to keep it located in a desired outcome basin or bifurcate to a more optimal
basin. Thus, CAS always tends to exist near tripping points, “far from equilibrium” (Prigogine, et
al., 1984) or at the “edge of chaos” (Kauffman & Johnsen, 1991; Langton, 1990).
System existence at “the edge of chaos” is an important CAS characteristic for IS
because it states that the system resides in a condition where it may quickly change to a new
state. Change may manifest itself as an unanticipated outcome if the system state and strange
attractor are unknown. It may also represent a condition for the system that allows it to
respond quickly to environmental changes and optimize its operation. The concept is familiar to
IS researchers and similar concepts exist in the social sciences.
For example, McKelvey (2001) uses the term “adaptive tension” to indicate the
condition where unmet system goals push the system “far from equilibrium” to a state allowing
for adaptation to higher fitness states. Similarly, Greenwood and Hinings define this as the
system’s “capacity for action”, showing systems without this capacity become inertial which in
turn leads to failure (Greenwood & Hinings, 1996).
Unfortunately, these and other studies fall short in recognizing the full impact of IS
operating at the “edge of chaos”. Because optimal IS operating states occur at tripping points
36
the IS will always be sensitized to change, unless the dynamics of IS change are understood
(using Chaos Theory and CAS) change to unanticipated states is almost guaranteed! When
unanticipated states are also undesirable, IS developments are in trouble. If this is not
acknowledged and controlled then IS developments will bifurcate to undesired states.
Therefore, operation at the “edge of chaos” explains why so many IS developments fail.
The next section provides background on IS, collaborative networks and
interorganizational system research and theory. This background, when combined with CT
concepts, provides the theoretical foundations for studies 1, 2, and 3.
2.4 Information Systems, Collaborative Networks, Inter-Organizational
Systems, and Complexity Theory
Information systems consist of complex multi-dimensional networks, connecting a
diversity of agents (individuals, groups, institutions, nations, computers, software components,
etc.) through multiple and diverse communication channels (Merali, 2006). They are complex
systems that lend themselves to analysis using CT because they deal with the evolution of the IS
and the characteristics that emerge over time. With respect to CT, IS change research falls into
three main streams; research using Complexity concepts, research using Chaos Theory, and
research using CAS Theory. Representative literature for these research streams is included in
the next few sections.
2.4.1 IS Change Research using Complexity Concepts
IS change research analyzes the linear progression of state of the system over time. It looks
for planned changes in an organization’s information processing structures and technologies
(Swanson, 1994). Convergence and divergence of the state space is not studied but rather IS
change is explained as a series of events and resultant IS states. This stream of research uses CT
concepts such as strange attractors and outcome basins without explicitly referring to CT or
37
Chaos Theory. Examples of such research are as follows and show how IS change research has
used Complexity concepts.
Lyytinen and Newman (2008) develop a punctuated socio-technical IS change model. Their
model views IS change as both incremental and punctuated based on critical events where a
critical event can be identified as causing an IS state change. Similar to CT concepts, socio-
technical network effects determine which events are critical to the system and cause multi-
level changes across the IS. Such IS models are conceptually similar to CAS theory describing IS
as a system of interacting agents and Chaos Theory and IS evolution as a trajectory of different
states of the system.
Lyytinen and Damsgaard (2011) extend the punctuated socio-technical change model and
report on the adoption of IS as an evolution into different configurations. What they call a
configuration has similarities to strange attractor outcome basins. Sets of factors analogous to
the dimensions of a state space define configurations. They are vision, key functionality, mode
of interaction, structure and mode of appropriation. They describe a strange attractor where all
possible configurations exist in five-dimensional state space and each dimension defines the
system characterizing factors. Their description validates the concept of a strange attractor
without using CT.
A further extension of these models is seen in the research of Mcleod and Doolin (2012).
They focus on the micro-level activities in the IS and highlight temporal, emergent and
contingent properties of an IS. Similar to Chaos theory, they explain IS change as a continuous
process resulting in evolution as a dynamic trajectory through state space driven by socio-
technical interactions. Similar to other research, they discuss concepts from CAS and Chaos
Theory without an explicit mention of these theories.
38
2.4.2 IS Change Research using Chaos Theory
Other research explicitly uses Chaos Theory. This type of research specifically describes IS
change using Chaos Theory. Representative research describes how metaphor applies to a
highly mathematical concept, such as Chaos Theory.
For example, Dhillon and Ward (2002) introduce a framework for applying Chaos Theory to
IS. As in Chaos Theory, they assert the impossibility of long-term IS prediction because of the
computation impossibility of change based outcome. They also assert that the concept of IS
success as a function of adaptation to the environment is too simplistic because it considers only
single levels of interaction. They argue the inherently chaotic nature of IS development and
management makes Chaos Theory one of the few theories appropriate to its understanding and
provide a framework for analyzing emergent IS outcomes based on quantitative and qualitative
analysis from case studies on eleven different information systems. This research introduces
Chaos Theory as a framework for IS research.
A more explicit use of strange attractors from Dhillon and Fabian (2005) defines the impact
of IS on an organization as a dynamic fractal, meaning the effect is unpredictable but a pattern
of interaction exists that can be analyzed and used to manage IS development. The strange
attractor exists as an area within the state space of the system. This is one of the first research
papers to address strange attractors as the patterns of actions and behaviors that result in the
emergence of IS characteristics.
Similarly McBride (2005) applies the elements of chaos theory, such as sensitivity to initial
conditions, strange attractors, and the effects of internal and external events to interpret IS in
organizations. Through qualitative case study analysis he shows Chaos Theory can be used to
understand the interactions between IS and their host organizations and introduces the idea of
using Chaos Theory metaphorically (not mathematically) to analyze IS.
39
Tanriverdi, et al. (2010) acknowledge the complexity of IS and the fact they exist in a state
space but take more of a technology focus by including the impact of ICT. In their research, ICT
has increased the complexity of IS “by fusing into the fabric of products, services, and business
processes and by increasing the diversity, adaptiveness, interconnectedness, and
interdependency of firms” (p823). They define a four dimensional state space with the concept
of strange attractors being implicit as shown in the following quote from their study,
“Similarities and differences in IT capabilities of firms also help business systems to remain in
between the extreme values of the four properties”(p824). They address the dimensions of state
space by showing ICT supporting organization success but also complexity as it adds new
dimension to IS analysis.
These studies are good examples of the use of Chaos Theory concepts to understand IS
change but do not applying them to solve specific IS problems, such as the preponderance of IS
development failures . They provide a general background but need extension to specific IS
developments and problems (as in this research). An important commonality in these research
studies regards the use of Chaos Theory using metaphors, it is important to remember that
Chaos Theory has a mathematical basis that is rarely, if ever, used in social science research.
Rather, it relies on metaphor to map the concepts of Chaos theory to IS change through an
understanding of behaviors that have a mathematical basis without doing an actual
mathematical derivation. CAS theory further extends the use of metaphor when applying CT
concepts in IS research.
2.5 Complex Adaptive Systems Based IS Research
CAS based IS research has its roots in organizational research (Gell-Mann, 1994; Holland,
1992, 2006; Lansing, 2003). In organizational system research using CAS Theory all systems
exhibit four major features; parallelism, conditional action, modularity, and adaption and

40
evolution (Holland, 1992). Representative research uses variants of the features. For example,
Anderson (1999) presents a view from the organization and social science perspective re-
categorizing the four system features as CT based organizational features. These features are
co-evolution at the edge of chaos, agents with schemata, self-organized networks sustained by
importing energy, and recombination and system evolution. Table 2.3 details each from the
systems and organizational perspectives and provides a good summary on the application of
CAS Theory to organizations.
Application of CAS Theory to organizations can then be extended to IS (since an IS can be
viewed as a collaborating organization supported by ICT) and show a direct link for CAS concepts
derived in the natural science to the social sciences. Numerous studies show CAS is applicable
to the study of IS. Table 2.4 provides a selected list of such research. Each examines one or
more of the four features of CAS and are the basis for evaluating IS change using CAS Theory.
Additionally, there is a large amount of similar and applicable studies on the use of CAS in
organization studies and strategic management falling outside the scope of this research.
Combining these streams of research creates a unified CAS and Chaos Theory perspective on
IS. CT is a framework for the study of IS, so the ability to incorporate different streams of
research acts to enhance its analysis capabilities. For example, organizational studies provide
insights into the social aspects of IS, IS studies (with their focus on the “IT artifact”) provide a
technical perspective, and Chaos and CAS Theory allow for analysis over multiple levels in the
short and long term. Together they provide the background and basis for a deep and rich
perspective on IS development. This perspective becomes clear by first detailing the complexity
of IS by viewing is as a collaborative network with a supporting interorganizational system as
described in the next section
41
2.6 A CAS and Chaos Theory View of Inter-Organizational Systems
This research views IS as a CAS that incorporates organizations, processes, and people
working toward a common goal of improving the organization (Silver, Markus, & Beath, 1995).
The organizations, processes, and people form a collaborative network and supported by an
interorganizational system. The description of an IS as a collaborative network supported by an
interorganizational system (IOS) allows for a distinction between the effects on the system that
are agency based (collaborative) or technology (IOS) based. The distinction between the two is
necessary to generate a complexity model for IS.
A collaborative network is “the joint organizational entity, infrastructure, business processes,
resources, and relationships which support a shared effort to provide some collective benefit,
whether it is a program, service, or a product” (Fedorowicz, Gogan, & Williams, 2006). For
example, collaborative networks creation occurs when agencies agree to share information on
an ongoing basis. An IOS provides the connecting infrastructure (information and
communications technology (ICT)) to support the exchange of information across the system on
a continuing basis and enable far-reaching agent interactions (Cash & Konsynski, 1985;
Fedorowicz, Gogan, & Williams, 2007).
Applying Chaos Theory to analyze a collaborative network utilizing an IOS requires defining
the state space for the system. Factors define the state space and strange attractors define the
possible states for system. Therefore, analysis using strange attractors reveals the state spaces
collaborative networks occupy and the strange attractor defines limits of the factor values.
Outcome basins define configurations for the IS. Chaos Theory shows how the collaborative
networks may switch outcome basins based on a small perturbation in factor values that may
result in the network occupying unintended or unpredicted outcome basins.
42
This research uses CAS and Chaos Theory to explain and understand IS change, but is too
broad for generalized analysis. Therefore, research is limited to a smaller domain of interest.
The domain of interest chosen is public sector organizations and particularly Public Safety
Networks. The next section reviews existing research in public sector system complexity and
shows why it is an applicable domain for this research.
2.7 The Public Sector and Complexity Theory
There are numerous studies using CAS and Chaos Theory in the public sector. This
research divides into two streams, validating the application of CT to the public sector and
applying CT concepts to public sector organizations. A few examples of significant research in
these streams follow.
2.7.1 Examples of Complexity Theory Concepts used in the Public Sector
Results from qualitative case studies by Rhodes, Murphy, Muir, and Murray (2011)
detail the potential for CT concepts to the public sector. CAS concepts offer an “intellectual
framework with which to observe and seek to understand, in a fresh manner, the functioning of
public management systems” ((Rhodes, et al., 2011), p2) when being applied to public service
and administration research (Rhodes, 2008; Rhodes & MacKechnie, 2003). The following
quotation from Meek ((2010), p1) succinctly describes the importance of CT to the public sector.
“CT offers enormous potential for improving our understanding of both policy development
and public administration. The central concepts of non-linearity, emergence, self-
organization, complex adaptive-systems provide attractive insights about behavior that
helps address the limitations of rationally based policy and administrative logics that have
guided much of our efforts in these areas of inquiry.”
In a similar vein, in their book Public Management and Complexity Theory, Rhodes, Murphy,
Muir, and Murray (2011) advance the use of CAS for studying public administration and public
service systems. They view CT as inherently useful as a means of understanding public policy
43
and management challenges because it integrates various theoretical streams in public
administration research to one coherent framework. “Public service provision may be
characterized as a ‘system’ and, particularly, one that may have multiple concepts of purpose,
involving many agents interacting with one another, triggered into action by policy objectives
that may be jointly pursued” (p. 200). Yet at the same time, they acknowledge there are
relatively few research programs that have utilized this approach.
Another view on CT use in public service acknowledges its complementary nature to many
existing theories but adds an additional depth to analysis. CT “overlaps with the existing
theories (institutional, rational choice, advocacy coalition framework, and network theories).
However, the conceptual and methodological tools of complexity theory can offer a better
understanding of the nonlinear, self-organizational, and emergent policy processes” (Morçöl,
2010). In this view, CT advantages include the ability to use existing (non-CT) theory at the
micro-level and then use CT concepts to create a macro-level view of the system. This is
particularly suited to the public sector because of the wealth of micro-level research available
for use with CT as described in the next section.
2.7.2 Examples of Complexity Theory Concepts applied to the Public Sector
The application of CT to the public sector mirrors IS change research in its focus on the
evolution of organizations. In particular, many show how the key aspects of Chaos and CAS
Theory for IS (as defined in this research) can be applied in the public sector. The following
details examples of such research.
Teisman and Klijn (2008) examine a UK rail extension project and how governance
processes evolve and sometimes result in unanticipated project outcomes. They describe
“temporary equilibriums” leading to self-organizing characteristics of autonomous agents. Their

44
results are very similar to the punctuated socio-technical change model of Lyytinen and
Newman. Their model utilizes self-organization concepts from CAS Theory and strange
attractors and outcome basins from Chaos Theory.
Van de Walle and Vogelaar further the application of strange attractors and time horizon
concepts (Van de Walle & Vogelaar, 2010). They focus on the validity timeframe for decisions.
They show that public sector reforms exhibit time horizons and focusing on formalization and
procedures may have direct positive effects on short-term efficiency and effectiveness, yet the
long term impacts are unpredictable. Management decisions may cause the organization to
“settle” into unintended outcome basins.
Van de Walle and Vogelaar bring an important additional dimension to the factors of a
public sector organization’s state space by considering the influence of power. A CT perspective
leaves considerable discretion for managers and individual public officials, but while this may in
many cases lead to superior performance and problem-solving abilities, it may also open
opportunities for opportunism and abuse of power. Thus, they define an unintended outcome
from the abuse of power and define an outcome basin for it.
Jannssen and Kuk (2006) use a CAS perspective to analyze eleven e-Government projects in
the Netherlands. They specifically concentrate on “interaction points” between local and
central governments to understand these projects and identify architectural design principles.
They show that the successful project managed interactions without exerting tight control over
the projects. Thus, the successful projects operated in a state allowing the system to adapt to
the best performing project development. The optimal projects operated at “the edge of chaos”
and they show how managers adapt their project to meet success.
45
In summary, public sector research uses CAS and Chaos Theory by viewing public sector
organizations as self-adapting systems consisting of many autonomous agents. Research
categorizes public service organizations as chaotic systems and uses concepts from strange
attractors. From CAS Theory decision time horizons are applied, in particular the notion that
organizational characteristics exhibit a limited time horizon for management decisions and
unintended consequences can arise from those decisions. In addition, much of the research
using CT for the public sector utilizes qualitative case studies to support their conclusions.
Just as the IS domain is too broad for study, requiring focus to public sector
interorganizational systems, the public sector domain is also too broad. Studies in the Public
Domain have included a wide range of application areas including healthcare, education,
transportation systems, and public administration. For this research, further focusing of the
domain of interest results in public sector interorganizational systems study for public safety
services.
2.8 Public Safety Networks
The domain of this research studies Public Safety Networks (PSNs). PSNs exhibit
characteristics of CAS (Tomasino, 2011) and many times PSNs emerge from public safety agency
collaborations in an unpredictable fashion (Williams, Fedorowicz, & Tomasino, 2010). Research
aiming at understand public administration and public service domains similar to PSNs
increasingly use CT and in particular CAS Theory (Janssen & Kuk, 2006; Rhodes & MacKechnie,
2003). Therefore PSN based research should provide valuable insights into explaining and
understanding IS change and evolution using CT concepts such as strange attractors.
PSNs are inter-agency, agent-based, collaborations focused on the development and use of
information and communication technologies (ICT) to support the information sharing and
46
functional interoperability needs of public safety organizations engaged in law enforcement,
criminal justice, and emergency response. They are agent-based systems consisting of a number
of independent public safety agencies, such as police, sheriff, fire, medical, and emergency
management, sharing technical and non-technical services under both formal and informal
agreements among themselves (Williams et al., 2009).
As a network of public safety agencies, supported by an ICT infrastructure, a PSN emerges
from the individual and collaborative behaviors of its member agencies. Behaviors at the
agency level aggregate to complex network behaviors in reaction to public safety events
(Tomasino, 2011; Williams, et al., 2010) and the PSN self-organizes and adapts as in CAS and
Chaos Theory.
A key aspect of PSNs is the sharing of information, which may include criminal, citizen, or
emergency data. PSNs implement an IOS for cross-boundary information sharing and
communications. The IOS also acts as a unifying force among member agencies but regulations,
political agendas, safety agencies and citizens dictating the use of the IOS may act to push the
member agencies apart (Dawes, Pardo, & Cresswell, 2004). Therefore, the complexity of agency
interactions lends itself to a CAS and Chaos Theory analysis that systematizes these effects.
Additionally PSNs encounter variability in the magnitude of events influencing their
operation and evolution. There are a multitude and complexity of factors affecting PSNs. PSNs
not only operate in a day-to-day routine fashion but must also accommodate and respond to
episodic, non-routine and unpredictable public safety events (Fedorowicz et al., 2011).
Therefore, they should provide applicable cases for the examination of non-linear network
effects, in particular small events causing large PSN changes.
47
A large number of factors influence the PSN including the IOS as a support system for the
PSN. Factors can be grouped into three contexts; the environmental (outer) IOS context, an
organizational (agency) IOS context (Pettigrew, 1990) and an interorganizational (collaborative)
IOS context that shapes the PSN (Pardo, Cresswell, Dawes, & Burke, 2004). Based on numerous
prior studies12 Fedorowicz, Gogan, and Williams (2007) identify factors which influence IOS
based on these contexts. They include factors from the external environment, agency context
and collaborative network. Table 2.5 details these factors. Within this research, these factors
describe the state space for the analysis of a PSN (Chapter 3, Section 3.4.3.4 describes the
choice of these factors for this research).
Defining the influential factors for PSNs concepts from CAS and Chaos Theory, such as
“strange attractors” and outcome basins, aid in the explanation and understanding of how the
PSN evolves. This opens a new window into the exploration and discovery of the complex
behaviors of public service organizations and expands the theoretical understanding of PSN
evolution. Although confined to PSN a goal of this research is to generalize findings to a broader
range of cross-agency intergovernmental collaborative initiatives employing IOS.
2.9 Research Contribution
The following Chapters of this research define and apply a model for IS development using
the concepts previously described. In particular, deriving a general model for PSNs uses the key
aspects of Chaos and CAS theory and enables the modeling of PSN development (using case
studies). The key aspects and how they influence model generation is detailed as follows.
12
See (Fedorowicz, et al., 2007), page 788 for a review and list of prior studies.
48
Sensitivity to Initial conditions. The inability to identify causes for PSN system outcomes
requires the model only consider what is observable, namely PSN states and state
changes.
State Space. Since observations are limited to PSN states, modeling occurs in state
space using only time domain descriptions of the system to derive the state space
description.
Strange attractors. The model allows for the construction of the PSN strange attractor
because it traces (plots) state changes through state space. The strange attractor
predicts possible future states of the system and determines when it is operating at the
“edge of chaos”.
Adaptation. PSN agents change their behaviors to increase their fitness in the PSN.
Therefore, the model is multi-level including environmental and agency level
interactions and effects.
Time horizons. Environment and agency effects will occur in the short and long-term.
The model must accommodate both. It consists of the short-term PSN state model
longitudinally instantiated to produce a sequence of longer-term state changes.
“Edge of Chaos”. The focus of the model is on state changes. Recognizing the optimal
PSN operations at the “edge of chaos” requires modeling the capacity to identify
outcome basins and bifurcations.
This research is the first to model PSN development and extends current perspectives on
how IS evolve and change over time. By utilizing CAS and Chaos Theory and the concept of
strange attractors this research provides a new perspective on the state and status of PSNs and
IS and how they occupy different state spaces over time. It shows both evolution and change
can be modeled outside the time-domain and explained and understood by examination of the

49
state of the IS without determining causality. This allows for the identification of the sensitivity
of the IS to system factors and the likelihood of the IS evolving to a undesired or unanticipated
state.
In practice, by understanding the influential factors (such as structure, culture, decisions,
and technology) that form the strange attractors, managers can make decisions that guide the IS
to remain in an outcome basin that is closely aligned to their goals for the system.
Understanding these factors can also help managers avoid bifurcations to undesired outcomes.
The uniqueness of this research stems from the detailed use and application of strange
attractors to IS by examining PSNs in the public sector. Additionally by characterizing an IS using
strange attractors and understanding sensitivity to initial conditions estimates of the time
horizon for decision making for the evolution of an IS can be made. Unpredictability of the
development and evolution of an IS can be understood better. “Although a chaotic system will
display behavior that travels randomly through a range of allowable states, an analysis of the
bifurcation diagram or attractor can provide information about how much time the system will
spend in one region or another”( (Kellert, 1993), p103).
Additionally, this research complements and adds to existing research and theories.
Although CT is counter to micro-reductionist models (sum of parts) for IS, reductionist
techniques can be used to understand micro-level actions and interactions leading to macro-
level behavior. Chaos Theory is based on mathematical models that cannot, in a finite sense,
characterize a system. Yet these mathematical models, based on reductionist models and
theories, can be utilized to understand and characterize IS within an acceptable area of
exactness. Rather than exactness, the goal is to get “close enough”.
50
In addition, this research brings to the forefront the need for historical (i.e. longitudinal)
analysis. An IS existing in a certain state at a given time is not a complete description of the
system. “Interpretation of state C implies a knowledge of the history of the system, which had to
go through bifurcation points A and B” (Prigogine, et al., 1984). Therefore this research also
contributes to epistemological considerations of IS, in particular the use of qualitative analysis
and case studies.
Lastly, PSNs are receiving more attention and priority in the United States as the country
deals with ever-increasing threats from terrorism and natural disasters. For example, PSN
enabled sharing of information has become increasing important to US Government
organizations such as the Department of Homeland Security, Department of Justice,
Department of Health and Human Services, and the National Science Foundation to enhance
public safety (Pardo, Gil-Garcia, & Burke, 2008). Additionally, the September 1th, 2011 terrorist
attacks on the World Trade Center revealed the criticality of inter-organizational coordination
afforded by ICT within PSNs and its affect on public safety agency and citizen safety (Comfort &
Kapucu, 2006). This research contributes to a better understanding of the operation and
management of PSNs that may ultimately increase public safety.
51
3 Study 1: A PSN State Space Process Model
3.1 Introduction
After two decades of interorganizational systems research, processes defining and
characterizing IS still present economic, social, governance and ownership challenges to
managers and researchers (Barrett & Konsynski, 1982; Robey, Im, & Wareham, 2008).
Traditional conceptualization of an IS that relies on adoption, governance and organizational
consequence do not adequately capture the complexity of these systems and how they evolve.
IS evolution challenges traditional IS conceptualizations because it is a “wicked problem”
involving relatively long times and interactions of all IS constituents spanning many agencies and
organizations14. Changes to IS emerge as agents and organizations adapt to their environments
over time.
Static, non-longitudinal traditional IS analysis techniques15 fail to recognize the dynamism of
IS change creating a need for new frameworks and models for understanding and managing the
full extent of the underlying IOS phenomena (Lyytinen & Robey, 1999; Reimers, Johnston, &
Klein, 2008; Robey, et al., 2008). Researchers are challenged by the complex technical,
organizational and social interactions of IS (Jacucci, Hanseth, & Lyytinen, 2006; Xia & Lee, 2004).
For example, as an IS becomes increasingly sophisticated and complex the likelihood of
unanticipated and unintended consequences grows (Markus & Robey, 1988). Very quickly a
seemingly successful IS can become a failure (Lim, Sia, & Yeow, 2011; Zarrella, Tims, Carr, & Palk,
2005).
14
As described in Chapter 1, IS and IOS conceptualization is a “wicked problem” requiring complexity perspectives to explain and understand. 15
The traditional process analysis techniques described are from (Langley, 1999; Lyytinen & Newman, 2008; Mohr, 1982)

52
Attempts have been made to capture the complexity of IS change. Examples capturing the
social and technical interactions of IS change include socio-technical change models using
structuration (DeSanctis & Poole, 1994; Giddens, 1984; Orlikowski, 1992) and social shaping of
technology (Williams & Edge, 1996) Theories. These theories adequately explain singular
change events and effects but do not explore the non-linear interactions that are typical of IS
change and do not draw on theories of process, evolution, or emergence and therefore fall short
in capturing all the complexities of IS change.
More recently, attempts explaining IS change use complex, situated socio-technical change
models across multiple levels of the organizations (Lyytinen & Newman, 2008; McLeoad &
Doolin, 2012; Rhodes, Murphy, Muir, & Murray, 2011). These longitudinal studies consider
multiple levels of context and process in explaining IS change and provide solutions to many of
the challenges of traditional IS conceptualization. Some studies come close to capturing the
complexity of IS change but use traditional process analysis techniques and are plagued by the
inherent limitation in these techniques; causal mechanism identification. The following
paragraphs expand on this limitation.
In a traditional process analysis16, series of significant events describe a system. Events are
significant when they cause a change in the state of the system. At any given time, the system
exists in a certain state17 and significant events cause it to transition to a different state.
Therefore, traditional process analysis results in a general process model tracing the history of
the system change as a series of events (Figure 3.1) causing state changes.
16
The traditional process analysis description is from (Langley, 1999; Lyytinen & Newman, 2008; Mohr, 1982). 17
The state of a system at a moment of time is the set of relevant properties, which the system has at that time. The values of relevant properties constitute the state of the system (Ackoff, 1971)

53
The limitation of the traditional process model is the identification of significant events.
“The major challenge is identifying events . . . how can one detect from a huge stream of
changes, events that truly influence the system? Many times this can only happen with the
benefit of hindsight or changing the ‘theoretical lens’ to explain the change” ((Lyytinen &
Newman, 2008), p599). Identification of events is particularly problematic because of the
systems sensitivity to initial conditions. As described in Chapter 2, Chaos Theory can be used to
show that not only is determination of these events problematic, but, in fact, impossible even
with current computational capabilities.
This study overcomes this limitation by removing the need to identify the critical events that
cause IS changes. Instead, this study models IS change as a process resulting in a sequence of IS
state changes within its state space. Figure 3.2 depicts the resulting State Space Process Model
for system change. As can be seen, sequential changes in system state represent IS change.
Although events occur and “cause” the state changes, events are not parts of the model. The
state of an IS (an outcome of IS change) represents all causal events precipitating the change
without the specific identification of each cause. A state space process model completely
describes IS change without suffering from the inherent causal mechanism identification
limitation of traditional process analysis.
Additionally, the model results in a clearer and more focused view of IS change by
elaborating the sequence of state changes rather than elaboration of states at fixed time
intervals. As Lyytinen and Newman (2008) discovered, IS state change is sporadic with long
intervals of relative stability. A state space model simplifies the conceptualization of IS change
by removing the repetitive non-changing states and only elaborates the sequence of each new
IS states. Removing the repetitive non-changing states can be thought of as removing analysis
54
“noise” that clouds the view of what is truly important, state change18. An IS change model
emerges by mapping traditional process models into state space using only knowledge of
system states and sequence.
As shown in Chapter 2, trajectories of systems states, plotted in multi-dimensional state
space, represent the system’s strange attractor and capture all the states in which the system
exists. Analysis of the shape of the strange attractor reveals the system’s sensitivity to initial
conditions (without identifying the event) and the potential for unanticipated or unintended
outcomes. Therefore utilization of a state space process model maintains the advantages of
traditional process analysis without the limitation of event identification and gives a clear
perspective on IS change.
This study analyzes the development of a criminal justice information system (CJIS), a type
of Public Safety Network (PSN), by deriving a detailed state space process model for IS change
and applying it to the CJIS. Since this study considers the IS domain of Public Safety Networks
(PSN) a PSN State Space CAS Model is derived to determine the state of the PSN and the state
changes or evolution of the PSN is tracked through a PSN State Space Process Model.
The study‘s structure is as follows. Section 3.2 derives the PSN State Space CAS Model
describing the state of the PSN. Then Section 3.4 describes the construction the PSN State
Space Process Model, using the PSN State Space CAS Model, and details the sequence of PSN
state changes. For each model a general IS model is first derived and then customized for PSNs.
Section 3.4 details the method for applying the model to the CJIS under study followed by this
18
For the state space model, an elaboration of states at time-intervals is nonetheless important and necessary. It is needed to produce the reduced sequence of states. In addition, the elaboration of only state changes does not preclude analysis of stable IS. A stable IS would have few state changes, which the state space model would clearly show.
55
study’s findings (Section 3.6). The study concludes with a discussion of the applicability,
limitation, and contribution of the models to theory and practice in Sections 3.8 and 3.9.
3.2 The PSN State Space CAS Model
This study adopts the complex adaptive systems (CAS) analysis perspective to conceptualize
IS development and change. IS change consists of multiple factors and non-linear interactions
between agents and technology (internal and external to the IS) causing unpredictable change.
Figure 3.3 depicts a general CAS model and one enhanced for modeling public sector IS
(heretofore referred to as the IS model) (Rhodes, et al., 2011). Both are multi-level models
consisting of a system embedded in a larger environment but the IS model conceptualizes the
environment and system differently than the general CAS model. For the IS model the external
and system environments are divided into rules and factors and system interactions are defined
as processes. The following section discussed each change.
3.2.1 Environmental Rules and Factors
In the IS model rules specify and factors influence agent behavior. Increasingly the public
sector IS environment consists of both mandated rules, specifications, and standards enacted by
public administrators, (Gil-Garcia & Martinez-Moyano, 2007) and factors, such as the local
economy. Therefore, a distinction is required between factors that may influence agent
behavior and rules that mandate behavior.
Additionally, for modeling purposes, the rules and factors defining the IS environment are
differentiated into the endogenous and exogenous environment. The endogenous environment
is internal to the system under study and consists of rules and factors interpreted by each agent
based on its processes and schema. They are the rules and factors that are specific to each
agency (or shared by agencies).

56
The exogenous environment is the factors and rules outside the scope of the system, and
although impactful to all agents, may not be as important to some agents and not feature in
their decision-making. For example, Janssen and Kuk (2006), in their Netherlands based study of
11 local e-government ICT projects, observed minimal impact of State-level ICT investment
targets and guidance (that were external to the project’s local government and non-mandated).
The local governments (the agents) felt the targets were unrealistic and would lead to rushed
developments and low quality outcomes, ignoring many of them. The local governments set
their own targets (endogenous rules) for the ICT projects using State-level targets (exogenous
rules) they felt were appropriate. In this example, ICT investment targets and guidance were
environmental factors because local government agencies picked and chose which ones to
follow.
Similar to the endogenous and exogenous environment, Koppenjan and Klijn (2004) break
the public sector environment into “interaction rules” which are made by the interacting agents,
and “arena rules” which define policies and rules at the system level. The “interaction rules” are
part of the endogenous environment and the “arena rules” correspond to the exogenous
environment. In-line with these researchers (Rhodes et al., Janssen and Kuk, Koppenjan and
Klijn), this research proposes a model differentiating between the exogenous and endogenous
environment. In assessing the impact of the environment on each agent, this study, uses a
process perspective described in the following section.
3.2.2 Interactions as Processes
In order to better understand the pattern of IS agent interactions the IS model defines
interactions (from the general CAS model) as processes. For this research, agent interactions
leading to specific outcomes define a process. Considering interactions as processes focuses
research on interactions related to the agency and collective goals of the IS (outcomes). This
57
focus potentially allows for easier identification of patterns of interactions by linking them to the
outcome they produce. For example, the existence of joint-agency teams (the interaction) may
result in increased IS efficiency (the outcome). Increases in inter-agency communication factors
(teamwork) result in a corresponding state change (efficient). Without linking the interaction to
the outcome, identification of state changes is impossible19. Therefore the definition of
interactions as processes helps uncover the important factors (and rules) influencing the IS,
providing insights into the emergence of new IS states or locks into predetermined states
(Haynes, 2008). Essential to the process definition of interactions is the definition of outcomes
for the IS.
3.3 IS Outcomes Classification of the outcomes of the system aids in identifying patterns of interactions.
Different types of outcomes may be associated with different processes, patterns of interactions
or factors. The IS model depicts the key outcomes for a CAS, namely, path dependency,
adaptation, bifurcation, and emergence (Rhodes, et al., 2011) as follows.
Path dependency refers to the tendency of the system to lock into a certain behaviors
based on past agent interactions and initial conditions. For example, agents having a
history of resisting change may not adopt new technologies. In this example,
resistance to change path dependencies creates non-adoption outcomes.
19
It may seem that the IS model has digressed into a causal model. As per the example given, implementing cross-agency teams causes efficient IS. What is actually being said is in this particular case, cross-agency teams lead to an IS state, characterized by inter-agency communications, which leads to efficiency. This clarifies the fallacy of causal models; creating cross-agency teams does not always lead to efficient IS. Instead, by using the IS model one could conclude types of IS exiting in states characterized by inter-agency communications are more efficient. Agents in this IS would take actions to increase inter-agency communications to increase efficiency, whether that means creating inter-agency teams, or not, is irrelevant.
58
Adaptation occurs when agents change in response to the action of other agents or
changes in the environment. Within a system, re-organization is an adaptive outcome
as the system changes its reporting structure to improve on meeting goals.
Bifurcation refers to the system quickly evolving to a new state or outcome basin. For
example, an organization’s outsourcing of IT support is a bifurcation with the new
organizational state defined by “outsourced IT support”20.
Emergence is the creation of new properties for the CAS that is impossible to predict
by the actions of the agents or the environment. “Workarounds” are a good example
of emergence as they appear within an organization and are unplanned or
anticipated.
Adaptation, bifurcation, and emergence are outcomes that result in a change of state of the
system whereas many times path dependency indicates a lack of state change. Therefore, these
types of outcomes, and when they occur, identify system state changes and associated
processes, patterns of interactions, and factors leading to state changes.
The resulting IS model (Figure 3.3) consists of six core elements, the system, environmental
factors, environmental rules, agents, processes, and outcomes. Each is derived from the
definitions of the CAS elements for public sector organizations (Rhodes, et al., 2011) and defined
in Table 3.1. Within this study the six IS model core elements are utilized to explain and
understand the development of a specific type of IS, public safety networks (PSNs), by
configuring and customizing the model for PSNs.
20
Although decisions to outsource may be long and drawn out this example assumes the actual implementation of outsourcing occurs relatively quickly.
59
3.3.1 Configuration: Mapping the IS Model to Public Safety Networks
This study configures the IS model for PSNs by mapping accepted PSN influential factors into
the six IS model core elements. The resulting PSN model is structurally the same as the IS
model, containing six elements, but has influential factors specific to PSNs describing the state
of each (and in total the state of the PSN).
To remove ambiguity and confusion regarding terminology this research defines the
following terms describing the state of a PSN.
PSN State Variables are the entire set of rules, factors and descriptions that describe
the state of the PSN. Referring to the “state of the PSN” refers to this set of variables.
Rules and factors are types of PSN State Variables as defined in section 3.2.1.
Collaborative Network factors (CN factors) are the accepted set of influential
collaborative network factors for PSNs defined by Fedorowicz, et al. (2007).
IS Core elements are categories or groupings of PSN State variables based on the
specifics of the IS model as described above.
Table 3.2 lists and exemplifies the CN factors. These factors were chosen because they
resulted from an exhaustive review of public sector collaborative networks and are verified
through empirical PSN research (as detailed in (Fedorowicz, et al., 2007)). As a result, they align
with the public sector CAS based IS model elements (Rhodes, et al., 2011) and represent a good
starting point for this research.
Mapping CN factors to IS core elements clarifies the origination and association of state
variables to different agents. Mapping provides context for each CN factors and defines its
“location” in the IS Model. This is important when considering application of the model to
particular PSNs as discussed in the research methods section (3.5). The CN factors map directly
60
into the IS core elements, as summarized in Table 3.3. Additional considerations regarding the
CN factor mappings to each IS core element are described as follows.
System – The modeled system is a CJIS, a type of PSN. Anything outside the scope of the
CJIS agents constitutes the external environment and CN factors from the external
environment map into the IS exogenous environment. Interacting agents bound the IS
endogenous environment and therefore the existing CN factors at the Agency Context
map to the endogenous environment.
Environmental factors – Environmental factors influence behavior and actions by the IS
agents but do not mandate action. They may or may not affect the IS. Exogenously, CN
factors such as critical events and economic conditions are environmental factors since
they may strongly affect the PSN but the PSN has no responsibility to act on them. For
the same reasons, endogenously, CN Agency context factors, resources and ICT
infrastructure, map to IOS endogenous environmental factors. For example PSN agents
with inadequate staff (resource factor) or faced with legacy software (ICT infrastructure
factor) are strongly impacted by these factors but neither prescribes decisions or actions
therefore they map to factors and not rules.
Environmental rules- In contrast environmental rules mandate actions. Exogenously
they represent laws, which prescribe specific action or strong influences such as partisan
divisions, or public opinion that effectively force change. Therefore, CN factors for
Politics map to IS exogenous environmental rules. Similarly, within the Agency context,
agency specific rules, charters, strategies and operational procedures define the actions
of the agents. They prescribe actions therefore they map to the IS endogenous
environment rules.
61
Agents – Agents are the groups engaged in system processes, interacting to accomplish
agency or joint goals. For PSNs, they are the agencies engaged in law enforcement,
criminal justice and emergency response.
Processes- An IS requires collaborative and interorganizational operations and
procedures supporting activities implementing the IS strategy, governance and
resourcing. As defined in this study, in an IS, governance, strategy, resources and
relationships involve the sharing of resources across the agencies. Therefore
collaborative network CN factors mappings are to a newly created PSN variable for
shared services.
Outcomes- Outcomes are the product of the processes in which the agents engage.
Example of outcomes might be certifications, re-organizations, new technology
adoption or new processes and procedures. CN factors do not contain outcomes but for
this study outcomes must be included as they feedback into the system. Section 3.3
defines the outcomes.
Since CN factors map directly into the IS core elements there is no need to modify the IS
model for PSNs. Figure 3.4 shows the resulting PSN State Space CAS model. It is structurally
identical to the IS model with the exception of terminology changes to simplify further analysis.
Each part of the model is not redefined but rather renamed to make the model terminology
specific to PSNs, as follows.
Agency Context replaces endogenous environment because this environment is specific
to the PSN agents.
Similarly the, external environment replaces exogenous environment because is external
to the PSN.
62
The Collaborative Network is the PSN name for processes referring to the collaborative
activities of the PSN.
Since this model is a state space CAS model the elaboration of specific outcomes in the
figure is a reminder of the types of outcomes considered for a CAS.
Implicit in the model are the PSN State Variables resulting from the mapping. Table 3.4 lists
the PSN State Variables. Additionally, Table 3.4 lists possible components for each variable.
Components help in evaluating the PSN. For example, under endogenous environment rules,
the PSN State Variable, strategy, has components of charter and vision. Evaluating a PSN for this
variable might require examining the institutional charters and mission statements for the
agencies to determine strategy.
In this study, the thirteen PSN State Variables defines a thirteen dimensional state space for
PSNs. Based on the IS model, CN factors, and CAS theory, thirteen dimensions seems
reasonable for the PSN state space but its sufficiency cannot be determined. In fact, due to the
properties of complex systems, the dimension may never be determinate but incorrect
specification of its dimension does not affect its use.
Under-specification of the PSN state space (for example, it is more appropriately described
by 28 rather than 13 dimensions) results in no loss of strange attractor information and does not
invalidate the model. Chaotic systems and strange attractors are insensitive to the dimension of
the state space. Interacting factors determine the evolution of any single dimension (or
variable) of the system. Therefore, single factors inherently contain all the information about
the system (Casdagli, Eubank, Farmer, & Gibson, 1991; Crutchfield, Farmer, Packard, & Shaw,
1986). Under-specification of the dimension of the state space leads to less insight regarding
the description of the system, but no decrease in accuracy.
63
Additionally, the fractal nature of the strange attractor accommodates any problems
associated with over-specification of the dimension of the state space (for example, only 5
dimensions are required instead of 13). Strange attractors are fractal, meaning they do not
occupy the entire state space and are confined to an area of the state space21. Over-
specification of the dimension (the variables) of the state space may result in variables that
never change and are irrelevant to the analysis. More typically, variables never attain certain
values and the strange attractor does not exist completely across that factor or dimension,
resulting in a non-integer, fractal dimension for the state space. Though typical in chaotic
systems, fractal system dimension does not impact the accuracy or validity of its strange
attractor (Dhillon & Fabian, 2005). Therefore, over-specification of the dimension of the state
space does not affect accuracy of the analysis22.
3.3.2 Customization: Modifying the PSN State Space CAS Model
After configuring the IS model for PSNs and creating the PSN State Space CAS model the
model is customized for a specific PSN. The customization process modifies the structure of the
PSN State Space Model and the PSN State Variables, if necessary, resulting in a model and
variables meeting the researcher’s goals for understanding and explaining a specific PSN
development. This process requires a detailed analysis of the specific PSN and is the subject of
the method and finding sections of this study. Sections 3.5 and 3.6 detail both. The next section
details how the PSN State Space CAS Model or a customized version of the model is used to
track PSN state changes.
21
Systems occupying any position in state space are random systems, not chaotic systems. 22
See Appendix B for detail on over and under specification of the dimension of state space.
64
3.4 The PSN State Space Process Model
As stated in Chapter 2.3.2, modeling a PSN as a CAS will result in a time horizon for cause and
effect relationships requiring a model that specific states and sequences of states. The PSN
State Space CAS Model describes the state of PSN at any given time and the PSN State Space
Process Model traces the sequence of changing PSN states over time. The following paragraphs
derive the PSN State Space Process Model from the punctuated socio-technical change model of
Lyytinen and Newman.
Lyytinen and Newman (2008) derive a model for information system (IS) change based on
periodic changes in the state of the system based on critical incidents (critical being defined as
significant enough to cause a state change). They refer to the model as a punctuated socio-
technical change model (PSIC) because it describes IS change as a series of socio-technical states
separated by critical incidents similar to the general process model shown in Figure 3.1. Figure
3.5 depicts Lyytinen and Newman’s PSIC model.
In describing the PSIC model Lyytinen and Neman state, “IS change is a set of consecutive
socio-technical system states some of which are in equilibrium and others are not at any point of
time, connected by events, where some succeed, some fail, and some punctuate” (IBID, p599).
They describe IS change as a trajectory of state changes through time separated by critical
incidents. Their model depends on the problematic if not impossible identification of critical
incidents to identify IS state changes (sensitivity to initial conditions). Even Lyytinen and
Newman recognized this and noted their model’s limited applicability to only historical analysis
or evaluations of IS change in hindsight. This model cannot predict IS change.
Figure 3.6 depicts the PSN State Space Process Model. Instantiation in time of the PSN State
Space CAS Model produces the sequence of states, represented by the PSN State Variables for
65
each PSN State Space CAS Model. Additionally, since PSNs are chaotic systems23 and the PSN
State Space Process Model produces the sequence of states of the PSN a plot of the states in
state space represents the PSN’s strange attractor. Although this model appears to be strikingly
similar to the PSIC model there are important differences, as follows.
Analyzing state change in state space using strange attractor concepts from Chaos
Theory removes the need to identify critical incidents. Characteristics of the strange
attractor, solely determine the Characteristics of the evolution of the IS.
The PSIC model traces state changes across time resulting in state changes only when
critical incidents cause a change. To capture every possible PSN state change the PSN
State Space Process Model traces the PSN state at set periodic intervals independent of
critical incidents. Small changes in PSN state across many time intervals represent
outcome basins and large changes in PSN state over a small number of time intervals
represent bifurcations. Because the PSIC model only evaluates PSN state changes after
critical incidents, it loses the ability to identify outcome basins (when there are no
critical incidents) or bifurcations caused by undetectably small incidents.
In the PSIC model, critical events follow “gaps”. “Gaps” are defined as any system
contingency, if left unattended, reducing the system performance. The PSIC model uses
critical incidents to identify the “gaps”. The PSN State Space Process Model uses
analysis of the PSN strange attractor to determine when the PSN is sensitive to “gaps”.
In other words, the PSN does not change state because of “gaps”, but rather its
environment changes and the PSN state changes. When a “gap” occurs, the PSN is
operating at the “edge of chaos” (as described in Chapter 2.3.3).
23
In the PSN State Space Process Model, the assumption is PSNs change chaotically. Testing this assumption occurs in Section 3.8.2.1.
66
Although the PSIC and PSN State Space Process Model are markedly different in their
treatment of state change, they share the advantage of using proven and accepted IS theories in
new ways. As Lyytinen and Newman explain, the PSIC model integrates theoretical streams to
analyze IS change and likewise the PSN State Space Process Model uses accepted theories to
generate the PSN state. Both are very complementary and consistent with existing theory
because they can use existing theory or concepts that best fit the IS or PSN under study. Shown
below are a few examples of the consistency of the PSN State Space Process Model with existing
theory.
The model is consistent with the concepts of socio-technical perspectives. Socio-technical
views of IS change envision it as a function of simultaneous technical and social events (Kling &
Lamb, 1999; Lamb, Sawyer, & Kling, 2000). In this view, IS change is a reciprocal relationship
between rational technical processes as well as social processes involving actors in political and
cultural roles. PSN State Space Process Model agent, political, economic, strategy, governance,
process and technical variables corresponds directly to technology, structure, actors, and task
factors for socio-technical systems (Burns & Flam, 1987). Therefore, it is consistent with socio-
technical theory because it encapsulates socio-technical theory in its variables.
Similarly the model contains aspects from both institutional and punctuated equilibrium
theories (Greenwood & Hinings, 1996; Romanelli & Tushman, 1994). Because they are never in
equilibrium, PSNs may exist in semi-stable states or areas of state-space corresponding to
outcome basins. Through bifurcation, the PSN jumps to new outcome basins very akin to
evolving through punctuated equilibrium states. Additionally bifurcations may involve a “de-
institutionalizing” of the PSN with completely new structures, routines, ideas, beliefs and values
emerging as factors for the new PSN state. The PSN can move into a state of increased
reformative or competitive values and become more susceptible to breaking down existing
67
institutions and adopting different organizational structures. Institutional and punctuated
equilibrium theories describe a system at a tripping point, ready to move from one outcome
basin (the institution) to another, exactly like a PSN described by the PSN State Space Process
Model.
The PSN State Space Process Model can also be considered a situated change model
(Gasson, 1999; Suchman, 1987). Situated change models link change to contextual settings or
environments. In the PSN State Space CAS Model, agents interpret the external environment
based on their schema and the PSN changes as the environment changes. Including the external
environment in the PSN State Space CAS Model (which is then instantiated in the PSN State
Space Process Model) links, or situates the PSN in its context defining the model as a situated
model.
In summary, the PSN state space model does not preclude the use of previously developed
theories or concepts and complements existing change models such as the PSIC model. The
uniqueness of the model stems from the utilization of the state space analysis and
corresponding concepts from CAS and Chaos theory, in particular, the strange attractor. The
next section details the research methodology used when applying this model and the
customization of the PSN State Variables to a specific PSN.
3.5 Method
The research utilizes case analysis techniques from Yin ((Yin, 2009) to model a single case
study of a criminal justice information system. The choice of case study method satisfies needs
for exploration, description and explanation of how strange attractors can be used to study PSN
change (research question 1). Because they include detailed analysis of events and actions case
68
studies best address research questions regarding IS change especially when system change
depends on context and environment (Yin, 1981).
The development of PSNs over many years should provide detailed data on each of the PSN
State Variables and enable a detailed analysis and construction of the PSN’s strange attractor,
but unfortunately, the availability of such data are rare. Therefore the chosen method
compensates for the lack of such data by utilizing process building through narratives (Pentland,
1999; Pettigrew, 1990) and metaphors derived from CAS and Chaos Theory (McBride, 2005).
The method consists of open-ended interviews, systematic narrative construction, coding,
metaphors, validation, and presentation. Each is summarized below and detailed in the sections
that follow.
- Open-ended Interviews
Open-ended interviews aid in linking pieces of evidence and issues to create the narrative of
the events under study. They utilize questions that do not constrain the informant’s thought
processes. Questions ask the informant to explain actions and events or tell stories. Answers to
open-ended questions focus available evidence on important events or situations that require
interpretation. For this study, open-ended questions aim to uncover the state of the PSN by
exploring the different model variables.
- Systematic Narrative Construction
Narratives describe series of chronological events or processes. More than just a historical
account, the narrative uncovers the multiple levels and interconnections of the process.
Constructed narratives are stories that explain the relationship between elements and events of
the process and can lead to a better understanding of process outcomes. A narrative includes
descriptions of the actors, their relationships and their embedded context.
69
This research primarily uses narrative construction to establish the sequence of state
changes in a PSN, but the narrative can also acts to uncover the generative processes and the
“how’s and whys” of PSN change. The narrative can be thought of as an encoding of many types
of data and actions that are relevant to organizational change (Pentland, 1999) or for this
research, PSN change. Narrative construction from informant interviews not only tells a story
but also provides important information on the enactment of the story from the perspective of
the informant (Weick, 1979). When constructing the narrative, contrasting different informant
views of the same event can give valuable insight into the agency context and define the most
influential PSN variables at the different stages of the PSN development.
By using a systematic approach for narrative construction, lengthy interview and archival
data can summarize key aspects of PSN development. The systematic approach distinguishes
between the actions and events identified by the informant (narrator) and his or her
interpretation and presentation of them. The coding section (3.5.3.1) details the systematic
narrative construction approach, from Davidson (1997), used in this research.
- Coding
In constructing the narrative this research codes informant interviews and archival data
based on narrative features from Pentland (1999). Important narrative features are as follows.
Sequence in time. The narrative must clearly represent PSN states sequentially.
Focus on agency and actors. In a complex system, such as a PSN, there are many
interacting agents, including agencies, people, and technology (data, software,
hardware). The narrative must clearly define who or what the informant is
describing.
70
Identify the narrative voice. Each informant’s interview represents a point of view
about a specific state of the PSN. Keeping track of the source of viewpoints on the
PSN development validates the narrative.
Identify the evaluative frame of reference. Informant views implicitly contain
standards against which the informant characterizes and judges the PSN events.
Informant statements regarding description of the problem, goals, or outcomes can
give insight into their evaluative framework.
Other indicators of context. Narratives contain a range of other indicators used to
identify constructs (i.e. embellishment).
As Pentland explains, the narrative is, “basically…a hypothesis about a causal sequence of
events” (p721) therefore, there exists the possibility of inaccuracy or errors. Narrative
construction based on informant’s recollections creates a retrospective event history with
validity risks associated with informant interpretation, recollections (forgetfulness), and bias.
Techniques to minimize this risk include using multiple responsible and trusted informants
((George & Bennett, 2005), p99-100) across all management levels (Myers, 2008). Informants
such as these, provide multiple perspectives on events and behaviors for analysis and
comparison.
Nonetheless, the potential for narrative inaccuracies exist when informant recollections
conflict. This research uses concepts from Pettigrew (1990) to reconcile conflicts by viewing the
interview data from four different perspectives, as follows.
1. Reconcile the narrative by viewing it as a consistent chronological sequence of
events across the organization (PSN), the actors, and the environment. For
71
example, the narrative describes PSN development states at the agency context
while maintaining consistency with external states such as the local economy.
2. Reconciliation includes a diagnostic component. In addition to specifying the
sequence of states for the PSN, the narrative portrays the current strategic concerns
of the agencies and actors in the PSN.
3. Identify concepts or themes that emerge from descriptions of the PSN state. For
example, Chaos Theory metaphors would provide guidance for theme identification
and are present in the terms informants use or the classification of outcomes (as in
the PSN model).
4. Reconcile the narrative across the different informants. Emergent themes must be
consistent with each informants account with inconsistencies analyzed and
explained.
- Metaphors
Metaphors24 help apply theoretical concepts to the study of the narrative. They interpret
the narrative and shed light on underlying patterns or, as in this study, complex socio-technical
phenomenon. Metaphors do not lead to causal conclusions but can map concepts from one
theoretical lens to another domain and provide insight into the important events and factors for
behaviors in that domain (Kellert, 2008). CAS and Chaos Theory based metaphors for IS
development involve looking for general patterns or shifts between semi-stable states that
represent the strange attractor and can be used to detect bifurcations and outcome basins.
Examples of such metaphors representing strange attractors include repeated wrong use of
technology, patterns of resistance, lack of communication, ownership concerns, or inadequate
24
Within this research, all metaphors are considered Conceptual Metaphors allowing for the conceptualization of one mental domain in terms of another.
72
specifications (McBride, 2005). Repeated occurrence of these behaviors indicates an attraction
of the IS to a state lying on the IS’s strange attractor.
- Validation
Validation of the model occurs based on the fit of the variables to the predefined codes and
categories for the model (Kendall, 1999). Achieving variable fit uses a class of grounding theory
techniques involving a priori selection of model variables. Through an iterative process variables
are fit to data until further iterations cause no further refinement of variables or their
assignment (Heath & Cowley, 2004). At this point the variables, model, and data are saturated
and need no additional iterations. The variables and model are verified and the definition of the
variables and model represent the concepts (or theory) that has emerged from the data
(Charmaz, 2006).
The grounded theory technique used in this research for the final validation of the PSN
factors and the PSN state-space model have been widely used in information systems research
(Matavire & Brown, 2008). The iterative process begins with the PSN State Variable definitions
as defined in Table 3.4 and the model in Figure 3.4 and are modified through axial coding (if
necessary).
- Presentation
As a final step after narrative analysis, techniques from synthetic case descriptions (Rihoux,
Joly, & Dandoy, 2008) are used to represent the PSN strange attractor. Narrative codings
diagrammed as a synthetic case description provide a concrete image of the state, and state
changes of the system, representing the strange attractor of the system.
73
3.5.1 Case Study: The Winnebago County Court and Case Management System
The case under study was chosen based on the theoretical concepts used in this research.
Case selection criteria should be driven by research concepts and theories (Gerring, 2007). CAS
concepts were used to develop the PSN State Space Process Model therefore CAS concepts
(Anderson, 1999) are used to determine case study criteria.
The case should have a large number of interacting agents each having a goal (schema) that
drives its actions and behavior. The agents are self-organizing, that is, there is no over-riding
governance mandating how they act and organize. As they interact, they co-evolve by adapting
to changes in their environment and the other agents. Additionally agents can enter, exit, or
recombine within the system creating new agencies or entities. The final criterion for the case is
the existence of sufficient information and case data to construct the initial conditions for the
analysis. Examination of each CAS concept for the case chosen is detailed below.
The PSN chosen for the study is the Winnebago County Integrated Court and Case
Management System (WCCMS)25 located in Rockford, Illinois. The PSN was included in the
Public Safety Network Study survey of 80 United States PSNs (PSN ID #49). Although the PSN
creation was at the local level, it appears to have very strong State level support and received
consideration as a model for further PSN developments in the State. Some of the characteristics
that made this a good choice for study are as follows (based on information in the PSN survey
results).
- WCCMS agencies- interaction and self-organization
WCCMS has a large number of interacting agents. At the micro-level the PSN employs
approximately 1600 people over 9 agencies working together to meet the goals of the PSN.
25
This case study is part of the Public Safety Network Study between Bentley, Syracuse and Penn State Universities. The National Science Foundation under projects IIS-0534877 and IIS-0534889 sponsors the project.

74
WCCMS is self-governing (self-organizing). Governance is only by local agencies (under a county
commissioner) without significant involvement from the State (with the exception of
conforming to State laws). Agencies must specify and negotiate support and development
priorities implemented by a county IT department.
The following agencies make up the PSN:
17th Judicial Circuit Court
Rockford Information Services Department
Rockford Police Department
Winnebago County Communications and Information Services Department
Winnebago County Department of Court Services Adult Probation, Juvenile Probation,
and Detention Divisions
Winnebago County Office of the Circuit Court Clerk
Winnebago County Public Defender’s Office
Winnebago County Sheriff’s Office
Winnebago County State’s Attorney’s Office
- WCCMS Initial State – Combining forces to address a crisis
Winnebago County was in the midst of a severe jail overcrowding problem resulting in a
federal lawsuit regarding inmate conditions. The County Chairman hoped a more streamlined
judicial process and new IOS, known as a Court and Case Management System (CCMS) would
reduce the number of inmates awaiting trial or adjudication and thus reduce the jail population.
He facilitated a new government initiative to improve operational effectiveness and efficiency in
the criminal justice process eventually leading to the development of a new CCMS.
In Winnebago County, courts hear and process over 120 cases in a daily session. As a result,
the new initiative had to move cases much more quickly through the system than the past
system. Additionally, by moving to the new initiative, the County could increase revenue by
utilizing the improved fines and fees collection process and software in the system. The goal for
75
WCCMS is to move Criminal Justice and Public Safety to paperless and streamlined processes,
and control costs.
Efforts began in 2006 on a comprehensive plan to improve justice processes between
agencies including evaluation of their existing CCMS. The county set out to create a more
efficient, integrated system that collects shared information on investigations, civil and domestic
cases, city offenses, county detention, pre-trial supervision, court case processing, and post trial
supervision of both adults and juveniles. The system would create a new level of integration for
the activities, actions and data of many of the agencies (recombination).
Officials initiated the project with a gap analysis that focused on technology, organization,
staffing, and business processes. The gap analysis gave WCCMS a good assessment of their
situation (initial condition) which they then used to plan and implement a new CCMS.
- WCCMS Technology- Meeting goals through new technology
Technically, the task for WCCMS was meeting agency needs and desires to move court data
more quickly through the system and go paperless and streamline costs (goal or schema). To
accomplish this they implemented a new CCMS supporting improved data sharing within the
County and the 17th Judicial Circuit. It included over 150 data sources and a wide range of data
types.
A complete re-design of the CCMS database from case-based data (a record for each court
case) organization to party-based (a record for each individual processed) was done during the
time period studied. Conversion to “party-based” provided the court with complete data on
each defendant (without searching multiple cases) and significantly increased the usability of
the data for agencies such as probation. Conversion activities included porting all files and
databases to “FullCourt Enterprise and FullCase Software” from Justice Systems, Inc.,
76
Albuquerque, NM (JSI). Conversion of over 1.8 million court cases and development 500,000
lines of new code required over 50,000 hours of labor.
The CCMS is integrated with a number of legacy systems and systems from other agencies
including OffenderTrak, CitePay, Traffic School, Office of Illinois Courts, States Attorney, Public
Defender, CAPS (citations, arrest warrants, orders of protection and sex offenders), Bottom Line
(check printing), collections (multiple vendors), PostivePay (bank reconciliation), and VINES
(Victim Information and Notification Everyday). Together the agencies had to adapt to the new
database (co-evolve). Figure 3.7 shows the development timeline.
3.5.2 Case Study Data
Semi- structured face-to-face interviews (of approximately one hour) were conducted with
WCCMS informants representing the IT department, county board, states attorney, public
defender, sheriff, trial court administration, circuit clerk, specialty courts, probation, collections,
and the system software vendor (see Table 3.5). Informants discussed their historical
recollections of events, motivations for participation and reflected on key milestones and
technical and non-technical challenges encountered so far.
On-site interviews, at WCCCMS offices, occurred over three days in March 2012. Two
interviewers were present at all times and all interviews were recorded and professionally
transcribed. Additionally a wealth of archival information provided by WCCMS included
documents such as specifications, project reports, budgets, meeting minutes and notes. Table
3.6 lists archival data used.
Interviews were conducted following the qualitative research guidelines of Myers and
Newman (2007) based on the dramaturgical model of qualitative interviewing. According to the
model, interviews need to be structured and prepared for as if they were a performance or
77
drama. Table 3.7 lists the guidelines for the interviews along with notes from the interviewer
regarding specifics from the WCCMS interviews. Table 3.8 details the interview case protocol.
3.5.3 Coding
Multiple coding steps, falling into two broad categories, narrative construction and narrative
analysis coded the data. The coding method followed grounded theory methods (Charmaz,
2006) consisting of incident-to-incident coding for narrative construction and axial coding for
narrative analysis. Additionally, narrative construction and analysis utilized memoing.
Narrative construction results in a retrospective event history of WCCMS as it attempts to
solve operational problems through the implementation and adoption of a new CCMS.
Narrative analysis codes the narrative and selected archival data establishing the PSN State
Variables and a description of the strange attractor for WCCMS. The researcher performed all
coding and analysis26. The following sections detail each coding method.
3.5.3.1 Narrative Construction
Narrative construction used interview transcriptions and archival documents to create the
WCCMS narrative. Comparison of the incidents and states across all informants was
accomplished using incident-to-incident coding and resulted in codes corresponding to the semi-
stable states of the PSN. Incidents included well-defined events, such as introduction of new
technologies, infusion of resources, or major public safety events, and more subtle events such
as the realization of a common need by a group of individuals. Comparison of incident
descriptions across informants provided insights into the context at the time of the incident and
26
To minimize single coder bias a detailed systematic approach is utilized requiring detailed documentation of coding protocols and resultant coding. This technique establishes consistency across all codings and is particularly important when knowledge of the case domain is needed for detailed coding (Charmaz, 2006). The systematic approach create a reliable instrument for coding requiring only a single coder (Milne & Adler, 1999). Additionally the coder was also an interviewer so “rich clues” in the interview were not lost (Glick, Huber, Miller, Doty, & Sutcliffe, 1990).

78
the perspective of the informant. Initial coding also utilized in vivo codes to identify specialized
terms (or phrases) relating to strange attractors. Specialized terms correspond to metaphors for
CAS and Chaos theory as described in Table 3.9.
Narrative construction required three separate codings of the data. The first coding (1)
created a chronological ordering of the data by CCMS development phase. The second coding
(2) structurally analyzed the interviews by agency and the third (3) coding produced the
narrative.
3.5.3.2 Coding 1 (Narrative Construction): Coding By CCMS Development Phase
Coding 1, the first step in incident-to-incident coding extracted the narrative clauses and
quotations by the relevant development phases of Winnebago’s new CCMS. Definition of
development phases was not arbitrary. Applying theoretical concepts from enterprise wide
systems research to the project documentation from Winnebago County resulted in the phases
of the CCMS development. Basing the development phases on theory gives additional meaning
and background to the actions and events occurring in each phase. The following sub-sections
describe the classification of the Winnebago CCMS27 as an enterprise wide system and compares
the CCMS development phases to enterprise wide systems. It concludes with a description of
the Winnebago CCMS development phases.
- The Winnebago CCMS as an Enterprise Wide System
A CCMS typically consists of database technology for managing court case information
supporting the members of the court, namely, judges, prosecutors, defenders, courtroom clerks,
clerical staff, probation, specialty courts and court IT staff. It contains appropriate technology so
27
To avoid confusion terminology is as follows. “WCCMS” refers to the Winnebago CJIS, a PSN consisting of justice agencies supported by underlying technology. The underlying technology is a CCMS referred to as the “Winnebago CCMS”.
79
judicial agencies can collaborate and share data (Sebutinde, 2003). The technology (hardware
and software) can transform the courtroom but only by combining it with the processes and
users of the court can it be truly effective (Crawford, 2010).
In this sense, a CCMS is a type of enterprise wide system (EWS) where the enterprise is the
inter-agency judicial system supported by the CCMS. Typing a CCMS as an EWS enables CCMS
data coding using accepted theory for enterprise wide system development phases. The
accepted theory chosen is from Markus and Tanis (2000). Their development phases align with
the WCCMS project documentation and provide clear definitions of the phases that will be
useful when coding events and actions to phases.
Markus and Tanis describe five characteristics of EWS common to CCMS. The common
characteristics are used to justify typing a CCMS as an EWS. The following summarizes and
applies each characteristic to the Winnebago CCMS.
Integration. An EWS seamlessly integrates all information flowing in a company into
configurable software system. Similarly, a CCMS integrates all the court and case data
into a software system and database that shareable throughout the justice agencies
fulfilling their needs and uses for the data. Additionally as State laws or statutes change,
the CCMS may need to be re-configured.
Packages. The software for both EWS and CCMS are commercial software packages.
Typically, hardware (computers, communication technology, and storage devices)
purchases support the software and shared data.
Best Practices. Because EWS is inter-organizational, they support generic business
processes that may be different from the way any particular organization does business.
The EWS vendor attempts to implement the best way, or best practice, for different
80
organizational functions. In exactly the same way, CCMS vendors attempt to improve
caseflow management by implementing a software system based on generic judicial
processes that can later be customized for different judicial systems and agencies
(Steelman, 2009).
Some Assembly Required. An integrated EWS consists of common software and a
shared database but may need to interface to any number of hardware, operating,
database, or telecommunications systems. Similarly, CCMS typically reside on different
hardware systems and access national public safety databases such as the Law
Enforcement Agencies Data System (LEADS) and the National Crime Information Center
(NCIC). They may also access other justice systems for data on individuals across
jurisdictions, counties, states, or countries. As in EWS, a CCMS may interface to other
systems using “bolt-on” applications either from third party vendors or as
customizations to the software.
Evolving. EWS are changing both architecturally and functionally. Architectural
evolution includes client-server architectures, service as a system, or cloud platforms.
Functionally the EWS evolves to meet the changing needs of the organization. Similarly,
CCMS architectures are evolving. For example, CCMS database systems are evolving
from “case-based” to “party-based” to meet the needs of all justice agencies.
As shown, within the context of judicial systems, CCMS exhibit the characteristics of an EWS.
Therefore, concepts in EWS development and lifecycles apply to a CCMS defining its
development phases.
- Comparison of CCMS and EWS Development Phases
In addition to defining the characteristics of an EWS, Markus and Tanis (2000) define four
phases of EWS development; chartering, project, shakedown, and onward and upward. As
81
Markus and Tanis state, “Each enterprise system experience is unique, and experiences may
differ considerably. . .” (IBID, p.189), therefore use of their development phases requires
modification for use with the Winnebago CCMS development. Definition of each Markus and
Tanis phase and modifications for Winnebago CCMS are as follows28.
Chartering Phase. The chartering phase involves the decisions and actions up to the
funding of a EWS. For Winnebago County the chartering phase started when it
contracted an outside consulting company to evaluate (against other court’s CCMS) the
processes and procedures, and effectiveness and efficiency of their existing CCMS. This
was their needs assessment phase. Following the needs assessment phase, CCMS
agency members developed a detailed system specification resulting in project funding
(corresponding to the end of the EWS chartering phase). Therefore, for the Winnebago
CCMS development the chartering phase divides into two sub-phases; needs
assessment and specification.
Project phase. Implementation activities prior to system launch define the project
phase. For Winnebago County, the choice of the software vendor preceded the
implementation of the system. This was a separate development phase for them
because it was their first attempt at an integrated CCMS and was a major task unto
itself. Following the project implementation phase was the initial launch, or “go-live” of
the system. Therefore, for the Winnebago CCMS development, the project phase also
divides into two sub-phases, vendor selection and implementation.
Shakedown phase. The shakedown phase covers the time from initial EWS launch to the
achievement of normal or all intended operations. For the Winnebago CCMS
28
Project information and presentations from Winnebago archival data (Gentner & Sego, 2011; Winnebago, 2011) is used to derive the Winnebago development phases.

82
development this phase began with their successful “go-live” (initial launch) and is
currently ongoing. It is their post-“go-live” phase.
Onward and Upward phase. The use of the system from normal operations until
substantial upgraded or replacement defines the onward and upward phase. For the
Winnebago CCMS the onward and upward phase has yet to occur (at the time of this
study). For the purposes of this research, this phase is an exploration into possible
future scenarios or outcomes for the Winnebago CCMS development. It is their futures
phase.
In addition to the Winnebago CCMS development phases derived from Markus and Tanis,
one additional phase is required. As a complex system development, the CCMS development
will be very dependent on its context and in particular the initial state of the system. Initial
conditions define the starting point for constructing a state-space description (Kellert, 1993).
For the Winnebago CCMS initial conditions are included as a phase preceding the needs
assessment phase. This phase has no time associated with it, but rather defines the state of the
system at the start of development.
Figure 3.8 shows the resulting phases for the Winnebago CCMS and its relationship to the
Markus and Tanis EWS phases. The next section details the specifics of each phase and its
coding.
- Development Phase Coding
Coding for each phase consists of the assignment of informant narrative clauses (phrase,
sentence, or paragraph) to one of the development phases. Development phase coding results
in chronologically sequenced narrative clauses. This coding was done using NVIVO9 allowing for
the assignment of narrative clauses to each phase and organizing the codings by informant.
83
NVIVO9 was the chosen coding tool because of its ease in extracting and grouping narrative
clauses into separate files associated with development phases.
Coding consisted of two types of clauses, narrative and non-narrative. For example,
narrative29 clauses describe actions and activities and imply a progression through time, such as,
“. . . in 1999 we implemented the JANO system.” - Information Technology Manager,
DoIT.
Non-narrative clauses provide information about the state of the Winnebago CCMS
development or WCCMS, such as,
“. . . the interaction between ourselves and the Public Defender’s office and especially
the Clerk’s office needed to be improved and this was one of the ways we answered that
by going to this new vendor.” - State’s Attorney.
Both types of clauses give meaning to actions and events in the phases. The definition of each
phase, specific to Winnebago CCMS development is as follows.
Initial Conditions phase. The event that motivated of the Winnebago CCMS
development was the attendance of the County Chairman and Circuit Clerk at the June
2004 Northeast Circuit Clerks Annual Meeting. It educated both on the deficiencies of
their system and spurred them to act (initiate a GAP analysis). Although the Meeting
occurred in June 2004, the Winnebago CCMS development did not proceed until six
months later when the Chairman received approval to do the GAP analysis. Statements
that refer to the Winnebago CCMS prior to January 2005 are included in this phase.
29
Narrative clauses depend on strict sequential ordering for their meaning. Nonnarrative clauses include summaries, orientations, contextual information or evaluations (Davidson, 1997).
84
Needs Assessment phase/GAP analysis. Winnebago County assessed the needs of their
judicial system by contracting a third party to perform a GAP analysis30. The period for
this phase was January 2005 to February 200631, starting with the attendance of the
County Chairman and Circuit Clerk at the Northeast Circuit Clerks Annual Meeting and
ending with the recommendations from the contracted GAP analysis consultants.
Statements referring to facts or perceptions by the informants related to this phase
code as “GAP”.
Specification phase/Systems requirements definition. The major outcome from the
GAP analysis was the need to replace Winnebago’s existing CCMS software. As a result,
Winnebago County embarked on a detailed system specification phase to develop a
systems requirements document (SRD). This phase concluded with the County’s
approval of the project (and funding) for the new CCMS and spanned February 2006 to
December 2008. Statements referring to facts or perceptions by the informants related
to this phase code as “SRD”.
Vendor Selection/Request for proposal. Following the development of the SRD and
approval of the project Winnebago was facing the challenge of choosing a CCMS
software vendor that could provide the functionality they desired and produce a system
under the approved timeframe and funding. This phase begins with the approval of the
project (January 2008) and ended six months later with the execution of a contract with
the chosen vendor (June 2008). Outcomes from this phase included a request for
proposal (RFP), and vendor evaluations and negotiations. Statements referring to facts
or perceptions by the informants related to this phase code as “RFP”.
30
Informants sometime refer to “GAP analysis” and other times the “GAP study”. Both represent the analysis done by the outside contractor. 31
Timeframes and dates are researcher derived from the WCCMS project plan (MS Project) and presentations (Gentner & Sego, 2011; Winnebago, 2011).
85
Implement Phase. The implementation phase of the CCMS development began with
the execution of a contract between the CCMS software vendor and Winnebago County
(June 2008). This phase continued until the first launch of the new CCMS (“go-live”) on
November 15, 2010. Statements referring to facts or perceptions by the informants
related to this phase code as “SysImpl”.
Post “go-live”/Enhancements. After the initial launch of the CCMS Winnebago County
and their software vendor were involved in fixing bugs, configuring, and enhancing the
new CCMS. This phase is ongoing; the system is in use, operational, and undergoing
enhancements. For the purposes of this research, informant interviews in March 2012
mark the end of this phase. Statements referring to facts or perceptions by the
informants related to this phase code as “Enhancements”.
Futures. Capturing statements made by informants that refer to the future of the CCMS
provide scenarios for the continued evolution of the system. Memoing identified the
narrative statements regarding futures but they were not specifically coded into a
futures file. These coding differs from previous codings because they are opinions of
the informants and are not reconstructing historical events. Instead, codings are
interpretations by the researcher.
At the completion of coding 1, six files were created containing all the narrative clauses
pertaining to each phase of the development. A second round of coding further analyzed this
data.
3.5.3.3 Coding 2 (Narrative Construction): Structural Analysis
In this coding phase, structural analysis of interview data by agent establishes the actors,
context problems, goals, actions, and outcomes in each development phase. Coding and
interview analysis was based on the method developed by Davidson (1997) during her field
86
study of three information system projects. This method was chosen because of its application
to information systems as well as Davidson’s research goal of understanding participant’s
communications of knowledge, assumptions, expectations, and negotiations regarding the
information system requirements. The method is based on narrative feature analysis as
previously described (Pentland, 1999). Additionally, from a complexity perspective, Davidson’s
research goals are analogous to interactions between agents, initial state conditions,
motivations (schema). Therefore, the method is appropriate for a complex analysis of WCCMS.
Davidson’s method involves the systematic analysis of interviews using eight categories,
Narrator’s abstract, Narrator’s perspective, Orientation/contextual descriptions, Actors,
Problematic situation, Goal/problem solution, Actions and Events, and Outcomes. The method
involves populating a structural analysis table with narrative clauses applicable to each category.
Table rows correspond to each of the eight categories. Table 3.10 describes the table and
categories.
Structural table creation was for each WCCMS agency and for each development phase.
Narrative clauses belonging to agency informants, included comments related to the
development phase, populated the tables. The coding resulted in forty-three (43) structural
analysis tables. Because not all agencies made statements for each development phase (or
were not involved in the phase), structural analysis does not include tables for all agencies
across all phases. Table 3.11 shows the agencies that had statements resulting in a structural
analysis by development phase. Detailing all 43 tables is beyond the scope of this report
therefore a representative table describes the method for one table.
- Coding 2 Example: Structural Analysis of the County Chairman’s Narrative on Needs
Assessment
87
In response to a question regarding the evaluation of the CCMS in use, prior to the new
CCMS development, the Winnebago County Chairman responded with his experiences and
perceptions of events that led to the decision to develop a new CCMS. Structural analysis
reconstructs the sequence of events and its context as described by the informant.
Considerations of the narrator’s context, description of the problem, and goals results in the
assignment of meaning to the narrative and the extraction of sequences of events. A
understanding the implicit meanings of event descriptions results in construction of a richer
narrative of the entire process. Events comparisons across narrators looked for coherence and
common themes (or lack thereof). Table 3.12 shows the structural analysis table from the
County Chairman regarding the needs assessment phase of the CCMS development. Details of
the table and its analysis are as follows.
Narrator’s abstract. The Narrator’s abstract provides information on the scope of the
statements by the informant. Although sets of statements arrangements are by
development phase, informants may limit or stress different part of the phase. The
Chairman summarizes the events pertaining to the GAP analysis spanning the needs
assessment phase.
Narrator’s Perspective. The narrative’s perspective includes any narrative clauses
revealing the narrator’s state of mind at the start of the phase. The Chairman’s
perspective shows dissatisfaction with the existing CCMS (JANO32) indicated by the
comments, “we were never getting anywhere” and “(agencies) didn’t like it and didn’t
use it” because of clerk-centrality. Clerk-centrality of JANO represents a theme heard
from other informants. Additionally, he makes statements regarding the County Board
32
Informants refer to the existing CCMS at the start of the development as JANO. This is an acronym for the company that produces and sells the CCMS. The actual name of the software product is “Clericus Maximus”.
88
indicating he believes he knows how to work with them and implicitly sees himself as
the conduit to the Board. Not stated in the interview (but included in the table) is the
Chairman’s position as an elected official and his need to maintain public approval of his
actions. All these clauses, together, constitute his perspective.
Orientation/Contextual Descriptions. The Chairman has prior experience with CCMS
systems and in particular, ones that have failed. He is committed to solve problems
with the CCMS and states his commitment with, “you have to stay committed because if
it doesn’t stay there at the top it will fall apart.” Clearly, at this point in the CCMS
development there is strong buy-in and support from the Chairman. Furthermore, the
Chairman re-asserts himself as a leader of the project by stating his success on the jail
project and the comfort the Board has in him. Additionally, he states the project started
with the GAP analysis and re-iterates that he expects the outcome to be a new CCMS.
Actors. This section defines the individuals or groups pertaining to the Chairman’s
comments.
Problematic Situation. In this section the Chairman lists WCCMS problems needing
solutions, namely, agencies on different systems (“The fact that we had software and
the state’s attorney was using different systems and the clerk and then court services,
the sheriff, and on and on.”), the lack of communication among agencies (“They’re right
across the hall in many cases and had no idea what one office operates versus the
other.”), and poor data output from the existing system (“We weren’t getting good data
. . .there was no data. . .”). He notes the uniqueness of a “party-based” CCMS, but
does not see remaining “case-based” as a problem.
Goal/Problem Solution. The Chairman indicates that the GAP analysis was very
important to solving the problems (“. . . agreeing to the gap study was key.”). The GAP
89
analysis is not the solution to WCCMS’s problems but plays a role in the solution and
how it integrates with other actions will be important. The GAP analysis is part of a
sequence of events that provide a solution. Additionally, the Chairman states some
goals he sees for the project, including becoming paperless and creating a “world-class
system”.
Actions and Events. The Chairman lists two events that occurred during the needs
assessment phase, the hiring of Management Consultants, LLC (MTG) to do the GAP
analysis, and executive team meetings. These actions when combined with actions
described by other informants create the sequence of events in the needs assessment
phase.
Outcomes. The Chairman describes two types of outcomes. First, he describes a very
tangible outcome, the results of the GAP analysis (both the gaps in the system and the
estimated project scope and costs) and second, a less tangible outcome regarding the
problem with the existing system (“our court case management system was built for the
clerk but not for the other agencies of the criminal justice system”). These statements
suggest further actions by him. Analysis of succeeding development phases searches for
similar comments from him or other informants.
Using the structural analysis table from the needs assessment phase, the sequence of
events and the potential changes (or stability) in the WCCMS state, from the Chairman’s
perspective, can be determined. For example, he perceives clerk-centrality as a long-standing
problem with the existing system indicating stability in this factor. In contrast, he experienced a
lack of communication between agencies but noted the initiation of executive meetings during
this phase. Potentially a state change in the relationships factor is occurring during this phase.
A full picture of the narrative for the Winnebago CCMS development emerges by comparing and
90
combining this structural analysis table with those from other agencies. Narrative construction
uses the comparison of the agency structural tables to create the narrative.
3.5.3.4 Coding 3 (Narrative Construction): Creating the WCCMS Development Narrative
Reconstruction of the available data to create one history or story of the Winnebago CCMS
development creates the narrative. It is more than just a coding task. Narrative construction
entails comparison of the structural analysis tables for development phase and each agency
using an iterative process. It consists of extracting the sequence of events and actions for the
CCMS development followed by an assignment of meaning to each event. Concepts introduced
previously, from Pettigrew (1990), were used to reconcile inconsistencies regarding
recollections across informants. Construction of the narrative and reconciliation of
inconsistencies included analysis of coherence of informant accounts of events, contexts, and
informant perspectives, detailed below.
- Extraction of Sequence of Events from the Structural Analysis Tables
Comparing information contained in the structural analysis tables on WCCMS problems and
needs, potential solutions, actions taken and the resulting outcomes results in the sequence of
events for each development phase. The technique is similar to Davidson’s (1997) narrative plot
sequence generation method with the exception that it is structured consistent with a system
view of the events specifying an input (problem, potential solutions), a transformation (actions
and events) and output (resulting outcomes). The following details the process.
1. Listing the actions and events for each table in chronological order. Chronological order
can be obtained by examination of the context of each statement or in some cases may
involve research into archival data to obtain the exact time or date associated with the
event. Archival data dates events such as contracts, “go-lives”, or other milestones.

91
Single events result by combining repeated or similar events attributed to multiple
agencies.
2. Associating the problematic situations and solutions to each event, while maintaining
the source (agency) of the problem. Single problems and solutions result by combining
repeated or similar problems and solutions attributed to multiple agencies.
3. Associating outcome(s) to each event, while maintaining the source (agency) of the
outcome. Single outcomes result by combining repeated or similar outcomes attributed
to multiple agencies.
In addition, this step assigns meanings and contextual information to each event. Meaning and
context determines WCCMS State variables when the narrative is complete.
- Assigning Meaning to Extracted Events
The assignment of meaning to each events involves consideration of the local, global, and
themal coherence of the statements in the structural analysis tables (Davidson, 1997).
Examining coherence uncovers aspects of the structure and content of the informant’s
statements and used to uncover commonalities or differences in recollections of events.
Commonalities and differences in accounts can directly relate to stability or changes in states
that will determine the strange attractor of the WCCMS.
Statements exhibiting local coherence string events together or qualify perspective or
context. Local coherence helps determine subjects of statements and reduces ambiguity
between agent’s statements regarding similar events. Many times generating local coherence
requires going back to the interview transcript for clarification.
For example, in the specification phase the public defender stated, “We have had a lot of
people come and go throughout that time but we’ve had a pretty significant presence from all

92
the major players.” Ambiguity exists in the meaning of the personal pronoun “we” used in the
statement and its use in “we” and “we’ve”. Obtaining local coherence requires going back to
the interview and looking at the context of the statement. It was determined the first “we”
referred to all the personnel in the justice system and the second “we” referred to the working
team creating the SRD.
Similarly, local coherence can link different events. During the implemention phase one
informant responded, referring to the schedule slip of the initial system launch,” I think if it was
an election year or something, then there may have been some elected officials that may have
been a little more concerned.” Obtaining local coherence in this statement required noting the
link or correlation of the importance of a schedule slip to an election year. Therefore, narrative
construction involved tracking and documenting election years.
Global coherence refers to the how the informant’s make sense of events and actions, what
meaning it has to them, and the key assumptions or context used to attribute that meaning.
Examination of global coherence can add richness to the narrative when used to examine
common or different meaning for events.
For example, a recurring statement from all agencies (throughout almost the entire
development project) was the cooperation among all the working team members. Repeatedly
comments were made about “teamwork”, “collaboration”, “helping each other”, and “good for
the whole”. These statements become globally coherent by coding the considerable effort
spent during team meetings educating team members on the intricacies of the agency
operations. The narrative becomes richer by including the important detail about working
meetings involving education not just reporting of status.

93
Similarly, analysis of global coherence can add to the richness of the narrative when
informant statements about actions and event differ. During the post-“go-live” phase of the
CCMS development, DoIT estimated that approximately 60 to 80% of the CCMS was completed,
whereas JSI (the software vendor) estimated “almost all” was completed. Searching for the
meaning behind each statement revealed DoIT considered configuration of the system in their
definition of complete, whereas JSI referred to implementation of the software only. When
constructing the narrative, global coherence regarding these statements contributed
information regarding the completeness of the software, the usefulness of the system
(configurations) and the need to invest more resources in further configuring.
Themal coherence refers to the repeated assumptions, beliefs, and goals stated throughout
the interviews. The previously mentioned statements about teamwork would have global
coherence because they are repeated beliefs of all the agents. Examples of additional themes
that are present throughout the interviews include clerk-centrality, resistance to change, or the
adversarial nature of agencies in judicial systems. Themal coherence is important in narrative
creation because it can highlight potential changes in state leading to bifurcations or stability,
indicating outcome basins.
By extracting all events and actions from the structural analysis tables and then
supplementing them and adding richness to their descriptions by considering local, global, and
themal coherence a complete narrative was constructed. The narrative for the Winnebago
CCMS development is included in Appendix D. Then, with the narrative constructed, axial
coding techniques extract and analyze the states and factors constituting the strange attractor.
The next section describes this technique.
94
3.5.3.5 Coding 4 (Narrative Analysis): Extracting States and Variables – Axial Coding
Narrative analysis includes multiple codings of the narrative and selected archival data
matching narrative clauses to state variables. Developed protocols for each coding targeted the
PSN State Space Variables (Table 3.4) and CAS and Chaos Theory metaphors (Table 3.9). Axial
coding method constructs the narrative over multiple passes. Along with axial coding memoing
provides additional information to the analysis process. Memoing, described below, follows the
axial coding method employed in this study.
- Memoing
Memos are included throughout the coding process. Memoing concentrated on identifying,
developing and identifying CAS and Chaos theory metaphors (Table 3.9) and description and
decisions regarding assignment of a narrative clause to a state factor. Organism and brain
metaphors are the basis for memoing and interpretation of information system developments
(Carlsen & Gjersvik, 1997; Schmitt, 2005; Walsham, 1991). Both of these metaphors provide
guidance on how to create and code for a CAS and Chaos Theory metaphor.
An organism metaphor considers process models that resemble open system organizations.
Using socio-technical and contingency theory, it views IS as adapting to their external
environment. For example, IS adapt by using ICT as a technical sub-system supporting
communication, coordination, and cooperation of social sub-systems. The information system
exists as a species or in different configurations.
The brain metaphor focuses more on the learning capabilities of the system. Aspects such a
integrating the information system with organizational learning is considered as well as
intentional aspects such as goals and the importance of roles. Interactions of actors are

95
important in this metaphor leading to a system that is more than the sum of its parts and is
capable of self-organizing.
In this study, the combination of organism and brain metaphors produces a code-able set of
CAS and Chaos Theory metaphors. For example, when adaption and interaction action are
combined with CAS fitness function concepts the metaphor of agents “hill-climbing” to meet
system level goals is produced (Kauffman & Johnsen, 1991; Langton, 1990).
- Axial coding method
Whereas the incident-to-incident coding breaks the data into separate pieces and codes, by
incident, axial coding brings the data back together in the form of categories and subcategories.
Axial coding reveals the values for the factors for each interview, which when combined with
the narrative provides a sequence of state variable values describing the strange attractor for
the WCCMS. Coding required five documented steps33 although each step was iterative in itself
requiring multiple passes through the data.
The aim of each step is to construct a set of factors and associated coding that fits each
narrative clause to a PSN State Variable. Coding of factors to narrative clauses may not fit or be
ambiguous. Non-fit or ambiguities are resolved by modifying assignment of narrative clauses to
state variables and/or the state variables and/or PSN State Space Model (this study refers to the
process as iterative axial coding). Modifications descriptions are part of the findings (3.6.1)
section. Iteration continues until the factors and model fit, there are no ambiguities, and
further coding reveals no additional insights. Coding saturates (or is saturated) when this
occurs.
33
Documented axial coding protocols result when coding results in a change to the state variables or the model.
96
Techniques and processes from Strauss and Corbin (Kendall, 1999)34, in the “style” of
Grounded Theory, are used for axial coding. According to Straus and Corbin, when strictly
adhering to Grounded Theory development categories emerge exclusively from the data. An a
priori knowledge of the data or concepts under study (i.e. using predefined categories) does not
necessarily need to be excluded from a Grounded Theory approach and may actually be more
appropriate for verifying a model (Jones & Noble, 2007). The axial method used is in the “style”
of Grounded Theory because is closely follows Grounded Theory but does not strictly adhere to
it. The method in this research uses existing coding categories from Williams, et al. (2010) as
the starting point for axial coding.
Axial coding consists of multiple coding passes through the WCCMS narrative. The first
coding pass consisted of assigning one of the initial PSN State Variables (Table 3.4) to narrative
clauses describing actions, events, perceptions, and behaviors. The coder assigns PSN State
Variables to narrative clauses based on his/her assessment regarding best fit for the clause.
Using Strauss and Corbin’s paradigm model the conditions, interactions, strategies and
consequences of the clause determine best fit. The coder focuses on assigning a PSN State
Variable to a narrative clause in terms of the conditions that give rise to it, the context in which
it was embedded, the strategies by which it was handled, and the consequences of those
strategies (Jones & Noble, 2007; Matavire & Brown, 2008). Memos describe the fit of the
clauses. An example, below, illustrates the method.
In describing the working teams in the CCMS project, the narrative contains the following
clause,
34
The axial coding method closely follows the method description by Strauss, A. and Corbin, J. (1998), Basics of Qualitative Research: Techniques and Procedures for Developing Grounded Theory, 2nd ed., Sage, Thousand Oaks, CA. as described in the cited literature.

97
“The philosophy in creating the team was to both elicit inputs on the specific practices of
each agency, as they applied to a CCMS, and to educate the members on the practices of the
other agencies. Weekly meetings included detailed reviews of specific justice processes and
procedures and reviews of the existing SRD.”
Three codings result from the clause. First, the sentence, “The philosophy in creating . . .
practices of the other agencies”, best fits the endogenous environmental rule under strategy
and vision because WCCMS has a vision of creating a cross-agency working team that specifies
and educates members on the practices of each agency. However, the best fit is not really a rule
(like a mission statement) but rather, as stated, a philosophy. Memoing indicates this is more a
factor than rule and endogenous environment factors need expansion to include philosophical
or visionary factors (which initially it does not include). The second pass of axial coding involves
evaluating the memo and comparing it with other codings of endogenous environment,
strategy/vision to see if a new factor needs to be added (i.e. endogenous environment factor,
culture/vision).
Second and third codings refer to the weekly meetings and processes in the meetings,
“Weekly meetings”, and “detailed reviews of specific justice processes and procedures and
reviews of the existing SRD”, respectively. Initially these would be coded under
processes/shared service/relationship and processes. Memoing would note that the
relationship and process is in relation to the CCMS project and not the actual services provided
by the agencies. Therefore, memoing would indicate that there may a need for factors and rules
differentiating agency services and relationships in general (adjudication) and those specific to
the CCMS project.
The process of assigning narrative clauses to variables and modification of variables
continues until no further modification of factors is required and the coding saturates. As stated
previously achieving saturation may require modification of the assignment of narrative clauses
98
to variables, the variables themselves or the PSN State Space CAS model. The resulting WCCMS
State Space CAS model, WCCMS State Variables and the assignment of narrative clauses to the
Variables constitutes the outcome of axial coding.
3.5.3.6 Coding 5 (Narrative analysis): Synthetic Case Description
Grounded Theory techniques involve the diagramming of axial codings providing a concrete
image of concepts and ideas regarding the system under analysis ((Charmaz, 2006), p117).
Diagramming is a visual representation of the categories and their relationships throughout the
narrative description of the case. There are many types of diagrams, including maps, charts and
figures. For this research, the type of diagram chosen is a synthetic case description.
Synthetic case description (SCD), for the period under study, elaborates all the narrative’s
state variables values and can be read at once, using one single page tabular diagram (Rihoux, et
al., 2008). Because the narrative is a chronological history of events and actions each coded
narrative clause can be assigned a time. Additionally, each coded narrative clause can be
assigned a value based on its content. For example, the attendance of the County Chairman at
the NE Clerks Annual Meeting codes to state variable “Critical Events”, value “impactful”
(because it marks the start of the development), and time November 2004 (when the Meeting
occurred).
In SCD, symbols visually represent assigned values. Therefore, a tabular SCD’s columns
represent the sequential measure of the coding (i.e. time, calendar time, months, or years) and
the rows the variable value symbols describing the state of the system. In this research,
graphing utilizes an Excel table where rows and columns represent the horizontal and vertical
axis. Symbols placed at the intersecting cell of the row and column of the table represent the
value of the factor at that specific time.
99
Because the SCD is a diagram of the states of the system, it closely resembles the system’s
strange attractor but since diagramming is not in state space, it is not an exact representation.
The discussion section (3.8) describes the use of the WCCMS SCD to generate its strange
attractor.
3.6 Findings
Three findings resulted from narrative construction and analysis of the Winnebago CCMS
development.
1. Axial coding did not saturate using the PSN State Variables and the PSN State Space
CAS Model.
2. Modification of both the PSN State Variables and PSN State Space CAS Model to a
WCCMS State Variables and WCCMS State Space CAS Model did saturate, and
3. The SCD, using axial coding results, produced a representation of the WCCMS
strange attractor.
The following sections detail all three findings.
3.6.1 Modification of the PSN State Variables and PSN State Space CAS Model
As stated in the method section the assignment of values to the PSN State Space Variables
used in the PSN State Space CAS Model is determined through an iterative axial coding process
and customization of both factors and model until they saturate ((Charmaz, 2006), p113). For
WCCMS, both required modification. Examples of some of the modifications are given below.
Initial coding of the narrative using the PSN factors in Table 3.4 detected ambiguities for
variables. For example, the narrative clause, “. . . on June 28th, 2006, the County Board
unanimously approved a $6.7 million project for a new CCMS . . .” represents adequate funding
for the CCMS development project but at the same time the County operates under a deficit
100
with funds diverted to the new jail. On a CCMS project basis, the factor Endogenous
Environment Factor/Resources/Funding could code as adequate (based on the project funding)
but from an operational basis, it would be inadequate (because of the diversion of operational
funds to the jail). Ambiguity resulted in the possibility of coding the narrative clause in two
different ways. Similarly, narrative clauses indicated that staffing was sufficient for the CCMS
project, but informants also recalled the court’s lack of staff was creating very high caseloads.
The PSN factor Endogenous Environment Factor/Resources/Staffing was ambiguous.
Ambiguities of this type revealed that there were two ongoing processes at WCCMS, one
process was the daily court operations and the other was the CCMS development process.
When these processes conflicted, the coding of the variable was ambiguous. Without
refinement of either the model or variables, the coding process could not reach saturation.
Emerging from the analysis was the need to modify both variables and model, and make
them specific to WCCMS. Modifications transformed the PSN State Space CAS Model to the
WCCMS State Space CAS Model and the PSN State Variables to the WCCMS State Variables. The
following sections describe both modifications.
3.6.1.1 The WCCMS State Space CAS Model
During the period under study, WCCMS had two agency level processes occurring, court
proceedings and development of a new CCMS. The two processes occur together because of
the need for the Winnebago County courts to maintain fairness and just adjudication of cases.
Adoption of a new CCMS (by a court) cannot be partial or applied to only some cases. The CCMS
launch must occur across the court at the same time for all court cases. Until the launch, court
operations and CCMS development occur in parallel. For WCCMS, since the same agencies and
staff support both processes, the PSN State Space CAS Model, depicting only a single level of

101
interactions of agents, process, and environment, does not represent the situation. In reality
there are two processes occurring simultaneously.
As a CJIS, the primary function of WCCMS is to adjudicate criminal cases. WCCMS agencies
(except DoIT and the Sheriff) constitute the 17th Circuit Court and exist within a Court Context
subordinate to the State of Illinois. Within the Court Context, each agency exists as interacting
entities with their separate rules (i.e. charters, missions) and factors. This represents a separate
Agency Context below the Court Context. The new CCMS development is at the Agency Context.
Because the Agency Context is subordinate to the Court Context, the WCCMS State Space CAS
Model must incorporate three levels or contexts, the State (external environment), Court
Context and Agency Context. Figure 3.9 shows the WCCMS State Space CAS Model updated to
represent each level and the dual court and CCMS development processes.
With a new model, a new set of state variables also needs generation. The exogenous and
endogenous Court Context and the CCMS project need new variables as well as modifications of
the endogenous agency context. The next section describes these modifications
3.6.1.2 WCCMS State Variables
PSN State Variables lack specificity for a CJIS because they describe a collaborative network
and supporting IOS for police-oriented PSNs. No variables exist to describe the CJIS at the Court
Context. Therefore, the PSN State Variables need expansion to include the Court Context.
- Variables for the Court Context
For the Court Context variables are based on the report of the National Center for State
Courts, Achieving High Performance: A Framework for Courts (Ostrom & Hanson, 2010). The
report’s High Performance Court Framework identifies the key administrative principles defining
the fair and effective practices in handling court cases and treating litigants, while maintaining
high performance operations and communicating that performance through metrics and
102
measures. It defines a set of variables for evaluating a court’s performance and consequently
applies to this research.
Ostrom and Hanson (2010) show operational metrics and technology are not the sole
descriptors of court efficiency and effectiveness, but are largely dependent on social aspects
such as culture and public perceptions. Court characterizations using their High Performance
Court Framework links values, court culture and performance variables. It uses their analysis of
State courts across the United States, The International Framework for Court Excellence35, and
court performance and measurement standards36.
The variables from the Framework replace the PSN Endogenous Environment Factors and
Processes (Collaborative Network), specifically describing the Court Context. New variables
include Court Culture, End-User Performance, Internal Operations, Performance Management,
and Social Value. Variable’s descriptions are as follows.
Court Culture. The structure of US trial courts inhibits agency collaboration regarding
how best to administer the courts. Judges control the day-to-day activities of the court
but there is minimal hierarchy of authority with judges, who are essentially all equal in
status with strong individual control and autonomy over cases. Adjudication is the
primary goal for a judge rather than establishing work environments, policies or
organizational goals. Therefore, courts depend on consensus building, outside the
courtroom, to reach mutually agreeable collaborative decisions. Courts build a court
culture that is conducive to collaboration based on the degree of solidarity and sociability
between the justice agencies.
Two factors describe the court culture as follows.
35
The International Consortium for Court Excellence, http://www.courtexcellence.com/ 36
The National Center for State Courts, Courtools http://www.courtools.org/

103
o The degree of solidarity is the extent to which justice agencies understand goals,
mutual interests, and common tasks. Narrative clauses referring to consensus,
cross-agency education, and cooperation represent high solidarity.
o The degree of sociability is the extent to which court personnel acknowledge,
communicate and interact with one another. Narrative clauses referring to
cross-agency meetings and teamwork represent high sociability.
The Framework uses the combination of solidarity and sociability factors to classify a
court as one of four types of court cultures.
o Autonomous (low solidarity, low sociability). Judges have wide discretion to
conduct business. An adversarial environment would be an indicator of an
autonomous culture.
o Hierarchical (high solidarity, low sociability). Established rules and procedures
are important for meeting court objectives. Hierarchical cultures are indicated
when rules and procedures describe court operations.
o Communal (low solidarity, high sociability). In these type courts, it is important
to “get along” and act collectively. Existence of agreed upon norms would
indicate a communal court.
o Networked (high solidarity, high sociability). In these courts agent inclusion and
coordination establishes a collaborative work environment. An indicator would
be the existence of operational policies but not hard and fast rules.
WCCMS narrative clauses code to each development phase representing solidarity and
sociability, followed by classification of the type of court culture (based on the solidarity
and sociability codings).

104
End-User Performance. The End-User perspective focuses on the person, company, or
other entity that directly receives the goods or services produced by the court. End-
users are concerned with the court activities (how they are performed) and their
consequences (fairness) and are represented by two factors.
o Procedural satisfaction is the degree to which end-users (litigants, jurors, and
witnesses) believe courts serve fair and equal justice. Indicators of procedural
satisfaction include access to courts, schedules met, and consistent rulings.
o Effectiveness is the degree to which end-users believe cases are timely,
predictable and complete in resolution.
Surveys or interviews with the end-users measure procedural satisfaction and
effectiveness. For WCCMS there were no interviews or surveys with end-user of the
courts, so there are no direct codings in the narrative. Instead, informant’s recollections
and opinions regarding the end-user perspective on the courts code to these variables.
Internal Operation factors describe the courts treatment and control of its caseload. If
backlogs or bottlenecks exist then the cases suffer from excessive waiting time and
potentially inconsistent treatment by the court. Internal operation factors included
efficiency and productivity.
o Efficiency represents the effort to achieve task and utilization of resources.
Comparison of court output compared to standard (or average) output measures
efficiency. For WCCMS, the case clearance rate (filings for a year divided by
deposed cases for the year) represents efficiency.
o Productivity measures the number of cases completed as a function of the
resources of the courts. A complete examination of productivity is beyond this
research (this is a separate research agenda for courts) but for this study annual

105
number of cases closed divided by the number of judges presiding estimates
productivity.
Performance Management involves the knowledge and skills necessary for the court to
adapt and describes the ability of the court to change state. Four categories described it
within the Framework.
o Technology Capital refers to technology in use, its degree of currency (new,
legacy), and degree of alignment to business goals and maintenance support
required. Technology aligning to WCCMS goals (like the CCMS under
development) would represent high Technology Capital.
o Information Capital measures the depth and quality of court and case
information available to the agencies. An indicator is the organization of the
court and case database, namely, “party-based” versus “case-based”. “Party-
based” databases would exhibit higher information capital because it integrates
numerous cases and data for each party whereas “case-based” fractures party
information among numerous court cases.
o Organizational Capital refers to degree of internal and external coordination of
resources. An internal indicator would be the caseload of each court with high
caseloads representing low coordination of resources. An external indicator
would be upper level management support. High management support
corresponds to high organizational capital.
o Human Capital is the degree of belief among court agents that they contribute to
court functions. For example, a highly clerk-centric CCMS would exhibit low
human capital because the CCMS constrains non-clerk agent’s contributions to
the court.
106
The Social Value factors for courts involve the perspective of the public and policy
makers that are not operating within the court (as an agent or end-user). They express
their opinions through elections, interests groups, and funding. The Framework
represents social value through two factors, adequate funding and public trust and
confidence.
o Adequate funding occurs when the courts have necessary resources and typically
results from the publication of court results (statistics) or reports. Funding of a
new CCMS would indicate that the public and policy makers assign social value to
the CCMS. Funding codes as adequate based on actual funding of the CCMS
project and informant opinions as expressed in the narrative.
o Trust and Confidence refers to the degree to which public believes judges and
managers are performing their jobs as intended. Although similar to procedural
satisfaction, it does not originate from end-users, but rather from public
perceptions and expectations. Typically, surveys or focus groups measure trust
and confidence. This data are not available for WCCMS, therefore trust and
confidences are not included in the State Variables.
Table 3.13 summarizes the Court Context WCCMS State Variables. In addition to WCCMS State
Variables for the Court Context, the CCMS Project (occurring simultaneously) requires its own
set of variables at the Agency Context. The next section describes these variables.
3.6.1.3 CCMS Project-level Factors
The CCMS project variables characterize the actions and behaviors of the Winnebago Justice
agencies while developing the new CCMS. Narrative clauses describing WCCMS agent’s actions
and behaviors developing the new CCMS code to these variables separately from variables
describing daily operations.
107
Although the CCMS development project is separate from daily justice operations, it
does affect the Court Context. For example, teamwork at the project level may translate to
increased cooperation in the courts. Court-level factors change, such as the culture, as the
project unfolds, or technical capital, until the launch of the new CCMS. Therefore coding of the
narrative, at the project-level, needs to target the propensity of the project to cause a state
change in WCCMS at the operational level. The project causes WCCMS to adapt and new states
emerge. Although the ability to adapt is a result of the project, it shapes WCCMS at all levels.
Therefore project coding describes the adaptive capacity of WCCMS.
Coding the adaptive capacity of WCCMS requires viewing the project from the
perspective of a CAS and defining variables that would make WCCMS more or less sensitive to
state change. Variables used in this research are based on the findings of Rogers, Medina,
Rivera, and Wiley (2005) regarding CAS and diffusion of innovations. When viewing the CCMS
project from the CAS perspective adoption of the innovation replaces adaptation. The resulting
coding method involves mapping diffusion of innovation factors (Rogers, 2003) to the state
space CAS domain (Rogers, et al., 2005). Table 3.14 describes the mapping. Resulting variables
summaries are below. For each variable, CAS factor coding follows the definition of the
diffusion of innovation factor.
Rate of Adoption is the output state for diffusion of innovations and the innovation
adoption speed by members of a system. In the CAS domain its maps to adaptation, the
degree to which a system creates emergent behavior in response to its environment. A
highly adaptable system will adopt innovations faster than non-adaptive systems. The
Key Outcome, emergence, captures adaptation for the CCMS project
Relative advantage is the perceived degree of innovation, by members of the system, as
being better than the idea it supersedes. Variability or heterophily is its counterpart in

108
the CAS domain and represents the degree to which different agencies differ in the
antecedent traits prior to the state change resulting from the adoption of the innovation
(i.e. CCMS). When a system exhibits heterophily perceptions about the innovation vary
and the members cannot determine the advantages of the innovation. Variability is
required to introduce an innovation into a system, but broad adoption and adaptation
of the system requires low variability. Cooperation, collaboration, and teamwork result
in low variability codings.
Compatibility is the perceived degree of innovation consistency with the existing values,
past experiences, and needs of the potential adopters. In the CAS domain, it maps to
reactivity or the sensitivity to change of the system. Systems are most reactive just
before a system level change or bifurcation. The two map because of the likelihood of
compatible innovation adoption, thus the system is highly reactive toward the
innovation. High reactivity codings result for narrative clauses that represent conditions
just prior to a change in the CCMS project. For example, a narrative clause explaining a
decision to shift development priorities or specifications would indicate high reactivity
as the project is about to change state to the new priority or specification.
Complexity of an innovation is the perceived degree of relative difficult to understand
and use the innovation. Criticality is its counterpart in the CAS domain and is the degree
to which the system requires higher fitness (i.e. change) to meet the demand of its
environment. These factors map because the criticality of the need for the innovation
determines its relative difficulty to understand and use. When a system is in a highly
critical state, it will adopt innovations that are more complex. Narrative clauses that
represent pressure on the system to adapt and adopt the innovations code high in

109
criticality. For example, narrative clauses describing a system needing to align to
institutional norms code as high in criticality.
Trialability represents the degree of experimentation with an innovation, on a limited
basis by the members of a system. Agent experimentation can ultimately lead to the
system level diffusion of the innovation. CAS are scale-free, meaning micro-level
behaviors (like experimentation) affect macro-level phenomena (diffusion). Therefore,
scale is the associated factor for trialability in a CAS. Narrative clauses that represent
actions at the agency level influencing the entire CCMS project code high in scale. For
example, the selection of the CCMS software vendor by the working team is high in
scale.
Observability is the degree to which the results of an innovation are visible to others in
the system. In a CAS, it maps to feedback; the degree to which micro-level behaviors
affecting macro-level phenomena followed by the macro-level induces further micro-
level changes. CAS breakdown occurs when system members become isolated or have
poor member relationships. Observability is the link between members whereas
feedback is the information transferred across the link. Narrative clauses that indicate
one agent affecting another, such as executive directives, code as high in feedback.
With the addition of the court-level and project-level factors a final set of factors was obtained
and summarized in the next section
3.7 The Resulting WCCMS State Variables The resulting WCCMS State Variables are listed and defined in Table 3.1537. They consist of
three sets of factors representing the three-levels of the WCCMS state-space model (County,
37
Codings and SCD symbols are also included I the Table. These are described in section 3.7.1.
110
Court, and Agency) and include CCMS project factors applied to the agency level. The following
summarizes the variables.
Exogenous and endogenous County Context factors include the factors and rules that
affect WCCMS but occur externally. For example, they include laws, economic
conditions, or politics at the County, State or Federal level.
Court Context Exogenous and Endogenous rules and factors describe the state of the
court in both its daily operations and how WCCMS agencies interact and work with each
other.
o Court Context Endogenous factors are from the NCSC Framework for High
Performance Courts (Ostrom & Hanson, 2010) and define the court factors
related to values, culture, and performance measurement of the Court.
o Court Context Endogenous rules define the governance, strategy, laws and
mandates that define and constrain the operations of each.
Agency Context Exogenous and Endogenous rules and factors describe the state of each
agency in their daily operations and interactions to develop the CCMS.
o Agency Context Endogenous factors include the state of resources and
technology for agencies. Since the WCCMS State Space CAS model includes the
CCMS project, factors describe technology exclusive of the CCMS (i.e. e-mail).
o Agency Context Endogenous rules define the governance, strategy, and internal
mandates that define and constrain the operations of each agency.
o Project factors are specific to the new CCMS development and include factors
describing innovation diffusion as a CAS.
Key outcomes represent possible state changes occurring in WCCMS
111
Additionally, although not a variable in the WCCMS State Space CAS model, the category
“Agents” describes agency actions along with each factor. These descriptions add richness to
the coding of each factor and act as a type of memoing that aids in defining the WCCMS strange
attractor.
Using the WCCMS State Space CAS Model and State Variables the fifth axial coding saturated.
Resulting unambiguous assignments of each narrative clause to a WCCMS State Variable and
further coding iterations provided no new information or modifications to the assignments.
Table 3.15 defines state variables value assignments. Appendix D includes the WCCMS
narrative, WCCMS State Variable codings, and value and time assignments
3.7.1 The WCCMS State Space Description – Synthetic Case Description (SCD)
In grounded theory, diagramming of saturated codings provides a concrete image of
concepts and ideas regarding the system under analysis ((Charmaz, 2006), p 117). Diagramming
visually represents the categories and their relationships throughout the narrative description of
the case. An example of diagramming is a SCD (as describe in section 3.5.3.6).
SCD construction involves elaborating the SCD from the saturated axial coding,
minimization of the SCD, and a final analyzed SCD. Each is detailed below for WCCMS.
Elaboration of the SCD requires the tabulation of the factor values for each time interval
for the period under study. For WCCMS, variable tabulation is by calendar quarter with
changes in factor values highlighted. Development phases are included as a visual aid to
the researcher. Figure 3.10 shows the elaborated SCD for WCCMS.
Minimization of the SCD involves removal of unchanging variables. As can be seen in the
elaborated SCD many of the variables do not change value throughout the period under
study and decrease the visualization of the SCD. Removing unchanging variables
112
produces the minimized SCD shown in Figure 3.11. Unchanging variables describe the
initial conditions of the system and are included as part of that state.
The analyzed SCD visualizes changing variables and patterns of change. Highlighting and
circles emphasize state changes and define states. If the SCD represented the WCCMS
strange attractor in state space, tabulation would not include time intervals (time is not a
state variable) but it is the belief of the researcher that keeping the time intervals for this
SCD results in an improved visualization of state changes. For WCCMS, including the
time intervals in the SCD reveals the timeframe for all state changes, on a single diagram.
Figure 3.12 shows the analyzed SCD representing for WCCMS.
The next section describes findings regarding the interpretation and analysis of the WWCMS
SCD and provides the basis for examination of the SCD as the WCCMS strange attractor.
3.7.2 Analysis and Interpretation of the WCCMS Synthetic Case Description
When creating an analyzed SCD, the researcher determined groups of state changes defined
as states of the system. Plain text descriptions are given to each state based on concepts,
theory, and researcher experience. For example, a state of “turmoil” might describe many
system state changes in a very short time interval. The following describes the defined states
for WCCMS.
The analyzed WCCMS SCD (Figure 3.12) shows four WCCMS states (dark dashed boxes),
defined as, Critically Unfit Hierarchical, Critically Unfit Networked, NewFit Networked and
FutureFit Autonomous. Naming of each state refers to the fitness of the employed CCMS
(Technology Capital) and the classification of the Endogenous Environment Factor, Court
Culture. This naming convention represents both important factors that change during the
period of study and provides a summary description of the state of the 17th District Court at the

113
associated time. Equally important to the analysis of WCCMS states is its initial state and it is
included as an additional state of the system and derived from the elaborated SCD. Each state is
detailed as follows38.
- Initial State. The initial state of WCCMS derives from the elaborated SCD (Figure 3.10)
because it includes all the state variables (no minimization has occurred) . Autonomous
court culture (low sociability and solidarity) characterizes the WCCMS initial state. The
adversarial nature of the agency’s court operations (they compete against each other when
adjudicating cases) causes low collaboration. They use an outdated clerk-centric, case-
based CCMS that is barely meeting the needs of the Clerk with very limited use by other
agencies. Agencies maintain their own case databases.
The CCMS state codes as Critically UnFit to indicating inefficiencies are causing problems
outside the Court (jail overcrowding). Additionally non-CCMS technology infrastructure is
highly unreliable. Because of poor economic conditions, the agencies are understaffed and
underfunded resulting in very high case loads. Exogenously, the County has been hit with a
federal lawsuit regarding the conditions in their overcrowded jails. State variables
contributing to the description of the initial state include,
o Court Context : Culture : Solidarity – Low
o Court Context : Culture : Sociability – Low
o Court Context: Culture: Classification – Autonomous
o Court Context : Performance Management : Technology Capital – Low
o Court Context : Performance Management : Information Capital – Low
o Court Context : Performance Management : Human Capital – Low
o Court Context : Social Value : Adequate Funding – Low
o Agency Context : Resources : Funding – Unsatisfactory
o Agency Context : ICT Infrastructure : Networks – Unsatisfactory
o Agency Context : ICT Infrastructure : Applications – Unsatisfactory
38 Narrative quotations that support the factor coding values are listed in Table 3.16.
114
o County Context : Critical Events : Crisis – Jail Overcrowding, pending lawsuit
- State 1: Critically Unfit, Hierarchical. This state occurs when WCCMS outsources the GAP
analysis. The attendance of the County Chairman and Court Clerk at the Northeast Clerk’s
Annual meeting, where they learned about the capabilities of new CCMS software,
precipitates the state change. They become aware of the inadequacies of their own system
and the Chairman concluded a more efficient CCMS might reduce adjudication time leading
to reduced numbers of defendants in jail awaiting trial. Potentially a new CCMS can help
solve the jail overcrowding crisis. He manages to get the GAP analysis expense approved
resulting in the funding variable change to “adequate”.
At this time, WCCMS also created a cross-agency GAP analysis team tasked to support the
consultants performing the outsourced GAP study. This marks the first time the agencies
start collaborating resulting in increases in Sociability and Solidarity and a re-classification of
the Court Culture to Hierarchical. Resisting their natural tendency to be adversarial
represents a bifurcation. Shortly after this state change, WCCMS formally starts the CCMS
project as an outcome of the GAP Analysis.
The CCMS in use has not changed so it still codes as Critically UnFit but the increased
collaboration supporting the GAP analysis classifies the court culture as Hierarchical. State
variables contributing to the description of the State 1: Critically Unfit, Hierarchical include,
o Court Context : Culture : Solidarity – Low
o Court Context : Culture : Sociability – Medium
o Court Context: Culture: Classification – Autonomous to Hierarchical
o Court Context : Performance Management : Technology Capital – Low
o Court Context : Performance Management : Information Capital – Low
o Court Context : Performance Management : Human Capital – Low
o Court Context : Social Value : Adequate Funding – Low to Medium
o Agency Context : Resources : Funding – Unsatisfactory
o Agency Context : ICT Infrastructure : Networks – Unsatisfactory
o County Context : Critical Events : Crisis – Attendance at NE Clerk Annual Meeting

115
State 2: Critically Unfit, Networked. This state occurs at the end of the System Requirement
Definition (SRD) phase. In this state, WCCMS agencies have overcome their natural aversion
to collaboration and actively work together and educate each other on the specification of
the new CCMS. Solidarity and Sociability increase to high. The cross-education of each
agency increases the human capital of the court to high.
The development of the SRD results in the approval of the new CCMS project that
previously had been operating as a continuation of the GAP analysis. Because the SRD
develops by the collaboration of the WCCMS agencies (the GAP analysis team has been
recast to the CCMS working team), it is a “bottom-up” implementation and the project is
high in reactivity, scale, and feedback as would be indicative of a project involving low-level
interactions.
The CCMS in use has not changed so it still codes as Critically UnFit but the high level of
collaboration change the court culture to Networked. State variables contributing to the
description of the State 2: Critically Unfit, Networked include,
o Court Context : Culture : Solidarity – increasing to High
o Court Context : Culture : Sociability – increasing to High
o Court Context: Culture: Classification – Networked
o Court Context : Performance Management : Human Capital – High
o Agency Context : Resources : Funding – Acceptable
o Agency Context : ICT Infrastructure : Networks – Increasing
o Adaptation : CCMS Project : Variability - High
o Adaptation : CCMS Project : Reactivity - Medium
o Adaptation : CCMS Project : Criticality - High
o Adaptation : CCMS Project : Scale - High
o Adaptation : CCMS Project : Feedback – Increasing
Stage 3: NewFit, Networked. A failed and successful CCMS “go-live” characterize this state.
The state change spans a full year because WCCMS re-schedules the “go-live” twice, has one
failed “go-live” followed by a November 2010 successful “go-live”. Project variables are high
116
because of the “go-live”. The project is at “the edge of Chaos”39 where it is very sensitive to
small changes in any project or WCCMS variable. Over the previous six quarters, CCMS
specification changed to accommodate “go-live” schedules. In addition, funding for the
project is being depleted and new sources have not been identified.
The successful “go-live” and launch of the new CCMS defines the state change. The CCMS
is new but the supporting processes and procedures are unimplemented, so technology
capital only increases to medium. Although the full potential of the new CCMS has not been
realized, the shared, “party-based” database results in the highest technology capital in the
past decade. This represents a new fitness level (NewFit) for WCCMS.
Court culture is also changing. The agencies have been increasing human capital through
cross-education but the lack of training for the new CCMS and associated lack of knowledge
of the capabilities of the CCMS reduces human capital to medium.
The state change also exhibits a swing back to lower sociability of agencies. The working
meetings are less frequently with limited attendance by key personnel. Therefore, court
culture variable reverts to hierarchical. State variables contributing to the description of the
State 3: NewFit, Networked include,
o Court Context : Culture : Solidarity –High
o Court Context : Culture : Sociability – High to decreasing
o Court Context: Culture: Classification – Networked (moving toward Hierarchical)
o Court Context : Performance Management : Technology Capital – Low to Medium
o Court Context : Performance Management : Information Capital – Low to Medium
o Court Context : Performance Management : Human Capital – Medium and
decreasing
o Agency Context : Resources : Funding – Acceptable to Unacceptable
o Agency Context : ICT Infrastructure : Networks – Satisfactory
o Adaptation : CCMS Project : Variability - High
o Adaptation : CCMS Project : Reactivity – Medium to High
o Adaptation : CCMS Project : Criticality - High
39
See Chapter 3
117
o Adaptation : CCMS Project : Scale – High
o Adaptation : CCMS Project : Feedback - High
o County Context : Critical Events – Failed “go-Live”
o County Context : Critical Events – Successful “go-Live”
State 4: FutureFit, Autonomous. The final state within the period of analysis is primarily
generated from narrative quotations regarding the future of WCCMS and results from a
National Center for Courts (NCSC)40 report on the jail overcrowding problem for the
County. Although an expected outcome of the new CCMS was reduced adjudication
times leading to lower jail occupancy, the NCSC report indicates this has not occurred. In
particular the report states that the capabilities of the CCMS, as of July 2012, have still
not been realized (initial launch was November 2010, eighteen months earlier).
The court culture reverts to autonomous. The County Chairman is prioritizing CCMS
implementation and the IT department dictates CCMS processes and procedures.
Decreasing collaborative decision-making results in decrease in project feedback (it is
less of a “bottom-up” collaborative implementation) and human and organizational
capital. Agencies see many of the Chairman’s and DoIT’s decisions as necessary but
results in growing frustration with delays to promised functionality. “Workarounds”
emerge to account for the missing functions. Together these changes put WCCMS into a
state where there future fitness (FutureFit) may be very difficult to predict. State
variables contributing to the description of the State 4: FutureFit, Autonomous include,
o Court Context : Culture : Sociability – decreasing to Low
o Court Context: Culture: Classification – Autonomous
o Court Context : Performance Management : Technology Capital – Medium
o Court Context : Performance Management : Information Capital – Medium to
High
40
Calendar year 2012 codings were obtained from archival data, specifically the Criminal Case Management and Jail Overcrowding in Winnebago County, Illinois, report from the National Center For State Courts (Steelman & Hall, 2012).
118
o Court Context : Performance Management : Human Capital – Low
o Court Context : Performance Management : Organizational Capital – Low
o Adaptation : CCMS Project : Feedback - High to Medium
In summary findings indicate that the method of iterative axial coding results in
modifications of both the PSN State Space CAS Model and variables for the particular system
under study (WCCMS). Upon achieving saturation, the method produces a sequential set of
variables representing the state space description of the system. SCD elaboration, minimization,
and analysis of the sequential variables results in a visual depiction the state changes of the
system. The following section re-visits strange attractors and examines if the SCD truly
represents the strange attractor.
3.8 Discussion
The SCD visualization of the WCCMS variables as presented in the previous section is a state
space description of the PSN, a complexity theory concept41. Therefore, the method described,
and the resulting SCD answers the study’s first research question; how can PSNs be modeled
using concepts from complexity theory? The PSN State Space CAS Model, variables and methods
from grounded theory and SCDs together describe how PSNs can be modeled using complexity
theory.
Modification of the PSN State Space CAS Model and State Variables to WCCMS does not
change this answer. Because complex system characteristics exhibit sensitivity to initial
conditions, models of complex systems are unique to each system being modeled and can only
be generalized to large populations if many simplifying assumptions are made (Kellert, 1993).
For example, strict mathematical models of chaotic systems can only be achieved if the systems
agents are considered to be non-adaptive, a very restrictive simplifying assumption. In this
41
It is not a plot of the PSN state in state space because it contains a time component, but it does describe all the states of the PSN and therefore describes it in state space.

119
study, PSN State Space CAS Model and variable’s modification to a WCCMS version result from
sensitivity to initial conditions and does not invalidate modeling PSNs using Complexity Theory
concepts; if anything it further validates the model since it supports key characteristics of
complex systems.
Less obvious is whether these models represent the strange attractor of the system. The
following section examines this in more detail and answers the second research question; does
the state of a PSN state evolve through its state-space in a bounded, chaotic trajectory and, if so,
does the trajectory conform to the Chaos Theory concept of a strange attractor? To answer this
question this research analyzes the WCCMS SCD state space diagram as the chaotic trajectory of
its state to see if it conforms to the concept of a strange attractor.
3.8.1 The WCCMS Strange Attractor
As stated previously (section 2.2.3) a strange attractor is a complex system’s trajectory in
state space that traces the behavior of the chaotic system over time, revealing its attraction to a
few ideal states (outcome basins). Previous research has shown that a PSN is a complex system
(Tomasino, 2011). Therefore, ascertaining if the WCCMS SCD state space diagram depicts a
strange attractor requires meeting two criteria; first it must show state changes and, second,
the state tendency to reside or return to outcome basins (Kellert, 1993; Lissack, 1999).
As described in the previous section the WCCMS SCD state-space diagram depicts changes in
WCCMS state. The WCCMS state transitions from an initial state through four additional states.
Therefore, the WCCMS state space diagram meets the first criteria for classification as a strange
attractor, state change. Additionally WCCMS becomes highly adaptive just before bifurcating to
a new state as described in the transition to the NewFIt, Networked state. It moves to the “edge
of Chaos”. This further validates the SCD as a representation of complex system state changes.

120
Determining whether the WCCMS resides in outcome basins is not as obvious from the SCD
state space diagram. In an outcome basin, WCCMS’ state would change little and it would
continually return to that state (until it bifurcated to a new state). Classifying a state as “the
same” or different requires a comparison of the variable values to see if they are sufficiently
alike. Definition of “the same” is subjective and open to interpretation. Outcome basins
identification using SCD state space diagrams is unlikely to be resolved and questions will always
exist as to the degree of state similarity. Although impossible to resolve definitively, this
problem has two explanations.
First, graphically plotting the most influential or descriptive factors of system, can help
visualize the trajectory and convergence of state changes to an outcome basin (if they number
three or less they can be plotted). Figure 3.13 contains a plot of the WCCMS SCD state space
diagram for its fitness and Court Culture42. In the plot, the range of fitness is from Critically Unfit
to Fit and coding classifications (autonomous, hierarchical, communal, and networked) defines
the range of Court Culture. Plotting WCCMS states as rectangles indicates the location of the
WCCMS state within an area (since there is no exact measure for either fitness or Court Culture).
The rectangle lists additional state information to enhance the analytic capabilities of the plot.
Looking at the graph, WCCMS transitions to new states characterized by more collaborative
Court Cultures (Autonomous to Networked) then traverses back to the Autonomous Culture in
State 4. Because the new CCMS is undergoing enhancements and configuration fitness in state
4 is still indeterminate (indicated by the dashed box) but many of its new features, particularly
the shared “party-based “database, most likely classifies its fitness as not Critically Unfit.
42
These were chosen because they were used as the naming criteria for each state and repeatedly appear as important in the state descriptions for WCCMS
121
Therefore, the fitness box for State 4 is depicted as spanning partially across UnFit to Fit (and is
located solely in the Autonomous Court Culture).
The graph shows WCCMS reverting to the autonomous Court Culture state. Even though
agencies have collaborated for a few years on a new CCMS, educated each other on their justice
processes, and working through critical events such as failed “go-lives”, they are reverting back
to their autonomous or potentially adversarial culture as in the past. This suggests that
Autonomous Court Culture is an outcome basin for WCCMS and supports the second criteria for
the SCD State-Space diagram classifying it as the strange attractor for WCCMS.
A second way to resolve the problem of identification of outcome basins is to utilize the
metaphors extracted from the WCCMS narrative. Extracted Metaphors identify complexity
theory concepts including outcome basins (as well as adaptation, bifurcation, and path
dependency). Table 3.17 lists the metaphors coded from the WCCMS narrative. Four of the
eight metaphors refer to autonomous Court Culture. This would further suggest that this state
is an outcome basin, in particular when combined with the WCCMS strange attractor plot.
By the combined arguments of the plot of influential WCCMS factors and an examination of
examination of narrative metaphors it is possible to conclude that the WCCMS SCD state space
diagram does contain outcome basins43. Therefore, for WCCMS, its SCD state space diagram
represents its strange attractor.
In summary, for the case of WCCMS this study concludes (and shows how) a PSN can be
modeled using concepts from complexity theory. WCCMS evolves through its state space in a
bounded, chaotic trajectory conforming to the Chaos Theory concept of a strange attractor.
43
It should be noted that a strange attractor does not necessarily contain an outcome basin. If the WCCMS State-Space diagram contained no outcome basins, it could still represent the WCCMS strange attractor. Having an outcome basin is a sufficient condition for the WCCMS State-Space diagram as a strange attractor but not a necessary condition.
122
Further validation of the findings of this research requires comparison to alternate theories and
concepts as detailed in the following section.
3.8.2 Alternate Explanations for the WCCMS development
Three key concepts from CT provide the basis for this study’s contributions. First, the
change in state of WCCMS is chaotic and not linear or random. Application of strange attractors
requires WCCMS to have chaotic state changes. Second, the study uses the complexity concept
of scale; that is small micro-level actions and behaviors through interactions and positive
feedback cascade resulting in macro-level system behaviors (sensitivity to initial conditions).
Third, the CT perspective assumes the interaction of agent’s adaptations increases their fitness
within the system. In the following sections, each key concept is further described and applied
to WCCMS to validate the conclusions of this research.
3.8.2.1 Are WCCMS State Changes following a Chaotic Trajectory?
Modeling PSNs and WCCMS using the PSN State Space Process model and understanding
and explaining system change using strange attractors requires changes in the state of WCCMS
to follow a chaotic trajectory. Non-linear feedback causes chaotic system trajectories where
small events can cause large and rapid changes in the system. The Lyapunov exponent
mathematically determines chaos (see Appendix C) but since there is no mathematical
description of WCCMS states, calculation of it is impossible. Instead, this study uses the
emergence of unanticipated outcomes as evidence of chaotic behavior.
If an unanticipated outcome appears as a rapid change in PSN state (bifurcation) then
chaotic behavior is evident (Plowman et al., 2007). For example, the initial failure of the system
“go-live” could be considered an unanticipated event. Analysis of the event indicated it was
unintended but not unanticipated (there are numerous informant quotations referring to
123
expectation the initial “go-live” would fail). In particular, the failure of the initial “go-live” was
disappointing but not surprising. Therefore, it does not indicate chaotic behavior.
Instead, what appears to be more of an unanticipated outcome is the attraction of WCCMS
to the Autonomous Court Culture. WCCMS rapidly changes state from a highly collaborative
state with the development and introduction of the new CCMS (the start of a bifurcation) and
then gets pulled back into a non-collaborative state characterized by the agencies behaving as
“natural enemies” caused by the adversarial nature of the court system. Systems that rapidly
diverge to two different states have Lyapunov exponents that are positive indicating chaotic
behavior (Appendix C). Therefore, at least for WCCMS, evidence of chaotic behavior is its
regression to the Autonomous Court Culture state and strange attractor concepts are
applicable.
3.8.2.2 Does WCCMS State Changes Exhibit Scale?
Complex systems exhibit the CT concept of scale. If the system does not exhibit scale, then
WCCMS state change could be more effectively modeled using other theories, for example
punctuated equilibrium theory. In Punctuated Equilibrium Theory (PET) (Romanelli & Tushman,
1994) micro-level state changes do not accumulate incrementally producing macro-level state
changes. According to PET, resistance to change prevents agents from influencing other agents
or macro-level behavior and holds the system in its current state. Change is due to sustained
short-term declines in system performance eventually causing a “revolutionary transformation”
(IBID, p1145) of the system as the system becomes critically unfit with its surrounding
environment.
PET seems a good fit for WCCMS. Informants repeatedly mention resistance to change
among the agencies and in particular the notion of the necessity of clerk-centric CCMS. These
are hard to change, deeply embedded behaviors. Additionally WCCMS is approaching a
124
“revolutionary transformation” due to jail overcrowding and is accelerating the need to increase
court efficiency. The County Chairman is influencing state change through directives and
statements of opinion. WCCMS appears to meet all the hypothesized reasons for PET change.
As applied to WCCMS, PET would be a plausible alternate theory. Evidence exists to support
state changes in WCCMS brought on by the inertia in the system creating a misfit between
actual WCCMS daily operations and required operations resulting in the development of the
new CCMS. WCCMS agents collaborate but then inertia reappears and they revert to
autonomous behavior. Although PET is an alternate theory to CT, it does not invalidate the
conclusions of this study.
PET is an explanation for non-change in a system due to inertia. In contrast CT is used to
explain change and as a result of scale and is applicable to systems that exhibit weak inertia
(Anderson, 1999). WCCMS exhibits strong inertia (resistance to change) so PET is applicable.
Whether this is true for other systems or PSNs is outside the scope of this research.
Therefore, this research would conclude that for WCCMS, PET might be an acceptable
alternate theory, but not be generalizable to other systems or PSNs. PET does suggest that a
measure of inertia is a factor that needs to be included in future research using the PSN State
Space CAS Model.
3.8.2.3 Do WCCMS Agents Adapt to Increase their Fitness?
Within WCCMS, each agency individually uses and interprets differently the shared data
they obtain from the CCMS. In court proceedings, the process of taking shared data and
interpreting it in different ways creates knowledge within either the judge or jury that decides
the case. A CT perspective describes court agent interactions as adaption in data use to gain a
favorable court outcome (increasing the agents fitness). If agents do not adapt to increase
fitness than an alternate theory, such as Actor-Network Theory (ANT) may explain change. ANT
125
explains system change as shifting power relationships causing different agent interpretations of
the system. In particular, ANT perspectives on technical and social co-definition of ICT may
apply. Within WCCMS, ICT (the technical) is the CCMS connecting agents (the social) who
convert data to information within the courts.
ANT, a socio-technical systems theory, examines the tight links between social and
technical elements in creating social order. It supports system evolution as actors within the
system build networks of social and technical elements. These elements are simultaneously
constituted and shaped by the network. Therefore a technical specification does not define
system elements, such as a CCMS, but rather, definition is modified by forces within the
network (Callon, 1991).
ANT can be useful in determining how different agents in WCCMS interpret and define
the CCMS used within the network. The WCCMS narrative indicates numerous definitions of a
CCMS using descriptors such as clerk-centric, party-based, case-based, holistic and system-
centric. Each agency’s creation of reality, or view, of the CCMS affects its use. As the agents
interact within their environment evolving or shifting power relationships cause different
interpretation of the CCMS (McLean & Hassard, 2004).
Using ANT, WCCMS stabilizes (to some extent) when people, technologies, roles,
routines, training, incentives, and so on are aligned. Alignment is achieved through what is
known as “translation,” involving four stages; problematization (defining a problem for which
the CCMS is a solution); interessement (getting others to accept this solution to the problem);
enrollment (defining the key roles and practices); and mobilization (engaging others in fulfilling
the roles, undertaking the practices, and linking with others in the network) (Callon, 1991).
For WCCMS, development phases represent stages of translation. For example, needs
assessment represents problematization; GAP analysis, interessement; system specification,
126
enrollment; and enhancement, mobilization. As the CCMS development is still in the
mobilization stage (it is still being configured) from an ANT perspective the degree of alignment
is not yet determined but it nonetheless has the appearance of being well suited as an alternate
explanation for the state changes in WCCMS. Each agency is currently interpreting the CCMS
and creating their own version and use.
Such a view of the state-changes is currently valid for WCCMS but suffers from the
general ANT limitation dealing with the micro-level individual interactions with technology. By
focusing on the micro-level aspects of the actor-network, ANT can only infer conclusions about
the macro-level. For example, ANT explains why judges do not use the system, re-inventing it as
a distraction (because of the incessant typing of the clerks) rather than an aid in the courts. ANT
describes how actors interact and interpret each other (the judge’s interpretation of the CCMS)
but because it is a micro-level analysis, it cannot explain why this interpretation occurs. ANT
lacks the context of a larger system and its impact on agent behavior.
Using the example above, ANT would fail to recognize higher-level contexts. Distracting
use of the CCMS in the courtroom was due to unimplemented functionality leading to the
eventual interpretation of the system by the judges. Thus ANT may lead to an erroneous
conclusion that CCMS, in general, are distracting to judges, whereas in reality the CCMS stage of
development results in it being distracting to judges.
In this sense, ANT is sometimes viewed more as a method for analyzing detailed
interactions that can be used to help understand the macro-level or system level but must be
incorporated within a larger framework that includes multiple levels of interactions. ANT is
considered complementary to many other theories and should be used in conjunction with
frameworks of theories for system analysis (Cresswell, Worth, & Sheikh, 2010). Therefore, the
127
use of ANT for WCCMS complements CT concepts and does not invalidate the findings of this
study.
3.9 Conclusions
This study has shown that the proposed CT based PSN State Space CAS Model, State Space
Process model and PSN State Variables, can be used to explain and understand the development
of cross-agency collaborations supported by information and communications technology. The
WCCMS Chaos Theory strange attractor developed describes the changes in state of the system.
In addition, the use of this model enables a predictive capability for information system
development that does not require determination of causes. The following describes predictive
capabilities of the model.
3.9.1 Predictive Capabilities of the PSN State Space Models
Identification of causal events creates problems for IS development. As a complex system,
IS development cannot have all event causes identified. The interactions of agents and
feedback of actions and behaviors from the micro to macro level makes causal event
identification impossible. As a result causality based models of IS development cannot be used
to predict or avoid unanticipated or undesired events.
CT concepts state that the trajectory of the changes in a systems state, or its strange
attractor, predicts future states by examination of the systems tendency to reside in outcome
basins. Examination of the state changes in WCCMS show outcome basins exists in its strange
attractor and the system reverts to Autonomous Court Cultures. Additionally, past history, both
its initial state and Critically UnFit state (State 1) indicates that Autonomous Court Cultures co-
exist with inefficient court operations. This would suggest to WCCMS management that even
though they have a plan and strategy for success of WCCMS it might be entering a state with an
128
unanticipated and unintended outcome of court inefficiency because its Court Culture is
becoming autonomous. The model has predictive capabilities without identifying any critical
event that might cause court inefficiency.
This result is particularly applicable and important to WCCMS because it is a CJIS. In United
States (US) courts, the judicial system creates an adversarial situation between the court
agencies. They compete on a daily basis in the courtroom and are not inclined to cooperate or
collaborate (Ney & McGarry, 2006). Thus non-cooperative, non-collaborating, Autonomous
Court Cultures is a norm in US CJIS. Winnebago County executives can expect the constant
pulling of WCCMS into the Autonomous Court Culture outcome basin, which would potentially
lead to an unanticipated or undesired outcome. By using the WCCMS State Space CAS model,
they can identify conditions when their CJIS may be in jeopardy.
Although results from this study answer the proposed research questions and provide
predictive capabilities for IS development, the study has limitations as follows.
3.9.2 Study Limitations
Although the study shows promising results for the PSN State Space Process and CAS Model,
application is only to one specific PSN, WCCMS. Generalized conclusions such as the impact of
Autonomous Court Cultures on CJIS although reasonable are not completely supported by a
single case study. Generalizing the results of this study may apply more to the method used to
generate the specific WCCMS state space model, applying it to different PSNs or IOS.
In addition, the time period under study is relatively short (under ten years) with only a few
state changes. The full impact of the new CCMS and the ongoing development of WCCMS may
require a few more years before state transitions provide more general or impactful results.
This study has indicated that CT concepts can be used to analyze IS developments, providing
129
explanations for IS developments but a single case study, over a limited time frame, cannot
provide broad understandings of IS development outside the single case.
The method employed in this study may have larger application to broader IS developments
and research. The method described, based on grounded theory technique uses narrative
analysis and iterative axial coding to modify a general PSN State Space CAS model to a specific
WCCMS model. Similarly, this method can be used for other PSNs or extended to other types of
IS. For example, the third study of this dissertation applies this method to understand the
emergence of PSN states for a police-oriented PSN.
3.9.3 Contributions to Research
This study makes significant contributions to both theory and practice. Theoretical
contributions include,
The extension of current perspectives on how IS evolve and change over time. By
utilizing CAS and Chaos Theory and the concept of strange attractors this research
provides a new perspective on the state and status of IS and how they occupy different
state spaces over time.
The explanation and understanding of IS evolution and change by examination of the
state of the IS without determining causality in the time-domain. Sensitivity of the IS to
system factors is used to predict the likelihood of the IS evolving to an unanticipated
state.
The classification of unexpected and unpredictable outcomes as bifurcations that occur
when IS operate at tripping points and switched to different outcome basins within the
strange attractor, showing the susceptibility of IS to small changes in its operation and
environment and initial conditions.
130
A method for the creation of state space models for IS using CT concepts, narrative
construction and analysis, iterative axial coding, and synthetic case descriptions.
Contributions in practice include,
A model and set of state variables for a WCCMS detailing how the system state
changed as it developed a new CCMS.
The discovery of an outcome basin for CJIS developments linked to the natural non-
collaborative tendencies of justice agencies. CJIS initiatives requiring collaboration
must overcome this tendency moving the CJIS out of this outcome basin by
introducing interaction between agencies.
The derivation of a general PSN State Space Process and CAS Model with associated
state variables. Depending on the PSN under study the model and variable has use
“as is” or with customization to understand and explain the development of the PSN.
The development of a managerial method for understanding influential factors (such
as structure, culture, decisions, and technology) that form PSN strange attractors.
Managers can make decisions that guide the PSN to remain in an outcome basin
closely aligning to their goals for the system. Understanding these factors can also
help managers avoid bifurcations, where the system quickly moves to an unexpected
outcome basin.
This study’s findings are generalize-able to a broad range of cross-agency intergovernmental
collaborative initiatives that employ interorganizational systems. This research should spur
further studies utilizing Chaos Theory and CAS for both public and private sector
interorganizational systems.
131
4 Study 2: Derivation of PSN Configurations Using Complexity
Theory
4.1 Introduction
Lyytinen and Damsgaard (2011) in their opinion piece on IS adoption propose that IS
structure and strategy are interdependent and consequently adoptions cluster into types or
configurations 44. This study analyzes IS configurations through the study of IOS, specifically
PSNs, and proposes PSNs not only cluster into configurations but also evolve into different
configurations represented by CAS and Chaos Theory outcome basins. PSN configurations are
not simple clusters of PSNs, alike on average, but rather configurations represent PSNs sharing a
common state as they evolve over time. Determining the PSN state requires analysis of PSNs
using CT.
Tracing the state changes of an IOS defines its evolution. Plotting these changes in state
space, resulting in the IOS strange attractor, defines all its possible states and its evolution. The
strange attractor may contain clearly defined areas the system tends to stay within, known as
outcome basins. Figure 4.1 shows a Lorenz strange attractor (Lorenz, 1963) containing two
areas (that appear as lobes) that are outcome basins. IOS evolving along a Lorenz attractor exist
predominantly in semi-stable states corresponding to the outcome basins. These outcome
basins define the configurations of the IOS.
System configurations exist as tight constellations or patterns of supportive elements
(Miller, 1986). Elements (both social and technical) interact and support each other aligning into
patterns that correspond to configurations. In this research, “elements” are the factors defining
44 They propose typologies of IS configurations consisting of dyadic, hub and spoke, industry, and
community configurations. For example, they describe the hub and spoke configuration containing a powerful customer at the center and suppliers on the spokes.
132
the state of the IOS. For example, IOS factors may align by visions, functionality, structure,
interaction, or funding, to form the configuration (Lyytinen & Damsgaard, 2011).
An important aspect of configurations is the similarity of elements in the configuration. A
common researcher misunderstanding views clusters with elements at some average level of
similarity as representations of configurations. In fact two different configurations can exist that
are similar in all aspects save one. The development of configurations requires a determination
of the elements relevant to the system and the various combinations forming configurations
((Ragin, 2000),p74-75).
This study uses fuzzy-set theory to determine and define PSN configurations based on the
PSN State Space Process Model derived in Chapter 3 (Section 3.3). It views configurations as
combinations of values for relevant variables or factors, treating each combination of values as a
different type of configuration. Analysis uses data from a detailed survey of United States Public
Safety Networks45 (PSN) to derive configurations in the public sector safety services domain.
The following sections contrast traditional configuration analysis for social systems to this
study’s approach and detail its contribution to IOS evolution and public safety.
4.2 Traditional Configuration Analysis
In traditional configuration analysis the three accepted means for analyzing social
complexity and configurations are the contingency table, cluster analysis and correspondence
analysis (Byrne, 1998):
Contingency tables. Contingency tables are cross-samplings of individuals with
respect to two or more qualitative variables ((Everitt & Dunn, 1983),p173). It
represents an n-dimensional condition space in which cases exist in some sub-
45 http://www.publicsafetynetworksstudy.org/
133
domains and not in others. The sub-domain corresponds to a configuration. Chi-
squared inference testing determines if there is a relationship between two
categorical variables46. Contingency tables compare “full(ish)” categories with
“empty(ish)” categories ((Byrne, 1998),p74), and are limited to comparisons of two
variables (a limitation of Chi-square testing). For this study, given 13 dimensions,
examination of dyadic (two-dimensional) relationships, as needed by the chi-squared
test would mean examination of over 8,000 cross-tabulations. This is clearly not
desirable or feasible.
Cluster analysis. Cluster analysis classifies cases into relatively homogenous subsets
clustering members more similar to each other, on average. These subsets would
define the configurations. Similar to contingency tables, cases are located in n-
dimensional state space with certain combinations of states that are possible and
combinations that are common. Cluster analysis is “polythetic” ((Bailey, 1994), p8)
meaning clusters are formed by average similarity. Cases can be grouped into a single
category that differ substantially from each other as long as, on average, they are
similar along the attributes chosen by the investigator ((Ragin, 2000), p77).
Therefore, inability to identify clusters that are very similar except for a single
element limits the use of cluster analysis. If the single element is important to the IOS
then clusters that are similar except for one single element may in fact represent
different configurations. Cluster analysis will not be able to differentiate these
configurations.
46Note for large sample sizes chi-square test may incorrectly indicate a statistically significant
relationship between samples.
134
Correspondence analysis. Correspondence analysis represents interrelationships of
categories in two-dimensional maps such as a scatter plots. Such analysis can contain
plots for two categories over a third category. For example Williams, et al. (2009)
analyze public safety network density over population (two interrelated elements)
across States (representing the third category (Figure 4.2)). Correspondence analysis
becomes more interesting when the third category is time, showing system change or
evolution, but, as previously stated, this technique’s limitation is visualization in only
two dimensions or “polythetic” considerations (as in cluster analysis) and does not
reveal all possible configurations
Fuzzy-set theory does not suffer from the limitation of conventional configuration analysis.
The next section briefly outlines fuzzy-set theory for configuration.
4.3 Configuration Analysis using Fuzzy-sets47
It is worth repeating that the although Chaos Theory can mathematically predict system
change and evolution into configurations, sensitivity to initial conditions make this impossible to
achieve (Kellert, 1993). In terms of Chaos Theory, mathematical formalization breaks down and
it is impossible to define, exactly, configurations (or outcome basins) for a system such as an
IOS. As a result, configuration analysis using standard techniques is problematic. For IOS,
configuration analysis requires estimation, measures of membership, and a focus on diversity
rather than homogeneity. Fuzzy-set science meets these requirements enabling its use for
configuration analysis of IOS as follows.
Sets are conventionally thought of as dichotomous (or “crisp”) where cases under study are
either “in” or “out” of the set. For example, the set of employed workers would conventionally
47 From (Ragin, 2000; Smithson & Verkuilen, 2006)

135
be represented by a binary variable with two values, 1 (“in”, i.e. employed) and 0 (“out”, i.e.,
unemployed). In contrast fuzzy-sets allow for membership in the set between 0 and 1 (with 0
representing full non-membership and 1 representing full membership) ((Ragin, 2000),p6-10).
Using the previous example, a “part-time” employee, would have a membership in the fuzzy-set
“employed” somewhere between 0 and 1 (as defined by the researcher) as the worker is neither
fully employed (1) or fully unemployed (0).
Although it is tempting to view membership as a continuous variable, fuzzy-set membership
is more than a continuous variable but is rather a calibration of a set of variables related to the
degree of membership within a category. For example, within a public safety network (PSN),
“connectivity”, a continuous variable, equals the number of communication channels available
to the members of the PSN. As a fuzzy-set, “connectivity” would transform to “degree of
connectivity” and would need calibration to values of fully connected and fully unconnected. So
a PSN with 20 total communications channels might have fully connected “degree of
connectivity” calibrated to 15 channels48 and 5 channels as fully unconnected. Thus, there is an
added meaning and granularity gained using fuzzy-set calibration. Additionally, eliminating
irrelevant data, lying outside the calibration’s limits, reduces “noise” in the data. Figure 4.3
depicts conventional crisp, continuous, and fuzzy-set (calibrated) membership for the PSN
“connectivity” example given above.
Calibration is a key aspect of fuzzy sets. Fuzzy-sets rely on theoretical concepts for
calibration. Through calibration, fuzzy-sets combine qualitative and quantitative assessment in
a single instrument ((Ragin, 2000), p8). Calibration’s uses include assigning set membership to a
single variable or combining multiple variables (or observations) into a single fuzzy-set.
48 Additionally other variables could be combines with the number of channels, such as number of
data types, to form and define “degree of connectivity”.

136
Therefore, it is possible to operationalize multiple variables into a description of the system that
accommodates multiple theoretical concepts. Additionally, expressing concepts qualitatively
through theory (e.g., 15 channels represent fully connected, above) allows for varying degrees
of membership in the concept (e.g. a quantitative measure of “degree of connectivity”). Set-
theoretic relationships between variables and theory result through the calibrated assignment
of degrees of membership to variables.
Calibration is a way of defining a set (creating a set-theoretic relationship). If the set-
theoretic relationship is fuzzy (not crisp) then a fuzzy-set is created. Therefore a fuzzy-set is a
fine-grained continuous measure of case variables that has been carefully calibrated using
substantive theoretical knowledge relevant to set membership ((Ragin, 2000), p7). Thus, system
configurations are macro-level set-theoretic relationships and fuzzy sets are a tool for analyzing
them. In a set-theoretic relationship configurations conceptualize systems as combinations of
attributes and the uniqueness of such systems are determined by the combinations in which
they occur (Fiss, 2007).
Set-theoretic relationships and configurations are directly applicable to CAS and Chaos
Theory. For a system, its state-space is a fuzzy-set and the fractal dimension it occupies
represents its possible membership. A set-theoretic relationship exists defining exactly the
trajectory of the system through the space. This trajectory is its strange attractor. The strange
attractor defines the occurrence of combinations of attributes as rough sub-sets corresponding
to outcome basins which through application of theory can be defined as configurations (Byrne,
2005). For example, a PSN may be attracted to a shared service configuration state represented
by some set of PSN factors values. As a tool, fuzzy-set theory will identify the set of factors but
only through the application of the shared service theoretical framework, and calibration of
variables against that framework, can interpretation of factors result in configurations
137
corresponding to a shared service PSN. Such analysis requires the iterative calibration of
variables, assessment, and application of theory.
4.4 Research Questions and Contribution of this Study
This study addresses the second set of research questions,
What configuration of states results from PSN evolution, if any?
o Do the PSN configurations conform to the Chaos Theory concept of outcome
basins of a strange attractor?
o Can PSN strange attractors and outcome basins be identified using fuzzy-set
social science?
The contribution of this study is further validation of the PSN State Space CAS and Process
model. The existence of PSN configurations that conform to outcome basins provides additional
evidence that PSNs evolve along a CT strange attractor and its use to predict future PSN states
without accessing causality. Results generalize, and validate IOS modeling in state space. The
next section outlines methodology for this study.
4.5 Method
This study uses an exploratory analysis method applying fuzzy-set configuration analysis to
determine different PSN configurations. A fuzzy-set configuration analysis requires the
application of theoretical concepts to define and interpret configurations. Two types of
theoretical concepts are used. First CAS and Chaos Theory use creates and calibrates an initial
set of factors for the PSNs based on the general PSN State Space CAS Model derived in Chapter
3. Second, the set of variables are interpreted by association using previously researched and
discovered configurations (Tomasino, 2011; Williams, Fedorowicz, & Tomasino, 2010). This will
138
act as a verification of the methodology and calibration of the fuzzy-set. Additional
configurations may be discovered and analyzed resulting from the first two analyses.
4.5.1 Data
The data set used contains survey results from the existing National Science Foundation
(NSF) funded project on PSNs49. The data set collection occurred in 2009 and 2010 by a
professional survey research team through phone interviews with senior PSN personnel (e.g.
CIO or project manager). An extensive search was conducted to identify all PSNs in the United
States. The project identified over 250 state and local level PSNs. Each PSN and interviewee
was assessed for his or her suitability and willingness to participate in the survey.
Survey creation was a yearlong process including pretesting by the researchers and public
safety representatives. It was also pilot tested on a small number of PSNs. The resulting survey
contained 95 questions and took approximately 45 minutes to administer. Questions included
factual and perceptual topics including demographics, features, goals, intended uses,
operational status, user characteristics, funding, technology architecture, technology
implementation, governance, triggering events and performance (Williams, et al., 2010).
Responses are quantitative (numerical), qualitative (scale), and open-ended. Appendix F
reproduces the survey.
4.5.2 Fuzzy-set Analysis – fuzzy-set Qualitative Comparative Analysis (fsQCA)
The analysis methodology is based on Ragin (2000) using techniques from qualitative
comparative analysis. Qualitative comparative analysis uses Boolean algebra to determine
which combinations of organizational characteristics combine to result in the outcome in
49 The Public Safety Networks Study; projects #IIS-0534877 & #IIS-0534889
139
question. If the approach utilizes a set-theoretic based on membership (fuzzy sets) then the
analysis is fuzzy-set qualitative comparative analysis (fsQCA).
The analysis uses “fsQCA 2.0”50 software from the University of Arizona. FsQCA analysis
required three steps. The first step was an assignment of survey questions to PSN variables.
Each PSN variable requires a calibration equation associating the degree of membership of the
questions (and answers) to the variables. The second step involved construction of
configurations based on the application of fuzzy-set operations to the variables. The third step
interprets the fuzzy-sets as configurations and develops “plain text” descriptions of the
configurations. Appendix G describes the fsQCA technique. The following sections describe the
calibration of the variables and extraction of the PSN configurations.
4.5.3 Assignment of Survey Questions to PSN Variables
The survey asked questions about the PSN’s origin, purpose, membership, usage,
development, technology, governance performance measures, and goals. The survey’s goal was
to reveal identifiable subsets of the PSNs and successful or unsuccessful PSNS, based on their
self-reported performance criteria and usage patterns. The similarities between the survey’s
and this study’s goals enables using the survey to analyze PSN configurations but some
modification was required. Construction of the survey had PSN variables in mind, but they did
not specifically consider the application of complexity concepts, such as outcome basins, to
understand IOS development.
Therefore, the existing survey questions require mapping into the PSN variables used in this
study. Since developed survey questions did not specifically address PSN variables, mappings
50 http://www.u.arizona.edu/~cragin/fsQCA/software.shtml
Ragin, Charles C., Kriss A. Drass and Sean Davey. 2006. Fuzzy-Set/Qualitative Comparative Analysis 2.0. Tucson, Arizona: Department of Sociology, University of Arizona.
140
are to general PSN variable categories rather than specific variables as developed in Chapter 3.
In addition, survey questions did not cover all PSN variables. This is not problematic, as the
intent of this study is to discover if configurations exist (as outcome basins) and not necessarily
define each configuration in the detail. Section 4.8.1 discusses Interpretation of configurations
and the lack of coverage of all variables as a limitation of this study.
Additionally, fsQCA is limited in its use for outcome basin analysis because it is not a
longitudinal analysis tool. Determining outcome basins requires knowledge of the sequence of
state changes (following a strange attractor), necessitating fsQCA analysis producing a sequence
of configurations. As an IOS develops, it moves along its strange attractor transitioning from
outcome basin to outcome basin (assuming there are multiple outcome basins on its strange
attractor). Therefore, in an analysis of multiple IOS evolving along similar strange attractors (as
in this study for PSNs), outcome basins, represented by configurations, occur in sequence; some
exist “early” in the strange attractor, and some “late”. Associating IOS operational maturity with
configurations provides the needed sequence.
- Using Maturity to Determine the Sequence of Outcome Basins
The cross-sectional nature of the analysis and the inability to access characteristic of a
longitudinal nature limits fsQCA analysis (Kent, 2008). As stated by Byrne (2005) for an analysis
of strange attractors and configurations, “history matters”. Configurations that conform to
outcome basins must account for time and occur as the system changes. FsQCA is limited to
analysis of a system at a single point in time.
Creation of additional factors for the maturity of the PSN and its management and use levels
removes this limitation. These factors were defined in the Public Safety Network Project (PSN,
2010) through extensive coding and analysis across multiple researchers. Use of maturity of the
PSN provides a time dimension to the analysis, and management and use level factors access
141
the consistency and coverage of the data set for different maturity levels. Consistent result
indicates validity of maturity measures as a proxy for time in further PSN fsQCA analysis.
Although maturity of an IOS refers to its state and not specifically its location in time, it is
the correct measure for sequencing outcome basins (Poeppelbuss, Niehaves, Simons, & Becker,
2011). Because analysis is in state space, ordering outcome basins by maturity normalizes the
basins over time; removing time differences for individual IOS to reach operational maturity.
Sequencing outcome basins requires knowing they are mature or not mature, not their age51.
FsQCA analysis also requires a set of outcomes for generation of configurations of causal
conditions. The PSN survey includes a number of judgments by the informants regarding the
performance and status of the PSN. These answers to these questions are the output conditions
for the analysis. Analysis used multiple outcomes in an attempt to uncover as many
configurations as possible. Table 4.2 lists PSN variables categories resulting from this analysis
along with their associated variables52.
4.5.4 Calibration - Measuring Membership
Calibration is the process of generating membership functions for the PSN variables using
answers to the PSN survey questions as inputs. The membership functions map the PSN survey
questions (and answers) to each of the PSN. For this study, each PSN survey question codes to a
numerical value, if applicable, and calibrates to represent a degree of membership based on the
subject of the question53.
51 For the purposes of this research using maturity to sequence outcome basins is referred to as adding a
“time dimension”. 52
Cryptic naming of factors is due to the acceptable naming conventions in fsQCA2.0. 53
Many of the PSN survey questions are textual answers for information purposes and are not used in this study.
142
For some questions achievement of numerical calibration required using the knowledge of
the researcher or PSN project team. For example, PSN descriptor calibrations (see Table 4.1) do
not rely on theory but are based on PSN project codings (PSN, 2010). Calibration methods not
based on theory are documented in detail (see Table 4.1, GOVAuth calibration). Other
questions used a numerical algorithm for calibration. An example of one calibration follows.
One PSN survey question asks an informant to answer “yes” or “no” to the use of ten
different technologies or devices in their PSN (see Appendix F, Q49). This factor is referred to as
ITDev. Consequently, ITDev defines the degree of comprehensive use of IT devices exhibited by
the PSN. One way to calibrate ITDev is simply as the count of the number of “yes” answers as
follows,
ITDev = 1 for 10 “yes” answers ->”comprehensive”
ITDev = 0 for 0 “yes” answers -> “not comprehensive”
0 < ITDev <1 = “yes” answers divided by 10 – some degree of “comprehensive”.
This type calibration is a simple linear membership function. It ignores “don’t know”
answers and does not consider the cumulative effects of using multiple technologies; limiting its
usefulness. For example, a PSN that uses only one or two IT devices might still be considered
very low in membership and likewise use of eight or more devices calibrates to very high
membership. Therefore, instead of a linear calibration an S-shaped calibration curve may be
more appropriate (Appendix G describes this type of calibration).
Since there is no theoretical justification to pick either a linear or an S-shaped calibration
this study used “trial and error” to choose a calibration technique. The technique involved
creating functions to convert linear data to S-shaped calibrations with variable mid-point
crossover points. Then, multiple runs of fsQCA2.0 compared the different calibrations on each
question. Results from the runs showed only data skewed to extreme values required
143
calibration techniques other than linear. The Discussion section (4.7) presents reasons for this
result.
Table 4.1 contains the calibration technique for all the applicable PSN Survey questions.
Calibration methods used were determined almost exclusively utilizing direct linear method,
Likert scale translation, counting, or indirect methods as described in Appendix G and
summarized below.
Direct Linear – Questions linearly map from their answer range to the membership
range of 1 to 0. There were no questions in the survey requiring this translation.
Likert scale translation54 – A number of questions required rating answers according to,
for example, “importance”, “agreement”, or “improved”. Answers to these questions
were scaled into degree of memberships between 0.5 and 1.0 (because all answers
indicate membership in the set) unless the answer indicated no membership in the set
(such as “not important”) which was given a degree of membership of 0. In some
question’s answers switched from ratings of “improvement” to “worsened”. These
questions represents two different fuzzy-sets for PSNs, those that exhibit
“improvement” and those that exhibit “worsening”, therefore these questions were
split into two separate factors measuring “degree of improvement” and “degree of
worsening” (if the questions answered was “not improved” rather than “worsened” the
questions would not require splitting).
Counting – Questions that required informant to answer “yes” or “no” regarding PSN
use of an element (from a list) are linearly scaled into membership by summation of the
54 These types of survey questions are more accurately represented as “Likert-like” as they define the
fsQCA anchor points for calibration (making them fsQCA type questions) but require a calibration algorithm (as in Likert questions) between the anchor points (as detailed in Table 4.1). For simplicity in reading the text, they are labeled as “Likert” for this study.
144
number of “yes” or “no” answers. Summations were then grouped into discrete
memberships such as 0, 0.25, 0.5, 0.75, and 1.0 to account for errors in responses
(Ragin, 2007).
Indirect methods – Questions calibrated using researcher of PSN Team knowledge as
described above.
FsQCA simulation extracts the configurations of the PSNs once question calibration is
completed.
4.5.5 Construction of Configurations using Fuzzy-set Operators
Configuration analysis was only performed on PSNs that were operational (OPER = 1). This
criterion was necessary since causal conditions would reflect actual PSN characteristics and not
planned or specified characteristics. A non-operational, planned PSN would not be a chaotic
system, since it would not yet have agent interactions (they interact as a planning system but
not as a PSN). Application of this criterion resulted in 56 PSNs for configuration analysis.
The detailed algorithm used in fsQCA to generate the fuzzy-sets is not detailed in this
research, but in summary can be thought of as similar to truth table based logic minimization
(based on the Quine-McClusky algorithm, (Ragin, 2009)) used for digital systems. Logic
minimization results in solution formulas that represent system configurations. The resulting
configurations are very complicated, due to the number of operators, and for this research, the
number of variables (dimensions) in the state space.
Two analyses construct the configurations for PSNs; the first develops a time measure for
the configurations and the second extracts the actual configurations. The first analysis uses the
PSN descriptor “maturity level” (MATURE) as the output and the remaining PSN descriptors as
the causal input conditions (from Table 4.2). Using PSN descriptors as inputs to the maturity
fsQCA runs results in higher consistency measures because these descriptors (mainly consisting
145
of answers to management and use level questions) are less likely to be judgmental or represent
opinion by informants. The existence of consistent PSN configurations for both mature and non-
mature PSNs means the variable MATURE can be used to provide a time dimension to further
fsQCA analysis.
The second analysis generates the configuration of PSN factors that are causal input
conditions for each PSN output (from Table 4.2). Solution formulas for each fsQCA run
represent a PSN configuration. Valid configurations have a consistency above 0.80 from the
fsQCA run (see Appendix G for description of consistency). FsQCA also provide a coverage
measure. Coverage indicates the percentage of PSNs that exist in the configuration.
4.5.6 Interpretation – Fuzzy-sets as Configurations
Interpretation of the fsQCA 2.0 derived solution formulas describes each combination of
variables as a configuration using “plain text”. For example, a fuzzy-set configuration with a
solution formula containing high membership in governance and shared ICT and resources could
be describing a shared services organizational structure for a PSN.
Performing interpretation requires two steps (see section 4.6.2). The first step involves the
comparison of the resulting solution formulas for each fsQCA run (for each output) for patterns
or similarities. Configurations are indicated by the same solution formula being present for
different outputs (Ragin, 2000). In the second step, the researcher interprets the resulting
solution formulas. It is important to remember that the goal of this study is to uncover the
existence of configurations, not interpret them. Therefore, a rigorous interpretation
methodology is not a critical issue for this study.
146
4.6 Findings
Three findings result from fuzzy-set analysis of the PSN survey data using fsQCA 2.0, as
follows.
1. Consistent with previous fsQCA analysis of this data set (see (Sawyer et al., 2012))
the resulting PSN configurations reveal two distinct groups of PSNs, one for court-
oriented practices and one reflecting routine policing and emergency management
practices (police-oriented).
2. Use of the maturity level variable MATURE as a proxy for time (required to verify
outcome basins) did not produce consistent results (and therefore cannot be used
as a proxy).
3. Mature PSNs exist in eight distinct configurations, four each for court and police-
oriented PSNs.
The following sections detail each finding.
4.6.1 Court and Police-oriented PSNs
Sawyer, et al. (2012) report on an underlying pattern in PSN development related to the
difference in mission of the PSNs. One group of PSNs emphasized court-related practices and
the other reflected practices for policing activities. Findings in this research are consistent with
Sawyer’s findings even though this research uses different calibrations and outputs for fsQCA
analysis.
In this research, PSNs with these missions group into two distinct and non-overlapping sets
of configurations. Each PSN is characterized as either court-oriented (PSN variable CJIS = 1) or
147
policing-orientated (PSN variable PEMS = 1) within the data set55. The characterization
intuitively suggests the existence of the two groups, but the striking result was that for every
resulting configuration the characterizations of court-oriented or police-oriented PSN never
exist together. In other words, there is never a configuration with either CJIS or PEMS equal to 1
or CJIS and PEMS equal to 0. This indicates that within the PSN data set court-oriented and
police-oriented PSNs exist completely distinct from each other (the fuzzy-sets do not intersect).
Therefore, PSNs exist as two different types, court-oriented and police-oriented, that then can
exist in a number of different configurations. Further reporting of results is for both types of
PSNs.
4.6.2 Configurations Resulting from Maturity Analysis
Utilizing the PSN variable MATURE as a proxy for time required the extraction of consistent
configurations for both Mature (Mature = 1) and NOT mature56 (Mature = 0) PSNs. Consistent
PSNs existed for mature PSNS but NOT mature configurations are inconsistent.
Table 4.3 contains the results of this analysis. With regard to this table (4.3), rather than list
the solution formula for each configuration, which can be difficult to visualize, a tabular list of
causal conditions similar to a truth table describes the configuration. For example, reading the
first row of the table, a configuration exists for policing-oriented PSNs (PEMS = 1, CJIS = 0)
managed at the State and Local levels (MLEVFed = 0, MLEVState = 1, MLEVLoc = 1) with users at
55 Characterization used indirect calibration based on the knowledge of the PSN Project Team (PSN, 2010)
56 Because this analysis uses fuzzy-set theory PSNs are considered either MATURE or NOT MATURE, based
on inclusion in the set MATURE. NOT MATURE does not necessarily equate to IMMATURE, therefore this study specifically avoids describing NOT MATURE PSNs as IMMATURE.
148
both the Federal and State level (ULEVFed = 1, ULEVState = 1, ULEVLoc = 0)57. The configuration
has high consistency (0.9) and there are approximately 6% of the PSNs in this configuration.
Of the twelve configurations identified, five have consistencies greater than 0.8 indicating
they are valid configurations. The other configurations have consistencies below 0.8 and are not
valid. Configurations with consistencies below 0.8 do not have sufficient degrees of
membership in the outcome variable to define a configuration (see Appendix G for a description
of consistency and valid configurations).
Results for NOT mature PSNs (fsQCA is run with the outcome set at NOT (MATURE)) did not
result in consistency above 0.8 for any configurations. Table 4.4 details the results for the
analysis, showing configuration consistency is at most only 0.75. Inconsistency of these results
indicates that these are no valid configurations of “NOT mature” PSNs58. Therefore the use of
the PSN condition MATURE cannot be used to add a time dimension to further analysis. As a
result, further analysis is cross-sectional and applicable only to mature PSNs.
4.6.3 Configurations Resulting from Multiple Output Analysis
Previous research and researchers using fsQCA2.0 have indicated that the analysis tool is
best suited for configuration analysis with typically six or less causal conditions (Kent, 2008;
Ragin & Giesel, 2008; Schneider & Wagemann, 2010; Skaaning, 2011). FsQCA2.0 constructs
truth tables for each output based on the number of input causal conditions resulting in k x 2k
dimension tables (if k represents the number of input causal conditions). Therefore,
configuration analysis with many causal conditions results in a very large dimension tables. For
57 Such textual descriptions usually describe the positive conditions (1) and omit the negative condition (0)
from the description. The negative description is implicit in the description. 58
It should be noted that consistency of 0.8 for validity is not yet generally accepted. Some researchers believe consistencies over 0.9 should only be considered (Skaaning, 2011). Therefore, even though a consistency of 0.75 for one configuration is close to .80 it cannot be considered valid. For the purposes of this research 0.8, per Ragin, is used as a strict criterion.
149
example, using the twenty factors for PSNs from Table 4.1 would result in truth tables of over
one million entries. Additionally the resulting solution formulas, with twenty factors, can be
very difficult, if not impossible to interpret. Attempts at running fsQCA2.0 with all twenty
factors resulted in the program crashing, hanging, or producing nonsense results (partial
outputs). As this study uses an exploratory method, a further reduction in the number of causal
factors allows the analysis to proceed.
In this method and for fsQCA analysis in general, manipulation of the input causal conditions
is not problematic. In fact, manipulation of the data are often necessary or encouraged to
produce and validate configurations and concepts (Schneider & Grofman, 2006). Carefully
defined input causal conditions, not the number of input causal conditions, result in valid
configurations. Therefore reducing the number of causal conditions, to accommodate
limitations in fsQCA2.0, does not invalidate this research as long as they are clearly defined.
Clearly defined input causal condition enables interpretation of the configurations.
For this study, averaging the relevant variables into the general PSN variables reduced the
input causal factors to ten in number (described in Table 4.2). For example, a new variable
CNGov (for Collaborative Network Governance) averaged the membership scores for GOVAuth,
and GOVPol (which are all directly mapped from the PSN Survey). Table 4.5 lists and defines the
resulting variables used as causal input conditions for the fsQCA analysis.
Because fsQCA analysis uses set theory, the decision to average membership scores (over
other techniques such as weighting) is not trivial. For example, if a PSN has very high
membership in GOVAuth (i.e. 0.8) and very low membership in GOVPol (i.e. 0.2) the average
membership in CNGov would be mid-range (0.5). This would indicate the PSN is neither “in” or
“out” of the set CNGOV. In actuality, a high membership score in GOVAuth might outweigh the
low score in GOVPol resulting in a high score for GNGov. Conversely, GOVPol may outweigh
150
GOVAuth resulting in a low CNGOV membership. Such conflicts are typically resolved through
theory or additional survey measures not available for this study. As a result output analysis
was repeated using fuzzy AND (which emphasizes low memberships) and fuzzy OR (which
emphasizes high memberships) instead of averaging membership scores. Each analysis resulted
in the same configurations with slightly (less than 10%) deviations in consistency. This
difference was not problematic and the study utilizes averaging to create general PSN variables.
Table 4.6 details fsQCA analysis results for the defined outputs. The tables shows the
resulting solution formulas for the two types of PSNs (CJIS – court-oriented, PEMS – police
oriented) for each output defined in Table 4.1. Additionally, a letter (in the column “Config”)
labels each configuration for ease of identification. For example, for court-oriented PSNs (CJIS)
two configurations exist for the output OPerfIMP (the PSN exhibits improved performance). The
first configuration (”A”) is high in membership for all listed factors except CNGov, CNProc, and
ITProc. It has high consistency (.9221) and is present in approximately 3% of the PSNs (coverage
is .0325). The second configuration (“B”) is high in membership for all factors except ITStrat. It
also has high consistency (.9026) and is present in approximately 13% of the PSNs (coverage is
.1282).
For each type of PSN, unique labeled configurations visually show that only four
configurations exist for each type of PSN. Consistency for each configuration is above 0.8
indicating configuration validity. Additionally many of the configurations have consistency of 1.0
indicating the configuration exists as a perfect subset within the output (meaning a very distinct
and well-defined configuration). It can also be seen that the coverage for each configuration
shows little variation across the analyzed outputs indicating further validation of the
configurations (a different coverage for a configuration would indicate that different numbers of
151
PSNs populate the configurations based on the output being analyzed and therefore could not
be considered a well-defined configuration).
Although certain configurations are present in many of the outcomes analyzed this does not
translate to the configuration being more prevalent for PSNs. Coverage is the measure of the
prevalence of the configuration. Configurations appearing for multiple outputs mean the set of
causal conditions defining the configuration is sufficient for those outputs. A configuration that
appears many times represents a sufficient set of conditions for many outputs but not
necessarily a predominant PSN configuration.
Table 4.7 lists the four configurations existing for each type of PSN. The table includes
average consistency and coverage also.
4.7 Discussion
This study’s results clearly show unique and well-defined configurations for PSNs in this data
set. As per previous research the existence of two types of PSNs is confirmed (court-oriented
and police-oriented) with each type having four configurations. Configurations exhibit very high
consistency (almost all over .95) indicating valid configurations. For each of the two types of
PSNs approximately one-third of the PSNs exist in one of the configurations (the other two-
thirds of the PSNs exist in configurations that are not consistent and therefore not valid as
configurations).
Additionally the configurations are very robust and do not vary when different calibration
techniques are used. As stated previously, determining calibration technique was by “trial and
error” using linear, counting, and direct calibration techniques varying these techniques for
questions that did not have justifiable calibration definitions. Although these questions did not
contain sufficient information to justify using a fine-grained calibration, like an S-curve, they
152
nevertheless clearly define the crossover point (membership = 0.5). Therefore the lack of
impact of calibration on the fsQCA runs means the presence of the factor is important in
deriving the configurations but the degree of presence (membership > 0.5) does not add to the
analysis.
Potentially a reason for this result is different interpretations of some survey questions by
each informant. The informants agree on being “in” the set for the factor but the degree of “in”
is not consistent across them. The data are very precise about defining “in” but very noisy
otherwise. Therefore, a fine-grained calibration method does nothing to influence the noisy
part of the data and resulting configurations are very robust using this study’s calibration
method.
Additionally, the maturity variable (MATURE) is not supported as a time proxy, meaning it
cannot be used to reflect the sequence of PSN configurations. Not mature PSNs do not exhibit
any underlying pattern of factors useful to group them into configurations. From a set-theory
perspective, this means there is no combination of management and use level factors that
subsumes the set of immature PSNs (or closely subsumes it). The next section details
implications of each of these findings including the impact of each finding on PSNs in general.
4.7.1 Implications of Inconsistent Configurations for NOT Mature PSNs
The intent of exploring the existence of configurations for mature and NOT mature PSNs
was addition of a time dimension to this analysis. A time dimension helps determine if PSN
configurations change over time and potentially conform to outcome basins of a strange
attractor. Without the time dimension, the analysis uncovers configurations for PSNs, which is
significant in the Public Safety domain, but does not advance CT conceptions of PSN
development as proposed in this research.
153
Since results did not indicate consistent configurations for both mature and NOT mature
PSNs there is not sufficient evidence configurations exist as outcome basins. Although CT
concepts strongly suggest configurations are outcome basins it is not confirmed by the study.
Therefore the study does not answer the research question,
Do the PSN configurations conform to the Chaos Theory concept of outcome basins of a
strange attractor?
Although this result does not answer the research question, it still has significant value to
PSN research. Since this result utilizes management and use level factors (factors with low bias)
the inconsistency indicates that before PSNs reach mature operations there are issues regarding
the level of government influencing the PSN development. Potentially these factors are still
developing for “immature” PSNs and there is no consistency in them. Early stages of PSN
development may be very sensitive to initial conditions resulting in PSN being different, making
configuration identification impossible. It suggests that the early stages of PSN development are
particularly problematic for public safety administrators and time horizons may be very short.
This is an area for further PSN research.
It is also important to realize that when doing a configuration analysis using fsQCA and
survey results (as in this study) the question has to be asked regarding what is being measured;
the consistency of the PSN configurations or consistency of the informant responses. For
example, since survey respondents have deep career investments in the PSN, answers to
questions that constitute outcomes may be overstated to give a favorable perception of the
PSN. As a result, the survey measures the consistency of behavior of the informants rather than
the actual state of the PSN.
To lessen the possibility of studying informant behavior and not the PSN, the maturity of
the PSN was specifically measured against management and use level characteristics and not
154
derived from questions that might be perceived as relating to success or failure of the PSN (such
as the variables used for the outputs analysis). This solves the measurement identification but
potentially introduces a new question regarding the two analyses. Analysis uses different causal
conditions for maturity and outcome analysis and questions the validity of using one analysis
(maturity) result for the other analysis (outcomes).
Answering this question requires applying a set perspective to the analysis. Regardless of
whether an analysis includes certain types of sets, the data still exists in those sets. Therefore,
data resulting in inconsistent configurations for the “not mature” set will also result in
inconsistent configurations when analyzed for the outcome set. Changing the set analysis does
not change the underlying nature of the data. Even though the analysis for maturity and PSN
outcomes utilize different causal factors, the lack of configurations in the more fact-based
maturity factors casts sufficient doubt about the existence of any configurations that exist for
not mature PSNs regardless of the factors used. Similarly, the existence of maturity
configurations for “mature” PSNs gives support to the configurations that are extracted using
PSN outcomes and PSN factors.
4.7.2 Implications of Consistent Configurations for PSN Output Analysis
Analysis of PSN configurations based on PSN output variables as combinations of PSN survey
variables resulted in four unique configurations for each type of PSN. Although these
configurations may represent outcome basins for a PSN strange attractor, study results are
inconclusive. These configurations represent possible states for mature PSNs.
Results are consistent with previous research on IS configurations (Lyytinen & Damsgaard,
2011) and confirm that PSNs, as a type of IOS, mature into unique configurations. These
configurations exhibit very high consistency indicating that PSNs exist in well-defined sets of
factors. The fact that these configurations exist across many different PSN outcomes further
155
supports the existence of these configurations (based on the definitions of the factors
constituting the configurations).
Although the purpose of this study is to determine the existence of configurations and not
the interpretation of them, the resulting configurations do suggest interesting concepts for
PSNs. For example, police-oriented PSNs exhibit strong membership in collaborative network
factors (CNStrat, CNGov, CNRes, and CNProc) but vary in membership for IT related factors. This
may suggest different levels of adoption and use of IT within police-oriented PSNs resulting in
variable membership in factors such as IT governance, strategy and processes.
Another interesting concept resulting from this analysis is the impact of critical safety events
on police-oriented PSNs. Almost 15% of the police-oriented PSNs are in configurations not
having high membership in external critical event impact. Fedorowicz, et al. (2007) saw similar
results in their examination of CAPWin (a PSN near Washington, D.C.); noticing a variability in
response to critical events. Intuitively it would be expected that all PSNs would be impacted by
critical events (such as the September 11th terrorist attacks) therefore an examination of PSNs
that do not consider them impactful may be an interesting area for further research.
For example, it is conceivable that police-oriented PSNs exhibiting sensitivity to critical
events have tightly coupled agencies, so an event influencing one agency influences all agencies.
Loosely coupled agencies do not exhibit the sensitivity, so a critical event only influences the
responsible agency. Potentially configurations represent tightly coupled or loosely coupled
police-oriented PSNs react differently to critical safety events.
Additionally, court-oriented PSNs have one predominant configuration (“B”), spanning
almost 15% of the PSNs, characterized by a high membership score in all factors except IT
strategy. As shown in Chapter 3, court-oriented PSNs have many interesting characteristics, in
particular the natural hostility of the member agencies (due to their competition within the
156
courts that impede collaboration). Mature court-oriented PSNs may exhibit high membership in
collaborative network and IT factors (except strategy) as a means of overcoming the inherent
non-collaboration tendencies resulting in the configuration shown. This configuration may be
confirming research on courts calling for active collaboration strategies and processes to
overcome the systematic pressures pulling the agencies in a court apart (Ostrom & Hanson,
2010). These PSNs might be characterized as highly collaborative court-oriented PSNs.
Interestingly there are also two court-oriented PSN configurations that are not impacted by
external laws (for “C” and “D”, PLAW = 0). Typically, the impact of changing laws requires
reconfiguring court management systems to accommodate the change (for example, laws may
require changes in charging language). PSNs exhibiting low impact of law changes also score
high in IT processes therefore they may represent PSNs that have detailed processes and
procedures in place to rapidly and efficiently make configurations changes. They might be
classified as highly adaptive, or agile, court-oriented PSNs.
Tale 4.8 lists possible interpretations for each configuration. Each configuration has a
“plain-text” description and a detailed description along with the variables affecting the
interpretation. Based on the degree of membership of different variables PSNs interpretation
include established, developing, local, regional, and with different IT capabilities. The table
contains examples of possible interpretations. It is included only to represent what is possible
using the techniques of this study.
The result of this study’s analysis provides interesting insights into PSN development and
suggests many areas for further research. Results indicate that fsQCA is a compelling and
extremely valid analysis technique for PSNs and suggests the use of this technique in more detail
for this and future PSN research.
157
4.8 Conclusions
Results of this study indicate that unique and well-defined PSN configurations exist for
mature PSNs. Additionally, PSNs exist as two distinct types, court-oriented and police oriented.
The two exist without overlap within the data, confirming results of similar research on this
data.
Although the existing configurations appear to be outcome basins of a PSN strange attractor
this cannot be definitively confirmed. Likewise, the study does not confirm PSN configurations
do not exist as outcome basins either. The lack of consistency in results for the temporal
aspects of this research precludes drawing any definitive conclusions.
Since the method used in the study resulted in configurations of PSNs and even though it
did not support inclusion of a time domain measure (maturity) it does tend to favor a positive
answer to the second research question for this study,
Can PSN strange attractors and outcome basins be identified using fuzzy-set social
science?
The reason for inconsistent NOT mature configurations does not suggest flaws in the
method employed (fuzzy-set analysis) but rather suggests that PSNs may not exist in unique
configurations during early stages of their development. This conclusion has support from the
observation that the inconsistent configurations resulted from objective informant responses
regarding management and use of the PSN rather than subjective outcome responses.
Therefore, it is reasonable to attribute the lack of consistent configurations for NOT mature
PSNs as inherent in the PSN and not resulting from the measure.
This study does show the value of using use of fuzzy-set analysis and its appropriateness for
systems that do not have a significant number of quantitative performance metrics. Such
systems require analysis using a mix of quantitative and qualitative metrics. PSNs fall into this
158
category and although there are initiatives in process to develop more quantitative metrics
(Sebutinde, 2003) work in this area is still at very early stages. Fuzzy-set analysis, through set-
theoretic concepts, has its use in evaluating PSNs using mainly qualitative data (and quantitative
metrics if they exist).
This study also introduced many new and compelling areas for further research in PSNs. Re-
confirming the existence of PSNs in two distinct types suggests further PSN research needs to
distinguish these two types. Studies that use populations including both these PSN types may
not produce meaningful results because the two types are distinct and need to be analyzed
separately. Within these two types of PSNs, this study uncovered many configurations and
areas for further research.
4.8.1 Study Limitations
Data used in this study does not cover all the PSN variables developed for the PSN State
Space Model in sufficient detail for a rigorous examination of PSN configurations. Uncovered
variables may be hiding configurations that may otherwise exist, based on the model.
Nevertheless, the analysis can be used to give valuable PSN insight in the very specific areas that
are covered, as demonstrated by Sawyer, et al. (2012).
A time dimension also needs to be associated with the resultant configurations. Outcome
basins are a component of strange attractors, which are a trajectory of the state of a system.
Therefore, extraction of configurations must have a means to sequence the configurations and
show the underlying attractor and outcome basins. The PSN survey utilized questions regarding
age of the PSN, but specificity was lacking in the question and resulting answers were
inconsistent. Research employing complexity concepts, such as strange attractors, must have
very specific and well-constructed time descriptors developed.
159
Additionally, the data represents a mix of data types (quantitative, scale, open-ended)
across many aspects of PSNs. Analysis required a process of recoding questions, mappings of
questions to factors, calibration of factors, and simplifications (averaging). Due to the numerous
“trial and error” experiments, and the configuration consistencies of the results across these
experiments, the extraction of configurations is not in doubt but the interpretation of the
configurations can be questioned. Accessing the validity of the interpretation of these
configurations is undoubtedly a separate study unto itself. As interpretation was not a goal of
this research, valid interpretation of the configurations is not a serious limitation.
4.8.2 Implications for Practice
The existence of mature PSNs in consistent configurations indicates that PSNs are
developing into different types. These configurations and their associated variables may spell
success for PSNs. PSN administrators and managers need to recognize that guiding their PSNs
into certain states may result in a higher likelihood of success. For example, referring to Table
4.7, most configurations score high in degree of membership for governance, strategies, and
processes, indicating successful PSNs have worked out how to make decisions (governance),
have shared goals (strategy), and have developed working relationships among its agencies
(processes). Successful PSNs have learned how to collaborate and cooperate.
This result is more compelling when coupled with the inconsistency of configurations for
NOT mature PSNs. PSNs may be in very volatile states in their early development stages. They
are trying to find themselves and may be very susceptible to unanticipated outcomes during
early development stages. Therefore, initially, their strange attractor may contain no outcome
basins and then settle into a few basins overtime. For managers this means intense focus on the
development of the PSN is required in its early stages.
160
In addition to analysis of individual PSNs, this research has application as a tool for analysis
of PSN groups. This may be very useful when PSN regionalization attempts apply initiatives
across regional or state levels. For example, within a State, police-oriented PSNs may be very
sophisticated using advanced technologies when located in metropolitan areas and exist side-
by-side with very rural small PSNs that just a few years ago were volunteer organizations. Using
techniques from this study characterizing all the types of PSNs in the State may provide better
insights into the impact of initiatives instituted across the State.
This study shows how to derive the configurations of PSNs. The next step in the research
process is to determine why the PSNs evolve into these configurations, which is a subject for
future research.
4.8.3 Areas for Future Research
After identifying the different configurations for PSNs, the next step is to determine why
they evolve into these configurations. Table 4.8 lists possible interpretations of each PSN
configuration and gives possible reasons for the interpretation. For example, configuration “A”
represents a developing CJIS because it is operationally mature but has to develop governance,
adequate resourcing, or processes. These may develop over time.
Information provided in Table 4.8 is not definitive. The goal of this study is to determine if
configurations exist and how to derive them. Table 4.8 is an example of the interpretation that
could result from future research using results from this study by adding investigations into each
configuration and analysis of the PSNs in the configuration to determine why they evolved this
way.
Additionally, the study suggests detailed investigation of each output variable. This research
identified the configurations that are present across the range of defined outputs. The
association of outputs to configurations needs investigation. A richer interpretation of each
161
configuration may result by adding an extra level of analysis and looking at correlations of
configurations to outputs.
Outputs shown are not exclusive to this PSN data set. Different survey question
combinations may create different output states and their resultant configurations based on the
goals for a particular research program. For example, Sawyer (2012) uses fsQCA and this data
set to identify patterns and configurations related to IT architecture using questions related to
success of the PSN as the outcome. Results indicated IT architectures used in successful PSNs.
Other studies could utilize different outcomes even using some variables that, in this research
were inputs. For example, CNGov, Collaborative Network Governance, used in this research as
an input, could be used as an outcome investigating configurations exhibiting high degrees of
Collaborative Network Governance.
In addition, analysis is not limited to outcomes exhibiting high degrees of membership.
Equally, important and possible using these studies techniques is the analysis of PSNs “not”
exhibiting the output. For example, CNGov analysis could examine PSNs that do “not” have high
degrees of membership in this variable. This should provide additional insight and
understanding of why PSNs evolve to certain configurations and why they sometimes do not.
Future research also requires the development of a variable to measure time so that the
configurations can be definitively determined to correspond to strange attractor outcome
basins. Although this research strongly suggests the configurations are outcome basins, the lack
of a consistent time measure precluded a definitive answer.
162
5 Study 3: Mandated and Emergent IOS Development:
Application of Strange Attractors to Information Systems in
the Public Sector
5.1 Introduction The current economic crisis heightens focus and attention on governments to do “more
with less”, but the call for efficient government agencies has echoed for years. Seemingly a case
of “déjà vu”, David Osbourne, in his 1993 seminal essay on reinventing government stated, “The
unprecedented, ongoing fiscal crisis has created a sudden urgency to do more with
less”(Osborne, 1993). Recently President Barack Obama, in his tasking of government to do
“more with less”, mandated that “…Government has a responsibility to streamline and make
more efficient its service delivery to better serve the public60”.
Solutions to doing “more with less” many times center on increasing productivity and
efficiency of services. “Productivity demands have required that managers do more with less
through improved efficiency and reduced costs”(Ulrich, 1995). One solution to “doing more with
less” is the establishment of collaborative networks. A collaborative network is “the joint
organizational entity, infrastructure, business processes, resources, and relationships which
support a shared effort to provide some collective benefit, whether it is a program, service, or a
product” (Fedorowicz, Gogan, & Williams, 2006). When the collective benefit is increased
operational productivity and effectiveness the organization is “doing more with less”.
When organizations form collaborative networks they increasingly use information and
communications technology (ICT) to support shared product offerings, services, and business
60
Executive Order--Streamlining Service Delivery and Improving Customer Service (April 27, 2011) http://www.whitehouse.gov/the-press-office/2011/04/27/executive-order-streamlining-service-delivery-and-improving-customer-ser
163
processes. They become complex organizations of diverse interconnected, interdependent, and
adaptive agents (Tanriverdi, Rai, & Venkatraman, 2010). Many times, they create
interorganizational systems (IOS) to provide the connecting infrastructure (ICT) to support the
exchange of information across the system on a continuing basis and enable far-reaching agent
interactions (Cash & Konsynski, 1985; Fedorowicz, Gogan, & Williams, 2007).
The creation of an IOS may be mandated, “top-down” to all agencies or emerge from the
interaction of the agencies. In hierarchical centralized organizations, decisions are made almost
exclusively at top managerial levels (Weber, 1968). IOS creation decisions are no exception. IOS
appear as Government mandated consolidation of ICT services and reorganizations, from high
levels of government to the public service agency level. It is generally accepted that decisions
regarding the degree of consolidation of public services, such as IOS creation, are formulated by
those who craft public policy (Provan & Milward, 2001). Therefore, decisions come from the top
of the governance bureaucracy and IOS creation is a “top-down”, mandated, phenomenon.
However, not all public service agencies exist within a bureaucratic system. Some agencies
are essentially autonomous and have freedom to make their own decisions about how they
work and with whom they work. When these agencies are in proximity to each other, on a
seemingly voluntary basis they work together, collaborate, and in many cases share services to
provide efficient and effective public services (Boyne, 2003). For these organizations, IOS
emerge from the interaction of the autonomous, but collaborating, agents.
Creation of an IOS can also be from a mix of mandate and emergence. An example is the
recent US Department of Labor funded feasibility study on a collaborative effort between
Tennessee, North Carolina, South Carolina, and Georgia to develop a common core
unemployment system. As the director of the study stated, “. . . the Department of Labor made
164
it clear it does not want to help fund 50 separate software development programs” (Raths, 2012)
and was looking for a shared solution across the States. Although funding such programs is
“top-down”, from the Federal Government, the IOS creation occurs at the State level. In this
case, the state unemployment agencies must figure out how to create an IOS supporting
unemployment services to reap the benefits of Federal funding. Federal funding mandates IOS
creation but the IOS emerges from the collaborating State agencies.
Information Systems (IS) literature refers to mandated processes as “top-down”, and non-
mandated, emergent processes as “bottom-up” (Klein & Kozlowski, 2000; Nan, 2011). Similarly
this study examines the IS process of IOS creation as a combination of “top-down” mandate and
“bottom-up” emergence from interacting agents. For the purposes of this research, mandated
IOS development61 refers to IOS resulting from “top-down” mandated processes and emergent
IOS development refers to IOS resulting from “bottom-up” non-mandated, emergent processes.
The resulting IOS is a complex system resulting from multi-level interactions of member
agencies embedded in an environment mandating the IOS to some degree. In particular, this
study will examine IOS creation within the public sector, in particular within Public Safety
Networks (PSN).
This study uses the PSN State Space Process and CAS models (Figure 3.4 and 3.6) to analyze
IOS development. The PSN State Space CAS model depicts the state of an IOS development, at
any given time, emerging from within the PSN (agents, context, and collaboration) combined
with mandates from the external environment. The PSN State Space Process model uses the
CAS model resulting in state changes that reflect the changing combination of mandate and
emergence in the development of the IOS. Diagramming the state changes in state space
61
Development of an IOS refers to activities and processes for IOS creation, activities, and processes to achieve its current state.
165
produces the IOS strange attractor enabling analysis of the contributions of both mandate and
emergence for the IOS development. Understanding the impact of both mandate and
emergence in an IOS is particularly important for PSNs because recent studies are concluding
that regionalization of public sector services result in efficiencies neither centralized or
decentralized services can realize (Feiock, 2004; Raths, 2012). PSNs may undergo mandated
consolidation into regional PSNs but be left to manage the IOS as an emergent process.
5.2 Mandated and Emergent IOS Development – A Review
The advantages and disadvantage of mandated and emergent IOS development makes for a
challenging management problem for IOS developers. Mandated IOS development typically
involves some type of incentive for organizations to work together including adding resources to
the IOS development or career enhancement for the individuals involved. In contrast, emergent
IOS development involves voluntary collaboration and requires trust among organizations. Trust
may take time to develop; therefore, management must be committed to the IOS development
to achieve long-term effectiveness (Popp, MacKean, Casebeer, Milward, & Lindstrom, 2013).
For IOS managers challenges exist in understanding how to mandate development and when to
let it emerge.
The complexity of IOS development, as a multi-level phenomenon, contributes to its
challenge to management. At one level, an IOS supports a collaborative network with specific
shared service goals, but when embedded into a larger environment it is part of a governance
network where organizations target broader common goals (Klijn, Koppenjan, & Termeer, 1995;
Provan & Kenis, 2007; Rhodes & MacKechnie, 2003). Conceptualizations of an IOS as strictly
resulting from formal mandate is too restrictive and omits IOS that emerge when organizations
166
work toward a common broad goal62 (Isett, Mergel, LeRoux, Mischen, & Rethemeyer, 2011). IOS
develop both from mandate and from emergence.
Additionally, mandated and emergent IOS developments interact. For example, although
trust is a requirement for emergent IOS development it also affects mandates. When
organizations are in a trusting, collaborative relationship mandates increase collaboration due to
incentives (i.e. resources) received. When the relationships are less trusting, mandates highlight
the lack of participants desire to collaborate, further straining the relationship and potentially
leading to “turf wars” (Hefferen, McDonald, Casbeer, & Wallsten, 2003).
Therefore, IOS development requires attention to how a mandate, or governance
mechanisms, affects collaboration. Governance mechanisms for mandated and emergent IOS
development falls into three broad categories based on its impact on collaboration between the
member agencies of the IOS. The following details each mechanism (Ouchi, 1979).
Bureaucratic mechanisms influence behavior by imposing constraints upon agencies.
Mechanisms include management decree, formal rules and regulations, and
performance monitoring. “Top-down” mandates typify these types of mechanisms.
Market mechanisms rely on incentives that re-orient the agencies towards their
interests. Examples, as stated above, include additional resources or workers to
incentive a type of behavior, such as collaboration. Mechanisms work by manipulating
agency interests but may result in collaboration to maintain legitimacy rather than
cooperative benefits representing a mix of mandated and emergent development.
Clan mechanisms target the establishment of collaborative values within the IOS
agencies. Members share values and beliefs that enhance collaboration. Mechanisms
intend to enhance interaction and include joint task forces, committees, training
62
For this study, the goal is public safety.

167
sessions, and other joint activities. This mechanism tends to be closely aligned to
emergent development.
IOS development occurs over time with each of these mechanisms playing a role in the
development (Rodriguez, Langley, Beland, & Denis, 2007). For example, early in the IOS
development bureaucratic mechanisms mobilize the agencies toward establishing the IOS.
This may occur through a mandate. Market mechanisms incentivize agencies to remain with
the IOS by altering the agencies interests in the IOS. The IOS may provide capabilities each
agency cannot achieve in isolation. Mandates motivate or enhance emergent IOS
development. As the IOS becomes operational clan mechanisms act to smooth operations
and collaboration by instilling shared values among the agencies. This requires continuous
effort and keeps all the agencies operating “on the same page”. When clan mechanisms are
in place, the IOS emerges into an operationally efficient entity.
The governance mechanism perspective on mandated and emergent IOS development
parallels CT perspectives. Bureaucratic mechanisms represent the causal events intended to
create an outcome. Market mechanisms determine agent’s fitness and influence their
adaptive capabilities. Clan mechanisms promote inter-action among the agents and result in
emergent IOS capabilities. As proposed in CT and this research, the problem with the Ouchi
(1979) perspective is its focus on mechanisms, or causality, resulting in behaviors and
outcomes. Within complex IOS, causes cannot be determined, therefore a state space
analysis using strange attractors is required to understand and explain mandated and
emergent IOS development.
5.3 Expected Contribution to Research on Public Sector IOS
The purpose of this study is to examine IOS creation in a PSN, resulting from mandated and
emergent processes. Through examination of a case study PSN, by example, it answers the third

168
research question, how can using the strange attractor concept from Chaos Theory and Complex
Adaptive Systems help IOS developments meet their goals? From a CT perspective, the resulting
IOS exists as a configuration or outcome basins of the strange attractor describing the
development of the PSN. Findings applying the models developed in Chapter 3 reveal mandated
and emergent IOS development processes and show how managers can use these processes to
guide the IOS development into states conforming to organizational goals.
This research contributes a CT perspective on the reinvention of government through IOS
creation and identifies a new and unexplored complex process for governments to achieve
efficiency gains from collaborating when developing IS. It extends current research in public
sector IS to include IOS developments combining mandated and emergent processes and uses
CAS and Chaos Theory to model such developments. In the public safety domain, this will lead
to more efficient and effective safety operations and ultimately help protect citizens.
The study’s structure is as follows. Sections 5.4 details the method used for examining a
specific IOS development for Public Safety Network services in Clermont County, Ohio. The PSN
State Space CAS and Process models, derived in Chapter 3, result in the strange attractor for the
IOS. Findings (Section 5.5) detail important conditions leading to mandated and emergent IOS
development and the derivation of the strange attractor for the specific IOS development.
Section 5.5 discusses the characteristics of the IOS development strange attractor properties,
showing IOS emerge when agencies form “tight” networked collaborations, share critical goals,
and concentrate knowledge in one agency. Although mandates may be critical in the creation of
the IOS, during IOS development, findings show they become part of the emergent process and
result from PSN outcomes feeding back from the external environment.
169
The study concludes (Section 5.6) with an examination of how managers can use the IOS
development strange attractor to analyze IOS development and guide it toward targeted goals.
Findings support the research model for public sector IOS creation providing a CT theoretical
perspective on mandated and emergent processes in multi-agent systems.
5.4 Method
The research method is a single case study of a public safety network supporting law
enforcement, fire, emergency medical, and transportation services. The case under study is a
collaborative network of public safety agencies within Clermont County, Ohio, the Clermont
County Division of Public Safety Services (DPSS). The method employs a single case study
analysis using techniques from Yin (2009). Case study method was chosen to satisfy needs for
exploration, description and explanation of how strange attractors can be used to study
collaboration leading to consolidations in PSNs. Case study best addresses this type of research
question especially when system change is highly dependent on context and environment (Yin,
1981).
The study uses semi-structured interviews guided by a documented interview protocol
(Miskon, Bandara, Field, & Gable, 2009). Based on previous research on PSNs63, questions
generated included inquiries into the external environment, agency context, collaboration, and
technology. Specifically, informant questions included topics such as governance, economics,
politics, critical safety events, processes, resources, stakeholders, champions, and ICT
infrastructure.
Like study 1, this study relies on process building through narratives (Pentland, 1999;
Pettigrew, 1990) and metaphors derived from CAS and Chaos Theory (McBride, 2005). The
63
From the Public Safety Networks Study, http://www.publicsafetynetworksstudy.org/
170
method of narrative analysis mirrors the method in Chapter 3 and is summarized in the
following sections, with particulars to this study noted.
5.4.1 Narrative Analysis and Coding
Narrative analysis involves the construction of a chronological description of a series of
events or a process. The methodology utilized relies on extracting the states of the PSN through
narrative and metaphors derived from CAS and Chaos Theory.
Analysis of lengthy interview and archival data utilizing a systematic narrative construction
approach summarizes key aspects of the PSN development. The coding section (5.4.3) details
the systematic approach of structural analysis, from Davidson (1997) (accounting for the
informant’s perspective), used in this study. Structural analysis resulted in the narrative of the
PSN development.
The narrative is the result of the case study investigation and considered part of the case
study data. Interviews, archival documents, and the narrative constitute the set of data
analyzed. A detailed case study protocol guided interviews (Table 5.2). The case study protocol
utilizes open-ended questions that do not constrain the informants thought process and can be
used to link pieces of evidence and issues and create the narrative. Answers to open-ended
questions focused available evidence on important events or situations that require
interpretation.
For this study, open-ended questions aim to uncover the state of the PSN (and IOS
development) by exploring the different PSN model state variables. A chronological narrative
construction provides insights into outcomes, such as bifurcation and open-ended questions,
and focuses the narrative on the state of the IS. The following sections detail the case
understudy, data, and coding.
171
5.4.2 Case Study
Sharing of technologies and services, such as in an IOS, occurs over time involving the
actors, institutions and relational ties of the collaborating agencies (Feiock, 2007). This is an
evolutionary process requiring longitudinal analysis. This study reports on interview and
archival data about a single case over a multi-year period.
5.4.2.1 Public Safety Networks
Public safety networks (PSNs) are inter-agency collaborations focused on the development
and use of information and communication technologies (ICT) to support the information
sharing and functional interoperability needs of public safety organizations engaged in law
enforcement, criminal justice, and emergency response (Williams et al., 2009). In the United
States, PSNs are government agencies existing at local (city and county) and state levels.
PSNs are typically structured along agency boundaries specified by the organizations that
are tasked with capturing and using information and systems (Gil-Garcia, Soon Ae, & Janssen,
2009). Governments try to structure PSNs as bureaucracies creating challenges in information
sharing across multiple agencies and the collaboration of the agencies to form a PSN (Anderson
& Dawes, 1991; Gil-Garcia, et al., 2009). The main barriers to the effectiveness of the PSN are
organizational, political and legal (Pardo, Gil-Garcia, & Burke, 2008). To increase effectiveness,
PSNs collaborate by sharing functions and services.
5.4.2.2 The Clermont County Division of Public Safety Services
The case under study is the Clermont County Division of Public Safety Services (DPSS), a
county level PSN. Formed and managed by Clermont County in the State of Ohio it provides
public safety services and communications services for the departments of transportation, law
enforcement (Sheriff and Police), fire, emergency medical services (EMS), and emergency
management.
172
Although initially formed from the “top-down” as a mandated entity for the Sheriff the
addition of services for police, fire, and emergency medical resulted in the emergence of an IOS
due to the collaboration of these agencies. Numerous factors affect DPSS, such as stakeholder
needs, agency interactions, State regulations, legacy systems, mutual aid, compatibility, and
finances. The choice of DPSS as a case for the study of IOS development resulted based on the
numerous factors involved during its creation and development64.
5.4.2.3 Data
Informant data included eleven semi-structured face-to-face interviews (from one to two
hours each) with twelve informants representing the DPSS staff (technical and managerial), PSN
users from the fire and police communities, and the county executive administration team and
one “ride-along” with a police officer. Interviews were on-site at the DPSS offices in Batavia,
Ohio, over three days in July 2010. One to three interviewers were present at each session, and
all interviews were recorded and professionally transcribed.
Informants discussed their motivations for participation and reflected on key milestones
and technical and non-technical challenges that they had encountered thus far. In particular,
interviews concentrated on historical perspectives, governance, political environment, funding
and budgets, key individuals, stakeholders, competition, and vision and culture.
Table 5.1 lists informants interviewed. Table 5.2 shows an example of an Interview protocol
developed for each informant or type of informant interviewed. NVIVO9 was used to code all
interviews. A systematic analysis method using state variables from existing research and
iterative axial coding as described in study 1 minimized research bias.
64
DPSS is the organization supporting connecting infrastructure (ICT) to support the exchange of information across the PSN and enables the interaction of the public safety agencies. Its role is as a public safety IOS within Clermont County. Within this study, references to DPSS are as an IOS.
173
5.4.3 Coding
Coding was done in multiple steps to first extract the relevant phases in the development
and then to provide a rich description of the events and occurrences in each phase. Initial
coding was incident-to-incident. Axial coding followed initial coding as a coding of interviews,
narrative, and selected archival data. Whereas the initial coding breaks the data into separate
pieces and codes by incident, axial coding brings the data back together in the form of
categories and subcategories.
Chapter 3 details the DPSS coding techniques using the PSN State Space CAS and Process
Model. Axial coding categories and subcategories conform to the strange attractor PSN State
Variables as detailed in Table 5.3, as part of the PSN State Space CAS Model.
Axial coding reveals the value for the factors for each interview, which when combined with
the narrative provides a sequence of state values describing the strange attractor for the DPSS.
Coding of each state value also considers and documents the conditions, agents, interactions
and consequences involving the state of the PSN at that time. This coding is iterative requiring
multiple passes through the data and possible redefinition of factors (iterative axial coding).
Memoing, along with in vivo coding, performed throughout the coding process, concentrated on
identifying, developing and identifying CAS and Chaos theory metaphors in the data.
Procedurally, coding of the case data occurred over five steps. In the first step (initial coding
– development phase), chronological ordering of interview data assigns development phases (of
the DPSS) to each narrative clause. The second step involves the construction of the narrative,
or story, describing the development of DPSS. The third step (axial coding), extracts the states
and variables for the PSN. In the fourth step (axial coding), state variables are assigned a value
and timeframe. The fifth coding step derives the trajectory or evolution of the state of DPSS

174
using a synthetic case description representing the strange attractor associated with the
development of DPSS. Details of each step are as follows.
5.4.3.1 Coding 1: Coding by DPSS Development Phase
The first coding uses interview transcriptions and archival documents to create the
chronological ordering of the interview data. Grouping narrative clauses into chronological
phases segregates them into common time-frames referred to by informants. Chronological
assignment fits the narrative characteristics (the story line) recalled by informants. Phases do
not necessarily correspond to states of the IOS development but rather acts to align each
informant’s accounts of events. Initial interview coding, by the researcher, resulted in the
development phases. The historical timeline and key events in the PSN development, as shown
in Table 5.4, determine the bounds of each phase. Two additional phases were included
describing the current state of DPSS (at the time of the interviews) and another describing a
potential future state. Each phase is described as follows,
Pre-APCO1665. This is the period prior to the implementation of the APCO16 system. It
starts with the creation of DPSS by the State mandate of E911 support and the actions
of the Sheriff’s Department to support E911 with a separate agency (DPSS).
APCO16 System. During this phase DPSS experiences growth through development of
its IOS supporting ICT based on APCO16. It begins when the APCO16 system is
introduced and transitions to a new phase when a new computer-aided dispatch (CAD)
system is introduced (DPSS is still using an APCO16 system at that time).
New-CAD. This phase describes the introduction and failure of a new CAD system. It
ends when a new replacement system is implemented and launched
65
APCO is an acronym for the Association of Public-Safety Communications Officials-International. APCO16 (and 25) are suites of standards for digital radio used by public safety agencies. It is also referred to as Project 16 (or 25) or P16 (25).
175
Current Shared Services. Narrative clauses in this phase describe the current operations
and environment for DPSS.
Futures. Informant’s thoughts on the future evolution of DPSS are included in this
phase.
At the completion of coding, the five files created contain all the narrative clauses pertaining to
each phase of the development.
5.4.3.2 Coding 2: Structural Analysis
This coding phase establishes the actors, context, problems, goals, actions and outcomes in
each development phase, by informant, through structural analysis. The method for coding and
interview analysis follows the method developed by Davidson (1997) during her field study of
three IS projects. The purpose of this coding is to produce informant descriptions of each
specific event for comparison and contrast in further analysis. Coding focuses on identifying the
informant’s perspective (account, context, description) on each event. It does not reveal state
variables or mandated or emergent processes (except through memoing).
Structural analysis results in grouping of narrative clauses into tables for each informant and
development phase. This coding resulted in the creation of thirty-four (34) structural analysis
tables. Because not all informants made statements for each development phase (or were not
involved in the phase), structural analysis does not include tables for all informants across all
phases. An example of this type of coding is included in Table 5.5. The example details the
recollections of the DPSS Director on the creation of DPSS and the contextual environment at
the time as summarized below.
- Coding 2 Example: Structural Analysis of the DPSS Director Narrative on the Creation of DPSS
176
In response to a question regarding the status of DPSS prior to their initial APCO16, radio
system introduction the DPSS the Director responded with his experiences and perceptions of
events that led to the decision to create DPSS. Details of the table and its analysis are as
follows.
Narrator’s abstract. The Narrator’s abstract provides information on the scope of the
statements by the informant. Although arrangement of narrative clauses is by
development phase, informants may limit or stress different parts of the phase. The
Director specifically discusses the status of Clermont County just prior to the creation of
DPSS.
Narrator’s Perspective. The narrative’s perspective includes any narrative clauses
revealing the narrator’s state of mind at the start of the phase. The Director describes
his current role and title in DPSS and the length of time in this position. He gives his
opinion on his responsibilities with the statement, “My job is to present what needs to
get done, and then they (the County Commissioners) make the policy decisions.”
Orientation/Contextual Descriptions. The director recalls public safety services in Ohio
at the time of DPSS creation; namely the support of certain operations by the Sheriff’s
office. He adds that at the time the County had an Administrator that was a, “great
believer” in technology. These statements, when combined with other informants
define the initial state of Clermont County at the creation of DPSS (initial conditions).
Actors. In this section the individuals or groups pertaining to his comments are defined.
Problematic Situation. According to the Director the problem was “. . . the need for a
consolidated communications center.” He defines the problem as coming from the
community, indicating some level of communication or agreement exists across a larger
group. He does not specifically state the problem, just specifying a “need”.
177
Goal/Problem Solution. In his description of the solution to the problem, the Director
further defines the problem. “E911 support” is the specific problem and “establishing a
consolidated communications center” the solution.
Actions and Events. The director lists the specific action taken, “. . . created the
Department of Public Safety Services” and who took the action (Commissioners). He
gives added detail by describing the outcome of “creation”.
Outcomes. The director gives insight into both the process (“. . . a group . . . got
together . . . and agreed. . .”) and again defines DPSS, this time as a “centralized
communications center.”
Comparing and combining this structural analysis table with those from other informants,
provides a full picture for the DPSS development narrative. Each informant account provides
details on the context of the event revealing valuable information about the state of DPSS and
its environment. Combining all tables into a narrative, results in a rich description of historical
description of DPSS results including a chronological reconstruction of events as well as the
multiple levels of context surrounding the events. Coding state variables (used in the CAS
model) relies almost exclusively on contextual descriptions. Narrative construction uses the
comparison of the informant structural tables to create the narrative.
5.4.3.3 Coding 3: Creating the DPSS Development Narrative
Constructing the Narrative is not strictly a coding task but is more a reconstruction of the
available data to create one history or story of DPSS. As an iterative process, narrative
construction involves the comparison of the each agency’s structural analysis tables by
development phase. It consists of extracting the sequence of events and actions for DPSS
followed by an analysis of meaning whereby the coherence of informant accounts of events,
contexts, and perspectives are considered. Chapter 3 details this coding method.
178
The development phases bound the sequence of timeframes for analysis. The narrative
provides details of actions and events during these phases. Although it did not occur for this
study, the detailed analysis of the development phases can result in a redefinition of
development phases and reworking the structural analysis in Coding 2. The resulting narrative66
is contained in Appendix E.
5.4.3.4 Coding 4: Extracting States and Variables – Axial Coding
Axial coding performed in the style of Grounded Theory results in multiple coding passes
through the DPSS narrative. The first pass involves assignment of PSN State variables to
narrative clauses describing actions, events, perceptions, and behaviors (based on the coder’s
determination of best fit to the clause). Determining best fit uses Strauss and Corbin’s paradigm
model (Heath & Cowley, 2004) considering the conditions, interactions, strategies and
consequences of the clause as described in Chapter 3. The process of assigning narrative clauses
to variables and modification of variables (if needed) continues until no further modification of
variables is required. Each set of variables, for a given timeframe, represents a state of DPSS.
When sequentially arranged, the sets of variables for the DPSS development, and an associated
coding of the narrative to these variables, enables the construction of the DPSS development
strange attractor, which in turn provides the insight into the mandated and emergent
development of DPSS.
- State Variables represent context, mandate, and emergence
Variables represent both the context, relating to the structure of the PSN, and impact,
relating to mandate and emergence. Contextually, variables describe each context, or level,
represented in the PSN State Space CAS model. Variables apply to the exogenous, external
66
The narrative contains coding results from coding 4 and 5 only to keep from reproducing the lengthy narrative multiple times.
179
environment (external to the County) and endogenous, agency context (agencies exist at the
County level). Variables also represent rules and factors describing DPSS. In the CAS model,
rules specify and factors influence agent behavior. Within this study, rules represent variables
for mandated IOS development and factors represent variables for emergent IOS development.
For example, State law, such as the mandated support of E911 services, contextually is
external to the County prescribing an action by the County (i.e. resulting in the creation of
DPSS). Therefore, it is an exogenous environmental rule and contributes to mandated IOS
development. In contrast, the economic condition of the County is a factor, because it
influences behavior at the agency level. A recessive economy may motivate agencies to control
costs through economies of scale and share services (and DPSS emerges as an IOS). Therefore, it
is an endogenous environmental factor and contributes to emergent IOS development.
Table 5.3 lists the set of PSN State variables used. An example of the assignment of
variables to a narrative clause, from the DPSS narrative, follows.
DPSS governance is a function of the laws of the county legislature and the supported
functionality of the PSN. From its formation until 2004 the DPSS was also controlled by a
Communications Advisory Board (CAB) which was disbanded, mainly because the
developments they advised upon were completed. DPSS went the next few years without
an advisory board, managing daily operations though their own management.
The first phrase coded is “DPSS governance is a function of the laws of the county legislature. . .”
referring to the need for DPSS to follow existing County laws. Therefore, it codes to the external
environment variable, Governance/Political, describing external laws. The second coded phrase,
“From its formation until 2004 the DPSS was also controlled by a Communications Advisory
Board (CAB)”, refers to direct control of DPSS. Therefore, it codes to the Governance/Authority
180
variable representing who controls DPSS. The third coded phrase “DPSS went the next few years
without an advisory board, managing daily operations though their own management,”
indicates DPSS self-management. This also codes to Governance/Authority, but as will be seen
in the next section has a different timeframe than the second coding.
5.4.3.5 Coding 5: Assignment of Coded Values and Time Sequences to Narrative Clauses
The concluding step in coding the narrative is to assign a value to each coded narrative
clause and a finer time sequence to the behaviors and actions described. Assigning values to
each clause serves two purposes in the research. First, the ability to assign values, consistently
across coding iterations, indicates the coding exercise has saturated and, second, the values
define the state of the PSN and enable the construction of its strange attractor.
Using the example from the previous section, assignment of values is as follows. The first
coding, regarding laws, results in a Governance/Political value of “impactful” since it describes
the impact of governance. The tense of the phrase (“is”) results in coding it as “current”67. The
second coding, regarding the CAB, results in a Governance/Authority value of “stable” starting in
2004 until its disbanding68 in 2007. Since it is disbanded in 2007, at this date the value becomes
“changing”. The third coding, regarding DPSS self governance, results in Governance/Authority
being “changing” as the governance is determined by the interaction of the agencies; as the
agents adapt the governance changes. This covers the time span from 2007 (disbanding of the
CAB) until the creation of the Communications User Group in 2010. With the assignment of
values and timeframes to each variable diagramming can proceed, leading to construction of the
strange attractor.
67
Note “current” for this study is July 2010. 68
The next clause in the narrative gave the disband timeframe. Information regarding timeframes for each coding is not necessarily contained in each clause but requires comparison across clauses describing the event.
181
5.4.3.6 Coding 6: Synthetic Case Description
Diagramming of codings provides a concrete image of concepts and ideas regarding the
system under analysis. Diagramming is a visual representation of the categories and their
relationships throughout the narrative description of the case. Synthetic case description (SCD),
for the period under study, elaborates all the narrative’s state variables values and can be read
at once, using one single page tabular diagram (Rihoux, Joly, & Dandoy, 2008). Symbols
represent assigned values. Therefore, a tabular SCD’s columns represent the sequential
measure of the coding (i.e. time, calendar time, months, or years) and the rows, the variable
value symbols describing the state of the system. In this research, the SCD utilizes an Excel table
where rows and columns represent the horizontal and vertical axis. Symbols placed at the
intersecting cell of the row and column of the table representing the value of the factor at that
specific time.
Because the SCD is a diagram of the states of the system, it closely resembles a system’s
strange attractor69 and traces the development of a system. Section 5.4.2 describes the use of
the DPSS SCD to generate its strange attractor. The SCD for DPSS is broken down into calendar
year quarters. Symbolic coding of the DPSS factors is included in the Coding 5 protocol shown in
Table 5.6. Figure 5.1 depicts the resulting SCD.
5.5 Findings
The following to sections present the findings for this study. The first section details the
development history of DPSS as a combination of mandate and emergent processes. The
second sections details DPSS as an IOS, considering development states as outcome basins in its
strange attractor. Both sets of findings use the constructed narrative and resulting SCD.
69
Because it is not diagrammed in state space, it is not an exact representation.
182
5.5.1 The Mandated and Emergent Development of DPSS
DPSS provides voice and data communications, law enforcement computer aided dispatch
(CAD) and emergency management services to Clermont County. The evolution of DPSS to its
current structure resulted from the trend within the County to transition from local
organizational control to shared services under DPSS. Appendix E provides the details of the
development over the period studied (1987 – 2010). A summary follows, noting mandated and
emergent influences on DPSS development.
Prior to 1987, in the State of Ohio and Clermont County, individual, autonomous agencies
provided and controlled all safety services. In particular, county communications and
dispatch capabilities and support centered on the County Sheriff.
The key event causing the creation of DPSS was the State mandate (Ohio Administrative
Code, 4901) that all counties must provide an emergency 911 (E911) capability to its
citizens. With the increased complexity of the mandated system, the County Sheriff was
motivated to see this capability fall under a separate agency and initiated the creation of
DPSS. Although DPSS supports many agencies, in Clermont County, mandate prescribes only
the support of communications, dispatch services, and E911 for the County Sheriff. The State
of Ohio mandated the E911 capability supported by DPSS, but DPSS creation emerged from
the interaction of the Sheriff with the County.
Over time, due to the complexity of their operations and increased costs, local police and
fire departments began consolidating their public safety communications and dispatch
services under DPSS. Many of these departments, just a decade ago, were volunteer or
part-time organizations (in particular volunteer fire departments) which had grown into full-
fledged service organizations with the growth of the county population. Factors, including
the increased dispatch and communications needs of these departments, coupled with the
183
high technology costs, accelerated the growth and emergence of DPSS as an IOS supporting
most of the County.
A fourth player (in addition to the County Sheriff, Police, and Fire) affecting DPSS growth
was the State of Ohio and its Multi-Access Radio Communications System (MARCS). MARCS
is a statewide communications system supporting public safety agencies. Currently DPSS is
part of the MARCS network providing communications infrastructure for MARCS in Clermont
County. The State provides funding to DPSS for supporting MARCS. DPSS uses existing ICT
infrastructure to support MARCS, therefore, MARCS support is not mandated. Additional
funding (for MARCS support) strongly motivates DPSS to provide the support.
Currently, DPSS has evolved into a complex IOS for public safety communications and
dispatch services supporting the Sheriff, local police and fire, MARCS, and emergency
medical services. Additionally, DPSS coordinates services with neighboring Union Township
and Northeast Communications Center. Figure 5.2 depicts the resulting DPSS agency
network. As can be seen, DPSS includes its own capabilities, such as radio communications,
CAD, and centralized services. It also exists as part of a larger network with other county
PSNs, the Ohio MARCS system, and neighboring counties.
5.5.2 Finding from the Synthetic Case Description for DPSS
Figure 5.1 depicts the DPSS SCD. As can be seen, four states result for the development of
DPSS. States represent times of relative stability in the state variables. Stability in a factor may
correspond to unchanging state variable values or consistent change in one direction (such as
always increasing). Development state boundaries are marked by state variable values rapidly
changing (or change in direction) as measured by the researcher. Each is detailed as follows.
State 1: Volunteer Services – This is the initial state for public safety services in Clermont
County. It is not strictly a state of DPSS (because DPSS does not yet exist), but rather the
184
state of the County just prior to the creation of DPSS. This state is characterized by the
autonomy of each public safety agency; most providing their services with some level of
mutual aid. Many of the agencies, at this time, were still volunteer organizations staffed
by part-time public safety members. The State of Ohio’s legislation to support E911
throughout the County (the previously noted critical event) marks the end of this state.
By default, the E911 legislation had the capability supported by the Sherriff’s department
but did not specifically mandate it. The Sheriff, unwilling to assume this responsibility,
lobbied Clermont County Commissioners for the creation of a separate organization,
DPSS, to support E911.
State 2: Emergent growth – With the establishment of DPSS, E911 support occurs
throughout the County. E911 support involves receiving emergency service request from
citizens (typically through a phone call), an E911 operator accessing the type of service
required (i.e. law enforcement, fire, EMS) and transferring the request to the appropriate
agency dispatcher for initiation of the public safety service. Dispatch occurs through
radio communication. During this state, DPSS is already supporting this entire capability
for the Sheriff and begins to support this capability for other agencies throughout the
County. Radio (voice) and dispatch services consolidate under DPSS as more and more
townships elect to utilize them to save costs and increase efficiencies. During this state
DPSS upgrades its technology to a multi-agency, multidiscipline (i.e. law enforcement,
fire, EMS) radio and data system (APCO16).
State 3: County Shared Services – This is the current state for DPSS. With the
implementation of APCO16, DPSS capabilities include shared voice, data, and dispatch
services across Clermont County. Although they do not service every township, those
that maintain autonomous operations act as back-up sites (Union and Hamilton
185
Townships). During this time, they also begin sharing services at the State level by
supporting Ohio MARCS (a Statewide Radio system). Although DPSS has technology and
collaboration problems (the CAD failure), they maintain all services throughout this state.
State 4: Regional Shared Services – This state represents a possible future state for DPSS.
The growing trend at the State level is funding regional activities that encompass
multiple counties. The hope is economies of scale will increase by further consolidation
of services. Federal funds, such as the Urban Area Security Initiatives (UASI), are diverted
to regional activates by organizations such as SOSINK (“Southwestern Ohio, Southeastern
Indiana and Northern Kentucky”) to promote safety across wider regions. DPSS would
seem to be in position to expand regionally except for the fact that their technology is
old. DPSS does not support the more capable APCO25 system, still relying on APCO16.
APCO25 capability may eventually determine which organizations become shared
regional PSNs and DPSS has strong competition from other APCO25 capable PSNs.
In the next section discusses findings with respect to mandated and emergent DPSS
development.
5.6 Discussion
The following discussion details events contributing to the state of DPSS and its development
by mandate and emergence. PSN State variables used in the PSN State Space CAS model
represent each event but the discussion is in “plain-text” providing a description of the relation
to mandate and emergence in DPSS development. Similarly, “plain-text” descriptions of
changes in DPSS state, resulting from the PSN State Space Process model, reveal patterns of
change useful for understanding, explaining, and guiding DPSS development.
186
5.6.1 Events Defining Mandated and Emergent DPSS Development
The narrative depicts a number of significant events affected the creation and development
of DPSS. Some events are mandates, such as E911 support, and some involved collaborations
between DPSS agencies. Other events fall somewhere between mandate and emergence. For
example, the availability of Federal funds may, in essence, mandate certain development
activities (or the funds are not received), but they prescribe no specific development activities.
In the discussion, mandated and emergent IOS development is a continuum from rule-based
mandates, such as laws prescribing development, to factors, such as agency culture, influencing
emergent development. Therefore, events necessary to IOS survival, such as securing necessary
operational funding, although not a rule, would fall close to mandate on the continuum.
Events fall into specific categories of critical, financial, resources, political, strategic,
governance, processes, and technology corresponding to categories of PSN State variables.
These events illustrate the mandated and emergent development of DPSS. Discussion below is
specific to DPSS, with considerations to IOS development in general added.
- Critical Event
During 2008, DPSS initiated the installation of new CAD software. Although they completed
an in-depth evaluation of the software, they failed to realize that their application was slightly
different from the current installed uses of the new software and it failed for them. Due to the
severity of the consequences of this failure, DPSS re-installed their old dispatch software and
then purchased and installed another new system. The crisis underscored the criticality of
communications to all constituents in the PSN.
For example, informants repeatedly stated their frustration with the lack of status updates,
from DPSS, regarding the failed CAD system. As a result, DPSS created a separate management
187
position for CAD and staffed the position with an individual with a history of supporting high
levels of inter-agency communications and collaboration. A new organizational structure
emerged for DPSS.
In itself, the critical event did not cause the re-organization at DPSS but the lack of inter-
action and communications with the PSN agencies precipitated the change. The critical event
exposed a deficiency in the state of DPSS, namely lack of communications, causing DPSS to re-
organize, emphasizing inter-action and communications. Critical events may act to intensify
deficiencies in an IOS and change emerges to accommodate the deficiency.
- Financial
DPSS receives financial support through user fees, charge-backs and federal grants. Because
of the County mandate to support the Sheriff’s Department, DPSS receives 75% of their
operational budget from the County operating budget. The mandate to support the Sheriff
provides assured funding for the maintenance of DPSS.
Other operational funding is less certain. A sensitive situation exists for DPSS when it
charges user fees, since suspending support, due to non-payment, is not an option for them.
Withdrawing public safety services, when a user fails to pay, potentially results in loss of life and
property. Therefore, when a user cannot pay their assessed charge (which happens with many
smaller townships) DPSS must absorb the loss. DPSS supports these townships in spite of the
financial loss they incur, suggesting that its emergence as a County IOS may be due to DPSS
goals other than operational self-sufficiency.
For DPSS, mandated support of the Sheriff Department and the associated mandated funding
to DPSS from the County, defines the minimum capabilities supported. For DPSS, mandate
defines the boundary between what it must support and what it may optionally support. DPSS
188
optionally support other townships, even if unfunded. Through this support, it emerges as a
larger IOS supporting most of the County. This suggests that the amount of mandated funding is
enabling the emergent development of DPSS. Assured funding (of 75% of its budget) is allowing
DPSS to grow and become a larger entity. Therefore, IOS funding tied to mandates defines the
minimum capabilities of the IOS development. The amount of funding may or may not enable
emergent IOS development.
- Resources
Similar to financial events, resourcing events for DPSS tie to funding for development. The
United States economic downturn in the last few years makes resources for growth of DPSS
capabilities, in addition to Sheriff’s Department support, a major issue for DPSS. PSN hardware
and software infrastructure is expensive (radio upgrade estimates are $10 to $12 million) but
capabilities of new technologies create pressure to upgrade systems (from users) and expand
DPSS, increasing operation and support costs.
Although federal funding exists through The Department of Homeland Security, limitations
on the use of funds makes them difficult to utilize for specific needs. For example, DPSS recently
upgraded their building and facilities using federal funds. Although they have a critical need to
upgrade their radio system, federally earmarked funds were for building upgrades, so DPSS
completed the less critical building upgrade rather than lose the available funds. Therefore,
earmarked federal funds specifying IOS development, such as grants, mandate IOS development.
IOS development may utilize these funds even if the specified development capability is not a
priority.
- Political
189
Each of the agencies within DPSS acts as a separate political entity pursuing its political
agenda or needs when required. As stated previously, DPSS’s mandate is to support the
Sheriff’s operations, so all other activities are on a voluntary basis. Gaining support from DPSS
can be a political event requiring lobbying, complaining, or both.
Although DPSS is in a political environment, County Commissioners are the decision makers.
DPSS management (i.e. the Director) feels that they are the implementers of the
Commissioner’s decisions and from this perspective, the Commissioners mandate DPSS
development. In contrast, the County Commissioners (and Chairman) recognize the need to
understand the view and opinion of its constituents (agencies) before pursuing DPSS growth or
upgrades resulting in agencies influencing all decisions. From this perspective, Commissioners
influence DPSS development and it emerges from their interaction with the agencies although
ultimately they mandate the change.
Political factors appear to contribute to emergent IOS development because actions occur
through persuasive events (such as lobbying and complaining). These persuasive events can
feedback into the system to higher governance levels mandating development. Therefore, when
combined with governance of the IOS, political activities can lead to mandated development
from IOS managers and administrators.
- Strategic
The culture in Clermont County has always been one of independence among agencies and
aversion to change so collaborative strategies do not come easy for them. Agencies need strong
motivations to collaborate. For example, rising costs for supplying safety services and the need
to support mutual aid are examples of strong motivations for collaboration. Agencies join DPSS
for cost savings resulting from shared resources.
190
Additionally, agencies sometimes must depend on each other, as exemplified in mutual aid.
Mutual aid occurs when one organization uses the resources of another to meet service needs.
The simplest example is when multiple fire departments respond to a fire. DPSS facilitates
mutual aid by providing the common infrastructure and communications for the agencies to
collaborate on safety services. For DPSS, when strong motivational factors exist to solve
problems such as rising costs or increasing quality of safety services (through mutual aid), they
emerge as a solution.
Strategically DPSS is a collaborative solution to problems that exist for its agencies.
Therefore, collaborative strategies by agencies in an IOS will lead to emergent IOS development.
The IOS emerges as a solution to strategic needs.
- Governance
DPSS governance is a function of the laws of the county legislature and the supported
functionality of the PSN. Starting in 2004, the Communications Advisory Board (CAB) advised on
the development of DPSS. It was disbanded in 2007, mainly because the developments they
advised upon were completed. DPSS went for the next few years without an advisory board,
managing daily operations through self- management. As they further developed, it became
necessary for them to communicate to the end users.
In 2007 the County formed the Communications Users Group, which, to date, is the standing
advisory group to DPSS and County officials. Its members include individuals from the PSN
member agencies and citizen groups. The users group became a forum for DPSS to
communicate future development plans and acts as a channel for agency collaborations. Both
the CAB and Users group were factors in the development of DPSS but neither had the power to
mandate development.
191
Events from DPSS indicate that informal governance groups, such as CAB and the users group
are necessary for emergent IOS development. They provide the forum for inter-agency
interactions resulting in collaborative agreement to develop capabilities. When they do not
exist, agencies will resort to political means to force mandated change from the formal
governing body as exemplified by the DPSS re-organization resulting from the CAD failure.
Therefore, informal governance groups contribute to emergent IOS development by increasing
the interaction between the IOS constituents.
- Processes
Dispatch accreditation requires a time specification (to dispatch resources) and
documentation of the processes. DPSS is not yet accredited. Since dispatch times are also part
of the E911 response time for police and fire personnel, the non-accreditation of DPSS can affect
the accreditation of fire and police departments. Although accreditation is a performance
measure, it specifies a type of process development for DPSS.
Accredited, standardized processes, such as dispatch, mandate IOS development. Other
processes may contribute to either mandated or emergent IOS development. For example,
deeply embedded existing processes may be institutionally standardized and impossible to
change and consequently mandate development. Other processes may evolve along with the
IOS development and emerge over time. Therefore, the type of process, standard, embedded, or
evolving, defines whether it contributes to mandated or emergent IOS development.
- Technology
Currently DPSS is supplying voice, data, and dispatch to County public safety agencies and
support to MARCS at the State level. It has weathered the CAD system failure, is facing a new
crisis with the introduction of new technology from Motorola (APCO 25), and feeling pressure to
192
upgrade to this technology. Other adjoining PSNs, such as Hamilton and Union Townships
already support this capability and DPSS potentially will lose agencies to these PSNs if their
technologies become out-dated.
This is particularly problematic to DPSS because the current trend in federal government,
according to informants, is to fund regional activities. Many of the informants believe
regionalization is the future for PSNs but the questions for DPSS will be whether they are the
regionalizing entity or the entity that gets absorbed into a regional PSN. Supporting new
technology may decide which PSNs survive and mandate development activities for DPSS.
ICT as the backbone infrastructure of an IOS is critical to its existence. An IOS may be able to
“get-by” with legacy technology but eventually constituents will demand upgrades. Technology
may have a time horizon for development decisions but will ultimately define IOS development.
Therefore, the need to stay current with technology mandates IOS development.
5.6.2 Patterns of State Change for IOS Development
From a CT perspective, the previous section describes DPSS development events from the
perspective of mandated and emergent IOS. Equally insightful is how these states change and
evolve. Since mandated IOS development is prescribed, this analysis focuses directly on
emergent IOS development resulting from the interaction of the member agencies. In
particular, the CT viewpoint determines the characteristics of IOS development states. As
outcome basins of the IOS development strange attractor, IOS development has a natural
attraction to these characteristics. Therefore, SCD state and variable changes (showing
outcome basins) explains how DPSS attained its present state and possible scenarios for the
future of DPSS, exemplifying how the SCD (as a strange attractor) can be used to analyze an IOS
development and guide its future development using mandated and emergent development.
193
This research defines three distinguishing characteristics for the DPSS (and IOS, in general)
outcome basins. Each characteristic derives from description of the state in the SCD and the
narrative. The characteristics are, “tight” collaboration, a common critical goal and unique and
nontransferable knowledge within the IOS. Description of all three follows.
- “Tight” Collaborations
DPSS and its peer public safety agencies exist as autonomous, loosely coupled agencies.
They participate in the PSN on a voluntary basis and can withdraw from the DPSS easily
(although potentially incurring infrastructure costs) and without penalty (some agencies could
easily move to Union or Hamilton Township PSNs). Although loosely coupled organizationally,
all agencies are part of a very “tight” collaboration, defined as follows.
Collaborative networks represent the joint organizational entity, infrastructure, business
processes, resources, and relationships which support a shared effort to provide some collective
benefit, whether it is a program, service, or a product (Fedorowicz, et al., 2007). Add joint
problem solving, bi-directional flow of knowledge, frequent contact and voluntary membership
and the collaboration becomes “tight” (Acevedo, 2007; Munkvold, 2005; Wellman, 2001).
DPSS exhibits “tight” collaboration. For example, the accreditation process represents joint
problem solving, since dispatch time improvements impact both the accreditation of DPSS and
its peer police and fire agencies. The reliance on advisory groups, such as CAB and the
Communications User Group, represent a forum for the flow of information between DPSS and
its peer agencies. There is constant contact between DPSS and the public safety agencies (many
DPSS personnel monitor radio communications at all times). Therefore, the relationship
between DPSS and its peer public safety agencies is a “tight” collaboration.
194
Analysis of the DPSS SCD illustrates its use as a strange attractor to understand the
development of DPSS as a “tight” collaboration. Collaborative Network variables are all
increasing from “adequate” when DPSS experiences emergent IOS development. During its
County Shared Services state collaboration decreases coincident with the failed CAD system, and
as discussed previously, DPSS quickly re-organizes to maintain collaboration. Reorganization
and establishment of the Communication Users Group returns it to a “tight” Collaboration.
The SCD also shows the future for DPSS may hinge on regionalization. The DPSS “tight”
collaboration maintains it within Clermont County, but is it “tight” enough to support emergent
development as a regional PSN? To help answer this question, the SCD provides DPSS managers
with the initial state prior to any activities they may undertake to evolve DPSS to a regional PSN.
If they decide “tight” collaboration is characteristic of a regional PSN outcome basin, then they
can use the characteristics of the current county level “tight” collaboration to determine the
definition of a “tight” collaboration state of a regional PSN. Future development activities may
mandate IOS development to attain that state or create the necessary factors for DPSS to
emerge as a regional PSN.
- Critical Common Goal
Related to a “tight” collaboration is the sharing of a critical common goal by DPSS and its
peer agencies. Although a subjective concept, a “critical goal” is one that has great importance
to all agencies. Ensuring public safety is a critical common goal for all members of the PSN.
A constantly heard theme by informants was the need to work together, cooperate, and
achieve a goal (public safety) which is larger than any individual organization. The PSN members
all share a goal that is critical to them and unites them as a “tight” collaboration. Because it is
195
unchanging (from the SCD) and mentioned numerous times (from narrative analysis) public
safety is determined to be common critical goal for DPSS agencies.
Although a critical goal is not specifically evident in the SCD within the Agency Context,
agency charter variable values are consistent, almost completely unchanging through the history
of DPSS, indicating a common goal is present. Interestingly, charters change to inconsistent at
the end of the County Shares Service State. Although public safety is a critical common goal for
all agencies, the threat from regionalization and incorporation into another PSN may be
emerging as a more important survival goal.
DPSS collaboration and resulting emergent IOS development focuses on a shared critical
common goal, but as the DPSS development continues, this goal may be modified or superseded
by a different goal. If DPSS develops into a regional PSN, DPSS managers will need to determine
the applicable critical common goal for collaboration. Relating to the characteristic of the
regional PSN outcome basin DPSS manager would need to access whether public safety is still a
common critical goal characterizing regional PSN outcome basins.
- Unique, Nontransferable Knowledge
DPSS also requires unique and nontransferable ICT knowledge to support shared services
across its agencies. It becomes a focal point for consolidation around that service. Cost and
efficiencies are given as reasons for consolidation but it is the consolidation of knowledge in one
agency that achieves the cost and efficiency gains.
DPSS has gained extensive knowledge in ICT and CAD systems that would be hard to
replicate in the other agencies. Knowledge is something they have acquired over years of
service. Additionally they deal with complex communication systems that require extensive
support. The CAD system upgrade failure demonstrated the complexity of their system, when a
196
minor difference in their environment, from other uses of the system, resulted in a complete
system failure. DPSS must have the knowledge to support such systems. Then, because of their
knowledge and expertise, DPSS becomes a natural focal point for consolidation of ICT services.
The context of the public safety agencies supported by DPSS (mainly within the county)
bounds the unique and non-transferable knowledge resident in DPSS. For example, it would be
expensive or very time consuming for the Sheriff’s Department to implement their own set of
DPSS capabilities and therefore, to the Sheriff, DPSS has unique and non-transferable
knowledge. Expanding the context outside the county introduces other organizations
duplicating DPSS services (they exist as back-ups to DPSS) with the potential for these
organizations to replace DPSS. Within this larger context, DPSS does not necessarily have
unique and non-transferable knowledge making it one of many choices as a regional PSN.
SCD analysis shows the increased capabilities in ICT infrastructure and processes throughout
the DPSS development. As described previously it shows a decrease during its CAD failure but
rebounds quickly to satisfactory. Critically important in the SCD analysis is the recognition that
DPSS capabilities correspond to the Agency Context, modeled as a County PSN. Therefore, a
regional development SCD would evaluate DPSS from a regional context. Unique and non-
transferrable knowledge highlights the sufficiency of DPSS operation for County operations but
are they sufficient for regional operations?
Therefore, in conclusion, IOS formed by autonomous, loosely coupled agencies exist in
states characterized by “tight” collaboration, a shared common critical goal, and one agency
with unique, nontransferable knowledge. These characteristics result from emergent IOS
development activities. Mandating IOS development activities, such as User Groups, enable
197
constituent interactions resulting in emergent IOS development. From a CT perspective, the IOS
is naturally attracted to these states as outcome basins of its strange attractor.
These results are strikingly similar to recent theoretical research by Moynihan, Provan and
Lemaire (2012) on the practice of organizational network development in the public sector. They
indentified the factors for emergent organizational networks as homophily, proximity,
heterophily, dependence reduction, prior relationships, legitimacy, and access to key
information and resources. Each corresponds to this study’s resulting characteristics from this
study as follows.
“Tight” collaborations result based on the homophily of the service provided (public
safety), the proximity of the locality served (the County), and prior relationships (such as
mutual aid).
A common critical goal unites the diverse agencies (heterophily) but highlights their
unique contributions to public safety. A critical goal establishes a prior relationship for
all agencies.
Unique, non-transferable knowledge legitimizes DPSS and reduces dependence on
outside expertise. DPSS provides access to key information and resources to all its
member public safety agencies.
Although Moynihan, Provan and Lemaire results are not from an empirical study, they
nonetheless recognize the importance of managing an IOS development by guiding the IOS to a
state that enables meeting targeted goals rather than specific actions. This study provides the
framework to IOS developers for guiding the IOS development to such states. The similarity of
their results to this study’s results validates results and conclusions from both.
198
Specifically, this study uses the PSN State Space Process and CAS models to analyze IOS
development. The PSN State Space CAS model depicts the state of an IOS development, at any
given time, emerging from within the PSN (agents, context, and collaboration) combined with
mandates from the external environment. The PSN State Space Process model uses the CAS
model to uncover state changes that reflect the changing combination of mandate and
emergence in the development of the IOS. Diagramming the state changes using an SCD
produces the IOS strange attractor enabling analysis of the contributions of both mandate and
emergence for the IOS development. Although this study uses the CT perspective to explain and
understand IOS development, and specifically DPSS development, alternate perspective may
apply.
5.6.3 Alternate Views on IOS Development
This study’s findings describe characteristics of IOS development states (i.e. outcome basins)
based on mandated and emergent IOS development. This section examines characteristics of
IOS development states from other research domains, namely; implicit and explicit firm
clustering, weak and strong ties, and county-level regionalization. These characteristics are
chosen based on their similarity to this study’s characteristics, intending to provide a
perspective on this study’s findings outside the PSN domain and suggest domains for further
research.
- Implicit and Explicit Clustering
Closely related to this study is institutional research on implicit and explicit clustering.
Clusters are regional agglomerations of sector or value chain related firms and other
organizations (like universities, R&D centers, public agencies) which derive economic
advantages from co-location and collaboration (Martin & Sunley, 2003). Explicit cluster policies
are established top-down by regional governments, similar to mandated IOS development.
199
Initiatives which only implicitly refer to the cluster ideas are governed bottom-up by private
companies (Fromhold-Eisebith & Eisebith, 2005). Implicit clusters would be similar to emergent
IOS developments.
In most cases, clusters involve the collaboration of firms but do not result in consolidated
services. In implicit clusters, organizations decide to cooperate and may entertain joint activities
but rarely share services. Regional industry associations are examples of implicit clusters.
Industry associations, in particular if they share services, may be potential locations for further
studies into IOS development.
An additional area for future research might be an investigation of implicit clustering as an
antecedent to emergent IOS development. Because DPSS creation was mandated, its potential
to emerge from agency interactions was less evident (although it emerged from the Sheriffs’
interaction). Would DPSS have eventually emerged based on the needs of the agencies and
their collaborative efforts leading to the emergent growth of DPSS? Contrasting DPSS to
industry associations leading to shared services may answer that question and lead to a deeper
understanding of emergent IOS development.
- Weak and Strong Ties
Weak and strong ties refer to the multiple exchanges that occur between organizations their
partners, competitors, and regulators (Scott & Davis, 2003). Alliances can occur between
organizations for particular projects, long-term relationships or joint ventures. This can result in
new structures of networked organizations.
Potentially firms that have strong ties would be involved in consolidations. The critical
factor missing from strong tie networks is a common critical goal. For example, in the New York
garment industry (Uzzi, 1997), loyalty, trust and better information encouraged strong ties that

200
could potentially lead to consolidation. Instead, firms succeeded when employing a mixture of
strong and weak ties so they did not become dependent on a single partner. Firms worked
together to collaborate but lacked a common goal that would strengthen all ties. In emergent
IOS development, common critical goals contribute to keeping the consolidation together.
From a CT perspective, weak and strong ties would apply the type of interaction occurring
among agencies. In the case of DPSS, the interaction is strong; represented as collaborations
that leads to and maintains its existence as a shared ICT organization. Other studies have noted
the strength of collaboration as significant factor for sharing services in PSN (such as (Dawes &
Eglene, 2004; Fedorowicz, et al., 2007; Pardo, et al., 2008). In this sense, collaboration occurs
when the agencies have strong ties, creating and maintaining emergent IOS development. A
future research area would be the effect of strong and weak ties on emergent and mandated
IOS development.
- County-level Regionalization
Research on US Counties suggests that counties are natural consolidation sites.
Regionalization promotes efficiency and equity among towns and cities, yet there are limited
examples of regionalization outside specific environmental and health domains (Adler-Milstein,
Landefeld, & Jha, 2010; Basolo, 2003). Counties represent “common” ground for agencies to
consolidate services (Meek & Lyu, 2010). This may be a function of the “strength” of the county
within the State and represents an area for further research. This also opens the question as to
whether emergent IOS development occurred at DPSS because of the specific factors addressed
in this research or due to its being a county-wide organization, suggesting the need for further
research in county-level consolidation and city-county consolidations as instances of emergent
IOS development.
201
As stated, this analysis is for an IOS at the County level, but the future for the IOS may be
regionalization. Therefore, a regional analysis of DPSS as a regional IOS would help DPSS
manage its future development and potentially define the mix of mandated and emergent
development required. Section 5.6.2 discusses this further in applications to practice.
The following section provides concluding remarks on this research and shows how CT
concepts and strange attractors are used to guide DPSS to regionalization.
5.7 Conclusion
This study exemplified the use of CT strange attractor concepts to understand mandated
and emergent IOS development for government inter-agency collaborations. A case of public
safety agency networked collaboration, the Clermont County Division Public Safety Services
(DPSS), examined an IOS resulting from a mix of both mandated and emergent IOS
development. The examination used the PSN State Space CAS and Process models, and method,
derived in Chapter 3 to answer this study’s research question, how can using the strange
attractor concept from Chaos Theory and Complex Adaptive Systems help IOS developments
meet their goals?
The models and method determine the state changes in DPSS leading to its current state.
The SCD for DPSS shows the progression of state changes representing its strange attractor.
Surprisingly DPSS transitioned through only a few states, residing in outcome basins maintained
by the collaborative activities of its member agencies. The study provides insights into how
DPSS became a shared ICT services agency how it stayed in this state despite serious problems
such as a failed CAD system. Agency interactions characterized as collaborative activities are
keeping DPSS in this outcome basin and as long as these activities do not waiver it appears to be
202
highly attracted to this basin. Therefore, for DPSS, the contribution of the study provides insight
into what keeps DPSS in this outcome basin and successful operations.
Analysis of the DPSS strange attractor results in the characteristics of the outcome basin and
suggests, in general, governments can maintain an IOS even if not mandated to do so. It shows
when government agencies exist in a “tight” networked collaboration sharing a common critical
goal, with a single agency obtaining unique and non-transferable knowledge, the agency will
emerge as a consolidation site of shared service pertaining to their knowledge.
Although this research uses a single case study in public safety, other areas for IOS
development are considered. Suggested areas include industry associations, strong tie networks
and county collaborations and consolidations (outside the public safety domain) are areas for
further research and may supply additional cases for analysis.
In an era of economic uncertainty, tightening budgets and restricted funding opportunities,
stretch government resources. There are repeated calls for the reinvention of federal, state,
and local governments and for them to do “more with less”. This research not only contributes
to theory on collaboration and consolidation, but also contributes to a critical need for
governments to increase efficiencies. By explaining and understanding mandated and emergent
IOS development, this study facilitates a new method for governments to increase efficiency,
effectiveness, and do “more with less”.
5.7.1 Research Limitations
In answering this study’s research question the PSN State Space CAS and Process models
are used to determine the states and state changes of DPSS leading to its current PSN state.
Analysis is at the County level. What is missing in this research is an evaluation of the impact of
DPSS‘s County-level context.
203
Counties are natural areas for consolidation of services in both health care and
environmental studies (Meek & Lyu, 2010; Tan, Wen, & Awad, 2005). Situating the IOS into the
County level in itself may influence the IOS development. A limitation of the study may be the
relationship of the phenomenon to its current place and time.
In this study, the PSN State Space CAS Model depicts impactful variables for agent
interactions among themselves and their environment through specifics such as events, laws,
strategies, budgets, and technologies in the County context. It does not address factors such as,
what does it mean to the agencies that a PSN exists at a County level and is accountable at that
level? Does that correspond to added security leading to consolidation irrespective of
collaboration? Attempts to generalize this study outside Counties must be carefully considered
when the potential “safety-blanket” of the County is removed. Future research needs more
consideration of context for the PSN and in general for IOS developments.
An additional limitation is the relatively few state changes for DPSS. Although the
period of the study and informant recollections is almost 25 years, analysis of the sequence of
states show DPSS transitioning through very few states. Mandate established DPSS, followed by
a long stable period of emergent development. Even with severe problems like the failed CAD
system, it does not transition to another state. Only in the future does it potentially transition
to a new state if regional PSNs emerge in Ohio.
A case with more state changes may have provided a better test for the PSN models but
the lack of changes may instead highlight the importance of outcome basins in organizations
such as PSNs. Because they involve critical services, like public safety, once PSNs are
successfully operational, the key analysis perspective may not be state change but rather state
204
stability and outcome basins. Examination of additional PSNs may resolve the choice of
perspective.
A final limitation, common to this study and study 1, is the use of a single case. Each
study is an exploration into the dynamics of PSN change and using CT perspectives to analyze
that change, but each study looks only at a single PSN; therefore generalizing results to all PSNs
is limited. The validity of the PSN State Space Models for single cases is evident but a next step
for use of the models may be a cross-case analysis looking a number of PSNs to generalize
results.
5.7.2 Contribution to Practice
This study contributes to practice by a retrospective analysis of the DPSS strange attractor
examining its development and a predictive analysis based on its future as a regional PSN. The
following sections detail both. Both illustrate the use of CT concept of the strange attractor in
practice to explain and understand past and future IOS development.
- Retrospective analysis - “Techno-myopia” and the Impact of the “It Artifact”
This study highlights one of the previously stated problems with IS change models (see
Section 1.1), a focus on the “IT artifact”. In the development of DPSS, there are numerous
changes in technology including the introduction of the APCO16 system, MARCS support, CAD
services, a failed CAD, and the current need to move to a new APCO25 system. Tracking
technology would lead one to believe that DPSS is transitioning through numerous states and
has had a very dynamic development.
The analysis used in this study shows just the opposite. Using the PSN State Space CAS and
Process models and CT concepts such as strange attractors reveals DPSS has been a relatively
stable organization characterized by a period of growth, followed by a length state characterized
205
by maintenance of this capability. Focusing analysis on the all factors (i.e. PSN State variables)
for DPSS reveals it is a relatively stable organization.
If DPSS managers instead only viewed DPSS from a technology perspective, or the “IT
artifact” they may miss influential factors and make less optimal decisions regarding its
operations. For example, with a technical focus they miss the importance of factors promoting
agency interactions that promote emergent IOS development (such as the CAB and Users
group). As Wastell and White (2010) contend a “techno-myopic” view can be very problematic
to IS managers because they focus on a single dimension, technology. IOS development is a
multi-dimensional challenge.
Additionally the study highlights the importance of collaboration of the County public safety
agencies leading to emergent IOS development. The important and most influential factor for
DPSS is maintaining agency collaboration. More than just communication, the agencies need to
work together and jointly solve problems. When DPSS has processes in place to promote
collaboration, such as the CAB and now the Communications Users Group, they perform better
and have fewer problems. From a CT perspective when DPSS collaborates, it operates at the
“edge of chaos” and positions itself for optimal performance.
Although it may seem obvious that collaborating agencies, working together is an optimal
state for organizations this is not easy to achieve for government agencies. Aside from
problems related to “techno-myopia”, governments favor autonomy and fragmentation
(believing it fosters efficiency) or competition resulting from jurisdiction-centered economic
interests (Basolo, 2003; Hamilton, 2000). Therefore, collaboration does not occur naturally.
Therefore collaboration of government agencies is attracted to non-collaboration and will
require effort (mandates such as User groups) to foster collaboration.
206
Additionally, if there is no “top” to mandate IOS development it must occur emergently,
requiring the mechanisms and process to enable collaboration. Therefore this study’s
contribution to practice is to help managers recognize the full set of factors impacting the state
of their organization (using CT concepts) and specifically, when implementing IOS put in place
the mechanisms and process to enable collaboration of member agencies leading to emergent
development.
- Using the Strange Attractor Predictive Capabilities
The future for DPSS appears to be as a regional PSN (according to informants). Assuming
they wish to evolve into that regional PSN, how can they utilize the method and results of this
study to guide them to regionalization? DPSS managers can use the current model as a
template for a regional PSN and modify it for regional characteristics.
The current PSN CAS model for DPSS is at the County level. To understand a regional PSN
they need to update the model to the regional context. Conceptions of a regional PSN
determines modification of the CAS model and may result minor modifications to accommodate
additional agencies across the region or the addition of multiple- levels of interaction. For
example, if a regional PSN manages existing PSNs then a multi-level hierarchical model results.
Even if there were no structural changes to the model, at a minimum, the external environment
variables would change, especially if the region crosses States. Therefore, based on their
knowledge of PSNs and expectation for regional PSNs, DPSS managers need to create a new
Regional PSN State Space CAS model to incorporate into the PSN State Space Process Model.
Generation of a regional CAS model then aids in developing and modifying the PSN State
variables for regional characteristics. This is a critical step for DPSS because it defines the state
of a regional PSN. The intent of specific mandated development activities is to guide DPSS to
207
the regional PSN state. Therefore, a regional PSN state is the targeted goal for the
development.
For example, DPSS analysis reveals funding goals for a regional PSN. DPSS operations are
funded mainly by mandate (75% of their budget). As stated, this assures their existence and the
amount of the funding allows them to engage in activities promoting emergent development.
Believing this to be a key state for a regional PSN (i.e. assured operational funding), DPSS
managers would explore opportunities to obtain such funds. Analysis of the desired state of a
regional PSN prescribes action, potentially enacted as mandated development that secures
necessary funding.
In addition, emergent IOS development predominates during the growth of DPSS. Assuming
the same would apply to regionalization DPSS, managers would enact policies to enhance
collaborations (the key finding for DPSS emergent growth), potentially establishing advisory
groups, educational sessions, or group meetings intended to get all regional agencies
interacting.
Although this study presents only a few examples of how strange attractors can guide DPSS
development to a regional PSN, DPSS managers would evaluate all the PSN state variables (and
any new ones from model modifications) to access their values as a regional PSN. Then using
concepts from strange attractors and mandated and emergent IOS development they can take
actions that move DPSS into the state of a regional PSN. If the state of a regional PSN
corresponds to government goals of “doing more with less”, they potentially secure their future
success.
208
6 Contributions and Futures
“We occupy a world that is connected on multiple dimensions, and at a deep level — a global
system of systems. That means, among other things, that it is subject to systems-level
failures, which require systems-level thinking about the effectiveness of its physical and
digital infrastructures. The world’s private and public sector leaders believe that a rapid
escalation of “complexity” is the biggest challenge confronting them. They expect it to
continue — indeed, to accelerate — in the coming years. They are equally clear that their
enterprises today are not equipped to cope effectively with this complexity in the global
environment.” - Samuel J. Palmisano, Chairman, President and CEO, IBM Corp. (2002-
2012)70
This quotation by Samuel Palmisano effectively captures the intent of this research; to
recognize the growing complexity of IS; to control for complexity by providing a modeling
framework for IS developments; and ultimately to help guide IS developments meet their
targeted goals. This chapter starts with a review of the contributions made and concludes with
a look into the future of complexity based IS research and makes recommendations for
additional research.
6.1 Contribution to Information Systems Research
This research extends previous work in the application of Complexity Theory to IS and is the
first to apply these theories to PSNs. The following sections detail contributions to both
academic and practice disciplines.
6.1.1 Academic Contributions
- IS Change Model Contribution
This research contributes to IS change research by introducing a new model for multi-level
and multi-causal analysis of IS phenomena using CT concepts of state space and strange
70
Berman, S., & Korsten, P. (2010). Capitalizing on Complexity: Insights from the Global Chief Executive
Officer Study, Somers, NY: IBM Institute for Business Value.

209
attractors. It removes the retrospective limitation of existing time domain IS research while
using complementing exiting reductionist dyadic research to describe micro-level events. It
provides a complete description of IS change at both the macro and micro-levels, explaining how
IS evolve and enables understanding the emergence of possible future IS states.
There is a growing need within the IS research community to view IS change from new
perspectives. In particular, what is needed is a complex systems view of IS, including
perceptions of systems in terms of adaptive processes, emergence, interaction, context and
nonlinear feedback (Boisot & McKelvey, 2010; Tsoukas & Dooley, 2011; Weick, 1977)71. In
contrast to reductionist dyadic micro-level views of IS, this perception promotes a macro-level
view of systems where the behavior of the system is multi-causal or as stated by Ragin (2000) a
“confluence of causal factors”. The model presented in this research describes the interaction
of multiple agents with their environment with each interaction a contributing cause to the
outcome of the IS (i.e. change). Each cause can be explained by traditional dyadic theory but a
system-level IS change can only be accounted for by considering all causes and how they
interact with each other. Models including all types of interaction in total (as in this research),
explains multi-causal, macro-level behavior in IS.
As stated in chapter 2, much IS research is reductionist in nature looking at individual
interaction between two agents. This micro-level view provides deep insights into how IS
interacts at the individual or organization level, as singular agents, but fails to account for
macro-level, or multiple levels of interactions. For example, a micro-level view of court-oriented
PSNs would not reveal the multiple levels of organization and interaction that occurs as the
court agents interact to share data, adjudicate court cases, and interact at the county level as
71
Table 6.1 defines each term.

210
shown in chapter 3. This research provides a means to conduct rigorous multi-level IS analysis
that is impossible using reductionist theories.
Because the model presented in this research is multi-level and multi-causal it is particularly
well suited to understanding and explaining IS development. As Robey (2008) in his review of IS
research concluded, the use of multiple theories (multi-causal) to explain IS conceptualizations
is superior to single dyadic or organizational theory conceptualizations because it allows for
each theory to complement the other. He shows how the use of multiple theories that span
technical, social, and network concepts produce better understanding of IS phenomena. The
model introduced in this research does not preclude using multiple theories and will provide
more complete description of IS phenomena.
For example, the Winnebago CJIS modeled in chapter 3 required the use of three different
theoretical concepts to explain fully the development of their CCMS. The model includes
theoretical and practice concepts from judicial systems (courts), public safety networks, and
complex technology diffusion. Adequate modeling of the Winnebago CJIS required inclusion of
all three concepts to explain its development. The PSN State-Space Process model for the
Winnebago CJIS is both multi-level and multi-causal and is an example of the type of modeling
of IS that can be done using the concepts in this research.
- Contribution to Solving “wicked” IS Development Problems
This research extends current models of IS development by explaining and understanding IS
evolution and change by examination of the state of the IS without determining casual events.
In complex IS developments identification of all causes of IS change is impossible and limits
existing research to retrospective, post hoc analysis. This research does not suffer from this
limitation, providing a more accurate analysis of IS change.
211
As shown in chapter 2, IS sensitivity to initial conditions limits existing causal models of IS
development to retrospective analysis of events and outcomes (Lyytinen & Newman, 2008).
Predictive modeling is impossible with these models because the far-reaching effect of events.
Not only is causal identification impossible but also attempts to identify causes can lead to
misconceptions regarding IS development. Before considering the effect of causal events, the
state of a complex system must be determined as it significantly contributes to the effect of an
event.
For example, when WCCMS reprioritized fine collections over other needed agency
functionality there was little negative effect on agencies because they existed in a state (prior to
the reprioritization) high in solidarity (NewFit, Neworked state) recognizing the re-prioritization
benefited WCCMS, as a unified system, although it may negatively influence some agencies.
Therefore, understanding the initial state of WCCMS explained why the re-prioritization had so
little effect.
Similarly, in chapter 5, a focus on the development of the DPSS caused by changes in
technology resulted in a view of multiple state changes. A complexity view, looking at the
system changes in state space gives an accurate representation of the PSN development with
relatively few state changes and enables a view into future states for the PSN based on its past
and existing states which cannot be accomplished using existing theories. Using the model and
method from this research the importance of emergent IOS development became evident in the
past and future development of the PSN as determined by the state of the PSN.
- Contribution to Method for IS analysis
This research also contributes to epistemological and methodological considerations of IS
development in particular the use of fuzzy-set qualitative data analysis (fsQCA) and case studies.
Existing IS change methods fail to reveal the diversity of IS developments or require data
212
unavailable to researchers. This research uses qualitative analysis techniques to capture all
aspects of an IS development including emergence and evolution of the IS to new states.
This research brings to the forefront the need for methods using longitudinal analysis of IS
development. An IS existing in a certain state at a given time is not a complete description of
the system. “Interpretation of state C implies a knowledge of the history of the system, which
had to go through bifurcation points A and B” (Prigogine, Stengers, & Toffler, 1984). This
research presents a method for fitting state variables to the model of IS change and determining
its sequence of states resulting in a depiction of its strange attractor, which is then used to guide
the IS development. The method employs narrative construction, analysis and iterative axial
coding to represent the system’s strange attractor as an SCD and fsQCA to identify outcome
basins for a specific type of IS. Methods utilize both qualitative and quantitative data from case
studies and surveys.
- Contributions to Social Science Research
This research provides a means to understand and explain the complexity of social science
systems. Unlike many existing IS change theories, this research is applicable outside the IS
domain to complex agent based systems. It has relevance to any social science system modeled
as a CAS.
This research shows IS existing as cross-agency collaborations supported by ICT evolve to
different configurations corresponding to CT outcome basins. In social science research, this
concept’s use helps researchers understand how systems evolve and more interestingly, why
sometimes they do not evolve; they become “stuck” in an outcome basin. The classification of
unexpected and unpredictable outcomes as bifurcations occurs when complex systems operate
at the “edge of chaos” and switch to different outcome basins within the strange attractor. This
213
has application to any number of complex systems exhibiting adaptive processes, emergence,
interaction, context, and nonlinear feedback. Through complexity concepts such as complex
adaptive systems, state-space, strange attractors, and outcome basins, systems, consisting of
many interacting agents, producing outcomes at many different system levels, can be better
analyzed and understood.
6.1.2 Contributions to Practice
- Guiding IS Developments Toward Targeted Goals
This research provides a method to guide IS developments to success by understanding the
impact of IS manager’s decisions on IS development and guide them to meet their targeted IS
goals. It can help IS managers address the “wicked” IS development problem.
This research presents a managerial method for understanding the influential factors (such
as structure, culture, decisions, and technology) that form an IS strange attractor. Managers can
make decisions that guide the IS to remain in an outcome basin closely aligned to their goals for
the system. Understanding these factors can also help managers avoid bifurcations, where the
system quickly moves to an unexpected outcome basin. Managers can better understand the
time horizon that dictates the effect on their decisions.
- The analysis of PSN State and Status
This research is the first to model PSN development and extends current perspectives on how
PSNs evolve and change over time. Existing research provides valuable insight into the
important factors and characteristics of PSN developments but do not specifically model the
change of PSN states. This research provides a detailed and specific description of PSN change
suitable for guiding PSN development.
By utilizing CAS and Chaos Theory and the concept of strange attractors this research
provides a new perspective on the state and status of PSNs (and IS) and how they occupy
214
different state spaces over time. It shows both evolution and change can be modeled outside
the time-domain and be explained and understood by examination of the state of the PSN
without determining causality. This allows for the identification of the sensitivity of the PSN to
system factors and the likelihood of the PSN evolving to an undesired or unanticipated state.
PSN managers can use this information to understand how PSNs self-organize into mature
configurations and develop strategies to promote developments toward or counter to these
configurations (depending on the goals for their PSN). The derived model is specific to PSNs and
validated by PSN case study analysis although the IS model and method have application to IS in
general.
- Increasing Public Safety
This research contributes to a better understanding of the operation and management of
PSNs that may ultimately increase public safety. By modeling a PSN in state space, managers
can determine the important factors for PSN development that lead to successful development.
PSNs that are more successful will ultimately lead to increases in public safety.
PSNs are receiving more attention and priority in the United States as the country deals with
ever-increasing threats from terrorism and natural disasters. For example, following the tragic
December 2012 shootings in Sandy Hook Elementary School, the U.S. House of Representatives
is re-addressing the need for increased PSN capabilities across the U.S. (Sasso, 2013) including a
nation-wide broadband network for first responders. Considering the diversity of communities,
agencies, users, and citizens involved, developing a nation-wide PSN is a “wicked” problem.
Such initiatives will require more detailed and rigorous analysis of existing PSNs using
complexity concepts as detailed in this research.
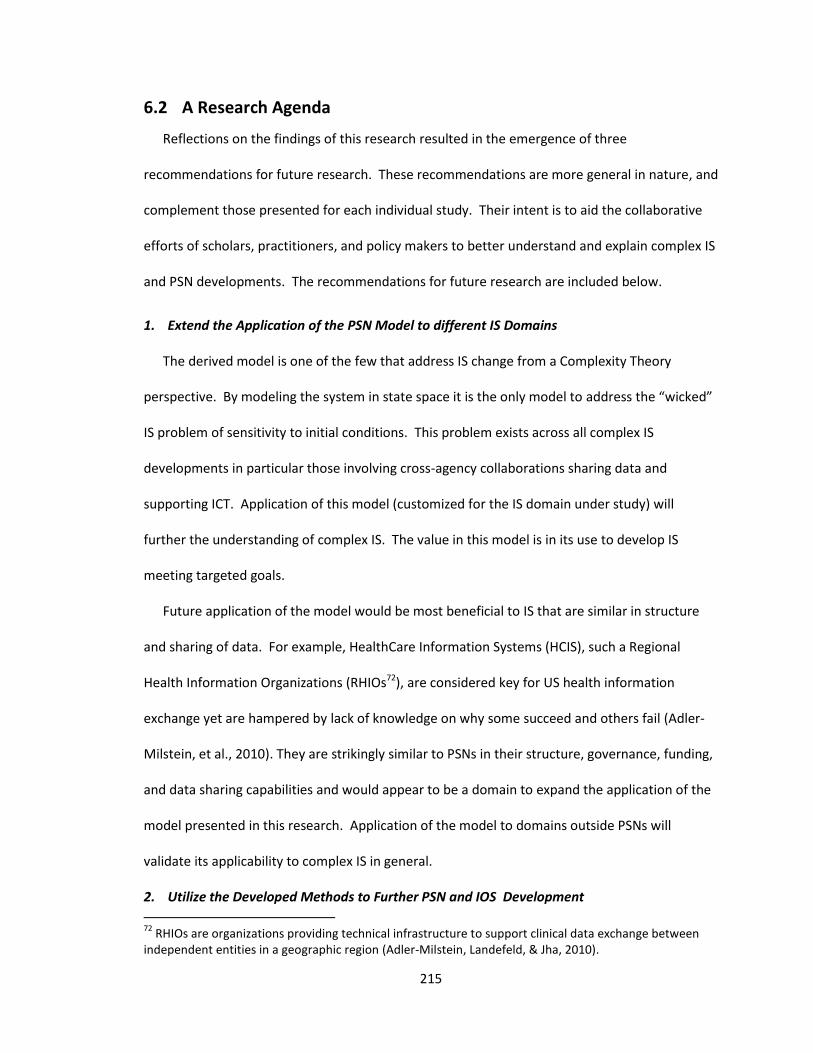
215
6.2 A Research Agenda
Reflections on the findings of this research resulted in the emergence of three
recommendations for future research. These recommendations are more general in nature, and
complement those presented for each individual study. Their intent is to aid the collaborative
efforts of scholars, practitioners, and policy makers to better understand and explain complex IS
and PSN developments. The recommendations for future research are included below.
1. Extend the Application of the PSN Model to different IS Domains
The derived model is one of the few that address IS change from a Complexity Theory
perspective. By modeling the system in state space it is the only model to address the “wicked”
IS problem of sensitivity to initial conditions. This problem exists across all complex IS
developments in particular those involving cross-agency collaborations sharing data and
supporting ICT. Application of this model (customized for the IS domain under study) will
further the understanding of complex IS. The value in this model is in its use to develop IS
meeting targeted goals.
Future application of the model would be most beneficial to IS that are similar in structure
and sharing of data. For example, HealthCare Information Systems (HCIS), such a Regional
Health Information Organizations (RHIOs72), are considered key for US health information
exchange yet are hampered by lack of knowledge on why some succeed and others fail (Adler-
Milstein, et al., 2010). They are strikingly similar to PSNs in their structure, governance, funding,
and data sharing capabilities and would appear to be a domain to expand the application of the
model presented in this research. Application of the model to domains outside PSNs will
validate its applicability to complex IS in general.
2. Utilize the Developed Methods to Further PSN and IOS Development
72
RHIOs are organizations providing technical infrastructure to support clinical data exchange between independent entities in a geographic region (Adler-Milstein, Landefeld, & Jha, 2010).
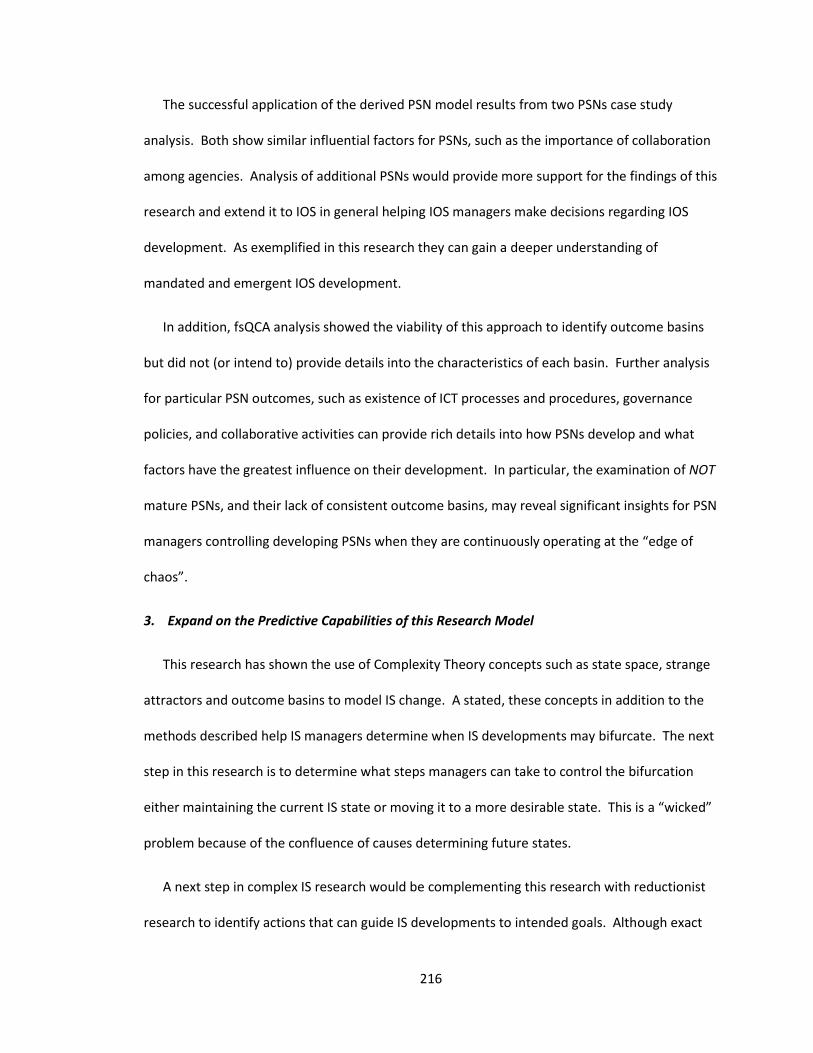
216
The successful application of the derived PSN model results from two PSNs case study
analysis. Both show similar influential factors for PSNs, such as the importance of collaboration
among agencies. Analysis of additional PSNs would provide more support for the findings of this
research and extend it to IOS in general helping IOS managers make decisions regarding IOS
development. As exemplified in this research they can gain a deeper understanding of
mandated and emergent IOS development.
In addition, fsQCA analysis showed the viability of this approach to identify outcome basins
but did not (or intend to) provide details into the characteristics of each basin. Further analysis
for particular PSN outcomes, such as existence of ICT processes and procedures, governance
policies, and collaborative activities can provide rich details into how PSNs develop and what
factors have the greatest influence on their development. In particular, the examination of NOT
mature PSNs, and their lack of consistent outcome basins, may reveal significant insights for PSN
managers controlling developing PSNs when they are continuously operating at the “edge of
chaos”.
3. Expand on the Predictive Capabilities of this Research Model
This research has shown the use of Complexity Theory concepts such as state space, strange
attractors and outcome basins to model IS change. A stated, these concepts in addition to the
methods described help IS managers determine when IS developments may bifurcate. The next
step in this research is to determine what steps managers can take to control the bifurcation
either maintaining the current IS state or moving it to a more desirable state. This is a “wicked”
problem because of the confluence of causes determining future states.
A next step in complex IS research would be complementing this research with reductionist
research to identify actions that can guide IS developments to intended goals. Although exact

217
results from these actions can never be predicted, potentially these theories can be combined
to give guidance to IS managers on the “most probable” outcomes from actions or at minimum
an “early warning” method for identifying undesirable bifurcations. As Samuel Palmisano states,
“. . . enterprises today are not equipped to cope effectively with this complexity in the global
environment.” Using results from this research as a framework and way of thinking about
complexity may help businesses cope with complexity and be successful in the changing global
environment.
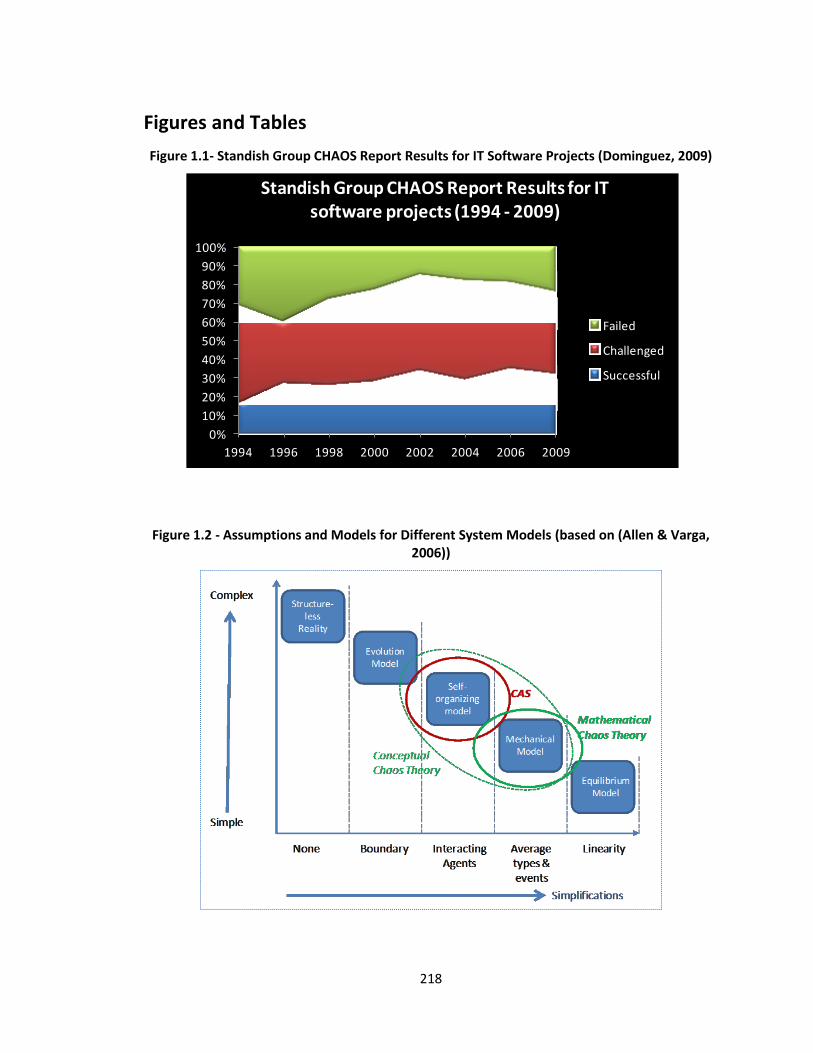
218
Figures and Tables
Figure 1.1- Standish Group CHAOS Report Results for IT Software Projects (Dominguez, 2009)
Figure 1.2 - Assumptions and Models for Different System Models (based on (Allen & Varga, 2006))
0%
10%
20%
30%
40%
50%
60%
70%
80%
90%
100%
1994 1996 1998 2000 2002 2004 2006 2009
Standish Group CHAOS Report Results for IT software projects (1994 - 2009)
Failed
Challenged
Successful
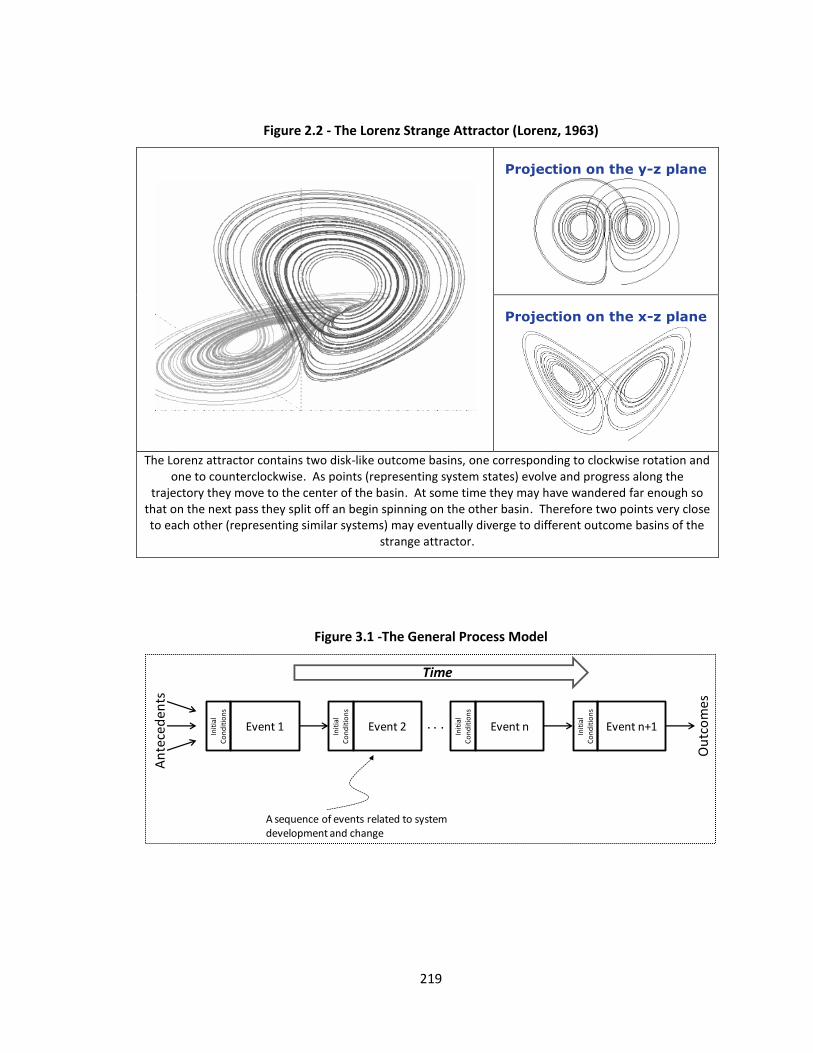
219
Figure 2.2 - The Lorenz Strange Attractor (Lorenz, 1963)
Projection on the y-z plane
Projection on the x-z plane
The Lorenz attractor contains two disk-like outcome basins, one corresponding to clockwise rotation and one to counterclockwise. As points (representing system states) evolve and progress along the
trajectory they move to the center of the basin. At some time they may have wandered far enough so that on the next pass they split off an begin spinning on the other basin. Therefore two points very close to each other (representing similar systems) may eventually diverge to different outcome basins of the
strange attractor.
Figure 3.1 -The General Process Model
Event 1
Init
ial
Co
nd
itio
ns
Event 2
Init
ial
Co
nd
itio
ns
Event n
Init
ial
Co
nd
itio
ns
Event n+1
Init
ial
Co
nd
itio
ns
. . .
An
tece
den
ts
Ou
tco
mes
Time
A sequence of events related to system development and change
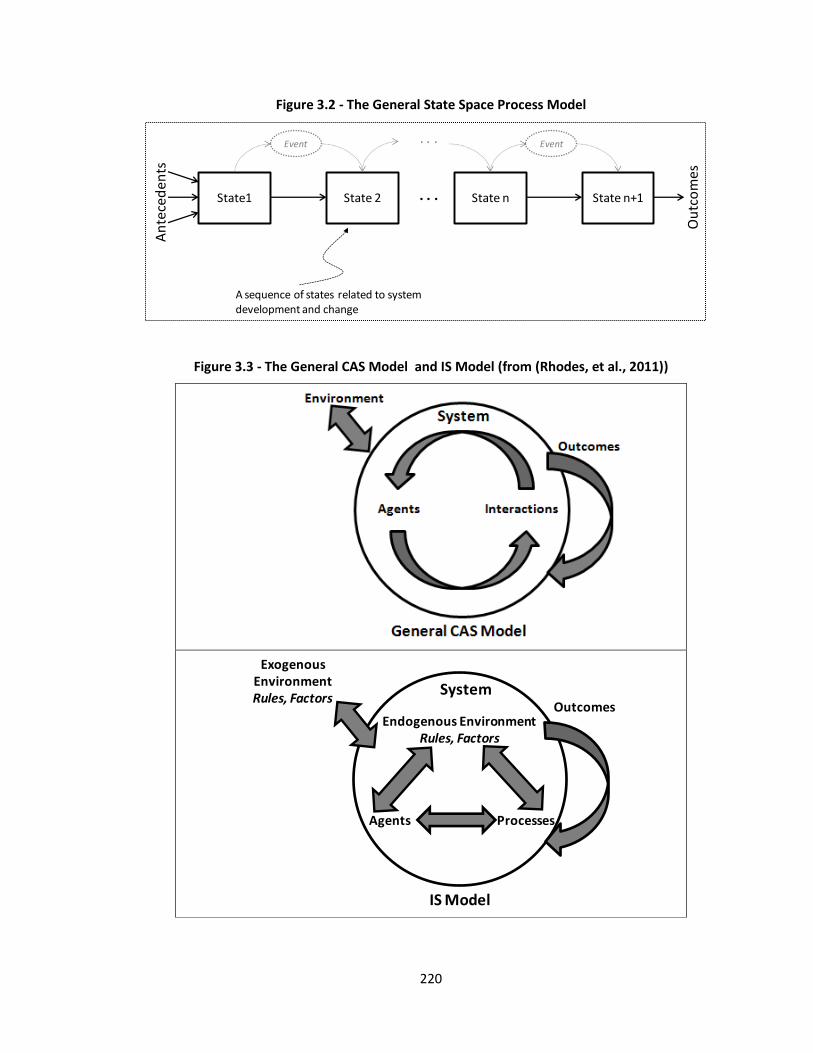
220
Figure 3.2 - The General State Space Process Model
Figure 3.3 - The General CAS Model and IS Model (from (Rhodes, et al., 2011))
State1 State 2 State n State n+1. . .
An
tece
den
ts
Ou
tco
mes
A sequence of states related to system development and change
Event Event. . .
Agents Processes
Outcomes
ExogenousEnvironmentRules, Factors
Endogenous EnvironmentRules, Factors
System
IS Model
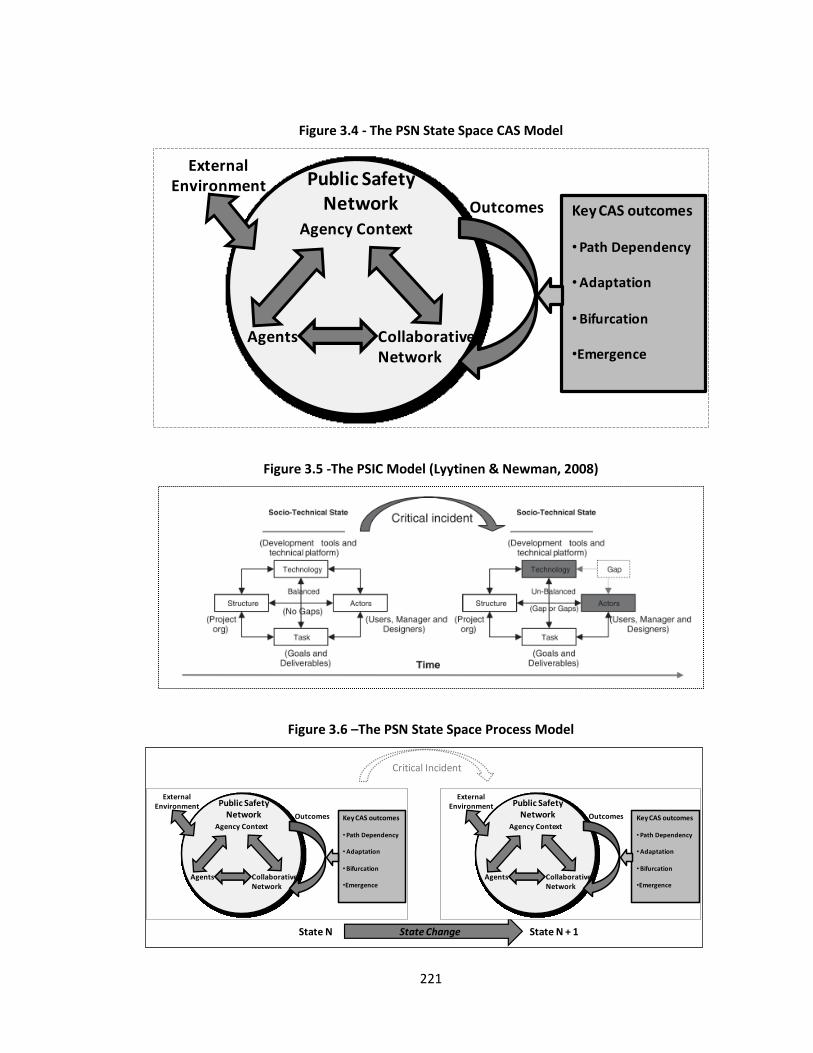
221
Figure 3.4 - The PSN State Space CAS Model
Figure 3.5 -The PSIC Model (Lyytinen & Newman, 2008)
Figure 3.6 –The PSN State Space Process Model
Agents CollaborativeNetwork
Outcomes
External Environment
Agency Context
Public Safety Network Key CAS outcomes
• Path Dependency
• Adaptation
• Bifurcation
•Emergence
Critical Incident
State N State N + 1State Change
Agents CollaborativeNetwork
Outcomes
External Environment
Agency Context
Public Safety Network Key CAS outcomes
• Path Dependency
• Adaptation
• Bifurcation
•EmergenceAgents Collaborative
Network
Outcomes
External Environment
Agency Context
Public Safety Network Key CAS outcomes
• Path Dependency
• Adaptation
• Bifurcation
•Emergence
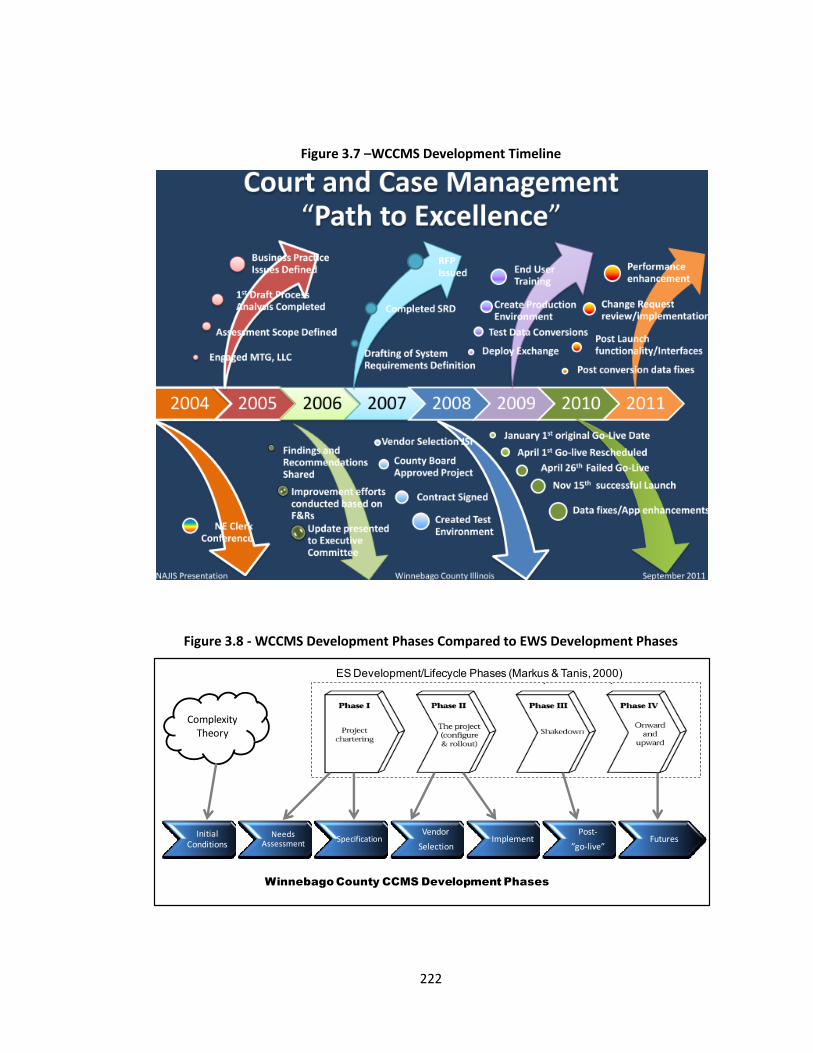
222
Figure 3.7 –WCCMS Development Timeline
Figure 3.8 - WCCMS Development Phases Compared to EWS Development Phases
Complexity Theory
Initial Conditions
Needs Assessment
SpecificationVendor
SelectionImplement
Post-
”go-live”Futures
ES Development/Lifecycle Phases (Markus & Tanis, 2000)
Winnebago County CCMS Development Phases
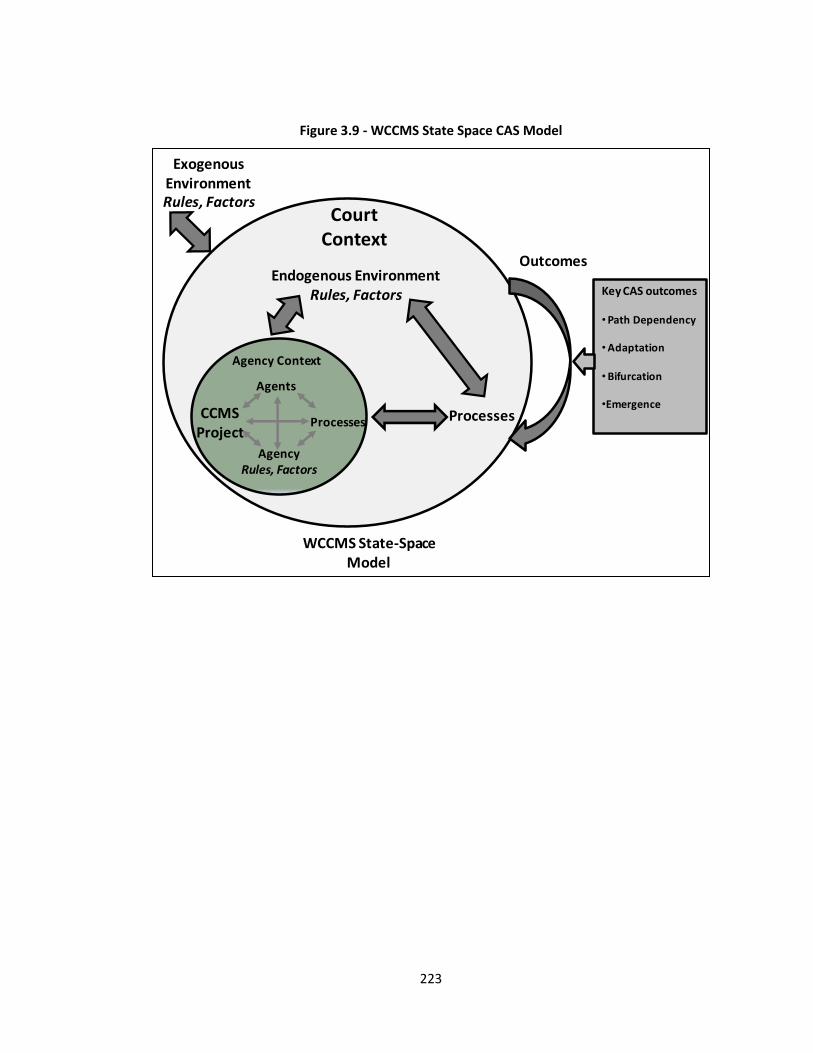
223
Figure 3.9 - WCCMS State Space CAS Model
Processes
Outcomes
ExogenousEnvironmentRules, Factors
Endogenous EnvironmentRules, Factors
Court Context
WCCMS State-Space Model
Agents
AgencyRules, Factors
ProcessesCCMS
Project
Agency Context
Key CAS outcomes
• Path Dependency
• Adaptation
• Bifurcation
•Emergence
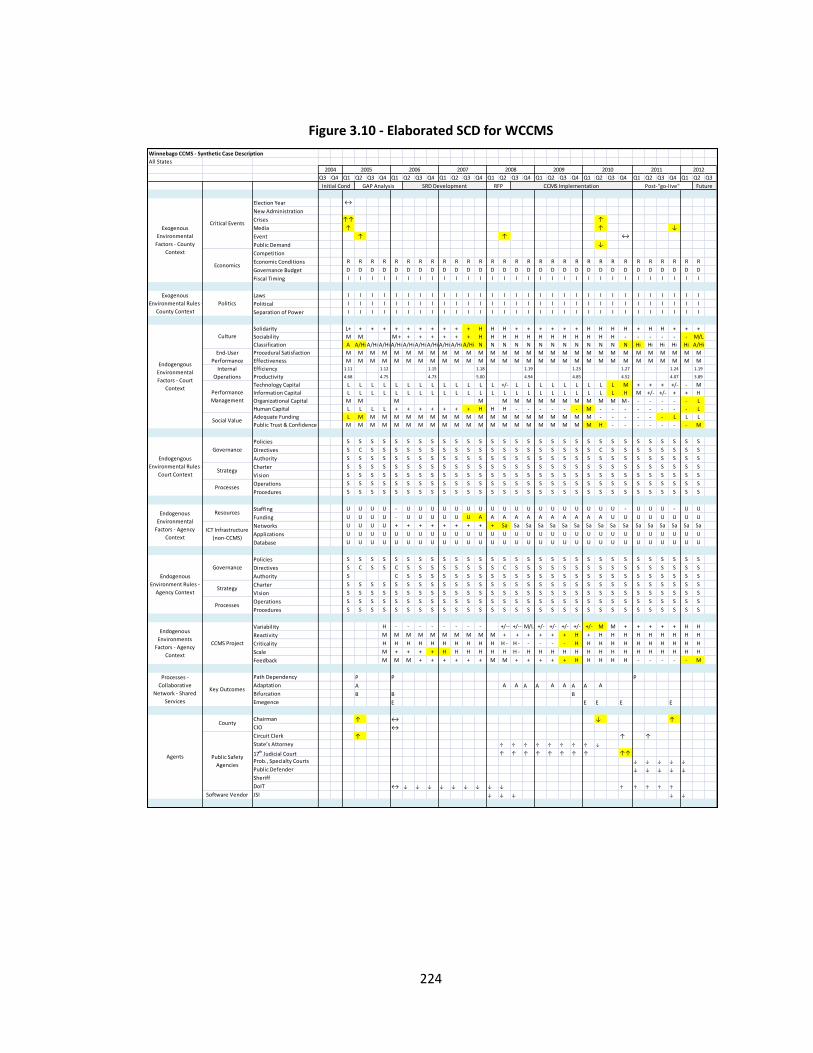
224
Figure 3.10 - Elaborated SCD for WCCMS
Winnebago CCMS - Synthetic Case Description
All States
Q3 Q4 Q1 Q2 Q3 Q4 Q1 Q2 Q3 Q4 Q1 Q2 Q3 Q4 Q1 Q2 Q3 Q4 Q1 Q2 Q3 Q4 Q1 Q2 Q3 Q4 Q1 Q2 Q3 Q4 Q1 Q2 Q3
Election Year ↔
New Administration
Crises ↑↑ ↑
Media ↑ ↑ ↓
Event ↑ ↑ ↔
Public Demand ↓
Competition
Economic Conditions R R R R R R R R R R R R R R R R R R R R R R R R R R R R R R
Governance Budget D D D D D D D D D D D D D D D D D D D D D D D D D D D D D D
Fiscal Timing I I I I I I I I I I I I I I I I I I I I I I I I I I I I I I
Laws I I I I I I I I I I I I I I I I I I I I I I I I I I I I I I
Political I I I I I I I I I I I I I I I I I I I I I I I I I I I I I I
Separation of Power I I I I I I I I I I I I I I I I I I I I I I I I I I I I I I
Solidarity L+ + + + + + + + + + + H H H + + + + + + H H H H + H H + + +
Sociability M M M + + + + + + + H H H H H H H H H H H H - - - - - - M/L
Classification A A/Hi A/Hi A/Hi A/Hi A/Hi A/Hi A/Hi A/Hi A/Hi A/Hi N N N N N N N N N N N N N Hi Hi Hi Hi Hi A/Hi
Procedural Satisfaction M M M M M M M M M M M M M M M M M M M M M M M M M M M M M M
Effectiveness M M M M M M M M M M M M M M M M M M M M M M M M M M M M M M
Efficiency 1.11 1.12 1.15 1.18 1.19 1.23 1.27 1.24 1.19
Productivity 4.68 4.75 4.73 5.00 4.94 4.85 4.52 4.07 3.89
Technology Capital L L L L L L L L L L L L L +/- L L L L L L L L L M + + + +/- - M
Information Capital L L L L L L L L L L L L L L L L L L L L L L L H M +/- +/- + + H
Organizational Capital M M M M M M M M M M M M M M M - - - - - - L
Human Capital L L L L + + + + + + + H H H - - - - - - M - - - - - - - - L
Adequate Funding L M M M M M M M M M M M M M M M M M M M M - - - - - - L L L
Public Trust & Confidence M M M M M M M M M M M M M M M M M M M M M H - - - - - - - M
Policies S S S S S S S S S S S S S S S S S S S S S S S S S S S S S S
Directives S C S S S S S S S S S S S S S S S S S S S C S S S S S S S S
Authority S S S S S S S S S S S S S S S S S S S S S S S S S S S S S S
Charter S S S S S S S S S S S S S S S S S S S S S S S S S S S S S S
Vision S S S S S S S S S S S S S S S S S S S S S S S S S S S S S S
Operations S S S S S S S S S S S S S S S S S S S S S S S S S S S S S S
Procedures S S S S S S S S S S S S S S S S S S S S S S S S S S S S S S
Staffing U U U U - U U U U U U U U U U U U U U U U U U - U U U - U U
Funding U U U U - U U U U U U A A A A A A A A A A A U U U U U U U U
Networks U U U U + + + + + + + + + Sa Sa Sa Sa Sa Sa Sa Sa Sa Sa Sa Sa Sa Sa Sa Sa Sa
Applications U U U U U U U U U U U U U U U U U U U U U U U U U U U U U U
Database U U U U U U U U U U U U U U U U U U U U U U U U U U U U U U
Policies S S S S S S S S S S S S S S S S S S S S S S S S S S S S S S
Directives S C S S C S S S S S S S S C S S S S S S S S S S S S S S S S
Authority S C S S S S S S S S S S S S S S S S S S S S S S S S S
Charter S S S S S S S S S S S S S S S S S S S S S S S S S S S S S S
Vision S S S S S S S S S S S S S S S S S S S S S S S S S S S S S S
Operations S S S S S S S S S S S S S S S S S S S S S S S S S S S S S S
Procedures S S S S S S S S S S S S S S S S S S S S S S S S S S S S S S
Variability H - - - - - - - - +/-- +/-- M/L +/- +/- +/- +/- +/- M M + + + + + H H
Reactivity M M M M M M M M M M + + + + + + H + H H H H H H H H H
Criticality H H H H H H H H H H H - H - - - - - H H H H H H H H H H H
Scale M + + + + H H H H H H H - H H H H H H H H H H H H H H H
Feedback M M M + + + + + + M M + + + + + H H H H H - - - - - M
Path Dependency P P P
Adaptation A A A A A A A A A A
Bifurcation B B B
Emegence E E E E E
Chairman ↑ ↔ ↓ ↑
CIO ↔
Circuit Clerk ↑ ↑ ↑
State’s Attorney ↑ ↑ ↑ ↑ ↑ ↑ ↑ ↑ ↓
17th Judicial Court ↑ ↑ ↑ ↑ ↑ ↑ ↑ ↑ ↑↑
Prob., Specialty Courts ↓ ↓ ↓ ↓ ↓
Public Defender ↓ ↓ ↓ ↓ ↓
Sheriff
DoIT ↔ ↓ ↓ ↓ ↓ ↓ ↓ ↓ ↓ ↓ ↑ ↑ ↑ ↑ ↑
Software Vendor JSI ↓ ↓ ↓ ↓ ↓
Agents
2004 2005 2006 2007
Critical Events
Economics
Politics
Culture
Endogenous
Environment Rules -
Agency Context
County
Public Safety
Agencies
Exogenous
Environmental Rules -
County Context
Endogengous
Environmental
Factors - Court
Context
End-User
Performance
Internal
Operations
Performance
Management
Social Value
Governance
Strategy
Processes
Resources
ICT Infrastructure
(non-CCMS)
Endogenous
Environmental
Factors - Agency
Context
Governance
Strategy
Processes -
Collaborative
Network - Shared
Services
Key Outcomes
GAP AnalysisInitial Cond
Endogenous
Environments
Factors - Agency
Context
CCMS Project
Processes
Exogenous
Environmental
Factors - County
Context
Endogengous
Environmental Rules -
Court Context
SRD Development RFP CCMS Implementation
2012
Post-"go-live" Future
2010 20112008 2009
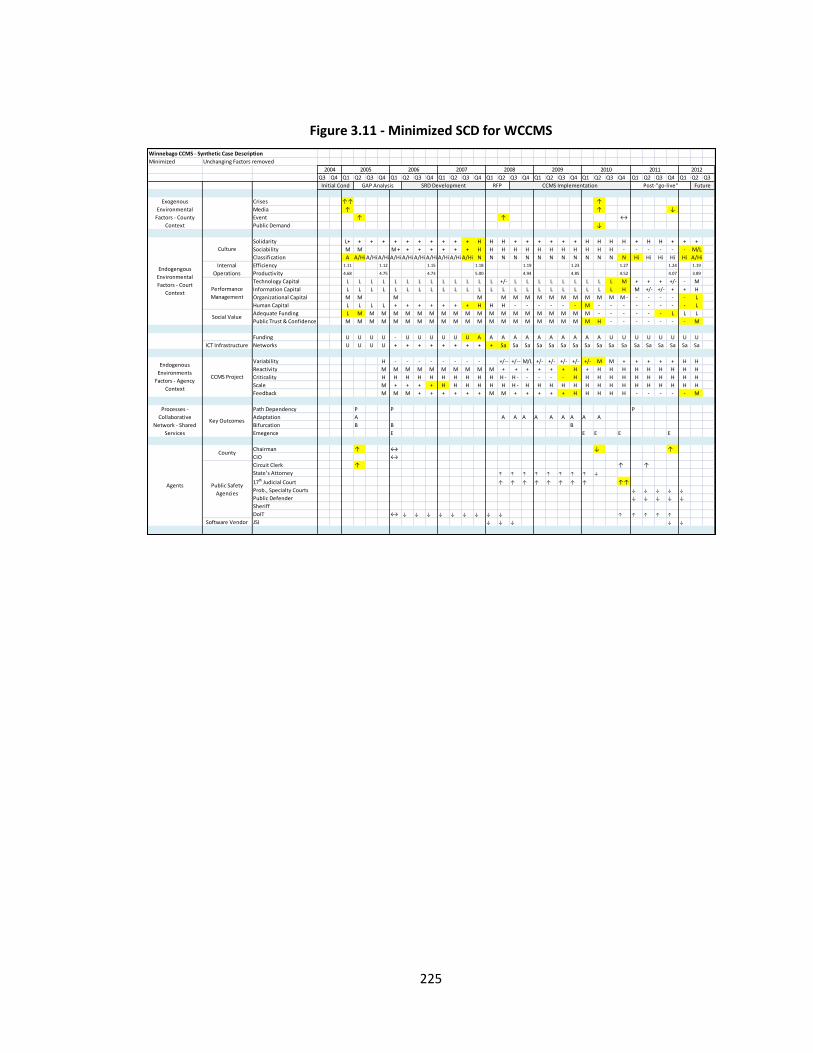
225
Figure 3.11 - Minimized SCD for WCCMS
Winnebago CCMS - Synthetic Case Description
Minimized Unchanging Factors removed
Q3 Q4 Q1 Q2 Q3 Q4 Q1 Q2 Q3 Q4 Q1 Q2 Q3 Q4 Q1 Q2 Q3 Q4 Q1 Q2 Q3 Q4 Q1 Q2 Q3 Q4 Q1 Q2 Q3 Q4 Q1 Q2 Q3
Crises ↑↑ ↑
Media ↑ ↑ ↓
Event ↑ ↑ ↔
Public Demand ↓
Solidarity L+ + + + + + + + + + + H H H + + + + + + H H H H + H H + + +
Sociability M M M + + + + + + + H H H H H H H H H H H H - - - - - - M/L
Classification A A/Hi A/Hi A/Hi A/Hi A/Hi A/Hi A/Hi A/Hi A/Hi A/Hi N N N N N N N N N N N N N Hi Hi Hi Hi Hi A/Hi
Efficiency 1.11 1.12 1.15 1.18 1.19 1.23 1.27 1.24 1.19
Productivity 4.68 4.75 4.73 5.00 4.94 4.85 4.52 4.07 3.89
Technology Capital L L L L L L L L L L L L L +/- L L L L L L L L L M + + + +/- - M
Information Capital L L L L L L L L L L L L L L L L L L L L L L L H M +/- +/- + + H
Organizational Capital M M M M M M M M M M M M M M M - - - - - - L
Human Capital L L L L + + + + + + + H H H - - - - - - M - - - - - - - - L
Adequate Funding L M M M M M M M M M M M M M M M M M M M M - - - - - - L L L
Public Trust & Confidence M M M M M M M M M M M M M M M M M M M M M H - - - - - - - M
Funding U U U U - U U U U U U A A A A A A A A A A A U U U U U U U U
ICT Infrastructure Networks U U U U + + + + + + + + + Sa Sa Sa Sa Sa Sa Sa Sa Sa Sa Sa Sa Sa Sa Sa Sa Sa
Variability H - - - - - - - - +/-- +/-- M/L +/- +/- +/- +/- +/- M M + + + + + H H
Reactivity M M M M M M M M M M + + + + + + H + H H H H H H H H H
Criticality H H H H H H H H H H H - H - - - - - H H H H H H H H H H H
Scale M + + + + H H H H H H H - H H H H H H H H H H H H H H H
Feedback M M M + + + + + + M M + + + + + H H H H H - - - - - M
Path Dependency P P P
Adaptation A A A A A A A A A A
Bifurcation B B B
Emegence E E E E E
Chairman ↑ ↔ ↓ ↑
CIO ↔
Circuit Clerk ↑ ↑ ↑
State’s Attorney ↑ ↑ ↑ ↑ ↑ ↑ ↑ ↑ ↓
17th Judicial Court ↑ ↑ ↑ ↑ ↑ ↑ ↑ ↑ ↑↑
Prob., Specialty Courts ↓ ↓ ↓ ↓ ↓
Public Defender ↓ ↓ ↓ ↓ ↓
Sheriff
DoIT ↔ ↓ ↓ ↓ ↓ ↓ ↓ ↓ ↓ ↓ ↑ ↑ ↑ ↑ ↑
Software Vendor JSI ↓ ↓ ↓ ↓ ↓
2010 2011 2012
Initial Cond GAP Analysis SRD Development RFP CCMS Implementation Post-"go-live" Future
2004 2005 2006 2007 2008 2009
Endogenous
Environments
Factors - Agency
Context
CCMS Project
Social Value
Exogenous
Environmental
Factors - County
Context
Endogengous
Environmental
Factors - Court
Context
Culture
Internal
Operations
Performance
Management
Processes -
Collaborative
Network - Shared
Services
Key Outcomes
Agents
County
Public Safety
Agencies
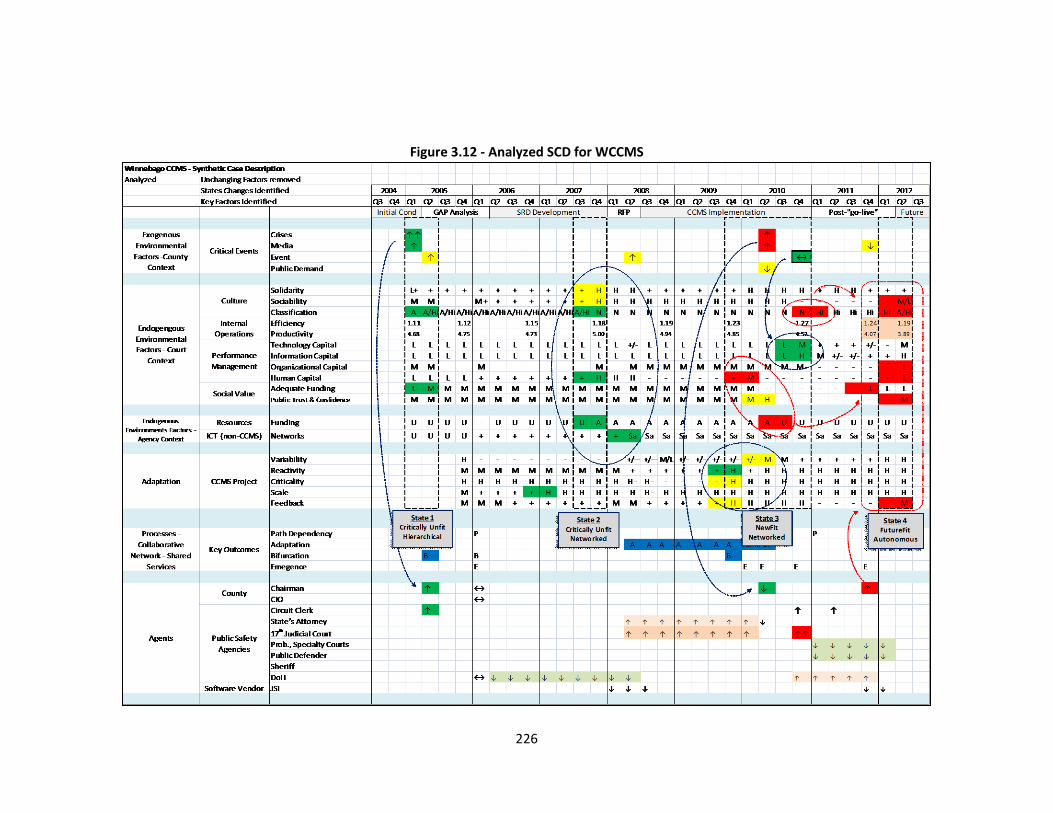
226
Figure 3.12 - Analyzed SCD for WCCMS
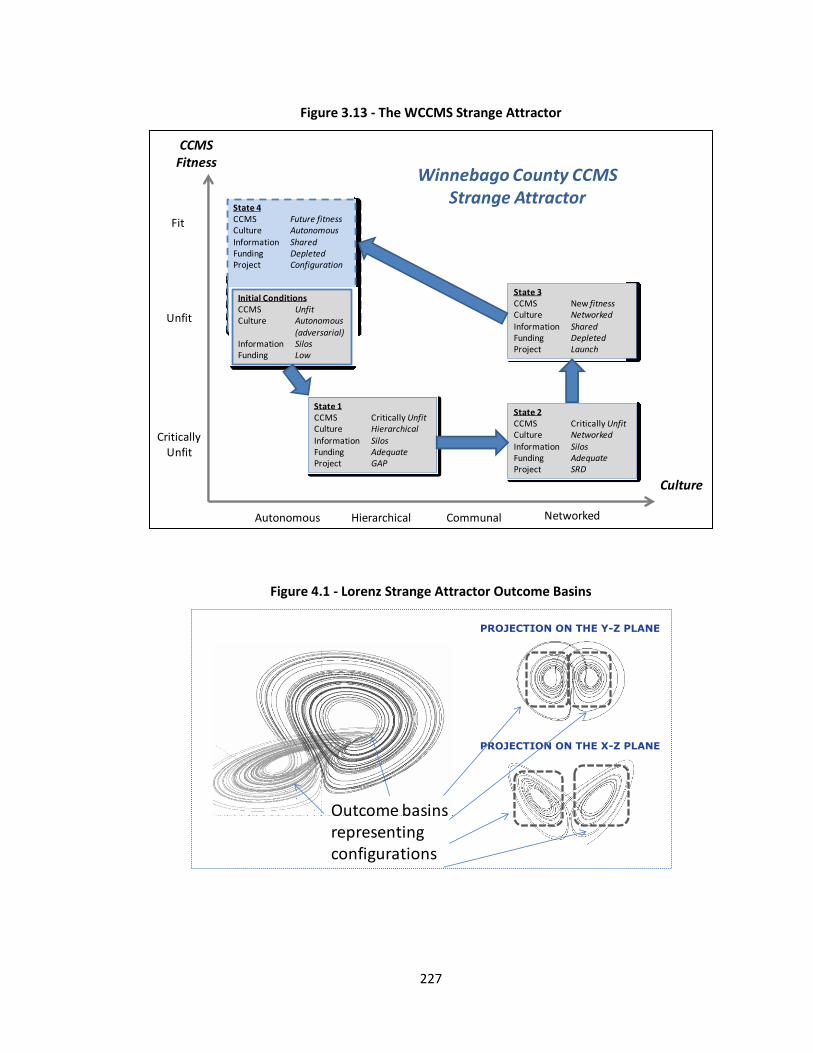
227
Figure 3.13 - The WCCMS Strange Attractor
Figure 4.1 - Lorenz Strange Attractor Outcome Basins
State 4CCMS Future fitnessCulture AutonomousInformation SharedFunding DepletedProject Configuration
Initial ConditionsCCMS UnfitCulture Autonomous
(adversarial)Information SilosFunding Low
State 1CCMS Critically UnfitCulture HierarchicalInformation SilosFunding AdequateProject GAP
State 2CCMS Critically UnfitCulture Networked
Information SilosFunding AdequateProject SRD
State 3CCMS New fitnessCulture NetworkedInformation SharedFunding DepletedProject Launch
CriticallyUnfit
Unfit
Fit
CCMSFitness
Culture
Autonomous Networked
Winnebago County CCMS Strange Attractor
Hierarchical Communal
PROJECTION ON THE Y-Z PLANE
PROJECTION ON THE X-Z PLANE
THE LORENZ ATTRACTOR CONTAINS TWO DISK-LIKE OUTCOME BASINS,
ONE CORRESPONDING TO CLOCKWISE ROTATION AND ONE TO
COUNTERCLOCKWISE. AS POINTS (REPRESENTING SYSTEM STATES) EVOLVE
AND PROGRESS ALONG THE TRAJECTORY THEY MOVE TO THE CENTER OF
THE BASIN. AT SOME TIME THEY MAY HAVE WANDERED FAR ENOUGH SO
THAT ON THE NEXT PASS THEY SPLIT OFF AN BEGIN SPINNING ON THE
OTHER BASIN. THEREFORE TWO POINTS VERY CLOSE TO EACH OTHER
(REPRESENTING SIMILAR SYSTEMS) MAY EVENTUALLY DIVERGE TO
DIFFERENT OUTCOME BASINS OF THE STRANGE ATTRACTOR.
Outcome basins representing configurations
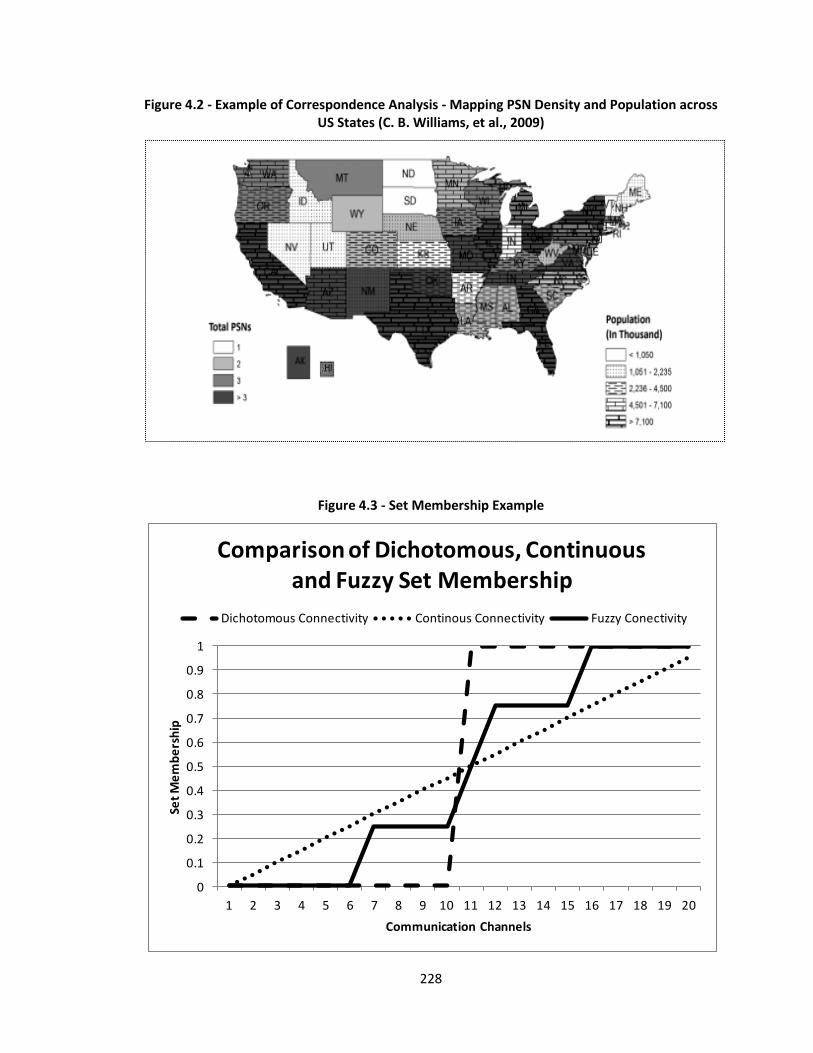
228
Figure 4.2 - Example of Correspondence Analysis - Mapping PSN Density and Population across US States (C. B. Williams, et al., 2009)
Figure 4.3 - Set Membership Example
0
0.1
0.2
0.3
0.4
0.5
0.6
0.7
0.8
0.9
1
1 2 3 4 5 6 7 8 9 10 11 12 13 14 15 16 17 18 19 20
Set
Me
mb
ers
hip
Communication Channels
Comparison of Dichotomous, Continuous and Fuzzy Set Membership
Dichotomous Connectivity Continous Connectivity Fuzzy Conectivity
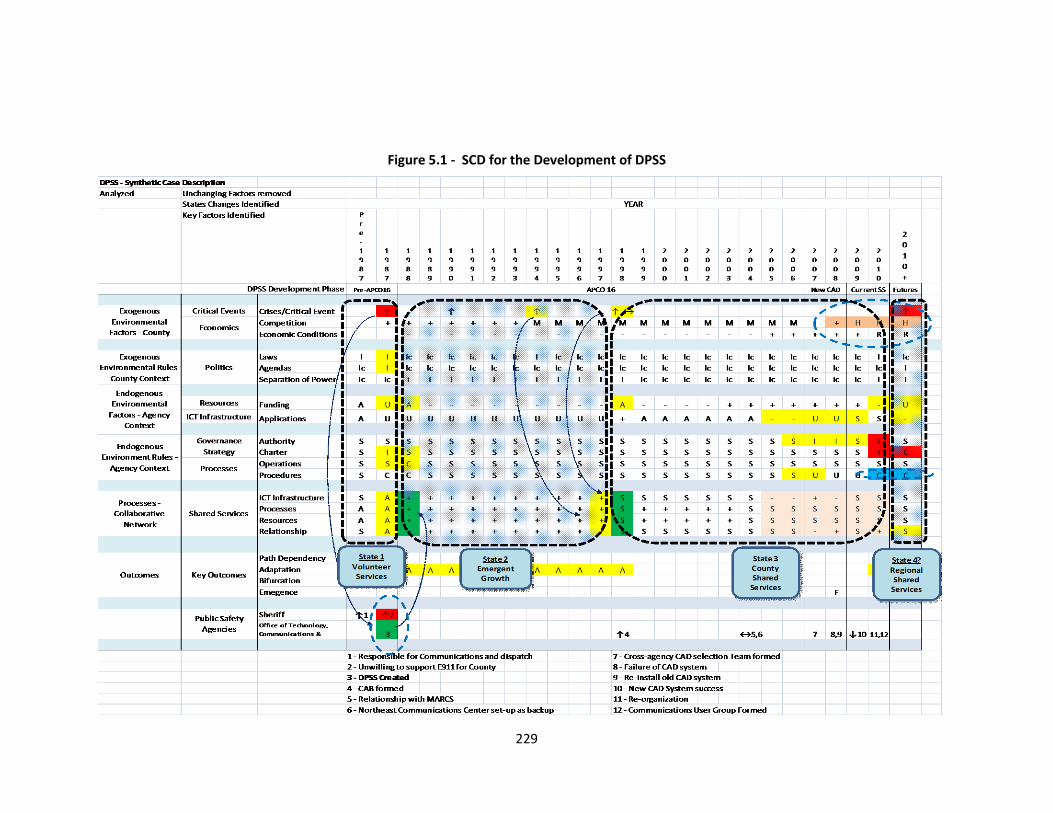
229
Figure 5.1 - SCD for the Development of DPSS
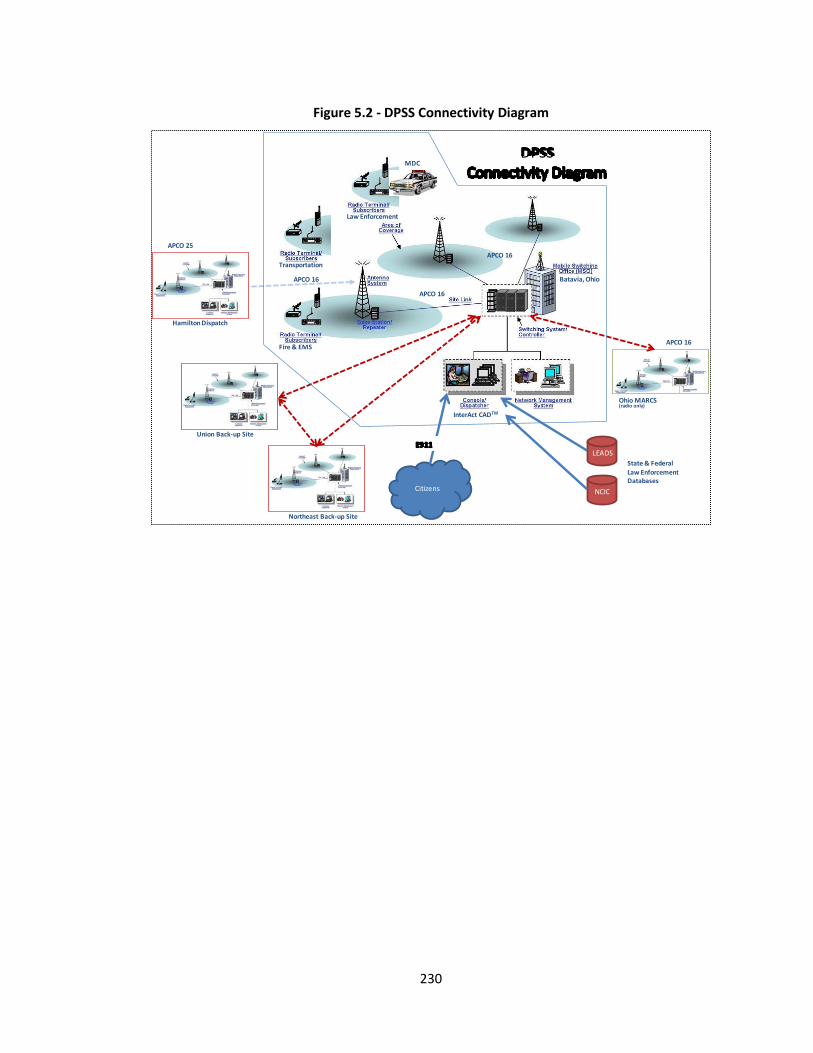
230
Figure 5.2 - DPSS Connectivity Diagram
InterAct CADTM
Batavia, Ohio
Transportation
Fire & EMS
Law Enforcement
APCO 16
APCO 16
Union Back-up Site
Northeast Back-up Site
Ohio MARCS(radio only)
Citizens
E911LEADS
NCIC
APCO 16
Hamilton Dispatch
APCO 16
APCO 25
DPSS Connectivity Diagram
State & FederalLaw EnforcementDatabases
MDC
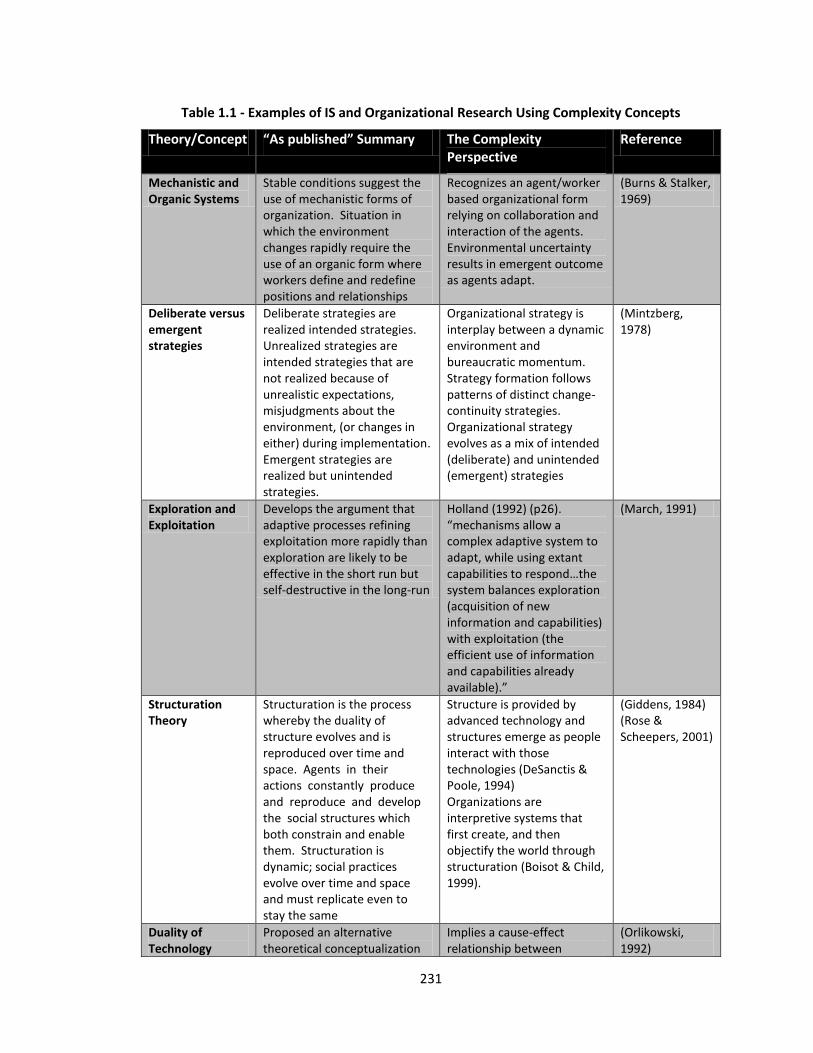
231
Table 1.1 - Examples of IS and Organizational Research Using Complexity Concepts
Theory/Concept “As published” Summary The Complexity Perspective
Reference
Mechanistic and Organic Systems
Stable conditions suggest the use of mechanistic forms of organization. Situation in which the environment changes rapidly require the use of an organic form where workers define and redefine positions and relationships
Recognizes an agent/worker based organizational form relying on collaboration and interaction of the agents. Environmental uncertainty results in emergent outcome as agents adapt.
(Burns & Stalker, 1969)
Deliberate versus emergent strategies
Deliberate strategies are realized intended strategies. Unrealized strategies are intended strategies that are not realized because of unrealistic expectations, misjudgments about the environment, (or changes in either) during implementation. Emergent strategies are realized but unintended strategies.
Organizational strategy is interplay between a dynamic environment and bureaucratic momentum. Strategy formation follows patterns of distinct change-continuity strategies. Organizational strategy evolves as a mix of intended (deliberate) and unintended (emergent) strategies
(Mintzberg, 1978)
Exploration and Exploitation
Develops the argument that adaptive processes refining exploitation more rapidly than exploration are likely to be effective in the short run but self-destructive in the long-run
Holland (1992) (p26). “mechanisms allow a complex adaptive system to adapt, while using extant capabilities to respond…the system balances exploration (acquisition of new information and capabilities) with exploitation (the efficient use of information and capabilities already available).”
(March, 1991)
Structuration Theory
Structuration is the process whereby the duality of structure evolves and is reproduced over time and space. Agents in their actions constantly produce and reproduce and develop the social structures which both constrain and enable them. Structuration is dynamic; social practices evolve over time and space and must replicate even to stay the same
Structure is provided by advanced technology and structures emerge as people interact with those technologies (DeSanctis & Poole, 1994) Organizations are interpretive systems that first create, and then objectify the world through structuration (Boisot & Child, 1999).
(Giddens, 1984) (Rose & Scheepers, 2001)
Duality of Technology
Proposed an alternative theoretical conceptualization
Implies a cause-effect relationship between
(Orlikowski, 1992)
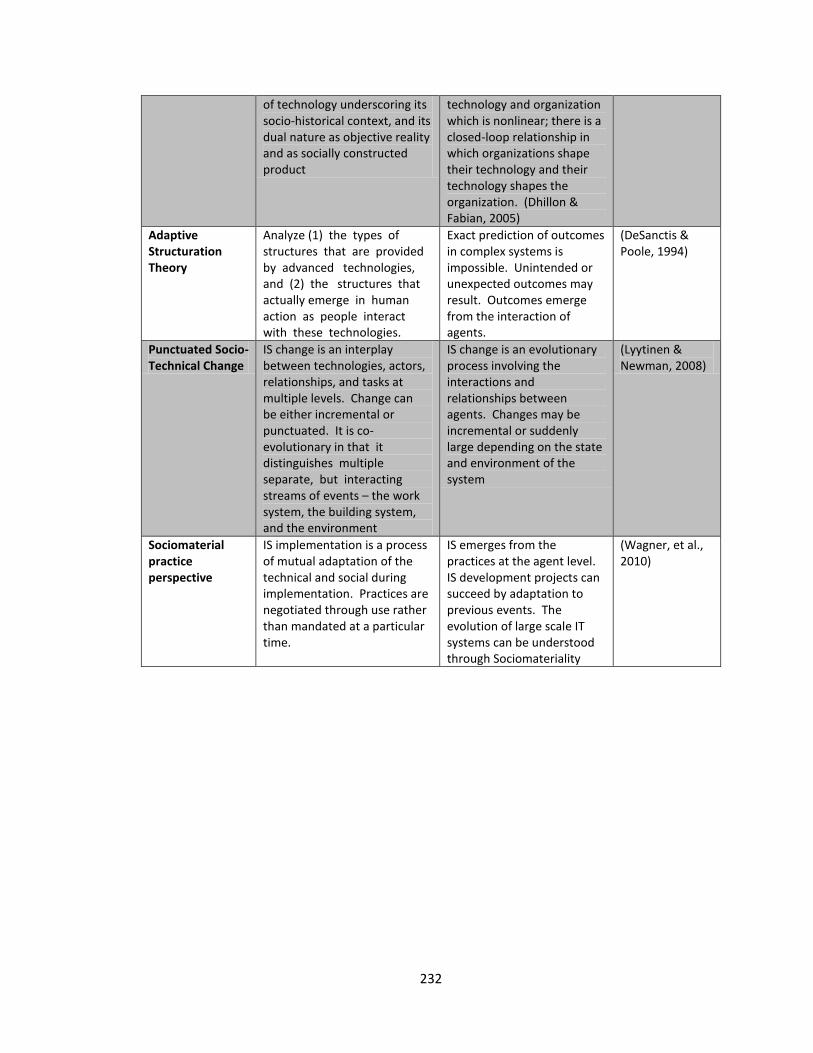
232
of technology underscoring its socio-historical context, and its dual nature as objective reality and as socially constructed product
technology and organization which is nonlinear; there is a closed-loop relationship in which organizations shape their technology and their technology shapes the organization. (Dhillon & Fabian, 2005)
Adaptive Structuration Theory
Analyze (1) the types of structures that are provided by advanced technologies, and (2) the structures that actually emerge in human action as people interact with these technologies.
Exact prediction of outcomes in complex systems is impossible. Unintended or unexpected outcomes may result. Outcomes emerge from the interaction of agents.
(DeSanctis & Poole, 1994)
Punctuated Socio-Technical Change
IS change is an interplay between technologies, actors, relationships, and tasks at multiple levels. Change can be either incremental or punctuated. It is co-evolutionary in that it distinguishes multiple separate, but interacting streams of events – the work system, the building system, and the environment
IS change is an evolutionary process involving the interactions and relationships between agents. Changes may be incremental or suddenly large depending on the state and environment of the system
(Lyytinen & Newman, 2008)
Sociomaterial practice perspective
IS implementation is a process of mutual adaptation of the technical and social during implementation. Practices are negotiated through use rather than mandated at a particular time.
IS emerges from the practices at the agent level. IS development projects can succeed by adaptation to previous events. The evolution of large scale IT systems can be understood through Sociomateriality
(Wagner, et al., 2010)
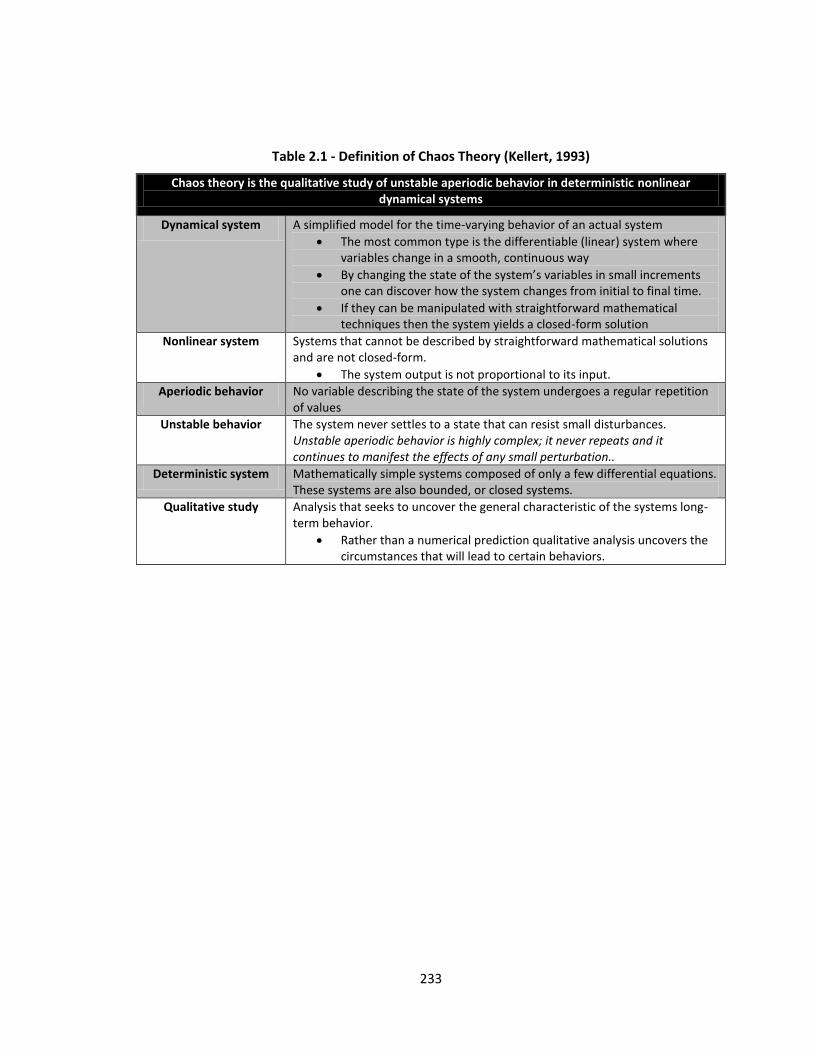
233
Table 2.1 - Definition of Chaos Theory (Kellert, 1993)
Chaos theory is the qualitative study of unstable aperiodic behavior in deterministic nonlinear dynamical systems
Dynamical system A simplified model for the time-varying behavior of an actual system
The most common type is the differentiable (linear) system where variables change in a smooth, continuous way
By changing the state of the system’s variables in small increments one can discover how the system changes from initial to final time.
If they can be manipulated with straightforward mathematical techniques then the system yields a closed-form solution
Nonlinear system Systems that cannot be described by straightforward mathematical solutions and are not closed-form.
The system output is not proportional to its input.
Aperiodic behavior No variable describing the state of the system undergoes a regular repetition of values
Unstable behavior The system never settles to a state that can resist small disturbances. Unstable aperiodic behavior is highly complex; it never repeats and it continues to manifest the effects of any small perturbation..
Deterministic system Mathematically simple systems composed of only a few differential equations. These systems are also bounded, or closed systems.
Qualitative study Analysis that seeks to uncover the general characteristic of the systems long-term behavior.
Rather than a numerical prediction qualitative analysis uncovers the circumstances that will lead to certain behaviors.
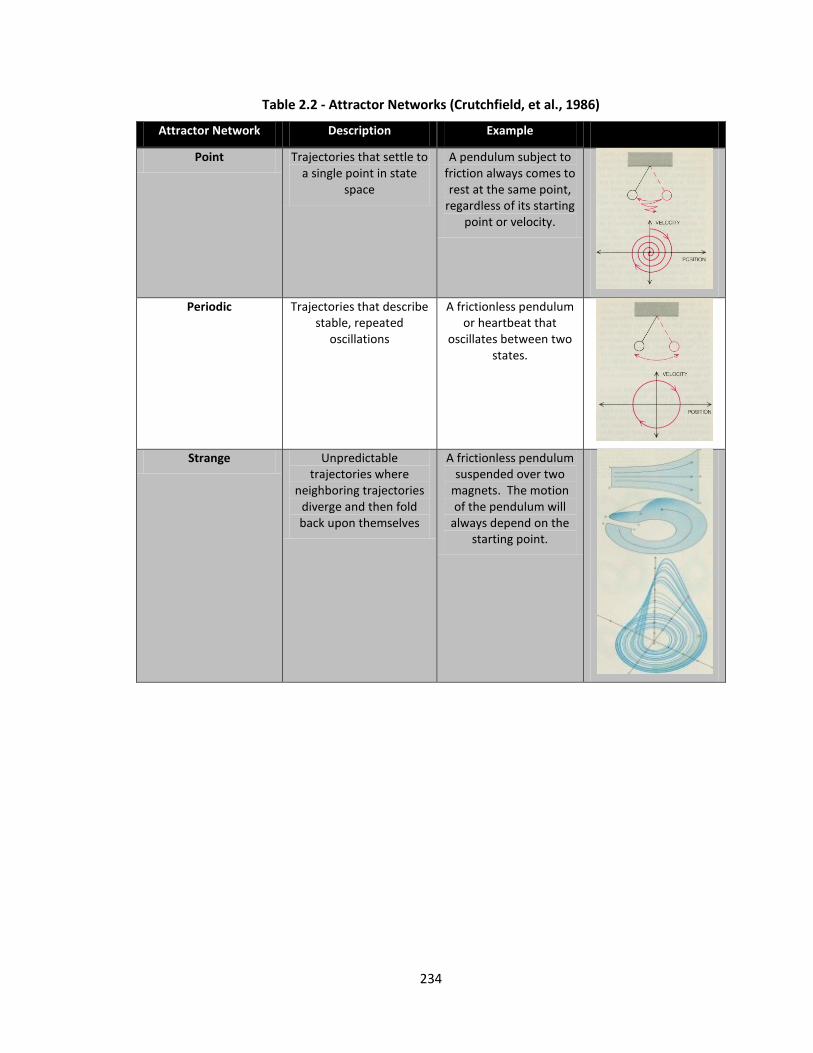
234
Table 2.2 - Attractor Networks (Crutchfield, et al., 1986)
Attractor Network Description Example
Point Trajectories that settle to a single point in state
space
A pendulum subject to friction always comes to rest at the same point,
regardless of its starting point or velocity.
Periodic Trajectories that describe stable, repeated
oscillations
A frictionless pendulum or heartbeat that
oscillates between two states.
Strange Unpredictable trajectories where
neighboring trajectories diverge and then fold back upon themselves
A frictionless pendulum suspended over two
magnets. The motion of the pendulum will
always depend on the starting point.
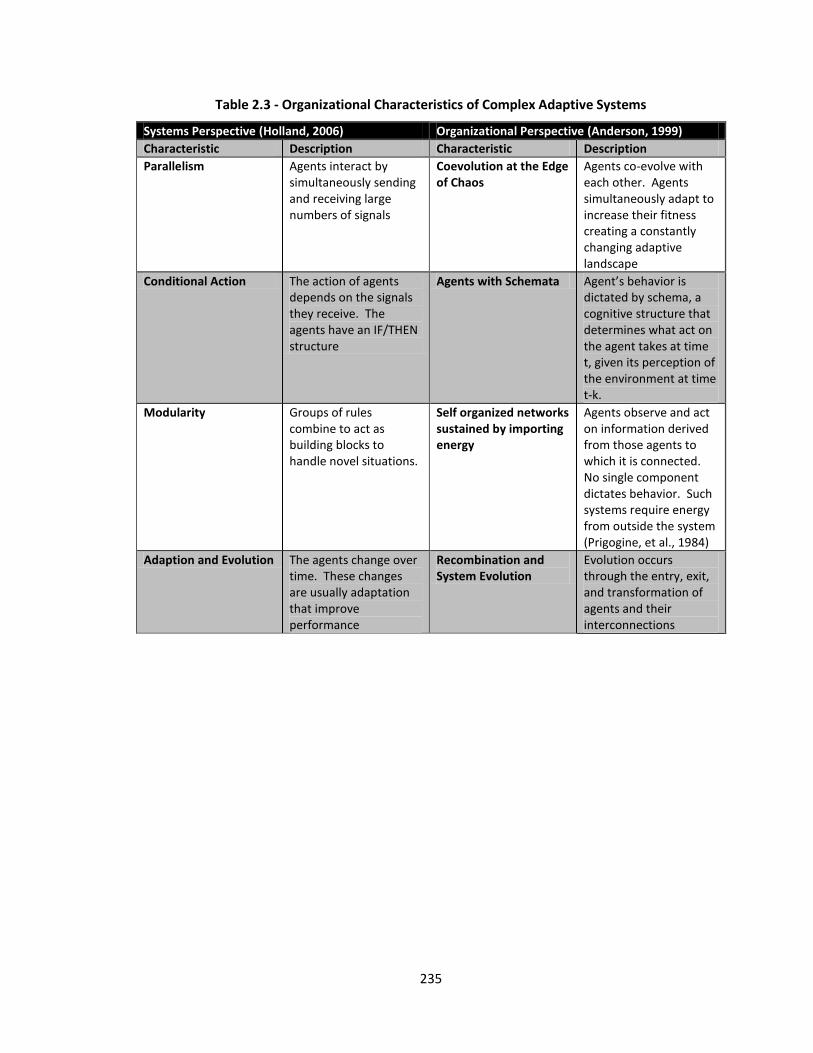
235
Table 2.3 - Organizational Characteristics of Complex Adaptive Systems
Systems Perspective (Holland, 2006) Organizational Perspective (Anderson, 1999)
Characteristic Description Characteristic Description
Parallelism Agents interact by simultaneously sending and receiving large numbers of signals
Coevolution at the Edge of Chaos
Agents co-evolve with each other. Agents simultaneously adapt to increase their fitness creating a constantly changing adaptive landscape
Conditional Action The action of agents depends on the signals they receive. The agents have an IF/THEN structure
Agents with Schemata Agent’s behavior is dictated by schema, a cognitive structure that determines what act on the agent takes at time t, given its perception of the environment at time t-k.
Modularity Groups of rules combine to act as building blocks to handle novel situations.
Self organized networks sustained by importing energy
Agents observe and act on information derived from those agents to which it is connected. No single component dictates behavior. Such systems require energy from outside the system (Prigogine, et al., 1984)
Adaption and Evolution The agents change over time. These changes are usually adaptation that improve performance
Recombination and System Evolution
Evolution occurs through the entry, exit, and transformation of agents and their interconnections
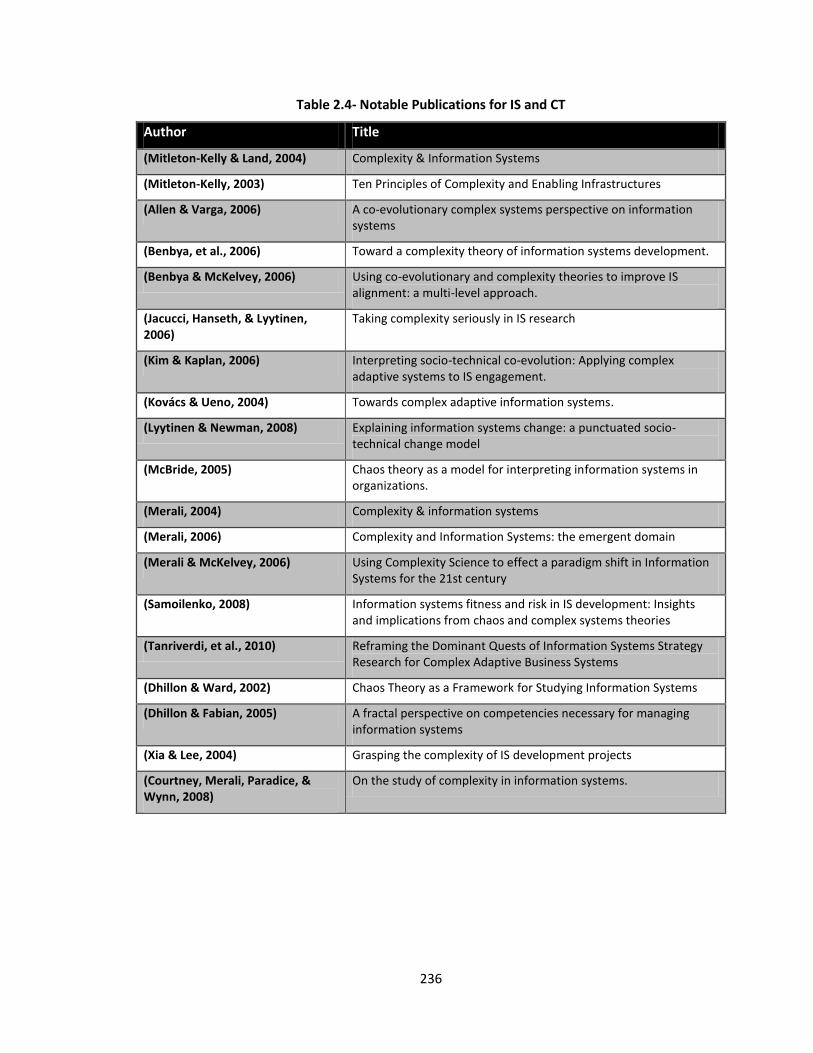
236
Table 2.4- Notable Publications for IS and CT
Author Title (Mitleton-Kelly & Land, 2004) Complexity & Information Systems
(Mitleton-Kelly, 2003) Ten Principles of Complexity and Enabling Infrastructures
(Allen & Varga, 2006) A co-evolutionary complex systems perspective on information systems
(Benbya, et al., 2006) Toward a complexity theory of information systems development.
(Benbya & McKelvey, 2006) Using co-evolutionary and complexity theories to improve IS alignment: a multi-level approach.
(Jacucci, Hanseth, & Lyytinen, 2006)
Taking complexity seriously in IS research
(Kim & Kaplan, 2006) Interpreting socio-technical co-evolution: Applying complex adaptive systems to IS engagement.
(Kovács & Ueno, 2004) Towards complex adaptive information systems.
(Lyytinen & Newman, 2008) Explaining information systems change: a punctuated socio-technical change model
(McBride, 2005) Chaos theory as a model for interpreting information systems in organizations.
(Merali, 2004) Complexity & information systems
(Merali, 2006) Complexity and Information Systems: the emergent domain
(Merali & McKelvey, 2006) Using Complexity Science to effect a paradigm shift in Information Systems for the 21st century
(Samoilenko, 2008) Information systems fitness and risk in IS development: Insights and implications from chaos and complex systems theories
(Tanriverdi, et al., 2010) Reframing the Dominant Quests of Information Systems Strategy Research for Complex Adaptive Business Systems
(Dhillon & Ward, 2002) Chaos Theory as a Framework for Studying Information Systems
(Dhillon & Fabian, 2005) A fractal perspective on competencies necessary for managing information systems
(Xia & Lee, 2004) Grasping the complexity of IS development projects
(Courtney, Merali, Paradice, & Wynn, 2008)
On the study of complexity in information systems.
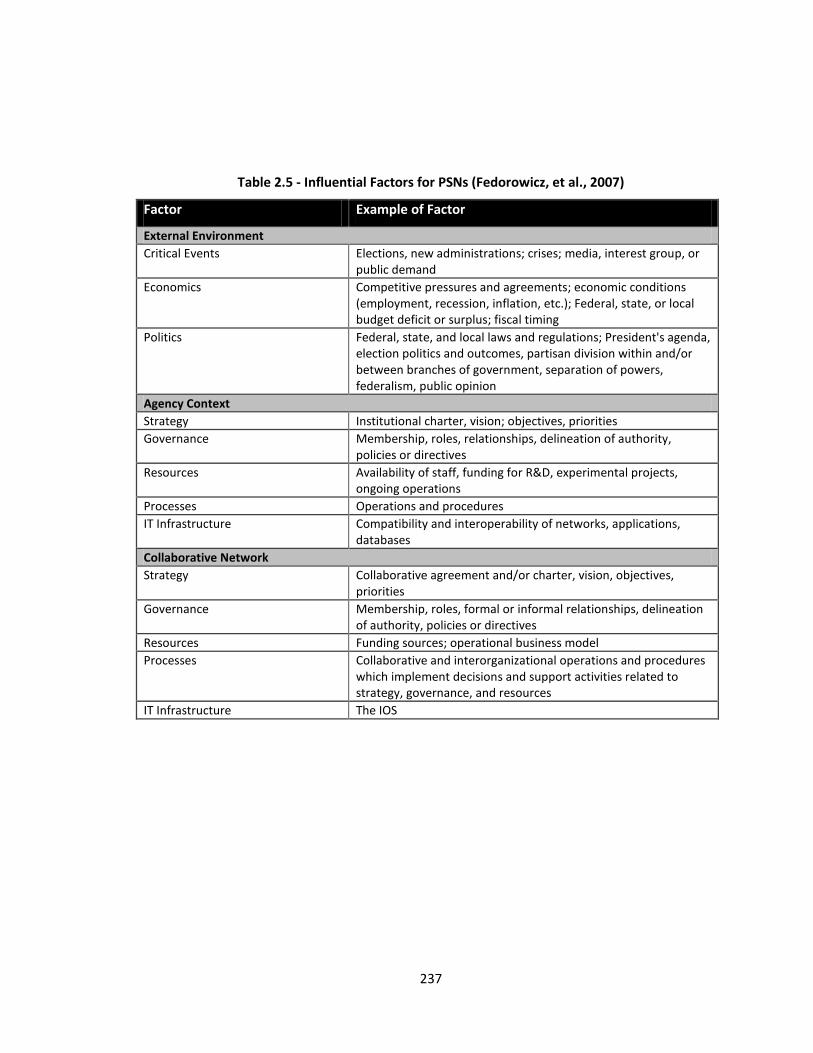
237
Table 2.5 - Influential Factors for PSNs (Fedorowicz, et al., 2007)
Factor Example of Factor External Environment
Critical Events Elections, new administrations; crises; media, interest group, or public demand
Economics Competitive pressures and agreements; economic conditions (employment, recession, inflation, etc.); Federal, state, or local budget deficit or surplus; fiscal timing
Politics Federal, state, and local laws and regulations; President's agenda, election politics and outcomes, partisan division within and/or between branches of government, separation of powers, federalism, public opinion
Agency Context
Strategy Institutional charter, vision; objectives, priorities
Governance Membership, roles, relationships, delineation of authority, policies or directives
Resources Availability of staff, funding for R&D, experimental projects, ongoing operations
Processes Operations and procedures
IT Infrastructure Compatibility and interoperability of networks, applications, databases
Collaborative Network
Strategy Collaborative agreement and/or charter, vision, objectives, priorities
Governance Membership, roles, formal or informal relationships, delineation of authority, policies or directives
Resources Funding sources; operational business model
Processes Collaborative and interorganizational operations and procedures which implement decisions and support activities related to strategy, governance, and resources
IT Infrastructure The IOS
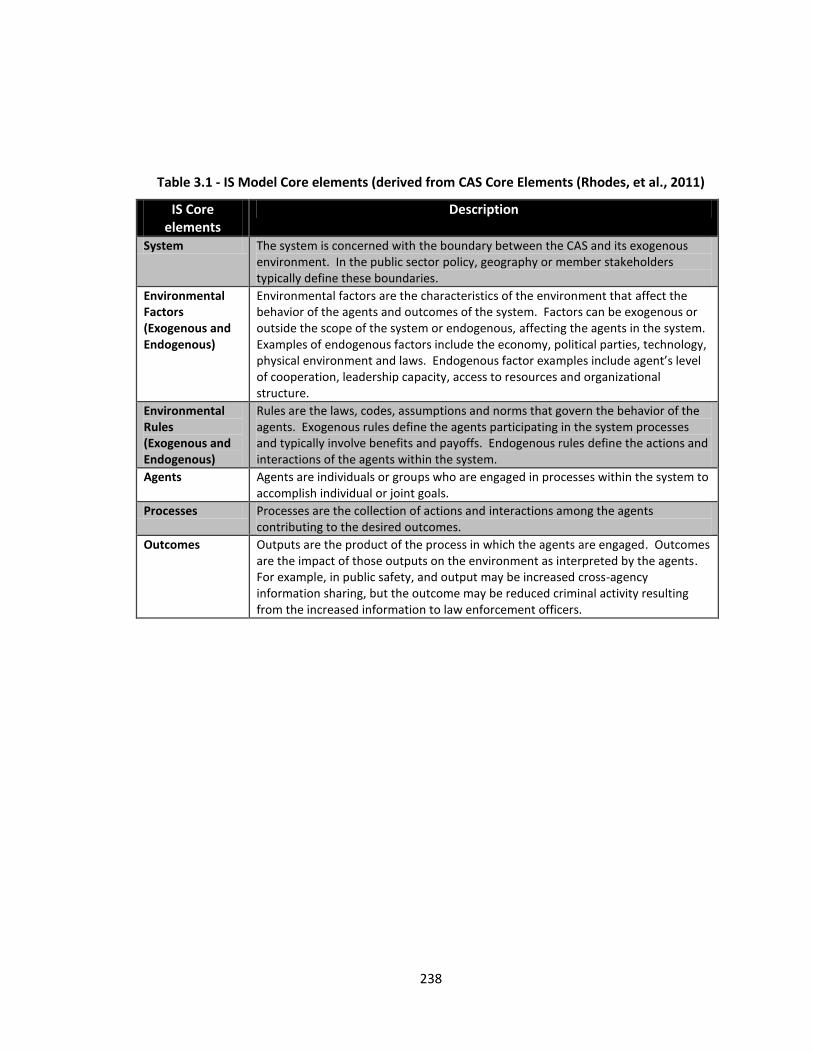
238
Table 3.1 - IS Model Core elements (derived from CAS Core Elements (Rhodes, et al., 2011)
IS Core elements
Description
System The system is concerned with the boundary between the CAS and its exogenous environment. In the public sector policy, geography or member stakeholders typically define these boundaries.
Environmental Factors (Exogenous and Endogenous)
Environmental factors are the characteristics of the environment that affect the behavior of the agents and outcomes of the system. Factors can be exogenous or outside the scope of the system or endogenous, affecting the agents in the system. Examples of endogenous factors include the economy, political parties, technology, physical environment and laws. Endogenous factor examples include agent’s level of cooperation, leadership capacity, access to resources and organizational structure.
Environmental Rules (Exogenous and Endogenous)
Rules are the laws, codes, assumptions and norms that govern the behavior of the agents. Exogenous rules define the agents participating in the system processes and typically involve benefits and payoffs. Endogenous rules define the actions and interactions of the agents within the system.
Agents Agents are individuals or groups who are engaged in processes within the system to accomplish individual or joint goals.
Processes Processes are the collection of actions and interactions among the agents contributing to the desired outcomes.
Outcomes Outputs are the product of the process in which the agents are engaged. Outcomes are the impact of those outputs on the environment as interpreted by the agents. For example, in public safety, and output may be increased cross-agency information sharing, but the outcome may be reduced criminal activity resulting from the increased information to law enforcement officers.
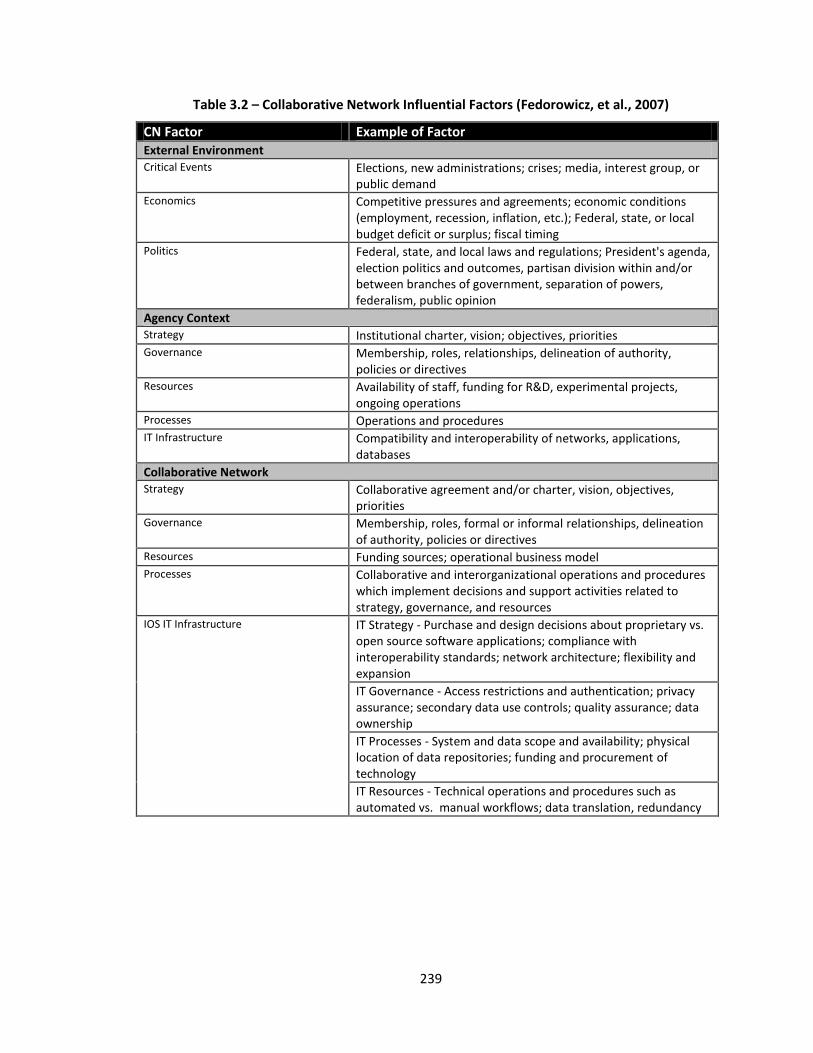
239
Table 3.2 – Collaborative Network Influential Factors (Fedorowicz, et al., 2007)
CN Factor Example of Factor External Environment Critical Events Elections, new administrations; crises; media, interest group, or
public demand Economics Competitive pressures and agreements; economic conditions
(employment, recession, inflation, etc.); Federal, state, or local budget deficit or surplus; fiscal timing
Politics Federal, state, and local laws and regulations; President's agenda, election politics and outcomes, partisan division within and/or between branches of government, separation of powers, federalism, public opinion
Agency Context Strategy Institutional charter, vision; objectives, priorities Governance Membership, roles, relationships, delineation of authority,
policies or directives Resources Availability of staff, funding for R&D, experimental projects,
ongoing operations Processes Operations and procedures IT Infrastructure Compatibility and interoperability of networks, applications,
databases
Collaborative Network Strategy Collaborative agreement and/or charter, vision, objectives,
priorities Governance Membership, roles, formal or informal relationships, delineation
of authority, policies or directives Resources Funding sources; operational business model Processes Collaborative and interorganizational operations and procedures
which implement decisions and support activities related to strategy, governance, and resources
IOS IT Infrastructure IT Strategy - Purchase and design decisions about proprietary vs. open source software applications; compliance with interoperability standards; network architecture; flexibility and expansion
IT Governance - Access restrictions and authentication; privacy assurance; secondary data use controls; quality assurance; data ownership
IT Processes - System and data scope and availability; physical location of data repositories; funding and procurement of technology
IT Resources - Technical operations and procedures such as automated vs. manual workflows; data translation, redundancy
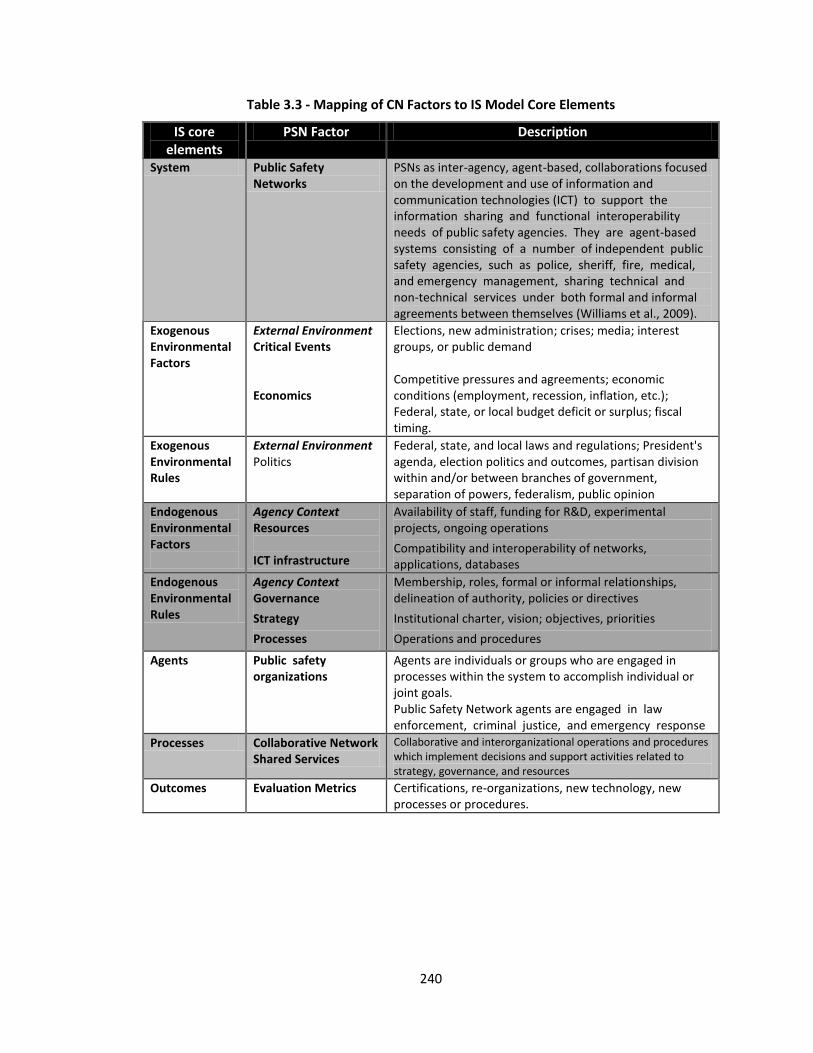
240
Table 3.3 - Mapping of CN Factors to IS Model Core Elements
IS core elements
PSN Factor Description
System Public Safety Networks
PSNs as inter-agency, agent-based, collaborations focused on the development and use of information and communication technologies (ICT) to support the information sharing and functional interoperability needs of public safety agencies. They are agent-based systems consisting of a number of independent public safety agencies, such as police, sheriff, fire, medical, and emergency management, sharing technical and non-technical services under both formal and informal agreements between themselves (Williams et al., 2009).
Exogenous Environmental Factors
External Environment Critical Events Economics
Elections, new administration; crises; media; interest groups, or public demand Competitive pressures and agreements; economic conditions (employment, recession, inflation, etc.); Federal, state, or local budget deficit or surplus; fiscal timing.
Exogenous Environmental Rules
External Environment Politics
Federal, state, and local laws and regulations; President's agenda, election politics and outcomes, partisan division within and/or between branches of government, separation of powers, federalism, public opinion
Endogenous Environmental Factors
Agency Context Resources ICT infrastructure
Availability of staff, funding for R&D, experimental projects, ongoing operations
Compatibility and interoperability of networks, applications, databases
Endogenous Environmental Rules
Agency Context Governance
Strategy
Processes
Membership, roles, formal or informal relationships, delineation of authority, policies or directives
Institutional charter, vision; objectives, priorities
Operations and procedures
Agents Public safety organizations
Agents are individuals or groups who are engaged in processes within the system to accomplish individual or joint goals. Public Safety Network agents are engaged in law enforcement, criminal justice, and emergency response
Processes Collaborative Network Shared Services
Collaborative and interorganizational operations and procedures which implement decisions and support activities related to strategy, governance, and resources
Outcomes Evaluation Metrics Certifications, re-organizations, new technology, new processes or procedures.
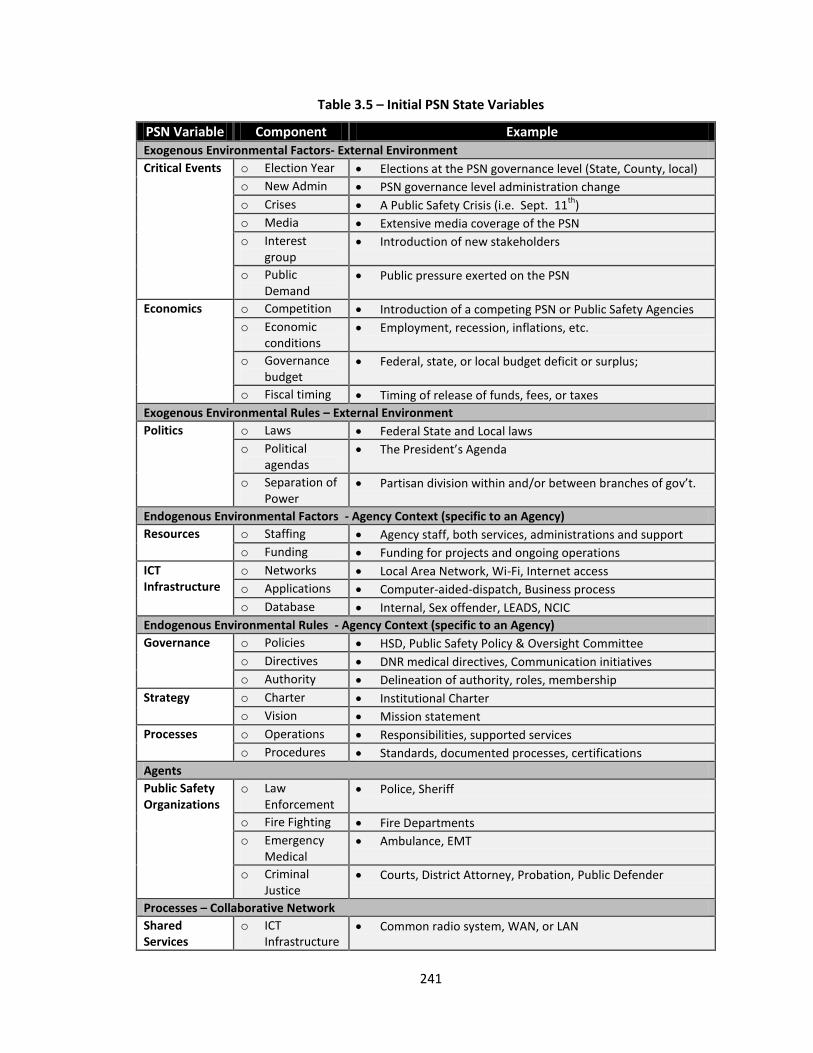
241
Table 3.5 – Initial PSN State Variables
PSN Variable Component Example Exogenous Environmental Factors- External Environment
Critical Events o Election Year Elections at the PSN governance level (State, County, local)
o New Admin PSN governance level administration change
o Crises A Public Safety Crisis (i.e. Sept. 11th
)
o Media Extensive media coverage of the PSN
o Interest group
Introduction of new stakeholders
o Public Demand
Public pressure exerted on the PSN
Economics o Competition Introduction of a competing PSN or Public Safety Agencies
o Economic conditions
Employment, recession, inflations, etc.
o Governance budget
Federal, state, or local budget deficit or surplus;
o Fiscal timing Timing of release of funds, fees, or taxes
Exogenous Environmental Rules – External Environment
Politics o Laws Federal State and Local laws
o Political agendas
The President’s Agenda
o Separation of Power
Partisan division within and/or between branches of gov’t.
Endogenous Environmental Factors - Agency Context (specific to an Agency)
Resources o Staffing Agency staff, both services, administrations and support
o Funding Funding for projects and ongoing operations
ICT Infrastructure
o Networks Local Area Network, Wi-Fi, Internet access
o Applications Computer-aided-dispatch, Business process
o Database Internal, Sex offender, LEADS, NCIC
Endogenous Environmental Rules - Agency Context (specific to an Agency)
Governance o Policies HSD, Public Safety Policy & Oversight Committee
o Directives DNR medical directives, Communication initiatives
o Authority Delineation of authority, roles, membership
Strategy o Charter Institutional Charter
o Vision Mission statement
Processes o Operations Responsibilities, supported services
o Procedures Standards, documented processes, certifications
Agents
Public Safety Organizations
o Law Enforcement
Police, Sheriff
o Fire Fighting Fire Departments
o Emergency Medical
Ambulance, EMT
o Criminal Justice
Courts, District Attorney, Probation, Public Defender
Processes – Collaborative Network
Shared Services
o ICT Infrastructure
Common radio system, WAN, or LAN
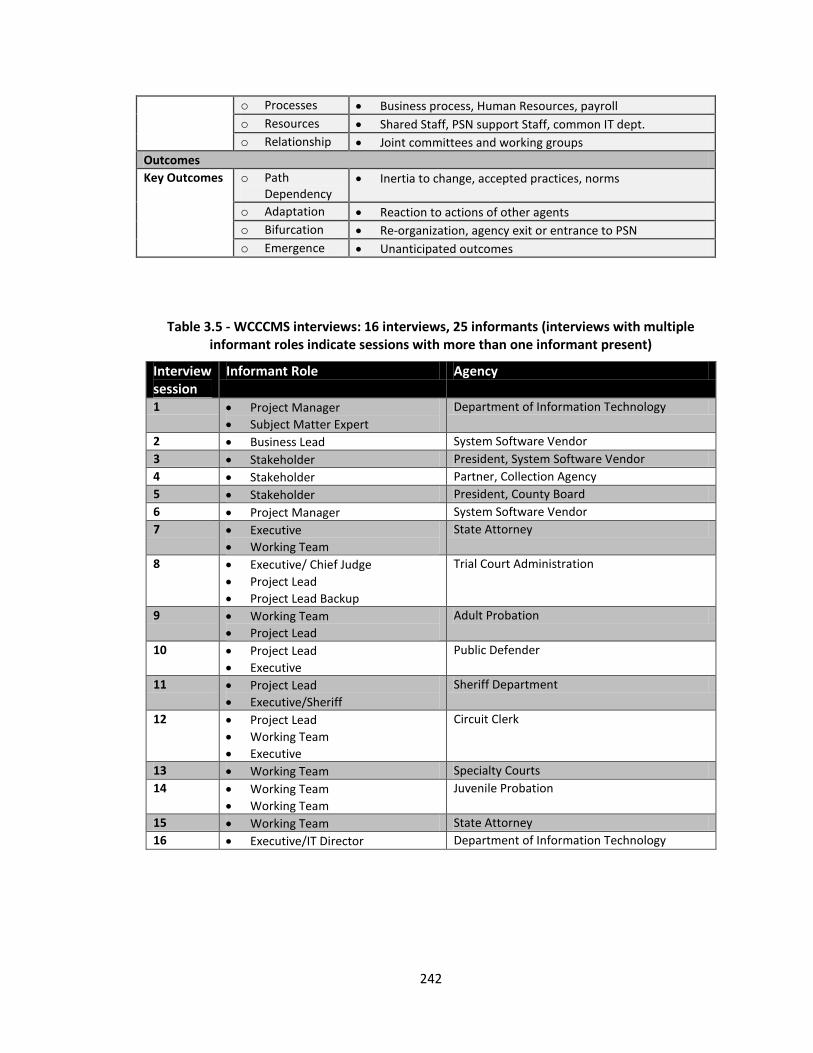
242
o Processes Business process, Human Resources, payroll
o Resources Shared Staff, PSN support Staff, common IT dept.
o Relationship Joint committees and working groups
Outcomes
Key Outcomes o Path Dependency
Inertia to change, accepted practices, norms
o Adaptation Reaction to actions of other agents
o Bifurcation Re-organization, agency exit or entrance to PSN
o Emergence Unanticipated outcomes
Table 3.5 - WCCCMS interviews: 16 interviews, 25 informants (interviews with multiple informant roles indicate sessions with more than one informant present)
Interview session
Informant Role Agency
1 Project Manager
Subject Matter Expert
Department of Information Technology
2 Business Lead System Software Vendor
3 Stakeholder President, System Software Vendor
4 Stakeholder Partner, Collection Agency
5 Stakeholder President, County Board
6 Project Manager System Software Vendor
7 Executive
Working Team
State Attorney
8 Executive/ Chief Judge
Project Lead
Project Lead Backup
Trial Court Administration
9 Working Team
Project Lead
Adult Probation
10 Project Lead
Executive
Public Defender
11 Project Lead
Executive/Sheriff
Sheriff Department
12 Project Lead
Working Team
Executive
Circuit Clerk
13 Working Team Specialty Courts
14 Working Team
Working Team
Juvenile Probation
15 Working Team State Attorney
16 Executive/IT Director Department of Information Technology
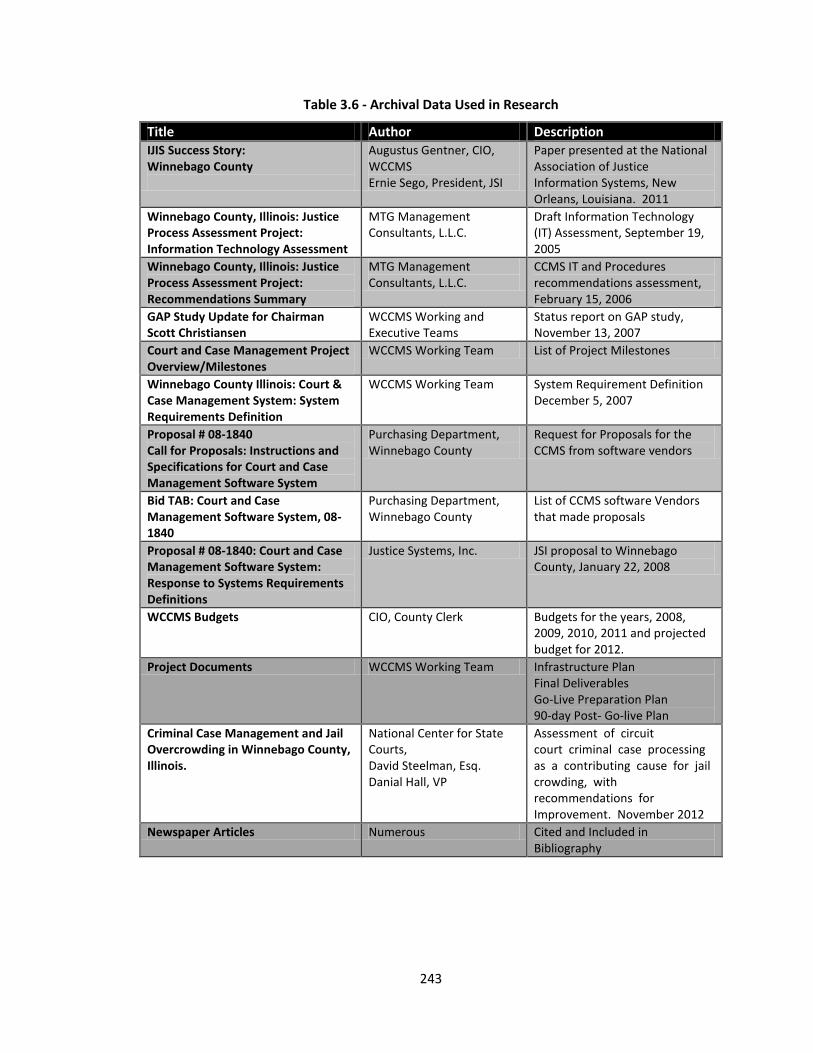
243
Table 3.6 - Archival Data Used in Research
Title Author Description IJIS Success Story: Winnebago County
Augustus Gentner, CIO, WCCMS Ernie Sego, President, JSI
Paper presented at the National Association of Justice Information Systems, New Orleans, Louisiana. 2011
Winnebago County, Illinois: Justice Process Assessment Project: Information Technology Assessment
MTG Management Consultants, L.L.C.
Draft Information Technology (IT) Assessment, September 19, 2005
Winnebago County, Illinois: Justice Process Assessment Project: Recommendations Summary
MTG Management Consultants, L.L.C.
CCMS IT and Procedures recommendations assessment, February 15, 2006
GAP Study Update for Chairman Scott Christiansen
WCCMS Working and Executive Teams
Status report on GAP study, November 13, 2007
Court and Case Management Project Overview/Milestones
WCCMS Working Team List of Project Milestones
Winnebago County Illinois: Court & Case Management System: System Requirements Definition
WCCMS Working Team System Requirement Definition December 5, 2007
Proposal # 08-1840 Call for Proposals: Instructions and Specifications for Court and Case Management Software System
Purchasing Department, Winnebago County
Request for Proposals for the CCMS from software vendors
Bid TAB: Court and Case Management Software System, 08-1840
Purchasing Department, Winnebago County
List of CCMS software Vendors that made proposals
Proposal # 08-1840: Court and Case Management Software System: Response to Systems Requirements Definitions
Justice Systems, Inc. JSI proposal to Winnebago County, January 22, 2008
WCCMS Budgets CIO, County Clerk Budgets for the years, 2008, 2009, 2010, 2011 and projected budget for 2012.
Project Documents WCCMS Working Team Infrastructure Plan Final Deliverables Go-Live Preparation Plan 90-day Post- Go-live Plan
Criminal Case Management and Jail Overcrowding in Winnebago County, Illinois.
National Center for State Courts, David Steelman, Esq. Danial Hall, VP
Assessment of circuit court criminal case processing as a contributing cause for jail crowding, with recommendations for Improvement. November 2012
Newspaper Articles Numerous Cited and Included in Bibliography
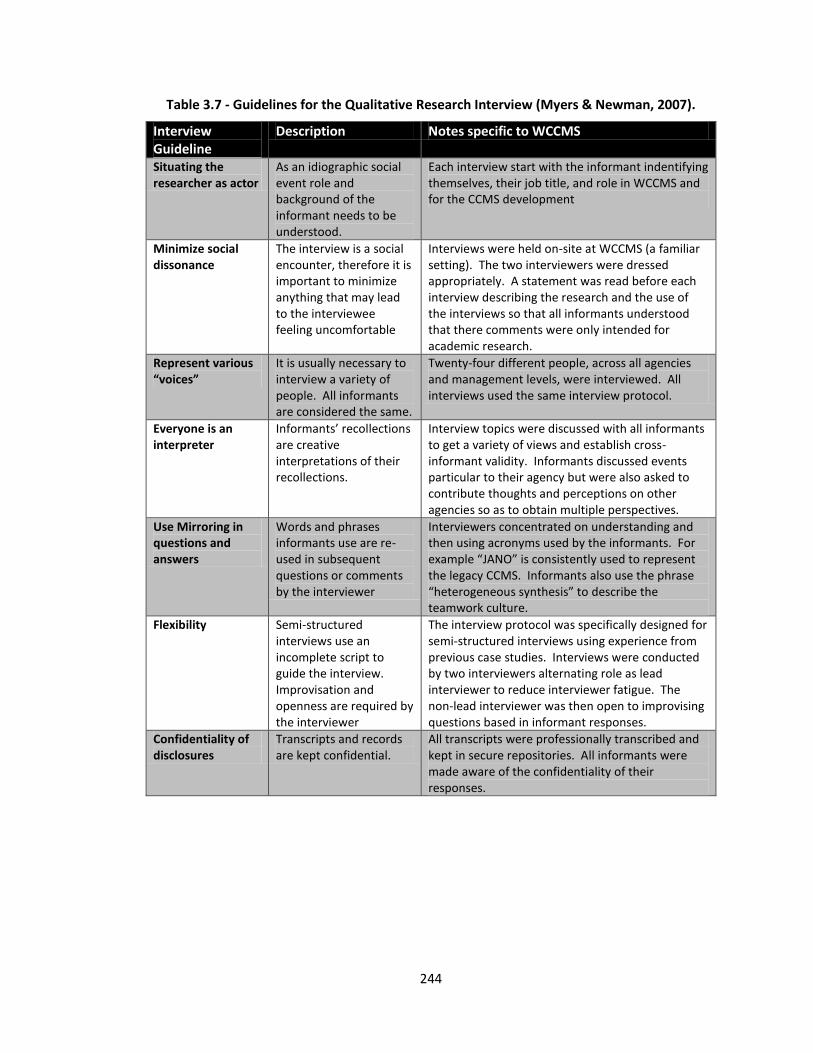
244
Table 3.7 - Guidelines for the Qualitative Research Interview (Myers & Newman, 2007).
Interview Guideline
Description Notes specific to WCCMS
Situating the researcher as actor
As an idiographic social event role and background of the informant needs to be understood.
Each interview start with the informant indentifying themselves, their job title, and role in WCCMS and for the CCMS development
Minimize social dissonance
The interview is a social encounter, therefore it is important to minimize anything that may lead to the interviewee feeling uncomfortable
Interviews were held on-site at WCCMS (a familiar setting). The two interviewers were dressed appropriately. A statement was read before each interview describing the research and the use of the interviews so that all informants understood that there comments were only intended for academic research.
Represent various “voices”
It is usually necessary to interview a variety of people. All informants are considered the same.
Twenty-four different people, across all agencies and management levels, were interviewed. All interviews used the same interview protocol.
Everyone is an interpreter
Informants’ recollections are creative interpretations of their recollections.
Interview topics were discussed with all informants to get a variety of views and establish cross-informant validity. Informants discussed events particular to their agency but were also asked to contribute thoughts and perceptions on other agencies so as to obtain multiple perspectives.
Use Mirroring in questions and answers
Words and phrases informants use are re-used in subsequent questions or comments by the interviewer
Interviewers concentrated on understanding and then using acronyms used by the informants. For example “JANO” is consistently used to represent the legacy CCMS. Informants also use the phrase “heterogeneous synthesis” to describe the teamwork culture.
Flexibility Semi-structured interviews use an incomplete script to guide the interview. Improvisation and openness are required by the interviewer
The interview protocol was specifically designed for semi-structured interviews using experience from previous case studies. Interviews were conducted by two interviewers alternating role as lead interviewer to reduce interviewer fatigue. The non-lead interviewer was then open to improvising questions based in informant responses.
Confidentiality of disclosures
Transcripts and records are kept confidential.
All transcripts were professionally transcribed and kept in secure repositories. All informants were made aware of the confidentiality of their responses.

245
Table 3.8 - WCCMS Interview Protocol
Interview Protocol:
A Case Study of the Winnebago County Integrated Court and Case Management System (WCCCMS)
General Information o Date Interview Completed:
o Organization:
o Contact Person’s Name:
o Contact Person’s Title:
o Location:
Agreement to recording of interview o The following text should be read verbatim to all the interviewees.
o My name is Art Tomasino and I am a PhD student at Bentley University. We are
conducting a study on Public Safety Networks (PSN) and Public Safety Infrastructure (PSI)
under a National Science Foundation grant. The study is being jointly done by Bentley,
Syracuse, and Penn State Universities.
o My name is Christine Williams, I am one of the principal investigators for the study. I am
a political scientist.
o As part of the study we are engaging in a as study of the Winnebago County Integrated
Court and Case Management System. Since you currently work with or have worked
with this agency we would like to interview you with regards to this PSN. Questions will
involve your role in the agency, experiences, impressions, and opinions.
o This is an academic study and will result in a published paper(s). The records of this
study will be kept private. In any sort of report we might publish, we will only include
any information that will make it possible to identify a participant after the participant
grants permission to do so. Research records will be stored securely and only
researchers will have access to audio recordings and computer records. Audio recordings
will be kept in a secure location for the duration of the study.
o Will you sign the consent form indicating you have read and agreed to these terms?
o Would it be OK if I record this interview? {If interviewee respond in affirmative
continue}
o I am going to now turn on the recorder {turn on recorder}.
This is an interview between {interviewer} and {participant’s name} for a case study on the Winnebago County Integrated Court and Case Management System on March {xx}, 2012.
Would you please state your name, title, and role within the Winnebago County Integrated Court and Case Management System?
The following represents a flow of questions for an unstructured interview. Text is only a
suggestion and the interviewer is free to deviate from this flow or ask different questions. All the
points in this interview should be covered although not necessarily in this order.
Introduction
Interviewee background
a) Describe your job and your background.
b) How long have you been in this role?
c) Who do you report to?
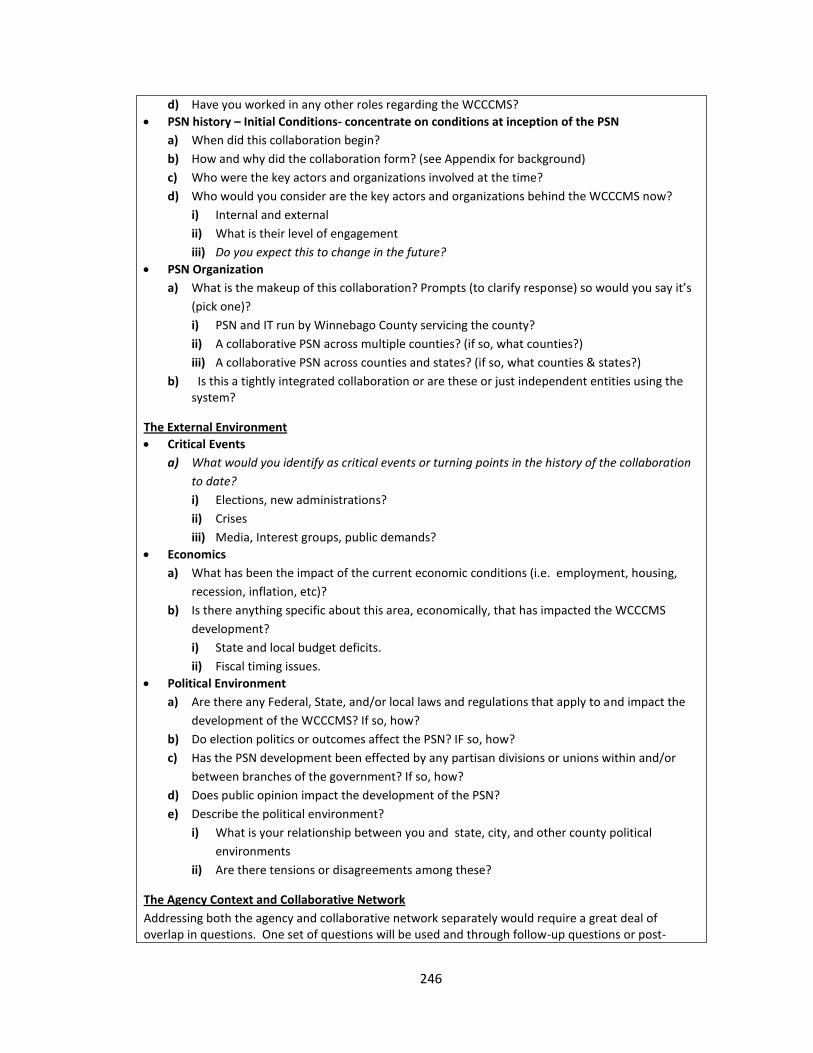
246
d) Have you worked in any other roles regarding the WCCCMS?
PSN history – Initial Conditions- concentrate on conditions at inception of the PSN
a) When did this collaboration begin?
b) How and why did the collaboration form? (see Appendix for background)
c) Who were the key actors and organizations involved at the time?
d) Who would you consider are the key actors and organizations behind the WCCCMS now?
i) Internal and external
ii) What is their level of engagement
iii) Do you expect this to change in the future?
PSN Organization
a) What is the makeup of this collaboration? Prompts (to clarify response) so would you say it’s
(pick one)?
i) PSN and IT run by Winnebago County servicing the county?
ii) A collaborative PSN across multiple counties? (if so, what counties?)
iii) A collaborative PSN across counties and states? (if so, what counties & states?)
b) Is this a tightly integrated collaboration or are these or just independent entities using the system?
The External Environment
Critical Events
a) What would you identify as critical events or turning points in the history of the collaboration
to date?
i) Elections, new administrations?
ii) Crises
iii) Media, Interest groups, public demands?
Economics
a) What has been the impact of the current economic conditions (i.e. employment, housing,
recession, inflation, etc)?
b) Is there anything specific about this area, economically, that has impacted the WCCCMS
development?
i) State and local budget deficits.
ii) Fiscal timing issues.
Political Environment
a) Are there any Federal, State, and/or local laws and regulations that apply to and impact the
development of the WCCCMS? If so, how?
b) Do election politics or outcomes affect the PSN? IF so, how?
c) Has the PSN development been effected by any partisan divisions or unions within and/or
between branches of the government? If so, how?
d) Does public opinion impact the development of the PSN?
e) Describe the political environment?
i) What is your relationship between you and state, city, and other county political
environments
ii) Are there tensions or disagreements among these?
The Agency Context and Collaborative Network
Addressing both the agency and collaborative network separately would require a great deal of overlap in questions. One set of questions will be used and through follow-up questions or post-
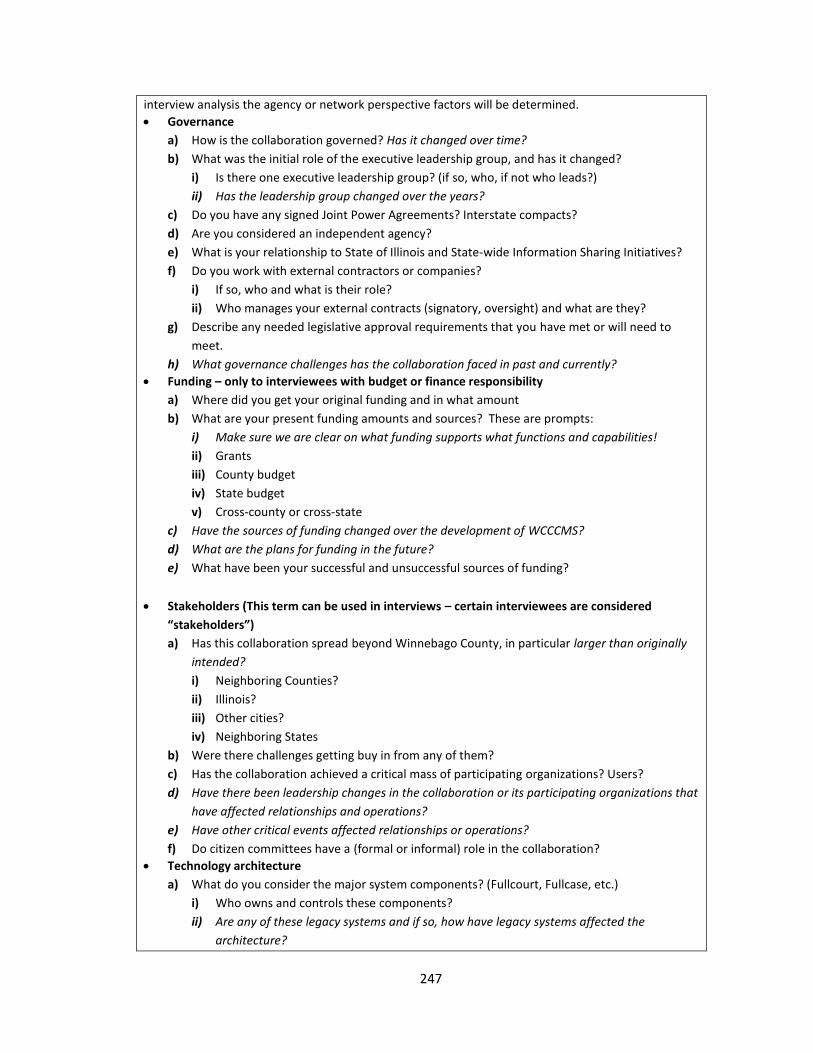
247
interview analysis the agency or network perspective factors will be determined.
Governance
a) How is the collaboration governed? Has it changed over time?
b) What was the initial role of the executive leadership group, and has it changed?
i) Is there one executive leadership group? (if so, who, if not who leads?)
ii) Has the leadership group changed over the years?
c) Do you have any signed Joint Power Agreements? Interstate compacts?
d) Are you considered an independent agency?
e) What is your relationship to State of Illinois and State-wide Information Sharing Initiatives?
f) Do you work with external contractors or companies?
i) If so, who and what is their role?
ii) Who manages your external contracts (signatory, oversight) and what are they?
g) Describe any needed legislative approval requirements that you have met or will need to
meet.
h) What governance challenges has the collaboration faced in past and currently?
Funding – only to interviewees with budget or finance responsibility
a) Where did you get your original funding and in what amount
b) What are your present funding amounts and sources? These are prompts:
i) Make sure we are clear on what funding supports what functions and capabilities!
ii) Grants
iii) County budget
iv) State budget
v) Cross-county or cross-state
c) Have the sources of funding changed over the development of WCCCMS?
d) What are the plans for funding in the future?
e) What have been your successful and unsuccessful sources of funding?
Stakeholders (This term can be used in interviews – certain interviewees are considered
“stakeholders”)
a) Has this collaboration spread beyond Winnebago County, in particular larger than originally
intended?
i) Neighboring Counties?
ii) Illinois?
iii) Other cities?
iv) Neighboring States
b) Were there challenges getting buy in from any of them?
c) Has the collaboration achieved a critical mass of participating organizations? Users?
d) Have there been leadership changes in the collaboration or its participating organizations that
have affected relationships and operations?
e) Have other critical events affected relationships or operations?
f) Do citizen committees have a (formal or informal) role in the collaboration?
Technology architecture
a) What do you consider the major system components? (Fullcourt, Fullcase, etc.)
i) Who owns and controls these components?
ii) Are any of these legacy systems and if so, how have legacy systems affected the
architecture?
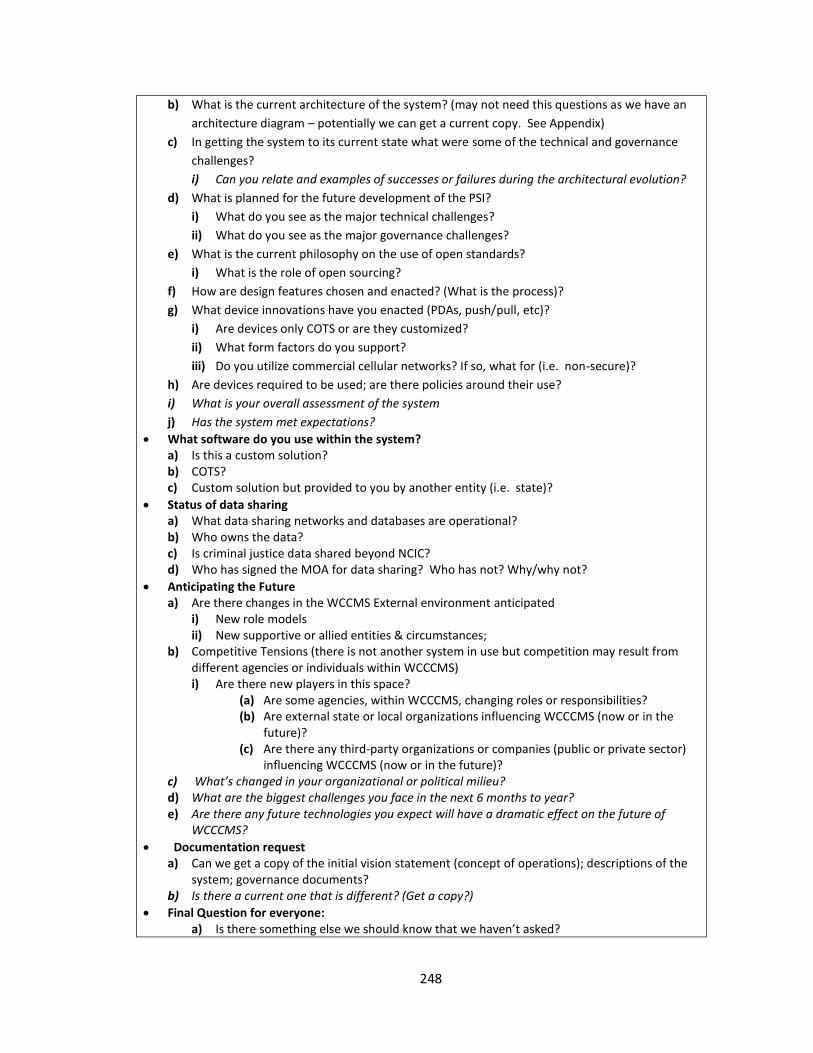
248
b) What is the current architecture of the system? (may not need this questions as we have an
architecture diagram – potentially we can get a current copy. See Appendix)
c) In getting the system to its current state what were some of the technical and governance
challenges?
i) Can you relate and examples of successes or failures during the architectural evolution?
d) What is planned for the future development of the PSI?
i) What do you see as the major technical challenges?
ii) What do you see as the major governance challenges?
e) What is the current philosophy on the use of open standards?
i) What is the role of open sourcing?
f) How are design features chosen and enacted? (What is the process)?
g) What device innovations have you enacted (PDAs, push/pull, etc)?
i) Are devices only COTS or are they customized?
ii) What form factors do you support?
iii) Do you utilize commercial cellular networks? If so, what for (i.e. non-secure)?
h) Are devices required to be used; are there policies around their use?
i) What is your overall assessment of the system
j) Has the system met expectations?
What software do you use within the system? a) Is this a custom solution? b) COTS? c) Custom solution but provided to you by another entity (i.e. state)?
Status of data sharing a) What data sharing networks and databases are operational? b) Who owns the data? c) Is criminal justice data shared beyond NCIC? d) Who has signed the MOA for data sharing? Who has not? Why/why not?
Anticipating the Future a) Are there changes in the WCCMS External environment anticipated
i) New role models ii) New supportive or allied entities & circumstances;
b) Competitive Tensions (there is not another system in use but competition may result from different agencies or individuals within WCCCMS) i) Are there new players in this space?
(a) Are some agencies, within WCCCMS, changing roles or responsibilities? (b) Are external state or local organizations influencing WCCCMS (now or in the
future)? (c) Are there any third-party organizations or companies (public or private sector)
influencing WCCCMS (now or in the future)? c) What’s changed in your organizational or political milieu? d) What are the biggest challenges you face in the next 6 months to year? e) Are there any future technologies you expect will have a dramatic effect on the future of
WCCCMS?
Documentation request a) Can we get a copy of the initial vision statement (concept of operations); descriptions of the
system; governance documents? b) Is there a current one that is different? (Get a copy?)
Final Question for everyone: a) Is there something else we should know that we haven’t asked?
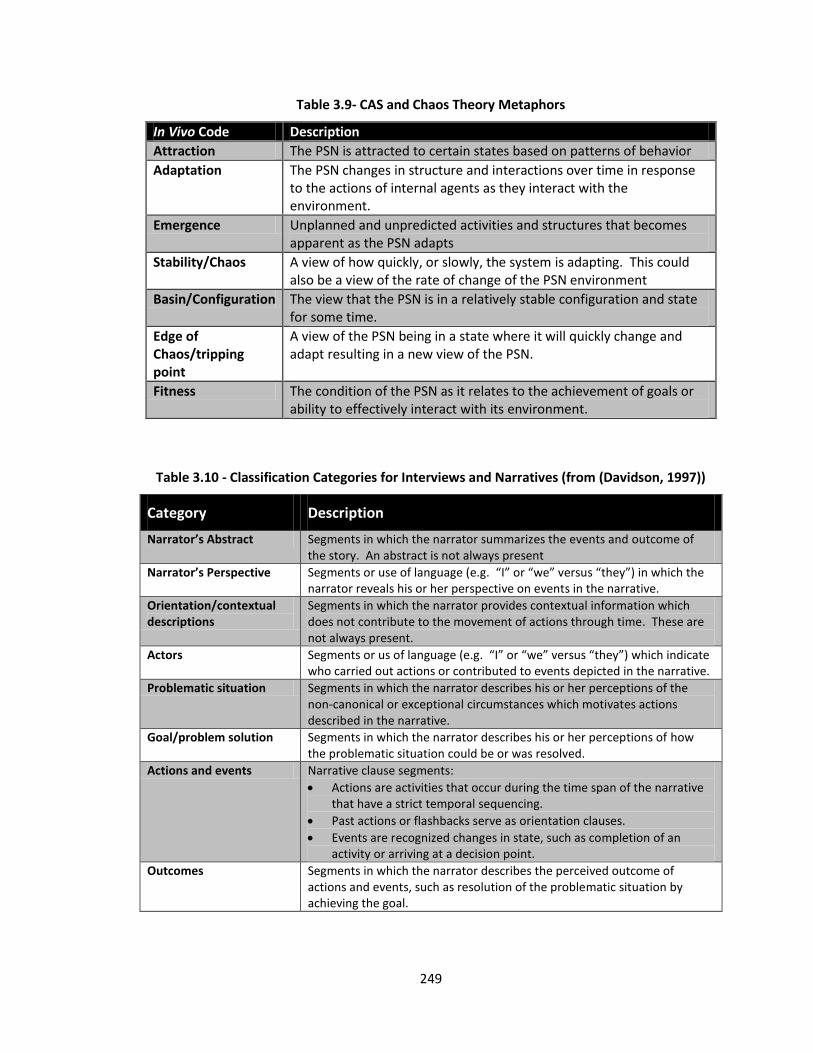
249
Table 3.9- CAS and Chaos Theory Metaphors
In Vivo Code Description
Attraction The PSN is attracted to certain states based on patterns of behavior
Adaptation The PSN changes in structure and interactions over time in response to the actions of internal agents as they interact with the environment.
Emergence Unplanned and unpredicted activities and structures that becomes apparent as the PSN adapts
Stability/Chaos A view of how quickly, or slowly, the system is adapting. This could also be a view of the rate of change of the PSN environment
Basin/Configuration The view that the PSN is in a relatively stable configuration and state for some time.
Edge of Chaos/tripping point
A view of the PSN being in a state where it will quickly change and adapt resulting in a new view of the PSN.
Fitness The condition of the PSN as it relates to the achievement of goals or ability to effectively interact with its environment.
Table 3.10 - Classification Categories for Interviews and Narratives (from (Davidson, 1997))
Category Description
Narrator’s Abstract Segments in which the narrator summarizes the events and outcome of the story. An abstract is not always present
Narrator’s Perspective Segments or use of language (e.g. “I” or “we” versus “they”) in which the narrator reveals his or her perspective on events in the narrative.
Orientation/contextual descriptions
Segments in which the narrator provides contextual information which does not contribute to the movement of actions through time. These are not always present.
Actors Segments or us of language (e.g. “I” or “we” versus “they”) which indicate who carried out actions or contributed to events depicted in the narrative.
Problematic situation Segments in which the narrator describes his or her perceptions of the non-canonical or exceptional circumstances which motivates actions described in the narrative.
Goal/problem solution Segments in which the narrator describes his or her perceptions of how the problematic situation could be or was resolved.
Actions and events Narrative clause segments:
Actions are activities that occur during the time span of the narrative that have a strict temporal sequencing.
Past actions or flashbacks serve as orientation clauses.
Events are recognized changes in state, such as completion of an activity or arriving at a decision point.
Outcomes Segments in which the narrator describes the perceived outcome of actions and events, such as resolution of the problematic situation by achieving the goal.
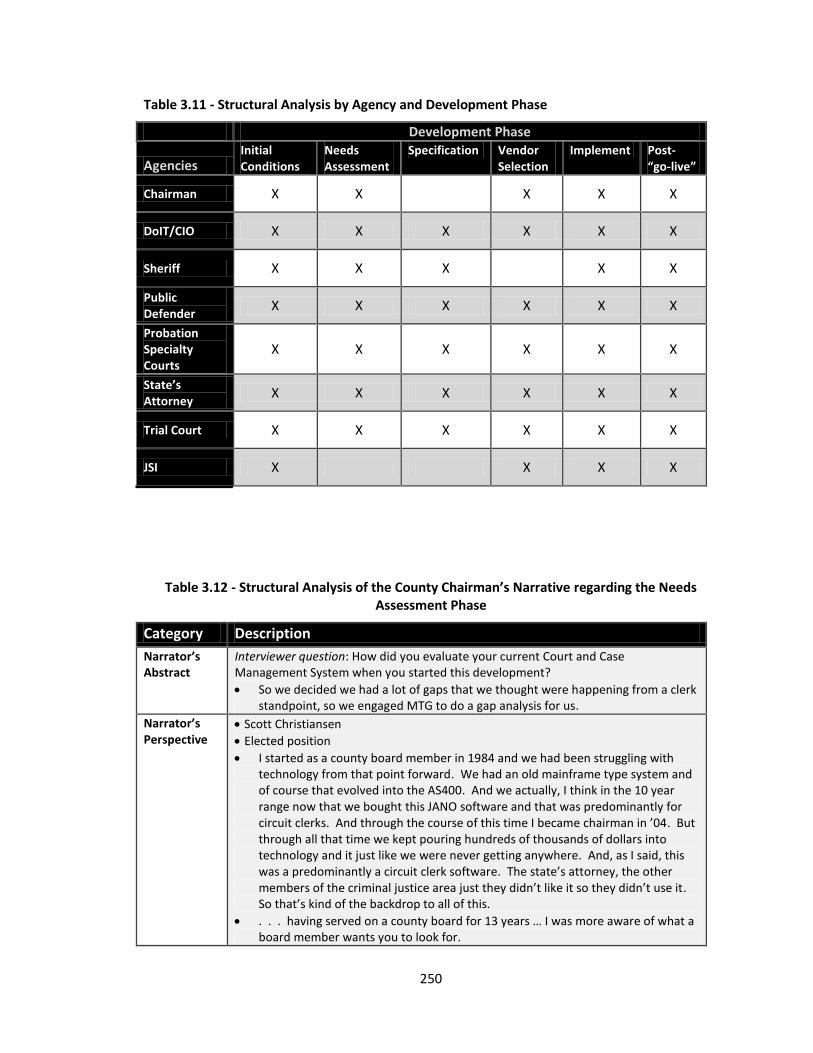
250
Table 3.11 - Structural Analysis by Agency and Development Phase
Development Phase
Agencies Initial Conditions
Needs Assessment
Specification Vendor Selection
Implement Post- “go-live”
Chairman X X X X X
DoIT/CIO X X X X X X
Sheriff X X X X X
Public Defender
X X X X X X
Probation Specialty Courts
X X X X X X
State’s Attorney
X X X X X X
Trial Court X X X X X X
JSI X X X X
Table 3.12 - Structural Analysis of the County Chairman’s Narrative regarding the Needs Assessment Phase
Category Description
Narrator’s Abstract
Interviewer question: How did you evaluate your current Court and Case Management System when you started this development?
So we decided we had a lot of gaps that we thought were happening from a clerk standpoint, so we engaged MTG to do a gap analysis for us.
Narrator’s Perspective
Scott Christiansen
Elected position
I started as a county board member in 1984 and we had been struggling with technology from that point forward. We had an old mainframe type system and of course that evolved into the AS400. And we actually, I think in the 10 year range now that we bought this JANO software and that was predominantly for circuit clerks. And through the course of this time I became chairman in ’04. But through all that time we kept pouring hundreds of thousands of dollars into technology and it just like we were never getting anywhere. And, as I said, this was a predominantly a circuit clerk software. The state’s attorney, the other members of the criminal justice area just they didn’t like it so they didn’t use it. So that’s kind of the backdrop to all of this.
. . . having served on a county board for 13 years … I was more aware of what a board member wants you to look for.
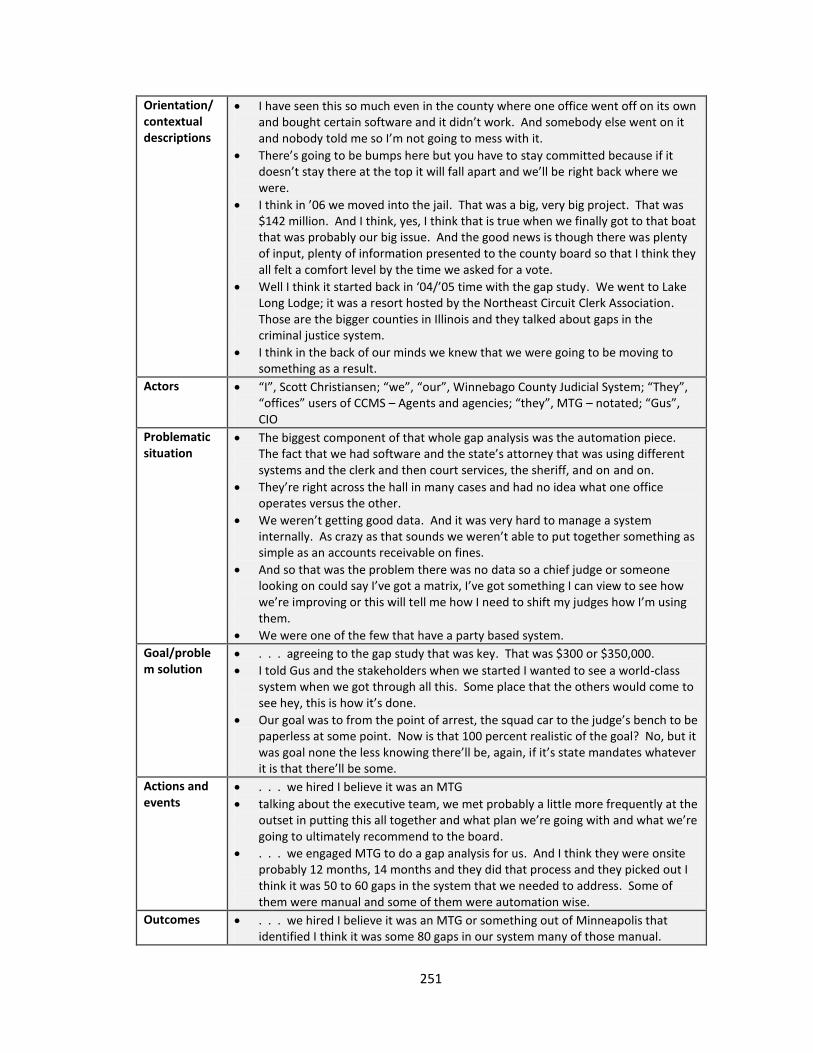
251
Orientation/ contextual descriptions
I have seen this so much even in the county where one office went off on its own and bought certain software and it didn’t work. And somebody else went on it and nobody told me so I’m not going to mess with it.
There’s going to be bumps here but you have to stay committed because if it doesn’t stay there at the top it will fall apart and we’ll be right back where we were.
I think in ’06 we moved into the jail. That was a big, very big project. That was $142 million. And I think, yes, I think that is true when we finally got to that boat that was probably our big issue. And the good news is though there was plenty of input, plenty of information presented to the county board so that I think they all felt a comfort level by the time we asked for a vote.
Well I think it started back in ‘04/’05 time with the gap study. We went to Lake Long Lodge; it was a resort hosted by the Northeast Circuit Clerk Association. Those are the bigger counties in Illinois and they talked about gaps in the criminal justice system.
I think in the back of our minds we knew that we were going to be moving to something as a result.
Actors “I”, Scott Christiansen; “we”, “our”, Winnebago County Judicial System; “They”, “offices” users of CCMS – Agents and agencies; “they”, MTG – notated; “Gus”, CIO
Problematic situation
The biggest component of that whole gap analysis was the automation piece. The fact that we had software and the state’s attorney that was using different systems and the clerk and then court services, the sheriff, and on and on.
They’re right across the hall in many cases and had no idea what one office operates versus the other.
We weren’t getting good data. And it was very hard to manage a system internally. As crazy as that sounds we weren’t able to put together something as simple as an accounts receivable on fines.
And so that was the problem there was no data so a chief judge or someone looking on could say I’ve got a matrix, I’ve got something I can view to see how we’re improving or this will tell me how I need to shift my judges how I’m using them.
We were one of the few that have a party based system.
Goal/problem solution
. . . agreeing to the gap study that was key. That was $300 or $350,000.
I told Gus and the stakeholders when we started I wanted to see a world-class system when we got through all this. Some place that the others would come to see hey, this is how it’s done.
Our goal was to from the point of arrest, the squad car to the judge’s bench to be paperless at some point. Now is that 100 percent realistic of the goal? No, but it was goal none the less knowing there’ll be, again, if it’s state mandates whatever it is that there’ll be some.
Actions and events
. . . we hired I believe it was an MTG
talking about the executive team, we met probably a little more frequently at the outset in putting this all together and what plan we’re going with and what we’re going to ultimately recommend to the board.
. . . we engaged MTG to do a gap analysis for us. And I think they were onsite probably 12 months, 14 months and they did that process and they picked out I think it was 50 to 60 gaps in the system that we needed to address. Some of them were manual and some of them were automation wise.
Outcomes . . . we hired I believe it was an MTG or something out of Minneapolis that identified I think it was some 80 gaps in our system many of those manual.

252
It came back and they (MTG) told us there was a five year process and that we’re probably looking at, at least $12 million.
And one of the biggest benefits, I will tell you, to this whole process was these offices talking to each other.
. . . they came in with their report and I think they (MTG) said at that board meeting and here’s what they guessed, five years, $12 to $15 million, I don’t remember exactly. We said well, we’re going to back and we’re going to scrub that out and see if we can do a little better, needless to say.
So I think the big thing they came back with was our court case management system was built for the clerk but not for the other agencies of the criminal justice system.
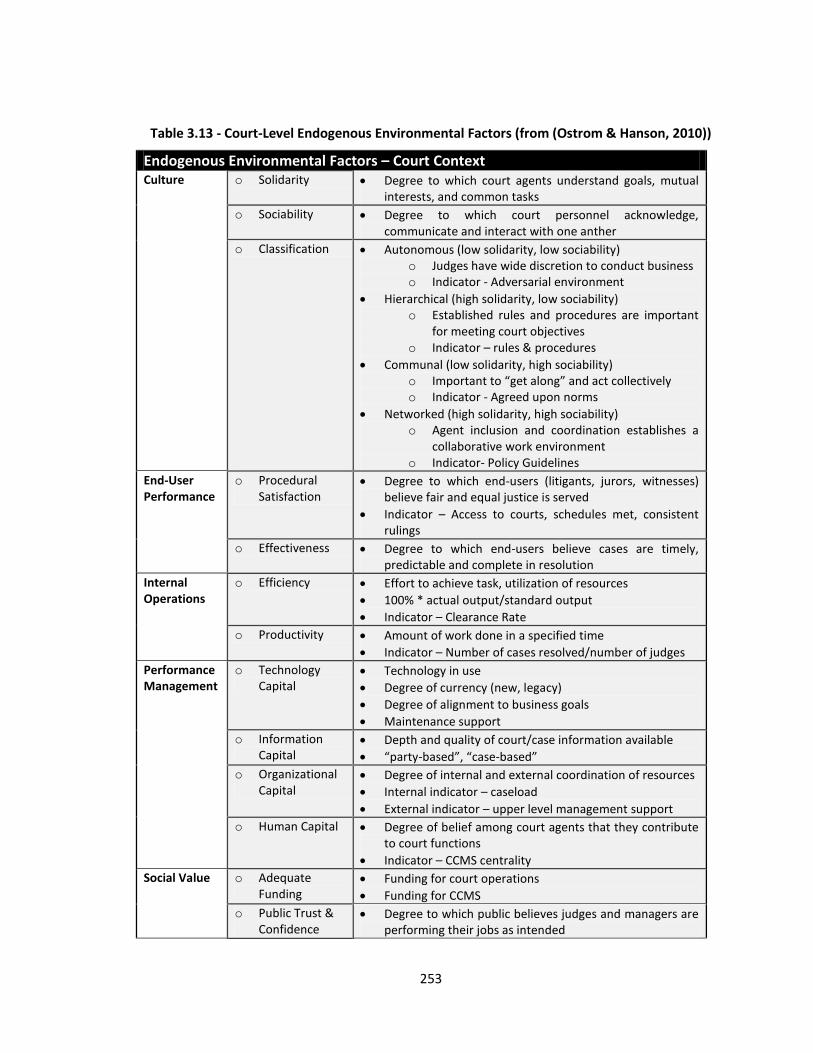
253
Table 3.13 - Court-Level Endogenous Environmental Factors (from (Ostrom & Hanson, 2010))
Endogenous Environmental Factors – Court Context Culture o Solidarity Degree to which court agents understand goals, mutual
interests, and common tasks
o Sociability Degree to which court personnel acknowledge, communicate and interact with one anther
o Classification Autonomous (low solidarity, low sociability) o Judges have wide discretion to conduct business o Indicator - Adversarial environment
Hierarchical (high solidarity, low sociability) o Established rules and procedures are important
for meeting court objectives o Indicator – rules & procedures
Communal (low solidarity, high sociability) o Important to “get along” and act collectively o Indicator - Agreed upon norms
Networked (high solidarity, high sociability) o Agent inclusion and coordination establishes a
collaborative work environment o Indicator- Policy Guidelines
End-User Performance
o Procedural Satisfaction
Degree to which end-users (litigants, jurors, witnesses) believe fair and equal justice is served
Indicator – Access to courts, schedules met, consistent rulings
o Effectiveness Degree to which end-users believe cases are timely, predictable and complete in resolution
Internal Operations
o Efficiency Effort to achieve task, utilization of resources
100% * actual output/standard output
Indicator – Clearance Rate
o Productivity Amount of work done in a specified time
Indicator – Number of cases resolved/number of judges
Performance Management
o Technology Capital
Technology in use
Degree of currency (new, legacy)
Degree of alignment to business goals
Maintenance support
o Information Capital
Depth and quality of court/case information available
“party-based”, “case-based”
o Organizational Capital
Degree of internal and external coordination of resources
Internal indicator – caseload
External indicator – upper level management support
o Human Capital Degree of belief among court agents that they contribute to court functions
Indicator – CCMS centrality
Social Value o Adequate Funding
Funding for court operations
Funding for CCMS
o Public Trust & Confidence
Degree to which public believes judges and managers are performing their jobs as intended
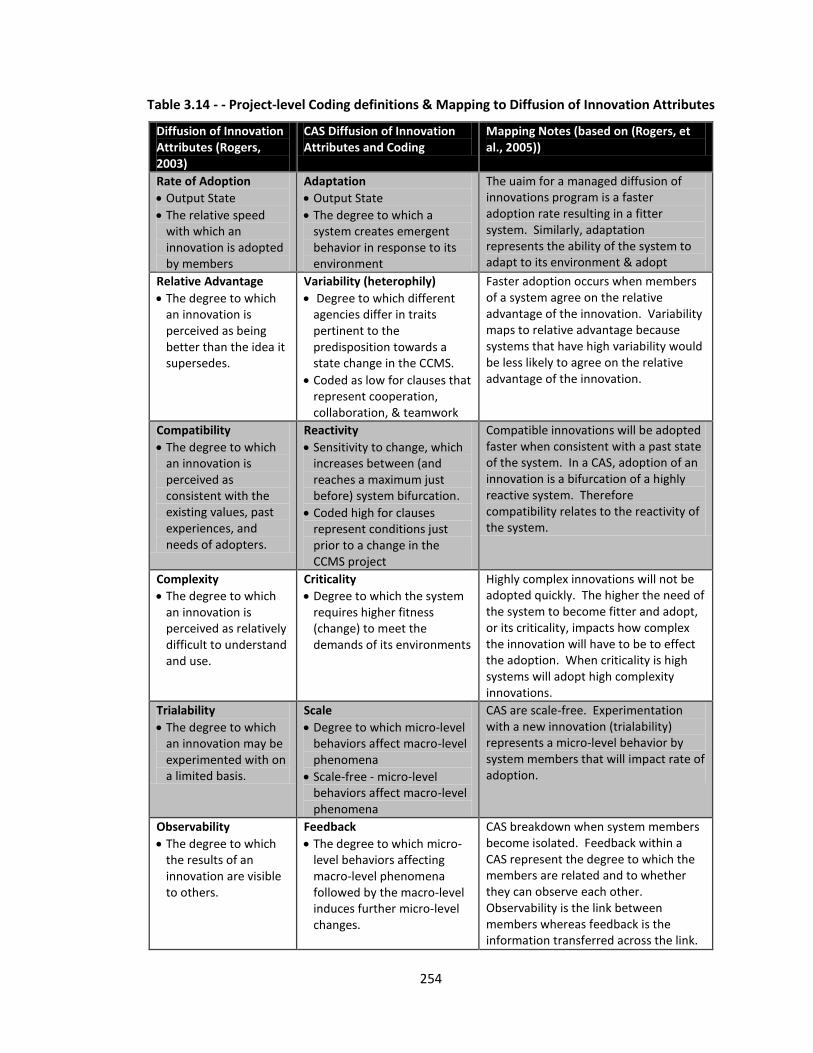
254
Table 3.14 - - Project-level Coding definitions & Mapping to Diffusion of Innovation Attributes
Diffusion of Innovation Attributes (Rogers, 2003)
CAS Diffusion of Innovation Attributes and Coding
Mapping Notes (based on (Rogers, et al., 2005))
Rate of Adoption
Output State
The relative speed with which an innovation is adopted by members
Adaptation
Output State
The degree to which a system creates emergent behavior in response to its environment
The uaim for a managed diffusion of innovations program is a faster adoption rate resulting in a fitter system. Similarly, adaptation represents the ability of the system to adapt to its environment & adopt
Relative Advantage
The degree to which an innovation is perceived as being better than the idea it supersedes.
Variability (heterophily)
Degree to which different agencies differ in traits pertinent to the predisposition towards a state change in the CCMS.
Coded as low for clauses that represent cooperation, collaboration, & teamwork
Faster adoption occurs when members of a system agree on the relative advantage of the innovation. Variability maps to relative advantage because systems that have high variability would be less likely to agree on the relative advantage of the innovation.
Compatibility
The degree to which an innovation is perceived as consistent with the existing values, past experiences, and needs of adopters.
Reactivity
Sensitivity to change, which increases between (and reaches a maximum just before) system bifurcation.
Coded high for clauses represent conditions just prior to a change in the CCMS project
Compatible innovations will be adopted faster when consistent with a past state of the system. In a CAS, adoption of an innovation is a bifurcation of a highly reactive system. Therefore compatibility relates to the reactivity of the system.
Complexity
The degree to which an innovation is perceived as relatively difficult to understand and use.
Criticality
Degree to which the system requires higher fitness (change) to meet the demands of its environments
Highly complex innovations will not be adopted quickly. The higher the need of the system to become fitter and adopt, or its criticality, impacts how complex the innovation will have to be to effect the adoption. When criticality is high systems will adopt high complexity innovations.
Trialability
The degree to which an innovation may be experimented with on a limited basis.
Scale
Degree to which micro-level behaviors affect macro-level phenomena
Scale-free - micro-level behaviors affect macro-level phenomena
CAS are scale-free. Experimentation with a new innovation (trialability) represents a micro-level behavior by system members that will impact rate of adoption.
Observability
The degree to which the results of an innovation are visible to others.
Feedback
The degree to which micro-level behaviors affecting macro-level phenomena followed by the macro-level induces further micro-level changes.
CAS breakdown when system members become isolated. Feedback within a CAS represent the degree to which the members are related and to whether they can observe each other. Observability is the link between members whereas feedback is the information transferred across the link.
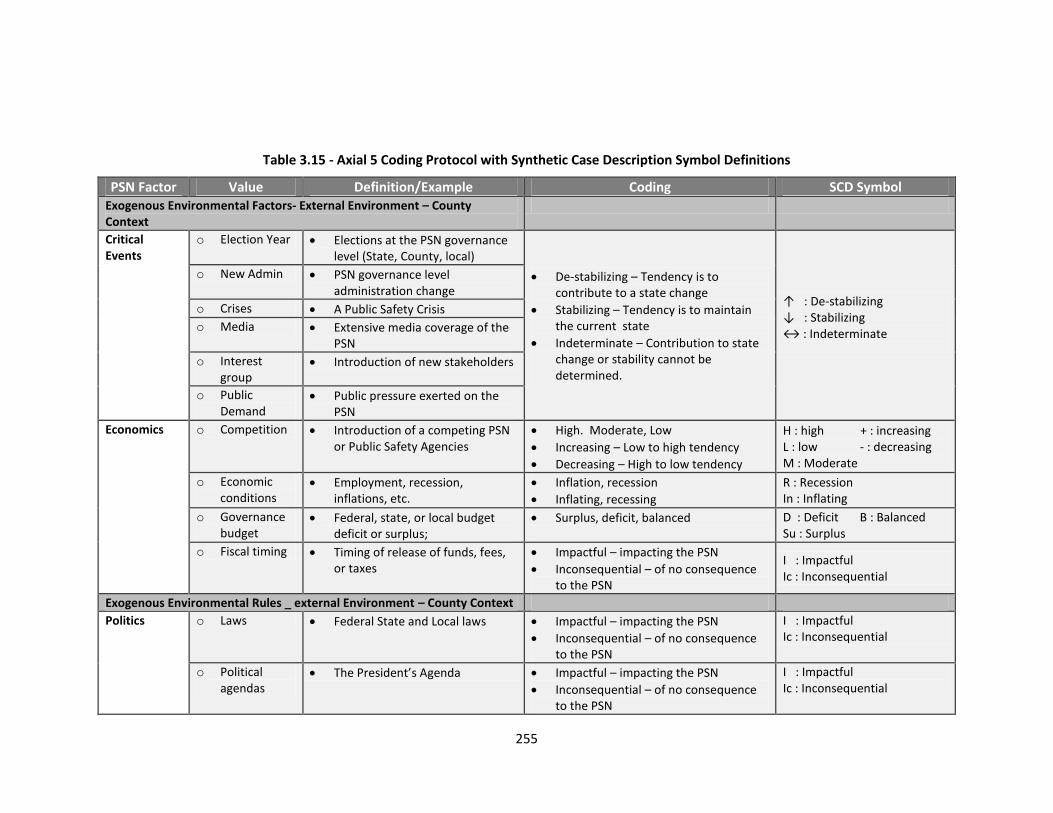
255
Table 3.15 - Axial 5 Coding Protocol with Synthetic Case Description Symbol Definitions
PSN Factor Value Definition/Example Coding SCD Symbol Exogenous Environmental Factors- External Environment – County Context
Critical Events
o Election Year Elections at the PSN governance level (State, County, local)
De-stabilizing – Tendency is to contribute to a state change
Stabilizing – Tendency is to maintain the current state
Indeterminate – Contribution to state change or stability cannot be determined.
↑ : De-stabilizing ↓ : Stabilizing ↔ : Indeterminate
o New Admin PSN governance level administration change
o Crises A Public Safety Crisis
o Media Extensive media coverage of the PSN
o Interest group
Introduction of new stakeholders
o Public Demand
Public pressure exerted on the PSN
Economics o Competition Introduction of a competing PSN or Public Safety Agencies
High. Moderate, Low
Increasing – Low to high tendency
Decreasing – High to low tendency
H : high + : increasing L : low - : decreasing M : Moderate
o Economic conditions
Employment, recession, inflations, etc.
Inflation, recession
Inflating, recessing
R : Recession In : Inflating
o Governance budget
Federal, state, or local budget deficit or surplus;
Surplus, deficit, balanced D : Deficit B : Balanced Su : Surplus
o Fiscal timing Timing of release of funds, fees, or taxes
Impactful – impacting the PSN
Inconsequential – of no consequence to the PSN
I : Impactful Ic : Inconsequential
Exogenous Environmental Rules _ external Environment – County Context
Politics o Laws Federal State and Local laws Impactful – impacting the PSN
Inconsequential – of no consequence to the PSN
I : Impactful Ic : Inconsequential
o Political agendas
The President’s Agenda Impactful – impacting the PSN
Inconsequential – of no consequence to the PSN
I : Impactful Ic : Inconsequential
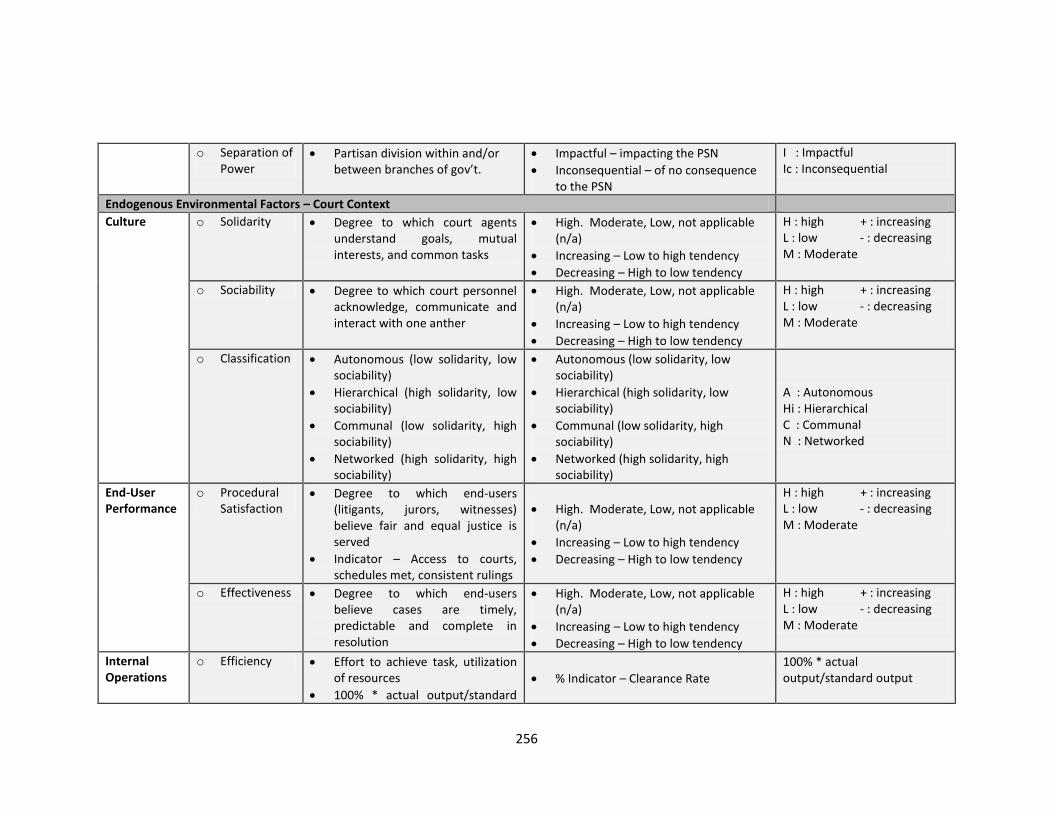
256
o Separation of Power
Partisan division within and/or between branches of gov’t.
Impactful – impacting the PSN
Inconsequential – of no consequence to the PSN
I : Impactful Ic : Inconsequential
Endogenous Environmental Factors – Court Context
Culture o Solidarity Degree to which court agents understand goals, mutual interests, and common tasks
High. Moderate, Low, not applicable (n/a)
Increasing – Low to high tendency
Decreasing – High to low tendency
H : high + : increasing L : low - : decreasing M : Moderate
o Sociability Degree to which court personnel acknowledge, communicate and interact with one anther
High. Moderate, Low, not applicable (n/a)
Increasing – Low to high tendency
Decreasing – High to low tendency
H : high + : increasing L : low - : decreasing M : Moderate
o Classification Autonomous (low solidarity, low sociability)
Hierarchical (high solidarity, low sociability)
Communal (low solidarity, high sociability)
Networked (high solidarity, high sociability)
Autonomous (low solidarity, low sociability)
Hierarchical (high solidarity, low sociability)
Communal (low solidarity, high sociability)
Networked (high solidarity, high sociability)
A : Autonomous Hi : Hierarchical C : Communal N : Networked
End-User Performance
o Procedural Satisfaction
Degree to which end-users (litigants, jurors, witnesses) believe fair and equal justice is served
Indicator – Access to courts, schedules met, consistent rulings
High. Moderate, Low, not applicable (n/a)
Increasing – Low to high tendency
Decreasing – High to low tendency
H : high + : increasing L : low - : decreasing M : Moderate
o Effectiveness Degree to which end-users believe cases are timely, predictable and complete in resolution
High. Moderate, Low, not applicable (n/a)
Increasing – Low to high tendency
Decreasing – High to low tendency
H : high + : increasing L : low - : decreasing M : Moderate
Internal Operations
o Efficiency Effort to achieve task, utilization of resources
100% * actual output/standard
% Indicator – Clearance Rate
100% * actual output/standard output
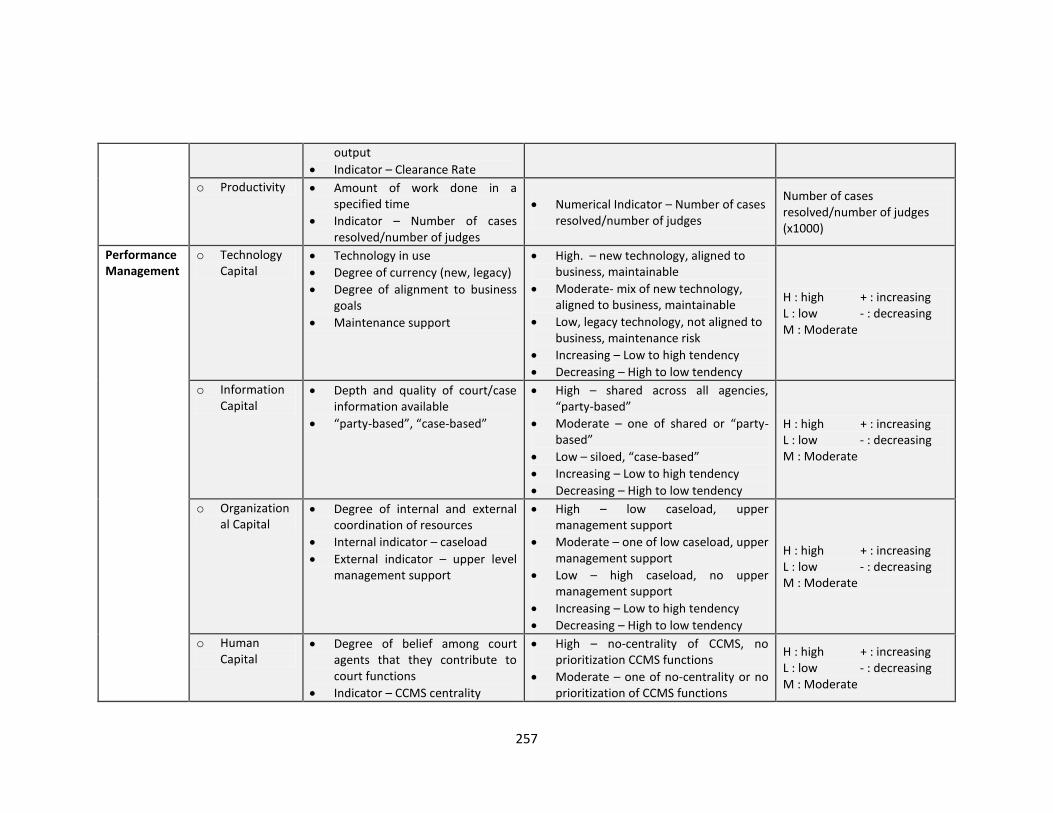
257
output
Indicator – Clearance Rate
o Productivity Amount of work done in a specified time
Indicator – Number of cases resolved/number of judges
Numerical Indicator – Number of cases resolved/number of judges
Number of cases resolved/number of judges (x1000)
Performance Management
o Technology Capital
Technology in use
Degree of currency (new, legacy)
Degree of alignment to business goals
Maintenance support
High. – new technology, aligned to business, maintainable
Moderate- mix of new technology, aligned to business, maintainable
Low, legacy technology, not aligned to business, maintenance risk
Increasing – Low to high tendency
Decreasing – High to low tendency
H : high + : increasing L : low - : decreasing M : Moderate
o Information Capital
Depth and quality of court/case information available
“party-based”, “case-based”
High – shared across all agencies, “party-based”
Moderate – one of shared or “party-based”
Low – siloed, “case-based”
Increasing – Low to high tendency
Decreasing – High to low tendency
H : high + : increasing L : low - : decreasing M : Moderate
o Organizational Capital
Degree of internal and external coordination of resources
Internal indicator – caseload
External indicator – upper level management support
High – low caseload, upper management support
Moderate – one of low caseload, upper management support
Low – high caseload, no upper management support
Increasing – Low to high tendency
Decreasing – High to low tendency
H : high + : increasing L : low - : decreasing M : Moderate
o Human Capital
Degree of belief among court agents that they contribute to court functions
Indicator – CCMS centrality
High – no-centrality of CCMS, no prioritization CCMS functions
Moderate – one of no-centrality or no prioritization of CCMS functions
H : high + : increasing L : low - : decreasing M : Moderate
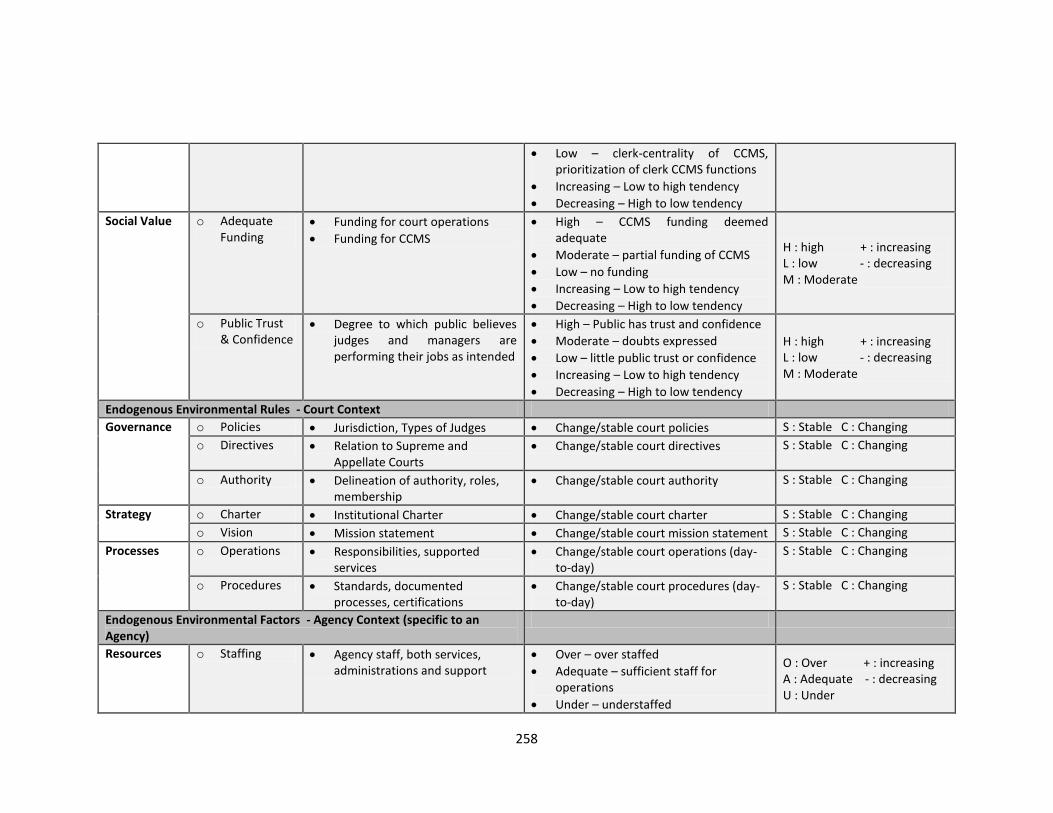
258
Low – clerk-centrality of CCMS, prioritization of clerk CCMS functions
Increasing – Low to high tendency
Decreasing – High to low tendency
Social Value o Adequate Funding
Funding for court operations
Funding for CCMS
High – CCMS funding deemed adequate
Moderate – partial funding of CCMS
Low – no funding
Increasing – Low to high tendency
Decreasing – High to low tendency
H : high + : increasing L : low - : decreasing M : Moderate
o Public Trust & Confidence
Degree to which public believes judges and managers are performing their jobs as intended
High – Public has trust and confidence
Moderate – doubts expressed
Low – little public trust or confidence
Increasing – Low to high tendency
Decreasing – High to low tendency
H : high + : increasing L : low - : decreasing M : Moderate
Endogenous Environmental Rules - Court Context
Governance o Policies Jurisdiction, Types of Judges Change/stable court policies S : Stable C : Changing
o Directives Relation to Supreme and Appellate Courts
Change/stable court directives S : Stable C : Changing
o Authority Delineation of authority, roles, membership
Change/stable court authority S : Stable C : Changing
Strategy o Charter Institutional Charter Change/stable court charter S : Stable C : Changing
o Vision Mission statement Change/stable court mission statement S : Stable C : Changing
Processes o Operations Responsibilities, supported services
Change/stable court operations (day-to-day)
S : Stable C : Changing
o Procedures Standards, documented processes, certifications
Change/stable court procedures (day-to-day)
S : Stable C : Changing
Endogenous Environmental Factors - Agency Context (specific to an Agency)
Resources o Staffing Agency staff, both services, administrations and support
Over – over staffed
Adequate – sufficient staff for operations
Under – understaffed
O : Over + : increasing A : Adequate - : decreasing U : Under
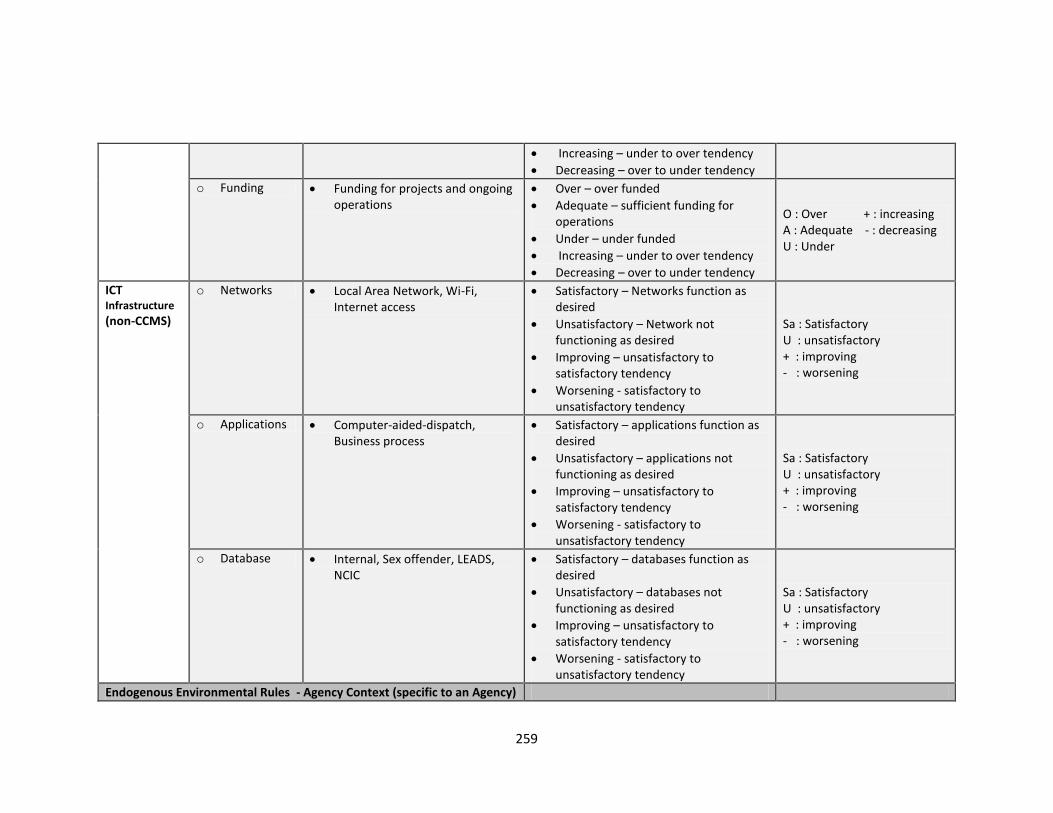
259
Increasing – under to over tendency
Decreasing – over to under tendency
o Funding Funding for projects and ongoing operations
Over – over funded
Adequate – sufficient funding for operations
Under – under funded
Increasing – under to over tendency
Decreasing – over to under tendency
O : Over + : increasing A : Adequate - : decreasing U : Under
ICT Infrastructure
(non-CCMS)
o Networks Local Area Network, Wi-Fi, Internet access
Satisfactory – Networks function as desired
Unsatisfactory – Network not functioning as desired
Improving – unsatisfactory to satisfactory tendency
Worsening - satisfactory to unsatisfactory tendency
Sa : Satisfactory U : unsatisfactory + : improving - : worsening
o Applications Computer-aided-dispatch, Business process
Satisfactory – applications function as desired
Unsatisfactory – applications not functioning as desired
Improving – unsatisfactory to satisfactory tendency
Worsening - satisfactory to unsatisfactory tendency
Sa : Satisfactory U : unsatisfactory + : improving - : worsening
o Database Internal, Sex offender, LEADS, NCIC
Satisfactory – databases function as desired
Unsatisfactory – databases not functioning as desired
Improving – unsatisfactory to satisfactory tendency
Worsening - satisfactory to unsatisfactory tendency
Sa : Satisfactory U : unsatisfactory + : improving - : worsening
Endogenous Environmental Rules - Agency Context (specific to an Agency)
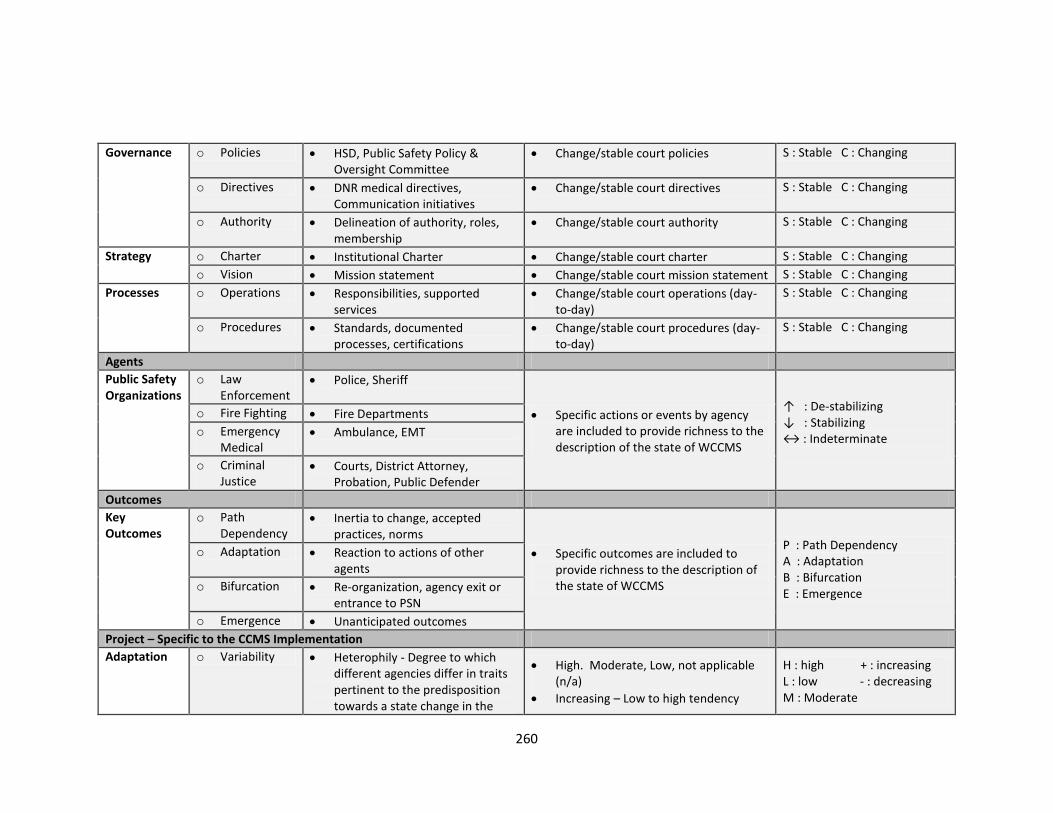
260
Governance o Policies HSD, Public Safety Policy & Oversight Committee
Change/stable court policies S : Stable C : Changing
o Directives DNR medical directives, Communication initiatives
Change/stable court directives S : Stable C : Changing
o Authority Delineation of authority, roles, membership
Change/stable court authority S : Stable C : Changing
Strategy o Charter Institutional Charter Change/stable court charter S : Stable C : Changing
o Vision Mission statement Change/stable court mission statement S : Stable C : Changing
Processes o Operations Responsibilities, supported services
Change/stable court operations (day-to-day)
S : Stable C : Changing
o Procedures Standards, documented processes, certifications
Change/stable court procedures (day-to-day)
S : Stable C : Changing
Agents
Public Safety Organizations
o Law Enforcement
Police, Sheriff
Specific actions or events by agency are included to provide richness to the description of the state of WCCMS
↑ : De-stabilizing ↓ : Stabilizing ↔ : Indeterminate
o Fire Fighting Fire Departments
o Emergency Medical
Ambulance, EMT
o Criminal Justice
Courts, District Attorney, Probation, Public Defender
Outcomes
Key Outcomes
o Path Dependency
Inertia to change, accepted practices, norms
Specific outcomes are included to provide richness to the description of the state of WCCMS
P : Path Dependency A : Adaptation B : Bifurcation E : Emergence
o Adaptation Reaction to actions of other agents
o Bifurcation Re-organization, agency exit or entrance to PSN
o Emergence Unanticipated outcomes
Project – Specific to the CCMS Implementation
Adaptation o Variability Heterophily - Degree to which different agencies differ in traits pertinent to the predisposition towards a state change in the
High. Moderate, Low, not applicable (n/a)
Increasing – Low to high tendency
H : high + : increasing L : low - : decreasing M : Moderate
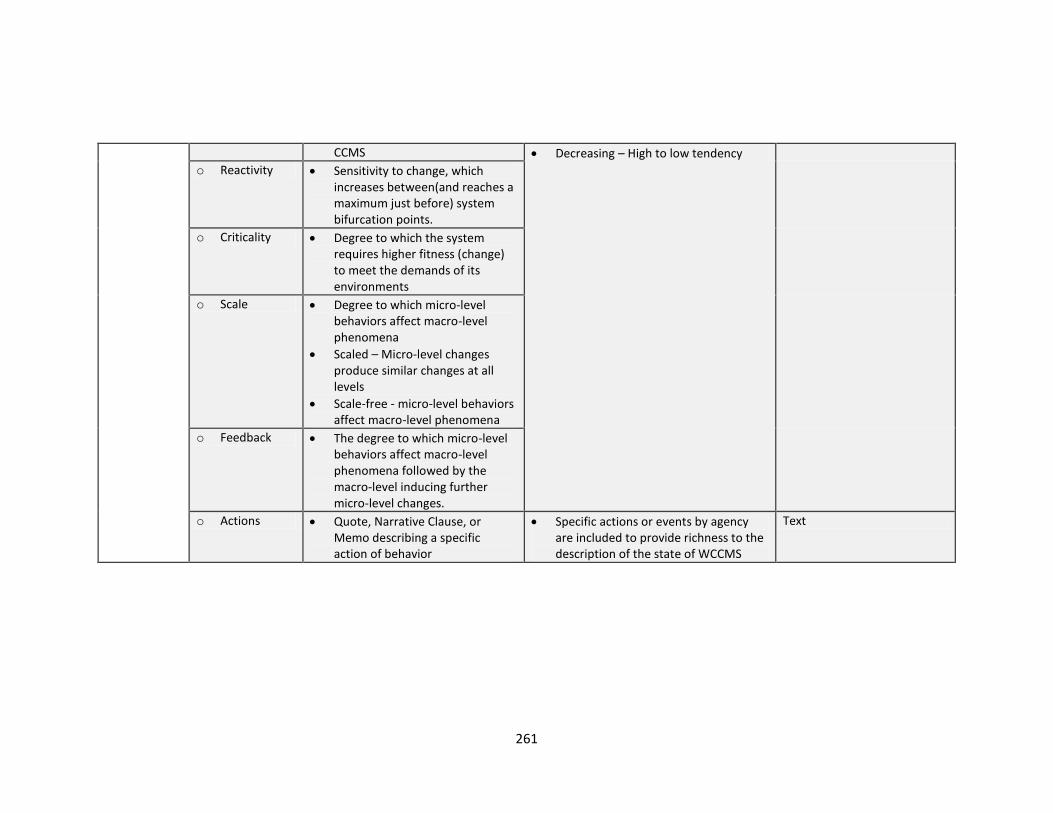
261
CCMS Decreasing – High to low tendency
o Reactivity Sensitivity to change, which increases between(and reaches a maximum just before) system bifurcation points.
o Criticality Degree to which the system requires higher fitness (change) to meet the demands of its environments
o Scale Degree to which micro-level behaviors affect macro-level phenomena
Scaled – Micro-level changes produce similar changes at all levels
Scale-free - micro-level behaviors affect macro-level phenomena
o Feedback The degree to which micro-level behaviors affect macro-level phenomena followed by the macro-level inducing further micro-level changes.
o Actions Quote, Narrative Clause, or Memo describing a specific action of behavior
Specific actions or events by agency are included to provide richness to the description of the state of WCCMS
Text
262
Table 3.16 - Narrative Quotations Supporting WCCMS State Factor Value Coding
Initial State
Autonomous Court Culture
“. . . these folks are natural enemies.” – Chief Information Officer
Low Resources - Case Overload
“We had so much case overload in the system. We’d been one or two in crime in the state of Illinois for 10 years, at least.” – Winnebago County Chairman
Unfit CCMS - State of the CCMS
“We had computer but everything was printed out . . . it wasn’t all in one system. It was like everybody kept their own files on their computer.” – Supervisor of the Pretrial Services Unit
“. . . we maintained our own {records} and we fed them over to the clerk’s office and the connection between here and the clerk was difficult to obtain at times and I’m sure there was a lot of keystrokes added over there when we were already doing them here. . .” – Manager of IT Integration: Public Safety
Case-based, clerk-centric CCMS
“. . . the perception in Winnebago County was that the circuit clerk was the centerpiece of all things that happen in criminal justice. . . There was dysfunctionality inside the system . . . whereas maybe this software called JANO was servicing the clerk well, but was absolutely useless for the public defender, the prosecutor or the court admin.” – Chief Information Officer
State 1: Critically Unfit, Hierarchical
Exogenous Critical Event “. . . there was a Northeast Clerk Conference that was in, I think, November or December of 2004. The Clerk at the time was Marc Gaspirini, and one of the topics was Integrated Court Case Management, so he came back, and fostered the idea, and wanted to see ways for improvement of the current system.” – Information Technology Manager, DoIT
Change in Court Culture to Hierarchical
“. . .we had individual meetings beside them {MTG}. . . coming together, talking about our needs and what we thought we could and couldn’t do based on either the law or different rules that we had that surrounded our department.” - Special Courts Administrator
“. . . {the agencies are} across the hall in many cases and had no idea what one office operates versus the other. . . . one of the biggest benefits, I will tell you, to this whole process, was these offices talking to each other!” – Winnebago County Chairman
Change in Social Value - Adequate Funding – Executive Management Support
“I think in the back of our minds we knew that we were going to be moving to something as a result. We just knew that we were going to be changing the court and case management system.”- Winnebago County Chairman
State 2: Critically Unfit, Networked
Change in Human Capital to High
“We had to overcome the legacy system, where the clerk is the official keeper of the records. . . if you want the most up-to-date probation information, you need to take it from probation. . . from the siloed environment we had to train people’s thoughts into convincing them that this
263
is a whole system.” – Information Technology Manager, DoIT
“. . . the fact people would want this type of technological advance or advantage would be counter to what they were used to as a society.” – Augustus Gentner, Chief Information Officer
“One of the more difficult things was trying to determine what the needs were in an electronic system when they had never used and electronic system. . . it was a really hard thing to try to define the needs of the department, and how to translate those needs into an electronic system. That was a real challenge.” – Senior Administrative Assistant for the Department of Court Services
Change in Culture to Networked
“. . . there was a working team level and then an executive team level. So this working team would meet weekly or more frequently than weekly to make progress and discuss the project. The executive level would meet more monthly or bi-monthly. . .” – Deputy Court Administrator
“. . . we all needed to be in the room all the time even if it wasn’t our issues being talked about.” – Trial Court Administrator for the 17
th Circuit Court
“It didn’t matter who you were, we all heard everything and had just as much input on everything.” – Manager of IT Integration: Public Safety
“I am absolutely amazed at how well we came together and picked something that would work for everybody instead of saying “no” because I want what is best for me. I’m absolutely shocked at how well we worked together; {In particular} elected officials who have to justify what they are doing to the people that are electing them. I was really amazed.” - Special Courts Administrator
Future change in Technology Capital - Decision to Change CCMS type
“. . . they needed to get a party based system because they needed to be able to coordinate information better. They couldn’t be doing collections if they weren’t party based because they would have the data spread around in a way that could not be properly consolidated and you would never get the right collections letter produced.” – Project Manager, Justice Systems Inc.
Change in Resources Funding to Adequate – CCMS project is Funded
“. . . we had to sharpen our pencils because MTG {the GAP study} estimated that it could be anywhere from $15-$16 million, and that was not palatable to the County Board. The Chairman said, “no way. You need to refine those numbers” So we brought it down to $6.7 million and at that point he said “Yeah, okay, I think we can present it to the board.”” – Chief Information Officer
State 3: NewFit, Networked
Critical event – Failed initial “go-live”
“I don’t think there was a “told you so,” it was kind of, “Well, we’ll get it fixed.”. . . it was more embarrassing than anything.” – Todd Hughes, Information Technology Manager, DoIT
“I’m talking about everybody, the Chairman, State’s Attorney; all the players that were brought in whether they are the political team or the working team or the clerks or the technology guys. Everybody said well crap that sucks let’s move to the next game . . . everyone was really good about moving forward.” – Project Manager, Justice Systems Inc.
There was some concern from the Board, but cooler heads prevailed . . . we were originally told it could take five years, so I figured we were still way ahead {even with this delay}.” – Winnebago County Chairman
Change in Human Capital to Medium
264
“I never thought it was going to happen on time anyway” – Deputy to the Public Defender
“I was somewhat relieved because I didn’t feel we were ready in April” – Trial Court Administrator for the 17
th Circuit Court
“We were so grateful it didn’t happen. We had no training.” – Supervisor of the Pretrial Services Unit “I think by the time we got ready for go-live you didn’t have a feeling you had your head wrapped around it, exactly the way you wanted to, and you hadn’t had that intensive training that we needed. . .” – Deputy Director of the Adult Probation Department
Change in Technology Capital – New CCMS “go-live”
“. . . we’ve delivered 98% of the system at this point. In that 2% there is still some important pieces that they need so I know they are anxious to see that.” – Project Manager, Justice Systems Inc.
Change in Court Culture to Hierarchical
“. . . decisions that should have been made during the meetings. . . I had to go back and say, “we’ll get back to you”. . . that was kind of upsetting. . . it would benefit the attorneys if they had been at the meetings to understand the whole system.” – Records Supervisor, State’s Attorney’s Office
Change in Information Capital
“The core environment is there and they are having a heyday being able to say we can know this kind of information that we couldn’t know before. . . They are extracting data and they know a lot about it.” –President, Justice Systems Inc.
Change in Resources – Funding
“. . . we have got to find a funding source for post project closure because there is always going to be enhancements . . . we have to figure out how to fund them.” – Chief Information Officer
Project Criticality, Reactivity and Feedback
“So when you are pushing a time table that much you’re going to run into issues that you probably wouldn’t run into if you were spreading it out. Has it been a hurried project? Yes.” – Manager of IT Integration: Public Safety
“The original contract said you can have all these things and there’s the target timeframe. Then there are adjustments, things get negotiated and we {JSI} want to push out the launch date. They {DoIT} say “no, we want these in, but we’re willing to live with them after the launch date.”” – Project Manager, Justice Systems Inc “As we got closer to the go-live date, tension really built on both ends; the vendor is under the gun to get everything functioning and the departments are under the gun to get something they know they can really use; particularly the Clerk, because they are dealing with money; the money issue was big . . . recording all the things happening in court; it just wasn’t very pretty.” – Senior Administrative Assistant for the Department of Court Services “We were told . . . to make this one, or else!” – Information Technology Manager, DoIT
265
State 4: FutureFit, Autonomous
Technology Capital NOT moving to High
“. . . it’s evolving and that’s a good thing. I don’t think I ever thought it would be quick. I was not naïve enough to think that we’re going to just turn a switch” – Winnebago County Chairman “. . . we went from what was known as a clerk-centric system to what I would say is a system-centric system. We started down that path to making it system-centric and for whatever reasons worked our way back to a more clerk or department centric system.” – Todd Schroeder, Trial Court Administrator for the 17
th Circuit Court
“The results are positive. I think the system we currently have is good and I think it’s producing what we want it to do. There are some growing pains. As we begin to adjust and recognize what we can do with it we will see greater efficiencies.” – State’s Attorney
“We still have workarounds; the system is not perfect for us. We’re a smaller player, so our issues really just pertain to the way we do our work, as opposed to the Clerk’s issues, which everyone relies on.” – Senior Administrative Assistant for the Department of Court Services
Court Culture Potentially moving to Autonomous
“Just as we went live everybody, all the departments, kind of had their own issues to deal with using the system and training their people and we all kind of huddled up into our own shells. I think we got away from understanding each other and why we do things and being able to share.” – Trial Court Administrator for the 17
th Circuit Court
“I think that it’s a natural process at some point that I want my stuff. . . They are still sitting down and talking but it’s not as good as it was.” - Special Courts Administrator
Human Capital moving to Low
“Well the judges are not used to our new way of recording entries in the courtroom” - –Clerk of the Circuit Court
“I can enter a case with three charges in less than three minutes . . . if they knew the system they wouldn’t have these problems.” – Records Supervisor, State’s Attorney’s Office
“The perceived changes in practice and the actual ones are vastly different . . . the people that believe it’s going to be a bigger deal are the people that are entrenched in their ways and those people are the lawyers, judges, and clerks.” – Deputy to the Public Defender
Project Criticality, Reactivity and Feedback
“I don’t want our workarounds to be our process.” – Senior Administrative Assistant for the Department of Court Services
“. . . focus needs to be on providing useful information day-to-day in the courtroom. Now there is more information available, but managing cases on a day-to-day basis had not been a focal point. . we are removing the data contamination from the previous system . . . and what I would like to see is standardized dockets.” – Chief Judge of the 17
th Circuit Court
“. . . my opinion, for right, wrong, or indifferent, of the whole CCMS is we have a ways to go. I think it has been a good project. I think the potential is there and I think in a year or two you come back and talk to us it will be a lot different. I am looking forward to the other parts of the system coming in place.”- Sheriff, Winnebago County
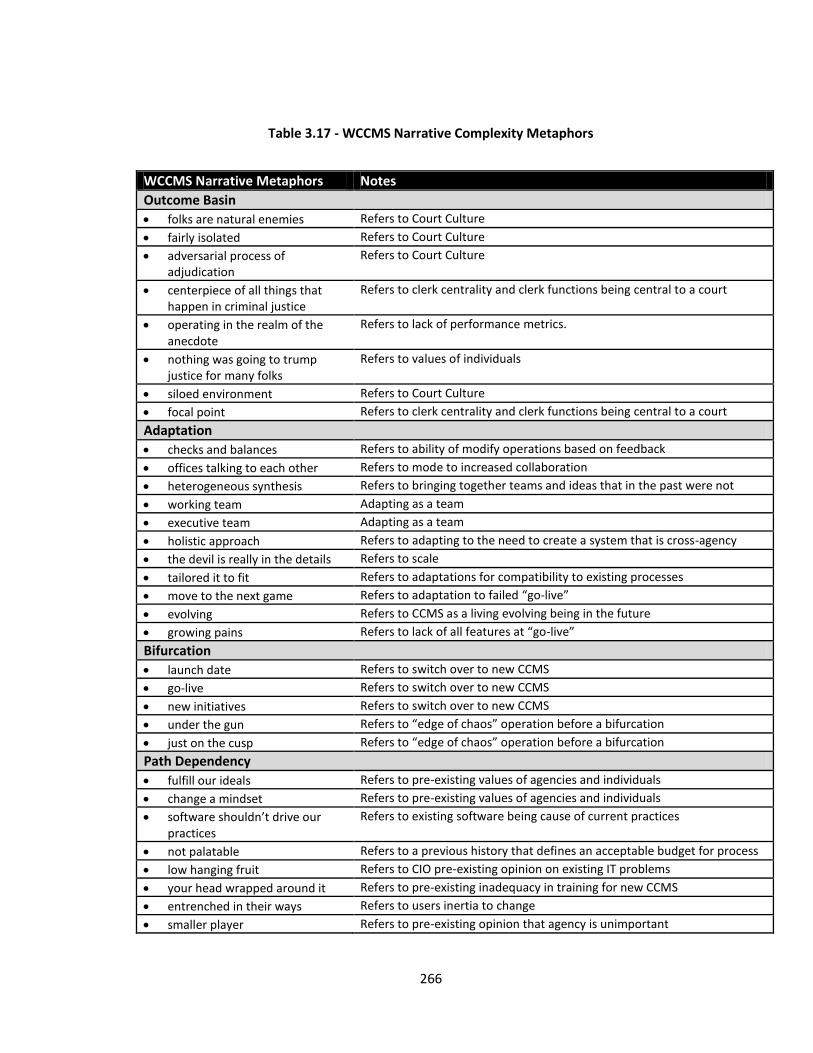
266
Table 3.17 - WCCMS Narrative Complexity Metaphors
WCCMS Narrative Metaphors Notes
Outcome Basin
folks are natural enemies Refers to Court Culture
fairly isolated Refers to Court Culture
adversarial process of adjudication
Refers to Court Culture
centerpiece of all things that happen in criminal justice
Refers to clerk centrality and clerk functions being central to a court
operating in the realm of the anecdote
Refers to lack of performance metrics.
nothing was going to trump justice for many folks
Refers to values of individuals
siloed environment Refers to Court Culture
focal point Refers to clerk centrality and clerk functions being central to a court
Adaptation
checks and balances Refers to ability of modify operations based on feedback
offices talking to each other Refers to mode to increased collaboration
heterogeneous synthesis Refers to bringing together teams and ideas that in the past were not
working team Adapting as a team
executive team Adapting as a team
holistic approach Refers to adapting to the need to create a system that is cross-agency
the devil is really in the details Refers to scale
tailored it to fit Refers to adaptations for compatibility to existing processes
move to the next game Refers to adaptation to failed “go-live”
evolving Refers to CCMS as a living evolving being in the future
growing pains Refers to lack of all features at “go-live”
Bifurcation
launch date Refers to switch over to new CCMS
go-live Refers to switch over to new CCMS
new initiatives Refers to switch over to new CCMS
under the gun Refers to “edge of chaos” operation before a bifurcation
just on the cusp Refers to “edge of chaos” operation before a bifurcation
Path Dependency
fulfill our ideals Refers to pre-existing values of agencies and individuals
change a mindset Refers to pre-existing values of agencies and individuals
software shouldn’t drive our practices
Refers to existing software being cause of current practices
not palatable Refers to a previous history that defines an acceptable budget for process
low hanging fruit Refers to CIO pre-existing opinion on existing IT problems
your head wrapped around it Refers to pre-existing inadequacy in training for new CCMS
entrenched in their ways Refers to users inertia to change
smaller player Refers to pre-existing opinion that agency is unimportant
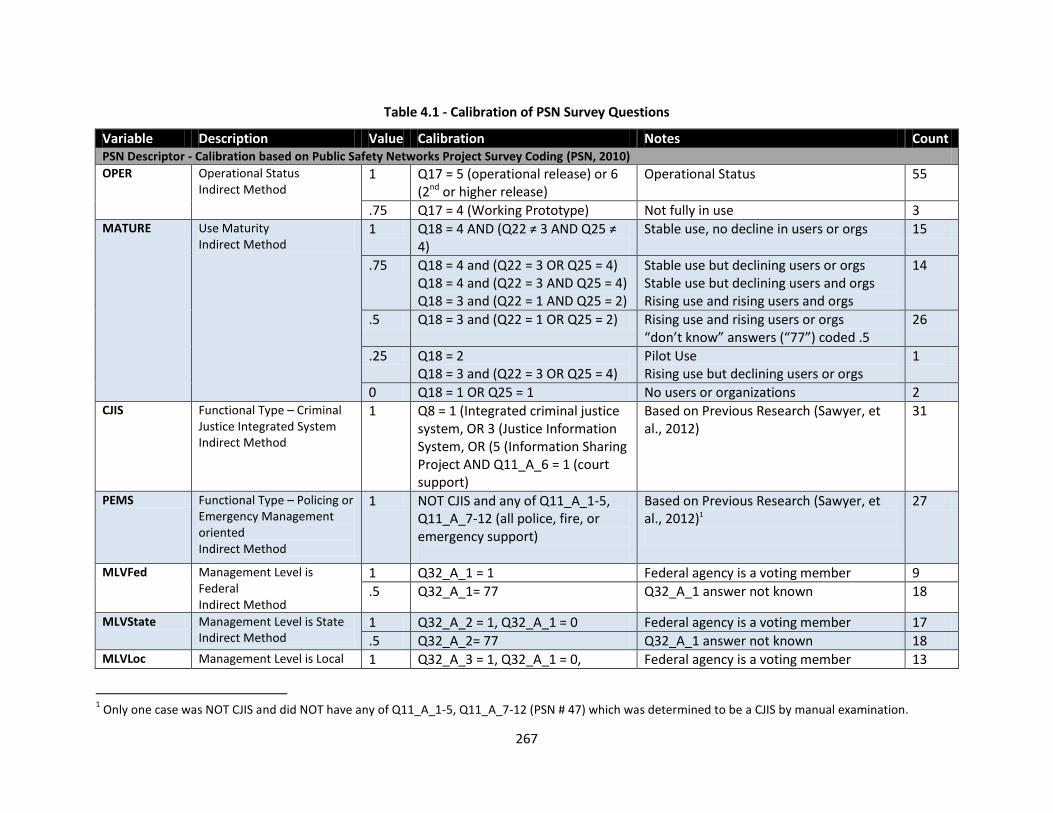
267
Table 4.1 - Calibration of PSN Survey Questions
Variable Description Value Calibration Notes Count PSN Descriptor - Calibration based on Public Safety Networks Project Survey Coding (PSN, 2010)
OPER Operational Status Indirect Method
1 Q17 = 5 (operational release) or 6 (2nd or higher release)
Operational Status 55
.75 Q17 = 4 (Working Prototype) Not fully in use 3 MATURE Use Maturity
Indirect Method 1 Q18 = 4 AND (Q22 ≠ 3 AND Q25 ≠
4) Stable use, no decline in users or orgs 15
.75 Q18 = 4 and (Q22 = 3 OR Q25 = 4) Q18 = 4 and (Q22 = 3 AND Q25 = 4) Q18 = 3 and (Q22 = 1 AND Q25 = 2)
Stable use but declining users or orgs Stable use but declining users and orgs Rising use and rising users and orgs
14
.5 Q18 = 3 and (Q22 = 1 OR Q25 = 2) Rising use and rising users or orgs “don’t know” answers (“77”) coded .5
26
.25 Q18 = 2 Q18 = 3 and (Q22 = 3 OR Q25 = 4)
Pilot Use Rising use but declining users or orgs
1
0 Q18 = 1 OR Q25 = 1 No users or organizations 2 CJIS Functional Type – Criminal
Justice Integrated System Indirect Method
1 Q8 = 1 (Integrated criminal justice system, OR 3 (Justice Information System, OR (5 (Information Sharing Project AND Q11_A_6 = 1 (court support)
Based on Previous Research (Sawyer, et al., 2012)
31
PEMS Functional Type – Policing or Emergency Management oriented Indirect Method
1 NOT CJIS and any of Q11_A_1-5, Q11_A_7-12 (all police, fire, or emergency support)
Based on Previous Research (Sawyer, et al., 2012)1
27
MLVFed Management Level is Federal Indirect Method
1 Q32_A_1 = 1 Federal agency is a voting member 9
.5 Q32_A_1= 77 Q32_A_1 answer not known 18
MLVState Management Level is State Indirect Method
1 Q32_A_2 = 1, Q32_A_1 = 0 Federal agency is a voting member 17
.5 Q32_A_2= 77 Q32_A_1 answer not known 18 MLVLoc Management Level is Local 1 Q32_A_3 = 1, Q32_A_1 = 0, Federal agency is a voting member 13
1 Only one case was NOT CJIS and did NOT have any of Q11_A_1-5, Q11_A_7-12 (PSN # 47) which was determined to be a CJIS by manual examination.
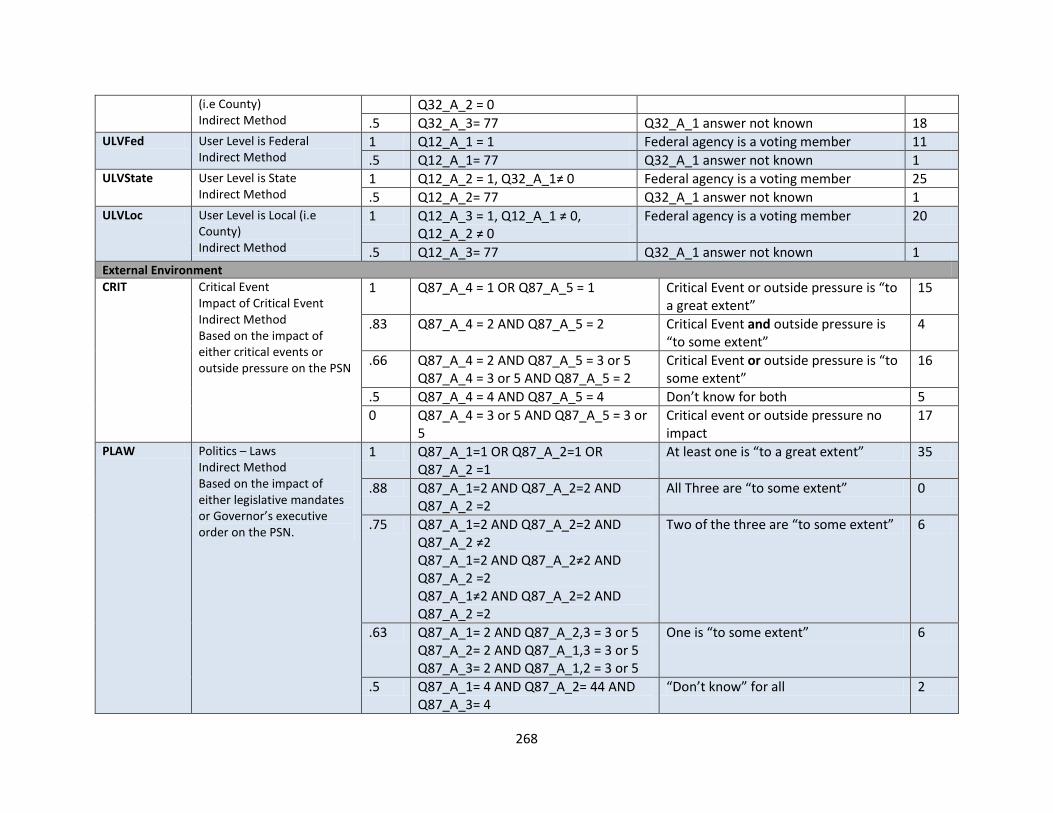
268
(i.e County) Indirect Method
Q32_A_2 = 0
.5 Q32_A_3= 77 Q32_A_1 answer not known 18 ULVFed User Level is Federal
Indirect Method 1 Q12_A_1 = 1 Federal agency is a voting member 11
.5 Q12_A_1= 77 Q32_A_1 answer not known 1 ULVState User Level is State
Indirect Method 1 Q12_A_2 = 1, Q32_A_1≠ 0 Federal agency is a voting member 25
.5 Q12_A_2= 77 Q32_A_1 answer not known 1 ULVLoc User Level is Local (i.e
County) Indirect Method
1 Q12_A_3 = 1, Q12_A_1 ≠ 0, Q12_A_2 ≠ 0
Federal agency is a voting member 20
.5 Q12_A_3= 77 Q32_A_1 answer not known 1 External Environment
CRIT Critical Event Impact of Critical Event Indirect Method Based on the impact of either critical events or outside pressure on the PSN
1 Q87_A_4 = 1 OR Q87_A_5 = 1 Critical Event or outside pressure is “to a great extent”
15
.83 Q87_A_4 = 2 AND Q87_A_5 = 2 Critical Event and outside pressure is “to some extent”
4
.66 Q87_A_4 = 2 AND Q87_A_5 = 3 or 5 Q87_A_4 = 3 or 5 AND Q87_A_5 = 2
Critical Event or outside pressure is “to some extent”
16
.5 Q87_A_4 = 4 AND Q87_A_5 = 4 Don’t know for both 5
0 Q87_A_4 = 3 or 5 AND Q87_A_5 = 3 or 5
Critical event or outside pressure no impact
17
PLAW Politics – Laws Indirect Method Based on the impact of either legislative mandates or Governor’s executive order on the PSN.
1 Q87_A_1=1 OR Q87_A_2=1 OR Q87_A_2 =1
At least one is “to a great extent” 35
.88 Q87_A_1=2 AND Q87_A_2=2 AND Q87_A_2 =2
All Three are “to some extent” 0
.75 Q87_A_1=2 AND Q87_A_2=2 AND Q87_A_2 ≠2 Q87_A_1=2 AND Q87_A_2≠2 AND Q87_A_2 =2 Q87_A_1≠2 AND Q87_A_2=2 AND Q87_A_2 =2
Two of the three are “to some extent” 6
.63 Q87_A_1= 2 AND Q87_A_2,3 = 3 or 5 Q87_A_2= 2 AND Q87_A_1,3 = 3 or 5 Q87_A_3= 2 AND Q87_A_1,2 = 3 or 5
One is “to some extent” 6
.5 Q87_A_1= 4 AND Q87_A_2= 44 AND Q87_A_3= 4
“Don’t know” for all 2
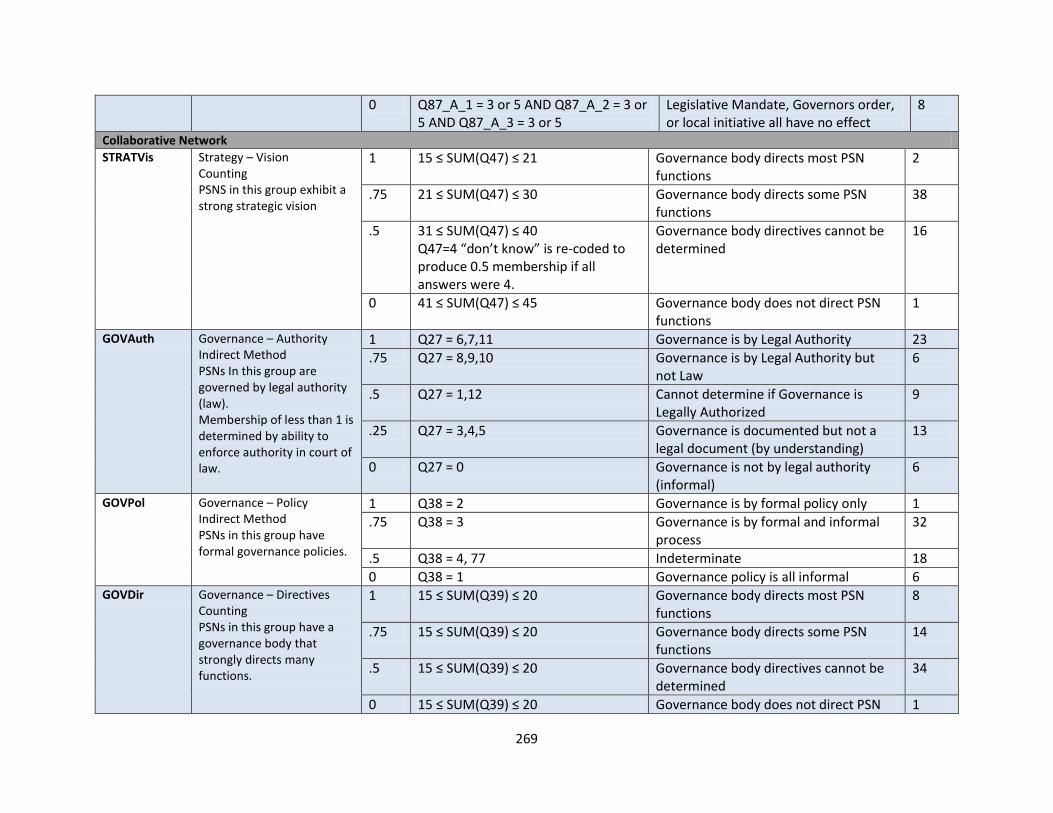
269
0 Q87_A_1 = 3 or 5 AND Q87_A_2 = 3 or 5 AND Q87_A_3 = 3 or 5
Legislative Mandate, Governors order, or local initiative all have no effect
8
Collaborative Network
STRATVis Strategy – Vision Counting PSNS in this group exhibit a strong strategic vision
1 15 ≤ SUM(Q47) ≤ 21 Governance body directs most PSN functions
2
.75 21 ≤ SUM(Q47) ≤ 30 Governance body directs some PSN functions
38
.5 31 ≤ SUM(Q47) ≤ 40 Q47=4 “don’t know” is re-coded to produce 0.5 membership if all answers were 4.
Governance body directives cannot be determined
16
0 41 ≤ SUM(Q47) ≤ 45 Governance body does not direct PSN functions
1
GOVAuth Governance – Authority Indirect Method PSNs In this group are governed by legal authority (law). Membership of less than 1 is determined by ability to enforce authority in court of law.
1 Q27 = 6,7,11 Governance is by Legal Authority 23
.75 Q27 = 8,9,10 Governance is by Legal Authority but not Law
6
.5 Q27 = 1,12 Cannot determine if Governance is Legally Authorized
9
.25 Q27 = 3,4,5 Governance is documented but not a legal document (by understanding)
13
0 Q27 = 0 Governance is not by legal authority (informal)
6
GOVPol Governance – Policy Indirect Method PSNs in this group have formal governance policies.
1 Q38 = 2 Governance is by formal policy only 1
.75 Q38 = 3 Governance is by formal and informal process
32
.5 Q38 = 4, 77 Indeterminate 18
0 Q38 = 1 Governance policy is all informal 6 GOVDir Governance – Directives
Counting PSNs in this group have a governance body that strongly directs many functions.
1 15 ≤ SUM(Q39) ≤ 20 Governance body directs most PSN functions
8
.75 15 ≤ SUM(Q39) ≤ 20 Governance body directs some PSN functions
14
.5 15 ≤ SUM(Q39) ≤ 20 Governance body directives cannot be determined
34
0 15 ≤ SUM(Q39) ≤ 20 Governance body does not direct PSN 1
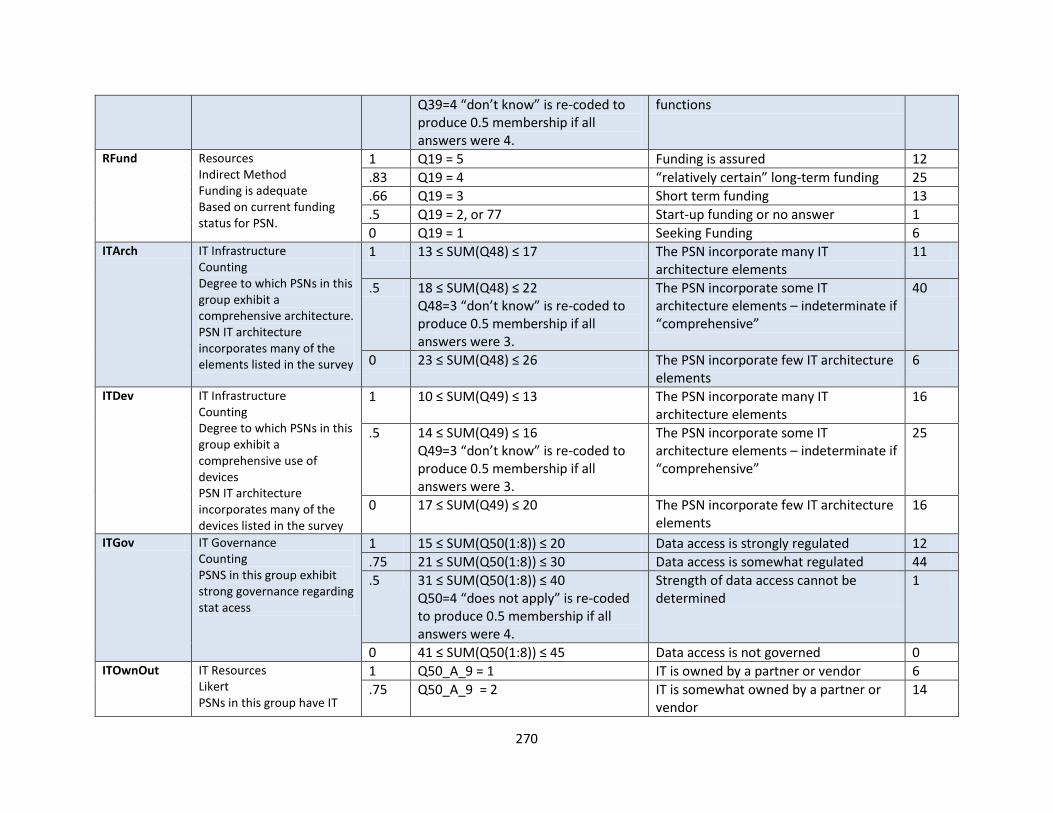
270
Q39=4 “don’t know” is re-coded to produce 0.5 membership if all answers were 4.
functions
RFund Resources Indirect Method Funding is adequate Based on current funding status for PSN.
1 Q19 = 5 Funding is assured 12
.83 Q19 = 4 “relatively certain” long-term funding 25
.66 Q19 = 3 Short term funding 13
.5 Q19 = 2, or 77 Start-up funding or no answer 1
0 Q19 = 1 Seeking Funding 6 ITArch IT Infrastructure
Counting Degree to which PSNs in this group exhibit a comprehensive architecture. PSN IT architecture incorporates many of the elements listed in the survey
1 13 ≤ SUM(Q48) ≤ 17 The PSN incorporate many IT architecture elements
11
.5 18 ≤ SUM(Q48) ≤ 22 Q48=3 “don’t know” is re-coded to produce 0.5 membership if all answers were 3.
The PSN incorporate some IT architecture elements – indeterminate if “comprehensive”
40
0 23 ≤ SUM(Q48) ≤ 26 The PSN incorporate few IT architecture elements
6
ITDev IT Infrastructure Counting Degree to which PSNs in this group exhibit a comprehensive use of devices PSN IT architecture incorporates many of the devices listed in the survey
1 10 ≤ SUM(Q49) ≤ 13 The PSN incorporate many IT architecture elements
16
.5 14 ≤ SUM(Q49) ≤ 16 Q49=3 “don’t know” is re-coded to produce 0.5 membership if all answers were 3.
The PSN incorporate some IT architecture elements – indeterminate if “comprehensive”
25
0 17 ≤ SUM(Q49) ≤ 20 The PSN incorporate few IT architecture elements
16
ITGov IT Governance Counting PSNS in this group exhibit strong governance regarding stat acess
1 15 ≤ SUM(Q50(1:8)) ≤ 20 Data access is strongly regulated 12
.75 21 ≤ SUM(Q50(1:8)) ≤ 30 Data access is somewhat regulated 44
.5 31 ≤ SUM(Q50(1:8)) ≤ 40 Q50=4 “does not apply” is re-coded to produce 0.5 membership if all answers were 4.
Strength of data access cannot be determined
1
0 41 ≤ SUM(Q50(1:8)) ≤ 45 Data access is not governed 0 ITOwnOut IT Resources
Likert PSNs in this group have IT
1 Q50_A_9 = 1 IT is owned by a partner or vendor 6
.75 Q50_A_9 = 2 IT is somewhat owned by a partner or vendor
14
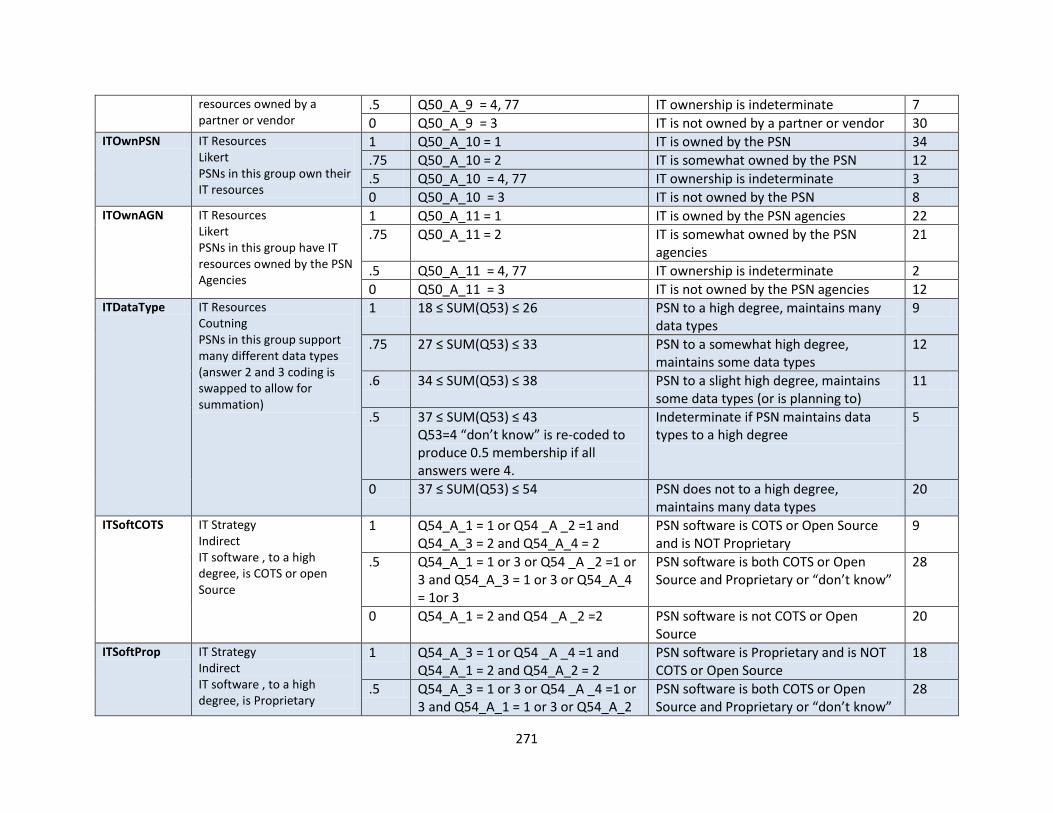
271
resources owned by a partner or vendor
.5 Q50_A_9 = 4, 77 IT ownership is indeterminate 7
0 Q50_A_9 = 3 IT is not owned by a partner or vendor 30 ITOwnPSN IT Resources
Likert PSNs in this group own their IT resources
1 Q50_A_10 = 1 IT is owned by the PSN 34
.75 Q50_A_10 = 2 IT is somewhat owned by the PSN 12
.5 Q50_A_10 = 4, 77 IT ownership is indeterminate 3
0 Q50_A_10 = 3 IT is not owned by the PSN 8 ITOwnAGN IT Resources
Likert PSNs in this group have IT resources owned by the PSN Agencies
1 Q50_A_11 = 1 IT is owned by the PSN agencies 22
.75 Q50_A_11 = 2 IT is somewhat owned by the PSN agencies
21
.5 Q50_A_11 = 4, 77 IT ownership is indeterminate 2
0 Q50_A_11 = 3 IT is not owned by the PSN agencies 12 ITDataType IT Resources
Coutning PSNs in this group support many different data types (answer 2 and 3 coding is swapped to allow for summation)
1 18 ≤ SUM(Q53) ≤ 26 PSN to a high degree, maintains many data types
9
.75 27 ≤ SUM(Q53) ≤ 33 PSN to a somewhat high degree, maintains some data types
12
.6 34 ≤ SUM(Q53) ≤ 38 PSN to a slight high degree, maintains some data types (or is planning to)
11
.5 37 ≤ SUM(Q53) ≤ 43 Q53=4 “don’t know” is re-coded to produce 0.5 membership if all answers were 4.
Indeterminate if PSN maintains data types to a high degree
5
0 37 ≤ SUM(Q53) ≤ 54 PSN does not to a high degree, maintains many data types
20
ITSoftCOTS IT Strategy Indirect IT software , to a high degree, is COTS or open Source
1 Q54_A_1 = 1 or Q54 _A _2 =1 and Q54_A_3 = 2 and Q54_A_4 = 2
PSN software is COTS or Open Source and is NOT Proprietary
9
.5 Q54_A_1 = 1 or 3 or Q54 _A _2 =1 or 3 and Q54_A_3 = 1 or 3 or Q54_A_4 = 1or 3
PSN software is both COTS or Open Source and Proprietary or “don’t know”
28
0 Q54_A_1 = 2 and Q54 _A _2 =2 PSN software is not COTS or Open Source
20
ITSoftProp IT Strategy Indirect IT software , to a high degree, is Proprietary
1 Q54_A_3 = 1 or Q54 _A _4 =1 and Q54_A_1 = 2 and Q54_A_2 = 2
PSN software is Proprietary and is NOT COTS or Open Source
18
.5 Q54_A_3 = 1 or 3 or Q54 _A _4 =1 or 3 and Q54_A_1 = 1 or 3 or Q54_A_2
PSN software is both COTS or Open Source and Proprietary or “don’t know”
28
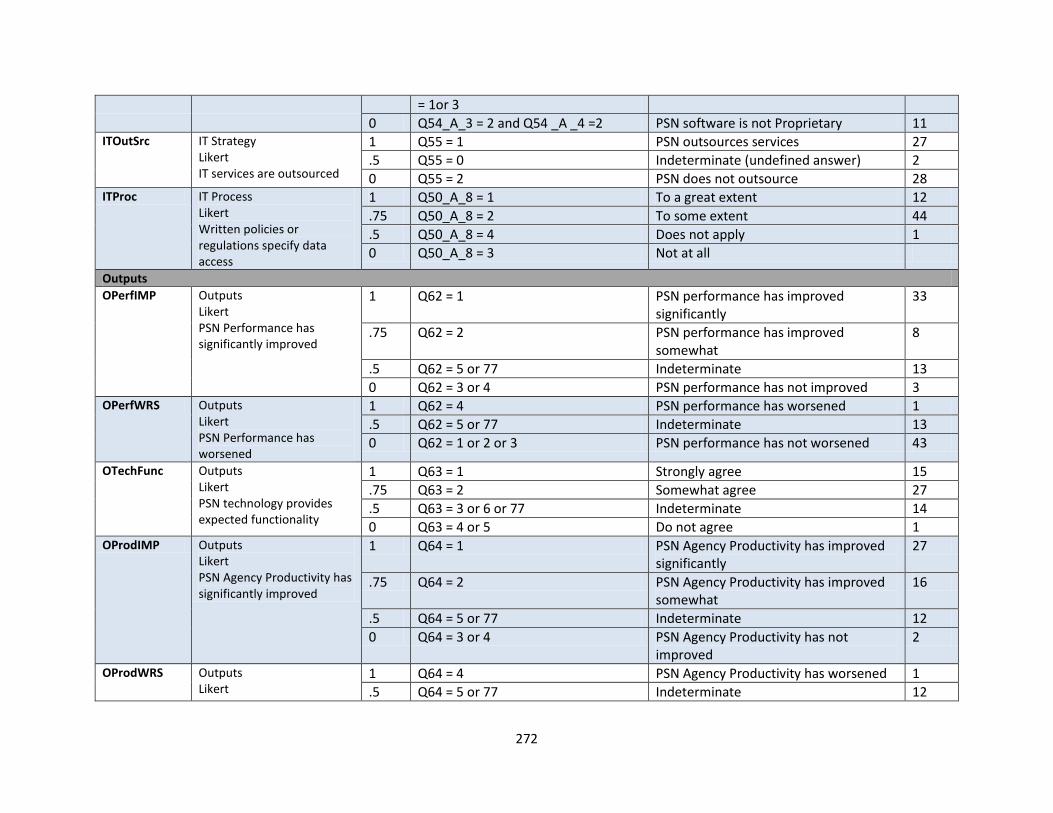
272
= 1or 3
0 Q54_A_3 = 2 and Q54 _A _4 =2 PSN software is not Proprietary 11 ITOutSrc IT Strategy
Likert IT services are outsourced
1 Q55 = 1 PSN outsources services 27
.5 Q55 = 0 Indeterminate (undefined answer) 2
0 Q55 = 2 PSN does not outsource 28 ITProc IT Process
Likert Written policies or regulations specify data access
1 Q50_A_8 = 1 To a great extent 12
.75 Q50_A_8 = 2 To some extent 44
.5 Q50_A_8 = 4 Does not apply 1
0 Q50_A_8 = 3 Not at all
Outputs
OPerfIMP Outputs Likert PSN Performance has significantly improved
1 Q62 = 1 PSN performance has improved significantly
33
.75 Q62 = 2 PSN performance has improved somewhat
8
.5 Q62 = 5 or 77 Indeterminate 13
0 Q62 = 3 or 4 PSN performance has not improved 3 OPerfWRS Outputs
Likert PSN Performance has worsened
1 Q62 = 4 PSN performance has worsened 1
.5 Q62 = 5 or 77 Indeterminate 13
0 Q62 = 1 or 2 or 3 PSN performance has not worsened 43
OTechFunc Outputs Likert PSN technology provides expected functionality
1 Q63 = 1 Strongly agree 15
.75 Q63 = 2 Somewhat agree 27
.5 Q63 = 3 or 6 or 77 Indeterminate 14
0 Q63 = 4 or 5 Do not agree 1 OProdIMP Outputs
Likert PSN Agency Productivity has significantly improved
1 Q64 = 1 PSN Agency Productivity has improved significantly
27
.75 Q64 = 2 PSN Agency Productivity has improved somewhat
16
.5 Q64 = 5 or 77 Indeterminate 12
0 Q64 = 3 or 4 PSN Agency Productivity has not improved
2
OProdWRS Outputs Likert
1 Q64 = 4 PSN Agency Productivity has worsened 1
.5 Q64 = 5 or 77 Indeterminate 12
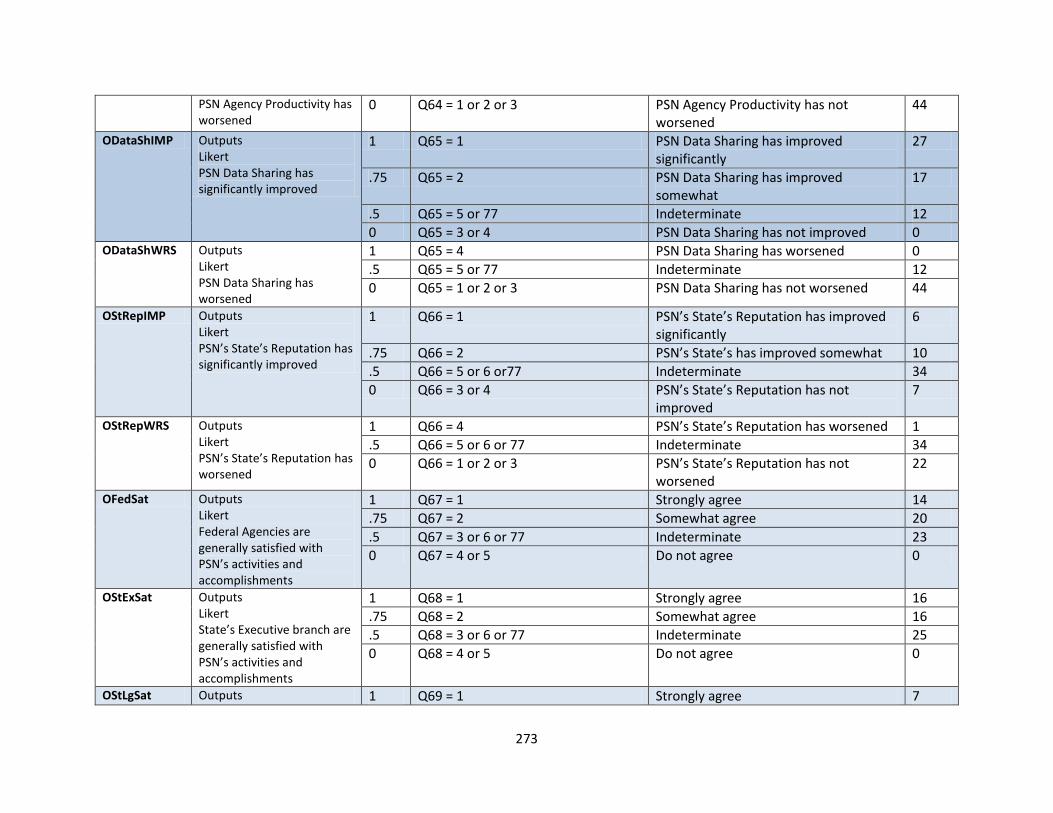
273
PSN Agency Productivity has worsened
0 Q64 = 1 or 2 or 3 PSN Agency Productivity has not worsened
44
ODataShIMP Outputs Likert PSN Data Sharing has significantly improved
1 Q65 = 1 PSN Data Sharing has improved significantly
27
.75 Q65 = 2 PSN Data Sharing has improved somewhat
17
.5 Q65 = 5 or 77 Indeterminate 12
0 Q65 = 3 or 4 PSN Data Sharing has not improved 0 ODataShWRS Outputs
Likert PSN Data Sharing has worsened
1 Q65 = 4 PSN Data Sharing has worsened 0
.5 Q65 = 5 or 77 Indeterminate 12
0 Q65 = 1 or 2 or 3 PSN Data Sharing has not worsened 44
OStRepIMP Outputs Likert PSN’s State’s Reputation has significantly improved
1 Q66 = 1 PSN’s State’s Reputation has improved significantly
6
.75 Q66 = 2 PSN’s State’s has improved somewhat 10
.5 Q66 = 5 or 6 or77 Indeterminate 34
0 Q66 = 3 or 4 PSN’s State’s Reputation has not improved
7
OStRepWRS Outputs Likert PSN’s State’s Reputation has worsened
1 Q66 = 4 PSN’s State’s Reputation has worsened 1
.5 Q66 = 5 or 6 or 77 Indeterminate 34
0 Q66 = 1 or 2 or 3 PSN’s State’s Reputation has not worsened
22
OFedSat Outputs Likert Federal Agencies are generally satisfied with PSN’s activities and accomplishments
1 Q67 = 1 Strongly agree 14
.75 Q67 = 2 Somewhat agree 20
.5 Q67 = 3 or 6 or 77 Indeterminate 23
0 Q67 = 4 or 5 Do not agree 0
OStExSat Outputs Likert State’s Executive branch are generally satisfied with PSN’s activities and accomplishments
1 Q68 = 1 Strongly agree 16
.75 Q68 = 2 Somewhat agree 16
.5 Q68 = 3 or 6 or 77 Indeterminate 25
0 Q68 = 4 or 5 Do not agree 0
OStLgSat Outputs 1 Q69 = 1 Strongly agree 7
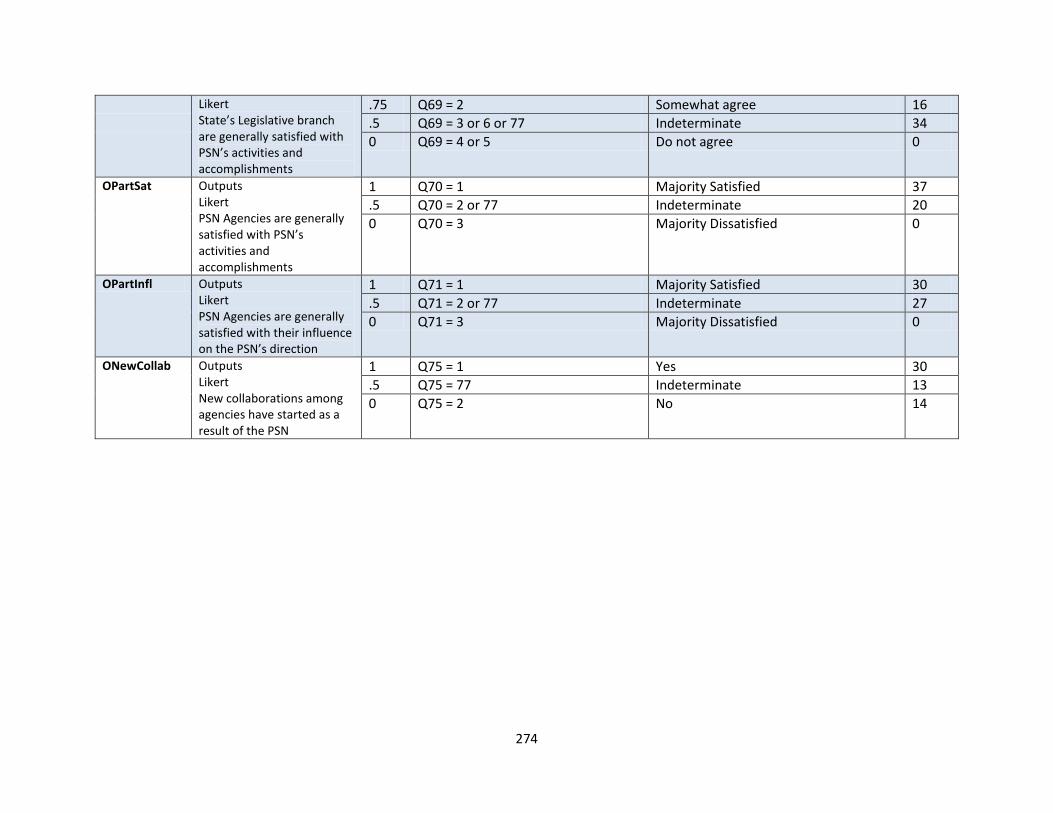
274
Likert State’s Legislative branch are generally satisfied with PSN’s activities and accomplishments
.75 Q69 = 2 Somewhat agree 16
.5 Q69 = 3 or 6 or 77 Indeterminate 34
0 Q69 = 4 or 5 Do not agree 0
OPartSat Outputs Likert PSN Agencies are generally satisfied with PSN’s activities and accomplishments
1 Q70 = 1 Majority Satisfied 37
.5 Q70 = 2 or 77 Indeterminate 20
0 Q70 = 3 Majority Dissatisfied 0
OPartInfl Outputs Likert PSN Agencies are generally satisfied with their influence on the PSN’s direction
1 Q71 = 1 Majority Satisfied 30
.5 Q71 = 2 or 77 Indeterminate 27
0 Q71 = 3 Majority Dissatisfied 0
ONewCollab Outputs Likert New collaborations among agencies have started as a result of the PSN
1 Q75 = 1 Yes 30
.5 Q75 = 77 Indeterminate 13
0 Q75 = 2 No 14
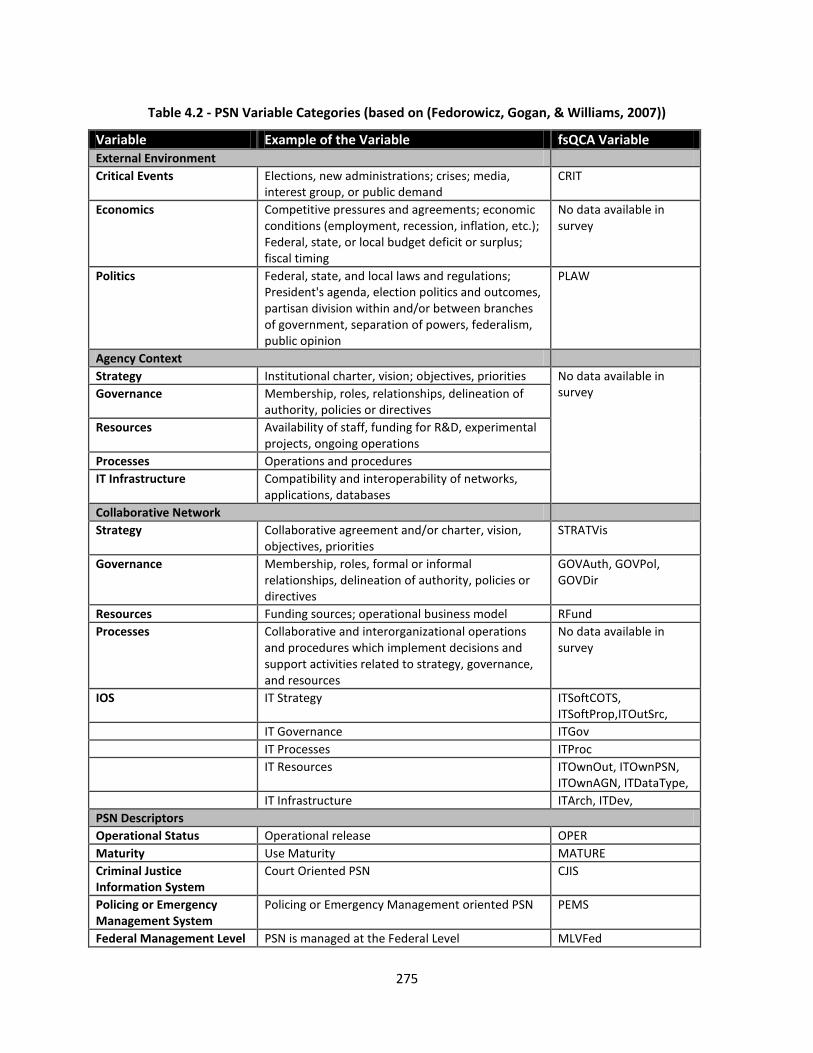
275
Table 4.2 - PSN Variable Categories (based on (Fedorowicz, Gogan, & Williams, 2007))
Variable Example of the Variable fsQCA Variable External Environment
Critical Events Elections, new administrations; crises; media, interest group, or public demand
CRIT
Economics Competitive pressures and agreements; economic conditions (employment, recession, inflation, etc.); Federal, state, or local budget deficit or surplus; fiscal timing
No data available in survey
Politics Federal, state, and local laws and regulations; President's agenda, election politics and outcomes, partisan division within and/or between branches of government, separation of powers, federalism, public opinion
PLAW
Agency Context
Strategy Institutional charter, vision; objectives, priorities No data available in survey Governance Membership, roles, relationships, delineation of
authority, policies or directives
Resources Availability of staff, funding for R&D, experimental projects, ongoing operations
Processes Operations and procedures
IT Infrastructure Compatibility and interoperability of networks, applications, databases
Collaborative Network
Strategy Collaborative agreement and/or charter, vision, objectives, priorities
STRATVis
Governance Membership, roles, formal or informal relationships, delineation of authority, policies or directives
GOVAuth, GOVPol, GOVDir
Resources Funding sources; operational business model RFund
Processes Collaborative and interorganizational operations and procedures which implement decisions and support activities related to strategy, governance, and resources
No data available in survey
IOS IT Strategy ITSoftCOTS, ITSoftProp,ITOutSrc,
IT Governance ITGov
IT Processes ITProc
IT Resources ITOwnOut, ITOwnPSN, ITOwnAGN, ITDataType,
IT Infrastructure ITArch, ITDev,
PSN Descriptors
Operational Status Operational release OPER
Maturity Use Maturity MATURE
Criminal Justice Information System
Court Oriented PSN CJIS
Policing or Emergency Management System
Policing or Emergency Management oriented PSN PEMS
Federal Management Level PSN is managed at the Federal Level MLVFed
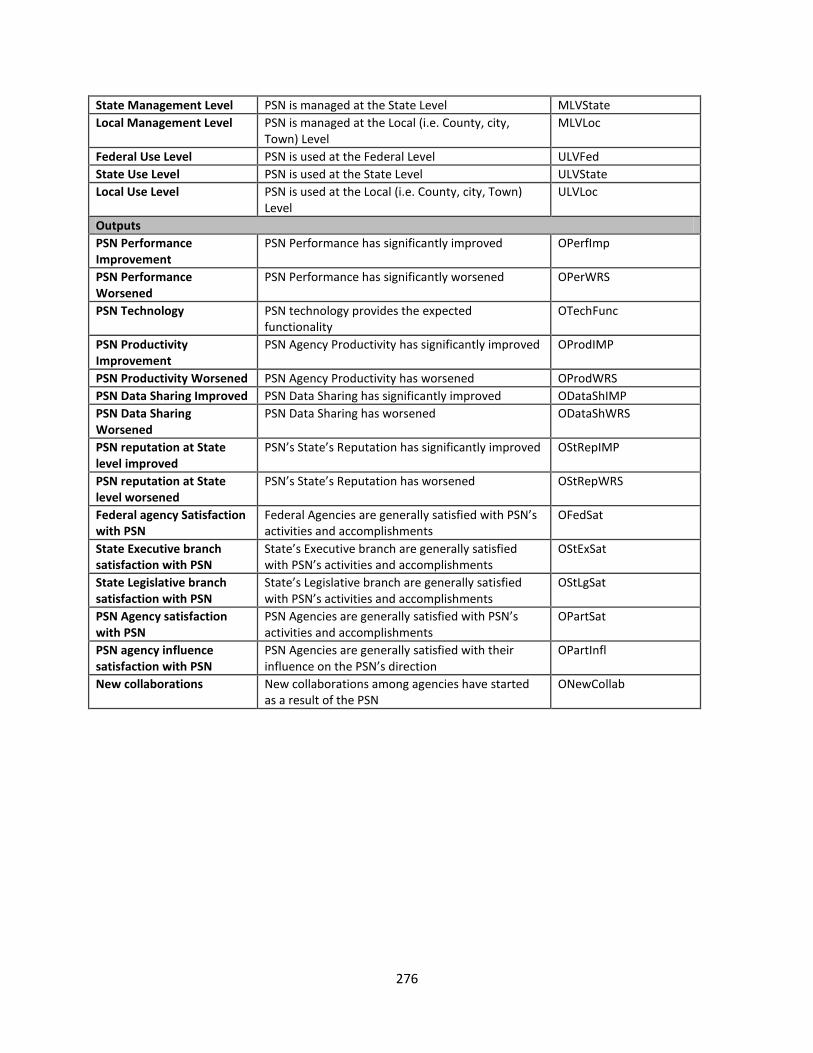
276
State Management Level PSN is managed at the State Level MLVState
Local Management Level PSN is managed at the Local (i.e. County, city, Town) Level
MLVLoc
Federal Use Level PSN is used at the Federal Level ULVFed
State Use Level PSN is used at the State Level ULVState
Local Use Level PSN is used at the Local (i.e. County, city, Town) Level
ULVLoc
Outputs
PSN Performance Improvement
PSN Performance has significantly improved OPerfImp
PSN Performance Worsened
PSN Performance has significantly worsened OPerWRS
PSN Technology PSN technology provides the expected functionality
OTechFunc
PSN Productivity Improvement
PSN Agency Productivity has significantly improved OProdIMP
PSN Productivity Worsened PSN Agency Productivity has worsened OProdWRS
PSN Data Sharing Improved PSN Data Sharing has significantly improved ODataShIMP
PSN Data Sharing Worsened
PSN Data Sharing has worsened ODataShWRS
PSN reputation at State level improved
PSN’s State’s Reputation has significantly improved OStRepIMP
PSN reputation at State level worsened
PSN’s State’s Reputation has worsened OStRepWRS
Federal agency Satisfaction with PSN
Federal Agencies are generally satisfied with PSN’s activities and accomplishments
OFedSat
State Executive branch satisfaction with PSN
State’s Executive branch are generally satisfied with PSN’s activities and accomplishments
OStExSat
State Legislative branch satisfaction with PSN
State’s Legislative branch are generally satisfied with PSN’s activities and accomplishments
OStLgSat
PSN Agency satisfaction with PSN
PSN Agencies are generally satisfied with PSN’s activities and accomplishments
OPartSat
PSN agency influence satisfaction with PSN
PSN Agencies are generally satisfied with their influence on the PSN’s direction
OPartInfl
New collaborations New collaborations among agencies have started as a result of the PSN
ONewCollab
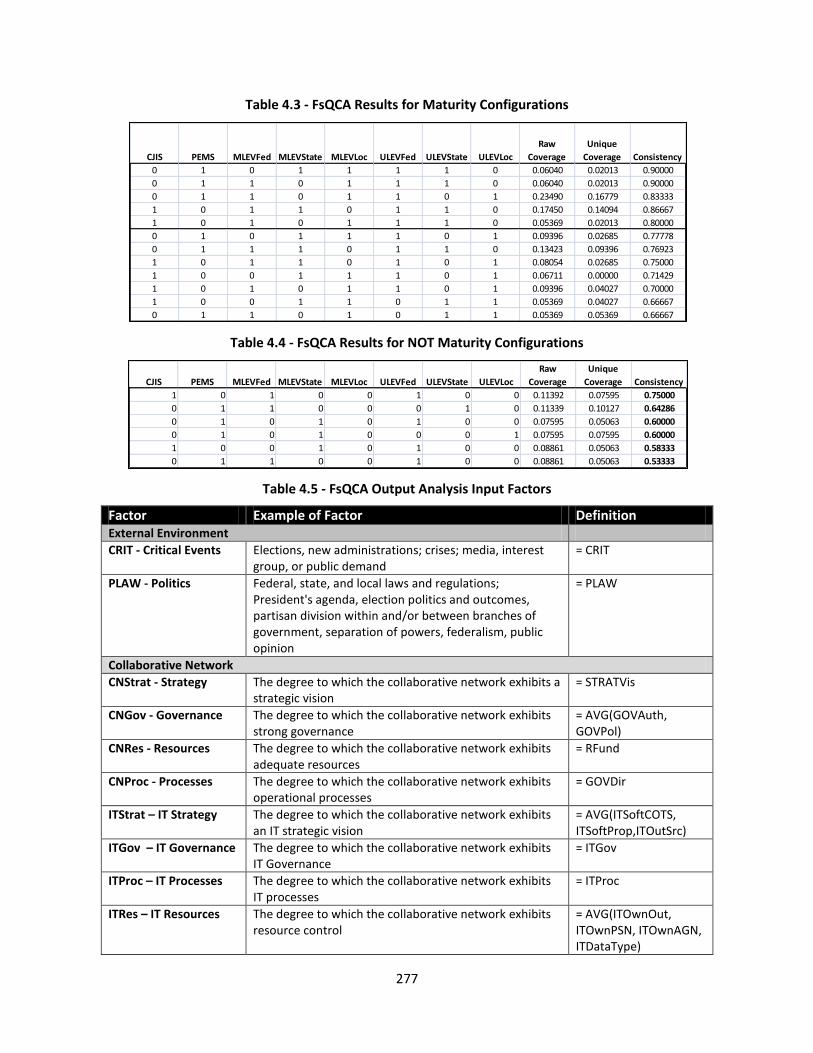
277
Table 4.3 - FsQCA Results for Maturity Configurations
Table 4.4 - FsQCA Results for NOT Maturity Configurations
Table 4.5 - FsQCA Output Analysis Input Factors
Factor Example of Factor Definition External Environment
CRIT - Critical Events Elections, new administrations; crises; media, interest group, or public demand
= CRIT
PLAW - Politics Federal, state, and local laws and regulations; President's agenda, election politics and outcomes, partisan division within and/or between branches of government, separation of powers, federalism, public opinion
= PLAW
Collaborative Network
CNStrat - Strategy The degree to which the collaborative network exhibits a strategic vision
= STRATVis
CNGov - Governance The degree to which the collaborative network exhibits strong governance
= AVG(GOVAuth, GOVPol)
CNRes - Resources The degree to which the collaborative network exhibits adequate resources
= RFund
CNProc - Processes The degree to which the collaborative network exhibits operational processes
= GOVDir
ITStrat – IT Strategy The degree to which the collaborative network exhibits an IT strategic vision
= AVG(ITSoftCOTS, ITSoftProp,ITOutSrc)
ITGov – IT Governance The degree to which the collaborative network exhibits IT Governance
= ITGov
ITProc – IT Processes The degree to which the collaborative network exhibits IT processes
= ITProc
ITRes – IT Resources The degree to which the collaborative network exhibits resource control
= AVG(ITOwnOut, ITOwnPSN, ITOwnAGN, ITDataType)
CJIS PEMS MLEVFed MLEVState MLEVLoc ULEVFed ULEVState ULEVLoc
Raw
Coverage
Unique
Coverage Consistency
0 1 0 1 1 1 1 0 0.06040 0.02013 0.90000
0 1 1 0 1 1 1 0 0.06040 0.02013 0.90000
0 1 1 0 1 1 0 1 0.23490 0.16779 0.83333
1 0 1 1 0 1 1 0 0.17450 0.14094 0.86667
1 0 1 0 1 1 1 0 0.05369 0.02013 0.80000
0 1 0 1 1 1 0 1 0.09396 0.02685 0.77778
0 1 1 1 0 1 1 0 0.13423 0.09396 0.76923
1 0 1 1 0 1 0 1 0.08054 0.02685 0.75000
1 0 0 1 1 1 0 1 0.06711 0.00000 0.71429
1 0 1 0 1 1 0 1 0.09396 0.04027 0.70000
1 0 0 1 1 0 1 1 0.05369 0.04027 0.66667
0 1 1 0 1 0 1 1 0.05369 0.05369 0.66667
CJIS PEMS MLEVFed MLEVState MLEVLoc ULEVFed ULEVState ULEVLoc
Raw
Coverage
Unique
Coverage Consistency
1 0 1 0 0 1 0 0 0.11392 0.07595 0.75000
0 1 1 0 0 0 1 0 0.11339 0.10127 0.64286
0 1 0 1 0 1 0 0 0.07595 0.05063 0.60000
0 1 0 1 0 0 0 1 0.07595 0.07595 0.60000
1 0 0 1 0 1 0 0 0.08861 0.05063 0.58333
0 1 1 0 0 1 0 0 0.08861 0.05063 0.53333
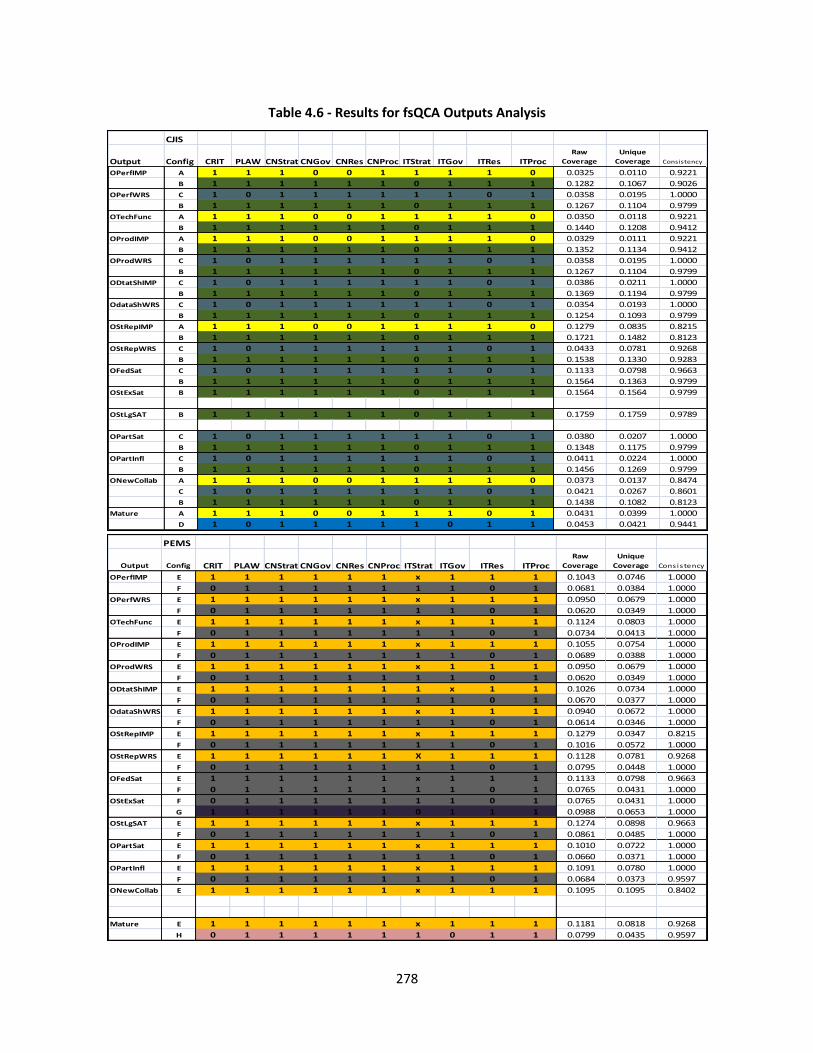
278
Table 4.6 - Results for fsQCA Outputs Analysis
CJIS
Output Config CRIT PLAW CNStrat CNGov CNRes CNProc ITStrat ITGov ITRes ITProcRaw
Coverage
Unique
Coverage Consistency
OPerfIMP A 1 1 1 0 0 1 1 1 1 0 0.0325 0.0110 0.9221
B 1 1 1 1 1 1 0 1 1 1 0.1282 0.1067 0.9026
OPerfWRS C 1 0 1 1 1 1 1 1 0 1 0.0358 0.0195 1.0000
B 1 1 1 1 1 1 0 1 1 1 0.1267 0.1104 0.9799
OTechFunc A 1 1 1 0 0 1 1 1 1 0 0.0350 0.0118 0.9221
B 1 1 1 1 1 1 0 1 1 1 0.1440 0.1208 0.9412
OProdIMP A 1 1 1 0 0 1 1 1 1 0 0.0329 0.0111 0.9221
B 1 1 1 1 1 1 0 1 1 1 0.1352 0.1134 0.9412
OProdWRS C 1 0 1 1 1 1 1 1 0 1 0.0358 0.0195 1.0000
B 1 1 1 1 1 1 0 1 1 1 0.1267 0.1104 0.9799
ODtatShIMP C 1 0 1 1 1 1 1 1 0 1 0.0386 0.0211 1.0000
B 1 1 1 1 1 1 0 1 1 1 0.1369 0.1194 0.9799
OdataShWRS C 1 0 1 1 1 1 1 1 0 1 0.0354 0.0193 1.0000
B 1 1 1 1 1 1 0 1 1 1 0.1254 0.1093 0.9799
OStRepIMP A 1 1 1 0 0 1 1 1 1 0 0.1279 0.0835 0.8215
B 1 1 1 1 1 1 0 1 1 1 0.1721 0.1482 0.8123
OStRepWRS C 1 0 1 1 1 1 1 1 0 1 0.0433 0.0781 0.9268
B 1 1 1 1 1 1 0 1 1 1 0.1538 0.1330 0.9283
OFedSat C 1 0 1 1 1 1 1 1 0 1 0.1133 0.0798 0.9663
B 1 1 1 1 1 1 0 1 1 1 0.1564 0.1363 0.9799
OStExSat B 1 1 1 1 1 1 0 1 1 1 0.1564 0.1564 0.9799
OStLgSAT B 1 1 1 1 1 1 0 1 1 1 0.1759 0.1759 0.9789
OPartSat C 1 0 1 1 1 1 1 1 0 1 0.0380 0.0207 1.0000
B 1 1 1 1 1 1 0 1 1 1 0.1348 0.1175 0.9799
OPartInfl C 1 0 1 1 1 1 1 1 0 1 0.0411 0.0224 1.0000
B 1 1 1 1 1 1 0 1 1 1 0.1456 0.1269 0.9799
ONewCollab A 1 1 1 0 0 1 1 1 1 0 0.0373 0.0137 0.8474
C 1 0 1 1 1 1 1 1 0 1 0.0421 0.0267 0.8601
B 1 1 1 1 1 1 0 1 1 1 0.1438 0.1082 0.8123
Mature A 1 1 1 0 0 1 1 1 0 1 0.0431 0.0399 1.0000
D 1 0 1 1 1 1 1 0 1 1 0.0453 0.0421 0.9441
PEMS
Output Config CRIT PLAW CNStrat CNGov CNRes CNProc ITStrat ITGov ITRes ITProcRaw
Coverage
Unique
Coverage Cons is tency
OPerfIMP E 1 1 1 1 1 1 x 1 1 1 0.1043 0.0746 1.0000
F 0 1 1 1 1 1 1 1 0 1 0.0681 0.0384 1.0000
OPerfWRS E 1 1 1 1 1 1 x 1 1 1 0.0950 0.0679 1.0000
F 0 1 1 1 1 1 1 1 0 1 0.0620 0.0349 1.0000
OTechFunc E 1 1 1 1 1 1 x 1 1 1 0.1124 0.0803 1.0000
F 0 1 1 1 1 1 1 1 0 1 0.0734 0.0413 1.0000
OProdIMP E 1 1 1 1 1 1 x 1 1 1 0.1055 0.0754 1.0000
F 0 1 1 1 1 1 1 1 0 1 0.0689 0.0388 1.0000
OProdWRS E 1 1 1 1 1 1 x 1 1 1 0.0950 0.0679 1.0000
F 0 1 1 1 1 1 1 1 0 1 0.0620 0.0349 1.0000
ODtatShIMP E 1 1 1 1 1 1 1 x 1 1 0.1026 0.0734 1.0000
F 0 1 1 1 1 1 1 1 0 1 0.0670 0.0377 1.0000
OdataShWRS E 1 1 1 1 1 1 x 1 1 1 0.0940 0.0672 1.0000
F 0 1 1 1 1 1 1 1 0 1 0.0614 0.0346 1.0000
OStRepIMP E 1 1 1 1 1 1 x 1 1 1 0.1279 0.0347 0.8215
F 0 1 1 1 1 1 1 1 0 1 0.1016 0.0572 1.0000
OStRepWRS E 1 1 1 1 1 1 X 1 1 1 0.1128 0.0781 0.9268
F 0 1 1 1 1 1 1 1 0 1 0.0795 0.0448 1.0000
OFedSat E 1 1 1 1 1 1 x 1 1 1 0.1133 0.0798 0.9663
F 0 1 1 1 1 1 1 1 0 1 0.0765 0.0431 1.0000
OStExSat F 0 1 1 1 1 1 1 1 0 1 0.0765 0.0431 1.0000
G 1 1 1 1 1 1 0 1 1 1 0.0988 0.0653 1.0000
OStLgSAT E 1 1 1 1 1 1 x 1 1 1 0.1274 0.0898 0.9663
F 0 1 1 1 1 1 1 1 0 1 0.0861 0.0485 1.0000
OPartSat E 1 1 1 1 1 1 x 1 1 1 0.1010 0.0722 1.0000
F 0 1 1 1 1 1 1 1 0 1 0.0660 0.0371 1.0000
OPartInfl E 1 1 1 1 1 1 x 1 1 1 0.1091 0.0780 1.0000
F 0 1 1 1 1 1 1 1 0 1 0.0684 0.0373 0.9597
ONewCollab E 1 1 1 1 1 1 x 1 1 1 0.1095 0.1095 0.8402
Mature E 1 1 1 1 1 1 x 1 1 1 0.1181 0.0818 0.9268
H 0 1 1 1 1 1 1 0 1 1 0.0799 0.0435 0.9597
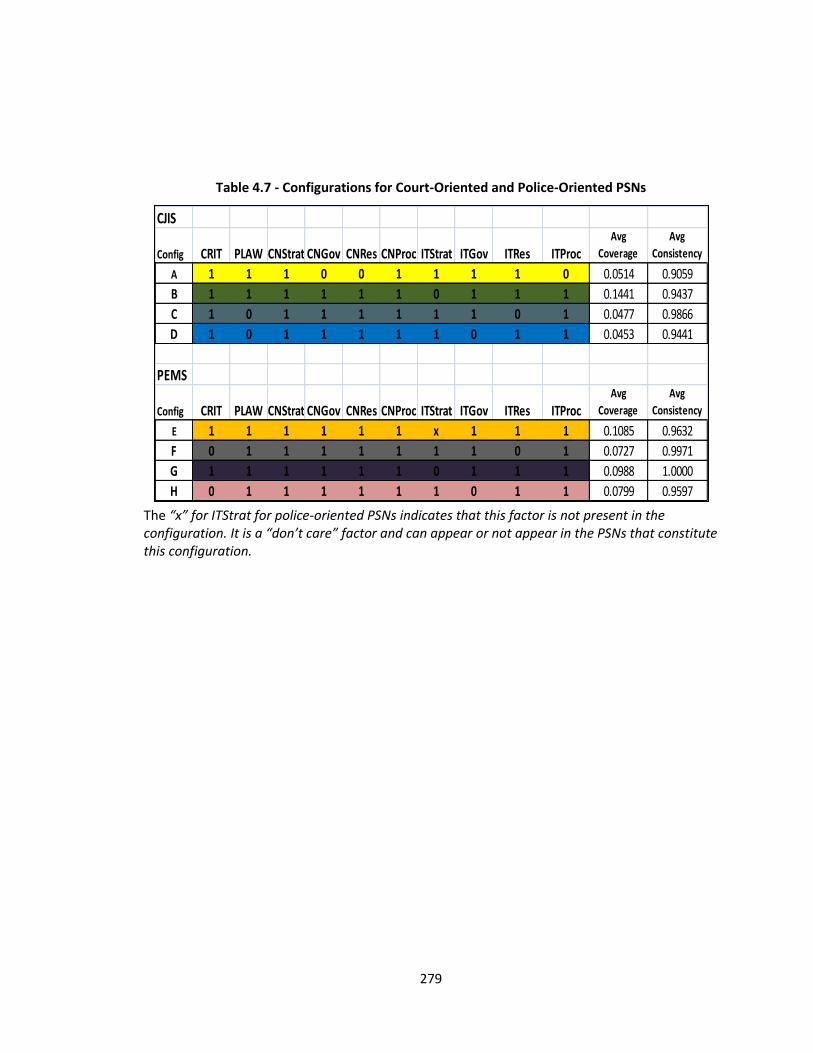
279
Table 4.7 - Configurations for Court-Oriented and Police-Oriented PSNs
The “x” for ITStrat for police-oriented PSNs indicates that this factor is not present in the configuration. It is a “don’t care” factor and can appear or not appear in the PSNs that constitute this configuration.
CJIS
Config CRIT PLAW CNStrat CNGov CNRes CNProc ITStrat ITGov ITRes ITProcAvg
Coverage
Avg
Consistency
A 1 1 1 0 0 1 1 1 1 0 0.0514 0.9059
B 1 1 1 1 1 1 0 1 1 1 0.1441 0.9437
C 1 0 1 1 1 1 1 1 0 1 0.0477 0.9866
D 1 0 1 1 1 1 1 0 1 1 0.0453 0.9441
PEMS
Config CRIT PLAW CNStrat CNGov CNRes CNProc ITStrat ITGov ITRes ITProcAvg
Coverage
Avg
Consistency
E 1 1 1 1 1 1 x 1 1 1 0.1085 0.9632
F 0 1 1 1 1 1 1 1 0 1 0.0727 0.9971
G 1 1 1 1 1 1 0 1 1 1 0.0988 1.0000
H 0 1 1 1 1 1 1 0 1 1 0.0799 0.9597
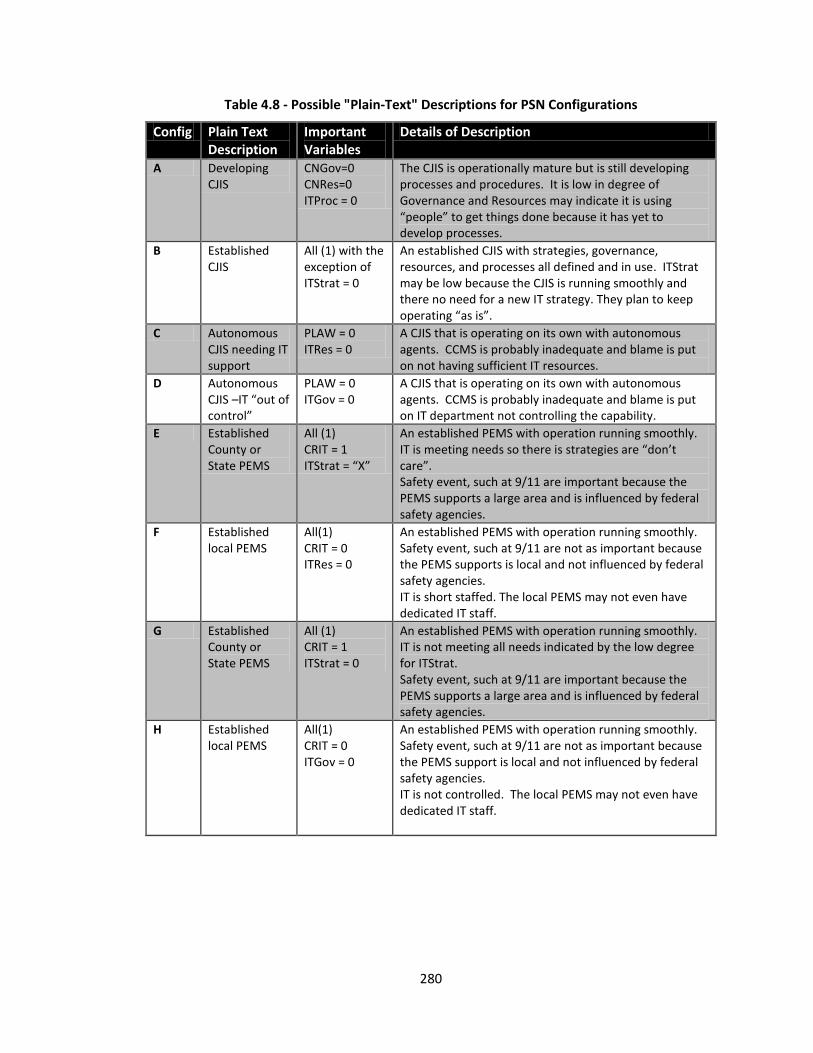
280
Table 4.8 - Possible "Plain-Text" Descriptions for PSN Configurations
Config Plain Text Description
Important Variables
Details of Description
A Developing CJIS
CNGov=0 CNRes=0 ITProc = 0
The CJIS is operationally mature but is still developing processes and procedures. It is low in degree of Governance and Resources may indicate it is using “people” to get things done because it has yet to develop processes.
B Established CJIS
All (1) with the exception of ITStrat = 0
An established CJIS with strategies, governance, resources, and processes all defined and in use. ITStrat may be low because the CJIS is running smoothly and there no need for a new IT strategy. They plan to keep operating “as is”.
C Autonomous CJIS needing IT support
PLAW = 0 ITRes = 0
A CJIS that is operating on its own with autonomous agents. CCMS is probably inadequate and blame is put on not having sufficient IT resources.
D Autonomous CJIS –IT “out of control”
PLAW = 0 ITGov = 0
A CJIS that is operating on its own with autonomous agents. CCMS is probably inadequate and blame is put on IT department not controlling the capability.
E Established County or State PEMS
All (1) CRIT = 1 ITStrat = “X”
An established PEMS with operation running smoothly. IT is meeting needs so there is strategies are “don’t care”. Safety event, such at 9/11 are important because the PEMS supports a large area and is influenced by federal safety agencies.
F Established local PEMS
All(1) CRIT = 0 ITRes = 0
An established PEMS with operation running smoothly. Safety event, such at 9/11 are not as important because the PEMS supports is local and not influenced by federal safety agencies. IT is short staffed. The local PEMS may not even have dedicated IT staff.
G Established County or State PEMS
All (1) CRIT = 1 ITStrat = 0
An established PEMS with operation running smoothly. IT is not meeting all needs indicated by the low degree for ITStrat. Safety event, such at 9/11 are important because the PEMS supports a large area and is influenced by federal safety agencies.
H Established local PEMS
All(1) CRIT = 0 ITGov = 0
An established PEMS with operation running smoothly. Safety event, such at 9/11 are not as important because the PEMS support is local and not influenced by federal safety agencies. IT is not controlled. The local PEMS may not even have dedicated IT staff.
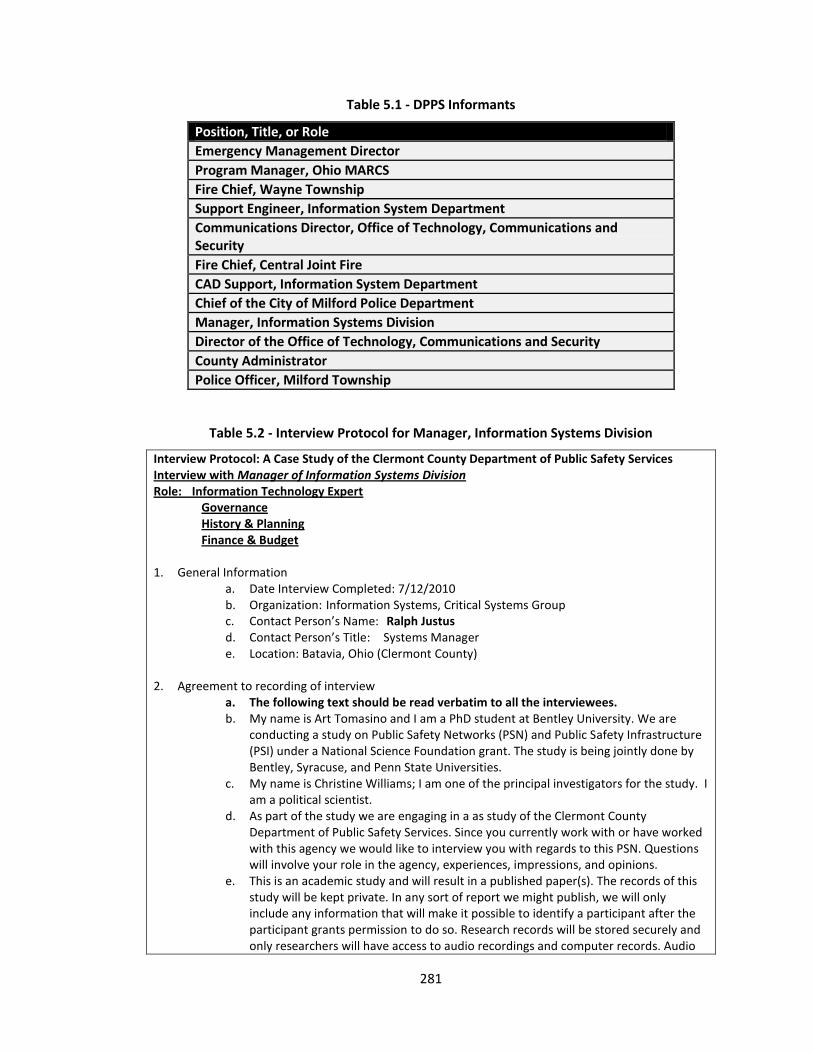
281
Table 5.1 - DPPS Informants
Position, Title, or Role
Emergency Management Director
Program Manager, Ohio MARCS
Fire Chief, Wayne Township
Support Engineer, Information System Department
Communications Director, Office of Technology, Communications and Security
Fire Chief, Central Joint Fire
CAD Support, Information System Department
Chief of the City of Milford Police Department
Manager, Information Systems Division
Director of the Office of Technology, Communications and Security
County Administrator
Police Officer, Milford Township
Table 5.2 - Interview Protocol for Manager, Information Systems Division
Interview Protocol: A Case Study of the Clermont County Department of Public Safety Services Interview with Manager of Information Systems Division Role: Information Technology Expert
Governance History & Planning Finance & Budget
1. General Information
a. Date Interview Completed: 7/12/2010 b. Organization: Information Systems, Critical Systems Group c. Contact Person’s Name: Ralph Justus d. Contact Person’s Title: Systems Manager e. Location: Batavia, Ohio (Clermont County)
2. Agreement to recording of interview a. The following text should be read verbatim to all the interviewees. b. My name is Art Tomasino and I am a PhD student at Bentley University. We are
conducting a study on Public Safety Networks (PSN) and Public Safety Infrastructure (PSI) under a National Science Foundation grant. The study is being jointly done by Bentley, Syracuse, and Penn State Universities.
c. My name is Christine Williams; I am one of the principal investigators for the study. I am a political scientist.
d. As part of the study we are engaging in a as study of the Clermont County Department of Public Safety Services. Since you currently work with or have worked with this agency we would like to interview you with regards to this PSN. Questions will involve your role in the agency, experiences, impressions, and opinions.
e. This is an academic study and will result in a published paper(s). The records of this study will be kept private. In any sort of report we might publish, we will only include any information that will make it possible to identify a participant after the participant grants permission to do so. Research records will be stored securely and only researchers will have access to audio recordings and computer records. Audio
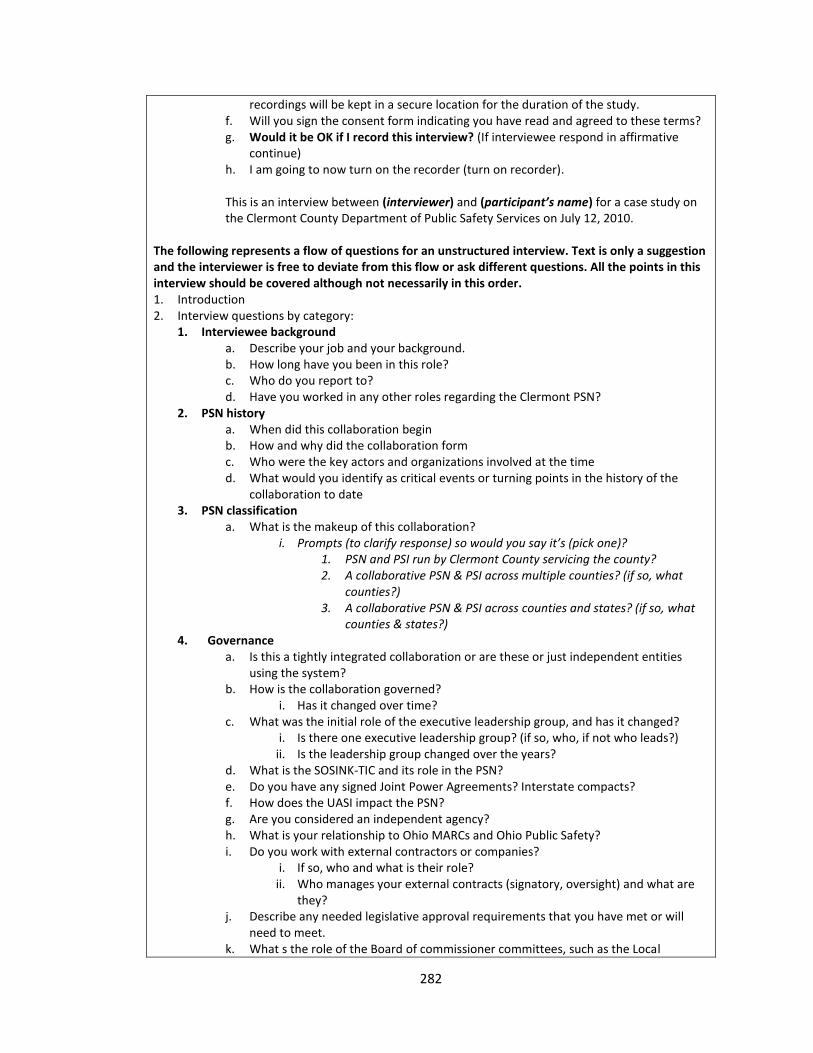
282
recordings will be kept in a secure location for the duration of the study. f. Will you sign the consent form indicating you have read and agreed to these terms? g. Would it be OK if I record this interview? (If interviewee respond in affirmative
continue) h. I am going to now turn on the recorder (turn on recorder).
This is an interview between (interviewer) and (participant’s name) for a case study on the Clermont County Department of Public Safety Services on July 12, 2010.
The following represents a flow of questions for an unstructured interview. Text is only a suggestion and the interviewer is free to deviate from this flow or ask different questions. All the points in this interview should be covered although not necessarily in this order. 1. Introduction 2. Interview questions by category:
1. Interviewee background a. Describe your job and your background. b. How long have you been in this role? c. Who do you report to? d. Have you worked in any other roles regarding the Clermont PSN?
2. PSN history a. When did this collaboration begin b. How and why did the collaboration form c. Who were the key actors and organizations involved at the time d. What would you identify as critical events or turning points in the history of the
collaboration to date 3. PSN classification
a. What is the makeup of this collaboration? i. Prompts (to clarify response) so would you say it’s (pick one)?
1. PSN and PSI run by Clermont County servicing the county? 2. A collaborative PSN & PSI across multiple counties? (if so, what
counties?) 3. A collaborative PSN & PSI across counties and states? (if so, what
counties & states?) 4. Governance
a. Is this a tightly integrated collaboration or are these or just independent entities using the system?
b. How is the collaboration governed? i. Has it changed over time?
c. What was the initial role of the executive leadership group, and has it changed? i. Is there one executive leadership group? (if so, who, if not who leads?)
ii. Is the leadership group changed over the years? d. What is the SOSINK-TIC and its role in the PSN? e. Do you have any signed Joint Power Agreements? Interstate compacts? f. How does the UASI impact the PSN? g. Are you considered an independent agency? h. What is your relationship to Ohio MARCs and Ohio Public Safety? i. Do you work with external contractors or companies?
i. If so, who and what is their role? ii. Who manages your external contracts (signatory, oversight) and what are
they? j. Describe any needed legislative approval requirements that you have met or will
need to meet. k. What s the role of the Board of commissioner committees, such as the Local
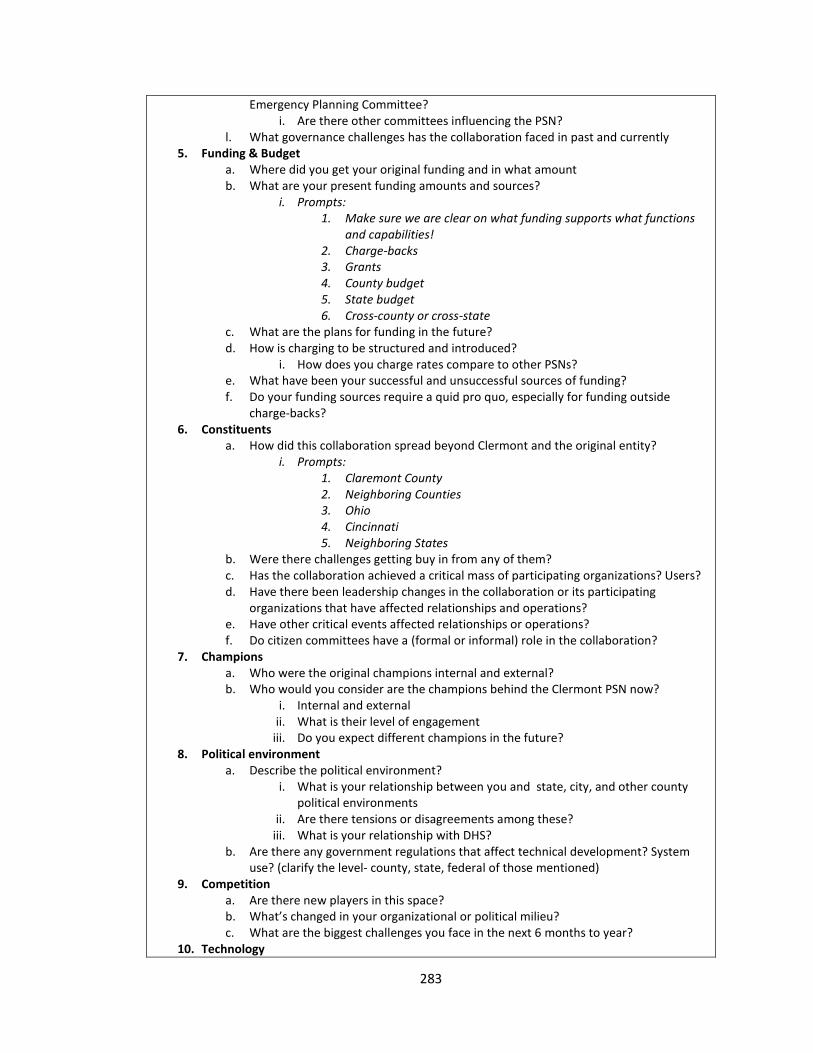
283
Emergency Planning Committee? i. Are there other committees influencing the PSN?
l. What governance challenges has the collaboration faced in past and currently 5. Funding & Budget
a. Where did you get your original funding and in what amount b. What are your present funding amounts and sources?
i. Prompts: 1. Make sure we are clear on what funding supports what functions
and capabilities! 2. Charge-backs 3. Grants 4. County budget 5. State budget 6. Cross-county or cross-state
c. What are the plans for funding in the future? d. How is charging to be structured and introduced?
i. How does you charge rates compare to other PSNs? e. What have been your successful and unsuccessful sources of funding? f. Do your funding sources require a quid pro quo, especially for funding outside
charge-backs? 6. Constituents
a. How did this collaboration spread beyond Clermont and the original entity? i. Prompts:
1. Claremont County 2. Neighboring Counties 3. Ohio 4. Cincinnati 5. Neighboring States
b. Were there challenges getting buy in from any of them? c. Has the collaboration achieved a critical mass of participating organizations? Users? d. Have there been leadership changes in the collaboration or its participating
organizations that have affected relationships and operations? e. Have other critical events affected relationships or operations? f. Do citizen committees have a (formal or informal) role in the collaboration?
7. Champions a. Who were the original champions internal and external? b. Who would you consider are the champions behind the Clermont PSN now?
i. Internal and external ii. What is their level of engagement
iii. Do you expect different champions in the future? 8. Political environment
a. Describe the political environment? i. What is your relationship between you and state, city, and other county
political environments ii. Are there tensions or disagreements among these?
iii. What is your relationship with DHS? b. Are there any government regulations that affect technical development? System
use? (clarify the level- county, state, federal of those mentioned) 9. Competition
a. Are there new players in this space? b. What’s changed in your organizational or political milieu? c. What are the biggest challenges you face in the next 6 months to year?
10. Technology
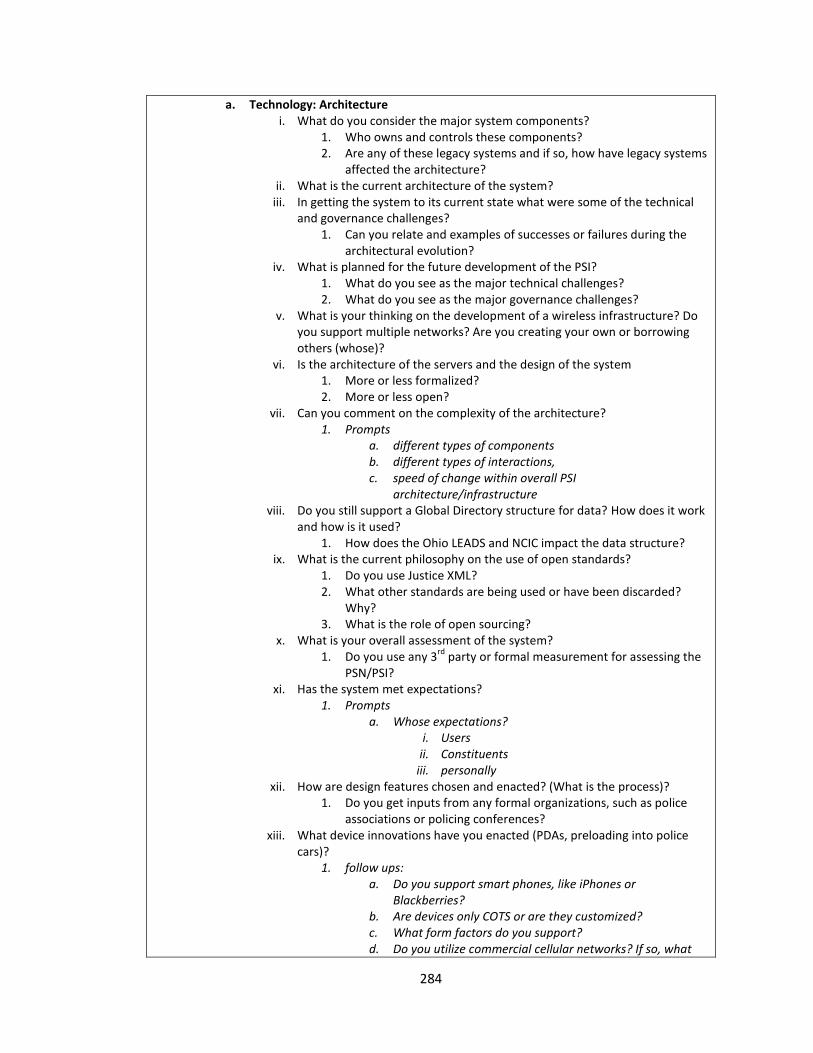
284
a. Technology: Architecture i. What do you consider the major system components?
1. Who owns and controls these components? 2. Are any of these legacy systems and if so, how have legacy systems
affected the architecture? ii. What is the current architecture of the system?
iii. In getting the system to its current state what were some of the technical and governance challenges?
1. Can you relate and examples of successes or failures during the architectural evolution?
iv. What is planned for the future development of the PSI? 1. What do you see as the major technical challenges? 2. What do you see as the major governance challenges?
v. What is your thinking on the development of a wireless infrastructure? Do you support multiple networks? Are you creating your own or borrowing others (whose)?
vi. Is the architecture of the servers and the design of the system 1. More or less formalized? 2. More or less open?
vii. Can you comment on the complexity of the architecture? 1. Prompts
a. different types of components b. different types of interactions, c. speed of change within overall PSI
architecture/infrastructure viii. Do you still support a Global Directory structure for data? How does it work
and how is it used? 1. How does the Ohio LEADS and NCIC impact the data structure?
ix. What is the current philosophy on the use of open standards? 1. Do you use Justice XML? 2. What other standards are being used or have been discarded?
Why? 3. What is the role of open sourcing?
x. What is your overall assessment of the system? 1. Do you use any 3
rd party or formal measurement for assessing the
PSN/PSI? xi. Has the system met expectations?
1. Prompts a. Whose expectations?
i. Users ii. Constituents
iii. personally xii. How are design features chosen and enacted? (What is the process)?
1. Do you get inputs from any formal organizations, such as police associations or policing conferences?
xiii. What device innovations have you enacted (PDAs, preloading into police cars)?
1. follow ups: a. Do you support smart phones, like iPhones or
Blackberries? b. Are devices only COTS or are they customized? c. What form factors do you support? d. Do you utilize commercial cellular networks? If so, what
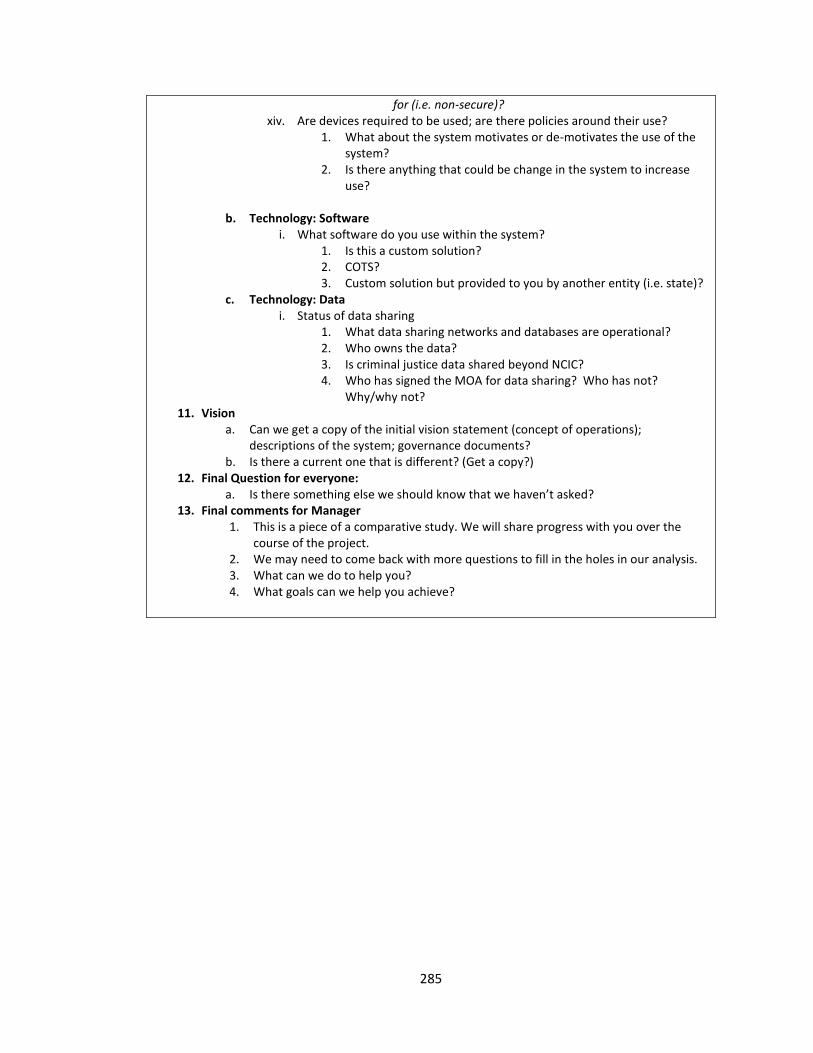
285
for (i.e. non-secure)? xiv. Are devices required to be used; are there policies around their use?
1. What about the system motivates or de-motivates the use of the system?
2. Is there anything that could be change in the system to increase use?
b. Technology: Software
i. What software do you use within the system? 1. Is this a custom solution? 2. COTS? 3. Custom solution but provided to you by another entity (i.e. state)?
c. Technology: Data i. Status of data sharing
1. What data sharing networks and databases are operational? 2. Who owns the data? 3. Is criminal justice data shared beyond NCIC? 4. Who has signed the MOA for data sharing? Who has not?
Why/why not? 11. Vision
a. Can we get a copy of the initial vision statement (concept of operations); descriptions of the system; governance documents?
b. Is there a current one that is different? (Get a copy?) 12. Final Question for everyone:
a. Is there something else we should know that we haven’t asked? 13. Final comments for Manager
1. This is a piece of a comparative study. We will share progress with you over the course of the project.
2. We may need to come back with more questions to fill in the holes in our analysis. 3. What can we do to help you? 4. What goals can we help you achieve?
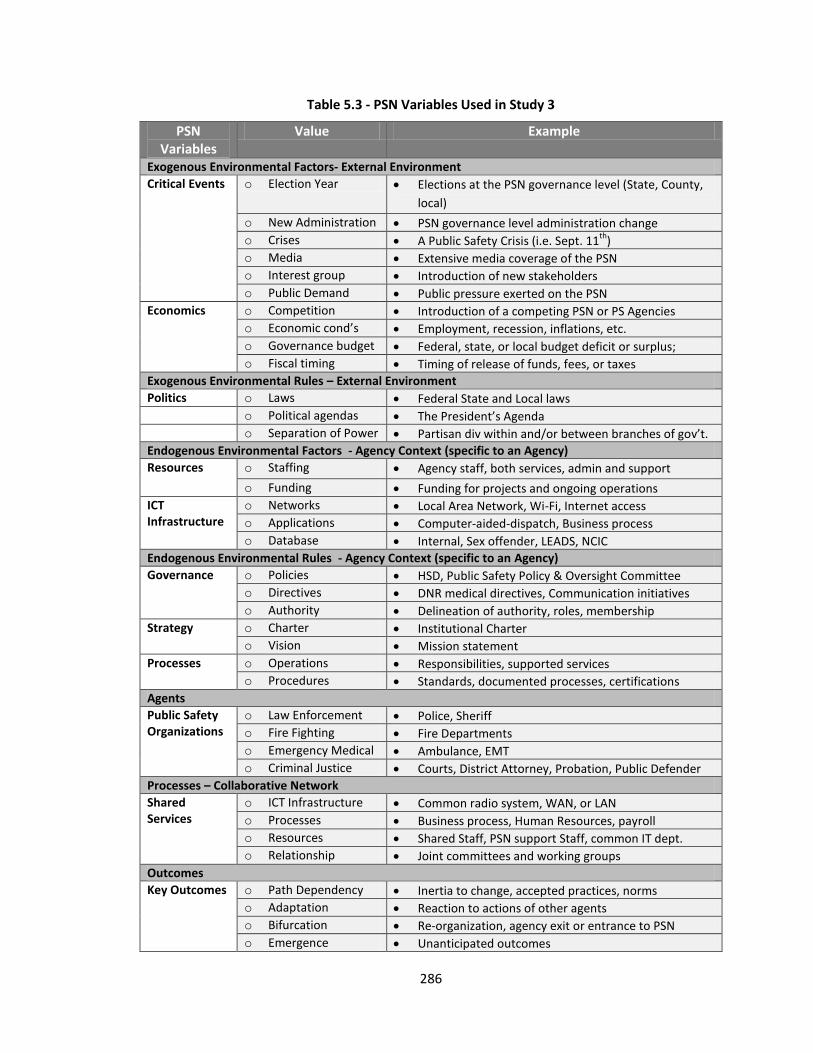
286
Table 5.3 - PSN Variables Used in Study 3
PSN Variables
Value Example
Exogenous Environmental Factors- External Environment
Critical Events o Election Year Elections at the PSN governance level (State, County,
local)
o New Administration PSN governance level administration change
o Crises A Public Safety Crisis (i.e. Sept. 11th
)
o Media Extensive media coverage of the PSN
o Interest group Introduction of new stakeholders
o Public Demand Public pressure exerted on the PSN
Economics o Competition Introduction of a competing PSN or PS Agencies
o Economic cond’s Employment, recession, inflations, etc.
o Governance budget Federal, state, or local budget deficit or surplus;
o Fiscal timing Timing of release of funds, fees, or taxes
Exogenous Environmental Rules – External Environment
Politics o Laws Federal State and Local laws
o Political agendas The President’s Agenda
o Separation of Power Partisan div within and/or between branches of gov’t.
Endogenous Environmental Factors - Agency Context (specific to an Agency)
Resources o Staffing Agency staff, both services, admin and support
o Funding Funding for projects and ongoing operations
ICT Infrastructure
o Networks Local Area Network, Wi-Fi, Internet access
o Applications Computer-aided-dispatch, Business process
o Database Internal, Sex offender, LEADS, NCIC
Endogenous Environmental Rules - Agency Context (specific to an Agency)
Governance o Policies HSD, Public Safety Policy & Oversight Committee
o Directives DNR medical directives, Communication initiatives
o Authority Delineation of authority, roles, membership
Strategy o Charter Institutional Charter
o Vision Mission statement
Processes o Operations Responsibilities, supported services
o Procedures Standards, documented processes, certifications
Agents
Public Safety Organizations
o Law Enforcement Police, Sheriff
o Fire Fighting Fire Departments
o Emergency Medical Ambulance, EMT
o Criminal Justice Courts, District Attorney, Probation, Public Defender
Processes – Collaborative Network
Shared Services
o ICT Infrastructure Common radio system, WAN, or LAN
o Processes Business process, Human Resources, payroll
o Resources Shared Staff, PSN support Staff, common IT dept.
o Relationship Joint committees and working groups
Outcomes
Key Outcomes o Path Dependency Inertia to change, accepted practices, norms
o Adaptation Reaction to actions of other agents
o Bifurcation Re-organization, agency exit or entrance to PSN
o Emergence Unanticipated outcomes
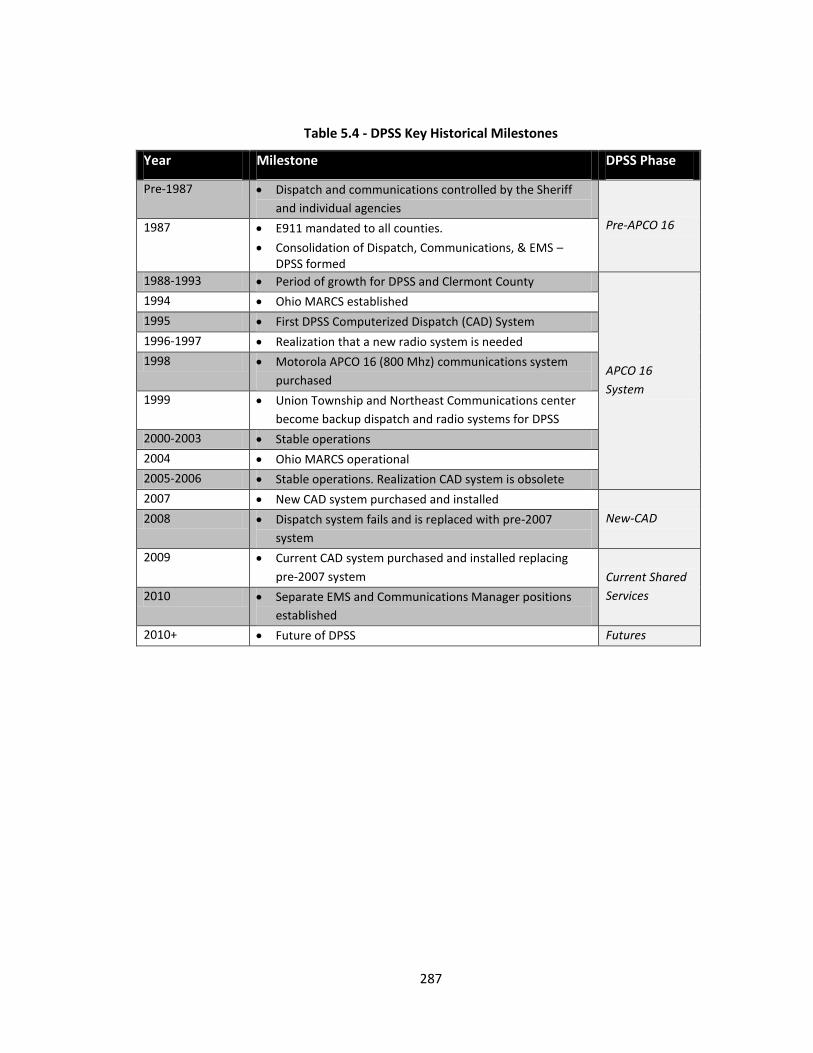
287
Table 5.4 - DPSS Key Historical Milestones
Year Milestone DPSS Phase
Pre-1987 Dispatch and communications controlled by the Sheriff
and individual agencies
Pre-APCO 16 1987 E911 mandated to all counties.
Consolidation of Dispatch, Communications, & EMS – DPSS formed
1988-1993 Period of growth for DPSS and Clermont County
APCO 16
System
1994 Ohio MARCS established
1995 First DPSS Computerized Dispatch (CAD) System
1996-1997 Realization that a new radio system is needed
1998 Motorola APCO 16 (800 Mhz) communications system
purchased
1999 Union Township and Northeast Communications center
become backup dispatch and radio systems for DPSS
2000-2003 Stable operations
2004 Ohio MARCS operational
2005-2006 Stable operations. Realization CAD system is obsolete
2007 New CAD system purchased and installed
New-CAD 2008 Dispatch system fails and is replaced with pre-2007
system
2009 Current CAD system purchased and installed replacing
pre-2007 system Current Shared
Services 2010 Separate EMS and Communications Manager positions
established
2010+ Future of DPSS Futures
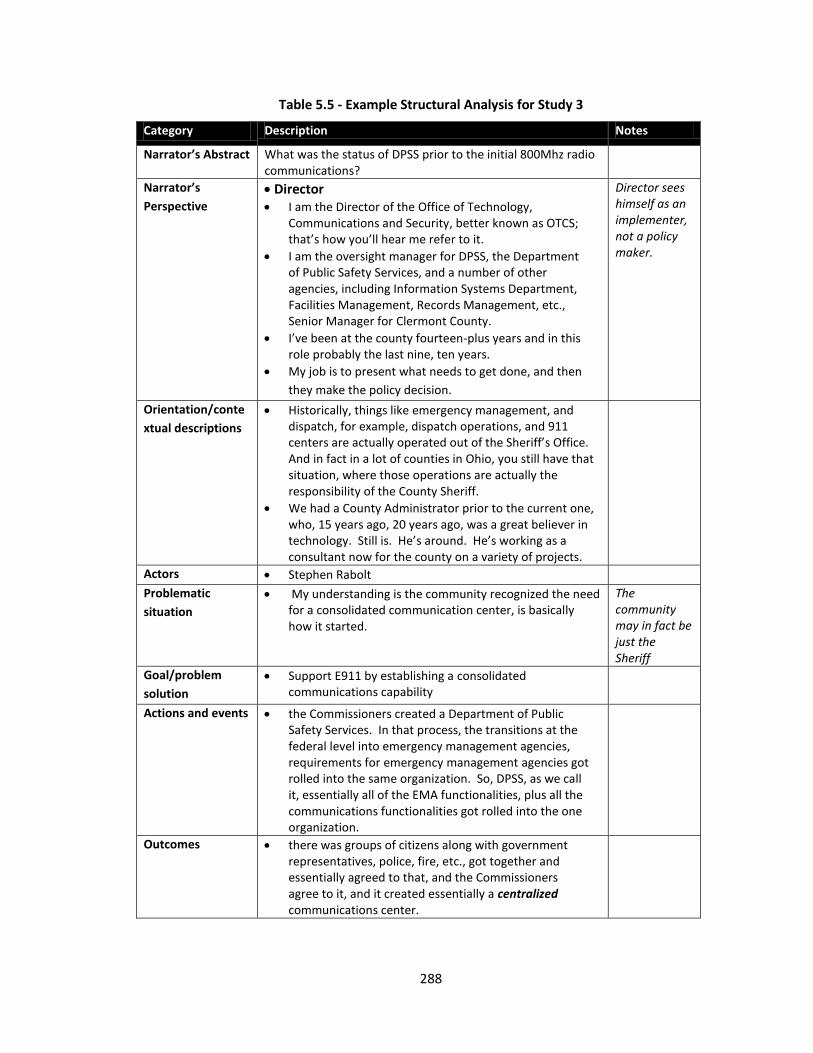
288
Table 5.5 - Example Structural Analysis for Study 3
Category Description Notes
Narrator’s Abstract What was the status of DPSS prior to the initial 800Mhz radio communications?
Narrator’s
Perspective
Director I am the Director of the Office of Technology,
Communications and Security, better known as OTCS; that’s how you’ll hear me refer to it.
I am the oversight manager for DPSS, the Department of Public Safety Services, and a number of other agencies, including Information Systems Department, Facilities Management, Records Management, etc., Senior Manager for Clermont County.
I’ve been at the county fourteen-plus years and in this role probably the last nine, ten years.
My job is to present what needs to get done, and then
they make the policy decision.
Director sees himself as an implementer, not a policy maker.
Orientation/conte
xtual descriptions
Historically, things like emergency management, and dispatch, for example, dispatch operations, and 911 centers are actually operated out of the Sheriff’s Office. And in fact in a lot of counties in Ohio, you still have that situation, where those operations are actually the responsibility of the County Sheriff.
We had a County Administrator prior to the current one, who, 15 years ago, 20 years ago, was a great believer in technology. Still is. He’s around. He’s working as a consultant now for the county on a variety of projects.
Actors Stephen Rabolt
Problematic
situation
My understanding is the community recognized the need for a consolidated communication center, is basically how it started.
The community may in fact be just the Sheriff
Goal/problem
solution
Support E911 by establishing a consolidated communications capability
Actions and events the Commissioners created a Department of Public Safety Services. In that process, the transitions at the federal level into emergency management agencies, requirements for emergency management agencies got rolled into the same organization. So, DPSS, as we call it, essentially all of the EMA functionalities, plus all the communications functionalities got rolled into the one organization.
Outcomes there was groups of citizens along with government representatives, police, fire, etc., got together and essentially agreed to that, and the Commissioners agree to it, and it created essentially a centralized communications center.
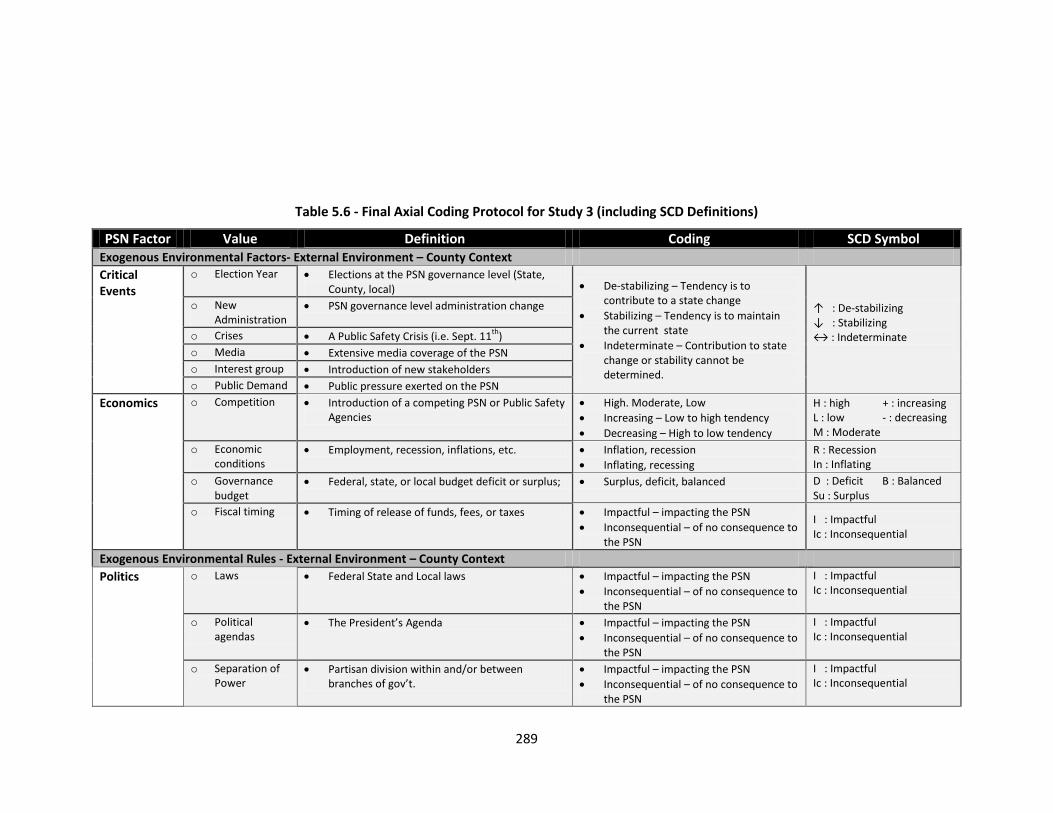
289
Table 5.6 - Final Axial Coding Protocol for Study 3 (including SCD Definitions)
PSN Factor Value Definition Coding SCD Symbol Exogenous Environmental Factors- External Environment – County Context
Critical Events
o Election Year Elections at the PSN governance level (State, County, local) De-stabilizing – Tendency is to
contribute to a state change
Stabilizing – Tendency is to maintain the current state
Indeterminate – Contribution to state change or stability cannot be determined.
↑ : De-stabilizing ↓ : Stabilizing ↔ : Indeterminate
o New Administration
PSN governance level administration change
o Crises A Public Safety Crisis (i.e. Sept. 11th
)
o Media Extensive media coverage of the PSN
o Interest group Introduction of new stakeholders
o Public Demand Public pressure exerted on the PSN
Economics o Competition Introduction of a competing PSN or Public Safety Agencies
High. Moderate, Low
Increasing – Low to high tendency
Decreasing – High to low tendency
H : high + : increasing L : low - : decreasing M : Moderate
o Economic conditions
Employment, recession, inflations, etc. Inflation, recession
Inflating, recessing
R : Recession In : Inflating
o Governance budget
Federal, state, or local budget deficit or surplus; Surplus, deficit, balanced D : Deficit B : Balanced Su : Surplus
o Fiscal timing Timing of release of funds, fees, or taxes Impactful – impacting the PSN
Inconsequential – of no consequence to the PSN
I : Impactful Ic : Inconsequential
Exogenous Environmental Rules - External Environment – County Context
Politics o Laws Federal State and Local laws Impactful – impacting the PSN
Inconsequential – of no consequence to the PSN
I : Impactful Ic : Inconsequential
o Political agendas
The President’s Agenda Impactful – impacting the PSN
Inconsequential – of no consequence to the PSN
I : Impactful Ic : Inconsequential
o Separation of Power
Partisan division within and/or between branches of gov’t.
Impactful – impacting the PSN
Inconsequential – of no consequence to the PSN
I : Impactful Ic : Inconsequential
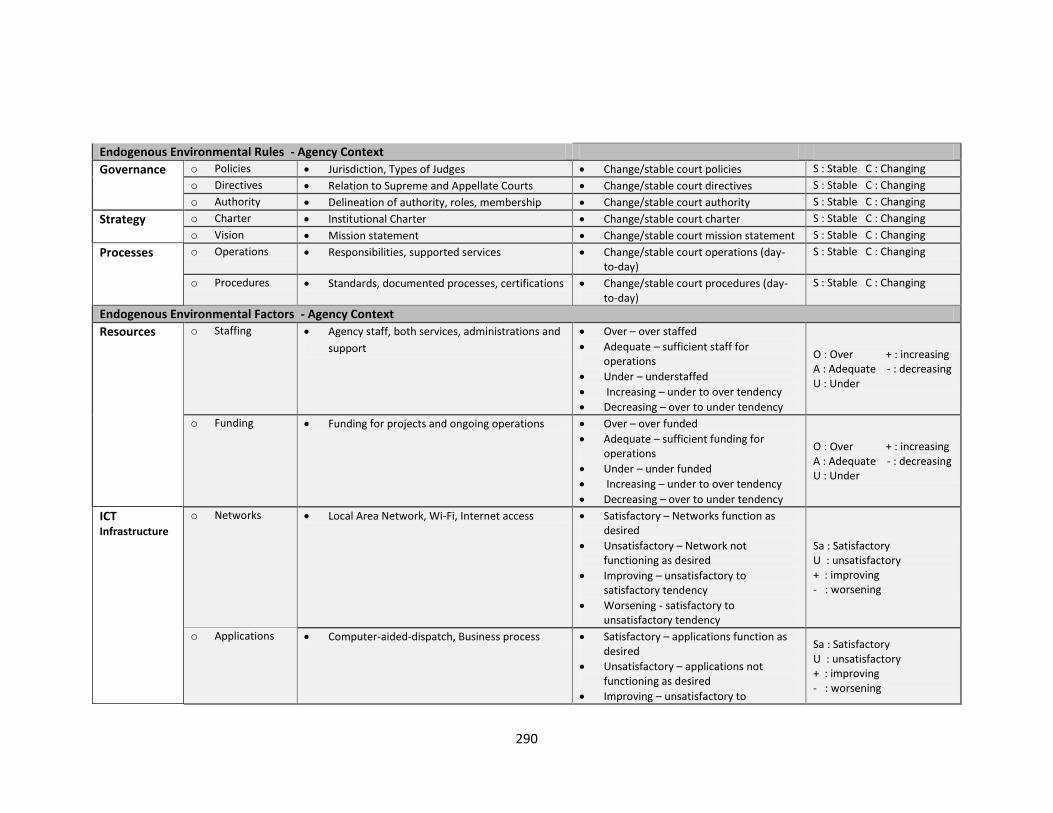
290
Endogenous Environmental Rules - Agency Context
Governance o Policies Jurisdiction, Types of Judges Change/stable court policies S : Stable C : Changing
o Directives Relation to Supreme and Appellate Courts Change/stable court directives S : Stable C : Changing
o Authority Delineation of authority, roles, membership Change/stable court authority S : Stable C : Changing
Strategy o Charter Institutional Charter Change/stable court charter S : Stable C : Changing
o Vision Mission statement Change/stable court mission statement S : Stable C : Changing
Processes o Operations Responsibilities, supported services Change/stable court operations (day-to-day)
S : Stable C : Changing
o Procedures Standards, documented processes, certifications Change/stable court procedures (day-to-day)
S : Stable C : Changing
Endogenous Environmental Factors - Agency Context
Resources o Staffing Agency staff, both services, administrations and
support
Over – over staffed
Adequate – sufficient staff for operations
Under – understaffed
Increasing – under to over tendency
Decreasing – over to under tendency
O : Over + : increasing A : Adequate - : decreasing U : Under
o Funding Funding for projects and ongoing operations Over – over funded
Adequate – sufficient funding for operations
Under – under funded
Increasing – under to over tendency
Decreasing – over to under tendency
O : Over + : increasing A : Adequate - : decreasing U : Under
ICT Infrastructure
o Networks Local Area Network, Wi-Fi, Internet access Satisfactory – Networks function as desired
Unsatisfactory – Network not functioning as desired
Improving – unsatisfactory to satisfactory tendency
Worsening - satisfactory to unsatisfactory tendency
Sa : Satisfactory U : unsatisfactory + : improving - : worsening
o Applications Computer-aided-dispatch, Business process Satisfactory – applications function as desired
Unsatisfactory – applications not functioning as desired
Improving – unsatisfactory to
Sa : Satisfactory U : unsatisfactory + : improving - : worsening
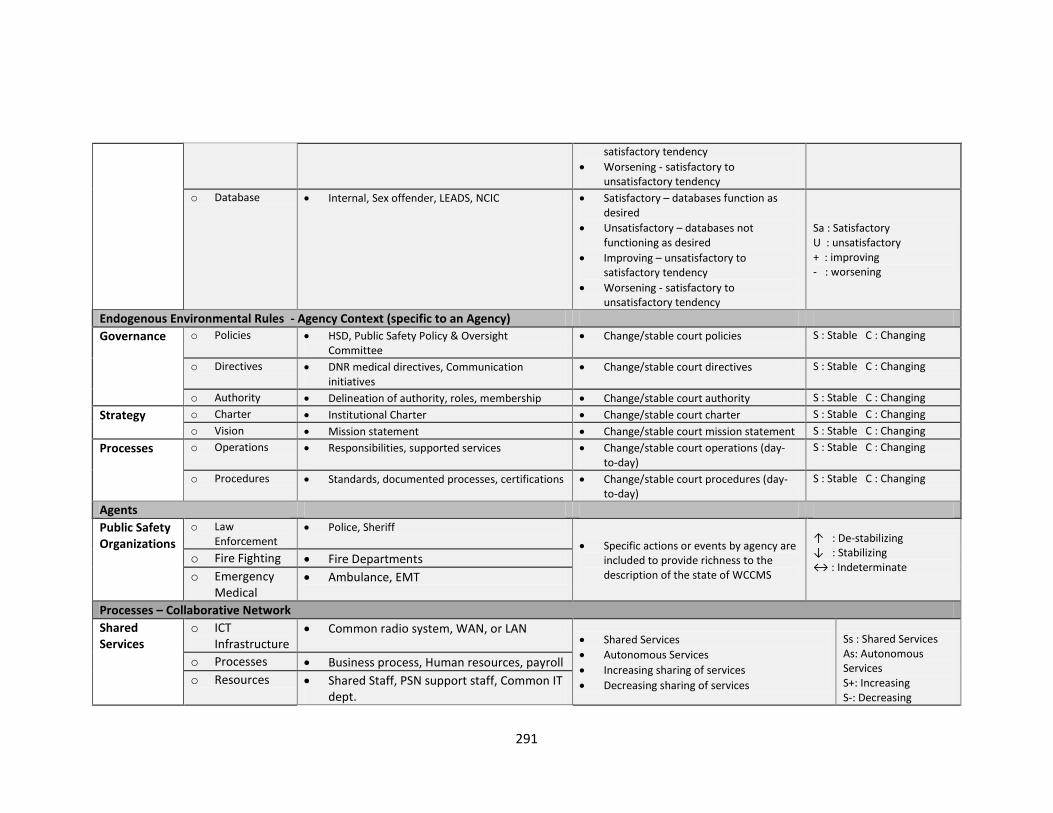
291
satisfactory tendency
Worsening - satisfactory to unsatisfactory tendency
o Database Internal, Sex offender, LEADS, NCIC Satisfactory – databases function as desired
Unsatisfactory – databases not functioning as desired
Improving – unsatisfactory to satisfactory tendency
Worsening - satisfactory to unsatisfactory tendency
Sa : Satisfactory U : unsatisfactory + : improving - : worsening
Endogenous Environmental Rules - Agency Context (specific to an Agency)
Governance o Policies HSD, Public Safety Policy & Oversight Committee
Change/stable court policies S : Stable C : Changing
o Directives DNR medical directives, Communication initiatives
Change/stable court directives S : Stable C : Changing
o Authority Delineation of authority, roles, membership Change/stable court authority S : Stable C : Changing
Strategy o Charter Institutional Charter Change/stable court charter S : Stable C : Changing
o Vision Mission statement Change/stable court mission statement S : Stable C : Changing
Processes o Operations Responsibilities, supported services Change/stable court operations (day-to-day)
S : Stable C : Changing
o Procedures Standards, documented processes, certifications Change/stable court procedures (day-to-day)
S : Stable C : Changing
Agents
Public Safety Organizations
o Law Enforcement
Police, Sheriff
Specific actions or events by agency are included to provide richness to the description of the state of WCCMS
↑ : De-stabilizing ↓ : Stabilizing ↔ : Indeterminate
o Fire Fighting Fire Departments
o Emergency Medical
Ambulance, EMT
Processes – Collaborative Network
Shared Services
o ICT Infrastructure
Common radio system, WAN, or LAN Shared Services
Autonomous Services
Increasing sharing of services
Decreasing sharing of services
Ss : Shared Services As: Autonomous Services S+: Increasing S-: Decreasing
o Processes Business process, Human resources, payroll
o Resources Shared Staff, PSN support staff, Common IT dept.
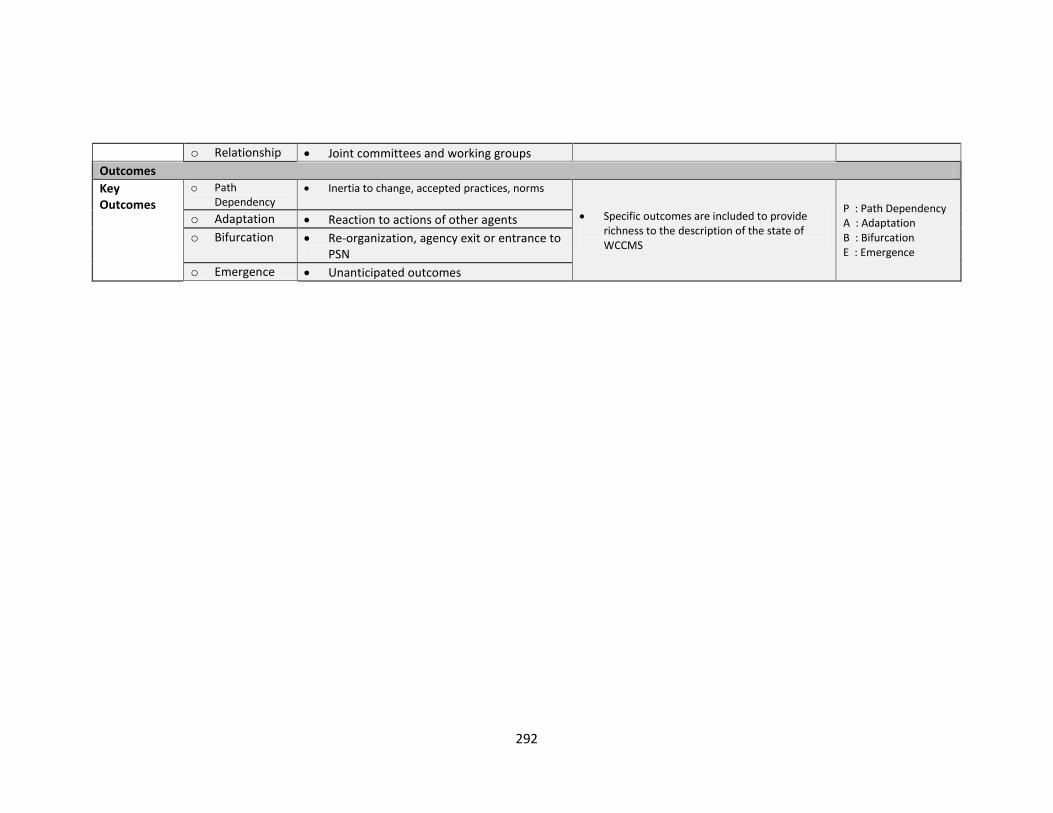
292
o Relationship Joint committees and working groups
Outcomes
Key Outcomes
o Path Dependency
Inertia to change, accepted practices, norms
Specific outcomes are included to provide richness to the description of the state of WCCMS
P : Path Dependency A : Adaptation B : Bifurcation E : Emergence
o Adaptation Reaction to actions of other agents
o Bifurcation Re-organization, agency exit or entrance to PSN
o Emergence Unanticipated outcomes
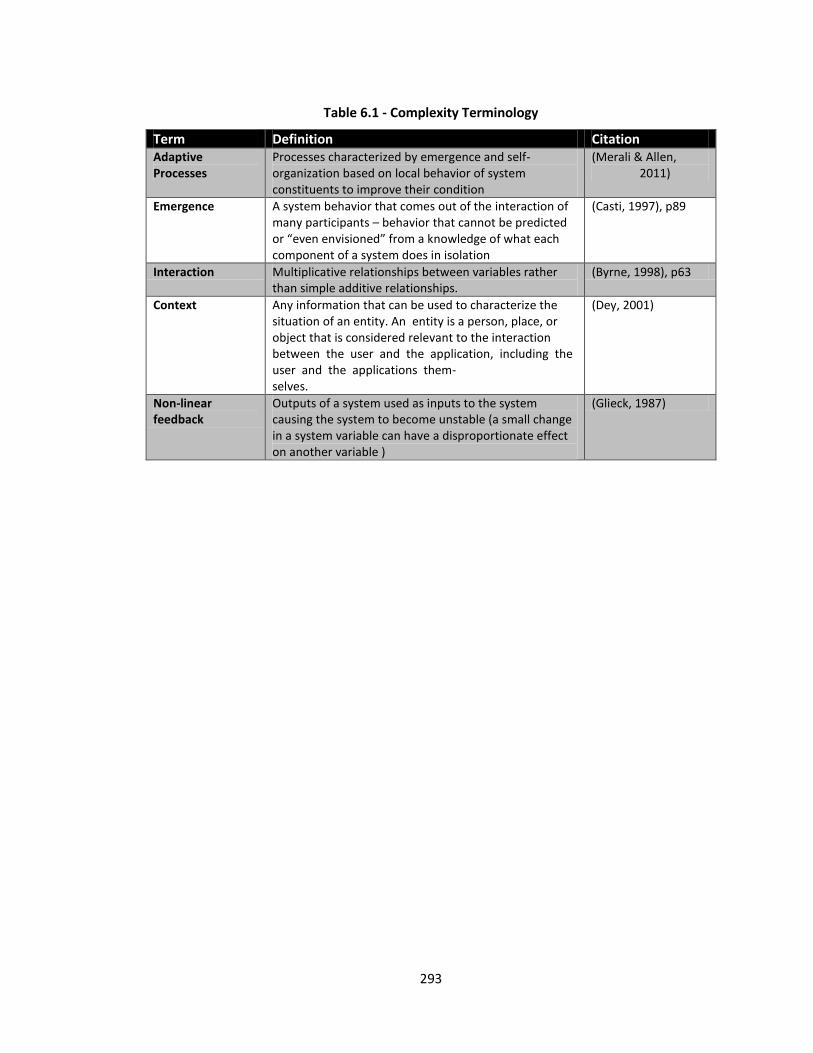
293
Table 6.1 - Complexity Terminology
Term Definition Citation Adaptive Processes
Processes characterized by emergence and self-organization based on local behavior of system constituents to improve their condition
(Merali & Allen, 2011)
Emergence A system behavior that comes out of the interaction of many participants – behavior that cannot be predicted or “even envisioned” from a knowledge of what each component of a system does in isolation
(Casti, 1997), p89
Interaction Multiplicative relationships between variables rather than simple additive relationships.
(Byrne, 1998), p63
Context Any information that can be used to characterize the situation of an entity. An entity is a person, place, or object that is considered relevant to the interaction between the user and the application, including the user and the applications them- selves.
(Dey, 2001)
Non-linear feedback
Outputs of a system used as inputs to the system causing the system to become unstable (a small change in a system variable can have a disproportionate effect on another variable )
(Glieck, 1987)
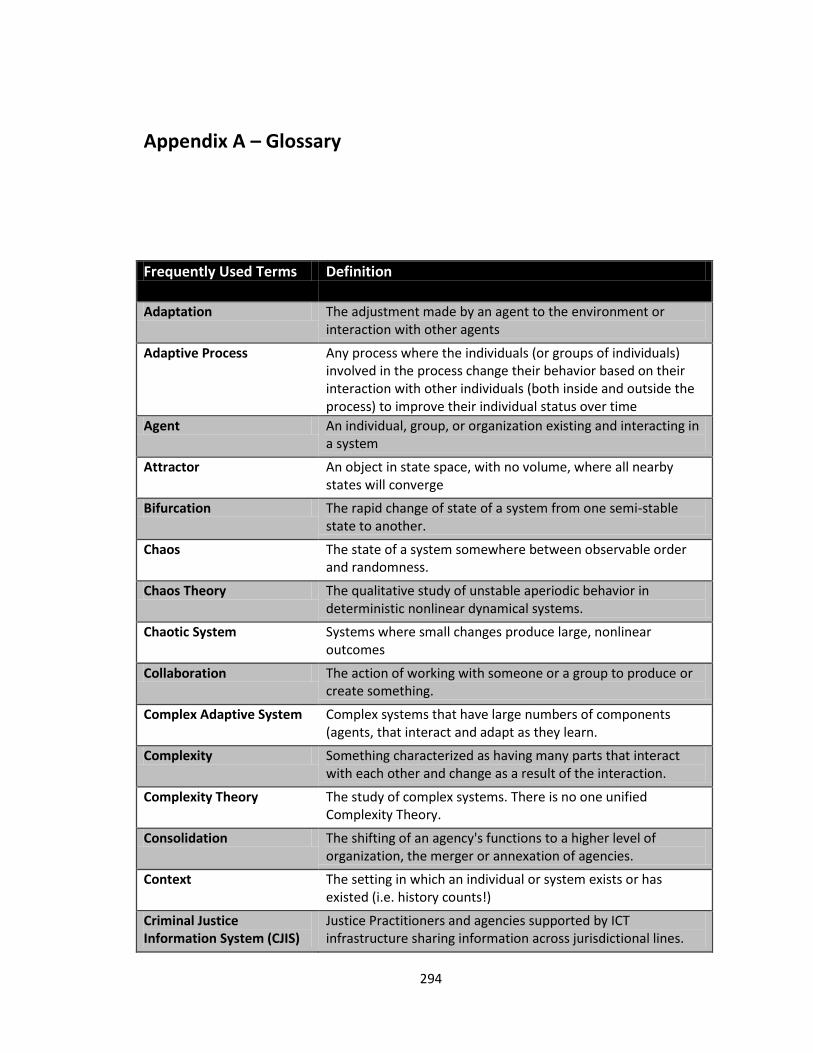
294
Appendix A – Glossary
Frequently Used Terms Definition
Adaptation The adjustment made by an agent to the environment or interaction with other agents
Adaptive Process Any process where the individuals (or groups of individuals) involved in the process change their behavior based on their interaction with other individuals (both inside and outside the process) to improve their individual status over time
Agent An individual, group, or organization existing and interacting in a system
Attractor An object in state space, with no volume, where all nearby states will converge
Bifurcation The rapid change of state of a system from one semi-stable state to another.
Chaos The state of a system somewhere between observable order and randomness.
Chaos Theory The qualitative study of unstable aperiodic behavior in deterministic nonlinear dynamical systems.
Chaotic System Systems where small changes produce large, nonlinear outcomes
Collaboration The action of working with someone or a group to produce or create something.
Complex Adaptive System Complex systems that have large numbers of components (agents, that interact and adapt as they learn.
Complexity Something characterized as having many parts that interact with each other and change as a result of the interaction.
Complexity Theory The study of complex systems. There is no one unified Complexity Theory.
Consolidation The shifting of an agency's functions to a higher level of organization, the merger or annexation of agencies.
Context The setting in which an individual or system exists or has existed (i.e. history counts!)
Criminal Justice Information System (CJIS)
Justice Practitioners and agencies supported by ICT infrastructure sharing information across jurisdictional lines.
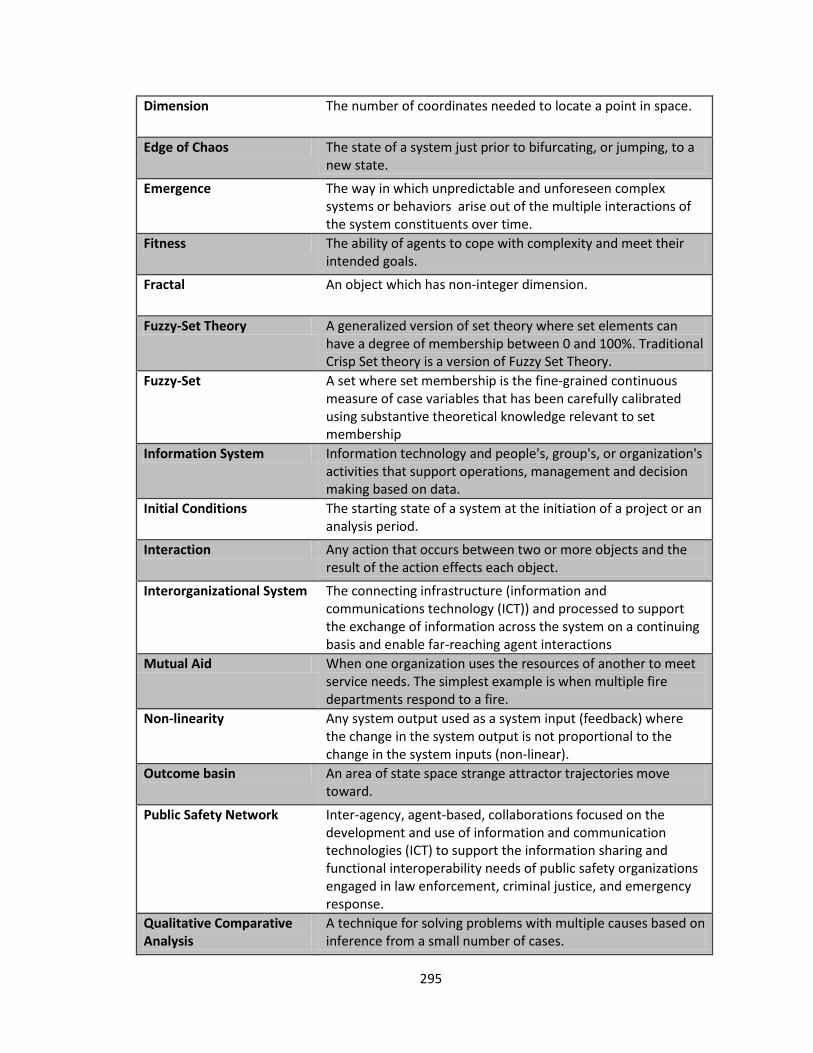
295
Dimension The number of coordinates needed to locate a point in space.
Edge of Chaos The state of a system just prior to bifurcating, or jumping, to a new state.
Emergence The way in which unpredictable and unforeseen complex systems or behaviors arise out of the multiple interactions of the system constituents over time.
Fitness The ability of agents to cope with complexity and meet their intended goals.
Fractal An object which has non-integer dimension.
Fuzzy-Set Theory A generalized version of set theory where set elements can have a degree of membership between 0 and 100%. Traditional Crisp Set theory is a version of Fuzzy Set Theory.
Fuzzy-Set A set where set membership is the fine-grained continuous measure of case variables that has been carefully calibrated using substantive theoretical knowledge relevant to set membership
Information System Information technology and people's, group's, or organization's activities that support operations, management and decision making based on data.
Initial Conditions The starting state of a system at the initiation of a project or an analysis period.
Interaction Any action that occurs between two or more objects and the result of the action effects each object.
Interorganizational System The connecting infrastructure (information and communications technology (ICT)) and processed to support the exchange of information across the system on a continuing basis and enable far-reaching agent interactions
Mutual Aid When one organization uses the resources of another to meet service needs. The simplest example is when multiple fire departments respond to a fire.
Non-linearity Any system output used as a system input (feedback) where the change in the system output is not proportional to the change in the system inputs (non-linear).
Outcome basin An area of state space strange attractor trajectories move toward.
Public Safety Network Inter-agency, agent-based, collaborations focused on the development and use of information and communication technologies (ICT) to support the information sharing and functional interoperability needs of public safety organizations engaged in law enforcement, criminal justice, and emergency response.
Qualitative Comparative Analysis
A technique for solving problems with multiple causes based on inference from a small number of cases.
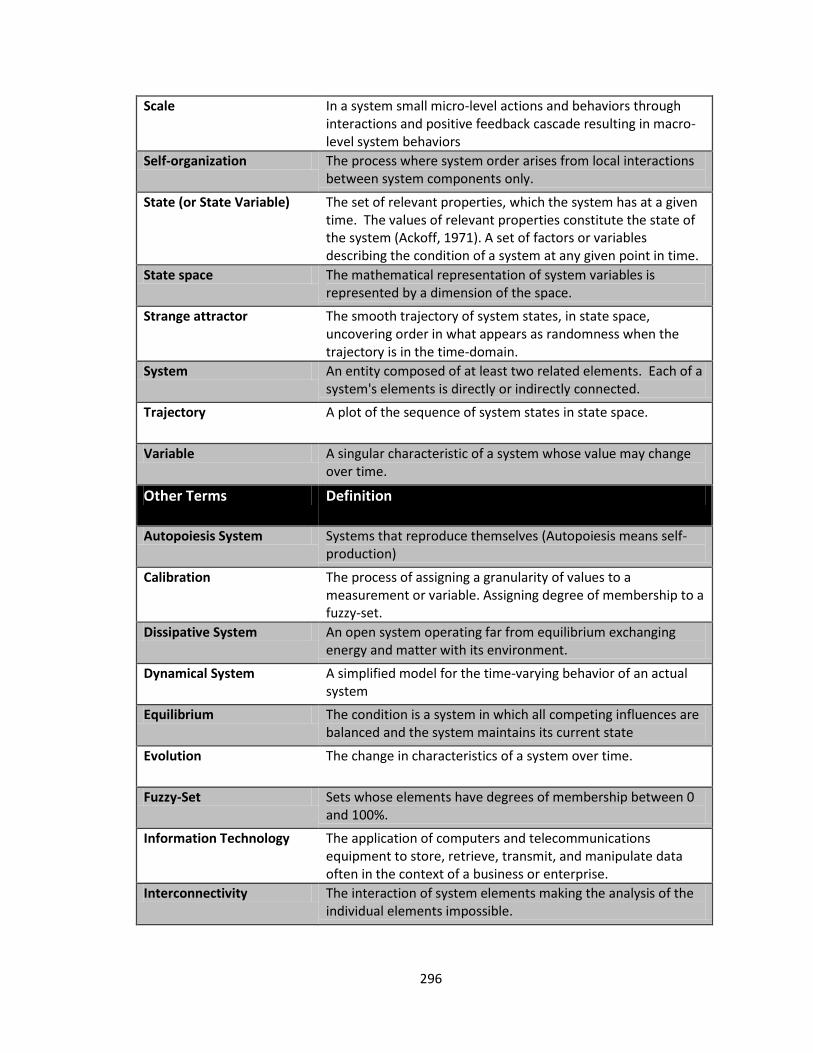
296
Scale In a system small micro-level actions and behaviors through interactions and positive feedback cascade resulting in macro-level system behaviors
Self-organization The process where system order arises from local interactions between system components only.
State (or State Variable) The set of relevant properties, which the system has at a given time. The values of relevant properties constitute the state of the system (Ackoff, 1971). A set of factors or variables describing the condition of a system at any given point in time.
State space The mathematical representation of system variables is represented by a dimension of the space.
Strange attractor The smooth trajectory of system states, in state space, uncovering order in what appears as randomness when the trajectory is in the time-domain.
System An entity composed of at least two related elements. Each of a system's elements is directly or indirectly connected.
Trajectory A plot of the sequence of system states in state space.
Variable A singular characteristic of a system whose value may change over time.
Other Terms Definition
Autopoiesis System Systems that reproduce themselves (Autopoiesis means self-production)
Calibration The process of assigning a granularity of values to a measurement or variable. Assigning degree of membership to a fuzzy-set.
Dissipative System An open system operating far from equilibrium exchanging energy and matter with its environment.
Dynamical System A simplified model for the time-varying behavior of an actual system
Equilibrium The condition is a system in which all competing influences are balanced and the system maintains its current state
Evolution The change in characteristics of a system over time.
Fuzzy-Set Sets whose elements have degrees of membership between 0 and 100%.
Information Technology The application of computers and telecommunications equipment to store, retrieve, transmit, and manipulate data often in the context of a business or enterprise.
Interconnectivity The interaction of system elements making the analysis of the individual elements impossible.
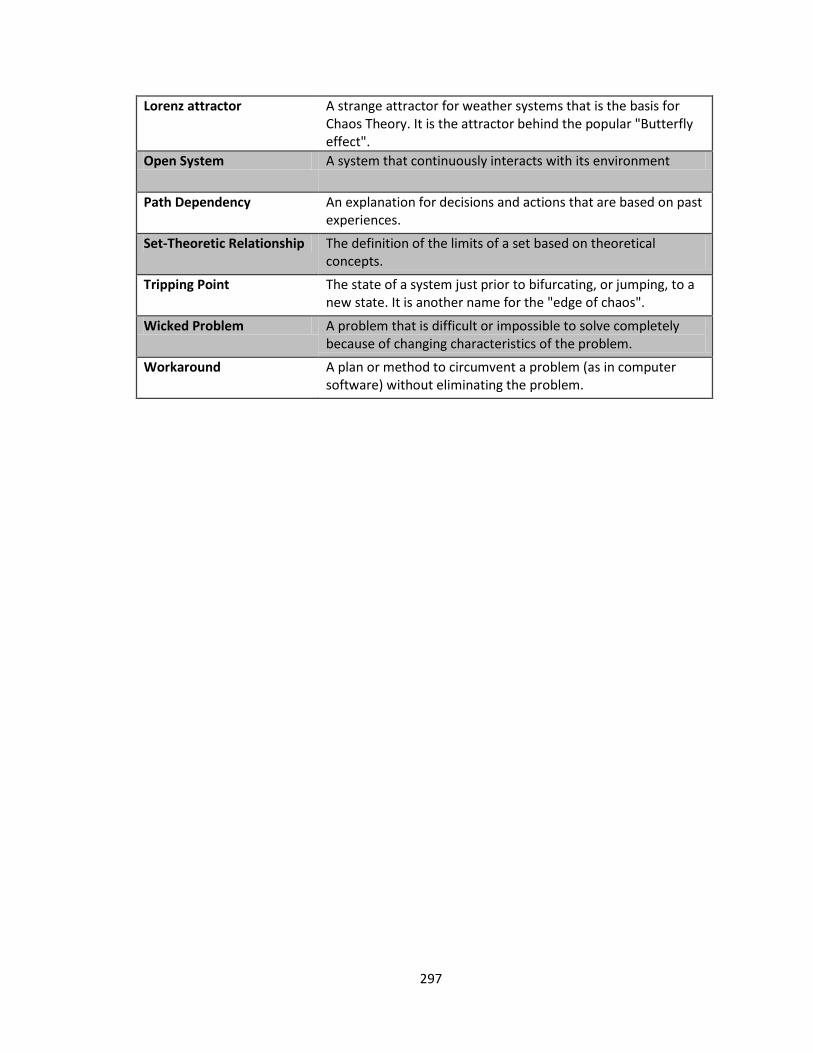
297
Lorenz attractor A strange attractor for weather systems that is the basis for Chaos Theory. It is the attractor behind the popular "Butterfly effect".
Open System A system that continuously interacts with its environment
Path Dependency An explanation for decisions and actions that are based on past experiences.
Set-Theoretic Relationship The definition of the limits of a set based on theoretical concepts.
Tripping Point The state of a system just prior to bifurcating, or jumping, to a new state. It is another name for the "edge of chaos".
Wicked Problem A problem that is difficult or impossible to solve completely because of changing characteristics of the problem.
Workaround A plan or method to circumvent a problem (as in computer software) without eliminating the problem.
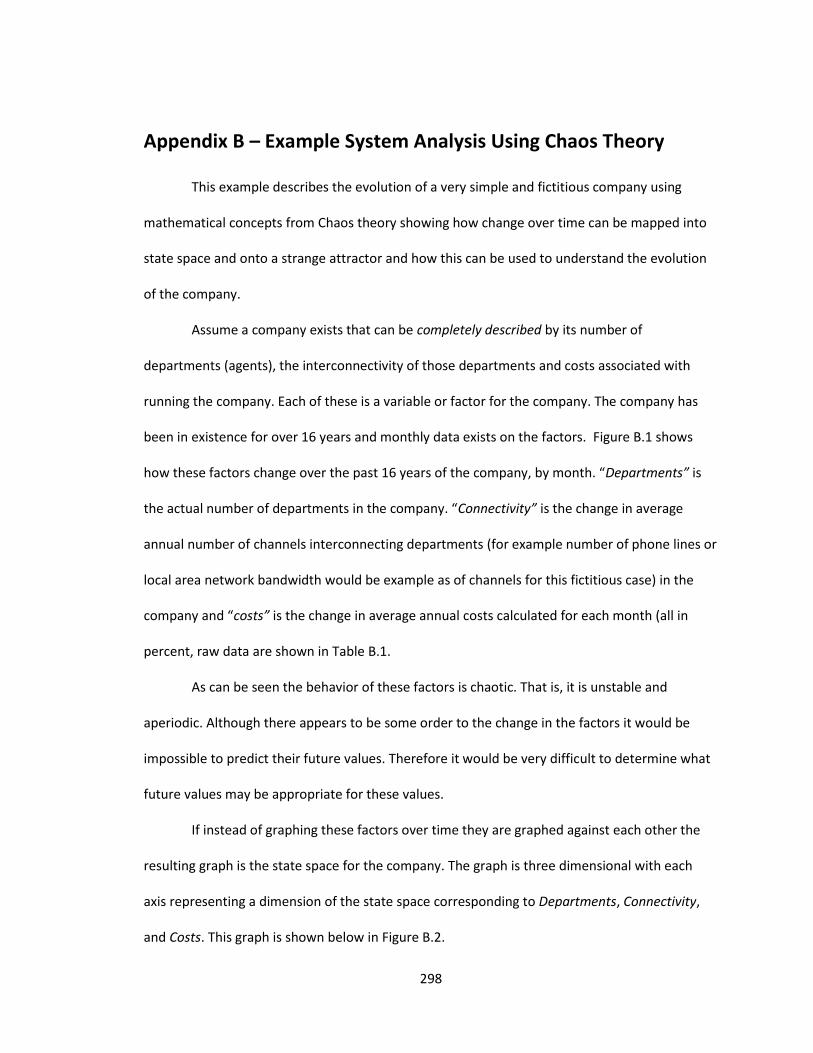
298
Appendix B – Example System Analysis Using Chaos Theory
This example describes the evolution of a very simple and fictitious company using
mathematical concepts from Chaos theory showing how change over time can be mapped into
state space and onto a strange attractor and how this can be used to understand the evolution
of the company.
Assume a company exists that can be completely described by its number of
departments (agents), the interconnectivity of those departments and costs associated with
running the company. Each of these is a variable or factor for the company. The company has
been in existence for over 16 years and monthly data exists on the factors. Figure B.1 shows
how these factors change over the past 16 years of the company, by month. “Departments” is
the actual number of departments in the company. “Connectivity” is the change in average
annual number of channels interconnecting departments (for example number of phone lines or
local area network bandwidth would be example as of channels for this fictitious case) in the
company and “costs” is the change in average annual costs calculated for each month (all in
percent, raw data are shown in Table B.1.
As can be seen the behavior of these factors is chaotic. That is, it is unstable and
aperiodic. Although there appears to be some order to the change in the factors it would be
impossible to predict their future values. Therefore it would be very difficult to determine what
future values may be appropriate for these values.
If instead of graphing these factors over time they are graphed against each other the
resulting graph is the state space for the company. The graph is three dimensional with each
axis representing a dimension of the state space corresponding to Departments, Connectivity,
and Costs. This graph is shown below in Figure B.2.
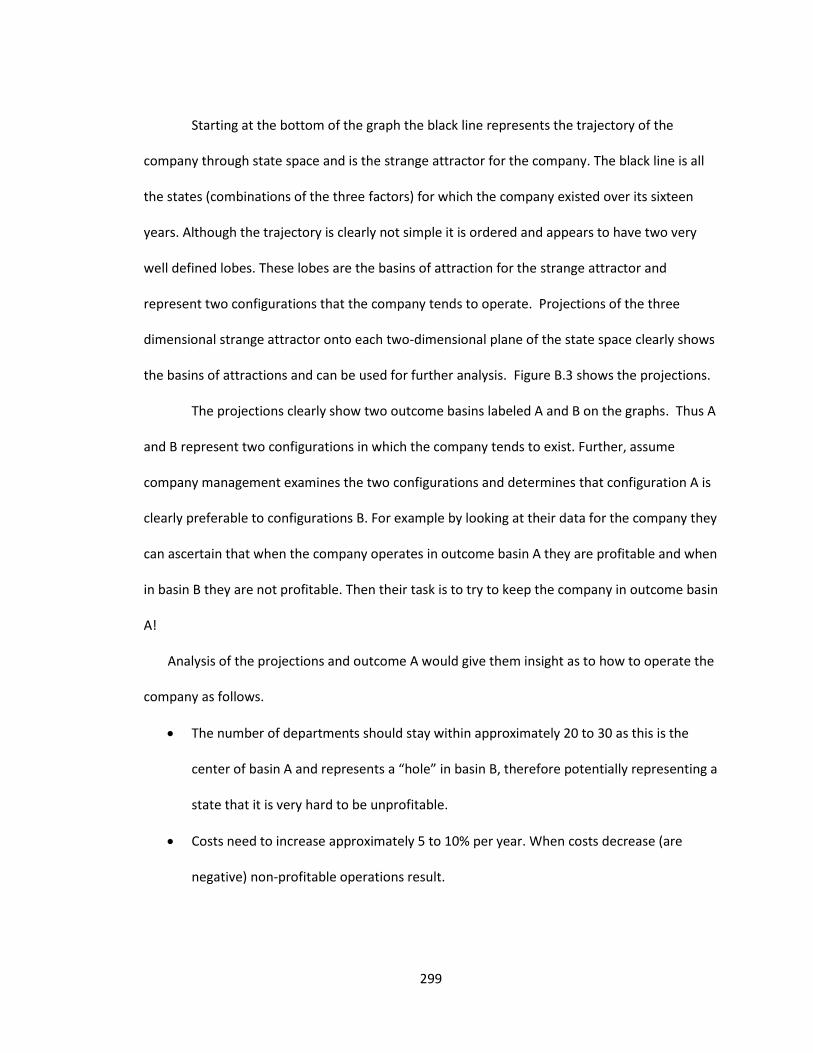
299
Starting at the bottom of the graph the black line represents the trajectory of the
company through state space and is the strange attractor for the company. The black line is all
the states (combinations of the three factors) for which the company existed over its sixteen
years. Although the trajectory is clearly not simple it is ordered and appears to have two very
well defined lobes. These lobes are the basins of attraction for the strange attractor and
represent two configurations that the company tends to operate. Projections of the three
dimensional strange attractor onto each two-dimensional plane of the state space clearly shows
the basins of attractions and can be used for further analysis. Figure B.3 shows the projections.
The projections clearly show two outcome basins labeled A and B on the graphs. Thus A
and B represent two configurations in which the company tends to exist. Further, assume
company management examines the two configurations and determines that configuration A is
clearly preferable to configurations B. For example by looking at their data for the company they
can ascertain that when the company operates in outcome basin A they are profitable and when
in basin B they are not profitable. Then their task is to try to keep the company in outcome basin
A!
Analysis of the projections and outcome A would give them insight as to how to operate the
company as follows.
The number of departments should stay within approximately 20 to 30 as this is the
center of basin A and represents a “hole” in basin B, therefore potentially representing a
state that it is very hard to be unprofitable.
Costs need to increase approximately 5 to 10% per year. When costs decrease (are
negative) non-profitable operations result.
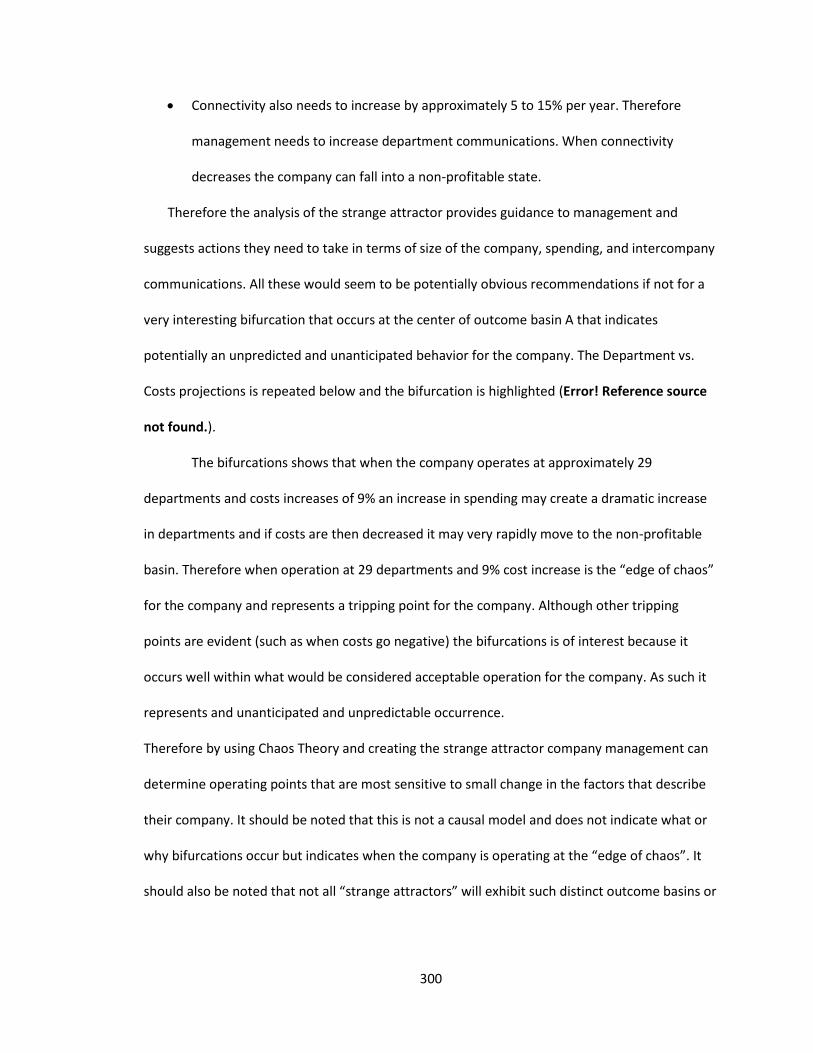
300
Connectivity also needs to increase by approximately 5 to 15% per year. Therefore
management needs to increase department communications. When connectivity
decreases the company can fall into a non-profitable state.
Therefore the analysis of the strange attractor provides guidance to management and
suggests actions they need to take in terms of size of the company, spending, and intercompany
communications. All these would seem to be potentially obvious recommendations if not for a
very interesting bifurcation that occurs at the center of outcome basin A that indicates
potentially an unpredicted and unanticipated behavior for the company. The Department vs.
Costs projections is repeated below and the bifurcation is highlighted (Error! Reference source
not found.).
The bifurcations shows that when the company operates at approximately 29
departments and costs increases of 9% an increase in spending may create a dramatic increase
in departments and if costs are then decreased it may very rapidly move to the non-profitable
basin. Therefore when operation at 29 departments and 9% cost increase is the “edge of chaos”
for the company and represents a tripping point for the company. Although other tripping
points are evident (such as when costs go negative) the bifurcations is of interest because it
occurs well within what would be considered acceptable operation for the company. As such it
represents and unanticipated and unpredictable occurrence.
Therefore by using Chaos Theory and creating the strange attractor company management can
determine operating points that are most sensitive to small change in the factors that describe
their company. It should be noted that this is not a causal model and does not indicate what or
why bifurcations occur but indicates when the company is operating at the “edge of chaos”. It
should also be noted that not all “strange attractors” will exhibit such distinct outcome basins or

301
bifurcations. This is a contrived example intended only to illustrate the use of Chaos Theory in
the social sciences.
Appendix B – Figures and Tables
Figure B.1- Company Factors for Each Month
Figure B.2- Company State Space
-40
-20
0
20
40
60
0 24 48 72 96 120 144 168 192Ch
ange
in %
Months
Change in Company Factors Over 16 Years
connectivity
costs
departments
Connectivity
Departments
Costs
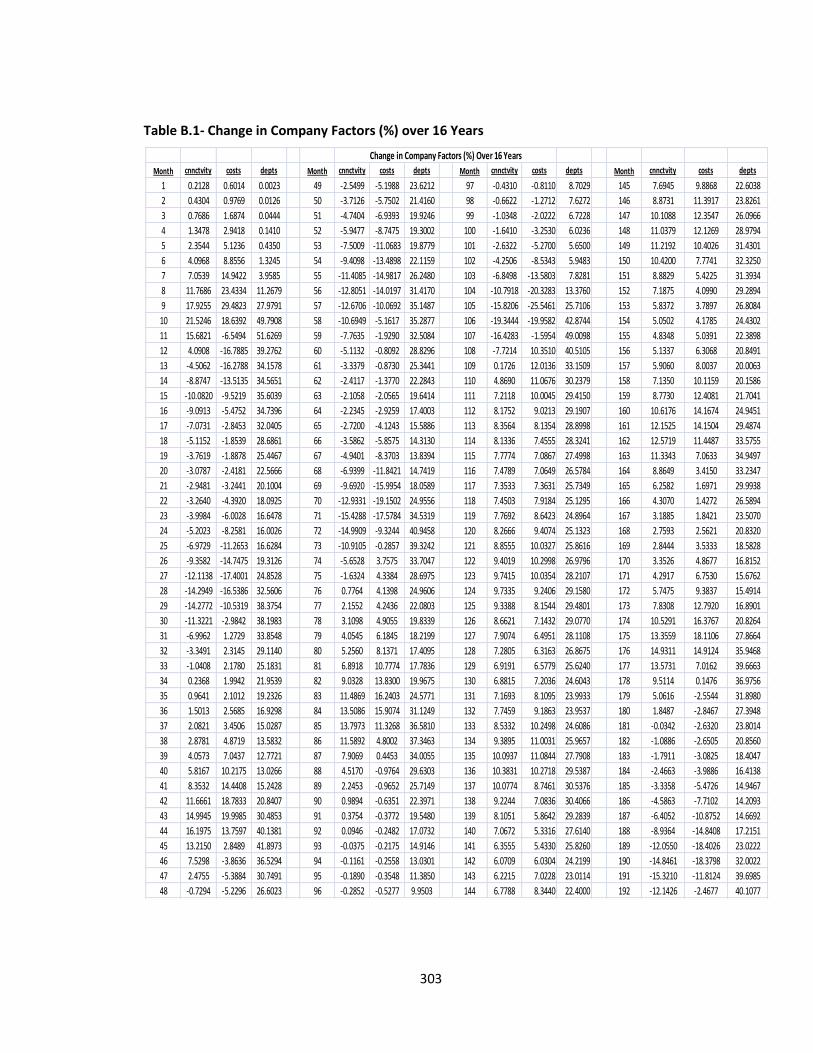
303
Table B.1- Change in Company Factors (%) over 16 Years
Change in Company Factors (%) Over 16 Years
Month cnnctvity costs depts Month cnnctvity costs depts Month cnnctvity costs depts Month cnnctvity costs depts
1 0.2128 0.6014 0.0023 49 -2.5499 -5.1988 23.6212 97 -0.4310 -0.8110 8.7029 145 7.6945 9.8868 22.6038
2 0.4304 0.9769 0.0126 50 -3.7126 -5.7502 21.4160 98 -0.6622 -1.2712 7.6272 146 8.8731 11.3917 23.8261
3 0.7686 1.6874 0.0444 51 -4.7404 -6.9393 19.9246 99 -1.0348 -2.0222 6.7228 147 10.1088 12.3547 26.0966
4 1.3478 2.9418 0.1410 52 -5.9477 -8.7475 19.3002 100 -1.6410 -3.2530 6.0236 148 11.0379 12.1269 28.9794
5 2.3544 5.1236 0.4350 53 -7.5009 -11.0683 19.8779 101 -2.6322 -5.2700 5.6500 149 11.2192 10.4026 31.4301
6 4.0968 8.8556 1.3245 54 -9.4098 -13.4898 22.1159 102 -4.2506 -8.5343 5.9483 150 10.4200 7.7741 32.3250
7 7.0539 14.9422 3.9585 55 -11.4085 -14.9817 26.2480 103 -6.8498 -13.5803 7.8281 151 8.8829 5.4225 31.3934
8 11.7686 23.4334 11.2679 56 -12.8051 -14.0197 31.4170 104 -10.7918 -20.3283 13.3760 152 7.1875 4.0990 29.2894
9 17.9255 29.4823 27.9791 57 -12.6706 -10.0692 35.1487 105 -15.8206 -25.5461 25.7106 153 5.8372 3.7897 26.8084
10 21.5246 18.6392 49.7908 58 -10.6949 -5.1617 35.2877 106 -19.3444 -19.9582 42.8744 154 5.0502 4.1785 24.4302
11 15.6821 -6.5494 51.6269 59 -7.7635 -1.9290 32.5084 107 -16.4283 -1.5954 49.0098 155 4.8348 5.0391 22.3898
12 4.0908 -16.7885 39.2762 60 -5.1132 -0.8092 28.8296 108 -7.7214 10.3510 40.5105 156 5.1337 6.3068 20.8491
13 -4.5062 -16.2788 34.1578 61 -3.3379 -0.8730 25.3441 109 0.1726 12.0136 33.1509 157 5.9060 8.0037 20.0063
14 -8.8747 -13.5135 34.5651 62 -2.4117 -1.3770 22.2843 110 4.8690 11.0676 30.2379 158 7.1350 10.1159 20.1586
15 -10.0820 -9.5219 35.6039 63 -2.1058 -2.0565 19.6414 111 7.2118 10.0045 29.4150 159 8.7730 12.4081 21.7041
16 -9.0913 -5.4752 34.7396 64 -2.2345 -2.9259 17.4003 112 8.1752 9.0213 29.1907 160 10.6176 14.1674 24.9451
17 -7.0731 -2.8453 32.0405 65 -2.7200 -4.1243 15.5886 113 8.3564 8.1354 28.8998 161 12.1525 14.1504 29.4874
18 -5.1152 -1.8539 28.6861 66 -3.5862 -5.8575 14.3130 114 8.1336 7.4555 28.3241 162 12.5719 11.4487 33.5755
19 -3.7619 -1.8878 25.4467 67 -4.9401 -8.3703 13.8394 115 7.7774 7.0867 27.4998 163 11.3343 7.0633 34.9497
20 -3.0787 -2.4181 22.5666 68 -6.9399 -11.8421 14.7419 116 7.4789 7.0649 26.5784 164 8.8649 3.4150 33.2347
21 -2.9481 -3.2441 20.1004 69 -9.6920 -15.9954 18.0589 117 7.3533 7.3631 25.7349 165 6.2582 1.6971 29.9938
22 -3.2640 -4.3920 18.0925 70 -12.9331 -19.1502 24.9556 118 7.4503 7.9184 25.1295 166 4.3070 1.4272 26.5894
23 -3.9984 -6.0028 16.6478 71 -15.4288 -17.5784 34.5319 119 7.7692 8.6423 24.8964 167 3.1885 1.8421 23.5070
24 -5.2023 -8.2581 16.0026 72 -14.9909 -9.3244 40.9458 120 8.2666 9.4074 25.1323 168 2.7593 2.5621 20.8320
25 -6.9729 -11.2653 16.6284 73 -10.9105 -0.2857 39.3242 121 8.8555 10.0327 25.8616 169 2.8444 3.5333 18.5828
26 -9.3582 -14.7475 19.3126 74 -5.6528 3.7575 33.7047 122 9.4019 10.2998 26.9796 170 3.3526 4.8677 16.8152
27 -12.1138 -17.4001 24.8528 75 -1.6324 4.3384 28.6975 123 9.7415 10.0354 28.2107 171 4.2917 6.7530 15.6762
28 -14.2949 -16.5386 32.5606 76 0.7764 4.1398 24.9606 124 9.7335 9.2406 29.1580 172 5.7475 9.3837 15.4914
29 -14.2772 -10.5319 38.3754 77 2.1552 4.2436 22.0803 125 9.3388 8.1544 29.4801 173 7.8308 12.7920 16.8901
30 -11.3221 -2.9842 38.1983 78 3.1098 4.9055 19.8339 126 8.6621 7.1432 29.0770 174 10.5291 16.3767 20.8264
31 -6.9962 1.2729 33.8548 79 4.0545 6.1845 18.2199 127 7.9074 6.4951 28.1108 175 13.3559 18.1106 27.8664
32 -3.3491 2.3145 29.1140 80 5.2560 8.1371 17.4095 128 7.2805 6.3163 26.8675 176 14.9311 14.9124 35.9468
33 -1.0408 2.1780 25.1831 81 6.8918 10.7774 17.7836 129 6.9191 6.5779 25.6240 177 13.5731 7.0162 39.6663
34 0.2368 1.9942 21.9539 82 9.0328 13.8300 19.9675 130 6.8815 7.2036 24.6043 178 9.5114 0.1476 36.9756
35 0.9641 2.1012 19.2326 83 11.4869 16.2403 24.5771 131 7.1693 8.1095 23.9933 179 5.0616 -2.5544 31.8980
36 1.5013 2.5685 16.9298 84 13.5086 15.9074 31.1249 132 7.7459 9.1863 23.9537 180 1.8487 -2.8467 27.3948
37 2.0821 3.4506 15.0287 85 13.7973 11.3268 36.5810 133 8.5332 10.2498 24.6086 181 -0.0342 -2.6320 23.8014
38 2.8781 4.8719 13.5832 86 11.5892 4.8002 37.3463 134 9.3895 11.0031 25.9657 182 -1.0886 -2.6505 20.8560
39 4.0573 7.0437 12.7721 87 7.9069 0.4453 34.0055 135 10.0937 11.0844 27.7908 183 -1.7911 -3.0825 18.4047
40 5.8167 10.2175 13.0266 88 4.5170 -0.9764 29.6303 136 10.3831 10.2718 29.5387 184 -2.4663 -3.9886 16.4138
41 8.3532 14.4408 15.2428 89 2.2453 -0.9652 25.7149 137 10.0774 8.7461 30.5376 185 -3.3358 -5.4726 14.9467
42 11.6661 18.7833 20.8407 90 0.9894 -0.6351 22.3971 138 9.2244 7.0836 30.4066 186 -4.5863 -7.7102 14.2093
43 14.9945 19.9985 30.4853 91 0.3754 -0.3772 19.5480 139 8.1051 5.8642 29.2839 187 -6.4052 -10.8752 14.6692
44 16.1975 13.7597 40.1381 92 0.0946 -0.2482 17.0732 140 7.0672 5.3316 27.6140 188 -8.9364 -14.8408 17.2151
45 13.2150 2.8489 41.8973 93 -0.0375 -0.2175 14.9146 141 6.3555 5.4330 25.8260 189 -12.0550 -18.4026 23.0222
46 7.5298 -3.8636 36.5294 94 -0.1161 -0.2558 13.0301 142 6.0709 6.0304 24.2199 190 -14.8461 -18.3798 32.0022
47 2.4755 -5.3884 30.7491 95 -0.1890 -0.3548 11.3850 143 6.2215 7.0228 23.0114 191 -15.3210 -11.8124 39.6985
48 -0.7294 -5.2296 26.6023 96 -0.2852 -0.5277 9.9503 144 6.7788 8.3440 22.4000 192 -12.1426 -2.4677 40.1077
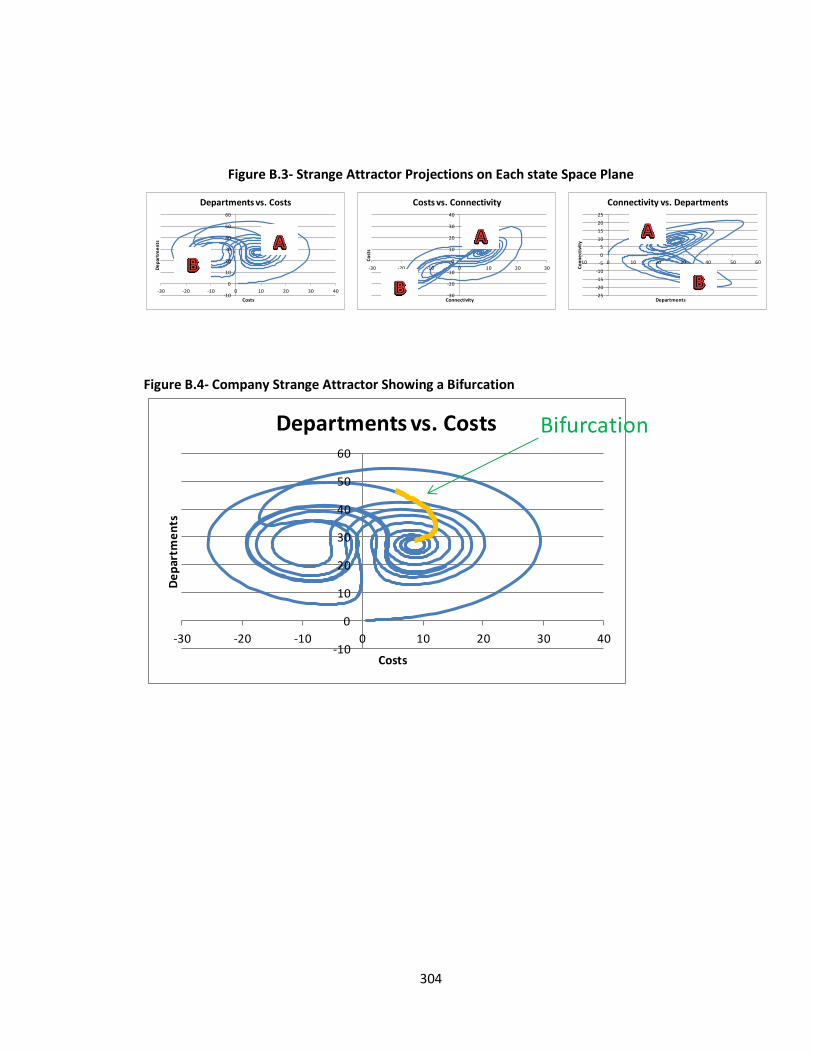
304
Figure B.3- Strange Attractor Projections on Each state Space Plane
Figure B.4- Company Strange Attractor Showing a Bifurcation
-10
0
10
20
30
40
50
60
-30 -20 -10 0 10 20 30 40
De
par
tme
nts
Costs
Departments vs. Costs
-30
-20
-10
0
10
20
30
40
-30 -20 -10 0 10 20 30
Co
sts
Connectivity
Costs vs. Connectivity
-25
-20
-15
-10
-5
0
5
10
15
20
25
-10 0 10 20 30 40 50 60
Co
nn
ect
ivit
y
Departments
Connectivity vs. Departments
-10
0
10
20
30
40
50
60
-30 -20 -10 0 10 20 30 40
De
par
tme
nts
Costs
Departments vs. Costs Bifurcation
305
Appendix C – A Summary of Chaos Theory Mathematics1
The following is a brief summary of the mathematical formulations behind Chaos
Theory. Chaos theory is the qualitative study of unstable aperiodic behavior in deterministic
nonlinear dynamical systems (Kellert, 1993). Therefore, it is based on the mathematics of
dynamical systems.
A dynamical system consists of a set of possible states, together with a rule that
determines the current state in terms of past states. Therefore, a dynamical system maps
current states into future states or performs a mapping in state space. If фt represents a
dynamical system and M the state space, then
фt : M -> M
In its simplest case, t is measured discretely at equal time increments, t = 0,1,2,3,…. and
the dynamical system is a sequence (fn)n, with
f : M -> M,
f0 = the identity seed of the system, and
fn = f0 -> f1 -> f2 -> . . . -> fn.
Therefore, dynamical systems trace a path through state space corresponding to the
sequence of states they sequentially attain. The function determining the current state, based
on the past states, represents an evolution rule for the system. As dynamical systems evolve,
they trace a path through state space. The path may be stable and reach a “steady” state, be
periodic, repeatedly returning to a few states, or chaotic, moving from state to state apparently
randomly. In the following section, dynamical systems of one dimension (one state variable) are
1 Appendix content is based on (Alligood, Sauer, & Yorke, 1997; Elert, 2007; Gidea & Niculescu, 2002)

306
described to simply and clearly illustrate the concepts and properties of steady-state, periodic,
and chaotic evolution.
One-dimension dynamical systems In a one-dimensional dynamical system the current state of the system is denoted as xn,
the seed of the system x0, thus,
f : M -> M,
x0 = a, where a is any real number, and
xn = f(xn-1),
where the sequence (fn(x0))n is called the trajectory of x0 and the set of its values, the
orbit around x0. Therefore for a general discrete dynamical system its trajectory is described is
by x0 values that satisfy the equations xn = f(xn-1) whose orbit is {x0, x1, x2,. . . , xn-1, xn}, and n is an
element of all integers. The function xn = f(xn-1) is the rule that determines the current state in
terms of past states. Therefore xn = f(xn-1) together with x0 determine the orbit and trajectory of
the system.
Types of Obits and Trajectories
There are different types of trajectories and orbits, as follows.
Fixed – This type of orbit is exhibited by x0 values that satisfy the equation x0 = f(x0). If a
point is fixed, its orbit remains constant. For example, for f(x) = x2, x0 = 1 is a fixed point
whose orbit is {1, 1, 1, 1, . . . }. For a given function, f, all the seed values, (x0) that result
in fixed orbits are known as fixed points.
Eventually Fixed - Points that show this orbit behavior do not start off as fixed, but after
n iterations, there orbits become fixed. For example, with f(x) = x2, -1 is an eventually
fixed point, because its orbit is {-1, 1, 1, 1, . . . ), starting at -1, but eventually (in one
iteration) becoming fixed at +1.
Eventually Periodic - As with eventually fixed orbits, eventually periodic points do not
start as periodic; however, after n iterations, there orbits become periodic. An example
of an eventually periodic point can be seen in f(x) = 1 - x2, using -1 as x0; the orbit is {-1,
0, 1, 0, 1, 0, 1, . . .}.

307
Increasing - Points behaving in this type, as the name implies, constantly increase when
iterated through the function. An increasing orbit can be seen on the function f(x) = x2
for any seed greater than 1. Using 5 as the seed, for example, the orbit is {5, 25, 625,
390625, 152587890625, . . . }.
Decreasing - This type of orbit is the counterpart to the increasing orbit. Decreasing
points always lower in value, when iterated through the function. This type of orbit is
exhibited on the function f(x) = 3x using any seed lower than 0. For instance, using -2 as
the seed produces the orbit {-2, -6, -18, -54, -162, . . . }.
Chaotic - These are points that do not fit into any of the above categories and whose
orbits seem to “jump around” randomly on the number line. For an example the orbit of
x0 = 4 on f(x) = 4x(1 - x) produces the orbit {.6, .96, .1536001, .5200284, .9983954,
6.40793 x 10⁻³,. . . , .1560364, .5267562, ,9971364, 1.1421554 x 10⁻², 4.516437x10⁻²,
.1724982,. . .}
It should be noted that the orbit and trajectory of a dynamical system are determined
by both the seed value x0 and the function (fn(x0))n. Therefore, a dynamical system may exhibit
different types of orbits and trajectories based on the value of x0. For example, the function f(x)
= 4x(1 - x), with x0 = 0 or .75 the orbit is fixed at 0 and .75 (respectively, f(0) = 0 and f(.75) = .75))
but, as shown above, for x0 = .6 behaves chaotically2.
As stated above, when an orbit has fixed points the orbit does not change always being
equal to the seed value. Fixed points have interesting properties. For a dynamical system that
has fixed points, seed values other than the fixed-point value may have orbits that converge to
the fixed-point value or diverge from it. Depending on the slope of the function at the fixed
point; orbits with seed values other than the fixed-point value may converge (eventually fixed)
to the fixed-point value or diverge (increasing or decreasing) away from the fixed-point value.
These fixed-points are referred to attracting, repelling, or neutral.
2 The function f(x) = rx(1 - x) is a simple logistic equation for approximating the evolution of an animal
population. Because it can exhibit all the types of obits and trajectories it is used as an illustrative example for one-dimensional dynamical systems analysis

308
Attraction and Repulsion Fixed points are considered attracting, repelling, or neutral depending on the effect of
the fixed point on other nearby points. “Near” is a relative term but can be formalized, such
that if a fixed point is denoted by p, then the “nearby” points around p are defined as Nε(p) : {|x
– p| < ε} and Nε(p) is referred to as the epsilon neighborhood of the fixed point p.
Attracting fixed points found where the absolute value of the function's slope is less
than 1, pull nearby points closer. That is, after a few iterations, a nearby point (used as
the seed) will be pulled very close to the attracted fixed point.
o If there is an ε > 0 such that for all x in Nε(p), limk->∞fk(x) = p, then p is a
attracting fixed point.
o If |f’(p)| < 1 then p is an attracting fixed point.
Repelling fixed points, found where the absolute value of the function's slope is greater
than 1, push nearby points away. After a few iterations, a nearby point (used as the
seed) will be pushed far away from the repelling fixed point.
o If there is an ε > 0 such that for all x in Nε(p), limk->∞fk(x) ≠ p, then p is a repelling
fixed point.
o If |f’(p)| > 1 then p is an repelling fixed point
Neutral fixed points are found where the function's slope is equal to 1 or -1. These
points can attract, repel, or do both. Whether a neutral fixed point will attract, repel, do
both, or do neither depends on the specific case.
o If |f’(p)| = 1 then p is an neutral fixed point.
For an example f(x) = 2x(1 - x) has a repelling fixed point at p = 0 and an attracting fixed
point at p = 0.5. The resulting orbits for x0 = -0.0001 (repelled from p = 0) and +0.0001 (repelled
from p = 0, attracted to p = 0.5) and x0 = .999 a (attracting to p = 0.5) are shown in Figure C.1.
For the x0 near the repelling point, p = 0, the orbit diverges to -∞ and .5. For the attracting fixed
point, the orbit converges to 0.5.
As can be seen, if the dynamical system operates, or is initiated, near an attracting fixed
point the system will converge to the fixed point and remain at this point. For systems
operating at such a point small fluctuations in the system parameters may cause very large

309
changes in the behavior of the system. For the example chosen, f(x) = 2x(1 - x), the number “2”
is a parameter of the general system function f(x) = rx(1 - x). If the parameter r changes the
behavior of the system can change.
With r = 2, and x0 = .01, the system converges to the attracting fixed point, p = .5. The
graph, Figure C.2, below, shows the convergence of the system over 1,000 and 50 iterations (n =
1000 and 50).
If the parameter r =3 then the system no longer converges to the attracting points but breaks
into a stable two cycle periodic orbit (Figure C.3). If the parameter is further changed to r = 1 +
√6 (3.44948974…) it breaks into a stable four cycle periodic orbit (Figure C.4). The period
continues doubling over ever shorter intervals until around r = 3.5699457… where the chaotic
behavior is evident. The orbit is shown for r = 3.9 because it clearly shows aperiodic,
nondeterministic behavior (Figure C.5).
An interesting aspect of this example is the magnitude of the changes in r is very small
to transition from a stable (periodic) system to a chaotic system. A change in r from ~3.5 (stable
4 cycle periodic orbit) to ~3.57 (a ½% change) results in chaotic behavior. Although these plots
indicate the behavior of the dynamical system, it can be problematic to visualize or to
differentiate stable multi-period behavior from chaotic behavior. Cobweb plots offer a solution
to this problem.
Cobweb Plots A clearer view of orbits and their stability (fixed, periodic, and chaotic) can be obtained
by graphing the orbit using a cobweb plot. A cobweb, or Verhulst diagram, is a visual tool used
to visualize the long-term behavior of a dynamical system under different initial conditions.
Given a dynamical system modeled by an iterated function f : M -> M, the cobweb plot uses the

310
diagonal y = x and the function f to create an iterative trajectory of the system, such that if xn =
f(xn-1) then the trajectory traced is {x0, x1, x2,. . . , xn-1, xn}. Each trajectory will be unique based on
the value of x0. The trajectory is created as follows.
1. The diagonal line y=x and the function f : M -> M (y = f(x)) are plotted.
2. The initial condition is located, which has coordinates (x0, f(x0)).
3. A trajectory is plotted horizontally from (x0, f(x0)) to (f(x0), f(x0)).
4. A trajectory is then plotted vertically from (f(x0)), f(x0)) to (f(x0), f(f(x0)))
5. Steps 3 and 4 are repeated for each iteration as desired.
The following plot (Figure C.6) shows the cobweb plot for, f(x) = 2x(1 - x), and x0 = .01. The blue
line represents f(x) = 2x(1 - x)and the black line y = x. The red line is the trajectory showing the
initial point at (.01,.0198) and converging to the fixed point (0.5, 0.5). Such a trajectory
represents a stable fixed orbit3. As stated previously the trajectory will change if different initial
conditions are used. For example, the plot in Figure C.7 shows the same function, , f(x) = 2x(1 -
x), but with and initial condition of x0 = .9. As can be seen the trajectory now makes one-half
orbit around the fixed point, 0.5, before converging to the fixed point (hence the terminology of
“orbit” for the trajectories).
The orbital nature of the trajectories is further illustrated for periodic trajectories. Below are
the cobweb plots for the functions f(x) = 3x(1 - x), and x0 = .9, and f(x) = (1 + √6)x(1 - x), and x0 =
.9 (Figure C.8). The first plot shows stable two cycle periodic orbit indicated by the orbit
approaching the fixed-point attractor from both sides. Note that even after 1000 iterations
there is a whole in the center and the orbit has not settled to the fixed point. The second plot is
stable four cycle periodic orbit indicated by the two bands of the trajectory. Higher period
orbits will show more bands (note for all cobweb plots the start of the trajectory is a transient
condition and can be ignored).
3 Plots are created using COBWEB PLOT 2008,
http://rstankewitz.iweb.bsu.edu/CobwebPlot2008/CobwebPlot.html

311
When the parameter r is changed to 3.9, which is chaotic behavior, the cobweb plot will
cover the entire region, as shown. Two plots are illustrated in Figure C.9, the first with 100
iterations, which shows the chaotic nature of the orbit, and the second plot with 100 iterations
showing that eventually the orbit will cover the entire sub-area defined by the function. The
cobweb plots represent a way of visualizing the general behavior of the dynamical system f(x) =
rx(1 - x) for different values of r and initial conditions x0. A more general way to visualize the
behavior of the system is through bifurcation diagram.
Bifurcation diagram Dynamical systems would be of little interest if they all persisted in fixed point states. If
the fixed point is stable, the system is likely to stay in that state, even with minor disturbances.
But systems change over time. As has been shown for the system f(x) = rx(1 - x) a change in the
parameter, r, results in the system behavior changing from stable fixed, to stable periodic, and
eventually chaotic. These changes in the system are called bifurcations.
Bifurcations can be visualized by plotting the values of the parameters against all the
possible states in which the system can exist (ignoring initial transients). This visualization is
called a bifurcation diagram and is shown below (Figure C.10) for f(x) = rx(1 - x). The bifurcation
diagram shows the transition of “attracting sets” of the system. For the functions shown, a fixed
point attracting set exists for r = 1 to 3 and f(x) is a single value. It then becomes a stable two
cycle periodic attractor set from 3 to (1 + √6) and f(x) splits (bifurcates) into two values. From (1
+ √6) to ~3.45 the system is a stable four cycle periodic attractor set. At r values greater than
~3.45 the system becomes chaotic represented by a multitude of possible f(x) values4.
The bifurcation diagram (Figure C.10) show stability of the system changes as the
parameter r is changed (note in the diagram the letter “C” is used instead of r). The system
4 The bifurcation diagram plotter is from http://math.bu.edu/DYSYS/applets/bif-dgm/Logistic.html
312
behavior becomes chaotic at r = ~3.45. The bands at r > ~3.45 indicate the system falls back into
fixed or periodic behavior. It should also be noted that the bifurcations are self-similar, meaning
that the bifurcation to stable two cycle periodic orbits is repeated twice for the bifurcation to
stable four cycle periodic orbits. Self-similarity repeats itself at finer resolutions and such
behavior is characteristic of geometric entities called “fractals”. Although self-similarity and
“fractals” are important concepts in complexity theory it is not within the focus of this study and
further elaboration is omitted.
This analysis has been used to illustrate one-dimensional dynamical systems. One-
dimensional analysis was used to illustrate the behavior of these systems and how they are
attracted to certain states, their sensitivity to initial conditions (x0) and how changing system
parameters cause behavior to bifurcate into different attractive sets. The next section examines
multi-dimensional dynamical systems and their behavior can “collapse” into strange attractor
regions.
Strange Attractors The one-dimensional analysis of dynamical systems involves the mapping of a set of
numbers to themselves as f : M -> M. in a multi-dimensional system maps a set of n-tuples of
numbers, where n represents the dimension of the system, such that f : Mn -> Mn. the n-tuples
represent a multi-dimensional state of the system, Mn the state space in which the system can
exist and n the dimension of the state space. Thus, all the orbits that a system can attain now
represent a set of orbits in each dimension and a system with seed p would have a set of orbits,
{ p, f(p), f2(p), f3(p), . . . , fn(p) }

313
Each orbit is generally similar to the other so that higher dimension orbits have similar
behavior to one-dimension orbits. For example, in two dimensions, a fixed point attractor
converges all points to the origin and would do the mapping,
f : (x,y) -> (½x, ½y).
Similarly a repelling attractor would drive all points to infinity. An example of such a mapping is,
f : (x,y) -> (2x, 2y).
In two dimensions an attractor may also pull all points to a line, such as in the following mapping
which attracts all points to the
f : (x,y) -> (x, ½y).
Additionally, the attractor can pull points to a structure. The following map will cause all points
to cycle around the origin in a four-cycle period.
f : (x,y) -> (-y, +x).
Mappings may act both attract and repel points. The mapping below pulls all points within the
unit circle to the origin, while all points outside the origin go to infinity,
f : (x,y) -> (x2 – y2, 2xy).
Therefore, for multiple dimensions, attractors and repellors can create orbits that are points,
paths, surfaces, volumes, and their higher dimension analogs.
In some mappings, the resultant attractor is not continuous across the n-dimensional space.
Although composed of lines, orbits do not flow continuously, but hop from one location to
another. When drawn, the attractor seems to materialize out of nothing. Seed values that
converge to the attractor do so in a different manner. Distinct points that are initially separated
by even the most minuscule gap will eventually diverge and evolve separately. For these

314
attractors, n is not an integer and the attractor occupies a non-integer dimensional space. Such
attractors are strange attractors.
For a strange attractor the orbits represent the set of attractor points (or states) in
which the system will exist after many iterations. Additionally there is an area around the orbits
in which any system with initial conditions within this space will converge to the orbits. This
area is known as the “basin of attraction”. Any system that has initial conditions outside the
basin will diverge to infinity. The following example is a two-dimensional attractor given by the
mapping, f : (x,y) -> (1.4 – x2 + 0.3y, x). In the plot below (Figure C.11) the black area represents
the attractor and the grey area the basin.
For multi-dimensional dynamical systems, the strange attractor is similar to the one
dimensional cobweb plot after transients have died out. The cobweb plot transients would be
similar to the outcome basin of the attractor. Such plots are difficult to calculate for all systems
and there is an obvious limitation to three dimensions for visualization. Therefore, a numerical
measure exists to determine the chaotic nature of a system called the Lyapunov exponent.
Lyapunov Functions In one dimension, attraction of a dynamical system orbit is when |f’(p)| < 1. In multiple
dimensions, a similar measure can be made by examining the distance between orbits that start
at seed values that are very close to each other. At each iteration n, of the orbit the distance is
calculated between orbits and can be represented by a function ∆xfn(x0) . This is the Lyapunov
function. If the system has attracting fixed points the function diminishes asymptotically to
zero. In eventually fixed point system the orbits initially are divergent but eventually settle to
some set distance. In chaotic systems the function behaves erratically . By averaging the
distance as n approaches ∞ a measure of the attraction of the system can be made. The limit is
called the Lyapunov exponent (λ) and is as follows,

315
λ = lim (n->∞,∆x0 ->0) (1/n) ln(|∆xfn(x0)|/ |∆x0|) .
The Lyapunov exponent is used (as |f’(p)| was in one-dimension) to determine the
attraction of orbits in multi-dimension systems. It is interpreted as follows.
λ < 0 – the orbits attract to a stable fixed point or periodic orbit.
λ = 0 – The orbit is a neutral fixed point indicating the system eventually reaches some
sort of steady state. For example, a system with an attractor of two concentric circles
would have λ = 0.
λ > 0 – The orbits are unstable and chaotic. Nearby points, no matter how close, will
diverge to some arbitrary separation. This does not mean that some organizational
pattern will not emerge. Such systems have orbits that are “strange attractors”.
Given a system with different parameters, calculation of the Lyapunov exponent can
provide information on when the system is approaching bifurcation points. For example, if the
Lyapunov exponent is calculated for all values of r for the function previously used, f(x) = rx(1 -
x), then bifurcations become evident as shown below. As can be seen (Figure C.12) the
Lyapunov exponent indicates the stability of the system and can show the onset of a bifurcation
when λ approaches zero.
Similar to a bifurcation diagram, the Lyapunov exponent can also be plotted. For these
plots different values of λ are shown in grayscale where white is assigned to all points where λ
equals zero and black to all points where lambda is greater than zero. This highlights the
transition from order to chaos. For points where lambda is less than zero a shade of gray is
assigned so that values close to zero are nearly white while those close to λ = −∞ are nearly
black. Lack is also used for any point where λ = −∞ (i.e., the superstable points and cycles).
These plots are referred to as the Lyapunov space and an example is shown below (Figure C.13).
Although these plots are interesting the complexity in interpreting them precludes their use and
instead the Lyapunov exponent is typically used to indicate chaotic systems.
316
Dimension of the State Space and Strange Attractor In dynamical system determination of the number of factors, or the dimension, used to
describe the system is not of concern due to the interaction of the factors. Interaction causes
the information for all factors to be represented in each individual factor. Additionally the
fractal nature of the strange attractor causes unnecessary factors to not exist within the system.
Over-specification (too many dimensions) or under-specification (too few dimensions) does not
affect accuracy of the strange attractor. The mathematical proof of this statement is based on
Taken’s Theorem and is beyond this research. For a mathematical description of the phenomena
see Casdaglhi, et. al (1991). The following will illustrate dimensional concepts of strange
attractors using the fictitious company described in Appendix A.
Figure C.14 depicts the strange attractor for the fictitious company described in
Appendix A using one dimension (cost) or two dimensions (cost and connectivity). The one-
dimension strange attractor is graphed, approximately, as a frequency distribution and shows
that there are potentially outcome basins at cost values of 8% and -1% (values represent change
in cost). The graph is an approximation of the strange attractor because in one dimension it is
difficult to represent the sequence of the value (potentially points could be numbered but the
resulting graph would be illegible) and therefore bifurcations are not shown (this is a limitation
of the representation and not the data).The graph still clearly shows the possible values for the
factor, cost, and the most likely values.
If the strange attractor is expanded to two dimensions the graph consists of a more
legible attractor with very clear outcome basins. Additionally the trajectory of the strange
attractor can be traced showing potential bifurcations and tripping points (as described in
Appendix A). It is important to note that the addition of the extra dimension, connectivity, does
not alter the values of the one dimension factor, cost. The addition of the dimension creates a
317
richer description of the strange attractor where outcome basins can be identified
approximately at cost, connectivity values of (9,9) and (-1, -5). The addition of extra dimensions
adds the description the system but any single dimension is still a valid representation.
This also is seen by considering the equations for the system. The system is represented
by three simple differential equations are as follows.
f’(cost) = 10 * (connectivity – cost)
f’(connectivity) = cost * (28 – departments) – connectivity
f’(departments) = cost * connectivity – 2.67 * departments
As can be seen the interactions of the three factors cause information regarding all factors to be
present in each individual factor. For example,
change in cost is a function of connectivity and cost,
change in connectivity is a functions of cost, departments, and connectivity,
and,
change in departments is a function of cost, connectivity and departments.
Each value of each dimension contains information from the previous values of all factors.
Therefore, even if a fourth factor is applicable to the system, but unidentified, information from
this factor is contained in the other three factors. Therefore, under-specification of the
dimension of the strange attractor does not affect the accuracy of the description of the strange
attractor but only diminishes the descriptive capabilities of the model.
Similarly, over-specification of the dimension of the strange attractor is not problematic due
to its fractal nature. Referring to the strange attractor for the system (Figure C.15)
The system will only exist in states defined by the strange attractor, by definition of a chaotic
system. Therefore, the addition of extra dimensions will create more unoccupied “white space”
but not alter the shape of the strange attractor in three dimensions. Of more interest is the

318
strange attractor defines all the possible values for each factor. As can be seen the system does
not exist completely across all values of each factors. When a system does not span the entire
factor (or dimension) it is said to have a fractal, or non-integer dimension. A fractal dimension
allows for analysis of the system for the observed values of the factors without the possibility of
error due to unobserved values (assuming sufficient values of the factors to produce a positive
Lyapunov exponent, indicating chaotic behavior).
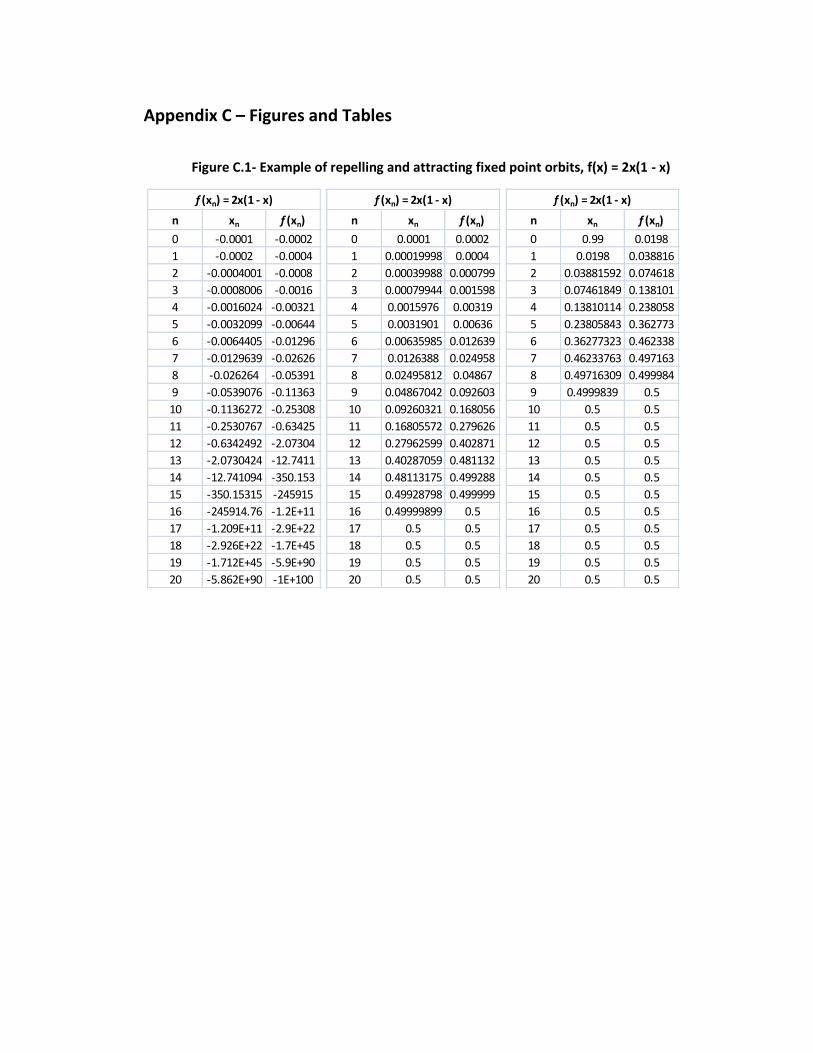
Appendix C – Figures and Tables
Figure C.1- Example of repelling and attracting fixed point orbits, f(x) = 2x(1 - x)
3
f (xn) = 2x(1 - x)
n xn f (xn)
0 -0.0001 -0.0002
1 -0.0002 -0.0004
2 -0.0004001 -0.0008
3 -0.0008006 -0.0016
4 -0.0016024 -0.00321
5 -0.0032099 -0.00644
6 -0.0064405 -0.01296
7 -0.0129639 -0.02626
8 -0.026264 -0.05391
9 -0.0539076 -0.11363
10 -0.1136272 -0.25308
11 -0.2530767 -0.63425
12 -0.6342492 -2.07304
13 -2.0730424 -12.7411
14 -12.741094 -350.153
15 -350.15315 -245915
16 -245914.76 -1.2E+11
17 -1.209E+11 -2.9E+22
18 -2.926E+22 -1.7E+45
19 -1.712E+45 -5.9E+90
20 -5.862E+90 -1E+100
f (xn) = 2x(1 - x)
n xn f (xn)
0 0.0001 0.0002
1 0.00019998 0.0004
2 0.00039988 0.000799
3 0.00079944 0.001598
4 0.0015976 0.00319
5 0.0031901 0.00636
6 0.00635985 0.012639
7 0.0126388 0.024958
8 0.02495812 0.04867
9 0.04867042 0.092603
10 0.09260321 0.168056
11 0.16805572 0.279626
12 0.27962599 0.402871
13 0.40287059 0.481132
14 0.48113175 0.499288
15 0.49928798 0.499999
16 0.49999899 0.5
17 0.5 0.5
18 0.5 0.5
19 0.5 0.5
20 0.5 0.5
f (xn) = 2x(1 - x)
n xn f (xn)
0 0.99 0.0198
1 0.0198 0.038816
2 0.03881592 0.074618
3 0.07461849 0.138101
4 0.13810114 0.238058
5 0.23805843 0.362773
6 0.36277323 0.462338
7 0.46233763 0.497163
8 0.49716309 0.499984
9 0.4999839 0.5
10 0.5 0.5
11 0.5 0.5
12 0.5 0.5
13 0.5 0.5
14 0.5 0.5
15 0.5 0.5
16 0.5 0.5
17 0.5 0.5
18 0.5 0.5
19 0.5 0.5
20 0.5 0.5
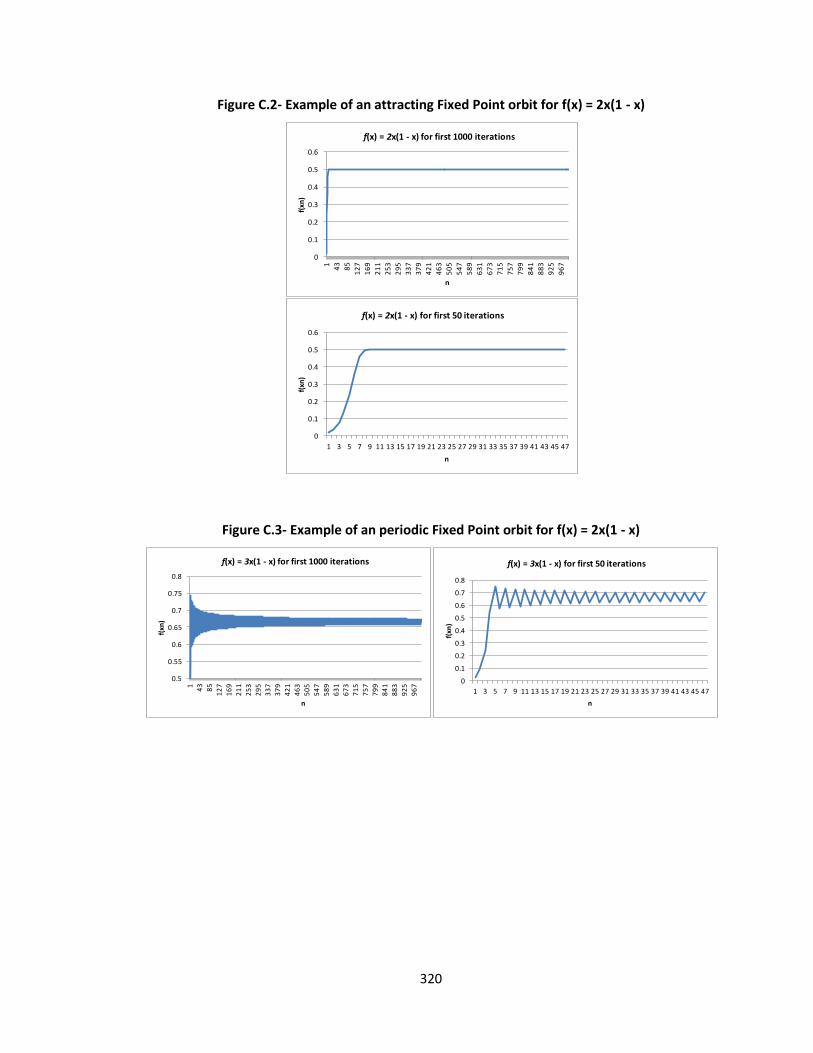
320
Figure C.2- Example of an attracting Fixed Point orbit for f(x) = 2x(1 - x)
Figure C.3- Example of an periodic Fixed Point orbit for f(x) = 2x(1 - x)
0
0.1
0.2
0.3
0.4
0.5
0.6
1 43
85
12
7
16
9
21
1
25
3
29
5
33
7
37
9
42
1
46
3
50
5
54
7
58
9
63
1
67
3
71
5
75
7
79
9
84
1
88
3
92
5
96
7
f(xn
)
n
f(x) = 2x(1 - x) for first 1000 iterations
0
0.1
0.2
0.3
0.4
0.5
0.6
1 3 5 7 9 11 13 15 17 19 21 23 25 27 29 31 33 35 37 39 41 43 45 47
f(xn
)
n
f(x) = 2x(1 - x) for first 50 iterations
0.5
0.55
0.6
0.65
0.7
0.75
0.8
1 43
85
12
7
16
9
21
1
25
3
29
5
33
7
37
9
42
1
46
3
50
5
54
7
58
9
63
1
67
3
71
5
75
7
79
9
84
1
88
3
92
5
96
7
f(xn
)
n
f(x) = 3x(1 - x) for first 1000 iterations
0
0.1
0.2
0.3
0.4
0.5
0.6
0.7
0.8
1 3 5 7 9 11 13 15 17 19 21 23 25 27 29 31 33 35 37 39 41 43 45 47
f(xn
)
n
f(x) = 3x(1 - x) for first 50 iterations
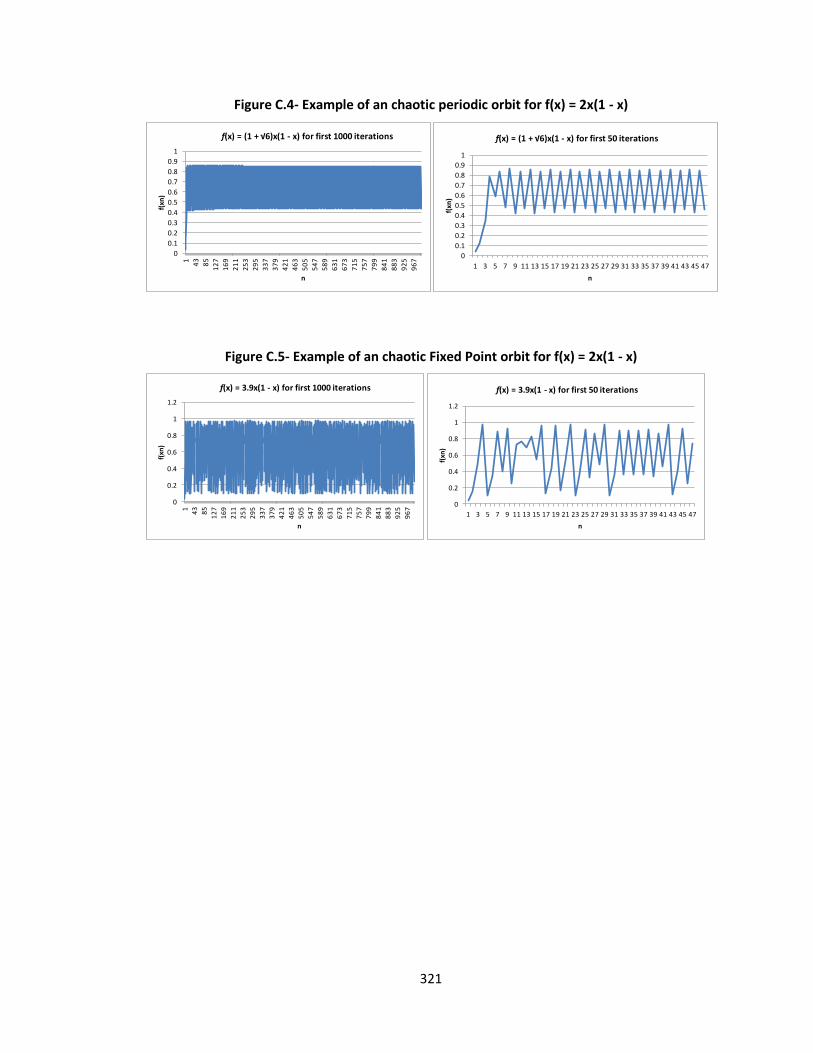
321
Figure C.4- Example of an chaotic periodic orbit for f(x) = 2x(1 - x)
Figure C.5- Example of an chaotic Fixed Point orbit for f(x) = 2x(1 - x)
0
0.1
0.2
0.3
0.4
0.5
0.6
0.7
0.8
0.9
1
1 43
85
12
7
16
9
21
1
25
3
29
5
33
7
37
9
42
1
46
3
50
5
54
7
58
9
63
1
67
3
71
5
75
7
79
9
84
1
88
3
92
5
96
7
f(xn
)
n
f(x) = (1 + √6)x(1 - x) for first 1000 iterations
0
0.1
0.2
0.3
0.4
0.5
0.6
0.7
0.8
0.9
1
1 3 5 7 9 11 13 15 17 19 21 23 25 27 29 31 33 35 37 39 41 43 45 47
f(xn
)
n
f(x) = (1 + √6)x(1 - x) for first 50 iterations
0
0.2
0.4
0.6
0.8
1
1.2
1 43
85
12
7
16
9
21
1
25
3
29
5
33
7
37
9
42
1
46
3
50
5
54
7
58
9
63
1
67
3
71
5
75
7
79
9
84
1
88
3
92
5
96
7
f(xn
)
n
f(x) = 3.9x(1 - x) for first 1000 iterations
0
0.2
0.4
0.6
0.8
1
1.2
1 3 5 7 9 11 13 15 17 19 21 23 25 27 29 31 33 35 37 39 41 43 45 47
f(xn
)
n
f(x) = 3.9x(1 - x) for first 50 iterations
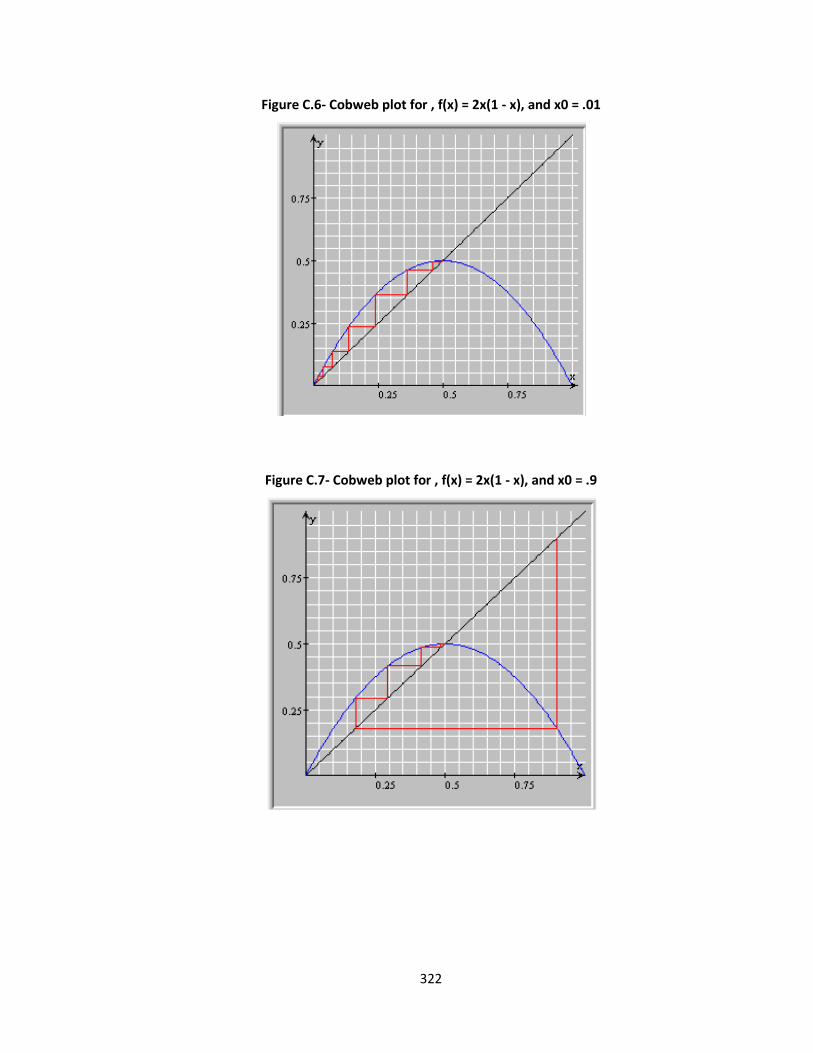
322
Figure C.6- Cobweb plot for , f(x) = 2x(1 - x), and x0 = .01
Figure C.7- Cobweb plot for , f(x) = 2x(1 - x), and x0 = .9
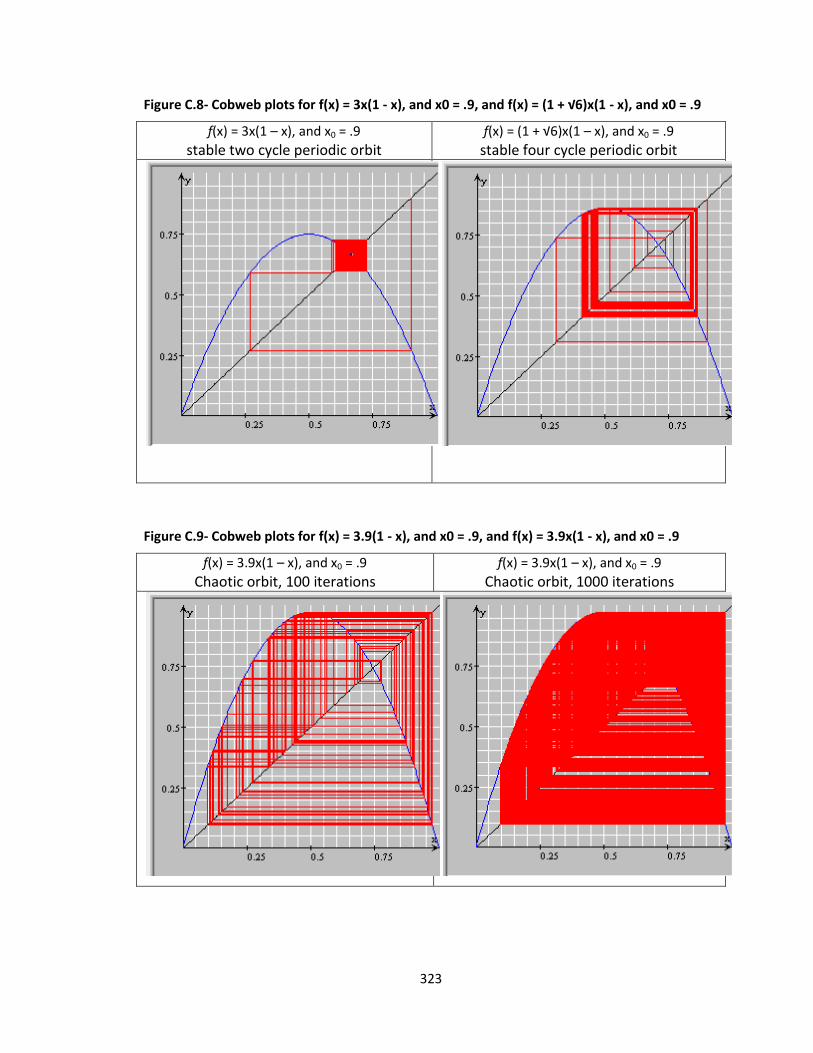
323
Figure C.8- Cobweb plots for f(x) = 3x(1 - x), and x0 = .9, and f(x) = (1 + √6)x(1 - x), and x0 = .9
f(x) = 3x(1 – x), and x0 = .9
stable two cycle periodic orbit f(x) = (1 + √6)x(1 – x), and x0 = .9
stable four cycle periodic orbit
Figure C.9- Cobweb plots for f(x) = 3.9(1 - x), and x0 = .9, and f(x) = 3.9x(1 - x), and x0 = .9
f(x) = 3.9x(1 – x), and x0 = .9
Chaotic orbit, 100 iterations f(x) = 3.9x(1 – x), and x0 = .9
Chaotic orbit, 1000 iterations
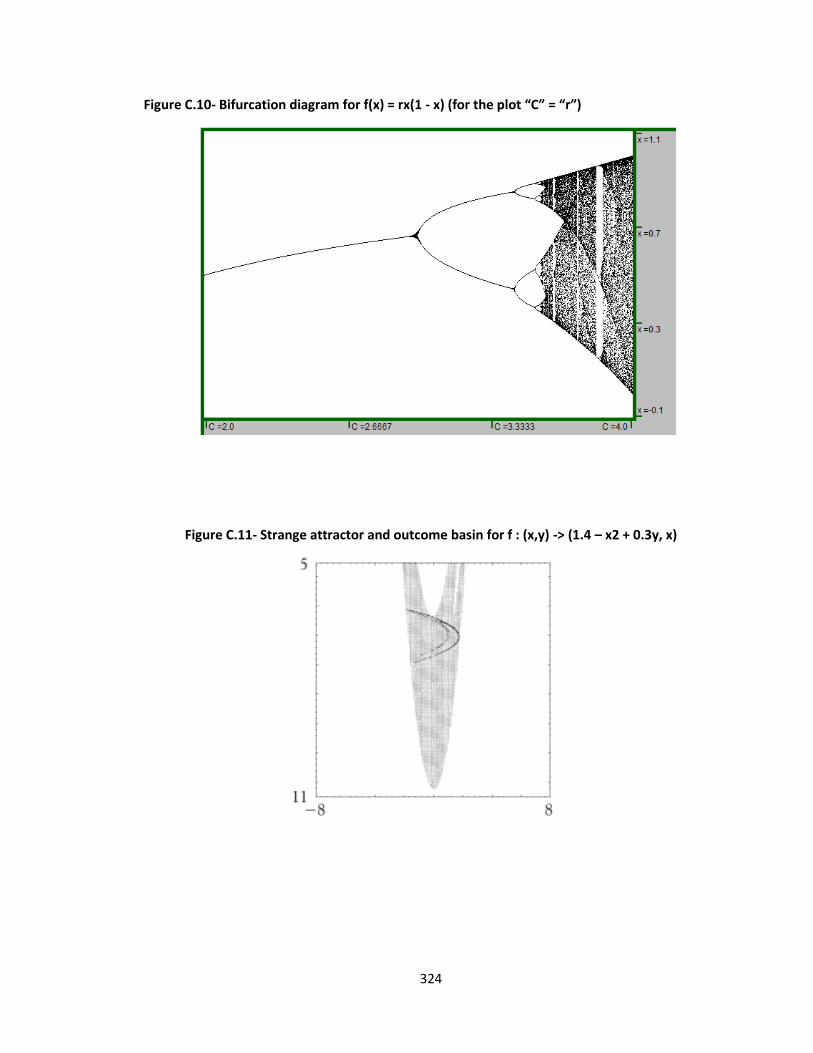
324
Figure C.10- Bifurcation diagram for f(x) = rx(1 - x) (for the plot “C” = “r”)
Figure C.11- Strange attractor and outcome basin for f : (x,y) -> (1.4 – x2 + 0.3y, x)
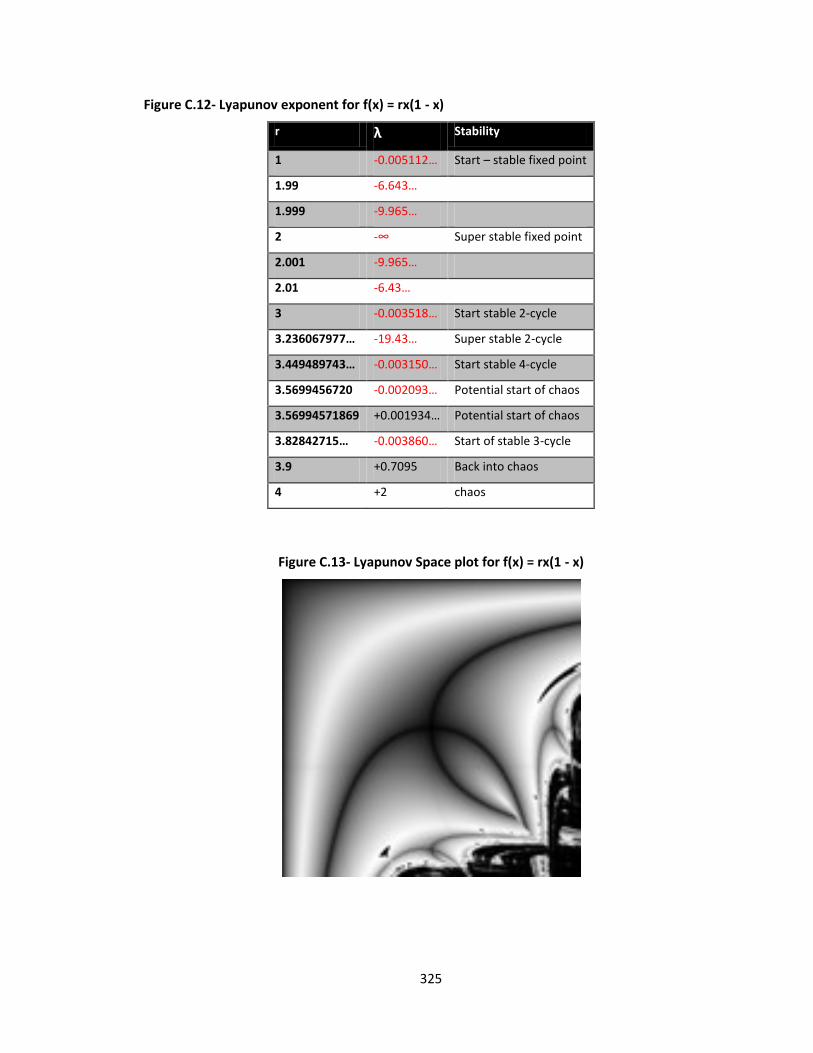
325
Figure C.12- Lyapunov exponent for f(x) = rx(1 - x)
r λ Stability
1 -0.005112… Start – stable fixed point
1.99 -6.643…
1.999 -9.965…
2 -∞ Super stable fixed point
2.001 -9.965…
2.01 -6.43…
3 -0.003518… Start stable 2-cycle
3.236067977… -19.43… Super stable 2-cycle
3.449489743… -0.003150… Start stable 4-cycle
3.5699456720 -0.002093… Potential start of chaos
3.56994571869 +0.001934… Potential start of chaos
3.82842715… -0.003860… Start of stable 3-cycle
3.9 +0.7095 Back into chaos
4 +2 chaos
Figure C.13- Lyapunov Space plot for f(x) = rx(1 - x)
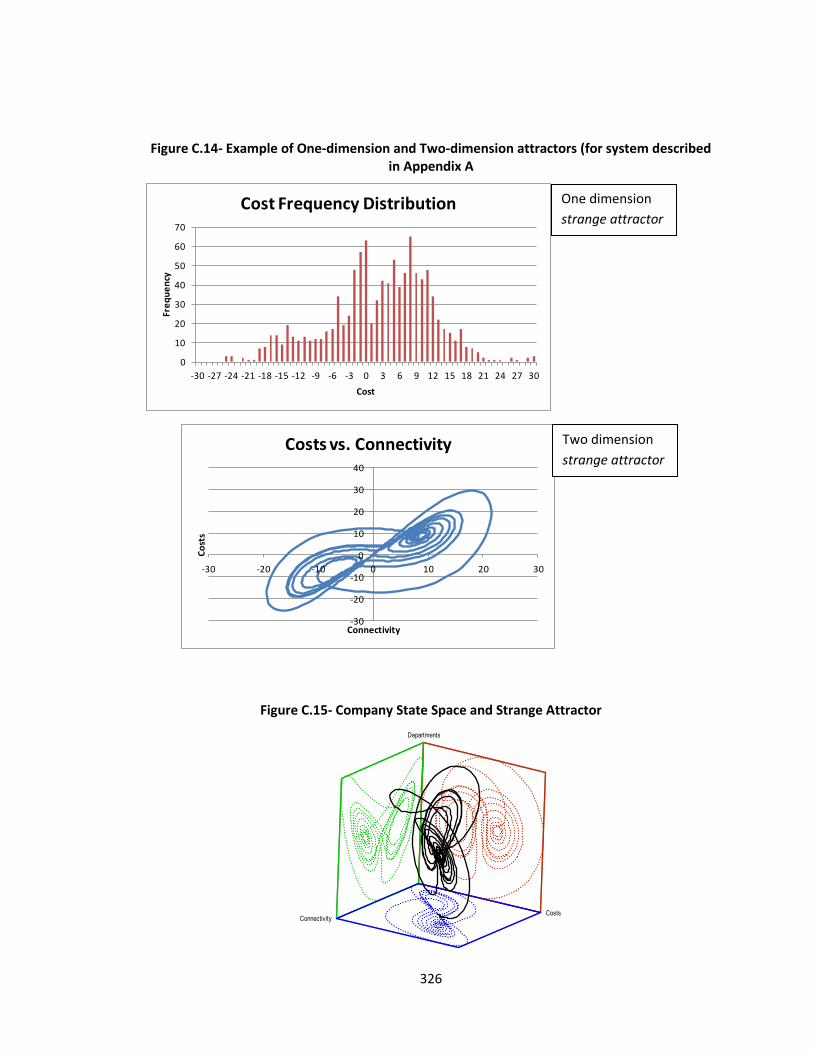
326
Figure C.14- Example of One-dimension and Two-dimension attractors (for system described in Appendix A
Figure C.15- Company State Space and Strange Attractor
0
10
20
30
40
50
60
70
-30 -27 -24 -21 -18 -15 -12 -9 -6 -3 0 3 6 9 12 15 18 21 24 27 30
Fre
qu
en
cy
Cost
Cost Frequency Distribution
-30
-20
-10
0
10
20
30
40
-30 -20 -10 0 10 20 30
Co
sts
Connectivity
Costs vs. Connectivity
Connectivity
Departments
Costs
One dimension
strange attractor
Two dimension
strange attractor

327
Appendix C - References
Alligood, K. T., Sauer, T., & Yorke, J. A. (1997). Chaos: an introduction to dynamical systems:
Springer Verlag.
Casdagli, M., Eubank, S., Farmer, J. D., & Gibson, J. (1991). State space reconstruction in the
presence of noise. Physica D: Nonlinear Phenomena, 51(1), 52-98.
Elert, G. (2007). The Chaos Hypertextbook: Mathematics in the Age of the Computer. Retrieved
December 10, 2011, 2011, from http://hypertextbook.com/chaos/
Gidea, M., & Niculescu, C. P. (2002). Chaotic Dynamical Systems: An Introduction: Universitaria
Press.
Kellert, S. H. (1993). In the wake of chaos: Unpredictable order in dynamical systems: University
of Chicago press.
328
Appendix D - Winnebago County Court and Case Management
System Narrative1
Criminal Justice Information Systems (CJIS) Criminal Justice Information Systems (CJIS) are information systems connecting federal, state
and local courts, police and corrections facilities to assist in the scheduling and data sharing
needs of their participants (Dunworth, 2005). A CJIS is used to implement purposeful, effective
sanctions by criminal justice agencies((Ney & McGarry, 2006), p17). That is, they help in the
enforcement of laws by giving justice agencies the necessary information to prosecute, defend,
and punish criminals.
Justice agencies, who just a few years ago organized their operations and information in “silos”,
now see the need to integrate across agencies and share data to ensure public safety (Gil-
Garcia, Schneider, Pardo, & Cresswell, 2005). Unfortunately, the data to be shared originate
from many different sources, each with its own policies on ownership, access and control
(Fedorowicz, Gogan, & Williams, 2007). Their users come from a mix of government levels,
multiple user functions, and adjoining geographies. Additionally, each participating agency has
its own reporting hierarchy outside of the collaboration, separate funding and budget sources,
and preexisting (and usually old) information and communications technology (ICT)
infrastructure. CJIS exhibit many communication and data sharing challenges faced by a wide
range of complex cross-agency initiatives (Williams, Fedorowicz, & Tomasino, 2010).
This narrative describes how justice agencies in Winnebago County, Illinois, overcame
organizational and data sharing challenges and implemented a CJIS for court and case
management.
Court and Case Management System (CCMS) A Court and Case Management system (CCMS) is a type of CJIS that allows judicial agencies to
collaborate and share data. It automates and tracks all aspects of a court case life cycle. There
are many definitions for a CCMS due to legal differences from one court to another. In general, a
CCMS can be defined as follows (Sebutinde, 2003).
“Court and case management is the process, system or strategy by which courts and
court users organize and control the filing conduct and disposal of court cases.
Although the actual process, system or strategy may differ from one jurisdiction to
another, the bottom line is that it must be able to meet the needs of the courts and
court users and should ultimately enhance the quality and administration of
justice.”(p.3)
1 Coding is included as comments on the right side of the narrative
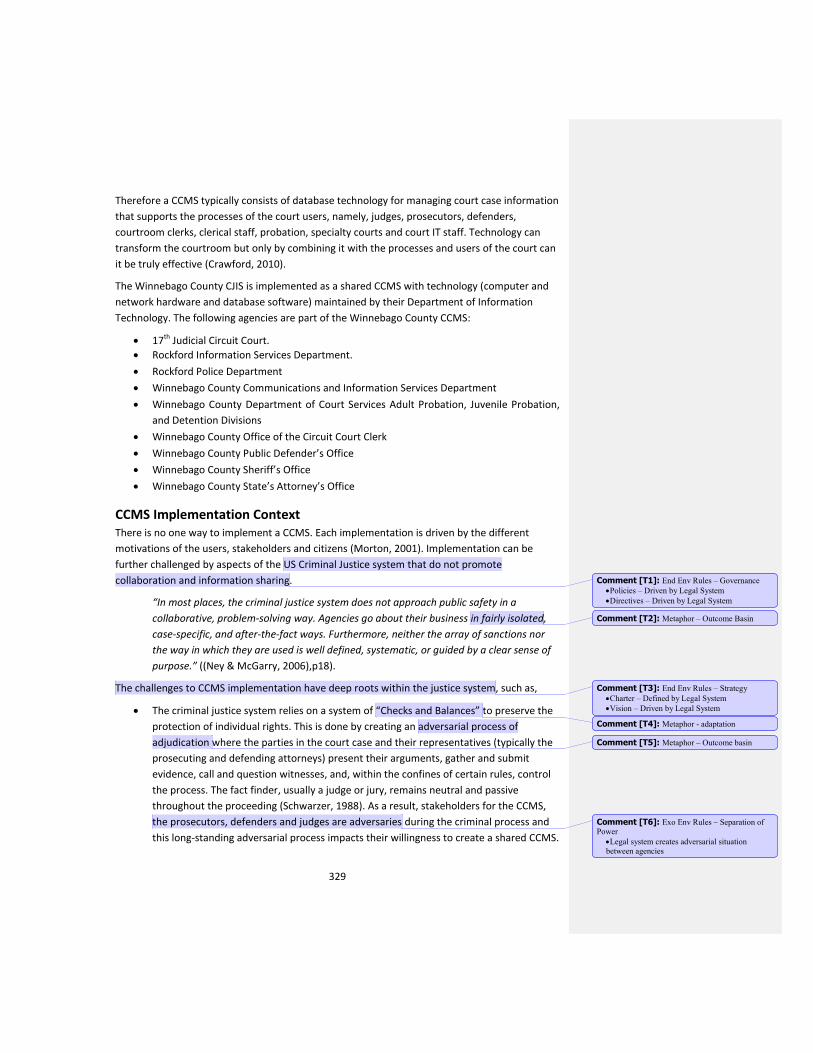
329
Therefore a CCMS typically consists of database technology for managing court case information
that supports the processes of the court users, namely, judges, prosecutors, defenders,
courtroom clerks, clerical staff, probation, specialty courts and court IT staff. Technology can
transform the courtroom but only by combining it with the processes and users of the court can
it be truly effective (Crawford, 2010).
The Winnebago County CJIS is implemented as a shared CCMS with technology (computer and
network hardware and database software) maintained by their Department of Information
Technology. The following agencies are part of the Winnebago County CCMS:
17th Judicial Circuit Court.
Rockford Information Services Department.
Rockford Police Department
Winnebago County Communications and Information Services Department
Winnebago County Department of Court Services Adult Probation, Juvenile Probation,
and Detention Divisions
Winnebago County Office of the Circuit Court Clerk
Winnebago County Public Defender’s Office
Winnebago County Sheriff’s Office
Winnebago County State’s Attorney’s Office
CCMS Implementation Context There is no one way to implement a CCMS. Each implementation is driven by the different
motivations of the users, stakeholders and citizens (Morton, 2001). Implementation can be
further challenged by aspects of the US Criminal Justice system that do not promote
collaboration and information sharing.
“In most places, the criminal justice system does not approach public safety in a
collaborative, problem-solving way. Agencies go about their business in fairly isolated,
case-specific, and after-the-fact ways. Furthermore, neither the array of sanctions nor
the way in which they are used is well defined, systematic, or guided by a clear sense of
purpose.” ((Ney & McGarry, 2006),p18).
The challenges to CCMS implementation have deep roots within the justice system, such as,
The criminal justice system relies on a system of “Checks and Balances” to preserve the
protection of individual rights. This is done by creating an adversarial process of
adjudication where the parties in the court case and their representatives (typically the
prosecuting and defending attorneys) present their arguments, gather and submit
evidence, call and question witnesses, and, within the confines of certain rules, control
the process. The fact finder, usually a judge or jury, remains neutral and passive
throughout the proceeding (Schwarzer, 1988). As a result, stakeholders for the CCMS,
the prosecutors, defenders and judges are adversaries during the criminal process and
this long-standing adversarial process impacts their willingness to create a shared CCMS.
Comment [T1]: End Env Rules – Governance
Policies – Driven by Legal System
Directives – Driven by Legal System
Comment [T2]: Metaphor – Outcome Basin
Comment [T3]: End Env Rules – Strategy
Charter – Defined by Legal System
Vision – Driven by Legal System
Comment [T4]: Metaphor - adaptation
Comment [T5]: Metaphor – Outcome basin
Comment [T6]: Exo Env Rules – Separation of Power
Legal system creates adversarial situation between agencies
330
Structurally the legal system reserves various functions to different levels (federal, state,
county, municipal) and branches (legislative, executive, judicial) of government. For
example, in Illinois, circuit courts (Winnebago County supports the 17th Judicial Circuit
Court) share jurisdiction with the Supreme Court to hear cases relating to revenue,
mandamus, prohibition, and habeas corpus (Illinois_Courts, 2012). CCMS implementers
must find ways to avoid institutional impediments and work collaboratively (Gil-
Garcia, et al., 2005) towards a common or shared objective.
There is uniqueness to delivering criminal justice unlike other Government services such
as transportation, trash disposal, or permits.
“The criminal justice system tries to fulfill our ideals about justice in the untidy
world of real life. This involves dealing with politics, human frailty, scarce
resources, and myriad conflicting and competing forces, including individual
interpretations of “justice.”” ((Ney & McGarry, 2006), p18).
Conflicting and competing forces, such as political agendas, can impede the
collaboration and cooperation required to implement a CCMS.
Typically a CCMS is centered on the processes and operation of the court clerk as they
record all official court and case data. Recently, with new initiatives to decrease crime
and recidivism more emphasis is being put on operations and agencies outside the clerk,
prosecutor, and defense, such as juvenile and adult probation and specialty courts. This
significantly increased the agencies involved in use of a CCMS and the types and
organization of court data (McKean & Ransford, 2004) and consequently makes for a
more complex CCMS implementation process.
These forces complicate the implementation of the CCMS because they impact the underlying
goals and outcomes for the system. If there is disagreement on outcomes for a system,
successful implementation is impossible.
Therefore the implementation of a CCMS is a complex problem with inherent CJIS challenges as
well as CCMS specific challenges (see Table D.1). In the next sections the implementation of the
Winnebago CCMS is described. The description is broken into six time sequential phases of the
development, initial conditions, needs determination, specification, vendor selection, system
implementation, and post “go-live”.
Initial Conditions - CCMS in Winnebago County – June 2004
Mid-year 2004 and continuing through the following year members of the Winnebago County
Criminal Justice System realized they had major problems. In the courts it was increasing
difficult for judges to get through the daily “call”, or docket. One problem was the increasing
crime rates in the county (of which Winnebago was one of the highest in the State) leading to
increased numbers of cases to be tried.
Comment [T7]: Exo Env Rules – Separation of Power
Legal functions reserved for different leves of
Gov’t
Comment [T8]: Metaphor – path dependency
Comment [T9]: Exo Env Rules – Politics
Political Agendas – Conflicting agendas can
impede collaboration and collaboration
Comment [T10]: Metaphor - adaptation
Comment [T11]: Exo Env Rules – Politics
Political Agendas – Decrease Crime & Recidivism – Expand CCMS outside Clerk
Comment [T12]: Initial Condition Exo Env Factor - Critical Event
Crisis – Increasing Crime Rates
331
From 1994 to 2004 the number of admissions to the Illinois Department of Corrections’ (IDOC)
Adult Division (and indicator of total crime) from Winnebago County nearly tripled, from 245 to
702 (see FigureD.1, D.2, D.3). Total cases tried was increasing as were pending cases, all
resulting in heavy court case loads. As the newly elected (November 2004) the County
Chairmam recalled,
“We had so much case overload in the system. We’d been one or two in crime in the
state of Illinois for 10 years, at least.”
Additionally the County Jail was overcrowded with deposed inmates as well as those awaiting
trial (see Figure D.3). Overcrowding was so severe that the County was involved in a federal
lawsuit regarding damages related to unsanitary conditions attributed to overcrowding. The
Public was very concerned. Citizens were concerned that overcrowding would cause prisoners
to be released earlier or tried less vehemently threatening their safety. As a result they
approved a 1.6% tax increase was passed (November 2002) with funds directed to construct a
new $160 million criminal-justice facility in downtown Rockford increasing the number of beds
in the facility from 394 to 1,212 (Havens, 2007).
Although Winnebago County administrators recognized there were many factors2 contributing
to increased crime rates and jail overcrowding one area of concern was the amount of time it
was taking to adjudicate cases. As in most criminal justice systems, like Winnebago County, a
case starts with law enforcement which leads to the State’s Attorney (the prosecutor) initiating
charges against the accused. In court a judge will then appoint a Public Defender to represent
the accused in future proceedings. If case information is accurate and flows from one agency to
the case can also be resolved quickly. If not, the case is typically deferred (a continuance) to
another court date. Each case then appears on the docket multiple times. A shared CCMS was
seen as a solution to these types of problems and as a way to get accurate information shared
across the agencies.
Existing Court Processes In Winnebago County the problem was further complicated by a non-standard Juvenile
Probation process which added additional delay to the adjudication problem. Winnebago’s
adjudication process starts with a probation adjustment step where the case is reviewed with
the accused and probation officer. Information from the probation officer is then be sent to the
State’s Attorney (the typical start of the adjudication process) after which a decision is made to
prosecute, or implement non-court actions such as informal probation, public service work,
restitution, or a warning letter.
“. . . we have court involved cases as well as not court involved cases, which causes an
issue when communicating with the State’s Attorney’s office.” - Deputy Director,
Juvenile Probation Division
2 The County was operating under a budget deficit. The entire state was in the midst of a no-growth
period (IGPA, 2012; Montgomery, 2004). See Figure 10.1.
Comment [T13]: Initial Condition
Exo Env Factor - Critical Event
Elections – New Administration
oBoard Chairman, Scott Christiansen elected in 2004 oCounty Clerk, Mark Gaspirini, in mid-term, election in 2006 oSheriff Richard Myers, in mid-term, election in 2006 oState’s Attorney, Paul Logli, elected in 2004
Comment [T14]: Initial Condition Agents – Courts
Case Overload
Adding to Jail overcrowding
Comment [T15]: Initial Condition Exo Env Factor- Critical Event
Crisis
Federal Lawsuit – jail overcrowding
Comment [T16]: Initial Condition Exo Env Factor-Critical Event
Public Demand - Safety
Media coverage – jail overcrowding
Comment [T17]: Initial Condition Exo Env Factor– Economics
Fiscal Timing – new tax for jail
Comment [T18]: Initial Condition Exo Env Factor– Economics
Economic Conditions – no growth
Governance Budget- deficit
Comment [T19]: Initial Condition End Env Rule – Processes
Non-standard Juvenile Probation Process
332
Probation adjustment adds steps to the criminal justice process and additional data (from the
probation officer) further complicating and slowing the entire process. Inefficiencies in the
CCMS only serve to further increase the time for case adjudication.
Unfortunately for Winnebago County their CCMS was inefficient. Agencies were all operating
independently and maintaining their own duplicate case records. There were problems with the
physical infrastructure causing connection and communications problems. Agencies had their
own databases and data transfer processes required duplication of data introducing the
potential for errors and inconsistencies.
“. . . we maintained our own {records} and we fed them over to the clerk’s office and the
connection between here and the clerk was difficult to obtain at times and I’m sure there
was a lot of keystrokes added over there when we were already doing them here. . .” –
Manager of IT Integration: Public Safety
There were also problems in ownership and sharing of data. For example, the State’s Attorney
used the clerk system but felt hostage to the clerk as they were unable to enter case data
themselves (such as the wording for charges), having to always rely on the clerk to initiate data
or data changes. The Public Defender, although an agency that procedurally never initiated data,
felt the need to have their own database so as to maintain the “checks and balances” inherent
in the legal system. Court data was stored in separate databases, or “silos”, by each justice
agency.
Inefficiencies of the CCMS were not the only contributor to the information “silos” present in
the County. There was also a legal responsibility to maintain confidentiality and security of
records. For example, Probation, Pre-trial, and Specialty Courts, although all under the
Probation umbrella were required to keep separate confidential records to maintain citizen
rights (this was particularly important for juvenile probation). Adult probation was using the
existing CCMS but juvenile probation and pre-trial were relying on paper records.
“We had computer but everything was printed out . . . it wasn’t all in one system. It was
like everybody kept their own files on their computer.” – Supervisor of the Pretrial
Services Unit
“. . . we didn’t have the ability to really do that, track restitution . . . all that kind of stuff
was paper instead of being in the system.” - Deputy Director, Juvenile Probation Division
Additionally, the Department of Information Technology (DoIT), who had the responsibility for
control and support of the Winnebago CCMS (and infrastructure), was in disarray. DoIT was not
delivering on its responsibilities. Systems were crashing and there were e-mail problems. The
County information system (all, not just CCMS) had up times in the 70% range. DoIT lacked the
processes for effective service delivery.
The CCMS in Use (1999 – 2010) As of 2004 the Winnebago Justice Agencies were using multiple different CCMS to support their
court activities. The system being used in the court room and by the Circuit Clerks was a CCMS
Comment [T20]: Initial Condition End Env Factors-ICT
Applications – JANO Inefficient
Comment [T21]: Initial Condition End Env Factors – Processes
Operations – Data “Silos”
Procedures – Duplicate Data Entry
Comment [T22]: Initial Condition Agents – State’s Attorney
Relying on Clerk
Comment [T23]: Initial Condition Exo Env Rules – Laws
Confidentiality of Data
Comment [T24]: Initial Condition End Env Factors – ICT
Database – Paper
Comment [T25]: Initial Condition End Env Factors – ICT
Networks – Highly unreliable
Agents – DoIT
In Disarray – many systems and applications
failing
333
called Clericus Magnus, from JANO Justice Systems (Jackson, Mississippi)3. JANO had been
hastily chosen in 1999 when concerns that the Y2K problem would cripple the existing
homegrown system (called Mapper). In essence it was a system supporting the clerk with
minimal support for any other agency.
“. . . the perception in Winnebago County was that the circuit clerk was the centerpiece
of all things that happen in criminal justice. . . There was dysfunctionality inside the
system . . . whereas maybe this software called JANO was servicing the clerk well, but
was absolutely useless for the public defender, the prosecutor or the court admin.” –
Chief Information Officer
JANO, and CCMS in general, tended to be clerk-centric for obvious reasons; the clerk is
responsible for recording all the case and court information. There is also the requirement of
the clerk to report information and statistics to the State of Illinois as determined by the
Director Of Administrative Services (Gulley & Pascale, 2009). Therefore JANO catered to the
recording and reporting needs of the circuit clerk, but, even as a clerk-centric system, it had
significant problems.
JANO needed to support legally mandated court and case reporting as well as aid in the efficient
and effective disposition of cases. The Chief Judge of the 17th Circuit Court (Winnebago County),
summed up his needs and frustrations with JANO recalling his interactions with the system.
“Well, as the chief judge I want to look at the cases that are pending, I want to look at by
type of case, I want to look at them by courtroom, maybe even by attorney’s and see
how long it is taking our average class X felony to resolve. How many court
appearances? How many continuances are there? Why are there continuances and at
who’s request and for what reason? . . . we’re not able to do any of those things with
specificity so we’re operating in the realm of the anecdote . . . the judge seated in that
specific courtroom needs to know this is the fifth time you’ve asked for a continuance
and see that at a glance without having to read through pages of docket sheets. . . “
Frustrations with JANO led the Chief Judge at the time (2004), the Chief Judge, to contract the
American University to do and evaluation of JANO with an overwhelming recommendation to
replace the system resulting. Yet, with the dissatisfaction with JANO and the associated
problems with court throughput, case loads, and jail overcrowding, all potentially linked to the
system, initial discussions regarding JANO did not center on replacing the system.
Culture Although Winnebago faced many problems, such as jail overcrowding and a potentially
ineffective CCMS any actions that might be taken could not sacrifice what was viewed as the
maintenance of justice in the courts. A just and fair adjudication of cases was held as the highest
goal of the justice system in the County.
3 Informants refer to the CCMS system by the company name JANO. All references to JANO refer to the
Clericus Magnus CCMS software, from JANO Systems, Inc.
Comment [T26]: Initial Condition Agents – Courts – Clerk
Using JANO
Comment [T27]: Metaphor – outcome basin
Comment [T28]: Initial Condition End Env Factors – ICT
JANO – Clerk Centrality
Comment [T29]: Initial Condition End Env Rules – Politics
Laws – Clerk enters case and court data
Laws- Clerk reports statistics to State
Comment [T30]: Initial Condition Agents – Courts
Frustrated with reporting and search capabilities
Comment [T31]: Metaphor – outcome basin
334
“. . . the courts were looking for efficiencies, but justice was important . . nothing was going to
trump justice for many folks.” – Information Technology Manager, DoIT
The service of justice within the justice agencies was equated to the timely adjudication of
cases, in particular at the management and executive levels.
“There’s a certain level of thoroughness that’s required and nobody’s willing to sacrifice
that but it’s always been a situation where you want to get justice be it criminal or on
the civil side done quicker. People have always been serious about it but the higher level
you go the more serious folks are about it.” – Deputy to the Public Defender
Therefore not only was a more efficient CCMS seen as a way to improve the operations of the
courts but also as a way to improve the service of justice to the citizens of the County.
As in many cross-agency collaborations there is a resistance to change. Regardless of the
effectiveness and efficiency of an information system there are embedded process and
information flows that are difficult to change and have strong influences on the work of the
agencies and individuals (Pardo, Cresswell, Dawes, & Burke, 2004). Winnebago County was no
exception.
“. . . there was resistance from people that liked paper. . . it’s difficult for people to
change a mindset. . .” – Senior Administrative Assistant for the Department of Court
Services
Changing the JANO system affected the use of the CCMS and the processes involved. For certain
agencies, such as probation and pre-trial, a fully integrated system meant a change in both their
processes and control (confidentiality) of data they currently enjoyed.
“{it’s} a cultural change for our department. To know that any Probation Officer,
whether they’re in Pretrial, Adult, out of the Resource Intervention Center can access the
information, and their juveniles. That was a really difficult thing. . . “ – Senior
Administrative Assistant for the Department of Court Services
With individual and agencies resistant to change, Winnebago County might have stayed with
JANO if not for the Clerk becoming aware of what was available in newer CCMS systems.
Determining Needs – GAP Analysis - June 2005 to Feb. 2006
The Impetus for Change Attendance of the Circuit Clerk at the Northeast Circuit Clerks Annual Meeting provided the
impetus for Winnebago County to consider a new CCMS (June 2005). The Circuit Clerk at the
time and the newly elected County Chairman attended.
“. . . there was a Northeast Clerk Conference that was in, I think, November or December
of 2004. . . . the topics was Integrated Court Case Management, so he came back, and
Comment [T32]: Metaphor – outcome basin
Comment [T33]: Initial Conditions End Env Rules – Strategy
Vision – “just” adjudication of cases
Comment [T34]: Initial Condition End Env Rules - Processes
Procedures – deeply embedded-resistance to change
Comment [T35]: Metaphor – path dependency
Comment [T36]: GAP
Ciritcal Events – Event
Attended NE Clerk Annual Meeting
Agents – Clerk, Chairman
Attended NE Clerk Annual Meeting
335
fostered the idea, and wanted to see ways for improvement of the current system.” –
Information Technology Manager, DoIT
Gaspirini had not gone to the conference with the intent of investigating a change from JANO,
but the conference was an eye-opener regarding CCMS. As the manager recalled,
“. . . the legacy application {JANO} was really clerk-centric. They weren’t dissatisfied
until they really saw what was out there, and they saw other vendors, and newer
technology, and the things that other systems were capable of doing. So, there really
wasn’t, as I said before, any design on replacing the system.”
Even though many of the individuals in the agencies had a comfort level with JANO,
management started pushing for a change. Although JANO was the predominant CCMS in use
only the Circuit Clerk was having its functional needs met. Other agencies were either highly
dissatisfied with JANO or using other applications with equal lack of functionality or support
(table D.2) With the information from the clerk conference, dissatisfaction with JANO, and
mounting external pressures for efficient case adjudication leading to reduced jail populations
Winnebago began the process of specifying and implementing a new CCMS.
Getting Started – GAP Analysis When County Chairman Christiansen and Circuit Clerk Gasparini had attended the Northeast
Clerk Annual meeting they heard many discussions and presentations regarding new CCMS
applications. Prevalent in these conversations was the notion of a GAP analysis to help with the
implementation of a new CCMS. For Winnebago County, a GAP Analysis was the evaluation of
the functions provided by a software system like a CCMS, compared to the operational
processes necessary to run the criminal justice system. The disconnect between software
functions and operational process requirements is known as the “gap” (Scott, 2002). County
executives made the decision to perform a GAP analysis for the existing criminal justice system.
An immediate problem presented itself when it was realized that the County neither had the
expertise for such an analysis or the resources. The GAP analysis would require an examination
of not only the JANO CCMS but also all the processes and functions in the justice system. As the
Deputy for the Criminal Bureau in Winnebago County recalled.
“Obviously with our high volume everyone has high case loads, busy court schedules and
then adding to their courtroom responsibilities the necessity to pretty much change their
whole procedures of being ready for court and what they need to do for court file
preparation was, shall I say not exactly top priority because obviously they had court
responsibilities and judges needing their work done.”
Additionally many resources were being diverted to the new jail which had initial operations
starting in 2006 further reducing resources for a GAP analysis.
County Chairman Scott Christiansen took control. Even with lack of resources and an ongoing
large jail project the he was not going to allow the GAP analysis to be delayed. Christianson
wanted not only to improve jail overcrowding with a larger jail but wanted improvements in the
Comment [T37]: GAP Outcomes – Emergence
Realization there are better CCMS than JANO
JANO needs to be replaced
Comment [T38]: GAP Agents – Chairman
Pushing for change in CCMS
Comment [T39]: GAP Outcomes – Bifurcation
Potential move to new CCMS
Comment [T40]: GAP End Env Factors – Resources
Inadequate Expertise for GAP Analysis
Insufficient staff for GAP Analysis
Comment [T41]: Initial Condition
End Env Factors – Resources
Resources/Funding diverted to new jail
336
courts, an understanding of the problems in the courts and the implementation of systems and
procedures that would allow him to monitor progress and to see that cases were adjudicated
quickly. As elected officials, he and State’s Attorney were particularly aware of the need for
quicker cases and the benefits this could have on the voting public.
As a result the Chairman, with the support of the State’s Attorney, convinced the County Board
to approve contracting MTG Management Consultants, L.L.C. (MTG) to perform a GAP Study (at
an approximate cost of $350k).
“. . . the immediate way was to just have somebody who knows what they’re doing look
at what we do, an outside person and say, okay, where are your problems? What things
do we see, as an outside or an expert in the area, you can fix and what are some
suggestions to fix.” – Deputy to the Public Defender
The GAP Study consisted of a series of on-site evaluations, meetings, and analysis over 14
months. MTG worked closely with a subject matter expert team from the Winnebago justice
agencies, known as the GAP Study Working Team made up of users and members of each justice
agency.
Important to the team and MTG was the notion that the GAP Study was not conceived with the
goal to replace the existing CCMS, JANO, but rather to evaluate the entire CJIS, including
processes and procedures. The Team strived to understand the needs and constraints on each
agency and the CCMS.
“. . .we had individual meetings beside them {MTG}. . . coming together, talking about
our needs and what we thought we could and couldn’t do based on either the law or
different rules that we had that surrounded our department.” - Special Courts
Administrator
Even though the Team and MTG attempted to remain impartial regarding the replacement of
JANO, there was an underlying sense that a new CCMS was in the works. As the County
Chairman recalled,
“I think in the back of our minds we knew that we were going to be moving to something
as a result. We just knew that we were going to be changing the court and case
management system.”
The sense that a major CCMS change might be coming acted to solidify and unify the GAP Study
Team and created an urgency and necessity for them to work together. The team members
were educating each other about their processes, problems, and future needs. The Chairman
recognized that an effective collaborating team had emerged.
“. . . {the agencies are} across the hall in many cases and had no idea what one office
operates versus the other. . . . one of the biggest benefits, I will tell you, to this whole
process, was these offices talking to each other!”
An effective collaborating Team would later prove to be a key factor in the success of the new
CCMS implementation.
Comment [T42]: Initial Condition Agents – Chairman
Desire to adjudicate cases faster in hope of decreasing jail overcrowding
Comment [T43]: GAP Agents – Chairman
Convinces County Board to perform a GAP Study
End Env Factors – Resources
$350k approved for GAP study
End Env Rule – Governance
Contracts MTG to do GAP study
Outcomes – Adaptation
Contract MTG to do GAP study
Comment [T44]: GAP End Env Rules – Operations
Meetings with MTG & GAP Study Team
Comment [T45]: GAP End Env Rules – Directives
GAP Study Working Team Created
Processes – Shared Services
Relationship – GAP Study Team Created
Processes – Meetings with MTG & GAP Study Team
Comment [T46]: GAP End Env Rules – Strategy
Vision – GAP study to evaluate entire CJIS
Comment [T47]: GAP Outcomes – Path Dependency
Sense that a new CCMS is in the works
Comment [T48]: GAP Outcomes – Emergence
Collaborating Team (GAP Study Team)
Comment [T49]: Metaphor - adaptation
337
Outcome of the GAP Study In February 2006, the final MTG GAP study report was issued containing twenty-three (23)
Technology, five (5) Organization and Staffing and thirty-one (31) Business Process improvement
recommendations (recommendations are summarized in (Table D.3). The single most
challenging and costly of these recommendations was to replace the core Court and Case
Management software, JANO (MTG, 2006).
As expected, the MTG report indicated that the problem with JANO was its clerk-centrality. It
did not support functionality required by other justice agencies and as a result promoted the
creation of information silos as each agency used or created their own system the achieve what
they needed from a CCMS.
“I think the big thing they {MTG} came back with was our court case management
system was built for the clerk but not for the other agencies of the criminal justice
system.” – Clerk of the Circuit Court
The clerk centrality of JANO was impacting the processes of the court. For example, the State’s
Attorney was very concerned that charging language was not getting into the court records
accurately since it was input by the clerks.
“. . . the reason for the GAP Study was to increase efficiency but also eliminate any of the
redundancy and human errors, to make sure that the people entering the charges are
the ones knowledgeable. . .Obviously you don’t want the clerks to be practicing law. So
as the attorneys, we’ve always looked for software that once we make the charging
decision, automatically puts in the charging language.“ - Deputy for the Criminal Bureau
The Chief Judge was very succinct in his assessment of using JANO.
“The software shouldn’t drive our practices.”
Replacing JANO was the major outcome from the GAP Study. Additionally, MTG provided an
estimate of the time and cost to implement a new CCMS. They estimated it would take
approximately 60 months at a cost of $16M. The County CIO realized that such a project would
most likely not succeed.
“We have a short attention span and I don’t mean to be rude, but I learned quickly that I
had a customer base {justice agencies and County Executives} that wanted results now
and if I start talking about a 60 month project, there’s no way I could keep that many
humans focused for that length of time.”
Even though the MTG project recommendations were most likely not feasible for Winnebago
County there was the agreement that something needed to be done and it needed to be done
quickly.
“. . . there was a very real awareness that we had to act in a fairly timely fashion
because if you do this kind of a study and then you shelve it for five years it’s utterly
Comment [T50]: GAP Outcome - Bifurcation
Recommendation to Replace the existing CCMS, JANO
Comment [T51]: GAP Outcomes – Path Dependency
Expected GAP outcome that clerk-centrality is the problem with JANO
Exo Env Rules – Politics
Political Agenda – Clerk-centric CCMS is a
problem
Comment [T52]: Initial Condition Agents – State’s Attorney
Do not want Clerks practicing law – with reference to entering charges into JANO
Comment [T53]: Metaphor – path dependency
Comment [T54]: Initial Condition Agents – Courts
Do not want software driving practices
338
worthless, you’ve wasted money and you’re not going to get anywhere.” – Deputy to
the Public Defender
As a result of the recognition of the need to move forward quickly from the GAP Study, the GAP
study Team was re-cast as the Court and Case Management Project Team and started working
on a Systems Requirements Definition using the MTG recommendations as a starting point. The
County Chairman gave project responsibility to the County CIO, with the challenge,
“. . . I wanted to see a world-class system when we got through this; someplace that the
others {Counties} would come to say, ‘This is how it’s done!
Specification - SRD Development – Feb. 2006 to Dec. 2007
The overwhelming conclusion for the GAP analysis was the need to replace JANO, but
Winnebago County needed to determine what exactly to replace it with. There were many
obstacles that needed to be overcome, including the natural hostility between the agencies and
the accepted belief that all CCMS must be clerk-centric. The GAP study uncovered the need for
an integrated CCMS that provided functionality for all the agencies, not just the clerks.
“We had to overcome the legacy system, where the clerk is the official keeper of the
records. . . if you want the most up-to-date probation information, you need to take it
from probation. . . from the siloed environment we had to train people’s thoughts into
convincing them that this is a whole system.” – Information Technology Manager, DoIT
In Winnebago County the notion of clerk-centrality of a CCMS derived from two sources. First,
clerk-centrality was implemented in JANO allowing only clerks to enter data and second, CCMS
clerk-centrality enabled the Judges further control of the courtroom. The Judges controlled the
clerks and there was a reluctance to give up control of the CCMS by allowing anyone other than
clerks to access and update case files. JANO technically facilitated clerk-centrality but the culture
in the County (from the Judges desire to remain in control) reinforced the clerk-centrality of the
CCMS. Both the technology and culture of the CCMS had to be overcome to create an integrated
system.
“. . . I think this is normal, {there is reluctance} to share power and control over systems
{between the agencies} . . . these folks are natural enemies.” – Chief Information Officer
More simply, clerk-centrality had become an accepted way of doing business for Winnebago
County. An integrated solution represented a change in the status quo that many were unwilling
to accept. As the CIO recalled,
“. . . the fact people would want this type of technological advance or advantage would
be counter to what they were used to as a society.”
Many of the agencies had implemented elaborate workarounds to accommodate their needs
using JANO and maintaining clerk-centrality of the CCMS. For example, the State’s Attorney had
Comment [T55]: GAP End Env Rules – Governance
Authority – DoIT/CIO tasked with the new CCMS project
Agents – Chairman
Assigns new CCMS project to DoIT/CIO
Agents – DoIT
Given new CCMS project
Comment [T56]: GAP End Env Stratgey – Vision
Create a world class system (new CCMS)
Comment [T57]: Initial Condition Exo env Rules – Politics
Separation of Power oLegal system creates a natural adversarial
situation between agencies
oLegal system reserves different judicial functions for different government levels
(federal, state, county, municipal)
Comment [T58]: Initial Condition Exo Env Rules – Politics
Political Agenda – all CCMS must be clerk-centric
Comment [T59]: Metaphor – outcome basin
Comment [T60]: Initial Condition ICT Infrastructure – Applications
JANO is Clerk-centric
Comment [T61]: Initial Condition Agents – Courts
Judges unwilling to give up control of CCMS (afforded by clerk-centrality)
End Env Rule – Governance
Authority – Courts Control Clerks
Comment [T62]: Metaphor – outcome basin
Comment [T63]: Initial Condition
End Env Rule – Governance
Policies – Clerk-centrality of CCMS
Comment [T64]: Initial Conditions End Env Rules – Processes
Operations – Workarounds to support JANO

339
established an office of the clerk with their office so that they could file the high number of
cases they prosecute. The clerks were physically located with the attorneys so that the SA could
prosecute more cases and minimize errors in charging language (since clerks entered the
language specified by the attorneys).
In addition to the clerk-centrality issues there was a lack of experience with integrated CCMS
that permeated the agencies. Through the GAP study the agencies were aware of what could be
done with an integrated CCMS but had no experience with generating a specification for the
system.
“One of the more difficult things was trying to determine what the needs were in an
electronic system when they had never used and electronic system. . . it was a really hard
thing to try to define the needs of the department, and how to translate those needs into
an electronic system. That was a real challenge.” – Senior Administrative Assistant for
the Department of Court Services
Lack of experience in specifying a CCMS was more acute for the agencies that had minimal use
of JANO, like probation. These agencies had difficulties defining the scope of the CCMS, with
regards to their services. They did not know what to specify since they were unable to
determine what was reasonable to include in a CCMS and what should be external.
Moving forward Winnebago County had to deal with clerk-centrality and inexperience with
integrated CCMS to develop an SRD for their system. The CIO recalled that combating these
issues required not only the SRD but a SRD development process.
“The SRD process, which took us about a year. . . we all got together; sat in a room for a
half day, minimum once a week, where everybody had to start understanding each
other’s needs, wants, desires, and business practices.”
To solve these problems Winnebago County created a cross-agency team and process for
developing the CCMS SRD.
Teams and Processes – “Heterogeneous Synthesis”
As stated previously, on February 15, 2006 MTG issued its “Recommendations Summary” draft
of the Winnebago County Justice Process Assessment Project (GAP Study). Contained in this
document were (23) Technology, (5) Organization and Staffing and (31) Business Process
improvement recommendations. The single most challenging and costly of these
recommendations was to replace the core CCMS software JANO. The GAP Study Working Team
(made up of members from justice agencies and Information Technology) had morphed into the
“Court & Case Management Project Team” and began working on the SRD (MTG, 2006).
In addition to the “Court & Case Management Project Team” (heretofore referred to as the
working team), in parallel, an executive team was formed to review the output from the
working team and make policy decisions.
“. . . there was a working team level and then an executive team level. So this working
team would meet weekly or more frequently than weekly to make progress and discuss
Comment [T65]: Initial Condition End Env Factors – Resources
Lack of experience with integrated CCMS
Comment [T66]: Initial Condition Agents – Probation
Minimal use of JANO – least experienced with
CCMS
Comment [T67]: SRD End Env Rules – Governance
Directives – GAP study Team recast as CCMS working Team
Processes – Shared Services
Relationship – GAP study Team recast as CCMS
working Team
Comment [T68]: Metaphor - adaptation
Comment [T69]: SRD End Env Rules – Governance
Directives – Executive Team Formed
Processes – Shared Services
Relationship – Executive Team formed
Comment [T70]: Metaphor - adaptation
Comment [T71]: Metaphor - adaptation
340
the project. The executive level would meet more monthly or bi-monthly. . .” – Deputy
Court Administrator
The working team consisted of at least one person from each agency that would develop the
SRD and choose the CCMS software vendor and support the actual implementation. To be on
the team members had to be familiar with the criminal justice system, in whole, and the
practices of their individual agency. Each member then reported to their corresponding
executive on the executive team.
The philosophy in creating the team was to both elicit inputs on the specific practices of each
agency, as they applied to a CCMS, and to educate the members on the practices of the other
agencies. Weekly meetings included detailed reviews of specific justice processes and
procedures and reviews of the existing SRD. The team spent hours reading the material, out
loud, making notes and modifications, and determining items that needed further investigation
for the next meeting.
“It didn’t matter who you were, we all heard everything and had just as much input on
everything.” – Manager of IT Integration: Public Safety
“. . . we all needed to be in the room all the time even if it wasn’t our issues being talked
about.” – Trial Court Administrator for the 17th Circuit Court
The working team was utilizing both the individual expertise of its members as well as
generating a collective expertise that would aid in integrating all their needs into one CCMS.
But the team did not rely solely on its internal expertise. The team analyzed systems from
several different states including the Louisiana State Courts; the City of Birmingham; Gwinnett
County Georgia; the State of Indiana; the State of Texas; and the State of Vermont. They
concluded that the Louisiana system was a close match to their needs and used it as the starting
point for developing the Winnebago County SRD.
The team also relied on standardized external software specifications to help generate the
format and details of the SRD. The format of the SRD followed the guidelines set forth by the
IEEE Standard 830-1998, “IEEE Recommended Practice for Software Requirements
Specifications.” The standard describes the content and qualities of a good software
requirements specification, and provided several sample SRD outlines. This standard aids in
specifying the requirements of software to be developed, but can also be applied to assist in the
selection of in-house and commercial software products. The Louisiana model and the IEEE
Standard not only acted as a starting point for the SRD development but also provided the team
documents for discussion and acted as a vehicle to get the members working together as a
team.
This was important because, as stated previously, the team consisted of members that
historically do not work together or cooperate with each other. In their daily jobs they are many
times adversaries representing opposite sides of a criminal or civil case. Confidentiality and
sharing of information are critical issues for each agency and aggressively protected. The team
Comment [T72]: SRD End Env Rules – Governance
Policies – Each agency will have a representative on the working team
Processes – Shared Services
Resources - Each agency will have a
representative on the working team
Comment [T73]: SRD End Env Rules – Strategy
Vision – Working team – not necessarily a rule
Comment [T74]: SRD End Env Rules – Processes
Operations – Weekly Team meetings
Comment [T75]: SRD End Env Rules – Processes
Procedures – detailed reviews
Comment [T76]: SRD End Env Rules – Processes
Procedures – Analyze CCMS from different states and counties
Comment [T77]: SRD End Env Rules – Governance
Directive – use Louisiana SRD as starting point for Winnebago SRD
Comment [T78]: SRD End Env Rules – Processes
Procedures – Use external software
specifications
341
members were now being asked to not only share information on their agency practices but also
develop an SRD for a system that promoted the integration and sharing of case data in a single
database.
“It’s a centralized database, so it was really hard for people to grasp, and there were
some struggles as far as business practices and who would update things {data}. . . there
were some checks and balances put in place to allow a comfort level of sharing a single
database.” – Court and Case Administrator
Developing the SRD for an integrated CCMS required a team of adversaries to cooperate. The
CIO used the term “heterogeneous synthesis” to describe how the SRD development involved a
process of bringing together data and people that don’t necessarily belong together. As the
team progressed through the SRD development and recognized the advantages of cooperating
“heterogeneous synthesis” become a term they used with pride to acknowledge their
accomplishment and overcome their natural tendencies to compete. Through “heterogeneous
synthesis” the working team maintained their agency autonomy yet created a SRD allowing
them to synthesize their business practices and data into an integrated CCMS.
The Special Courts Administrator, voiced the opinion of many other team members describing
the results of “heterogeneous synthesis”.
“I am absolutely amazed at how well we came together and picked something that
would work for everybody instead of saying “no” because I want what is best for me. I’m
absolutely shocked at how well we worked together; {In particular} elected officials who
have to justify what they are doing to the people that are electing them. I was really
amazed.”
Governance – who makes the decisions
In addition to the working team performing the technical evaluation of their justice processes
and potential CCMS requirements they were also given the authority and autonomy to make
decisions without always going to the executive team. The people that would ultimately use the
system were making the decision on the requirements and specification.
“{The executives} had faith in them {the working team} to make the right decisions and
very rarely were we burdened with bureaucratic yes/no votes. . . {sometimes} we had to
go back to executives and say, “we need a policy decision”, but they trusted the working
team to make appropriate decisions . . . we could manage it and understand the nitty-
gritty of why we’re making a decisions.” – Information Technology Manager, DoIT
By giving the working team the authority to specify the CCMS the SRD focused on the usage
needs of the agencies rather than a policy that might be over-ruled or become outdated in only
a few years.
Although the working team had authority to develop the SRD, governance of the process was
informal. Executives appointed members to the working team but no organizational or legal
Comment [T79]: SRD End Env Rules – Governance
Policies – Team members will share information
Directive – Working Team will create SRD
Comment [T80]: Metaphor - adaptation
Comment [T81]: SRD End Env Rules – Strategy
Charter – “Heterogeneous Synthesis”
Comment [T82]: SRD Outcomes
Bifurcation – Traditional adversaries working together as a team
Comment [T83]: SRD End Env Rules - Governance
Authority – Working team given authority to make decisions
342
mandate. Across agencies there was a conceptual agreement to contribute to the working team
but there was no binding contract. Members referred to the working team as a “cooperative”.
“The SRD was really created as a group. The entire group, not one person, signed off on
it.” – Circuit Clerk Chief Deputy
Goals
Through the process of developing the SRD the goals for the CCMS were established. In general
the goals targeted an integrated CCMS that supported the functional needs of all the agencies
while maintaining legal requirements, such as case statistics reporting, and confidentiality of
information. As a court system, the CCMS functionality was still centered on the needs of the
clerk and SA but through a shared database allowed for quicker dissemination of data and
hopefully faster court case adjudication.
Goals for the CCMS included,
Being a paperless system (as much as possible).
Support of real-time data entry and analysis.
Supply standard metrics and reporting allowing performance monitoring. For example,
when a case is initiated a report can be generated indicating how many cases are
assigned to each attorney, how many they have closed and the aging of the case files.
A Web based interface allowing for access from any internet connected computer.
o Attorneys wish to access the system on their laptops in the courtroom.
Integration into the offender jail tacking system and Police Information Management
System (PIMS). The CCMS cannot replace these systems due to legal constraints.
Minimal data entry so that records are entered in only one application and then
transferred to external applications or the CCMS internal database.
o Use data from mandated sources, such as warrants or arrest records, to
populate data fields in the CCMS database.
o Real-time transfer of data across applications. For example, if the courts cancel
a warrant entry the CCMS would automatically cancel the warrant in PIMS.
Similarly orders of protection need to be immediately transferred to PIMS so as
to maintain citizen safety.
Maintain information confidentiality related to HIPAA rules associated with the jail
medical department.
Case initiation done by both the State’s Attorney and the Court Clerk.
Standardized forms and court language
o Statutory charging language is standardized and stored in CCMS tables. When a
case is initiated charging language can be chosen from the table. Entry of the
charging language in the tables would be limited to only a few authorized
individuals.
o Form based standard documents for example, letters, warning letters,
dispositions letter, victim information, and restitution information.
Comment [T84]: SRD
End Env Rules – Governance
Directives – no formal contract or insistence for
agencies to participate in teams - cooperative
Comment [T85]: SRD End Env Rules – Governance
Authority – Working Team signs off on SRD
Comment [T86]: SRD
End Env Rules - Strategy
Vision - Goals for the CCMS developed

343
o The system will support generation of customized reports or metrics as needed
by the county without requiring support from the software vendor.
Support of public access to court information that is not confidential to individuals.
Support probation agencies. Probation data must be secure and confidential from all
other agencies (this capability is known as a Chinese wall).
o Probation requires functionality to support residency, juvenile placements, and
alternate sentencing and recidivism activities.
o Probation data must be organized by the individual, or party, in the case so that
information on movement (residency) or drug history can easily be obtained.
o Include probation interview and risk assessment pages to the system database.
The goals for the system represented a consensus view of the CCMS functionality. As the IT
project manager recalled,
“. . . we took a holistic approach, and we didn’t necessarily take what was best for the
clerk; we didn’t take what was best for the State’s Attorney, or best for the Public
Defender, or anybody else. We took what was holistically best for the whole system, and
I’m sure that some people would say concessions were made for this or that to get the
ultimate system for what we thought was going to be best for everybody.”
Crafting an SRD for approval
Equally important to creating an SRD that represented an integrated CCMS was the need to
create an SRD that would get approved by County executives. Executives trusted the working
team to construct an SRD that met the needs of the County but they were concerned that the
cost of the project would be prohibitive.
“. . . we had to sharpen our pencils because MTG {the GAP study} estimated that it could
be anywhere from $15-$16 million, and that was not palatable to the County Board. The
Chairman said, “no way. You need to refine those numbers” So we brought it down to
$6.7 million and at that point he said “Yeah, okay, I think we can present it to the
board.”” – Chief Information Officer
One issue for the working and executive teams was quantifying the return on investment for the
CCMS. There were no metrics in place for the existing system and most of the metrics in the new
system had no baseline in which to gauge progress. Additionally there was a significant amount
of funding attributed to the addition of the public defender and probation functionality, with
which the County had no CCMS experience. Since this was a new capability estimating its impact
was difficult and justifying a prohibitively large const would be difficult to get approved by the
County Board.
To get approval for the project the County Chairman had to step up and push the project
through the County Board. He knew the new CCMS was essential but also knew what funding he
could get approve by the Board. Once the SRD and project reflected that funding he went before
the Board and was able to get the project bonded and approved. On June 28th, 2006, the County
Board unanimously approved a $6.7 million project for a new CCMS.
Comment [T87]: SRD End Env Rules – Processes
Procedures – Consensus view of CCMS
Comment [T88]: Metaphor - adaptation
Comment [T89]: SRD End Env Rules – Governance
Authority – SRD approval by County Executives
Comment [T90]: SRD Exo Env Rules – Resources
Funding – Project cost prohibitive to approval
Comment [T91]: Metaphor – path dependency
Comment [T92]: SRD End Env Rules – Governance
Policies – ROI of CCMS difficult to quantify
Comment [T93]: SRD Agents – Chairman
Pushes funding through County Board
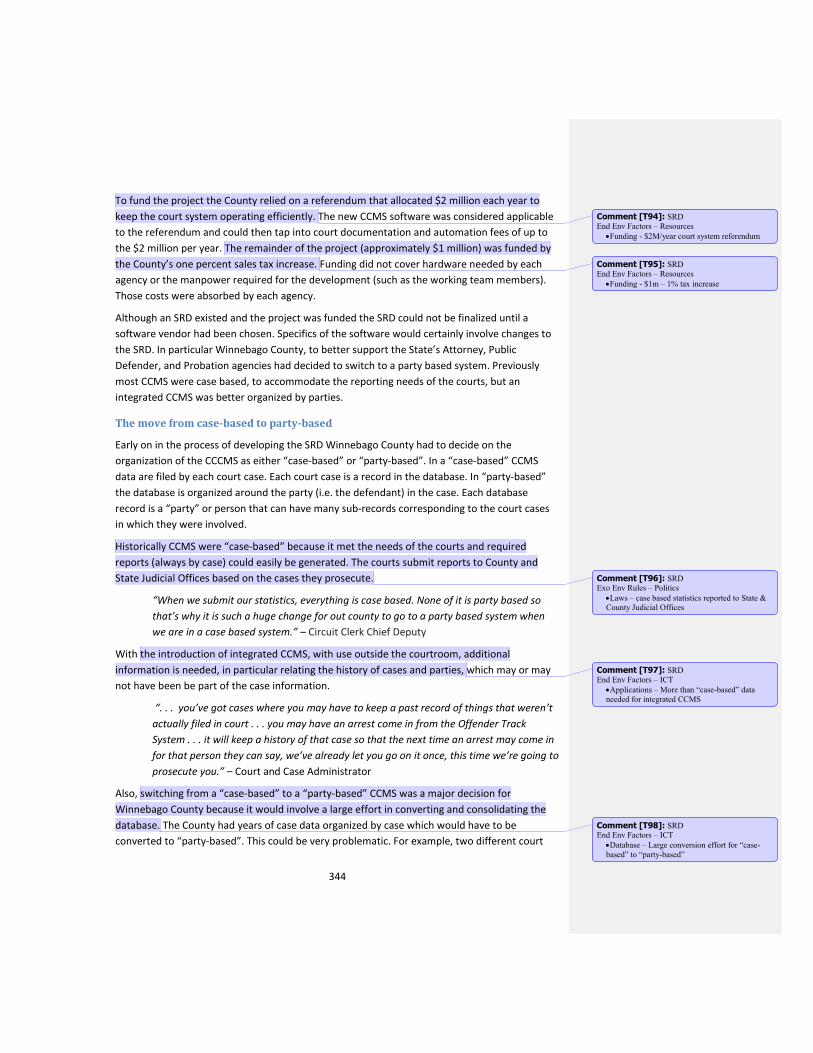
344
To fund the project the County relied on a referendum that allocated $2 million each year to
keep the court system operating efficiently. The new CCMS software was considered applicable
to the referendum and could then tap into court documentation and automation fees of up to
the $2 million per year. The remainder of the project (approximately $1 million) was funded by
the County’s one percent sales tax increase. Funding did not cover hardware needed by each
agency or the manpower required for the development (such as the working team members).
Those costs were absorbed by each agency.
Although an SRD existed and the project was funded the SRD could not be finalized until a
software vendor had been chosen. Specifics of the software would certainly involve changes to
the SRD. In particular Winnebago County, to better support the State’s Attorney, Public
Defender, and Probation agencies had decided to switch to a party based system. Previously
most CCMS were case based, to accommodate the reporting needs of the courts, but an
integrated CCMS was better organized by parties.
The move from case-based to party-based
Early on in the process of developing the SRD Winnebago County had to decide on the
organization of the CCCMS as either “case-based” or “party-based”. In a “case-based” CCMS
data are filed by each court case. Each court case is a record in the database. In “party-based”
the database is organized around the party (i.e. the defendant) in the case. Each database
record is a “party” or person that can have many sub-records corresponding to the court cases
in which they were involved.
Historically CCMS were “case-based” because it met the needs of the courts and required
reports (always by case) could easily be generated. The courts submit reports to County and
State Judicial Offices based on the cases they prosecute.
“When we submit our statistics, everything is case based. None of it is party based so
that’s why it is such a huge change for out county to go to a party based system when
we are in a case based system.” – Circuit Clerk Chief Deputy
With the introduction of integrated CCMS, with use outside the courtroom, additional
information is needed, in particular relating the history of cases and parties, which may or may
not have been be part of the case information.
“. . . you’ve got cases where you may have to keep a past record of things that weren’t
actually filed in court . . . you may have an arrest come in from the Offender Track
System . . . it will keep a history of that case so that the next time an arrest may come in
for that person they can say, we’ve already let you go on it once, this time we’re going to
prosecute you.” – Court and Case Administrator
Also, switching from a “case-based” to a “party-based” CCMS was a major decision for
Winnebago County because it would involve a large effort in converting and consolidating the
database. The County had years of case data organized by case which would have to be
converted to “party-based”. This could be very problematic. For example, two different court
Comment [T94]: SRD
End Env Factors – Resources
Funding - $2M/year court system referendum
Comment [T95]: SRD
End Env Factors – Resources
Funding - $1m – 1% tax increase
Comment [T96]: SRD Exo Env Rules – Politics
Laws – case based statistics reported to State & County Judicial Offices
Comment [T97]: SRD
End Env Factors – ICT
Applications – More than “case-based” data
needed for integrated CCMS
Comment [T98]: SRD End Env Factors – ICT
Database – Large conversion effort for “case-
based” to “party-based”
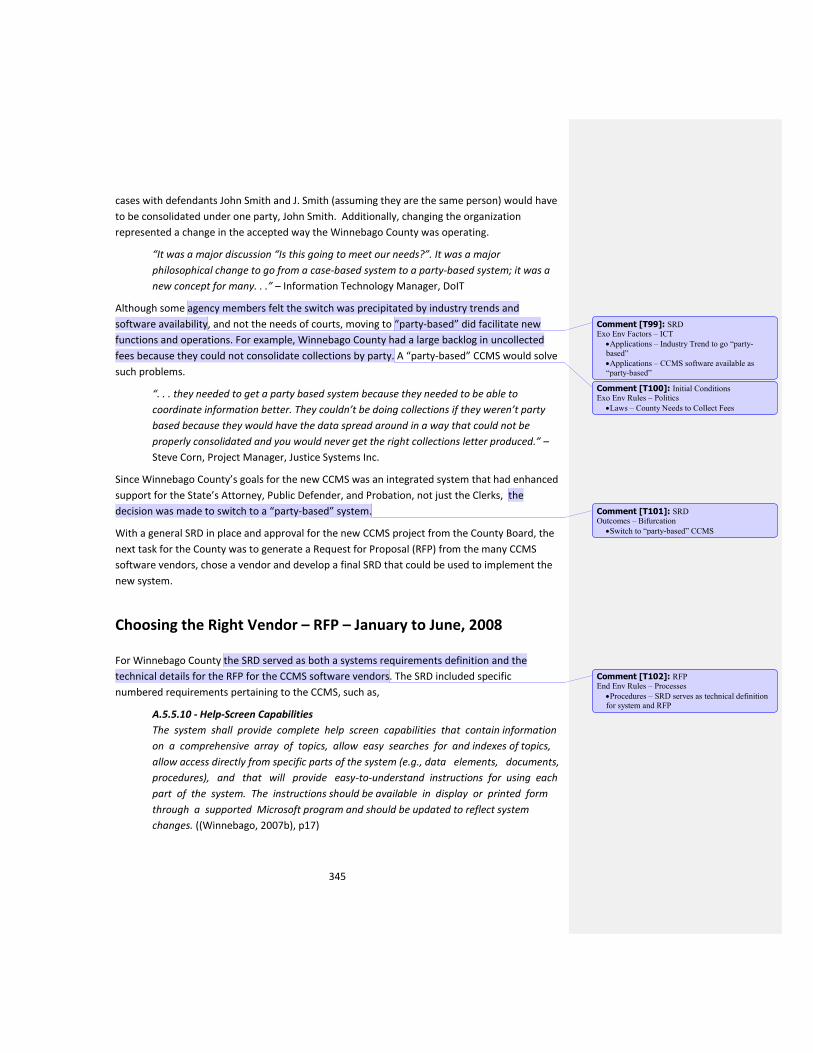
345
cases with defendants John Smith and J. Smith (assuming they are the same person) would have
to be consolidated under one party, John Smith. Additionally, changing the organization
represented a change in the accepted way the Winnebago County was operating.
“It was a major discussion “Is this going to meet our needs?”. It was a major
philosophical change to go from a case-based system to a party-based system; it was a
new concept for many. . .” – Information Technology Manager, DoIT
Although some agency members felt the switch was precipitated by industry trends and
software availability, and not the needs of courts, moving to “party-based” did facilitate new
functions and operations. For example, Winnebago County had a large backlog in uncollected
fees because they could not consolidate collections by party. A “party-based” CCMS would solve
such problems.
“. . . they needed to get a party based system because they needed to be able to
coordinate information better. They couldn’t be doing collections if they weren’t party
based because they would have the data spread around in a way that could not be
properly consolidated and you would never get the right collections letter produced.” –
Steve Corn, Project Manager, Justice Systems Inc.
Since Winnebago County’s goals for the new CCMS was an integrated system that had enhanced
support for the State’s Attorney, Public Defender, and Probation, not just the Clerks, the
decision was made to switch to a “party-based” system.
With a general SRD in place and approval for the new CCMS project from the County Board, the
next task for the County was to generate a Request for Proposal (RFP) from the many CCMS
software vendors, chose a vendor and develop a final SRD that could be used to implement the
new system.
Choosing the Right Vendor – RFP – January to June, 2008
For Winnebago County the SRD served as both a systems requirements definition and the
technical details for the RFP for the CCMS software vendors. The SRD included specific
numbered requirements pertaining to the CCMS, such as,
A.5.5.10 - Help-Screen Capabilities
The system shall provide complete help screen capabilities that contain information
on a comprehensive array of topics, allow easy searches for and indexes of topics,
allow access directly from specific parts of the system (e.g., data elements, documents,
procedures), and that will provide easy-to-understand instructions for using each
part of the system. The instructions should be available in display or printed form
through a supported Microsoft program and should be updated to reflect system
changes. ((Winnebago, 2007b), p17)
Comment [T99]: SRD Exo Env Factors – ICT
Applications – Industry Trend to go “party-
based”
Applications – CCMS software available as
“party-based”
Comment [T100]: Initial Conditions Exo Env Rules – Politics
Laws – County Needs to Collect Fees
Comment [T101]: SRD Outcomes – Bifurcation
Switch to “party-based” CCMS
Comment [T102]: RFP End Env Rules – Processes
Procedures – SRD serves as technical definition for system and RFP
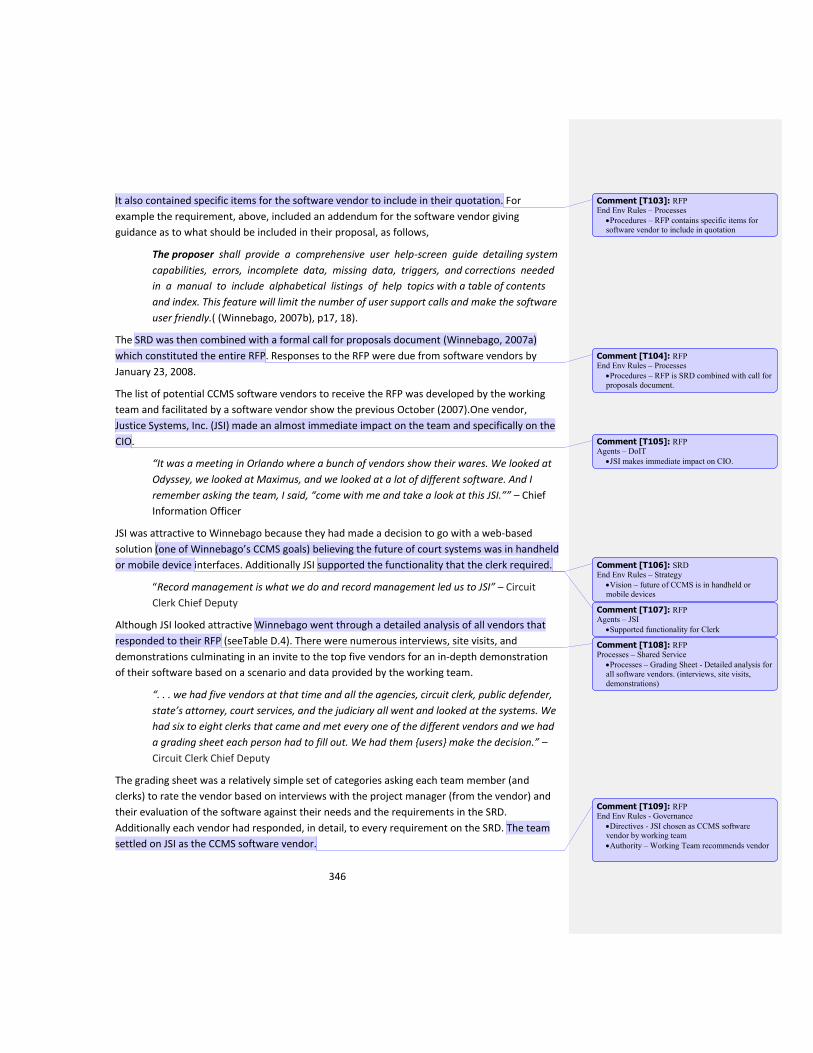
346
It also contained specific items for the software vendor to include in their quotation. For
example the requirement, above, included an addendum for the software vendor giving
guidance as to what should be included in their proposal, as follows,
The proposer shall provide a comprehensive user help-screen guide detailing system
capabilities, errors, incomplete data, missing data, triggers, and corrections needed
in a manual to include alphabetical listings of help topics with a table of contents
and index. This feature will limit the number of user support calls and make the software
user friendly.( (Winnebago, 2007b), p17, 18).
The SRD was then combined with a formal call for proposals document (Winnebago, 2007a)
which constituted the entire RFP. Responses to the RFP were due from software vendors by
January 23, 2008.
The list of potential CCMS software vendors to receive the RFP was developed by the working
team and facilitated by a software vendor show the previous October (2007).One vendor,
Justice Systems, Inc. (JSI) made an almost immediate impact on the team and specifically on the
CIO.
“It was a meeting in Orlando where a bunch of vendors show their wares. We looked at
Odyssey, we looked at Maximus, and we looked at a lot of different software. And I
remember asking the team, I said, “come with me and take a look at this JSI.”” – Chief
Information Officer
JSI was attractive to Winnebago because they had made a decision to go with a web-based
solution (one of Winnebago’s CCMS goals) believing the future of court systems was in handheld
or mobile device interfaces. Additionally JSI supported the functionality that the clerk required.
“Record management is what we do and record management led us to JSI” – Circuit
Clerk Chief Deputy
Although JSI looked attractive Winnebago went through a detailed analysis of all vendors that
responded to their RFP (seeTable D.4). There were numerous interviews, site visits, and
demonstrations culminating in an invite to the top five vendors for an in-depth demonstration
of their software based on a scenario and data provided by the working team.
“. . . we had five vendors at that time and all the agencies, circuit clerk, public defender,
state’s attorney, court services, and the judiciary all went and looked at the systems. We
had six to eight clerks that came and met every one of the different vendors and we had
a grading sheet each person had to fill out. We had them {users} make the decision.” –
Circuit Clerk Chief Deputy
The grading sheet was a relatively simple set of categories asking each team member (and
clerks) to rate the vendor based on interviews with the project manager (from the vendor) and
their evaluation of the software against their needs and the requirements in the SRD.
Additionally each vendor had responded, in detail, to every requirement on the SRD. The team
settled on JSI as the CCMS software vendor.
Comment [T103]: RFP End Env Rules – Processes
Procedures – RFP contains specific items for software vendor to include in quotation
Comment [T104]: RFP End Env Rules – Processes
Procedures – RFP is SRD combined with call for proposals document.
Comment [T105]: RFP Agents – DoIT
JSI makes immediate impact on CIO.
Comment [T106]: SRD End Env Rules – Strategy
Vision – future of CCMS is in handheld or mobile devices
Comment [T107]: RFP Agents – JSI
Supported functionality for Clerk
Comment [T108]: RFP Processes – Shared Service
Processes – Grading Sheet - Detailed analysis for all software vendors. (interviews, site visits,
demonstrations)
Comment [T109]: RFP End Env Rules - Governance
Directives - JSI chosen as CCMS software vendor by working team
Authority – Working Team recommends vendor
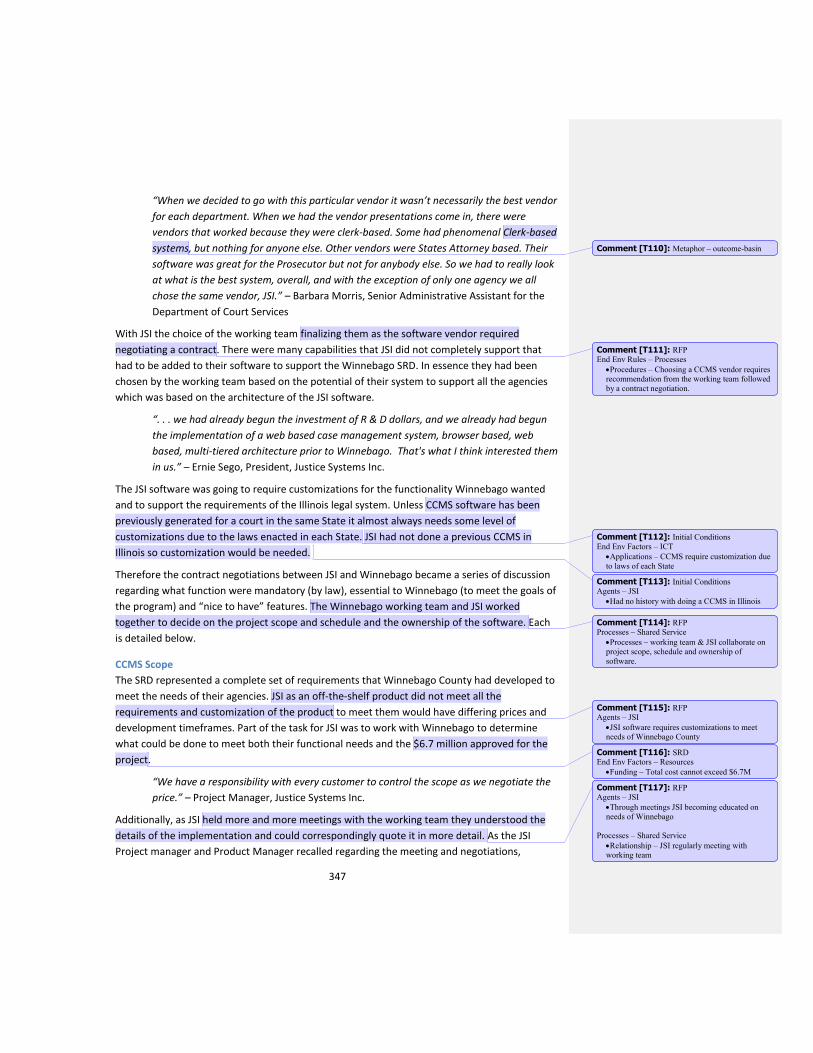
347
“When we decided to go with this particular vendor it wasn’t necessarily the best vendor
for each department. When we had the vendor presentations come in, there were
vendors that worked because they were clerk-based. Some had phenomenal Clerk-based
systems, but nothing for anyone else. Other vendors were States Attorney based. Their
software was great for the Prosecutor but not for anybody else. So we had to really look
at what is the best system, overall, and with the exception of only one agency we all
chose the same vendor, JSI.” – Barbara Morris, Senior Administrative Assistant for the
Department of Court Services
With JSI the choice of the working team finalizing them as the software vendor required
negotiating a contract. There were many capabilities that JSI did not completely support that
had to be added to their software to support the Winnebago SRD. In essence they had been
chosen by the working team based on the potential of their system to support all the agencies
which was based on the architecture of the JSI software.
“. . . we had already begun the investment of R & D dollars, and we already had begun
the implementation of a web based case management system, browser based, web
based, multi-tiered architecture prior to Winnebago. That's what I think interested them
in us.” – Ernie Sego, President, Justice Systems Inc.
The JSI software was going to require customizations for the functionality Winnebago wanted
and to support the requirements of the Illinois legal system. Unless CCMS software has been
previously generated for a court in the same State it almost always needs some level of
customizations due to the laws enacted in each State. JSI had not done a previous CCMS in
Illinois so customization would be needed.
Therefore the contract negotiations between JSI and Winnebago became a series of discussion
regarding what function were mandatory (by law), essential to Winnebago (to meet the goals of
the program) and “nice to have” features. The Winnebago working team and JSI worked
together to decide on the project scope and schedule and the ownership of the software. Each
is detailed below.
CCMS Scope
The SRD represented a complete set of requirements that Winnebago County had developed to
meet the needs of their agencies. JSI as an off-the-shelf product did not meet all the
requirements and customization of the product to meet them would have differing prices and
development timeframes. Part of the task for JSI was to work with Winnebago to determine
what could be done to meet both their functional needs and the $6.7 million approved for the
project.
“We have a responsibility with every customer to control the scope as we negotiate the
price.” – Project Manager, Justice Systems Inc.
Additionally, as JSI held more and more meetings with the working team they understood the
details of the implementation and could correspondingly quote it in more detail. As the JSI
Project manager and Product Manager recalled regarding the meeting and negotiations,
Comment [T110]: Metaphor – outcome-basin
Comment [T111]: RFP End Env Rules – Processes
Procedures – Choosing a CCMS vendor requires recommendation from the working team followed
by a contract negotiation.
Comment [T112]: Initial Conditions
End Env Factors – ICT
Applications – CCMS require customization due
to laws of each State
Comment [T113]: Initial Conditions Agents – JSI
Had no history with doing a CCMS in Illinois
Comment [T114]: RFP Processes – Shared Service
Processes – working team & JSI collaborate on project scope, schedule and ownership of
software.
Comment [T115]: RFP Agents – JSI
JSI software requires customizations to meet needs of Winnebago County
Comment [T116]: SRD End Env Factors – Resources
Funding – Total cost cannot exceed $6.7M
Comment [T117]: RFP Agents – JSI
Through meetings JSI becoming educated on
needs of Winnebago
Processes – Shared Service
Relationship – JSI regularly meeting with working team
348
“. . . they enlightened us a little bit more in those meetings and we learned this really
means a little bit more than we thought and here is the price on that.”
“All RFPs are pretty vague. The devil is really in the details and I think it is difficult for any
client to put all the details in a RFP.”
Working with JSI the Winnebago working team was able to define the scope of the project and
produce sufficient information to enable JSI to plan and quote the CCMS project.
Ownership of Software
One of the things that attracted JSI to developing the Winnebago CCMS was the fact that much
of the functionality that was in the SRD, but not yet implemented by their software, was on their
product roadmap. They had planned to implement these functions and the Winnebago project
presented itself as a way to enhance the product and receive at least partial payment for the
development costs.
“. . . we were just waiting for funding to move to this architecture. So we would have
gotten there eventually Winnebago just got us their faster.” – Product Manager, Justice
Systems Inc.
JSI stipulated they retained the rights to any modifications to the software but since this
enhanced the product they gave preferential pricing to Winnebago.
“. . . it’s still our system. . . {for example} now there’s imaging as a specific part of
probation, so a Kansas court could use Full Court Enterprise now and they will have
imaging as a part of probation as part of the standard product. Winnebago County
specifically paid for that because it’s not something we had before . . . but they get some
benefit from that {pricing}. So it goes both ways.” – Project Manager, Justice Systems
Inc.
In particular, at the time of the negotiations the State of Illinois indicated they might be
interested in deploying the Winnebago CCMS State-wide. This would be a big and profitable
project for JSI if it occurred. The lure of a State-wide project made JSI more aggressive in how
they structured the project with Winnebago.
“It helped us out a lot and JSI definitely understands the market for court and case
management systems in Illinois. . . There’s a lot of counties that need new systems.” –
Circuit Clerk Chief Deputy
Therefore an additional way for Winnebago County to balance the functionality of the CCMS
(meeting the SRD) and the approved funding was to allow JSI to own many of the
customizations, including them as part of their next generation product, and resell them to
other customers.
Project schedule
In addition to adjusting and negotiating the scope and ownership of the software the
development schedule could also be modified to meet Winnebago’s needs and create an
acceptable project for JSI. Not all SRD requirements needed to be implemented for the initial
Comment [T118]: Metaphor - adaptation
Comment [T119]: RFP Agents – JSI
Most of Winnebago customization already on JSI product roadmap
Comment [T120]: RFP Processes – Relationship
JSI retains rights for software in exchange for preferential customization pricing to Winnebago
Comment [T121]: RFP
End Env Factors o ICT
Applications – State of Illinois considering JSI
for state-wide implementation
Comment [T122]: RFP Agents – JSI
Aggressively price implementation with potential for state-wide business
349
release (called a “go-live”) of the CCMS. The complete functionality could be “phased in” over a
series of software releases. This had two benefits for the project, first, Winnebago did not have
to absorb cost of JSI adding additional resources to meet a demanding, single release schedule,
and second, JSI could more efficiently and cost effectively schedule their existing resources over
the phases. This was particularly important for resources with specific expertise that could not
execute difficult technical tasks in parallel.
“Most times we could come up with the resource to make it happen in the timeframe, it
was only rarely when we said, if you want this then it effects the launch date and price.
In most cases where we did that, they said they would live with it after the launch date.”
– Project Manager, Justice Systems Inc.
As a result of these negotiations JSI worked with Winnebago to structure a project with
functionality introduced in phases meeting Winnebago’s SRD and project funding limits. As the
County Chairman stated,
“It ended up being $6.7 million, so we did a god job with our vendor getting it down to
what we needed”
The JSI CCMS Solution The final contract executed with JSI included many modifications to two existing JSI products,
FullCourt Enterprise and FullCase. FullCourt Enterprise was the case management software and
provided the back-end infrastructure, a browser-based user interface, and collection of modular
tools and applications (many specific to Winnebago). It included services; initial custom
configuration, deployment, and consulting services and ongoing training, technical support, and
help desk capabilities. FullCase was the specific application for the clerk and State Attorney and
linked into FullCourt Enterprise. JSI also provided a service bus which allowed for linking external
applications, such as the Police OffenderTrack into the CCMS database.
For developing and installing the software, converting the data from the legacy CCMS and
training Winnebago JSI would receive approximately $2.6M with an additional $1.1M for
services for support and maintenance over the first five years. Even though a great deal of effort
had gone into Winnebago choosing JSI and JSI structuring the development project it still was an
imperfect solution. As the Circuit Clerk recalled JSI may have underbid the project.
“I think from the vendor standpoint, they didn’t realize how big of a project the
conversion was going to be. We converted 1.8 million cases. That’s a lot and I think they
underbid that a little bit.”
Regardless, JSI and Winnebago executed an initial contract on June 27, 2008 and the CCMS
project officially began. The development was scheduled to complete on January 2010.
Including the six months Winnebago had used to develop an RFP and reach an agreement with
JSI, the development was scheduled to take two years.
Comment [T123]: Initial Conditions End Env Factors – ICT
Applications – not all CCMS functionality needs to be present at initial release – functionality can
be phased in.
Comment [T124]: Metaphor - bifurcation
Comment [T125]: RFP Outcomes _ Adaptation
Project structured in phases to accommodate functionality and funding needs
Comment [T126]: RFP Agents – JSI
CCMS to be implemented with customized version of JSI product FullCourt Enterprise and
FullCase
Comment [T127]: RFP Processes Shared Services
Relationship – Contract between JSI &
Winnebago 6/27/2008
Comment [T128]: Imp
End Env Rules – ICT
Applications – “go-live” January 2010
350
System Implementation - CCMS Development – Jun. 2008 to
Nov. 2010
Project Kickoff and Initial Development The kickoff of the project did not mean that Winnebago County and JSI had a detailed product
definition that JSI could work against. The process of developing and SRD and modifying it
through the RFP process had created enough details on the new CCMS to develop a project
schedule and a cost quotation (from JSI) that the executive team could use to get approval from
the County Board. The SRD and RFP process had created a project that both Winnebago and JSI
could approve meeting the $6.7 million budget. It did not create a CCMS specification with
enough detail to implement.
This development environment was not new to JSI. They would replicate a design methodology
they had used successfully in previous developments depended on regular meeting with the
users of the system, in this case the Winnebago working team, to review and discuss the details
of the implementation.
“{we visited Winnebago} once a month if not every other month for over a year
gathering specification, detail design, and change management. . . we also had a
programmer back home working conversion issues. . . and a development team doing
the code.” – Product Manager, Justice Systems Inc.
As Todd Hughes, DoIT Project Manager recalled they did not have a project plan, but rather
considered the design an iterative process, meeting with JSI and updating the design
specifications based on the inputs from the agency members on the working team with
guidance from JSI on what could be achieved with the technology and estimates of the impact
on costs and schedule for certain customizations.
The Winnebago working team met for one half day every Wednesday, for an extended day once
a month, and for an entire week when JSI visited (which was close to monthly for the first two
years of the development). The working team discussed the needs of each agency and
recommended or suggested specifications or modification but DoIT positioned themselves as
the main interface to JSI.
“I would say that one of the things about JSI, part of the process was that they don’t just
take the suit off the rack and hand it to you. They tailored it to fit you but as things go
sometimes that needs to be adjusted as you go down the road. IT handles that for us. . .
when we’re looking at adjustments we express that to the group and to IT and then IT is
the one that actually does the work with JSI to create those changes.” – State’s Attorney
Getting the agencies to trust them and represent them to JSI was a major accomplishment for
DoIT. Just a short time earlier, prior to Augustus Gentner becoming CIO, the department was in
disarray with major problems with relatively simple applications such as e-mail. With the arrival
of Gentner he realized to be successful he needed the confidence of the agencies. They needed
Comment [T129]: Imp End Env Rules- Processes
Procedure – RFP/SRD does not have sufficient detail for implementation
Comment [T130]: Initial Conditions Agents – JSI
Experienced with iterative design processes
Comment [T131]: Imp End Env Rules – Processes
Procedures – Implementation to be an iterative design process
Comment [T132]: Imp Processes – Shared Services
Relationship – Working team meets with JSI for
entire week when JSI in town – More than previously
Comment [T133]: Imp Agents – DoIT
Main interface to JSI
Comment [T134]: Metaphor - adaptation
351
to trust him and his team (DoIT) to manage and implement the new integrated CCMS. To build
that trust he brought in new staff and then solved all the outstanding IT problems. He showed
the agencies he had an effective team in place.
“So I wound up replacing the staff, hiring competent people and I also went after the low
hanging fruit. As an example, email system was only up 73% of the time based on 24/7
365. I isolated why that was happening, made the appropriate technical and
administrative interventions and produced 100% all the time.” – Chief Information
Officer
By fixing the existing IT problem’s DoIT had proved to the agencies that they could manage a
complex undertaking like a new CCMS and take on a lead role in the development.
With DoIT leading, the working team collaborations became key to the development of the
CCMS. Not only was agency specific information getting to JSI but the team members continued
educating each other on each agencies needs and working together to specify the details of an
integrated system.
“{The CCMS is} not a byproduct of this new computer system or court and case
management software but it’s a byproduct of the work we did together as a team” -
Special Courts Administrator
Through the meetings the working team, DoIT, and JSI came to consensus on how the CCMS
would work. It also challenged the members to think about the system differently, not from
their own perspective, but as an integrated system for everyone. Additionally, by meeting as a
group the members recognized who were the experts in different areas and knew who the “go-
to” people were for different questions or information.
Although all team members extolled the meetings as the key to the CCMS development, oddly,
not all members attended regularly. In fact members from the State’s Attorney’s office and the
Judges rarely attended the meetings. This was frustrating to members of the working team
because it delayed decisions (since potentially the decision makers were not present) and it
decreased the dissemination of information on the practices of each agency.
“. . . decisions that should have been made during the meetings. . . I had to go back and
say, “we’ll get back to you”. . . that was kind of upsetting. . . it would benefit the
attorneys if they had been at the meetings to understand the whole system.” – Records
Supervisor, State’s Attorney’s Office
The State’s Attorney and Judges did not attend meetings because of the high case loads in the
courts (it was not unusual for a day’s docket to have over 100 cases to try). Although they had
valid reasons for not attending this caused problems for the CCMS development and later use.
For example, the judges flatly refused to use the implemented courtroom notes capability built
into the system despite the best efforts of the working team to specify this functionality. The
team needed judges present to get it right. The effort, schedule time, and cost of this
functionality were wasted.
Comment [T135]: SRD
Agents – DoIT
New staff, with more experience, brought in.
End Env Factors - ICT
Network – DoIT resolves all outstanding ICT problems (non-CCMS).
End Env Factors - Resources
Staff – DoIT staff replaced with more experience
people
Comment [T136]: Metaphor – path dependency
Comment [T137]: Imp End Env Rules – Governance
Authority – DoIT takes on leadership role during implementation
Agents – DoIT
Agencies trust DoIT to lead project
Comment [T138]: Imp Processes – Shared Service
Processes – meetings serve dual purpose,
detailed specification and education
Comment [T139]: Imp Outcomes – Emergence
CCMS emerges from team effort
Comment [T140]: Imp Outcomes – Adaptation
Team members view CCMS not just from their
own perspective but as an integrated team
Comment [T141]: Imp
Outcomes – Emergence
Certain team members emerge as “go-to” people
for information
Comment [T142]: Imp Agents – Courts
Judges rarely attend meetings now that imp has started
Agents – State Attorney
Attorneys rarely attend meetings now that imp has started
Comment [T143]: Imp Processes – shared service
Relationships – less effective working team
meetings because judges and SA are not attending
Comment [T144]: Imp Agents – Courts & States Attorney
Continued high case loads
Comment [T145]: CCMS Outcomes – Path Dependency
Judges not using notes capability
352
The aggressive schedule Winnebago County had adopted was also impacting the development.
The GAP study called for development of this CCMS to take as much as five years. Winnebago
was trying to accomplish it in only two years. County executives such as Chairman Christiansen
and CIO Gentner had pushed for an aggressive schedule because for Board approval but also
because they needed to maintain urgency to the development so that it would get the attention
it needed from the agencies and JSI.
Additionally, now that they had chosen JSI as their new CCMS vendor there was a fear that they
would lose all support for their existing JANO system (Maximus, the parent company for JANO,
had bid the project, but lost to JSI). A long development schedule would expose them to
potential support problems with JANO.
To accommodate the aggressive schedule JSI was implementing the essential functionality of the
system first, mainly applications for the Circuit Clerk and State’s Attorney, and putting the other
functions at a lower priority that could be implemented after the planned CCMS launch date.
This made for a feasible schedule but the schedule was still so tight JSI could not afford to invest
time to fully understand functions other than the Clerk and State’s Attorney. Understanding
these other agency needs required more than just implementation from documents, but actual
hands-on experience, which they could not afford, schedule-wise.
“. . . it’s one thing for me to explain to you, “Here’s what to do,” but it’s another to
actually come and see what we do. That would have made a huge difference. We
wouldn’t be having a lot of the problems we are currently having if they {JSI} would have
just come for four hours, not even, just a couple of hours. . .” – Supervisor of the Pretrial
Services Unit
Although Winnebago County, under the leadership of the DoIT department, had assembled a
highly effective collaboration process between all members of the CCMS development team the
the day-to-day demands of the courts and the aggressive schedule of the project decreased the
collaboration from some agencies and JSI. They were not reaping the full benefits of the process
they had worked so hard to put in place.
Managing Scope Creep With the CCMS development progressing as an iterative process of monthly adjustments based
on the results of team meetings it was expected that there would be a natural tendency to solve
problems by doing additional customization or adding features. This would increase the scope of
the project and eventually invalidate any schedule or budgets previously approved. Both
Winnebago County and JSI recognized the need to control scope creep.
“They were really good about staying within the bounds that they had specified which
made it possible for us to stay within the bounds we specified.” – President, Justice
Systems Inc.
It was imperative that all parties control scope creep because the aggressive schedule would
only magnify its impact on the project. When working under a tight schedule any problem or
Comment [T146]: Imp Processes – Shared Services
Processes – Aggressive schedule adopted
Comment [T147]: Imp End Env Rules – Strategy
Vision– Christiansen & Gentner push for aggressive schedule to maintain sense of urgency
in agencies
Comment [T148]: Imp End Env Factors – ICT
Applications – fear legacy CCMS will fail and not be supported
Comment [T149]: Imp Processes – Shared Services
Processes – implement essential functionality first
Agents – JSI
Implementing Essential functionality first
Comment [T150]: Imp
Agents - JSI
JSI with insufficient time to fully understand or
implement functionality outside Clerk and SA
Processes – Shared Services
Relationship – JSI spending less time with agencies outside Clerk and SA
Comment [T151]: Outcomes – Emergence
Decreased collaboration between agencies
Outcomes – Bifurcation
Less collaboration among agencies
353
additional task becomes noticeable since there is no slack in the schedule to accommodate the
new work.
“So when you are pushing a time table that much you’re going to run into issues that you
probably wouldn’t run into if you were spreading it out. Has it been a hurried project?
Yes.” - Manager of IT Integration: Public Safety
As JSI did the development inevitable unanticipated problems were fixed by further
customizations and additional features. Although unintended, project scope was increasing. As
a result DoIT started asking agencies to accept delays of their functionality into later CCMS
releases after the first “go-live”, in essence controlling the project scope for the initial launch.
Clerk and State’s Attorney functionality, was given implementation priority and was now going
to be the critical items for the CCMS launch.
“The original contract said you can have all these things and there’s the target
timeframe. Then there are adjustments, things get negotiated and we {JSI} want to push
out the launch date. They {DoIT} say “no, we want these in, but we’re willing to live with
them after the launch date.”” – Project Manager, Justice Systems Inc.
The short term solution was to delay functionality to accommodate the January 2010 launch
date. Post “go-live” this would create mounting frustrations with the lower priority agencies as
they continued to wait for their functionality.
Even with the frustrations with certain members not attending team meetings and delaying
functionality all team members were committed to making the project a success and considered
the project on track and running as smoothly as possible. As software problems were uncovered
they were analyzed and fixed but a larger problem, having nothing to do with the software,
threatened the project.
Data Conversion Going into the project both Winnebago County and JSI knew that data conversion would be
difficult. What they did not realize was the complexity of the problem and how many different
databases had to be converted. What was thought to be a conversion of five legacy databases
turned into much more complex task.
The clerk had data that was resident on JANO and from the prior (Mapper) legacy system that
also had to be converted. Juvenile Probation was on a different system than Adult Probation and
likewise the Public Defender and State’s Attorney had their own systems. There was data on
cases, fees, fines, and finances. Some of the data was incomplete and some required combining
multiple cases to get one complete case record. Then, once the case data was compiled it had
to be re-converted into a party based organization.
“You’ve got to bring all those images over into a new imaging environment and
document management environment and index them to the right cases. But the images
were over her; party information was in one place for the court; party information for
Comment [T152]: Imp
End Env Rules – Governance
Directives – no clack in schedule to
accommodate new work
Comment [T153]: Matpahor - Birfurcation
Comment [T154]: Imp End Env Factors – ICT
Applications – Project scope increasing due to unanticipated problems requiring fixes
Comment [T155]: Imp End Env Rules – Governance
Directives – Agencies being asked to accept
delays to promised functionality
Agents – DoIT
Asking agencies to accept delays to promised functionality
Comment [T156]: Imp End Env Factors – Governance
Directives – Clerk and SA functionality given
implementation priority
Directives – Clerk and SA functionality Critical Specification for launch
Comment [T157]: Imp
Processes – Shared Service
Relationships – Agencies committed to making
project success.
Comment [T158]: Imp Outcomes – Emergence
Realization data conversion effort was under-estimated
Comment [T159]: Imp End Env Factors – ICT
Database – Need to convert 5 different legacy
databases
354
the Prosecutor was in a different place. It all has to fit together into a party based
integrated justice environment.” – President, Justice Systems Inc.
Further complicating data conversion was the need to convert at least part of the data in a very
short time. The Winnebago CCMS “go-live” was to be accomplished over a weekend with JANO
being replaced while court was not in session. Therefore active case data must be converted in
two days. JSI had to implement an automated data conversion procedure to convert all the data.
“We had to work in conjunction with Winnebago to say how we get from A to N. What’s
the rule? Is it always this way in the old system? And they would come back and say
either yes or they would say sometimes it’s here and sometimes it’s there and sometimes
this and sometimes it’s that, and we would write the code” – Product Manager, Justice
Systems Inc.
For JSI data conversion became a project unto itself requiring specification, software
development, and supporting hardware.
“It took us months of just solid computer time, just systems running hard to get the
images out and through a filter and into the environment that is there now. We had to
start months in advance of the projected go-live date.” – President, Justice Systems Inc.
In total JSI converted data on over 1.8 million cases. The conversion process they put in place
correctly converted 99.7% of the cases and 99.6% of the parties but due to the size of the
database this meant approximately 6,000 cases and 8,000 parties would have to be manually
adjusted. This task would fall to Winnebago County.
Such a large problem could have spelled doom for the project. Both JSI and Winnebago had to
absorb the cost of the problem and it would have been easy for them to try to assign blame and
in JSI’s case ask for additional funds or Winnebago’s more resources from JSI. Instead both
simply addressed the problem and worked through getting it done. For Winnebago County
there was no going back, they had to get this system up and running. Similarly JSI needed this
system to further their product line.
“We built it in such a way that we could resell it. We could reuse it in Kansas, in Idaho. .
.” – Product Manager, Justice Systems Inc.
Just as the Winnebago working team continued collaborating and cooperating with each other,
even when encountering frustrations and problems Winnebago County and JSI maintained their
strong partnership as they worked through the problems and issues with the CCMS
implementation. Unfortunately, the problems did not come without some cost. Meeting the
January 2010 “go-live” was looking doubtful.
Pushing for completion – schedule slips With only a few months left until “go-live” it became clear the January 2010 date was not
feasible. JSI had installed three versions of the CCMS at Winnebago, one for development (DoIT
had to develop certain tables and user scripts), one for test, and one for training. The court
clerks were running scenarios on the training version and running into major problems.
Comment [T160]: Imp End Env Factors – ICT
Database – Need to convert part of legacy databases over a very short time (days)
Comment [T161]: Imp Outcomes – Emergence
Data conversion emerges as separate project
Agents – JSI
Data conversion treated as separate project
Comment [T162]: Metaphor - Bifurcation
Comment [T163]: Imp End Env Factors – ICT
Database – 6,000 cases and 8,000 parties need to
be converted manually
Comment [T164]: Imp Processes – Shared Service
Relationship – JSI and Winnebago maintain collaboration despite implementation problems
Comment [T165]: Imp Agents – Clerk
Running scenarios on test CCMS and encountering problems
355
Additionally the State’s Attorney capability was not yet implemented and Winnebago did not
want to go live with them running on a separate system.
“We knew we weren’t going to make it. We didn’t have the things we had established as
absolutely mission critical implemented and ready to go on the system, so we moved the
launch date to April 1st, 2010.” – Information Technology Manager, DoIT
Even April 1st proved to be a challenge. Critical to launching the CCMS was the clerk functionality
regarding assignment of fees and fines. Winnebago already had a large backlog in fines
collections and they did not want to make the situation worse by creating a backlog in assigning
the fees due to non-functionality in the court system.
“As we got closer to the go-live date, tension really built on both ends; the vendor is
under the gun to get everything functioning and the departments are under the gun to
get something they know they can really use; particularly the Clerk, because they are
dealing with money; the money issue was big . . . recording all the things happening in
court; it just wasn’t very pretty.” – Senior Administrative Assistant for the Department of
Court Services
As a result the schedule was slipped once again and a new “go-live” date was set at April 26,
2010.
Failed “go-live” On Thursday April 22, JSI and DoIT began the process of launching the new CCMS. The plan was
to convert all court data, from the legacy systems, from close of business on Wednesday and
manually enter Thursday’s and Friday’s data over the weekend. All seemed to be going
smoothly. The conversion process was completed and the new system was running on Saturday.
Unfortunately, when the Clerks came in to enter Thursday’s and Friday’s data the system failed.
One operation would lock the database tables disabling anyone else from using the system. The
system could not be launched with the problem.
“. . .We would do load tests, where we would spend from 7:30 to 8:00 in the morning
getting every user we could on the system and process cases as you would in a normal
day ; it’s hard to ask people to do that. . . obviously we didn’t get a full test. The testing
didn’t bring the problem to light.” – Information Technology Manager, DoIT
The actual problem was minor, a defect in a low-level JAVA driver for the database. Within one
day the problem was fixed but the new CCMS would not be available for the following Monday,
April 26th as planned.
“. . . we were on a minute-to-minute timeline. And so everybody said it’s better to come
up with a new target date.” – Project Manager, Justice Systems Inc.
Winnebago activated their contingency plan and rolled back the legacy system for the start of
the business on Monday. When the courts opened that day they were operating on JANO.
Comment [T166]: Imp End Env Factors – ICT
Applications – New CCMS having many problems in test
Comment [T167]: Imp
End Env Rules – Governance
Directives – Will not “go-live” without SA
functionality implemented.
Comment [T168]: Imp Critical Events – Crisis
“go-live #1 cancelled
End Env Factors – Governance
Directive – “go-live” #2 = April 1, 2010
Comment [T169]: Metaphor - Bifurcation
Comment [T170]: Imp End Env Rules – Governance
Directives – Clerk fines and fees functionality must be working at “go-live”
Comment [T171]: Imp Critical Events – Crisis
“go-live #2 cancelled
End Env Factors –Governance Directives– “go-live” #3 = April 26, 2010
Comment [T172]: Imp Critical Event – Crisis
“Go-live” #3 fails
Comment [T173]: Imp End Env Factors – ICT
Applications – “go-live” #3 occurs
Comment [T174]: Imp
End Env Rules – Governance
Directives – Contingency plan activated
356
Although the failed “go-live” was tremendously disappointing to DoIT and JSI the reaction from
most team members, the executive team, and the County Chairman was very calm.
“I don’t think there was a “told you so,” it was kind of, “Well, we’ll get it fixed.”. . . it was
more embarrassing than anything.” – Information Technology Manager, DoIT
“I’m talking about everybody, Chairman Christiansen, Joe Bruscato; all the players that
were brought in whether they are the political team or the working team or the clerks or
the technology guys. Everybody said well crap that sucks let’s move to the next game . . .
everyone was really good about moving forward.” – Project Manager, Justice Systems
Inc.
Team members were particularly unfazed by the failure, if not relieved. Many members felt the
April date was never really going to happen. Also, many believed users were not really prepared
for the launch, so the failure gave them more time for training and preparations.
“I never thought it was going to happen on time anyway” – Dave Doll, Deputy to the
Public Defender
“I was somewhat relieved because I didn’t feel we were ready in April” – Trial Court
Administrator for the 17th Circuit Court
“We were so grateful it didn’t happen. We had no training.” – Supervisor of the Pretrial
Services Unit
“I think by the time we got ready for go-live you didn’t have a feeling you had your head
wrapped around it, exactly the way you wanted to, and you hadn’t had that intensive
training that we needed. . .” – Deputy Director of the Adult Probation Department
The only impact of the failure on the agencies was the extra work for the clerk to enter the last
two days data into JANO. Otherwise the agencies were going back to operating as they had for
the past ten years. The failure had very little impact on the agencies.
Winnebago had publicized the “go-live” with press releases and announcements and now had to
go public with the bad news. Fortunately the impact of the failure on the County citizens was
almost non-existent. The public interface to the system was still the same and for most the
failure was something they read or heard about and shrugged off. Similar to the agencies,
citizens were not affected by the failure.
Additionally the County Chairman stepped in to allay any fears or concerns from the County
Board.
“There was some concern from the Board, but cooler heads prevailed . . . we were
originally told it could take five years, so I figured we were still way ahead {even with this
delay}.” – Winnebago County Chairman
With the failed “go-live” Winnebago County now had to pull the team together and plan for a
new launch.
Comment [T175]: Imp
Outcomes – Adaptation
Calm response to failed “go-live”
Comment [T176]: Metaphor - adaptation
Comment [T177]: Imp Outcomes – Emergence
As project approached “go-live” #3 most
agencies did not believe it would happen
Sense of relief “go-live” failed
Comment [T178]: Imp End Env Factors – Resources
Staffing – Users not prepared or trained for “go-live”
Comment [T179]: Metaphor – path dependency
Comment [T180]: Imp Critical Events – Media
“go-live” had been publicized and now had to be retracted
Critical Events – Public Demand
Almost no public reaction to failed “go-live” #3
Comment [T181]: Imp Agents – Chairman
Allays fears of County Board over failed “go-live” #3
357
Re-grouping, re-prioritizing Even though the cause of the April 26th “go-live” was minor and already fixed Winnebago County
did not rush to launch the CCMS. The reaction to the failure had been minimal, but they knew a
second failure would not be taken so calmly.
“We were told . . . to make this one, or else!” – Information Technology Manager, DoIT
With the scramble to launch the system now gone the team could afford the time to re-analyzed
the project and determine a new “go-live” date that was assured to work and to revise their
thinking about some of the accommodations and functionality delays they accepted for the April
date. The JSI Project Manager remembers Winnebago County coming to them and asking about
adding functions for the new “go-live”.
“They came to us and said what works for you; we talked to them about what worked
for them; they said, well since we’re delaying it anyway we’d like to go ahead and see A,
B, and C, which we were going to live without previously but since you can put them on
the work schedule or they were on the schedule let’s make sure they’re done. That kind
of back and forth occurred. . .”
Additionally there was a real concern among the agencies that there was insufficient training.
DoIT and JSI had made a large investment in facilities and software to train the users, but many
of them did not have spare time to learn the new system and there was insufficient budget
available to authorize overtime devoted to training. If the April “go-live” had occurred many
users, including the Clerks, were going to have to learn the system “on-the-fly” and there was
concern this would seriously slow down the courts. A delayed release was an opportunity for
more training.
The delay also gave the JSI and the team the opportunity to make sure that the fines and fees
functionality was working flawlessly. Fines and fee collection in Winnebago County is very
important and very visible because collected fees are dispersed across the County. The Court
keeps a percentage of the fee, based on State law, and the rest is dispersed as needed. Part of
the fee might go to Rockford Township, the Police, or even retirement funds. If the fines and
fees functionality is not working correctly it impacts more than just the courts but the entire
county. The functionality had to be correct.
Over the next three months the project was re-planed and scheduled and a new “go-live” date
was set for November 15th, 2010. This “go-live” would be successful4.
The initial CCMS On November 15th, 2010, Winnebago County successfully launched their new CCMS. The system
utilized JSI’s FullCourt Enterprise, used by the Clerks and Judges, for case management and
included charging and party tracking on civil, criminal, and juvenile cases including probation
and supervision functions. All financial functionality was running. Also, JSI’s FullCase had also
4 Success of the “go-live” is defined as the new CCMS being launched and used by the agencies and the
legacy CCMS no longer in use. Success does not mean all functionality per the SRD was implemented.
Comment [T182]: Imp End Env Factors – Governance
Directives – Another failed “go-live” would not
be tolerated
Comment [T183]: Imp Outcomes – Adaptation
Analysis taken to see if functionality can be increased with a new “go-live”
Comment [T184]: Imp Outcomes – Emergence
Concern there is insufficient training
Comment [T185]: Imp End Env Factors – Resources
Funding – insufficient funds to authorize overtime for training.
Comment [T186]: Imp End Env Rules – Governance
Directive – Clerk fines & fees functionality must
be working flawlessly at “go-live”
Comment [T187]: Imp End Env Rules – Governance
Directive –“go-live #4 set for 11/15/2010
Critical Event – Crisis
“go-live” #4 is successful
Comment [T188]: Imp End Env Factors – ICT
Applications – New CCMS in use
Database – Conversion completed as planned (still many manual conversion pending)
Database – data shared across agencies (except where legally prohibited.
Processes – Shared Service
Processes – new CCMS processes being used
ICT – integrated CCMS in use
358
been customized for Winnebago and was in use by the State Attorney and Public Defender. The
system was fully integrated across cases, parties, courtroom documents and charges.
Almost all 1.8 million cases had been converted from case based to party based. Cases as far
back as 1950 could be searched electronically, with complete records available for criminal files
since 1980, civil files since 1988 and ordinance violations, traffic citations, DUI and conservation
case since 1996. These files could be searched on-line by the citizens of the County.
At “go-live” Winnebago County estimated that, depending on the agency, anywhere from 60%
to 80% of the functionality specified in the SRD had been implemented. JSI felt they had
delivered almost all required functions.
“. . . we’ve delivered 98% of the system at this point. In that 2% there is still some
important pieces that they need so I know they are anxious to see that.” – Project
Manager, Justice Systems Inc.
The discrepancy between the completion numbers, between Winnebago and JSI, underscored
what would be the challenge for system moving post-“go-live”. For some agencies the new
CCMS meant a change in both the software system and the processes and procedure they used.
For others there were only small changes in process and procedures only requiring learning a
new software system. For JSI they were only delivering software and data conversion. As a result
each agency had different expectation for the CCMS and they would use those expectations to
evaluate it and determine whether they thought the development was complete.
The Post-“go-live” CCMS – Nov. 2010 – March 2012 The initial release of the CCMS had mixed reactions from the agencies. In general the “go-live”
was seen as a success. The system worked, data had been converted and the agencies were
using the system. The “go-live” was seen as the first step toward a fully integrated CCMS and
justice processes. Winnebago County now had an integrated CCMS in place and could move
forward to put in place the processes and procedure for highly effective and efficient justice
operations.
“. . . it’s evolving and that’s a good thing. I don’t think I ever thought it would be quick. I
was not naïve enough to think that we’re going to just turn a switch” – Winnebago
County Chairman
Each agency was experiencing different results with the new CCMS and needed differing levels
of help and support. The Clerk remained central to all efforts and was getting the most support
to get its functionality up and running. Some of the agencies remarked they were implementing
an integrated system, but with the needs of the Clerk being the priority it seemed like they had
just launched another clerk-centric CCMS.
“The Clerks, it was not pretty there . . . they impacted us. When we went go-live we were
totally at the mercy of the Clerk.” – Senior Administrative Assistant for the Department
of Court Services
Comment [T189]: Imp Agents – DoIT
Estimate 60 – 80% of functionality implemented
Agents – JSI
Estimate almost all functionality implemented
Comment [T190]: Imp Processes – Shared Service
Processes – varying level of new processes
associated with new CCMS for each agency
Outcomes – Emergence
Understanding of the difference between CCMS being implemented and CCMS being in full
use/operation in the County (configuration
problem)
Comment [T191]: Metaphor - adaptation
Comment [T192]: CCMS End Env Factors
Aplications – Each agency experiencing
different results with CCMS
Comment [T193]: CCMS Outcomes – Emergence
Emerging sense that the new CCMS was Clerk-centric
359
“. . . we went from what was known as a clerk-centric system to what I would say is a
system-centric system. We started down that path to making it system-centric and for
whatever reasons worked our way back to a more clerk or department centric system.” –
Trial Court Administrator for the 17th Circuit Court
The initial post-“go-live” impact of the system on each agency is as follows.
Clerks and Judges
Even though the CCMS was an integrated system much of the required court data was still input
from the Clerks. Recording court proceedings had to be smooth and efficient but with the new
system it was taking more time.
“. . at the beginning we were going to be slower and I think we made everybody aware
of that. This is a huge change in systems for the Clerk and {initially} it’s going to be
slower and it’s going to take us longer to get from point A to point B so we’re not going
to put in every piece of detail that you want because it would bog us down . . . the offices
were very understanding. . .” - Circuit Clerk Chief Deputy
For the Clerks the new CCMS represented an improvement from JANO but the improvements
came with process and procedural changes. This magnified the impact of the new CCMS on the
clerks because it meant not only learning a new system but also a new way of doing tasks.
“We wanted to change the way we do business based on the system and I think some
people are still struggling with that . . .” – Clerk of the Circuit Court
Additionally the new system allowed the clerks to enter in much more data in the courtroom.
Entering more data was going to take more time and slow down courtroom operations but it
was expected the integrated system would reap benefits in other areas that would overall speed
up the adjudication process. Unfortunately at this time, the judges were only experiencing the
courtroom slowdown.
“Well the judges are not used to our new way of recording entries in the courtroom” -
Clerk of the Circuit Court
Also Judges were finding the entry of all the court data in the courtroom distracting.
“The judges did not like that clicking of the fingernails on the keyboard; so that was
nixed right there. So now {after a} big heavy court call the clerks are supposed to go back
to their desk and enter in all this information by hand and get ready for the next day’s
court docket.” – Records Supervisor, State’s Attorney’s Office
The Clerks were now doing double-duty, recording court proceeding, in court, on paper and
then entering them into the CCMS after the court sessions. Right after the initial “go-live” Clerk
resources were stretched.
Some of these difficulties stemmed from the Judges non-attendance in the working meetings.
Many had different expectations for the system. Some were expecting a more complete
capability or different processes. For example, many of the judges were not prepared for the
Comment [T194]: CCMS
Agents – Clerks
Recording data taking more time than expected
Comment [T195]: CCMS Agents-Clerks
Learning new CCMS and new processes and procedures
Processes – Shared Services
New CCMS also involves process and procedure
changes
Comment [T196]: CCMS Agents – Clerks
Entering more data in court which is slowing down courtroom operations
Entering more data expected to reap benefits through integration with other agencies
Comment [T197]: CCMS Agents – Courts
Judges upset with slowdown of courtroom operations
Comment [T198]: CCMS Agents – Courts
Judges find entering of data on computers
distracting
Comment [T199]: CCMS Agents- Clerks
Clerks forced to record data on paper and then enter in CCMS after hours
Resources stretched
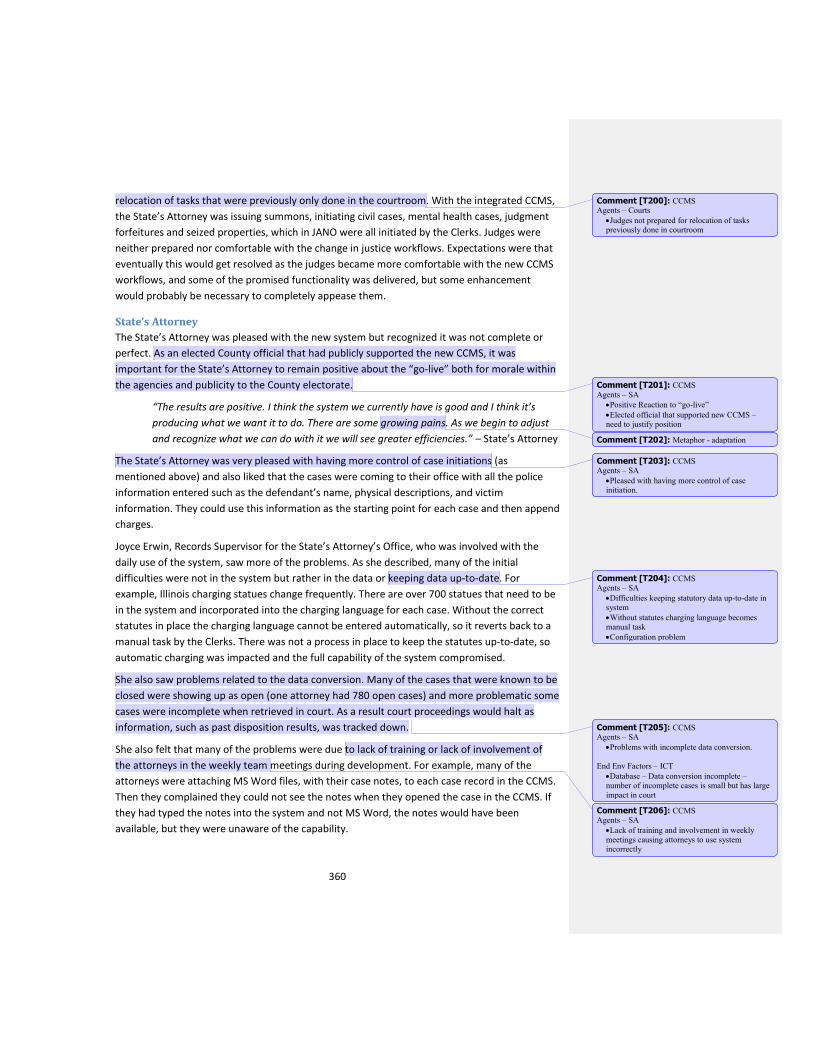
360
relocation of tasks that were previously only done in the courtroom. With the integrated CCMS,
the State’s Attorney was issuing summons, initiating civil cases, mental health cases, judgment
forfeitures and seized properties, which in JANO were all initiated by the Clerks. Judges were
neither prepared nor comfortable with the change in justice workflows. Expectations were that
eventually this would get resolved as the judges became more comfortable with the new CCMS
workflows, and some of the promised functionality was delivered, but some enhancement
would probably be necessary to completely appease them.
State’s Attorney
The State’s Attorney was pleased with the new system but recognized it was not complete or
perfect. As an elected County official that had publicly supported the new CCMS, it was
important for the State’s Attorney to remain positive about the “go-live” both for morale within
the agencies and publicity to the County electorate.
“The results are positive. I think the system we currently have is good and I think it’s
producing what we want it to do. There are some growing pains. As we begin to adjust
and recognize what we can do with it we will see greater efficiencies.” – State’s Attorney
The State’s Attorney was very pleased with having more control of case initiations (as
mentioned above) and also liked that the cases were coming to their office with all the police
information entered such as the defendant’s name, physical descriptions, and victim
information. They could use this information as the starting point for each case and then append
charges.
Joyce Erwin, Records Supervisor for the State’s Attorney’s Office, who was involved with the
daily use of the system, saw more of the problems. As she described, many of the initial
difficulties were not in the system but rather in the data or keeping data up-to-date. For
example, Illinois charging statues change frequently. There are over 700 statues that need to be
in the system and incorporated into the charging language for each case. Without the correct
statutes in place the charging language cannot be entered automatically, so it reverts back to a
manual task by the Clerks. There was not a process in place to keep the statutes up-to-date, so
automatic charging was impacted and the full capability of the system compromised.
She also saw problems related to the data conversion. Many of the cases that were known to be
closed were showing up as open (one attorney had 780 open cases) and more problematic some
cases were incomplete when retrieved in court. As a result court proceedings would halt as
information, such as past disposition results, was tracked down.
She also felt that many of the problems were due to lack of training or lack of involvement of
the attorneys in the weekly team meetings during development. For example, many of the
attorneys were attaching MS Word files, with their case notes, to each case record in the CCMS.
Then they complained they could not see the notes when they opened the case in the CCMS. If
they had typed the notes into the system and not MS Word, the notes would have been
available, but they were unaware of the capability.
Comment [T200]: CCMS Agents – Courts
Judges not prepared for relocation of tasks previously done in courtroom
Comment [T201]: CCMS
Agents – SA
Positive Reaction to “go-live”
Elected official that supported new CCMS – need to justify position
Comment [T202]: Metaphor - adaptation
Comment [T203]: CCMS Agents – SA
Pleased with having more control of case initiation.
Comment [T204]: CCMS Agents – SA
Difficulties keeping statutory data up-to-date in system
Without statutes charging language becomes manual task
Configuration problem
Comment [T205]: CCMS Agents – SA
Problems with incomplete data conversion.
End Env Factors – ICT
Database – Data conversion incomplete – number of incomplete cases is small but has large
impact in court
Comment [T206]: CCMS Agents – SA
Lack of training and involvement in weekly
meetings causing attorneys to use system incorrectly

361
“It’s just a misunderstanding of how the system works. I think if the attorneys were
required to make some of those CCM meetings they would understand how the system
works and it would be a lot easier on everybody.”
“I can enter a case with three charges in less than three minutes . . . if they knew the
system they wouldn’t have these problems.”
The concern with the Attorneys was that their initial bad experiences might sour them to the
use of the system, but as their record coordinator noted, “Once they get on the system, they
enjoy it.”
Public Defender
For the Public Defender Attorneys the impact of the new CCMS was minimal. Most of the
information from the CCMS flows to the Public Defender so use of the system is in preparation
for court cases. As a result the impact of the new CCMS was almost entirely on the support staff,
which was heavily using the system.
“. . . from our support staff almost everything is impacted by the new system . . . so
everybody got into it pretty quickly . . Everybody had their anxiety and their problems
but they understood they had to do it.” – Deputy to the Public Defender
An integrated CCMS was the major benefit to the Public Defender. Even if data was entered
incorrectly at least everyone was looking at the same data. Problems with duplicate data entry
were gone and there were no surprises due to mismatched data.
Disappointments in the system mainly stemmed from functionality that had not yet been
implemented. For example real-time plea negotiation and full Chinese Wall functionality, which
was planned, had been delayed due to priorities with the Clerk functions. The Public Defender
found this annoying but not a critical issue.
From the Public Defender’s perspective initial problems in the system were more a problem
with people not accepting change.
“The perceived changes in practice and the actual ones are vastly different . . . the
people that believe it’s going to be a bigger deal are the people that are entrenched in
their ways and those people are the lawyers, judges, and clerks.” – Deputy to the Public
Defender
In the Public Defender’s office they had accepted that change was inevitable with the new CCMS
and had invested time and effort into getting their staff ready to use it, resulting in fewer
problems for them.
Probation, Pre-Trial and Specialty Courts
Probation, Pre-Trial, and Specialty courts, as users, not initiators of the data in the system (like
the Public Defender) were seeing definite improvements in their operations with the new CCMS.
Most of the problems they ran into involved errors in the data conversion which they corrected.
They felt that the process of developing the CCMS greatly enhanced their situation because all
Comment [T207]: CCMS
Agents – Public Defender
Heavy use of system by support staff for
courtroom preparation
Comment [T208]: CCMS Agents – Public Defender
Integrated system helping them – even if data are wrong everyone seeing same data
End Env Factor - ICT
Database – Shared data has everyone working
with same data – even if data has problems.
Comment [T209]: CCMS Agents – Public Defender
Disappointed with functionality not implemented
End Env Factors – ICT
Applications – Disappointment with unimplemented functions
Comment [T210]: CCMS Outcomes - Path Dependency
Problems with CCMS due to people not accepting change - inertia
Comment [T211]: Metaphor – path dependency
Comment [T212]: Imp
Agents – Public Defender
Investing time and effort with staff to understand
and know how to use system
Comment [T213]: CCMS Processes – Shared Services
Agents that are users of data, not initiators, are having more success with the new CCMS
Agents – Probation, Pre-Trial & Specialty Courts (PPS)
Seeing improvements in operations due to new
CCMS
Comment [T214]: CCMS Agents – PPS
Most problems data related – they can fix most problems
More autonomous in operations with CCMS – not dependent on DoIT or JSI
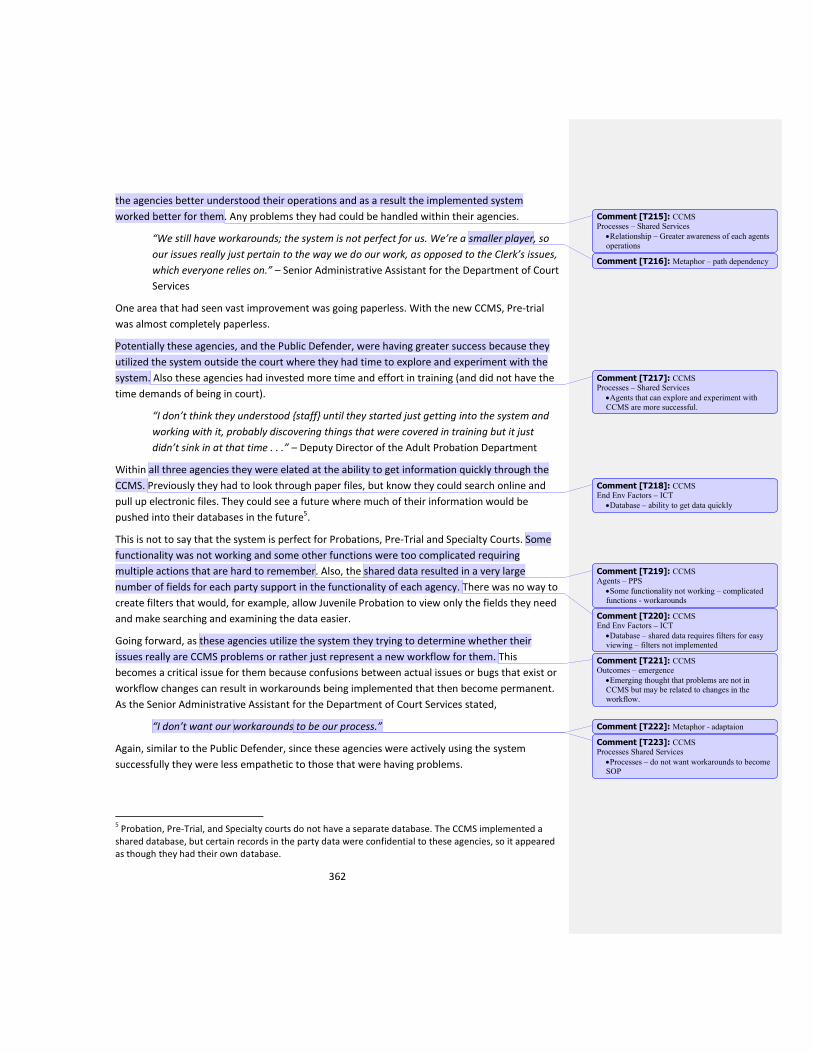
362
the agencies better understood their operations and as a result the implemented system
worked better for them. Any problems they had could be handled within their agencies.
“We still have workarounds; the system is not perfect for us. We’re a smaller player, so
our issues really just pertain to the way we do our work, as opposed to the Clerk’s issues,
which everyone relies on.” – Senior Administrative Assistant for the Department of Court
Services
One area that had seen vast improvement was going paperless. With the new CCMS, Pre-trial
was almost completely paperless.
Potentially these agencies, and the Public Defender, were having greater success because they
utilized the system outside the court where they had time to explore and experiment with the
system. Also these agencies had invested more time and effort in training (and did not have the
time demands of being in court).
“I don’t think they understood {staff} until they started just getting into the system and
working with it, probably discovering things that were covered in training but it just
didn’t sink in at that time . . .” – Deputy Director of the Adult Probation Department
Within all three agencies they were elated at the ability to get information quickly through the
CCMS. Previously they had to look through paper files, but know they could search online and
pull up electronic files. They could see a future where much of their information would be
pushed into their databases in the future5.
This is not to say that the system is perfect for Probations, Pre-Trial and Specialty Courts. Some
functionality was not working and some other functions were too complicated requiring
multiple actions that are hard to remember. Also, the shared data resulted in a very large
number of fields for each party support in the functionality of each agency. There was no way to
create filters that would, for example, allow Juvenile Probation to view only the fields they need
and make searching and examining the data easier.
Going forward, as these agencies utilize the system they trying to determine whether their
issues really are CCMS problems or rather just represent a new workflow for them. This
becomes a critical issue for them because confusions between actual issues or bugs that exist or
workflow changes can result in workarounds being implemented that then become permanent.
As the Senior Administrative Assistant for the Department of Court Services stated,
“I don’t want our workarounds to be our process.”
Again, similar to the Public Defender, since these agencies were actively using the system
successfully they were less empathetic to those that were having problems.
5 Probation, Pre-Trial, and Specialty courts do not have a separate database. The CCMS implemented a
shared database, but certain records in the party data were confidential to these agencies, so it appeared as though they had their own database.
Comment [T215]: CCMS
Processes – Shared Services
Relationship – Greater awareness of each agents
operations
Comment [T216]: Metaphor – path dependency
Comment [T217]: CCMS Processes – Shared Services
Agents that can explore and experiment with
CCMS are more successful.
Comment [T218]: CCMS End Env Factors – ICT
Database – ability to get data quickly
Comment [T219]: CCMS Agents – PPS
Some functionality not working – complicated functions - workarounds
Comment [T220]: CCMS End Env Factors – ICT
Database – shared data requires filters for easy viewing – filters not implemented
Comment [T221]: CCMS Outcomes – emergence
Emerging thought that problems are not in
CCMS but may be related to changes in the workflow.
Comment [T222]: Metaphor - adaptaion
Comment [T223]: CCMS Processes Shared Services
Processes – do not want workarounds to become SOP
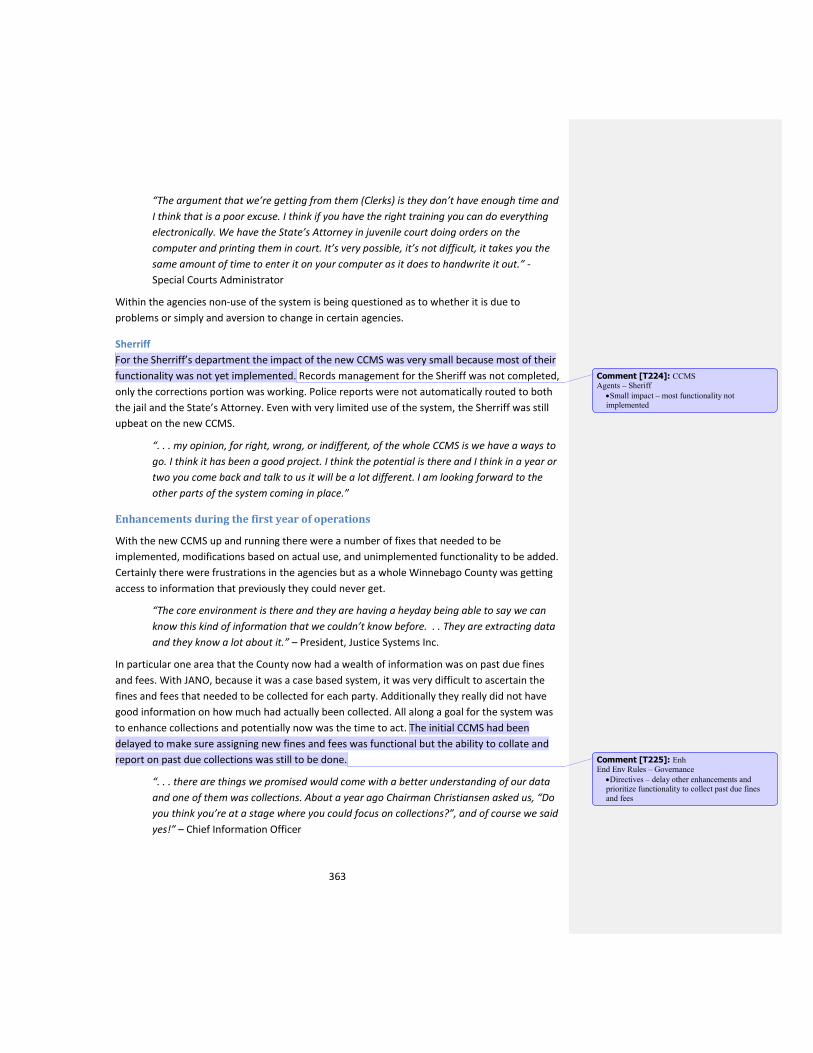
363
“The argument that we’re getting from them (Clerks) is they don’t have enough time and
I think that is a poor excuse. I think if you have the right training you can do everything
electronically. We have the State’s Attorney in juvenile court doing orders on the
computer and printing them in court. It’s very possible, it’s not difficult, it takes you the
same amount of time to enter it on your computer as it does to handwrite it out.” -
Special Courts Administrator
Within the agencies non-use of the system is being questioned as to whether it is due to
problems or simply and aversion to change in certain agencies.
Sherriff
For the Sherriff’s department the impact of the new CCMS was very small because most of their
functionality was not yet implemented. Records management for the Sheriff was not completed,
only the corrections portion was working. Police reports were not automatically routed to both
the jail and the State’s Attorney. Even with very limited use of the system, the Sherriff was still
upbeat on the new CCMS.
“. . . my opinion, for right, wrong, or indifferent, of the whole CCMS is we have a ways to
go. I think it has been a good project. I think the potential is there and I think in a year or
two you come back and talk to us it will be a lot different. I am looking forward to the
other parts of the system coming in place.”
Enhancements during the first year of operations
With the new CCMS up and running there were a number of fixes that needed to be
implemented, modifications based on actual use, and unimplemented functionality to be added.
Certainly there were frustrations in the agencies but as a whole Winnebago County was getting
access to information that previously they could never get.
“The core environment is there and they are having a heyday being able to say we can
know this kind of information that we couldn’t know before. . . They are extracting data
and they know a lot about it.” – President, Justice Systems Inc.
In particular one area that the County now had a wealth of information was on past due fines
and fees. With JANO, because it was a case based system, it was very difficult to ascertain the
fines and fees that needed to be collected for each party. Additionally they really did not have
good information on how much had actually been collected. All along a goal for the system was
to enhance collections and potentially now was the time to act. The initial CCMS had been
delayed to make sure assigning new fines and fees was functional but the ability to collate and
report on past due collections was still to be done.
“. . . there are things we promised would come with a better understanding of our data
and one of them was collections. About a year ago Chairman Christiansen asked us, “Do
you think you’re at a stage where you could focus on collections?”, and of course we said
yes!” – Chief Information Officer
Comment [T224]: CCMS Agents – Sheriff
Small impact – most functionality not implemented
Comment [T225]: Enh End Env Rules – Governance
Directives – delay other enhancements and prioritize functionality to collect past due fines
and fees
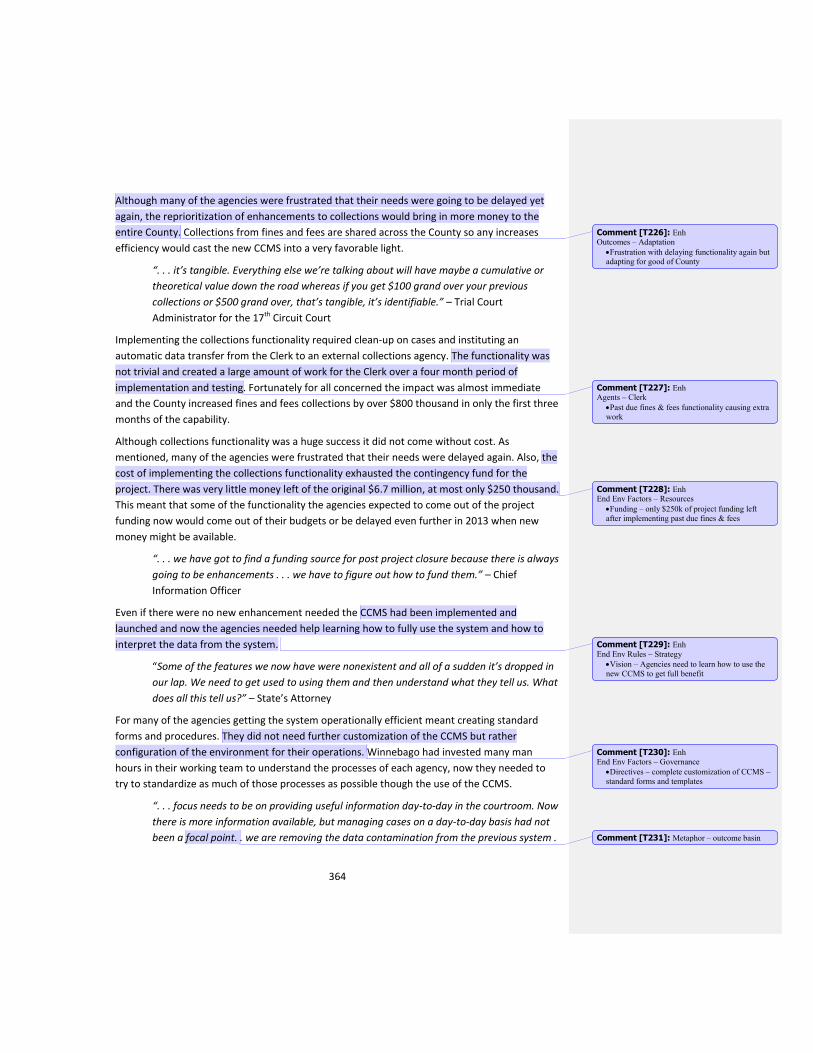
364
Although many of the agencies were frustrated that their needs were going to be delayed yet
again, the reprioritization of enhancements to collections would bring in more money to the
entire County. Collections from fines and fees are shared across the County so any increases
efficiency would cast the new CCMS into a very favorable light.
“. . . it’s tangible. Everything else we’re talking about will have maybe a cumulative or
theoretical value down the road whereas if you get $100 grand over your previous
collections or $500 grand over, that’s tangible, it’s identifiable.” – Trial Court
Administrator for the 17th Circuit Court
Implementing the collections functionality required clean-up on cases and instituting an
automatic data transfer from the Clerk to an external collections agency. The functionality was
not trivial and created a large amount of work for the Clerk over a four month period of
implementation and testing. Fortunately for all concerned the impact was almost immediate
and the County increased fines and fees collections by over $800 thousand in only the first three
months of the capability.
Although collections functionality was a huge success it did not come without cost. As
mentioned, many of the agencies were frustrated that their needs were delayed again. Also, the
cost of implementing the collections functionality exhausted the contingency fund for the
project. There was very little money left of the original $6.7 million, at most only $250 thousand.
This meant that some of the functionality the agencies expected to come out of the project
funding now would come out of their budgets or be delayed even further in 2013 when new
money might be available.
“. . . we have got to find a funding source for post project closure because there is always
going to be enhancements . . . we have to figure out how to fund them.” – Chief
Information Officer
Even if there were no new enhancement needed the CCMS had been implemented and
launched and now the agencies needed help learning how to fully use the system and how to
interpret the data from the system.
“Some of the features we now have were nonexistent and all of a sudden it’s dropped in
our lap. We need to get used to using them and then understand what they tell us. What
does all this tell us?” – State’s Attorney
For many of the agencies getting the system operationally efficient meant creating standard
forms and procedures. They did not need further customization of the CCMS but rather
configuration of the environment for their operations. Winnebago had invested many man
hours in their working team to understand the processes of each agency, now they needed to
try to standardize as much of those processes as possible though the use of the CCMS.
“. . . focus needs to be on providing useful information day-to-day in the courtroom. Now
there is more information available, but managing cases on a day-to-day basis had not
been a focal point. . we are removing the data contamination from the previous system .
Comment [T226]: Enh Outcomes – Adaptation
Frustration with delaying functionality again but adapting for good of County
Comment [T227]: Enh Agents – Clerk
Past due fines & fees functionality causing extra work
Comment [T228]: Enh End Env Factors – Resources
Funding – only $250k of project funding left
after implementing past due fines & fees
Comment [T229]: Enh
End Env Rules – Strategy
Vision – Agencies need to learn how to use the
new CCMS to get full benefit
Comment [T230]: Enh End Env Factors – Governance
Directives – complete customization of CCMS –
standard forms and templates
Comment [T231]: Metaphor – outcome basin
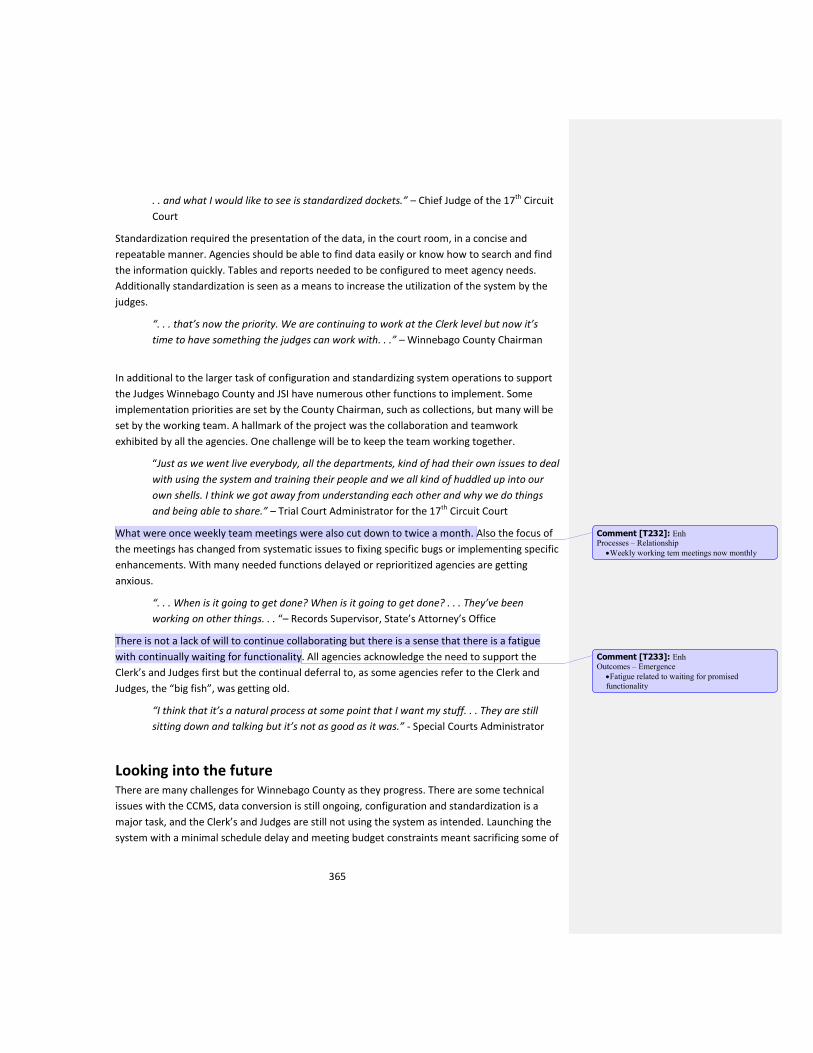
365
. . and what I would like to see is standardized dockets.” – Chief Judge of the 17th Circuit
Court
Standardization required the presentation of the data, in the court room, in a concise and
repeatable manner. Agencies should be able to find data easily or know how to search and find
the information quickly. Tables and reports needed to be configured to meet agency needs.
Additionally standardization is seen as a means to increase the utilization of the system by the
judges.
“. . . that’s now the priority. We are continuing to work at the Clerk level but now it’s
time to have something the judges can work with. . .” – Winnebago County Chairman
In additional to the larger task of configuration and standardizing system operations to support
the Judges Winnebago County and JSI have numerous other functions to implement. Some
implementation priorities are set by the County Chairman, such as collections, but many will be
set by the working team. A hallmark of the project was the collaboration and teamwork
exhibited by all the agencies. One challenge will be to keep the team working together.
“Just as we went live everybody, all the departments, kind of had their own issues to deal
with using the system and training their people and we all kind of huddled up into our
own shells. I think we got away from understanding each other and why we do things
and being able to share.” – Trial Court Administrator for the 17th Circuit Court
What were once weekly team meetings were also cut down to twice a month. Also the focus of
the meetings has changed from systematic issues to fixing specific bugs or implementing specific
enhancements. With many needed functions delayed or reprioritized agencies are getting
anxious.
“. . . When is it going to get done? When is it going to get done? . . . They’ve been
working on other things. . . “– Records Supervisor, State’s Attorney’s Office
There is not a lack of will to continue collaborating but there is a sense that there is a fatigue
with continually waiting for functionality. All agencies acknowledge the need to support the
Clerk’s and Judges first but the continual deferral to, as some agencies refer to the Clerk and
Judges, the “big fish”, was getting old.
“I think that it’s a natural process at some point that I want my stuff. . . They are still
sitting down and talking but it’s not as good as it was.” - Special Courts Administrator
Looking into the future There are many challenges for Winnebago County as they progress. There are some technical
issues with the CCMS, data conversion is still ongoing, configuration and standardization is a
major task, and the Clerk’s and Judges are still not using the system as intended. Launching the
system with a minimal schedule delay and meeting budget constraints meant sacrificing some of
Comment [T232]: Enh Processes – Relationship
Weekly working tem meetings now monthly
Comment [T233]: Enh
Outcomes – Emergence
Fatigue related to waiting for promised
functionality
366
the functionality that needs to be implemented. Resourcing this work, with staff and money will
be difficult.
Also, throughout the project Winnebago County benefitted from almost no change in personnel,
either at the staff or executive levels. Many of the officials, like the County Board, County
Chairman, and State’s Attorney are elected officials and can be voted out of office.
“The risks are when elected officials change and may not share similar ideas.” – Chief
Information Officer
Changes in personnel may change priorities in the County and affect the CCMS in the future.
The future of the CCMS is difficult to predict because it is not yet completely implemented and
all the benefits are not yet realized.
“. . . frankly, we’re just on the cusp. Another year is a big thing . . . I am really excited
about us getting to when they (the Clerks) leave the courtroom they’re done with the
case and everything has been updated.” – Winnebago County Chairman
As CIO Gentner stated the County is attempting to do “just-in-time” justice. This is a lofty goal
for the courts which tend to be very conservative, but with the implementation of the new
CCMS, Winnebago County has moved in this direction. The challenge for them will be to
maintain their progress.
“We are doing pot go-live enhancements and cleanup and now what we have to do is
give ourselves a new goal and a new sense of purpose.” – Chief Information Officer
Appendix D - Figures and Tables
Figure D.1- - University of Illinois Flash Index
Comment [T234]: Metaphor - bifurcation
Comment [T235]: Metaphor - bifurcation
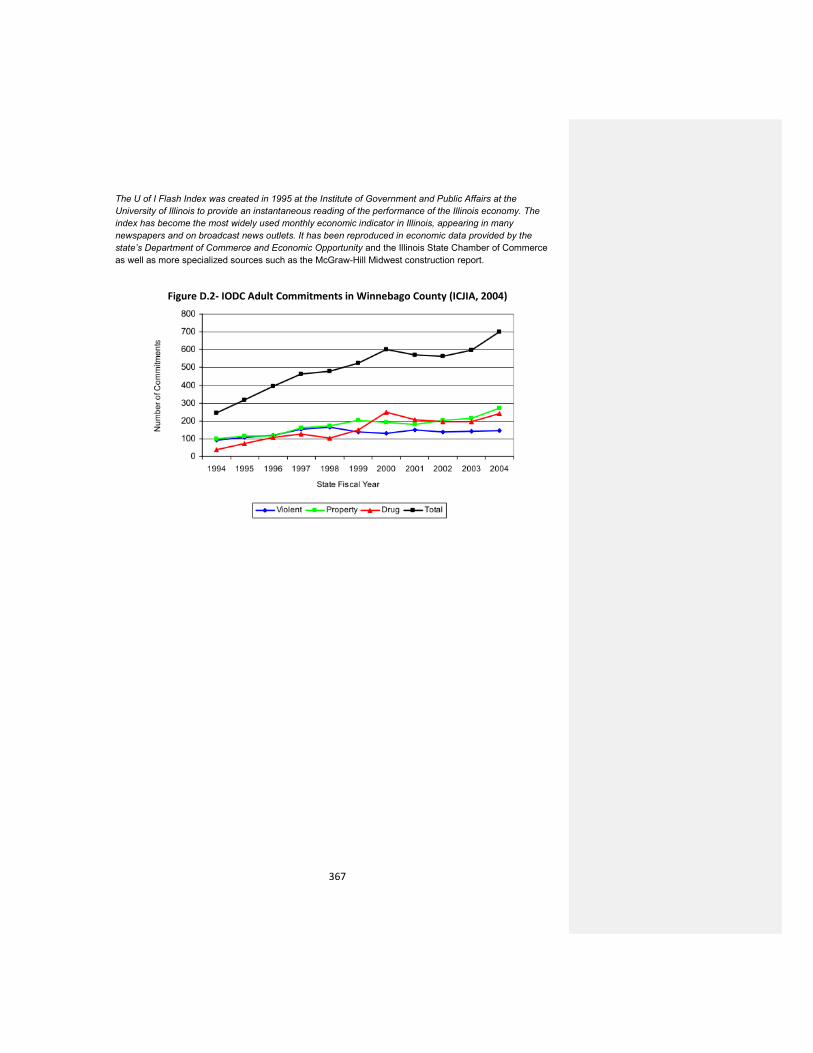
367
The U of I Flash Index was created in 1995 at the Institute of Government and Public Affairs at the
University of Illinois to provide an instantaneous reading of the performance of the Illinois economy. The
index has become the most widely used monthly economic indicator in Illinois, appearing in many
newspapers and on broadcast news outlets. It has been reproduced in economic data provided by the
state’s Department of Commerce and Economic Opportunity and the Illinois State Chamber of Commerce
as well as more specialized sources such as the McGraw-Hill Midwest construction report.
Figure D.2- IODC Adult Commitments in Winnebago County (ICJIA, 2004)
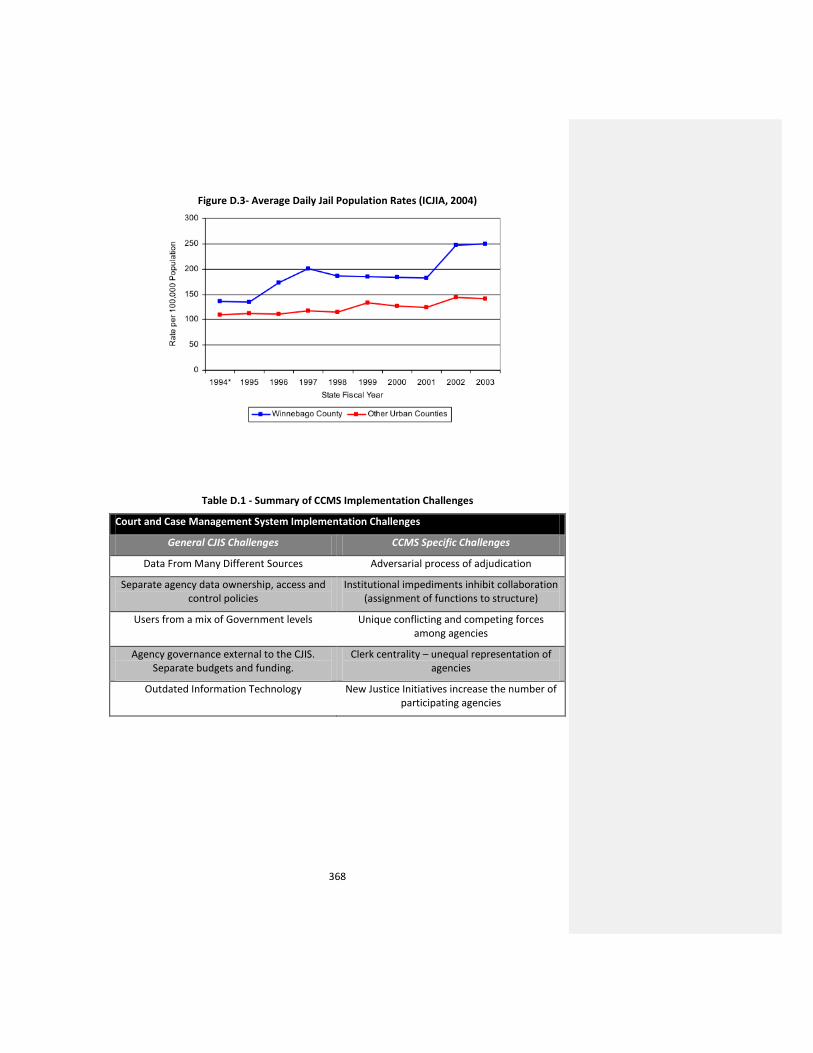
368
Figure D.3- Average Daily Jail Population Rates (ICJIA, 2004)
Table D.1 - Summary of CCMS Implementation Challenges
Court and Case Management System Implementation Challenges
General CJIS Challenges CCMS Specific Challenges
Data From Many Different Sources Adversarial process of adjudication
Separate agency data ownership, access and control policies
Institutional impediments inhibit collaboration (assignment of functions to structure)
Users from a mix of Government levels Unique conflicting and competing forces among agencies
Agency governance external to the CJIS. Separate budgets and funding.
Clerk centrality – unequal representation of agencies
Outdated Information Technology New Justice Initiatives increase the number of participating agencies
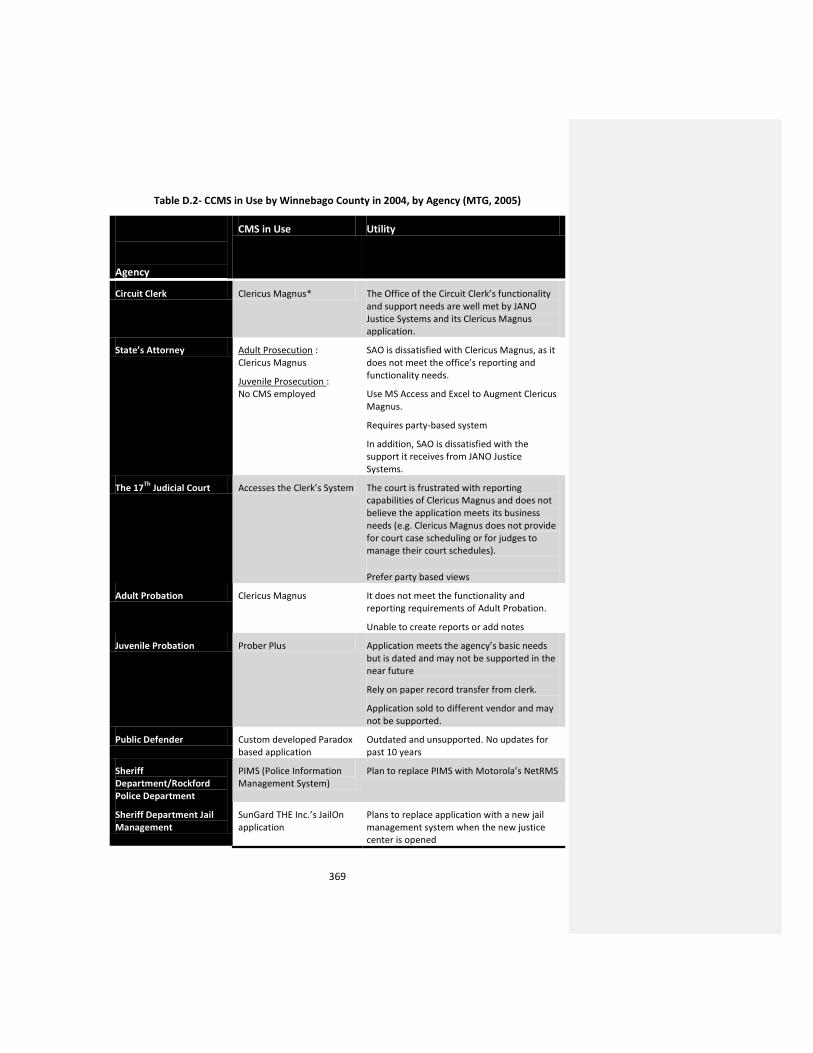
369
Table D.2- CCMS in Use by Winnebago County in 2004, by Agency (MTG, 2005)
Agency
CMS in Use Utility
Circuit Clerk Clericus Magnus* The Office of the Circuit Clerk’s functionality and support needs are well met by JANO Justice Systems and its Clericus Magnus application.
State’s Attorney Adult Prosecution : Clericus Magnus
Juvenile Prosecution : No CMS employed
SAO is dissatisfied with Clericus Magnus, as it does not meet the office’s reporting and functionality needs.
Use MS Access and Excel to Augment Clericus Magnus.
Requires party-based system
In addition, SAO is dissatisfied with the support it receives from JANO Justice Systems.
The 17Th
Judicial Court Accesses the Clerk’s System The court is frustrated with reporting capabilities of Clericus Magnus and does not believe the application meets its business needs (e.g. Clericus Magnus does not provide for court case scheduling or for judges to manage their court schedules).
Prefer party based views
Adult Probation Clericus Magnus It does not meet the functionality and reporting requirements of Adult Probation.
Unable to create reports or add notes
Juvenile Probation Prober Plus Application meets the agency’s basic needs but is dated and may not be supported in the near future
Rely on paper record transfer from clerk.
Application sold to different vendor and may not be supported.
Public Defender Custom developed Paradox based application
Outdated and unsupported. No updates for past 10 years
Sheriff Department/Rockford Police Department
PIMS (Police Information Management System)
Plan to replace PIMS with Motorola’s NetRMS
Sheriff Department Jail Management
SunGard THE Inc.’s JailOn application
Plans to replace application with a new jail management system when the new justice center is opened
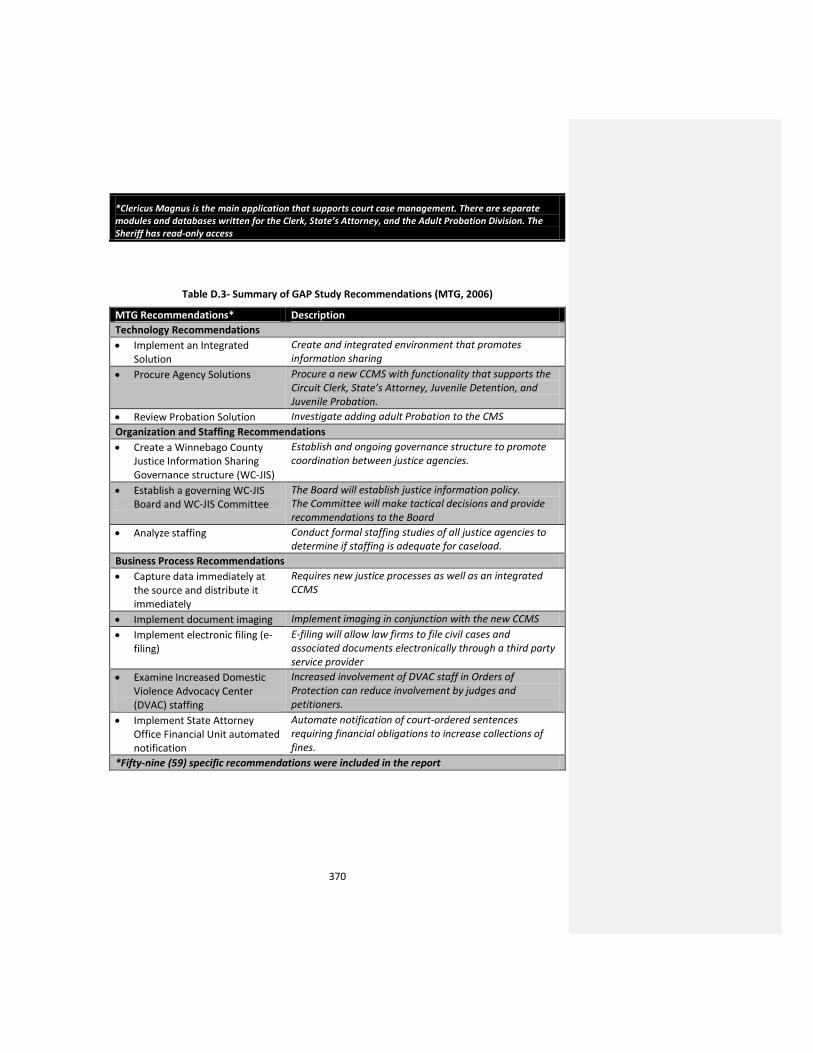
370
*Clericus Magnus is the main application that supports court case management. There are separate modules and databases written for the Clerk, State’s Attorney, and the Adult Probation Division. The Sheriff has read-only access
Table D.3- Summary of GAP Study Recommendations (MTG, 2006)
MTG Recommendations* Description
Technology Recommendations
Implement an Integrated Solution
Create and integrated environment that promotes information sharing
Procure Agency Solutions Procure a new CCMS with functionality that supports the Circuit Clerk, State’s Attorney, Juvenile Detention, and Juvenile Probation.
Review Probation Solution Investigate adding adult Probation to the CMS
Organization and Staffing Recommendations
Create a Winnebago County Justice Information Sharing Governance structure (WC-JIS)
Establish and ongoing governance structure to promote coordination between justice agencies.
Establish a governing WC-JIS Board and WC-JIS Committee
The Board will establish justice information policy. The Committee will make tactical decisions and provide recommendations to the Board
Analyze staffing Conduct formal staffing studies of all justice agencies to determine if staffing is adequate for caseload.
Business Process Recommendations
Capture data immediately at the source and distribute it immediately
Requires new justice processes as well as an integrated CCMS
Implement document imaging Implement imaging in conjunction with the new CCMS
Implement electronic filing (e-filing)
E-filing will allow law firms to file civil cases and associated documents electronically through a third party service provider
Examine Increased Domestic Violence Advocacy Center (DVAC) staffing
Increased involvement of DVAC staff in Orders of Protection can reduce involvement by judges and petitioners.
Implement State Attorney Office Financial Unit automated notification
Automate notification of court-ordered sentences requiring financial obligations to increase collections of fines.
*Fifty-nine (59) specific recommendations were included in the report
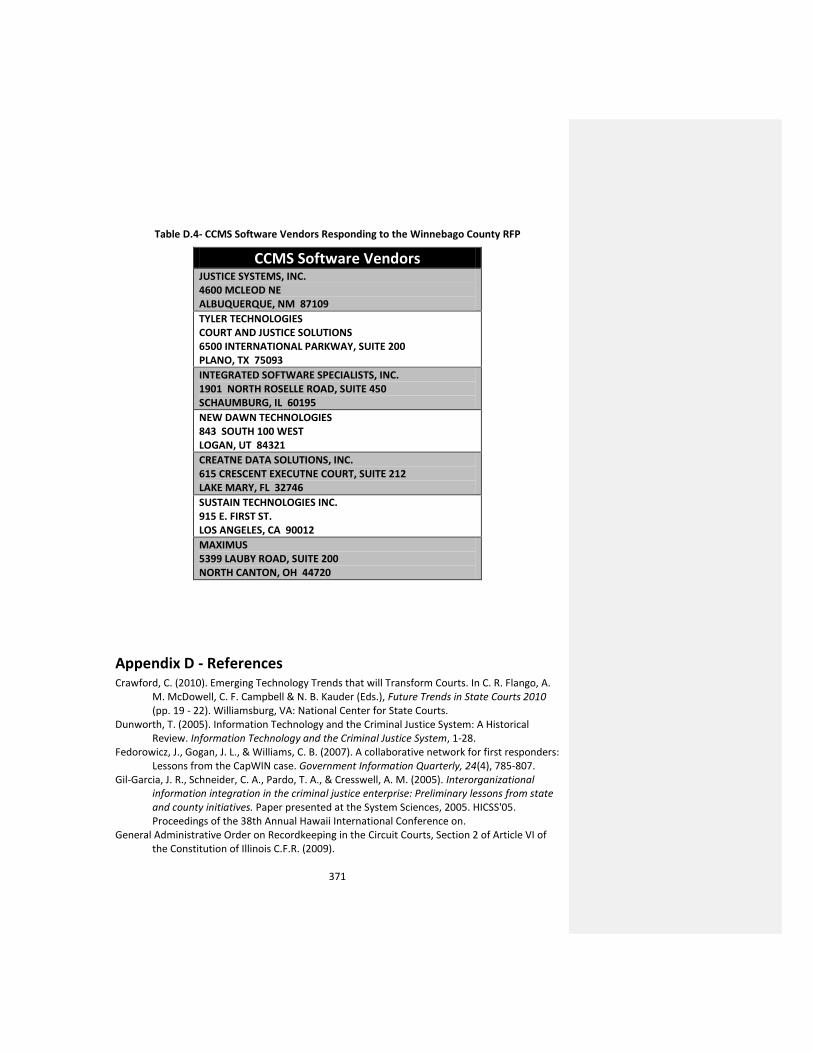
371
Table D.4- CCMS Software Vendors Responding to the Winnebago County RFP
CCMS Software Vendors JUSTICE SYSTEMS, INC. 4600 MCLEOD NE ALBUQUERQUE, NM 87109
TYLER TECHNOLOGIES COURT AND JUSTICE SOLUTIONS 6500 INTERNATIONAL PARKWAY, SUITE 200 PLANO, TX 75093
INTEGRATED SOFTWARE SPECIALISTS, INC. 1901 NORTH ROSELLE ROAD, SUITE 450 SCHAUMBURG, IL 60195
NEW DAWN TECHNOLOGIES 843 SOUTH 100 WEST LOGAN, UT 84321
CREATNE DATA SOLUTIONS, INC. 615 CRESCENT EXECUTNE COURT, SUITE 212 LAKE MARY, FL 32746
SUSTAIN TECHNOLOGIES INC. 915 E. FIRST ST. LOS ANGELES, CA 90012
MAXIMUS 5399 LAUBY ROAD, SUITE 200 NORTH CANTON, OH 44720
Appendix D - References Crawford, C. (2010). Emerging Technology Trends that will Transform Courts. In C. R. Flango, A.
M. McDowell, C. F. Campbell & N. B. Kauder (Eds.), Future Trends in State Courts 2010 (pp. 19 - 22). Williamsburg, VA: National Center for State Courts.
Dunworth, T. (2005). Information Technology and the Criminal Justice System: A Historical Review. Information Technology and the Criminal Justice System, 1-28.
Fedorowicz, J., Gogan, J. L., & Williams, C. B. (2007). A collaborative network for first responders: Lessons from the CapWIN case. Government Information Quarterly, 24(4), 785-807.
Gil-Garcia, J. R., Schneider, C. A., Pardo, T. A., & Cresswell, A. M. (2005). Interorganizational information integration in the criminal justice enterprise: Preliminary lessons from state and county initiatives. Paper presented at the System Sciences, 2005. HICSS'05. Proceedings of the 38th Annual Hawaii International Conference on.
General Administrative Order on Recordkeeping in the Circuit Courts, Section 2 of Article VI of the Constitution of Illinois C.F.R. (2009).
372
Havens, J. (2007, February 7-13, 2007). Jail lawsuit plaintiff likely to receive nothing. The Rock River Times.
ICJIA. (2004). A Profile of the Winnebago County Criminal and Juvenile Justice Systems. Chicago, Illinois: Illinois Criminal Justice Information Authority.
IGPA. (2012). State of Illinois Economic Environment: Administrative Review & Restructuring Committee: University of Illinois.
Illinois_Courts. (2012). Illinois Circuit Court General Information. Retrieved October 18, 2012, from http://www.state.il.us/court/CircuitCourt/CCInfoDefault.asp
McKean, L., & Ransford, C. (2004). Current Strategies for Reducing Recidivism. Chicago, Illinois: The Center for Impact Reseach.
Montgomery, A. (2004). Winnebago County Approves Budget The Beloit Daily News. Morton, H. (2001). Integrated Criminal Justice Information Systems. Washinton, D.C.: The
National Conference of State Legislatures. MTG. (2005). Information Technology Assessment. Rockford, Illinois: MTG Management
Consultants, L.L.C. MTG. (2006). Recommendations Summary. Rockford, Illinois: MTG Management Consultants,
L.L.C. Ney, B., & McGarry, P. (2006). Getting It Right: Collaborative Problem Solving for Criminal
Justice. Silver Spring, Maryland: The Center for Effective Public Policy. Pardo, T. A., Cresswell, A. M., Dawes, S. S., & Burke, G. B. (2004). Modeling the Social &
Technical Processes of Interorganizational Information Integration. Paper presented at the Proceedings of the 37th Hawaii International Conference on System Sciences.
Schwarzer, W. W. (1988). Federal Rules, the Adversary Process, and Discovery Reform, The. U. Pitt. L. Rev., 50, 703.
Scott, T. (2002). Aligning your data collection and ERP implementation decisions. IT Papers. Retrieved from http://www.asapla.com/pdffiles/Aligning%20DC%20and%20ERP.pdf
Sebutinde, J. (2003). Court Case Management and Other Procedural Reforms: The Distance Learning Programme for Anglophone Africa.
Williams, C. B., Fedorowicz, J., & Tomasino, A. P. (2010). Governmental factors associated with state-wide interagency collaboration initiatives. Paper presented at the Proceedings of the 11th Annual International Digital Government Research Conference on Public Administration Online: Challenges and Opportunities.
Winnebago. (2007a). Call For Proposals: Instructions and Specifications for Court and Case Management Software System. Rockford, Illinois: Winnebago County Illinois.
Winnebago. (2007b). System Requirements Definition. Rockford, Illinois: Winnebago County Illinois.
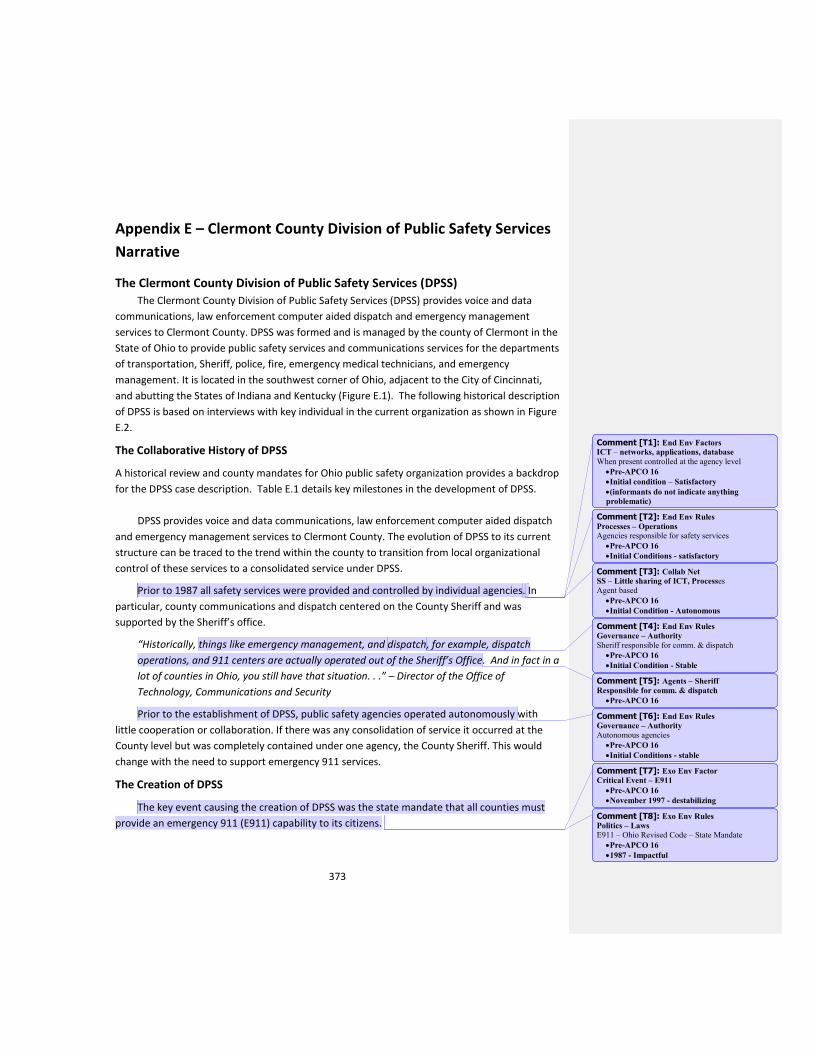
373
Appendix E – Clermont County Division of Public Safety Services
Narrative
The Clermont County Division of Public Safety Services (DPSS)
The Clermont County Division of Public Safety Services (DPSS) provides voice and data
communications, law enforcement computer aided dispatch and emergency management
services to Clermont County. DPSS was formed and is managed by the county of Clermont in the
State of Ohio to provide public safety services and communications services for the departments
of transportation, Sheriff, police, fire, emergency medical technicians, and emergency
management. It is located in the southwest corner of Ohio, adjacent to the City of Cincinnati,
and abutting the States of Indiana and Kentucky (Figure E.1). The following historical description
of DPSS is based on interviews with key individual in the current organization as shown in Figure
E.2.
The Collaborative History of DPSS
A historical review and county mandates for Ohio public safety organization provides a backdrop
for the DPSS case description. Table E.1 details key milestones in the development of DPSS.
DPSS provides voice and data communications, law enforcement computer aided dispatch
and emergency management services to Clermont County. The evolution of DPSS to its current
structure can be traced to the trend within the county to transition from local organizational
control of these services to a consolidated service under DPSS.
Prior to 1987 all safety services were provided and controlled by individual agencies. In
particular, county communications and dispatch centered on the County Sheriff and was
supported by the Sheriff’s office.
“Historically, things like emergency management, and dispatch, for example, dispatch
operations, and 911 centers are actually operated out of the Sheriff’s Office. And in fact in a
lot of counties in Ohio, you still have that situation. . .” – Director of the Office of
Technology, Communications and Security
Prior to the establishment of DPSS, public safety agencies operated autonomously with
little cooperation or collaboration. If there was any consolidation of service it occurred at the
County level but was completely contained under one agency, the County Sheriff. This would
change with the need to support emergency 911 services.
The Creation of DPSS
The key event causing the creation of DPSS was the state mandate that all counties must
provide an emergency 911 (E911) capability to its citizens.
Comment [T1]: End Env Factors
ICT – networks, applications, database
When present controlled at the agency level
Pre-APCO 16
Initial condition – Satisfactory
(informants do not indicate anything
problematic)
Comment [T2]: End Env Rules
Processes – Operations
Agencies responsible for safety services
Pre-APCO 16
Initial Conditions - satisfactory
Comment [T3]: Collab Net
SS – Little sharing of ICT, Processes Agent based
Pre-APCO 16
Initial Condition - Autonomous
Comment [T4]: End Env Rules
Governance – Authority
Sheriff responsible for comm. & dispatch
Pre-APCO 16
Initial Condition - Stable
Comment [T5]: Agents – Sheriff
Responsible for comm. & dispatch
Pre-APCO 16
Comment [T6]: End Env Rules
Governance – Authority
Autonomous agencies
Pre-APCO 16
Initial Conditions - stable
Comment [T7]: Exo Env Factor
Critical Event – E911
Pre-APCO 16
November 1997 - destabilizing
Comment [T8]: Exo Env Rules
Politics – Laws
E911 – Ohio Revised Code – State Mandate
Pre-APCO 16
1987 - Impactful
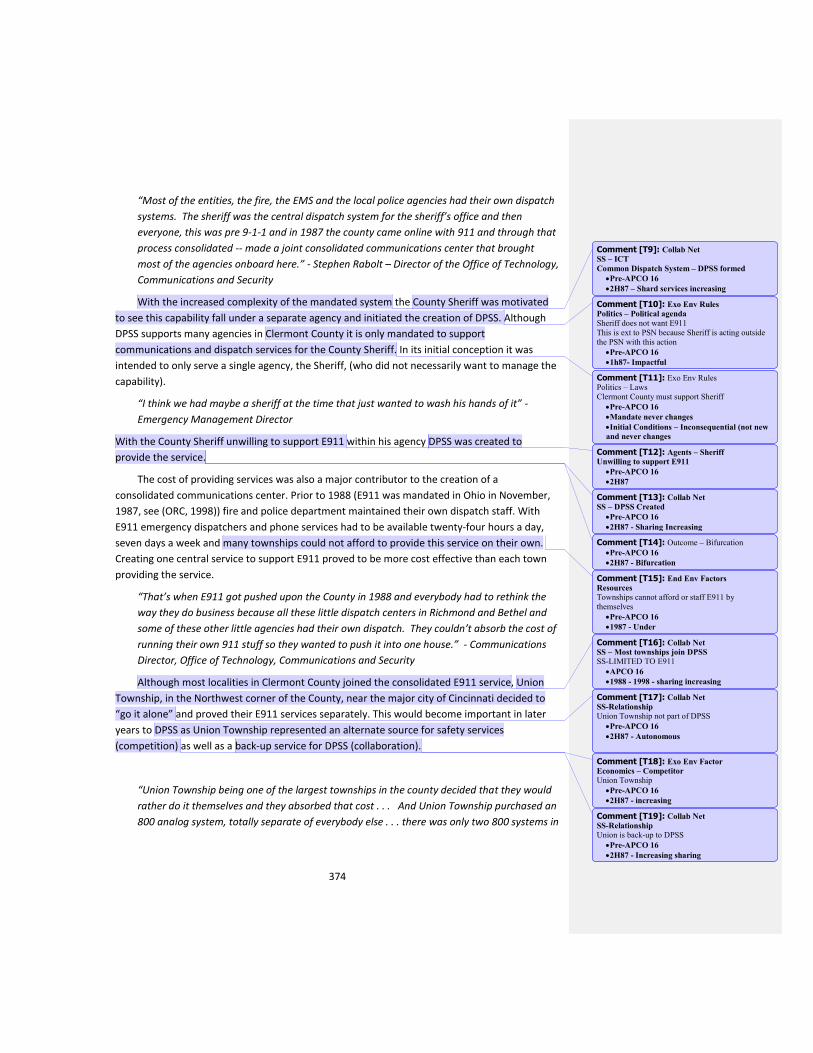
374
“Most of the entities, the fire, the EMS and the local police agencies had their own dispatch
systems. The sheriff was the central dispatch system for the sheriff’s office and then
everyone, this was pre 9-1-1 and in 1987 the county came online with 911 and through that
process consolidated -- made a joint consolidated communications center that brought
most of the agencies onboard here.” - Stephen Rabolt – Director of the Office of Technology,
Communications and Security
With the increased complexity of the mandated system the County Sheriff was motivated
to see this capability fall under a separate agency and initiated the creation of DPSS. Although
DPSS supports many agencies in Clermont County it is only mandated to support
communications and dispatch services for the County Sheriff. In its initial conception it was
intended to only serve a single agency, the Sheriff, (who did not necessarily want to manage the
capability).
“I think we had maybe a sheriff at the time that just wanted to wash his hands of it” -
Emergency Management Director
With the County Sheriff unwilling to support E911 within his agency DPSS was created to
provide the service.
The cost of providing services was also a major contributor to the creation of a
consolidated communications center. Prior to 1988 (E911 was mandated in Ohio in November,
1987, see (ORC, 1998)) fire and police department maintained their own dispatch staff. With
E911 emergency dispatchers and phone services had to be available twenty-four hours a day,
seven days a week and many townships could not afford to provide this service on their own.
Creating one central service to support E911 proved to be more cost effective than each town
providing the service.
“That’s when E911 got pushed upon the County in 1988 and everybody had to rethink the
way they do business because all these little dispatch centers in Richmond and Bethel and
some of these other little agencies had their own dispatch. They couldn’t absorb the cost of
running their own 911 stuff so they wanted to push it into one house.” - Communications
Director, Office of Technology, Communications and Security
Although most localities in Clermont County joined the consolidated E911 service, Union
Township, in the Northwest corner of the County, near the major city of Cincinnati decided to
“go it alone” and proved their E911 services separately. This would become important in later
years to DPSS as Union Township represented an alternate source for safety services
(competition) as well as a back-up service for DPSS (collaboration).
“Union Township being one of the largest townships in the county decided that they would
rather do it themselves and they absorbed that cost . . . And Union Township purchased an
800 analog system, totally separate of everybody else . . . there was only two 800 systems in
Comment [T9]: Collab Net
SS – ICT
Common Dispatch System – DPSS formed
Pre-APCO 16
2H87 – Shard services increasing
Comment [T10]: Exo Env Rules
Politics – Political agenda
Sheriff does not want E911
This is ext to PSN because Sheriff is acting outside the PSN with this action
Pre-APCO 16
1h87- Impactful
Comment [T11]: Exo Env Rules Politics – Laws Clermont County must support Sheriff
Pre-APCO 16
Mandate never changes
Initial Conditions – Inconsequential (not new
and never changes
Comment [T12]: Agents – Sheriff
Unwilling to support E911
Pre-APCO 16
2H87
Comment [T13]: Collab Net
SS – DPSS Created
Pre-APCO 16
2H87 - Sharing Increasing
Comment [T14]: Outcome – Bifurcation
Pre-APCO 16
2H87 - Bifurcation
Comment [T15]: End Env Factors
Resources
Townships cannot afford or staff E911 by
themselves
Pre-APCO 16
1987 - Under
Comment [T16]: Collab Net
SS – Most townships join DPSS
SS-LIMITED TO E911
APCO 16
1988 - 1998 - sharing increasing
Comment [T17]: Collab Net
SS-Relationship
Union Township not part of DPSS
Pre-APCO 16
2H87 - Autonomous
Comment [T18]: Exo Env Factor
Economics – Competitor
Union Township
Pre-APCO 16
2H87 - increasing
Comment [T19]: Collab Net
SS-Relationship
Union is back-up to DPSS
Pre-APCO 16
2H87 - Increasing sharing
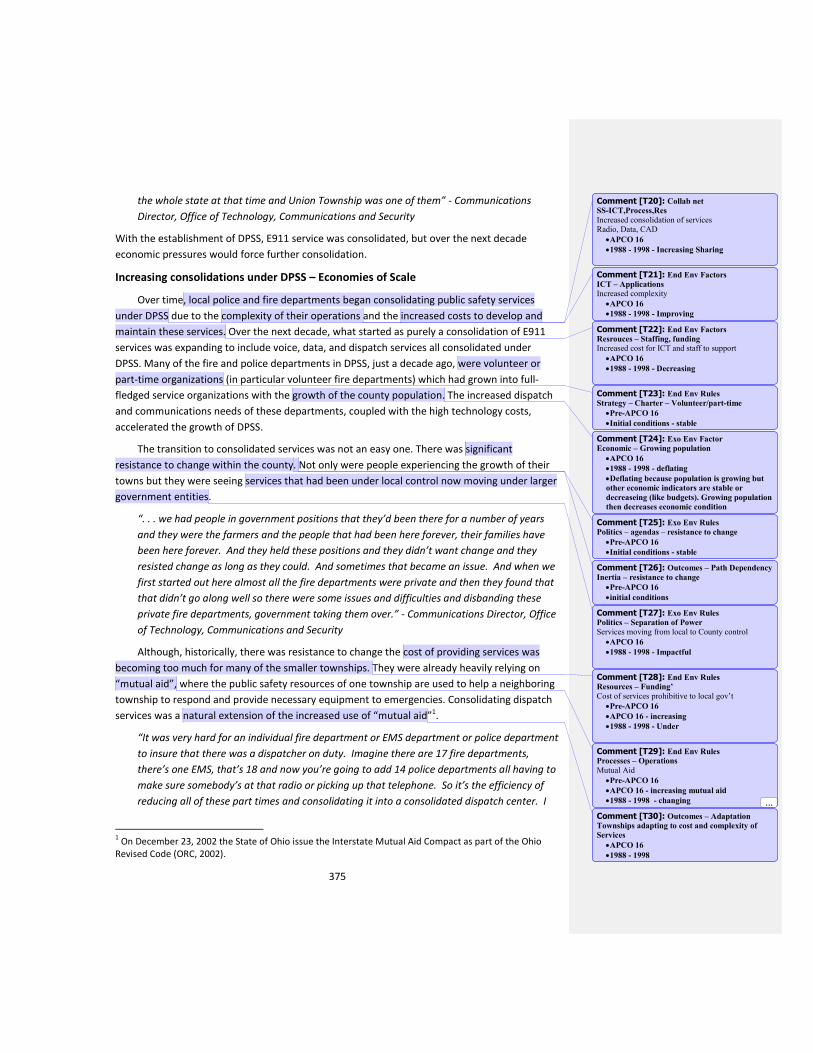
375
the whole state at that time and Union Township was one of them” - Communications
Director, Office of Technology, Communications and Security
With the establishment of DPSS, E911 service was consolidated, but over the next decade
economic pressures would force further consolidation.
Increasing consolidations under DPSS – Economies of Scale
Over time, local police and fire departments began consolidating public safety services
under DPSS due to the complexity of their operations and the increased costs to develop and
maintain these services. Over the next decade, what started as purely a consolidation of E911
services was expanding to include voice, data, and dispatch services all consolidated under
DPSS. Many of the fire and police departments in DPSS, just a decade ago, were volunteer or
part-time organizations (in particular volunteer fire departments) which had grown into full-
fledged service organizations with the growth of the county population. The increased dispatch
and communications needs of these departments, coupled with the high technology costs,
accelerated the growth of DPSS.
The transition to consolidated services was not an easy one. There was significant
resistance to change within the county. Not only were people experiencing the growth of their
towns but they were seeing services that had been under local control now moving under larger
government entities.
“. . . we had people in government positions that they’d been there for a number of years
and they were the farmers and the people that had been here forever, their families have
been here forever. And they held these positions and they didn’t want change and they
resisted change as long as they could. And sometimes that became an issue. And when we
first started out here almost all the fire departments were private and then they found that
that didn’t go along well so there were some issues and difficulties and disbanding these
private fire departments, government taking them over.” - Communications Director, Office
of Technology, Communications and Security
Although, historically, there was resistance to change the cost of providing services was
becoming too much for many of the smaller townships. They were already heavily relying on
“mutual aid”, where the public safety resources of one township are used to help a neighboring
township to respond and provide necessary equipment to emergencies. Consolidating dispatch
services was a natural extension of the increased use of “mutual aid”1.
“It was very hard for an individual fire department or EMS department or police department
to insure that there was a dispatcher on duty. Imagine there are 17 fire departments,
there’s one EMS, that’s 18 and now you’re going to add 14 police departments all having to
make sure somebody’s at that radio or picking up that telephone. So it’s the efficiency of
reducing all of these part times and consolidating it into a consolidated dispatch center. I
1 On December 23, 2002 the State of Ohio issue the Interstate Mutual Aid Compact as part of the Ohio
Revised Code (ORC, 2002).
Comment [T20]: Collab net
SS-ICT,Process,Res
Increased consolidation of services Radio, Data, CAD
APCO 16
1988 - 1998 - Increasing Sharing
Comment [T21]: End Env Factors
ICT – Applications
Increased complexity
APCO 16
1988 - 1998 - Improving
Comment [T22]: End Env Factors
Resrouces – Staffing, funding
Increased cost for ICT and staff to support
APCO 16
1988 - 1998 - Decreasing
Comment [T23]: End Env Rules
Strategy – Charter – Volunteer/part-time
Pre-APCO 16
Initial conditions - stable
Comment [T24]: Exo Env Factor
Economic – Growing population
APCO 16
1988 - 1998 - deflating
Deflating because population is growing but
other economic indicators are stable or
decreaseing (like budgets). Growing population
then decreases economic condition
Comment [T25]: Exo Env Rules
Politics – agendas – resistance to change
Pre-APCO 16
Initial conditions - stable
Comment [T26]: Outcomes – Path Dependency
Inertia – resistance to change
Pre-APCO 16
initial conditions
Comment [T27]: Exo Env Rules
Politics – Separation of Power
Services moving from local to County control
APCO 16
1988 - 1998 - Impactful
Comment [T28]: End Env Rules
Resources – Funding’
Cost of services prohibitive to local gov’t
Pre-APCO 16
APCO 16 - increasing
1988 - 1998 - Under
Comment [T29]: End Env Rules
Processes – Operations
Mutual Aid
Pre-APCO 16
APCO 16 - increasing mutual aid
1988 - 1998 - changing ...
Comment [T30]: Outcomes – Adaptation
Townships adapting to cost and complexity of
Services
APCO 16
1988 - 1998
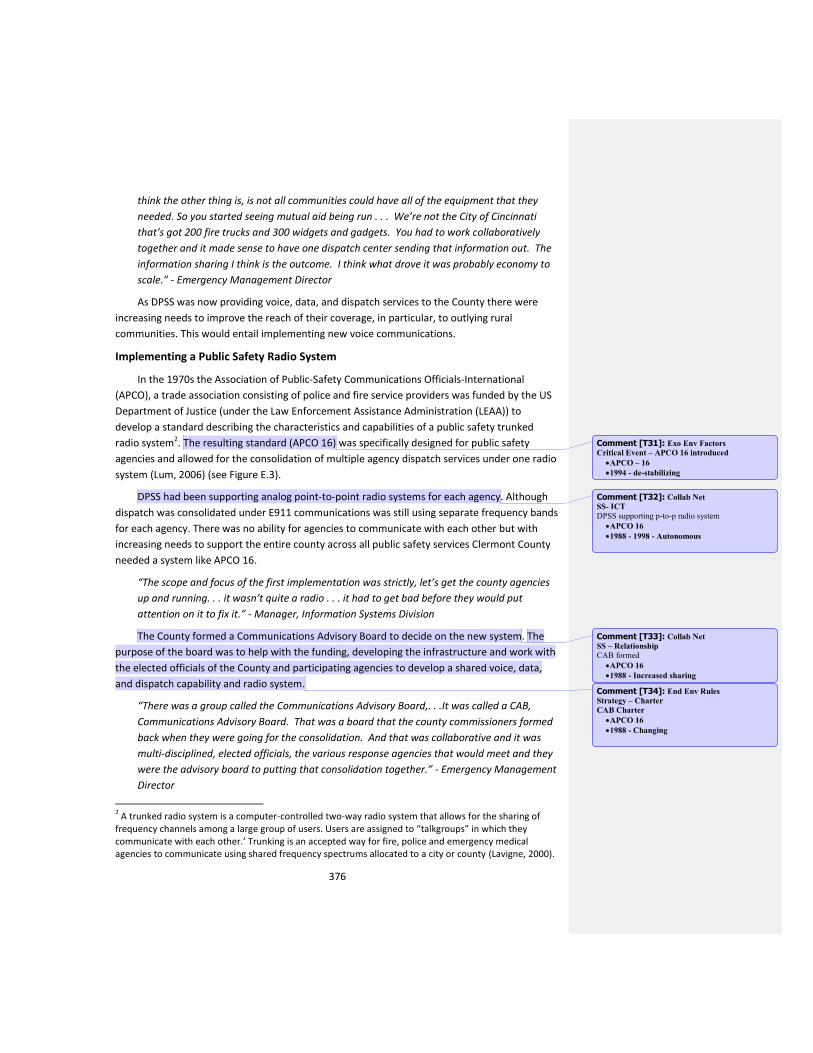
376
think the other thing is, is not all communities could have all of the equipment that they
needed. So you started seeing mutual aid being run . . . We’re not the City of Cincinnati
that’s got 200 fire trucks and 300 widgets and gadgets. You had to work collaboratively
together and it made sense to have one dispatch center sending that information out. The
information sharing I think is the outcome. I think what drove it was probably economy to
scale.” - Emergency Management Director
As DPSS was now providing voice, data, and dispatch services to the County there were
increasing needs to improve the reach of their coverage, in particular, to outlying rural
communities. This would entail implementing new voice communications.
Implementing a Public Safety Radio System
In the 1970s the Association of Public-Safety Communications Officials-International
(APCO), a trade association consisting of police and fire service providers was funded by the US
Department of Justice (under the Law Enforcement Assistance Administration (LEAA)) to
develop a standard describing the characteristics and capabilities of a public safety trunked
radio system2. The resulting standard (APCO 16) was specifically designed for public safety
agencies and allowed for the consolidation of multiple agency dispatch services under one radio
system (Lum, 2006) (see Figure E.3).
DPSS had been supporting analog point-to-point radio systems for each agency. Although
dispatch was consolidated under E911 communications was still using separate frequency bands
for each agency. There was no ability for agencies to communicate with each other but with
increasing needs to support the entire county across all public safety services Clermont County
needed a system like APCO 16.
“The scope and focus of the first implementation was strictly, let’s get the county agencies
up and running. . . it wasn’t quite a radio . . . it had to get bad before they would put
attention on it to fix it.” - Manager, Information Systems Division
The County formed a Communications Advisory Board to decide on the new system. The
purpose of the board was to help with the funding, developing the infrastructure and work with
the elected officials of the County and participating agencies to develop a shared voice, data,
and dispatch capability and radio system.
“There was a group called the Communications Advisory Board,. . .It was called a CAB,
Communications Advisory Board. That was a board that the county commissioners formed
back when they were going for the consolidation. And that was collaborative and it was
multi-disciplined, elected officials, the various response agencies that would meet and they
were the advisory board to putting that consolidation together.” - Emergency Management
Director
2 A trunked radio system is a computer-controlled two-way radio system that allows for the sharing of
frequency channels among a large group of users. Users are assigned to “talkgroups” in which they communicate with each other.’ Trunking is an accepted way for fire, police and emergency medical agencies to communicate using shared frequency spectrums allocated to a city or county (Lavigne, 2000).
Comment [T31]: Exo Env Factors
Critical Event – APCO 16 introduced
APCO – 16
1994 - de-stabilizing
Comment [T32]: Collab Net
SS- ICT
DPSS supporting p-to-p radio system
APCO 16
1988 - 1998 - Autonomous
Comment [T33]: Collab Net
SS – Relationship
CAB formed
APCO 16
1988 - Increased sharing
Comment [T34]: End Env Rules
Strategy – Charter
CAB Charter
APCO 16
1988 - Changing
377
The focal point for the CAB was purchasing and procurement of radios, but once purchased
and deployed the equipment was owned by the respective agencies. Clermont County supplied
radios to the participating agencies so that the new system would be operational across the
participating agencies.
“When the radio system first went in, the county purchased a baseline number of subscriber
units, radios, for everybody to use, just contemplating that a lot of the agencies would never
be able to participate if they were expected to go out and buy their own radios, because
they couldn’t get, in their capital cycles, enough money together to do it. So the county, in
their funding, provided for a fairly adequate number of radios for every agency. Now, most
agencies have added over the years, particularly the fire agencies, have added radios.” -
Manager, Information Systems Division
At the time the County also made a significant investment into systems and equipment
from Motorola. They purchased all Motorola radios and installed their Smartnet trunking
system. One problem with the APCO 16 specification was the lack of specification of a signaling
standard and as a result radio systems could be APCO 16 compliant but at the same time not be
interoperable, with Motorola becoming the primary supplier in the County. Maintaining
acceptable public safety services forced DPSS to upgrade to APCO 16, but at the same time they
became single-sourced to Motorola.
“. . . once you make a commitment you’re stuck for a long period of time, you’re committed
for a long period of time. Because the life of a communications system, a radio system is
really in excess of ten years, some of them go 20. So if you’ve bought into a proprietary
system you’re pretty locked in.” -Manager, Information Systems Division
By the end of 1998 DPSS had made the commitment to Motorola and implemented their
new APCO 16 system. The new system brought a state-of-the-art radio system to the County
with new capabilities for all agencies.
“When the APCO 16 came along, then – only one person can still talk on the radio at a time,
but the digital system lets you have different talk groups. The Fire Chiefs have a talk group.
Our own inner departments were given talk groups and all of our fire trucks and portable
radios had a couple of talk groups where we could talk to each other. So, it went from
basically a one-line telephone to 50 or 60 line system.”- Fire Chief, Central Joint Fire
During this time the State of Ohio was also working on consolidated communications trying to
tie all the State agencies together.
The Ohio Multi-Agency Radio Communications System (MARCS)
A third player (in addition to the County Sheriff and local Police and Fire Departments)
affecting consolidations under DPSS was the State of Ohio and it’s Multi-Access Radio
Communications System (MARCS). MARCS was established by the State to provide for
interoperable communications between all State agencies. The State recognized the need for
interoperability during the Shadyside flood disaster of 1990 when a flash flood killed twenty-six
Comment [T35]: End Env Rules
Governance – Policies
Agencies own radios after initially being purchased
by County
APCO 16
1998 - Changing
Comment [T36]: Outcomes – Adaptation
County adapts to cost problem and buys radios for
agencies
APCO 16
1998
Comment [T37]: Collab Net
SS- ICT
Common radio system – Motorola – APCO16
APCO 16
1998 - Sharing
Comment [T38]: End Env Factors
Critical Event - Interest Group - single source to
Motorola
APCO 16
1998 - Indeterminate
Comment [T39]: Collab Net
SS-ICT
DPSS using APCO 16
APCO 16
1998 - Sharing
Comment [T40]: End Env Factor
Economic – Competition
MARCS
APCO 16
1994 - present - Moderate
Comment [T41]: End Env Rule
Political – Law
State creates MARCS
APCO 16
1994 - Impactful
Comment [T42]: End Env Factor
Crit Event – Shadyside flood – 1990
APCO 16
1990 - Impacttful
378
people Appalachian Valleys of Belmont County. First responders were unable to communicate
with each other even though they had portable and mobile radios. The inability to communicate
between responders created serious issues when attempting to rescue and evacuate people on
either side of the raging river resulting in the deaths. As a result the State authorized the
implementation of a state-wide radios system, in 1994, but it took a full decade to completely
implement (DAS, 2010). Its implementation coincided with DPSS moving to an APCO 16 system.
It made sense for DPSS and MARCS to collaborate. They were both APCO 16 systems
and DPSS had the infrastructure MARCS needed.
“Clermont County was in the process of putting in our communications system at the time.
MARCS came in after us, actually. So, we worked real hard with the MARCS agency. So we
share resources. We had tower sites that were available. We have generators; we’ve got
communications equipment that we were able to negotiate with the state and save them a
lot of money actually, because we co-located tower sites locations. So, we shared, and it
just made sense. We had the infrastructure in place. They were busy building theirs out,
and so where we could we cooperated” - Director of the Office of Technology,
Communications and Security
“. . . we partnered up with Clermont County in order to utilize their towers instead of
building our own towers literally across the street from them. So we’ve got a long and
positive relationship with the folks at Clermont County.” - Program Manager, Ohio MARCS
The arrangement was mutually beneficial to DPSS and the State. For DPSS, MARCS became
a back-up site in the event their systems were not functioning. For MARCS they did not have to
supply the infrastructure (radio towers) or maintain them. MARCS was getting infrastructure in
Clermont County for free and for this support they were waiving their support fees to DPSS ($20
per radio per month).
Not only was MARCS helping DPSS by acting as a back-up site for communications but they
also helped with their single-source problems with Motorola. MARCS was also installing
Motorola equipment. With the State using Motorola, and DPSS, and other counties and
townships, Ohio’s presence at Motorola was substantial. As a result they were getting good
pricing and even better support from Motorola.
“The biggest problem with Motorola is they are a for profit enterprise and they always look
to make money . . .we’re not a bit shy at beating them up about that because our position is
if they’re going to be a partner in public safety they have to forego some of that
tremendous profit they like to make. . . we pay them a lot of money to keep the system up
and running, they do an excellent job of doing that.” - Program Manager, Ohio MARCS
As of 2004, DPSS was supporting almost all voice, data, and communications public safety
services for Clermont County. They were supporting and part of the Ohio MARCS system and
had an up-to-date APCO 16 system. They had strong relationships with the agencies and
townships in the County. For example, even though Union Township still remained separate
from DPSS they were now working together and Union was a back-up site for DPSS. DPSS had
Comment [T43]: Collab Net
SS-relationship
Collaboration with MARCS
APCO 16
2004 - present - Sharing
Comment [T44]: Collab Net
SS – ICT
Shared tower sies with MARCS
APCO 16
2004 - present - Sharing
Comment [T45]: Outcomes – Emergence
Unexpected collaboration with MARCS
APCO 16
2004
Comment [T46]: Collab Net
SS – Relationships – MARCS is back-up for
DPSS
APCO 16
2004 - present - Sharing
Comment [T47]: End Env Factors
Resources – Funding
DPSS not paying MARCS fee
APCO 16
2004 - present - increasing
Comment [T48]: Exo Env Factors
Resources - Funding – MARCS helping to reduce
price of ICT from Motorola
APCO 16
2004 - present - increasing
Comment [T49]: Exo Env Factor Economic – Conditions – Motorola is for profit
company
Constant
Comment [T50]: Collab Net
SS-ICT, Processes, Resources, Relationship
DPSS supporting almost all voice, data, & comm. In county
APCO 16
2004 - Sharing
379
also installed back-up capabilities in the Northeast Communications Center3, in the town of
Loveland, and could also utilize MARCS in an emergency. The resulting DPSS agency network is
depicted in Figure E.3.
Unfortunately, for DPSS, technology advances rapidly and their systems were getting old.
Even the “new” APCO 16 system was six years old. As an early entrant into computer-aided
dispatch, DPSS was now faced with supplanting or replacing legacy systems in most of the
county. Previously, most agencies simply “signed up” with DPSS but with Computer-aided
dispatch (CAD) legacy related compatibility problems occurring there was a danger large
townships that could support their own capability would leave the collaboration. As a result
DPSS embarked on an upgrade to their existing CAD system.
DPSS at Risk, Problems with the new CAD System
During 2008, DPSS initiated the installation of new CAD software. Although they completed
an in-depth evaluation of the software, they failed to realize that their application was slightly
different than the current installed uses of the new software and it failed for them. Configuring
the system for DPSS caused it to fail.
It seemed that DPSS had gone through all the correct steps in planning, purchasing and
installing the system. They had gotten inputs from all the users and agencies before choosing a
vendor. Additionally they brought in representatives from Union Township and Northeast
Communications Center to participate in the choice with the hope they would all eventually
move to the new system.
“. . . we gathered a group of people, some of us from ISD, some from dispatch, from all
three centers, because at that time we thought that all three centers would be getting the
same system. From the fire/EMS side of life, from the law side of life, from the Sheriff’s
Office . . . We got all these people together. We came up with a proposal . . . This group of
people would meet every week, . . . I think there were five different companies that we
looked at closer, and decided on which ones we wanted to have come in and do demos.”-
CAD Support, Information System Department
They had even gone to the vendor site and evaluated and run the system but when the
system was installed and put into use calls that were entered into the system were getting
dropped. Somewhere between the E911 operator and the emergency services dispatcher calls
were disappearing.
“. . .if it disappears from the computer, nobody knows it existed. What happened is, people
will call back, “My vice squad is not here. What happened to it?” And I said, “Well, I took
the call. Why didn’t you dispatch it?” The call never got to dispatch . . . calls would be
missing, which to a dispatcher is the worst thing that can happen. You know you took a
call, and it’s gone.”- CAD Support, Information System Department
3 Northeast Communications, like Union Township, maintained their own E911 capability.
Comment [T51]: Collab Net
SS- relationship
NE set up as back-up site
APCO 16
1999 - Sharing
Comment [T52]: Collab Net
SS- ICT
ICT aging – new capabilities available
APCO 16
2005 - 2006 - Decreasing Sharing
Comment [T53]: Collab Net
SS-ICT
CAD system “dated”
APCO 16
2005 - 2006 - Decreasing Sharing
Comment [T54]: Exo Env Factor
Economic – condition
Large townships can now afford their own systems
APCO 16
2005 - 2006 - Increasing
Comment [T55]: Collab Net
SS-ICT
New CAD system installed
New-CAD
2007 - Sharing increasing
Comment [T56]: Collab Net
SS – ICT
CAD system Fails
New-CAD
2008 - Sharing decreasing
Comment [T57]: Collab Net
SS – Relationships
Cross-agency CAD specification team created
New-CAD
2007 - increasing sharing
Comment [T58]: Exo Env Factors
Economic – Competition
Move to get Union and NE to adopt common CAD system
New-CAD
2007 - decreasing
Comment [T59]: End Env Rules
Process – Operations
Safety operations compromised with missing data
New-CAD
2008 - Changing
380
Technically DPSS had missed that they were buying a system designed for a much smaller
single township application that was being configured to a larger application supporting an
entire county. Additionally the nature of CAD support requires the set-up and conversion to a
new system in only a few days, therefore extensive testing is difficult. Most testing occurs during
active use of the system and fixes are made “on-the-fly”. For DPSS the problems they
encountered did not have any easy fix4.
“. . . the vendor was successful in a small single purpose installations and failed
spectacularly in a larger multi jurisdictional multiple discipline application.” - Manager,
Information Systems Division
“The company programmer was very responsive and tried to fix the system. It’s just that he
couldn’t get it fixed . . . everybody was doing the best they could, except it just couldn’t get
done.” - CAD Support, Information System Department
DPSS saw the problem as mainly a technical failure of the CAD system, but member
agencies were experiencing other frustrations. These frustrations, along with the CAD system
failure, were creating a hostile environment. Agencies were involved in meetings about the CAD
system but were not involved in the decision making. Implementation decisions were made by
DPSS and presented to the member agencies as final.
“. . . there was a number of heated discussions over the CAD system and then us really not
being involved in any discussions until after it was over and done . . .” - Chief of the City of
Milford Police Department
Additionally, even before the system failures were encountered agencies were unhappy
with the system. The system was in use for eighteen months until it was replaced so each
agency had extensive experience with the system. Expectation about the functionality had been
set, but the actual system was not meeting those expectations despite the failures.
“. . . there were a lot of things touted to us when we went through this project, of what we
were going to be able to do interfacing with this system. Those interfaces never
materialized. . .” – Fire Chief, Wayne Township
“I think that’s one of our frustrations it seems.…is the lack of not necessarily knowing
everything that was going on that needed to be dealt with…it’s imperative to be constantly
keeping us informed about things.” - Chief of the City of Milford Police Department
“We were just totally frustrated that we weren’t moving forward, or that we couldn’t get
answers to our day-to-day problems.” - Fire Chief, Central Joint Fire
A full year into the new CAD system DPSS was in crisis. E911 calls were disappearing,
agencies were unhappy with the system (even if it worked) and both Union Township and
Northeast Communications that had planned to join DPSS with the new CAD system had
backed-off and were making individual plans. Still with these problems the feeling in the County
4 At the time of the Interviews Clermont County was involved with legal action against the software
vendor. As a result details of the failure could not be shared with the researchers.
Comment [T60]: Outcome – Emergence
Unanticipated failure of CAD
New-CAD
2008
Comment [T61]: Collab Net
SS – relationships
Frustrations with DPSS – not in the loop
New-CAD
2007 - 2008 - sharing decreasing
Comment [T62]: End Env Rules
Governance – Auth
DPSS making CAD decisions
New-CAD
2007 - 2008 - impactful
Comment [T63]: End Env Factors
ICT – Applications
CAD not meeting functionality by agency
New-CAD
2007 - 2008 - unsatisfactory
381
was not one of blaming anyone in DPSS but rather acknowledgement that the needs of the
county had outgrown the organizational structure of DPSS.
Both Communications (CAD) and Emergency Management Services (EMS) fell under the
same person and the growing feeling was this was too much for one person. Additionally the
person running both was more experienced in EMS; communications was suffering.
“. . . normally when you have a split position like that usually has it bent toward one way or
another. Here we have this person who’s in charge of both communications and EMS but
she has it bent more towards EMS as opposed to having this bend toward communications.
So EMS becomes the priority for her as opposed to communications.” - Chief of the City of
Milford Police Department
The director of DPSS took action to quell any further problems. First, DPSS, hastily, but
efficiently re-installed their previous CAD system while reinstituting a search for a new CAD
system. When they eventually installed the new system it was not exactly what everyone
wanted but it worked flawlessly and had acceptable functionality. What helped was getting all
the agencies involved in every step of implementing the new system, including decision making.
Agencies may have wished for a more capable system, but there were no surprises when it was
launched. Expectations had been met.
“We just went way out of our way the second time around to make sure we had buy-in.” -
Director of the Office of Technology, Communications and Security
Second the responsibilities of communications and EMS were divided across two people. As
a result of the crisis DPSS created a separate management position for computer-aided dispatch
and staffed the position with an individual with a history of high levels of inter-agency
communications. One of his first actions was to re-establish inter-agency communications by
instituting a Communications User Group monthly meeting. With these actions taken DPSS
resumed relatively normal operations and was well on the way to recovering from any long term
damage the CAD crisis had caused.
“Yeah, we have some bruised egos on that one, yeah, we do . . . We took a credibility hit. . . I
think today we are about 90% over it.” - Director of the Office of Technology,
Communications and Security
The Current Collaborative Environment at DPSS
The current collaborative environment for DPSS falls into specific categories of critical,
financial, political, strategic, governance, resources and processes. It is detailed in the following
sections.
Financial
DPSS receives funding through the County budget, user fees, charge-backs and federal
grants. Under County mandate, DPSS must support the Sheriff’s Department resulting in the
County budgeting and supplying funds for these operations. This accounts for approximately
70% of DPSS required funding and has been a stable source of funds since their inception.
Comment [T64]: Agents
DPSS – Org not efficient for needs of County
New-CAD
2007 - 2008
Comment [T65]: End Env Rules
Processes – Operations
Manager supports dual role in DPSS
New-CAD
2007 - 2008 - Stable
Comment [T66]: End Env Rules
Resources – Staffing
Manager experienced in EMS not Comm
New-CAD
2007 - 2008 - Stable
Comment [T67]: Collab Net
SS-ICT
DPSS re-installs old system
New-CAD
2009 - Increasing Sharing
Comment [T68]: Collab Net
SS-Relationships
Multi-agency specification and decision on new CAD system
New-CAD
2009 - increasing sharing
Comment [T69]: Agents
Reorganization at DPSS
Current SS
2010
Comment [T70]: Collab Net
SS-Relationships
Establish Comm Users Group
Current SS
2010- increased sharing
Comment [T71]: End Env Factors
Resources – Funding
DPSS funding impacted by nonpayment
Current SS
2010 - decreasing
382
Additionally DPSS receives funds for user fees and charge-backs. DPSS is in a sensitive
situation because it charges its users for fees, but suspending support due to non-payment is
not an option. Withdrawing public safety services, when a user fails to pay, potentially results in
loss of life and property. Therefore when a user cannot pay their assessed charge (which
happens with many smaller townships) DPSS must absorb the loss. There is growing sentiment,
in DPSS, that this scenario would best be solved by eliminating these types of fees, in particular
when considering the cost and resources required assessing the charge.
“…there’s no penalty for not paying the bill… If you sit down and you figured up the
manpower hours to do this billing, it’s not worth it; it’s just not worth it. And the animosity
and the hard feelings that it costs to collect…”- Communications Director, Office of
Technology, Communications and Security
Recent downturns in the United States economy had increased competition for federal
funds. Although not specifically stated in funding guidelines, many DPSS managers believe that
larger regionalized capabilities were receiving funds ahead of small localized capabilities. DPSS
managers were not planning on receiving significant federal funding as it is organized today.
Political
Each of the agencies within DPSS act as a separate political entity which will pursue their
political agenda or needs when required. As stated previously, DPSS is only mandated to
support the Sheriff’s operations, so all other activities are on a voluntary basis. As such, gaining
support can be a political event requiring lobbying, complaining, or both.
“…we have found that the more that we complain, and that we get our elected officials
involved, kind of makes things happen a little quicker.” - Fire Chief, Central Joint Fire
Fortunately for DPSS the elected officials that hear the complaints do not micro-manage
and let DPSS management exercise their authority. They let them do their job but hold them
accountable for the results.
“Frequently they go above, because they’ll talk to me, and they’ll get the wrong answer,
and then they think that if they go above me, then they’ll get a better answer. Now,
historically, again, I’m very lucky here in Clermont that if those calls go to the
Commissioner’s Office or the Administrator’s Office the standard answer they get is, “Have
you talked to Steve?” and “We’re going to put you back to Steve.” - Director of the Office of
Technology, Communications and Security
Although DPSS does have autonomy the County executives are seen as the decision makers.
DPSS management feels that they are the implementers of the executive’s decisions.
“…Not the decisions.. (be) very careful on that. We implement; the policymakers make the
decisions.” – Director of the Office of Technology, Communications and Security
County administration recognizes the need to understand the view and opinion of the
constituents before pursuing DPSS growth or upgrades.
Comment [T72]: End Env Factors
Resources – Funding
Not collecting all fees
Current SS
2010 - decreasing
Comment [T73]: Exo Env Factors
Economics – Condtiions
Downturn in US economy
Current SS
2010 - recessing
Comment [T74]: End Env Rules
Resources - funding
Funding going to regional plans
Current SS
2010 - decreasing
Comment [T75]: End Env Rules
Governance – Auth
Lobbying of County Commissioners on increase
Current SS
2010 - Impactful
Comment [T76]: End Env Rules
Governance Directives
Commissioners require input from DPSS on
decisions
Current SS
2010 - Impactful
Comment [T77]: End Env Rules
Governance – Auth
Commissioners are ultimate decision makers
Current SS
2010 - Impactful
383
Strategic
DPSS plans and strategies are developed internally but communicated through advisory
boards and communications user groups. Decision regarding DPSS operations, development,
and growth are ultimately made by the three men, the Board of Commissioners for Clermont
County. Weighing heavily as an advisor is the County Administrator, who controls all budgets
and day-to-operations for the county. Since strategies are developed only through advisory
committees and approved only at county executive levels trust and control issues become
apparent among the DPSS agencies.
Cost has caused constituents to collaborate and the need to support mutual aid. Cost
savings occur when the constituents share resources and do not replicate resources. As stated
by the Clermont County Administrator,
“I can’t see anyone going alone anymore. The cost is just too high to purchase, install and
support…”
Although valuing independence, agencies are dependent on each other. Mutual aid occurs
when one organization uses the resources of another to meet service needs. The simplest
example is when multiple fire departments respond to a fire. Mutual aid is a collaborative
action.
“In today’s economic times, we feel that it’s very important to use mutual aid, and use
mutual aid appropriately.” – Fire Chief, Wayne Township
Agencies see collaboration as part of their individual strategies for operations and growth.
They regard further regionalization as the future for PSNs and DPSS in the Clermont County
region. They see this as key to solving funding and interoperability issues but are not yet
addressing the issues involved with supporting an even more diverse member agency base
(potentially spanning counties, major cities and states).
Governance
DPSS governance is a function of the laws of the county legislature and the supported
functionality of the PSN. From its formation until 2004 the DPSS was also controlled by a
Communications Advisory Board (CAB) which was disbanded, mainly because the developments
that they advised upon were completed. DPSS went the next few years without an advisory
board, managing daily operations though their own management. As they implemented changes
to their systems and operations it became necessary for them to communicate to the end users.
“…we were starting to make changes and we need the buy-in so we need to get a group
back together” – Emergency Management Director
In 2007 the County formed the Communications Users Group, which, to date, is the
standing advisory group to DPSS and County officials. Its members include individuals from the
PSN member agencies and citizen groups. The users group became a forum for DPSS to
communicate their plans but there still remained no formal means for users to communicate
Comment [T78]: End Env Rules
Strategy – Charter
DPSS charter developed internally
Current SS
2010 - stable
Comment [T79]: End Env Rules
Governance – Auth
Commissioners
Current SS
2010 - stable
Comment [T80]: End Env Rules
Processes – Operations
County Administrator
Current SS
2010 - stable
Comment [T81]: End Env Rules
Processes – Procedures
Mutual Aid
Current SS
2010 - stable
Comment [T82]: Collab Net SS – relationships
Agencies depend on each other
Current SS
2010 - Sharing
Comment [T83]: End Env Rules Strategy – Vision Further Collaboration
Current SS
2010 - changing
Comment [T84]: Exo Env Rules
Politics – Laws
State laws define many DPSS operations
Current SS
2010- Impactful
Comment [T85]: End Env Rules
Governance – Authority
CAB controls DPSS until disbanded
2004 – 2007 - stable
2010 - Changing
Comment [T86]: End Env Rules
Governance – Auth
DPSS internally managed
Current SS
2010 - Changing
Comment [T87]: End Env Rules
Governance – Auth
Comm Users Group Formed
Current SS
2010 - Changing
384
problem. Problem resolution was handled by DPSS individuals, through phone calls, on a day-to-
day basis.
Resources
With the United States economic downturn in the last few years funding is a major issue
for DPSS. Public Safety Service hardware and software infrastructure is expensive (radio
upgrades are estimated at $10 to $12 million). The capabilities derived from new technology
create pressure to upgrade systems (from users) and the expansion of DPSS to include more
uses increases operation and support costs.
“Unfortunately for us in Clermont County our timing is really bad and our system is aging at
very poor fiscal time.” – Support Engineer, Information System Department
Although federal funding exists through The Department of Homeland Security the
limitation of the use of funds makes them difficult to utilize for specific needs. For example,
DPSS recently upgraded their building and facilities using federal funds. Although they have a
need to upgrade their radio system, funds were earmarked for building upgrades so DPSS
completed the less critical building upgrade rather than lose the available funds.
“…in government you have a lot of different pockets and a lot of different drawers that you
put money in. Well, you can’t just always take from one drawer and move it to another.
You’re limited in your ability to do that.” – Manager, Information Systems Division
DPSS is depending more and more on county funding. They rely on county bonds to fund
infrastructure and upgrades structuring.
Processes
There are no formal metrics monitoring the operation of DPSS except for an accreditation
process for dispatch operations. Dispatch accreditation requires a time specification (to dispatch
resources) and documentation of the processes. Since dispatch times are also part of the total
dispatch time from a 911 call to response at the incident by police and fire personnel, the non-
accreditation of DPSS can affect the accreditation of fire and police departments in the county.
This is not currently an issue although if accreditation does not occur within the expected two
year time frame it would be a cause for agencies to opt out of DPSS.
“We want to know what time the call came in. We want to know what time the call was
dispatched. We want to know from the time the call was dispatched until our units either
get to the patient or the property that’s involved.” – Fire Chief, Central Joint Fire
There is little cross-agency policies and procedure in place for DPSS. Agencies produce
policies and procedures for their own internal operation but there are no processes in place that
cross agency boundaries.
What Lies in the Future for DPSS?
DPSS has a number of challenges awaiting it over the next few years. They have successfully
created a collaborative public safety organization supporting voice, data, and dispatch services
Comment [T88]: Collab Net
SS – relationships
Comm Users Group is forum to communicate problems
Current SS
2010 - Increasing Sharing
Comment [T89]: End Env Factors
Resources - Funding
No funds available for new systems or expansion
Current SS
2010 - Under
Comment [T90]: Exo Env Factors
Economics – Competition New technologies
Current SS
2010 - Increasing
Comment [T91]: End Env Factors
Resources – funding
Limitation on available funds
Current SS
2010
Comment [T92]: End Env Factors
Resources – funding
Depending more and more on the County budget
Current SS
2010
Comment [T93]: End Env Rules
Processes – Procedures
No formal metrics
Current SS
2010 - Under
Comment [T94]: End Env Rules
Processes – Procedures
DPSS working on accreditation.
Current SS
2010 - Changing
Comment [T95]: End Env Rules
Processes – Procedures
Processes and procedures are internal to agencies
Current SS
2010 - Stable
385
during a time of major transition and growth for Clermont County. What just two decades ago
was service characterized by rural, independent township based agencies is now supported
across the entire county using sophisticated technologies and complex arrangements (i.e.
mutual aid). They weathered a major CAD problem that could have caused major disruptions to
their collaborative activities but nevertheless need to continue to foster higher levels of
cooperation and collaboration.
For DPSS is the continuing problem of keeping current with technology. They are once
again faced with the need to upgrade their radio system. The APCO 16 system is obsolete and
has been replaced, by Motorola, with a newer more capable APCO 25 system. Many agencies
want to move to this system as soon as possible. Making the situation more difficult is their
back-up site, and closest competitor, Hamilton County is already supporting APCO 25 and can
take agencies away from DPSS.
Within the last year a small six officer police department made the decision to upgrade to
APCO 25 and utilize support services from Hamilton Township. For DPSS this event has created
increasing pressure to move to APCO 25 as the small police department, through interaction
with other police departments is creating a ground-swell to have the entire county on APCO 25.
“APCO 25 is supposed to be a standard that everybody builds to for the benefit of all.” –
Manager, Information Systems Division
“So, the goal of the new system is to put in an APCO 25 system, which is then capable of
communicating directly with our Hamilton County partners, or Warren County, Butler
County, all the counties surrounding Cincinnati.” – Director of the Office of Technology,
Communications and Security
Moving to APCO 25 is acknowledged by all as the more capable system, the problem is cost.
Moving to the new system is at least a $8 to $10 million investment.
“. . .and we do have a migration plan in place, but again, that is awaiting action by the
Commissioners and funding considerations.” – Manager, Information Systems Division
Regionalization may be a solution for DPSS. Potentially DPSS could look for federal grant
funding to upgrade to APCO 25, but funding of this type tends to be tied to higher level strategic
plans. Currently federal funding is more available for regional projects that are believed to give a
higher return on every dollar spent.
“. . . grant funding from the feds . . . but they want regionalization. They’re all about
getting people together, forming alliances, forming partnerships, and spending this 10
million dollars for six counties to take advantage of, so I’m not sure that if Clermont County
had their grant application prepared today, and could give it to someone, that it would even
be looked at.” – Fire Chief, Central Joint Fire
Having a plan for regionalization may be the key to the future of DPSS. Technically it is
possible, federal funding is more likely obtained, and it solves problems of interoperability.
Comment [T96]: Exo Env Factor
Critical event
Motorola introduces APCO 25
Futures - Impactful
Comment [T97]: Exo Env Factors Economic – Competition Hamilton is APCO 25 – taking agencies from DPSS
Futures
Comment [T98]: End Env Factors
Resources – Funding
Inadequate to upgrade to APCO 25
Futures - Under
Comment [T99]: Exo Env Rules
Politics – agendas
Push for regionalization
Futures - Impactful

386
“. . .our counties, and the counties to the east, that will slowly progress over time, mainly
because two things will happen. One it’s going to be a budget issue, where people have to
look at alternatives, because they can no longer afford what they’re currently doing, which
of course forces some sort of regionalization. And there are more elected officials being put
in place than are thinking from a regional standpoint. . .” – Director of the Office of
Technology, Communications and Security
“I truly believe that there should not be county lines that we should be in a regional role.” –
Emergency Management Director
“The systems are big enough that one regional backbone could exist, and all of us end users
be tied into that backbone, which makes interoperability at that point almost a given.” –
Fire Chief, Central Joint Fire
The question for DPSS is whether they would be the regional PSN or absorbed into another
PSN, like their competitor Hamilton County. For example, MARCS is poised to take on more
regional communications migrating everyone to the State level.
“. . if they just want to get out of the radio business and become users of the MARCS system
primarily then what we would do is we would want to take over their tower sites and all of
their infrastructure.” – Program Manager, Ohio MARCS
For DPSS they know regionalization is a certainty, they just don’t yet know their role.
“. . .consolidated centers outside of single counties is going to become the trend. You’re
going to have regional centers at some point.” – Director of the Office of Technology,
Communications and Security
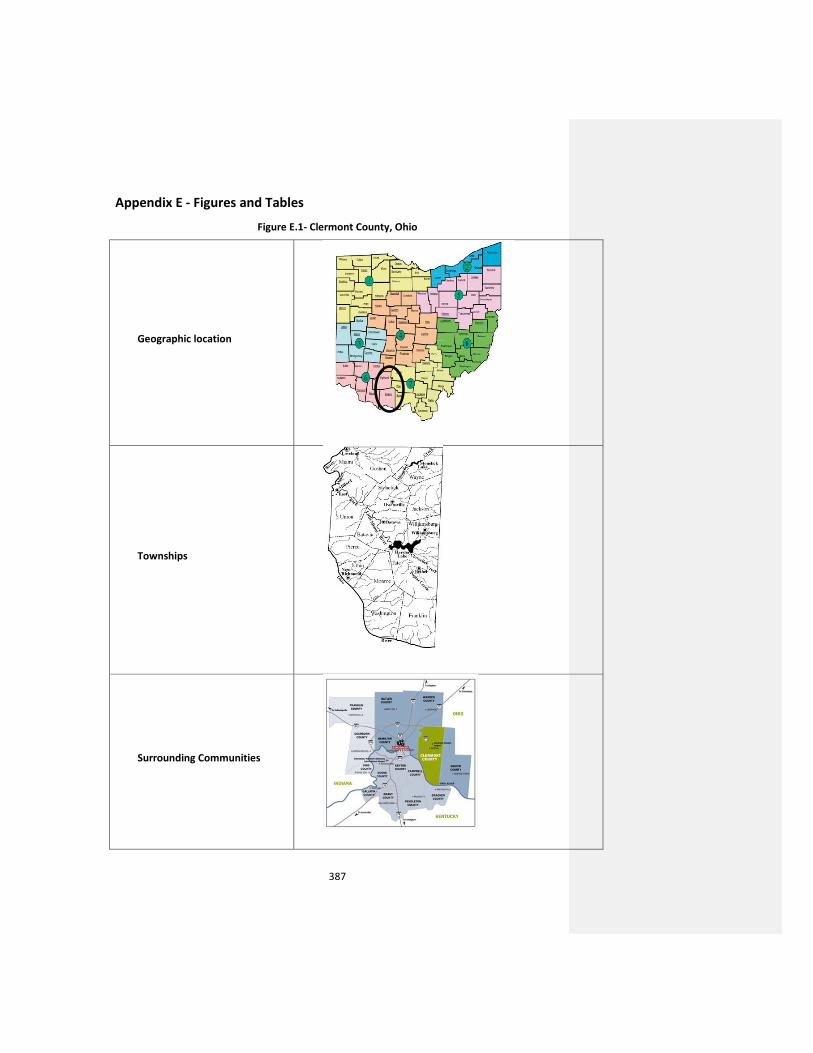
387
Appendix E - Figures and Tables
Figure E.1- Clermont County, Ohio
Geographic location
Townships
Surrounding Communities
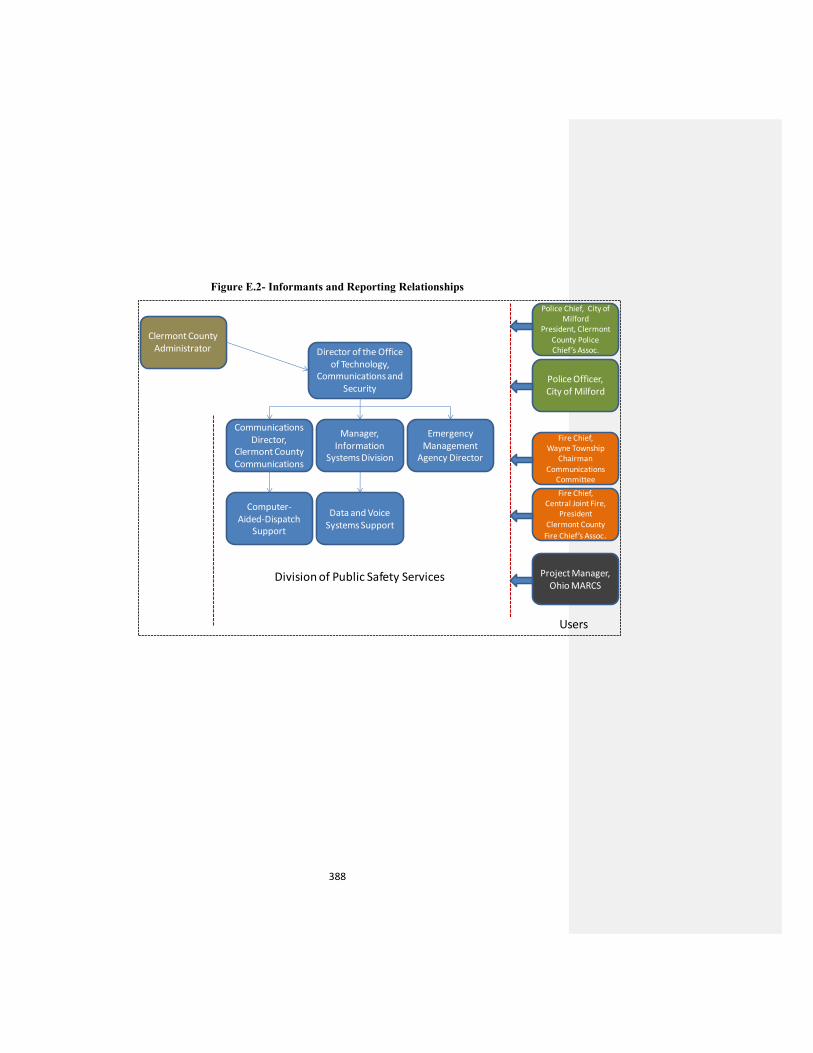
388
Figure E.2- Informants and Reporting Relationships
Director of the Office of Technology,
Communications and Security
Communications Director,
Clermont County Communications
Manager, Information
Systems Division
Emergency Management
Agency Director
Computer-Aided-Dispatch
Support
Data and Voice Systems Support
Police Chief, City of Milford
President, Clermont County Police Chief’s Assoc.
Police Officer, City of Milford
Fire Chief, Wayne Township
Chairman
Communications Committee
Fire Chief, Central Joint Fire,
President
Clermont County
Fire Chief’s Assoc.
Clermont County Administrator
Project Manager,Ohio MARCS
Division of Public Safety Services
Users
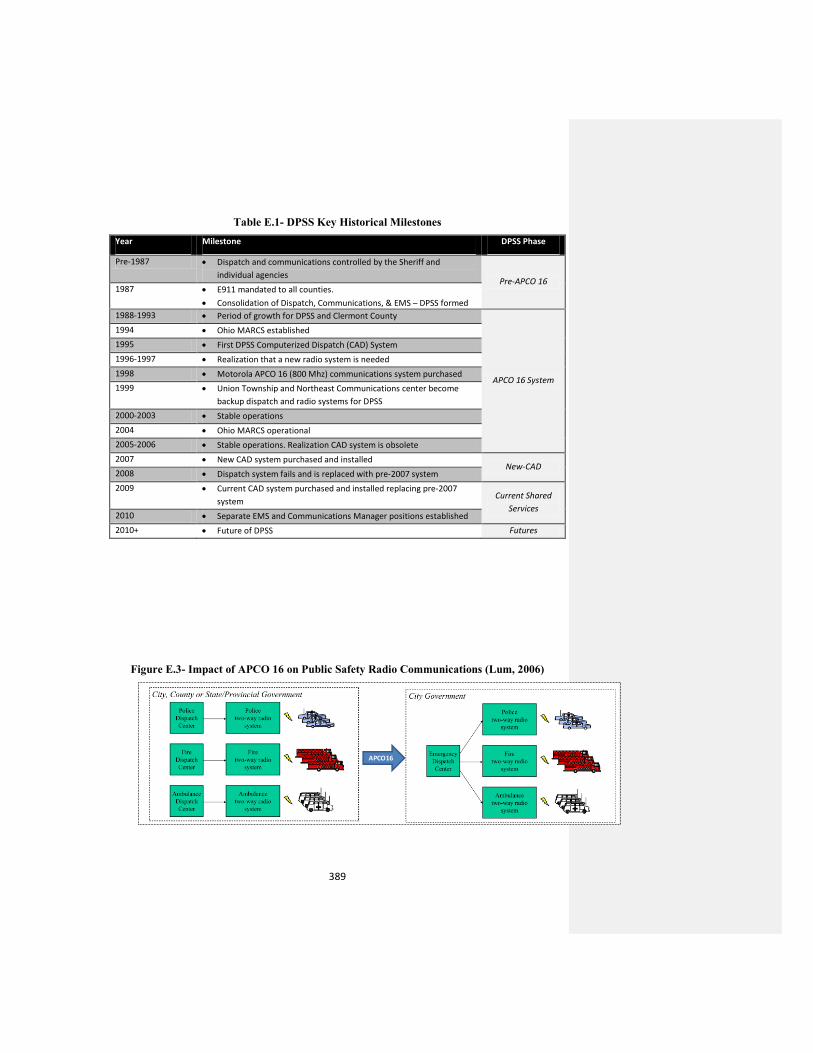
389
Table E.1- DPSS Key Historical Milestones
Year Milestone DPSS Phase
Pre-1987 Dispatch and communications controlled by the Sheriff and
individual agencies Pre-APCO 16
1987 E911 mandated to all counties.
Consolidation of Dispatch, Communications, & EMS – DPSS formed
1988-1993 Period of growth for DPSS and Clermont County
APCO 16 System
1994 Ohio MARCS established
1995 First DPSS Computerized Dispatch (CAD) System
1996-1997 Realization that a new radio system is needed
1998 Motorola APCO 16 (800 Mhz) communications system purchased
1999 Union Township and Northeast Communications center become
backup dispatch and radio systems for DPSS
2000-2003 Stable operations
2004 Ohio MARCS operational
2005-2006 Stable operations. Realization CAD system is obsolete
2007 New CAD system purchased and installed New-CAD
2008 Dispatch system fails and is replaced with pre-2007 system
2009 Current CAD system purchased and installed replacing pre-2007
system Current Shared
Services 2010 Separate EMS and Communications Manager positions established
2010+ Future of DPSS Futures
Figure E.3- Impact of APCO 16 on Public Safety Radio Communications (Lum, 2006)
APCO16
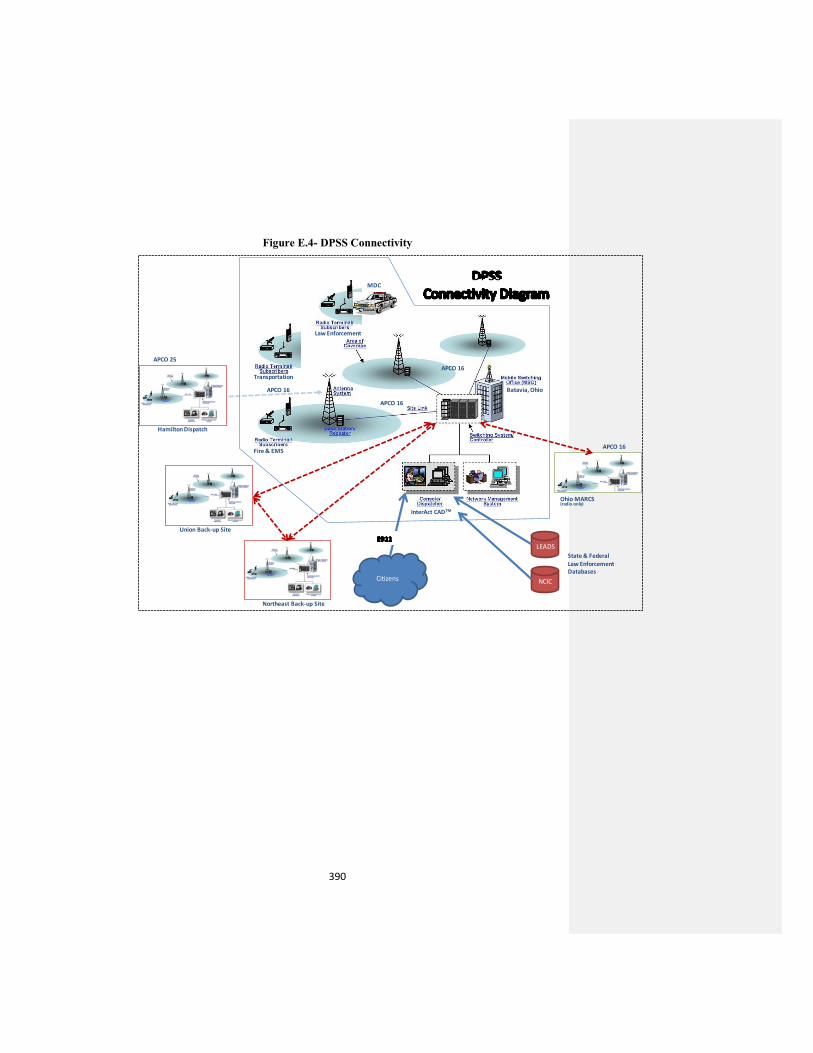
390
Figure E.4- DPSS Connectivity
InterAct CADTM
Batavia, Ohio
Transportation
Fire & EMS
Law Enforcement
APCO 16
APCO 16
Union Back-up Site
Northeast Back-up Site
Ohio MARCS(radio only)
Citizens
E911LEADS
NCIC
APCO 16
Hamilton Dispatch
APCO 16
APCO 25
DPSS Connectivity Diagram
State & FederalLaw EnforcementDatabases
MDC

391
Appendix E - References
DAS. (2010). MARCS Services. Retrieved August 23, 2010, 2010, from http://das.ohio.gov/Divisions/InformationTechnology/MARCSServices.aspx#Facts
Lavigne, R. (2000). Trunking versus conventional radio systems. Paper presented at the Security Technology, 2000. Proceedings. IEEE 34th Annual 2000 International Carnahan Conference on.
Lum, D. (2006). An Introduction to Government Radio Systems. Radio Resource International, 1st Qtr. 2006.
ORC. (1998). 1753.28 Emergency services coverage. Retrieved from http://codes.ohio.gov/orc/1753.28. ORC. (2002). 5502.41 Intrastate mutual aid compact. Retrieved from http://codes.ohio.gov/orc/5502.41.

392
Appendix F – Public Safety Networks Project Survey
PSN Web Survey (Version 6.0)
{Web version of this survey begins with an informed consent section not included below.}
1. What is the full name of the public safety network with which you are associated?
Q5_1 PSN_NAME {OPEN ENDED RESPONSE} Q1_1. What is your full name? {OPEN ENDED RESPONSE}
2. What is your job title and how would you summarize your primary responsibilities?
Q2_1. Title {OPEN ENDED RESPONSE} Q2_2. Responsibilities {OPEN ENDED RESPONSE}
3. Can you give me your contact information, address, phone number and direct extension?
Q3_1. Address {OPEN ENDED RESPONSE} Q3_2. Phone number {OPEN ENDED RESPONSE} Q3_3. Direct extension {OPEN ENDED RESPONSE}
4. Can you provide me with your primary e-mail address?
Q4_1. Email {OPEN ENDED RESPONSE}
(Q5_1 - see above, before Q1)
6. What is your role in the PSN? Q6_1. Role {OPEN ENDED RESPONSE}
Q7. In what City and State is the main office for PSN Name located?
Q7_1 City {OPEN ENDED RESPONSE} Q7_2 State {TWO-LETTERS STATE CODE}
{NOTE: VARIABLES StateID and RegionID FOLLOW THIS QUESTION}
8. Which of the following best describes PSN Name?
Q8. (SELECT ONE) (1) Integrated criminal justice system (2) Integrated policing support system (3) Justice information system (4) Public safety system (5) Information sharing project (e.g. data about crime or juvenile courts) (6) Communications interoperability project (7) Emergency management system (8) Homeland security system (9) Other (please explain) {IF SELECTED}
Q8Specified_9 {OPEN ENDED RESPONSE}
9. I’m now going to list several of the major purposes of public safety networks. Please indicate if
each is a planned purpose of PSN Name.
Q9_A_1. Joint IT purchasing (e.g. communications equipment, computers)? YES or NO Q9_A_2. Developing standards for interorganizational data exchange? YES or NO Q9_A_3. Supporting shared services (e.g. accounting, HR)? YES or NO Q9_A_4. Supporting cross-agency or collaborative business processes (e.g., emergency event
coordination)? Q9_A_5. Providing a cross-agency IT infrastructure for public safety information sharing? YES
or NO
393
Q9_A_6. Are there other major purposes of <NAME: PSN> that I have not listed? YES or NO {IF YES}
Q9Specify_1 briefly describe {OPEN ENDED RESPONSE}
10. I’m now going to list 7 organizational goals of public safety networks, after I read them to you I
would like you to think about which of these would be the top three goals of PSN Name. {Please
Select Top 3}
Q10_1 Facilitating information sharing within and across agencies TOP 3 YES or NO Q10_2 Improving officer safety TOP 3 YES or NO Q10_3 Providing enhanced services to member agencies (e.g., access to databases, email,
discussion boards) TOP 3 YES or NO Q10_4 Fulfilling existing data reporting requirements TOP 3 YES or NO Q10_5 Identifying and assessing trends (e.g., identifying statistical trends) TOP 3 YES or NO Q10_6 Improving public accountability TOP 3 YES or NO Q10_7 Managing people resources (including time savings; enhanced productivity; staff
redeployment) TOP 3 YES or NO Q10_8 Other {IF SELECTED} Q10Specified_8 please specify {OPEN ENDED RESPONSE}
11. Please indicate if the following functional areas are supported by <NAME:IJS>. Q11_A_1. Patrol/Police? YES or NO Q11_A_2. Dispatch/Computer-Aided Dispatch/911? YES or NO Q11_A_3. Fire? YES or NO Q11_A_4. Large-scale planned events (e.g., marathon or demonstration)? YES or NO Q11_A_5. Criminal investigation? YES or NO Q11_A_6. Courts, probation and correction? YES or NO Q11_A_7. Routine emergency incident coordination? YES or NO Q11_A_8. Disaster/crisis coordination? YES or NO Q11_A_9. Homeland security? YES or NO Q11_A_10. Planning or scheduling resources? YES or NO Q11_A_11. Emergency medicine? YES or NO Q11_A_12. Traffic control/transport? YES or NO Q11_A_13. Are there any other functional areas of PSN Name that I may not have mentioned? YES or NO answers to this question are disables in the survey Q11Specify_1 briefly describe {OPEN ENDED RESPONSE}
Are the following organizations intended users of the PSN Name?
Q12_A_1. Federal agencies? (1) Primary user group, (2) Secondary user group, (3) Not an intended user group, (4) Don’t know
Q12_A_2. State agencies? (1) Primary user group, (2) Secondary user group, (3) Not an intended user group, (4) Don’t know
Q12_A_3. Local agencies? (1) Primary user group, (2) Secondary user group, (3) Not an intended user group, (4) Don’t know
Q12_A_4. Private companies? (1) Primary user group, (2) Secondary user group, (3) Not an intended user group, (4) Don’t know
Q12_A_5. Other answers to this question are disables in the survey Q12Specify_1 (please specify) {OPEN ENDED RESPONSE}
{ NOTE: FOR Q13-Q16, valid responses include “not applicable”, zero, or any number response –
including decimals/fractions.}
13. Based on your knowledge, how many people, in full-time equivalents (FTE), work directly for PSN
Name?
Q13. {NUMBER or NOT APPLICABLE} Q13Specify_1 {NUMBER RESPONSE}
394
14. Based on your knowledge, what percentage of the total staff of PSN Name are contractors or
vendor personnel?
Q14. {NUMBER or NOT APPLICABLE} Q14Specify_1 {NUMBER RESPONSE}
15. Based on your knowledge, how many full time equivalent staff of PSN Name are IT professionals?
Q15. {NUMBER or NOT APPLICABLE} Q15Specify_1 {NUMBER RESPONSE}
16. Based on your knowledge, what percentage of the IT professionals on PSN Name are contractors
or vendor personnel?
Q16. {NUMBER or NOT APPLICABLE} Q16Specify_1 {NUMBER RESPONSE}
17. Which of the following would best describe the operational status of the technological
infrastructure supporting PSN Name?
Q17. {SELECT ONE} (1) Planning stage {SKIP TO 19} (2) Concept of operations {SKIP TO 19} (3) Specifications {SKIP TO 19} (4) Working prototype (5) Operational release (6) Second or higher release
{ NOTE: SKIPPED IF THE ANSWER TO Q17 IS A, B, OR C }
18. Which best describes the current level of use of PSN Name?
Q18. {SELECT ONE} (1) No use (2) Pilot use (3) Rising use (4) Steady/stable use (5) Falling use
19. Which best describes the current status of funding for PSN Name?
Q19. {SELECT ONE} (1) Seeking funding (2) Have seed, capital or start up funding (3) Have adequate operational funding for the short term (4) Long term funding is relatively certain. (5) Funding is assured and self-sustaining.
20. Based on your knowledge, please estimate the percentage of current funding for PSN Name from each
of the following sources.
{NOTE: total percentage should not exceed 100%} Q20_1 Grants {PERCENTAGE 0 to 100} Q20_2 Bonds {PERCENTAGE 0 to 100} Q20_3 Appropriations {PERCENTAGE 0 to 100} Q20_4 Earmarks {PERCENTAGE 0 to 100} Q20_5 Other capital funds {PERCENTAGE 0 to 100} Q20_6 Charge-backs to participants {PERCENTAGE 0 to 100} Q20_7 Subscriptions to participants {PERCENTAGE 0 to 100} Q20_8 Other Operational Fees {PERCENTAGE 0 to 100} {IF SELECTED} Q20Specify_1 (Please Specify) {OPEN ENDED RESPONSE} {Q21 through 26 are skipped if the answer to Q17 is A, B, or C, or the answer to Q18 is A }
395
21. I would now like to ask a series of questions about “participating organizations,” those
organizations that use PSN Name. How many participating organizations does PSN Name have
at present?
Q21_1. {NUMBER RESPONSE}.
22. Based on your knowledge, is the number of participating organizations in PSN Name growing, stable,
or declining?
Q22. {SELECT ONE} (1) Growing. (2) Stable (3) Declining 23. Based on your knowledge, has PSN Name reached a critical mass of participating organizations?
Q23. {SELECT ONE} (1)Yes (2)No 24: I am now going to ask you about individual users of PSN Name. In particular, and based on your
knowledge, how many individual users does <NAME: PSN> have?
Q24. {NUMBER or I DON’T KNOW} Q24Specify_1 {NUMBER RESPONSE} { Valid responses include "I don't know", zero, or any whole number response.}
25. Is the number of individual users of PSN Name growing, stable, or declining?
Q25. {SELECT ONE} (1) No end users (2) Growing (3) Stable (4) Declining 26. Based on your knowledge, has PSN Name reached a critical mass of individual users?
Q26. {SELECT ONE} (1) Yes (2) Partially – for some functions or locations (3) No 27. Now I would like to ask you a series of questions about how PSN Name is governed.
What is the current legal authority for PSN Name as an organizational entity?
Q27. (SELECT ONE) (1) Does not apply (2) None (informal) (3) Memorandum of Understanding (MOU) (4) Memorandum of Agreement (MOA) (5) Administrative Action (6) Executive Order (7) 501(3)(C) incorporation (8) Joint powers agreement (9) Inter-governmental agreement (10) Compact (11) State Statute/legislative mandate (12) Other {IF SELECTED}
Q27Specified_12 Please specify {OPEN ENDED RESPONSE}
28. Which of the following answers best describes the PSN Name ?
Q28. (SELECT ONE) (1) An informal working group (2) A subunit of an agency (3) A separate agency or organization (4) An inter-agency task force or committee (5) A public-private partnership (6) A non-governmental entity (e.g., non-profit) (7) Other {IF SELECTED}
Q28Specified_7 Please specify {OPEN ENDED RESPONSE}
29. Where does PSN Name report?
Q29. (SELECT ONE)
396
(1) Each member reports to its own authority (2) Office of the chief information officer (CIO) (3) Executive branch – Administration department other than the CIO (4) Executive branch – public safety agency (5) Legislative branch (6) Judicial branch (7) An independent entity (8) Other {IF SELECTED}
Q29Specified_8 Please specify {OPEN-ENDED RESPONSE}
{PROGRAMMING NOTE: IF Q28 IS A, SKIP TO Q46}
Q30. Is there a formal governance body for PSN Name? (1) Yes (2) No
{IF YES} Q30name_1 What is its name? {OPEN-ENDED RESPONSE} {IF NO, SKIP TO Q40}
31. Which of the following organizations or groups are members of the governance body?
Q31_A_1 Federal agencies YES or NO Q31_A_2 State agencies YES or NO Q31_A_3 Local agencies YES or NO Q31_A_4 Citizens YES or NO Q31_A_5 Technology partners (vendors) YES or NO Q31_A_6 Other private companies YES or NO Q31_A_7 Other answers to this question are disables in the survey Q31Specify_1 Please specify {OPEN ENDED RESPONSE}
32. Which of the following organizations or groups are voting members of the governance body?
Q32_A_1 Federal agencies YES or NO Q32_A_2 State agencies YES or NO Q32_A_3 Local agencies YES or NO Q32_A_4 Citizens YES or NO Q32_A_5 Technology partners (vendors) YES or NO Q32_A_6 Other private companies YES or NO Q32_A_7 Other answers to this question are disables in the survey Q32Specify_1 Please specify {OPEN ENDED RESPONSE}
33. I am going to list a number of common ways that representation on an public safety network
governance body can be determined. For each, please indicate if this is a factor for
representation of the governance body for PSN Name.
Q33_A_1 Level of agency (local, state, federal) YES or NO Q33_A_2 Type of agency (e.g., police, fire) YES or NO Q33_A_3 Location/geography of agency YES or NO Q33_A_4 Appointment by external entity YES or NO Q33_A_5 Subscription YES or NO Q33_A_6 Payment YES or NO Q33_A_7 Election by current members YES or NO Q33_A_8 Other answers to this question are disables in the survey Q33Specify_1 Please explain {OPEN ENDED RESPONSE}
Q34. Does each group with voting privileges have the same number of votes? (1) Yes {SKIP TO Q36 (2)
No
35. If no, which group has the most votes?
Q35_1. {OPEN ENDED RESPONSE}
397
36. Based on your knowledge, do some member organizations disproportionately dominate the
governance body of PSN Name?
Q36. (1) YES (2) NO
37. Disagreements among members of the governance body impede the success of the <PSN>?
Q37. (SELECT ONE) (1) Strongly agree (2) Agree (3) Neither agree nor disagree (4) Disagree (5) Strongly disagree
38. How does the governance body of <NAME: PSN> solicit input from stakeholders?
Q38. (SELECT ONE) (1) Informally only (2) Formal process only (3) Both formally and informally (4) Neither: input not solicited
39. I’m going to read a list of governance functions. For each, is it an important responsibility of the
<NAME: PSN> governance body?
Q39_A_1. Making decisions about which organizations can be members of PSN Name? (1) Very important (2) Somewhat important (3) Not important
Q39_A_2. Approving the budget for PSN Name? (1) Very important (2) Somewhat important (3) Not important
Q39_A_3. Monitoring, evaluating, and controlling the financial performance of PSN Name? (1) Very important (2) Somewhat important (3) Not important
Q39_A_4. Monitoring, evaluating, and controlling the technical performance of PSN Name? (1) Very important (2) Somewhat important (3) Not important
Q39_A_5. Monitoring and evaluating the satisfaction of PSN Name stakeholders? (1) Very important (2) Somewhat important (3) Not important
Q39_A_6. Identifying requirements for PSN Name functionality or services? (1) Very important (2) Somewhat important (3) Not important
Q39_A_7. Approving strategic plans for new applications, new functionality, or new services to be offered by PSN Name?
(1) Very important (2) Somewhat important (3) Not important Q39_A_8. Prioritizing PSN Name technical projects?
(1) Very important (2) Somewhat important (3) Not important Q39_A_9. Making key staffing decisions for PSN Name?
(1) Very important (2) Somewhat important (3) Not important Q39_A_10. Making decisions about IT procurements and services contracts for PSN Name?
(1) Very important (2) Somewhat important (3) Not important Q39_A_11. Developing IT architectural plans or technical standards that apply to PSN Name?
(1) Very important (2) Somewhat important (3) Not important Q39_A_12. Monitoring PSN Name compliance with architectural plans or technical standards?
(1) Very important (2) Somewhat important (3) Not important Q39_A_13. Granting exceptions to PSN Name compliance with architectural plans or technical standards?
(1) Very important (2) Somewhat important (3) Not important Q39_A_14. Deciding on pricing for PSN Name services?
(1) Very important (2) Somewhat important (3) Not important Q39_A_15. Deciding on service level agreements (SLAs) for PSN Name services?
(1) Very important (2) Somewhat important (3) Not important
398
40. Is there another organization or committee, other than a formal governance body, that provides
important control or oversight functions for PSN Name?
Q40. YES or NO {IF NO, SKIP TO Q46}
41. If yes, what is the name of an organization, other than the formal governance body, that provides
important control or oversight functions for PSN Name?
Q41_1. Name {OPEN ENDED RESPONSE}
42. What is the most important control or oversight function it performs for PSN Name?
Q42_1. Function {OPEN ENDED RESPONSE}
43. Is there a second organization or committee, other than a formal governance body, that provides
important control or oversight functions for PSN Name?
Q43. (1) YES (2) NO {IF NO, SKIP TO Q46}
44. If yes, what is the name of that organization?
Q44_1. Name {OPEN ENDED RESPONSE}
45. What is the most important control or oversight function it performs for PSN Name?
Q45_1. Function {OPEN ENDED RESPONSE}
46. In general, the PSN effectively governed.
Q46 {SELECT ONE} (1) Strongly agree (2) Agree (3) Neither agree nor disagree (4) Disagree (5) Strongly disagree (6) Not applicable
47. I’m going to read a number of information technology-related objectives that may be pursued by public safety networks. After I read through them I would like you to respond whether it is a primary or secondary system objective being pursued by PSN Name.
Q47_A_1 Increasing the number of data sources to which users can get access (1) Primary objective (2) Secondary objective (3) Not an objective (4) Don’t know
Q47_A_2 Increasing the number of users who can get access to data (1) Primary objective (2) Secondary objective (3) Not an objective (4) Don’t know
Q47_A_3 Increasing the mobility of data access (1) Primary objective (2) Secondary objective (3) Not an objective (4) Don’t know
Q47_A_4 Increasing data security (1) Primary objective (2) Secondary objective (3) Not an objective (4) Don’t know
Q47_A_5 Consolidating systems (1) Primary objective (2) Secondary objective (3) Not an objective (4) Don’t know
Q47_A_6 Leveraging existing investments in information technology (1) Primary objective (2) Secondary objective (3) Not an objective (4) Don’t know
Q47_A_7 Upgrading or replacing aging IT infrastructure (1) Primary objective (2) Secondary objective (3) Not an objective (4) Don’t know
Q47_A_8 Improving IT infrastructure reliability (1) Primary objective (2) Secondary objective (3) Not an objective (4) Don’t know
Q47_A_9 Increasing in-house control of the system (1) Primary objective (2) Secondary objective (3) Not an objective (4) Don’t know
Q47_A_10 Increasing the extent of outsourcing (1) Primary objective (2) Secondary objective (3) Not an objective (4) Don’t know
399
Q47_A_11 Increasing the use of commercial, off-the-shelf (COTS) software (1) Primary objective (2) Secondary objective (3) Not an objective (4) Don’t know
Q47_A_12 Increasing the use of open-source software (1) Primary objective (2) Secondary objective (3) Not an objective (4) Don’t know
Q47_A_13 Increasing system ease-of-use (1) Primary objective (2) Secondary objective (3) Not an objective (4) Don’t know
Q47_A_14 Increasing use of data standards (e.g., Global Justice XML or National Information Exchange Model, NIEM)
(1) Primary objective (2) Secondary objective (3) Not an objective (4) Don’t know Q47_A_15 Increasing communications interoperability
(1) Primary objective (2) Secondary objective (3) Not an objective (4) Don’t know Q47p Are other objectives related to the technological infrastructure that I have not listed being
pursued?
(1) YES (2) NO {IF YES}
Q47p_Specify Can you briefly describe those objectives {OPEN ENDED RESPONSE}
48. To your knowledge, does PSN Name’s IT architecture incorporate the following elements?
Q48_A_1 Central storage of some participating agency data? (1) Yes (2) No (3) Don’t know Q48_A_2 A portal that provides access to the data sources of various agencies?
(1) Yes (2) No (3) Don’t know
Q48_A_3 Access to data sources not now found in participating agency systems? (1) Yes (2) No (3) Don’t know
(1) Yes (2) No (3) Don’t know
Q48_A_4 The ability to search multiple data sources with a single query? (1) Yes (2) No (3) Don’t know Q48_A_5 Existing COBOL applications? (1) Yes (2) No (3) Don’t know Q48_A_6 Radio communications? (1) Yes (2) No (3) Don’t know Q48_A_7 800 MHZ (megahertz) frequency? (1) Yes (2) No (3) Don’t know Q48_A_8 Mobile access via private telecommunications network (e.g. Verizon or Sprint)? (1) Yes (2) No (3) Don’t know Q48_A_9 Standardization of data via Global Justice XML or its successor the National Information Exchange Model (NIEM)? (1) Yes (2) No (3) Don’t know Q48_A_10 Standardization of business processes? (1) Yes (2) No (3) Don’t know Q48_A_11 Services-oriented architecture (SOA)? (1) Yes (2) No (3) Don’t know Q48_A_12 A plan to migrate to a Service Oriented Architecture (SOA)? (1) Yes (2) No (3) Don’t know Q48_A_13 A mandatory architectural review by some external agency or committee? (1) Yes (2) No (3) Don’t know 49. Which of the following technologies or devices (if any) are planned for or used in PSN Name?
Q49_A_1 Mobile phones (1) Yes (2) No (3) Don’t know Q49_A_2 Smart phones (1) Yes (2) No (3) Don’t know Q49_A_3 Handhelds/PDAs (1) Yes (2) No (3) Don’t know Q49_A_4 Radio (1) Yes (2) No (3) Don’t know Q49_A_5 In-car computers (1) Yes (2) No (3) Don’t know Q49_A_6 In-car touch screen devices (1) Yes (2) No (3) Don’t know Q49_A_7 In-car e-mail (1) Yes (2) No (3) Don’t know Q49_A_8 In-car text message (1) Yes (2) No (3) Don’t know Q49_A_9 In-car maps/access to geographic information systems (1) Yes (2) No (3) Don’t know Q49_A_10 In-car voice input/output (1) Yes (2) No (3) Don’t know
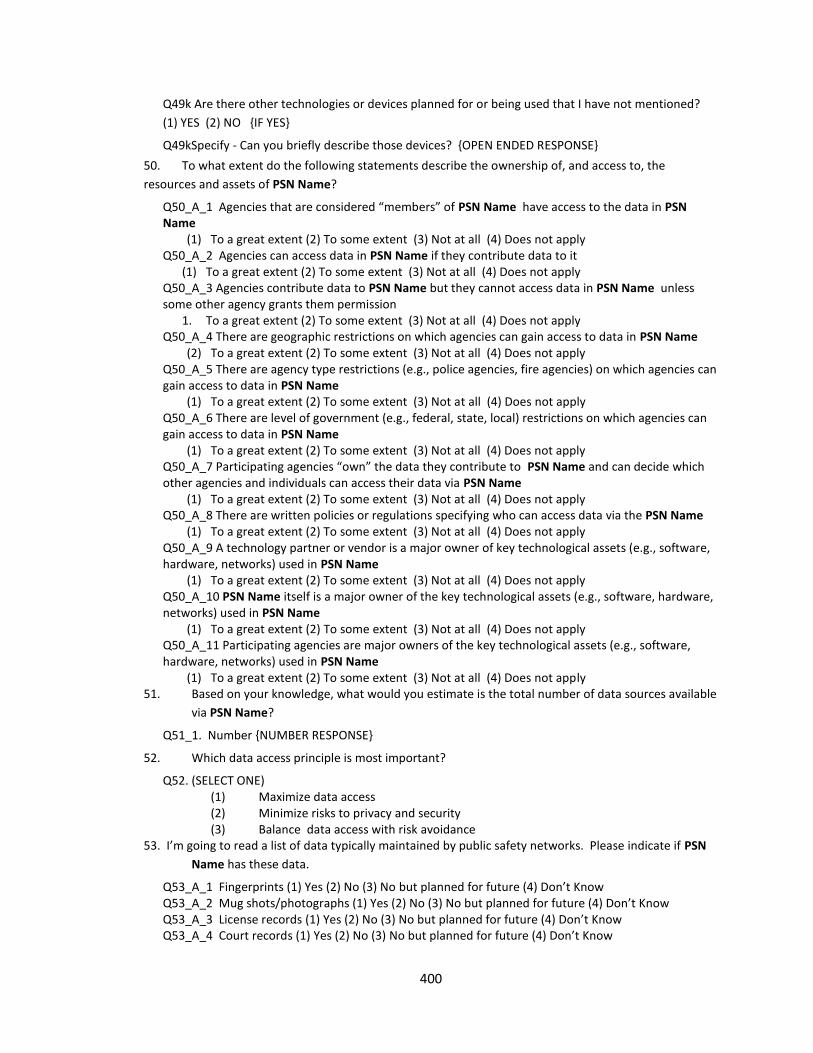
400
Q49k Are there other technologies or devices planned for or being used that I have not mentioned?
(1) YES (2) NO {IF YES}
Q49kSpecify - Can you briefly describe those devices? {OPEN ENDED RESPONSE}
50. To what extent do the following statements describe the ownership of, and access to, the
resources and assets of PSN Name?
Q50_A_1 Agencies that are considered “members” of PSN Name have access to the data in PSN Name
(1) To a great extent (2) To some extent (3) Not at all (4) Does not apply Q50_A_2 Agencies can access data in PSN Name if they contribute data to it
(1) To a great extent (2) To some extent (3) Not at all (4) Does not apply Q50_A_3 Agencies contribute data to PSN Name but they cannot access data in PSN Name unless some other agency grants them permission
1. To a great extent (2) To some extent (3) Not at all (4) Does not apply Q50_A_4 There are geographic restrictions on which agencies can gain access to data in PSN Name
(2) To a great extent (2) To some extent (3) Not at all (4) Does not apply Q50_A_5 There are agency type restrictions (e.g., police agencies, fire agencies) on which agencies can gain access to data in PSN Name
(1) To a great extent (2) To some extent (3) Not at all (4) Does not apply Q50_A_6 There are level of government (e.g., federal, state, local) restrictions on which agencies can gain access to data in PSN Name
(1) To a great extent (2) To some extent (3) Not at all (4) Does not apply Q50_A_7 Participating agencies “own” the data they contribute to PSN Name and can decide which other agencies and individuals can access their data via PSN Name
(1) To a great extent (2) To some extent (3) Not at all (4) Does not apply Q50_A_8 There are written policies or regulations specifying who can access data via the PSN Name
(1) To a great extent (2) To some extent (3) Not at all (4) Does not apply Q50_A_9 A technology partner or vendor is a major owner of key technological assets (e.g., software, hardware, networks) used in PSN Name
(1) To a great extent (2) To some extent (3) Not at all (4) Does not apply Q50_A_10 PSN Name itself is a major owner of the key technological assets (e.g., software, hardware, networks) used in PSN Name
(1) To a great extent (2) To some extent (3) Not at all (4) Does not apply Q50_A_11 Participating agencies are major owners of the key technological assets (e.g., software, hardware, networks) used in PSN Name
(1) To a great extent (2) To some extent (3) Not at all (4) Does not apply 51. Based on your knowledge, what would you estimate is the total number of data sources available
via PSN Name?
Q51_1. Number {NUMBER RESPONSE}
52. Which data access principle is most important?
Q52. (SELECT ONE) (1) Maximize data access (2) Minimize risks to privacy and security (3) Balance data access with risk avoidance
53. I’m going to read a list of data typically maintained by public safety networks. Please indicate if PSN
Name has these data.
Q53_A_1 Fingerprints (1) Yes (2) No (3) No but planned for future (4) Don’t Know Q53_A_2 Mug shots/photographs (1) Yes (2) No (3) No but planned for future (4) Don’t Know Q53_A_3 License records (1) Yes (2) No (3) No but planned for future (4) Don’t Know Q53_A_4 Court records (1) Yes (2) No (3) No but planned for future (4) Don’t Know
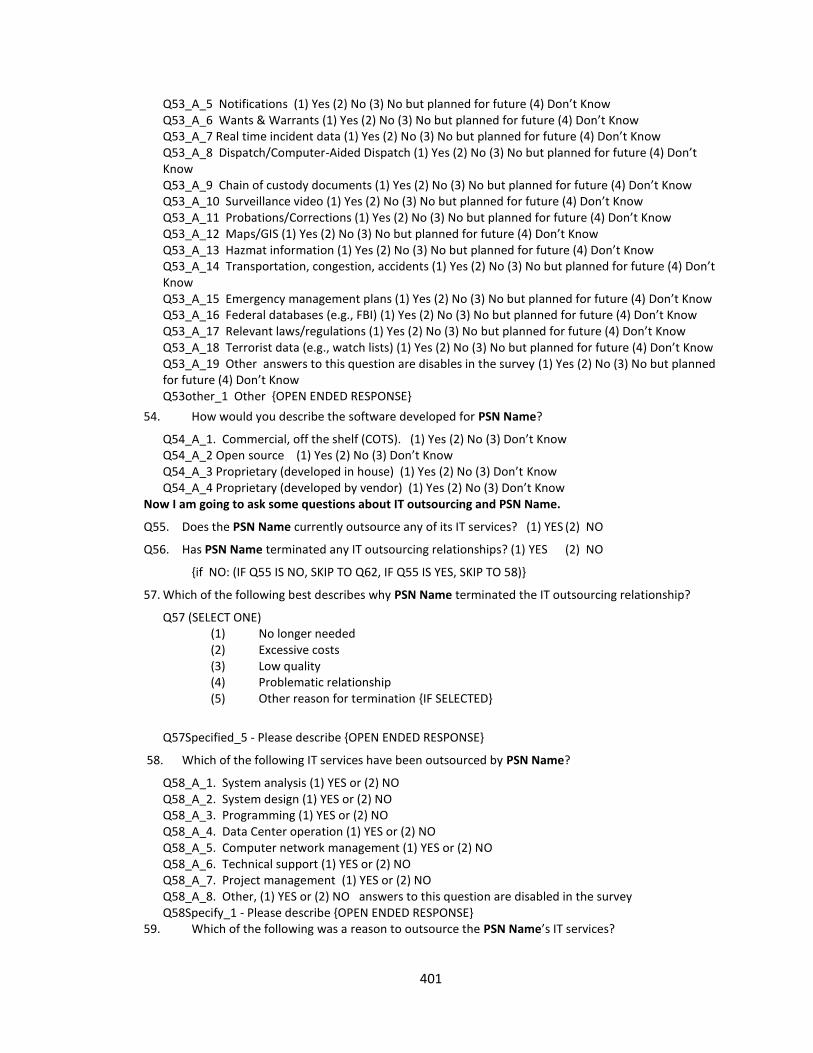
401
Q53_A_5 Notifications (1) Yes (2) No (3) No but planned for future (4) Don’t Know Q53_A_6 Wants & Warrants (1) Yes (2) No (3) No but planned for future (4) Don’t Know Q53_A_7 Real time incident data (1) Yes (2) No (3) No but planned for future (4) Don’t Know Q53_A_8 Dispatch/Computer-Aided Dispatch (1) Yes (2) No (3) No but planned for future (4) Don’t Know Q53_A_9 Chain of custody documents (1) Yes (2) No (3) No but planned for future (4) Don’t Know Q53_A_10 Surveillance video (1) Yes (2) No (3) No but planned for future (4) Don’t Know Q53_A_11 Probations/Corrections (1) Yes (2) No (3) No but planned for future (4) Don’t Know Q53_A_12 Maps/GIS (1) Yes (2) No (3) No but planned for future (4) Don’t Know Q53_A_13 Hazmat information (1) Yes (2) No (3) No but planned for future (4) Don’t Know Q53_A_14 Transportation, congestion, accidents (1) Yes (2) No (3) No but planned for future (4) Don’t Know Q53_A_15 Emergency management plans (1) Yes (2) No (3) No but planned for future (4) Don’t Know Q53_A_16 Federal databases (e.g., FBI) (1) Yes (2) No (3) No but planned for future (4) Don’t Know Q53_A_17 Relevant laws/regulations (1) Yes (2) No (3) No but planned for future (4) Don’t Know Q53_A_18 Terrorist data (e.g., watch lists) (1) Yes (2) No (3) No but planned for future (4) Don’t Know Q53_A_19 Other answers to this question are disables in the survey (1) Yes (2) No (3) No but planned for future (4) Don’t Know Q53other_1 Other {OPEN ENDED RESPONSE}
54. How would you describe the software developed for PSN Name?
Q54_A_1. Commercial, off the shelf (COTS). (1) Yes (2) No (3) Don’t Know Q54_A_2 Open source (1) Yes (2) No (3) Don’t Know Q54_A_3 Proprietary (developed in house) (1) Yes (2) No (3) Don’t Know Q54_A_4 Proprietary (developed by vendor) (1) Yes (2) No (3) Don’t Know
Now I am going to ask some questions about IT outsourcing and PSN Name.
Q55. Does the PSN Name currently outsource any of its IT services? (1) YES (2) NO
Q56. Has PSN Name terminated any IT outsourcing relationships? (1) YES (2) NO
{if NO: (IF Q55 IS NO, SKIP TO Q62, IF Q55 IS YES, SKIP TO 58)}
57. Which of the following best describes why PSN Name terminated the IT outsourcing relationship?
Q57 (SELECT ONE) (1) No longer needed (2) Excessive costs (3) Low quality (4) Problematic relationship (5) Other reason for termination {IF SELECTED}
Q57Specified_5 - Please describe {OPEN ENDED RESPONSE}
58. Which of the following IT services have been outsourced by PSN Name?
Q58_A_1. System analysis (1) YES or (2) NO Q58_A_2. System design (1) YES or (2) NO Q58_A_3. Programming (1) YES or (2) NO Q58_A_4. Data Center operation (1) YES or (2) NO Q58_A_5. Computer network management (1) YES or (2) NO Q58_A_6. Technical support (1) YES or (2) NO Q58_A_7. Project management (1) YES or (2) NO Q58_A_8. Other, (1) YES or (2) NO answers to this question are disabled in the survey Q58Specify_1 - Please describe {OPEN ENDED RESPONSE}
59. Which of the following was a reason to outsource the PSN Name’s IT services?
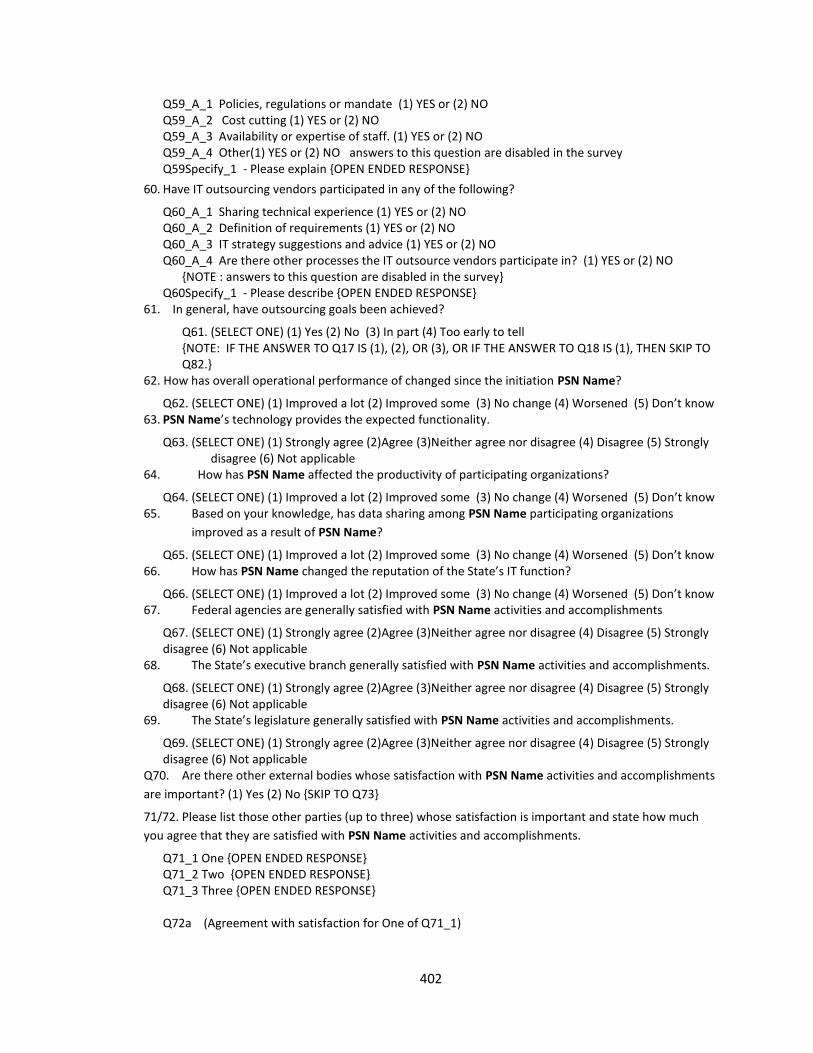
402
Q59_A_1 Policies, regulations or mandate (1) YES or (2) NO Q59_A_2 Cost cutting (1) YES or (2) NO Q59_A_3 Availability or expertise of staff. (1) YES or (2) NO Q59_A_4 Other(1) YES or (2) NO answers to this question are disabled in the survey Q59Specify_1 - Please explain {OPEN ENDED RESPONSE}
60. Have IT outsourcing vendors participated in any of the following?
Q60_A_1 Sharing technical experience (1) YES or (2) NO Q60_A_2 Definition of requirements (1) YES or (2) NO Q60_A_3 IT strategy suggestions and advice (1) YES or (2) NO Q60_A_4 Are there other processes the IT outsource vendors participate in? (1) YES or (2) NO
{NOTE : answers to this question are disabled in the survey} Q60Specify_1 - Please describe {OPEN ENDED RESPONSE}
61. In general, have outsourcing goals been achieved?
Q61. (SELECT ONE) (1) Yes (2) No (3) In part (4) Too early to tell {NOTE: IF THE ANSWER TO Q17 IS (1), (2), OR (3), OR IF THE ANSWER TO Q18 IS (1), THEN SKIP TO Q82.}
62. How has overall operational performance of changed since the initiation PSN Name?
Q62. (SELECT ONE) (1) Improved a lot (2) Improved some (3) No change (4) Worsened (5) Don’t know 63. PSN Name’s technology provides the expected functionality.
Q63. (SELECT ONE) (1) Strongly agree (2)Agree (3)Neither agree nor disagree (4) Disagree (5) Strongly disagree (6) Not applicable
64. How has PSN Name affected the productivity of participating organizations?
Q64. (SELECT ONE) (1) Improved a lot (2) Improved some (3) No change (4) Worsened (5) Don’t know 65. Based on your knowledge, has data sharing among PSN Name participating organizations
improved as a result of PSN Name?
Q65. (SELECT ONE) (1) Improved a lot (2) Improved some (3) No change (4) Worsened (5) Don’t know 66. How has PSN Name changed the reputation of the State’s IT function?
Q66. (SELECT ONE) (1) Improved a lot (2) Improved some (3) No change (4) Worsened (5) Don’t know 67. Federal agencies are generally satisfied with PSN Name activities and accomplishments
Q67. (SELECT ONE) (1) Strongly agree (2)Agree (3)Neither agree nor disagree (4) Disagree (5) Strongly disagree (6) Not applicable
68. The State’s executive branch generally satisfied with PSN Name activities and accomplishments.
Q68. (SELECT ONE) (1) Strongly agree (2)Agree (3)Neither agree nor disagree (4) Disagree (5) Strongly disagree (6) Not applicable
69. The State’s legislature generally satisfied with PSN Name activities and accomplishments.
Q69. (SELECT ONE) (1) Strongly agree (2)Agree (3)Neither agree nor disagree (4) Disagree (5) Strongly disagree (6) Not applicable
Q70. Are there other external bodies whose satisfaction with PSN Name activities and accomplishments
are important? (1) Yes (2) No {SKIP TO Q73}
71/72. Please list those other parties (up to three) whose satisfaction is important and state how much
you agree that they are satisfied with PSN Name activities and accomplishments.
Q71_1 One {OPEN ENDED RESPONSE} Q71_2 Two {OPEN ENDED RESPONSE} Q71_3 Three {OPEN ENDED RESPONSE} Q72a (Agreement with satisfaction for One of Q71_1)

403
(SELECT ONE) (1) Strongly agree (2)Agree (3)Neither agree nor disagree (4) Disagree (5) Strongly disagree Q72b (Agreement with satisfaction for Two of Q71_2) (SELECT ONE) (1) Strongly agree (2)Agree (3)Neither agree nor disagree (4) Disagree (5) Strongly disagree Q72c (Agreement with satisfaction for Three of Q71_3) (SELECT ONE) (1) Strongly agree (2)Agree (3)Neither agree nor disagree (4) Disagree (5) Strongly disagree
73. Based on your knowledge, in general, how satisfied are member or participating organizations
with PSN Name activities and accomplishment accomplishments?
Q73 (SELECT ONE) (1) Majority are satisfied (2) Mixed: some satisfied/some dissatisfied (3) Majority are dissatisfied
74. In general, how satisfied are member or participating organizations with their influence on the
PSN Name's direction?
Q74 (SELECT ONE) (1) Majority are satisfied (2) Mixed: some satisfied/some dissatisfied (3) Majority are dissatisfied
Q75. Have any new initiatives or collaborations among member or participating organizations started
beyond PSN Name as a result of this PSN? (1) Yes (2) No
The following are a list of key performance metrics collected about public safety networks. For each,
indicate if this is an important performance measure for PSN Name and indicate if the measure has
improved, not changed, or worsened since the PSN Name began.
Usage
Q76_A_1 (1) Yes (2) No Q76_B_1 (1) Improved a lot (2) Improved some (3) No change (4) Worsened (5) Don’t know
Inter-agency collaboration Q76_A_2(1) Yes (2) No Q76_B_2 (1) Improved a lot (2) Improved some (3) No change (4) Worsened (5) Don’t know
Success stories Q76_A_3(1) Yes (2) No Q76_B_3 (1) Improved a lot (2) Improved some (3) No change (4) Worsened (5) Don’t know
User productivity Q76_A_4(1) Yes (2) No Q76_B_4 (1) Improved a lot (2) Improved some (3) No change (4) Worsened (5) Don’t know
Process improvement Q76_A_5(1) Yes (2) No Q76_B_5 (1) Improved a lot (2) Improved some (3) No change (4) Worsened (5) Don’t know
System reliability Q76_A_6(1) Yes (2) No Q76_B_6 (1) Improved a lot (2) Improved some (3) No change (4) Worsened (5) Don’t know
Community outreach Q76_A_7(1) Yes (2) No Q76_B_7(1) Improved a lot (2) Improved some (3) No change (4) Worsened (5) Don’t know
Data quality
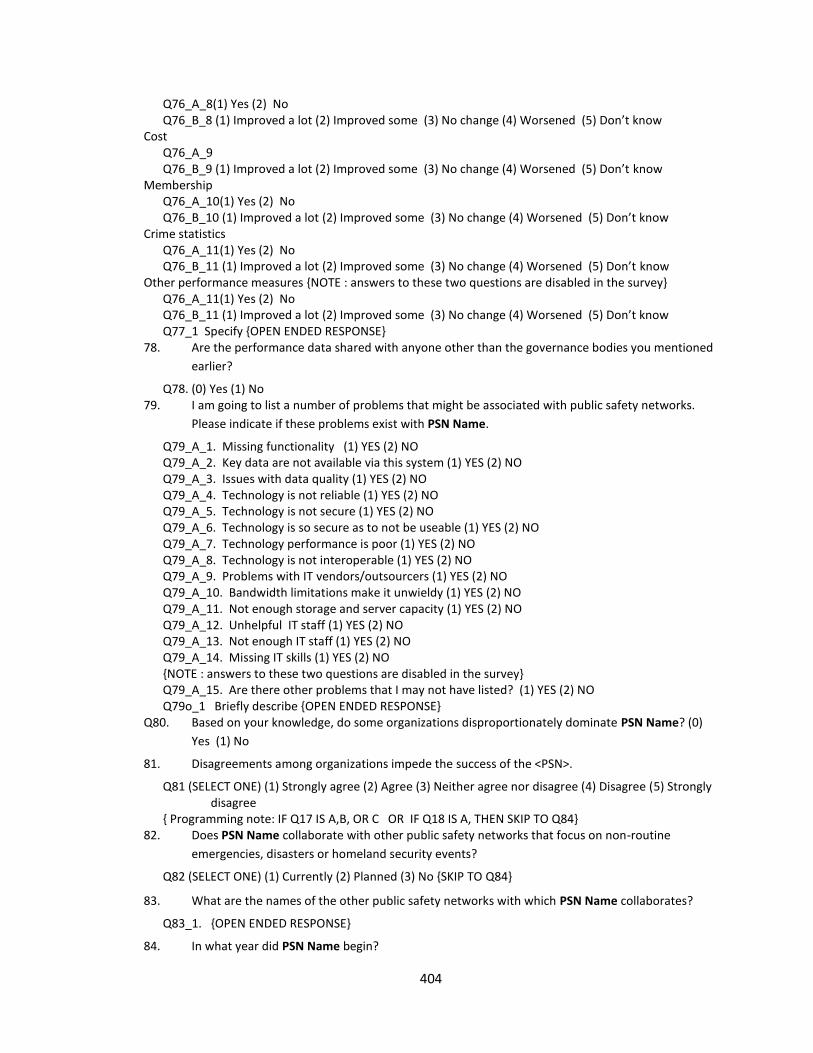
404
Q76_A_8(1) Yes (2) No Q76_B_8 (1) Improved a lot (2) Improved some (3) No change (4) Worsened (5) Don’t know
Cost Q76_A_9 Q76_B_9 (1) Improved a lot (2) Improved some (3) No change (4) Worsened (5) Don’t know
Membership Q76_A_10(1) Yes (2) No Q76_B_10 (1) Improved a lot (2) Improved some (3) No change (4) Worsened (5) Don’t know
Crime statistics Q76_A_11(1) Yes (2) No Q76_B_11 (1) Improved a lot (2) Improved some (3) No change (4) Worsened (5) Don’t know
Other performance measures {NOTE : answers to these two questions are disabled in the survey} Q76_A_11(1) Yes (2) No Q76_B_11 (1) Improved a lot (2) Improved some (3) No change (4) Worsened (5) Don’t know Q77_1 Specify {OPEN ENDED RESPONSE}
78. Are the performance data shared with anyone other than the governance bodies you mentioned
earlier?
Q78. (0) Yes (1) No 79. I am going to list a number of problems that might be associated with public safety networks.
Please indicate if these problems exist with PSN Name.
Q79_A_1. Missing functionality (1) YES (2) NO Q79_A_2. Key data are not available via this system (1) YES (2) NO Q79_A_3. Issues with data quality (1) YES (2) NO Q79_A_4. Technology is not reliable (1) YES (2) NO Q79_A_5. Technology is not secure (1) YES (2) NO Q79_A_6. Technology is so secure as to not be useable (1) YES (2) NO Q79_A_7. Technology performance is poor (1) YES (2) NO Q79_A_8. Technology is not interoperable (1) YES (2) NO Q79_A_9. Problems with IT vendors/outsourcers (1) YES (2) NO Q79_A_10. Bandwidth limitations make it unwieldy (1) YES (2) NO Q79_A_11. Not enough storage and server capacity (1) YES (2) NO Q79_A_12. Unhelpful IT staff (1) YES (2) NO Q79_A_13. Not enough IT staff (1) YES (2) NO Q79_A_14. Missing IT skills (1) YES (2) NO {NOTE : answers to these two questions are disabled in the survey} Q79_A_15. Are there other problems that I may not have listed? (1) YES (2) NO Q79o_1 Briefly describe {OPEN ENDED RESPONSE}
Q80. Based on your knowledge, do some organizations disproportionately dominate PSN Name? (0)
Yes (1) No
81. Disagreements among organizations impede the success of the <PSN>.
Q81 (SELECT ONE) (1) Strongly agree (2) Agree (3) Neither agree nor disagree (4) Disagree (5) Strongly disagree
{ Programming note: IF Q17 IS A,B, OR C OR IF Q18 IS A, THEN SKIP TO Q84} 82. Does PSN Name collaborate with other public safety networks that focus on non-routine
emergencies, disasters or homeland security events?
Q82 (SELECT ONE) (1) Currently (2) Planned (3) No {SKIP TO Q84}
83. What are the names of the other public safety networks with which PSN Name collaborates?
Q83_1. {OPEN ENDED RESPONSE}
84. In what year did PSN Name begin?
405
Q84_1 Year {YEAR RESPONSE}, Age this is an additional variable
85. Before PSN Name was initiated, was data sharing a commonly accepted practice among PSN Name participating organizations?
Q85. (SELECT ONE) (1) Yes (2) No {SKIP TO Q87} (3) Among some members (4) Don’t know {SKIP TO Q87}
Q86. Was the data sharing prior to the initiation of PSN Name a relatively recent or longstanding
practice?
(1) Recent (2) Longstanding
87. I am going to list reasons or events that sometimes trigger the initiation of public safety
networks. Please indicate to what extent each event played a role in the initiation of PSN Name.
Q87_A_1. Legislative mandate (1) To a great extent (2) To some extent (3) Not at all (4) Don’t know (5) Does not apply Q87_A_2. Governor’s executive order (1) To a great extent (2) To some extent (3) Not at all (4) Don’t know (5) Does not apply Q87_A_3. A local government initiative (1) To a great extent (2) To some extent (3) Not at all (4) Don’t know (5) Does not apply Q87_A_4. A public safety event (e.g., 9/11, bridge jumper) (1) To a great extent (2) To some extent (3) Not at all (4) Don’t know (5) Does not apply Q87_A_5. Pressure from the outside (citizens, private sector organizations) (1) To a great extent (2) To some extent (3) Not at all (4) Don’t know (5) Does not apply Q87_A_6. A longstanding practice of information sharing among some of the founding agencies of <NAME: PSN> (1) To a great extent (2) To some extent (3) Not at all (4) Don’t know (5) Does not apply Q87_A_7. A prior technology-based collaboration among some of the founding agencies of <NAME: PSN> (1) To a great extent (2) To some extent (3) Not at all (4) Don’t know (5) Does not apply Q87_A_8. Another public safety network that served as a role model for <NAME: PSN> (1) To a great extent (2) To some extent (3) Not at all (4) Don’t know (5) Does not apply Q87_A_9. External funding made available (such as a grant or appropriation) (1) To a great extent (2) To some extent (3) Not at all (4) Don’t know (5) Does not apply Q87_A_10. Some other event or interaction among some of the founding agencies of <NAME: PSN> (1) To a great extent (2) To some extent (3) Not at all (4) Don’t know (5) Does not apply
{PROGRAMMING NOTE: SKIP Q88 IF Q87 Response H is C,D, OR E} 88. What are the names and locations of the public safety networks that were the model for PSN
Name?
Q88_1 Name1 {OPEN ENDED RESPONSE} Q88_2 City1 {OPEN ENDED RESPONSE} Q88_3 State1 {OPEN ENDED RESPONSE} Q88_4 Name2 {OPEN ENDED RESPONSE} Q88_5 City2 {OPEN ENDED RESPONSE} Q88_6 State2 {OPEN ENDED RESPONSE} Q88_7 Name3 {OPEN ENDED RESPONSE} Q88_8 City3 {OPEN ENDED RESPONSE} Q88_9 State3 {OPEN ENDED RESPONSE}
89. Who (individual or organization) initiated PSN Name?
Q89_1 Who {OPEN ENDED RESPONSE}
90. Which best describes where the initiator was/is located?
Q90 (SELECT ONE) (1) Federal agency
406
(2) Governor’s office (3) State legislature (4) State agency (5) State Judiciary (6) State CIO office (7) County Board of Supervisors (8) County court (9) County CIO office (10) County Commission (11) Local agency (12) Mayoral office (13) City CIO office (14) NGO (15) Other {IF selected}
Q90Specified Please describe {OPEN ENDED RESPONSE}
91. In addition to the initiator, what agencies were involved at the beginning of <NAME: PSN>?
Q91_1 Agencies {OPEN ENDED RESPONSE}
Q92. Based on your knowledge, was this the first time <NAME: PSN>’s founding members collaborated
on a public safety initiative? (2) Yes, (1) N0, (0) Don’t know
Q93. I am interested in contacting individuals like yourself at other public safety network
organizations. Can you provide us with contact information for other individuals who should be
a part of our survey?
{OPEN ENDED RESPONSE} Q93_1 Contact Name1 {OPEN ENDED RESPONSE} Q93_2 PSN Name 1 {OPEN ENDED RESPONSE} Q93_3 Phone1 {OPEN ENDED RESPONSE} Q93_4 Email 1 {OPEN ENDED RESPONSE} Q93_5 Title or expertise of contact 1 {OPEN ENDED RESPONSE} Q93_6 Contact Name2 {OPEN ENDED RESPONSE} Q93_7 PSN Name 2 {OPEN ENDED RESPONSE} Q93_8 Phone2 {OPEN ENDED RESPONSE} Q93_9 Email 2 {OPEN ENDED RESPONSE} Q93_10 Title or expertise of contact 2 {OPEN ENDED RESPONSE} Q93_11 Contact Name3 {OPEN ENDED RESPONSE} Q93_12 PSN Name 3 {OPEN ENDED RESPONSE} Q93_13 Phone3 {OPEN ENDED RESPONSE} Q93_14 Email 3 {OPEN ENDED RESPONSE} Q93_15 Title or expertise of contact 3 {OPEN ENDED RESPONSE}
Q94. Would you be interested in receiving a summary of survey responses when the project is
complete? (1) Yes, (2) No
Q95. And finally, may someone from the research team contact you again if I have more questions?
(2) Yes, (1) No
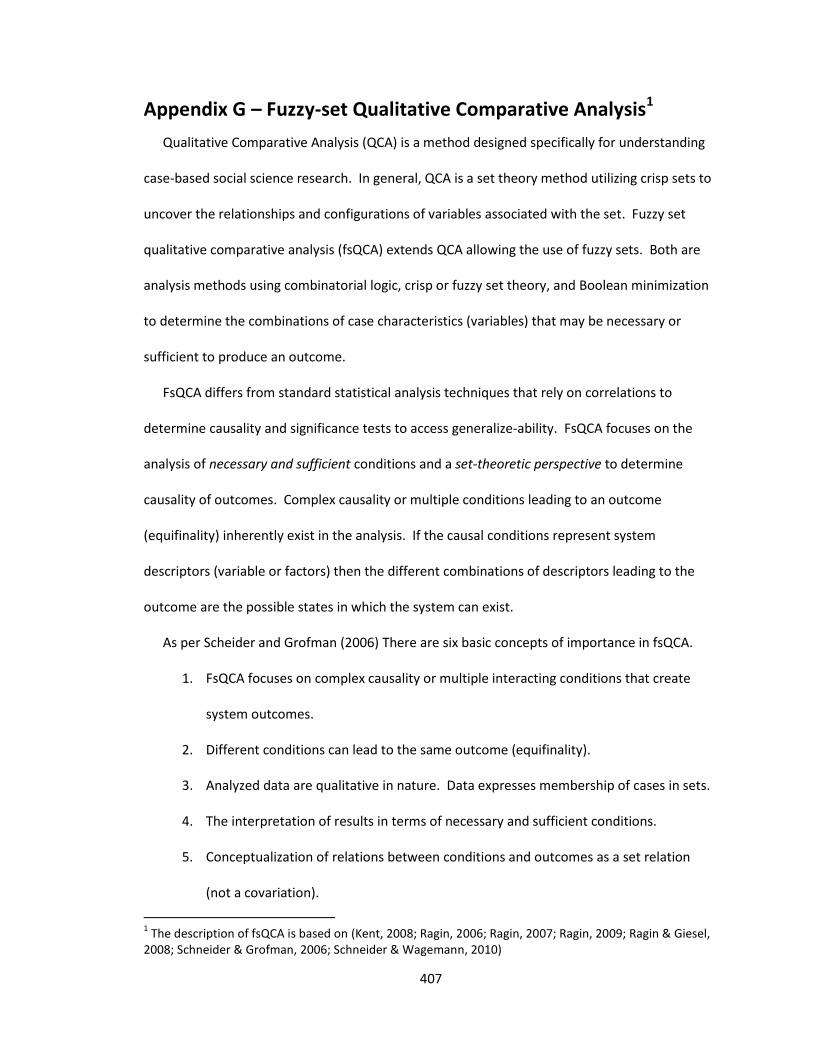
407
Appendix G – Fuzzy-set Qualitative Comparative Analysis1
Qualitative Comparative Analysis (QCA) is a method designed specifically for understanding
case-based social science research. In general, QCA is a set theory method utilizing crisp sets to
uncover the relationships and configurations of variables associated with the set. Fuzzy set
qualitative comparative analysis (fsQCA) extends QCA allowing the use of fuzzy sets. Both are
analysis methods using combinatorial logic, crisp or fuzzy set theory, and Boolean minimization
to determine the combinations of case characteristics (variables) that may be necessary or
sufficient to produce an outcome.
FsQCA differs from standard statistical analysis techniques that rely on correlations to
determine causality and significance tests to access generalize-ability. FsQCA focuses on the
analysis of necessary and sufficient conditions and a set-theoretic perspective to determine
causality of outcomes. Complex causality or multiple conditions leading to an outcome
(equifinality) inherently exist in the analysis. If the causal conditions represent system
descriptors (variable or factors) then the different combinations of descriptors leading to the
outcome are the possible states in which the system can exist.
As per Scheider and Grofman (2006) There are six basic concepts of importance in fsQCA.
1. FsQCA focuses on complex causality or multiple interacting conditions that create
system outcomes.
2. Different conditions can lead to the same outcome (equifinality).
3. Analyzed data are qualitative in nature. Data expresses membership of cases in sets.
4. The interpretation of results in terms of necessary and sufficient conditions.
5. Conceptualization of relations between conditions and outcomes as a set relation
(not a covariation).
1 The description of fsQCA is based on (Kent, 2008; Ragin, 2006; Ragin, 2007; Ragin, 2009; Ragin & Giesel,
2008; Schneider & Grofman, 2006; Schneider & Wagemann, 2010)
408
6. Iterative FsQCA analysis requires redefinition of conditions and potentially adding or
deleting cases to uncover sets of causal conditions.
FsQCA is best applied when the researcher assumes (or believes) that complex causality is
present and the population of cases is too low for statistical techniques. Typically, the
researcher has previously gained knowledge of the population and uses this knowledge to
define, specify and measure the key concepts applicable to the system under study.
The following sections elaborate QCA and fsQCA concepts. First the QCA concept is
described, since it is conceptually simpler, and then extended to fsQCA. A basic understanding
of QCA concepts, which consider only crisp conditions (full membership (1) or nonmembership
(0)), is useful in understanding fsQCA concepts, where conditions can take any value in the
range of full membership (1) to full nonmembership (0). Concepts are explained by starting with
the assignment of data to sets (membership), empirical linking of conditions to outcomes (truth
tables), extending this to representation of outcomes causality (solution formulas), and
concluding with validation of the sufficiency of the conditions for outcomes (sufficiency,
coverage and consistency).
Membership
Membership is a measure of the relation of a condition to a set. For example, a researcher
may define the set “rich” to include all individuals with income over a certain threshold. In QCA
analysis, any individual with income greater than the threshold would be “in” the set (1),
otherwise they would be “out”. In fsQCA, calibrated membership accesses the degree of
membership in the set. Using the previous example an individual with income at
three times the threshold might be considered “in” the set (membership = 1),
at twice the threshold, “more in the set than out” (membership = .75),

409
at the threshold “indeterminate or cross-over as to whether in or out” (membership =
.5),
at half the threshold, “more out than in” (membership = .25), and
with zero income “out” (membership = 0).
Theoretical concepts, at the discretion of the researcher, would be the basis for calibrations.
Numerous techniques have emerged for calibrating membership and many are specific to
the research and cases, such as:
Likert scales that access conditions such as “strongly agree” to “strongly disagree”
simply translate to membership scores. A 5-point Likert scale would translate to
membership values of (0, .25, .5, .75, 1).
Direct membership uses the full membership, full non-membership and crossover to
anchor calibration. Intermediate membership can then be calculated using
exponents and probabilities to create a smooth S-shaped calibration curve (Ragin,
2007).
Indirect membership relies on the researcher’s knowledge and grouping of cases
according to their membership in a target set. Many times this type of calibration is
open and revised as a study proceeds. Typically, theory based, calibration is at a
minimum documented in detail giving meaning to the calibration and further fsQCA
analysis.
Counting derives membership using the proportion of positive answers to total
answers to derive membership. For example, the proportion of number of
attributes that are associated with a set and exhibited by a case to the total number
of attributes defining the set defines membership.
410
Of critical importance, independent of calibration technique(s) used, is the detailed
documentation of the techniques so that resulting causal conditions from an fsQCA analysis can
be explained and evaluated (Schneider & Wagemann, 2010).
Truth Tables
Truth tables represent all the logically possible combinations of the conditions that result in
an outcome. It is essentially the representation of the empirical data from a study in tabular
form. For example a system with outcome Z and causal conditions A, B, and C, might have
observed data as shown in Table G.1.
QCA analyzes crisp data and continuous data would use fsQCA. Since QCA uses crisp data, its
truth table is usually constructed for every possible combination of inputs A, B, and C. If a
combination is not empirically observed it can be deleted from the table or designated as a
“don’t care” (either 0 or 1, denoted by “X”) based on the knowledge of the researcher. Truth
tables for fsQCA only contain the observed empirical data, as there are infinite possible
combinations of inputs.
Solution formulas
A solution formula is a way of expressing the results of QCA or fsQCA analysis. Letters (or
strings) linked by Boolean operators represent outcomes and their causally relevant conditions.
The three basic Boolean operators are logical OR (+), logical AND (*), and logical NOT (~). Each
operator is defined the same for QCA and fsQCA as follows.
Logical NOT is the negation of the original value
o NOT (X) = 1 – X
Logical AND represents the intersection sets and is calculated as the minimum value
of two (or more) sets.
411
o X * Y = min(X,Y)
Logical OR represents the union of two sets and is calculated as the maximum value
of two (or more) sets.
o X + Y = max(X,Y)
FsQCA also utilizes two additional operators, concentration and dilation, as follows (the
operations are valid for QCA, but would have no effect on crisp set values)
CONCENTRATION involves squaring the original values and expands values to the adverb
“very”. For example, a person with member ship of .8 in “tall” converts to a
membership of .64 in “very tall”.
o Conc(X) = X2
DILATION involves taking the square root of the original value and results in values as
“more or less” in a set. For example, a person with a .36 membership in “rich” dilates to
a membership of .6 in “more or less rich”.
o Dil(X) = X1/2
Then, combining variables using operators to represent how the value sets of the causal
condition relate to the output results in a solution formula. From Table G.1 the solution formula
for Y (in QCA) is as follows.
Y ← ~A*~B*C + ~A*B*~C + A*~B*~C + A*~B*C
FsQCA produces similar solution formulas. The sign ← (along with its counterpart →) indicates a
logical relationship.
Necessary and Sufficient Conditions
Necessary conditions are very important in social science research because the relevant
causal condition is present in all instances of an outcome. In contrast, sufficient conditions are
important for causal complexity because they exist only in combinations with other conditions.

412
Stated in tandem, necessity and sufficiency provide a complete understanding of causality, as
follows.
A condition is necessary and sufficient if it is the only condition producing an outcome.
Similarly if it is absent then the outcome is also absent.
A condition is necessary but not sufficient if it is contained in all combinations producing
the outcome. Again, if is absent the condition is also absent. In QCA, a necessary
condition occurs when the outcome is present (1) and the condition, or input, is also
present (1). In fsQCA necessity is indicated when the membership of the input (xi) is
greater than the membership of the outcome (yi). The set of cases containing the input
condition subsumes the output set.
A condition is sufficient but not necessary if it is capable of producing the outcome by
itself, but at the same time, other combinations of conditions can also produce the
outcome. In QCA whenever a sufficient condition exists (1) the outcome is also present
(1). In fsQCA sufficiency is indicated when the membership of the input (xi) is less than
or equal to the membership of the outcome (zi). The set of cases containing the input
condition is a subset of the output set.
A condition is neither necessary nor sufficient if it produces an output only if combined
with other conditions.
Necessary conditions are always present when the outcome is present. A condition is sufficient
if when present it produces the output but the output may be present when the sufficient
condition is not present. Since sufficiency relates to the combinations of conditions that create
an output the main analysis from QCA and fsQCA is a determination of the list of sufficient
conditions for a specific outcome.
413
Consistency and Coverage
Consistency and coverage are measures of the fit of possible sufficient conditions to explain
and outcome. Whenever a sufficient condition is present, the outcome is also present. Many
times, in empirical data, a condition is associated with an outcome, but not in every instance.
For example, the condition may hold for the majority of cases, but not all. Consistency and
coverage are measures of the sufficiency of a condition.
For QCA consistency is simply the proportion of cases in which the condition is sufficient
(produces the outcome) to the number of cases that contain the condition (the output may not
be present). Similarly, coverage is the proportion of cases that contain the condition to the total
number of cases in which the outcome is present.
For fsQCA consistency is the proportion of cases with condition membership less than or
equal to the output membership to the total number of cases with the outcome membership
greater than zero. High consistency values indicate the condition is sufficient for the output.
Likewise, coverage is the proportion of cases with condition membership less that than or equal
to the output membership to the total number of cases where the membership of the output is
greater than zero.
It is important to note that when all the membership scores for the condition are less than
the membership for the outcome the consistency is unity (1) and the condition is completely
sufficient. If only a few cases have the condition membership greater than the outcome
membership, the consistency is close to unity. Therefore when utilizing fsQCA analysis
conditions considered potentially sufficient for an outcome typically have consistencies greater
than .8 (Ragin, 2009).
Accessing the prominence or importance of the causal conditions uses coverage of the
condition. Coverage is an indicator of the percentage of cases explained by the combination of
414
causal conditions for the indicated output. Table G.2 summarizes the sufficiency, consistency,
and coverage for QCA and fsQCA analysis.
Analysis in QCA and fsQCA
Utilizing calibration, truth table, solution formula, sufficiency, and consistency and coverage
concepts QCA and fsQCA analysis is a five step process as follows.
1. Data collected is calibrated and assigned a degree of membership. For QCA
membership is crisp, either “in” (1) or “out” (0) of a set. In fsQCA, membership is
continuous and determined by a theory based rigorous, well documented, calibration
technique.
2. Outcomes of interest are associated with conditions, or inputs, that are present or
absent when the outcome is present or absent. This is represented as a truth table
showing the input causal conditions and resulting outputs. In QCA truth tables can
many times be generated by observation or for large data sets with the assistance of
computer programs. In fsQCA, typically computer programs are used.
3. The resulting truth tables are simplified to generate solution formula for each
outcome. In QCA Boolean logic simplification techniques are used either manually or
with logic minimization programs. In fsQCA computer programs are utilized which
implement the Quine-McClusky minimization techniques (which can also be used in
QCA). The result in solution formula defines the combinations of causal conditions
(complex causality) that result in an output.
4. The combinations of causal conditions are evaluated for their fit to the outcome by
calculating their consistency and fit to the outcome. Consistency and coverage access
the validity of the causal conditions that result in an outcome.

415
5. The researcher evaluates the valid causal conditions and gives them meaning and
definition that is relevant to the population under study.
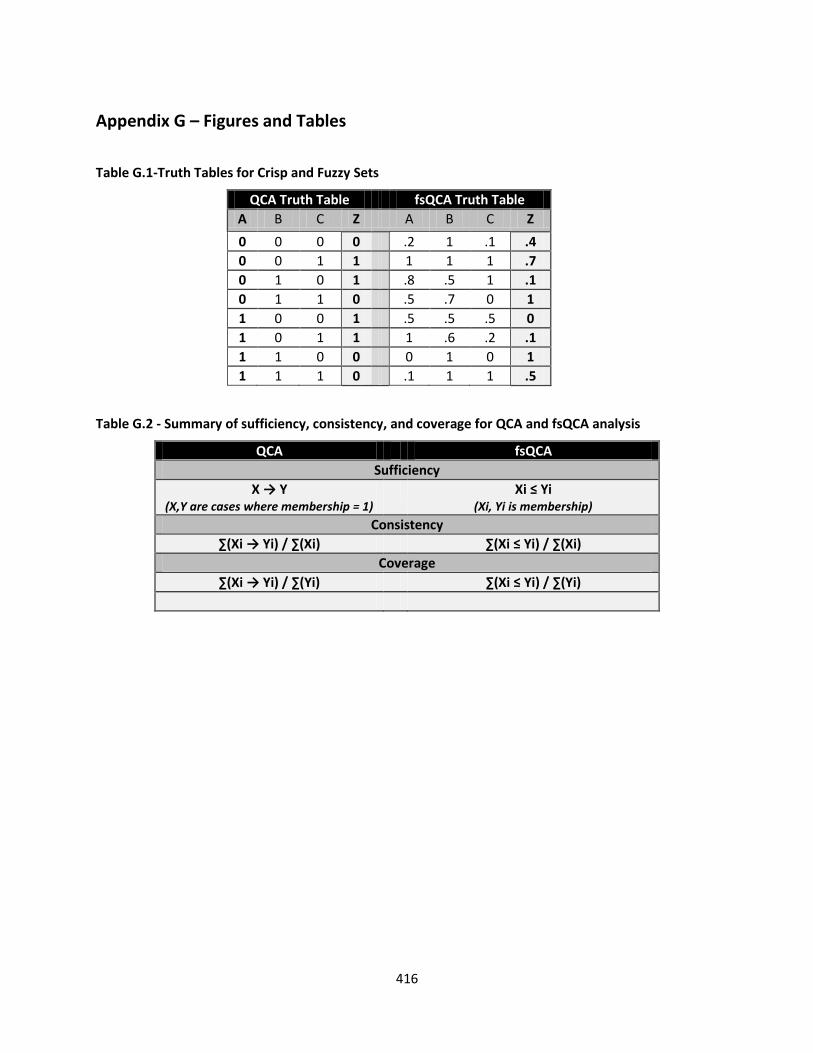
416
Appendix G – Figures and Tables
Table G.1-Truth Tables for Crisp and Fuzzy Sets
QCA Truth Table fsQCA Truth Table
A B C Z A B C Z
0 0 0 0 .2 1 .1 .4
0 0 1 1 1 1 1 .7
0 1 0 1 .8 .5 1 .1
0 1 1 0 .5 .7 0 1
1 0 0 1 .5 .5 .5 0
1 0 1 1 1 .6 .2 .1
1 1 0 0 0 1 0 1
1 1 1 0 .1 1 1 .5
Table G.2 - Summary of sufficiency, consistency, and coverage for QCA and fsQCA analysis
QCA fsQCA
Sufficiency
X → Y (X,Y are cases where membership = 1)
Xi ≤ Yi (Xi, Yi is membership)
Consistency
∑(Xi → Yi) / ∑(Xi) ∑(Xi ≤ Yi) / ∑(Xi)
Coverage
∑(Xi → Yi) / ∑(Yi) ∑(Xi ≤ Yi) / ∑(Yi)
417
Appendix G – References
Kent, R. (2008). Using fsQCA: A Brief Guide and Workshop for Fuzzy-Set Qualitative Comparative Analysis. Department of Marketing, University of Sterling, 2008-2010.
Ragin, C. C. (2006). Set relations in social research: Evaluating their consistency and coverage. Political Analysis, 14(3), 291-310.
Ragin, C. C. (2007). Fuzzy sets: calibration versus measurement. Methodology volume of Oxford handbooks of political science.
Ragin, C. C. (2009). Qualitative comparative analysis using fuzzy sets (fsQCA). Configurational Comparative Methods. Qualitative Comparative Analysis (QCA) and Related Techniques. Los Angeles: Sage, 87-121.
Ragin, C. C., & Giesel, H. M. (2008). User’s guide to fuzzy-set/qualitative comparative analysis. University of Arizona, 87.
Schneider, C. Q., & Grofman, B. (2006). It might look like a regression equation… but it’s not! An intuitive approach to the presentation of QCA and fs/QCA results’. Paper presented at the Conference on “Comparative Politics: Empirical Applications of Methodological Innovations”, Sophia University, Tokyo (Japan).
Schneider, C. Q., & Wagemann, C. (2010). Standards of good practice in qualitative comparative analysis (QCA) and fuzzy-sets. Comparative Sociology, 9(3), 397-418.
418
References
A Accenture. (2005). Driving high performance in government: maximizing the value of public-
sector shared service. Minneapolis, MN: Accenture. Acevedo, M. (2007). Network Capital: An expression of social capital in the network society. The
Journal Of Community Informatics, 3(2). Retrieved at: http://www.ci-
journal.net/index.php/ciej/article/view/267/317. Ackoff, R. L. (1971). Towards a system of systems concepts. Management Science, 17(11), 661-
671. Adler-Milstein, J., Landefeld, J., & Jha, A. K. (2010). Characteristics associated with regional
health information organization viability. Journal of the American Medical Informatics Association, 17(1), 61-65.
Allen, P. M., & Varga, L. (2006). A co-evolutionary complex systems perspective on information systems. Journal of Information Technology, 21(4), 229-238.
Alter, S., & Wright, R. (2010). Validating work system principles for use in systems analysis and design. Paper presented at the ICIS 2010. St. Louis, MO.
Anderson, D. F., & Dawes, S. S. (1991). Government Information Management: A Primer and Casebook. Englewood Cliffs, New Jersey: Prentice Hall.
Anderson, P. (1999). Complexity Theory and Organization Science. Organization Science, 10(3), 216-232.
Arthur, W. B. (1996). Increasing returns and the new world of business. Harvard Business Review, 74(4), 100-109.
B Bailey, K. D. (1994). Typologies and Taxonomies: An Introduction to Classification Techniques
(Series No. 07-102). Thousand Oaks, Ca: Sage Publications, Inc. Bardach, E. (2001). Developmental dynamics: interagency collaboration as an emergent
phenomenon. Journal of Public Administration Research & Theory, 11(2), 149-164. Barrett, S., & Konsynski, B. (1982). Inter-organization information sharing systems. MIS
Quarterly, 6(4), 93-105. Basolo, V. (2003). US regionalism and rationality. Urban Studies, 40(3), 447-462. Benbasat, I., & Zmud, R. W. (2003). The identity crisis within the IS discipline: Defining and
communicating the discipline's core properties. MIS Quarterly, 27(2) 183-194. Benbya, H., & McKelvey, B. (2006). Toward a complexity theory of information systems
development. Information Technology & People, 19(1), 12-34. Benbya, H., & McKelvey, B. (2006). Using co-evolutionary and complexity theories to improve is
alignment: a multi-level approach. Journal of Information Technology, 21(4), 284. Bergeron, B. (2003). Essentials of Shared Services. Hoboken, New Jersey: John Wiley & Sons,
Inc. Bloch, M., Blumberg, S., & Laartz, J. (2012). Delivering large- scale it projects on time, on
budget, and on value. McKinsey Quarterly. Retrieved at https://www.mckinseyquarterly.com/PDFDownload.aspx?ar=3026
Boisot, M., & Child, J. (1999). Organizations as adaptive systems in complex environments: the case of china. Organization Science, 10(3), 237-252.
419
Boisot, M., & McKelvey, B. (2010). Integrating modernist and postmodernist perspectives on organizations: a complexity science bridge. Academy of Management Review, 35(3), 415-433.
Borman, M. (2010). The formation of shared services partnerships in local government to manage resource dependencies. Paper presented at the AMCIS 2010. Lima, Peru.
Borman, M., & Ulbrich, F. (2011). Managing dependencies in inter-organizational collaboration: the case of shared services for application hosting collaboration in Australia. Paper presented at the 44th Hawaii International Conference on System Sciences (HICSS). Kauai, HI.
Boyne, G. A. (2003). Sources of public service improvement: A critical review and research agenda. Journal of Public Administration Research and Theory, 13(3), 367-394.
Burns, T. R., & Flam, H. (1987). The Shaping of Social Organization: Social Rule System Theory with Applications. London: Sage Publications, Inc.
Burns, T., & Stalker, G. M. (1961). The management of innovation. University of Illinois at Urbana-Champaign's Academy for Entrepreneurial Leadership Historical Research Reference in Entrepreneurship. Retrieved at SSRN: http://ssrn.com/abstract=1496187
Byrne, D. S. (1998). Complexity Theory and the Social Sciences: An Introduction. London: Routledge.
Byrne, D. S. (2005). Complexity, configurations and cases. Theory, Culture & Society, 22(5), 95-111.
C Callon, M. (1991). Techno-economic networks and irreversibility. In J. Law (Ed.), A Sociology of
Monsters. Essays on Power, Technology and Domination (pp. 132-161). London: Routledge.
Carlsen, S., & Gjersvik, R. (1997). Organizational metaphors as lenses for analyzing workflow technology. Paper presented at the ACM SigGroup GROUP'97 Conference. Phoenix, Az.
Casdagli, M., Eubank, S., Farmer, J. D., & Gibson, J. (1991). State space reconstruction in the presence of noise. Physica D: Nonlinear Phenomena, 51(1), 52-98.
Cash, J., James I., & Konsynski, B. R. (1985). IS redraws competitive boundaries. Harvard Business Review, 63(2), 134-142.
Casti, J. (1997). Would-be Worlds: How Simulation is Changing the Frontiers of Science. New York: John Wiley & Sons Inc.
Casti, J. L. (1994). Complexification: Explaining a Paradoxical World Through the Science of Surprise. New York: HarperCollins Publishers
Charmaz, K. (2006). Constructing Grounded Theory: A Practical Guide Through Qualitative Analysis. New York: Sage Publications Ltd.
Chorafas, D. N. (1994). Chaos Theory in the Financial Markets: Applying Fractals, Fuzzy logic, Genetic Algorithms, Swarm Simulation & the Monte Carlo Method to Manage Market Chaos & Volatility. Chicago: McGraw-Hill.
Churchman, C. W. (1967). Guest Editorial: Wicked Problems. Management Science, 14(4), B141-B142.
Comfort, L. K., & Kapucu, N. (2006). Inter-organizational coordination in extreme events: The World Trade Center attacks, September 11, 2001. Natural Hazards, 39(2), 309-327.
Conboy, K. (2010). Project failure en masse: a study of loose budgetary control in ISD projects. European Journal of Information Systems, 19(3), 273-287.
420
Courtney, J., Merali, Y., Paradice, D., & Wynn, E. (2008). On the study of complexity in Information Systems. International Journal of Information Technologies and Systems Approach, 1(1), 37-48.
Crawford, C. (2010). Emerging technology trends that will transform courts. In C. R. Flango, A. M. McDowell, C. F. Campbell & N. B. Kauder (Eds.), Future Trends in State Courts 2010 (pp. 19 - 22). Williamsburg, VA: National Center for State Courts.
Cresswell, K., Worth, A., & Sheikh, A. (2010). Actor-Network Theory and its role in understanding the implementation of information technology developments in healthcare. BMC Medical Informatics and Decision Making, 10(1), 67-78.
Crutchfield, J. P., Farmer, J. D., Packard, N. H., & Shaw, R. S. (1986). Chaos. Scientific American, 255(6), 46-57.
D Davidson, E. (1997). Examining project history narratives: an analytic approach. In A. Lee, J.
Liebenau & J. I. DeGross (Eds.), Information Systems and Qualitative Research (pp. 123-148). London: Chapman & Hall, Ltd.
Dawes, S. S. (2008). The evolution and continuing challenges of e-governance. Public Administration Review, 68(s1), S86-S102.
Dawes, S. S., Pardo, T. A., & Cresswell, A. M. (2004). Designing electronic government information access programs: a holistic approach. Government Information Quarterly, 21(1), 3-23.
Dawes, S. S., & Eglene, O. (2004). New models of collaboration for delivering government services: a dynamic model drawn from multi-national research. Paper presented at the Proceedings of the 2004 annual national conference on Digital government research. Seattle, WA.
Dawes, S. S., Cresswell, A. M., & Pardo, T. A. (2009). From “need to know” to “need to share”: Tangled problems, information boundaries, and the building of public sector knowledge networks. Public Administration Review, 69(3), 392-402.
Desai, A. (2005). Adaptive Complex Enterprise. Communications of the ACM, 48(5), 32-35. DeSanctis, G., & Poole, M. S. (1994). Capturing the Complexity in Advanced Technology Use:
Adaptive Structuration Theory. Organization Science, 5(2), 121-147. Dey, A. K. (2001). Understanding and using context. Personal and Ubiquitous Computing, 5(1), 4-
7. Dhillon, G., & Fabian, F. (2005). A fractal perspective on competencies necessary for managing
information systems. International Journal of Technology Management, 31(1), 129-139. Dhillon, G., & Ward, J. (2002). Chaos Theory as a framework for studying information systems.
Information Resources Management Journal (IRMJ), 15(2), 1-13. Dreier, P., Mollenkopf, J., & Swanstrom, T. (2001). Place Matters: Metropolitics for the Twenty-
first Century (Studies in Government & Public Policy): Lawrence: University Press of Kansas.
E Everitt, B. S., & Dunn, G. (1983). Advanced Methods of Data Exploration and Modeling (Vol.
253): London: Heinemann Educational Books.
421
F Fedorowicz, J., Gogan, J. L., & Williams, C. B. (2007). A collaborative network for first
responders: Lessons from the CapWIN case. Government Information Quarterly, 24(4), 785-807.
Fedorowicz, J., Gogan, J., & Williams, C. (2006). The challenge of interagency integration: lessons learned in five e-government cases. IBM Center for the Business of Government Monograph, Washington, DC.
Fedorowicz, J., Markus, M. L., Sawyer, S., Tyworth, M., & Williams, C. B. (2006). Design principles for public safety response mobilization. Paper presented at the Proceedings of the 2006 international conference on Digital government research. San Diego, CA.
Feiock, R. C. (2004). Metropolitan governance: Conflict, Competition, And Cooperation: Washington, D.C.: Georgetown University Press.
Feiock, R. C. (2007). Rational Choice and Regional Governance. Journal of Urban Affairs, 29(1), 47-63.
Feld, C. S., & Stoddard, D. B. (2004). Getting IT right. Harvard Business Review, 82(2), 72-81. Fiss, P. C. (2007). A set-theoretic approach to organizational configurations. The Academy of
Management Review, 32(4), 1180-1198. Fountain, J. E. (2001). Building the Virtual State: Information Technology and Institutional
Change: Washington, D.C.: Brookings Institute Press. Fromhold-Eisebith, M., & Eisebith, G. (2005). How to institutionalize innovative clusters?
Comparing explicit top-down and implicit bottom-up approaches. Research Policy, 34, 1250-1268.
G Galliers, R. D. (2003). Change as crisis or growth? Toward a trans-disciplinary view of
information systems as a field of study: A response to Benbasat and Zmud's call for returning to the IT artifact. Journal of the Association for Information Systems, 4(1), 13.
Galup, S., Quan, J. J., Dattero, R., & Conger, S. (2007). Information technology service management: an emerging area for academic research and pedagogical development. Paper presented at the Proceedings of the 2007 ACM SIGMIS CPR conference on Computer personnel research: The global information technology workforce. St. Louis, MO.
Gantman, S. (2011). IT outsourcing in the public sector: a literature analysis. Journal of Global Information Technology Management, 14(2), 48.
Gasson, S. (1999). A social action model of situated information systems design. ACM SIGMIS Database, 30(2), 82-97.
Gell-Mann, M. (1994). Complex adaptive systems. In G. A. Cowan, D. Pines & D. Metzger (Eds.), Complexity: Metaphors, Models and Reality (pp. 17-29). Reading, Ma.: Addison Wesley.
Gell-Mann, M. (1995). What is complexity. Complexity, 1(1), 16-19. Gentner, A., & Sego, E. (2011). IJIS Success Story: Winnebago County, IL. Paper presented at
the National Association of Justice Information Systems, New Orleans, Louisiana. George, A. L., & Bennett, A. (2005). Case Studies and Theory Development in the Social
Sciences: Cambridge, Ma.:The MIT Press. Gerring, J. (2007). Case Study Research: Principles and Practices. New York, NY: Cambridge
Univeristy Press.
422
Giddens, A. (1984). The Constitution of Society: Outline of the Theory Of Structuration: Berkeley and Los Angeles: Univiversity of California Press.
Gidea, M., & Niculescu, C. P. (2002). Chaotic Dynamical Systems: An Introduction: Craiova: Universitaria Press.
Gil-Garcia, J. R., & Martinez-Moyano, I. J. (2007). Understanding the evolution of e-government: The influence of systems of rules on public sector dynamics. Government Information Quarterly, 24(2), 266-290.
Gil-García, J. R., & Pardo, T. A. (2005). E-government success factors: Mapping practical tools to theoretical foundations. Government Information Quarterly, 22(2), 187-216.
Gil-Garcia, J. R., Soon Ae, C., & Janssen, M. (2009). Government information sharing and integration: Combining the social and the technical. Information Polity, 14(1/2), 1-10.
Glass, R. L. (2006). The Standish report: does it really describe a software crisis? Communications of the ACM, 49(8), 15-16.
Glick, W. H., Huber, G. P., Miller, C. C., Doty, D. H., & Sutcliffe, K. M. (1990). Studying changes in organizational design and effectiveness: retrospective event histories and periodic assessments. Organization Science, 1(3), 293-312.
Glieck, J. (1987). Chaos: Making a New Science: New York: Viking Press. Grant, G., McKnight, S., Uruthirapathy, A., & Brown, A. (2007). Designing governance for shared
services organizations in the public service. Government Information Quarterly, 24(3), 522-538.
Greenwood, R., & Hinings, C. R. (1996). Understanding Radical Organizational Change: Bringing together the Old and the New Institutionalism. The Academy of Management Review, 21(4), 1022-1054.
H Hamilton, D. K. (2000). Organizing government structure and governance functions in
metropolitan areas in response to growth and change: a critical overview. Journal of Urban Affairs, 22(1), 65-84.
Haynes, P. (2008). Complexity Theory and evaluation in public Management. Public Management Review, 10(3), 401-419.
Heath, H., & Cowley, S. (2004). Developing a grounded theory approach: a comparison of Glaser and Strauss. International Journal of Nursing Studies, 41(2), 141-150.
Hefferen, W., McDonald, A., Casbeer, A., & Wallsten, D. (2003). Mandated intersectoral, interdisciplinary collaboration. In P. Hibbert (Ed.), Co-creating Emergent Insight (pp. 221 - 227). Glasgow: Graduate School of Business, University of Strathclyde.
Holland, J. (1992). Complex Adaptive Systems. Daedalus, 121(1), 17-30. Holland, J. (2006). Studying Complex Adaptive Systems. Journal of Systems Science and
Complexity, 19(1), 1-8.
I Isett, K. R., Mergel, I. A., LeRoux, K., Mischen, P. A., & Rethemeyer, R. K. (2011). Networks in
public administration scholarship: Understanding where we are and where we need to go. Journal of Public Administration Research and Theory, 21(suppl 1), i157-i173.
J Jacucci, E., Hanseth, O., & Lyytinen, K. (2006). Taking complexity seriously in IS research.
Information Technology & People, 19(1), 5-11.
423
Janssen, M., & Joha, A. (2006). Motives for establishing shared service centers in public administrations. International Journal of Information Management, 26(2), 102-115.
Janssen, M., & Kuk, G. (2006). A Complex Adaptive System Perspective of Enterprise Architecture in Electronic Government. Paper presented at the 39th Annual Hawaii International Conference on System Sciences (HICSS), Kauai, HI .
Janssen, M., & Wagenaar, R. (2003). Developing Generic Shared Services for e-Government. Electronic Journal of e-Government, 2(1), 31-38.
Janssen, M., & Wagenaar, R. (2004). An analysis of a shared services centre in e-government. Paper presented at the 37th Hawaii International Conference on System Sciences (HICSS), Big Island, HI.
Jones, R., & Noble, G. (2007). Grounded theory and management research: a lack of integrity? Qualitative Research in Organizations and Management: An International Journal, 2(2), 84-103.
K Katz, B. (2000). Reflections on Regionalism: Editor's Overview: Washington, D.C., Brookings
Institute Press. Kauffman, S. (1993). The Orgins of Order. New York: Oxford University Press. Kauffman, S. A., & Johnsen, S. (1991). Coevolution to the edge of chaos: Coupled fitness
landscapes, poised states, and coevolutionary avalanches. Journal of Theoretical Biology, 149(4), 467-505.
Kearney, A. T. (2005). Shared Services in Government: Turning Private-Sector Lessons into Public-Sector Best Practices. Chicago, IL: AT Kearney, Inc.
Kellert, S. H. (1992). A Philosophical Evaluation of the Chaos Theory "Revolution". Proceedings of the Biennial Meeting of the Philosophy of Science Association, 1992, 33-49.
Kellert, S. H. (1993). In The Wake Of Chaos: Unpredictable Order in Dynamical Systems: Chicago: University of Chicago press.
Kellert, S. H. (2008). Borrowed Knowledge: Chaos Theory and the Challenge Of Learning Across Disciplines: Chicago: University of Chicago Press.
Kendall, J. (1999). Axial coding and the grounded theory controversy. Western Journal of Nursing Research, 21(6), 743-757.
Kent, R. (2008). Using fsQCA: A Brief Guide and Workshop for Fuzzy-Set Qualitative Comparative Analysis. Department of Marketing, University of Sterling, 2008-2010.
Kim, R. M., & Kaplan, S. M. (2006). Interpreting socio-technical co-evolution: Applying complex adaptive systems to IS engagement. Information Technology & People, 19(1), 35.
Klein, K. J., & Kozlowski, S. W. J. (2000). Multilevel Theory, Research, and Methods in Organizations: Foundations, Extensions, and New Directions. San Francisco, CA: Jossey-Bass.
Kling, R., & Lamb, R. (1999). IT and organizational change in digital economies: a socio-technical approach. ACM SIGCAS Computers and Society, 29(3), 17-25.
Kock, N., & Nosek, J. (2005). Expanding the boundaries of e-collaboration. IEEE Transactions on Professional Communication, 48(1), 1-9.
Koppenjan, J. F. M., & Klijn, E. H. (2004). Managing Uncertainties in Networks: A Network Approach to Problem Solving and Decision Making: London: Routledge.
Kovács, A. I., & Ueno, H. (2004). Towards complex adaptive information systems. Paper presented at the 2nd International Conference on Information Technology for Application (ICITA 2004), Harbin, China.
424
L Lamb, R., Sawyer, S., & Kling, R. (2000). A Social Informatics Perspective on Socio-Technical
Networks. Paper presented at AMCIS 2000, Long Beach, CA. Langley, A. (1999). Strategies for theorizing from process data. Academy of Management
Review, 24(4), 691-710. Langton, C. G. (1990). Computation at the edge of chaos: Phase transitions and emergent
computation. Physica D: Nonlinear Phenomena, 42(1-3), 12-37. Lansing, J. S. (2003). Complex adaptive systems. Annual Review of Anthropology (2003), 183-
204. Lee, W., Aggarwal, P., Shin, H., Cha, T., & Kim, S. (2006). A Typology of Interorganizational
Relationships: A Marriage, a Fling, or Something in Between. International Journal of E-Business Research, 2(2), 1-21.
Lim, W.-K., Sia, S. K., & Yeow, A. (2011). Managing risks in a failing IT project: a social constructionist view. Journal of the Association for Information Systems, 12(6), 414-440.
Linden, R. M. (2002). Working Across Boundaries: Making Collaboration Work in Government and Nonprofit Organizations: San Francisco, CA.: Jossey-Bass Inc Publications.
Lissack, M. R. (1999). Complexity: the science, its vocabulary and its relation to organizations. Emergence, 1(1), 110.
Lorenz, E. (1963). Deterministic nonperiodic flow. Journal of the Atmospheric Sciences, 20(2), 130-141.
Lowery, D. (2000). A transactions costs model of metropolitan governance: Allocation versus redistribution in urban America. Journal of Public Administration Research and Theory, 10(1), 49.
Luhmann, N. (1986). The autopoiesis of social systems. Sociocybernetic Paradoxes, 6(2), 172-192.
Lyytinen, K., & Damsgaard, J. (2011). Inter-organizational information systems adoption–a configuration analysis approach. European Journal of Information Systems, 20(5), 496-509.
Lyytinen, K., & King, J. L. (2004). Nothing at the Center? Journal of the Association for Information Systems, 5(6), 220-246.
Lyytinen, K., & Newman, M. (2008). Explaining information systems change: a punctuated socio-technical change model. European Journal of Information Systems, 17(6), 589-613.
Lyytinen, K., & Robey, D. (1999). Learning failure in information systems development. Information Systems Journal, 9(2), 85-101.
M Maguire, S., & McKelvey, B. (1999). Complexity and management: Moving from fad to firm
foundations. Emergence, 1(2), 19-61. Mandelbrot, B. B. (1983). The Fractal Geometry of Nature: New York: W.H. Freeman. March, J. G. (1991). Exploration and exploitation in organizational learning. Organization
Science, 71-87. Mark, B. (2010). Characteristics of a successful shared services centre in the Australian public
sector. Transforming Government: People, Process and Policy, 4(3), 220. Markus, M. (1999). Thinking the Unthinkable: What happens if the IS field as we know it goes
away? In Currie, W.L. & R. Galliers (eds.), Rethinking MIS (pp. 175-203): Oxford: Oxford University Press.
425
Markus, M. L. (2005). Technology-Shaping Effects of E-Collaboration Technologies. International Journal of e-Collaboration, 1(1), 1-23.
Markus, M. L., & Keil, M. (1994). If we build it, they will come: Designing information systems that people want to use. Sloan Management Review, 35, 11-11.
Markus, M. L., & Robey, D. (1988). Information technology and organizational change: causal structure in theory and research. Management Science, 583-598.
Markus, M. L., & Tanis, C. (2000). The enterprise systems experience-from adoption to success. In Zmud, R.W., (ed.), Framing the Domains of IT Research: Glimpsing the Future Through the Past (173-207). Cincinnati, OH: Pinnaflex Press.
Markus, M. L. (2005). Technological shaping effects of e-collaboration technologies: Bugs and features. International Journal of E-Collaboration, 1(1), 1-23.
Markus, M. L., & Bui, Q. N. (2011). Governing Public Sector Interorganizational Network Infrastructures-The Importance of Formal and Legal Arrangements. Paper presented at the Proceedings of the 44th Hawaii International Conference on System Sciences (HICCS), Kauai, HI.
Martin, R., & Sunley, P. (2003). Deconstructing clusters: chaotic concept or policy panacea? Journal of Economic Geography, 3(1), 5.
Matavire, R., & Brown, I. (2008). Investigating the use of Grounded Theory in information systems research. Paper presented at the 2008 annual research conference of the South African Institute of Computer Scientists and Information Technologists on IT research in developing countries, Wilderness, South Africa.
Maturana, H. R., & Varela, F. J. (1980). Autopoiesis and Cognition: The Realization of the Living (Vol. 42): Hingham Ma.:, Springer.
McBride, N. (2005). Chaos theory as a model for interpreting information systems in organizations. Information Systems Journal, 15(3), 233-254.
McKelvey, B. (1999). Complexity theory in organization science: Seizing the promise or becoming a fad. Emergence, 1(1), 5-32.
McKelvey, B. (2001). Energising order-creating networks of distributed intelligence: improving the corporate brain. International Journal of Innovation Management, 5, 181-212.
McLean, C., & Hassard, J. (2004). Symmetrical absence/symmetrical absurdity: critical notes on the production of actor network accounts. Journal of Management Studies, 41(3), 493-519.
McLeoad, L., & Doolin, B. (2012). Information systems development as situated socio-technical change: a process approach. European Journal of Information Systems, 21(2), 176-191.
Meek, J. W. (2010). Complexity Theory for Public Administration and Policy. Emergence: Complexity & Organization, 12(1), 1-3.
Meek, J., & Lyu, H. (2010). bridging jurisdictions: conservancies working across borders as adaptive systems. Emergence : Complexity and Organization, 12(1), 39.
Merali, Y. (2004). Complexity and Information Systems. Social Theory and Philosophy of Information Systems (pp. 407-446): Sussex, UK: John Wiley & Sons Ltd.
Merali, Y. (2006). Complexity and Information Systems: the emergent domain. Journal of Information Technology, 21(4), 216.
Merali, Y., & Allen, P. (2011). Complexity and System Thinking. In P. Allen, S. Maguire & B. McKelvey (Eds.), The Sage Handbook of Complexity and Management (pp. 31-52). London, UK: Sage Publishing.
Merali, Y., & McKelvey, B. (2006). Using Complexity Science to effect a paradigm shift in Information Systems for the 21st century. Journal of Information Technology, 21(4), 211.
426
Miller, D. (1986). Configurations of strategy and structure: Towards a synthesis. Strategic Management Journal, 7(3), 233-249.
Milne, M. J., & Adler, R. W. (1999). Exploring the reliability of social and environmental disclosures content analysis. Accounting, Auditing & Accountability Journal, 12(2), 237-256.
Mingers, J., & White, L. (2010). A review of the recent contribution of systems thinking to operational research and management science. European Journal of Operational Research, 207(3), 1147-1161.
Mintzberg, H. (1978). Patterns in strategy formation. Management Science, 934-948. Miskon, S., Bandara, W., Field, E., & Gable, G. (2009). Understanding Shared Services: An
Exploration of the IS Literature. Paper presented at the 20th Australasian Conference on Information Systems, Melbourne, Australia.
Mitleton-Kelly, E. (1998). Organisations as complex evolving systems. Paper presented at the OACES Conference, Warwick, UK.
Mitleton-Kelly, E. (2003). Ten principles of complexity and enabling infrastructures. Complex systems and evolutionary perspectives on organisations: The application of complexity theory to organizations (pp. 23–50): Bingley, UK: Emerald House Publishing.
Mitleton-Kelly, E. (2004). Co-evolutionary integration: a complexity perspective on mergers & acquisitions. Paper presented at the 20th EGOS Colloquium, Ljubljana University, Slovenia
Mitleton-Kelly, E., & Land, F. (2004). Complexity & Information Systems. In G. B. Davis (Ed.), Blackwell Encyclopedia of Management: Management Information Systems (Vol. 7, pp. 16). Malden, Mass.: Blackwell Publishers, Ltd.
Mohr, L. B. (1982). Explaining Organizational Behavior: San Francisco: Jossey-Bass Publishers. Morçöl, G. (2010). Issues in reconceptualizing public policy from the perspective of Complexity
Theory. Emergence : Complexity and Organization, 12(1), 52. Morçöl, G. (2011). Complexity Theory & The Micro–Macro Problem. Paper presented at the
ASPA Conference. Rutgers University, Newark, NJ Morin, E. (2008). On Complexity: Cresskill, NJ: Hampton Press. Moynihan, D. P., Provan, K. G., & Lemaire, R. H. (2012). Core concepts and key ideas for
understanding public sector organizational networks: using research to inform scholarship and practice. Public Administration Review, 72(5), 638-648.
Munkvold, B. E. (2005). Experiences from global e-collaboration: contextual influences on technology adoption and use. IEEE Transactions on Professional Communication, 48(1), 78-86.
Myers, M. D. (2008). Qualitative Research in Business & Management: London: Sage Publications Ltd.
Myers, M. D., & Newman, M. (2007). The qualitative interview in IS research: Examining the craft. Information and Organization, 17(1), 2-26.
N Nan, N. (2011). Capturing bottom-up information technology use processes: a complex adaptive
systems model. MIS Quarterly, 35(2), 505-A507. Ney, B., & McGarry, P. (2006). Getting It Right: Collaborative Problem Solving for Criminal
Justice. Silver Spring, Maryland: U.S. Department of Justice, The Center for Effective Public Policy.
Niehaves, B., & Krause, A. (2010). Shared service strategies in local government - a multiple case study exploration. Transforming Government: People, Process and Policy, 4(3), 266-279.

427
O Orlikowski, W. J. (1992). The duality of technology: Rethinking the concept of technology in
organizations. Organization Science, 398-427. Orlikowski, W. J., & Lacono, C. S. (2001). Research commentary: Desperately seeking the 'IT' in
IT research--A call to theorizing the IT artifact. Information Systems Research, 12(2), 121.
Osborne, D. (1993). Reinventing government. Public Productivity & Management Review, 16(4), 349-356.
Ostrom, B., & Hanson, R. (2010). Achieving High Performance: A Framework for Courts. Williamsburg, Virginia: The National Center for State Courts.
Ouchi, W. G. (1979). A conceptual framework for the design of organizational control mechanisms. Management Science, 25(9), 833-848.
P Page, S. E. (2009). Understanding Complexity. Chantilly, Va.: The Teaching Company. Pardo, T. A., & Scholl, H. J. J. (2002). Walking atop the cliffs: Avoiding failure and reducing risk
in large scale e-government projects. Paper presented at the 35th Annual Hawaii International Conference on Systems Sciences (HICCS), Big Island, HI.
Pardo, T. A., Cresswell, A. M., Dawes, S. S., & Burke, G. B. (2004). Modeling the social & technical processes of interorganizational information integration. Paper presented at the 37th Hawaii International Conference on System Sciences (HICSS), Big Island, HI.
Pardo, T. A., Gil-Garcia, J. R., & Burke, G. B. (2008). Sustainable Cross-Boundary Information Sharing Digital Government In H. Chen, L. Brandt, V. Gregg, R. Traunmüller, S. Dawes, E. Hovy, A. Macintosh, & C. A. Larson (Eds.), Digital government: Advanced research and case studies, and Implementation. New York: Springer. (pp.421-438)
Pentland, B. T. (1999). Building process theory with narrative: From description to explanation. Academy of Management Review, 711-724.
Peters, B. G. (1998). Managing Horizontal Government: The Politics of Co Ordination. Public Administration, 76(2), 295-311.
Pettigrew, A. M. (1990). Longitudinal field research on change: theory and practice. Organization Science, 267-292.
Plowman, D. A., Baker, L. T., Beck, T. E., Kulkarni, M., Solansky, S. T., & Travis, D. V. (2007). Radical change accidentally: The emergence and amplification of small change. The Academy of Management Journal, 50(3), 515-543.
Poeppelbuss, J., Niehaves, B., Simons, A., & Becker, J. (2011). Maturity Models in Information Systems Research: Literature Search and Analysis. Communications of the Association for Information Systems, 29(1), 27.
Popp, J., MacKean, G., Casebeer, A., Milward, H., & Lindstrom, R. (2013). Inter-organizational networks: A critical review of the literature to Inform practice. Retrieved at http://www.iph.ucalgary.ca/system/files/Network+lit+review+Feb.+27-+Final.pdf.
Prigogine, I., Stengers, I., & Toffler, A. (1984). Order Out of Chaos: Man's New Dialogue with Nature. Toronto-New York-London-Sydney: Bantam Books.
Provan, K. G., & Kenis, P. (2007). Modes of Network Governance: Structure, Management, and Effectiveness. Journal of Public Administration Research and Theory, 18(2), 229-252
Provan, K. G., & Milward, H. B. (2001). Do networks really work? A framework for evaluating public-sector organizational networks. Public Administration Review, 61(4), 414.
PSN (2010). Survey Coding Sheet, The Public Safety Networks Project.
428
R Ragin, C. C. (2000). Fuzzy-Set Social Science: Chicago: University of Chicago Press. Ragin, C. C. (2007). Fuzzy sets: calibration versus measurement. In J. M. Box-Steffensmeier, H. E.
Brady & D. Collier (Eds.), The Oxford Handbook of Political Methodology (pp. 174-198). Oxford: The Oxford University Press
Ragin, C. C. (2009). Qualitative comparative analysis using fuzzy sets (fsQCA). In B. Rihoux & C. C. Ragin (Eds.), Configurational Comparative Methods: Qualitative Comparative Analysis
(QCA) and Related Techniques (pp. 87-121). Thousand Oaks, CA.: Sage Publications. Ragin, C. C., & Giesel, H. M. (2008). User’s guide to fuzzy-set/qualitative comparative analysis.
Retrieved at http://www.u.arizona.edu/~cragin/fsQCA/download/fsQCAManual.pdf. Raths, D. (2012). Shared and regional services are on the rise public CIO. Retrieved at
http://www.govtech.com/pcio/Shared-and-Regional-Services-Are-on-the-Rise.html?elq=3b43a6f513664c39b4e8a46d465a52e6
Reimers, K., Johnston, R., & Klein, S. (2008). A theorizing evolution of inter-organizational information systems on long timescales. Proceedings of JAIS Theory Development Workshop . Sprouts: Working Papers on Information Systems,, 8(31). Retrieved at http://sprouts.aisnet.org/8-31.
Rhodes, M. L. (2008). Complexity and emergence in public management. Public Management Review, 10(3), 361-379.
Rhodes, M. L., & MacKechnie, G. (2003). Understanding Public Service Systems: Is There a Role for Complex Adaptive Systems Theory? In M. R. Lissack (Ed.), Emergence (Vol. 5, pp. 57- 85). Mahwah, New Jersey: Lawrence Erlbaum Associates, Inc.
Rhodes, M. L., Murphy, J., Muir, J., & Murray, J. A. (2011). Public Management and Complexity Theory: Richer Decision-Making in Public Service. New York, New York: Routledge.
Rihoux, B., Joly, J., & Dandoy, R. (2008). The Key Determinants of Community Conflict Escalation and De-escalation in Europe: A Systematic Comparative Analysis (QCA). PEACE-COM D8 Report: Peace Processes in Community Conflicts. Retrieved at http://www.uclouvain.be/cps/ucl/doc/spri/documents/Deliverable_8_PEACE-COM.pdf.
Ritchey, T. (2008). Wicked problems. Retrieved at www.swemorph.com Robey, D., Im, G., & Wareham, J. D. (2008). Theoretical foundations of empirical research on
interorganizational systems: assessing past contributions and guiding future directions. Journal of the Association for Information Systems, 9(9), 4.
Robey, D., Im, G., & Wareham, J. D. (2008). Theoretical foundations of empirical research on interorganizational systems: assessing past contributions and guiding future directions. Journal of the Association for Information Systems, 9(9), 4.
Rocheleau, B., & Wu, L. (2002). Public versus private information systems. The American Review of Public Administration, 32(4), 379-397.
Rodriguez, C., Langley, A., Beland, F., & Denis, J.-L. (2007). Governance, Power, and Mandated Collaboration in an Interorganizational Network. Administration & Society, 39(2), 150-193.
Rogers, E. M. (2003). Diffusion of Innovations (5th Edition). New York: The Free Press, A Division of Simon and Schuster.
Rogers, E. M., Medina, U. E., Rivera, M. A., & Wiley, C. J. (2005). Complex adaptive systems and the diffusion of innovations. The Innovation Journal: The Public Sector Innovation Journal, 10(3), 1-26.
Romanelli, E., & Tushman, M. L. (1994). Organizational transformation as punctuated equilibrium: An empirical test. Academy of Management Journal, 37(5), 1141-1166.
429
Romano, N., Jr., Pick, J., & Roztocki, N. (2007). Editorial introduction to the special issue on collaboration issues in cross-organizational cross-border IS/IT. Journal of Information Technology Theory and Application, 8(4), iii.
Romano, N., Jr., Pick, J., & Roztocki, N. (2010). A motivational model for technology-supported cross-organizational and cross-border collaboration. European Journal of Information Systems, 19(2), 117.
Rose, J., & Scheepers, R. (2001). Structuration Theory and Information System Development--Frameworks for Practice. Paper presented at the 9th European Conference on Information Systems. Bled, Slovenia.
S Samoilenko, S. (2008). Information systems fitness and risk in IS development: Insights and
implications from chaos and complex systems theories. Information Systems Frontiers, 10(3), 281-292.
Sasso, B. (2013). House to hold hearing on public safety network. Hilicon Valley: THE HILL's Technology Blog. Retrieved at http://thehill.com/blogs/hillicon-valley/technology/286205-house-to-hold-hearing-on-public-safety-network
Sawyer, R. K. (2001). Emergence in Sociology: Contemporary Philosophy of Mind and Some Implications for Sociological Theory. American Journal of Sociology, 107(3), 551-585.
Sawyer, S., Allen, J., & Lee, H. (2003). Broadband and mobile opportunities: a socio‐technical perspective. Journal of Information Technology, 18(2), 121-136.
Sawyer, S., Fedorowicz, J., Tyworth, M., Markus, M. L., & Williams, C. B. (2007). A taxonomy for public safety networks. Paper presented at the 8th Annual International Conference on Digital Government Research: Bridging Disciplines & Domains. Philadelphia, PA.
Sawyer, S., Schrier, R., Fedorowicz, J., Dias, M., Williams, C., & Tyworth, M. (2012). Architectural patterns of US public safety networks: a fuzzy set qualitative comparison analysis. Paper presented at the 13th Annual International Conference on Digital Government Research. College Park, MD.
Schmitt, R. (2005). Systematic metaphor analysis as a method of qualitative research. The Qualitative Report, 10(2), 358-394.
Schneider, C. Q., & Grofman, B. (2006). It might look like a regression equation… but it’s not! An intuitive approach to the presentation of QCA and fs/QCA results. Paper presented at the Conference on “Comparative Politics: Empirical Applications of Methodological Innovations”, Sophia University, Tokyo (Japan).
Schneider, C. Q., & Wagemann, C. (2010). Standards of good practice in qualitative comparative analysis (QCA) and fuzzy-sets. Comparative Sociology, 9(3), 397-418.
Schulman, D. S., Jr., J. R. D., Harmer, M. J., & Lusk, J. S. (1999). Shared Services: Adding Value to the Business Units. New York: Wiley.
Scott, W. R., & Davis, G. F. (2003). Organizations and Organizing: Rational, Natural, and Open System Perspectives. Saddle River, New Jersey: Prentice Hall.
Sebutinde, J. (2003). Court case management and other procedural reforms. Paper presented at The Distance Learning Programme for Anglophone Africa, Retrieved at http://info.worldbank.org/etools/docs/library/108523/sebutinde_paper.pdf.
Seltzer, E. (2004). Working Across Boundaries: A Framework for Regional Collaboration. Land Lines, 16(3), 5-8
Silver, M. S., Markus, M. L., & Beath, C. M. (1995). The information technology interaction model: a foundation for the MBA core course. MIS Quarterly, 19(3), 361-390.
430
Simon, H. A. (1959). Theories of decision-making in economics and behavioral science. The American Economic Review, 49(3), 253-283.
Simon, H. A. (1978). Rationality as process and as product of thought. The American Economic Review, 68(2), 1-16.
Skaaning, S.-E. (2011). Assessing the robustness of crisp-set and fuzzy-set QCA results. Sociological Methods & Research, 40(2), 391-408.
Smithson, M., & Verkuilen, J. (2006). Fuzzy Set Theory: Applications in the Social Sciences: Thousand Oaks, CA.:Sage Publications, Inc.
Steelman, D. (2009). CaseFlow Management Trends. Courts Today, 7, 24-26. Steelman, D. C., & Hall, D. J. (2012). Criminal Case Management and Jail Overcrowding in
Winnebago County, Illinois. Williamsburg, Virginia: The National Center For State Courts.
Suchman, L. A. (1987). Plans and Situated Actions: The Problem of Human-Machine Communication. Cambridge: Cambridge University Press.
Swanson, B. E. (1994). Information Systems innovation among organizations. Management Science, 40(9), 1069-1092.
T Tan, J., Wen, H. J., & Awad, N. (2005). Health care and services delivery systems as complex
adaptive systems. Communications of the ACM, 48(5), 36-44. Tanriverdi, H., Rai, A., & Venkatraman, N. (2010). Reframing the dominant quests of
information systems strategy research for complex adaptive business Systems. Information Systems Research, 21(4), 822.
Taylor, F. W. (1995). The Principles of Scientific Management. In J. M. Shafritz & J. S. Ott. (Eds.), Classics of Organization Theory, 4th Edition. Fort Worth, TX: Harcourt Brace.
Teisman, G. R., & Klijn, E.-H. (2008). Complexity theory and public management. Public Management Review, 10(3), 287-297.
Thurmaier, K., & Wood, C. (2002). Interlocal Agreements As An Alternative to Consolidation. In J. Carr & R. C. Feiock (Eds.), Perspectives on City County Consolidation and its Alternatives. Armonk, NY: M.E. Sharpe.
Tomasino, A. (2011). Public safety networks as a type of complex adaptive system. Paper presented at the International Conference on Complex Systems. Quincy, MA.
Tomasino, A. (2011). Shared services organizations in the public sector: the case of public safety networks. Paper presented at the America's Conference on Information Systems. Lima, Peru
Tsoukas, H. (1998). Introduction: chaos, complexity and organization theory. Organization, 5(3), 291.
Tsoukas, H., & Dooley, K. J. (2011). Introduction to the special issue: towards the ecological style: embracing complexity in organizational research. Organization Studies, 32(6), 729-735.
U Ulbrich, F. (2010). Adopting shared services in a public-sector organization. Transforming
Government: People, Process and Policy, 4(3), 249-265. Ulrich, D. (1995). Shared services: from vogue to value. Human Resource Planning, 18(3), 12-24. Uzzi, B. (1997). Social structure and competition in interfirm networks: The paradox of
embeddedness. Administrative Science Quarterly, 42(1).
431
V Van de Walle, S., & Vogelaar, M. (2010). Emergence and public administration. A literature
review for the project “A New Synthesis in Public Administration”. Erasmus University Rotterdam.
von Wurtemberg, L. M., Franke, U., Lagerstrom, R., Ericsson, E., & Lillieskold, J. (2011). IT project success factors: An experience report. Paper presented at the Technology Management In The Energy-Smart World (PICMET), Portland, Oregon.
W Wagner, E. L., Newell, S., & Piccoli, G. (2010). Understanding project survival in an ES
environment: a sociomaterial practice perspective. Journal of the Association for Information Systems, 11(5), 276-297.
Waldrop, M. M. (1992). Complexity: The Emerging Science at the Edge of Chaos. New York, New York: Simon and Schuster.
Walsham, G. (1991). Organizational metaphors and information systems research. European Journal of Information Systems, 1(2), 83-94.
Wastell, D., & White, S. (2010). Facts, myths and thought-styles… and a rallying cry for civic engagement. The Journal of Strategic Information Systems, 19(4), 307-318.
Weber, M. (1968). Bureaucracy. In J. M. Shafritz & J. S. Ott (Eds.), Classics of Organization
Theory. Fort Worth, TX.: Harcourt-Brace. Weick, K. E. (1977). Organization design: Organizations as self-designing systems.
Organizational dynamics, 6(2), 30-46. Weick, K. E. (1979). The Social Psychology of Organizing (Vol. 2): Reading, MA.:Addison-
Wesley. Wellman, B. (2001). The persistence and transformation of community: from neighborhood
groups to social networks. Report to the Law Commission of Canada. Retrieved at http://homes.chass.utoronto.ca/~wellman/publications/lawcomm/lawcomm7.PDF.
Williams, C. B., Dias, M., Fedorowicz, J., Jacobson, D., Vilvovsky, S., Sawyer, S., et al. (2009). The formation of inter-organizational information sharing networks in public safety: Cartographic insights on rational choice and institutional explanations. Information Polity, 14(1), 13-29.
Williams, C. B., Fedorowicz, J., & Tomasino, A. P. (2010). Governmental factors associated with state-wide interagency collaboration initiatives. Paper presented at the 11th Annual International Digital Government Research Conference on Public Administration Online: Challenges and Opportunities. Peubla, Mexico.
Williams, C. B., Dias, M., Fedorowicz, J., Jacobson, D., Vilvovsky, S., Sawyer, S., et al. (2009). The formation of inter-organizational information sharing networks in public safety: Cartographic insights on rational choice and institutional explanations. Information Polity: The International Journal of Government & Democracy in the Information Age, 14(1/2), 13-29.
Williams, R., & Edge, D. (1996). The social shaping of technology. Research policy, 25(6), 865-899.
Williamson, D. J. (2011). A Correlational Study Assessing the Relationships among Information Technology Project Complexity, Project Complication, and Project Success. Retrieved at www.pmi-swva.org/images.html?file_id=R1iusy%2FaMzc%3D.
Winnebago County. (2011). Court and Case Management Project Overview/Milestones. Rockford, Illinois: Winnebago County Illinois.
432
X Xia, W., & Lee, G. (2004). Grasping the complexity of IS development projects.
Communications of the ACM, 47(5), 68-74.
Y Yin, R. K. (1981). The case study crisis: Some answers. Administrative Science Quarterly, 26(1),
58-65. Yin, R. K. (2009). Case Study Research: Design and methods (Vol. 5). Thousand Oaks, CA.: Sage
Publications, Inc.
Z Zarrella, E., Tims, M., Carr, B., & Palk, W. (2005). Global IT project management survey. Sydney,
Australia: KPMG. Zimmerman, J. F. (1970). Metropolitan Reform in the U.S.: An Overview. Public Administration
Review, 30(5), 531.
433
Vita
Arthur P. Tomasino attended Smithtown High School East in Smithtown, New York. He
graduated from the State University of New York at Stony Brook with Bachelor’s of Science in
Electrical Engineering. He worked for over twenty-five years in the Semiconductor Industry in a
number of roles including design engineering, consulting, and executive management. He
founded and ran one for the largest U.S. Design Services Companies in this Industry. He was a
member of the Division of Special Registration (Engineering) at Yale University and earned his
Master’s in Business Administration from Northeastern University in 1995. In September 2009,
he entered the Bentley University Ph.D. Program.
Permanent address: 115 Laconia Circle, North Andover, MA 01845
This manuscript was typed by the author.