Embed Size (px)
Citation preview

CS Investment Funds 1 Investment Company with Variable Capital under
Luxembourg law – R.C.S. Luxembourg B131404
Audited Annual Report
at 31.10.2021

CS Investment Funds 1 • Audited Annual Report as at 31.10.2021
Table of Contents Page 2
Management and Administration 3
Audit Report 5
Combined Report 8
Notes 10
Manager's Report (unaudited) 16
Report by Subfund
Credit Suisse (Lux) Dynamic Bond Fund (until 08.04.2021) 19
Credit Suisse Investment Partners (Lux) Global Convertible Bond Fund (previously Credit Suisse (Lux) AgaNola Global Convertible Bond Fund) 22
Credit Suisse (Lux) Financial Bond Fund 30
Credit Suisse (Lux) Credit Special Situation Fund 39
Credit Suisse (Lux) SQ Euro Corporate Bond Fund 45
Credit Suisse (Lux) European Sovereign Plus Bond Fund 51
Credit Suisse (Lux) Global High Yield Bond Fund 55
Credit Suisse (Lux) Global Inflation Linked Bond Fund 64
Credit Suisse (Lux) Floating Rate Credit Fund 73
Credit Suisse (Lux) Global Value Bond Fund (previously Credit Suisse (Lux) AgaNola Global Value Bond Fund) 84
Credit Suisse (Lux) High Yield USD Bond Fund 91
Credit Suisse (Lux) SQ US Corporate Bond Fund 96
Credit Suisse (Lux) Latin America Corporate Bond Fund 103
Credit Suisse Investment Partners (Lux) Convert International Bond Fund (since 11.03.2021) 109
Credit Suisse (Lux) Emerging Market Corporate Short Duration Bond Fund (since 15.09.2021) 116
Unaudited information 121

CS Investment Funds 1 • Audited Annual Report as at 31.10.2021
Management and Administration Page 3
Company
CS Investment Funds 1 5, rue Jean Monnet, L-2180 Luxembourg R.C.S. Luxembourg B 131404
Board of Directors of the Company
Dominique Délèze Director, Credit Suisse Asset Management (Switzerland) Ltd., Zurich Nina Egelhof (until 14.09.2021) Director, Credit Suisse Fund Management S.A., Luxembourg Freddy Brausch (until 09.03.2021) Independent Director, Luxembourg Guy Reiter Director, Credit Suisse Asset Management (Switzerland) AG, Zurich Fernand Schaus (until 14.01.2021) Director, Credit Suisse Fund Management S.A., Luxembourg Mario Koster (since 15.01.2021 until 10.03.2021) Independent Director, Luxembourg Eduard von Kymmel (since 15.09.2021) Independent Director, Luxembourg
Auditor of the Company
PricewaterhouseCoopers, Société coopérative 2, rue Gerhard Mercator, L-2182 Luxembourg
Management Company
Credit Suisse Fund Management S.A. 5, rue Jean Monnet, L-2180 Luxembourg R.C.S. Luxembourg B 72925
Board of Directors of the Management Company
Josef H.M. Hehenkamp Managing Director, Credit Suisse Asset Management (Switzerland) Ltd., Zurich Rudolf Kömen (until 14.09.2021) Director, Credit Suisse Fund Management S.A., Luxembourg Thomas Nummer Independent Director, Luxembourg Daniel Siepmann Managing Director, Credit Suisse Fund Services (Luxembourg) S.A., Luxembourg Luc De Vet (since 14.04.2021) Independent Director, Luxembourg
Auditor of the Management Company
PricewaterhouseCoopers, Société cooperative 2, rue Gerhard Mercator, L-2182 Luxembourg
Depositary Bank
Credit Suisse (Luxembourg) S.A. 5, rue Jean Monnet, L-2180 Luxembourg
Central Administration
Credit Suisse Fund Services (Luxembourg) S.A. 5, rue Jean Monnet, L-2180 Luxembourg
Investment Manager
Credit Suisse Asset Management (Switzerland) Ltd. Kalandergasse 4, CH-8045 Zurich
- Credit Suisse (Lux) Credit Special Situation Fund - Credit Suisse (Lux) Dynamic Bond Fund (until 08.04.2021) - Credit Suisse (Lux) Emerging Market Corporate Short Duration Bond Fund (since 15.09.2021) - Credit Suisse (Lux) European Sovereign Plus Bond Fund - Credit Suisse (Lux) Financial Bond Fund - Credit Suisse (Lux) Floating Rate Credit Fund - Credit Suisse (Lux) Global Inflation Linked Bond Fund - Credit Suisse (Lux) Latin America Corporate Bond Fund - Credit Suisse (Lux) SQ Euro Corporate Bond Fund - Credit Suisse (Lux) SQ US Corporate Bond Fund
Credit Suisse Investment Partners (Schweiz) AG ("CSIP")
- Credit Suisse (Lux) Global Value Bond Fund (previously Credit Suisse (Lux) AgaNola Global Value Bond Fund)
- Credit Suisse Investment Partners (Lux) Convert International Bond Fund (since 11.03.2021)
- Credit Suisse Investment Partners (Lux) Global Convertible Bond Fund (previously Credit Suisse (Lux) AgaNola Global Convertible Bond Fund)
Credit Suisse Asset Management LLC 11 Madison Avenue, New York, NY 10010, USA
- Credit Suisse (Lux) High Yield USD Bond Fund Credit Suisse Asset Management LLC One Madison Avenue, New York, NY 10010, USA and Credit Suisse Asset Management Limited One Cabot Square, London E1440J (Co-Investment Manager)
- Credit Suisse (Lux) Global High Yield Bond Fund Representative in Switzerland
Credit Suisse Funds AG Uetlibergstrasse 231, Postfach, CH-8070 Zurich
Paying Agent in Switzerland
Credit Suisse (Switzerland) Ltd. Paradeplatz, 8, CH-8001 Zurich
Distribution Agent
Credit Suisse Fund Management S.A. 5, rue Jean Monnet, L-2180 Luxembourg
Representatives and Paying Agents outside
Luxembourg and Switzerland
The full list of Representatives and Paying Agents outside Luxembourg and Switzerland can be obtained, free of charge, at the registered office of the Management Company.

CS Investment Funds 1 • Audited Annual Report as at 31.10.2021
Management and Administration Page 4
No subscription may be accepted on the basis of the financial reports. Subscriptions are accepted only on the basis of the current prospectus accompanied by the Key Investor Information Documents, the latest annual report and the latest semi-annual report. The issue and redemption prices will be published in Luxembourg at the registered office of the SICAV. The net asset value will also be published daily on the Internet at www.credit-suisse.com and may be published in different newspapers. Shareholders may obtain the prospectus, the Key Investor Information Documents, the latest annual and semi-annual reports, the changes in the composition of the securities portfolio during the reporting year and copies of the Articles of Association free of charge from the registered office of the Company or the local representatives in the countries where the SICAV is registered.

Audit report
To the Shareholders ofCS Investment Funds 1
Our opinion
In our opinion, the accompanying financial statements give a true and fair view of the financial positionof CS Investment Funds 1 (the “Fund”) and of each of its sub—funds as at 31 October 2021, and of theresults of their operations and changes in their net assets for the year then ended in accordance withLuxembourg legal and regulatory requirements relating to the preparation and presentation of thefinancial statements.
What we have audited
The Fund's financial statements comprise:
o the Combined Statements of Net Assets for the Fund and Statement of Net Assets for each of thesub—funds as at 31 October 2021;
o the Combined Statements of Operations / Changes in Net Assets for the Fund and the Statement ofOperations / Changes in Net Assets for each of the sub-funds for the year then ended;the Statement of Investments in Securities for each of the sub—funds as at 31 October 2021; andthe notes to the financial statements, which include a summary of significant accounting policies.
Basis for opinion
We conducted our audit in accordance with the Law of 23 July 2016 on the audit profession (Law of23 July 2016) and with International Standards on Auditing (|SAs) as adopted for Luxembourg by the“Commission de Surveillance du Secteur Financier” (CSSF). Our responsibilities under the Law of23 July 2016 and |SAs as adopted for Luxembourg by the CSSF are further described in the“Responsibilities of the “Réviseur d’entreprises agree” for the audit of the financial statements” sectionof our report.
We believe that the audit evidence we have obtained is sufficient and appropriate to provide a basis forour opinion.
We are independent of the Fund in accordance with the International Code of Ethics for ProfessionalAccountants, including International Independence Standards, issued by the International EthicsStandards Board for Accountants (IESBA Code) as adopted for Luxembourg by the CSSF together withthe ethical requirements that are relevant to our audit of the financial statements. We have fulfilled ourother ethical responsibilities under those ethical requirements.
Other information
The Board of Directors of the Fund is responsible for the other information. The other informationcomprises the information stated in the annual report but does not include the financial statements andour audit report thereon.
Our opinion on the financial statements does not cover the other information and we do not express anyform of assurance conclusion thereon.
Pricewaterh0useC00pers, Société coopératiue, 2 rue Gerhard Mercator, B.P. 1443, L—1014 LuxembourgT: +352 494848 1, F: +352 494848 2900, www.pwc.lu
Cabinet de révision agréé. Expert-comptable (autorisation gouvernementale n°1oo28256)R.C.S. Luxembourg B 65 477 — TVA LU25482518

In connection with our audit of the financial statements, our responsibility is to read the other informationidentified above and, in doing so, consider whether the other information is materially inconsistent withthe financial statements or our knowledge obtained in the audit, or otherwise appears to be materiallymisstated. If, based on the work we have performed, we conclude that there is a material misstatementof this other information, we are required to report that fact. We have nothing to report in this regard.
Responsibilities of the Board of Directors of the Fund for the financial statements
The Board of Directors ofthe Fund is responsible for the preparation and fair presentation of the financialstatements in accordance with Luxembourg legal and regulatory requirements relating to the preparationand presentation of the financial statements, and for such internal control as the Board of Directors ofthe Fund determines is necessary to enable the preparation of financial statements that are free frommaterial misstatement, whether due to fraud or error.
In preparing the financial statements, the Board of Directors of the Fund is responsible for assessingthe Fund’s and each of its sub-funds’ ability to continue as a going concern, disclosing, as applicable,matters related to going concern and using the going concern basis of accounting unless the Board ofDirectors of the Fund either intends to liquidate the Fund or close any of its sub-funds or to ceaseoperations, or has no realistic alternative but to do so.
Responsibilities of the “Réviseur d’entreprises agréé” for the audit of the financial statements
The objectives of our audit are to obtain reasonable assurance about whether the financial statementsas a whole are free from material misstatement, whether due to fraud or error, and to issue an auditreport that includes our opinion. Reasonable assurance is a high level of assurance, but is not aguarantee that an audit conducted in accordance with the Law of 23 July 2016 and with lSAs as adoptedfor Luxembourg by the CSSF will always detect a material misstatement when it exists. Misstatementscan arise from fraud or error and are considered material if, individually or in the aggregate, they couldreasonably be expected to influence the economic decisions of users taken on the basis of thesefinancial statements.
As part of an audit in accordance with the Law of 23 July 2016 and with |SAs as adopted for Luxembourgby the CSSF, we exercise professional judgment and maintain professional scepticism throughout theaudit. We also:
0 identify and assess the risks of material misstatement of the financial statements, whether due tofraud or error, design and perform audit procedures responsive to those risks, and obtain auditevidence that is sufficient and appropriate to provide a basis for our opinion. The risk of not detectinga material misstatement resulting from fraud is higher than for one resulting from error, as fraud mayinvolve collusion, forgery, intentional omissions, misrepresentations, or the override of internalcontrol;
0 obtain an understanding of internal control relevant to the audit in order to design audit proceduresthat are appropriate in the circumstances, but not for the purpose of expressing an opinion on theeffectiveness of the Fund's internal control;
0 evaluate the appropriateness of accounting policies used and the reasonableness of accountingestimates and related disclosures made by the Board of Directors of the Fund;

o conclude on the appropriateness of the Board of Directors of the Fund’s use of the going concernbasis of accounting and, based on the audit evidence obtained, whether a material uncertainty existsrelated to events or conditions that may cast significant doubt on the Fund's or any of its sub-funds‘ability to continue as a going concern. If we conclude that a material uncertainty exists, we arerequired to draw attention in our audit report to the related disclosures in the financial statements or,if such disclosures are inadequate, to modify our opinion. Our conclusions are based on the auditevidence obtained up to the date of our audit report. However, future events or conditions may causethe Fund or any of its sub-funds to cease to continue as a going concern;
o evaluate the overall presentation, structure and content of the financial statements, including thedisclosures, and whether the financial statements represent the underlying transactions and eventsin a manner that achieves fair presentation.
We communicate with those charged with governance regarding, among other matters, the plannedscope and timing of the audit and significant audit findings, including any significant deficiencies ininternal control that we identify during our audit.
Pricewaterhousecoopers, Société coopérative Luxembourg, 9 February 2022Represented by
Dr. Norbert Briihl

CS Investment Funds 1 • Audited Annual Report as at 31.10.2021
Combined Report Page 8
Statement of Net Assets (in CHF)
The notes are an integral part of the financial statements.
31.10.2021
Assets
Investments in securities at market value 7,224,897,064.57Cash at banks and at brokers 168,132,621.31Subscriptions receivable 892,246.52Income receivable 53,629,188.55
Net unrealised gain on swaps contracts 11,806,896.00Net unrealised gain on forward foreign exchange contracts 28,833,448.33Other assets 11,498.41
7,488,202,963.69
Liabilities
Due to banks and to brokers 23,948,021.73Redemptions payable 133,267.31
Interest payable 5,708.87Provisions for accrued expenses 3,321,575.07Net unrealised loss on financial futures contracts 143,839.18
Net unrealised loss on swaps contracts 107,679.32Net unrealised loss on forward foreign exchange contracts 494,290.26Other liabilities 33,977.02
28,188,358.76
Net assets 7,460,014,604.93

CS Investment Funds 1 • Audited Annual Report as at 31.10.2021
Combined Report Page 9
Statement of Operations / Changes in Net Assets (in CHF)
The notes are an integral part of the financial statements.
For the period from
01.11.2020 to 31.10.2021
Net assets at the beginning the year 5,975,669,086.12
Income
Interest on investments in securities (net) 185,350,629.57
Dividends (net) 2,160,586.32
Bank Interest 5,896.57
Securities lending income 1,695,507.97
Other income 16,931.41
189,229,551.84
Expenses
Management fee 27,222,203.39
Performance fee 2,037,065.62
Depositary fee 3,902,324.35
Administration expenses 3,704,086.58
Printing and publication expenses 174,970.21
Interest and bank charges 422,867.98
Audit, control, legal, representative bank and other expenses 3,759,308.06
"Taxe d'abonnement" 1,240,357.26
42,463,183.45
Net income (loss) 146,766,368.39
Realised gain (loss)
Net realised gain (loss) on sales of investments 165,519,750.69
Net realised gain (loss) on financial futures contracts 421,236.23
Net realised gain (loss) on swaps contracts -10,083,194.17
Net realised gain (loss) on forward foreign exchange contracts -35,484,139.70
Net realised gain (loss) on foreign exchange 6,660,275.12
127,033,928.17
Net realised gain (loss) 273,800,296.56
Change in net unrealised appreciation (depreciation)
Change in net unrealised appreciation (depreciation) on investments 158,341,212.61
Change in net unrealised appreciation (depreciation) on financial futures contracts -408,282.04
Change in net unrealised appreciation (depreciation) on swaps contracts 27,165,733.10
Change in net unrealised appreciation (depreciation) on forward foreign exchange contracts 33,724,881.67
218,823,545.34
Net increase (decrease) in net assets as a result of operations 492,623,841.90
Subscriptions / Redemptions
Subscriptions 3,043,652,184.87
Redemptions -1,994,188,693.54
1,049,463,491.33
Distribution -31,301,993.27
Currency translation adjustment -26,439,821.15
Net assets at the end of the year 7,460,014,604.93

CS Investment Funds 1 • Audited Annual Report as at 31.10.2021
Notes Page 10
General
CS Investment Funds 1 (the "Company") is an undertaking for collective investment in transferable securities in the legal form of an investment company with variable capital (société d’investissement à capital variable, SICAV) subject to Part I of the Law of December 17, 2010, as amended on undertakings for collective investment ("Law of December 17, 2010") transposing Directive 2009/65/EC of the European Parliament and of the Council of July 13, 2009 on the coordination of laws, regulations and administrative provisions relating to undertakings for collective investment in transferable securities. As of 31.10.2021 the Company had 14 Subfunds. Changes: Effective as per 15.02.2021 Credit Suisse (Lux) AgaNola Global Value Bond Fund has been renamed into Credit Suisse (Lux) Global Value Bond Fund. Effective as per 15.02.2021 Credit Suisse (Lux) AgaNola Global Convertible Bond Fund has been renamed into Credit Suisse Investment Partners (Lux) Global Convertible Bond Fund. Credit Suisse Investment Partners (Lux) Convert International Bond Fund was launched on 11.03.2021. As at 09.04.2021, CS Investment Funds 1 - Credit Suisse (Lux) Dynamic Bond Fund (until 08.04.2021) has been merged into CS Investment Funds 6 - Credit Suisse (Lux) Dynamic Bond Fund. Credit Suisse (Lux) Emerging Market Corporate Short Duration Bond Fund was launched on 15.09.2021.
Summary of significant accounting policies
a) Presentation of financial statements The financial statements are presented in accordance with Luxembourg legal and regulatory requirements concerning Undertakings for Collective Investment in Transferable Securities. The financial statements are presented on the basis of the latest net asset value calculated during the financial period (i.e. 31.10.2021). As a result of the merger of the Subfund Credit Suisse (Lux) Dynamic Bond Fund, the financial statements are prepared on a non-going concern basis for this Subfund. b) Computation of the net asset value of each Subfund The net asset value of the Shares of each Subfund shall be calculated in the reference currency of the respective Subfund and shall be determined under the responsibility of the Company’s Board of Directors in Luxembourg on each banking day in Luxembourg (each such day being referred to as a "Valuation Day"). A banking day is defined as being a day on which banks are normally open for business in Luxembourg. The financial statements reflect the net asset values as of 31.10.2021 based on the market prices of the investments as of 31.10.2021. The Investment Manager needs to undertake transactions in order to maintain the desired asset allocation as a result of subscriptions or redemptions, which may generate additional costs for the Subfund and its shareholders. As a consequence, in order to protect the existing investors’ interest, from these capital movements, when net capital movements exceed a threshold pre-defined by the Board of Directors, an adjustment of the NAV per share used is applied. This adjustment reflects the estimated tax and dealing costs that may be incurred by the Subfund as a result of these transactions, and the estimated bid-off spread of the assets in which the fund invests. A periodical review is undertaken in order to verify the appropriateness of the swing factor being applied. For the active Subfunds, the Net Asset Value calculated will be increased by up to a maximum of 2% per Share in the event of a net surplus of subscription applications or reduced by up to a maximum of 2% per Share in the event of a net surplus of redemption applications in respect of the applications received on the respective Valuation Day. The NAV per share as disclosed in the statistical information is the published NAV per share whereas the total net assets disclosed in the statement of net assets is the total net asset value excluding year end swing adjustment.
As per 31.10.2021, no swing pricing was applied on the Subfunds. c) Valuation of investment securities of each Subfund Securities which are listed on a stock exchange shall be valued at the last traded price. If such a price is not available for a particular trading day, the closing bid price may be taken as a basis for the valuation. If a security is traded on several stock exchanges, the valuation shall be made by reference to the exchange on which it is primarily traded. In the case of securities for which trading on a stock exchange is not significant although a secondary market with regulated trading among securities dealers does exist, the valuation may be based on this secondary market. Securities traded on a regulated market shall be valued in the same way as securities listed on a stock exchange. Securities that are not listed on a stock exchange and are not traded on a regulated market shall be valued at their last available market price. If no such price is available, the Company shall value these securities in accordance with other criteria to be established by the Board of Directors and on the basis of the probable sales price, the value of which shall be estimated with due care and in good faith. Shares and units in UCIs shall be valued on the basis of their most recently calculated net asset value, taking due account of the redemption fee where necessary. Where no net asset value and only buy and sell prices are available, the shares or units in such UCIs may be valued at the mean of such buy and sell prices. The amounts resulting from such valuations shall be converted into the reference currency of each Subfund at the prevailing mid-market rate. If a valuation in accordance with the above rules is rendered impossible or incorrect owing to special or changed circumstances, then the Board of Directors of the Company shall be entitled to use other generally recognised and auditable valuation principles in order to value the Subfund’s assets. Because of the inherent uncertainty, these estimated values may significantly differ from the values that would have been used had a readily market for the securities existed, and from the values that may be ultimately recovered. d) Cash at banks and at brokers Cash at banks and at brokers includes cash in hand, margin calls and deposits held at call with banks and bank overdrafts. e) Net realised gain/loss on sales of investments of each Subfund The realised gains or losses on the sales of securities are calculated on the basis of the average acquisition cost. f) Foreign exchange conversion The financial statements are kept in the reference currency of each Subfund and the combined financial statements are kept in CHF. Cash at banks, other net assets and the value of portfolio securities in currencies other than the reference currency of each Subfund are converted into the reference currency at the foreign exchange rate prevailing on the date of valuation. Income and expenses in currencies other than the reference currency of each Subfund are converted into the reference currency at the foreign exchange rate applicable at the date they accrue to the Subfund. Realised gains or losses on foreign currencies are accounted for in the statement of operations / changes in net assets. The acquisition cost of securities in currencies other than the reference currency of each Subfund is converted into the reference currency at the foreign exchange rate valid at the date of acquisition. g) Transactions on investments in securities of each Subfund The transactions on investments in securities are booked on a trade date basis. h) Valuation of financial futures contracts of each Subfund Unmatured financial futures contracts are valued at valuation date at market rates prevailing at this date and resulting changes in unrealised gains or losses are posted to the statement of operations / changes in net assets and are shown under "net unrealised gain/loss on financial futures contracts" in the statement of net assets.

CS Investment Funds 1 • Audited Annual Report as at 31.10.2021
Notes Page 11
i) Valuation of forward foreign exchange contracts of each Subfund Unmatured forward foreign exchange contracts are valued at valuation date at forward exchange rates prevailing at this date and resulting changes in unrealised gains or losses are posted to the statement of operations / changes in net assets and are shown under "net unrealised gain/loss on forward foreign exchange contracts" in the statement of net assets. j) Valuation of swap contracts of each Subfund On each valuation day, swap agreements are valued at the net present value of the future cash flows, using the relevant interest rate yield curve on valuation day. Assets swaps and the securities linked to the assets swaps are not revalued as the security and the asset swap are considered for the purpose of the valuation as a single instrument and unrealised results are posted to the statement of operations / changes in net assets and are shown under "net unrealised gain/loss on swaps contracts" in the statement of net assets. k) Allocation of accrued expenses Accrued expenses which can be allocated directly to a Subfund are charged to this Subfund. Accrued expenses which cannot be allocated directly are divided among the Subfunds in proportion to the net assets of each Subfund. l) Securities Lending The Company can practise lending of securities included in its portfolios of its Subfunds. The Company may only lend securities within a standardized system of securities lending organised by a recognised institution of securities compensation or by first class financial institutions specialised in this type of operations. m) Income recognition Dividends are recorded on ex-dividend date, net of withholding tax. Interests are accrued on a daily basis. n) Valuation of options of each Subfund Unmatured options are valued at valuation date at market rates prevailing at this date and resulting changes in unrealised gains or losses are posted to the statement of operations / changes in net assets.
Management fee
(see detail at Subfund level)
As remuneration for its services and reimbursement of its expenses, the Management Company is entitled to a monthly management fee, payable at the end of each month and calculated on the basis of the average of the daily net asset value of the relevant share class during that month. Class DA, DAH, DB and DBH Shares are not subject to a management fee but only to a management service fee, payable to the Management Company covering all fees and expenses excluding the fees payable to the Depositary Bank, of not more than 0.35% p.a. Class DAP, DAHP, DBP and DBHP Shares are not subject to a management fee but only to a management service fee, payable to the Management Company covering all fees and expenses excluding the fees payable to the Depositary Bank, of not more than 0.35% p.a., and a performance fee, payable to the Management Company.
Performance fee
In addition to the Management fees, the following Subfunds are subject to a fee linked to the performance of the assets that the relevant Investment Manager is managing ("Performance Fee"): Credit Suisse (Lux) Dynamic Bond Fund (until 08.04.2021) Credit Suisse Investment Partners (Lux) Global Convertible Bond Fund (previously Credit Suisse (Lux) AgaNola Global Convertible Bond Fund) Credit Suisse (Lux) Credit Special Situation Fund Credit Suisse (Lux) Global Value Bond Fund (previously Credit Suisse (Lux) AgaNola Global Value Bond Fund) Credit Suisse (Lux) High Yield USD Bond Fund Below the detailed calculation method of the performance fees for Credit Suisse (Lux) Dynamic Bond Fund (until 08.04.2021), Credit Suisse (Lux) Credit Special Situation Fund and Credit Suisse (Lux) Global Value Bond Fund (previously Credit Suisse (Lux) AgaNola Global Value Bond Fund):
The Management Company is entitled to a performance fee which is calculated with every net asset value calculation on the basis of the Net Asset Value of the Share Class concerned.The Performance Fee may only be charged and set aside, if the following two criteria are fulfilled cumulatively: a) The performance of the unswung Net Asset Value of a Share Class, as calculated on a daily basis, must be greater than the performance of the reference value further defined below (“Hurdle-Rate-Index-Value”), which is also calculated on a daily basis. At the time of launch, the Hurdle-Rate- Index-Value is equal to the issue price of the respective Share Class. b) The unswung Net Asset Value of a Share Class, which is used for the calculation of a Performance Fee, must be greater than the previous unswung Net Asset Values (“High Watermark”). Each preceding decline in the unswung Net Asset Value per Share of the respective Share Class must be offset by a further increase above the last maximum value at which a Performance Fee was incurred. The Hurdle-Rate-Index-Value described in a) above is composed of the threemonth Libor interest rate (“3M Libor”), set by ICE Benchmark Administration (the “Benchmark Administrator”), for the respective Reference Currency of the Share Class, calculated on a daily, indexed basis (100 + ( [rLibor] / 4 ( 1 / ( [#days / #day in quarter]) ). The calculation of the Hurdle-Rate-Index-Value begins with the launch of the Subfund and will not be reset. The Libor interest rate, within the Hurdle-Rate-Index-Value, will be reset quarterly to the new Libor rate at the beginning of each calender quarter (on the first valuation day of January, April, July and October). The Benchmark Administrator was authorised under article 34 of the Benchmark Regulation by the United Kingdom’s Financial Conduct Authority on 27 April 2018 and appears on the register of administrators maintained by ESMA pursuant to article 36 of the Benchmark Regulation. Calculation of the Performance Fee and the necessary provisioning takes place on a daily basis. If, on the Calculation Date, the unswung Net Asset Value of a Share Class is above the Hurdle-Rate-Index-Value and is greater than the preceding unswung Net Asset Values (prior to deduction of the Performance Fee), a Performance Fee of 15% shall be deducted on the difference between the unswung Net Asset Value of the Share Class and the greater value between Hurdle-Rate-Index-Value and High Watermark. The calculation of the Performance Fee takes place on the basis of the Shares of the respective Class that are currently in circulation. The payment of the Performance Fee amounts calculated for each quarter and set aside according to the above described method takes place at the beginning of the following quarter. This Performance Fee cannot be refunded if the unswung Net Asset Value falls again after deduction of the Performance Fee. This means that a Performance Fee may also be charged and paid if, at the end of the calander quarter, the unswung Net Asset Value per Share of the respective Class is lower than the value at the beginning of the calender quarter. Credit Suisse (Lux) Dynamic Bond Fund (until 08.04.2021):
Share Class CCY Performance fee rate
Amount of performance fee charged for the
year
% on the Share Class NAV of
performance fee charges for the year
B USD 15% 22,454.38 0.78%
DAP USD 15% 124,243.68 0.85%
DBP USD 15% 311,243.93 0.70%
EB USD 15% 155,184.74 0.72%
IB USD 15% 18,267.73 0.72%
UB USD 15% 22,369.04 0.58%
BH CHF 15% 27,672.31 0.79%
EBH CHF 15% 55,585.49 0.66%
IBH CHF 15% 11,989.14 0.67%
UBH CHF 15% 21,679.23 0.46%
BH EUR 15% 27,828.66 0.64%
CBH EUR 15% 1,755.73 0.82%
EBH EUR 15% 129,766.79 0.66%
IBH EUR 15% 15,238.19 0.82%
UBH EUR 15% 38,660.23 0.64%
The performance fee charged during the year ended amounted to USD 983,939.27.

CS Investment Funds 1 • Audited Annual Report as at 31.10.2021
Notes Page 12
Credit Suisse Investment Partners (Lux) Global Convertible Bond Fund (previously Credit Suisse (Lux) AgaNola Global Convertible Bond Fund): The Management Company is entitled to a performance fee which is calculated with every net asset value calculation on the basis of the unswung Net Asset Value of the Share Class concerned. The performance fee may only be charged and crystallized, if the following conditions are fulfilled cumulatively: a). the unswung Net Asset Value of a Share Class, which is used in the calculation of a performance fee must be greater than the previous Net Asset Values (“high water mark”). Each preceding decline in the unswung Net Asset Value per Share of the respective Share Class must be offset by a further increase above the last maximum value at which a Performance Fee was incurred. b). the performance of the unswung Net Asset Value of a Share Class, as calculated on a daily basis, must exceed a quarterly performance of 1.25% (“hurdle rate”) (the “hurdle NAV”). The hurdle NAV is reset at the beginning of each quarter to start with the last net asset value calculated in the previous quarter which is used as a basis for the calculation of the new hurdle NAV. The performance fee calculation, together with the necessary provisioning and crystallization, takes place with every net asset value calculation. If, on the Calculation Date, the unswung net asset value of a Share Class is above the hurdle NAV and is greater than the high water mark, a performance fee of 20% shall be deducted on the difference between the unswung net asset value of the relevant Share Class and the high water mark and/or the hurdle NAV (whichever is the greater of the two). The performance fee is calculated on the basis of the Shares of the relevant Share Class that are currently in circulation. The payment of the Performance Fee amounts calculated and crystallized according to the above described method takes place at the beginning of the following quarter. This Performance Fee cannot be refunded if the unswung Net Asset Value falls again after deduction of the Performance Fee. This means that a Performance Fee may also be charged and paid if, at the end of the calendar quarter, the unswung Net Asset Value per Share of the respective Class is lower than the value at the beginning of the calendar quarter.
Share Class CCY Performance fee rate
Amount of performance fee charged for the
year
% on the Share Class NAV of
performance fee charges for the year
IBHP CHF 20% 284,732.49 1.39% IBHP EUR 20% 70,861.98 1.44%
The performance fee charged during the year ended amounted to USD 355,594.47. Credit Suisse (Lux) Credit Special Situation Fund:
Share Class CCY Performance fee rate
Amount of performance fee charged for the
year
% on the Share Class NAV of
performance fee charges for the year
IA USD 15% 152,463.90 0.92%
IB USD 15% 179,096.16 0.95%
MA USD 15% 265,303.57 1.04%
QA USD 15% 208,955.35 0.86%
QAH CHF 15% 55,279.09 0.54%
QAH EUR 15% 28,793.37 0.51%
The performance fee charged during the year ended amounted to USD 889,891.44. Credit Suisse (Lux) Global Value Bond Fund (previously Credit Suisse (Lux) AgaNola Global Value Bond Fund): All active share classes are not subject to performance fees. No performance fees have been charged for the Subfund over the reporting period. Credit Suisse (Lux) High Yield USD Bond Fund: The Management Company is entitled to a Performance Fee for the Share Class DBP (“the Share Class”), which is calculated on the basis of the unswung net asset value of the Share Class. The Performance Fee shall be payable for each reference period (“Reference Period”). Unless otherwise agreed between the parties, the initial Reference Period will start with the launch of the Share Class, as the case may be, and ends on the last day of that Accounting Year.
The calculation of the Performance Fee and the necessary provisioning take place with every Net Asset Value calculation. The accrued Performance Fee shall be payable annually in arrears within one month after the end of the respective Reference Period, and, if Shares are redeemed during the Reference Period, the amount of Performance Fee included in the Net Asset Value per Share will be due and owed (i.e. crystallise) for these redeemed Shares at the time of redemption, when the following conditions are fulfilled: (i) the net asset value of the Share Class used in the calculation of a Performance Fee must be greater than the highest NAV (prior to deduction of the Performance Fee) at the end of a performance period where a Performance Fee has been paid (“high water mark”); and (ii) the percentage increase in the net asset value per Share Class over the performance period exceeds the percentage increase on the benchmark relevant to the Share Class over the same performance period. The performance fee calculation, together with the necessary provisioning, takes place with every Net Asset Value calculation, however the Performance Fee is only crystallized at the end of the Reference Period and if Shares are redeemed during the Reference Period. In the event that this amount is negative, the negative amount shall be carried to the next Reference Period. If, on the Calculation Date, the unswung net asset value of the Share Class is above the benchmark and is greater than the preceding high water mark, a Performance Fee of 20% shall be deducted on the difference between the unswung net asset value of the Share Class and the greater value between the benchmark and the high water mark. The Performance Fee is calculated on the basis of the Shares of the Share Class that are currently in circulation. The amount of Performance Fee payable for the relevant Reference Period shall not exceed 0.50% of the average TNAV of the Share Class during that Reference Period. All active share classes are not subject to performance fees. No performance fees have been charged for the Subfund over the reporting period.
"Taxe d'abonnement"
Under the prevailing laws and regulations, the Fund is subject in Luxembourg, on the basis of its investments, to a "taxe d'abonnement" at the annual rate of 0.05%, payable quarterly and calculated on the basis of the net assets of each Subfund at the end of each quarter. In the case of Share Classes that may only be acquired by institutional investors, this annual tax rate is 0.01%. This tax does not apply for those assets of the Fund which are invested in other undertakings for collective investment under Luxembourg law.
Total Expense Ratio (TER)
(see detail at Subfund level)
The TER expresses the sum of all costs and commissions charged on an ongoing basis to the fund’s assets, taken retrospectively as a percentage of the average assets. If a Subfund invests at least 10% of its net assets as a fund of fund in target funds, a composite TER of the fund of funds is to be calculated as follows: The prorated TER of the individual target funds including a performance related remuneration, weighted according to the share they represent in the overall assets of the fund of funds as of the closing date and the TER of the fund of funds minus the retroceded commissions received from the target funds during the reporting period. The TER is calculated following the SFAMA* guideline. No TER is disclosed for share classes launched less than 6 months before closing or closed during the period. * As at 25.09.2020, the SFAMA ("Swiss Funds & Asset Management Association") merged with the AMP ("Asset Management Platform") to become the AMAS ("Asset Management Association Switzerland").
Exchange Rates
The combined financial statements are kept in CHF. For this purpose, the financial statements of the Subfunds are converted into CHF at the foreign exchange rates as of 31.10.2021: 1 EUR = 1.057400 CHF 1 USD = 0.913718 CHF

CS Investment Funds 1 • Audited Annual Report as at 31.10.2021
Notes Page 13
Fund performance
(see detail at Subfund level)
The performance is based on the net asset values as calculated on the last business day of the year Y respectively Y-1. Those net asset values reflect the market prices of the investments as of the last business day of the year Y respectively Y-1. The YTD (Year-To-Date) Performance includes the period from 01.01.2021 until 31.10.2021.
Historical performance is no indicator of current or future performance. The performance data given does not take into account commissions and costs incurred in the purchase or redemption of Subfund shares. For shares launched more than 3 years ago no performance since inception is disclosed. The performances are calculated based on the swung NAV per share.
Cross-Subfund investments
The following investments were not eliminated from the combined figures. As at 31.10.2021, the total combined NAV without these investments would amount to CHF 7,448,931,901.69.
Valuation (in USD)
Credit Suisse (Lux) Global Value Bond Fund (previously Credit Suisse (Lux) AgaNola Global Value Bond Fund) investing into:
Credit Suisse Investment Partners (Lux) Convert International Bond Fund (since 11.03.2021) -DA- USD 12,129,240.00
Transaction costs
Transactions costs include brokerage fees, stamp duty, local taxes and other foreign charges if incurred during the period. Transaction costs are included in the cost of securities purchased and sold. For the year ended on 31.10.2021, the Company incurred transaction costs relating to purchase or sale of investments in securities and similar transactions, (including derivatives instruments or other eligible assets) as follows:
Subfund CCY Amount Credit Suisse (Lux) Dynamic Bond Fund USD 2.54 Credit Suisse Investment Partners (Lux) Global Convertible Bond Fund (previously Credit Suisse (Lux) AgaNola Global Convertible Bond Fund)
USD 13,457.75
Credit Suisse (Lux) Financial Bond Fund EUR 62.44 Credit Suisse (Lux) Credit Special Situation Fund USD 0.00 Credit Suisse (Lux) SQ Euro Corporate Bond Fund EUR 130.36 Credit Suisse (Lux) European Sovereign Plus Bond Fund
EUR 0.00
Credit Suisse (Lux) Global High Yield Bond Fund USD 7.19 Credit Suisse (Lux) Global Inflation Linked Bond Fund
USD 0.00
Credit Suisse (Lux) Floating Rate Credit Fund USD 0.00 Credit Suisse (Lux) Global Value Bond Fund (previously Credit Suisse (Lux) AgaNola Global Value Bond Fund)
USD 283.80
Credit Suisse (Lux) High Yield USD Bond Fund USD 30.05 Credit Suisse (Lux) SQ US Corporate Bond Fund USD 3,249.54 Credit Suisse (Lux) Latin America Corporate Bond Fund
USD 860.05
Credit Suisse Investment Partners (Lux) Convert International Bond Fund (since 11.03.2021)
USD 967.92
Credit Suisse (Lux) Emerging Market Corporate Short Duration Bond Fund (since 15.09.2021) USD 0.00
Not all transaction costs are separately identifiable. For fixed income investments, forward foreign exchange contracts and for some other derivative contracts, transaction costs will be included in the purchase and sales price of the investment. Whilst not separately identifiable these transaction costs will be captured within the performance of each Subfund.
Securities lending
The Subfunds participated in the securities lending system with Credit Suisse (Switzerland) Ltd., Zurich (the "principal") as of 31.10.2021 as follows:
Subfund
CCY
Stock lending
market value
Collateral
market value
Credit Suisse Investment Partners (Lux) Global Convertible Bond Fund (previously Credit Suisse (Lux) AgaNola Global Convertible Bond Fund) USD 273,509,699.00 268,702,390.00 Credit Suisse (Lux) Financial Bond Fund EUR 153,557,824.00 161,447,461.00 Credit Suisse (Lux) Credit Special Situation Fund USD 60,981,066.00 58,296,236.46 Credit Suisse (Lux) SQ Euro Corporate Bond Fund EUR 57,466,527.00 60,419,096.00 Credit Suisse (Lux) European Sovereign Plus Bond Fund EUR 1,120,643.00 1,178,220.44 Credit Suisse (Lux) Global High Yield Bond Fund USD 65,875,591.00 66,322,998.36 Credit Suisse (Lux) Global Inflation Linked Bond Fund USD 51,098,841.00 58,031,595.98 Credit Suisse (Lux) Floating Rate Credit Fund USD 78,711,240.00 71,542,500.72 Credit Suisse (Lux) Global Value Bond Fund (previously Credit Suisse (Lux) AgaNola Global Value Bond Fund) USD 16,363,708.00 21,109,493.62 Credit Suisse (Lux) High Yield USD Bond Fund USD 366,039.00 183,066.10 Credit Suisse (Lux) SQ US Corporate Bond Fund USD 40,305,909.00 31,847,954.00 Credit Suisse (Lux) Latin America Corporate Bond Fund USD 99,319,789.00 88,713,144.00 Credit Suisse Investment Partners (Lux) Convert International Bond Fund (since 11.03.2021) USD 14,250,126.00 9,618,367.00 Credit Suisse (Lux) Emerging Market Corporate Short Duration Bond Fund (since 15.09.2021) USD 0.00 0.00
The collateral delivered by the securities lending counterparty to the Company is composed of a well-diversified portfolio of securities consisting of - highly rated bonds issued or guaranteed by governments, government agencies, bodies regulated by public law or corporations (excluding Credit Suisse affiliates) from selected OECD countries. - highly rated bonds from supranational organisations - equities listed on selected stock exchanges within the OECD on the condition that the shares are included in a main and liquid index. The determination of the market value of the collateral is subject to the application of appropriate haircuts adapted to the volatility of the collateral type. The revenues mentioned in the statement of operations / changes in net assets under "Security Lending Income" are the net amounts received from the lending principal. Any direct and indirect operational costs and fees are borne by the principal out of its fee and include the liability risk assumed by the principal.

CS Investment Funds 1 • Audited Annual Report as at 31.10.2021
Notes Page 14
For the year ended on 31.10.2021, the fees paid to the principal and the Subfunds amounted to as follows:
Subfund CCY
Gross amount
securities
lending
Expenses and
commissions
from the
securities
lending
counterparty Net Amount
Credit Suisse (Lux) Dynamic BondFund USD 5,876.78 2,350.71 3,526.07 Credit Suisse Investment Partners (Lux) Global Convertible Bond Fund (previously Credit Suisse (Lux) AgaNola Global Convertible Bond Fund) USD 799,467.97 319,787.19 479,680.78 Credit Suisse (Lux) Financial Bond Fund EUR 466,241.80 186,496.72 279,745.08 Credit Suisse (Lux) Credit Special Situation Fund USD 349,823.37 139,929.35 209,894.02 Credit Suisse (Lux) SQ Euro Corporate Bond Fund EUR 122,470.27 48,988.11 73,482.16 Credit Suisse (Lux) European Sovereign Plus Bond Fund EUR 2,437.33 974.93 1,462.40 Credit Suisse (Lux) Global High Yield Bond Fund USD 319,278.90 127,711.56 191,567.34 Credit Suisse (Lux) Global Inflation Linked Bond Fund USD 185,630.03 74,252.01 111,378.02 Credit Suisse (Lux) Floating Rate Credit Fund USD 204,742.87 81,897.15 122,845.72 Credit Suisse (Lux) Global Value Bond Fund (previously Credit Suisse (Lux) AgaNola Global Value Bond Fund) USD 110,088.12 44,035.25 66,052.87 Credit Suisse (Lux) High Yield USD Bond Fund USD 2,154.53 861.81 1,292.72 Credit Suisse (Lux) SQ US Corporate Bond Fund USD 70,631.28 28,252.51 42,378.77 Credit Suisse (Lux) Latin America Corporate Bond Fund USD 348,944.10 139,577.64 209,366.46 Credit Suisse Investment Partners (Lux) Convert International Bond Fund (since 11.03.2021) USD 11,944.97 4,777.99 7,166.98 Credit Suisse (Lux) Emerging Market Corporate Short Duration Bond Fund(since 15.09.2021) USD - - -
Risk Management
For all Subfunds the global exposure is calculated on the basis of the commitment approach, except for CS Investment Funds 1 - Credit Suisse (Lux) Dynamic Bond Fund (until 08.04.2021), the global exposure is calculated under the VaR approach.
Financial Derivative Instruments
The Subfunds may engage in derivative transactions for the purpose of efficient portfolio management. Details of the derivatives are displayed in the Notes pages. Depending on the type of derivatives held, collateral might be received from the different counterparts to reduce the counterparty exposure. For other type of derivatives, margin accounts might be used. As at 31.10.2021, in order to reduce the counterparty risk, the following Subfund received the following assets as collateral from the following counterparty for an amount of: Subfund Type Counterparty Amount Credit Suisse (Lux) Global High Yield Bond Fund
Cash Morgan Stanley Capital Group (New York)
USD 6,010,000
Credit Suisse (Lux) Global Inflation Linked Bond Fund Cash BNP Paribas USD 1,680,000
Credit Suisse (Lux) Global Inflation Linked Bond Fund Cash
Citigroup Global Markets Limited USD 1,620,000
Credit Suisse (Lux) Global Inflation Linked Bond Fund Cash
Credit Suisse International USD 360,000
Credit Suisse (Lux) Global Value Bond Fund (previously Credit Suisse (Lux) AgaNola Global Value Bond Fund) Cash
Credit Suisse (Switzerland) Ltd USD 240,000
Changes in the composition of the security portfolio
Changes in the composition of the security portfolio during the reporting period are available to Shareholders free of charge at the registered office of the Company or the local representatives in the countries where the Company is registered.
Coronavirus Covid-19
Since the end of 2019 we have seen the development of the coronavirus COVID-19 outbreak globally. The Board of Directors and the Investment Manager continue to watch the efforts of governments to contain the spread of the virus and monitor the economic impact, if any, on the investments in our portfolio.
Brexit
According to the rules on disclosure to investors in Directive 2009/65/EC, UCITS management companies must take a number of steps to inform investors of the consequences of the withdrawal (BREXIT) of the United Kingdom from the European Union (EU) and the end of the transition period as of 31st December 2020. In particular, according to Article 72 and 78 of Directive 2009/65/EC, UCITS management companies must keep up to date the essential elements of prospectus and a key investor information document. This includes information on Member States in which the management company is authorised, where the UCITS is managed or marketed cross-border. Moreover, UCITS management companies must assess whether the change of the legal status of the investment fund would impact on compliance with the investment strategy of the fund as communicated earlier to investors.
The overall impact by BREXIT is quite limited, as Credit Suisse Fund Management S.A. remains domiciled in Luxembourg and authorized by the CSSF. Also, there is no material impact on compliance with the investment strategy of the fund as communicated earlier to investors. The CS Investment Funds 1 remains a UCITS Fund and the delegation of the portfolio management as well as the appointed Depositary did not change. The sub-funds which have been registered within the UK for distribution in the past, have been notified accordingly under the Temporary Permissions Regime (TPR) to the UK Regulator Financial Conduct Authority FCA. As a consequence thereof the CS Investment Funds 1 and any notified sub-fund continue to be eligible for marketing to the public in the United Kingdom during the TPR which is set to last for up to three years. Should the management company decide to not register any of the sub-funds before the end of the TPR under the respective newly applicable national law of the United Kingdom, such TPR registration will end automatically without any notice of de-registration to the FCA. Where the investment guidelines determined the geographical scope by using the designations Europe, the European Union (EU) or the European Economic Area (EEA), amendments have been made to the investment guidelines to the effect that the geographical scope remains as is, i.e. investments in the UK will continue to be allowed in principle and for the investor nothing changes in this respect even though some instruments may qualify as OTC under EU Law rather than as exchange traded derivatives (ETD) under UK Law. The target investments have been investigated according to their instrument/asset type as to whether they might no longer be eligible investments after BREXIT and, where necessary, they have been divested, if any at all. Where necessary for ongoing compliance with EU and national laws, the tradeflow has been readjusted to meet new requirements. In order to adhere e.g. to the Derivatives Trade Obligation under MIFIR (DTO) for certain derivatives categories, UK Multilateral Trading Facilities (MTFs) were replaced by MTFs domiciled in the European Union.

CS Investment Funds 1 • Audited Annual Report as at 31.10.2021
Notes Page 15
In anticipation of the end of the time-limited equivalence decision regarding UK Central Clearing Counterparties (CCPs), which is valid for a period of 18 months from 1 January 2021 to 30 June 2022, preparation measures have been started back in October 2020 in order to shift clearing activities away from UK CCPs to CCPs authorized or recognized by the EU. For the investor in the CS Investment Funds 1, its exposure to geographical markets and instrument types as well as the availability of fund shares/units in its jurisdiction has not changed after the end of the BREXIT transition period.
Subsequent events
No significant event occurred after the year end.

CS Investment Funds 1 • Audited Annual Report as at 31.10.2021
Manager's Report (unaudited) Page 16
The information stated relates to the period under review and is not indicative of future returns.
Credit Suisse (Lux) Dynamic Bond Fund (until 08.04.2021)
As at 09.04.2021, CS Investment Funds 1 - Credit Suisse (Lux) Dynamic Bond Fund has been merged into CS Investment Funds 6 - Credit Suisse (Lux) Dynamic Bond Fund.
Credit Suisse Investment Partners (Lux) Global Convertible Bond Fund
(previously Credit Suisse (Lux) AgaNola Global Convertible Bond Fund)
Risky assets started buoyant into the reporting period. Technology and so called stay-at-home stocks continued to be sought after against a backdrop of a worsening Covid-19 pandemic, which forced many countries into another lockdown. Meanwhile central banks remained supportive keeping rates at historic lows. The situation changed around March/April 2021 with the arrival of the warmer season in the northern hemisphere and the rollout of the Covid-19 vaccine. The outlook for the pandemic improved thereafter and economies started to re-open. On the other hand, more and more supply-side shortages disrupted the global flow of goods causing inflationary pressure. In the period under review the Credit Suisse Investment Partners (Lux) Global Convertible Bond Fund generated a solid absolute return of 12.53% (net of all costs, in USD Hedged) outperforming its benchmark index by more than 1%. The fund was positioned with a moderate long delta vs. Benchmark throughout the reporting period. Outperformance was primarily generated via security selection, mainly within, but also outside of the Benchmark, and secondly, by actively participating in the primary market. The primary market continued to be very strong and total size of the convertible bond market, as measured by Refinitiv, grew from around US$ 400bln to nearly US$490bln. Most of the new issuances came out of the US. Europa and Asia were not as strong, but gained some traction in third quarter of 2021.
Credit Suisse (Lux) Financial Bond Fund
The financial year started with a big bang. The successful development of a vaccine against Covid-19 early November 2020 boosted valuations for financial assets. Having something in the hand to overcome the negative impacts of the pandemia delivered the base for one of the strongest recovery of the global economy in the last decades. 2021 was characterized by high monetary and fiscal stimuli, supply chain issues with shortages of important product parts and much higher energy and commodity prices. This caused a huge rise in inflation rates and to a less degree in higher yield levels. The profitability of the banking sector improved substantially, thanks to a stabilization of the net interest margins, an increase in fee income and much lower credit costs, what explains the solid gains of subordinated financial bonds in the reporting period. The preference for Additional Tier 1 and Restricted Tier 1 bonds paid out very well, as this segment of the capital structure profited particularly from the hunt for yield. Although the fund couldn’t escape higher interest rates, the effect was manageable and mitigated through the use of interest rate swaps, which reduced the duration of the fund. After the recent rally in subordinated financial debt and credit spreads approaching all-time lows, we transition our focus from a pure spread compression view to a more balanced carry play. Hence, the fund remains predominantly positioned in contingent capital of the better capitalized and more diversified banks and insurers in Europe and prefers shorter non-call structures with significant backend spread cushions.
Credit Suisse (Lux) Credit Special Situation Fund
The reporting period was characterized primarily by the developments of the COVID-19 pandemic. While financial markets started to recover already earlier in 2020, they got a further boost in November 2020 on news of a vaccine available in due time. This improved recovery confidence further over the course of 2021 and together with continuously easing financial conditions, default rates began to drop significantly and the credit rating cycle quickly moved from extremely negative to extremely positive. The strong recovery momentum continued despite the rapidly spreading delta variant and eventually credit risk premiums edged to the lowest levels since the great financial crisis.
The fund did benefit strongly from this extraordinarily constructive backdrop. In a strong reversal that followed the dramatic market collapse at the beginning of the pandemic, the fund outperformed all major comparable rates and credit market asset classes. It even outperformed Fallen Angels, which were among the main beneficiaries of unprecedented global fiscal and monetary policy support. The fund increased exposure towards lagging sectors, which suffered most from the global pandemic, including cruise liners or air travel services. Overall, the risk exposure of the fund has grown over the course of the year in an attempt to benefit from this unusually strong market environment.
Credit Suisse (Lux) SQ Euro Corporate Bond Fund
Similar to the previous year, global financial markets enjoyed a volatile 12 month, still mainly driven by the COVID-19 crisis – albeit with different dynamics. Credit markets continued to perform well especially during the last quarter of 2020, tightening by roughly 30bps in the EUR IG space. In 2021, asset prices were generally driven by the underlying government bonds. 5 year German Bund yields have risen by more than 40bps during the reporting period on the back of spiking realized and expected inflation due to economic reopening coupled with supply chain disruptions, while European central banks still remained accomodative. In line with the market developments, the overall portfolio risk regarding credit (e.g. measured by spread duration) has been gradually decreased in response to the generally tight credit market. The subfund follows a systematic approach regarding security selection, thereby following principles of factor investing to capture the long-term factor premia of “Quality” and “Value”, that generally defines the asset allocation. During the review period, the “Quality” factor has significantly underperformed the broad market, while “Value” contributed positively: taken together, the two-factor model has underperformed. The systematic security selection is supplemented by high conviction security picks based on fundamental coverage, mainly within High Yield, that contributed positively to the relative performance.
Credit Suisse (Lux) European Sovereign Plus Bond Fund
European government bond markets have experienced a volatile year coupled with predominantely rising rates of core countries. For example, the German Bund 10 year yield increased from about -0.62% by the end of October 2020 to -0.11% by the end of October 2021. Overall, the steady increase in nominal yields is due to rising inflation expectations, on the back of economic reopening throughout Europe coupled with supply chain concerns. With European core yields trading negative and financial conditions backed-up by central banks, spreads of European peripheral countries have outperformed due to higher carry and yield-seeking investors. During the review period, the fund was generally long peripheral risks (mainly Italy, but also Cyprus and Portugal) and underweight in the more core countries (Ireland, Belgium, and Spain) to profit from the central bank support. In addition, selected corporate credits were added to the portfolio, totalling to about 5%, focused on the shorter end of the curve, on the back of a more positive credit outlook at the beginning of 2021. For the time being, the fund is still maintaining an overweight towards European peripheral countries (albeit to a lesser extent from a duration risk point of view) and corporates, while we keep closely monitoring the economic environment in Europe as well as country specific developments and idiosyncratic risks.
Credit Suisse (Lux) Global High Yield Bond Fund
The annual period ended October 31, 2021 was positive for the high yield asset class, as a broader economic reopening following the most difficult stages of the COVID-19 pandemic led to improved corporate fundamentals and stable market technicals. The high yield market exited the 2020 calendar year with significant momentum and then impressively delivered positive returns in the first nine months of 2021 despite several pockets of weakness driven by higher longer-term U.S. treasury yields amidst fears of inflationary pressure as the economy recovers. The 10-year U.S. treasury rate widened by 68 basis points over the period, contributing to outflows from the asset class for much of 2021.

CS Investment Funds 1 • Audited Annual Report as at 31.10.2021
Manager's Report (unaudited) Page 17
The information stated relates to the period under review and is not indicative of future returns.
For the annual period ending October 31, 2021, from a sector perspective, Real Estate and Leisure were the top contributors to performance. Within Real Estate, security selection and an underweight position versus the benchmark both contributed to outperformance. Energy and Capital Goods were detractors to performance. From a rating perspective, Caa2 was a positive contributor to performance due to security selection, while Ba3 was a detractor to performance due to an overweight position versus the benchmark and security selection. Looking forward, we are constructive on the high yield asset class. Fundamentals have continued to improve, but we are mindful of potential impacts from labor shortages and supply chain disruption, and we believe meticulous credit analysis is imperative as we navigate these headwinds. From a technical standpoint, we believe rate volatility driven by inflationary forces will likely provide attractive buying opportunities. The fund remains positioned with an underweight to the energy sector and short on duration versus the Index, putting us in the position to capitalize on a sell-off driven by energy prices or rate increases.
Credit Suisse (Lux) Global Inflation Linked Bond Fund
The global healing process has progressed into a genuine recovery. Equity markets are near all-time highs, earnings are surging and bond yields are on the rise. The post-lockdown recovery has been powerful, and most developed economies have seen double-digit gross domestic product rebounds from 2020 lows. More recently though economic data indicate a marked slowdown in activity. There are worries about what happens next, particularly about monetary policy and the outlook for inflation. The inflation spike has been larger than expected, but we still think it is transitory, caused by base effects from when the U.S. consumer price index fell during the lockdown last year and by temporary supply bottlenecks. As short-term pressures ease, we expect inflation in most major economies to be meaningfully lower in a year’s time. The economic releases did not dissuade the Federal Reserve from its plans to taper quantitative easing to a full stop by mid-next year. Elevated inflation figures are still held by the central bank to be transitory. This means that even though the U.S. Federal Reserve is going to taper asset purchases, rate hikes are unlikely before the second half of 2023. Another worry is the highly contagious COVID-19 delta variant. The evidence so far is that vaccines are effective in preventing serious COVID-19 infections. Vaccination rates are accelerating globally, and emerging economies are catching up with developed markets. The onset of winter in the northern hemisphere will be a test, but the rollout of booster vaccination shots should help prevent widescale renewed lockdowns. The market with the best performance, as measured by the Barclays World Government Inflation-Linked Bonds index (WGILB, local return), was Italy (8.37%) followed by Germany (7.31%) and the United States (7.06%). The worst performing market was New Zealand (-7.93%) followed by Canada (-3.90%). In relative terms (compared to nominal bonds of similar maturity), Germany was the best performing market with an outperformance of 10.58%. The main positive performance contribution came from the synthetic inflation exposure through corporate bonds and inflation swaps, as credit spreads tightened over the reporting period. The exposure to corporate bonds was held more or less steady. From an overall duration standpoint the subfund was activelly positioned around benchmark duration. More recently the subfund is neutral in duration terms compared to the benchmark.
Credit Suisse (Lux) Floating Rate Credit Fund
The reporting period was strongly affected by the aftershocks of the outbreak of the Covid-19 pandemic in the first quarter of 2020, albeit from different angles and with changed dynamics. Credit markets continued to perform well, specifially in the last quarter of 2020. Over the course of the year 2021, however, asset prices were predominantly affected by global interest rates volatility. Stagflation had become a more prominent fear as supply chain disruptions and their impact on the availability and prices of goods assumed more and more non-temporary characteristics. Global central banks saw a rising need to normalize monetary policy on the one hand, but feared the risk to weaken the growth outlook on the other hand, as escalating inflation was putting pressure on real income growth.
The subfund posted a positive performance over the reporting period due its low duration and selective buying approach on credits that are less prone to inflationary induced margin pressure and due to its investments in the crossover credit space. The fund has benefited from active credit management and increasing diversification effects from its flexibility to rotate across all sectors of the global fixed income market and generated stable returns post the market recovery and spread tightening throughout the reporting period. The overall portfolio credit risk, measured by spread duration, has been gradually decreased throughout 2021 in response to the generally tighter market credit spreads. With credit spreads still at the tight end of their historical range, the fund is focused on more idiosyncratic risk factors and limits duration-driven capital losses.
Credit Suisse (Lux) Global Value Bond Fund (previously Credit Suisse
(Lux) AgaNola Global Value Bond Fund)
Risky assets started buoyant into the reporting period. Technology and so called stay-at-home stocks continued to be sought after against a backdrop of a worsening Covid-19 pandemic, which forced many countries into another lockdown. Meanwhile central banks remained supportive keeping rates at historic lows. The situation changed around March/April 2021 with the arrival of the warmer season in the northern hemisphere and the rollout of the Covid-19 vaccine. The outlook for the pandemic improved thereafter and economies started to re-open. On the other hand, more and more supply-side shortages disrupted the global flow of goods causing inflationary pressure. Risky asset performed well in the respective reporting period while interest rate sensitive assets underperformed. In the period under review the Credit Suisse (Lux) Global Value Bond Fund generated a solid absolute return outperforming its benchmark and Global Fixed Income in general. The fund was positioned with a reduced modified duration throughout the reporting period therefore protecting the fund from increased interest rate volatility. Further we applied a credit barbell strategy with majority invested in investment-grade corporate bonds and selected credit satellites like Emerging Markets-, Convertibles- or High Yield bonds with an average credit rating of BBB overall to provide additional return sources for the fund. Especially the Convertible bond allocation was increased at the cost of corporate bonds (EM & developed countries).
Credit Suisse (Lux) High Yield USD Bond Fund
The annual period ended October 31, 2021 was positive for the high yield asset class, as a broader economic reopening following the most difficult stages of the COVID-19 pandemic led to improved corporate fundamentals and stable market technicals. The high yield market exited the 2020 calendar year with significant momentum and then impressively delivered positive returns in the first nine months of 2021 despite several pockets of weakness driven by higher longer-term U.S. treasury yields amidst fears of inflationary pressure as the economy recovers. The 10-year U.S. treasury rate widened by 68 basis points over the period, contributing to outflows from the asset class for much of 2021. For the annual period ending October 31, 2021, from a sector perspective, Leisure and Utility were the top contributors to performance. Within Leisure, security selection and an overweight position versus the benchmark contributed to outperformance. Within Utility, an underweight position contributed to outperformance. Energy and Telecommunications were detractors to performance. From a rating perspective, Ba1 was a positive contributor to performance while Ba2 was a detractor to performance, both due to an underweight position versus the benchmark and security selection. Looking forward, we are constructive on the high yield asset class. Fundamentals have continued to improve, but we are mindful of potential impacts from labor shortages and supply chain disruption, and we believe meticulous credit analysis is imperative as we navigate these headwinds. From a technical standpoint, we believe rate volatility driven by inflationary forces will likely provide attractive buying opportunities. The fund remains positioned with an underweight to the energy sector and short on duration versus the Index, putting us in the position to capitalize on a sell-off driven by energy prices or rate increases.

CS Investment Funds 1 • Audited Annual Report as at 31.10.2021
Manager's Report (unaudited) Page 18
The information stated relates to the period under review and is not indicative of future returns.
Credit Suisse (Lux) SQ US Corporate Bond Fund
Similar to the previous year, global financial markets enjoyed a volatile 12 month, still mainly driven by the COVID-19 crisis – albeit with different dynamics. Credit markets continued to perform well especially during the last quarter of 2020, tightening by roughly 40bps in the USD IG space. In 2021, asset prices were generally driven by the underlying government bonds. 5 year US Treasury yields have risen by more than 80bps during the reporting period on the back of spiking realized and expected inflation due to economic reopening coupled with supply chain disruptions and a potential less accomodative stance by the Fed. In line with the market developments, the overall portfolio risk regarding credit (e.g. measured by spread duration) has been gradually decreased in response to the generally tight credit market. The subfund follows a systematic approach regarding security selection, thereby following principles of factor investing to capture the long-term factor premia of “Quality” and “Value”, that generally defines the asset allocation. During the review period, the “Quality” factor has significantly underperformed the broad market, while “Value” contributed positively: taken together, the two-factor model performed in line with the benchmark. The systematic security selection is supplemented by high conviction security picks based on fundamental coverage, mainly within High Yield, that contributed positively to the relative performance. However, duration and curve positioning negatively impacted the returns.
Credit Suisse (Lux) Latin America Corporate Bond Fund
Global economic growth made a strong rebound from the sharp drop in activity due to the outbreak of the Covid-19 pandemic. Risk markets were well supported by strong fiscal and monetary policy measures as well as progress on vaccination programs. Economic growth and rising commodity markets had a positive impact on credit metrics of many EM corporates including those in the Latin America region. As a result, credit spreads experienced a strong tightening over the reporting period. On the other side, improving growth prospects led to an upward correction in US Treasury yields and expectations that the Fed will make a formal taper announcement for its quantitative easing program at its November meeting. The Subfund posted a positive absolute performance during the reporting period. The main driver has been the strong credit spread tightening and interest rate carry that was able to offset rising US Treasury yields. From a relative perspective (gross of fees) the fund also outperformed its benchmark. Over the reporting period, the fund increased its exposure to high yield bonds in the BB and B-rated category where we saw the potential for spread compression as Latin America lagged somewhat the recovery relative to other regions. Our duration was below benchmark for most of the reporting period. The average rating of the fund is BB. From a country perspective, the fund increased its weight in Brazil at the expense of Mexico and Argentina. The fund also neutralized some underweights in Peru and Colombia.
Credit Suisse Investment Partners (Lux) Convert International Bond Fund
(since 11.03.2021)
The reporting period was exceptionally favourable for risky assets. Global equities recorded ten all-time-high monthly closes, a feat almost unprecedented in any priod 12-month period. Convertible bonds were a major beneficiary of that and manged to capture a large proportion of the upside in stocks. The primary market for convertible bonds reinforced the positive dynamic with a continuous supply of new deals which allowed investors to gain exposure to new names and at the same time take profits and rotate out of existing, high delta issues. Valuations head steady in the US and Japan, while Europe saw a gradual richening to reach pre-pandemic levels. Asia-ex Japan was sthe only region which saw a sustained weakness in valuations following the crackdown of the Chinese government on the online education and gaming sectors and amid fears of rising defaults in the Chinese real estate sector.
The period under review saw the Credit Suisse Investment Partners (Lux) Convert International Bond fund deliver a total return of 22.94% (net of all costs, in USD unhedged). The fund was positioned with a moderate long delta throughout the reporting period which we reduced in September-October 2021. In absolute terms the fund’s delta was virtually unchanged at just below 65%, rallying sharply in the last two months of 2020 before gradually declining over the course of 2021. We made the relative delta adjustment in line with our view that financial asset prices have decoupled from economic fundamentals and are thus vulnerable to sharp corrections. We furthermore see credit markets as ‘priced to perfection’, especially in the weakest segments of the credit spectrum, where the risk-reward is rather unfavourable for investors. As we move into the new reporting period, we see the asset class as uniquely positioned to benefit from the current environment. With inflation running well ahead of central bank target levels and inflation expectations in danger of becoming entrenched, it is imperative that we move towards a less accommodating monetary policy. Higher interest rates are typically associated with lower corporate and government bond prices. In contrast, convertible bonds show consistently positive returns during periods of rising yields. This, coupled with the strong convexity (upside potential coupled with bond floor portection) of the asset class is likely to continue to attract investors going forward.
Credit Suisse (Lux) Emerging Market Corporate Short Duration Bond Fund
(since 15.09.2021)
Volatility in credit markets as well as in the short-term rate market has picked up since the fund was launched on September 15th 2021. In credit markets, volatility was mostly contained to the Chinese real estate sector as investor concerns grew about refinancing issues and rising defaults. Globally, credit fundamentals of emerging market corporates remain solid on strong economic growth and high commodity prices. On the rate side, we have seen a sharp repricing in shorter dated US Treasury yields. The high and more persistent level of inflation has shifted investor expectations towards an earlier start for rate hikes by the US Federal Reserve. The Subfund has been only launched on September 15th 2021. During the reporting period of 1.5 months, we have been investing the cash proceeds in a diversified basis across various regions, countries, sectors, ratings and issuers. The performance has been negative during this short period in line with the general market given the strong rise in short-term rates, implementation of portfolio positions (bid-offer spread) as well as the sharp spread widening in Chinese real estate names. At the end of the period, the fund has an average credit quality of BB+ with a duration of 2.3. From a regional perspective, just over 80% of the fund is invested across Latin America, Asia and Europe with the remainder split between Middle East, Africa and an allocation in cash.
The information and return data relate to the reporting period under review and are not indicative of future returns.

CS Investment Funds 1 • Audited Annual Report as at 31.10.2021
Credit Suisse (Lux) Dynamic Bond Fund (until 08.04.2021) Page 19
Technical Data and Notes
Technical Data
Valoren ISIN Management Fee
B - Capitalisation USD 25641255 LU1120824096 0.90%
DAP - Distribution USD 50236386 LU2057893328 0.00%
DBP - Capitalisation USD 29959405 LU1303401217 0.00%
EB - Capitalisation USD 25641274 LU1120824252 0.45%
IB - Capitalisation USD 25641278 LU1120824419 0.45%
UB - Capitalisation USD 26358853 LU1147757626 0.55%
BH - Capitalisation CHF 33004993 LU1435227506 0.90%
EBH - Capitalisation CHF 28667060 LU1253098104 0.45%
IBH - Capitalisation CHF 25641288 LU1120824500 0.45%
UBH - Capitalisation CHF 28261240 LU1235128805 0.55%
BH - Capitalisation EUR 25641265 LU1120824179 0.90%
CBH - Capitalisation EUR 35224402 LU1546464188 0.90%
EBH - Capitalisation EUR 25641275 LU1120824336 0.45%
IBH - Capitalisation EUR 25641303 LU1120824682 0.45%
UBH - Capitalisation EUR 26358903 LU1147757972 0.55%
Credit Suisse (Lux) Dynamic Bond Fund (until 08.04.2021) was merged on 09.04.2021 into CS Investments 6 - Credit Suisse (Lux) Dynamic Bond Fund. There is no management fee for -DAP- and -DBP- share classes.
Fund Performance
PTD Since Inception 2020 2019 2018
B - Capitalisation USD 0.19% / 10.08% 5.78% 0.10%
DAP - Distribution USD 0.33% 11.24% / / /
DBP - Capitalisation USD 0.53% / 11.23% 6.75% 1.13%
EB - Capitalisation USD 0.32% / 10.53% 6.14% 0.59%
IB - Capitalisation USD 0.31% / 10.51% 6.13% 0.55%
UB - Capitalisation USD 0.29% / 10.40% 6.06% 0.45%
BH - Capitalisation CHF -0.06% / 8.49% 2.73% -3.18%
EBH - Capitalisation CHF 0.06% / 8.81% 3.24% -2.77%
IBH - Capitalisation CHF 0.05% / 8.77% 3.16% -2.82%
UBH - Capitalisation CHF 0.04% / 8.69% 3.13% -2.84%
BH - Capitalisation EUR -0.08% / 8.53% 3.32% -2.87%
CBH - Capitalisation EUR -0.19% / 8.15% 2.85% -3.31%
EBH - Capitalisation EUR 0.04% / 8.83% 3.81% -2.37%
IBH - Capitalisation EUR 0.04% / 8.82% 3.68% -2.41%
UBH - Capitalisation EUR 0.01% / 8.73% 3.71% -2.47%
PTD = Performance-To-Date (01.01.2021 – 08.04.2021)
Distribution
Ex-Date Amount
DAP - Distribution USD 15.12.2020 8.27

CS Investment Funds 1 • Audited Annual Report as at 31.10.2021
Credit Suisse (Lux) Dynamic Bond Fund (until 08.04.2021) Page 20
Statement of Net Assets (in USD) and Fund Evolution
The notes are an integral part of the financial statements.
Fund Evolution 08.04.2021 31.10.2020 31.10.2019
Total net assets USD 122,752,076.40* 129,866,871.35 69,166,766.81
Net asset value per share
B - Capitalisation USD 123.70 118.03 112.58
DAP - Distribution USD 1,104.05 1,057.31 /
DBP - Capitalisation USD 1,281.07 1,215.96 1,147.69
EB - Capitalisation USD 127.17 121.11 115.04
IB - Capitalisation USD 126.93 120.89 114.87
UB - Capitalisation USD 122.94 117.14 111.40
BH - Capitalisation CHF 104.82 100.47 97.59
EBH - Capitalisation CHF 109.01 104.27 100.99
IBH - Capitalisation CHF 110.52 105.75 102.43
UBH - Capitalisation CHF 107.94 103.32 100.15
BH - Capitalisation EUR 110.49 105.91 102.77
CBH - Capitalisation EUR 104.80 100.64 98.01
EBH - Capitalisation EUR 113.71 108.79 105.25
IBH - Capitalisation EUR 113.14 108.26 104.75
UBH - Capitalisation EUR 109.99 105.29 101.97
* TNA before liquidation
Number of shares outstanding At the end of the period At the beginning of the
period
Number of shares
issued
Number of shares
redeemed
B - Capitalisation USD 0.000 27,787.460 2,900.278 30,687.738
DAP - Distribution USD 0.000 14,635.275 1,411.597 16,046.872
DBP - Capitalisation USD 0.000 31,031.952 12,564.558 43,596.510
EB - Capitalisation USD 0.000 171,025.256 400.000 171,425.256
IB - Capitalisation USD 0.000 20,269.130 0.000 20,269.130
UB - Capitalisation USD 0.000 20,575.892 21,127.977 41,703.869
BH - Capitalisation CHF 0.000 39,154.464 3,299.323 42,453.787
EBH - Capitalisation CHF 0.000 72,584.604 7,620.000 80,204.604
IBH - Capitalisation CHF 0.000 15,915.484 0.000 15,915.484
UBH - Capitalisation CHF 0.000 24,552.550 32,091.700 56,644.250
BH - Capitalisation EUR 0.000 32,392.927 1,711.006 34,103.933
CBH - Capitalisation EUR 0.000 2,619.736 0.000 2,619.736
EBH - Capitalisation EUR 0.000 144,614.508 15,726.999 160,341.507
IBH - Capitalisation EUR 0.000 20,300.393 0.000 20,300.393
UBH - Capitalisation EUR 0.000 44,542.478 6,609.703 51,152.181

CS Investment Funds 1 • Audited Annual Report as at 31.10.2021
Credit Suisse (Lux) Dynamic Bond Fund (until 08.04.2021) Page 21
Statement of Operations / Changes in Net Assets (in USD)
The notes are an integral part of the financial statements.
For the period from
01.11.2020 to 08.04.2021
(date of merger)
Net assets at the beginning of the period 129,866,871.35
Income
Interest on investments in securities (net) 1,517,288.32
Bank Interest 13.01
Securities lending income 3,526.07
1,520,827.40
Expenses
Management fee 191,863.36
Performance fee 983,939.27
Depositary fee 35,280.52
Administration expenses 36,555.72
Printing and publication expenses 9,739.01
Interest and bank charges 49,097.60
Audit, control, legal, representative bank and other expenses 130,818.45
"Taxe d'abonnement" 8,855.25
1,446,149.18
Net income (loss) 74,678.22
Realised gain (loss)
Net realised gain (loss) on sales of investments 3,507,779.36
Net realised gain (loss) on financial futures contracts -429,310.68
Net realised gain (loss) on swaps contracts 3,399,642.41
Net realised gain (loss) on forward foreign exchange contracts -22,929.35
Net realised gain (loss) on foreign exchange -346,278.00
6,108,903.74
Net realised gain (loss) 6,183,581.96
Change in net unrealised appreciation (depreciation)
Change in net unrealised appreciation (depreciation) on investments 2,266,695.31
Change in net unrealised appreciation (depreciation) on financial futures contracts -197,226.57
Change in net unrealised appreciation (depreciation) on swaps contracts -1,344,620.01
Change in net unrealised appreciation (depreciation) on forward foreign exchange contracts -92,954.25
631,894.48
Net increase (decrease) in net assets as a result of operations 6,815,476.44
Subscriptions / Redemptions
Subscriptions 28,871,571.09
Redemptions -165,427,871.60
-136,556,300.51
Distribution -126,047.28
Net assets at the end of the period 0.00

CS Investment Funds 1 • Audited Annual Report as at 31.10.2021
Credit Suisse Investment Partners (Lux) Global Convertible Bond Fund (previously Credit Suisse (Lux) AgaNola Global Convertible Bond Fund)
Page 22
Technical Data and Notes
Technical Data
Valoren ISIN Management Fee Total Expense Ratio
B - Capitalisation USD 10670988 LU0458985982 1.20% 1.39%
EB - Capitalisation USD 43511278 LU1875412121 0.42% 0.57%
FB - Capitalisation USD 3449721 LU0324196665 0.42% 0.57%
IB - Capitalisation USD 34491659 LU1515062245 0.80% 0.99%
MBH - Capitalisation USD 40798264 LU1732803868 0.34% 0.51%
UB - Capitalisation USD 26349671 LU1144398358 0.90% 1.09%
BH - Capitalisation CHF 10670990 LU0458986014 1.20% 1.47%
EBH - Capitalisation CHF 43511317 LU1875412477 0.42% 0.65%
FBH - Capitalisation CHF 3449820 LU0324197556 0.42% 0.65%
IBH - Capitalisation CHF 34491657 LU1515062161 0.80% 1.07%
IBHP - Capitalisation CHF 34491653 LU1515061940 0.60% 2.26%
UBH - Capitalisation CHF 26349690 LU1144398432 0.90% 1.17%
BH - Capitalisation EUR 10670991 LU0458986105 1.20% 1.47%
CBH - Capitalisation EUR 35224423 LU1546464345 1.20% 2.17%
EAH - Distribution EUR 43511334 LU1875412717 0.42% 0.66%
EBH - Capitalisation EUR 43511320 LU1875412550 0.42% 0.65%
FBH - Capitalisation EUR 3449818 LU0324197390 0.42% 0.65%
IBH - Capitalisation EUR 24943198 LU1089177338 0.80% 1.07%
IBHP - Capitalisation EUR 34491656 LU1515062088 0.60% 2.31%
MAH - Distribution EUR 40798051 LU1732803272 0.34% 0.59%
UAH - Distribution EUR 38311087 LU1685862994 0.90% 1.17%
UBH - Capitalisation EUR 26349698 LU1144398515 0.90% 1.17%
The TER excluding performance fees is 0.87% for -IBHP- EUR and -IBHP- CHF shares. As at 01.05.2021 the management fee for share classes -MBH- USD and -MAH- EUR decreased from 0.37% to 0.34%.
Fund Performance
YTD Since Inception 2020 2019 2018
B - Capitalisation USD 3.31% / 12.10% 10.22% -3.09%
EB - Capitalisation USD 4.02% 28.43% 13.02% 11.13% /
FB - Capitalisation USD 4.02% / 13.01% 11.12% -2.28%
IB - Capitalisation USD 3.66% 22.94% 12.53% 10.67% /
MBH - Capitalisation USD 4.07% 28.14% 13.07% 11.18% /
UB - Capitalisation USD 3.57% / 12.44% 10.55% -2.79%
BH - Capitalisation CHF 2.28% / 9.73% 6.54% -6.25%
EBH - Capitalisation CHF 2.98% 14.88% 10.64% / /
FBH - Capitalisation CHF 2.96% / 10.64% 7.39% -5.45%
IBH - Capitalisation CHF 2.61% / 10.14% 6.97% -5.86%
IBHP - Capitalisation CHF 2.38% / 8.79% 7.06% -5.70%
UBH - Capitalisation CHF 2.53% / 10.05% 6.84% -5.99%
BH - Capitalisation EUR 2.44% / 9.91% 6.96% -5.92%
CBH - Capitalisation EUR 1.87% / 9.14% 6.22% -6.53%
EAH - Distribution EUR 3.15% 16.84% 10.81% 7.87% /
EBH - Capitalisation EUR 3.15% 16.49% 10.78% / /
FBH - Capitalisation EUR 3.14% / 10.85% 7.85% -5.12%
IBH - Capitalisation EUR 2.79% / 10.35% 7.41% -5.50%
IBHP - Capitalisation EUR 2.54% / 8.85% 7.54% -5.33%
MAH - Distribution EUR 3.21% 16.72% 10.87% / /
UAH - Distribution EUR 2.70% / 10.25% 7.30% -5.52%
UBH - Capitalisation EUR 2.71% / 10.24% 7.28% -5.56%
Distribution
Ex-Date Amount
EAH - Distribution EUR 15.12.2020 0.04
MAH - Distribution EUR 15.12.2020 0.86

CS Investment Funds 1 • Audited Annual Report as at 31.10.2021
Credit Suisse Investment Partners (Lux) Global Convertible Bond Fund (previously Credit Suisse (Lux) AgaNola Global Convertible Bond Fund)
Page 23
Technical Data and Notes (Continued)
Notes
Forward foreign exchange contracts
Purchases Sales Maturity Valuation
Counterparty (In USD)
CHF 300 USD -329 09.11.2021 -0.27
Credit Suisse (Schweiz) AG - Zurich - Switzerland
CHF 22,300 USD -24,412 09.11.2021 0.45
Credit Suisse (Schweiz) AG - Zurich - Switzerland
USD 46,009 EUR -39,400 09.11.2021 403.65
Credit Suisse (Schweiz) AG - Zurich - Switzerland
USD 112,497 CHF -103,200 09.11.2021 -480.05
Credit Suisse (Schweiz) AG - Zurich - Switzerland
EUR 695,000 USD -806,190 09.11.2021 -1,733.33
Credit Suisse (Schweiz) AG - Zurich - Switzerland
CHF 213,700 USD -232,327 09.11.2021 1,619.14
Credit Suisse (Schweiz) AG - Zurich - Switzerland
EUR 327,200 USD -379,467 09.11.2021 -735.54
Credit Suisse (Schweiz) AG - Zurich - Switzerland
CHF 165,500 USD -180,048 09.11.2021 1,131.80
Credit Suisse (Schweiz) AG - Zurich - Switzerland
EUR 195,800 USD -227,235 09.11.2021 -598.56
Credit Suisse (Schweiz) AG - Zurich - Switzerland
CHF 113,300 USD -122,694 09.11.2021 1,340.23
Credit Suisse (Schweiz) AG - Zurich - Switzerland
USD 63,080 CHF -58,200 09.11.2021 -633.97
Credit Suisse (Schweiz) AG - Zurich - Switzerland
USD 193,865 EUR -167,000 09.11.2021 564.01
Credit Suisse (Schweiz) AG - Zurich - Switzerland
EUR 90,900 USD -105,403 09.11.2021 -187.26
Credit Suisse (Schweiz) AG - Zurich - Switzerland
USD 83,665 CHF -77,200 09.11.2021 -848.54
Credit Suisse (Schweiz) AG - Zurich - Switzerland
USD 89,281 EUR -77,100 09.11.2021 38.85
Credit Suisse (Schweiz) AG - Zurich - Switzerland
CHF 175,200 USD -189,301 09.11.2021 2,497.01
Credit Suisse (Schweiz) AG - Zurich - Switzerland
USD 79,259 EUR -68,600 09.11.2021 -144.45
Credit Suisse (Schweiz) AG - Zurich - Switzerland
CHF 311,300 USD -335,266 09.11.2021 5,526.75
Credit Suisse (Schweiz) AG - Zurich - Switzerland
EUR 5,300 USD -6,137 09.11.2021 -2.00
Credit Suisse (Schweiz) AG - Zurich - Switzerland
CHF 149,600 USD -161,583 09.11.2021 2,190.28
Credit Suisse (Schweiz) AG - Zurich - Switzerland
CHF 78,500 USD -84,762 09.11.2021 1,174.67
Credit Suisse (Schweiz) AG - Zurich - Switzerland
USD 50,491 EUR -43,600 09.11.2021 24.50
Credit Suisse (Schweiz) AG - Zurich - Switzerland
USD 9,135,799 EUR -7,894,800 09.11.2021 -2,360.06
UBS AG London Branch - London - United Kingdom
USD 7,443,085 CHF -6,896,100 09.11.2021 -106,321.54
Credit Suisse (Schweiz) AG - Zurich - Switzerland
USD 5,437,942 GBP -4,000,000 09.11.2021 -45,077.61
Citibank N.A.- London - United Kingdom
EUR 1,364,600 USD -1,578,743 09.11.2021 769.64
JP Morgan Securities PLC - London - United Kingdom
CHF 802,700 USD -866,834 09.11.2021 11,914.25
UBS AG London Branch - London - United Kingdom
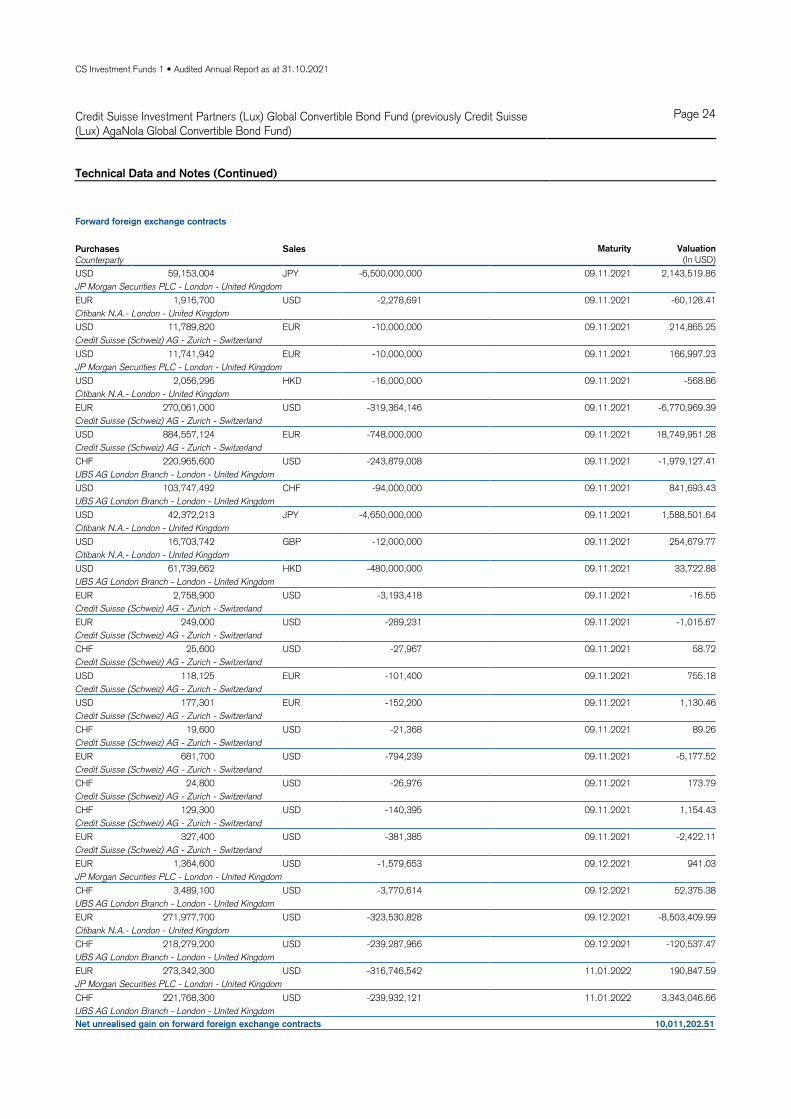
CS Investment Funds 1 • Audited Annual Report as at 31.10.2021
Credit Suisse Investment Partners (Lux) Global Convertible Bond Fund (previously Credit Suisse (Lux) AgaNola Global Convertible Bond Fund)
Page 24
Technical Data and Notes (Continued)
Forward foreign exchange contracts
Purchases Sales Maturity Valuation
Counterparty (In USD)
USD 59,153,004 JPY -6,500,000,000 09.11.2021 2,143,519.86
JP Morgan Securities PLC - London - United Kingdom
EUR 1,916,700 USD -2,278,691 09.11.2021 -60,128.41
Citibank N.A.- London - United Kingdom
USD 11,789,820 EUR -10,000,000 09.11.2021 214,865.25
Credit Suisse (Schweiz) AG - Zurich - Switzerland
USD 11,741,942 EUR -10,000,000 09.11.2021 166,997.23
JP Morgan Securities PLC - London - United Kingdom
USD 2,056,296 HKD -16,000,000 09.11.2021 -568.86
Citibank N.A.- London - United Kingdom
EUR 270,061,000 USD -319,364,146 09.11.2021 -6,770,969.39
Credit Suisse (Schweiz) AG - Zurich - Switzerland
USD 884,557,124 EUR -748,000,000 09.11.2021 18,749,951.28
Credit Suisse (Schweiz) AG - Zurich - Switzerland
CHF 220,965,600 USD -243,879,008 09.11.2021 -1,979,127.41
UBS AG London Branch - London - United Kingdom
USD 103,747,492 CHF -94,000,000 09.11.2021 841,693.43
UBS AG London Branch - London - United Kingdom
USD 42,372,213 JPY -4,650,000,000 09.11.2021 1,588,501.64
Citibank N.A.- London - United Kingdom
USD 16,703,742 GBP -12,000,000 09.11.2021 254,679.77
Citibank N.A.- London - United Kingdom
USD 61,739,662 HKD -480,000,000 09.11.2021 33,722.88
UBS AG London Branch - London - United Kingdom
EUR 2,758,900 USD -3,193,418 09.11.2021 -16.55
Credit Suisse (Schweiz) AG - Zurich - Switzerland
EUR 249,000 USD -289,231 09.11.2021 -1,015.67
Credit Suisse (Schweiz) AG - Zurich - Switzerland
CHF 25,600 USD -27,967 09.11.2021 58.72
Credit Suisse (Schweiz) AG - Zurich - Switzerland
USD 118,125 EUR -101,400 09.11.2021 755.18
Credit Suisse (Schweiz) AG - Zurich - Switzerland
USD 177,301 EUR -152,200 09.11.2021 1,130.46
Credit Suisse (Schweiz) AG - Zurich - Switzerland
CHF 19,600 USD -21,368 09.11.2021 89.26
Credit Suisse (Schweiz) AG - Zurich - Switzerland
EUR 681,700 USD -794,239 09.11.2021 -5,177.52
Credit Suisse (Schweiz) AG - Zurich - Switzerland
CHF 24,800 USD -26,976 09.11.2021 173.79
Credit Suisse (Schweiz) AG - Zurich - Switzerland
CHF 129,300 USD -140,395 09.11.2021 1,154.43
Credit Suisse (Schweiz) AG - Zurich - Switzerland
EUR 327,400 USD -381,385 09.11.2021 -2,422.11
Credit Suisse (Schweiz) AG - Zurich - Switzerland
EUR 1,364,600 USD -1,579,653 09.12.2021 941.03
JP Morgan Securities PLC - London - United Kingdom
CHF 3,489,100 USD -3,770,614 09.12.2021 52,375.38
UBS AG London Branch - London - United Kingdom
EUR 271,977,700 USD -323,530,828 09.12.2021 -8,503,409.99
Citibank N.A.- London - United Kingdom
CHF 218,279,200 USD -239,287,966 09.12.2021 -120,537.47
UBS AG London Branch - London - United Kingdom
EUR 273,342,300 USD -316,746,542 11.01.2022 190,847.59
JP Morgan Securities PLC - London - United Kingdom
CHF 221,768,300 USD -239,932,121 11.01.2022 3,343,046.66
UBS AG London Branch - London - United Kingdom
Net unrealised gain on forward foreign exchange contracts 10,011,202.51

CS Investment Funds 1 • Audited Annual Report as at 31.10.2021
Credit Suisse Investment Partners (Lux) Global Convertible Bond Fund (previously Credit Suisse (Lux) AgaNola Global Convertible Bond Fund)
Page 25
Statement of Net Assets (in USD) and Fund Evolution
The notes are an integral part of the financial statements.
31.10.2021
Assets
Investments in securities at market value 2,057,686,884.48Cash at banks and at brokers 83,262,406.79Income receivable 2,085,833.01Net unrealised gain on forward foreign exchange contracts 10,011,202.51
2,153,046,326.79
Liabilities
Interest payable 6,236.09Provisions for accrued expenses 1,221,956.31Other liabilities 98.77
1,228,291.17
Net assets 2,151,818,035.62
Fund Evolution 31.10.2021 31.10.2020 31.10.2019
Total net assets USD 2,151,818,035.62 1,427,555,925.31 1,335,930,997.57
Net asset value per share
B - Capitalisation USD 153.36 137.41 130.18
EB - Capitalisation USD 128.43 114.14 107.24
FB - Capitalisation USD 199.17 177.00 166.31
IB - Capitalisation USD 122.94 109.71 103.52
MBH - Capitalisation USD 1,281.45 1,138.12 1,068.81
UB - Capitalisation USD 141.97 126.83 119.77
BH - Capitalisation CHF 130.39 118.28 114.81
EBH - Capitalisation CHF 114.88 103.37 /
FBH - Capitalisation CHF 164.79 148.29 142.77
IBH - Capitalisation CHF 122.47 110.66 107.01
IBHP - Capitalisation CHF 120.38 109.99 106.83
UBH - Capitalisation CHF 121.73 110.10 106.56
BH - Capitalisation EUR 134.55 121.81 118.01
CBH - Capitalisation EUR 114.49 104.36 101.81
EAH - Distribution EUR 116.25 104.41 100.57
EBH - Capitalisation EUR 116.49 104.62 100.53
FBH - Capitalisation EUR 172.95 155.25 149.19
IBH - Capitalisation EUR 1,309.92 1,181.04 1,139.63
IBHP - Capitalisation EUR 121.99 111.26 107.87
MAH - Distribution EUR 1,165.13 1,046.24 1,005.33
UAH - Distribution EUR 116.19 104.86 101.28
UBH - Capitalisation EUR 125.01 112.82 108.97
Number of shares outstanding At the end of the year At the beginning of
the year
Number of shares
issued
Number of shares
redeemed
B - Capitalisation USD 176,660.892 136,571.356 62,685.299 22,595.763
EB - Capitalisation USD 428,772.168 297,992.952 243,790.563 113,011.347
FB - Capitalisation USD 1,013,347.307 576,011.056 719,089.712 281,753.461
IB - Capitalisation USD 68,949.647 85,228.563 10,500.000 26,778.916
MBH - Capitalisation USD 127,578.115 124,343.807 7,145.000 3,910.692
UB - Capitalisation USD 115,886.881 116,637.147 25,117.046 25,867.312
BH - Capitalisation CHF 69,738.412 64,930.522 11,340.634 6,532.744
EBH - Capitalisation CHF 2,865,452.231 1,162,722.071 1,791,177.289 88,447.129
FBH - Capitalisation CHF 1,218,210.845 400,577.081 1,010,874.003 193,240.239

CS Investment Funds 1 • Audited Annual Report as at 31.10.2021
Credit Suisse Investment Partners (Lux) Global Convertible Bond Fund (previously Credit Suisse (Lux) AgaNola Global Convertible Bond Fund)
Page 26
Statement of Net Assets (in USD) and Fund Evolution (Continued)
The notes are an integral part of the financial statements.
Number of shares outstanding At the end of the year At the beginning of
the year
Number of shares
issued
Number of shares
redeemed
IBH - Capitalisation CHF 236,402.320 221,961.842 64,399.000 49,958.522
IBHP - Capitalisation CHF 151,945.172 170,257.790 12,265.000 30,577.618
UBH - Capitalisation CHF 652,129.108 705,792.793 72,786.284 126,449.969
BH - Capitalisation EUR 550,696.032 501,627.315 124,196.356 75,127.639
CBH - Capitalisation EUR 3,349.942 4,389.267 379.422 1,418.747
EAH - Distribution EUR 2,037,441.035 2,177,718.812 291,180.769 431,458.546
EBH - Capitalisation EUR 82,934.115 26,345.630 60,059.818 3,471.333
FBH - Capitalisation EUR 1,123,627.525 392,188.439 881,061.543 149,622.457
IBH - Capitalisation EUR 25,040.270 36,406.288 13,221.000 24,587.018
IBHP - Capitalisation EUR 31,790.336 37,491.680 5,000.000 10,701.344
MAH - Distribution EUR 155,140.585 177,836.811 55,247.134 77,943.360
UAH - Distribution EUR 12,257.670 13,111.700 1,732.670 2,586.700
UBH - Capitalisation EUR 699,927.391 660,830.969 168,602.164 129,505.742

CS Investment Funds 1 • Audited Annual Report as at 31.10.2021
Credit Suisse Investment Partners (Lux) Global Convertible Bond Fund (previously Credit Suisse (Lux) AgaNola Global Convertible Bond Fund)
Page 27
Statement of Operations / Changes in Net Assets (in USD)
The notes are an integral part of the financial statements.
For the period from
01.11.2020 to 31.10.2021
Net assets at the beginning of the year 1,427,555,925.31
Income
Interest on investments in securities (net) 5,637,543.80
Dividends (net) 1,929,387.35
Bank Interest 867.86
Securities lending income 479,680.78
Other income 18,530.24
8,066,010.03
Expenses
Management fee 9,480,428.83
Performance fee 355,594.47
Depositary fee 1,025,121.76
Administration expenses 1,249,477.31
Printing and publication expenses 31,180.36
Interest and bank charges 104,951.33
Audit, control, legal, representative bank and other expenses 1,424,891.04
"Taxe d'abonnement" 351,769.41
14,023,414.51
Net income (loss) -5,957,404.48
Realised gain (loss)
Net realised gain (loss) on sales of investments 116,149,059.33
Net realised gain (loss) on forward foreign exchange contracts -13,229,432.63
Net realised gain (loss) on foreign exchange 4,111,986.10
107,031,612.80
Net realised gain (loss) 101,074,208.32
Change in net unrealised appreciation (depreciation)
Change in net unrealised appreciation (depreciation) on investments 43,128,800.17
Change in net unrealised appreciation (depreciation) on forward foreign exchange contracts 12,776,386.54
55,905,186.71
Net increase (decrease) in net assets as a result of operations 156,979,395.03
Subscriptions / Redemptions
Subscriptions 994,109,701.14
Redemptions -426,540,099.40
567,569,601.74
Distribution -286,886.46
Net assets at the end of the year 2,151,818,035.62

CS Investment Funds 1 • Audited Annual Report as at 31.10.2021
Credit Suisse Investment Partners (Lux) Global Convertible Bond Fund (previously Credit Suisse (Lux) AgaNola Global Convertible Bond Fund)
Page 28
Statement of Investments in Securities
The notes are an integral part of the financial statements. Any differences in the percentage of Net Assets are the result of roundings.
Breakdown by Country
USA 23.25
France 21.69
Netherlands 8.64
Germany 5.90
Luxembourg 5.84
Switzerland 4.31
Cayman Islands 4.29
Japan 4.21
Hong Kong 2.44
South Korea 1.80
Virgin Islands (UK) 1.67
Italy 1.64
Spain 1.51
Belgium 1.24
India 1.23
United Kingdom 1.07
People's Republic of China 1.03
Taiwan 0.92
Sweden 0.84
Singapore 0.55
Canada 0.38
Austria 0.36
Jersey 0.22
Denmark 0.17
Bermuda 0.16
New Zealand 0.14
Israel 0.11
Total 95.63
Breakdown by Economic Sector
Financial, investment and other div. companies 18.58
Internet, software and IT services 11.81
Energy and water supply 7.20
Banks and other credit institutions 6.82
Traffic and transportation 6.25
Chemicals 5.61
Petroleum 4.83
Electronics and semiconductors 4.60
Real estate 4.00
Mining, coal and steel industry 3.46
Electrical appliances and components 2.93
Aeronautic and astronautic industry 2.43
Countries and central governments 2.32
Telecommunication 2.11
Rubber and tires 1.86
Computer hardware and networking 1.55
Textiles, garments and leather goods 1.40
Vehicles 1.36
Pharmaceuticals, cosmetics and medical products 1.32
Building materials and building industry 1.08
Retailing, department stores 0.96
Food and soft drinks 0.86
Tobacco and alcoholic beverages 0.57
Non-ferrous metals 0.50
Biotechnology 0.39
Precious metals and precious stones 0.38
Miscellaneous services 0.23
Lodging and catering industry, leisure facilities 0.21
Total 95.63
Statement of Investments in Securities
Description
Quantity /
Nominal
Valuation
(in USD)
% of net
assets
Securities listed on a stock exchange or other organised
markets
Shares
EUR CA-IMMOBILIEN-ANLAGEN AG RTS 4,000,000 0.00 0.00USD CHARTER COMMUNICATIONS A 3,000 2,024,670.00 0.09HKD CHINA MODERN DAIRY HOLDINGS 7,500,000 1,417,269.06 0.07USD ILLUMINA 8,000 3,320,480.00 0.15JPY SONY 180,000 20,742,816.61 0.96HKD WUXI APPTEC CO LTD -H- 355,624 7,602,510.34 0.35
Total Shares 35,107,746.01 1.63
Bonds
EUR ADIDAS AG CV 0.05%/18-12.09.2023 4,400,000 6,037,109.40 0.28USD ADM AG HOLDING LTD CV 0%/20-260823 10,000,000 10,509,600.00 0.49USD AKAMAI TECHNOLOGIES INC CV 0.375%/19-
010927 5,000,000 5,503,700.00 0.26
EUR AMADEUS IT GROUP SA CV 1.5%/20-090425 18,000,000 27,713,313.81 1.29EUR AMERICA MOVIL BV CV 0%/21-020324 50,000,000 59,130,846.00 2.75USD ARES CAPITAL CORP CV 3.75%/17-010222 22,000,000 24,619,980.00 1.14USD ASAHI REFINING US INC CV 0%/21-160326 3,000,000 3,071,640.00 0.14EUR ATOS SE CV 0%/19-061124 16,000,000 19,896,182.64 0.92USD BANK OF AMERICA CORP S L CV 7.25%/PERPET 30,000 43,152,300.00 2.01USD BASF 0.925%/17-090323 15,000,000 15,054,150.00 0.70USD BENTLEY SYSTEMS CV 144A 0.375%/21-010727 5,000,000 5,071,050.00 0.24USD BHARTI AIRTEL LTD CV 1.5%/20-170225 20,000,000 26,528,800.00 1.23USD BOOKING HOLDINGS INC CV 0.75%/20-010525 30,000,000 44,574,600.00 2.07GBP BP CAPITAL MKTS CV 1%/16-280423 12,000,000 17,080,389.89 0.79USD BRENNTAG FINANCE CV 1.875%/15-021222 18,500,000 22,248,100.00 1.03USD CARREFOUR SA CV 0%/18-270324 20,000,000 20,606,200.00 0.96EUR CELLNEX TELECOM S.A. CV 0.5%/19-050728 3,000,000 4,711,130.03 0.22CHF CEMBRA MONEY BANK AG CV 0%/19-090726 5,000,000 5,370,915.23 0.25USD CIE GEN ETABLIS MICHELIN CV 0%/18-101123 26,000,000 26,681,980.00 1.24EUR CITIGROUP CV 0.5%/16-040823 23,000,000 29,561,094.89 1.37HKD CITIGROUP GLOB MK L S960 CV 0%/20-250724 130,000,000 18,183,684.15 0.85HKD CITIGROUP GLOB MKT FND L CV 0%/21-280524 95,000,000 13,309,326.27 0.62USD CYBERARK SOFTWARE LTD CV 0%/19-151124 1,000,000 1,296,110.00 0.06EUR DEUTSCHE POST AG CV 0.05%/17-300625 27,000,000 36,900,918.29 1.71EUR DIASORIN SPA CV 0%/21-050528 4,000,000 5,461,849.68 0.25USD DROPBOX INC CV 144A 0%/21-010328 3,000,000 3,291,780.00 0.15EUR EDENRED CV 0%/19-060924 80,000 5,801,988.60 0.27EUR EDENRED CV 0%/21-140628 390,000 29,464,464.51 1.37EUR ELECTRICITE DE FRANCE SA CV 0%/20-
14.09.2024 4,800,000 83,594,185.20 3.88
EUR ELIOTT CAPITAL SARL CV 0%/19-301222 24,000,000 27,805,106.88 1.29EUR ENGIE SA CV 0%/21-020624 110,000 10,788,590.42 0.50USD EURONET WORLDWIDE INC CV 0.75%/19-
150349 5,000,000 5,368,300.00 0.25
USD EXPEDIA GROUP INC CV 144A 0%/21-150226 13,000,000 14,031,160.00 0.65USD FIRST MAJESTIC SILVER CV 1.875%/18-01032 2,000,000 2,967,800.00 0.14USD FORD MOTOR COMPANY CV 144A 0%/21-
150326 3,000,000 3,538,170.00 0.16
EUR GEELY SWEDEN FINANCE AB CV 0%/19-190624 12,000,000 18,112,675.23 0.84USD GLENCORE FUNDING LLC CV 0%/18-270325 24,000,000 24,926,640.00 1.16USD GLOBALWAFERS CO LTD CV 0%/21-010626 3,000,000 3,116,700.00 0.14EUR GN STORE NORD CV 0%/19-210524 3,000,000 3,748,413.76 0.17EUR GRAND CITY PR REG S CV 0.25%/16-020322 7,000,000 8,264,709.18 0.38USD GSK FINANCE NO 3 LTD CV 0%/20-220623 6,000,000 5,897,700.00 0.27USD HON HAI PRECISION INDUST CV 0%/21-050826 16,100,000 16,581,712.00 0.77EUR IBERDROLA CV 0%/15-111122 23,500,000 33,621,370.16 1.56USD ILLUMINA INC CV 0%/18-150823 11,000,000 12,973,620.00 0.60EUR IMMOFINANZ REG S CV 2%/17-240124 6,000,000 7,758,180.86 0.36USD JAZZ INVESTMENTS I LTD CV 2%/20-150626 3,000,000 3,497,190.00 0.16USD JOHN BEAN TECHNOLOGIES C 0.25%/21-
150526 3,000,000 3,277,980.00 0.15
EUR JP MORGAN CHASE BANK NA CV 0%/21-100624 14,000,000 17,931,496.17 0.83EUR JP MORGAN CHASE BANK NA CV 0%/21-180224 15,000,000 19,337,821.09 0.90USD JPMORGAN CHASE BANK NA 0%/19-070822 4,000,000 4,675,840.00 0.22USD JPMORGAN CHASE FINANCIAL S A CV 0.25%/18 20,000,000 22,727,000.00 1.06EUR KERING CV 0%/19-300922 15,000,000 20,887,089.53 0.97EUR LAGFIN SCA CV 2%/20-020725 3,000,000 4,484,702.50 0.21USD LCI INDUSTRIES CV 144A 1.125%/21-150526 3,000,000 3,154,260.00 0.15EUR LEG IMMOBILIEN AG CV 0.4%/20-300628 23,500,000 28,744,151.61 1.34EUR LEG IMMOBILIEN CV 0.875%/17-010925 9,000,000 12,979,276.25 0.60USD LENOVO GROUP LTD CV 3.375%/19-24.01.2024 24,000,000 33,365,040.00 1.55USD LIBERTY BROADBAND CV144A 1.25%/20-
300950 4,000,000 4,014,720.00 0.19
USD LIVEPERSON INC CV -144A- 0%/20-15.12.2026 3,000,000 2,937,510.00 0.14USD LIVONGO HEALTH CV 0.875%/20-010625 1,000,000 1,461,050.00 0.07USD LUMENTUM HOLDINGS INC CV 0.5%/19-151226 3,000,000 3,270,750.00 0.15USD MARRIOTT VACATION WORLDW CV 144A 0%/21-
150126 4,000,000 4,509,480.00 0.21
JPY MEDICAL HOLDINGS CV 0%/17-071022 200,000,000 1,808,322.48 0.08JPY MERCARI INC CV 0%/21-140728 300,000,000 2,830,773.55 0.13USD MICHELIN CV 0%/17-100122 13,000,000 13,323,310.00 0.62EUR MONDELEZ INTL HLDINGS NE CV 0%/21-200924 14,400,000 17,012,852.60 0.79USD MP MATERIALS COR CV 144A 0.25%/21-010426 3,000,000 3,170,460.00 0.15EUR NEXI SPA CV 0%/21-240228 1,500,000 1,641,842.65 0.08USD NEXTERA ENERGY PARTNERS CV 0%/20-151125 4,000,000 4,642,840.00 0.22USD NICE LTD CV 0%/20-150925 1,000,000 1,174,920.00 0.05JPY NIPPON STEEL CORP CV 0%/21-041024 1,000,000,000 9,075,026.12 0.42JPY NIPPON STEEL CORP CV 0%/21-051026 4,400,000,000 40,381,208.91 1.88USD OKTA INC CV 0.375%/20-150626 1,000,000 1,253,220.00 0.06EUR OLIVER CAPITAL SARL CV 0%/20-291223 18,000,000 24,145,465.77 1.12

CS Investment Funds 1 • Audited Annual Report as at 31.10.2021
Credit Suisse Investment Partners (Lux) Global Convertible Bond Fund (previously Credit Suisse (Lux) AgaNola Global Convertible Bond Fund)
Page 29
Statement of Investments in Securities (Continued)
The notes are an integral part of the financial statements. Any differences in the percentage of Net Assets are the result of roundings.
Description
Quantity /
Nominal
Valuation
(in USD)
% of net
assets
USD OMNICELL INC CV 0.25%/20-150925 1,000,000 1,868,540.00 0.09USD ON SEMICONDUCTOR CORP CV 0%/21-010527 3,000,000 3,639,330.00 0.17EUR ORPAR CV 0%/17-200624 3,000,000 4,342,881.51 0.20USD PACIRA PHARMACEUTICALS CV 0.75%/20-01082 1,000,000 1,055,490.00 0.05GBP PHP FINANCE LIMITED CV 2.875%/19-150725 3,000,000 4,752,790.91 0.22USD PIONEER NATURAL RESOURCE CV 0.25%/20-
150525 40,000,000 71,019,600.00 3.30
EUR PIRELLI & C SPA CV 0%/20-221225 2,000,000 2,467,673.61 0.11EUR POSCO CV 0%/21-010926 33,000,000 38,695,639.46 1.80EUR PRYSMIAN SPA CV 0%/21-020226 4,000,000 4,866,606.57 0.23USD QIAGEN NV CV 0%/20-171227 800,000 863,272.00 0.04EUR REMY COINTREAU CV 0.125%/16-070926 60,000 12,266,873.15 0.57EUR SAFRAN SA CV 0%/21-010428 4,500 950,105.14 0.04EUR SAFRAN SA CV 0.875%/20-150527 320,000 52,199,566.56 2.43EUR SAGERPAR CV 0%/21-010426 17,000,000 20,263,840.97 0.94EUR SCHNEIDER ELECTRIC SE CV 0%/20-150626 120,000 27,967,584.78 1.30EUR SELENA SARL CV 0%/20-250625 80 11,606,939.76 0.54EUR SGX TREASURY I PTE LTD CV 0%/21-010324 7,900,000 9,322,834.93 0.43USD SHANGHAI PORT CV 0%/17-090822 4,000,000 4,542,360.00 0.21JPY SHIP HEALTHCARE HLDN CV 0%/18-131223 400,000,000 4,210,619.88 0.20CHF SIKA AG CV 0.15%/18-050625 45,000,000 80,953,619.06 3.76SGD SINGAPORE AIR LTD CV 1.625%/20-031225 3,000,000 2,501,226.19 0.12EUR SNAM 0% CV 17-200322 17,000,000 20,855,809.06 0.97USD SOLAR EDGE TECHNOLOGIES CV 0%/20-150925 1,000,000 1,481,860.00 0.07USD SOUTHWEST AIRLINES CO CV 1.25%/20-010525 54,000,000 75,950,460.00 3.53USD SQUARE INC CV 144A 0%/20-010526 3,000,000 3,543,570.00 0.16USD SSR MINING INC CV 2.5%/19-010439 4,400,000 5,169,340.00 0.24USD STMICROELECTRONICS NV S B CV 0%/040827 41,000,000 53,077,370.00 2.47JPY SUMITOMO METAL MINING CV 0%/18-150323 500,000,000 4,393,334.17 0.20CHF SWISS PRIME SITE AG CV 0.325%/18-160125 4,000,000 4,476,218.70 0.21EUR TAG IMMOBILIEN AG CV 0.625%/20-270826 20,000,000 23,883,556.95 1.11USD TOTAL CV 0.5%/15-02122022 32,000,000 32,838,080.00 1.53EUR UMICORE SA CV 0%/20-230625 5,000,000 6,433,037.03 0.30USD UNIVERSE TREK LTD CV 0%/21-150626 10,000,000 9,656,000.00 0.45USD UNIVERSE TREK LTD CV 2.5%/20-080725 10,000,000 11,134,900.00 0.52EUR VEOLIA ENVIRONNEMENT SA CV 0%/19-010125 800,000 31,854,000.60 1.48USD VINCI CV 0.375%/17-160222 18,000,000 20,076,480.00 0.93EUR WORLDLINE SA/FRANCE CV 0%/19-30.07.2026 255,000 30,676,695.46 1.43EUR WORLDLINE SA/FRANCE CV 0%/20-300725 80,000 10,895,092.14 0.51USD XERO INVESTMENTS LTD CV 0%/20-021225 3,000,000 3,086,730.00 0.14USD XIAOMI BEST TIME INTL CV 0%/20-171227 19,000,000 19,091,580.00 0.89EUR ZALANDO SE CV 0.05%/20-06.08.2025 2,400,000 3,264,278.22 0.15EUR ZHEJIANG EXPRESSWAY CO CV 0%/21-200126 12,000,000 14,648,979.69 0.68HKD ZHONGSHENG GROUP CV 0%/20-210525 125,000,000 25,814,061.51 1.20
Total Bonds 1,898,302,664.32 88.22
Total securities listed on a stock exchange or other
organised markets 1,933,410,410.33 89.85
Securities not listed on a stock exchange
Bonds
CHF IDORSIA LTD CV 2.125%/21-040828 2,000,000 2,035,639.80 0.09USD MEITUAN CV/21-270428 65,000,000 65,174,200.00 3.03JPY MENICON CO LTD CV 0%/21-290125 400,000,000 4,352,378.25 0.20JPY NIPRO CORPORATION CV 0%/21-250926 300,000,000 2,717,535.24 0.13
Total Bonds 74,279,753.29 3.45
Total securities not listed on a stock exchange 74,279,753.29 3.45
Money market instruments
USD TREASURY BILL 0%/21-161221 25,000,000 24,997,566.72 1.16USD TREASURY BILL 0%/21-261121 25,000,000 24,999,154.14 1.16
Total money market instruments 49,996,720.86 2.32
Total of Portfolio 2,057,686,884.48 95.63
Cash at banks and at brokers 83,262,406.79 3.87
Other net assets 10,868,744.35 0.50
Total net assets 2,151,818,035.62 100.00

CS Investment Funds 1 • Audited Annual Report as at 31.10.2021
Credit Suisse (Lux) Financial Bond Fund Page 30
Technical Data and Notes
Technical Data
Valoren ISIN Management Fee Total Expense Ratio
EA - Distribution EUR 48071882 LU2001707095 0.40% 0.56%
EB - Capitalisation EUR 26495906 LU1160527336 0.40% 0.56%
IA - Distribution EUR 48071884 LU2001706444 0.50% 0.70%
IB - Capitalisation EUR 26493403 LU1160526791 0.50% 0.70%
MB - Capitalisation EUR 31143113 LU1348933547 0.25% 0.41%
QB - Capitalisation EUR 26495929 LU1160527849 1.00% 1.20%
DBH - Capitalisation CHF 27433640 LU1203073041 0.00% 0.15%
EBH - Capitalisation CHF 26495909 LU1160527500 0.40% 0.64%
QBH - Capitalisation CHF 26495932 LU1160528144 1.00% 1.28%
DBH - Capitalisation GBP 55610163 LU2196418771 0.00% /
IAH - Distribution GBP 49857194 LU2050655047 0.50% 0.78%
UAH - Distribution GBP 49150509 LU2034323647 0.50% 0.77%
DAH - Distribution USD 49408615 LU2039695205 0.00% 0.15%
DBH - Capitalisation USD 28325639 LU1238154758 0.00% 0.15%
EBH - Capitalisation USD 26495920 LU1160527682 0.40% 0.64%
IAH - Distribution USD 48073327 LU2001707251 0.50% 0.78%
IBH - Capitalisation USD 26495435 LU1160527252 0.50% 0.78%
QAH - Distribution USD 48073284 LU2001707509 1.00% 1.28%
QBH - Capitalisation USD 26495939 LU1160528490 1.00% 1.28%
UAH - Distribution USD 49133934 LU2034323217 0.50% 0.77%
There is no management fee for -DAH- and -DBH- share classes. Credit Suisse (Lux) Financial Bond Fund -DBH- GBP was closed on 26.03.2021.
Fund Performance
YTD Since Inception 2020 2019 2018
EA - Distribution EUR 4.34% 13.84% 4.24% / /
EB - Capitalisation EUR 4.34% 25.44% 4.24% 17.35% /
IA - Distribution EUR 4.22% 17.57% 4.07% / /
IB - Capitalisation EUR 4.22% 17.60% 4.10% / /
MB - Capitalisation EUR 4.47% 5.49% / / /
QB - Capitalisation EUR 3.79% / 3.57% 16.66% -5.27%
DBH - Capitalisation CHF 4.54% 14.01% 4.44% / /
EBH - Capitalisation CHF 4.11% 13.54% 3.92% / /
QBH - Capitalisation CHF 3.56% / 3.26% 16.16% -5.74%
DBH - Capitalisation GBP / / / / /
IAH - Distribution GBP 4.69% 13.21% 3.49% / /
UAH - Distribution GBP 4.69% 10.66% / / /
DAH - Distribution USD 5.36% 20.25% 6.80% / /
DBH - Capitalisation USD 5.38% / 6.89% 21.52% -1.48%
EBH - Capitalisation USD 4.95% 18.77% 6.36% / /
IAH - Distribution USD 4.60% 22.06% 6.08% / /
IBH - Capitalisation USD 4.83% 22.38% 6.17% / /
QAH - Distribution USD 4.17% 13.76% 5.59% / /
QBH - Capitalisation USD 4.39% / 5.68% 20.01% -2.66%
UAH - Distribution USD 4.82% 12.48% / / /
Distribution
Ex-Date Amount
EA - Distribution EUR 01.12.2020 11.58
EA - Distribution EUR 02.03.2021 11.09
EA - Distribution EUR 01.06.2021 11.23
EA - Distribution EUR 07.09.2021 11.54
IA - Distribution EUR 01.12.2020 11.52
IA - Distribution EUR 02.03.2021 11.02
IA - Distribution EUR 01.06.2021 11.14
IA - Distribution EUR 07.09.2021 11.46
IAH - Distribution GBP 01.12.2020 12.22
IAH - Distribution GBP 02.03.2021 11.67
IAH - Distribution GBP 01.06.2021 12.19
IAH - Distribution GBP 07.09.2021 12.41
UAH - Distribution GBP 01.12.2020 1.22
UAH - Distribution GBP 02.03.2021 1.16
UAH - Distribution GBP 01.06.2021 1.22
UAH - Distribution GBP 07.09.2021 1.24
DAH - Distribution USD 01.12.2020 14.61

CS Investment Funds 1 • Audited Annual Report as at 31.10.2021
Credit Suisse (Lux) Financial Bond Fund Page 31
Technical Data and Notes (Continued)
Distribution
DAH - Distribution USD 02.03.2021 14.73
DAH - Distribution USD 01.06.2021 14.62
DAH - Distribution USD 07.09.2021 14.65
IAH - Distribution USD 01.12.2020 13.27
IAH - Distribution USD 02.03.2021 13.26
IAH - Distribution USD 01.06.2021 13.15
IAH - Distribution USD 07.09.2021 13.17
QAH - Distribution USD 01.12.2020 11.58
QAH - Distribution USD 02.03.2021 11.48
QAH - Distribution USD 01.06.2021 11.35
QAH - Distribution USD 07.09.2021 11.39
UAH - Distribution USD 01.12.2020 1.27
UAH - Distribution USD 02.03.2021 1.27
UAH - Distribution USD 01.06.2021 1.26
UAH - Distribution USD 07.09.2021 1.27
Notes
Forward foreign exchange contracts
Purchases Sales Maturity Valuation
Counterparty (In EUR)
EUR 12,298 CHF -13,000 09.11.2021 3.09
Credit Suisse (Schweiz) AG - Zurich - Switzerland
EUR 2,411,669 USD -2,791,500 09.11.2021 -12.50
Credit Suisse (Schweiz) AG - Zurich - Switzerland
CHF 59,600 EUR -55,873 09.11.2021 495.99
Credit Suisse (Schweiz) AG - Zurich - Switzerland
EUR 104,048 USD -121,500 09.11.2021 -920.59
Credit Suisse (Schweiz) AG - Zurich - Switzerland
EUR 254,776 CHF -271,100 09.11.2021 -1,627.10
Credit Suisse (Schweiz) AG - Zurich - Switzerland
EUR 258,669 USD -300,300 09.11.2021 -771.14
Credit Suisse (Schweiz) AG - Zurich - Switzerland
EUR 4,673 CHF -5,000 09.11.2021 -55.91
Credit Suisse (Schweiz) AG - Zurich - Switzerland
EUR 16,981 CHF -18,200 09.11.2021 -232.02
Credit Suisse (Schweiz) AG - Zurich - Switzerland
EUR 146,978 USD -170,200 09.11.2021 -64.26
Credit Suisse (Schweiz) AG - Zurich - Switzerland
CHF 42,400 EUR -39,514 09.11.2021 587.34
Credit Suisse (Schweiz) AG - Zurich - Switzerland
EUR 44,659 USD -51,600 09.11.2021 80.11
Credit Suisse (Schweiz) AG - Zurich - Switzerland
USD 5,200 EUR -4,491 09.11.2021 1.47
Credit Suisse (Schweiz) AG - Zurich - Switzerland
CHF 39,700 EUR -37,033 09.11.2021 514.63
Credit Suisse (Schweiz) AG - Zurich - Switzerland
CHF 112,300 EUR -104,788 09.11.2021 1,424.36
Credit Suisse (Schweiz) AG - Zurich - Switzerland
USD 1,000,000 EUR -861,827 09.11.2021 2,110.32
JP Morgan Securities PLC - London - United Kingdom
EUR 277,045 CHF -300,000 09.11.2021 -6,690.58
Credit Suisse (Schweiz) AG - Zurich - Switzerland
GBP 1,100,000 EUR -1,287,387 09.11.2021 15,285.48
Credit Suisse (Schweiz) AG - Zurich - Switzerland
EUR 6,823,813 USD -8,000,000 09.11.2021 -87,705.68
UBS AG London Branch - London - United Kingdom

CS Investment Funds 1 • Audited Annual Report as at 31.10.2021
Credit Suisse (Lux) Financial Bond Fund Page 32
Technical Data and Notes (Continued)
Forward foreign exchange contracts
Purchases Sales Maturity Valuation
Counterparty (In EUR)
EUR 3,965,727 GBP -3,400,000 09.11.2021 -60,727.18
UBS AG London Branch - London - United Kingdom
CHF 613,700 EUR -565,406 09.11.2021 15,023.39
Credit Suisse (Schweiz) AG - Zurich - Switzerland
GBP 6,300 EUR -7,324 09.11.2021 136.87
Credit Suisse (Schweiz) AG - Zurich - Switzerland
EUR 18,743,486 USD -22,000,000 09.11.2021 -263,195.96
JP Morgan Securities PLC - London - United Kingdom
EUR 196,173,600 USD -232,000,000 09.11.2021 -4,260,810.92
Credit Suisse (Schweiz) AG - Zurich - Switzerland
USD 184,903,100 EUR -156,349,598 09.11.2021 3,395,142.73
Credit Suisse (Schweiz) AG - Zurich - Switzerland
CHF 47,970,000 EUR -44,738,369 09.11.2021 631,055.90
Credit Suisse (Schweiz) AG - Zurich - Switzerland
EUR 14,176,010 CHF -15,200,000 09.11.2021 -199,944.21
Credit Suisse (Schweiz) AG - Zurich - Switzerland
EUR 142,932,432 GBP -121,500,000 09.11.2021 -953,842.25
Credit Suisse (Schweiz) AG - Zurich - Switzerland
GBP 4,019,900 EUR -4,729,005 09.11.2021 31,552.17
Credit Suisse (Schweiz) AG - Zurich - Switzerland
EUR 1,887,359 USD -2,192,300 09.11.2021 -6,652.44
Credit Suisse (Schweiz) AG - Zurich - Switzerland
EUR 857,361 USD -998,800 09.11.2021 -5,540.90
Credit Suisse (Schweiz) AG - Zurich - Switzerland
EUR 4,126 CHF -4,400 09.11.2021 -35.51
Credit Suisse (Schweiz) AG - Zurich - Switzerland
EUR 102,156 USD -119,000 09.11.2021 -652.26
Credit Suisse (Schweiz) AG - Zurich - Switzerland
EUR 44,817 CHF -48,000 09.11.2021 -580.38
Credit Suisse (Schweiz) AG - Zurich - Switzerland
CHF 76,800 EUR -71,598 09.11.2021 1,038.97
Credit Suisse (Schweiz) AG - Zurich - Switzerland
USD 39,600 EUR -34,122 09.11.2021 90.06
Credit Suisse (Schweiz) AG - Zurich - Switzerland
CHF 58,900 EUR -54,997 09.11.2021 710.21
Credit Suisse (Schweiz) AG - Zurich - Switzerland
EUR 294,819 GBP -250,300 09.11.2021 -1,598.67
UBS AG London Branch - London - United Kingdom
EUR 5,984,353 USD -6,921,700 09.11.2021 4,436.88
UBS AG London Branch - London - United Kingdom
GBP 1,000,000 EUR -1,175,090 09.11.2021 9,157.41
JP Morgan Securities PLC - London - United Kingdom
EUR 2,152,741 USD -2,500,000 09.11.2021 -7,104.19
UBS AG London Branch - London - United Kingdom
EUR 1,346,481 USD -1,561,900 09.11.2021 -2,904.13
Credit Suisse (Schweiz) AG - Zurich - Switzerland
CHF 73,800 EUR -69,168 09.11.2021 631.60
Credit Suisse (Schweiz) AG - Zurich - Switzerland
EUR 1,103,045 USD -1,279,200 09.11.2021 -2,104.58
Credit Suisse (Schweiz) AG - Zurich - Switzerland
CHF 97,800 EUR -91,600 09.11.2021 898.39
Credit Suisse (Schweiz) AG - Zurich - Switzerland
CHF 35,800 EUR -33,504 09.11.2021 355.34
Credit Suisse (Schweiz) AG - Zurich - Switzerland
EUR 912,629 USD -1,063,300 09.11.2021 -5,997.44
Credit Suisse (Schweiz) AG - Zurich - Switzerland
USD 740,100 EUR -635,341 09.11.2021 4,059.62
Credit Suisse (Schweiz) AG - Zurich - Switzerland

CS Investment Funds 1 • Audited Annual Report as at 31.10.2021
Credit Suisse (Lux) Financial Bond Fund Page 33
Technical Data and Notes (Continued)
Forward foreign exchange contracts
Purchases Sales Maturity Valuation
Counterparty (In EUR)
CHF 13,400 EUR -12,504 09.11.2021 169.11
Credit Suisse (Schweiz) AG - Zurich - Switzerland
USD 99,700 EUR -86,093 09.11.2021 41.65
Credit Suisse (Schweiz) AG - Zurich - Switzerland
CHF 4,500 EUR -4,197 09.11.2021 59.52
Credit Suisse (Schweiz) AG - Zurich - Switzerland
EUR 1,375,337 CHF -1,474,200 09.11.2021 -18,941.77
Citibank N.A.- London - United Kingdom
USD 1,500,000 EUR -1,296,964 09.11.2021 -1,057.75
UBS AG London Branch - London - United Kingdom
GBP 1,000,000 EUR -1,170,760 09.11.2021 13,487.99
JP Morgan Securities PLC - London - United Kingdom
CHF 112,300 EUR -104,803 09.12.2021 1,428.32
Credit Suisse (Schweiz) AG - Zurich - Switzerland
USD 181,997,200 EUR -153,055,738 09.12.2021 4,070,839.37
Credit Suisse (Schweiz) AG - Zurich - Switzerland
CHF 48,583,700 EUR -44,767,495 09.12.2021 1,190,922.43
Credit Suisse (Schweiz) AG - Zurich - Switzerland
GBP 4,026,200 EUR -4,677,940 09.12.2021 87,160.32
Credit Suisse (Schweiz) AG - Zurich - Switzerland
CHF 48,696,000 EUR -45,449,667 11.01.2022 621,040.18
Credit Suisse (Schweiz) AG - Zurich - Switzerland
GBP 4,026,200 EUR -4,723,691 11.01.2022 37,425.68
Credit Suisse (Schweiz) AG - Zurich - Switzerland
USD 175,392,700 EUR -151,412,973 11.01.2022 -145,733.92
Credit Suisse (Schweiz) AG - Zurich - Switzerland
Net unrealised gain on forward foreign exchange contracts 4,101,862.66
Swaps contracts
Type Payable Receivable Maturity Valuation
Counterparty Nominal Nominal (in EUR)
IRS EUR 10,000,000 -0.3643 EUR 10,000,000 6M EURIBOR 27.08.2026 187,271.00
Credit Suisse International - London - United Kingdom
IRS EUR 10,000,000 -0.1753 EUR 10,000,000 6M EURIBOR 24.03.2028 188,168.00
Credit Suisse International - London - United Kingdom
IRS EUR 25,000,000 -0.2778 EUR 25,000,000 6M EURIBOR 13.08.2028 677,189.00
Credit Suisse International - London - United Kingdom
IRS EUR 5,000,000 -0.1488 EUR 5,000,000 6M EURIBOR 10.09.2029 127,935.00
Credit Suisse International - London - United Kingdom
IRS EUR 20,000,000 -0.1443 EUR 20,000,000 6M EURIBOR 17.06.2030 597,911.00
Credit Suisse International - London - United Kingdom
IRS EUR 20,000,000 -0.1203 EUR 20,000,000 6M EURIBOR 18.06.2030 555,868.00
Credit Suisse International - London - United Kingdom
IRS EUR 10,000,000 0.0517 EUR 10,000,000 6M EURIBOR 24.03.2031 181,930.00
Credit Suisse International - London - United Kingdom
IRS USD 19,000,000 1.1222 USD 19,000,000 USD-SOFR-OIS-COMPOUND/1D
21.09.2031 260,002.59
Credit Suisse International - London - United Kingdom
Net unrealised gain on swaps contracts 2,776,274.59

CS Investment Funds 1 • Audited Annual Report as at 31.10.2021
Credit Suisse (Lux) Financial Bond Fund Page 34
Statement of Net Assets (in EUR) and Fund Evolution
* Cash at banks and at brokers include: EUR 2,931,627.77 held as cash collateral with Credit Suisse International London. The notes are an integral part of the financial statements.
31.10.2021
Assets
Investments in securities at market value 992,743,097.29Cash at banks and at brokers* 21,007,503.28Income receivable 12,856,547.35Net unrealised gain on swaps contracts 2,776,274.59Net unrealised gain on forward foreign exchange contracts 4,101,862.66Other assets 665.42
1,033,485,950.59
Liabilities
Due to banks and to brokers 2,379,689.83Provisions for accrued expenses 477,458.68
2,857,148.51
Net assets 1,030,628,802.08
Fund Evolution 31.10.2021 31.10.2020 31.10.2019
Total net assets EUR 1,030,628,802.08 793,650,483.05 385,680,163.20
Net asset value per share
EA - Distribution EUR 1,047.81 973.79 1,018.74
EB - Capitalisation EUR 1,254.38 1,116.31 1,122.54
IA - Distribution EUR 1,074.80 998.90 1,049.57
IB - Capitalisation EUR 1,175.95 1,047.97 1,055.26
MB - Capitalisation EUR 1,054.89 937.38 /
QB - Capitalisation EUR 1,440.45 1,290.10 1,305.64
DBH - Capitalisation CHF 1,140.11 1,012.11 1,016.11
EBH - Capitalisation CHF 1,135.37 1,012.87 1,022.02
QBH - Capitalisation CHF 1,390.06 1,248.06 1,267.43
DBH - Capitalisation GBP / 993.69 /
IAH - Distribution GBP 1,033.17 960.12 1,015.27
UAH - Distribution GBP 103.55 96.21 /
DAH - Distribution USD 1,068.83 992.66 1,034.56
DBH - Capitalisation USD 1,681.45 1,477.75 1,445.27
EBH - Capitalisation USD 1,187.70 1,049.04 1,031.17
IAH - Distribution USD 1,086.27 1,009.32 1,057.08
IBH - Capitalisation USD 1,223.81 1,082.45 1,065.91
QAH - Distribution USD 1,046.03 971.80 1,003.37
QBH - Capitalisation USD 1,613.53 1,434.25 1,418.91
UAH - Distribution USD 104.74 97.28 /
Number of shares outstanding At the end of the year At the beginning of
the year
Number of shares
issued
Number of shares
redeemed
EA - Distribution EUR 22,105.279 20,834.279 2,410.000 1,139.000
EB - Capitalisation EUR 42,740.713 51,989.974 12,700.596 21,949.857
IA - Distribution EUR 54,004.900 53,402.841 25,672.757 25,070.698
IB - Capitalisation EUR 85,920.488 94,600.840 48,502.056 57,182.408
MB - Capitalisation EUR 145,383.978 80,639.563 67,101.533 2,357.118
QB - Capitalisation EUR 22,491.908 23,370.516 13,402.688 14,281.296
DBH - Capitalisation CHF 3,592.178 12,490.759 1,101.419 10,000.000
EBH - Capitalisation CHF 120,402.950 11,604.000 134,408.875 25,609.925
QBH - Capitalisation CHF 3,067.997 3,231.940 337.852 501.795
DBH - Capitalisation GBP 0.000 19,306.483 33,770.762 53,077.245
IAH - Distribution GBP 10,956.375 10,460.138 3,134.581 2,638.344
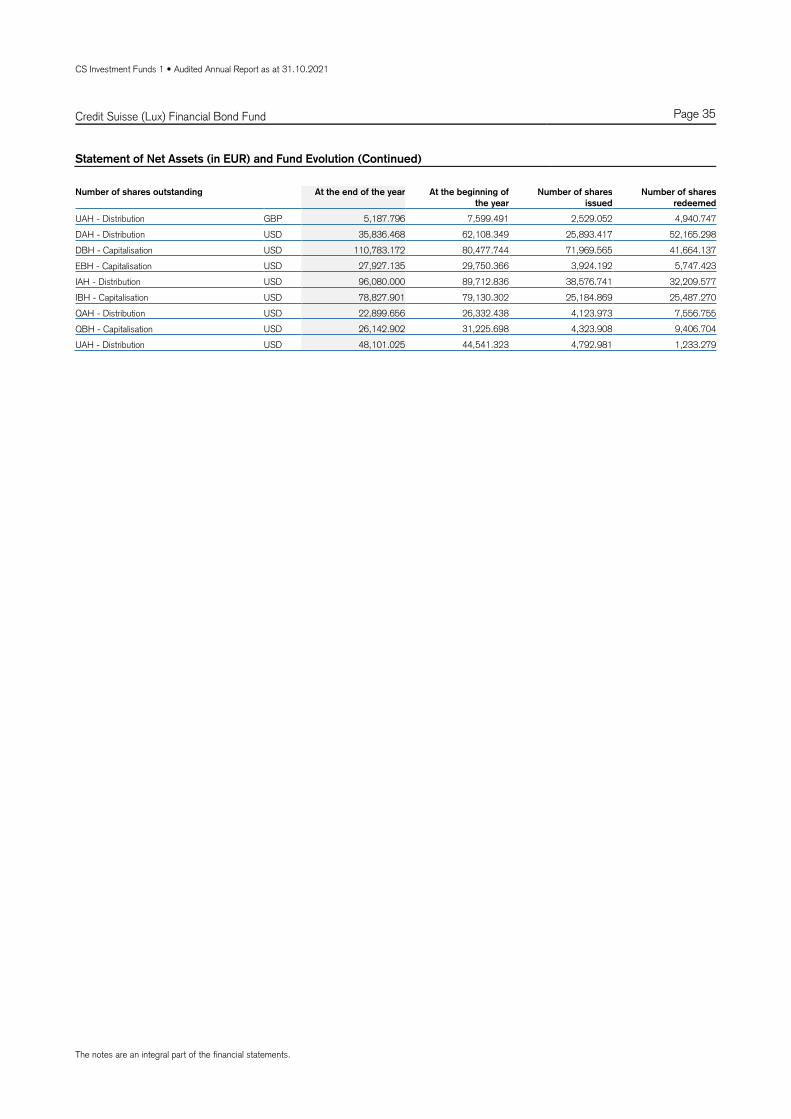
CS Investment Funds 1 • Audited Annual Report as at 31.10.2021
Credit Suisse (Lux) Financial Bond Fund Page 35
Statement of Net Assets (in EUR) and Fund Evolution (Continued)
The notes are an integral part of the financial statements.
Number of shares outstanding At the end of the year At the beginning of
the year
Number of shares
issued
Number of shares
redeemed
UAH - Distribution GBP 5,187.796 7,599.491 2,529.052 4,940.747
DAH - Distribution USD 35,836.468 62,108.349 25,893.417 52,165.298
DBH - Capitalisation USD 110,783.172 80,477.744 71,969.565 41,664.137
EBH - Capitalisation USD 27,927.135 29,750.366 3,924.192 5,747.423
IAH - Distribution USD 96,080.000 89,712.836 38,576.741 32,209.577
IBH - Capitalisation USD 78,827.901 79,130.302 25,184.869 25,487.270
QAH - Distribution USD 22,899.656 26,332.438 4,123.973 7,556.755
QBH - Capitalisation USD 26,142.902 31,225.698 4,323.908 9,406.704
UAH - Distribution USD 48,101.025 44,541.323 4,792.981 1,233.279

CS Investment Funds 1 • Audited Annual Report as at 31.10.2021
Credit Suisse (Lux) Financial Bond Fund Page 36
Statement of Operations / Changes in Net Assets (in EUR)
The notes are an integral part of the financial statements.
For the period from
01.11.2020 to 31.10.2021
Net assets at the beginning of the year 793,650,483.05
Income
Interest on investments in securities (net) 47,474,693.98
Securities lending income 279,745.08
47,754,439.06
Expenses
Management fee 4,022,622.12
Depositary fee 563,518.72
Administration expenses 535,384.51
Printing and publication expenses 19,642.03
Interest and bank charges 178,598.12
Audit, control, legal, representative bank and other expenses 483,650.64
"Taxe d'abonnement" 259,319.79
6,062,735.93
Net income (loss) 41,691,703.13
Realised gain (loss)
Net realised gain (loss) on sales of investments 5,284,300.48
Net realised gain (loss) on swaps contracts -1,171,245.33
Net realised gain (loss) on forward foreign exchange contracts -1,313,064.72
Net realised gain (loss) on foreign exchange -740,945.96
2,059,044.47
Net realised gain (loss) 43,750,747.60
Change in net unrealised appreciation (depreciation)
Change in net unrealised appreciation (depreciation) on investments 68,755,838.07
Change in net unrealised appreciation (depreciation) on swaps contracts 3,739,441.59
Change in net unrealised appreciation (depreciation) on forward foreign exchange contracts 499,818.68
72,995,098.34
Net increase (decrease) in net assets as a result of operations 116,745,845.94
Subscriptions / Redemptions
Subscriptions 564,773,076.24
Redemptions -432,538,437.40
132,234,638.84
Distribution -12,002,165.75
Net assets at the end of the year 1,030,628,802.08

CS Investment Funds 1 • Audited Annual Report as at 31.10.2021
Credit Suisse (Lux) Financial Bond Fund Page 37
Statement of Investments in Securities
The notes are an integral part of the financial statements. Any differences in the percentage of Net Assets are the result of roundings.
Breakdown by Country
United Kingdom 16.73
Netherlands 14.34
France 10.00
Germany 9.99
Spain 8.10
Italy 7.26
Austria 6.91
Switzerland 5.27
Ireland 4.52
Belgium 4.08
Sweden 3.62
Denmark 2.49
Portugal 1.70
Finland 0.98
Luxembourg 0.31
Total 96.32
Breakdown by Economic Sector
Banks and other credit institutions 78.04
Insurance companies 9.43
Financial, investment and other div. companies 7.29
Mortgage and funding institutions (MBS, ABS) 1.56
Total 96.32
Statement of Investments in Securities
Description Quantity /
Nominal
Valuation
(in EUR)
% of net
assets
Securities listed on a stock exchange or other organised
markets
Bonds
EUR ABN AMRO BANK NV FF 17-PERPET 23,000,000 24,986,280.00 2.42EUR ACHMEA BV SUB FF FRN/19-PERPET 17,000,000 18,126,420.00 1.76EUR AEGON NV SUB FF FRN/19-PERPET 12,000,000 14,243,280.00 1.38EUR AGEAS FINANCE NV SUB FF FRN/19-PERPET 16,000,000 16,646,720.00 1.62EUR AIB GROUP PLC SUB FF FRN/19-PERPET 15,500,000 16,510,290.00 1.60EUR AIB GROUP PLC SUB FF FRN/20-PERPET 2,400,000 2,681,448.00 0.26EUR ALLIANZ SE SUB FF FRN/20-PERPET 15,000,000 14,811,900.00 1.44EUR ALLIANZ SE SUB FF FRN/21-PERPET 3,800,000 3,713,588.00 0.36EUR ASR NEDERLAND FF 4.625%/17-PERPET 19,000,000 20,702,780.00 2.01EUR BANCO BILBAO VIZCAY SUB FF FRN/20-PERPET 10,000,000 11,321,900.00 1.10EUR BANCO BILBAO VIZCAYA SUB FF FRN/PERPET 4,000,000 4,325,480.00 0.42EUR BANCO COMERC PORTUG SUB FF FRN/19-
PERPET 5,000,000 5,339,550.00 0.52
EUR BANCO DE SABADELL SA SUB FF FRN/17PERPET
12,000,000 12,442,560.00 1.21
USD BANCO SANTANDER SA SUB FF FRN/19-PERPET 3,000,000 2,809,954.63 0.27EUR BANCO SANTANDER SA SUB FF FRN/20-PERPET 17,000,000 17,595,000.00 1.71EUR BANK OF IRELAND GROUP SUB FF FRN/20-
PERP 8,000,000 8,841,040.00 0.86
EUR BANK OF IRELAND GRP SUB FF FRN/20-PERPET 10,000,000 11,675,900.00 1.13EUR BANKINTER SA SUB FF FRN/20-PERPET 10,000,000 11,364,500.00 1.10GBP BARCLAYS PLC SUB FF FRN/19-PERPET 15,000,000 19,641,338.47 1.91GBP BARCLAYS PLC SUB FF FRN/19-PERPET 9,800,000 12,597,744.74 1.22EUR BAWAG GROUP AG (SUBORDINATED) FIX-TO-
FRN FRN/18-PERPETUAL 11,000,000 11,680,130.00 1.13
EUR BAWAG GROUP AG SUB FF FRN/20-PERPET 7,000,000 7,519,190.00 0.73USD BNP PARIBAS SUB FF FRN/18-PERPET 28,000,000 28,594,720.24 2.77EUR BPCE SA SUB FF FRN/21-131046 5,000,000 4,932,050.00 0.48EUR CAIXABANK FF 6.75%/17-PERPET 13,000,000 14,511,250.00 1.41EUR CAIXABANK SA SUB FF FRN/20-PERPET 8,000,000 9,161,760.00 0.89USD COMMERZBANK AG SUB FF FRN/19-PERPET 8,000,000 7,451,319.94 0.72EUR COMMERZBANK AG SUB FF FRN/20-PERPET 15,000,000 16,269,300.00 1.58EUR COMMERZBANK AG SUB FF FRN/20-PERPET 3,000,000 3,442,500.00 0.33EUR COOPERATIEVE RABOBANK UA
(SUBORDINATED) FIX-TO-FRN FRN/18-PERPETUAL
15,000,000 16,401,000.00 1.59
EUR COOPERATIEVE RABOBANK UA (SUBORDINATED) FIX-TO-FRN FRN/20-PERPETUAL
15,000,000 16,511,250.00 1.60
EUR CREDIT AGRICOLE SA SUB FF FRN/20-PERPET 12,000,000 12,923,040.00 1.25GBP CREDIT AGRICOLE SA SUB FF FRN/21-PERPET 15,000,000 20,468,048.56 1.99USD CREDIT SUISSE GROUP AG FF FRN/19-PERPET 5,000,000 4,713,329.01 0.46USD CREDIT SUISSE GROUP AG SUB FF FRN/PERPET 12,000,000 10,825,871.68 1.05CHF CREDIT SUISSE GROUP AG SUB FF FRN/PERPET 6,000,000 5,617,552.49 0.55USD CREDIT SUISSE GROUP REG S FF 14-PERPET 4,400,000 4,105,602.07 0.40USD DANSKE BANK A/S SUB FF FRN/18-PERPET 10,000,000 9,644,156.41 0.94EUR DEUTSCHE BANK AG SUB FF FRN/21-PERPET 5,000,000 5,165,850.00 0.50USD DEUTSCHE BANK FF 7.5%/14-PERPET 11,200,000 10,601,602.07 1.03EUR DEUTSCHE BANK REG S FF 6%/14-PERPET 7,000,000 7,097,230.00 0.69EUR DEUTSCHE PFANDRIEFBANK FF 5.7%/18-
PERPET 12,000,000 12,277,440.00 1.19
GBP DIRECT LINE SUB FF 4.75%/17-PERPET 15,000,000 18,167,012.14 1.76EUR ERSTE GROUP BANK AG (SUBORDINATED) FIX-
TO-FRN FRN/19-PERPETUAL 15,000,000 16,318,800.00 1.58
EUR ERSTE GROUP BANK AG SUB FF FRN/20-PERPET
9,000,000 9,535,770.00 0.93
EUR GENERALI FINANCE FIX-TO-FRN 4.596%/14-PERPETUAL
10,000,000 11,079,800.00 1.08
EUR HELVETIA EUROPE SA SUB FF FRN/20-300941 3,000,000 3,242,760.00 0.31GBP HSBC HOLDINGS PLC SUB FF FRN/18-PERPET 3,000,000 3,846,218.54 0.37EUR HSBC HOLDINGS REG S FF 4.75%/17-PERPET 22,000,000 24,019,160.00 2.33USD ING GROEP NV SUB FF FRN/19-PERPET 20,000,000 18,806,653.70 1.82USD ING GROUP FF 15-PERPET 8,500,000 8,084,273.06 0.78EUR INTESA SANPAOLO FF 6.25%/17-PERPET 11,000,000 11,969,980.00 1.16EUR INTESA SANPAOLO SPA SUB FF FRN/20-PERPET 6,000,000 6,614,460.00 0.64USD JULIUS BAER GROUP LTD (SUBORDINATED) FIX-
TO-FRN FRN/20-PERPETUAL 13,700,000 12,429,975.37 1.21
EUR KBC GROUP NV SUB FF FRN/18-PERPET 20,000,000 21,200,000.00 2.06EUR KBC GROUP NV SUB FF FRN/19-PERPET 4,000,000 4,248,160.00 0.41EUR LA BANQUE POSTALE SUB FF FRN/19-PERPET 16,000,000 16,651,520.00 1.62EUR LB BADEN-WUERTTEMBG SUB FF FRN/19-
PERPET 17,000,000 17,232,050.00 1.67
GBP LEGAL & GENERAL GROUP SUB FF FRN/PERPET 7,650,000 9,962,080.54 0.97GBP LLOYDS BANKING GRP SUB FF FRN/14-PERPET 15,000,000 22,356,529.46 2.17USD LLOYDS BANKING GRP SUB FF FRN/18-PERPET 2,000,000 1,981,075.83 0.19EUR LLOYDS BANKING REG S FF 6.375%/14-PERPET 3,000,000 3,271,920.00 0.32EUR MEDIOBANCA CRED FIN SUB FF FRN/20-231130 6,000,000 6,109,680.00 0.59GBP NATIONWIDE BLDG SOC SUB FF FRN/19-
PERPET 17,000,000 21,785,170.27 2.11
GBP NATIONWIDE BLDG SOC SUB FF FRN/20-PERPET
3,000,000 3,879,798.64 0.38
GBP NATWEST GROUP PLC SUB FF FRN/20-PERPET 9,000,000 11,300,396.80 1.10EUR NN GROUP FF 4.625%/17-130148 3,000,000 3,533,820.00 0.34USD NORDDEUTSCH LB GIR REG S 6.25%/14-100424 5,400,000 4,909,438.76 0.48USD NORDEA BANK ABP SUB FF FRN/19-PERPET 7,000,000 6,916,949.67 0.67EUR NOVO BANCO LUX S 4 3.5%/13-230143 3,000,000 2,963,910.00 0.29EUR NOVO BANCO SA SUB FF FRN/18-060728 9,000,000 9,229,770.00 0.90EUR NYKREDIT REALKREDIT AS FF FRN/20-PERPET 15,000,000 16,031,400.00 1.56EUR RAIFFEISEN BANK INTERNATIONAL
(SUBORDINATED) FIX-TO-FRN 6.125%/17-PERPETUAL
10,000,000 10,490,100.00 1.02
EUR RAIFFEISEN BANK INTL SUB FF FRN/20-PERPE 14,000,000 15,630,860.00 1.52USD ROYAL BANK OF SCOTLAND FF 15-PERPET 15,000,000 15,247,569.67 1.48

CS Investment Funds 1 • Audited Annual Report as at 31.10.2021
Credit Suisse (Lux) Financial Bond Fund Page 38
Statement of Investments in Securities (Continued)
The notes are an integral part of the financial statements. Any differences in the percentage of Net Assets are the result of roundings.
Description Quantity /
Nominal
Valuation
(in EUR)
% of net
assets
EUR SAMPO OYJ SUB FF FRN/20-030952 3,000,000 3,157,200.00 0.31USD SKANDINAVISKA ENSK SUB FF FRN/19-PERPET 18,000,000 16,517,848.35 1.60USD SOCIETE GENERALE FF 7.875%/13-PERPET 8,500,000 8,083,024.41 0.78USD SOCIETE GENERALE SUB FF FRN/15-PERPET 3,000,000 3,029,993.52 0.29USD SOCIETE GENERALE SUB FF FRN/18-PERPET 3,000,000 2,899,909.27 0.28USD SOCIETE GENERALE SUB FF FRN/20-PERPET 6,000,000 5,529,280.62 0.54USD STANDARD LIFE ABERDEEN FIX-TO-FRN
4.25%/17-30.06.2048 4,600,000 4,325,609.85 0.42
USD SVENSKA HANDELSBANKEN AB (SUBORDINATED) FIX-TO-FRN FRN/20-PERPETUAL
23,000,000 20,826,303.74 2.02
CHF UBS GROUP AG SUB FF FRN/19-PERPET 9,000,000 8,711,462.08 0.85USD UBS GROUP AG SUB FF FRN/20-PERPET 4,000,000 3,728,044.93 0.36USD UBS GROUP FUNDING SWITZE S FF
FRN/PERPET 4,500,000 4,225,430.98 0.41
EUR UNICREDIT FF 5.375%/17-PERPET 20,000,000 21,300,400.00 2.07EUR UNIONE DI BANCH ITALIA SUB FF FRN/PERPET 12,000,000 13,187,400.00 1.28EUR UNIPOLSAI ASSICURAZIONI S FF FRN/PERPET 4,000,000 4,611,760.00 0.45EUR VAN LANSCHOT NV SUB FF FRN/19-PERPET 6,000,000 6,428,280.00 0.62USD ZURICH FINANCE IRELAND (SUBORDINATED)
FIX-TO-FRN FRN/21-19.04.2051 8,000,000 6,842,220.78 0.66
Total Bonds 992,743,097.29 96.32
Total securities listed on a stock exchange or other
organised markets 992,743,097.29 96.32
Total of Portfolio 992,743,097.29 96.32
Cash at banks and at brokers 21,007,503.28 2.04
Due to banks and to brokers -2,379,689.83 -0.23
Other net assets 19,257,891.34 1.87
Total net assets 1,030,628,802.08 100.00

CS Investment Funds 1 • Audited Annual Report as at 31.10.2021
Credit Suisse (Lux) Credit Special Situation Fund Page 39
Technical Data and Notes
Technical Data
Valoren ISIN Management Fee Total Expense Ratio
DA - Distribution USD 49408634 LU2039695387 0.00% 0.12%
DB - Capitalisation USD 26580401 LU1166641354 0.00% 0.11%
IA - Distribution USD 26580275 LU1166640620 0.75% 1.92%
IB - Capitalisation USD 26607283 LU1166642592 0.75% 1.94%
MA - Distribution USD 52169101 LU2110791428 0.35% 1.60%
QA - Distribution USD 26607271 LU1166641941 1.00% 2.11%
QAH - Distribution CHF 26607277 LU1166642162 1.00% 1.87%
DBH - Capitalisation EUR 50890536 LU2076257877 0.00% 0.15%
QAH - Distribution EUR 26607278 LU1166642246 1.00% 1.83%
There is no management fee for -DA-, -DB- and -DBH- share classes. The TER excluding performance fees is 1.00% for -IA- USD shares, 1.00% for -IB- USD shares, 0.56% for -MA- USD shares, 1.25% for -QA- USD shares, 1.33% for -QAH- CHF and 1.33% for -QAH- EUR shares.
Fund Performance
YTD Since Inception 2020 2019 2018
DA - Distribution USD 7.34% 14.13% 4.70% / /
DB - Capitalisation USD 7.34% / 4.72% 15.54% -0.75%
IA - Distribution USD 5.56% 12.46% 2.92% / /
IB - Capitalisation USD 5.51% 12.25% 3.13% / /
MA - Distribution USD 5.86% 7.56% / / /
QA - Distribution USD 5.42% / 2.54% 13.31% -2.15%
QAH - Distribution CHF 4.79% / 0.65% 10.34% -5.04%
DBH - Capitalisation EUR 6.64% 11.63% 2.56% / /
QAH - Distribution EUR 5.18% / 0.71% 10.69% -4.83%
Distribution
Ex-Date Amount
DA - Distribution USD 01.12.2020 15.00
DA - Distribution USD 02.03.2021 15.00
DA - Distribution USD 01.06.2021 15.00
DA - Distribution USD 07.09.2021 15.00
IA - Distribution USD 01.12.2020 15.00
IA - Distribution USD 02.03.2021 15.00
IA - Distribution USD 01.06.2021 15.00
IA - Distribution USD 07.09.2021 15.00
MA - Distribution USD 01.12.2020 15.00
MA - Distribution USD 02.03.2021 15.00
MA - Distribution USD 01.06.2021 15.00
MA - Distribution USD 07.09.2021 15.00
QA - Distribution USD 01.12.2020 15.00
QA - Distribution USD 02.03.2021 15.00
QA - Distribution USD 01.06.2021 15.00
QA - Distribution USD 07.09.2021 15.00
QAH - Distribution CHF 01.12.2020 15.00
QAH - Distribution CHF 02.03.2021 15.00
QAH - Distribution CHF 01.06.2021 15.00
QAH - Distribution CHF 07.09.2021 15.00
QAH - Distribution EUR 01.12.2020 15.00
QAH - Distribution EUR 02.03.2021 15.00
QAH - Distribution EUR 01.06.2021 15.00
QAH - Distribution EUR 07.09.2021 15.00
Notes
Forward foreign exchange contracts
Purchases Sales Maturity Valuation
Counterparty (In USD)
USD 1,074,889 EUR -920,000 09.11.2021 9,995.56
Credit Suisse (Schweiz) AG - Zurich - Switzerland
USD 334,548 EUR -289,100 09.11.2021 -82.66
Credit Suisse (Schweiz) AG - Zurich - Switzerland
USD 1,636,244 EUR -1,400,000 09.11.2021 15,753.71
Credit Suisse (Schweiz) AG - Zurich - Switzerland

CS Investment Funds 1 • Audited Annual Report as at 31.10.2021
Credit Suisse (Lux) Credit Special Situation Fund Page 40
Technical Data and Notes (Continued)
Purchases Sales Maturity Valuation
Counterparty (In USD)
EUR 800,000 USD -937,937 09.11.2021 -11,944.00
UBS AG London Branch - London - United Kingdom
USD 595,522 EUR -500,000 09.11.2021 16,773.01
UBS AG London Branch - London - United Kingdom
USD 819,797 EUR -700,000 09.11.2021 9,550.91
Credit Suisse (Schweiz) AG - Zurich - Switzerland
USD 115,266,365 EUR -97,470,000 09.11.2021 2,445,208.02
Credit Suisse (Schweiz) AG - Zurich - Switzerland
USD 2,549,371 CHF -2,310,000 09.11.2021 20,515.39
UBS AG London Branch - London - United Kingdom
USD 638,846 EUR -550,000 09.11.2021 2,225.94
UBS AG London Branch - London - United Kingdom
USD 93,755 CHF -86,900 09.11.2021 -1,377.92
Credit Suisse (Schweiz) AG - Zurich - Switzerland
EUR 500,000 USD -580,381 09.11.2021 -1,635.50
Credit Suisse (Schweiz) AG - Zurich - Switzerland
CHF 274,100 USD -300,310 09.11.2021 -241.94
Credit Suisse (Schweiz) AG - Zurich - Switzerland
USD 235,093 EUR -200,000 09.11.2021 3,593.65
Credit Suisse (Schweiz) AG - Zurich - Switzerland
USD 820,928 EUR -700,000 09.11.2021 10,681.88
Credit Suisse (Schweiz) AG - Zurich - Switzerland
CHF 3,191,100 USD -3,521,773 09.11.2021 -28,348.58
UBS AG London Branch - London - United Kingdom
EUR 850,000 USD -985,530 09.11.2021 -1,662.60
Credit Suisse (Schweiz) AG - Zurich - Switzerland
CHF 113,500 USD -123,393 09.11.2021 859.95
Credit Suisse (Schweiz) AG - Zurich - Switzerland
EUR 321,300 USD -371,734 09.11.2021 168.36
Credit Suisse (Schweiz) AG - Zurich - Switzerland
USD 481,406 CHF -442,000 09.11.2021 -2,467.90
Credit Suisse (Schweiz) AG - Zurich - Switzerland
EUR 2,240,000 USD -2,648,435 09.11.2021 -55,655.04
Credit Suisse (Schweiz) AG - Zurich - Switzerland
EUR 700,000 USD -826,060 09.11.2021 -15,816.50
Credit Suisse (Schweiz) AG - Zurich - Switzerland
USD 948,603 EUR -800,000 09.11.2021 22,605.69
Credit Suisse (Schweiz) AG - Zurich - Switzerland
EUR 10,902,200 USD -12,892,756 09.11.2021 -273,558.00
Credit Suisse (Schweiz) AG - Zurich - Switzerland
CHF 3,465,200 USD -3,799,349 09.12.2021 -2,546.63
Credit Suisse (Schweiz) AG - Zurich - Switzerland
EUR 10,844,500 USD -12,901,723 09.12.2021 -340,712.50
Credit Suisse (Schweiz) AG - Zurich - Switzerland
EUR 379,000 USD -438,743 09.12.2021 246.73
Credit Suisse (Schweiz) AG - Zurich - Switzerland
EUR 11,223,500 USD -13,006,140 11.01.2022 7,385.06
Credit Suisse (Schweiz) AG - Zurich - Switzerland
CHF 3,242,800 USD -3,509,228 11.01.2022 48,055.92
Citibank N.A.- London - United Kingdom
Net unrealised gain on forward foreign exchange contracts 1,877,570.01

CS Investment Funds 1 • Audited Annual Report as at 31.10.2021
Credit Suisse (Lux) Credit Special Situation Fund Page 41
Statement of Net Assets (in USD) and Fund Evolution
The notes are an integral part of the financial statements.
31.10.2021
Assets
Investments in securities at market value 225,455,788.03Cash at banks and at brokers 18,457.68Income receivable 3,924,227.02Net unrealised gain on forward foreign exchange contracts 1,877,570.01
231,276,042.74
Liabilities
Due to banks and to brokers 2,592,190.30Provisions for accrued expenses 84,504.63
2,676,694.93
Net assets 228,599,347.81
Fund Evolution 31.10.2021 31.10.2020 31.10.2019
Total net assets USD 228,599,347.81 236,506,218.40 151,432,748.62
Net asset value per share
DA - Distribution USD 1,033.91 936.58 /
DB - Capitalisation USD 1,459.34 1,247.04 1,256.95
IA - Distribution USD 977.89 904.57 989.53
IB - Capitalisation USD 1,122.49 977.40 1,003.61
MA - Distribution USD 978.46 901.97 /
QA - Distribution USD 839.93 785.83 871.08
QAH - Distribution CHF 703.99 672.28 769.19
DBH - Capitalisation EUR 1,116.32 962.09 /
QAH - Distribution EUR 732.26 694.40 791.64
Number of shares outstanding At the end of the year At the beginning of
the year
Number of shares
issued
Number of shares
redeemed
DA - Distribution USD 18,252.438 34,846.471 8,725.818 25,319.851
DB - Capitalisation USD 54,185.179 58,613.179 37,107.831 41,535.831
IA - Distribution USD 14,152.689 18,086.394 7,828.452 11,762.157
IB - Capitalisation USD 16,768.792 17,823.156 5,658.064 6,712.428
MA - Distribution USD 26,000.000 26,000.000 0.000 0.000
QA - Distribution USD 27,247.937 32,277.850 1,939.401 6,969.314
QAH - Distribution CHF 14,442.753 11,475.471 7,548.382 4,581.100
DBH - Capitalisation EUR 26,246.770 29,676.000 2,175.770 5,605.000
QAH - Distribution EUR 5,463.347 8,042.351 2,185.831 4,764.835

CS Investment Funds 1 • Audited Annual Report as at 31.10.2021
Credit Suisse (Lux) Credit Special Situation Fund Page 42
Statement of Operations / Changes in Net Assets (in USD)
The notes are an integral part of the financial statements.
For the period from
01.11.2020 to 31.10.2021
Net assets at the beginning of the year 236,506,218.40
Income
Interest on investments in securities (net) 12,123,657.20
Dividends (net) 405.71
Bank Interest 505.64
Securities lending income 209,894.02
12,334,462.57
Expenses
Management fee 846,981.78
Performance fee 889,891.44
Depositary fee 139,628.80
Administration expenses 74,568.51
Printing and publication expenses 9,006.83
Interest and bank charges 9,989.04
Audit, control, legal, representative bank and other expenses 76,027.51
"Taxe d'abonnement" 39,803.91
2,085,897.82
Net income (loss) 10,248,564.75
Realised gain (loss)
Net realised gain (loss) on sales of investments 8,493,362.58
Net realised gain (loss) on swaps contracts -1,998,680.56
Net realised gain (loss) on forward foreign exchange contracts 425,004.25
Net realised gain (loss) on foreign exchange 270,315.08
7,190,001.35
Net realised gain (loss) 17,438,566.10
Change in net unrealised appreciation (depreciation)
Change in net unrealised appreciation (depreciation) on investments 16,448,523.27
Change in net unrealised appreciation (depreciation) on swaps contracts 1,013,306.00
Change in net unrealised appreciation (depreciation) on forward foreign exchange contracts 1,232,735.38
18,694,564.65
Net increase (decrease) in net assets as a result of operations 36,133,130.75
Subscriptions / Redemptions
Subscriptions 86,530,507.19
Redemptions -123,213,012.11
-36,682,504.92
Distribution -7,357,496.42
Net assets at the end of the year 228,599,347.81

CS Investment Funds 1 • Audited Annual Report as at 31.10.2021
Credit Suisse (Lux) Credit Special Situation Fund Page 43
Statement of Investments in Securities
The notes are an integral part of the financial statements. Any differences in the percentage of Net Assets are the result of roundings.
Breakdown by Country
Netherlands 13.72
Luxembourg 12.41
USA 11.74
Germany 6.68
United Kingdom 6.67
Ireland 5.47
France 4.99
Portugal 4.87
Argentina 3.75
Ukraine 3.42
Brazil 3.03
Italy 2.86
South Africa 2.85
Austria 2.74
Virgin Islands (UK) 1.90
Spain 1.47
Japan 1.31
Iceland 1.10
Finland 1.00
Canada 0.89
Mexico 0.80
Liberia 0.67
Jersey 0.65
Cayman Islands 0.60
Sweden 0.51
Cyprus 0.47
Oman 0.47
Bermuda 0.46
Romania 0.35
Georgia 0.33
Turkey 0.23
Greece 0.21
Total 98.62
Breakdown by Economic Sector
Financial, investment and other div. companies 34.45
Banks and other credit institutions 22.59
Petroleum 5.60
Telecommunication 5.38
Retailing, department stores 4.60
Pharmaceuticals, cosmetics and medical products 3.73
Countries and central governments 3.39
Electrical appliances and components 3.10
Lodging and catering industry, leisure facilities 2.85
Energy and water supply 2.39
Traffic and transportation 1.98
Chemicals 1.70
Non-classifiable/non-classified institutions 1.46
Internet, software and IT services 1.31
Precious metals and precious stones 1.05
Insurance companies 0.89
Mining, coal and steel industry 0.81
Aeronautic and astronautic industry 0.49
Miscellaneous services 0.35
Forestry, paper and forest products 0.26
Food and soft drinks 0.23
Building materials and building industry 0.02
Total 98.62
Statement of Investments in Securities
Description Quantity /
Nominal
Valuation
(in USD)
% of net
assets
Securities listed on a stock exchange or other organised
markets
Shares
EUR ABENGOA 210,655 3,924.87 0.00EUR ABENGOA B 2,178,239 40,584.35 0.02
Total Shares 44,509.22 0.02
Bonds
USD ABSA GROUP LTD SUB FF FRN/21-PERPET 1,000,000 1,039,410.00 0.45USD AEROPUERTOS ARGENT 2000 S 9.375%/010227 2,829,551 2,250,999.92 0.98USD ALFA BANK (ALFA BOND) (SUBORDINATED)
5.95%/19-15.04.2030 1,000,000 1,038,900.00 0.45
USD ALTICE FINANCING SA 5.75%/21-150829 200,000 197,182.00 0.09EUR ALTICE FRANCE HOLDING S.A. 4%/20-150228 1,000,000 1,083,660.47 0.47USD ALTICE FRANCE HOLDING SA 6%/20-150228 3,000,000 2,852,100.00 1.25EUR ALTICE FRANCE SA 4%/21-150729 1,200,000 1,358,801.29 0.59EUR ALTICE FRANCE SA 4.25%/21-151029 1,500,000 1,723,255.19 0.75USD AMC ENTERTAINMENT HLDGS 10.5%/20-150425 500,000 537,195.00 0.23USD ANDRADE GUTIER INT SA 144A 11%/18-200821 660 504.74 0.00USD ANDRADE GUTIERREZ INTERNATIONAL SA
9.5%/19-25.11.2024 6,000,000 4,601,520.00 2.01
USD ARD FINANCE SA 6.5%/19-300627 1,000,000 1,048,500.00 0.46USD ARDSHININVESTBANK CJSC 6.5%/20-
28.01.2025 2,500,000 2,489,650.00 1.09
USD ARION BANKI HF SUB FF FRN/20-PERPET 2,500,000 2,516,325.00 1.10EUR ARYZTA EURO FINANCE DAC SUB FF/14-PERPET 4,500,000 6,648,522.76 2.91USD ATENTO LUXCO 1 SA 8%/21-10.02.2026 1,000,000 1,066,060.00 0.47EUR BANCA MONTE PASCHI FF 5.375%/18-180128 5,500,000 4,649,986.73 2.03EUR BANCO BPM SPA SUB FF FRN/21-PERPET 1,500,000 1,897,259.30 0.83EUR BANCO COMERC PORTUG SUB FF FRN/19-
PERPET 1,600,000 1,977,342.16 0.86
EUR BANCO SANTANDER FF 1%/17-PERPET 3,000,000 3,316,250.32 1.45EUR BANK OF CYPRUS HOLD SUB FF FRN/21-
231031 2,000,000 2,390,207.30 1.05
EUR BARCLAYS BANK FF 4.75%/05-PERPET 1,000,000 1,127,508.68 0.49USD BAUSCH HEALTH COS 144A 5.25%/19-300130 500,000 452,235.00 0.20USD BAUSCH HEALTH COS INC -144A- 5.25%/20-
15.02.2031 750,000 675,952.50 0.30
USD BAUSCH HEALTH COS INC 5.25%/19-300130 1,000,000 904,470.00 0.40USD BRASKEM IDESA SAPI 7.45%/19-15.11.2029 1,000,000 1,062,540.00 0.46EUR CARNIVAL PLC 1%/19-281029 5,500,000 4,992,098.76 2.18EUR CASINO GUICHARD PERRACH 3.248%/14-
070324 3,500,000 3,958,755.52 1.73
EUR CASINO GUICHARD PERRACHO 5.25%/21-150427
1,500,000 1,653,368.86 0.72
EUR CASINO GUICHARD PERRACHON (SUBORDINATED) FIX-TO-FRN 4.87%/13-PERPETUAL
1,500,000 1,191,070.63 0.52
EUR CHEMOURS CO 4%/18-150526 1,750,000 2,051,413.68 0.90EUR CIRSA FINANCE INTER 4.75%/19-220525 1,000,000 1,156,879.68 0.51USD CITGO PETROLEUM CORP 144A 7%/20-150625 1,500,000 1,546,605.00 0.68EUR CODERE FIN 2 LUX REG S 6.75%/16-011121 3,125,000 2,297,213.58 1.00EUR CODERE FINANCE 2 LUXEM 10.75%/21-300923 950,000 1,188,723.73 0.52USD CODERE FINANCE 2 LUXEMB 7.625%/16-011123 3,624,687 2,468,448.09 1.08EUR COMMERZBANK AG SUB FF FRN/21-PERPET 2,400,000 2,761,291.08 1.21EUR CRYSTAL ALMOND SARL 4.25%/19-151024 1,000,000 1,182,883.09 0.52USD CYDSA SAB DE CV 6.25%/17-04.10.2027 750,000 763,387.50 0.33EUR DEUTSCHE BANK AG SUB FF FRN/21-PERPET 2,000,000 2,391,271.97 1.05USD DEUTSCHE BANK FF 7.5%/14-PERPET 1,800,000 1,971,756.00 0.86EUR DEUTSCHE BANK REG S FF 6%/14-PERPET 3,000,000 3,519,972.61 1.54EUR DEUTSCHE POSTBANK FD I SUB FF
FRN/PERPET 3,174,000 3,630,980.91 1.59
USD DIG INTL FIN/DIG INTL HL 144A 8.75%/19-2 1,000,000 1,041,250.00 0.46USD DRESDNER FNDG TRUST I SUB 8.151%/300631 1,750,000 2,482,655.00 1.09USD DTEK FINANCE PLC 7%/21-311227 1,512,856 930,890.55 0.41EUR DTEK RENEWABLES FINANCE 8.5%/19-
12.11.2024 1,000,000 1,184,942.99 0.52
EUR DUFRY ONE BV 3.375%/21-150428 1,000,000 1,139,960.69 0.50CHF DUFRY ONE BV 3.625%/21-150426 500,000 548,938.73 0.24EUR EG GLOBAL FINANCE PLC 6.25%/19-301025 2,500,000 2,941,613.78 1.29EUR EGGER HOLZWERKSTOFF FF 4.875%/18-
PERPET 500,000 601,770.00 0.26
USD ESKOM HOLDINGS SOC LTD 6.35%/18-10.08.2028
1,500,000 1,619,280.00 0.71
USD ESKOM HOLDINGS SOC LTD 8.45%/18-10.08.2028
3,500,000 3,846,255.00 1.68
EUR FIDELIDADE COMPA SE SUB FF FRN/21-040931 1,700,000 2,023,374.09 0.89EUR FINNAIR OYJ SUB FF FRN/20-PERPET 1,800,000 2,275,148.87 1.00CHF GATEGROUP FINANCE LUXEMBOURG 3%/17-
28.02.2022 2,500,000 2,371,903.42 1.04
USD GENERAL ELECTRIC FF 5%/16-PERPET 7,250,000 7,081,510.00 3.10USD GRAN TIERRA ENERGY INTL 6.25%/18-150225 500,000 465,425.00 0.20EUR GRENKE FINANCE PLC 0.625%/19-090125 1,500,000 1,645,765.73 0.72USD HSBC BANK FRN 1985-PERPET 500,000 470,020.00 0.21USD HUARONG FINANCE FF 4%/17-PERPET 3,000,000 2,869,290.00 1.26USD HUARONG FINANCE FIX-TO-FLOATERS 4.5%/17-
PERPETUAL 1,500,000 1,472,535.00 0.64
EUR IKB DEUTSCHE INDUSTRIEBANK FF 18-310128 1,500,000 1,775,140.49 0.78EUR ILIAD HOLDING SAS 5.625%/21-151028 500,000 598,188.31 0.26USD ILIAD HOLDING SAS 7%/21-151028 200,000 206,172.00 0.09USD KENBOURNE INVEST SA 6.875%/19-261124 1,250,000 1,309,300.00 0.57USD KERNEL HOLDING SA 6.5%/19-171024 500,000 530,170.00 0.23USD KERNEL HOLDING SA 6.75%/20-271027 500,000 531,350.00 0.23EUR KLEOPATRA HOLDINGS 2 SUB 6.5%/21-010926 1,600,000 1,689,603.52 0.74

CS Investment Funds 1 • Audited Annual Report as at 31.10.2021
Credit Suisse (Lux) Credit Special Situation Fund Page 44
Statement of Investments in Securities (Continued)
The notes are an integral part of the financial statements. Any differences in the percentage of Net Assets are the result of roundings.
Description Quantity /
Nominal
Valuation
(in USD)
% of net
assets
EUR KONDOR FINANCE PLC (NAK) 7.125%/19-19.07.2024
2,250,000 2,613,811.14 1.14
USD L BRANDS INC 6.875%/16-011135 2,000,000 2,433,440.00 1.06EUR LA BANQUE POSTALE SUB FF FRN/19-PERPET 600,000 722,623.93 0.32EUR LB BADEN-WUERTTEMBG SUB FF FRN/19-
PERPET 1,000,000 1,173,046.46 0.51
USD LCPR SR SECURED FIN DAC 6.75%/19-15.10.2027
750,000 792,142.50 0.35
EUR LHMC FINCO 2 SARL 7.25%/19-02.10.2025 1,406,079 1,647,329.47 0.72USD MACY'S RETAIL 3.625%/14-010624 750,000 776,025.00 0.34EUR METINVEST B.V. 5.625%/19-17.06.2025 1,500,000 1,844,592.85 0.81USD MHP SE 7.75%/17-100524 1,000,000 1,082,070.00 0.47USD NGD HOLDINGS BV 6.75%/21-311226 853,974 837,757.03 0.37USD NORDSTROM 5%/13-150144 500,000 495,365.00 0.22EUR NOVO BANCO SA SUB FF FRN/18-060728 6,000,000 7,120,767.56 3.11USD OI SA 10%/18-27.07.2025 5,000,000 4,520,950.00 1.98USD OMAN GOV INTERNTL BOND 6.25%/21-250131 1,000,000 1,085,510.00 0.47USD ORIFLAME INVESTMENT 5.125%/21-040526 1,500,000 1,489,515.00 0.65USD ORYX FUNDING LTD 5.8%/21-03.02.2031 850,000 906,567.50 0.40USD PAN AMERICAN ENERGY LLC 9.125%/21-300427 4,300,000 4,832,254.00 2.11USD PAR PHARMACEUTICAL INC -144A- 7.5%/19-
01.04.2027 3,000,000 3,028,770.00 1.32
USD PETROBRAS GLOBAL FINANCE 6.85%/15-05.06.2115
3,500,000 3,420,795.00 1.50
EUR PIRAEUS FINANCIAL HLDG SUB FF FRN/PERPET 400,000 472,107.08 0.21EUR PROMONTORIA HOLDING 6.75%/18-150823 2,750,000 3,178,904.99 1.39EUR RCS & RDS SA 3.25%/20-050228 700,000 803,602.50 0.35USD ROLLS-ROYCE PLC 5.75%/20-151027 1,000,000 1,113,110.00 0.49USD ROTHSCHILDS CONTINUATION FINANCE
(SUBORDINATED) FRN 86-PERPETUAL 1,700,000 1,498,737.00 0.66
USD ROYAL CARIBBEAN CRUI 144A 5.5%/21-310826 1,500,000 1,530,465.00 0.67USD SAMARCO MINERACAO (REG.-S-) 4.125%/12-
01.11.2022 3,750,000 2,409,337.50 1.05
USD SASOL FINANCING USA LLC 6.5%/18-27.09.2028
2,500,000 2,777,425.00 1.21
EUR SELECTA GROUP BV 10%/20-010726 348,362 391,172.64 0.17EUR SELECTA GROUP BV 8%/20-010426 972,202 1,147,424.87 0.50USD SILKNET JSC 11%/19-02.04.2024 700,000 756,903.00 0.33USD SOFTBANK GROUP SUB FF 6%/17-PERPET 3,000,000 3,002,970.00 1.31EUR STICHTING AK RABOBANK SUB 6.5%/14-
PERPET 1,000,000 1,610,868.86 0.70
USD TEVA PHARMACEUTICAL FINANCE 4.1%/16-01.10.2046
1,500,000 1,251,465.00 0.55
USD TEVA PHARMACEUTICALS NE 6.75%/18-01.03.2028
2,000,000 2,207,940.00 0.97
USD TRIVIUM PACKAGING FIN 144A 8.5%/150827 2,500,000 2,642,150.00 1.16USD TULLOW OIL PLC 10.25%/21-150526 1,000,000 1,052,490.00 0.46USD UKRAINE (REG. -S-) FRN 15-31.05.2040 6,300,000 6,667,983.00 2.92USD ULKER BISKUVI SANAYI AS 6.95%/20-301025 500,000 525,290.00 0.23EUR UNITED GROUP BV 3.625%/20-150228 1,500,000 1,669,720.80 0.73EUR VERISURE MIDHOLDING AB 5.25%/21-
15.02.2029 1,000,000 1,175,812.29 0.51
EUR VERTICAL MIDCO GMBH 6.625%/20-150728 1,500,000 1,670,091.59 0.73USD VFU FUNDING (VF UKRAINE) 6.2%/20-110225 1,100,000 1,139,655.00 0.50EUR VOLKSBANK WIEN AG SUB/18-PERPET 4,400,000 5,660,308.80 2.48EUR VOLKSWAGEN INTL FIN NV (SUBORDINATED)
FIX-TO-FRN FRN/20-PERPETUAL 1,500,000 1,895,922.68 0.83
EUR WINTERSHALL DEA S NC8 FF FRN/21-PERPET 1,400,000 1,599,266.27 0.70USD YPF SOCIEDAD ANONIMA 6.95%/17-21.07.2027 2,050,000 1,494,757.50 0.65
Total Bonds 223,454,126.03 97.75
Certificates
EUR STICHTING AK RABOBANK SUB 6.5%/14-PERPET
500,000 805,434.43 0.35
Total Certificates 805,434.43 0.35
Total securities listed on a stock exchange or other
organised markets 224,304,069.68 98.12
Securities not listed on a stock exchange
Bonds
EUR CODERE FINANCE 2 LUXEMBO 10.75%/21-30092
1,026,000 1,151,718.35 0.50
Total Bonds 1,151,718.35 0.50
Total securities not listed on a stock exchange 1,151,718.35 0.50
Total of Portfolio 225,455,788.03 98.62
Cash at banks and at brokers 18,457.68 0.01
Due to banks and to brokers -2,592,190.30 -1.13
Other net assets 5,717,292.40 2.50
Total net assets 228,599,347.81 100.00

CS Investment Funds 1 • Audited Annual Report as at 31.10.2021
Credit Suisse (Lux) SQ Euro Corporate Bond Fund Page 45
Technical Data and Notes
Technical Data
Valoren ISIN Management Fee Total Expense Ratio
A - Distribution EUR 40678902 LU1785831402 0.65% 0.91%
B - Capitalisation EUR 25772629 LU1126274130 0.65% 0.92%
EA - Distribution EUR 40678903 LU1785831584 0.20% 0.43%
EB - Capitalisation EUR 10348197 LU0439683276 0.20% 0.43%
IB - Capitalisation EUR 25772649 LU1126274569 0.30% 0.57%
UB - Capitalisation EUR 40678962 LU1785831667 0.45% 0.72%
EBH - Capitalisation CHF 10348198 LU0439683516 0.20% 0.51%
EBH - Capitalisation USD 10348189 LU0439682898 0.20% 0.51%
Fund Performance
YTD Since Inception 2020 2019 2018
A - Distribution EUR -0.91% 5.84% 3.24% 4.88% /
B - Capitalisation EUR -0.92% 5.84% 3.25% 4.88% /
EA - Distribution EUR -0.51% 7.63% 3.75% 5.39% /
EB - Capitalisation EUR -0.51% / 3.75% 5.40% -2.22%
IB - Capitalisation EUR -0.63% / 3.58% 5.25% -2.40%
UB - Capitalisation EUR -0.75% 6.57% 3.46% 5.08% /
EBH - Capitalisation CHF -0.75% / 3.42% 4.87% -2.66%
EBH - Capitalisation USD 0.05% / 5.32% 8.55% 0.59%
Distribution
Ex-Date Amount
A - Distribution EUR 15.12.2020 0.66
EA - Distribution EUR 15.12.2020 1.15
Notes
Forward foreign exchange contracts
Purchases Sales Maturity Valuation
Counterparty (In EUR)
EUR 149,463 USD -172,900 09.11.2021 88.34
Credit Suisse (Schweiz) AG - Zurich - Switzerland
EUR 346,213 CHF -371,100 09.11.2021 -4,768.21
Citibank N.A.- London - United Kingdom
USD 960,000 EUR -808,002 09.11.2021 21,378.19
Credit Suisse (Schweiz) AG - Zurich - Switzerland
CHF 728,800 EUR -671,449 09.11.2021 17,841.03
Credit Suisse (Schweiz) AG - Zurich - Switzerland
EUR 20,665,874 USD -24,440,000 09.11.2021 -448,854.40
Credit Suisse (Schweiz) AG - Zurich - Switzerland
CHF 10,979,300 EUR -10,239,649 09.11.2021 144,435.11
Credit Suisse (Schweiz) AG - Zurich - Switzerland
EUR 229,668 CHF -246,000 09.11.2021 -2,995.20
Credit Suisse (Schweiz) AG - Zurich - Switzerland
EUR 85,272 CHF -91,500 09.11.2021 -1,267.38
Credit Suisse (Schweiz) AG - Zurich - Switzerland
USD 208,800 EUR -175,698 09.11.2021 4,692.05
Credit Suisse (Schweiz) AG - Zurich - Switzerland
USD 120,000 EUR -102,673 09.11.2021 999.33
Credit Suisse (Schweiz) AG - Zurich - Switzerland
USD 6,446,500 EUR -5,451,005 09.11.2021 118,368.96
Credit Suisse (Schweiz) AG - Zurich - Switzerland
USD 3,770,000 EUR -3,259,593 09.11.2021 -2,548.56
Credit Suisse (Schweiz) AG - Zurich - Switzerland

CS Investment Funds 1 • Audited Annual Report as at 31.10.2021
Credit Suisse (Lux) SQ Euro Corporate Bond Fund Page 46
Technical Data and Notes (Continued)
Forward foreign exchange contracts
Purchases Sales Maturity Valuation
Counterparty (In EUR)
CHF 248,500 EUR -231,876 09.11.2021 3,151.86
Credit Suisse (Schweiz) AG - Zurich - Switzerland
USD 760,000 EUR -645,585 09.11.2021 11,007.11
Credit Suisse (Schweiz) AG - Zurich - Switzerland
USD 6,655,300 EUR -5,596,964 09.12.2021 148,863.05
Credit Suisse (Schweiz) AG - Zurich - Switzerland
CHF 162,200 EUR -151,372 09.12.2021 2,062.97
Credit Suisse (Schweiz) AG - Zurich - Switzerland
CHF 11,794,400 EUR -10,867,961 09.12.2021 289,113.75
Credit Suisse (Schweiz) AG - Zurich - Switzerland
CHF 11,956,600 EUR -11,159,510 11.01.2022 152,487.45
Credit Suisse (Schweiz) AG - Zurich - Switzerland
USD 6,310,700 EUR -5,447,900 11.01.2022 -5,243.57
Credit Suisse (Schweiz) AG - Zurich - Switzerland
Net unrealised gain on forward foreign exchange contracts 448,811.88

CS Investment Funds 1 • Audited Annual Report as at 31.10.2021
Credit Suisse (Lux) SQ Euro Corporate Bond Fund Page 47
Statement of Net Assets (in EUR) and Fund Evolution
The notes are an integral part of the financial statements.
31.10.2021
Assets
Investments in securities at market value 247,788,278.25Cash at banks and at brokers 801,554.34Income receivable 1,797,278.81Net unrealised gain on forward foreign exchange contracts 448,811.88
250,835,923.28
Liabilities
Provisions for accrued expenses 89,605.63
89,605.63
Net assets 250,746,317.65
Fund Evolution 31.10.2021 31.10.2020 31.10.2019
Total net assets EUR 250,746,317.65 279,063,322.73 190,778,269.36
Net asset value per share
A - Distribution EUR 104.09 103.95 103.33
B - Capitalisation EUR 105.84 105.04 103.70
EA - Distribution EUR 104.63 104.46 103.84
EB - Capitalisation EUR 149.01 147.15 144.57
IB - Capitalisation EUR 1,131.89 1,119.34 1,101.48
UB - Capitalisation EUR 106.57 105.55 103.99
EBH - Capitalisation CHF 139.72 138.39 136.43
EBH - Capitalisation USD 167.65 164.33 158.61
Number of shares outstanding At the end of the year At the beginning of
the year
Number of shares
issued
Number of shares
redeemed
A - Distribution EUR 56,994.178 72,873.823 38.570 15,918.215
B - Capitalisation EUR 99,018.710 150,074.074 6,387.995 57,443.359
EA - Distribution EUR 35,224.460 35,865.342 3,071.798 3,712.680
EB - Capitalisation EUR 1,210,057.576 1,276,616.810 62,598.267 129,157.501
IB - Capitalisation EUR 457.283 457.283 0.000 0.000
UB - Capitalisation EUR 647.737 647.737 0.000 0.000
EBH - Capitalisation CHF 250,080.182 296,570.000 7,900.000 54,389.818
EBH - Capitalisation USD 115,325.000 177,900.000 1,775.000 64,350.000
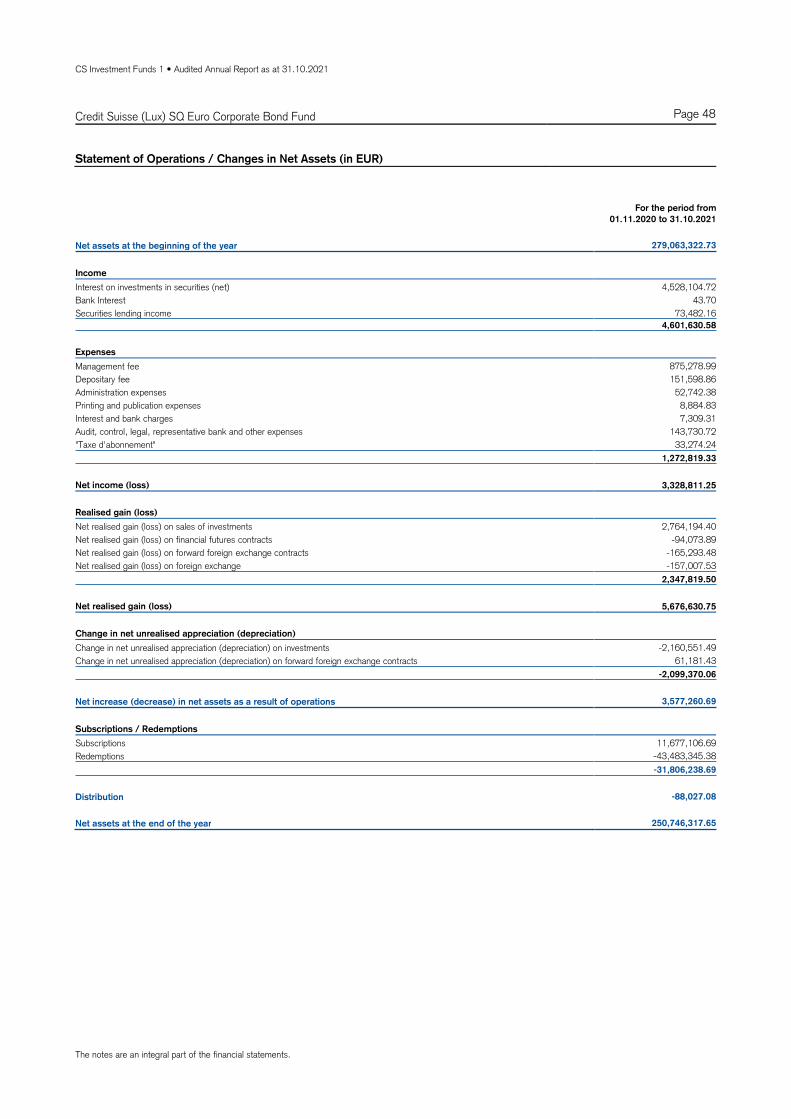
CS Investment Funds 1 • Audited Annual Report as at 31.10.2021
Credit Suisse (Lux) SQ Euro Corporate Bond Fund Page 48
Statement of Operations / Changes in Net Assets (in EUR)
The notes are an integral part of the financial statements.
For the period from
01.11.2020 to 31.10.2021
Net assets at the beginning of the year 279,063,322.73
Income
Interest on investments in securities (net) 4,528,104.72
Bank Interest 43.70
Securities lending income 73,482.16
4,601,630.58
Expenses
Management fee 875,278.99
Depositary fee 151,598.86
Administration expenses 52,742.38
Printing and publication expenses 8,884.83
Interest and bank charges 7,309.31
Audit, control, legal, representative bank and other expenses 143,730.72
"Taxe d'abonnement" 33,274.24
1,272,819.33
Net income (loss) 3,328,811.25
Realised gain (loss)
Net realised gain (loss) on sales of investments 2,764,194.40
Net realised gain (loss) on financial futures contracts -94,073.89
Net realised gain (loss) on forward foreign exchange contracts -165,293.48
Net realised gain (loss) on foreign exchange -157,007.53
2,347,819.50
Net realised gain (loss) 5,676,630.75
Change in net unrealised appreciation (depreciation)
Change in net unrealised appreciation (depreciation) on investments -2,160,551.49
Change in net unrealised appreciation (depreciation) on forward foreign exchange contracts 61,181.43
-2,099,370.06
Net increase (decrease) in net assets as a result of operations 3,577,260.69
Subscriptions / Redemptions
Subscriptions 11,677,106.69
Redemptions -43,483,345.38
-31,806,238.69
Distribution -88,027.08
Net assets at the end of the year 250,746,317.65

CS Investment Funds 1 • Audited Annual Report as at 31.10.2021
Credit Suisse (Lux) SQ Euro Corporate Bond Fund Page 49
Statement of Investments in Securities
The notes are an integral part of the financial statements. Any differences in the percentage of Net Assets are the result of roundings.
Breakdown by Country
USA 15.15
Netherlands 13.62
France 12.07
Germany 11.74
United Kingdom 10.93
Luxembourg 6.93
Spain 6.67
Italy 6.49
Ireland 3.25
Japan 2.54
Cayman Islands 1.37
Finland 1.21
Austria 1.09
Switzerland 1.08
United Arab Emirates 0.80
People's Republic of China 0.68
Saudi-Arabia 0.60
Singapore 0.54
Sweden 0.40
Portugal 0.39
Bermuda 0.36
Peru 0.36
Denmark 0.20
Mexico 0.18
South Korea 0.18
Total 98.82
Breakdown by Economic Sector
Banks and other credit institutions 32.41
Financial, investment and other div. companies 29.84
Telecommunication 6.20
Pharmaceuticals, cosmetics and medical products 3.50
Real estate 3.48
Petroleum 2.06
Mechanical engineering and industrial equipment 1.90
Electrical appliances and components 1.72
Insurance companies 1.67
Packaging industries 1.64
Tobacco and alcoholic beverages 1.62
Vehicles 1.58
Building materials and building industry 1.37
Internet, software and IT services 1.24
Chemicals 1.12
Food and soft drinks 1.06
Miscellaneous services 1.05
Rubber and tires 0.88
Retailing, department stores 0.79
Computer hardware and networking 0.66
Electronics and semiconductors 0.64
Aeronautic and astronautic industry 0.64
Mortgage and funding institutions (MBS, ABS) 0.48
Countries and central governments 0.40
Energy and water supply 0.34
Mining, coal and steel industry 0.20
Public non profit institutions 0.18
Healthcare and social services 0.16
Total 98.82
Statement of Investments in Securities
Description Quantity /
Nominal
Valuation
(in EUR)
% of net
assets
Securities listed on a stock exchange or other organised
markets
Bonds
EUR ABN AMRO BANK N.V. 0.5%/21-230929 1,000,000 982,270.00 0.39USD ALFA SAB DE CV (REG. -S-) 5.25%/14-
25.03.2024 500,000 462,134.37 0.18
USD ALIBABA GROUP HOLDING 3.4%/17-061227 750,000 688,476.99 0.27USD ALIBABA GROUP HOLDING 3.6%/15-28.11.2024 750,000 689,552.82 0.28EUR AMERICAN INTL GROUP 1.875%/17-21.06.2027 1,500,000 1,597,095.00 0.64EUR AMERICAN TOWER CORP 0.875%/21-210529 1,500,000 1,490,805.00 0.59EUR ANGLO AMERICAN CAPITAL 1.625%/17-180925 3,250,000 3,400,410.00 1.36EUR ANGLO AMERICAN CAPITAL 1.625%/19-110326 1,000,000 1,041,530.00 0.42EUR ARDAGH PKG FIN/HLDGS USA2.125%/19-
150826 1,500,000 1,484,910.00 0.59
EUR AROUNDTOWN SA 0%/20-16.07.2026 1,500,000 1,454,955.00 0.58EUR AROUNDTOWN SA 0.625%/19-09.07.2025 500,000 502,590.00 0.20EUR AROUNDTOWN SA 1.45%/19-09.07.2028 1,000,000 1,025,710.00 0.41EUR ASAHI GROUP HOLDINGS 0.336%/21-190427 1,500,000 1,493,310.00 0.60EUR ASSICURAZIONI GE SUB 1.713%/21-300632 1,500,000 1,469,205.00 0.59EUR AT&T INC 0.8%/19-04.03.2030 1,200,000 1,196,760.00 0.48USD AT&T INC 1.65%/20-01.02.2028 400,000 337,251.24 0.13EUR AT&T INC 1.8%/18-05.09.2026 1,500,000 1,598,340.00 0.64EUR AUCHAN HOLDING SA 2.875%/20-290126 1,000,000 1,083,800.00 0.43EUR AUCHAN HOLDING SA 3.25%/20-23.07.2027 800,000 897,496.00 0.36USD BAIDU INC 1.72%/20-09.04.2026 450,000 385,166.56 0.15EUR BALL CORP 0.875%/19-150324 1,000,000 1,003,270.00 0.40EUR BANCO BILBAO VIZCAYA ARG (SUBORDINATED)
FIX-TO-FRN FRN/20-16.01.2030 1,500,000 1,501,470.00 0.60
EUR BANCO BILBAO VIZCAYA ARG 0.5%/20-140127 1,000,000 994,520.00 0.40EUR BANCO COMERC PORTUGUES FIX-TO-FRN
FRN/21-12.02.2027 1,000,000 969,660.00 0.39
USD BANCO DE CREDITO DEL PER 2.7%/19-11.01.2025
500,000 443,918.77 0.18
USD BANCO DE CREDITO DEL PERU CREDITO (REG. -S-) 4.25%/13-01.04.2023
500,000 450,749.62 0.18
EUR BANCO DE SABADELL SA 1.125%/19-27.03.2025
1,500,000 1,512,480.00 0.60
EUR BANCO DE SABADELL SA FF FRN/20-290623 500,000 506,315.00 0.20EUR BANKIA SA SUB FF FRN/19-150229 1,500,000 1,603,020.00 0.64EUR BANKINTER SA 0.625%/20-06.10.2027 1,000,000 996,970.00 0.40EUR BARCLAYS BANK 1.875%/16-081223 2,000,000 2,084,960.00 0.83EUR BARCLAYS FF 1.375%/18-240126 500,000 517,040.00 0.21EUR BAYER AG 0.75%/20-060127 1,200,000 1,217,028.00 0.49EUR BAYER AG SUB FF FRN/19-120579 1,600,000 1,599,984.00 0.64EUR BAYER CAPITAL CORP BV 1.5%/18-26.06.2026 1,800,000 1,889,406.00 0.75EUR BECTON DICKINSON EURO 0.334%/21-130828 400,000 392,184.00 0.16EUR BECTON DICKINSON REG S 1.9%/16-151226 900,000 964,863.00 0.38EUR BERRY GLOBAL INC 1%/20-15.01.2025 1,000,000 1,012,580.00 0.40EUR BEVCO LUX SARL 1.5%/20-16.09.2027 2,000,000 2,091,680.00 0.83EUR BNP PARIBAS 1%/17-270624 1,500,000 1,539,450.00 0.61EUR BNP PARIBAS SUB FF FRN/18-201130 1,500,000 1,597,170.00 0.64USD BOC AVIATION LTD 2.75%/20-02.12.2023 500,000 444,441.56 0.18USD BOC AVIATION LTD 3.25%/20-290425 1,000,000 899,624.11 0.36EUR BORGWARNER INC 1%/21-190531 2,000,000 1,968,780.00 0.79EUR BOSTON SCIENTIFIC CORP 0.625%/19-011227 2,000,000 2,001,940.00 0.80EUR BP CAPITAL MARKETS PLC (SUBORDINATED)
FIX-TO-FRN FRN/20-PERPETUAL 2,000,000 2,131,880.00 0.85
EUR BRITISH TELECOMMUNICATIO (SUBORDINATED) FIX-TO-FRN FRN/20-18.08.2080
1,000,000 948,180.00 0.38
EUR BRITISH TELECOMMUNICATIO 1%/17-211124 1,500,000 1,528,680.00 0.61EUR BRITISH TELECOMMUNICATIO 1.5%/17-230627 1,000,000 1,030,590.00 0.41EUR CAIXABANK SA 0.625%/19-01.10.2024 1,000,000 1,011,930.00 0.40EUR CAIXABANK SA 1.375%/19-190626 1,000,000 1,035,330.00 0.41EUR CAIXABANK SA 2.375%/19-010224 1,500,000 1,577,490.00 0.63EUR CAIXABANK SA FF FRN/21-090229 900,000 878,112.00 0.35EUR CAPGEMINI SE 2%/20-15.04.2029 800,000 886,920.00 0.35EUR CELLNEX FINANCE CO SA 1%/21-150927 1,200,000 1,163,592.00 0.46EUR CEPSA FINANCE SA 2.25%/20-13.02.2026 1,500,000 1,595,790.00 0.64EUR CHUBB INA HOLDINGS INC 1.55%/18-150328 1,000,000 1,064,500.00 0.42EUR CIE DE SAINT-GOBAIN 2.375%/20-04.10.2027 1,000,000 1,119,340.00 0.45EUR CITIGROUP INC 1.25%/19-10.04.2029 1,000,000 1,037,580.00 0.41EUR CITIGROUP INC FIX-TO-FRN FRN/19-08.10.2027 2,000,000 1,995,600.00 0.80EUR CK HUTCHISON GROUP 1.5%/19-171031 1,000,000 1,026,390.00 0.41EUR CNH INDUSTRIAL FIN EUR S 1.75%/17-
12.09.2025 1,000,000 1,051,220.00 0.42
EUR CNH INDUSTRIAL FIN EUR S 1.75%/19-250327 1,000,000 1,057,580.00 0.42EUR COMMERZBANK AG 0.25%/19-160924 2,000,000 2,002,880.00 0.80EUR COMMERZBANK AG SUB FF FRN/21-291231 1,800,000 1,754,370.00 0.70EUR CONTI-GUMMI FINANCE B.V. 1.125%/250924 700,000 719,572.00 0.29EUR CONTINENTAL AG 2.5%/20-27.08.2026 2,000,000 2,197,840.00 0.88EUR COVIVIO 1.625%/20-230630 1,000,000 1,066,430.00 0.43EUR CREDIT AGRICOLE SA 0.375%/21-200428 1,500,000 1,471,665.00 0.59EUR CREDIT AGRICOLE SUB 3%/14-221224 1,000,000 1,074,980.00 0.43USD CREDIT SUISSE GROUP FUNDING (GUERNSEY)
3.8%/16-09.06.2023 1,500,000 1,357,109.53 0.54
EUR CROWN EURO HOLDINGS SA 0.75%/19-15.02.2023
1,000,000 1,002,440.00 0.40
EUR CROWN EUROPEAN HOLDINGS (REG. -S-) 2.625%/16-30.09.2024
600,000 623,022.00 0.25
EUR DAIMLER 1.375%/16-11.05.2028 1,000,000 1,065,650.00 0.42EUR DAIMLER AG 1%/17-151127 750,000 780,765.00 0.31EUR DAIMLER AG 2%/20-22.08.2026 1,000,000 1,086,700.00 0.43EUR DAIMLER AG S. -85- 0.75%/19-08.02.2030 1,000,000 1,019,830.00 0.41EUR DANAHER CORP 2.1%/20-300926 2,000,000 2,168,300.00 0.86EUR DANONE FF 1.75%/17-PERPET 1,000,000 1,021,560.00 0.41

CS Investment Funds 1 • Audited Annual Report as at 31.10.2021
Credit Suisse (Lux) SQ Euro Corporate Bond Fund Page 50
Statement of Investments in Securities (Continued)
The notes are an integral part of the financial statements. Any differences in the percentage of Net Assets are the result of roundings.
Description Quantity /
Nominal
Valuation
(in EUR)
% of net
assets
EUR DANSKE BANK A/S FIX-TO-FRN FRN/19-27.08.2025
500,000 503,225.00 0.20
EUR DELL BANK 0.5%/21-271026 800,000 794,600.00 0.32EUR DEUTSCHE BANK AG 1.625%/20-200127 1,500,000 1,564,650.00 0.62EUR DEUTSCHE BANK AG 1.75%/18-170128 1,000,000 1,048,090.00 0.42EUR DEUTSCHE BANK AG FF FRN/20-191130 1,100,000 1,145,914.00 0.46EUR DOVER CORP 0.75%/19-041127 1,000,000 1,013,470.00 0.40EUR EDP FINANCE BV 1.5%/17-22.11.2027 3,600,000 3,828,744.00 1.53EUR ELECTRICITE DE FRANCE SA (SUBORDINATED)
FIX-TO-FRN FRN/18-PERPETUAL 800,000 851,472.00 0.34
EUR ENBW (SUBORDINATED) FIX-TO-FRN FRN/19-05.08.2079
1,500,000 1,511,910.00 0.60
EUR ENEL FINANCE INTERNATIONAL (REG. -S-) 1.375%/16-01.06.2026
1,500,000 1,575,675.00 0.63
EUR ENEL FINANCE INTL NV 0%/21-280526 1,200,000 1,185,936.00 0.47EUR ENEL FINANCE INTL NV 0.375%/21-280529 1,400,000 1,375,836.00 0.55EUR ENI SPA SUB FF FRN/20-PERPET 1,500,000 1,561,230.00 0.62EUR ERSTE GROUP BANK AG (SUBORDINATED) FIX-
TO-FRN FRN/19-10.06.2030 1,000,000 1,006,680.00 0.40
EUR FASTIGHETS AB BALDER 1%/21-200129 1,500,000 1,457,325.00 0.58EUR FIRST ABU DHABI BANK PJS 0.125%/21-
16.02.2026 2,000,000 1,995,220.00 0.80
EUR FISERV INC 0.375%/19-010723 500,000 503,875.00 0.20USD FORD MOTOR CREDIT CO LLC 2.7%/21-100826 550,000 474,128.75 0.19EUR FRESENIUS FIN IRELAND PL 2.125%/17-01022 1,100,000 1,194,996.00 0.48EUR FRESENIUS SE & CO KGAA 1.625%/20-081027 1,500,000 1,592,430.00 0.64EUR FRESENIUS SE & CO KGAA 2.875%/19-
15.02.2029 600,000 688,608.00 0.27
EUR GAZPROM (GAZ CAPITAL SA) 2.949%/240124 1,000,000 1,052,060.00 0.42EUR GENERAL MOTORS FINL CO 0.85%/20-
26.02.2026 1,000,000 1,010,310.00 0.40
EUR GENERAL MOTORS FINL CO 2.2%/19-010424 500,000 524,545.00 0.21EUR GOLDMAN SACHS GROUP 1.25%/16-010525 2,500,000 2,568,450.00 1.02EUR GOLDMAN SACHS GROUP 2%/15-270723 500,000 518,625.00 0.21EUR GOLDMAN SACHS GROUP INC 1.375%/17-
150524 2,000,000 2,042,700.00 0.81
EUR GRENKE FINANCE PLC 0.625%/19-090125 1,000,000 948,090.00 0.38EUR H.J. HEINZ REG S 2%/15-300623 800,000 822,208.00 0.33EUR HEIDELBERGCEMENT FIN LU 1.625%/17-070426 1,500,000 1,580,775.00 0.63EUR HEIDELBERGCEMENT FIN LUX 1.5%/17-140627 500,000 527,725.00 0.21EUR HEIDELBERGCEMENT FIN LUX 1.75%/18-240428 600,000 641,856.00 0.26EUR HEIMSTADEN BOSTAD 1%/21-130428 1,300,000 1,291,095.00 0.51EUR HEIMSTADEN BOSTAD 1.625%/21-131031 1,000,000 999,260.00 0.40EUR HOCHTIEF AG 0.5%/19-030927 1,000,000 996,970.00 0.40EUR HOCHTIEF AG 1.75%/18-030725 250,000 262,102.50 0.10EUR HOLCIM FINANCE LUX SA 1.75%/17-29.08.2029 900,000 965,880.00 0.39EUR HSBC HOLDINGS 3.125%/16-070628 1,500,000 1,721,565.00 0.69EUR IBERDROLA FF 1.875%/17-PERPET 1,000,000 1,021,050.00 0.41EUR IBERDROLA INTL BV SUB FF FRN/20-PERPET 1,000,000 1,020,600.00 0.41USD IND & COMM BK CHINA/SG 1%/20-090923 1,000,000 864,852.02 0.34USD IND & COMM BK CHINA/SG 1.2%/20-090925 1,000,000 852,002.59 0.34EUR INEOS QUATTRO FINANCE 2 2.5%/21-
15.01.2026 1,500,000 1,499,100.00 0.60
EUR INFRASTRUTTURE WIRELESS 1.875%/20-080726 1,000,000 1,033,640.00 0.41USD ING GROEP NV 4.1%/18-02.10.2023 1,000,000 918,772.95 0.37EUR ING GROUP (SUBORDINATED) FIX-TO-FRN
2%/18-22.03.2030 2,500,000 2,607,425.00 1.04
EUR ING GROUP FF 2.5%/17-150229 1,500,000 1,572,540.00 0.63EUR INTESA SANPAOLO 1.375%/17-180124 2,000,000 2,061,760.00 0.82EUR INTESA SANPAOLO SPA 1%/19-19.11.2026 1,500,000 1,528,710.00 0.61EUR INTESA SANPAOLO SPA 1.35%/21-240231 1,500,000 1,470,885.00 0.59EUR JEFFERIES GROUP LLC 1%/19-190724 1,000,000 1,022,700.00 0.41EUR KION GROUP AG 1.625%/20-240925 1,500,000 1,572,630.00 0.63USD KOREA GAS CORP 2.875%/19-160729 500,000 459,464.25 0.18EUR LA POSTE SA SUB FF FRN/18-PERPET 1,200,000 1,257,552.00 0.50EUR LLOYDS BANKING FRN 18-070928 1,000,000 1,028,790.00 0.41EUR LLOYDS BANKING GROUP PLC 1.5%/17-120927 1,000,000 1,067,620.00 0.43USD LUKOIL INTERNATIONAL FINANCE (REG. -S-)
4.563%/13-24.04.2023 1,000,000 904,031.11 0.36
EUR MEDIOBANCA DI CRED FIN 0.875%/19-15.01.2026
1,000,000 1,013,610.00 0.40
EUR MOLSON COORS BREWING 1.25%/16-15.07.2024
2,500,000 2,568,700.00 1.02
EUR NATL GRID ELECT TRANS 0.823%/20-07.07.2032 1,000,000 997,020.00 0.40EUR NATWEST MARKETS PLC 0.125%/21-180626 1,000,000 988,630.00 0.39EUR NATWEST MARKETS PLC 2.75%/20-020425 1,000,000 1,087,480.00 0.43EUR NIBC BANK NV 2%/19-090424 1,500,000 1,566,720.00 0.62EUR NN GROUP FF 4.5%/14-PERPET 1,000,000 1,131,790.00 0.45EUR NOKIA OYJ 2.375%/20-150525 1,500,000 1,581,795.00 0.63EUR ORANGE FF 5.25%/14-PERPET 1,500,000 1,655,940.00 0.66EUR PERKINELMER 1.875%/16-19.07.2026 1,500,000 1,596,900.00 0.64USD QTEL INTERNATIONAL (REG. -S-) 3.25%/12-
21.02.2023 1,000,000 891,008.86 0.36
EUR RAIFFEISEN BNK INTL SUB FF FRN/20-180632 1,600,000 1,722,544.00 0.69EUR REPSOL INTL FINANCE 2.625%/20-15.04.2030 1,000,000 1,162,480.00 0.46EUR REXEL SA 2.75%/19-150626 1,250,000 1,273,775.00 0.51EUR SANTANDER ISSUANCES (SUBORDINATED)
3.25%/16-04.04.2026 1,000,000 1,107,430.00 0.44
EUR SANTANDER ISSUANCES 2.5%/15-180325 400,000 427,148.00 0.17USD SAUDI ARABIAN OIL CO 2.25%/20-24.11.2030 1,800,000 1,511,486.71 0.60USD SEAGATE HDD CAYMAN 144A 3.125%/20-
150729 2,000,000 1,659,883.34 0.66
EUR SES SA 1.625%/18-220326 750,000 783,202.50 0.31EUR SIG COMBIBLOC PURCHASER 1.875%/20-
180623 1,000,000 1,026,450.00 0.41
EUR SIG COMBIBLOC PURCHASER 2.125%/20-180625
500,000 523,670.00 0.21
EUR SMITHS GROUP 2%/17-230227 1,500,000 1,610,115.00 0.64EUR SMURFIT KAPPA ACQUISIT 2.875%/18-150126 1,500,000 1,645,770.00 0.66EUR SOCIETE GENERALE 1.125%/18-23.01.2025 3,000,000 3,090,270.00 1.23
Description Quantity /
Nominal
Valuation
(in EUR)
% of net
assets
EUR SOCIETE GENERALE 1.375%/17-13.01.2028 500,000 518,550.00 0.21EUR SOCIETE GENERALE SUB FF FRN/21-300631 1,000,000 995,940.00 0.40EUR SOFTBANK GROUP CORP. 2.125%/21-060724 1,350,000 1,339,794.00 0.53EUR SPIE 3.125%/17-220324 1,000,000 1,046,510.00 0.42EUR STANDARD CHARTERED (SUBORDINATED) (REG.
-S-) 3.125%/14-19.11.2014 1,500,000 1,625,010.00 0.65
EUR TAKEDA PHARMACEUTICAL CO 1%/20-090729 1,950,000 1,995,396.00 0.80EUR TAKEDA PHARMACEUTICAL CO LTD 0.75%/20-
09.07.2027 1,500,000 1,528,470.00 0.61
EUR TELECOM ITALIA (REG. -S-) 3%/16-30.09.2025 750,000 788,587.50 0.31EUR TELECOM ITALIA SPA 2.375%/17-121027 500,000 505,600.00 0.20EUR TELEFONICA EMISIONES SAU 0.664%/20-
03.02.2030 800,000 801,552.00 0.32
EUR TELFONICA DEUTSCH FINAN 1.75%/18-05.07.2025
1,000,000 1,050,640.00 0.42
EUR TESCO CRP TREASURY SERV 0.875%/19-290526 1,000,000 1,019,720.00 0.41EUR TEVA PHARM FNC NL II S. -WI- 3.25%/18-
15.04.2022 200,000 201,020.00 0.08
EUR TEVA PHARMACEUTIC FIN II 1.25%/15-310323 650,000 648,381.50 0.26EUR TEVA PHARMACEUTICAL FINANCE II BV
1.125%/16-15.10.2024 1,450,000 1,401,207.50 0.56
EUR THE KRAFT HEINZ FOODS (REG. -S-) 2.25%/16-25.05.2028
750,000 806,655.00 0.32
EUR THYSSENKRUPP 1.375%/17-030322 500,000 500,515.00 0.20EUR TOTAL REG S FF 2.625%/15-PERPET 750,000 789,607.50 0.31EUR TOTAL SE SUB FF FRN/21-PERPET 1,300,000 1,296,763.00 0.52EUR TRATON FINANCE LUXEMBRG 0.75%/21-240329 1,700,000 1,680,790.00 0.67USD UBS AG SUB 5.125%/14-150524 500,000 470,028.08 0.19USD UBS GROUP INC. FRN/20-300127 1,050,000 891,418.02 0.36EUR UNIBAIL-RODAMCO FIX-TO-FLOATERS
2.125%/18- PERPETTUAL 700,000 690,137.00 0.28
EUR UNIBAILRODAMCOREG S 101 1.375%/16-090326 1,000,000 1,048,020.00 0.42EUR UNIBAIL-RODAMCO-WESTFLD 0.625%/20-
040527 1,300,000 1,304,433.00 0.52
EUR UNICREDIT SPA 1%/18-180123 1,500,000 1,519,815.00 0.61EUR UNICREDIT SPA FF FRN/19-030725 500,000 514,730.00 0.21EUR UNICREDIT SPA FF FRN/20-160626 1,200,000 1,231,500.00 0.49EUR UNICREDIT SPA FF FRN/20-220727 1,500,000 1,582,110.00 0.63EUR VERTICAL MIDCO GMBH 4.375%/20-15.07.2027 300,000 309,243.00 0.12EUR VODAFONE GROUP PLC (SUBORDINATED) FIX-
TO-FRN FRN/18-03.01.2079 500,000 517,235.00 0.21
EUR VODAFONE GROUP PLC 1.125%/17-20.11.2025 1,500,000 1,555,830.00 0.62EUR VOLKSWAGEN BANK GMBH 1.25%/18-100624 700,000 720,699.00 0.29EUR VOLKSWAGEN FIN NV SUB FF FRN/20-PERPET 1,800,000 1,924,992.00 0.77EUR VOLKSWAGEN FIN SERV 0.875%/18-120423 2,000,000 2,027,380.00 0.81EUR VOLKSWAGEN FIN SERV AG 2.25%/18-
16.10.2026 1,250,000 1,358,550.00 0.54
EUR VOLKSWAGEN FIN SERV AG 3.375%/20-06.04.2028
1,250,000 1,457,550.00 0.58
EUR VOLKSWAGEN INTERNATIONAL FINANCE (SUBORDINATED) FIX-TO-FRN 3.5%/15-PERPETUAL
400,000 430,600.00 0.17
EUR VOLKSWAGEN INTERNATIONAL FINANCE (SUBORDINATED) FIX-TO-FRN 3.875%/17 PERPETUAL
1,500,000 1,638,675.00 0.65
EUR VOLVO TREASURY AB 0%/21-180526 1,000,000 991,290.00 0.40EUR VW INTL FINANCE 1.875%/17-300327 1,000,000 1,076,240.00 0.43EUR WELLS FARGO & COMPANY 0.625%/19-250330 1,000,000 974,740.00 0.39EUR WELLS FARGO & COMPANY 1.5%/17-24.05.2027 1,000,000 1,046,270.00 0.42EUR WELLS FARGO REG S S 64 1.625%/15-020625 1,000,000 1,048,390.00 0.42EUR WENDEL 2.75%/14-02.10.2024 1,000,000 1,071,030.00 0.43EUR ZURICH FINANCE IRELAND (SUBORDINATED)
FIX-TO-FRN FRN/20-17.09.2050 2,000,000 2,071,400.00 0.83
Total Bonds 247,788,278.25 98.82
Total securities listed on a stock exchange or other
organised markets 247,788,278.25 98.82
Total of Portfolio 247,788,278.25 98.82
Cash at banks and at brokers 801,554.34 0.32
Other net assets 2,156,485.06 0.86
Total net assets 250,746,317.65 100.00

CS Investment Funds 1 • Audited Annual Report as at 31.10.2021
Credit Suisse (Lux) European Sovereign Plus Bond Fund Page 51
Technical Data and Notes
Technical Data
Valoren ISIN Management Fee Total Expense Ratio
EB - Capitalisation EUR 11943534 LU0554754233 0.45% 0.68%
EBH - Capitalisation CHF 11943536 LU0554756014 0.45% 0.76%
EBH - Capitalisation USD 11943537 LU0554756444 0.45% 0.76%
Fund Performance
YTD Since Inception 2020 2019 2018
EB - Capitalisation EUR -3.79% / 5.64% 9.18% -0.24%
EBH - Capitalisation CHF -4.09% / 5.28% 8.68% -0.61%
EBH - Capitalisation USD -3.27% / 7.30% 12.32% 2.58%
Notes
Forward foreign exchange contracts
Purchases Sales Maturity Valuation
Counterparty (In EUR)
EUR 1,919 USD -2,220 09.11.2021 1.14
Credit Suisse (Schweiz) AG - Zurich - Switzerland
USD 5,400 EUR -4,544 09.11.2021 121.34
Credit Suisse (Schweiz) AG - Zurich - Switzerland
CHF 602,900 EUR -555,456 09.11.2021 14,759.00
Credit Suisse (Schweiz) AG - Zurich - Switzerland
EUR 1,552,669 CHF -1,677,900 09.11.2021 -34,264.74
Credit Suisse (Schweiz) AG - Zurich - Switzerland
CHF 3,037,100 EUR -2,832,497 09.11.2021 39,953.72
Credit Suisse (Schweiz) AG - Zurich - Switzerland
EUR 13,709 CHF -14,700 09.11.2021 -194.01
Credit Suisse (Schweiz) AG - Zurich - Switzerland
CHF 41,800 EUR -39,004 09.11.2021 530.18
Credit Suisse (Schweiz) AG - Zurich - Switzerland
USD 332,900 EUR -281,492 09.11.2021 6,112.63
Credit Suisse (Schweiz) AG - Zurich - Switzerland
CHF 41,800 EUR -39,010 09.12.2021 531.64
Credit Suisse (Schweiz) AG - Zurich - Switzerland
USD 338,300 EUR -284,503 09.12.2021 7,566.95
Credit Suisse (Schweiz) AG - Zurich - Switzerland
CHF 1,962,100 EUR -1,807,979 09.12.2021 48,096.56
Credit Suisse (Schweiz) AG - Zurich - Switzerland
USD 318,700 EUR -275,127 11.01.2022 -264.81
Credit Suisse (Schweiz) AG - Zurich - Switzerland
CHF 2,003,900 EUR -1,870,309 11.01.2022 25,556.56
Credit Suisse (Schweiz) AG - Zurich - Switzerland
Net unrealised gain on forward foreign exchange contracts 108,506.16

CS Investment Funds 1 • Audited Annual Report as at 31.10.2021
Credit Suisse (Lux) European Sovereign Plus Bond Fund Page 52
Statement of Net Assets (in EUR) and Fund Evolution
The notes are an integral part of the financial statements.
31.10.2021
Assets
Investments in securities at market value 53,419,368.65Cash at banks and at brokers 1,391,970.89Income receivable 270,892.96Net unrealised gain on forward foreign exchange contracts 108,506.16
55,190,738.66
Liabilities
Provisions for accrued expenses 26,411.80
26,411.80
Net assets 55,164,326.86
Fund Evolution 31.10.2021 31.10.2020 31.10.2019
Total net assets EUR 55,164,326.86 70,313,150.84 72,889,533.39
Net asset value per share
EB - Capitalisation EUR 146.10 150.40 146.71
EBH - Capitalisation CHF 137.03 141.61 138.60
EBH - Capitalisation USD 163.39 167.00 159.89
Number of shares outstanding At the end of the year At the beginning of
the year
Number of shares
issued
Number of shares
redeemed
EB - Capitalisation EUR 333,366.348 400,275.528 26,569.110 93,478.290
EBH - Capitalisation CHF 43,290.000 67,015.000 7,975.000 31,700.000
EBH - Capitalisation USD 6,015.000 8,530.000 455.000 2,970.000
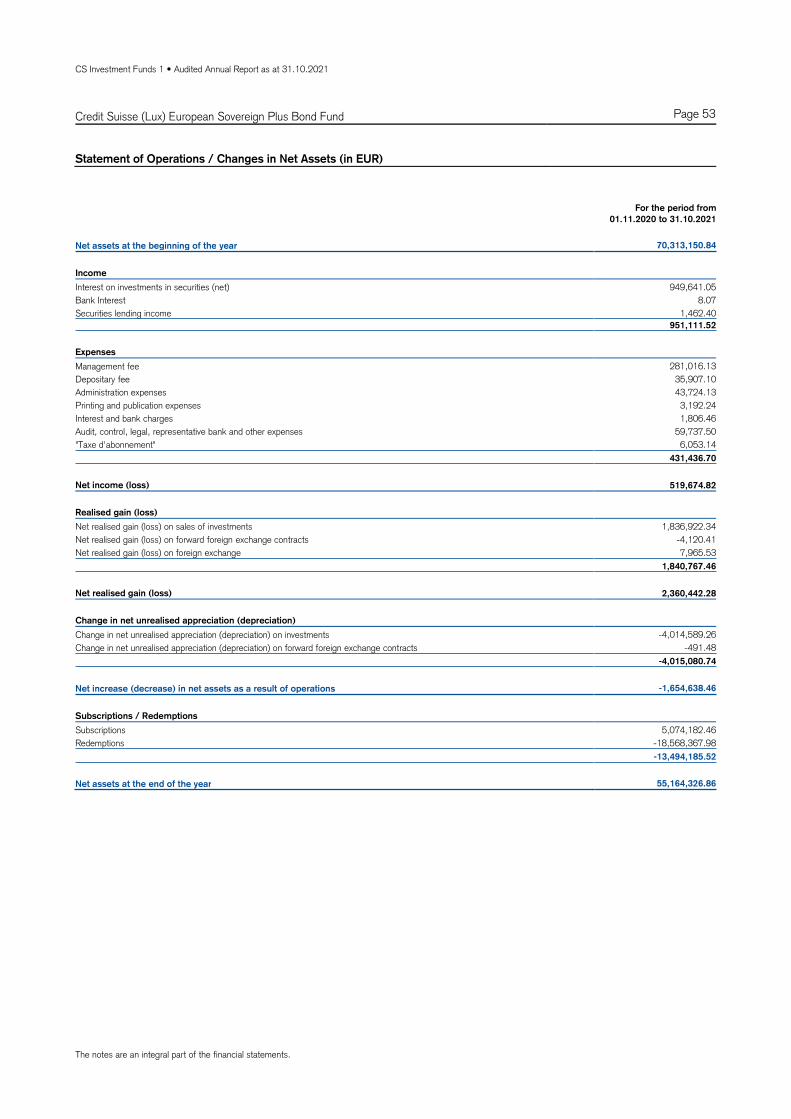
CS Investment Funds 1 • Audited Annual Report as at 31.10.2021
Credit Suisse (Lux) European Sovereign Plus Bond Fund Page 53
Statement of Operations / Changes in Net Assets (in EUR)
The notes are an integral part of the financial statements.
For the period from
01.11.2020 to 31.10.2021
Net assets at the beginning of the year 70,313,150.84
Income
Interest on investments in securities (net) 949,641.05
Bank Interest 8.07
Securities lending income 1,462.40
951,111.52
Expenses
Management fee 281,016.13
Depositary fee 35,907.10
Administration expenses 43,724.13
Printing and publication expenses 3,192.24
Interest and bank charges 1,806.46
Audit, control, legal, representative bank and other expenses 59,737.50
"Taxe d'abonnement" 6,053.14
431,436.70
Net income (loss) 519,674.82
Realised gain (loss)
Net realised gain (loss) on sales of investments 1,836,922.34
Net realised gain (loss) on forward foreign exchange contracts -4,120.41
Net realised gain (loss) on foreign exchange 7,965.53
1,840,767.46
Net realised gain (loss) 2,360,442.28
Change in net unrealised appreciation (depreciation)
Change in net unrealised appreciation (depreciation) on investments -4,014,589.26
Change in net unrealised appreciation (depreciation) on forward foreign exchange contracts -491.48
-4,015,080.74
Net increase (decrease) in net assets as a result of operations -1,654,638.46
Subscriptions / Redemptions
Subscriptions 5,074,182.46
Redemptions -18,568,367.98
-13,494,185.52
Net assets at the end of the year 55,164,326.86

CS Investment Funds 1 • Audited Annual Report as at 31.10.2021
Credit Suisse (Lux) European Sovereign Plus Bond Fund Page 54
Statement of Investments in Securities
The notes are an integral part of the financial statements. Any differences in the percentage of Net Assets are the result of roundings.
Breakdown by Country
Italy 43.19
Spain 35.67
Belgium 12.63
Cyprus 2.40
Ireland 2.24
Portugal 0.70
Total 96.84
Breakdown by Economic Sector
Countries and central governments 91.04
Banks and other credit institutions 3.46
Financial, investment and other div. companies 0.89
Environmental services and recycling 0.76
Telecommunication 0.69
Total 96.84
Statement of Investments in Securities
Description Quantity /
Nominal
Valuation
(in EUR)
% of net
assets
Securities listed on a stock exchange or other organised
markets
Bonds
EUR BANCO COMERC PORTUGUES FIX-TO-FRN FRN/21-12.02.2027
400,000 387,864.00 0.70
EUR BELGIUM KINGDOM 1.25%/18-220433 550,000 611,308.50 1.11EUR BELGIUM KINGDOM 144A 0.4%/20-220640 900,000 865,008.00 1.57EUR BELGIUM KINGDOM 144A 0.65%/21-220671 150,000 129,570.00 0.23EUR BELGIUM KINGDOM 144A 1.45%/17-220637 800,000 914,384.00 1.66EUR BELGIUM OLO S 73 3%/14-220634 850,000 1,128,434.50 2.05EUR BELGIUM OLO S 75 REG S 1%/15-220631 750,000 809,865.00 1.47EUR BELGIUM OLO S 78 REG S 1.6%/16-220647 400,000 477,472.00 0.87EUR BELGIUM OLO S 79 0.20%/16-221023 2,000,000 2,031,660.00 3.68EUR BONOS Y DEL ESTADO 144A 0.1%/21-300431 250,000 239,870.00 0.43EUR BONOS Y OBLIG D ESTADO 144A 1%/20-311050 500,000 463,760.00 0.84EUR BONOS Y OBLIG DEL ESTA 144A1.85%/300735 600,000 679,692.00 1.23EUR BONOS Y OBLIG DEL ESTAD 144A 1.2%/311040 650,000 664,508.00 1.20EUR BONOS Y OBLIG DEL ESTADO 0%/20-310125 3,000,000 3,026,190.00 5.49EUR BONOS Y OBLIG DEL ESTADO 0.5%/20-300430 2,150,000 2,166,813.00 3.93EUR BONOS Y OBLIG DEL ESTADO 0.8%/20-300727 150,000 156,136.50 0.28EUR BONOS Y OBLIG DEL ESTADO 1.25%/20-311030 500,000 534,325.00 0.97EUR BONOS Y OBLIG DEL ESTADO 1.4%/18-300428 600,000 647,442.00 1.17EUR BONOS Y OBLIG DEL ESTADO 1.45%/21-311071 250,000 227,095.00 0.41EUR BONOS Y OBLIG DEL ESTADO 144A 0.6%/19-31 1,800,000 1,836,018.00 3.33EUR BONOS Y OBLIG DEL ESTADO 144A 1.4/300728 1,200,000 1,297,680.00 2.35EUR BONOS Y OBLIG DEL ESTADO 144A 1.45%/17-3 1,100,000 1,189,056.00 2.16EUR BUONI POLIENNALI DEL 144A 1.45%/010336 1,500,000 1,502,970.00 2.72EUR BUONI POLIENNALI DEL 144A 1.8%/010341 650,000 663,968.50 1.20EUR BUONI POLIENNALI DEL TES 0%/20-150124 600,000 600,906.00 1.09EUR BUONI POLIENNALI DEL TES 0.35%/19-010225 1,750,000 1,762,757.50 3.20EUR BUONI POLIENNALI DEL TES 0.85%/19-150127 1,000,000 1,017,690.00 1.84EUR BUONI POLIENNALI DEL TES 0.9%/20-010431 550,000 540,969.00 0.98EUR BUONI POLIENNALI DEL TES 0.95%/20-010830 800,000 796,424.00 1.44EUR BUONI POLIENNALI DEL TES 0.95%/21-010337 750,000 694,987.50 1.26EUR BUONI POLIENNALI DEL TES 1.35%/19-010430 1,050,000 1,083,211.50 1.96EUR BUONI POLIENNALI DEL TES 1.45%/17-151124 800,000 833,160.00 1.51EUR BUONI POLIENNALI DEL TES 1.45%/18-150525 1,150,000 1,202,302.00 2.18EUR BUONI POLIENNALI DEL TES 1.5%/21-300445 750,000 716,790.00 1.30EUR BUONI POLIENNALI DEL TES 2%/18-010228 1,000,000 1,082,730.00 1.96EUR BUONI POLIENNALI DEL TES 2.05%/17-010827 1,600,000 1,732,160.00 3.14EUR BUONI POLIENNALI DT 144A 0.6%/21-010831 1,000,000 951,920.00 1.73EUR CAIXABANK SA 0.625%/19-01.10.2024 500,000 505,965.00 0.92EUR CELLNEX FINANCE CO SA 0.75%/21-15.11.2026 500,000 490,220.00 0.89EUR IRELAND 1.7%/17-150537 300,000 352,875.00 0.64EUR IRISH TSY 0.4% 2035 0.4%/20-150535 500,000 496,325.00 0.90EUR IRISH TSY 1.35% 2031 1.35%/18-180331 350,000 387,026.50 0.70EUR ITALY BTP 1.25%/16-011226 50,000 51,990.00 0.09EUR ITALY BTP 1.65%/15-010332 1,500,000 1,569,600.00 2.85EUR ITALY BTP 2%/15-011225 3,000,000 3,210,330.00 5.82EUR ITALY BTP 2.25%/16-010936 350,000 387,355.50 0.70EUR ITALY BTP 2.7%/16-010347 1,250,000 1,479,512.50 2.68EUR ITALY BTP 2.8%/16-010367 300,000 350,877.00 0.64EUR ITALY BTP 4%/05-010237 150,000 201,133.50 0.36EUR REPUBLIC OF CYPRUS 0%/21-090226 1,330,000 1,324,919.40 2.40EUR SERVICIOS MEDIO AMBIENT 1.661%/19-041226 400,000 420,216.00 0.76EUR SPAIN 1.3%/16-311026 1,600,000 1,708,560.00 3.10EUR SPAIN 1.95%/15-300730 750,000 848,017.50 1.54EUR SPAIN 2.9%/16-311046 650,000 891,475.00 1.62EUR SPAIN 4.2%/05-310137 575,000 852,236.25 1.54EUR SPAIN 4.7%/09-300741 500,000 829,555.00 1.50EUR TELECOM ITALIA SPA 1.625%/21-180129 400,000 380,872.00 0.69EUR UNICREDIT SPA 1%/18-180123 1,000,000 1,013,210.00 1.84
Total Bonds 53,419,368.65 96.84
Total securities listed on a stock exchange or other
organised markets 53,419,368.65 96.84
Total of Portfolio 53,419,368.65 96.84
Cash at banks and at brokers 1,391,970.89 2.52
Other net assets 352,987.32 0.64
Total net assets 55,164,326.86 100.00

CS Investment Funds 1 • Audited Annual Report as at 31.10.2021
Credit Suisse (Lux) Global High Yield Bond Fund Page 55
Technical Data and Notes
Technical Data
Valoren ISIN Management Fee Total Expense Ratio
B - Capitalisation USD 10671030 LU0458987335 1.20% 1.40%
DB - Capitalisation USD 3679056 LU0340004091 0.00% 0.12%
EA - Distribution USD 56484303 LU2215766085 0.52% 0.68%
EB - Capitalisation USD 3679053 LU0340003523 0.52% 0.68%
MB - Capitalisation USD 27057495 LU1189105080 0.30% 0.47%
BH - Capitalisation CHF 10671043 LU0458987418 1.20% 1.40%
DBH - Capitalisation CHF 23143246 LU1007181461 0.00% 0.11%
EBH - Capitalisation CHF 3679067 LU0340004760 0.52% 0.68%
EBH - Capitalisation EUR 3679066 LU0340004505 0.52% 0.68%
MBH - Capitalisation EUR 51057144 LU2080572279 0.30% 0.47%
There is no Management fee for the -DB- and -DBH- shares.
Fund Performance
YTD Since Inception 2020 2019 2018
B - Capitalisation USD 3.04% / 4.04% 14.18% -2.81%
DB - Capitalisation USD 4.15% / 5.34% 15.63% -1.56%
EA - Distribution USD 3.66% 9.14% / / /
EB - Capitalisation USD 3.66% / 4.71% 14.97% -2.12%
MB - Capitalisation USD 3.85% / 4.95% 15.22% -1.90%
BH - Capitalisation CHF 2.20% / 1.78% 10.48% -5.93%
DBH - Capitalisation CHF 3.31% / 3.05% 11.97% -4.71%
EBH - Capitalisation CHF 2.86% / 2.45% 11.20% -5.24%
EBH - Capitalisation EUR 2.99% / 2.83% 11.59% -4.82%
MBH - Capitalisation EUR 3.20% 7.82% 3.06% / /
Distribution
Ex-Date Amount
EA - Distribution USD 01.12.2020 9.57
EA - Distribution USD 02.03.2021 12.03
EA - Distribution USD 01.06.2021 11.78
EA - Distribution USD 07.09.2021 11.24
Notes
Forward foreign exchange contracts
Purchases Sales Maturity Valuation
Counterparty (In USD)
USD 1,026,875 GBP -750,000 13.12.2021 -1,307.09
Morgan Stanley Capital Services LLC - New-York - USA
USD 3,506,380 EUR -3,000,000 13.12.2021 31,022.25
Canadian Imperial Bank of Commerce - Toronto - Canada
USD 965,482 GBP -700,000 13.12.2021 5,844.29
BNP Paribas S.A.- Paris - France
USD 384,491 EUR -331,000 13.12.2021 1,045.36
Canadian Imperial Bank of Commerce - Toronto - Canada
USD 1,172,326 EUR -1,000,000 13.12.2021 13,869.71
BNP Paribas S.A.- Paris - France
USD 1,175,128 EUR -1,000,000 13.12.2021 16,668.83
Canadian Imperial Bank of Commerce - Toronto - Canada
EUR 2,500,000 USD -2,943,145 13.12.2021 -47,040.00
Goldman Sachs International - London - United Kingdom
GBP 250,000 USD -344,772 13.12.2021 -2,044.75
BNP Paribas S.A.- Paris - France
USD 324,575 EUR -275,000 13.12.2021 5,997.08
Morgan Stanley Capital Services LLC - New-York - USA

CS Investment Funds 1 • Audited Annual Report as at 31.10.2021
Credit Suisse (Lux) Global High Yield Bond Fund Page 56
Technical Data and Notes (Continued)
Forward foreign exchange contracts
Purchases Sales Maturity Valuation
Counterparty (In USD)
USD 1,769,102 EUR -1,500,000 13.12.2021 31,406.16
Morgan Stanley Capital Services LLC - New-York - USA
USD 571,809 EUR -481,779 13.12.2021 13,681.92
Morgan Stanley Capital Services LLC - New-York - USA
USD 691,132 GBP -500,000 13.12.2021 5,676.01
Barclays Bank PLC Wholesale - London - United Kingdom
USD 610,992 EUR -500,000 13.12.2021 31,738.81
Morgan Stanley Capital Services LLC - New-York - USA
USD 366,698 EUR -300,000 13.12.2021 19,145.84
Canadian Imperial Bank of Commerce - Toronto - Canada
USD 2,129,290 GBP -1,500,000 13.12.2021 72,916.62
Morgan Stanley Capital Services LLC - New-York - USA
USD 2,410,992 EUR -2,000,000 13.12.2021 94,011.17
Morgan Stanley Capital Services LLC - New-York - USA
USD 2,428,839 EUR -2,000,000 13.12.2021 111,840.00
Canadian Imperial Bank of Commerce - Toronto - Canada
USD 2,359,900 GBP -1,700,000 13.12.2021 29,349.47
Barclays Bank PLC Wholesale - London - United Kingdom
USD 604,326 EUR -500,000 13.12.2021 25,079.37
Canadian Imperial Bank of Commerce - Toronto - Canada
EUR 1,419,508 USD -1,685,784 13.12.2021 -41,367.29
Morgan Stanley Capital Services LLC - New-York - USA
USD 909,251 EUR -750,000 13.12.2021 40,377.79
Canadian Imperial Bank of Commerce - Toronto - Canada
USD 1,224,566 EUR -1,000,000 13.12.2021 66,056.45
Canadian Imperial Bank of Commerce - Toronto - Canada
USD 81,842 GBP -59,557 13.12.2021 194.14
Citibank N.A.- London - United Kingdom
USD 2,046,704 GBP -1,500,000 13.12.2021 -9,660.33
Morgan Stanley Capital Services LLC - New-York - USA
USD 123,331 GBP -92,000 13.12.2021 -2,791.94
Morgan Stanley Capital Services LLC - New-York - USA
USD 3,710,985 EUR -3,000,000 13.12.2021 235,416.51
Morgan Stanley Capital Services LLC - New-York - USA
USD 2,141,018 EUR -1,750,000 13.12.2021 113,627.72
Morgan Stanley Capital Services LLC - New-York - USA
USD 144,369,785 EUR -118,266,577 13.12.2021 7,357,236.41
Morgan Stanley Capital Services LLC - New-York - USA
EUR 1,700,000 USD -1,981,630 13.12.2021 -12,278.93
Canadian Imperial Bank of Commerce - Toronto - Canada
USD 963,068 GBP -700,000 13.12.2021 3,430.98
BNP Paribas S.A.- Paris - France
USD 1,156,859 EUR -1,000,000 13.12.2021 -1,581.37
Barclays Bank PLC Wholesale - London - United Kingdom
USD 744,374 GBP -550,000 13.12.2021 -9,624.93
BNP Paribas S.A.- Paris - France
USD 292,366 EUR -250,000 13.12.2021 2,752.16
Morgan Stanley Capital Services LLC - New-York - USA
USD 351,700 EUR -300,000 13.12.2021 4,162.69
Canadian Imperial Bank of Commerce - Toronto - Canada
EUR 3,300,000 USD -3,917,074 13.12.2021 -94,215.00
BNP Paribas S.A.- Paris - France
USD 919,997 GBP -675,000 13.12.2021 -5,366.54
Canadian Imperial Bank of Commerce - Toronto - Canada
USD 203,857 GBP -147,890 13.12.2021 1,112.30
Citibank N.A.- London - United Kingdom
USD 598,575 EUR -500,000 13.12.2021 19,333.84
Canadian Imperial Bank of Commerce - Toronto - Canada
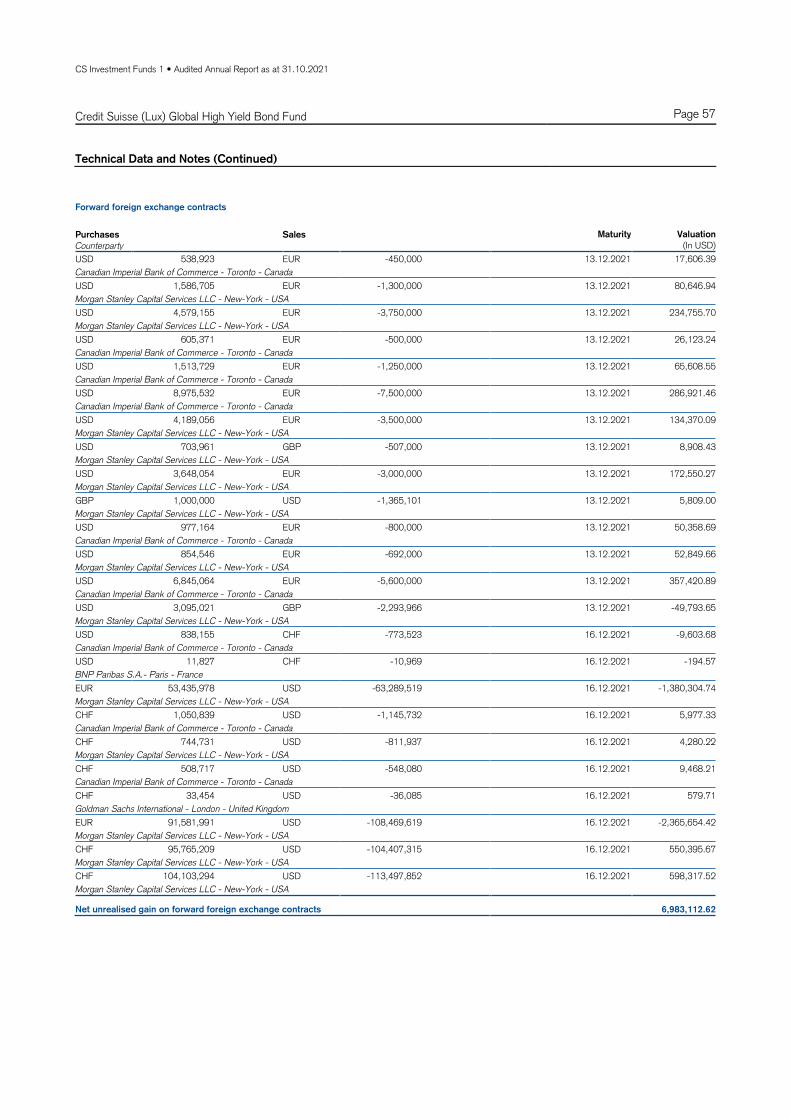
CS Investment Funds 1 • Audited Annual Report as at 31.10.2021
Credit Suisse (Lux) Global High Yield Bond Fund Page 57
Technical Data and Notes (Continued)
Forward foreign exchange contracts
Purchases Sales Maturity Valuation
Counterparty (In USD)
USD 538,923 EUR -450,000 13.12.2021 17,606.39
Canadian Imperial Bank of Commerce - Toronto - Canada
USD 1,586,705 EUR -1,300,000 13.12.2021 80,646.94
Morgan Stanley Capital Services LLC - New-York - USA
USD 4,579,155 EUR -3,750,000 13.12.2021 234,755.70
Morgan Stanley Capital Services LLC - New-York - USA
USD 605,371 EUR -500,000 13.12.2021 26,123.24
Canadian Imperial Bank of Commerce - Toronto - Canada
USD 1,513,729 EUR -1,250,000 13.12.2021 65,608.55
Canadian Imperial Bank of Commerce - Toronto - Canada
USD 8,975,532 EUR -7,500,000 13.12.2021 286,921.46
Canadian Imperial Bank of Commerce - Toronto - Canada
USD 4,189,056 EUR -3,500,000 13.12.2021 134,370.09
Morgan Stanley Capital Services LLC - New-York - USA
USD 703,961 GBP -507,000 13.12.2021 8,908.43
Morgan Stanley Capital Services LLC - New-York - USA
USD 3,648,054 EUR -3,000,000 13.12.2021 172,550.27
Morgan Stanley Capital Services LLC - New-York - USA
GBP 1,000,000 USD -1,365,101 13.12.2021 5,809.00
Morgan Stanley Capital Services LLC - New-York - USA
USD 977,164 EUR -800,000 13.12.2021 50,358.69
Canadian Imperial Bank of Commerce - Toronto - Canada
USD 854,546 EUR -692,000 13.12.2021 52,849.66
Morgan Stanley Capital Services LLC - New-York - USA
USD 6,845,064 EUR -5,600,000 13.12.2021 357,420.89
Canadian Imperial Bank of Commerce - Toronto - Canada
USD 3,095,021 GBP -2,293,966 13.12.2021 -49,793.65
Morgan Stanley Capital Services LLC - New-York - USA
USD 838,155 CHF -773,523 16.12.2021 -9,603.68
Canadian Imperial Bank of Commerce - Toronto - Canada
USD 11,827 CHF -10,969 16.12.2021 -194.57
BNP Paribas S.A.- Paris - France
EUR 53,435,978 USD -63,289,519 16.12.2021 -1,380,304.74
Morgan Stanley Capital Services LLC - New-York - USA
CHF 1,050,839 USD -1,145,732 16.12.2021 5,977.33
Canadian Imperial Bank of Commerce - Toronto - Canada
CHF 744,731 USD -811,937 16.12.2021 4,280.22
Morgan Stanley Capital Services LLC - New-York - USA
CHF 508,717 USD -548,080 16.12.2021 9,468.21
Canadian Imperial Bank of Commerce - Toronto - Canada
CHF 33,454 USD -36,085 16.12.2021 579.71
Goldman Sachs International - London - United Kingdom
EUR 91,581,991 USD -108,469,619 16.12.2021 -2,365,654.42
Morgan Stanley Capital Services LLC - New-York - USA
CHF 95,765,209 USD -104,407,315 16.12.2021 550,395.67
Morgan Stanley Capital Services LLC - New-York - USA
CHF 104,103,294 USD -113,497,852 16.12.2021 598,317.52
Morgan Stanley Capital Services LLC - New-York - USA
Net unrealised gain on forward foreign exchange contracts 6,983,112.62

CS Investment Funds 1 • Audited Annual Report as at 31.10.2021
Credit Suisse (Lux) Global High Yield Bond Fund Page 58
Statement of Net Assets (in USD) and Fund Evolution
The notes are an integral part of the financial statements.
31.10.2021
Assets
Investments in securities at market value 948,146,933.17Cash at banks and at brokers 32,565,781.79Subscriptions receivable 975,108.15Income receivable 13,314,973.71Net unrealised gain on forward foreign exchange contracts 6,983,112.62
1,001,985,909.44
Liabilities
Due to banks and to brokers 6,677,335.25Redemptions payable 104,438.51Provisions for accrued expenses 345,759.64Other liabilities 36,734.51
7,164,267.91
Net assets 994,821,641.53
Fund Evolution 31.10.2021 31.10.2020 31.10.2019
Total net assets USD 994,821,641.53 814,559,441.87 583,165,118.03
Net asset value per share
B - Capitalisation USD 138.64 128.44 126.74
DB - Capitalisation USD 1,426.79 1,304.85 1,271.96
EA - Distribution USD 1,045.91 1,003.83 /
EB - Capitalisation USD 250.74 230.61 226.14
MB - Capitalisation USD 1,386.94 1,272.83 1,245.38
BH - Capitalisation CHF 120.82 113.11 114.42
DBH - Capitalisation CHF 1,325.28 1,224.69 1,223.62
EBH - Capitalisation CHF 204.05 189.56 190.59
EBH - Capitalisation EUR 219.18 203.27 203.57
MBH - Capitalisation EUR 1,078.15 997.68 /
Number of shares outstanding At the end of the year At the beginning of
the year
Number of shares
issued
Number of shares
redeemed
B - Capitalisation USD 7,385.143 4,390.395 4,470.330 1,475.582
DB - Capitalisation USD 119,999.856 31,017.728 101,152.880 12,170.752
EA - Distribution USD 39,967.130 26,060.827 19,180.492 5,274.189
EB - Capitalisation USD 619,889.103 608,879.386 149,740.812 138,731.095
MB - Capitalisation USD 171,922.347 218,302.330 4,165.000 50,544.983
BH - Capitalisation CHF 6,355.088 7,310.250 884.838 1,840.000
DBH - Capitalisation CHF 77,409.977 73,635.404 7,580.433 3,805.860
EBH - Capitalisation CHF 474,265.869 398,164.927 112,533.839 36,432.897
EBH - Capitalisation EUR 417,945.249 379,324.218 106,902.585 68,281.554
MBH - Capitalisation EUR 49,588.960 49,588.960 0.000 0.000

CS Investment Funds 1 • Audited Annual Report as at 31.10.2021
Credit Suisse (Lux) Global High Yield Bond Fund Page 59
Statement of Operations / Changes in Net Assets (in USD)
The notes are an integral part of the financial statements.
For the period from
01.11.2020 to 31.10.2021
Net assets at the beginning of the year 814,559,441.87
Income
Interest on investments in securities (net) 48,338,043.02
Bank Interest 518.80
Securities lending income 191,567.34
48,530,129.16
Expenses
Management fee 2,981,023.74
Depositary fee 545,986.34
Administration expenses 641,189.39
Printing and publication expenses 11,698.65
Interest and bank charges 28,312.77
Audit, control, legal, representative bank and other expenses 194,876.44
"Taxe d'abonnement" 72,264.70
4,475,352.03
Net income (loss) 44,054,777.13
Realised gain (loss)
Net realised gain (loss) on sales of investments 6,883,707.64
Net realised gain (loss) on forward foreign exchange contracts -17,853,173.14
Net realised gain (loss) on foreign exchange 15,764.99
-10,953,700.51
Net realised gain (loss) 33,101,076.62
Change in net unrealised appreciation (depreciation)
Change in net unrealised appreciation (depreciation) on investments 21,385,354.71
Change in net unrealised appreciation (depreciation) on forward foreign exchange contracts 17,463,419.92
38,848,774.63
Net increase (decrease) in net assets as a result of operations 71,949,851.25
Subscriptions / Redemptions
Subscriptions 267,439,394.18
Redemptions -157,654,779.36
109,784,614.82
Distribution -1,472,266.41
Net assets at the end of the year 994,821,641.53

CS Investment Funds 1 • Audited Annual Report as at 31.10.2021
Credit Suisse (Lux) Global High Yield Bond Fund Page 60
Statement of Investments in Securities
The notes are an integral part of the financial statements. Any differences in the percentage of Net Assets are the result of roundings.
Breakdown by Country
USA 65.23
Luxembourg 4.78
Netherlands 4.32
Canada 3.99
United Kingdom 2.76
Germany 2.74
France 2.36
Ireland 2.24
Italy 2.08
Spain 1.44
Sweden 0.97
Cayman Islands 0.75
Marshall Islands 0.43
Norway 0.42
Isle of Man 0.24
Belgium 0.22
Portugal 0.14
Romania 0.12
Mauritius 0.10
Total 95.31
Breakdown by Economic Sector
Financial, investment and other div. companies 37.93
Internet, software and IT services 4.66
Lodging and catering industry, leisure facilities 4.34
Telecommunication 4.04
Real estate 4.01
Pharmaceuticals, cosmetics and medical products 3.50
Petroleum 3.34
Miscellaneous services 3.31
Building materials and building industry 3.00
Vehicles 2.57
Healthcare and social services 2.57
Mechanical engineering and industrial equipment 2.49
Electronics and semiconductors 2.22
Chemicals 1.86
Energy and water supply 1.81
Packaging industries 1.57
Environmental services and recycling 1.33
Miscellaneous consumer goods 1.20
Mining, coal and steel industry 1.16
Traffic and transportation 1.11
Electrical appliances and components 1.08
Textiles, garments and leather goods 0.83
Biotechnology 0.79
Computer hardware and networking 0.68
Banks and other credit institutions 0.58
Non-classifiable/non-classified institutions 0.55
Graphics publishing and printing media 0.54
Non-ferrous metals 0.49
Insurance companies 0.45
Retailing, department stores 0.39
Aeronautic and astronautic industry 0.35
Agriculture and fishery 0.34
Food and soft drinks 0.20
Total 95.31
Statement of Investments in Securities
Description Quantity /
Nominal
Valuation
(in USD)
% of net
assets
Securities listed on a stock exchange or other organised
markets
Shares
USD PATTERSON-UTI ENERGY 88,264 755,539.84 0.08USD SANDRIDGE ENERGY A WTS 100422 8,752 437.60 0.00USD SANDRIDGE ENERGY B WTS 041022 3,685 176.88 0.00EUR SOLOCAL GROUP 203,669 307,583.22 0.03
Total Shares 1,063,737.54 0.11
Bonds
USD 1011778 BC / NEW RED 144A 3.5%/150229 1,000,000 970,420.00 0.10USD 180 MEDICAL INC 144A 3.875%/21-151029 3,400,000 3,424,446.00 0.34USD ABC SUPPLY CO INC 144A 4%/19-150128 4,425,000 4,510,092.75 0.45USD ACRISURE LLC / FIN 144A 7%/17-151125 3,001,000 3,040,043.01 0.31USD ACRISURE LLC / FIN INC -144A- 10.125%/19-
01.08.2026 1,250,000 1,392,762.50 0.14
USD ADAMS HOMES INC 144A 7.5%/20-150225 1,000,000 1,049,160.00 0.11EUR ADEVINTA ASA 2.625%/20-151125 2,500,000 2,951,190.02 0.30EUR ADEVINTA ASA 3%/20-151127 1,000,000 1,179,260.90 0.12USD ADVANCED DRAINAGE SYS 144A 5%/19-300927 4,500,000 4,696,965.00 0.47EUR AEDAS HOMES OPCO SLU 4%/21-150826 250,000 295,341.77 0.03USD AG ISSUER LLC 144A 6.25%/20-010328 5,126,000 5,352,107.86 0.54USD ALCOA NEDERLAND 144A 4.125%/21-310329 1,440,000 1,499,414.40 0.15USD ALLIANT HOLD / CO-ISS 144A 6.75%/151027 1,531,000 1,586,667.16 0.16USD ALLIANT HOLD / CO-ISSUER 5.875%/011129 2,500,000 2,518,700.00 0.25USD ALLIED UNI HLD /ALL FIN 4.625%/21-010628 2,617,000 2,599,125.89 0.26EUR ALLIED UNI HLD/ALL FIN 3.625%/21-010628 1,750,000 1,991,690.90 0.20USD ALLIED UNIVERSAL 144A 6%/21-010629 4,250,000 4,190,287.50 0.42USD ALLIED UNIVERSAL -144A- 6.625%/19-
15.07.2026 700,000 736,617.00 0.07
EUR ALTICE FINANCING S.A. 2.25%/20-150125 1,250,000 1,398,608.95 0.14EUR ALTICE FINANCING S.A. 3%/20-150128 500,000 550,486.47 0.06USD ALTICE FINANCING SA 144A 5%/20-150128 2,910,000 2,808,237.30 0.28USD ALTICE FRANCE SA 144A 5.125%/21-150729 3,000,000 2,923,740.00 0.29USD AMC ENTERTAINMENT HLDGS 10.5%/20-150425 455,000 488,847.45 0.05USD AMC ENTERTAINMENT HLDGS 12%/150626 1,166,431 1,162,010.23 0.12USD AMN HEALTHCARE INC 144A 4%/20-150429 885,000 903,390.30 0.09USD AMN HEALTHCARE INC 144A 4.625%/19-011027 6,000,000 6,167,400.00 0.62EUR APCOA PARKING HOLD G 4.625%/21-150127 1,500,000 1,727,872.62 0.17USD API GROUP DE INC 144A 4.125%/21-150729 2,071,000 2,062,943.81 0.21USD ARCOSA INC 144A 4.375%/21-150429 4,753,000 4,845,540.91 0.49USD ARDAGH METAL PACK 144A 3.25%/21-010928 1,750,000 1,715,665.00 0.17USD ARDAGH METAL PACKAGING 144A 4%/21-
010929 880,000 876,840.80 0.09
EUR ARDAGH PKG FIN/HLDG USA 2.125%/20-150826
500,000 571,704.65 0.06
GBP ARROW GLOBAL FIN REG S 5.125%/16-150924 3,450,000 4,734,076.16 0.48EUR ARROW GLOBAL FINANCE 144A FRN/18-010326 2,000,000 2,316,768.21 0.23EUR ARROW GLOBAL FINANCE FRN 18-010326 1,350,000 1,563,818.54 0.16USD ASBURY AUTOMOTIVE GROUP 4.5%/20-
01.03.2028 1,813,000 1,852,052.02 0.19
USD ASBURY AUTOMOTIVE GROUP 4.75%/20-01.03.2030
2,561,000 2,616,291.99 0.26
USD ASGN INCORPORATED 144A 4.625%/19-150528 5,585,000 5,776,509.65 0.58USD ATKORE INC 144A 4.25%/21-010631 6,000,000 6,105,540.00 0.61USD ATLAS LUXCO 4 / ALL UNI 4.625%/21-010628 1,633,000 1,620,262.60 0.16USD AUSTIN BIDCO INC 144A 7.125%/20-151228 8,767,000 9,071,302.57 0.91USD AUTOMATION TOOLING 144A 4.125%/20-151228 4,208,000 4,257,780.64 0.43USD AVANTOR FUNDING 144A 3.875%/21-011129 2,000,000 2,003,960.00 0.20EUR AVANTOR FUNDING INC 3.875%/20-150728 750,000 901,761.02 0.09USD AXALTA COAT/DUTCH HLD BV 4.75%/20-
150627 775,000 802,652.00 0.08
EUR AXALTA COATING 144A 3.75%/16-150125 845,000 990,158.38 0.10USD AXALTA COATING SYS 144A 3.375%/20-150229 475,000 452,542.00 0.05EUR BANIJAY ENTERTAINMENT 3.5%/20-01.03.2025 1,000,000 1,158,441.97 0.12USD BAUSCH HEALTH COS 144A 5.25%/19-300130 3,155,000 2,853,602.85 0.29USD BAUSCH HEALTH COS INC -144A- 5%/19-
30.01.2028 1,570,000 1,455,123.10 0.15
USD BAUSCH HEALTH COS INC -144A- 5%/20-15.02.2029
1,500,000 1,377,810.00 0.14
USD BAUSCH HEALTH COS INC 144A 7.25%/300529 1,425,000 1,446,802.50 0.15GBP BELLIS FINCO PLC 4%/21-160227 750,000 972,089.81 0.10EUR BK LC FINCO 1 SARL 5.25%/21-300429 500,000 599,241.41 0.06USD BLACK KNIGHT INFOSERV 144A 3.625%/010928 3,000,000 2,990,670.00 0.30USD BLACKSTONE TR 144A 3.75%/21-150127 3,250,000 3,234,237.50 0.33EUR BLITZ F 6%/18-300726 3,500,000 3,660,969.41 0.37USD BOOZ ALLEN HAMILTON 144A 3.875%/010928 1,750,000 1,777,440.00 0.18USD BOOZ ALLEN HAMILTON 144A 4%/21-010729 1,605,000 1,626,186.00 0.16EUR BORMIOLI PHARMA BIDCO FRN 17-15.11.2024 500,000 543,490.89 0.05USD BOYD GAMING CORP 144A 4.75%/21-150631 1,500,000 1,545,270.00 0.16USD BOYNE USA INC 144A 4.75%/21-150529 1,500,000 1,541,775.00 0.15EUR BRUNELLO BIDCO SPA 3.5%/21-15.02.2028 2,000,000 2,299,247.45 0.23EUR BRUNELLO BIDCO SPA FRN/21-150228 1,000,000 1,157,747.62 0.12USD BUILDERS FIRST 144A 4.25%/21-010232 750,000 757,342.50 0.08USD BUILDERS FIRSTSOURCE 144A 6.75%/010627 201,466 213,110.73 0.02USD BUILDERS FIRSTSOURCE INC 144A 5%/010330 4,000,000 4,248,120.00 0.43USD CA MAGNUM HOLDINGS 144A 5.375%/21-
311026 965,000 995,484.35 0.10
USD CANPACK SA/US 144A 3.875%/21-151129 2,250,000 2,237,242.50 0.22USD CARGO AIRCRAFT MGMT 144A 4.75%/010228 8,500,000 8,694,310.00 0.87USD CATALENT PHARMA SOLUTION 144A 5%/150727 500,000 519,885.00 0.05USD CCO HLDGS LLC/CAP COR 144A
5.375%/010629 3,535,000 3,801,680.40 0.38
USD CCO HLDGS LLC/CAP CORP 144A 4.5%/150830 2,400,000 2,445,456.00 0.25

CS Investment Funds 1 • Audited Annual Report as at 31.10.2021
Credit Suisse (Lux) Global High Yield Bond Fund Page 61
Statement of Investments in Securities (Continued)
The notes are an integral part of the financial statements. Any differences in the percentage of Net Assets are the result of roundings.
Description Quantity /
Nominal
Valuation
(in USD)
% of net
assets
USD CD&R SMOKEY BUYER INC -144A- 6.75%/20-15.07.2025
1,500,000 1,590,120.00 0.16
USD CDK GLOBAL INC 144A 5.25%/19-150529 1,750,000 1,879,972.50 0.19USD CDK GLOBAL INC 4.875%/18-010627 2,867,000 2,985,521.78 0.30USD CDW LLC/CDW FINANCE 3.25%/20-150229 350,000 355,019.00 0.04USD CDW LLC/CDW FINANCE 4.125%/20-010525 1,750,000 1,806,560.00 0.18USD CEDAR FAIR LP 5.25%/20-150729 1,465,000 1,519,791.00 0.15USD CEDAR FAIR/CAN/MAGNUM/MI 5.375%/18-
15.04.2027 920,000 949,808.00 0.10
USD CENTENE CORP 4.25%/20-151227 1,490,000 1,561,654.10 0.16USD CENTENE CORP 4.625%/20-151229 2,010,000 2,173,413.00 0.22EUR CENTURION BIDCO SPA 5.875%/20-30.09.2026 3,500,000 4,212,146.98 0.42USD CHENIERE ENERGY INC 4.625%/21-151028 900,000 945,801.00 0.10USD CHENIERE ENERGY PARTNERS 3.25%/21-
310132 2,000,000 1,985,680.00 0.20
USD CHENIERE ENERGY PARTNERS 4.5%/20-011029 755,000 806,702.40 0.08USD CHENIERE ENRG PARTNERS 144A 4%/21-
010331 2,000,000 2,083,160.00 0.21
EUR CHEPLAPHARM ARZNEIMITTEL 4.375%/20-15.01.2028
250,000 297,879.04 0.03
EUR CHROME HOLDCO SUB 144A 5%/21-310529 500,000 580,129.43 0.06EUR CHROME HOLDCO SUB 5%/21-310529 1,000,000 1,160,258.85 0.12USD CHURCHILL DOWNS INC -144A- 4.75%/17-
15.01.2028 870,000 905,165.40 0.09
EUR CIRSA FINANCE INTER 4.75%/19-220525 1,800,000 2,082,383.42 0.21USD CLEVELAND-CLIFFS INC -144A- 6.75%/20-
15.03.2026 500,000 532,355.00 0.05
USD CLEVELAND-CLIFFS INC 9.875%/20-171025 483,000 553,595.28 0.06USD CNX MIDSTREAM PART LP 4.75%/21-150430 705,000 706,515.75 0.07USD CNX RESOURCES CORP 144A 6%/20-150129 1,325,000 1,399,783.00 0.14USD CNX RESOURCES CORP 144A 7.25%/19-140327 2,865,000 3,049,018.95 0.31EUR CODERE FIN 2 LUX REG S 6.75%/16-011121 2,062,500 1,516,160.96 0.15USD COMMSCOPE FINANCE LLC 144A 6%/19-010326 500,000 518,305.00 0.05USD COMMSCOPE FINANCE LLC 144A 8.25%/010327 1,925,000 1,963,307.50 0.20USD COMMSCOPE INC 144A 4.75%/21-010929 3,584,000 3,519,774.72 0.35USD COMMSCOPE TECHNOLOGIES FINANCE -144A-
5%/17-15.03.2027 2,916,000 2,712,229.92 0.27
USD COMPASS GROUP DIVERSIFIE 5.25%/21-150429 5,000,000 5,204,100.00 0.52GBP CONSTELLATION AUTOMOT 4.875%/21-150727 1,000,000 1,323,109.68 0.13USD COOPER STANDARD 144A 5.625%/16-151126 4,350,000 3,495,051.00 0.35USD CORELOGIC INC 144A 4.5%/21-010528 5,750,000 5,684,220.00 0.57USD CPI CG INC 144A 8.625%/21-150326 875,000 945,901.25 0.10USD CROWDSTRIKE HOLDINGS INC 3%/21-150229 3,250,000 3,218,280.00 0.32USD CROWN AMER/CAP CORP VI 4.75%/19-010226 2,500,000 2,580,150.00 0.26USD CSC HOLDINGS LLC 144A 4.125%/20-011230 1,000,000 958,780.00 0.10USD CSC HOLDINGS LLC 144A 4.5%/21-151131 5,000,000 4,857,000.00 0.49USD CSC HOLDINGS LLC 144A 5.375%/18-010228 1,000,000 1,032,320.00 0.10EUR CTC BONDCO GMBH 5.25%/17-15.12.2025 2,321,000 2,730,430.17 0.27USD CUSHMAN & WAKEFIELD US -144A- 6.75%/20-
15.05.2028 4,500,000 4,830,525.00 0.49
USD DARLING INGREDIENTS 144A 5.25%/150427 495,000 513,671.40 0.05USD DAVITA INC -144A- 4.625%/20-01.06.2030 1,950,000 1,962,207.00 0.20USD DIAMOND 1 FINANCE 144A 7.125%/16-150624 2,606,000 2,652,412.86 0.27USD DIAMOND BC BV 144A 4.625%/21-011029 475,000 479,066.00 0.05USD DIAMOND SPORTS GR 144A 5.375%/19-150826 3,725,000 2,111,106.50 0.21USD DIAMOND SPORTS GR 144A 6.625%/150827 1,400,000 420,728.00 0.04USD DORNOCH DEBT MER144A 6.625%/21-151029 2,850,000 2,814,375.00 0.28EUR EAGLE INT GLO/RUYI US 5.375%/18-010523 1,150,000 1,288,184.16 0.13USD EAGLE INT GLOB US FI 144A 7.5%/18-010525 3,445,000 3,270,097.35 0.33USD EG GLOBAL FIN PLC 144A 8.5%/19-301025 2,125,000 2,215,355.00 0.22EUR EIRCOM FINANCE DAC 2.625%/19-150227 2,250,000 2,569,936.90 0.26EUR EIRCOM FINANCE DAC 3.5%/19-150526 1,000,000 1,177,085.27 0.12USD ELASTIC NV 144A 4.125%/21-150729 5,365,000 5,346,490.75 0.54USD EMERGENT BIOSOLUTIONS 144A
3.875%/150828 1,670,000 1,612,969.50 0.16
GBP ENCORE CAPITAL GROUP INC 4.25%/21-010628 1,500,000 2,015,053.89 0.20USD ENDO LUX FIN CO I 144A 6.125%/21-010429 2,500,000 2,464,800.00 0.25USD ENDURE DIGITAL INC 144A 6%/21-150229 6,288,000 5,814,639.36 0.58EUR ENERGIZER GAMMA ACQ BV 3.5%/21-300629 1,500,000 1,685,864.44 0.17USD ENERGIZER HOLDINGS INC -144A- 4.375%/20-
31.03.2029 1,230,000 1,179,668.40 0.12
USD ENERSYS 144A 4.375%/19-151227 5,048,000 5,306,659.52 0.53USD ENTEGRIS INC 144A 3.625%/21-010529 1,800,000 1,815,426.00 0.18EUR FABRIC BC SPA FRN/18-301124 500,000 519,400.14 0.05USD FIRST QUANT MINERALS 6.875%/18-010326 800,000 834,072.00 0.08USD FIRST QUANTUM MINERALS -144A- 7.25%/17-
01.04.2023 3,800,000 3,869,046.00 0.39
USD FIRST QUANTUM MINERALS L -144A- 6.5%/18-01.03.2024
3,150,000 3,200,274.00 0.32
EUR FLAMINGO LUX II SA 5%/21-310329 750,000 850,648.19 0.09USD FLEX ACQUISITION 144A 6.875%/17-150125 4,683,000 4,726,270.92 0.48USD FORD MOTOR COMPANY 8.5%/20-210423 2,195,000 2,407,102.85 0.24USD FORD MOTOR COMPANY 9%/20-220425 2,195,000 2,642,494.65 0.27USD FOUNDATION BUILDING M 144A 6%/21-010329 4,500,000 4,362,885.00 0.44USD FRONT RANGE BIDCO INC 144A 4%/20-010327 2,350,000 2,284,317.50 0.23EUR GAMMA BIDCO SPA 6.25%/20-150725 500,000 598,616.49 0.06USD GARTNER INC 144A 3.625%/21-150629 1,000,000 1,005,710.00 0.10USD GARTNER INC 144A 3.75%/20-011030 1,625,000 1,657,841.25 0.17USD GARTNER INC 144A 4.5%/20-010728 750,000 782,715.00 0.08USD GCP APPLIED TECHNOLOGIES 144A 5.5%/18-15 2,454,000 2,514,172.08 0.25USD GEMS MENA KY /GEMS 144A 7.125%/19-310726 7,205,000 7,475,835.95 0.75USD GENESIS ENERGY LP/FIN 6.25%/17-150526 5,458,000 5,293,768.78 0.53USD GFL ENVIRONMENTAL INC 144A 3.75%/010825 1,500,000 1,545,090.00 0.16USD GLOBAL NET LEASE/GLOBAL 3.75%/20-151227 5,750,000 5,675,135.00 0.57USD GLP CAPITAL II 5.375%/16-150426 1,100,000 1,242,857.00 0.12USD GO DADDY OPCO/FINCO 144A 5.25%/19-
011227 3,250,000 3,379,415.00 0.34
EUR GOLDEN GOOSE SPA FRN/21-140527 500,000 574,835.01 0.06USD GOLDEN NUGGET INC -144A- 6.75%/16-
15.10.2024 5,000,000 5,022,050.00 0.50
Description Quantity /
Nominal
Valuation
(in USD)
% of net
assets
EUR GOLDSTORY SAS 5.375%/21-01.03.2026 200,000 238,368.04 0.02USD GPC MERGER SUB INC 144A 7.125%/20-150828 250,000 257,510.00 0.03USD GRAFTECH FINANCE INC -144A- 4.625%/20-
15.12.2028 4,950,000 5,004,846.00 0.50
USD GRANITE HLDGS US ACQU 144A 11%/19-011027 1,250,000 1,371,412.50 0.14USD GRANITE MERGER SUB 2 INC 11%/19-150727 6,325,000 7,218,090.00 0.73EUR GRIFOLS 3.2%/17-010525 1,125,000 1,306,098.39 0.13USD GRIFOLS ESCROW 144A 4.75%/21-151028 3,750,000 3,811,500.00 0.38EUR GRIFOLS SA 1.625%/19-150225 1,000,000 1,156,706.09 0.12USD GROUP 1 AUTOMOTIVE INC 144A 4%/20-150828 1,500,000 1,501,140.00 0.15USD GTCR AP FINANCE INC 144A 8%/19-150527 1,500,000 1,579,920.00 0.16USD GTT ESCROW 144A 7.875%/16-311224 3,660,000 424,120.80 0.04USD GYP HOLDINGS III 144A 4.625%/21-010529 8,500,000 8,476,285.00 0.85USD H.B. FULLER CO 4.25%/20-15.10.2028 1,285,000 1,309,492.10 0.13USD HARSCO CORP 144A 5.75%/19-310727 2,100,000 2,183,895.00 0.22USD HEALTHEQUITY INC 144A 4.5%/21-011029 3,000,000 3,039,450.00 0.31USD HERENS HOLDCO SARL 144A 4.75%/21-150528 3,350,000 3,327,990.50 0.33EUR HERENS MIDCO SARL 144A 5.25%/21-150529 1,000,000 1,082,526.37 0.11EUR HERENS MIDCO SARL 5.25%/21-150529 2,500,000 2,706,315.92 0.27USD HESS MIDSTR PART 144A 5.125%/19-150628 4,030,000 4,190,877.60 0.42USD HESS MIDSTREAM 144A 4.25%/21-150230 710,000 711,121.80 0.07USD HESS MIDSTREAM OPE 144A 5.625%/19-150226 2,500,000 2,591,400.00 0.26USD HORIZON PHARMA USA INC 144A 5.5%/010827 2,350,000 2,489,496.00 0.25EUR HOUSE OF FINANCE NV/THE 4.375%/19-150726 1,300,000 1,530,887.84 0.15EUR HOUSE OF HR SUB 7.5%/20-150127 500,000 614,065.78 0.06EUR HSE FINANCE SARL 5.625%/21-151026 500,000 594,346.24 0.06EUR HSE FINANCE SARL FRN/21-151026 1,000,000 1,175,210.52 0.12USD IAA SPINCO INC -144A- 5.5%/19-15.06.2027 1,100,000 1,147,707.00 0.12EUR IDEAL STANDARD INTL SA 6.375%/21-300726 1,050,000 1,140,334.48 0.11USD IHO VERWALTUNGS REG S 4.75%/16-150926 2,000,000 2,055,140.00 0.21USD IMOLA MERGER CORP 144A 4.75%/21-150529 6,145,000 6,318,411.90 0.64EUR INEOS FINANCE REG S 5.375%/16-010824 1,000,000 1,158,974.30 0.12USD INSTALLED BDNG PROD 144A 5.75%/19-010228 2,320,000 2,438,482.40 0.25USD INTELLIGENT PACKAGING -144A- 6%/20-
15.09.2028 1,000,000 1,030,680.00 0.10
USD INTERTAPE POLYMER 144A 4.375%/21-150629 4,750,000 4,786,860.00 0.48USD INTL FC STONE INC 144A 8.625%/20-150625 3,534,000 3,767,880.12 0.38USD IRB HOLDING CORP 144A 7%/20-150625 3,800,000 4,028,608.00 0.40USD ISTAR INC 4.25%/19-010825 3,750,000 3,869,925.00 0.39USD ISTAR INC 4.75%/19-011024 2,000,000 2,116,500.00 0.21USD ISTAR INC 5.5%/20-150226 750,000 782,932.50 0.08USD ITT HOLDINGS LLC 144A 6.5%/21-010829 4,180,000 4,193,877.60 0.42USD JACOBS ENTMT 144A 7.875%/17-010224 4,904,000 5,061,859.76 0.51USD JAMES HARDIE INTL FIN 144A 5%/17-150128 1,000,000 1,047,630.00 0.11EUR JAMES HARDIE INTL FIN 3.625%/18-011026 1,100,000 1,294,399.17 0.13USD JAZZ SECURITIES 144A 4.375%/21-150129 5,750,000 5,920,315.00 0.60USD KAISER ALUMINUM CORP 144A 4.5%/21-010631 1,000,000 985,270.00 0.10EUR KAIXO BONDCO SA 5.125%/21-300929 5,450,000 6,263,431.04 0.63EUR KAPLA HOLDING SAS 144A 3.375%/19-151226 500,000 573,614.11 0.06EUR KAPLA HOLDING SAS 3.375%/19-151226 4,485,000 5,145,318.54 0.52EUR KAPLA HOLDING SAS FRN/19-151226 150,000 171,197.20 0.02USD KBR INC 144A 4.75%/20-300928 1,420,000 1,454,662.20 0.15USD KORN/FERRY INTER 144A 4.625%/19-151227 892,000 924,870.20 0.09USD KRATON POLYMERS LLC/CAP 4.25%/20-151225 2,475,000 2,561,476.50 0.26EUR KRONOS INTERNATIONAL INC 3.75%/17-150925 2,500,000 2,914,910.23 0.29EUR LABORATOIRE EIMER SELARL 5%/21-01.02.2029 1,250,000 1,467,826.97 0.15USD LAMB WESTON HLD 144A 4.125%/21-310130 1,400,000 1,402,226.00 0.14USD LAMB WESTON HLD 144A 4.375%/21-310132 2,000,000 2,004,500.00 0.20USD LAREDO PETROLEUM 144A 7.75%/21-310729 950,000 941,868.00 0.09USD LCM INVESTMENTS HOLDINGS 4.875%/010529 1,500,000 1,540,785.00 0.15USD LCPR SENIOR SECU FIN DAC 6.75%/19-151027 3,000,000 3,168,570.00 0.32USD LCPR SR SECURED 144A 5.125%/21-150729 2,500,000 2,538,025.00 0.26USD LEVEL 3 FINANCING 144A 3.75%/21-150729 1,460,000 1,381,846.20 0.14USD LEVEL 3 FINANCING INC 4.25%/20-010728 1,500,000 1,486,485.00 0.15EUR LINCOLN FINANCING SARL 3.625%/19-
01.04.2024 925,000 1,077,457.03 0.11
EUR LINCOLN FINANCING SARL FRN/19-010424 3,002,000 3,479,692.48 0.35USD LITHIA MOTORS INC 144A 3.875%/21-010629 2,000,000 2,074,420.00 0.21USD LITHIA MOTORS INC 144A 4.375%/20-150131 600,000 640,758.00 0.06USD LITHIA MOTORS INC 144A 4.625%/19-151227 1,350,000 1,429,609.50 0.14USD LIVE NATION ENT 144A 4.875%/16-011124 4,310,000 4,366,719.60 0.44USD LIVE NATION ENTER. 144A 5.625%/18-150326 535,000 555,859.65 0.06USD LIVE NATION ENTERT 144A 4.75%/19-151027 515,000 525,634.75 0.05USD LIVE NATION ENTERTAINMEN -144A- 6.5%/20-
15.05.2027 1,000,000 1,098,250.00 0.11
EUR LORCA TELECOM 4%/21-180927 1,000,000 1,166,878.32 0.12EUR LORCA TELECOM BONDCO 4%/20-18.09.2027 250,000 291,751.40 0.03EUR LOUVRE BIDCO SAS 6.5%/20-300924 3,000,000 3,582,498.83 0.36USD LSF11 A5 HOLDCO LLC 144A 6.625%/21-15102 3,060,000 3,067,435.80 0.31USD LVL3 FINANCING INC 144A 3.625%/20-150129 1,000,000 947,780.00 0.10USD MADISON IAQ LLC 144A 4.125%/21-300628 3,645,000 3,626,957.25 0.36USD MADISON IAQ LLC 144A 5.875%/21-300629 735,000 730,362.15 0.07USD MAJORDRIVE HLDINGS IV L 6.375%/21-010629 1,910,000 1,840,953.50 0.19USD MASONITE INTERNAT C 144A 5.375%/010228 2,000,000 2,103,600.00 0.21USD MASTEC INC 144A 4.5%/20-150828 3,375,000 3,474,427.50 0.35USD MATTEL INC 144A 3.375%/21-010426 1,000,000 1,032,490.00 0.10USD MATTEL INC 144A 3.75%/21-010429 2,000,000 2,079,780.00 0.21USD MERLIN ENTERTAINMENTS 5.75%/18-150626 2,000,000 2,071,980.00 0.21USD MGM GROWTH PROP OP FIN 4.5%/17-010926 2,147,000 2,331,319.95 0.23USD MGM GROWTH/MGM FIN 4.5%/18-150128 3,000,000 3,284,010.00 0.33USD MIDCONTIN COM&FIN 144A 5.375%/19-150827 3,538,000 3,682,527.30 0.37USD MINERALS TECHNOLOGIES IN 5%/20-010728 1,250,000 1,289,675.00 0.13USD MOTION BONDCO DAC 6.625%/19-151127 1,407,000 1,425,206.58 0.14USD MOZART DEBT 144A 5.25%/21-011029 650,000 660,965.50 0.07USD MOZART DEBT144A 3.875%/21-010429 5,500,000 5,474,865.00 0.55USD MPT OPER PARTNERSP/FINL 4.625%/19-010829 3,550,000 3,761,047.50 0.38USD MPT OPER PARTNERSP/FINL 5%/17-151027 2,657,000 2,799,601.19 0.28USD MPT OPERATING PARTNER 5.25%/16-010826 1,342,000 1,384,930.58 0.14USD MSCI INC 144A 4%/19-151129 2,750,000 2,879,910.00 0.29USD MURPHY OIL USA INC 144A 3.75%/21-150231 1,495,000 1,475,026.80 0.15

CS Investment Funds 1 • Audited Annual Report as at 31.10.2021
Credit Suisse (Lux) Global High Yield Bond Fund Page 62
Statement of Investments in Securities (Continued)
The notes are an integral part of the financial statements. Any differences in the percentage of Net Assets are the result of roundings.
Description Quantity /
Nominal
Valuation
(in USD)
% of net
assets
USD NATIONAL CINEM LLC 144A 5.875%/19-150428 555,000 515,245.35 0.05USD NAVIOS MARITIME HL 144A 11.25%/17-150822 4,238,000 4,249,145.94 0.43USD NEW FORTRESS ENERGY 144A 6.5%/21-300926 2,750,000 2,676,850.00 0.27USD NEW FORTRESS ENERGY IN 144A 6.75%/150925 2,000,000 1,950,420.00 0.20USD NEW RED FIN 144A 3.875%/19-150128 1,000,000 998,570.00 0.10USD NEWMARK GROUP INC 6.125%/19-151123 4,450,000 4,811,696.00 0.48USD NFP CORP 144A 4.875%/21-150828 3,475,000 3,533,519.00 0.36USD NFP CORP -144A- 6.875%/20-15.08.2028 5,000,000 5,089,800.00 0.51EUR NIDDA BONDCO GMBH 144A 7.25%/18-300925 1,400,000 1,647,287.51 0.17EUR NIDDA BONDCO GMBH 5%/17-300925 4,505,000 5,160,651.53 0.52EUR NIDDA BONDCO GMBH 7.25%/18-300925 2,200,000 2,588,594.66 0.26USD NORTHERN OIL GAS 144A 8.125%/21-010328 1,035,000 1,113,473.70 0.11USD NOVELIS CORP 144A 3.25%/21-151126 585,000 585,251.55 0.06USD NOVELIS CORP 144A 3.875%/21-150831 865,000 847,795.15 0.09USD OLYMPUS WTR US HLDG CORP 6.25%/21-
011029 1,475,000 1,472,197.50 0.15
EUR OLYMPUS WTR US HLDG CRP 3.875%/21-011028
1,000,000 1,155,259.53 0.12
EUR OLYMPUS WTR US HLDG CRP 5.375%/21-011029
650,000 731,060.28 0.07
USD OPTION CARE 144A 4.375%/21-311029 735,000 742,629.30 0.07USD ORTHO-CLINICAL INC/SA -144A- 7.375%/20-
01.06.2025 596,000 626,974.12 0.06
USD OWENS & MINOR INC 4.375%/14-151224 5,277,000 5,607,815.13 0.56USD PACTIVE EVERGREEN GROUP 4.375%/21-
151028 4,000,000 3,955,640.00 0.40
USD PANTHER BF AGGREGATOR 2 144A 8.5%/150527
3,775,000 4,014,863.50 0.40
EUR PANTHER BF AGGREGATOR 2 4.375%/19-150526
500,000 592,945.97 0.06
USD PAPA JOHN'S INTERNATION 3.875%/21-150929 1,750,000 1,714,947.50 0.17EUR PAPER INDUSTRIES FRN/20-010325 500,000 491,212.12 0.05EUR PAPREC HOLDING S 3.5%/21-010728 750,000 868,822.80 0.09USD PARK RIVER HOLDIN 144A 5.625%/21-010229 2,500,000 2,346,300.00 0.24USD PARK RIVER HOLDINGS INC 6.75%/21-010829 3,750,000 3,694,275.00 0.37EUR PAYSAFE FIN PLC/PAYSAFE 3%/21-150629 500,000 560,247.87 0.06USD PAYSAFE FIN PLC/PAYSAFE 4%/21-150629 5,100,000 4,855,455.00 0.49USD PBF HOLDING CO LLC 6%/20-150228 1,530,000 1,113,763.50 0.11USD PENINSULA PACIFIC ENTER 144A 8.5%/151127 5,510,000 5,885,396.30 0.59USD PENSKE AUTOMOTIVE GROUP SUB 3.75%/21-
150 2,500,000 2,486,750.00 0.25
EUR PEOPLECERT WISDOM ISSUER 5.75%/21-150926
250,000 298,553.14 0.03
USD PERFORMANCE FOOD GRP I 6.875%/20-010525 250,000 264,075.00 0.03USD PG&E CORP 5.25%/20-01.07.2030 400,000 418,448.00 0.04USD PGT INNOVATIONS INC 4.375%/21-011029 2,250,000 2,234,947.50 0.22EUR PICARD BONDCO 5.375%/21-010727 1,000,000 1,142,217.32 0.11EUR PICARD GROUPE SA 3.875%/21-010726 1,000,000 1,162,735.37 0.12USD PLASTIPAK HOLDINGS 144A 6.25%/17-151025 5,205,000 5,303,738.85 0.53EUR PLAYTECH PLC 3.75%/18-121023 2,000,000 2,344,588.50 0.24EUR PLT VII FINANCE SARL 4.625%/20-050126 500,000 590,585.18 0.06USD POLAR US BORROWER LLC 6.75%/21-150526 4,250,000 4,238,822.50 0.43USD POLYONE CORP -144A- 5.75%/20-15.05.2025 750,000 786,877.50 0.08USD POWDR CORP -144A- 6%/20-01.08.2025 1,108,000 1,161,715.84 0.12USD PRESIDIO HOLDING INC 144A 4.875%/010227 2,195,000 2,244,189.95 0.23USD PRESTIGE BRANDS INC 144A 3.75%/21-010431 2,000,000 1,935,380.00 0.19EUR PRESTIGEBIDCO 6.25%/16-151223 2,700,000 3,141,041.51 0.32GBP PUNCH FINANCE PL 6.125%/21-300626 2,000,000 2,752,424.53 0.28EUR Q-PARK HOLDING BV 2%/20-010327 150,000 165,196.28 0.02EUR Q-PARK HOLDING BV FRN/20-010326 1,450,000 1,614,113.78 0.16EUR QUINTILES IMS INC 2.875%/17-150925 1,000,000 1,166,068.25 0.12USD RADIOLOGY PARTNERS INC 144A 9.25%/010228 5,150,000 5,466,004.00 0.55USD RATTLER MIDSTREAM LP 144A 5.625%/150725 1,000,000 1,047,760.00 0.11EUR RCS & RDS SA 2.5%/20-050225 1,000,000 1,147,910.99 0.12USD REYNOLDS GRP ISS/REYNOLD -144A- 4%/20-
15.10.2027 250,000 244,925.00 0.02
USD RLJ LODGING TRUST LP 144A 4%/21-150929 1,500,000 1,498,545.00 0.15USD ROCKIES EXPRESS PIPELI 144A 4.95%/150729 1,000,000 1,071,660.00 0.11USD ROCKIES EXPRESS PIPELIN 144A 4.8%/150530 3,951,000 4,212,911.79 0.42EUR ROSSINI SARL FRN/19-301025 225,000 261,076.47 0.03USD RP ESCROW ISSUER LLC 5.25%/20-151225 2,750,000 2,755,362.50 0.28EUR SASU NEWCO SAB 20 SAS 4.25%/17-300924 3,000,000 3,472,652.66 0.35EUR SCHOELLER PACKAGING 6.375%/19-011124 2,000,000 2,383,587.83 0.24EUR SCHUMANN REG S 7%/16-310723 6,850,000 5,468,889.96 0.55USD SCIENCE APP INT 144A 4.875%/20-010428 3,400,000 3,511,792.00 0.35USD SEAWORLD PARKS & ENTERTA 8.75%/20-
010525 2,000,000 2,145,240.00 0.22
USD SEAWORLD PARKS 144A 5.25%/21-150829 2,150,000 2,194,204.00 0.22USD SENSAT TECHNOLOGIES INC 4.375%/19-150230 750,000 792,675.00 0.08USD SENSATA TECHNOLOGIES 144A 3.75%/150231 1,100,000 1,089,308.00 0.11USD SENSATA TECHNOLOGIES 144A 4%/21-150429 5,400,000 5,489,100.00 0.55USD SERVICE CORP INTL 4%/21-150531 377,000 385,753.94 0.04GBP SHERWOOD FINANCING 6%/21-151126 750,000 1,028,057.25 0.10EUR SHIBA BIDCO SPA 4.5%/21-311028 100,000 115,867.34 0.01USD SHIFT4 PAYMENTS LLC/FIN 4.625%/20-011126 4,790,000 4,985,240.40 0.50USD SIRIUS XM RADIO INC 144A 3.875%/21-01093 975,000 938,154.75 0.09USD SIRIUS XM RADIO INC 144A 4%/21-150728 1,000,000 1,007,940.00 0.10USD SIRIUS XM RADIO INC -144A- 5.5%/19-
01.07.2029 1,613,000 1,741,814.18 0.18
USD SIRIUS XM RDIO INC 144A 4.125%/20-010730 1,250,000 1,245,450.00 0.13USD SIX FLAGS ENTERTAINMENT -144A- 4.875%/16-
31.07.2024 1,700,000 1,721,590.00 0.17
USD SIX FLAGS ENTERTAINMENT -144A- 5.5%/17-15.04.2027
1,027,000 1,065,173.59 0.11
USD SIX FLAGS THEME PARKS 144A 7%/20-010725 250,000 266,075.00 0.03EUR SOFIMA HOLDING S.P.A 3.75%/20-150128 3,000,000 3,455,467.49 0.35EUR SOLOCAL GROUP 0%/17-150322 504,164 510,514.09 0.05EUR SOLOCAL GROUP FRN/20-150325 138,715 140,461.95 0.01USD SONIC AUTOMOTIVE 144A 4.625%/21-151129 400,000 401,436.00 0.04USD SONIC AUTOMOTIVE INC 4.875%/21-151131 850,000 851,241.00 0.09
Description Quantity /
Nominal
Valuation
(in USD)
% of net
assets
USD SPEEDWAY MOT FD 144A 4.875%/19-011127 7,237,000 7,398,385.10 0.74USD SQUARE INC 144A 3.5%/21-010631 485,000 497,964.05 0.05USD SS&C TECHNOLOGIES INC 144A 5.5%/300927 600,000 632,508.00 0.06USD STANDARD IND. INC 144A 3.375%/20-150131 3,650,000 3,391,361.00 0.34USD STANDARD INDUSTRIES INC 5%/17-150227 750,000 770,257.50 0.08USD STARWOOD PROPERTY TRUST 3.625%/21-
150726 1,200,000 1,201,548.00 0.12
USD STARWOOD PROPERTY TRUST 5%/17-151221 210,000 210,569.10 0.02USD STARWOOD PROPERTY TRUST 5.5%/20-011123 6,000,000 6,309,420.00 0.63USD STERICYCLE INC 144A 3.875%/20-150129 2,650,000 2,609,455.00 0.26USD SUBURBAN PROPANE PARTNRS 5%/21-010631 500,000 513,060.00 0.05USD SUMMIT MATERIALS LLC/FIN -144A- 5.25%/20-
15.01.2029 1,900,000 2,001,023.00 0.20
USD SUNCOKE ENERGY 144A 4.875%/21-300629 2,000,000 1,987,540.00 0.20EUR SUNSHINE MID BV 144A 6.5%/18-150526 100,000 119,396.95 0.01EUR SUNSHINE MID BV 6.5%/18-150526 1,986,000 2,371,223.51 0.24USD SURGERY CENTER HOLDINGS 144A
10%/150427 1,000,000 1,075,310.00 0.11
USD SYNAPTICS INC 144A 4%/21-150629 4,577,000 4,637,919.87 0.47EUR SYNTHOMER PLC 3.875%/20-010725 1,000,000 1,191,296.30 0.12USD TALLGRASS NRG PRTNR/FIN 7.5%/20-011025 2,040,000 2,208,524.40 0.22USD TALOS PRODUCTION INC 12%/21-150126 2,024,000 2,202,051.28 0.22EUR TAP SGPS SA 5.625%/19-021224 1,500,000 1,421,039.35 0.14USD TARGA RESOURCES PART 144A 4%/21-150132 1,000,000 1,032,690.00 0.10USD TASEKO MINES LTD 144A 7%/21-150226 3,750,000 3,889,800.00 0.39EUR TECHEM VERWALTUNGSGES 144A 6%/18-
300726 750,000 784,493.56 0.08
EUR TECHEM VERWALTUNGSGESELL 2%/20-150725 956,000 1,088,264.61 0.11USD TELENET FINANCE LUX NOTE 144A 5.5%/17-01 6,400,000 6,684,032.00 0.67USD TEMPUR SEALY INTL INC 3.875%/21-151031 1,500,000 1,488,705.00 0.15USD TENNECO INC 144A 7.875%/20-150129 450,000 492,444.00 0.05USD THOR INDUSTRIES 144A 4%/21-151029 850,000 842,741.00 0.08EUR TI AUTOMOTIVE FINANCE 3.75%/21-150429 4,000,000 4,645,201.50 0.47EUR TITAN HOLDINGS II BV 5.125%/21-150729 2,000,000 2,295,058.20 0.23USD T-MOBILE USA INC 2.875%/21-150231 770,000 768,167.40 0.08USD TMS INTERNATIONAL 144A 6.25%/21-150429 1,100,000 1,137,213.00 0.11USD TOPBUILD CORP 144A 3.625%/21-150329 4,000,000 4,024,840.00 0.40USD TRANSDIGM INC 144A 8%/20-151225 1,250,000 1,330,375.00 0.13USD TRANSDIGM INC SUB 5.5%/20-151127 830,000 852,725.40 0.09USD TRANSDIGM INC SUB 7.5%/19-150327 1,250,000 1,315,262.50 0.13USD TRIMAS CORP 144A 4.125%/21-150429 6,000,000 6,127,980.00 0.62USD TRINSEO OP/FIN 144A 5.125%/21-010429 2,100,000 2,106,594.00 0.21USD TRIPADVISOR INC 144A 7%/20-150725 496,000 526,756.96 0.05EUR TRIVIUM PACKAGING FIN FRN/19-150826 2,139,000 2,462,634.41 0.25USD TRONOX INC -144A- 6.5%/20-01.05.2025 3,400,000 3,576,630.00 0.36EUR TUI CRUISES GMBH 6.5%/21-150526 500,000 594,560.33 0.06USD TWILIO INC 3.625%/21-150329 500,000 505,330.00 0.05USD TWILIO INC 3.875%/21-150331 500,000 505,120.00 0.05EUR UNILABS SUBHOLDING 144A 5.75%/17-150525 1,000,000 1,174,655.04 0.12EUR UNILABS SUBHOLDING AB 5.75%/17-15.05.2025 4,250,000 4,992,283.92 0.50USD UNITED AIRLINES INC 144A 4.625%/150429 333,000 343,772.55 0.03EUR UNITED GROUP BV 3.625%/20-150228 2,000,000 2,226,294.41 0.22EUR UNITED GROUP BV 4%/20-151127 2,000,000 2,269,737.57 0.23EUR UNITED GROUP BV FRN/20-150226 1,325,000 1,504,253.15 0.15USD UPC BROADBAND FIN 144A 4.875%/21-150731 4,000,000 4,072,640.00 0.41EUR UPC HOLDING 3.875%/17-150629 1,600,000 1,886,576.72 0.19USD US FOODS INC 144A 4.75%/21-150229 1,750,000 1,772,592.50 0.18USD VALEANT PHARMA 144A 5.5%/17-011125 1,000,000 1,017,950.00 0.10USD VALVOLINE INC 144A 4.25%/20-150230 1,000,000 1,015,880.00 0.10USD VENATOR FIN SARL/VENATOR 9.5%/20-010725 3,000,000 3,302,820.00 0.33EUR VERISURE HOLDING AB 3.25%/21-150227 1,000,000 1,156,011.74 0.12EUR VERISURE HOLDING AB FRN/20-150425 500,000 587,935.08 0.06EUR VERISURE MIDHOLDING AB 5.25%/21-
15.02.2029 1,500,000 1,763,718.44 0.18
EUR VERTICAL MIDCO GMBH 4.375%/20-15.07.2027 1,500,000 1,789,357.31 0.18USD VERTIV GROUP 144A 4.125%/21-151128 3,450,000 3,443,203.50 0.35USD VIAVI SOLUTIONS INC 144A 3.75%/21-011029 1,500,000 1,490,535.00 0.15USD VICI PROPERTIES / NOTE -144A- 4.625%/19-
01.12.2029 2,091,000 2,236,136.31 0.22
USD VICI PRPRTIES/NOTE 144A 4.25%/19-011226 2,788,000 2,892,048.16 0.29USD VINE ENERGY HOLD 144A 6.75%/21-150429 3,000,000 3,229,410.00 0.32EUR VIRGIN MEDIA FINANCE PLC 3.75%/20-150730 1,000,000 1,151,475.32 0.12EUR VMED O2 UK FINANCING I 3.25%/20-310131 1,000,000 1,162,989.96 0.12USD W & T OFFSHORE INC 144A 9.75%/18-011123 4,435,000 4,324,302.40 0.43USD WESCO DISTRIBUTION INC 7.125%/20-150625 800,000 851,752.00 0.09USD WESCO DISTRIBUTION INC 7.25%/20-150628 1,750,000 1,933,015.00 0.19USD WEWORK COS INC 144A 7.875%/18-010525 3,566,000 3,624,125.80 0.36USD WHITE CAP BUYER LLC 144A 6.875%/151028 6,000,000 6,210,480.00 0.62USD WILLIAM CARTER 144A 5.5%/20-150525 750,000 785,355.00 0.08USD WILLIAMS SCOTSMAN INTL -144A- 4.625%/20-
15.08.2028 1,460,000 1,510,413.80 0.15
USD WINNEBAGO INDUSTRIES 144A 6.25%/150728 2,250,000 2,434,050.00 0.24USD WMG ACQUISITION CORP 144A 3%/20-150231 750,000 730,590.00 0.07USD WMG ACQUISITION CORP 144A 3.875%/150730 5,250,000 5,472,705.00 0.55USD WOLVERINE WORLD WIDE 144A 4%/21-150829 2,750,000 2,716,120.00 0.27USD YUM! BRANDS INC 144A 4.75%/19-150130 2,575,000 2,769,721.50 0.28USD YUM! BRANDS INC 3.625%/20-150331 1,550,000 1,533,399.50 0.15USD ZI TECH LLC/ZI FIN CORP 3.875%/21-010229 2,050,000 2,038,704.50 0.20EUR ZIGGO SEC. FIN REG S SEC 4.25%/16-150127 3,000,000 2,848,834.73 0.29EUR ZONCOLAN BIDCO SPA 4.875%/21-211028 1,500,000 1,742,853.22 0.18
Total Bonds 942,093,703.58 94.70
Total securities listed on a stock exchange or other
organised markets 943,157,441.12 94.81
Securities not listed on a stock exchange
Bonds
EUR ALTICE FRANCE HOLDING S.A. 8%/20-150527 1,250,000 1,535,569.49 0.15

CS Investment Funds 1 • Audited Annual Report as at 31.10.2021
Credit Suisse (Lux) Global High Yield Bond Fund Page 63
Statement of Investments in Securities (Continued)
The notes are an integral part of the financial statements. Any differences in the percentage of Net Assets are the result of roundings.
Description Quantity /
Nominal
Valuation
(in USD)
% of net
assets
EUR ALTICE FRANCE HOLDING S.A. 8%/20-150527 2,500,000 3,071,138.98 0.31EUR CODERE FINANCE 2 LUXEMBO 10.75%/21-
30092 341,000 382,783.58 0.04
Total Bonds 4,989,492.05 0.50
Total securities not listed on a stock exchange 4,989,492.05 0.50
Total of Portfolio 948,146,933.17 95.31
Cash at banks and at brokers 32,565,781.79 3.27
Due to banks and to brokers -6,677,335.25 -0.67
Other net assets 20,786,261.82 2.09
Total net assets 994,821,641.53 100.00

CS Investment Funds 1 • Audited Annual Report as at 31.10.2021
Credit Suisse (Lux) Global Inflation Linked Bond Fund Page 64
Technical Data and Notes
Technical Data
Valoren ISIN Management Fee Total Expense Ratio
A - Distribution USD 30070817 LU1307159316 0.90% 1.10%
B - Capitalisation USD 10671046 LU0458987681 0.90% 1.10%
EB - Capitalisation USD 3449617 LU0324196079 0.32% 0.48%
IB - Capitalisation USD 30070835 LU1307159662 0.45% 0.65%
MB - Capitalisation USD 33386686 LU1457602677 0.20% 0.36%
UA - Distribution USD 30070839 LU1307159829 0.55% 0.75%
UB - Capitalisation USD 30070847 LU1307160322 0.55% 0.75%
EBH - Capitalisation CHF 3449717 LU0324196582 0.32% 0.56%
UAH - Distribution CHF 30070845 LU1307160165 0.55% /
UBH - Capitalisation CHF 30070852 LU1307160678 0.55% /
AH - Distribution EUR 30070826 LU1307159407 0.90% 1.18%
BH - Capitalisation EUR 10671056 LU0458988069 0.90% 1.18%
EBH - Capitalisation EUR 3449624 LU0324196400 0.32% 0.56%
IBH - Capitalisation EUR 24942761 LU1089177171 0.45% 0.73%
UAH - Distribution EUR 30070843 LU1307160082 0.55% 0.83%
UBH - Capitalisation EUR 30070851 LU1307160595 0.55% 0.83%
UAH - Distribution GBP 36111739 LU1584817669 0.55% /
UBH - Capitalisation GBP 36114753 LU1584817826 0.55% /
Credit Suisse (Lux) Global Inflation Linked Bond Fund -UAH- CHF was closed on 11.01.2021. Credit Suisse (Lux) Global Inflation Linked Bond Fund -UBH- CHF was closed on 11.01.2021. Credit Suisse (Lux) Global Inflation Linked Bond Fund -UAH- GBP was closed on 11.01.2021. Credit Suisse (Lux) Global Inflation Linked Bond Fund -UBH- GBP was closed on 11.01.2021.
Fund Performance
YTD Since Inception 2020 2019 2018
A - Distribution USD 3.60% / 5.10% 5.38% -0.31%
B - Capitalisation USD 3.59% / 5.10% 5.38% -0.31%
EB - Capitalisation USD 4.13% / 5.75% 6.04% 0.31%
IB - Capitalisation USD 3.98% / 5.58% 5.86% 0.14%
MB - Capitalisation USD 4.23% / 5.88% 6.17% 0.43%
UA - Distribution USD 3.90% / 5.47% 5.75% 0.04%
UB - Capitalisation USD 3.89% / 5.48% 5.75% 0.04%
EBH - Capitalisation CHF 3.18% / 3.75% 2.40% -3.07%
UAH - Distribution CHF / / 3.82% 2.16% -3.25%
UBH - Capitalisation CHF / / 3.49% 2.18% -3.26%
AH - Distribution EUR 2.85% / 3.37% 2.15% -3.34%
BH - Capitalisation EUR 2.86% / 3.36% 2.15% -3.32%
EBH - Capitalisation EUR 3.39% / 4.01% 2.78% -2.76%
IBH - Capitalisation EUR 3.24% / 3.84% 2.65% -2.60%
UAH - Distribution EUR 3.15% / 3.74% 2.58% -2.86%
UBH - Capitalisation EUR 3.15% / 3.74% 2.58% -2.74%
UAH - Distribution GBP / / 4.30% 3.87% -1.57%
UBH - Capitalisation GBP / / 4.33% 3.99% -1.55%
Distribution
Ex-Date Amount
UA - Distribution USD 15/12/2020 0.33
UAH - Distribution CHF 15/12/2020 0.57
UAH - Distribution EUR 15/12/2020 0.21
UAH – Distribution GBP 15/12/2020 0.11
Notes
Forward foreign exchange contracts
Purchases Sales Maturity Valuation
Counterparty (In USD)
USD 1,727,953 EUR -1,490,000 09.11.2021 3,290.72
UBS AG London Branch - London - United Kingdom

CS Investment Funds 1 • Audited Annual Report as at 31.10.2021
Credit Suisse (Lux) Global Inflation Linked Bond Fund Page 65
Technical Data and Notes (Continued)
Forward foreign exchange contracts
Purchases Sales Maturity Valuation
Counterparty (In USD)
USD 7,255,538 EUR -6,200,000 09.11.2021 79,076.93
UBS AG London Branch - London - United Kingdom
USD 317,825 GBP -230,400 09.11.2021 2,003.07
JP Morgan Securities PLC - London - United Kingdom
EUR 2,000,000 USD -2,350,088 09.11.2021 -35,106.00
Credit Suisse (Schweiz) AG - Zurich - Switzerland
EUR 460,000 USD -540,931 09.11.2021 -8,485.16
Credit Suisse (Schweiz) AG - Zurich - Switzerland
CHF 88,319,700 USD -97,478,163 09.11.2021 -791,054.98
UBS AG London Branch - London - United Kingdom
USD 49,610,208 JPY -5,444,310,000 09.11.2021 1,859,848.45
Citibank N.A.- London - United Kingdom
USD 16,247,167 AUD -21,970,000 09.11.2021 -255,141.26
Credit Suisse (Schweiz) AG - Zurich - Switzerland
USD 11,400,946 NZD -16,180,000 09.11.2021 -176,755.69
JP Morgan Securities PLC - London - United Kingdom
USD 2,424,362 DKK -15,240,000 09.11.2021 53,106.85
Citibank N.A.- London - United Kingdom
EUR 246,600 USD -287,281 09.11.2021 -1,843.83
Credit Suisse (Schweiz) AG - Zurich - Switzerland
EUR 117,800 USD -137,228 09.11.2021 -875.14
Credit Suisse (Schweiz) AG - Zurich - Switzerland
USD 86,561 CHF -79,400 09.11.2021 -361.51
Credit Suisse (Schweiz) AG - Zurich - Switzerland
CHF 73,400 USD -79,840 09.11.2021 514.38
Credit Suisse (Schweiz) AG - Zurich - Switzerland
CHF 42,400 USD -45,813 09.11.2021 604.30
Credit Suisse (Schweiz) AG - Zurich - Switzerland
EUR 108,800 USD -125,706 09.11.2021 229.13
Credit Suisse (Schweiz) AG - Zurich - Switzerland
CHF 2,500 USD -2,691 09.11.2021 45.98
Credit Suisse (Schweiz) AG - Zurich - Switzerland
CHF 40,200 USD -43,420 09.11.2021 588.57
Credit Suisse (Schweiz) AG - Zurich - Switzerland
CHF 545,600 USD -588,876 09.11.2021 8,414.24
Credit Suisse (Schweiz) AG - Zurich - Switzerland
EUR 4,056,400 USD -4,691,296 09.11.2021 3,950.93
Credit Suisse (Schweiz) AG - Zurich - Switzerland
EUR 2,747,600 USD -3,266,517 09.11.2021 -86,194.41
Citibank N.A.- London - United Kingdom
NZD 178,000 USD -125,712 09.11.2021 1,656.78
Credit Suisse (Schweiz) AG - Zurich - Switzerland
USD 59,611 CAD -75,100 09.11.2021 -976.10
Credit Suisse (Schweiz) AG - Zurich - Switzerland
USD 256,568,868 EUR -216,960,000 09.11.2021 5,438,488.54
Credit Suisse (Schweiz) AG - Zurich - Switzerland
EUR 88,040,500 USD -104,113,438 09.11.2021 -2,207,351.41
Credit Suisse (Schweiz) AG - Zurich - Switzerland
USD 72,675,197 GBP -52,210,000 09.11.2021 1,108,069.25
Citibank N.A.- London - United Kingdom
USD 8,057,548 CAD -10,080,000 09.11.2021 -74,475.86
UBS AG London Branch - London - United Kingdom
USD 9,033,833 SEK -77,830,000 09.11.2021 -29,088.04
Citibank N.A.- London - United Kingdom
CHF 1,999,600 USD -2,188,982 09.11.2021 60.14
Credit Suisse (Schweiz) AG - Zurich - Switzerland
USD 6,104 CHF -5,600 09.11.2021 -26.05
Credit Suisse (Schweiz) AG - Zurich - Switzerland

CS Investment Funds 1 • Audited Annual Report as at 31.10.2021
Credit Suisse (Lux) Global Inflation Linked Bond Fund Page 66
Technical Data and Notes (Continued)
Forward foreign exchange contracts
Purchases Sales Maturity Valuation
Counterparty (In USD)
EUR 522,100 USD -605,628 09.11.2021 -1,302.12
Credit Suisse (Schweiz) AG - Zurich - Switzerland
USD 64,034 CHF -58,900 09.11.2021 -446.14
Credit Suisse (Schweiz) AG - Zurich - Switzerland
EUR 417,700 USD -485,188 09.11.2021 -1,703.80
Credit Suisse (Schweiz) AG - Zurich - Switzerland
USD 12,782 CHF -11,700 09.11.2021 -26.84
Credit Suisse (Schweiz) AG - Zurich - Switzerland
EUR 392,000 USD -456,636 09.11.2021 -2,900.02
Credit Suisse (Schweiz) AG - Zurich - Switzerland
USD 54,795 CHF -50,600 09.11.2021 -598.38
Credit Suisse (Schweiz) AG - Zurich - Switzerland
USD 164,843 EUR -142,000 09.11.2021 479.58
Credit Suisse (Schweiz) AG - Zurich - Switzerland
USD 229,939 EUR -198,300 09.11.2021 408.41
Credit Suisse (Schweiz) AG - Zurich - Switzerland
EUR 138,200 USD -160,035 09.11.2021 -69.65
Credit Suisse (Schweiz) AG - Zurich - Switzerland
EUR 42,400 USD -49,101 09.11.2021 -23.83
Credit Suisse (Schweiz) AG - Zurich - Switzerland
EUR 710,800 USD -822,532 09.11.2021 212.53
UBS AG London Branch - London - United Kingdom
EUR 68,700 USD -79,526 09.11.2021 -5.91
Credit Suisse (Schweiz) AG - Zurich - Switzerland
USD 59,005 CHF -53,900 09.11.2021 -1.04
Credit Suisse (Schweiz) AG - Zurich - Switzerland
USD 31,529 EUR -27,000 09.11.2021 276.62
Credit Suisse (Schweiz) AG - Zurich - Switzerland
USD 161,001 EUR -138,800 09.11.2021 340.96
Credit Suisse (Schweiz) AG - Zurich - Switzerland
USD 113,686 CHF -104,500 09.11.2021 -714.43
Credit Suisse (Schweiz) AG - Zurich - Switzerland
EUR 141,300 USD -164,634 09.11.2021 -1,080.24
Credit Suisse (Schweiz) AG - Zurich - Switzerland
USD 25,625 CHF -23,600 09.11.2021 -210.64
Credit Suisse (Schweiz) AG - Zurich - Switzerland
USD 103,985 EUR -89,600 09.11.2021 273.85
Credit Suisse (Schweiz) AG - Zurich - Switzerland
USD 61,020 CHF -56,300 09.11.2021 -613.26
Credit Suisse (Schweiz) AG - Zurich - Switzerland
CHF 74,500 USD -80,739 09.11.2021 819.10
Credit Suisse (Schweiz) AG - Zurich - Switzerland
USD 169,280 EUR -146,200 09.11.2021 55.11
Credit Suisse (Schweiz) AG - Zurich - Switzerland
USD 7,558 CHF -7,000 09.11.2021 -104.72
Credit Suisse (Schweiz) AG - Zurich - Switzerland
CHF 3,533,100 USD -3,818,164 09.12.2021 53,035.87
UBS AG London Branch - London - United Kingdom
CHF 83,483,300 USD -91,518,335 09.12.2021 -46,100.89
UBS AG London Branch - London - United Kingdom
EUR 4,056,400 USD -4,693,997 09.12.2021 4,466.10
Credit Suisse (Schweiz) AG - Zurich - Switzerland
EUR 90,788,100 USD -107,996,903 09.12.2021 -2,838,499.03
Citibank N.A.- London - United Kingdom

CS Investment Funds 1 • Audited Annual Report as at 31.10.2021
Credit Suisse (Lux) Global Inflation Linked Bond Fund Page 67
Technical Data and Notes (Continued)
Forward foreign exchange contracts
Purchases Sales Maturity Valuation
Counterparty (In USD)
CHF 87,668,000 USD -94,848,404 11.01.2022 1,321,551.43
UBS AG London Branch - London - United Kingdom
EUR 94,844,500 USD -109,865,877 11.01.2022 105,277.39
Credit Suisse (Schweiz) AG - Zurich - Switzerland
Net unrealised gain on forward foreign exchange contracts 3,485,008.83
Swaps contracts
Type Payable Receivable Maturity Valuation
Counterparty Nominal Nominal (in USD)
IRS EUR 5,000,000 0.01435 EUR 5,000,000 YOY/EUR Inflation - Monthly 18.01.2022 152,078.85
Citigroup Global Markets Ltd. - London - United Kingdom
IRS USD 6,000,000 0.023925 USD 6,000,000 YOY/US Inflation - Monthly 11.02.2022 237,982.00
BNP Paribas S.A.-Paris-France
IRS USD 7,000,000 0.02135 USD 7,000,000 YOY/US Inflation - Daily 14.11.2022 340,748.00
BNP Paribas S.A.-Paris-France
IRS EUR 10,000,000 0.01459 EUR 10,000,000 YOY/EUR Inflation - Monthly 18.01.2023 372,715.51
Citigroup Global Markets Ltd. - London - United Kingdom
IRS USD 10,000,000 0.021695 USD 10,000,000 YOY/US Inflation - Monthly 18.01.2023 494,873.00
Citigroup Global Markets Ltd. - London - United Kingdom
IRS USD 5,000,000 0.0255 USD 5,000,000 YOY/US Inflation - Monthly 01.07.2023 166,292.00
Credit Suisse International - London - United Kingdom
IRS USD 5,000,000 0.025 USD 5,000,000 YOY/US Inflation - Monthly 23.06.2024 214,643.00
Credit Suisse International - London - United Kingdom
IRS EUR 5,000,000 0.01517 EUR 5,000,000 YOY/EUR Inflation - Monthly 18.01.2025 206,599.21
Citigroup Global Markets Ltd. - London - United Kingdom
IRS USD 5,000,000 0.02193 USD 5,000,000 YOY/US Inflation - Monthly 18.01.2025 324,194.00
BNP Paribas S.A.-Paris-France
IRS USD 10,000,000 1.97 USD 10,000,000 Zero Coupon/US Inflation - Interpolated - Maturity
15.12.2025 867,191.00
Credit Suisse International - London - United Kingdom
IRS EUR 7,000,000 0.01575 EUR 7,000,000 YOY/EUR Inflation - Monthly 18.01.2027 311,397.46
Citigroup Global Markets Ltd. - London - United Kingdom
IRS USD 10,000,000 0.02228 USD 10,000,000 YOY/US Inflation - Monthly 18.01.2027 721,876.00
BNP Paribas S.A.-Paris-France
IRS USD 5,000,000 2.0425 USD 5,000,000 Zero Coupon/US Inflation - Interpolated - Maturity
15.12.2027 479,321.00
Credit Suisse International - London - United Kingdom
IRS USD 2,000,000 2.12 USD 2,000,000 Zero Coupon/US Inflation - Interpolated - Maturity
15.12.2030 202,074.00
Credit Suisse International - London - United Kingdom
Net unrealised gain on swaps contracts 5,091,985.03

CS Investment Funds 1 • Audited Annual Report as at 31.10.2021
Credit Suisse (Lux) Global Inflation Linked Bond Fund Page 68
Statement of Net Assets (in USD) and Fund Evolution
* Cash at banks and at brokers include: USD 700,000.00 held as cash collateral with Credit Suisse International London. The notes are an integral part of the financial statements.
31.10.2021
Assets
Investments in securities at market value 1,056,494,179.30Cash at banks and at brokers* 7,945,199.55Income receivable 2,634,927.78Net unrealised gain on swaps contracts 5,091,985.03Net unrealised gain on forward foreign exchange contracts 3,485,008.83
1,075,651,300.49
Liabilities
Due to banks and to brokers 5,270,170.71Interest payable 11.87Provisions for accrued expenses 481,093.83Other liabilities 107.05
5,751,383.46
Net assets 1,069,899,917.03
Fund Evolution 31.10.2021 31.10.2020 31.10.2019
Total net assets USD 1,069,899,917.03 890,237,451.49 892,802,553.73
Net asset value per share
A - Distribution USD 116.95 111.27 107.31
B - Capitalisation USD 117.36 111.67 107.57
EB - Capitalisation USD 171.52 162.19 155.28
IB - Capitalisation USD 1,203.16 1,139.66 1,092.93
MB - Capitalisation USD 1,189.00 1,122.97 1,073.81
UA - Distribution USD 117.28 111.52 107.54
UB - Capitalisation USD 119.66 113.46 108.91
EBH - Capitalisation CHF 137.87 131.87 129.05
UAH - Distribution CHF / 98.79 97.06
UBH - Capitalisation CHF / 99.78 97.91
AH - Distribution EUR 103.80 99.65 97.99
BH - Capitalisation EUR 104.09 99.93 98.18
EBH - Capitalisation EUR 150.96 144.03 140.63
IBH - Capitalisation EUR 1,095.38 1,046.87 1,023.88
UAH - Distribution EUR 104.44 100.12 98.44
UBH - Capitalisation EUR 106.46 101.85 99.71
UAH - Distribution GBP / 103.72 101.24
UBH - Capitalisation GBP / 104.85 101.94
Number of shares outstanding At the end of the year At the beginning of
the year
Number of shares
issued
Number of shares
redeemed
A - Distribution USD 41,038.489 33,557.860 13,707.858 6,227.229
B - Capitalisation USD 472,367.490 444,997.676 72,692.931 45,323.117
EB - Capitalisation USD 1,241,532.915 1,090,429.666 419,541.869 268,438.620
IB - Capitalisation USD 22,239.396 17,198.393 6,243.646 1,202.643
MB - Capitalisation USD 116,185.294 109,551.067 6,634.227 0.000
UA - Distribution USD 11,940.732 7,644.181 4,296.551 0.000
UB - Capitalisation USD 70,528.650 34,609.486 40,664.152 4,744.988
EBH - Capitalisation CHF 1,924,330.258 1,558,091.809 672,683.928 306,445.479
UAH - Distribution CHF 0.000 1.000 0.000 1.000
UBH - Capitalisation CHF 0.000 261.000 0.000 261.000
AH - Distribution EUR 97,024.632 114,738.393 2,588.026 20,301.787
BH - Capitalisation EUR 341,743.224 209,940.915 169,811.036 38,008.727
EBH - Capitalisation EUR 1,401,917.363 1,433,489.344 304,513.801 336,085.782

CS Investment Funds 1 • Audited Annual Report as at 31.10.2021
Credit Suisse (Lux) Global Inflation Linked Bond Fund Page 69
Statement of Net Assets (in USD) and Fund Evolution (Continued)
The notes are an integral part of the financial statements.
Number of shares outstanding At the end of the year At the beginning of
the year
Number of shares
issued
Number of shares
redeemed
IBH - Capitalisation EUR 2,557.124 501.309 2,055.815 0.000
UAH - Distribution EUR 21,750.780 15,865.780 6,600.000 715.000
UBH - Capitalisation EUR 227,295.151 64,268.252 167,720.076 4,693.177
UAH - Distribution GBP 0.000 1.000 0.000 1.000
UBH - Capitalisation GBP 0.000 167.144 0.000 167.144

CS Investment Funds 1 • Audited Annual Report as at 31.10.2021
Credit Suisse (Lux) Global Inflation Linked Bond Fund Page 70
Statement of Operations / Changes in Net Assets (in USD)
The notes are an integral part of the financial statements.
For the period from
01.11.2020 to 31.10.2021
Net assets at the beginning of the year 890,237,451.49
Income
Interest on investments in securities (net) 8,686,838.67
Bank Interest 1,736.73
Securities lending income 111,378.02
8,799,953.42
Expenses
Management fee 3,617,881.49
Depositary fee 557,750.16
Administration expenses 679,117.46
Printing and publication expenses 21,933.31
Interest and bank charges 5,927.87
Audit, control, legal, representative bank and other expenses 665,477.79
"Taxe d'abonnement" 161,842.21
5,709,930.29
Net income (loss) 3,090,023.13
Realised gain (loss)
Net realised gain (loss) on sales of investments 12,935,321.50
Net realised gain (loss) on swaps contracts -1,150,629.87
Net realised gain (loss) on forward foreign exchange contracts -11,818,747.25
Net realised gain (loss) on foreign exchange 4,355,615.07
4,321,559.45
Net realised gain (loss) 7,411,582.58
Change in net unrealised appreciation (depreciation)
Change in net unrealised appreciation (depreciation) on investments 26,542,576.83
Change in net unrealised appreciation (depreciation) on swaps contracts 8,180,058.96
Change in net unrealised appreciation (depreciation) on forward foreign exchange contracts 2,722,896.66
37,445,532.45
Net increase (decrease) in net assets as a result of operations 44,857,115.03
Subscriptions / Redemptions
Subscriptions 300,275,157.70
Redemptions -165,461,935.06
134,813,222.64
Distribution -7,872.13
Net assets at the end of the year 1,069,899,917.03

CS Investment Funds 1 • Audited Annual Report as at 31.10.2021
Credit Suisse (Lux) Global Inflation Linked Bond Fund Page 71
Statement of Investments in Securities
The notes are an integral part of the financial statements. Any differences in the percentage of Net Assets are the result of roundings.
Breakdown by Country
USA 58.23
Italy 7.67
United Kingdom 7.26
France 6.16
Spain 5.86
Japan 4.51
Germany 1.99
Australia 1.97
Canada 1.41
New Zealand 1.03
Sweden 0.85
Netherlands 0.54
Supranational 0.42
Denmark 0.23
Switzerland 0.22
Finland 0.17
Guernsey 0.11
Luxembourg 0.11
Total 98.75
Breakdown by Economic Sector
Countries and central governments 89.84
Banks and other credit institutions 3.50
Financial, investment and other div. companies 1.67
Pharmaceuticals, cosmetics and medical products 0.96
Graphics publishing and printing media 0.58
Supranational organisations 0.42
Food and soft drinks 0.42
Telecommunication 0.34
Healthcare and social services 0.30
Computer hardware and networking 0.26
Insurance companies 0.19
Miscellaneous consumer goods 0.17
Lodging and catering industry, leisure facilities 0.11
Total 98.75
Statement of Investments in Securities
Description Quantity /
Nominal
Valuation
(in USD)
% of net
assets
Securities listed on a stock exchange or other organised
markets
Bonds
EUR ALIIANZ FINANCE II BV 3.5%/12-14.02.2022 1,000,000 1,170,639.38 0.11USD APPLE 3.45%/14-06.05.2024 1,320,000 1,405,509.60 0.13AUD AUSTRALIAN GOVERNMENT I/L 0.75%/17-
21.11.2027 5,239,000 4,586,267.85 0.43
AUD AUSTRALIAN GOVERNMENT S. -CAIN407- I/L 3%/09-20.09.2025
5,460,000 6,050,134.86 0.57
AUD AUSTRALIAN GOVERNMENT S. -TI408- I/L 2.5%/10-20.09.2030
4,453,000 5,218,387.58 0.49
USD BANCO SANTANDER 3.5%/17-11.04.2022 1,200,000 1,215,900.00 0.11EUR BANK OF NOVA SCOTIA 0.375%/17-06.04.2022 1,000,000 1,161,728.56 0.11USD BANK OF NOVA SCOTIA 1.625%/20-010523 1,000,000 1,016,360.00 0.09USD BANK OF NY MELLON CORP SJ 2.1%/19-241024 1,000,000 1,035,580.00 0.10USD BLACKROCK 3.5%/14-180324 720,000 766,353.60 0.07USD BNP PARIBAS 3.375%/18-090125 1,500,000 1,586,865.00 0.15EUR BRD I/L 0.1%/12-15.04.2023 1,605,939 2,139,169.94 0.20EUR BRD I/L 0.5%/12-150430 5,500,000 8,466,466.75 0.79EUR BUONI POLIENNALI DEL TES 0%/21-010426 2,500,000 2,845,648.82 0.27EUR BUONI POLIENNALI DEL TES I/L 0.65%/20-
15.05.2026 5,660,000 7,296,766.54 0.68
EUR BUONI POLIENNALI DEL TES I/L -144A- 0.4%/19-15.05.2030
8,357,000 10,938,416.98 1.02
EUR BUONI POLIENNALI DT 144A 0.6%/21-010831 2,875,000 3,167,127.08 0.30CAD CANADA S. VS05 I/L 4.25%/95-01.12.2026 4,811,000 7,890,894.06 0.74USD CANADIAN IMPERIAL BANK 2.25%/20-280125 1,000,000 1,031,360.00 0.10USD CATERPILLAR FINL SERVICE 2.55%/17-291122 2,000,000 2,045,140.00 0.19USD CISCO SYSTEMS 3.625%/14-04.03.2024 1,320,000 1,409,192.40 0.13USD CITIGROUP 3.4%/16-010526 1,000,000 1,077,550.00 0.10USD CITIGROUP 3.7%/16-120126 750,000 814,035.00 0.08USD COMCAST 3.375%/15-15.08.2025 2,700,000 2,899,314.00 0.27EUR CORP ANDINA DE FOMENTO 1.625%/20-
03.06.2025 2,000,000 2,426,706.96 0.23
EUR CPPIB CAPITAL INC 0.25%/20-06.04.2027 2,500,000 2,915,691.38 0.27EUR CREDIT AGRICOLE LONDON 0.875%/15-190122 1,000,000 1,160,825.90 0.11EUR CREDIT SUISSE AG LONDON BRANCH 1%/16-
07.06.2023 2,000,000 2,359,979.93 0.22
EUR CS GROUP FUNDING 1.25%/15-140422 1,000,000 1,165,466.48 0.11DKK DENMARK I/L 0.1%/12-15.11.2023 10,172,398 1,818,753.04 0.17DKK DENMARK I/L 0.1%/17-15.11.2030 3,400,000 643,255.55 0.06EUR DEUTSCHE TELEKOM INT FI 0.625%/16-030423 1,500,000 1,757,295.70 0.16USD EUROPEAN INVESTMENT BANK 1.625%/20-
14.03.2025 2,000,000 2,047,720.00 0.19
EUR FRANCE (GOVT OF) I/L 0.1%/19-01.03.2029 3,345,390 4,577,801.82 0.43EUR FRANCE (GOVT OF) I/L 144A 0.1%/21-250731 3,000,000 4,195,427.09 0.39EUR FRANCE OAT I/L 0.1%/14-01.03.2025 2,000,000 2,611,647.95 0.24EUR FRANCE OAT I/L 0.1%/16-01.03.2028 5,000,000 6,809,071.71 0.64EUR FRANCE OAT I/L 0.25%/12-25.07.2024 7,717,050 10,514,028.49 0.98EUR FRANCE OAT I/L 0.7%/14-25.07.2030 6,550,450 10,006,818.94 0.94EUR FRANCE OAT I/L 1.85%/10-25.07.2027 9,677,037 15,866,103.83 1.48EUR FRANCE OAT I/L 3.4%/99-25.07.2029 3,955,639 8,599,609.32 0.80EUR GERMANY I/L 0.1%/15-15.04.2026 7,696,365 10,637,235.77 0.99USD GLAXOSMITHKLINE CAP INC 3.375%/18-
15.05.2023 1,000,000 1,043,610.00 0.10
USD GLAXOSMITHKLINE CAPITAL 2.8%/13-180323 1,170,000 1,207,264.50 0.11USD GLAXOSMITHKLINE CAPITAL 2.85%/12-080522 5,000,000 5,065,850.00 0.47USD GOLDMAN SACHS GROUP 3.75%/15-220525 1,770,000 1,901,617.20 0.18USD GOLDMAN SACHS GROUP 4%/14-03.03.2024 2,000,000 2,136,460.00 0.20EUR INTESA SANPAOLO SPA 0.875%/17-270622 1,500,000 1,750,647.30 0.16EUR ITALY BTP I/L 0.1%/16-15.05.2022 3,959,000 5,058,075.13 0.47EUR ITALY BTP I/L 1.3%/16-15.05.2028 10,550,000 15,007,356.31 1.40EUR ITALY BTP I/L 2.6%/07-15.09.2023 9,051,000 14,042,637.27 1.31EUR ITALY I/L 2.35%/14-15.09.2024 6,548,000 9,193,844.08 0.86EUR ITALY I/L 3.1%/11-15.09.2026 7,894,000 12,748,318.85 1.19JPY JAPAN N. -17- I/L 0.1%/13-10.09.2023 240,900,000 2,261,374.09 0.21JPY JAPAN N. -19- I/L 0.1%/14-10.09.2024 458,400,000 4,178,476.71 0.39JPY JAPAN N. -20- I/L 0.1%/15-10.03.2025 1,085,700,000 9,937,831.30 0.93JPY JAPAN N. -21- I/L 0.1%/16-10.03.2026 881,900,000 8,115,065.96 0.76JPY JAPAN N. -22- I/L 0.1%/17-10.03.2027 735,800,000 6,852,809.30 0.64JPY JAPAN S. -18- I/L 0.1%/14-10.03.2024 364,500,000 3,404,468.90 0.32USD JOHN DEERE CAPITAL CORP 2.45%/20-090130 1,000,000 1,036,440.00 0.10EUR JOHN DEERE CASH MANAGEME 1.375%/20-
02.04.2024 1,000,000 1,200,808.89 0.11
USD JP MORGAN CHASE 3.9%/15-150725 2,700,000 2,932,875.00 0.27USD JPMORGAN CHASE & CO 3.2%/13-250123 5,000,000 5,166,933.25 0.48EUR MACQUARIE BANK (REG. -S-) 1.125%/15-
20.01.2022 1,000,000 1,161,358.24 0.11
USD MASTERCARD INC 2.95%/19-010629 1,000,000 1,075,120.00 0.10EUR MCDONALD'S CORP 0.625%/17-290124 1,000,000 1,176,888.53 0.11USD MERCK & CO INC 3.4%/19-070329 1,500,000 1,648,275.00 0.15USD METLIFE S D 4.368%/13-150923 780,000 832,470.60 0.08EUR MORGAN STANLEY 1.875%/17-27.04.2027 1,000,000 1,243,766.01 0.12EUR NATIONAL AUSTRALIA BANK 1.25%/16-180526 2,500,000 3,029,854.09 0.28USD NATIONAL BANK OF CANADA 2.1%/20-010223 1,000,000 1,018,380.00 0.10NZD NEW ZEALAND GVT ILB I/L 2%/12-20.09.2025 6,495,000 5,710,753.39 0.53NZD NEW ZEALAND GVT ILB I/L 3%/13-20.09.2030 5,443,000 5,343,470.01 0.50EUR NORDEA BANK AB 1.125%/17-27.09.2027 1,500,000 1,825,498.23 0.17USD NOVARTIS CAPITAL 2.4%/12-210922 3,440,000 3,504,500.00 0.33USD PEPSICO 2.75%/13-010323 2,500,000 2,576,450.00 0.24USD PEPSICO 2.75%/15-300425 1,860,000 1,959,603.00 0.18USD SIEMENS FINANCIERINGSMAATSCHAPPIJ (REG. -
S-) 2.9%/15-27.05.2022 1,000,000 1,014,830.00 0.09
EUR SPAIN I/L 0.65%/16-30.11.2027 12,709,000 18,052,659.32 1.69EUR SPAIN I/L 1.8%/13-30.11.2024 11,546,000 16,217,798.99 1.52EUR SPAIN I/L BOND I/L 0.15%/18-30.11.2023 5,923,000 7,641,447.92 0.71

CS Investment Funds 1 • Audited Annual Report as at 31.10.2021
Credit Suisse (Lux) Global Inflation Linked Bond Fund Page 72
Statement of Investments in Securities (Continued)
The notes are an integral part of the financial statements. Any differences in the percentage of Net Assets are the result of roundings.
Description Quantity /
Nominal
Valuation
(in USD)
% of net
assets
EUR SPAIN I/L BOND I/L -144A- 1%/15-30.11.2030 12,957,000 19,606,618.23 1.83USD STATE STREET CORP 2.65%/16-190526 3,000,000 3,175,950.00 0.30SEK SWEDEN I/L 0.125%/15-01.06.2026 14,410,000 2,017,838.03 0.19SEK SWEDEN I/L 0.125%/16-01.12.2027 9,960,000 1,412,016.16 0.13SEK SWEDEN I/L 1%/13-01.06.2025 13,160,000 1,860,532.83 0.17SEK SWEDEN I/L BOND I/L -144A- 0.125%/20-
01.06.2030 6,850,000 976,264.85 0.09
SEK SWEDEN S. 3104 I/L 3.5%/98-01.12.2028 12,965,000 2,843,942.34 0.27USD TOYOTA MOTOR CREDIT CORP S. -B- 2.15%/20-
13.02.2030 1,200,000 1,211,376.00 0.11
GBP TSY 0 1/8% 2028 I/L GILT I/L 0.125%/18-10.08.2028
8,450,000 16,010,919.05 1.50
GBP TSY 0 1/8% I/L GILT I/L 0.125%/21-100831 2,400,000 4,627,205.20 0.43USD TSY INFL S A-2031 I/L 0.125%/21-150131 19,200,000 22,410,035.74 2.09USD TSY INFL IX N/B I/L 0.125%/20-15.10.2025 16,200,000 18,573,293.83 1.74USD TSY INFL IX N/B I/L 0.125%/20-150730 20,330,100 24,170,397.84 2.26USD TSY INFL IX N/B S. -A-2029- I/L 0.875%/19-
15.01.2029 15,714,200 19,789,479.95 1.85
USD TSY INFL IX N/B S. -A-2030- I/L 0.125%/20-15.01.2030
19,257,200 22,704,265.76 2.12
USD TSY INFL IX N/B S. -D-2028- I/L 0.75%/18-15.07.2028
20,000,000 25,090,203.15 2.35
USD TSY INFL IX N/B S. -D-2029- I/L 0.25%/19-15.07.2029
18,682,100 22,411,589.81 2.09
USD TSY INFL IX N/B S. -X-2024- I/L 0.5%/19-15.04.2024
12,128,000 14,115,252.83 1.32
USD TSY INFL IX N/B S. -X-2025- I/L 0.125%/20-15.04.2025
8,000,000 9,134,580.74 0.85
USD TSY INFL S 2X-2026 I/L 0.125%/21-150426 8,750,000 9,944,010.24 0.93EUR UNILEVER 1%/17-14.02.2027 1,500,000 1,816,002.99 0.17GBP UNITED KINGDOM I/L 0.125%/11-22.03.2029 11,500,000 25,896,934.28 2.42GBP UNITED KINGDOM I/L 0.125%/15-22.03.2026 4,775,031 9,103,234.62 0.85GBP UNITED KINGDOM I/L 1.25%/06-22.11.2027 5,970,000 16,966,441.68 1.59USD UNITEDHEALTH GROUP 2.95%/17-151027 3,000,000 3,220,050.00 0.30USD US I/L 2.5%/09-15.01.2029 5,000,000 8,213,489.53 0.77USD US I/L 0.125%/14-15.07.2024 16,000,000 19,777,591.36 1.85USD US I/L 0.375%/13-15.07.2023 16,780,500 20,880,411.13 1.95USD US I/L 0.375%/17-15.01.2027 16,720,000 21,034,178.07 1.97USD US I/L 1.75%/08-15.01.2028 3,876,900 6,121,823.68 0.57USD US I/L 2%/06-15.01.2026 8,000,000 12,901,131.90 1.21USD US I/L 2.375%/04-15.01.2025 13,000,000 21,718,907.06 2.03USD US I/L 2.375%/07-15.01.2027 7,500,000 12,424,770.89 1.16USD US I/L 3.625%/98-15.04.2028 6,000,000 13,609,994.40 1.27USD US I/L 3.875%/99-15.04.2029 8,470,100 19,783,990.41 1.85USD US TREASURY I/L 0.125%/12-150722 9,780,500 11,965,808.86 1.12USD US TREASURY I/L 0.125%/13-150123 5,500,000 6,768,112.68 0.63USD US TREASURY I/L 0.125%/16-15.07.2026 16,000,000 20,024,176.77 1.87USD US TREASURY I/L 0.25%/15-15.01.2025 26,000,000 32,344,876.75 3.02USD US TREASURY I/L 0.375%/15-15.07.2025 16,717,200 21,140,506.98 1.98USD US TREASURY I/L 0.375%/17-15.07.2027 17,300,000 21,651,092.33 2.02USD US TREASURY I/L 0.5%/18-15.01.2028 19,370,000 24,175,175.14 2.26USD US TREASURY I/L 0.625%/14-150124 20,000,000 25,112,309.69 2.35USD US TREASURY I/L 0.625%/16-150126 27,000,000 34,461,746.25 3.22USD US TREASURY I/L 0.625%/18-15.04.2023 8,000,000 9,264,976.62 0.87USD VERIZON COMMUNICATIONS 4.125%/17-
16.03.2027 2,000,000 2,235,120.00 0.21
USD VERIZON COMMUNICATIONS 4.329%/18-21.09.2028
1,184,000 1,352,068.80 0.13
USD WALT DISNEY COMPANY/THE 2.95%/17-15.06.2027
2,000,000 2,159,780.00 0.20
USD WALT DISNEY COMPANY/THE 3.8%/20-22.03.2030
1,000,000 1,126,160.00 0.11
USD WESTPAC BANKING CORP 2.65%/20-160130 1,000,000 1,054,940.00 0.10
Total Bonds 1,027,015,710.68 95.99
Total securities listed on a stock exchange or other
organised markets 1,027,015,710.68 95.99
Securities not listed on a stock exchange
Bonds
JPY JAPAN GOVT CPI LINKED S. -23- I/L 0.1%/18-10.03.2028
689,600,000 6,335,264.03 0.59
JPY JAPAN GOVT CPI LINKED S. -24- I/L 0.1%/19-10.03.2029
700,200,000 6,390,293.63 0.60
JPY JAPAN GOVT CPI LINKED S. -25- I/L 0.2%/20-10.03.2030
89,000,000 824,178.15 0.08
USD TSY INFL IX N/B S D-2031 I/L 0.125%/21-1 14,000,000 15,928,732.81 1.49
Total Bonds 29,478,468.62 2.76
Total securities not listed on a stock exchange 29,478,468.62 2.76
Total of Portfolio 1,056,494,179.30 98.75
Cash at banks and at brokers 7,945,199.55 0.74
Due to banks and to brokers -5,270,170.71 -0.49
Other net assets 10,730,708.89 1.00
Total net assets 1,069,899,917.03 100.00

CS Investment Funds 1 • Audited Annual Report as at 31.10.2021
Credit Suisse (Lux) Floating Rate Credit Fund Page 73
Technical Data and Notes
Technical Data
Valoren ISIN Management Fee Total Expense Ratio
A - Distribution USD 38689111 LU1699964828 0.80% 1.05%
B - Capitalisation USD 10670981 LU0458985636 0.80% 1.05%
DA - Distribution USD 49408652 LU2039695544 0.00% 0.12%
DB - Capitalisation USD 3679009 LU0340000420 0.00% 0.11%
EB - Capitalisation USD 3679006 LU0340000263 0.50% 0.71%
IA - Distribution USD 38689163 LU1699965718 0.50% 0.75%
IB - Capitalisation USD 23727978 LU1034382256 0.50% 0.75%
UA - Distribution USD 38689175 LU1699966872 0.60% 0.85%
UB - Capitalisation USD 38689179 LU1699967250 0.60% 0.85%
AH - Distribution CHF 38689156 LU1699965049 0.60% /
DBH - Capitalisation CHF 23143261 LU1007181891 0.00% 0.15%
EBH - Capitalisation CHF 3679019 LU0340001154 0.30% 0.57%
IBH - Capitalisation CHF 23729088 LU1034382330 0.30% 0.66%
UAH - Distribution CHF 38689176 LU1699966955 0.40% 0.72%
AH - Distribution EUR 38689158 LU1699965122 0.60% 0.93%
BH - Capitalisation EUR 10670983 LU0458985800 0.60% 0.93%
DBH - Capitalisation EUR 3679015 LU0340000776 0.00% 0.15%
EBH - Capitalisation EUR 3679016 LU0340000933 0.30% 0.59%
IBH - Capitalisation EUR 23729139 LU1034382413 0.30% 0.62%
UAH - Distribution EUR 38689177 LU1699967094 0.40% 0.73%
UBH - Capitalisation EUR 38689181 LU1699967417 0.40% 0.73%
DBH - Capitalisation GBP 23486012 LU1023137125 0.00% /
IBH - Capitalisation GBP 23729148 LU1034382504 0.35% 0.68%
There is no management fee for -DA-, -DB- and -DBH- share classes. Credit Suisse (Lux) Floating Rate Credit Fund -AH- CHF was closed on 11.01.2021. Credit Suisse (Lux) Floating Rate Credit Fund -DBH- CHF was launched on 04.03.2021. Credit Suisse (Lux) Floating Rate Credit Fund -DBH- GBP was closed on 24.03.2021.
Fund Performance
YTD Since Inception 2020 2019 2018
A - Distribution USD 2.17% / 3.54% 6.77% -0.18%
B - Capitalisation USD 2.18% / 3.52% 6.78% -0.18%
DA - Distribution USD 2.98% 8.35% 4.52% / /
DB - Capitalisation USD 2.98% / 4.57% 7.77% 0.72%
EB - Capitalisation USD 2.46% / 3.89% 7.14% 0.17%
IA - Distribution USD 2.43% / 3.84% 7.10% 0.12%
IB - Capitalisation USD 2.43% / 3.84% 7.09% 0.13%
UA - Distribution USD 2.34% / 3.75% 6.99% 0.02%
UB - Capitalisation USD 2.34% / 3.74% 6.99% 0.02%
AH - Distribution CHF / / 1.26% 3.38% -3.37%
DBH - Capitalisation CHF / 1.41% / / /
EBH - Capitalisation CHF 1.82% / 2.06% 3.73% -3.02%
IBH - Capitalisation CHF 1.79% / 2.01% 3.71% -3.00%
UAH - Distribution CHF 1.70% / 1.94% 3.63% -3.24%
AH - Distribution EUR 1.66% / 1.92% 3.79% -2.98%
BH - Capitalisation EUR 1.65% / 1.89% 3.80% -3.02%
DBH - Capitalisation EUR 2.33% 8.44% 2.69% 4.56% /
EBH - Capitalisation EUR 1.94% / 2.25% 4.17% -2.62%
IBH - Capitalisation EUR 1.90% / 2.19% 4.11% -2.74%
UAH - Distribution EUR 1.83% / 2.13% 3.97% -2.72%
UBH - Capitalisation EUR 1.82% / 2.09% 4.01% -2.89%
DBH - Capitalisation GBP / / / / /
IBH - Capitalisation GBP 2.34% / 2.77% 5.40% -1.45%
Distribution
Ex-Date Amount
A - Distribution USD 01.12.2020 0.44
A - Distribution USD 02.03.2021 0.44
A - Distribution USD 01.06.2021 0.40
A - Distribution USD 07.09.2021 0.40
DA - Distribution USD 01.12.2020 6.77
DA - Distribution USD 02.03.2021 6.77
DA - Distribution USD 01.06.2021 6.54

CS Investment Funds 1 • Audited Annual Report as at 31.10.2021
Credit Suisse (Lux) Floating Rate Credit Fund Page 74
Technical Data and Notes (Continued)
Distribution
DA - Distribution USD 07.09.2021 6.48
IA - Distribution USD 01.12.2020 0.51
IA - Distribution USD 02.03.2021 0.52
IA - Distribution USD 01.06.2021 0.48
IA - Distribution USD 07.09.2021 0.48
UA - Distribution USD 01.12.2020 0.49
UA - Distribution USD 02.03.2021 0.49
UA - Distribution USD 01.06.2021 0.46
UA - Distribution USD 07.09.2021 0.45
AH - Distribution CHF 01.12.2020 0.44
UAH - Distribution CHF 01.12.2020 0.49
UAH - Distribution CHF 02.03.2021 0.45
UAH - Distribution CHF 01.06.2021 0.46
UAH - Distribution CHF 07.09.2021 0.43
AH - Distribution EUR 01.12.2020 0.45
AH - Distribution EUR 02.03.2021 0.41
AH - Distribution EUR 01.06.2021 0.41
AH - Distribution EUR 07.09.2021 0.41
UAH - Distribution EUR 01.12.2020 0.50
UAH - Distribution EUR 02.03.2021 0.45
UAH - Distribution EUR 01.06.2021 0.46
UAH - Distribution EUR 07.09.2021 0.46
Notes
Forward foreign exchange contracts
Purchases Sales Maturity Valuation
Counterparty (In USD)
CHF 196,300 USD -214,894 09.11.2021 3.78
Credit Suisse (Schweiz) AG - Zurich - Switzerland
EUR 962,200 USD -1,113,744 09.11.2021 -5.77
Credit Suisse (Schweiz) AG - Zurich - Switzerland
CHF 81,900 USD -89,658 09.11.2021 1.68
Credit Suisse (Schweiz) AG - Zurich - Switzerland
EUR 1,119,800 USD -1,307,702 09.11.2021 -11,544.02
Credit Suisse (Schweiz) AG - Zurich - Switzerland
EUR 82,800 USD -96,032 09.11.2021 -191.77
Credit Suisse (Schweiz) AG - Zurich - Switzerland
CHF 115,700 USD -126,123 09.11.2021 538.36
Credit Suisse (Schweiz) AG - Zurich - Switzerland
EUR 22,300 USD -25,867 09.11.2021 -54.79
Credit Suisse (Schweiz) AG - Zurich - Switzerland
CHF 98,900 USD -107,520 09.11.2021 749.34
Credit Suisse (Schweiz) AG - Zurich - Switzerland
GBP 60,700 USD -83,701 09.11.2021 -496.52
Credit Suisse (Schweiz) AG - Zurich - Switzerland
EUR 145,100 USD -168,557 09.11.2021 -604.64
Credit Suisse (Schweiz) AG - Zurich - Switzerland
CHF 105,700 USD -114,991 09.11.2021 722.85
Credit Suisse (Schweiz) AG - Zurich - Switzerland
CHF 180,700 USD -197,405 09.11.2021 414.52
Credit Suisse (Schweiz) AG - Zurich - Switzerland
EUR 536,000 USD -624,423 09.11.2021 -4,007.67
Credit Suisse (Schweiz) AG - Zurich - Switzerland
EUR 27,600 USD -32,152 09.11.2021 -205.04
Credit Suisse (Schweiz) AG - Zurich - Switzerland
GBP 32,800 USD -45,313 09.11.2021 -351.78
Credit Suisse (Schweiz) AG - Zurich - Switzerland
EUR 109,600 USD -127,699 09.11.2021 -837.90
Credit Suisse (Schweiz) AG - Zurich - Switzerland

CS Investment Funds 1 • Audited Annual Report as at 31.10.2021
Credit Suisse (Lux) Floating Rate Credit Fund Page 75
Technical Data and Notes (Continued)
Forward foreign exchange contracts
Purchases Sales Maturity Valuation
Counterparty (In USD)
CHF 130,700 USD -142,167 09.11.2021 915.93
Credit Suisse (Schweiz) AG - Zurich - Switzerland
CHF 112,800 USD -122,480 09.11.2021 1,007.11
Credit Suisse (Schweiz) AG - Zurich - Switzerland
EUR 340,900 USD -397,111 09.11.2021 -2,521.98
Credit Suisse (Schweiz) AG - Zurich - Switzerland
USD 3,598,731 EUR -3,100,000 09.11.2021 10,506.81
UBS AG London Branch - London - United Kingdom
CHF 65,800 USD -71,256 09.11.2021 778.35
Credit Suisse (Schweiz) AG - Zurich - Switzerland
EUR 1,121,400 USD -1,301,561 09.11.2021 -3,550.35
Credit Suisse (Schweiz) AG - Zurich - Switzerland
CHF 115,400 USD -125,076 09.11.2021 1,257.40
Credit Suisse (Schweiz) AG - Zurich - Switzerland
EUR 274,200 USD -318,316 09.11.2021 -932.28
Credit Suisse (Schweiz) AG - Zurich - Switzerland
EUR 219,700 USD -254,753 09.11.2021 -452.58
Credit Suisse (Schweiz) AG - Zurich - Switzerland
CHF 32,000 USD -34,680 09.11.2021 351.83
Credit Suisse (Schweiz) AG - Zurich - Switzerland
USD 115,800 EUR -100,000 09.11.2021 50.39
Credit Suisse (Schweiz) AG - Zurich - Switzerland
CHF 29,600 USD -31,872 09.11.2021 532.03
Credit Suisse (Schweiz) AG - Zurich - Switzerland
EUR 75,600 USD -87,347 09.11.2021 159.21
Credit Suisse (Schweiz) AG - Zurich - Switzerland
CHF 503,700 USD -543,905 09.11.2021 7,515.63
Credit Suisse (Schweiz) AG - Zurich - Switzerland
USD 3,933,351 EUR -3,400,000 09.11.2021 -2,117.76
Credit Suisse (Schweiz) AG - Zurich - Switzerland
CHF 71,700 USD -77,356 09.11.2021 1,137.24
Credit Suisse (Schweiz) AG - Zurich - Switzerland
USD 2,776 EUR -2,400 09.11.2021 -1.89
Credit Suisse (Schweiz) AG - Zurich - Switzerland
GBP 3,100 USD -4,222 09.11.2021 27.00
Credit Suisse (Schweiz) AG - Zurich - Switzerland
CHF 246,000 USD -265,655 09.11.2021 3,651.31
UBS AG London Branch - London - United Kingdom
GBP 2,500 USD -3,400 09.11.2021 26.64
Credit Suisse (Schweiz) AG - Zurich - Switzerland
USD 931,366 EUR -800,000 09.11.2021 5,371.68
Credit Suisse (Schweiz) AG - Zurich - Switzerland
EUR 350,000 USD -406,113 09.11.2021 -991.55
Credit Suisse (Schweiz) AG - Zurich - Switzerland
USD 4,102,200 EUR -3,500,000 09.11.2021 50,970.38
UBS AG London Branch - London - United Kingdom
CHF 4,584,600 USD -5,022,144 09.11.2021 -3,199.28
UBS AG London Branch - London - United Kingdom
USD 1,188,917 EUR -1,000,000 09.11.2021 31,419.45
Credit Suisse (Schweiz) AG - Zurich - Switzerland
GBP 1,800 USD -2,487 09.11.2021 -19.97
Credit Suisse (Schweiz) AG - Zurich - Switzerland
USD 3,559,017 EUR -3,000,000 09.11.2021 86,525.99
Credit Suisse (Schweiz) AG - Zurich - Switzerland
EUR 23,737,000 USD -28,070,498 09.11.2021 -595,134.06
Credit Suisse (Schweiz) AG - Zurich - Switzerland
USD 203,554,569 EUR -172,130,000 09.11.2021 4,314,744.80
Credit Suisse (Schweiz) AG - Zurich - Switzerland

CS Investment Funds 1 • Audited Annual Report as at 31.10.2021
Credit Suisse (Lux) Floating Rate Credit Fund Page 76
Technical Data and Notes (Continued)
Forward foreign exchange contracts
Purchases Sales Maturity Valuation
Counterparty (In USD)
CHF 5,206,100 USD -5,745,956 09.11.2021 -46,629.59
UBS AG London Branch - London - United Kingdom
USD 4,613,452 CHF -4,180,000 09.11.2021 37,428.50
UBS AG London Branch - London - United Kingdom
USD 5,929,828 GBP -4,260,000 09.11.2021 90,411.32
Citibank N.A.- London - United Kingdom
GBP 931,200 USD -1,296,210 09.11.2021 -19,763.32
Citibank N.A.- London - United Kingdom
EUR 2,258,700 USD -2,614,658 09.12.2021 1,557.60
JP Morgan Securities PLC - London - United Kingdom
CHF 246,000 USD -265,848 09.12.2021 3,692.74
UBS AG London Branch - London - United Kingdom
GBP 2,500 USD -3,400 09.12.2021 26.86
Credit Suisse (Schweiz) AG - Zurich - Switzerland
EUR 20,973,600 USD -24,949,127 09.12.2021 -655,741.70
Citibank N.A.- London - United Kingdom
CHF 9,790,700 USD -10,733,028 09.12.2021 -5,406.59
UBS AG London Branch - London - United Kingdom
GBP 933,000 USD -1,289,295 09.12.2021 -10,285.39
Credit Suisse (Schweiz) AG - Zurich - Switzerland
EUR 23,484,600 USD -27,213,738 11.01.2022 16,396.95
JP Morgan Securities PLC - London - United Kingdom
CHF 10,036,700 USD -10,858,751 11.01.2022 151,298.25
UBS AG London Branch - London - United Kingdom
GBP 935,500 USD -1,271,354 11.01.2022 11,342.93
Credit Suisse (Schweiz) AG - Zurich - Switzerland
Net unrealised gain on forward foreign exchange contracts 3,466,486.67
Swaps contracts
Type Payable Receivable Maturity Valuation
Counterparty Nominal Nominal (in USD)
IRS EUR 11,000,000 -0.3098 EUR 11,000,000 6M EURIBOR 15.06.2023 -10,137.51
Credit Suisse International - London - United Kingdom
IRS USD 40,000,000 0.1982 USD 40,000,000 USD-SOFR-OIS-COMPOUND/1D
30.08.2023 181,348.00
Credit Suisse International - London - United Kingdom
IRS EUR 9,000,000 -0.5118 EUR 9,000,000 6M EURIBOR 12.01.2024 100,298.86
Credit Suisse International - London - United Kingdom
IRS EUR 6,000,000 -0.3868 EUR 6,000,000 6M EURIBOR 24.05.2024 40,641.46
Credit Suisse International - London - United Kingdom
IRS EUR 3,000,000 -0.4158 EUR 3,000,000 6M EURIBOR 04.06.2024 24,208.51
Credit Suisse International - London - United Kingdom
IRS EUR 9,000,000 -0.4468 EUR 9,000,000 6M EURIBOR 30.08.2024 100,979.32
Credit Suisse International - London - United Kingdom
IRS USD 55,000,000 0.3982 USD 55,000,000 USD-SOFR-OIS-COMPOUND/1D
30.08.2024 466,317.00
Credit Suisse International - London - United Kingdom
IRS USD 7,000,000 0.6667 USD 7,000,000 USD-SOFR-OIS-COMPOUND/1D
22.10.2024 15,473.00
Credit Suisse International - London - United Kingdom
IRS EUR 7,000,000 -0.2483 EUR 7,000,000 6M EURIBOR 22.10.2024 38,531.80
Credit Suisse International - London - United Kingdom
IRS EUR 8,000,000 -0.2568 EUR 8,000,000 6M EURIBOR 04.11.2024 47,712.26
Credit Suisse International - London - United Kingdom
IRS EUR 12,000,000 -0.1808 EUR 12,000,000 6M EURIBOR 07.01.2025 48,472.57

CS Investment Funds 1 • Audited Annual Report as at 31.10.2021
Credit Suisse (Lux) Floating Rate Credit Fund Page 77
Technical Data and Notes (Continued)
Swaps contracts
Type Payable Receivable Maturity Valuation
Counterparty Nominal Nominal (in USD)
Credit Suisse International - London - United Kingdom
IRS EUR 8,000,000 -0.3178 EUR 8,000,000 6M EURIBOR 05.05.2025 79,500.76
Credit Suisse International - London - United Kingdom
IRS EUR 8,000,000 -0.2763 EUR 8,000,000 6M EURIBOR 15.06.2025 71,983.26
Credit Suisse International - London - United Kingdom
IRS GBP 3,500,000 0.4192 GBP 3,500,000 GBP-SONIA-OIS-COMPOUND/1D
27.08.2025 116,418.57
Credit Suisse International - London - United Kingdom
IRS USD 10,000,000 0.5772 USD 10,000,000 USD-SOFR-OIS-COMPOUND/1D
29.08.2025 104,544.00
Credit Suisse International - London - United Kingdom
IRS USD 50,000,000 0.5722 USD 50,000,000 USD-SOFR-OIS-COMPOUND/1D
29.08.2025 532,692.00
Credit Suisse International - London - United Kingdom
IRS EUR 4,000,000 -0.4278 EUR 4,000,000 6M EURIBOR 22.09.2025 73,268.97
Credit Suisse International - London - United Kingdom
IRS EUR 10,000,000 -0.2068 EUR 10,000,000 6M EURIBOR 04.11.2025 83,072.03
Credit Suisse International - London - United Kingdom
IRS EUR 2,500,000 0.006752 EUR 2,500,000 6M EURIBOR 09.01.2026 -102,734.87
Credit Suisse International - London - United Kingdom
IRS EUR 3,000,000 -0.4503 EUR 3,000,000 6M EURIBOR 19.01.2026 73,208.79
Credit Suisse International - London - United Kingdom
IRS EUR 2,000,000 -0.2103 EUR 2,000,000 6M EURIBOR 24.05.2026 20,702.05
Credit Suisse International - London - United Kingdom
IRS USD 12,000,000 0.6787 USD 12,000,000 USD-SOFR-OIS-COMPOUND/1D
27.08.2026 157,997.00
Credit Suisse International - London - United Kingdom
IRS USD 4,000,000 0.7182 USD 4,000,000 USD-SOFR-OIS-COMPOUND/1D
30.08.2026 45,280.00
Credit Suisse International - London - United Kingdom
IRS USD 42,000,000 0.7122 USD 42,000,000 USD-SOFR-OIS-COMPOUND/1D
30.08.2026 487,929.00
Credit Suisse International - London - United Kingdom
IRS USD 7,000,000 0.9972 USD 7,000,000 USD-SOFR-OIS-COMPOUND/1D
22.10.2026 -3,435.00
Credit Suisse International - London - United Kingdom
IRS EUR 7,000,000 -0.0723 EUR 7,000,000 6M EURIBOR 22.10.2026 42,863.38
Credit Suisse International - London - United Kingdom
IRS EUR 11,000,000 -0.1598 EUR 11,000,000 6M EURIBOR 20.04.2027 163,444.20
Credit Suisse International - London - United Kingdom
IRS EUR 5,000,000 -0.1658 EUR 5,000,000 6M EURIBOR 24.06.2027 70,743.85
Credit Suisse International - London - United Kingdom
IRS EUR 9,000,000 -0.2748 EUR 9,000,000 6M EURIBOR 06.07.2027 198,547.07
Credit Suisse International - London - United Kingdom
IRS USD 3,000,000 0.8302 USD 3,000,000 USD-SOFR-OIS-COMPOUND/1D
30.08.2027 37,402.00
Credit Suisse International - London - United Kingdom
IRS EUR 2,500,000 -0.2368 EUR 2,500,000 6M EURIBOR 09.09.2027 53,197.63
Credit Suisse International - London - United Kingdom
IRS EUR 5,000,000 -0.3278 EUR 5,000,000 6M EURIBOR 14.09.2027 138,703.36
Credit Suisse International - London - United Kingdom
IRS EUR 3,500,000 -0.3558 EUR 3,500,000 6M EURIBOR 22.09.2027 104,510.09
Credit Suisse International - London - United Kingdom
IRS EUR 3,000,000 -0.1868 EUR 3,000,000 6M EURIBOR 03.03.2028 66,286.12
Credit Suisse International - London - United Kingdom
IRS EUR 5,000,000 -0.0803 EUR 5,000,000 6M EURIBOR 13.05.2028 62,441.74
Credit Suisse International - London - United Kingdom
IRS EUR 2,000,000 -0.0393 EUR 2,000,000 6M EURIBOR 24.05.2028 18,985.84
Credit Suisse International - London - United Kingdom

CS Investment Funds 1 • Audited Annual Report as at 31.10.2021
Credit Suisse (Lux) Floating Rate Credit Fund Page 78
Technical Data and Notes (Continued)
Swaps contracts
Type Payable Receivable Maturity Valuation
Counterparty Nominal Nominal (in USD)
IRS EUR 3,000,000 -0.1958 EUR 3,000,000 6M EURIBOR 20.07.2028 72,074.69
Credit Suisse International - London - United Kingdom
IRS USD 5,500,000 0.9297 USD 5,500,000 USD-SOFR-OIS-COMPOUND/1D
30.08.2028 72,934.00
Credit Suisse International - London - United Kingdom
IRS EUR 4,000,000 0.0727 EUR 4,000,000 6M EURIBOR 22.10.2028 20,610.62
Credit Suisse International - London - United Kingdom
IRS EUR 3,500,000 -0.0693 EUR 3,500,000 6M EURIBOR 22.03.2029 67,959.51
Credit Suisse International - London - United Kingdom
IRS USD 2,000,000 1.0082 USD 2,000,000 USD-SOFR-OIS-COMPOUND/1D
30.08.2029 27,472.00
Credit Suisse International - London - United Kingdom
IRS USD 12,500,000 1.0737 USD 12,500,000 USD-SOFR-OIS-COMPOUND/1D
30.08.2030 174,800.00
Credit Suisse International - London - United Kingdom
IRS EUR 3,000,000 -0.0243 EUR 3,000,000 6M EURIBOR 06.09.2031 99,102.26
Credit Suisse International - London - United Kingdom
IRS EUR 6,000,000 -0.1098 EUR 6,000,000 6M EURIBOR 26.01.2033 330,639.05
Credit Suisse International - London - United Kingdom
Net unrealised gain on swaps contracts 4,616,989.24

CS Investment Funds 1 • Audited Annual Report as at 31.10.2021
Credit Suisse (Lux) Floating Rate Credit Fund Page 79
Statement of Net Assets (in USD) and Fund Evolution
* Cash at banks and at brokers include: USD 7,123,647.03 held as cash collateral with Credit Suisse International London. The notes are an integral part of the financial statements.
31.10.2021
Assets
Investments in securities at market value 583,127,124.00Cash at banks and at brokers* 10,262,221.40Income receivable 6,007,509.67Net unrealised gain on swaps contracts 4,616,989.24Net unrealised gain on forward foreign exchange contracts 3,466,486.67Other assets 11,814.14
607,492,145.12
Liabilities
Due to banks and to brokers 4,009,917.67Provisions for accrued expenses 192,276.70
4,202,194.37
Net assets 603,289,950.75
Fund Evolution 31.10.2021 31.10.2020 31.10.2019
Total net assets USD 603,289,950.75 550,247,789.29 564,218,376.14
Net asset value per share
A - Distribution USD 103.11 99.63 100.12
B - Capitalisation USD 112.68 107.13 104.89
DA - Distribution USD 1,033.22 998.34 /
DB - Capitalisation USD 1,198.16 1,128.13 1,093.65
EB - Capitalisation USD 144.28 136.68 133.37
IA - Distribution USD 103.19 99.71 100.20
IB - Capitalisation USD 116.74 110.64 108.00
UA - Distribution USD 103.23 99.76 100.25
UB - Capitalisation USD 113.58 107.76 105.29
AH - Distribution CHF / 91.22 93.60
DBH - Capitalisation CHF 1,012.48 / /
EBH - Capitalisation CHF 118.90 113.60 113.14
IBH - Capitalisation CHF 100.10 95.69 95.33
UAH - Distribution CHF 93.37 91.10 93.48
AH - Distribution EUR 94.52 92.09 94.31
BH - Capitalisation EUR 103.70 99.28 99.00
DBH - Capitalisation EUR 1,084.38 1,029.87 1,019.03
EBH - Capitalisation EUR 127.62 121.75 120.99
IBH - Capitalisation EUR 102.71 98.04 97.47
UAH - Distribution EUR 94.65 92.21 94.42
UBH - Capitalisation EUR 104.55 99.89 99.41
DBH - Capitalisation GBP / 1,003.18 /
IBH - Capitalisation GBP 109.66 104.10 102.82
Number of shares outstanding At the end of the year At the beginning of
the year
Number of shares
issued
Number of shares
redeemed
A - Distribution USD 201,592.725 187,291.007 47,500.182 33,198.464
B - Capitalisation USD 287,139.337 332,238.507 171,495.151 216,594.321
DA - Distribution USD 17,322.721 14,964.927 13,501.033 11,143.239
DB - Capitalisation USD 209,165.754 166,997.114 90,495.375 48,326.735
EB - Capitalisation USD 160,497.690 152,494.000 41,967.690 33,964.000
IA - Distribution USD 387,234.898 467,442.670 117,777.449 197,985.221
IB - Capitalisation USD 458,856.590 445,314.046 130,362.557 116,820.013
UA - Distribution USD 50,806.684 47,298.211 14,572.264 11,063.791
UB - Capitalisation USD 303,053.319 286,507.080 79,493.804 62,947.565

CS Investment Funds 1 • Audited Annual Report as at 31.10.2021
Credit Suisse (Lux) Floating Rate Credit Fund Page 80
Statement of Net Assets (in USD) and Fund Evolution (Continued)
The notes are an integral part of the financial statements.
Number of shares outstanding At the end of the year At the beginning of
the year
Number of shares
issued
Number of shares
redeemed
AH - Distribution CHF 0.000 1,651.077 0.000 1,651.077
DBH - Capitalisation CHF 16,850.000 0.000 16,860.000 10.000
EBH - Capitalisation CHF 100,389.042 26,135.042 83,417.000 9,163.000
IBH - Capitalisation CHF 9,729.603 86,762.026 3,670.037 80,702.460
UAH - Distribution CHF 20,270.089 13,103.308 9,141.781 1,975.000
AH - Distribution EUR 48,353.303 52,525.958 5,585.578 9,758.233
BH - Capitalisation EUR 57,337.688 63,569.647 24,411.799 30,643.758
DBH - Capitalisation EUR 22,583.614 7,567.227 15,740.750 724.363
EBH - Capitalisation EUR 170,350.677 149,312.650 93,332.308 72,294.281
IBH - Capitalisation EUR 56,642.062 38,734.065 19,838.166 1,930.169
UAH - Distribution EUR 11,369.665 9,879.665 2,170.000 680.000
UBH - Capitalisation EUR 105,607.333 90,804.824 22,762.974 7,960.465
DBH - Capitalisation GBP 0.000 48,256.771 0.000 48,256.771
IBH - Capitalisation GBP 26,570.692 34,886.647 2,487.590 10,803.545

CS Investment Funds 1 • Audited Annual Report as at 31.10.2021
Credit Suisse (Lux) Floating Rate Credit Fund Page 81
Statement of Operations / Changes in Net Assets (in USD)
The notes are an integral part of the financial statements.
For the period from
01.11.2020 to 31.10.2021
Net assets at the beginning of the year 550,247,789.29
Income
Interest on investments in securities (net) 18,033,877.60
Dividends (net) 2,525.00
Securities lending income 122,845.72
18,159,248.32
Expenses
Management fee 1,653,298.64
Depositary fee 328,785.96
Administration expenses 199,822.44
Printing and publication expenses 22,454.43
Interest and bank charges 12,895.79
Audit, control, legal, representative bank and other expenses 272,305.73
"Taxe d'abonnement" 114,805.24
2,604,368.23
Net income (loss) 15,554,880.09
Realised gain (loss)
Net realised gain (loss) on sales of investments 11,146,862.12
Net realised gain (loss) on swaps contracts -9,965,642.18
Net realised gain (loss) on forward foreign exchange contracts 3,193,412.74
Net realised gain (loss) on foreign exchange -13,951.53
4,360,681.15
Net realised gain (loss) 19,915,561.24
Change in net unrealised appreciation (depreciation)
Change in net unrealised appreciation (depreciation) on investments -4,868,408.61
Change in net unrealised appreciation (depreciation) on swaps contracts 17,672,619.75
Change in net unrealised appreciation (depreciation) on forward foreign exchange contracts 2,266,367.78
15,070,578.92
Net increase (decrease) in net assets as a result of operations 34,986,140.16
Subscriptions / Redemptions
Subscriptions 261,832,157.66
Redemptions -241,772,815.22
20,059,342.44
Distribution -2,003,321.14
Net assets at the end of the year 603,289,950.75

CS Investment Funds 1 • Audited Annual Report as at 31.10.2021
Credit Suisse (Lux) Floating Rate Credit Fund Page 82
Statement of Investments in Securities
The notes are an integral part of the financial statements. Any differences in the percentage of Net Assets are the result of roundings.
Breakdown by Country
Netherlands 13.51
USA 12.56
Germany 8.27
Cayman Islands 7.10
United Kingdom 6.92
Luxembourg 6.41
Ireland 5.46
France 3.79
Mexico 3.01
Supranational 2.60
Switzerland 2.51
Spain 2.48
Italy 2.47
Virgin Islands (UK) 2.18
United Arab Emirates 1.53
Sweden 1.52
Peru 1.38
Japan 1.27
Austria 1.05
Bermuda 1.00
Belgium 0.98
Denmark 0.95
Qatar 0.88
Portugal 0.74
Singapore 0.72
Chile 0.68
India 0.55
Colombia 0.54
Norway 0.51
Australia 0.44
South Africa 0.35
Indonesia 0.34
Isle of Man 0.34
Saudi-Arabia 0.32
Panama 0.31
Romania 0.29
Egypt 0.26
Paraguay 0.22
Bahrain 0.20
Total 96.66
Breakdown by Economic Sector
Financial, investment and other div. companies 37.53
Banks and other credit institutions 21.13
Petroleum 5.69
Telecommunication 3.30
Internet, software and IT services 2.91
Supranational organisations 2.87
Energy and water supply 2.79
Pharmaceuticals, cosmetics and medical products 2.56
Chemicals 1.92
Food and soft drinks 1.82
Electrical appliances and components 1.81
Miscellaneous services 1.43
Mortgage and funding institutions (MBS, ABS) 1.43
Computer hardware and networking 1.39
Real estate 1.39
Traffic and transportation 1.32
Packaging industries 0.91
Mining, coal and steel industry 0.62
Insurance companies 0.60
Forestry, paper and forest products 0.48
Non-ferrous metals 0.47
Retailing, department stores 0.40
Textiles, garments and leather goods 0.35
Precious metals and precious stones 0.35
Building materials and building industry 0.33
Electronics and semiconductors 0.30
Vehicles 0.30
Miscellaneous consumer goods 0.26
Total 96.66
Statement of Investments in Securities
Description Quantity /
Nominal
Valuation
(in USD)
% of net
assets
Securities listed on a stock exchange or other organised
markets
Bonds
EUR ABN AMRO BANK NV SUB FF FRN/20-PERPET 1,200,000 1,485,839.57 0.25USD ABQ FINANCE 3.5%/17-22.02.2022 1,000,000 1,008,980.00 0.17USD AFRICA FINANCE CORP 2.875%/21-280428 3,050,000 3,044,205.00 0.50USD AFRICA FINANCE CORP 3.125%/20-16.06.2025 3,500,000 3,639,020.00 0.60USD AFRICAN EXPORT-IMPORT BA 4.125%/17-
20.06.2024 1,500,000 1,592,805.00 0.26
EUR AIB GROUP PLC SUB FF FRN/19-191129 2,000,000 2,359,794.77 0.39EUR ALLIANZ SE SUB FF FRN/21-PERPET 3,200,000 3,618,989.23 0.60EUR ALTICE FINANCING S.A. 3%/20-150128 3,000,000 3,302,918.80 0.55USD ALTICE FINANCING SA 144A 5%/20-150128 500,000 482,515.00 0.08EUR AMCO SPA 2.25%/20-17.07.2027 3,500,000 4,337,303.57 0.72USD ARAB PETROLEUM INVST 1.46%/20-30.06.2025 5,000,000 5,009,800.00 0.83USD ARCONIC CORP -144A- 6%/20-15.05.2025 2,700,000 2,840,373.00 0.47EUR ARDAGH PKG FIN/HLDGS USA2.125%/19-
150826 1,250,000 1,432,010.08 0.24
EUR ARKEMA SUB FF FRN/19-PERPET 3,000,000 3,644,712.59 0.60EUR AT&T INC SUB FF FRN/20-PERPET 2,000,000 2,323,225.67 0.39USD BAIC FINANCE INV CO LTD 2%/21-160324 3,000,000 3,006,450.00 0.50USD BAIDU INC 1.625%/21-230227 1,750,000 1,711,062.50 0.28USD BAIDU INC 1.72%/20-09.04.2026 4,000,000 3,962,080.00 0.66EUR BANCO COMERC PORTUGUES FIX-TO-FRN
FRN/21-12.02.2027 4,000,000 4,488,556.14 0.74
USD BANCO DE CREDITO DEL PERU CREDITO (REG. -S-) 4.25%/13-01.04.2023
4,000,000 4,173,040.00 0.69
EUR BANCO DE SABADELL SA SUB FF FRN/121228 2,000,000 2,523,152.18 0.42USD BANCO NACIONAL DE PANAMA 2.5%/20-
11.08.2030 2,000,000 1,898,120.00 0.31
USD BANCO SANTANDER CHILE 2.7%/20-100125 4,000,000 4,121,120.00 0.68USD BANCO SANTANDER MEXICO 5.375%/20-
17.04.2025 4,000,000 4,431,560.00 0.73
EUR BANCO SANTANDER SA SUB FF FRN/20-PERPET 1,000,000 1,197,753.75 0.20USD BANK OF IRELAND FIX-TO-FRN 4.125%/17-
19.09.2027 4,000,000 4,071,120.00 0.67
USD BANK OF IRELAND GROUP 4.5%/18-25.11.2023 2,400,000 2,563,080.00 0.42EUR BAYER AG SUB FF FRN/19-120579 4,000,000 4,628,953.71 0.77USD BAYER US FINANCE II LLC 4.25%/18-151225 2,000,000 2,193,240.00 0.36USD BBVA BANCO CONTINENTAL (REG. -S-) 5%/12-
26.08.2022 4,000,000 4,133,880.00 0.69
USD BBVA BANCOMER SA TEXAS 1.875%/20-18.09.2025
3,850,000 3,861,935.00 0.64
EUR BEVCO LUX SARL 1.5%/20-16.09.2027 4,500,000 5,446,342.53 0.90USD BLACK SEA TRADE AND DEVE 3.5%/19-
25.06.2024 350,000 367,643.50 0.06
EUR BP CAPITAL MARKETS PLC (SUBORDINATED) FIX-TO-FRN FRN/20-PERPETUAL
2,000,000 2,467,118.13 0.41
USD BP CAPITAL MARKETS PLC (SUBORDINATED) FIX-TO-FRN FRN/20-PERPETUAL
4,000,000 4,251,360.00 0.70
USD BRASKEM FINANCE 6.45%/14-03.02.2024 2,500,000 2,737,875.00 0.45USD BRASKEM NETHERLANDS (SUBORDINATED) FIX-
TO-FRN FRN/20-23.01.2081 2,000,000 2,240,540.00 0.37
USD CBQ FINANCE LTD 2%/20-15.09.2025 4,000,000 4,025,080.00 0.67EUR CELLNEX FINANCE CO SA 1%/21-150927 3,300,000 3,703,058.82 0.61USD CEMEX SAB DE CV 3.875%/21-11.07.2031 2,000,000 2,008,220.00 0.33EUR CEPSA FINANCE SA 2.25%/20-13.02.2026 3,500,000 4,309,031.95 0.71USD CHINA CINDA 2020 I MNGMN 1.875%/21-
20.01.2026 4,150,000 4,011,597.50 0.66
USD COMMERZBANK AG SUB FF FRN/19-PERPET 1,000,000 1,077,880.00 0.18EUR COMMERZBANK S 865 4%/16-230326 2,500,000 3,201,474.26 0.53USD COMMERZBANK T 1 REG S 8.125%/13-190923 1,000,000 1,120,340.00 0.19USD COUNTRY GARDEN HLDGS 4.75%/18-
17.01.2023 3,400,000 3,374,228.00 0.56
USD CREDIT SUISSE GROUP AG 7.5%/18-170723 3,000,000 3,199,560.00 0.53USD CREDIT SUISSE GROUP AG FF FRN/19-PERPET 2,000,000 2,181,800.00 0.36USD CREDIT SUISSE GROUP CAPITAL II
(SUBORDINATED) (REG. -S-) FIX-TO-FRN 7.5%/13-PERPETUAL
2,000,000 2,187,080.00 0.36
USD CS GROUP FF 7.125%/17-PERPET 3,000,000 3,109,260.00 0.52USD DANSKE BANK A/S 144A 5.375%/19-120124 3,000,000 3,263,250.00 0.54USD DANSKE BANK A/S 5.375%/19-120124 2,250,000 2,447,437.50 0.41EUR DEUTSCHE BAHN FIN GMBH SUB FF FRN/19-
PER 1,000,000 1,157,284.72 0.19
USD DEUTSCHE BANK 4.5%/15-010425 2,000,000 2,146,080.00 0.36EUR DEUTSCHE BANK AG SUB FF FRN/21-PERPET 3,000,000 3,586,907.95 0.59EUR DEUTSCHE BANK REG S FF 6%/14-PERPET 2,000,000 2,346,648.41 0.39EUR DEUTSCHE PFANDBRIEFBANK (SUBORDINATED)
FIX-TO-FRN 2.875%/17-28.06.2027 1,700,000 1,985,660.47 0.33
USD DIB SUKUK LTD 2.95%/20-16.01.2026 3,000,000 3,113,460.00 0.52USD DIB SUKUK LTD S. -5- 3.664%/17-14.02.2022 1,000,000 1,009,030.00 0.17USD DNB BANK ASA FF 6.5%/16-PERPET 3,000,000 3,061,770.00 0.51USD DOHA FINANCE LIMITED 2.375%/21-310326 4,000,000 4,057,400.00 0.67USD DRESDNER FNDG TRUST I SUB 8.151%/300631 1,500,000 2,127,990.00 0.35EUR DUFRY ONE BV 3.375%/21-150428 3,000,000 3,419,882.06 0.57USD EASTERN & SOUTHERN AFRIC 4.875%/19-
23.05.2024 3,500,000 3,650,465.00 0.61
EUR EASYJET FINCO BV 1.875%/21-030328 3,500,000 4,111,090.12 0.68USD ECOPETROL 5.375%/15-26.06.2026 3,000,000 3,254,790.00 0.54USD EDF (SUBORDINATED) FIX-TO-FRN 5.25%/13-
PERPETUAL 2,500,000 2,596,125.00 0.43
USD EDF REG S FF 14-PERPET 3,000,000 3,192,390.00 0.53EUR EIRCOM FINANCE DAC 2.625%/19-150227 3,500,000 3,997,679.62 0.66EUR ELECTRICITE DE FR SUB FF FRN/20-PERPET 2,000,000 2,374,098.38 0.39EUR ELM FOR FIRMENICH INTERN (SUBORDINATED)
FIX-TO-FRN FRN/20-PERPETUAL 3,500,000 4,311,178.65 0.71
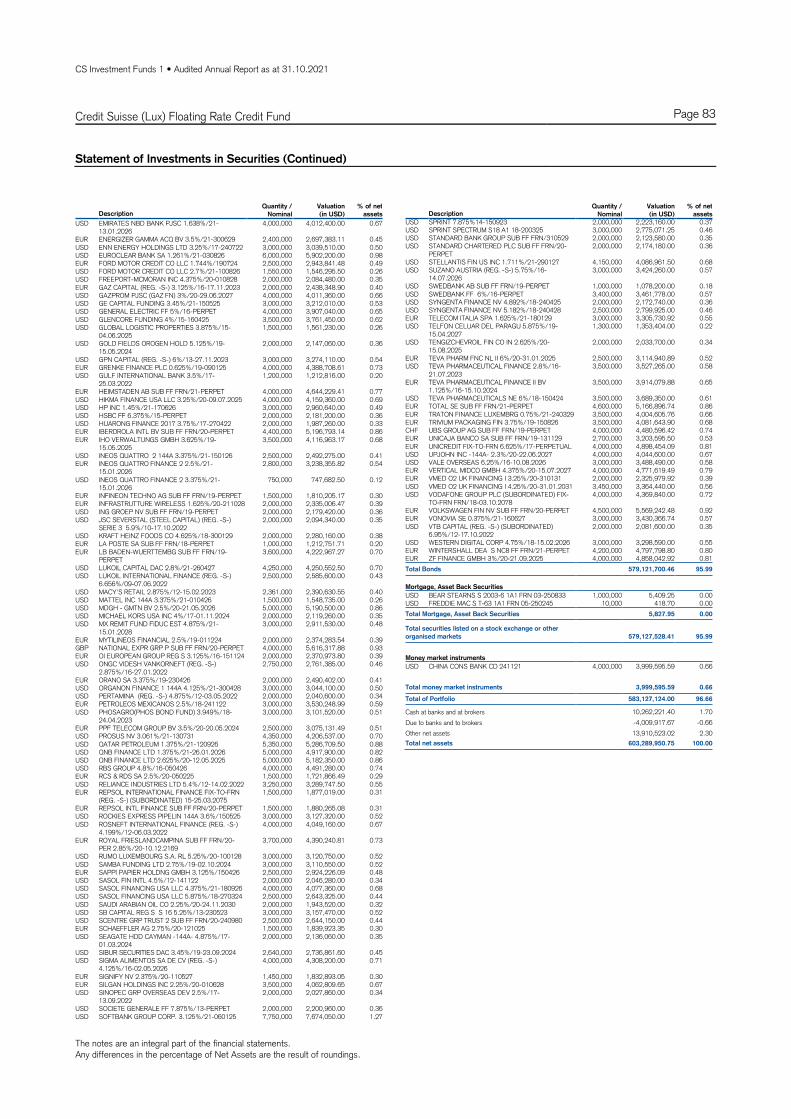
CS Investment Funds 1 • Audited Annual Report as at 31.10.2021
Credit Suisse (Lux) Floating Rate Credit Fund Page 83
Statement of Investments in Securities (Continued)
The notes are an integral part of the financial statements. Any differences in the percentage of Net Assets are the result of roundings.
Description Quantity /
Nominal
Valuation
(in USD)
% of net
assets
USD EMIRATES NBD BANK PJSC 1.638%/21-13.01.2026
4,000,000 4,012,400.00 0.67
EUR ENERGIZER GAMMA ACQ BV 3.5%/21-300629 2,400,000 2,697,383.11 0.45USD ENN ENERGY HOLDINGS LTD 3.25%/17-240722 3,000,000 3,039,510.00 0.50USD EUROCLEAR BANK SA 1.261%/21-030826 6,000,000 5,902,200.00 0.98EUR FORD MOTOR CREDIT CO LLC 1.744%/190724 2,500,000 2,943,841.48 0.49USD FORD MOTOR CREDIT CO LLC 2.7%/21-100826 1,550,000 1,546,295.50 0.26USD FREEPORT-MCMORAN INC 4.375%/20-010828 2,000,000 2,084,480.00 0.35EUR GAZ CAPITAL (REG. -S-) 3.125%/16-17.11.2023 2,000,000 2,438,348.90 0.40USD GAZPROM PJSC (GAZ FN) 3%/20-29.06.2027 4,000,000 4,011,360.00 0.66USD GE CAPITAL FUNDING 3.45%/21-150525 3,000,000 3,212,010.00 0.53USD GENERAL ELECTRIC FF 5%/16-PERPET 4,000,000 3,907,040.00 0.65USD GLENCORE FUNDING 4%/15-160425 3,500,000 3,761,450.00 0.62USD GLOBAL LOGISTIC PROPERTIES 3.875%/15-
04.06.2025 1,500,000 1,561,230.00 0.26
USD GOLD FIELDS OROGEN HOLD 5.125%/19-15.05.2024
2,000,000 2,147,060.00 0.36
USD GPN CAPITAL (REG. -S-) 6%/13-27.11.2023 3,000,000 3,274,110.00 0.54EUR GRENKE FINANCE PLC 0.625%/19-090125 4,000,000 4,388,708.61 0.73USD GULF INTERNATIONAL BANK 3.5%/17-
25.03.2022 1,200,000 1,212,816.00 0.20
EUR HEIMSTADEN AB SUB FF FRN/21-PERPET 4,000,000 4,644,229.41 0.77USD HIKMA FINANCE USA LLC 3.25%/20-09.07.2025 4,000,000 4,159,360.00 0.69USD HP INC 1.45%/21-170626 3,000,000 2,960,640.00 0.49USD HSBC FF 6.375%/15-PERPET 2,000,000 2,181,200.00 0.36USD HUARONG FINANCE 2017 3.75%/17-270422 2,000,000 1,987,260.00 0.33EUR IBERDROLA INTL BV SUB FF FRN/20-PERPET 4,400,000 5,196,793.14 0.86EUR IHO VERWALTUNGS GMBH 3.625%/19-
15.05.2025 3,500,000 4,116,963.17 0.68
USD INEOS QUATTRO 2 144A 3.375%/21-150126 2,500,000 2,492,275.00 0.41EUR INEOS QUATTRO FINANCE 2 2.5%/21-
15.01.2026 2,800,000 3,238,355.82 0.54
USD INEOS QUATTRO FINANCE 2 3.375%/21-15.01.2026
750,000 747,682.50 0.12
EUR INFINEON TECHNO AG SUB FF FRN/19-PERPET 1,500,000 1,810,205.17 0.30EUR INFRASTRUTTURE WIRELESS 1.625%/20-211028 2,000,000 2,335,006.47 0.39USD ING GROEP NV SUB FF FRN/19-PERPET 2,000,000 2,179,420.00 0.36USD JSC SEVERSTAL (STEEL CAPITAL) (REG. -S-)
SERIE 3 5.9%/10-17.10.2022 2,000,000 2,094,340.00 0.35
USD KRAFT HEINZ FOODS CO 4.625%/18-300129 2,000,000 2,280,160.00 0.38EUR LA POSTE SA SUB FF FRN/18-PERPET 1,000,000 1,212,751.71 0.20EUR LB BADEN-WUERTTEMBG SUB FF FRN/19-
PERPET 3,600,000 4,222,967.27 0.70
USD LUKOIL CAPITAL DAC 2.8%/21-260427 4,250,000 4,250,552.50 0.70USD LUKOIL INTERNATIONAL FINANCE (REG. -S-)
6.656%/09-07.06.2022 2,500,000 2,585,600.00 0.43
USD MACY'S RETAIL 2.875%/12-15.02.2023 2,361,000 2,390,630.55 0.40USD MATTEL INC 144A 3.375%/21-010426 1,500,000 1,548,735.00 0.26USD MDGH - GMTN BV 2.5%/20-21.05.2026 5,000,000 5,190,500.00 0.86USD MICHAEL KORS USA INC 4%/17-01.11.2024 2,000,000 2,119,260.00 0.35USD MX REMIT FUND FIDUC EST 4.875%/21-
15.01.2028 3,000,000 2,911,530.00 0.48
EUR MYTILINEOS FINANCIAL 2.5%/19-011224 2,000,000 2,374,283.54 0.39GBP NATIONAL EXPR GRP P SUB FF FRN/20-PERPET 4,000,000 5,616,317.88 0.93EUR OI EUROPEAN GROUP REG S 3.125%/16-151124 2,000,000 2,370,973.80 0.39USD ONGC VIDESH VANKORNEFT (REG. -S-)
2.875%/16-27.01.2022 2,750,000 2,761,385.00 0.46
EUR ORANO SA 3.375%/19-230426 2,000,000 2,490,402.00 0.41USD ORGANON FINANCE 1 144A 4.125%/21-300428 3,000,000 3,044,100.00 0.50USD PERTAMINA (REG. -S-) 4.875%/12-03.05.2022 2,000,000 2,040,600.00 0.34EUR PETROLEOS MEXICANOS 2.5%/18-241122 3,000,000 3,530,248.99 0.59USD PHOSAGRO(PHOS BOND FUND) 3.949%/18-
24.04.2023 3,000,000 3,101,520.00 0.51
EUR PPF TELECOM GROUP BV 3.5%/20-20.05.2024 2,500,000 3,075,131.49 0.51USD PROSUS NV 3.061%/21-130731 4,350,000 4,206,537.00 0.70USD QATAR PETROLEUM 1.375%/21-120926 5,350,000 5,286,709.50 0.88USD QNB FINANCE LTD 1.375%/21-26.01.2026 5,000,000 4,917,900.00 0.82USD QNB FINANCE LTD 2.625%/20-12.05.2025 5,000,000 5,182,350.00 0.86USD RBS GROUP 4.8%/16-050426 4,000,000 4,491,280.00 0.74EUR RCS & RDS SA 2.5%/20-050225 1,500,000 1,721,866.49 0.29USD RELIANCE INDUSTRIES LTD 5.4%/12-14.02.2022 3,250,000 3,289,747.50 0.55EUR REPSOL INTERNATIONAL FINANCE FIX-TO-FRN
(REG. -S-) (SUBORDINATED) 15-25.03.2075 1,500,000 1,877,019.00 0.31
EUR REPSOL INTL FINANCE SUB FF FRN/20-PERPET 1,500,000 1,880,265.08 0.31USD ROCKIES EXPRESS PIPELIN 144A 3.6%/150525 3,000,000 3,127,320.00 0.52USD ROSNEFT INTERNATIONAL FINANCE (REG. -S-)
4.199%/12-06.03.2022 4,000,000 4,049,160.00 0.67
EUR ROYAL FRIESLANDCAMPINA SUB FF FRN/20-PER 2.85%/20-10.12.2169
3,700,000 4,390,240.81 0.73
USD RUMO LUXEMBOURG S.A. RL 5.25%/20-100128 3,000,000 3,120,750.00 0.52USD SAMBA FUNDING LTD 2.75%/19-02.10.2024 3,000,000 3,110,550.00 0.52EUR SAPPI PAPIER HOLDNG GMBH 3.125%/150426 2,500,000 2,924,226.09 0.48USD SASOL FIN INTL 4.5%/12-141122 2,000,000 2,046,280.00 0.34USD SASOL FINANCING USA LLC 4.375%/21-180926 4,000,000 4,077,360.00 0.68USD SASOL FINANCING USA LLC 5.875%/18-270324 2,500,000 2,643,325.00 0.44USD SAUDI ARABIAN OIL CO 2.25%/20-24.11.2030 2,000,000 1,943,520.00 0.32USD SB CAPITAL REG S S 16 5.25%/13-230523 3,000,000 3,157,470.00 0.52USD SCENTRE GRP TRUST 2 SUB FF FRN/20-240980 2,500,000 2,644,150.00 0.44EUR SCHAEFFLER AG 2.75%/20-121025 1,500,000 1,839,923.35 0.30USD SEAGATE HDD CAYMAN -144A- 4.875%/17-
01.03.2024 2,000,000 2,136,060.00 0.35
USD SIBUR SECURITIES DAC 3.45%/19-23.09.2024 2,640,000 2,736,861.60 0.45USD SIGMA ALIMENTOS SA DE CV (REG. -S-)
4.125%/16-02.05.2026 4,000,000 4,308,200.00 0.71
EUR SIGNIFY NV 2.375%/20-110527 1,450,000 1,832,893.05 0.30EUR SILGAN HOLDINGS INC 2.25%/20-010628 3,500,000 4,062,809.65 0.67USD SINOPEC GRP OVERSEAS DEV 2.5%/17-
13.09.2022 2,000,000 2,027,860.00 0.34
USD SOCIETE GENERALE FF 7.875%/13-PERPET 2,000,000 2,200,960.00 0.36USD SOFTBANK GROUP CORP. 3.125%/21-060125 7,750,000 7,674,050.00 1.27
Description Quantity /
Nominal
Valuation
(in USD)
% of net
assets
USD SPRINT 7.875%14-150923 2,000,000 2,223,160.00 0.37USD SPRINT SPECTRUM S18 A1 18-200325 3,000,000 2,775,071.25 0.46USD STANDARD BANK GROUP SUB FF FRN/310529 2,000,000 2,123,580.00 0.35USD STANDARD CHARTERED PLC SUB FF FRN/20-
PERPET 2,000,000 2,174,180.00 0.36
USD STELLANTIS FIN US INC 1.711%/21-290127 4,150,000 4,086,961.50 0.68USD SUZANO AUSTRIA (REG. -S-) 5.75%/16-
14.07.2026 3,000,000 3,424,260.00 0.57
USD SWEDBANK AB SUB FF FRN/19-PERPET 1,000,000 1,078,200.00 0.18USD SWEDBANK FF 6%/16-PERPET 3,400,000 3,461,778.00 0.57USD SYNGENTA FINANCE NV 4.892%/18-240425 2,000,000 2,172,740.00 0.36USD SYNGENTA FINANCE NV 5.182%/18-240428 2,500,000 2,799,925.00 0.46EUR TELECOM ITALIA SPA 1.625%/21-180129 3,000,000 3,305,730.92 0.55USD TELFON CELUAR DEL PARAGU 5.875%/19-
15.04.2027 1,300,000 1,353,404.00 0.22
USD TENGIZCHEVROIL FIN CO IN 2.625%/20-15.08.2025
2,000,000 2,033,700.00 0.34
EUR TEVA PHARM FNC NL II 6%/20-31.01.2025 2,500,000 3,114,940.89 0.52USD TEVA PHARMACEUTICAL FINANCE 2.8%/16-
21.07.2023 3,500,000 3,527,265.00 0.58
EUR TEVA PHARMACEUTICAL FINANCE II BV 1.125%/16-15.10.2024
3,500,000 3,914,079.88 0.65
USD TEVA PHARMACEUTICALS NE 6%/18-150424 3,500,000 3,689,350.00 0.61EUR TOTAL SE SUB FF FRN/21-PERPET 4,600,000 5,166,896.74 0.86EUR TRATON FINANCE LUXEMBRG 0.75%/21-240329 3,500,000 4,004,605.76 0.66EUR TRIVIUM PACKAGING FIN 3.75%/19-150826 3,500,000 4,081,643.90 0.68CHF UBS GROUP AG SUB FF FRN/19-PERPET 4,000,000 4,480,596.42 0.74EUR UNICAJA BANCO SA SUB FF FRN/19-131129 2,700,000 3,203,595.50 0.53EUR UNICREDIT FIX-TO-FRN 6.625%/17-PERPETUAL 4,000,000 4,898,454.09 0.81USD UPJOHN INC -144A- 2.3%/20-22.06.2027 4,000,000 4,044,600.00 0.67USD VALE OVERSEAS 6.25%/16-10.08.2026 3,000,000 3,488,490.00 0.58EUR VERTICAL MIDCO GMBH 4.375%/20-15.07.2027 4,000,000 4,771,619.49 0.79EUR VMED O2 UK FINANCING I 3.25%/20-310131 2,000,000 2,325,979.92 0.39USD VMED O2 UK FINANCING I 4.25%/20-31.01.2031 3,450,000 3,364,440.00 0.56USD VODAFONE GROUP PLC (SUBORDINATED) FIX-
TO-FRN FRN/18-03.10.2078 4,000,000 4,369,840.00 0.72
EUR VOLKSWAGEN FIN NV SUB FF FRN/20-PERPET 4,500,000 5,569,242.48 0.92EUR VONOVIA SE 0.375%/21-160627 3,000,000 3,430,366.74 0.57USD VTB CAPITAL (REG. -S-) (SUBORDINATED)
6.95%/12-17.10.2022 2,000,000 2,081,600.00 0.35
USD WESTERN DIGITAL CORP 4.75%/18-15.02.2026 3,000,000 3,298,590.00 0.55EUR WINTERSHALL DEA S NC8 FF FRN/21-PERPET 4,200,000 4,797,798.80 0.80EUR ZF FINANCE GMBH 3%/20-21.09.2025 4,000,000 4,858,042.92 0.81
Total Bonds 579,121,700.46 95.99
Mortgage, Asset Back Securities
USD BEAR STEARNS S 2003-6 1A1 FRN 03-250833 1,000,000 5,409.25 0.00USD FREDDIE MAC S T-63 1A1 FRN 05-250245 10,000 418.70 0.00
Total Mortgage, Asset Back Securities 5,827.95 0.00
Total securities listed on a stock exchange or other
organised markets 579,127,528.41 95.99
Money market instruments
USD CHINA CONS BANK CD 241121 4,000,000 3,999,595.59 0.66
Total money market instruments 3,999,595.59 0.66
Total of Portfolio 583,127,124.00 96.66
Cash at banks and at brokers 10,262,221.40 1.70
Due to banks and to brokers -4,009,917.67 -0.66
Other net assets 13,910,523.02 2.30
Total net assets 603,289,950.75 100.00

CS Investment Funds 1 • Audited Annual Report as at 31.10.2021
Credit Suisse (Lux) Global Value Bond Fund (previously Credit Suisse (Lux) AgaNola Global Value Bond Fund)
Page 84
Technical Data and Notes
Technical Data
Valoren ISIN Management Fee Total Expense Ratio
A - Distribution USD 24292897 LU1061737885 0.90% /
B - Capitalisation USD 10671058 LU0458988226 0.90% 1.17%
DA - Distribution USD 49408393 LU2039695031 0.00% 0.12%
DB - Capitalisation USD 23044507 LU1002221247 0.00% 0.12%
FB - Capitalisation USD 10020697 LU0417723953 0.45% 0.68%
IB - Capitalisation USD 36447015 LU1599199350 0.45% /
UA - Distribution USD 26358769 LU1144398606 0.55% 0.82%
UB - Capitalisation USD 26358803 LU1144399083 0.55% 0.82%
AH - Distribution CHF 21858249 LU0953015418 0.90% 1.25%
BH - Capitalisation CHF 10671060 LU0458988655 0.90% 1.25%
FBH - Capitalisation CHF 10020804 LU0417724175 0.45% 0.76%
IBH - Capitalisation CHF 11645064 LU0536227712 0.45% 0.80%
UAH - Distribution CHF 26358770 LU1144398788 0.55% 0.90%
UBH - Capitalisation CHF 26358807 LU1144399166 0.55% 0.90%
AH - Distribution EUR 21858251 LU0953015251 0.90% 1.25%
BH - Capitalisation EUR 10671063 LU0458988812 0.90% 1.25%
FBH - Capitalisation EUR 10020740 LU0417724092 0.45% 0.76%
UAH - Distribution EUR 26358777 LU1144398861 0.55% 0.90%
UBH - Capitalisation EUR 26358816 LU1144399240 0.55% 0.90%
DBH - Capitalisation GBP 56413358 LU2214634128 0.00% /
Credit Suisse (Lux) Global Value Bond Fund -A- USD share was closed on 11.01.2021. Credit Suisse (Lux) Global Value Bond Fund -DBH- GBP share was closed on 11.01.2021. Credit Suisse (Lux) Global Value Bond Fund -IB- USD share was closed on 07.04.2021. There is no management fee for -DA-, -DB- and -DBH- share classes.
Fund Performance
YTD Since Inception 2020 2019 2018
A - Distribution USD / / 6.77% 6.99% 0.00%
B - Capitalisation USD 0.55% / 6.76% 7.00% 0.00%
DA - Distribution USD 1.43% 11.79% 7.80% / /
DB - Capitalisation USD 1.43% / 7.89% 8.04% 0.99%
FB - Capitalisation USD 0.95% / 7.26% 7.50% 0.48%
IB - Capitalisation USD / / 7.22% 7.46% 0.43%
UA - Distribution USD 0.84% / 7.12% 7.35% 0.34%
UB - Capitalisation USD 0.85% / 7.12% 7.35% 0.35%
AH - Distribution CHF -0.34% / 4.68% 3.33% -3.27%
BH - Capitalisation CHF -0.34% / 4.63% 3.31% -3.32%
FBH - Capitalisation CHF 0.06% / 5.12% 3.84% -2.92%
IBH - Capitalisation CHF 0.03% / 5.08% 3.82% -2.90%
UAH - Distribution CHF -0.05% / 5.05% 3.67% -2.92%
UBH - Capitalisation CHF -0.06% / 4.99% 3.68% -3.04%
AH - Distribution EUR -0.19% / 4.95% 3.81% -3.01%
BH - Capitalisation EUR -0.19% / 4.86% 3.78% -3.00%
FBH - Capitalisation EUR 0.21% / 5.36% 4.24% -2.48%
UAH - Distribution EUR 0.11% / 5.31% 4.15% -2.49%
UBH - Capitalisation EUR 0.11% / 5.22% 4.11% -2.59%
DBH - Capitalisation GBP / / / / /
Distribution
Ex-Date Amount
A - Distribution USD 15.12.2020 2.09
DA - Distribution USD 15.12.2020 31.13
UA - Distribution USD 15.12.2020 2.53
AH - Distribution CHF 15.12.2020 1.66
UAH - Distribution CHF 15.12.2020 2.04
AH - Distribution EUR 15.12.2020 1.71
UAH - Distribution EUR 15.12.2020 2.11
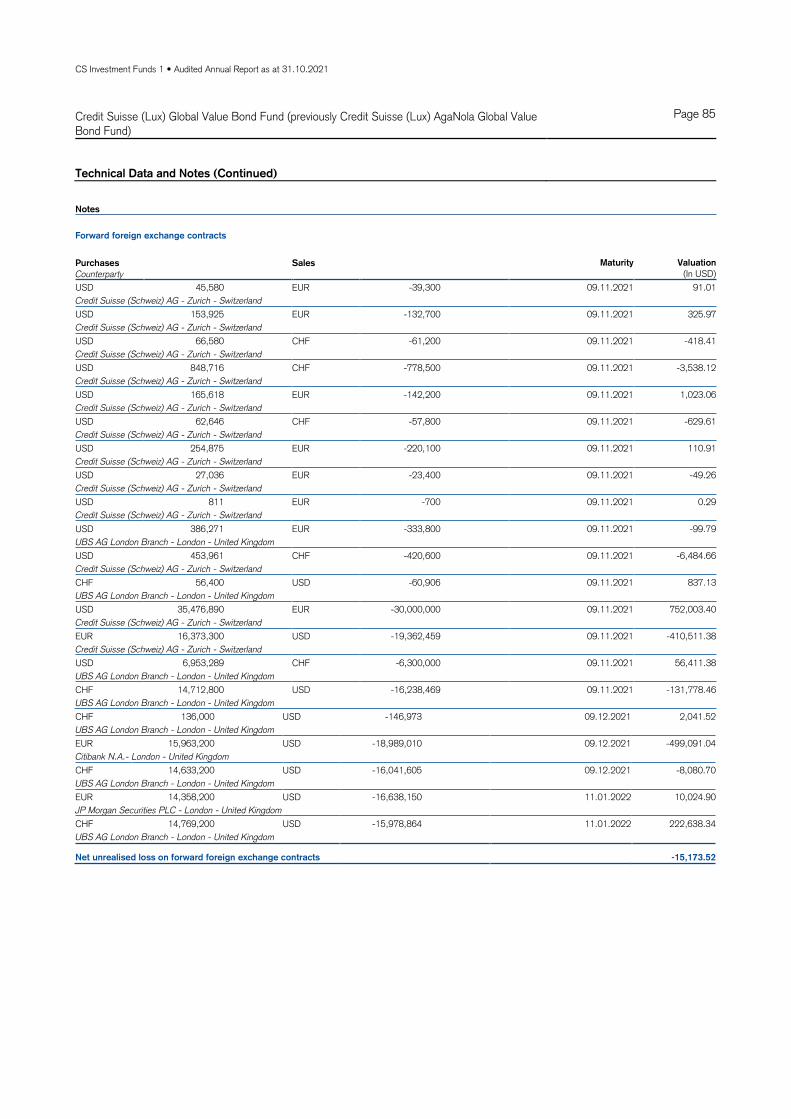
CS Investment Funds 1 • Audited Annual Report as at 31.10.2021
Credit Suisse (Lux) Global Value Bond Fund (previously Credit Suisse (Lux) AgaNola Global Value Bond Fund)
Page 85
Technical Data and Notes (Continued)
Notes
Forward foreign exchange contracts
Purchases Sales Maturity Valuation
Counterparty (In USD)
USD 45,580 EUR -39,300 09.11.2021 91.01
Credit Suisse (Schweiz) AG - Zurich - Switzerland
USD 153,925 EUR -132,700 09.11.2021 325.97
Credit Suisse (Schweiz) AG - Zurich - Switzerland
USD 66,580 CHF -61,200 09.11.2021 -418.41
Credit Suisse (Schweiz) AG - Zurich - Switzerland
USD 848,716 CHF -778,500 09.11.2021 -3,538.12
Credit Suisse (Schweiz) AG - Zurich - Switzerland
USD 165,618 EUR -142,200 09.11.2021 1,023.06
Credit Suisse (Schweiz) AG - Zurich - Switzerland
USD 62,646 CHF -57,800 09.11.2021 -629.61
Credit Suisse (Schweiz) AG - Zurich - Switzerland
USD 254,875 EUR -220,100 09.11.2021 110.91
Credit Suisse (Schweiz) AG - Zurich - Switzerland
USD 27,036 EUR -23,400 09.11.2021 -49.26
Credit Suisse (Schweiz) AG - Zurich - Switzerland
USD 811 EUR -700 09.11.2021 0.29
Credit Suisse (Schweiz) AG - Zurich - Switzerland
USD 386,271 EUR -333,800 09.11.2021 -99.79
UBS AG London Branch - London - United Kingdom
USD 453,961 CHF -420,600 09.11.2021 -6,484.66
Credit Suisse (Schweiz) AG - Zurich - Switzerland
CHF 56,400 USD -60,906 09.11.2021 837.13
UBS AG London Branch - London - United Kingdom
USD 35,476,890 EUR -30,000,000 09.11.2021 752,003.40
Credit Suisse (Schweiz) AG - Zurich - Switzerland
EUR 16,373,300 USD -19,362,459 09.11.2021 -410,511.38
Credit Suisse (Schweiz) AG - Zurich - Switzerland
USD 6,953,289 CHF -6,300,000 09.11.2021 56,411.38
UBS AG London Branch - London - United Kingdom
CHF 14,712,800 USD -16,238,469 09.11.2021 -131,778.46
UBS AG London Branch - London - United Kingdom
CHF 136,000 USD -146,973 09.12.2021 2,041.52
UBS AG London Branch - London - United Kingdom
EUR 15,963,200 USD -18,989,010 09.12.2021 -499,091.04
Citibank N.A.- London - United Kingdom
CHF 14,633,200 USD -16,041,605 09.12.2021 -8,080.70
UBS AG London Branch - London - United Kingdom
EUR 14,358,200 USD -16,638,150 11.01.2022 10,024.90
JP Morgan Securities PLC - London - United Kingdom
CHF 14,769,200 USD -15,978,864 11.01.2022 222,638.34
UBS AG London Branch - London - United Kingdom
Net unrealised loss on forward foreign exchange contracts -15,173.52

CS Investment Funds 1 • Audited Annual Report as at 31.10.2021
Credit Suisse (Lux) Global Value Bond Fund (previously Credit Suisse (Lux) AgaNola Global Value Bond Fund)
Page 86
Statement of Net Assets (in USD) and Fund Evolution
The notes are an integral part of the financial statements.
31.10.2021
Assets
Investments in securities at market value 161,809,701.81Cash at banks and at brokers 2,991,888.82Income receivable 1,046,412.65
165,848,003.28
Liabilities
Due to banks and to brokers 240,762.60Provisions for accrued expenses 103,898.59Net unrealised loss on forward foreign exchange contracts 15,173.52
359,834.71
Net assets 165,488,168.57
Fund Evolution 31.10.2021 31.10.2020 31.10.2019
Total net assets USD 165,488,168.57 238,107,285.76 251,284,517.02
Net asset value per share
A - Distribution USD / 106.32 103.74
B - Capitalisation USD 147.84 142.39 136.42
DA - Distribution USD 1,080.69 1,060.20 1,011.06
DB - Capitalisation USD 1,281.13 1,221.01 1,157.69
FB - Capitalisation USD 186.78 179.03 170.74
IB - Capitalisation USD / 1,122.02 1,070.41
UA - Distribution USD 113.15 111.06 108.35
UB - Capitalisation USD 127.62 122.48 116.96
AH - Distribution CHF 91.85 91.04 90.91
BH - Capitalisation CHF 122.33 119.17 116.82
FBH - Capitalisation CHF 155.70 150.95 147.29
IBH - Capitalisation CHF 1,080.47 1,047.87 1,022.81
UAH - Distribution CHF 96.60 95.70 95.52
UBH - Capitalisation CHF 109.02 105.83 103.40
AH - Distribution EUR 94.71 93.69 93.32
BH - Capitalisation EUR 128.90 125.34 122.55
FBH - Capitalisation EUR 165.92 160.56 156.27
UAH - Distribution EUR 99.63 98.50 98.09
UBH - Capitalisation EUR 112.29 108.80 106.03
DBH - Capitalisation GBP / 1,001.67 /
Number of shares outstanding At the end of the year At the beginning of
the year
Number of shares
issued
Number of shares
redeemed
A - Distribution USD 0.000 4,501.406 925.000 5,426.406
B - Capitalisation USD 136,995.743 160,829.134 3,810.832 27,644.223
DA - Distribution USD 4,904.356 8,224.356 0.000 3,320.000
DB - Capitalisation USD 11,206.588 20,358.078 7,867.718 17,019.208
FB - Capitalisation USD 68,820.536 80,890.536 4,300.000 16,370.000
IB - Capitalisation USD 0.000 8,638.001 371.000 9,009.001
UA - Distribution USD 7,546.474 7,968.705 427.769 850.000
UB - Capitalisation USD 92,355.213 92,355.213 0.000 0.000
AH - Distribution CHF 13,265.280 15,647.462 178.048 2,560.230
BH - Capitalisation CHF 110,462.872 131,848.987 1,846.025 23,232.140
FBH - Capitalisation CHF 117,525.000 148,072.000 9,100.000 39,647.000
IBH - Capitalisation CHF 1,669.937 2,184.937 786.385 1,301.385

CS Investment Funds 1 • Audited Annual Report as at 31.10.2021
Credit Suisse (Lux) Global Value Bond Fund (previously Credit Suisse (Lux) AgaNola Global Value Bond Fund)
Page 87
Statement of Net Assets (in USD) and Fund Evolution (Continued)
The notes are an integral part of the financial statements.
Number of shares outstanding At the end of the year At the beginning of
the year
Number of shares
issued
Number of shares
redeemed
UAH - Distribution CHF 29,140.265 31,230.265 600.000 2,690.000
UBH - Capitalisation CHF 49,078.393 53,738.272 0.000 4,659.879
AH - Distribution EUR 36,415.293 47,285.804 12.000 10,882.511
BH - Capitalisation EUR 144,683.230 193,140.310 1,164.361 49,621.441
FBH - Capitalisation EUR 124,029.950 216,416.189 3,246.465 95,632.704
UAH - Distribution EUR 6,015.881 5,357.083 759.111 100.313
UBH - Capitalisation EUR 22,620.373 21,793.562 3,368.735 2,541.924
DBH - Capitalisation GBP 0.000 9,666.796 0.000 9,666.796

CS Investment Funds 1 • Audited Annual Report as at 31.10.2021
Credit Suisse (Lux) Global Value Bond Fund (previously Credit Suisse (Lux) AgaNola Global Value Bond Fund)
Page 88
Statement of Operations / Changes in Net Assets (in USD)
The notes are an integral part of the financial statements.
For the period from
01.11.2020 to 31.10.2021
Net assets at the beginning of the year 238,107,285.76
Income
Interest on investments in securities (net) 4,956,856.96
Dividends (net) 64,443.20
Bank Interest 205.87
Securities lending income 66,052.87
5,087,558.90
Expenses
Management fee 1,094,944.83
Depositary fee 112,719.43
Administration expenses 129,002.47
Printing and publication expenses 20,534.36
Interest and bank charges 19,053.17
Audit, control, legal, representative bank and other expenses 235,788.61
"Taxe d'abonnement" 50,198.93
1,662,241.80
Net income (loss) 3,425,317.10
Realised gain (loss)
Net realised gain (loss) on sales of investments 5,232,230.72
Net realised gain (loss) on financial futures contracts 46,910.25
Net realised gain (loss) on forward foreign exchange contracts 241,139.21
Net realised gain (loss) on foreign exchange -534,181.38
4,986,098.80
Net realised gain (loss) 8,411,415.90
Change in net unrealised appreciation (depreciation)
Change in net unrealised appreciation (depreciation) on investments 687,094.41
Change in net unrealised appreciation (depreciation) on forward foreign exchange contracts 260,591.32
947,685.73
Net increase (decrease) in net assets as a result of operations 9,359,101.63
Subscriptions / Redemptions
Subscriptions 16,045,554.01
Redemptions -97,534,099.22
-81,488,545.21
Distribution -489,673.61
Net assets at the end of the year 165,488,168.57

CS Investment Funds 1 • Audited Annual Report as at 31.10.2021
Credit Suisse (Lux) Global Value Bond Fund (previously Credit Suisse (Lux) AgaNola Global Value Bond Fund)
Page 89
Statement of Investments in Securities
The notes are an integral part of the financial statements. Any differences in the percentage of Net Assets are the result of roundings.
Breakdown by Country
USA 32.62
Netherlands 12.73
Luxembourg 11.99
United Kingdom 9.51
Germany 8.46
France 4.05
Switzerland 2.97
Mexico 2.42
Japan 2.39
Ireland 2.25
Supranational 1.89
Sweden 1.83
Belgium 1.29
Cayman Islands 1.18
Kazakhstan 1.01
Peru 0.59
Romania 0.55
Chile 0.02
Spain 0.02
Brazil 0.00
Total 97.78
Breakdown by Economic Sector
Financial, investment and other div. companies 25.76
Banks and other credit institutions 12.16
Countries and central governments 11.61
Investment trusts/funds 9.12
Food and soft drinks 6.25
Petroleum 4.18
Pharmaceuticals, cosmetics and medical products 3.96
Internet, software and IT services 2.71
Energy and water supply 2.63
Chemicals 2.61
Traffic and transportation 2.39
Miscellaneous services 1.96
Supranational organisations 1.89
Insurance companies 1.79
Mining, coal and steel industry 1.63
Computer hardware and networking 1.20
Biotechnology 1.20
Electrical appliances and components 1.18
Electronics and semiconductors 0.92
Building materials and building industry 0.63
Rubber and tires 0.62
Non-ferrous metals 0.59
Retailing, department stores 0.45
Healthcare and social services 0.31
Telecommunication 0.01
Total 97.78
Statement of Investments in Securities
Description
Quantity /
Nominal
Valuation
(in USD)
% of net
assets
Securities listed on a stock exchange or other organised
markets
Shares
EUR ABENGOA B 1,742,590 32,467.46 0.02CHF BASLER KANTONALBANK 19,750 1,370,390.52 0.83
Total Shares 1,402,857.98 0.85
Bonds
EUR ABN AMRO BANK NV FF 17-PERPET 1,500,000 1,885,785.17 1.14USD ACCELERATE DIAGNOSTICS CV 2.5%/18-150323 500,000 355,185.00 0.21USD AFRICA FINANCE CORP 2.875%/21-280428 1,050,000 1,048,005.00 0.63USD ALLIANZ 3.875%/16-PERPETUAL 2,000,000 1,998,620.00 1.21USD ALLIANZ SE SUB FF FRN/21-PERPET 1,000,000 968,830.00 0.59USD ANGLO AMERICAN CAPITAL 3.625%/17-110924 2,000,000 2,125,820.00 1.28USD ASTRAZENECA PLC 0.7%/20-080426 2,900,000 2,814,914.00 1.70USD BANK OF AMERICA CORP FIX-TO-FRN FRN/19-
22.10.2025 2,000,000 2,067,980.00 1.25
USD BARCLAYS PLC SUB FF FRN/21-PERPET 500,000 493,565.00 0.30USD BARRY CALLEBAUT SERVICES (REG. -S-)
5.5%/13-15.06.2023 2,000,000 2,139,920.00 1.29
USD BASF 0.925%/17-090323 2,000,000 2,007,220.00 1.21EUR BAYER AG SUB FF FRN/19-120579 2,000,000 2,314,476.86 1.40USD BP CAPITAL MARKETS PLC (SUBORDINATED)
FIX-TO-FRN FRN/20-PERPETUAL 2,000,000 2,125,680.00 1.28
USD CEMEX SAB DE CV 3.875%/21-11.07.2031 1,000,000 1,004,110.00 0.61USD CIE GEN ETABLIS MICHELIN CV 0%/18-101123 1,000,000 1,026,230.00 0.62USD COMISION FEDER DE ELEC 3.348%/21-090231 2,000,000 1,936,340.00 1.17EUR COOPERATIEVE RABOBANK UA
(SUBORDINATED) FIX-TO-FRN FRN/18-PERPETUAL
1,600,000 2,024,539.44 1.22
USD CREDIT SUISSE GROUP FUNDING (GUERNSEY) 3.8%/16-09.06.2023
2,500,000 2,617,525.00 1.58
EUR DEUTSCHE LUFTHANSA AG CV 2%/20-171125 500,000 607,637.26 0.37USD EASTERN & SOUTHERN AFRIC 4.875%/19-
23.05.2024 2,000,000 2,085,980.00 1.26
EUR ELECTRICITE DE FRANCE SA (SUBORDINATED) FIX-TO-FRN FRN/20-PERPETUAL
2,000,000 2,411,431.26 1.46
EUR ELIOTT CAPITAL SARL CV 0%/19-301222 2,500,000 2,896,365.30 1.75USD GAZPROM PJSC (GAZ FN) 2.95%/21-27.01.2029 3,500,000 3,427,935.00 2.07USD GENERAL ELECTRIC FF 5%/16-PERPET 2,000,000 1,953,520.00 1.18USD GLENCORE FUNDING LLC CV 0%/18-270325 2,600,000 2,700,386.00 1.63USD HAEMONETICS CORP CV 144A 0%/21-010326 500,000 439,005.00 0.27EUR HEIMSTADEN AB SUB FF FRN/21-PERPET 850,000 986,898.75 0.60EUR HELLAS TELECOM 8.5%/05-151013 (MATURED) 756,723 8,349.71 0.01USD HIDROVIAS INT FIN SARL 4.95%/21-08.02.2031 450,000 425,434.50 0.26EUR HSBC HOLDINGS REG S FF 4.75%/17-PERPET 1,000,000 1,263,462.41 0.76USD HYUNDAI CAPITAL AMERICA 1.25%/20-
18.09.2023 1,400,000 1,406,384.00 0.85
EUR ILIAD SA 1.875%/21-110228 1,500,000 1,658,993.10 1.00EUR INEOS QUATTRO FINANCE 2 2.5%/21-
15.01.2026 1,500,000 1,734,833.48 1.05
USD ING GROEP NV FF FRN/21-010427 2,000,000 1,995,640.00 1.21USD ING GROUP FF 15-PERPET 2,000,000 2,201,300.00 1.33USD INVERSIONES ALSACIA REG S 8%/14-311218 1,178,119 26,912.93 0.02USD JPMORGAN CHASE & CO FF FRN/21-040227 3,000,000 2,915,220.00 1.76CHF KAZAK TEMIR ZHOLY 3.638%/14-200622 1,500,000 1,676,283.71 1.01USD LASMO (USA) 7.3%/97-15.11.2027 3,000,000 3,824,790.00 2.31EUR LB BADEN-WUERTTEMBG SUB FF FRN/19-
PERPET 1,600,000 1,876,874.34 1.13
EUR LYONDELLBASELL REG S 8.375%/05-150899 1,150,000 0.01 0.00USD MACY'S RETAIL 3.625%/14-010624 716,000 740,845.20 0.45USD MINERVA LUXEMBOURG SA 4.375%/21-180331 1,500,000 1,426,860.00 0.86USD NCR CORP 144A 5.125%/21-150429 1,000,000 1,024,040.00 0.62USD NESTLE HOLDINGS INC 0.625%/20-150126 5,000,000 4,861,350.00 2.94USD NOVARTIS CAPITAL 3.4%/14-060524 4,000,000 4,252,160.00 2.57USD NTT FINANCE CORP 0.583%/21-010324 1,500,000 1,489,785.00 0.90USD OGX PETROLEO E GAS REG S 8.5%/11-010618 1,000,000 1,360.00 0.00USD ON SEMICONDUCTOR CORP 144A
3.875%/010928 1,500,000 1,522,665.00 0.92
USD ORGANON FINANCE 1 144A 4.125%/21-300428 1,000,000 1,014,700.00 0.61EUR PAPREC HOLDING S 3.5%/21-010728 500,000 579,215.20 0.35USD PEPSICO INC 3%/17-151027 2,000,000 2,162,620.00 1.31USD PETROLEOS MEXICANOS 6.5%/18-13.03.2027 -
C14- 1,000,000 1,066,730.00 0.64
EUR PPF TELECOM GROUP BV 3.5%/20-20.05.2024 2,500,000 3,075,131.49 1.86CHF PROMAN HOLDING AG 3.5%/17-31.05.2022 845,000 925,949.34 0.56EUR RCS & RDS SA 2.5%/20-050225 800,000 918,328.79 0.55USD ROCHE HOLDINGS INC 0.45%/21-050324 2,000,000 1,986,780.00 1.20EUR ROYAL FRIESLANDCAMPINA SUB FF FRN/20-
PER 2.85%/20-10.12.2169 1,000,000 1,186,551.57 0.72
CHF RUSSIAN RAIL(RZD CAP) SUB FF FRN/PERPET 1,500,000 1,647,390.76 1.00USD SA GLOBAL SUKUK LTD 0.946%/21-170624 1,000,000 990,250.00 0.60USD SASOL FINANCING USA LLC 4.375%/21-180926 1,000,000 1,019,340.00 0.62USD SEAGATE HDD CAYMAN 144A 3.375%/20-
150731 1,000,000 959,550.00 0.58
USD SIBUR SECURITIES DAC 3.45%/19-23.09.2024 2,000,000 2,073,380.00 1.25USD SIEMENS FINANCIERINGSMAT 0.65%/21-110324 3,000,000 2,988,330.00 1.81USD SOFTBANK GROUP CORP. 4%/21-060726 2,500,000 2,472,775.00 1.49USD SWEDBANK FF 6%/16-PERPET 2,000,000 2,036,340.00 1.23USD TELADOC HEALTH INC CV 1.25%/20-010627 500,000 516,860.00 0.31USD TEVA PHARMACEUTICAL FINANCE 3.15%/16-
01.10.2026 3,500,000 3,307,640.00 2.00
USD TOTAL CV 0.5%/15-02122022 1,000,000 1,026,190.00 0.62

CS Investment Funds 1 • Audited Annual Report as at 31.10.2021
Credit Suisse (Lux) Global Value Bond Fund (previously Credit Suisse (Lux) AgaNola Global Value Bond Fund)
Page 90
Statement of Investments in Securities (Continued)
The notes are an integral part of the financial statements. Any differences in the percentage of Net Assets are the result of roundings.
Description
Quantity /
Nominal
Valuation
(in USD)
% of net
assets
USD US S. C-2023 1.75%/13-15.05.2023 6,000,000 6,128,789.04 3.70USD US TREASURY N/B 1.75%/19-31.07.2024 7,000,000 7,201,250.00 4.35USD US TREASURY N/B S. -Y-2025- 0.375%/20-
30.04.2025 6,000,000 5,887,500.00 3.56
EUR VERTICAL MIDCO GMBH 4.375%/20-15.07.2027 1,500,000 1,789,357.31 1.08EUR VMED O2 UK FINANCING I 3.25%/20-310131 1,500,000 1,744,484.94 1.05USD VOLCAN CIA MINERA SAA-CM 4.375%/21-
11.02.2026 1,000,000 979,470.00 0.59
EUR VOLKSWAGEN INTL FIN NV (SUBORDINATED) FIX-TO-FRN FRN/20-PERPETUAL
1,000,000 1,263,948.45 0.76
EUR WINTERSHALL DEA S NC8 FF FRN/21-PERPET 1,000,000 1,142,333.05 0.69EUR ZF FINANCE GMBH 3%/20-21.09.2025 2,000,000 2,429,021.46 1.47
Total Bonds 145,317,653.83 87.81
Total securities listed on a stock exchange or other
organised markets 146,720,511.81 88.66
Investment funds
Fund Units (Open-End)
USD CREDIT SUISSE INVESTMENT PARTNERS (LUX) CONVERT INTERNATIONAL BOND FUND DA USD
12,000 12,129,240.00 7.33
USD CS INVESTMENT FUNDS 14 - CREDIT SUISSE (LUX) CORPORATE SHORT DURATION USD BOND FUND -DB-
2,500 2,959,950.00 1.79
Total Fund Units (Open-End) 15,089,190.00 9.12
Total investment funds 15,089,190.00 9.12
Total of Portfolio 161,809,701.81 97.78
Cash at banks and at brokers 2,991,888.82 1.81
Due to banks and to brokers -240,762.60 -0.15
Other net assets 927,340.58 0.56
Total net assets 165,488,168.61 100.00

CS Investment Funds 1 • Audited Annual Report as at 31.10.2021
Credit Suisse (Lux) High Yield USD Bond Fund Page 91
Technical Data and Notes
Technical Data
Valoren ISIN Management Fee Total Expense Ratio
B - Capitalisation USD 38309360 LU1684797787 1.20% 1.82%
BH - Capitalisation EUR 38309364 LU1684798249 1.20% 1.81%
Fund Performance
YTD Since Inception 2020 2019 2018
B - Capitalisation USD 1.92% / 3.00% 11.13% -2.99%
BH - Capitalisation EUR 1.35% / 1.23% 7.88% -5.70%
Notes
Forward foreign exchange contracts
Purchases Sales Maturity Valuation
Counterparty (In USD)
EUR 815,234 USD -965,562 16.12.2021 -21,058.29
Morgan Stanley Capital Services LLC - New-York - USA
Net unrealised loss on forward foreign exchange contracts -21,058.29

CS Investment Funds 1 • Audited Annual Report as at 31.10.2021
Credit Suisse (Lux) High Yield USD Bond Fund Page 92
Statement of Net Assets (in USD) and Fund Evolution
The notes are an integral part of the financial statements.
31.10.2021
Assets
Investments in securities at market value 11,552,870.15Cash at banks and at brokers 426,389.31Subscriptions receivable 1,392.97Income receivable 169,268.02
12,149,920.45
Liabilities
Redemptions payable 41,413.20Provisions for accrued expenses 13,276.22Net unrealised loss on forward foreign exchange contracts 21,058.29
75,747.71
Net assets 12,074,172.74
Fund Evolution 31.10.2021 31.10.2020 31.10.2019
Total net assets USD 12,074,172.74 12,525,805.23 15,860,358.16
Net asset value per share
B - Capitalisation USD 344.86 322.76 321.62
BH - Capitalisation EUR 144.88 136.64 138.91
Number of shares outstanding At the end of the year At the beginning of
the year
Number of shares
issued
Number of shares
redeemed
B - Capitalisation USD 32,286.629 35,519.949 745.295 3,978.615
BH - Capitalisation EUR 5,605.363 6,667.313 8.782 1,070.732

CS Investment Funds 1 • Audited Annual Report as at 31.10.2021
Credit Suisse (Lux) High Yield USD Bond Fund Page 93
Statement of Operations / Changes in Net Assets (in USD)
The notes are an integral part of the financial statements.
For the period from
01.11.2020 to 31.10.2021
Net assets at the beginning of the year 12,525,805.23
Income
Interest on investments in securities (net) 650,066.03
Securities lending income 1,292.72
651,358.75
Expenses
Management fee 149,376.96
Depositary fee 7,159.38
Administration expenses 8,715.46
Printing and publication expenses 2,574.59
Audit, control, legal, representative bank and other expenses 53,295.94
"Taxe d'abonnement" 6,199.62
227,321.95
Net income (loss) 424,036.80
Realised gain (loss)
Net realised gain (loss) on sales of investments -128,693.32
Net realised gain (loss) on forward foreign exchange contracts -17,716.67
Net realised gain (loss) on foreign exchange 3,453.67
-142,956.32
Net realised gain (loss) 281,080.48
Change in net unrealised appreciation (depreciation)
Change in net unrealised appreciation (depreciation) on investments 547,025.57
Change in net unrealised appreciation (depreciation) on forward foreign exchange contracts 3,130.14
550,155.71
Net increase (decrease) in net assets as a result of operations 831,236.19
Subscriptions / Redemptions
Subscriptions 254,665.45
Redemptions -1,537,534.13
-1,282,868.68
Net assets at the end of the year 12,074,172.74

CS Investment Funds 1 • Audited Annual Report as at 31.10.2021
Credit Suisse (Lux) High Yield USD Bond Fund Page 94
Statement of Investments in Securities
The notes are an integral part of the financial statements. Any differences in the percentage of Net Assets are the result of roundings.
Breakdown by Country
USA 81.98
Canada 5.43
Netherlands 2.47
Luxembourg 2.31
Cayman Islands 1.72
Spain 1.68
Marshall Islands 0.09
Total 95.68
Breakdown by Economic Sector
Financial, investment and other div. companies 30.01
Lodging and catering industry, leisure facilities 8.57
Real estate 5.48
Pharmaceuticals, cosmetics and medical products 4.40
Building materials and building industry 4.01
Vehicles 3.82
Internet, software and IT services 3.77
Healthcare and social services 3.68
Packaging industries 2.98
Energy and water supply 2.91
Telecommunication 2.79
Petroleum 2.41
Mechanical engineering and industrial equipment 2.30
Miscellaneous consumer goods 2.00
Insurance companies 1.89
Miscellaneous services 1.74
Biotechnology 1.68
Electronics and semiconductors 1.56
Environmental services and recycling 1.29
Electrical appliances and components 1.27
Chemicals 1.02
Graphics publishing and printing media 0.99
Traffic and transportation 0.97
Aeronautic and astronautic industry 0.87
Retailing, department stores 0.54
Non-ferrous metals 0.47
Computer hardware and networking 0.46
Non-classifiable/non-classified institutions 0.44
Textiles, garments and leather goods 0.41
Mining, coal and steel industry 0.38
Agriculture and fishery 0.35
Food and soft drinks 0.21
Total 95.68
Statement of Investments in Securities
Description Quantity /
Nominal
Valuation
(in USD)
% of net
assets
Securities listed on a stock exchange or other organised
markets
Bonds
USD ABC SUPPLY CO INC 144A 4%/19-150128 95,000 96,826.85 0.80USD ACRISURE LLC / FIN 144A 7%/17-151125 225,000 227,927.25 1.89USD ADVANCED DRAINAGE SYS 144A 5%/19-300927 50,000 52,188.50 0.43USD AG ISSUER LLC 144A 6.25%/20-010328 95,000 99,190.45 0.82USD ALLIANT HOLD / CO-ISSUER 5.875%/011129 50,000 50,374.00 0.42USD ALLIED UNI HLD /ALL FIN 4.625%/21-010628 200,000 198,634.00 1.65USD AMC ENTERTAINMENT HLDGS 10.5%/20-150425 17,000 18,264.63 0.15USD AMC ENTERTAINMENT HLDGS 12%/150626 17,108 17,043.16 0.14USD AMN HEALTHCARE INC 144A 4%/20-150429 45,000 45,935.10 0.38USD AMN HEALTHCARE INC 144A 4.625%/19-011027 50,000 51,395.00 0.43USD API GROUP DE INC 144A 4.125%/21-150729 27,000 26,894.97 0.22USD ARCOSA INC 144A 4.375%/21-150429 60,000 61,168.20 0.51USD ASBURY AUTOMOTIVE GROUP 4.75%/20-
01.03.2030 35,000 35,755.65 0.30
USD ASGN INCORPORATED 144A 4.625%/19-150528 84,000 86,880.36 0.72USD ATKORE INC 144A 4.25%/21-010631 75,000 76,319.25 0.63USD AUSTIN BIDCO INC 144A 7.125%/20-151228 115,000 118,991.65 0.99USD AUTOMATION TOOLING 144A 4.125%/20-151228 60,000 60,709.80 0.50USD AVANTOR FUNDING 144A 3.875%/21-011129 50,000 50,099.00 0.41USD BAUSCH HEALTH COS INC 144A 7%/19-150128 200,000 202,946.00 1.68USD BLACK KNIGHT INFOSERV 144A 3.625%/010928 50,000 49,844.50 0.41USD BLACKSTONE TR 144A 3.75%/21-150127 50,000 49,757.50 0.41USD BOOZ ALLEN HAMILTON 144A 3.875%/010928 35,000 35,548.80 0.29USD BOOZ ALLEN HAMILTON 144A 4%/21-010729 10,000 10,132.00 0.08USD BOYNE USA INC 144A 4.75%/21-150529 50,000 51,392.50 0.43USD BUILDERS FIRST 144A 4.25%/21-010232 25,000 25,244.75 0.21USD BUILDERS FIRSTSOURCE INC 144A 5%/010330 45,000 47,791.35 0.40USD CARGO AIRCRAFT MGMT 144A 4.75%/010228 110,000 112,514.60 0.93USD CATALENT PHARMA SOLUTION 144A 5%/150727 75,000 77,982.75 0.65USD CCO HLDGS LLC/CAP COR 144A
5.375%/010629 105,000 112,921.20 0.94
USD CDK GLOBAL INC 144A 5.25%/19-150529 125,000 134,283.75 1.11USD CEDAR FAIR LP 5.25%/20-150729 150,000 155,610.00 1.29USD CENTENE CORP 4.25%/20-151227 75,000 78,606.75 0.65USD CHENIERE ENERGY PARTNERS 4.5%/20-011029 80,000 85,478.40 0.71USD CHURCHILL DOWNS INC -144A- 4.75%/17-
15.01.2028 98,000 101,961.16 0.84
USD CNX MIDSTREAM PART LP 4.75%/21-150430 20,000 20,043.00 0.17USD CNX RESOURCES CORP 144A 6%/20-150129 25,000 26,411.00 0.22USD CNX RESOURCES CORP 144A 7.25%/19-140327 25,000 26,605.75 0.22USD COMMSCOPE INC 144A 4.75%/21-010929 100,000 98,208.00 0.81USD COMPASS GROUP DIVERSIFIE 5.25%/21-150429 75,000 78,061.50 0.65USD COOPER STANDARD 144A 5.625%/16-151126 200,000 160,692.00 1.33USD CORELOGIC INC 144A 4.5%/21-010528 100,000 98,856.00 0.82USD CPI CG INC 144A 8.625%/21-150326 15,000 16,215.45 0.13USD CROWDSTRIKE HOLDINGS INC 3%/21-150229 50,000 49,512.00 0.41USD CSC HOLDINGS LLC 144A 4.5%/21-151131 200,000 194,280.00 1.61USD CUSHMAN & WAKEFIELD US -144A- 6.75%/20-
15.05.2028 50,000 53,672.50 0.44
USD DAVITA INC -144A- 4.625%/20-01.06.2030 40,000 40,250.40 0.33USD DIAMOND BC BV 144A 4.625%/21-011029 25,000 25,214.00 0.21USD DIAMOND SPORTS GR 144A 5.375%/19-150826 110,000 62,341.40 0.52USD DIAMOND SPORTS GR 144A 6.625%/150827 25,000 7,513.00 0.06USD DORNOCH DEBT MER144A 6.625%/21-151029 40,000 39,500.00 0.33USD ELASTIC NV 144A 4.125%/21-150729 70,000 69,758.50 0.58USD ENDO LUX FIN CO I 144A 6.125%/21-010429 40,000 39,436.80 0.33USD ENDURE DIGITAL INC 144A 6%/21-150229 75,000 69,354.00 0.57USD ENERGIZER HOLDINGS INC -144A- 4.375%/20-
31.03.2029 20,000 19,181.60 0.16
USD ENTEGRIS INC 144A 3.625%/21-010529 40,000 40,342.80 0.33USD FLEX ACQUISITION 144A 6.875%/17-150125 100,000 100,924.00 0.84USD FORD MOTOR COMPANY 8.5%/20-210423 30,000 32,898.90 0.27USD FORD MOTOR COMPANY 9%/20-220425 30,000 36,116.10 0.30USD FOUNDATION BUILDING M 144A 6%/21-010329 50,000 48,476.50 0.40USD GARTNER INC 144A 4.5%/20-010728 50,000 52,181.00 0.43USD GCP APPLIED TECHNOLOGIES 144A 5.5%/18-15 30,000 30,735.60 0.25USD GEMS MENA KY /GEMS 144A 7.125%/19-310726 200,000 207,518.00 1.72USD GENESIS ENERGY 5.625%/14-150624 150,000 149,445.00 1.24USD GENESIS ENERGY LP/FIN 6.25%/17-150526 45,000 43,645.95 0.36USD GENESIS ENERGY LP/FIN 6.5%/17-011025 25,000 24,652.50 0.20USD GLOBAL NET LEASE/GLOBAL 3.75%/20-151227 55,000 54,283.90 0.45USD GOLDEN NUGGET INC -144A- 6.75%/16-
15.10.2024 235,000 236,036.35 1.95
USD GRAFTECH FINANCE INC -144A- 4.625%/20-15.12.2028
50,000 50,554.00 0.42
USD GRANITE HLDGS US ACQU 144A 11%/19-011027 25,000 27,428.25 0.23USD GRANITE MERGER SUB 2 INC 11%/19-150727 90,000 102,708.00 0.85USD GRIFOLS ESCROW 144A 4.75%/21-151028 200,000 203,280.00 1.68USD GROUP 1 AUTOMOTIVE INC 144A 4%/20-150828 25,000 25,019.00 0.21USD GTCR AP FINANCE INC 144A 8%/19-150527 60,000 63,196.80 0.52USD GTT ESCROW 144A 7.875%/16-311224 250,000 28,970.00 0.24USD GYP HOLDINGS III 144A 4.625%/21-010529 110,000 109,693.10 0.91USD H.B. FULLER CO 4.25%/20-15.10.2028 65,000 66,238.90 0.55USD HARSCO CORP 144A 5.75%/19-310727 20,000 20,799.00 0.17USD HEALTHEQUITY INC 144A 4.5%/21-011029 50,000 50,657.50 0.42USD HESS MIDSTR PART 144A 5.125%/19-150628 50,000 51,996.00 0.43USD HESS MIDSTREAM 144A 4.25%/21-150230 15,000 15,023.70 0.12USD HIGH RIDGE 8.875%/17-150325 125,000 1,725.00 0.01USD IAA SPINCO INC -144A- 5.5%/19-15.06.2027 75,000 78,252.75 0.65USD IMOLA MERGER CORP 144A 4.75%/21-150529 65,000 66,834.30 0.55USD INSTALLED BDNG PROD 144A 5.75%/19-010228 70,000 73,574.90 0.61USD INTERTAPE POLYMER 144A 4.375%/21-150629 50,000 50,388.00 0.42USD IRB HOLDING CORP 144A 7%/20-150625 50,000 53,008.00 0.44
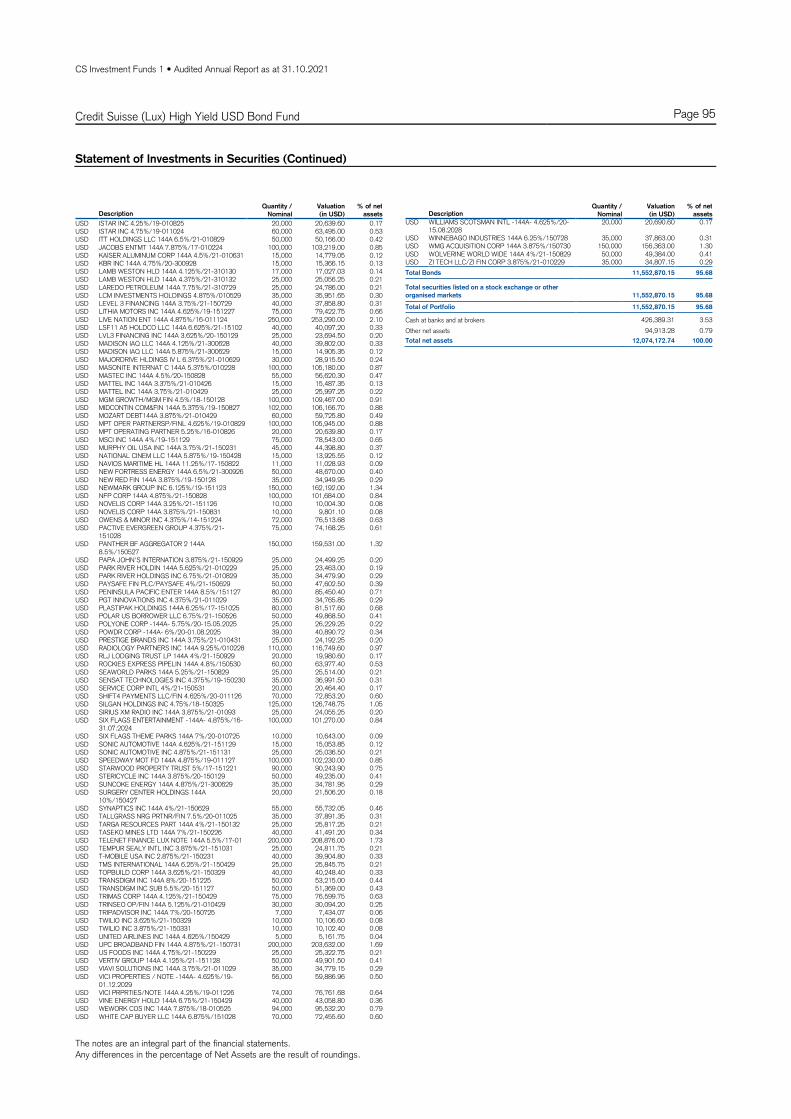
CS Investment Funds 1 • Audited Annual Report as at 31.10.2021
Credit Suisse (Lux) High Yield USD Bond Fund Page 95
Statement of Investments in Securities (Continued)
The notes are an integral part of the financial statements. Any differences in the percentage of Net Assets are the result of roundings.
Description Quantity /
Nominal
Valuation
(in USD)
% of net
assets
USD ISTAR INC 4.25%/19-010825 20,000 20,639.60 0.17USD ISTAR INC 4.75%/19-011024 60,000 63,495.00 0.53USD ITT HOLDINGS LLC 144A 6.5%/21-010829 50,000 50,166.00 0.42USD JACOBS ENTMT 144A 7.875%/17-010224 100,000 103,219.00 0.85USD KAISER ALUMINUM CORP 144A 4.5%/21-010631 15,000 14,779.05 0.12USD KBR INC 144A 4.75%/20-300928 15,000 15,366.15 0.13USD LAMB WESTON HLD 144A 4.125%/21-310130 17,000 17,027.03 0.14USD LAMB WESTON HLD 144A 4.375%/21-310132 25,000 25,056.25 0.21USD LAREDO PETROLEUM 144A 7.75%/21-310729 25,000 24,786.00 0.21USD LCM INVESTMENTS HOLDINGS 4.875%/010529 35,000 35,951.65 0.30USD LEVEL 3 FINANCING 144A 3.75%/21-150729 40,000 37,858.80 0.31USD LITHIA MOTORS INC 144A 4.625%/19-151227 75,000 79,422.75 0.66USD LIVE NATION ENT 144A 4.875%/16-011124 250,000 253,290.00 2.10USD LSF11 A5 HOLDCO LLC 144A 6.625%/21-15102 40,000 40,097.20 0.33USD LVL3 FINANCING INC 144A 3.625%/20-150129 25,000 23,694.50 0.20USD MADISON IAQ LLC 144A 4.125%/21-300628 40,000 39,802.00 0.33USD MADISON IAQ LLC 144A 5.875%/21-300629 15,000 14,905.35 0.12USD MAJORDRIVE HLDINGS IV L 6.375%/21-010629 30,000 28,915.50 0.24USD MASONITE INTERNAT C 144A 5.375%/010228 100,000 105,180.00 0.87USD MASTEC INC 144A 4.5%/20-150828 55,000 56,620.30 0.47USD MATTEL INC 144A 3.375%/21-010426 15,000 15,487.35 0.13USD MATTEL INC 144A 3.75%/21-010429 25,000 25,997.25 0.22USD MGM GROWTH/MGM FIN 4.5%/18-150128 100,000 109,467.00 0.91USD MIDCONTIN COM&FIN 144A 5.375%/19-150827 102,000 106,166.70 0.88USD MOZART DEBT144A 3.875%/21-010429 60,000 59,725.80 0.49USD MPT OPER PARTNERSP/FINL 4.625%/19-010829 100,000 105,945.00 0.88USD MPT OPERATING PARTNER 5.25%/16-010826 20,000 20,639.80 0.17USD MSCI INC 144A 4%/19-151129 75,000 78,543.00 0.65USD MURPHY OIL USA INC 144A 3.75%/21-150231 45,000 44,398.80 0.37USD NATIONAL CINEM LLC 144A 5.875%/19-150428 15,000 13,925.55 0.12USD NAVIOS MARITIME HL 144A 11.25%/17-150822 11,000 11,028.93 0.09USD NEW FORTRESS ENERGY 144A 6.5%/21-300926 50,000 48,670.00 0.40USD NEW RED FIN 144A 3.875%/19-150128 35,000 34,949.95 0.29USD NEWMARK GROUP INC 6.125%/19-151123 150,000 162,192.00 1.34USD NFP CORP 144A 4.875%/21-150828 100,000 101,684.00 0.84USD NOVELIS CORP 144A 3.25%/21-151126 10,000 10,004.30 0.08USD NOVELIS CORP 144A 3.875%/21-150831 10,000 9,801.10 0.08USD OWENS & MINOR INC 4.375%/14-151224 72,000 76,513.68 0.63USD PACTIVE EVERGREEN GROUP 4.375%/21-
151028 75,000 74,168.25 0.61
USD PANTHER BF AGGREGATOR 2 144A 8.5%/150527
150,000 159,531.00 1.32
USD PAPA JOHN'S INTERNATION 3.875%/21-150929 25,000 24,499.25 0.20USD PARK RIVER HOLDIN 144A 5.625%/21-010229 25,000 23,463.00 0.19USD PARK RIVER HOLDINGS INC 6.75%/21-010829 35,000 34,479.90 0.29USD PAYSAFE FIN PLC/PAYSAFE 4%/21-150629 50,000 47,602.50 0.39USD PENINSULA PACIFIC ENTER 144A 8.5%/151127 80,000 85,450.40 0.71USD PGT INNOVATIONS INC 4.375%/21-011029 35,000 34,765.85 0.29USD PLASTIPAK HOLDINGS 144A 6.25%/17-151025 80,000 81,517.60 0.68USD POLAR US BORROWER LLC 6.75%/21-150526 50,000 49,868.50 0.41USD POLYONE CORP -144A- 5.75%/20-15.05.2025 25,000 26,229.25 0.22USD POWDR CORP -144A- 6%/20-01.08.2025 39,000 40,890.72 0.34USD PRESTIGE BRANDS INC 144A 3.75%/21-010431 25,000 24,192.25 0.20USD RADIOLOGY PARTNERS INC 144A 9.25%/010228 110,000 116,749.60 0.97USD RLJ LODGING TRUST LP 144A 4%/21-150929 20,000 19,980.60 0.17USD ROCKIES EXPRESS PIPELIN 144A 4.8%/150530 60,000 63,977.40 0.53USD SEAWORLD PARKS 144A 5.25%/21-150829 25,000 25,514.00 0.21USD SENSAT TECHNOLOGIES INC 4.375%/19-150230 35,000 36,991.50 0.31USD SERVICE CORP INTL 4%/21-150531 20,000 20,464.40 0.17USD SHIFT4 PAYMENTS LLC/FIN 4.625%/20-011126 70,000 72,853.20 0.60USD SILGAN HOLDINGS INC 4.75%/18-150325 125,000 126,748.75 1.05USD SIRIUS XM RADIO INC 144A 3.875%/21-01093 25,000 24,055.25 0.20USD SIX FLAGS ENTERTAINMENT -144A- 4.875%/16-
31.07.2024 100,000 101,270.00 0.84
USD SIX FLAGS THEME PARKS 144A 7%/20-010725 10,000 10,643.00 0.09USD SONIC AUTOMOTIVE 144A 4.625%/21-151129 15,000 15,053.85 0.12USD SONIC AUTOMOTIVE INC 4.875%/21-151131 25,000 25,036.50 0.21USD SPEEDWAY MOT FD 144A 4.875%/19-011127 100,000 102,230.00 0.85USD STARWOOD PROPERTY TRUST 5%/17-151221 90,000 90,243.90 0.75USD STERICYCLE INC 144A 3.875%/20-150129 50,000 49,235.00 0.41USD SUNCOKE ENERGY 144A 4.875%/21-300629 35,000 34,781.95 0.29USD SURGERY CENTER HOLDINGS 144A
10%/150427 20,000 21,506.20 0.18
USD SYNAPTICS INC 144A 4%/21-150629 55,000 55,732.05 0.46USD TALLGRASS NRG PRTNR/FIN 7.5%/20-011025 35,000 37,891.35 0.31USD TARGA RESOURCES PART 144A 4%/21-150132 25,000 25,817.25 0.21USD TASEKO MINES LTD 144A 7%/21-150226 40,000 41,491.20 0.34USD TELENET FINANCE LUX NOTE 144A 5.5%/17-01 200,000 208,876.00 1.73USD TEMPUR SEALY INTL INC 3.875%/21-151031 25,000 24,811.75 0.21USD T-MOBILE USA INC 2.875%/21-150231 40,000 39,904.80 0.33USD TMS INTERNATIONAL 144A 6.25%/21-150429 25,000 25,845.75 0.21USD TOPBUILD CORP 144A 3.625%/21-150329 40,000 40,248.40 0.33USD TRANSDIGM INC 144A 8%/20-151225 50,000 53,215.00 0.44USD TRANSDIGM INC SUB 5.5%/20-151127 50,000 51,369.00 0.43USD TRIMAS CORP 144A 4.125%/21-150429 75,000 76,599.75 0.63USD TRINSEO OP/FIN 144A 5.125%/21-010429 30,000 30,094.20 0.25USD TRIPADVISOR INC 144A 7%/20-150725 7,000 7,434.07 0.06USD TWILIO INC 3.625%/21-150329 10,000 10,106.60 0.08USD TWILIO INC 3.875%/21-150331 10,000 10,102.40 0.08USD UNITED AIRLINES INC 144A 4.625%/150429 5,000 5,161.75 0.04USD UPC BROADBAND FIN 144A 4.875%/21-150731 200,000 203,632.00 1.69USD US FOODS INC 144A 4.75%/21-150229 25,000 25,322.75 0.21USD VERTIV GROUP 144A 4.125%/21-151128 50,000 49,901.50 0.41USD VIAVI SOLUTIONS INC 144A 3.75%/21-011029 35,000 34,779.15 0.29USD VICI PROPERTIES / NOTE -144A- 4.625%/19-
01.12.2029 56,000 59,886.96 0.50
USD VICI PRPRTIES/NOTE 144A 4.25%/19-011226 74,000 76,761.68 0.64USD VINE ENERGY HOLD 144A 6.75%/21-150429 40,000 43,058.80 0.36USD WEWORK COS INC 144A 7.875%/18-010525 94,000 95,532.20 0.79USD WHITE CAP BUYER LLC 144A 6.875%/151028 70,000 72,455.60 0.60
Description Quantity /
Nominal
Valuation
(in USD)
% of net
assets
USD WILLIAMS SCOTSMAN INTL -144A- 4.625%/20-15.08.2028
20,000 20,690.60 0.17
USD WINNEBAGO INDUSTRIES 144A 6.25%/150728 35,000 37,863.00 0.31USD WMG ACQUISITION CORP 144A 3.875%/150730 150,000 156,363.00 1.30USD WOLVERINE WORLD WIDE 144A 4%/21-150829 50,000 49,384.00 0.41USD ZI TECH LLC/ZI FIN CORP 3.875%/21-010229 35,000 34,807.15 0.29
Total Bonds 11,552,870.15 95.68
Total securities listed on a stock exchange or other
organised markets 11,552,870.15 95.68
Total of Portfolio 11,552,870.15 95.68
Cash at banks and at brokers 426,389.31 3.53
Other net assets 94,913.28 0.79
Total net assets 12,074,172.74 100.00

CS Investment Funds 1 • Audited Annual Report as at 31.10.2021
Credit Suisse (Lux) SQ US Corporate Bond Fund Page 96
Technical Data and Notes
Technical Data
Valoren ISIN Management Fee Total Expense Ratio
A - Distribution USD 40678882 LU1785831311 0.65% 0.90%
B - Capitalisation USD 35598131 LU1561148120 0.65% 0.90%
DA - Distribution USD 57217226 LU2237393348 0.00% 0.21%
DB - Capitalisation USD 35598167 LU1561148716 0.00% 0.21%
EA - Distribution USD 35598168 LU1561148807 0.20% 0.41%
EB - Capitalisation USD 35598172 LU1561149284 0.20% 0.41%
UA - Distribution USD 35598201 LU1561152825 0.45% 0.70%
UB - Capitalisation USD 35598205 LU1561153476 0.45% 0.69%
EBH - Capitalisation CHF 35598174 LU1561149524 0.20% 0.49%
EBH - Capitalisation EUR 35598173 LU1561149441 0.20% /
There is no management fee for -DA- and -DB- share classes. Credit Suisse (Lux) SQ US Corporate Bond Fund -DA- USD was launched on 08.03.2021 Credit Suisse (Lux) SQ US Corporate Bond Fund -EBH- EUR was launched on 20.08.2021 No TER is disclosed for share classes launched less than 6 months before closing.
Fund Performance
YTD Since Inception 2020 2019 2018
A - Distribution USD -1.43% 16.66% 7.31% 10.43% /
B - Capitalisation USD -1.43% 16.66% 7.32% 10.41% /
DA - Distribution USD / 1.21% / / /
DB - Capitalisation USD -0.87% / 8.10% 11.31% -0.87%EA - Distribution USD -1.03% 18.64% 7.85% 10.96% /
EB - Capitalisation USD -1.03% / 7.82% 10.96% -1.19%
UA - Distribution USD -1.27% 17.46% 7.53% 10.64% /
UB - Capitalisation USD -1.26% 17.45% 7.53% 10.64% /
EBH - Capitalisation CHF -1.96% / 5.49% 7.19% -4.41%
EBH - Capitalisation EUR / -1.16% / / /
Distribution
Ex-Date Amount
A - Distribution USD 15.12.2020 2.69
EA - Distribution USD 15.12.2020 32.30
UA - Distribution USD 15.12.2020 2.91
Notes
Forward foreign exchange contracts
Purchases Sales Maturity Valuation
Counterparty (In USD)
USD 27,792 EUR -23,800 09.11.2021 243.82
Credit Suisse (Schweiz) AG - Zurich - Switzerland
USD 19,691 EUR -16,900 09.11.2021 129.17
Credit Suisse (Schweiz) AG - Zurich - Switzerland
CHF 11,800 USD -12,706 09.11.2021 212.09
Credit Suisse (Schweiz) AG - Zurich - Switzerland
USD 17,255 EUR -14,900 09.11.2021 8.37
Credit Suisse (Schweiz) AG - Zurich - Switzerland
USD 2,508,195 EUR -2,120,000 09.11.2021 54,303.09
JP Morgan Securities PLC - London - United Kingdom
EUR 190,000 USD -225,736 09.11.2021 -5,812.29
JP Morgan Securities PLC - London - United Kingdom
CHF 1,465,300 USD -1,617,247 09.11.2021 -13,124.29
UBS AG London Branch - London - United Kingdom
USD 29,151 CHF -26,800 09.11.2021 -187.76
Credit Suisse (Schweiz) AG - Zurich - Switzerland

CS Investment Funds 1 • Audited Annual Report as at 31.10.2021
Credit Suisse (Lux) SQ US Corporate Bond Fund Page 97
Technical Data and Notes (Continued)
Forward foreign exchange contracts
Purchases Sales Maturity Valuation
Counterparty (In USD)
CHF 10,700 USD -11,596 09.11.2021 117.64
Credit Suisse (Schweiz) AG - Zurich - Switzerland
USD 166,687 CHF -154,500 09.11.2021 -2,449.83
Credit Suisse (Schweiz) AG - Zurich - Switzerland
USD 115,216 EUR -99,600 09.11.2021 -70.30
Credit Suisse (Schweiz) AG - Zurich - Switzerland
USD 986,714 EUR -850,000 09.11.2021 2,846.06
Credit Suisse (Schweiz) AG - Zurich - Switzerland
USD 3,615,310 EUR -3,080,000 09.11.2021 50,227.42
UBS AG London Branch - London - United Kingdom
EUR 4,526,000 USD -5,382,455 09.11.2021 -143,650.71
Credit Suisse (Schweiz) AG - Zurich - Switzerland
CHF 2,027,200 USD -2,220,672 09.11.2021 -1,414.64
UBS AG London Branch - London - United Kingdom
USD 23,556,655 EUR -19,920,000 09.11.2021 499,330.25
Credit Suisse (Schweiz) AG - Zurich - Switzerland
EUR 4,526,000 USD -5,385,587 09.12.2021 -143,193.59
Credit Suisse (Schweiz) AG - Zurich - Switzerland
CHF 3,492,500 USD -3,828,643 09.12.2021 -1,928.62
UBS AG London Branch - London - United Kingdom
EUR 4,285,000 USD -4,965,419 11.01.2022 2,991.79
JP Morgan Securities PLC - London - United Kingdom
CHF 2,811,900 USD -3,042,207 11.01.2022 42,387.99
UBS AG London Branch - London - United Kingdom
Net unrealised gain on forward foreign exchange contracts 340,965.66

CS Investment Funds 1 • Audited Annual Report as at 31.10.2021
Credit Suisse (Lux) SQ US Corporate Bond Fund Page 98
Statement of Net Assets (in USD) and Fund Evolution
The notes are an integral part of the financial statements.
31.10.2021
Assets
Investments in securities at market value 613,354,727.37Cash at banks and at brokers 3,785,577.67Income receivable 4,974,777.00Net unrealised gain on forward foreign exchange contracts 340,965.66
622,456,047.70
Liabilities
Provisions for accrued expenses 182,845.82Other liabilities 245.13
183,090.95
Net assets 622,272,956.75
Fund Evolution 31.10.2021 31.10.2020 31.10.2019
Total net assets USD 622,272,956.75 566,583,081.55 234,046,049.73
Net asset value per share
A - Distribution USD 109.56 111.45 108.53
B - Capitalisation USD 116.66 115.85 109.79
DA - Distribution USD 1,013.06 / /
DB - Capitalisation USD 1,218.28 1,201.57 1,130.29
EA - Distribution USD 1,101.41 1,120.26 1,090.35
EB - Capitalisation USD 1,202.32 1,188.22 1,120.80
UA - Distribution USD 109.80 111.69 108.73
UB - Capitalisation USD 117.45 116.40 110.09
EBH - Capitalisation CHF 1,066.07 1,066.15 1,030.78
EBH - Capitalisation EUR 987.28 / /
Number of shares outstanding At the end of the year At the beginning of
the year
Number of shares
issued
Number of shares
redeemed
A - Distribution USD 74,053.994 84,218.086 448.602 10,612.694
B - Capitalisation USD 164,203.246 181,925.662 803.726 18,526.142
DA - Distribution USD 6,226.457 0.000 6,226.457 0.000
DB - Capitalisation USD 131,516.267 98,974.917 73,273.525 40,732.175
EA - Distribution USD 2,767.197 11,631.256 583.293 9,447.352
EB - Capitalisation USD 332,046.636 329,174.754 20,252.613 17,380.731
UA - Distribution USD 715.548 715.548 0.000 0.000
UB - Capitalisation USD 3,865.596 837.041 3,028.555 0.000
EBH - Capitalisation CHF 8,993.000 11,052.564 5,599.000 7,658.564
EBH - Capitalisation EUR 13,281.000 0.000 13,608.000 327.000

CS Investment Funds 1 • Audited Annual Report as at 31.10.2021
Credit Suisse (Lux) SQ US Corporate Bond Fund Page 99
Statement of Operations / Changes in Net Assets (in USD)
The notes are an integral part of the financial statements.
For the period from
01.11.2020 to 31.10.2021
Net assets at the beginning of the year 566,583,081.55
Income
Interest on investments in securities (net) 18,641,375.17
Bank Interest 2,513.95
Securities lending income 42,378.77
18,686,267.89
Expenses
Management fee 1,700,098.03
Depositary fee 337,414.76
Administration expenses 88,593.33
Printing and publication expenses 9,793.50
Audit, control, legal, representative bank and other expenses 113,460.58
"Taxe d'abonnement" 55,655.21
2,305,015.41
Net income (loss) 16,381,252.48
Realised gain (loss)
Net realised gain (loss) on sales of investments 3,903,599.55
Net realised gain (loss) on financial futures contracts 556,187.93
Net realised gain (loss) on forward foreign exchange contracts 324,344.81
Net realised gain (loss) on foreign exchange 272,829.27
5,056,961.56
Net realised gain (loss) 21,438,214.04
Change in net unrealised appreciation (depreciation)
Change in net unrealised appreciation (depreciation) on investments -14,931,423.72
Change in net unrealised appreciation (depreciation) on financial futures contracts -75,781.30
Change in net unrealised appreciation (depreciation) on forward foreign exchange contracts 90,978.73
-14,916,226.29
Net increase (decrease) in net assets as a result of operations 6,521,987.75
Subscriptions / Redemptions
Subscriptions 143,645,981.55
Redemptions -93,879,192.88
49,766,788.67
Distribution -598,901.22
Net assets at the end of the year 622,272,956.75

CS Investment Funds 1 • Audited Annual Report as at 31.10.2021
Credit Suisse (Lux) SQ US Corporate Bond Fund Page 100
Statement of Investments in Securities
The notes are an integral part of the financial statements. Any differences in the percentage of Net Assets are the result of roundings.
Breakdown by Country
USA 67.03
United Kingdom 7.09
Netherlands 2.37
Japan 2.22
Mexico 2.06
Cayman Islands 1.91
Spain 1.68
France 1.62
Italy 1.46
Canada 1.42
Germany 1.31
United Arab Emirates 0.88
Ireland 0.73
Peru 0.66
People's Republic of China 0.64
Portugal 0.60
Saudi-Arabia 0.57
Singapore 0.50
Supranational 0.50
Denmark 0.44
Finland 0.43
South Korea 0.42
India 0.35
Bermuda 0.33
Luxembourg 0.33
Belgium 0.32
Australia 0.31
Egypt 0.26
Switzerland 0.13
Total 98.57
Breakdown by Economic Sector
Banks and other credit institutions 24.95
Financial, investment and other div. companies 17.42
Telecommunication 8.32
Pharmaceuticals, cosmetics and medical products 5.43
Petroleum 4.26
Energy and water supply 3.90
Internet, software and IT services 3.77
Food and soft drinks 3.58
Computer hardware and networking 3.23
Real estate 3.14
Electrical appliances and components 2.19
Insurance companies 2.16
Healthcare and social services 1.71
Vehicles 1.34
Countries and central governments 1.33
Graphics publishing and printing media 1.25
Miscellaneous consumer goods 1.21
Building materials and building industry 1.18
Electronics and semiconductors 0.87
Supranational organisations 0.77
Retailing, department stores 0.76
Packaging industries 0.75
Precious metals and precious stones 0.75
Tobacco and alcoholic beverages 0.69
Forestry, paper and forest products 0.69
Chemicals 0.65
Biotechnology 0.63
Traffic and transportation 0.37
Textiles, garments and leather goods 0.34
Mortgage and funding institutions (MBS, ABS) 0.30
Miscellaneous services 0.26
Lodging and catering industry, leisure facilities 0.21
Mining, coal and steel industry 0.17
Total 98.57
Statement of Investments in Securities
Description Quantity /
Nominal
Valuation
(in USD)
% of net
assets
Securities listed on a stock exchange or other organised
markets
Bonds
USD ABBVIE 3.6%/15-14.05.2025 700,000 751,583.00 0.12USD ABBVIE INC 2.95%/20-211126 2,000,000 2,114,840.00 0.34USD ABBVIE INC 3.2%/20-21.11.2029 3,500,000 3,744,860.00 0.60USD ABBVIE INC 3.8%/20-15.03.2025 1,500,000 1,615,935.00 0.26USD ABU DHABI NATIONAL ENERG 4.875%/18-23043 1,000,000 1,188,790.00 0.19USD AFRICA FINANCE CORP 3.125%/20-16.06.2025 3,000,000 3,119,160.00 0.50USD AFRICAN EXPORT-IMPORT BA 4.125%/17-
20.06.2024 1,550,000 1,645,898.50 0.26
USD AGILENT TECHNOLOGIES INC 2.1%/20-04.06.2030
2,000,000 1,969,980.00 0.32
USD ALFA SAB DE CV (REG. -S-) 5.25%/14-25.03.2024
1,000,000 1,069,610.00 0.17
USD ALIBABA GROUP HOLDING 3.4%/17-061227 1,500,000 1,593,480.00 0.26USD ALLY FINANCIAL 4.125%/15-130222 500,000 505,135.00 0.08USD ALLY FINANCIAL 5.75%/15-201125 2,000,000 2,272,780.00 0.37USD ALLY FINANCIAL INC 1.45%/20-02.10.2023 1,500,000 1,514,940.00 0.24USD AMERICAN INTL GROUP 3.4%/20-30.06.2030 2,000,000 2,167,720.00 0.35USD AMERICAN INTL GROUP 3.75%/15-100725 1,000,000 1,078,400.00 0.17USD AMERICAN TOWER CORP 1.5%/20-310128 3,000,000 2,883,570.00 0.46USD AMERICAN TOWER CORP 2.7%/21-150431 2,000,000 2,037,400.00 0.33USD AMERISOURCEBERGEN CORP 2.7%/21-150331 2,000,000 2,035,660.00 0.33USD ANGLO AMERICAN CAPITAL 4%/17-110927 800,000 867,848.00 0.14USD ANTHEM INC 3.65%/17-011227 1,100,000 1,207,591.00 0.19USD AON CORP 2.8%/20-150530 2,000,000 2,076,120.00 0.33USD ARROW ELECTRONICS INC 3.25%/17-08.09.2024 1,500,000 1,576,860.00 0.25USD ASSURED GUARANTY 5%/14-010724 679,000 747,171.60 0.12USD AT&T INC 2.3%/20-010627 2,000,000 2,044,680.00 0.33USD AT&T INC 2.75%/20-010631 2,000,000 2,036,000.00 0.33USD AT&T INC 2.95%/19-150726 2,000,000 2,119,960.00 0.34USD AVNET 4.625%/16-150426 2,500,000 2,761,600.00 0.44USD BAIDU INC 1.72%/20-09.04.2026 1,500,000 1,485,780.00 0.24USD BAIDU INC 2.375%/20-091030 1,500,000 1,451,685.00 0.23USD BAKER HUGHES LLC/CO-OBL 3.337%/18-
151227 1,000,000 1,079,330.00 0.17
USD BALL CORP 4%/13-151123 1,500,000 1,579,410.00 0.25USD BALL CORP 5.25%/15-010725 1,800,000 2,009,070.00 0.32EUR BANCO COMERC PORTUGUES FIX-TO-FRN
FRN/21-12.02.2027 3,300,000 3,703,058.82 0.60
USD BANCO DE CREDITO DEL PER 2.7%/19-11.01.2025
3,000,000 3,082,350.00 0.50
USD BANCO DE CREDITO DEL PERU CREDITO (REG. -S-) 4.25%/13-01.04.2023
1,000,000 1,043,260.00 0.17
USD BANCO SANTANDER (MEXICO) - INSTITUCION DE BANCA MULTIPLE GRUPO FINANCIERO (REG -S-) 4.125%/12-09.11.2022
2,500,000 2,574,425.00 0.41
USD BANCO SANTANDER MEXICO 5.375%/20-17.04.2025
2,500,000 2,769,725.00 0.45
USD BANCO SANTANDER SA 4.379%/18-120428 1,600,000 1,803,840.00 0.29USD BANCO SANTANDER SA SUB 2.749%/20-031230 1,800,000 1,773,810.00 0.29USD BANK OF AMERICA (SUBORDINATED) S. -L-
4%/15-22.01.2025 750,000 808,695.00 0.13
USD BANK OF AMERICA (SUBORDINATED) S. -L- 4.25%/14-22.10.2026
2,500,000 2,770,700.00 0.45
USD BANK OF AMERICA CORP FF FRN/20-190626 4,750,000 4,713,567.50 0.76USD BARCLAYS 4.337%/17-100128 1,000,000 1,102,380.00 0.18USD BARCLAYS BANK 4.375%/16-120126 1,000,000 1,101,820.00 0.18USD BARCLAYS BANK 5.2%/16-120526 3,500,000 3,965,045.00 0.64USD BARCLAYS BANK PLC 4.836% 17 - 09.05.28 1,000,000 1,114,910.00 0.18USD BARCLAYS PLC FF FRN/20-070526 2,000,000 2,081,400.00 0.33USD BAYER US FINANCE II LLC 4.375%/18-151228 1,250,000 1,408,750.00 0.23USD BBVA BANCOMER SA TEXAS 1.875%/20-
18.09.2025 1,600,000 1,604,960.00 0.26
USD BBVA BANCOMER SA TEXAS 4.375%/14-10.04.2024
2,500,000 2,685,425.00 0.43
USD BECTON DICKINSON AND CO 1.957%/21-110231 2,000,000 1,939,720.00 0.31USD BECTON DICKINSON AND CO 2.823%/20-
20.05.2030 2,000,000 2,081,820.00 0.33
USD BERRY GLOBAL ESCROW 144A 4.875%/150726 2,000,000 2,096,780.00 0.34USD BERRY GLOBAL INC 1.57%/21-150126 700,000 693,119.00 0.11USD BEST BUY CO INC 4.45%/18-011028 1,500,000 1,715,490.00 0.28USD BLOCK FINANCIAL LLC 3.875%/20-150830 2,000,000 2,132,660.00 0.34USD BNP PARIBAS REG S T 1 4.375%/15-280925 2,000,000 2,179,220.00 0.35USD BNP PARIBAS SUB FF FRN/20-120835 1,200,000 1,154,568.00 0.19USD BOC AVIATION LTD 2.75%/20-02.12.2023 1,000,000 1,028,660.00 0.17USD BOC AVIATION LTD 3.25%/20-290425 2,000,000 2,082,180.00 0.33USD BORGWARNER INC 2.65%/20-010727 1,000,000 1,041,200.00 0.17USD BOSTON PROPERTIES LP 4.5%/18-01.12.2028 2,250,000 2,571,660.00 0.41USD BP CAPITAL MARKETS PLC (SUBORDINATED)
FIX-TO-FRN FRN/20-PERPETUAL 4,650,000 4,942,206.00 0.79
USD BRITISH TELECOMMUNICATIO 4.5%/18-041223 3,000,000 3,212,580.00 0.52USD BROADCOM INC 3.15%/20-15.11.2025 2,000,000 2,112,260.00 0.34USD BROADCOM INC 3.625%/20-151024 2,000,000 2,137,920.00 0.34USD BROADCOM INC 4.15%/20-15.11.2030 2,150,000 2,364,527.00 0.38USD BROADCOM INC 4.25%/20-150426 900,000 990,243.00 0.16USD BROADCOM INC 4.75%/20-15.04.2029 800,000 912,448.00 0.15USD CAMPBELL SOUP CO 4.15%/18-15.03.2028 1,800,000 2,017,314.00 0.32USD CANADIAN NATL RESOURCES 3.85%/17-
01.06.2027 2,000,000 2,170,100.00 0.35
USD CARDINAL HEALTH 3.75%/15-150925 800,000 864,896.00 0.14USD CARDINAL HEALTH INC 3.079%/17-150624 2,000,000 2,098,440.00 0.34USD CBS 2.9%/16-150127 2,612,000 2,748,346.40 0.44USD CBS 3.5%/15-150125 1,000,000 1,063,170.00 0.17EUR CELLNEX FINANCE CO SA 1%/21-150927 2,100,000 2,356,491.97 0.38

CS Investment Funds 1 • Audited Annual Report as at 31.10.2021
Credit Suisse (Lux) SQ US Corporate Bond Fund Page 101
Statement of Investments in Securities (Continued)
The notes are an integral part of the financial statements. Any differences in the percentage of Net Assets are the result of roundings.
Description Quantity /
Nominal
Valuation
(in USD)
% of net
assets
EUR CELLNEX FINANCE CO SA 1.25%/21-150129 1,800,000 1,996,582.59 0.32USD CENOVUS ENERGY INC 4.25%/17-150427 2,500,000 2,746,925.00 0.44USD CENTERPOINT ENERGY INC 4.25%/18-
01.11.2028 1,500,000 1,697,760.00 0.27
USD CHARLES SCHWAB CORP 1.65%/20-110331 1,500,000 1,438,770.00 0.23USD CHARTER COM OP 4.464%/16-230722 1,200,000 1,225,716.00 0.20USD CHARTER COM OP 4.908%/16-230725 2,000,000 2,225,120.00 0.36USD CHARTER COMM OPT LLC/CAP 2.8%/20-010431 100,000 99,542.00 0.02USD CHARTER COMM OPT LLC/CAP 5.05%/19-
300329 2,000,000 2,334,940.00 0.38
USD CITIGROUP (SUBORDINATED) 3.875%/15-26.03.2025
1,500,000 1,612,980.00 0.26
USD CITIGROUP 2.9%/16-081221 2,200,000 2,201,056.00 0.35USD CITIGROUP 3.7%/16-120126 2,000,000 2,170,760.00 0.35USD CITIGROUP 4.125%/16-250728 2,000,000 2,220,940.00 0.36USD CITIGROUP 4.45%/15-29.09.2027 2,500,000 2,802,800.00 0.45USD CITIGROUP FRN 17-10.01.2028 2,000,000 2,179,940.00 0.35USD CITIGROUP INC 2.7%/17-271022 2,200,000 2,245,342.00 0.36USD CITIGROUP INC 2.75%/17-25.04.2022 1,300,000 1,312,753.00 0.21USD CITIGROUP INC FIX-TO-FRN FRN/20-30.10.2024 2,000,000 1,995,600.00 0.32USD CITIGROUP SUB 4%/14-050824 1,000,000 1,076,080.00 0.17USD CNH INDUSTRIAL CAP LLC 1.875%/20-
15.01.2026 2,000,000 2,015,880.00 0.32
USD COCA-COLA EUROPEAN PART 1.5%/21-150127 3,800,000 3,745,508.00 0.60USD CONAGRA BRANDS INC 4.3%/18-01.05.2024 1,500,000 1,616,295.00 0.26USD CONAGRA BRANDS INC 4.6%/18-01.11.2025 3,000,000 3,342,900.00 0.54USD CONAGRA BRANDS INC 4.85%/18-011128 1,500,000 1,751,715.00 0.28USD CONSTELLATION BRANDS 3.5%/17-090527 2,000,000 2,172,260.00 0.35USD CONSTELLATION BRANDS INC 3.15%/19-010829 2,000,000 2,125,420.00 0.34USD COOPERATIEVE RABOBANK 3.75%/16-210726 2,500,000 2,719,175.00 0.44USD COX COMMUNICATIONS INC -144A- 1.8%/20-
01.10.2030 2,000,000 1,900,180.00 0.31
USD CVS HEALTH CORP 1.3%/20-210827 1,000,000 970,180.00 0.16USD CVS HEALTH CORP 1.75%/20-21.08.2030 1,500,000 1,428,525.00 0.23USD CVS HEALTH CORP 3.625%/20-010427 1,500,000 1,636,785.00 0.26USD CVS HEALTH CORP 4.3%/18-25.03.2028 602,000 682,445.26 0.11USD D.R. HORTON INC 1.4%/20-151027 2,000,000 1,943,080.00 0.31USD DAIMLER FIN REG S 3.3%/15-190525 1,500,000 1,598,025.00 0.26USD DAIMLER FINANCE NA LLC 3.75%/18-220228 1,500,000 1,663,425.00 0.27USD DAIMLERCHRYSLER NORTH AMERICA 8.5%/01-
18.01.2031 2,000,000 3,014,160.00 0.48
USD DANSKE BANK A/S 5.375%/19-120124 2,500,000 2,719,375.00 0.44USD DELL INT LLC 6.02%/21-150626 2,000,000 2,357,140.00 0.38USD DEUTSCHE BANK 3.7%/14-30.05.2024 2,500,000 2,645,975.00 0.43EUR DEUTSCHE BANK AG 1.625%/20-200127 2,000,000 2,414,254.95 0.39EUR DEUTSCHE BANK AG FF FRN/20-191130 1,700,000 2,049,441.15 0.33USD DEUTSCHE BANK NY 3.95%/18-27.02.2023 1,000,000 1,039,350.00 0.17USD DOMINION ENERGY INC S B 4.25%/18-010628 1,500,000 1,693,785.00 0.27USD DOMINION ENERGY INC S C 3.375%/20-010430 1,500,000 1,613,745.00 0.26USD DRESDNER FNDG TRUST I SUB 8.151%/300631 2,000,000 2,837,320.00 0.46USD EASTMAN CHEMICAL 3.8%/14-15.03.2025 800,000 858,776.00 0.14USD EDF REG S FF 14-PERPET 2,500,000 2,660,325.00 0.43USD EDP FINANCE BV 1.71%/20-24.01.2028 1,600,000 1,563,520.00 0.25USD EDP FINANCE BV 3.625%/17-150724 500,000 530,215.00 0.09USD ENBRIDGE INC 3.7%/17-150727 2,600,000 2,836,834.00 0.46USD ENEL FINANCE INTERNATIONAL N.V. 2.65%/19-
10.09.2024 2,000,000 2,081,840.00 0.33
USD ENI SPA 4.25%/19-090529 1,000,000 1,135,350.00 0.18USD ENTERPRISE PRODUCTS OP 3.95%/16-150227 1,000,000 1,103,890.00 0.18USD ENTERPRISE PRODUCTS OPER 2.8%/20-
31.01.2030 1,500,000 1,560,345.00 0.25
USD ENTERPRISE PRODUCTS OPER 3.125%/310729 1,000,000 1,066,570.00 0.17USD ENTERPRISE PRODUCTS OPER 3.9%/14-150224 1,000,000 1,060,530.00 0.17USD EQUINIX INC 1%/20-15.09.2025 2,000,000 1,961,160.00 0.32USD EQUINIX INC 1.25%/20-15.07.2025 1,000,000 992,300.00 0.16USD EQUINIX INC 1.55%/20-150328 1,000,000 970,430.00 0.16USD EQUINIX INC 1.8%/20-150727 1,000,000 994,940.00 0.16USD EUROCLEAR BANK SA 1.261%/21-030826 2,000,000 1,967,400.00 0.32USD EXELON CORP 4.05%/20-15.04.2030 2,000,000 2,252,120.00 0.36USD EXPRESS SCRIPTS HOLDING 3.4%/16-010327 1,050,000 1,122,670.50 0.18USD FEDEX CORP 4.25%/20-15.05.2030 2,000,000 2,284,060.00 0.37EUR FIRST ABU DHABI BANK PJS 0.125%/21-
16.02.2026 3,700,000 4,271,591.44 0.69
USD FISERV INC 2.65%/20-010630 2,000,000 2,033,940.00 0.33USD FISERV INC 3.2%/19-010726 2,000,000 2,126,480.00 0.34USD FORD MOTOR CREDIT CO LLC 2.7%/21-100826 1,100,000 1,097,371.00 0.18USD FREEPORT-MCMORAN INC 4.125%/20-010328 500,000 517,845.00 0.08USD FREEPORT-MCMORAN INC 5%/19-010927 2,000,000 2,089,420.00 0.34USD GAZ CAPITAL REG S 4.95%/12-190722 2,000,000 2,057,760.00 0.33USD GE CAPITAL FUNDING 3.45%/21-150525 1,750,000 1,873,672.50 0.30USD GENERAL ELECTRIC FF 5%/16-PERPET 2,500,000 2,441,900.00 0.39USD GENERAL MOTORS FIN 3.45%/17-140122 700,000 702,492.00 0.11USD GENERAL MOTORS FIN 3.7%/16-090523 500,000 519,275.00 0.08USD GENERAL MOTORS FIN 3.95%/17-130424 1,000,000 1,061,740.00 0.17USD GENERAL MOTORS FINL CO 1.25%/21-080126 4,000,000 3,920,640.00 0.63USD GENERAL MOTORS FINL CO 2.35%/21-080131 1,000,000 970,840.00 0.16USD GENERAL MOTORS FINL CO 3.5%/17-071124 2,000,000 2,118,820.00 0.34USD GENERAL MOTORS FINL CO 4.35%/17-170127 1,000,000 1,105,090.00 0.18USD GILEAD SCIENCES INC 1.2%/20-011027 2,000,000 1,930,240.00 0.31USD GOLDMAN SACHS GROUP 3.85%/17-260127 4,000,000 4,332,240.00 0.70USD GOLDMAN SACHS GROUP 4%/14-03.03.2024 918,000 980,635.14 0.16USD GOLDMAN SACHS GROUP FIX-TO-FRN
2.908%/17-05.06.2023 2,500,000 2,533,100.00 0.41
USD GOLDMAN SACHS GROUP INC 3.625%/19-20.02.2024
1,500,000 1,587,015.00 0.26
USD GOLDMAN SACHS GROUP INC 3.8%/20-15.03.2030
2,000,000 2,207,780.00 0.35
USD GOLDMAN SACHS GROUP INC FF FRN/21-100927
2,500,000 2,459,050.00 0.40
Description Quantity /
Nominal
Valuation
(in USD)
% of net
assets
USD GOLDMAN SACHS GROUP INC FIX-TO-FRN FRN/18-01.05.2029
2,500,000 2,801,500.00 0.45
EUR GRENKE FINANCE PLC 0.625%/19-090125 1,000,000 1,097,177.15 0.18EUR GRENKE FINANCE PLC 1.5%/18-051023 3,000,000 3,452,620.66 0.55USD GRUPO BIMBO REG S 3.875%/14-270624 2,000,000 2,126,780.00 0.34USD HARTFORD FINL SVCS GRP 2.8%/19-190829 1,000,000 1,043,050.00 0.17USD HASBRO INC 3.5%/17-150927 1,500,000 1,617,420.00 0.26USD HASBRO INC 3.9%/19-191129 1,500,000 1,647,945.00 0.26USD HCA 4.5%/16-150227 2,000,000 2,218,960.00 0.36USD HCA 5.25%/16-150626 500,000 567,505.00 0.09USD HCA INC 4.125%/19-15.06.2029 1,000,000 1,109,130.00 0.18USD HCA INC 4.75%/12-010523 2,500,000 2,643,500.00 0.42USD HCA INC 5%/14-150324 1,000,000 1,088,430.00 0.17USD HP INC 3%/20-17.06.2027 200,000 211,810.00 0.03USD HP INC 3.4%/20-170630 6,000,000 6,338,220.00 1.02USD HSBC HOLDINGS 4.25%/15-180825 1,500,000 1,627,095.00 0.26USD HSBC HOLDINGS 4.375%/16-231126 2,000,000 2,202,440.00 0.35USD HSBC HOLDINGS PLC 4.95%/20-31.03.2030 800,000 942,304.00 0.15USD HSBC HOLDINGS PLC FRN/18-190629 647,000 731,329.98 0.12USD HUMANA INC 4.875%/20-010430 1,500,000 1,777,200.00 0.29USD HYUNDAI CAPITAL AMERICA 2.375%/20-100223 1,000,000 1,018,490.00 0.16USD HYUNDAI CAPITAL AMERICA 2.375%/20-151027 2,000,000 2,004,660.00 0.32USD HYUNDAI CAPITAL AMERICA 5.875%/20-070425 1,000,000 1,133,370.00 0.18USD IND & COMM BK CHINA/SG 1%/20-090923 2,000,000 2,001,700.00 0.32USD IND & COMM BK CHINA/SG 1.2%/20-090925 2,000,000 1,971,960.00 0.32USD INEOS QUATTRO 2 144A 3.375%/21-150126 3,500,000 3,489,185.00 0.56USD INEOS QUATTRO FINANCE 2 3.375%/21-
15.01.2026 900,000 897,219.00 0.14
EUR INFRASTRUTTURE WIRELESS 1.625%/20-211028 1,000,000 1,167,503.24 0.19EUR INFRASTRUTTURE WIRELESS 1.875%/20-080726 2,000,000 2,392,359.78 0.38USD INTERPUBLIC GROUP COS 4.65%/18-01.10.2028 3,000,000 3,492,270.00 0.56USD INTERPUBLIC GROUP COS 4.75%/20-300330 1,000,000 1,174,940.00 0.19USD INTERPUBLIC GROUP OF COMPANIES 4.2%/14-
15.04.2024 250,000 268,100.00 0.04
USD JEFFERIES GROUP LLC 2.75%/20-15.10.2032 2,000,000 1,984,660.00 0.32USD JPMORGAN CHASE & CO (SUBORDINATED) FIX-
TO-FRN FRN/20-13.05.2031 2,000,000 2,067,480.00 0.33
USD JPMORGAN CHASE 2.972%/16-15.01.2023 1,700,000 1,708,806.00 0.27USD JPMORGAN CHASE 3.375%/13-01.05.2023 1,200,000 1,248,552.00 0.20USD KELLOGG CO 2.1%/20-010630 2,500,000 2,467,475.00 0.40USD KEYCORP S O 4.15%/18-291025 2,500,000 2,759,025.00 0.44USD KEYCORP S. -O- 4.1%/18-30.04.2028 800,000 907,496.00 0.15USD KIMCO REALTY CORP 1.9%/20-010328 1,500,000 1,482,390.00 0.24USD KINDER MORGAN 4.3%/14-010625 1,800,000 1,968,768.00 0.32USD KINDER MORGAN ENERGY 3.95%/12-010922 750,000 765,157.50 0.12USD KINDER MORGAN ENERGY PARTNERS
3.45%/12-15.02.2023 1,500,000 1,543,215.00 0.25
USD KINDER MORGAN INC 4.3%/18-010328 2,676,000 3,010,847.88 0.48USD KOREA NATL OIL REG S 2.625%/16-140426 1,500,000 1,563,825.00 0.25USD KRAFT HEINZ FOODS 3%/16-010626 1,850,000 1,933,731.00 0.31USD KRAFT HEINZ FOODS CO 3.875%/21-150527 1,000,000 1,086,120.00 0.17USD LABORATORY CORP OF AMER 1.55%/21-010626 1,250,000 1,241,662.50 0.20USD LABORATORY CORP OF AMER 2.7%/21-010631 1,150,000 1,172,379.00 0.19USD LENNAR CORP 4.5%/17-300424 1,500,000 1,611,000.00 0.26USD LENNAR CORP 4.75%/18-291127 1,000,000 1,141,060.00 0.18USD LINCOLN NATIONAL CORP 3.8%/18-010328 3,000,000 3,316,260.00 0.53USD LLOYDS BANK 4.65%/16-240326 2,250,000 2,504,385.00 0.40USD LLOYDS BANKING GROUP PLC 4.375%/18-
22032 2,000,000 2,259,700.00 0.36
USD LUKOIL INTERNATIONAL FINANCE (REG. -S-) 4.563%/13-24.04.2023
2,000,000 2,092,380.00 0.34
USD MACQUARIE BANK T2 REG S 4.875%/15-100625 1,738,000 1,910,392.22 0.31USD MARATHON OIL CORP 4.4%/17-150727 2,000,000 2,221,040.00 0.36USD MARRIOTT INTERNATIO S EE 5.75%/20-010525 211,000 239,314.09 0.04USD MARRIOTT INTERNATIONAL S GG 3.5%/20-1510 1,000,000 1,058,120.00 0.17USD MARSH & MCLENNAN COS INC 2.25%/20-
151130 1,000,000 1,000,440.00 0.16
USD MATTEL INC 144A 5.875%/19-151227 2,000,000 2,158,560.00 0.35USD MCKESSON CORP 1.3%/21-150826 2,000,000 1,962,280.00 0.32USD MORGAN STANLEY (SUBORD) 4.1%/13-
22.05.2023 2,000,000 2,102,600.00 0.34
USD MORGAN STANLEY (SUBORD) S. -F- 4.875%/12-01.11.2022
1,000,000 1,042,510.00 0.17
USD MORGAN STANLEY (SUBORDINATED) S. -F- 3.95%/15-23.04.2027
1,000,000 1,098,450.00 0.18
USD MORGAN STANLEY 2.75%/17-19.05.2022 2,200,000 2,229,084.00 0.36USD MORGAN STANLEY 3.125%/18-23.01.2023 2,000,000 2,062,220.00 0.33USD MORGAN STANLEY 3.625%/17-20.01.2027 1,750,000 1,901,987.50 0.31USD MORGAN STANLEY 6.25%/06-090826 1,000,000 1,203,270.00 0.19USD MORGAN STANLEY S I FF FRN/19-230130 1,750,000 2,003,382.50 0.32USD MORGAN STANLEY S I FF FRN/21-200727 1,500,000 1,476,015.00 0.24USD MORGAN STANLEY S. -I- FIX-TO-FRN FRN/20-
01.04.2031 2,000,000 2,184,620.00 0.35
USD MOTOROLA SOLUTIONS INC 2.3%/20-151130 2,500,000 2,442,925.00 0.39USD NEWMONT GOLDCORP CORP 2.8%/19-011029 2,000,000 2,063,380.00 0.33USD NISSAN MOTOR CO 4.345%/20-170927 2,500,000 2,712,000.00 0.44USD NOKIA OYJ 3.375%/17-120622 500,000 507,440.00 0.08USD NOKIA OYJ 4.375%/17-120627 2,000,000 2,158,500.00 0.35USD NOMURA HOLDINGS INC 3.103%/20-160130 2,000,000 2,067,960.00 0.33USD NORDSTROM INC 2.3%/21-080424 3,000,000 3,017,040.00 0.48USD NUTRIEN LTD 2.95%/20-130530 1,000,000 1,052,070.00 0.17USD NXP BV/NXP FDG/NXP USA -144A- 3.4%/20-
01.05.2030 2,500,000 2,683,675.00 0.43
USD NXP BV/NXP FDG/NXP USA -144A- 3.875%/19-18.06.2026
1,000,000 1,090,180.00 0.18
USD OMNICOM GROUP INC 2.45%/20-300430 2,800,000 2,815,792.00 0.45USD ONEOK INC 2.75%/19-010924 2,000,000 2,081,180.00 0.33USD ONEOK INC 4.35%/19-150329 1,500,000 1,671,195.00 0.27USD ORACLE CORP 2.3%/21-250328 4,000,000 4,048,400.00 0.65USD ORACLE CORP 2.625%/17-150223 1,000,000 1,025,590.00 0.16

CS Investment Funds 1 • Audited Annual Report as at 31.10.2021
Credit Suisse (Lux) SQ US Corporate Bond Fund Page 102
Statement of Investments in Securities (Continued)
The notes are an integral part of the financial statements. Any differences in the percentage of Net Assets are the result of roundings.
Description Quantity /
Nominal
Valuation
(in USD)
% of net
assets
USD PACIFIC GAS & ELECTRIC 1.75%/20-16.06.2022 5,400,000 5,399,190.00 0.87USD PACKAGING CORP OF AMERIC 3.4%/17-
15.12.2027 1,000,000 1,088,300.00 0.17
USD PERKINELMER INC 3.3%/19-15.09.2029 800,000 857,056.00 0.14USD PIONEER NATURAL RESOURCE 1.9%/20-150830 1,500,000 1,428,135.00 0.23USD PNC BANK NA SUB 2.7%/19-221029 1,500,000 1,564,410.00 0.25USD POSCO 2.5%/20-170125 1,000,000 1,032,110.00 0.17USD PULTEGROUP INC 5.5%/16-010326 921,000 1,058,882.91 0.17USD QTEL INTERNATIONAL (REG. -S-) 3.25%/12-
21.02.2023 2,000,000 2,062,240.00 0.33
USD REINSURANCE GRP OF AMER 3.9%/19-15.05.2029
1,800,000 1,998,468.00 0.32
USD RELIANCE INDUSTRIES (REG. -S-) 4.125%/15-28.01.2025
2,000,000 2,148,000.00 0.35
USD SABINE PASS LIQUEFACTION 4.2%/17-15.03.2028
2,000,000 2,223,420.00 0.36
USD SABINE PASS LIQUEFACTION 5%/17-15.03.2027 750,000 851,625.00 0.14USD SABINE PASS LIQUEFACTION 5.625%/15-
01.03.2025 2,000,000 2,245,800.00 0.36
USD SANTANDER HOLDINGS 4.5%/15-170725 1,000,000 1,095,210.00 0.18USD SANTANDER HOLDINGS USA 3.45%/20-
02.06.2025 2,000,000 2,123,580.00 0.34
USD SANTANDER HOLDINGS USA 4.45%/18-031221 240,000 240,724.80 0.04USD SAUDI ARABIAN OIL CO 2.25%/20-24.11.2030 3,650,000 3,546,924.00 0.57USD SEAGATE HDD CAYMAN 144A 3.125%/20-
150729 2,000,000 1,920,900.00 0.31
USD SEAGATE HDD CAYMAN -144A- 4.875%/17-01.03.2024
2,115,000 2,258,883.45 0.36
USD SHERWIN-WILLIAMS CO 2.95%/19-15.08.2029 1,500,000 1,587,915.00 0.26USD SIMON PROPERTY GROUP 3.5%/15-010925 1,000,000 1,077,420.00 0.17USD SIMON PROPERTY GROUP LP 1.75%/21-010228 2,000,000 1,966,240.00 0.32USD SOCIETE GENERALE 3%/20-220130 1,000,000 1,030,280.00 0.17USD SOCIETE GENERALE 4.75%/18-140928 1,000,000 1,148,270.00 0.18USD SOCIETE GENERALE REG S 4%/12012017 1,000,000 1,086,000.00 0.17USD SOCIETE GENERALE SUB FF FRN/20-PERPET 750,000 799,845.00 0.13USD SOFTBANK GROUP CORP. 3.125%/21-060125 2,850,000 2,822,070.00 0.45USD SOFTBANK GROUP CORP. 4%/21-060726 2,450,000 2,423,319.50 0.39USD SPECTRA ENERGY PARTNERS 3.5%/15-150325 800,000 852,512.00 0.14USD STANDARD CHART REG S 3.95%/13-110123 3,000,000 3,096,150.00 0.50USD STANDARD CHARTERED REG S 4.05%/16-
120426 1,800,000 1,956,852.00 0.31
USD TAKEDA PHARMACEUTICAL CO LTD 2.05%/20-31.03.2030
3,900,000 3,812,913.00 0.61
EUR TELECOM ITALIA SPA 2.375%/17-121027 1,000,000 1,170,211.20 0.19EUR TELECOM ITALIA SPA 2.75%/19-15.04.2025 1,000,000 1,205,518.90 0.19USD TELEFONICA EMISIONES 4.103%/17-080327 2,300,000 2,551,390.00 0.41USD TENCENT HOLD REG S T 4 3.8%/15-110225 1,500,000 1,600,530.00 0.26USD TENCENT HOLDINGS LTD 3.595%/18-
19.01.2028 1,500,000 1,598,550.00 0.26
USD TEVA PHARMACEUTICAL FINANCE 2.8%/16-21.07.2023
2,000,000 2,015,580.00 0.32
USD THERMO FISHER SCIENTIFIC 1.75%/21-151028 200,000 197,152.00 0.03USD T-MOBILE USA INC 1.5%/21-150226 1,000,000 993,480.00 0.16USD T-MOBILE USA INC 2.05%/21-150228 2,350,000 2,331,341.00 0.37USD T-MOBILE USA INC 2.55%/21-150231 2,000,000 1,985,560.00 0.32USD T-MOBILE USA INC 3.5%/21-150425 2,000,000 2,133,440.00 0.34USD T-MOBILE USA INC 3.875%/21-150430 500,000 547,270.00 0.09USD TYSON FOODS INC 4%/19-010326 2,000,000 2,197,500.00 0.35USD UBS AG SUB 5.125%/14-150524 750,000 815,910.00 0.13EUR UNICREDIT SPA 0.5%/19-090425 1,750,000 2,037,034.85 0.33USD UPJOHN INC 2.3%/20-220627 1,000,000 1,011,150.00 0.16USD UPJOHN INC 2.7%/20-220630 600,000 600,390.00 0.10USD US TREASURY N/B S E-2031 1.25%/21-150831 8,500,000 8,264,589.87 1.33USD VALERO ENERGY 3.4%/16-15.09.2026 1,850,000 1,979,222.50 0.32USD VALERO ENERGY CORP 2.85%/20-15.04.2025 1,500,000 1,569,615.00 0.25USD VERIZON COMMUNICATIONS 0.85%/20-
20.11.2025 2,000,000 1,958,960.00 0.31
USD VERIZON COMMUNICATIONS 1.45%/21-200326 1,500,000 1,496,625.00 0.24USD VERIZON COMMUNICATIONS 1.68%/21-301030 1,000,000 944,100.00 0.15USD VERIZON COMMUNICATIONS 1.75%/20-
20.01.2031 3,000,000 2,835,150.00 0.46
USD VERIZON COMMUNICATIONS 2.1%/21-220328 500,000 501,720.00 0.08USD VERIZON COMMUNICATIONS 2.355%/21-150332 2,500,000 2,463,175.00 0.40USD VERIZON COMMUNICATIONS 3.5%/14-
01.11.2024 500,000 533,725.00 0.09
USD VERTICAL US NEWCO INC 5.25%/20-150727 450,000 459,657.00 0.07USD VF CORP 2.95%/20-23.04.2030 2,000,000 2,089,900.00 0.34USD VMWARE INC 3.9%/17-210827 2,600,000 2,852,746.00 0.46USD VODAFONE GROUP 4.375%/18-300528 2,000,000 2,280,600.00 0.37USD VOLKSWAGEN GROUP AMERICA 1.25%/20-
241125 1,500,000 1,478,790.00 0.24
USD VOLKSWAGEN GRP AMERICA 1.625%/20-241127 1,500,000 1,467,315.00 0.24USD WALGREENS BOOTS 3.45%/16-010626 561,000 601,599.57 0.10USD WELLS FARGO & CO S 158 3.55%/15-290925 1,500,000 1,614,585.00 0.26USD WELLS FARGO & CO S M 4.1%/14-030626 1,500,000 1,645,920.00 0.26USD WELLS FARGO & CO S155 4.3%/15-220727 1,750,000 1,956,587.50 0.31USD WELLS FARGO & CO 3.3%/14-090924 1,500,000 1,596,855.00 0.26USD WELLS FARGO & COMPANY 3%/16-22.04.2026 2,000,000 2,117,700.00 0.34USD WELLS FARGO 3%/16-231026 2,500,000 2,640,700.00 0.42USD WELLS FARGO S. M 3.45%/13-13.02.2023 1,000,000 1,036,670.00 0.17USD WELLS FARGO&COMPANY S Q 4.15%/19-
240129 2,000,000 2,251,060.00 0.36
USD WELLTOWER INC 2.7%/19-15.02.2027 1,500,000 1,566,525.00 0.25USD WELLTOWER INC 3.1%/19-15.01.2030 1,000,000 1,053,130.00 0.17USD WESTERN DIGITAL CORP 4.75%/18-15.02.2026 800,000 879,624.00 0.14USD WHIRLPOOL CORP 4.75%/19-26.02.2029 1,800,000 2,093,328.00 0.34USD WILLIAMS PARTNERS 3.6%/15-150322 800,000 805,656.00 0.13USD WILLIAMS PARTNERS 4%/15-150925 2,000,000 2,174,100.00 0.35USD WILLIAMS PARTNERS 4.3%/14-040324 1,000,000 1,069,640.00 0.17USD WILLIAMS PARTNERS LP 3.75%/17-15.06.2027 1,100,000 1,198,186.00 0.19
Description Quantity /
Nominal
Valuation
(in USD)
% of net
assets
USD WRKCO 4.65%/19-150326 2,000,000 2,251,960.00 0.36USD WRKCO INC 4.9%/19-15.03.2029 1,750,000 2,054,045.00 0.33
Total Bonds 613,354,727.37 98.57
Total securities listed on a stock exchange or other
organised markets 613,354,727.37 98.57
Total of Portfolio 613,354,727.37 98.57
Cash at banks and at brokers 3,785,577.67 0.61
Other net assets 5,132,651.71 0.82
Total net assets 622,272,956.75 100.00

CS Investment Funds 1 • Audited Annual Report as at 31.10.2021
Credit Suisse (Lux) Latin America Corporate Bond Fund Page 103
Technical Data and Notes
Technical Data
Valoren ISIN Management Fee Total Expense Ratio
A - Distribution USD 48786752 LU2022004787 1.20% 1.41%
B - Capitalisation USD 48786756 LU2022005164 1.20% 1.41%
DA - Distribution USD 48786763 LU2022005677 0.00% 0.12%
DB - Capitalisation USD 48786764 LU2022005750 0.00% 0.12%
IA - Distribution USD 48765181 LU2022006139 0.60% 0.69%
IB - Capitalisation USD 48765189 LU2022006568 0.60% 0.69%
MB - Capitalisation USD 48735704 LU2022009406 0.10% 0.28%
UA - Distribution USD 48767290 LU2022010834 0.70% 0.91%
UB - Capitalisation USD 48767312 LU2022011212 0.70% 0.91%
DBH - Capitalisation CHF 48786770 LU2022011998 0.00% 0.15%
IBH - Capitalisation EUR 48765147 LU2022006642 0.60% 0.77%
There is no management fee for -DA-, -DB- and -DBH- share classes. Credit Suisse (Lux) Latin America Corporate Bond Fund -DBH- CHF was launched on 11.01.2021.
Fund Performance
YTD Since Inception 2020
A - Distribution USD 0.68% 9.76% 6.29%
B - Capitalisation USD 0.69% 9.76% 6.27%
DA - Distribution USD 1.76% 12.74% 7.66%
DB - Capitalisation USD 1.77% 12.74% 7.66%
IA - Distribution USD 1.27% 11.56% 7.18%
IB - Capitalisation USD 1.27% 11.56% 7.18%
MB - Capitalisation USD 1.62% 11.94% /
UA - Distribution USD 1.10% 10.90% 6.81%
UB - Capitalisation USD 1.09% 10.89% 6.81%
DBH - Capitalisation CHF / 1.86% /
IBH - Capitalisation EUR 0.54% 7.71% 4.92%
Distribution
Ex-Date Amount
A - Distribution USD 01.12.2020 1.08
A - Distribution USD 02.03.2021 1.03
A - Distribution USD 01.06.2021 1.02
A - Distribution USD 07.09.2021 1.01
DA - Distribution USD 01.12.2020 14.05
DA - Distribution USD 02.03.2021 13.70
DA - Distribution USD 01.06.2021 13.47
DA - Distribution USD 07.09.2021 13.49
IA - Distribution USD 01.12.2020 12.96
IA - Distribution USD 02.03.2021 12.52
IA - Distribution USD 01.06.2021 12.33
IA - Distribution USD 07.09.2021 11.66
UA - Distribution USD 01.12.2020 1.21
UA - Distribution USD 02.03.2021 1.16
UA - Distribution USD 01.06.2021 1.15
UA - Distribution USD 07.09.2021 1.14
Notes
Financial futures contracts
Description Currency Quantity Engagement Valuation
Counterparty (In USD)
US TREASURY NOTES ULTRA 10 YEARS 21/12/2 USD 65 9,427,031.25 -157,421.88
Net unrealised gain on financial futures contracts -157,421.88
Counterparty: Credit Suisse (Schweiz) AG

CS Investment Funds 1 • Audited Annual Report as at 31.10.2021
Credit Suisse (Lux) Latin America Corporate Bond Fund Page 104
Technical Data and Notes (Continued)
Forward foreign exchange contracts
Purchases Sales Maturity Valuation
Counterparty (In USD)
USD 23,136 EUR -20,000 09.11.2021 -14.12
Credit Suisse (Schweiz) AG - Zurich - Switzerland
EUR 3,100 USD -3,685 09.11.2021 -97.25
Citibank N.A.- London - United Kingdom
CHF 11,700 USD -12,817 09.11.2021 -8.16
UBS AG London Branch - London - United Kingdom
EUR 1,389,700 USD -1,643,408 09.11.2021 -34,842.56
Credit Suisse (Schweiz) AG - Zurich - Switzerland
CHF 4,414,600 USD -4,872,380 09.11.2021 -39,540.35
UBS AG London Branch - London - United Kingdom
USD 491,601 EUR -415,000 09.11.2021 11,240.01
Credit Suisse (Schweiz) AG - Zurich - Switzerland
USD 54,915 CHF -50,900 09.11.2021 -807.10
Credit Suisse (Schweiz) AG - Zurich - Switzerland
EUR 1,392,800 USD -1,656,804 09.12.2021 -43,546.03
Citibank N.A.- London - United Kingdom
CHF 4,426,300 USD -4,852,319 09.12.2021 -2,444.28
UBS AG London Branch - London - United Kingdom
EUR 1,392,800 USD -1,613,964 11.01.2022 972.45
JP Morgan Securities PLC - London - United Kingdom
CHF 4,426,300 USD -4,788,834 11.01.2022 66,724.27
UBS AG London Branch - London - United Kingdom
Net unrealised loss on forward foreign exchange contracts -42,363.12
Swaps contracts
Type Payable Receivable Maturity Valuation
Counterparty Nominal Nominal (in USD)
CDS USD 1,250,000 BUY prot CDX NA HY S37 12/26
USD SELL prot CDX NA HY S37 12/26
20.12.2026 -117,847.45
Credit Suisse International - London - United Kingdom
Net unrealised loss on swaps contracts -117,847.45
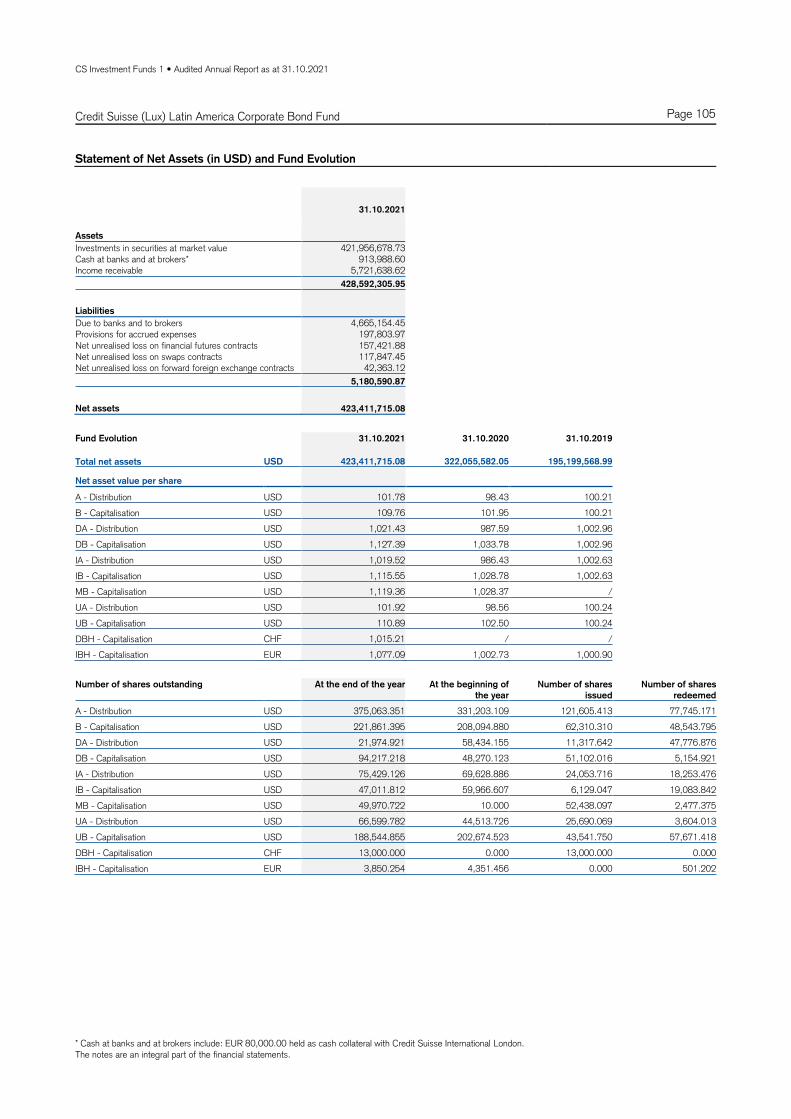
CS Investment Funds 1 • Audited Annual Report as at 31.10.2021
Credit Suisse (Lux) Latin America Corporate Bond Fund Page 105
Statement of Net Assets (in USD) and Fund Evolution
* Cash at banks and at brokers include: EUR 80,000.00 held as cash collateral with Credit Suisse International London. The notes are an integral part of the financial statements.
31.10.2021
Assets
Investments in securities at market value 421,956,678.73Cash at banks and at brokers* 913,988.60Income receivable 5,721,638.62
428,592,305.95
Liabilities
Due to banks and to brokers 4,665,154.45Provisions for accrued expenses 197,803.97Net unrealised loss on financial futures contracts 157,421.88Net unrealised loss on swaps contracts 117,847.45Net unrealised loss on forward foreign exchange contracts 42,363.12
5,180,590.87
Net assets 423,411,715.08
Fund Evolution 31.10.2021 31.10.2020 31.10.2019
Total net assets USD 423,411,715.08 322,055,582.05 195,199,568.99
Net asset value per share
A - Distribution USD 101.78 98.43 100.21
B - Capitalisation USD 109.76 101.95 100.21
DA - Distribution USD 1,021.43 987.59 1,002.96
DB - Capitalisation USD 1,127.39 1,033.78 1,002.96
IA - Distribution USD 1,019.52 986.43 1,002.63
IB - Capitalisation USD 1,115.55 1,028.78 1,002.63
MB - Capitalisation USD 1,119.36 1,028.37 /
UA - Distribution USD 101.92 98.56 100.24
UB - Capitalisation USD 110.89 102.50 100.24
DBH - Capitalisation CHF 1,015.21 / /
IBH - Capitalisation EUR 1,077.09 1,002.73 1,000.90
Number of shares outstanding At the end of the year At the beginning of
the year
Number of shares
issued
Number of shares
redeemed
A - Distribution USD 375,063.351 331,203.109 121,605.413 77,745.171
B - Capitalisation USD 221,861.395 208,094.880 62,310.310 48,543.795
DA - Distribution USD 21,974.921 58,434.155 11,317.642 47,776.876
DB - Capitalisation USD 94,217.218 48,270.123 51,102.016 5,154.921
IA - Distribution USD 75,429.126 69,628.886 24,053.716 18,253.476
IB - Capitalisation USD 47,011.812 59,966.607 6,129.047 19,083.842
MB - Capitalisation USD 49,970.722 10.000 52,438.097 2,477.375
UA - Distribution USD 66,599.782 44,513.726 25,690.069 3,604.013
UB - Capitalisation USD 188,544.855 202,674.523 43,541.750 57,671.418
DBH - Capitalisation CHF 13,000.000 0.000 13,000.000 0.000
IBH - Capitalisation EUR 3,850.254 4,351.456 0.000 501.202

CS Investment Funds 1 • Audited Annual Report as at 31.10.2021
Credit Suisse (Lux) Latin America Corporate Bond Fund Page 106
Statement of Operations / Changes in Net Assets (in USD)
The notes are an integral part of the financial statements.
For the period from
01.11.2020 to 31.10.2021
Net assets at the beginning of the year 322,055,582.05
Income
Interest on investments in securities (net) 21,938,901.59
Bank Interest 31.61
Securities lending income 209,366.46
22,148,299.66
Expenses
Management fee 1,712,092.54
Depositary fee 237,050.55
Administration expenses 187,464.39
Printing and publication expenses 10,605.35
Interest and bank charges 2,188.84
Audit, control, legal, representative bank and other expenses 91,731.42
"Taxe d'abonnement" 118,341.10
2,359,474.19
Net income (loss) 19,788,825.47
Realised gain (loss)
Net realised gain (loss) on sales of investments 2,013,517.54
Net realised gain (loss) on financial futures contracts 396,092.96
Net realised gain (loss) on swaps contracts 35,386.35
Net realised gain (loss) on forward foreign exchange contracts -346,087.39
Net realised gain (loss) on foreign exchange -100,229.15
1,998,680.31
Net realised gain (loss) 21,787,505.78
Change in net unrealised appreciation (depreciation)
Change in net unrealised appreciation (depreciation) on investments 7,161,248.70
Change in net unrealised appreciation (depreciation) on financial futures contracts -173,828.13
Change in net unrealised appreciation (depreciation) on swaps contracts -117,847.45
Change in net unrealised appreciation (depreciation) on forward foreign exchange contracts -316.57
6,869,256.55
Net increase (decrease) in net assets as a result of operations 28,656,762.33
Subscriptions / Redemptions
Subscriptions 197,507,858.87
Redemptions -116,884,496.35
80,623,362.52
Distribution -7,923,991.82
Net assets at the end of the year 423,411,715.08

CS Investment Funds 1 • Audited Annual Report as at 31.10.2021
Credit Suisse (Lux) Latin America Corporate Bond Fund Page 107
Statement of Investments in Securities
The notes are an integral part of the financial statements. Any differences in the percentage of Net Assets are the result of roundings.
Breakdown by Country
Mexico 17.20
Luxembourg 10.46
Colombia 10.22
Peru 9.54
Chile 8.65
Argentina 7.55
Netherlands 6.69
Brazil 5.20
Bermuda 5.03
USA 3.55
Cayman Islands 3.49
Panama 2.72
Austria 2.22
Spain 1.62
Canada 1.55
Virgin Islands (UK) 0.99
Ireland 0.77
Venezuela 0.48
Guatemala 0.47
Paraguay 0.43
Supranational 0.38
United Kingdom 0.32
Dominican Republic 0.13
Total 99.66
Breakdown by Economic Sector
Financial, investment and other div. companies 23.92
Petroleum 15.95
Banks and other credit institutions 15.84
Telecommunication 11.52
Energy and water supply 7.14
Food and soft drinks 3.76
Chemicals 2.59
Forestry, paper and forest products 2.49
Countries and central governments 2.18
Non-ferrous metals 1.61
Building materials and building industry 1.55
Mining, coal and steel industry 1.46
Retailing, department stores 1.44
Miscellaneous services 1.37
Traffic and transportation 1.18
Tobacco and alcoholic beverages 1.01
Agriculture and fishery 0.99
Supranational organisations 0.86
Precious metals and precious stones 0.64
Electrical appliances and components 0.59
Real estate 0.43
Miscellaneous consumer goods 0.43
Packaging industries 0.33
Vehicles 0.28
Pharmaceuticals, cosmetics and medical products 0.12
Total 99.66
Statement of Investments in Securities
Description Quantity /
Nominal
Valuation
(in USD)
% of net
assets
Securities listed on a stock exchange or other organised
markets
Bonds
USD ADECOAGRO SA 6%/17-21.09.2027 1,000,000 1,043,190.00 0.25USD AEROPUERTOS ARGENT 2000 S. -2020- -144A-
9.375%/20-01.02.2027 1,178,979 937,916.17 0.22
USD AEROPUERTOS DOMINICANOS 6.75%/17-300329
500,000 529,385.00 0.13
USD AES PANAMA GENERATION HL 4.375%/20-31.05.2030
3,850,000 3,966,270.00 0.94
USD AI CANDELARIA SPAIN SLU 5.75%/21-150633 2,450,000 2,413,666.50 0.57USD ALFA SAB 144A 6.875%/14-25.03.2044 1,500,000 1,970,835.00 0.47USD ALPEK (REG. -S-) 5.375%/13-08.08.2023 750,000 803,287.50 0.19USD ALPEK SA DE CV 4.25%/19-180929 500,000 529,990.00 0.13USD AMERICA MOVIL 4.375%/12-160742 1,250,000 1,504,925.00 0.36USD AMERICA MOVIL 6.125%/10-300340 2,000,000 2,837,760.00 0.67USD AMERICA MOVIL SAB DE CV 2.875%/20-070530 750,000 779,392.50 0.18USD AMERICA MOVIL SAB DE CV 3.625%/19-220429 2,500,000 2,714,475.00 0.64USD AMERICA MOVIL SAB DE CV 6.125%/07-
15.11.2037 600,000 829,404.00 0.20
USD ANTOFAGASTA PLC 2.375%/20-14.10.2030 750,000 708,510.00 0.17USD ATENTO LUXCO 1 SA 8%/21-10.02.2026 1,500,000 1,599,090.00 0.38USD AUNA SA 6.5%/20-20.11.2025 3,000,000 3,128,700.00 0.74USD AZUL INVESTMENTS LLP 5.875%/17-261024 400,000 372,416.00 0.09USD B2W DIGITAL LUX SARL 4.375%/20-20.12.2030 250,000 233,322.50 0.06USD B3 SA-BRASIL BOLSA BALC 4.125%/21-200931 2,900,000 2,792,671.00 0.66USD BANC CREDITO INVERSIONES 3.5%/17-121027 1,500,000 1,596,195.00 0.38USD BANCO BRADESCO (CAYMAN) 3.2%/20-270125 500,000 505,965.00 0.12USD BANCO DE BOGOTA SA 4.375%/17-030827 750,000 783,225.00 0.18USD BANCO DE BOGOTA SA SUB 5.375%/190223 2,000,000 2,080,760.00 0.49USD BANCO DE BOGOTA SA SUB 6.25%/16-120526 4,250,000 4,654,557.50 1.10USD BANCO DE CREDITO DEL PER (SUBORDINATED)
FIX-TO-FRN FRN/20-01.07.2030 5,000,000 4,960,100.00 1.17
USD BANCO DE CREDITO DEL PER 2.7%/19-11.01.2025
3,500,000 3,596,075.00 0.85
USD BANCO DO BRASIL REG S 5.875%/11-260122 3,500,000 3,529,715.00 0.83USD BANCO DO BRASIL REG S FF 6.25%/13-PERPET 5,500,000 5,404,300.00 1.28USD BANCO GENERAL SA 4.125%/17-07.08.2027 2,250,000 2,412,562.50 0.57USD BANCO GENERAL SA SUB FF FRN/21-PERPET 1,250,000 1,259,800.00 0.30USD BANCO INBURSA 4.375%/17-11.04.2027 2,500,000 2,650,950.00 0.63USD BANCO INDUSTRIAL SA SUB FF FRN/21-290131 2,000,000 2,007,460.00 0.47USD BANCO INT DEL PERU SUB FF FRN/20-080730 1,000,000 1,008,400.00 0.24USD BANCO INTERNAC DEL PERU 3.25%/19-
04.10.2026 1,300,000 1,331,369.00 0.31
USD BANCO INTERNAC DEL PERU 3.375%/18-180123 900,000 918,999.00 0.22USD BANCO MACRO SA SUB FF FRN/16-041126 2,500,000 2,137,700.00 0.50USD BANCO MER DEL NORTE FF 6.875%/17-PERPET 850,000 862,622.50 0.20USD BANCO MERCANTIL DE NOR SUB FF
FRN/041031 2,250,000 2,402,977.50 0.57
USD BANCO SANTANDER MEXICO SUB FF FRN/011028
600,000 641,706.00 0.15
USD BANCOLOMBIA SA (SUBORDINATED) FIX-TO-FRN FRN/19-18.12.2029
4,000,000 4,067,440.00 0.96
USD BANCOLOMBIA SA 3%/20-290125 2,000,000 2,022,400.00 0.48USD BANCOLOMBIA SA SUB FF FRN/17-181027 2,750,000 2,785,612.50 0.66USD BANISTMO SA 3.65%/17-190922 1,250,000 1,270,750.00 0.30USD BBANCO MERCANTIL DE NOR SUB FF
FRN/PERPE 2,750,000 2,884,172.50 0.68
USD BBVA BANCO CONTINENTAL (REG. -S-) 5%/12-26.08.2022
600,000 620,082.00 0.15
USD BBVA BANCOMER REG S 6.75%/12-300922 700,000 732,893.00 0.17USD BBVA BANCOMER SA TEXAS SUB FF
FRN/180133 1,350,000 1,397,344.50 0.33
USD BRASKEM AMERICA REG S 7.125%/11-220741 1,250,000 1,525,625.00 0.36USD BRASKEM IDESA SAPI 6.99%/21-200232 750,000 768,712.50 0.18USD BRASKEM IDESA SAPI 7.45%/19-15.11.2029 1,250,000 1,328,175.00 0.31USD BRASKEM NETHERLANDS (SUBORDINATED) FIX-
TO-FRN FRN/20-23.01.2081 450,000 504,121.50 0.12
USD BRASKEM NETHERLANDS 4.5%/17-10.01.2028 2,250,000 2,304,990.00 0.54USD BRF GMBH 4.35%/16-290926 350,000 354,529.00 0.08USD C&W SENIOR FINANCING DAC 6.875%/150927 1,750,000 1,845,742.50 0.44USD CABCORP REG S 5.75%/17-310127 1,000,000 1,036,160.00 0.24USD CABLE ONDA SA 4.5%/19-300130 2,500,000 2,601,325.00 0.61USD CAMPOSOL SA 6%/20-030227 3,000,000 3,135,090.00 0.74USD CANACOL ENERGY LTD 7.25%/18-030525 650,000 680,914.00 0.16USD CELULOSA ARAUCO CONSTITU 3.875%/18-
02.11.2027 2,000,000 2,132,660.00 0.50
USD CELULOSA ARAUCO CONSTITU 4.25%/19-300429
1,250,000 1,331,850.00 0.31
USD CELULOSA ARAUCO CONSTITU 5.15%/19-29.01.2050
500,000 561,135.00 0.13
USD CELULOSA ARAUCO CONSTITU 5.5%/18-02.11.2047
1,250,000 1,442,687.50 0.34
USD CEMEX SAB DE CV 5.45%/19-19.11.2029 3,250,000 3,522,902.50 0.83USD CEMEX SAB DE CV 7.375%/20-050627 2,750,000 3,044,112.50 0.72USD CENCOSUD (REG. -S-) 5.15%/15-12.02.2025 1,650,000 1,801,569.00 0.43USD CENCOSUD SA 4.375%/17-17.07.2027 1,000,000 1,062,950.00 0.25USD CENCOSUD SA 6.625%/15-120245 750,000 962,505.00 0.23USD CENTRAL AMERICAN BANK 2%/20-060525 1,560,000 1,595,708.40 0.38USD CERRO DEL AGUILA SA 4.125%/17-16.08.2027 1,500,000 1,564,200.00 0.37USD CIA DE MINAS BUENAVENTUR 5.5%/21-230726 400,000 398,052.00 0.09USD COCA-COLA FEMSA SAB CV 2.75%/20-
22.01.2030 4,500,000 4,665,150.00 1.10
USD COLBUN SA 3.15%/20-06.03.2030 3,000,000 3,017,670.00 0.71USD COLBUN SA 3.15%/21-190132 1,400,000 1,383,508.00 0.33

CS Investment Funds 1 • Audited Annual Report as at 31.10.2021
Credit Suisse (Lux) Latin America Corporate Bond Fund Page 108
Statement of Investments in Securities (Continued)
The notes are an integral part of the financial statements. Any differences in the percentage of Net Assets are the result of roundings.
Description Quantity /
Nominal
Valuation
(in USD)
% of net
assets
USD COLOMBIA TELECOMUNICACIO 4.95%/20-17.07.2030
1,650,000 1,700,853.00 0.40
USD CORP ANDINA DE FOMENTO 4.375%/12-150622 2,000,000 2,046,700.00 0.48USD COSAN LTD 5.5%/19-20.09.2029 1,750,000 1,833,912.50 0.43USD CREDICORP LTD 2.75%/20-17.06.2025 2,500,000 2,546,950.00 0.60USD CSN ISLANDS XI CORP 6.75%/20-28.01.2028 1,250,000 1,332,487.50 0.31USD CSN RESOURCES SA 7.625%/19-17.04.2026 1,500,000 1,584,060.00 0.37USD CYDSA SAB DE CV 6.25%/17-04.10.2027 2,000,000 2,035,700.00 0.48USD DIGICEL GROUP 0.5 LTD 10%/20-010424 4,040,000 4,079,834.40 0.96USD DIGICEL GROUP 0.5 LTD 144A 8%/20-010425 507,500 491,249.85 0.12USD DIGICEL GROUP 0.5 LTD SUB CV 144A 7%/20- 1,606,837 1,172,991.01 0.28USD DIGICEL INTL FINANCE LTD 144A 13%/20-311 1,449,000 1,490,122.62 0.35USD DIGICEL INTL FINANCE LTD 144A 8.75%/20-2 1,000,000 1,040,800.00 0.25USD DIGICEL INTL FINANCE LTD 8.75%/19-250524 1,000,000 1,041,250.00 0.25USD DIGICEL REG S 6.75%/15-010323 4,500,000 4,356,990.00 1.03USD ECOPETROL 4.125%/14-160125 2,250,000 2,332,260.00 0.55USD ECOPETROL 5.375%/15-26.06.2026 6,000,000 6,509,580.00 1.54USD ECOPETROL 5.875%/13-18.09.2023 3,000,000 3,224,580.00 0.76USD ECOPETROL 5.875%/14-28.05.2045 2,500,000 2,521,950.00 0.60USD ECOPETROL 7.375%/13-18.09.2043 2,750,000 3,206,802.50 0.76USD ECOPETROL SA 6.875%/20-29.04.2030 3,500,000 4,047,540.00 0.96USD EMBRAER NETHERLANDS 5.05%/15-150625 1,750,000 1,820,700.00 0.43USD EMBRAER NETHERLANDS FINA 6.95%/20-
170128 1,250,000 1,392,725.00 0.33
USD ENEL CHILE SA 4.875%/18-12.06.2028 2,250,000 2,549,092.50 0.60USD ENERGUATE TRUST 5.875%/17-030527 1,350,000 1,382,602.50 0.33USD ENERSIS AMERICA 4%/16-25.10.2026 3,250,000 3,472,527.50 0.82USD ENFRAGEN ENERGIA SUR SA 5.375%/20-
30.12.2030 3,000,000 2,882,430.00 0.68
USD ENTEL CHILE SA 3.05%/21-140932 3,300,000 3,220,800.00 0.76USD FALABELLA SA 3.375%/21-150132 2,300,000 2,284,452.00 0.54USD FEL ENERGY VI SARL 5.75%/20-01.12.2040 850,000 837,409.84 0.20USD FENIX POWER PERU SA 4.317%/17-200927 3,000,000 2,531,107.50 0.60USD FIBRIA OVERSEAS FINANCE 5.5%/17-17.01.2027 2,750,000 3,083,712.50 0.73USD FIDEICOM F/1401 REG S 6.95%/14-300144 1,500,000 1,828,365.00 0.43USD FIRST QUANTUM MINERAL L 6.875%/20-151027 1,000,000 1,072,110.00 0.25USD FIRST QUANTUM MINERALS L 7.25%/17-010423 850,000 865,444.50 0.20USD FIRST QUANTUM MINERALS L 7.5%/17-010425 1,000,000 1,035,940.00 0.24USD FOMENTO ECONOMICO MEX 3.5%/20-
16.01.2050 4,000,000 4,289,720.00 1.01
USD FRESNILLO PLC 4.25%/20-02.10.2050 650,000 666,757.00 0.16USD FRONTERA ENERGY CORP 7.875%/21-210628 1,050,000 1,015,696.50 0.24USD FS LUXEMBOURG SARL 10%/20-15.12.2025 1,400,000 1,545,124.00 0.36USD GAS NATURAL LICUADO QUINTERO (REG. -S-)
4.634%/14-31.07.2029 2,750,000 2,787,055.56 0.66
USD GEOPARK LTD 5.5%/20-17.01.2027 2,500,000 2,494,900.00 0.59USD GERDAU TRADE 4.875%/17-241027 1,000,000 1,094,790.00 0.26USD GOL FINANCE SA 7%/17-310125 550,000 495,049.50 0.12USD GRAN TIERRA ENERGY INC 7.75%/19-23.05.2027 2,000,000 1,862,600.00 0.44USD GRAN TIERRA ENERGY INTL 6.25%/18-150225 2,000,000 1,861,700.00 0.44USD GRUPO BIMBO REG S 4.875%/14-270644 3,100,000 3,749,326.00 0.89USD GRUPO BIMBO SAB DE SUB FF FRN/18-PERPET 1,750,000 1,828,382.50 0.43USD GRUPO KUO SAB DE CV 5.75%/17-070727 1,250,000 1,285,900.00 0.30USD GRUPO TELEVISA 5%/14-13.05.2045 1,000,000 1,218,250.00 0.29USD GRUPO TELEVISA 6.625%/10-15.01.2040 1,250,000 1,742,837.50 0.41USD GRUPO UNICOMER REG S 14 7.875%/17-010424 400,000 415,596.00 0.10USD GTL TRADE FINANCE 7.25%/14-160444 1,250,000 1,666,275.00 0.39USD HIDROVIAS INT FIN SARL 4.95%/21-08.02.2031 1,250,000 1,181,762.50 0.28USD INDUSTRIAS PENOLES SAB D 4.15%/19-
12.09.2029 1,000,000 1,085,440.00 0.26
USD INDUSTRIAS PENOLES SAB D 5.65%/19-12.09.2049
1,000,000 1,218,570.00 0.29
USD INFRAESTRUCTURA ENERGETI 4.875%/140148 1,250,000 1,283,700.00 0.30USD INKIA ENERGY LTD 5.875%/17-091127 2,500,000 2,583,925.00 0.61USD INRETAIL CONSUMER 3.25%/21-220328 1,250,000 1,231,887.50 0.29USD INTERCEMENT FIN OP BV 5.75%/14-170724 3,500,000 3,265,955.00 0.77USD INTL AIRPORT FINANCE SA 12%/19-150333 1,450,000 1,559,380.60 0.37USD INVERSIONES CMPC (REG. -S-) 4.375%/17-
04.04.2027 1,000,000 1,089,900.00 0.26
USD INVERSIONES CMPC (REG. -S-) 4.75%/14-15.09.2024
1,150,000 1,234,283.50 0.29
USD ITAU UNIBANCO HLDG S11 FRN/19-211129 2,000,000 2,001,360.00 0.47USD ITAU UNIBANCO REG S FF 6.125%/17-PERPET 4,000,000 3,983,800.00 0.94USD ITAUUNIBANCO REG S T 5 6.2%/11-211221 1,250,000 1,257,187.50 0.30USD JSM GLOBAL SARL 4.75%/20-20.10.2030 200,000 190,806.00 0.05USD KALLPA GENERACION (REG.-S-) 4.875%/16-
24.05.2026 1,500,000 1,605,360.00 0.38
USD KENBOURNE INVEST SA 4.7%/21-22.01.2028 1,400,000 1,394,652.00 0.33USD KENBOURNE INVEST SA 6.875%/19-261124 1,750,000 1,833,020.00 0.43USD KLABIN AUSTRIA GMBH 5.75%/19-030429 2,000,000 2,180,060.00 0.51USD KLABIN AUSTRIA GMBH 7%/19-030449 500,000 578,350.00 0.14USD LCPR SR SECURED FIN DAC 6.75%/19-
15.10.2027 1,350,000 1,425,856.50 0.34
USD LIMA METRO LINE 2 FIN LT 5.875%/15-05.07.2034
2,850,000 1,652,122.92 0.39
USD MC BRAZIL DWNSTRM 7.25%/21-300631 1,650,000 1,610,697.00 0.38USD MEXICHEM (REG. -S-) 5.875%/14-17.09.2044 1,500,000 1,842,450.00 0.44USD MILLICOM INTL CELLULAR 5.125%/17-150128 3,850,000 3,612,470.40 0.85USD MILLICOM INTL CELLULAR 6.25%/19-250329 3,500,000 3,441,217.50 0.81USD MINERVA LUXEMBOURG SA 5.875%/17-190128 1,500,000 1,604,415.00 0.38USD MOVIDA EUROPE SA 5.25%/21-08.02.2031 1,000,000 946,240.00 0.22USD MX REMIT FUND FIDUC EST 4.875%/21-
15.01.2028 2,500,000 2,426,275.00 0.57
USD NATURA COSMETICOS SA 4.125%/21-030528 500,000 496,945.00 0.12USD NBM US HOLDINGS INC 6.625%/19-060829 2,000,000 2,183,540.00 0.52USD NBM US HOLDINGS INC 7%/19-14.05.2026 500,000 530,245.00 0.13USD NEMAK SAB DE CV 3.625%/21-280631 1,250,000 1,172,462.50 0.28USD NEXA RESOURCES S.A. 6.5%/20-18.01.2028 1,750,000 1,946,735.00 0.46USD NEXA RESOURCES SA 5.375%/17-040527 2,350,000 2,501,504.50 0.59USD OI SA 10%/18-27.07.2025 250,000 226,047.50 0.05
Description Quantity /
Nominal
Valuation
(in USD)
% of net
assets
USD ORAZUL ENERGY EGENOR 5.625%/17-280427 2,500,000 2,494,375.00 0.59USD ORBIA ADVANCE CORP SAB 1.875%/21-110526 1,000,000 992,360.00 0.23USD PAMPA ENERGIA REG S 7.5%/17-240127 2,500,000 2,229,600.00 0.53USD PAMPA ENERGIA SA 7.375%/16-21.07.2023 2,500,000 2,411,950.00 0.57USD PAN AMERICAN ENERGY LLC 9.125%/21-300427 450,000 505,701.00 0.12USD PERU LNG SRL 5.375%/18-220330 2,000,000 1,692,960.00 0.40USD PETROBRAS GLOBAL FIN 8.75%/16-230526 3,000,000 3,704,250.00 0.87USD PETROBRAS GLOBAL FINANCE 5.6%/20-030131 2,250,000 2,359,012.50 0.56USD PETROBRAS GLOBAL FINANCE 5.999%/18-
27.01.2028 4,750,000 5,187,855.00 1.23
USD PETROBRAS GLOBAL FINANCE 6.85%/15-05.06.2115
2,000,000 1,954,740.00 0.46
USD PETROBRAS INTL FIN 6.875%/09-200140 4,000,000 4,367,640.00 1.03USD PETROLEOS MEXICANOS 5.95%/20-28.01.2031 1,250,000 1,231,112.50 0.29USD PETROLEOS MEXICANOS 6.95%/20-280160 1,250,000 1,108,337.50 0.26USD REDE D'OR FINANCE SARL 4.95%/18-170128 750,000 771,202.50 0.18EUR REPUBLIC OF ARGENTINA 0.5%/20-09.07.2029 1,022 449.26 0.00USD REPUBLIC OF ARGENTINA 1%/20-09.07.2029 52,298 19,106.55 0.00EUR REPUBLIC OF ARGENTINA STEP-UP/20-090741 500,000 183,105.88 0.04USD REPUBLIC OF ARGENTINA STEP-UP/20-090746 1,697,500 538,039.60 0.13USD RUMO LUXEMBOURG S.A. RL 5.25%/20-100128 2,000,000 2,080,500.00 0.49USD SABLE INTL FINANCE LTD 5.75%/19-070927 1,867,000 1,943,864.39 0.46USD SAN MIGUEL INDUSTRIAS 3.5%/21-020828 800,000 787,976.00 0.19USD SIERRACOL ENRGY ANDINA 6%/21-150628 1,600,000 1,575,952.00 0.37USD SIMPAR EUROPE SA 5.2%/21-26.01.2031 2,050,000 1,974,355.00 0.47USD SUAM FINANCE (REG -S-) 4.875%14-17.04.2024 1,250,000 1,345,100.00 0.32USD SUZANO AUSTRIA GMBH 6%/19-15.01.2029 4,750,000 5,462,927.50 1.29USD SUZANO AUSTRIA GMBH 7%/17-16.03.2047 650,000 818,876.50 0.19USD TELECOM ARGENTINA SA 8%/19-180726 2,500,000 2,338,775.00 0.55USD TELECOM ARGENTINA SA 8.5%/20-06.08.2025 3,241,000 3,165,614.34 0.75USD TELEFONICA CHILE REG S 3.875%/12-121022 3,000,000 3,067,230.00 0.72USD TELFON CELUAR DEL PARAGU 5.875%/19-
15.04.2027 1,750,000 1,821,890.00 0.43
USD TERMOCANDELARIA POWER 7.875%/19-30.01.2029
2,250,000 2,154,988.69 0.51
USD TOTAL PLAY TELECOM 6.375%/21-200928 850,000 838,389.00 0.20USD TOTAL PLAY TELECOM 7.5%/20-12.11.2025 3,500,000 3,647,385.00 0.86USD TRANS PERU (REG. -S-) 4.25%/13-30.04.2028 2,300,000 2,470,384.00 0.58USD TRANSPORT DE GAS DEL SUR 6.75%/18-
02.05.2025 2,500,000 2,343,550.00 0.55
USD TRANSPRTDRA DE GAS INTL 5.55%/18-011128 1,750,000 1,969,432.50 0.47USD TRUST F/1401 5.25%/15-30.01.2026 3,000,000 3,292,650.00 0.78USD TUPY OVERSEAS SA 4.5%/21-16.02.2031 3,000,000 2,838,150.00 0.67USD ULTRAPAR INTERNATIONL SA 5.25%/19-060629 2,250,000 2,333,295.00 0.55USD UNIGEL LUXEMBOURG SA 8.75%/19-01.10.2026 3,000,000 3,199,740.00 0.76USD US S. B-2022 2%/12-15.02.2022 2,000,000 2,011,250.00 0.48USD US TREASURY N/B 1.125%/20-28.02.2022 2,000,000 2,007,031.26 0.47USD US TREASURY N/B S AU-23 0.125%/20-151223 3,000,000 2,972,812.50 0.70USD USIMINAS INTERNAT S.A R.L. 5.875%/180726 1,000,000 1,052,810.00 0.25USD VALE CANADA LTD 7.2%/02-150932 1,500,000 1,886,355.00 0.45USD VALE OVERSEAS 6.875%/06-21.11.2036 250,000 327,472.50 0.08USD VALE OVERSEAS LIMITED 3.75%/20-08.07.2030 1,000,000 1,022,170.00 0.24USD VOLCAN (REG. -S-) 5.375%/12-02.02.2022 1,850,000 1,858,010.50 0.44USD VOLCAN CIA MINERA SAA-CM 4.375%/21-
11.02.2026 3,650,000 3,575,065.50 0.84
USD VTR COMUNICACIONES SPA 5.125%/20-150128 1,581,000 1,647,465.24 0.39USD VTR COMUNICACIONES SPA 6.375%/20-150728 1,350,000 1,444,513.50 0.34USD YPF (REG -S-) 8.5%/15-28.07.2025 5,000,000 4,038,650.00 0.95USD YPF (REG -S-) 8.75%/14-04.04.2024 2,250,000 2,036,880.00 0.48USD YPF ENERGIA ELECTRICA SA 10%/19-
25.07.2026 3,250,000 2,983,045.00 0.70
USD YPF SA 8.5%/20-230325 2,250,000 1,793,531.25 0.42USD YPF SOCIEDAD ANONIMA 6.95%/17-21.07.2027 2,500,000 1,822,875.00 0.43USD YPF SOCIEDAD ANONIMA 7%/17-15.12.2047 2,250,000 1,474,560.00 0.35USD YPF SOCIEDAD ANONIMA 8.5%/19-270629 1,300,000 1,000,220.00 0.24
Total Bonds 420,225,538.73 99.25
Total securities listed on a stock exchange or other
organised markets 420,225,538.73 99.25
Securities not listed on a stock exchange
Bonds
USD REPUBLIC OF PERU 3%/21-150134 1,500,000 1,485,405.00 0.35
Total Bonds 1,485,405.00 0.35
Promissory Notes
USD OP SERVICIOS MEGA 8.25%/20-11.02.2025 250,000 245,735.00 0.06
Total Promissory Notes 245,735.00 0.06
Total securities not listed on a stock exchange 1,731,140.00 0.41
Total of Portfolio 421,956,678.73 99.66
Cash at banks and at brokers 913,988.60 0.22
Due to banks and to brokers -4,665,154.45 -1.10
Other net assets 5,206,202.20 1.22
Total net assets 423,411,715.08 100.00
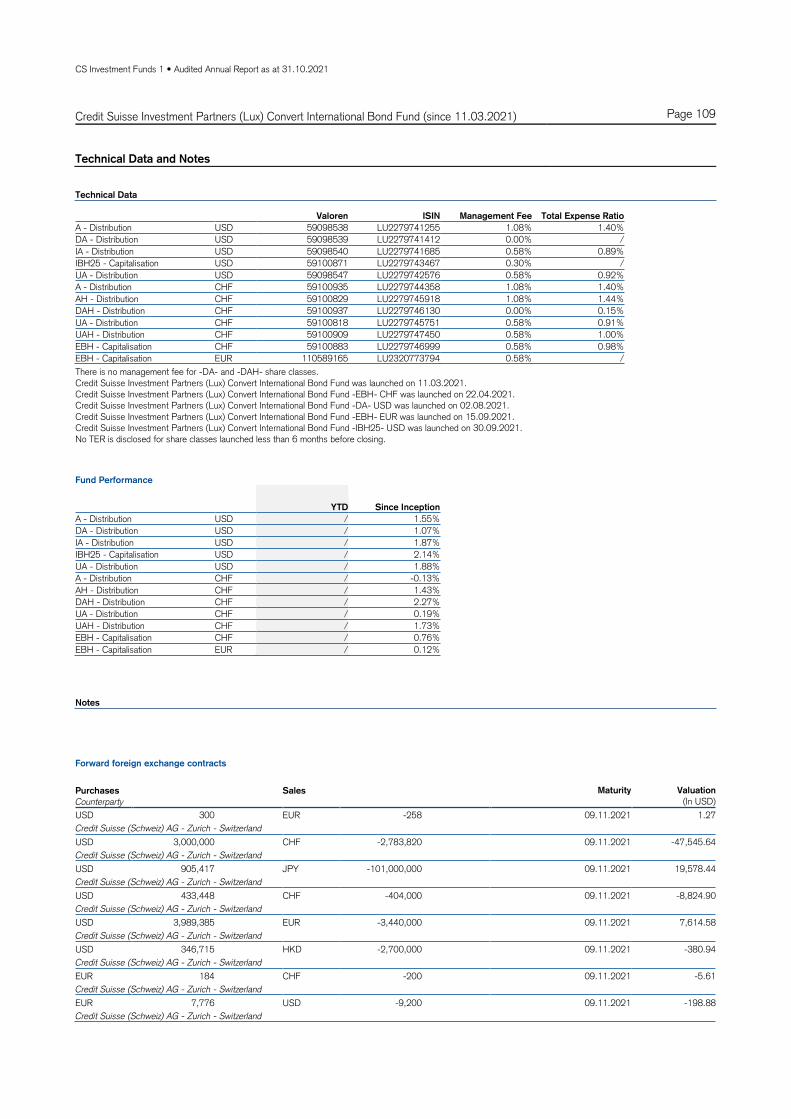
CS Investment Funds 1 • Audited Annual Report as at 31.10.2021
Credit Suisse Investment Partners (Lux) Convert International Bond Fund (since 11.03.2021) Page 109
Technical Data and Notes
Technical Data
Valoren ISIN Management Fee Total Expense Ratio
A - Distribution USD 59098538 LU2279741255 1.08% 1.40%
DA - Distribution USD 59098539 LU2279741412 0.00% /
IA - Distribution USD 59098540 LU2279741685 0.58% 0.89%
IBH25 - Capitalisation USD 59100871 LU2279743467 0.30% /
UA - Distribution USD 59098547 LU2279742576 0.58% 0.92%
A - Distribution CHF 59100935 LU2279744358 1.08% 1.40%
AH - Distribution CHF 59100829 LU2279745918 1.08% 1.44%
DAH - Distribution CHF 59100937 LU2279746130 0.00% 0.15%
UA - Distribution CHF 59100818 LU2279745751 0.58% 0.91%
UAH - Distribution CHF 59100909 LU2279747450 0.58% 1.00%
EBH - Capitalisation CHF 59100883 LU2279746999 0.58% 0.98%
EBH - Capitalisation EUR 110589165 LU2320773794 0.58% /
There is no management fee for -DA- and -DAH- share classes. Credit Suisse Investment Partners (Lux) Convert International Bond Fund was launched on 11.03.2021. Credit Suisse Investment Partners (Lux) Convert International Bond Fund -EBH- CHF was launched on 22.04.2021. Credit Suisse Investment Partners (Lux) Convert International Bond Fund -DA- USD was launched on 02.08.2021. Credit Suisse Investment Partners (Lux) Convert International Bond Fund -EBH- EUR was launched on 15.09.2021. Credit Suisse Investment Partners (Lux) Convert International Bond Fund -IBH25- USD was launched on 30.09.2021. No TER is disclosed for share classes launched less than 6 months before closing.
Fund Performance
YTD Since Inception
A - Distribution USD / 1.55%
DA - Distribution USD / 1.07%
IA - Distribution USD / 1.87%
IBH25 - Capitalisation USD / 2.14%
UA - Distribution USD / 1.88%
A - Distribution CHF / -0.13%
AH - Distribution CHF / 1.43%
DAH - Distribution CHF / 2.27%
UA - Distribution CHF / 0.19%
UAH - Distribution CHF / 1.73%
EBH - Capitalisation CHF / 0.76%
EBH - Capitalisation EUR / 0.12%
Notes
Forward foreign exchange contracts
Purchases Sales Maturity Valuation
Counterparty (In USD)
USD 300 EUR -258 09.11.2021 1.27
Credit Suisse (Schweiz) AG - Zurich - Switzerland
USD 3,000,000 CHF -2,783,820 09.11.2021 -47,545.64
Credit Suisse (Schweiz) AG - Zurich - Switzerland
USD 905,417 JPY -101,000,000 09.11.2021 19,578.44
Credit Suisse (Schweiz) AG - Zurich - Switzerland
USD 433,448 CHF -404,000 09.11.2021 -8,824.90
Credit Suisse (Schweiz) AG - Zurich - Switzerland
USD 3,989,385 EUR -3,440,000 09.11.2021 7,614.58
Credit Suisse (Schweiz) AG - Zurich - Switzerland
USD 346,715 HKD -2,700,000 09.11.2021 -380.94
Credit Suisse (Schweiz) AG - Zurich - Switzerland
EUR 184 CHF -200 09.11.2021 -5.61
Credit Suisse (Schweiz) AG - Zurich - Switzerland
EUR 7,776 USD -9,200 09.11.2021 -198.88
Credit Suisse (Schweiz) AG - Zurich - Switzerland

CS Investment Funds 1 • Audited Annual Report as at 31.10.2021
Credit Suisse Investment Partners (Lux) Convert International Bond Fund (since 11.03.2021) Page 110
Technical Data and Notes (Continued)
Forward foreign exchange contracts
Purchases Sales Maturity Valuation
Counterparty (In USD)
EUR 193 JPY -25,000 09.11.2021 4.69
Credit Suisse (Schweiz) AG - Zurich - Switzerland
CHF 2,708,688 EUR -2,500,000 09.11.2021 71,567.44
Credit Suisse (Schweiz) AG - Zurich - Switzerland
CHF 4,579,165 USD -5,000,000 09.11.2021 12,995.09
Credit Suisse (Schweiz) AG - Zurich - Switzerland
CHF 1,631,141 HKD -14,000,000 09.11.2021 -14,080.28
Credit Suisse (Schweiz) AG - Zurich - Switzerland
CHF 96,957,622 USD -107,000,000 09.11.2021 -856,612.89
Credit Suisse (Schweiz) AG - Zurich - Switzerland
CHF 17,900,680 EUR -16,700,000 09.11.2021 266,443.64
Credit Suisse (Schweiz) AG - Zurich - Switzerland
CHF 2,725,003 JPY -330,000,000 09.11.2021 88,843.79
Credit Suisse (Schweiz) AG - Zurich - Switzerland
CHF 1,324,147 GBP -1,050,000 09.11.2021 10,303.82
Credit Suisse (Schweiz) AG - Zurich - Switzerland
Net unrealised loss on forward foreign exchange contracts -450,296.38

CS Investment Funds 1 • Audited Annual Report as at 31.10.2021
Credit Suisse Investment Partners (Lux) Convert International Bond Fund (since 11.03.2021) Page 111
Statement of Net Assets (in USD) and Fund Evolution
The notes are an integral part of the financial statements.
31.10.2021
Assets
Investments in securities at market value 214,441,897.04Cash at banks and at brokers 11,335,387.50Income receivable 312,164.83
226,089,449.37
Liabilities
Provisions for accrued expenses 69,408.19Net unrealised loss on forward foreign exchange contracts 450,296.38
519,704.57
Net assets 225,569,744.80
Fund Evolution 31.10.2021
Total net assets USD 225,569,744.80
Net asset value per share
A - Distribution USD 511.18
DA - Distribution USD 1,010.77
IA - Distribution USD 1,763.27
IBH25 - Capitalisation USD 1,022.73
UA - Distribution USD 158.65
A - Distribution CHF 305.89
AH - Distribution CHF 146.16
DAH - Distribution CHF 1,875.57
UA - Distribution CHF 152.92
UAH - Distribution CHF 141.53
EBH - Capitalisation CHF 1,017.60
EBH - Capitalisation EUR 1,001.88
Number of shares outstanding At the end of the year At the beginning of
the year
Number of shares
issued
Number of shares
redeemed
A - Distribution USD 6,799.415 0.000 7,482.415 683.000
DA - Distribution USD 12,000.000 0.000 12,000.000 0.000
IA - Distribution USD 9,134.087 0.000 9,134.087 0.000
IBH25 - Capitalisation USD 25,000.000 0.000 25,000.000 0.000
UA - Distribution USD 6,524.000 0.000 8,274.000 1,750.000
A - Distribution CHF 46,962.300 0.000 49,833.361 2,871.061
AH - Distribution CHF 104.327 0.000 868.327 764.000
DAH - Distribution CHF 68,834.105 0.000 70,172.979 1,338.874
UA - Distribution CHF 46,003.088 0.000 49,922.831 3,919.743
UAH - Distribution CHF 1,530.478 0.000 1,810.478 280.000
EBH - Capitalisation CHF 2,042.920 0.000 2,042.920 0.000
EBH - Capitalisation EUR 10.000 0.000 10.000 0.000

CS Investment Funds 1 • Audited Annual Report as at 31.10.2021
Credit Suisse Investment Partners (Lux) Convert International Bond Fund (since 11.03.2021) Page 112
Statement of Operations / Changes in Net Assets (in USD)
The notes are an integral part of the financial statements.
For the period from
11.03.2021 (inception date)
to 31.10.2021
Net assets at the beginning of the period 0.00
Income
Interest on investments in securities (net) 592,480.11
Dividends (net) 367,848.65
Securities lending income 7,166.98
967,495.74
Expenses
Management fee 313,772.41
Depositary fee 66,960.37
Administration expenses 20,941.08
Printing and publication expenses 4,936.49
Interest and bank charges 13,150.98
Audit, control, legal, representative bank and other expenses 36,739.33
"Taxe d'abonnement" 18,424.08
474,924.74
Net income (loss) 492,571.00
Realised gain (loss)
Net realised gain (loss) on sales of investments -581,713.44
Net realised gain (loss) on forward foreign exchange contracts 1,997,206.11
Net realised gain (loss) on foreign exchange 284,828.14
1,700,320.81
Net realised gain (loss) 2,192,891.81
Change in net unrealised appreciation (depreciation)
Change in net unrealised appreciation (depreciation) on investments 4,057,164.24
Change in net unrealised appreciation (depreciation) on forward foreign exchange contracts -450,296.38
3,606,867.86
Net increase (decrease) in net assets as a result of operations 5,799,759.67
Subscriptions / Redemptions
Subscriptions 224,829,042.99
Redemptions -5,059,057.86
219,769,985.13
Net assets at the end of the period 225,569,744.80

CS Investment Funds 1 • Audited Annual Report as at 31.10.2021
Credit Suisse Investment Partners (Lux) Convert International Bond Fund (since 11.03.2021) Page 113
Statement of Investments in Securities
The notes are an integral part of the financial statements. Any differences in the percentage of Net Assets are the result of roundings.
Breakdown by Country
USA 56.27
Cayman Islands 6.17
France 3.73
Japan 3.37
Luxembourg 2.77
Netherlands 2.72
Germany 2.15
Canada 1.89
Italy 1.89
Spain 1.59
Switzerland 1.53
Virgin Islands (UK) 1.52
Israel 1.18
Liberia 1.00
Taiwan 1.00
Jersey 0.84
Belgium 0.78
South Korea 0.71
Bermuda 0.60
United Kingdom 0.57
Panama 0.42
Hong Kong 0.37
New Zealand 0.36
People's Republic of China 0.36
Finland 0.29
Singapore 0.28
Denmark 0.22
United Arab Emirates 0.18
Australia 0.16
Sweden 0.13
Austria 0.00
Total 95.07
Breakdown by Economic Sector
Internet, software and IT services 21.23
Financial, investment and other div. companies 12.95
Pharmaceuticals, cosmetics and medical products 6.74
Energy and water supply 5.58
Electronics and semiconductors 4.33
Telecommunication 3.59
Graphics publishing and printing media 3.46
Retailing, department stores 3.03
Miscellaneous services 2.81
Lodging and catering industry, leisure facilities 2.76
Mining, coal and steel industry 2.50
Traffic and transportation 2.43
Chemicals 2.39
Electrical appliances and components 2.38
Banks and other credit institutions 2.13
Computer hardware and networking 1.67
Vehicles 1.61
Mechanical engineering and industrial equipment 1.58
Biotechnology 1.56
Real estate 1.42
Miscellaneous consumer goods 1.40
Precious metals and precious stones 1.10
Non-ferrous metals 1.09
Textiles, garments and leather goods 0.99
Petroleum 0.99
Building materials and building industry 0.81
Healthcare and social services 0.56
Food and soft drinks 0.55
Aeronautic and astronautic industry 0.51
Environmental services and recycling 0.29
Investment trusts/funds 0.25
Tobacco and alcoholic beverages 0.18
Rubber and tires 0.18
Total 95.07
Statement of Investments in Securities
Description Quantity /
Nominal
Valuation
(in USD)
% of net
assets
Securities listed on a stock exchange or other organised
markets
Shares
USD AMERICAN EAGLE OUTFITTERS 20,000 474,800.00 0.21USD BROADCOM INC 800 425,336.00 0.19EUR CA-IMMOBILIEN-ANLAGEN AG RTS 100,000 0.00 0.00USD COLONY CAPITAL INC 20,000 134,000.00 0.06USD DANAHER 1,500 467,655.00 0.21USD ENVISTA HOLDINGS CORP 11,000 430,100.00 0.19USD ILLUMINA 400 166,024.00 0.07USD NUANCE COMMUNICATIONS 5,000 275,250.00 0.12USD PENN NATIONAL GAMING 5,000 358,000.00 0.16USD SEA LTD ADR A 1,000 343,570.00 0.15JPY SONY 3,000 345,713.61 0.15USD SQUARE A 1,926 490,167.00 0.22
Total Shares 3,910,615.61 1.73
Bonds
USD 1LIFE HEALTHCARE INC CV 3%/20-150625 300,000 291,072.00 0.13USD 21VIANET GROUP INC CV 144A 0%/21-010226 300,000 247,926.00 0.11USD 2U INC CV 2.25%/20-010525 300,000 383,427.00 0.17USD ABU DHABI NATIONAL OIL CV 0.7%/21-040624 400,000 398,240.00 0.18USD ACCELERATE DIAGNOSTICS CV 2.5%/18-150323 250,000 175,215.00 0.08USD ADM AG HOLDING LTD CV 0%/20-260823 200,000 209,580.00 0.09USD AERIE PHARMACEUTICALS CV 1.5%/19-011024 250,000 224,002.50 0.10USD AKAMAI TECHNOLOGIES INC CV 0.125%/18-
010525 400,000 489,784.00 0.22
USD AKAMAI TECHNOLOGIES INC CV 0.375%/19-010927
1,200,000 1,319,196.00 0.58
USD ALARM.COM HLDGS INC CV 144A 0%/21-150126 300,000 276,147.00 0.12USD ALGONQUIN PWR & CV 7.75%/21-150624 10,000 482,200.00 0.21EUR AMADEUS IT GROUP SA CV 1.5%/20-090425 300,000 461,232.40 0.20EUR ANLLIAN CAPITAL LTD CV 0%/20-050225 800,000 1,180,385.74 0.52USD APTIV PLC S A CV 5.5%/20-150623 5,000 966,000.00 0.43USD ARCELORMITTAL SA SUB CV 5.5%/20-180523 18,000 1,453,320.00 0.64EUR ARCHER OBLIGATIONS CV 0%/17-310323 300,000 552,414.44 0.24USD ARES CAPITAL CORP CV 4.625%/19-010324 500,000 570,040.00 0.25USD ASAHI REFINING US INC CV 0%/21-160326 500,000 509,580.00 0.23EUR ATOS SE CV 0%/19-061124 600,000 744,627.88 0.33USD AVALARA INC CV 144A 0.25%/21-010826 1,000,000 1,046,240.00 0.46USD AVANTOR INC S A CV 6.25%/19-150522 8,000 990,240.00 0.44USD AVAYA HOLDINGS CORP CV 2.25%/18-150623 200,000 206,576.00 0.09USD BANDWIDTH INC CV 0.25%/20-010326 250,000 290,562.50 0.13USD BANK OF AMERICA CORP S L CV 7.25%/PERPET 600 859,332.00 0.38EUR BASIC-FIT NV CV 1.5%/21-170628 300,000 369,265.75 0.16EUR BE SEMICONDUCTOR CV 0.75%/20-05.08.2027 400,000 778,246.00 0.35USD BECTON DICKINSON AND CO SB CV 6%/010623 12,000 631,200.00 0.28USD BENTLEY SYSTEMS CV 144A 0.375%/21-010727 1,500,000 1,518,180.00 0.67USD BEYOND MEAT INC CV 144A 0%/21-150327 400,000 334,336.00 0.15USD BIGCOMMERCE HOLDINGS CV 0.25%/21-011026 800,000 793,784.00 0.35USD BILIBILI INC CV 1.25%/20-150627 600,000 1,171,620.00 0.52USD BILL.COM HOLDINGS CV 144A 0%/20-011225 500,000 966,825.00 0.43USD BILL.COM HOLDINGS INC CV 0%/21-010427 300,000 322,239.00 0.14USD BLACKLINE INC CV 144A 0%/21-150326 1,300,000 1,326,910.00 0.59USD BOFA FINANCE LLC S A CV 0.125%/20-010922 800,000 917,320.00 0.41USD BOOKING HOLDINGS INC CV 0.75%/20-010525 500,000 742,130.00 0.33USD BOSIDENG INTERNATIONAL CV 1%/19-171224 200,000 282,122.00 0.13USD BOSTON SCIENTIFIC CORP SA CV 5.5%/010623 10,000 1,170,400.00 0.52USD BOX INC CV 144A 0%/21-150126 600,000 716,052.00 0.32USD BRENNTAG FINANCE CV 1.875%/15-021222 500,000 600,935.00 0.27USD BRIDGEBIO PHARMA INC CV 2.5%/20-150327 200,000 287,800.00 0.13USD BROADCOM INC SUB S A CV 8%/19-300922 1,500 2,516,010.00 1.12USD BURLINGTON STORES INC CV 2.25%/20-150425 400,000 573,480.00 0.25USD CABLE ONE INC CV 144A 1.125%/21-150328 500,000 493,705.00 0.22USD CARNIVAL CORP CV 5.75%/20-010423 200,000 459,610.00 0.20HKD CATHAY PACIFIC FIN III 2.75%/21-050226 4,000,000 536,209.77 0.24EUR CELLNEX TELECOM S.A. CV 0.5%/19-050728 2,000,000 3,136,332.66 1.39USD CERIDIAN HCM HLDG INC CV 0.25%/21-150326 500,000 574,210.00 0.25USD CHEESECAKE FACTORY INC CV 0.375%/21-1506 200,000 181,948.00 0.08USD CHEGG INC CV 0%/20-010926 700,000 651,889.00 0.29USD CHENIERE ENERGY CV 4.25%/15-150345 500,000 424,760.00 0.19USD CHINA HONGQIAO GROUP CV 5.25%/21-250126 400,000 526,772.00 0.23HKD CHINA YUHUA CV 0.9%/19-271224 4,000,000 495,053.05 0.22USD CIE GEN ETABLIS MICHELIN CV 0%/18-101123 400,000 409,892.00 0.18USD CINEMARK HOLDINGS INC CV 4.5%/20-010825 200,000 316,734.00 0.14EUR CITIGROUP CV 0.5%/16-040823 400,000 513,522.74 0.23HKD CITIGROUP GLOB MK L S960 CV 0%/20-250724 5,000,000 696,640.77 0.31USD CLEVELAND-CLIFFS INC CV 1.5%/17-150125 200,000 622,090.00 0.28USD CLOUDFLARE INC CV 144A 0%/21-150826 1,000,000 1,261,320.00 0.56USD CNX RESOURCES CORPORATION CV-010526 200,000 273,552.00 0.12USD COINBASE GLOBAL INC CV 0.5%/21-010626 500,000 591,575.00 0.26USD CONMED CV 2.625%/19-010224 250,000 428,555.00 0.19USD COPA HOLDINGS SA CV 4.5%/20-150425 300,000 483,591.00 0.21USD COUPA SOFTWARE INC CV 0.375%/20-150626 1,500,000 1,649,370.00 0.73USD CRACKER BAR OLD CNT CV 0.625%/21-150626 300,000 294,108.00 0.13USD CREE INC CV 0.875%/18-010923 450,000 904,729.50 0.40USD CYBERARK SOFTWARE LTD CV 0%/19-151124 500,000 647,365.00 0.29USD DANAHER CORP S A CV 4.75%/19-150422 1,200 2,502,300.00 1.11USD DATADOG INC CV 0.125%/20-150625 500,000 947,465.00 0.42EUR DELIVERY HERO AG CV 0.25%/20-230124 1,100,000 1,576,312.21 0.70GBP DERWENT LONDON CAPITAL 3 CV 1.5%/120625 300,000 413,209.11 0.18EUR DEUTSCHE POST AG CV 0.05%/17-300625 400,000 545,661.89 0.24USD DEXCOM CV 0.75%/18-011223 300,000 1,133,448.00 0.50USD DEXCOM INC CV 0.25%/20-151125 1,200,000 1,535,628.00 0.68EUR DIASORIN SPA CV 0%/21-050528 500,000 680,532.44 0.30

CS Investment Funds 1 • Audited Annual Report as at 31.10.2021
Credit Suisse Investment Partners (Lux) Convert International Bond Fund (since 11.03.2021) Page 114
Statement of Investments in Securities (Continued)
The notes are an integral part of the financial statements. Any differences in the percentage of Net Assets are the result of roundings.
Description Quantity /
Nominal
Valuation
(in USD)
% of net
assets
USD DICK'S SPORTING GOODS CV 3.25%/20-150425 300,000 1,141,548.00 0.51USD DISH NETWORK CORP CV 144A 0%/20-151225 1,800,000 2,066,616.00 0.92USD DOMINION ENERGY INC S A CV 7.25%/19-0106 3,000 300,720.00 0.13USD DROPBOX INC CV 144A 0%/21-010328 1,000,000 1,091,450.00 0.48USD DTE ENERGY CO CV 0%/19-011122 5,000 252,400.00 0.11EUR EDENRED CV 0%/21-140628 15,000 1,130,870.49 0.50JPY EDION CV 0%/15-190625 60,000,000 561,234.74 0.25USD ELANCO ANIMAL HEALTH INC CV 5%/20-010223 12,000 608,160.00 0.27EUR ELECTRICITE DE FRANCE SA CV 0%/20-
14.09.2024 70,000 1,215,355.52 0.54
EUR ELIOTT CAPITAL SARL CV 0%/19-301222 500,000 579,058.97 0.26USD ELM BV CV 3.25%/18-130624 400,000 439,624.00 0.19USD ENVESTNET INC CV 1.75%/18-010623 400,000 525,800.00 0.23USD EQT CORP CV 1.75%/20-010526 300,000 468,744.00 0.21USD ESR CAYMAN LTD CV 1.5%/20-300925 500,000 515,660.00 0.23USD ESSENTIAL UTILITIES INC CV 6%/19-300422 7,000 404,320.00 0.18USD ETSY INC CV 0.125%/20-010927 900,000 1,331,793.00 0.59USD ETSY INC CV 144A 0.25%/21-150628 500,000 635,650.00 0.28USD EVERBRIDGE INC CV 0.125%/19-151224 300,000 455,910.00 0.20USD EXACT SCIENCES CORP CV 0.375%/20-010328 1,100,000 1,179,717.00 0.52EUR FALCK RENEWABLES SPA CV 0%/20-230925 300,000 516,912.33 0.23USD FARFETCH LTD CV 3.75%/20-010527 200,000 516,742.00 0.23USD FINE PERFECTION INVSTMNT CV 0%/21-170422 600,000 614,886.00 0.27USD FIREEYE INC CV 0.875%/18-010624 250,000 263,330.00 0.12USD FIRST MAJESTIC SILVER CV 1.875%/18-01032 300,000 434,871.00 0.19USD FISKER INC CV 144A 2.5%/21-150926 300,000 315,282.00 0.14USD FIVE9 INC CV 0.5%/20-010625 400,000 535,780.00 0.24USD FIVERR INTERNATIONAL CV 0%/20-011125 500,000 553,315.00 0.25AUD FLIGHT CENTRE LTD CV 2.5%/20-171127 400,000 364,575.62 0.16USD FORD MOTOR COMPANY CV 144A 0%/21-
150326 1,300,000 1,532,141.00 0.68
USD GDS HOLDINGS LIMITED CV 2%/18-010625 100,000 136,704.00 0.06EUR GEELY SWEDEN FINANCE AB CV 0%/19-190624 200,000 301,509.92 0.13USD GFL ENVIRONMENTAL INC CV 6%/20-150323 7,000 660,380.00 0.29USD GLENCORE FUNDING LLC CV 0%/18-270325 1,000,000 1,036,690.00 0.46USD GLOBALWAFERS CO LTD CV 0%/21-010626 1,000,000 1,036,580.00 0.46EUR GN STORE NORD CV 0%/19-210524 400,000 498,617.36 0.22USD GREENBRIER COS CV 144A 2.875%/21-150428 250,000 259,890.00 0.12USD GUARDANT HEALTH INC CV 144A 0%/20-151127 700,000 774,137.00 0.34USD GUESS INC CV 2%/19-150424 500,000 554,575.00 0.25USD GUIDEWIRE SOFTWARE INC CV 1.25%/18-15032 300,000 373,023.00 0.17USD HAEMONETICS CORP CV 144A 0%/21-010326 400,000 350,364.00 0.16EUR HELLOFRESH SE CV 0.75%/20-130525 500,000 902,585.57 0.40USD HON HAI PRECISION INDUST CV 0%/21-050826 500,000 513,275.00 0.23USD HUAZHU GROUP LTD CV 0.375%/17-011122 300,000 341,094.00 0.15USD HUBSPOT INC CV 0.375%/20-010625 200,000 574,992.00 0.25USD IAC FINANCECO 2 CV 144A 0.875%/150626 400,000 726,392.00 0.32USD IAC FINANCECO 3 INC CV 2%/19-150130 300,000 586,377.00 0.26EUR IBERDROLA CV 0%/15-111122 500,000 714,914.33 0.32USD II-VI INC CV 0.25%/17-010922 300,000 403,074.00 0.18USD II-VI INC CV 6%/20-010723 2,000 513,400.00 0.23USD INSIGHT ENTERPRISES INC CV 0.75%/19-1502 250,000 363,287.50 0.16USD INSMED INC CV 0.75%/21-010628 500,000 581,445.00 0.26USD INSULET CORP CV 0.375%/20-010926 600,000 889,212.00 0.39USD INTEGRA LIFESCIENCES HLD CV 0.5%/20-1508 700,000 760,060.00 0.34USD INTERDIGITAL INC CV 2%/19-010624 700,000 753,872.00 0.33USD INVITAE CORP CV 2%/19-010924 200,000 235,800.00 0.10USD IQIYI INC CV 4%/20-151226 300,000 262,017.00 0.12USD IVANHOE MINES LTD CV 144A 2.5%/21-150426 500,000 649,930.00 0.29USD J2 GLOBAL CV 144A 1.75%/19-011126 750,000 1,019,835.00 0.45USD JAZZ INVESTMENTS I LTD CV 2%/20-150626 600,000 697,254.00 0.31USD JETBLUE AIRWAYS CV 144A 0.5%/21-010426 500,000 482,890.00 0.21USD JOHN BEAN TECHNOLOGIES C 0.25%/21-
150526 400,000 436,240.00 0.19
EUR JP MORGAN CHASE BANK NA CV 0%/21-100624 200,000 255,349.53 0.11EUR JP MORGAN CHASE BANK NA CV 0%/21-180224 600,000 771,096.51 0.34USD JPMORGAN CHASE FINANCIAL S A CV 0.25%/18 500,000 567,475.00 0.25USD KBR INC CV 144A 2.5%/18-011123 500,000 851,660.00 0.38HKD KINGSOFT CORP LTD CV 0.625%/20-290425 2,000,000 304,890.89 0.14USD KKR & CO INC S C CV 6%/20-150923 10,000 1,000,400.00 0.44EUR KLOECKNER & CO CV 2%/16-080923 400,000 506,134.86 0.22EUR LAGFIN SCA CV 2%/20-020725 600,000 896,940.50 0.40USD LCI INDUSTRIES CV 144A 1.125%/21-150526 500,000 525,300.00 0.23EUR LEG IMMOBILIEN CV 0.875%/17-010925 200,000 288,106.65 0.13USD LENOVO GROUP LTD CV 3.375%/19-24.01.2024 600,000 833,022.00 0.37USD LG DISPLAY CO LTD CV 1.5%/19-220824 400,000 441,644.00 0.20USD LI AUTO INC CV 144A 0.25%/21-010528 300,000 400,953.00 0.18USD LIBERTY MEDIA CORP CV 1%/17-300123 300,000 458,847.00 0.20USD LIBERTY MEDIA CORP CV 2.75%/19-011249 300,000 310,182.00 0.14USD LIBERTY MEDIA CORP CV144A 0.5%/20-011250 1,400,000 1,785,392.00 0.79USD LIVEPERSON INC CV -144A- 0%/20-15.12.2026 500,000 489,290.00 0.22USD LIVONGO HEALTH CV 0.875%/20-010625 600,000 875,694.00 0.39USD LUMENTUM HOLDINGS INC CV 0.5%/19-151226 1,000,000 1,089,580.00 0.48USD LYFT INC CV 1.5%/20-150525 200,000 278,606.00 0.12USD MARRIOTT VACATION WORLDW CV 144A 0%/21-
150126 700,000 788,368.00 0.35
USD MERCADOLIBRE INC CV 2%/18-150828 200,000 675,602.00 0.30JPY MERCARI INC CV 0%/21-140728 40,000,000 376,619.11 0.17USD MICROCHIP TECH SUB CV 0.125%/20-151124 1,000,000 1,117,830.00 0.50USD MICROPORT SCIENTIFIC CV 0%/21-110626 700,000 599,494.00 0.27USD MICROSTRATEGY INC CV 0.75%/20-151225 250,000 484,327.50 0.21USD MICROSTRATEGY INC CV -144A- 0%/21-
15.02.2027 500,000 412,965.00 0.18
USD MIDDLEBY CORP CV 1%/20-010925 400,000 602,020.00 0.27JPY MITSUBISHI CHEMICAL HOLD CV 0%/17-290424 100,000,000 923,718.35 0.41USD MONGODB INC CV 0.25%/20-150126 400,000 1,004,224.00 0.45USD MP MATERIALS COR CV 144A 0.25%/21-010426 750,000 789,217.50 0.35USD NATIONAL VISION HOLDINGS CV 2.5%/20-1505 200,000 412,586.00 0.18USD NCL CORPORATION LTD CV 5.375%/20-010825 400,000 665,200.00 0.29USD NEUROCRINE BIOSCIENCE CV 2.25%/17-150524 300,000 422,367.00 0.19
Description Quantity /
Nominal
Valuation
(in USD)
% of net
assets
EUR NEXI SPA CV 0%/21-240228 800,000 874,390.33 0.39USD NEXTERA ENERGY INC CV 4.872%/19-010922 45,000 2,844,900.00 1.26USD NEXTERA ENERGY INC CV 5.279%/20-010323 10,000 544,700.00 0.24USD NEXTERA ENERGY PARTNERS CV 0%/20-151125 600,000 694,932.00 0.31USD NICE LTD CV 0%/20-150925 1,000,000 1,172,730.00 0.52JPY NIPPON STEEL CORP CV 0%/21-051026 150,000,000 1,375,277.16 0.61USD NISOURCE INC CV 7.75%/21-010324 3,000 321,690.00 0.14USD NORTONLIFELOCK INC CV 144A 2%/16-150822 300,000 383,478.00 0.17USD NOVAVAX INC CV 3.75%/16-010223 200,000 273,938.00 0.12USD NOVOCURE LTD CV 144A 0%/20-011125 500,000 510,170.00 0.23USD NUVASIVE INC CV 0.375%/20-150325 300,000 284,313.00 0.13USD OAK STREET HEALTH CV 144A 0%/21-150326 500,000 467,480.00 0.21GBP OCADO GROUP PLC CV 0.75%/20-180127 400,000 529,775.72 0.23USD OKTA INC CV 0.375%/20-150626 1,000,000 1,251,070.00 0.55EUR OLIVER CAPITAL SARL CV 0%/20-291223 1,200,000 1,607,170.28 0.71USD OMNICELL INC CV 0.25%/20-150925 500,000 932,305.00 0.41USD ON SEMICONDUCTOR CORP CV 0%/21-010527 1,000,000 1,210,730.00 0.54USD OPENDOOR IN CV 144A 0.25%/21-150826 500,000 696,470.00 0.31EUR ORPAR CV 0%/17-200624 200,000 289,039.39 0.13EUR OUTOKUMPU OYJ CV 5%/20-090725 300,000 646,620.38 0.29USD PACIRA PHARMACEUTICALS CV 0.75%/20-01082 600,000 631,428.00 0.28USD PALO ALTO NETWORKS CV 0.375%/20-010625 500,000 874,675.00 0.39USD PALO ALTO NETWORKS CV 0.75%/18-010723 800,000 1,542,344.00 0.68USD PARSONS CORP CV 0.25%/20-150825 300,000 303,615.00 0.13USD PB ISSUER NO 5 LTD CV 3%/19-101225 200,000 356,536.00 0.16USD PEBBLEBROOK HOTEL TRUST CV 1.75%/20-
151226 800,000 892,848.00 0.40
USD PEGASYSTEMS INC CV 0.75%/20-010325 500,000 545,025.00 0.24USD PG&E CORP CV 5.5%/20-160823 7,000 791,700.00 0.35USD PHARMARON BEIJING CO CV 0%/21-180626 200,000 205,550.00 0.09USD PINDUODUO INC CV 0%/20-011225 1,000,000 937,080.00 0.42USD PIONEER NATURAL RESOURCE CV 0.25%/20-
150525 800,000 1,419,840.00 0.63
EUR PIRELLI & C SPA CV 0%/20-221225 600,000 739,121.69 0.33EUR POSCO CV 0%/21-010926 1,000,000 1,170,685.67 0.52EUR PRYSMIAN SPA CV 0%/21-020226 700,000 850,578.75 0.38USD PURE STORAGE INC CV 0.125%/18-150423 500,000 596,660.00 0.26USD Q2 HOLDINGS INC CV 0.75%/19-010626 200,000 222,298.00 0.10USD QIAGEN NV CV 0.5%/17-130923 400,000 551,104.00 0.24USD QTS REALTY TRUST INC S B CV 6.5%/PERPET 1,500 258,169.50 0.11USD RAPID7 INC CV 144A 0.25%/21-150327 250,000 343,442.50 0.15USD RBC BEARINGS INC S A CV 5%/21-151024 5,000 597,950.00 0.27USD REALOGY GRP/CO-ISSUER CV 0.25%/21-150626 250,000 254,247.50 0.11USD REDFIN CORP CV 0%/20-151025 400,000 407,664.00 0.18EUR REMY COINTREAU CV 0.125%/16-070926 2,000 408,259.28 0.18USD RINGCENTRAL INC CV 0%/20-150326 600,000 584,526.00 0.26JPY ROHM COMPANY LTD CV 0%/19-051224 50,000,000 475,071.19 0.21USD ROYAL CARIBBEAN CRUISES 2.875%/20-151123 1,800,000 2,254,680.00 1.00USD SABRE GLBL INC CV 4%/20-150425 250,000 393,592.50 0.17EUR SAFRAN SA CV 0.875%/20-150527 7,000 1,140,285.87 0.51EUR SAGERPAR CV 0%/21-010426 400,000 475,768.62 0.21USD SAILPOINT TECH HOLD CV 0.125%/19-150924 300,000 528,399.00 0.23USD SAREPTA THERAPEUTICS CV 1.5%/17-151124 250,000 337,792.50 0.15JPY SBI HOLDINGS INC CV 0%/18-130923 90,000,000 832,759.36 0.37EUR SCHNEIDER ELECTRIC SE CV 0%/20-150626 2,270 527,012.33 0.23USD SEA LTD CV 0.25%/21-150926 500,000 526,030.00 0.23USD SEA LTD CV 1%/19-011224 450,000 3,077,424.00 1.36USD SEA LTD CV 2.375%/20-011225 150,000 571,767.00 0.25EUR SELENA SARL CV 0%/20-250625 8 1,159,721.89 0.51USD SHIFT4 PAYMENTS INC CV 144A 0%/20-151225 300,000 324,069.00 0.14JPY SHIP HEALTHCARE HLDN CV 0%/18-131223 30,000,000 314,928.26 0.14USD SHOPIFY INC CV 0.125%/20-01.11.2025 500,000 632,865.00 0.28CHF SIKA AG CV 0.15%/18-050625 1,700,000 3,050,340.57 1.35USD SILICON LABORATORIESCV 0.625%/20-150625 300,000 482,220.00 0.21SGD SINGAPORE AIR LTD CV 1.625%/20-031225 750,000 624,583.52 0.28EUR SNAM 0% CV 17-200322 500,000 612,138.96 0.27USD SNAP INC CV 0.75%/20-010826 150,000 358,453.50 0.16USD SNAP INC CV 144A 0%/21-010527 2,000,000 2,026,660.00 0.90USD SOFI TECHNOLOGIES 144A 0%/21-151026 500,000 586,240.00 0.26USD SOLAR EDGE TECHNOLOGIES CV 0%/20-150925 400,000 591,872.00 0.26JPY SOSEI GROUP CORP CV 0.25%/21-270726 40,000,000 363,530.75 0.16USD SOUTHERN CO SUB CV 6.75%/19-010822 14,000 713,720.00 0.32USD SOUTHWEST AIRLINES CO CV 1.25%/20-010525 1,200,000 1,686,612.00 0.75USD SPLUNK INC CV 0.5%/18-150923 1,300,000 1,623,674.00 0.72USD SQUARE CV 0.125%/20-010325 500,000 1,069,850.00 0.47USD SQUARE INC CV 144A 0%/20-010526 1,000,000 1,175,440.00 0.52USD SSR MINING INC CV 2.5%/19-010439 1,200,000 1,406,256.00 0.62USD STANLEY BLACK & DECKER I 5.25%/19-151122 5,000 539,600.00 0.24USD STMICROELECTRONICS NV S B CV 0%/040827 1,200,000 1,551,000.00 0.69USD SUNNOVA ENERGY INT CV 0.25%/21-011226 250,000 356,117.50 0.16EUR TAG IMMOBILIEN AG CV 0.625%/20-270826 600,000 715,326.31 0.32EUR TAKEAWAY.COM NV CV 2.25%/19-250124 200,000 268,815.29 0.12USD TANDEM DIABETES CARE CV 1.5%/20-010525 400,000 556,988.00 0.25USD TWITTER INC CV 0.25%/18-150624 700,000 825,783.00 0.37USD TYLER TECHNOLOGIES 144A 0.25%/21-150326 600,000 730,638.00 0.32EUR UMICORE SA CV 0%/20-230625 1,000,000 1,283,691.14 0.57USD UNITED MICROELECTRONICS CV 0%/21-070726 300,000 298,506.00 0.13USD UNITED STATES STEEL CORP CV 5%/19-011126 300,000 651,000.00 0.29USD UNIVERSE TREK LTD CV 0%/21-150626 300,000 288,780.00 0.13USD UNIVERSE TREK LTD CV 2.5%/20-080725 200,000 222,158.00 0.10USD UPSTART HOLDINGS 144A 0.25%/21-150826 500,000 698,680.00 0.31USD UPWORK INC CV 144A 0.25%/21-150826 100,000 107,096.00 0.05USD VAIL RESORTS INC CV 144A 0%/20-010126 800,000 878,400.00 0.39EUR VEOLIA ENVIRONNEMENT SA CV 0%/19-010125 10,000 397,364.93 0.18USD VERINT SYSTEMS CV 144A 0.25%/21-150426 250,000 247,805.00 0.11USD VIAVI SOLUTIONS CV 1%/18-010324 300,000 386,418.00 0.17USD VINCI CV 0.375%/17-160222 400,000 445,200.00 0.20USD VIVA BIOTECH INVMT MNT CV 1%/20-301225 200,000 174,430.00 0.08GBP VODAFONE GROUP PLCSUB S B CV
1.5%/120322 600,000 761,346.30 0.34

CS Investment Funds 1 • Audited Annual Report as at 31.10.2021
Credit Suisse Investment Partners (Lux) Convert International Bond Fund (since 11.03.2021) Page 115
Statement of Investments in Securities (Continued)
The notes are an integral part of the financial statements. Any differences in the percentage of Net Assets are the result of roundings.
Description Quantity /
Nominal
Valuation
(in USD)
% of net
assets
USD VONAGE HOLDINGS CORP CV 1.75%/19-010624 350,000 409,682.00 0.18USD VROOM INC CV 144A 0.75%/21-010726 150,000 115,950.00 0.05USD WAYFAIR INC CV 0.625%/20-011025 1,500,000 1,478,790.00 0.66USD WAYFAIR INC CV 1%/19-150826 300,000 545,364.00 0.24USD WEIMOB INVESTMENT LTD CV 0%/21-070626 400,000 371,192.00 0.16USD WELLS FARGO C A S L CV 7.5%/09-PERPET 200 303,994.00 0.13USD WIN SEMICONDUCTORS CORP CV 0%/21-
140126 400,000 409,692.00 0.18
USD WIX LTD CV 0%/18-010723 200,000 283,536.00 0.13USD WORKDAY CV 0.25%/17-011022 500,000 988,075.00 0.44USD WORKIVA INC CV 1.125%/19-150826 250,000 494,555.00 0.22USD XD INC CV 1.25%/21-120426 500,000 500,240.00 0.22USD XERO INVESTMENTS LTD CV 0%/20-021225 800,000 819,952.00 0.36USD YANDEX N.V. CV 0.75%/20-03.03.2035 600,000 862,398.00 0.38EUR ZALANDO SE CV 0.625%/20-060827 600,000 815,132.18 0.36USD ZENDESK INC CV 0.625%/20-150625 500,000 586,190.00 0.26EUR ZHEJIANG EXPRESSWAY CO CV 0%/21-200126 500,000 609,182.19 0.27HKD ZHONGSHENG GROUP CV 0%/20-210525 3,000,000 618,924.29 0.27USD ZILLOW GROUP INC CV 2.75%/20-150525 1,000,000 1,738,800.00 0.77USD ZSCALER CV 0.125%/20-010725 600,000 1,294,878.00 0.57USD ZYNGA INC CV 0.25%/19-010624 600,000 681,432.00 0.30
Total Bonds 206,055,659.20 91.35
Total securities listed on a stock exchange or other
organised markets 209,966,274.81 93.08
Securities not listed on a stock exchange
Shares
USD VIACOMCBS INC B 6,000 217,320.00 0.10
Total Shares 217,320.00 0.10
Bonds
JPY CYBERAGENT INC CV 0%/18-170223 40,000,000 437,935.48 0.19CHF IDORSIA LTD CV 2.125%/21-040828 400,000 406,252.42 0.18USD MEITUAN CV/21-270428 1,000,000 1,000,250.00 0.44JPY MENICON CO LTD CV 0%/21-290125 70,000,000 760,106.89 0.34JPY NIPRO CORPORATION CV 0%/21-250926 50,000,000 451,514.95 0.20USD NRG ENERGY INC CV 2.75%/19-010648 300,000 348,408.00 0.15USD RH CV-150924 150,000 466,633.50 0.21JPY SEIREN CO LTD CV 0%/20-291225 10,000,000 112,085.05 0.05JPY SENKO GROUP HOLDINGS CO CV 0%/21-
180325 30,000,000 275,115.94 0.12
Total Bonds 4,258,302.23 1.89
Total securities not listed on a stock exchange 4,475,622.23 1.98
Total of Portfolio 214,441,897.04 95.07
Cash at banks and at brokers 11,335,387.50 5.03
Other net liabilities -207,539.74 -0.10
Total net assets 225,569,744.80 100.00
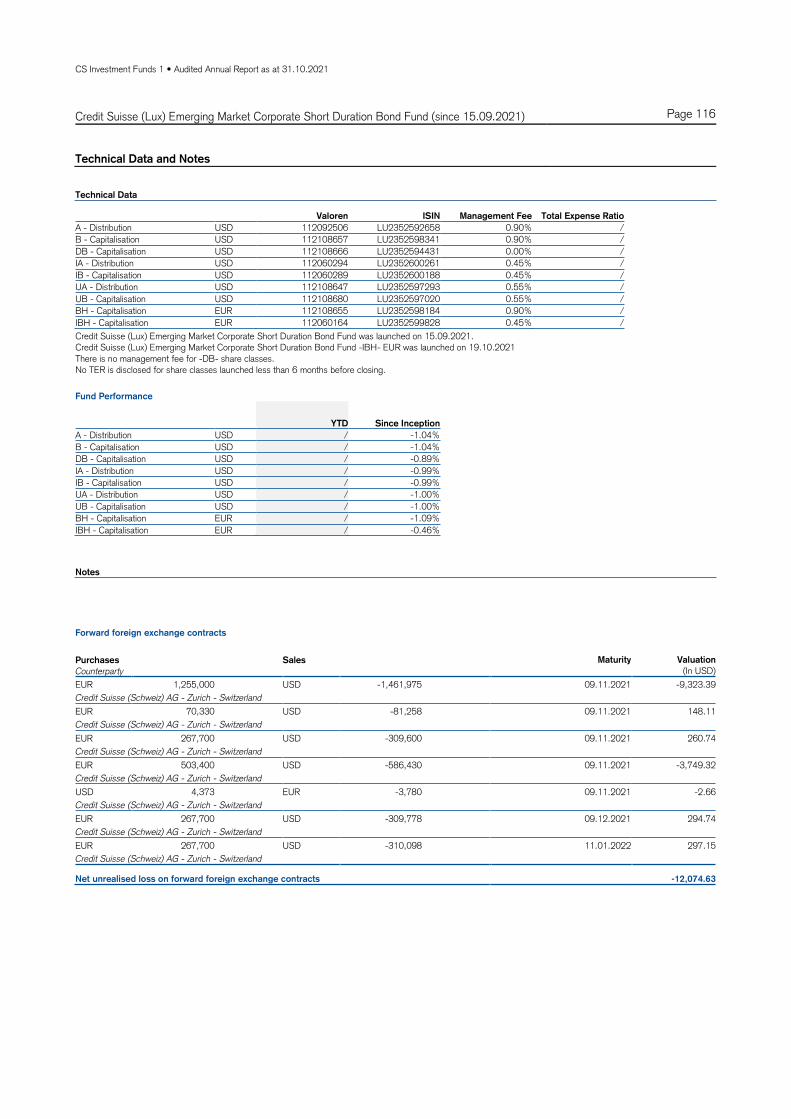
CS Investment Funds 1 • Audited Annual Report as at 31.10.2021
Credit Suisse (Lux) Emerging Market Corporate Short Duration Bond Fund (since 15.09.2021) Page 116
Technical Data and Notes
Technical Data
Valoren ISIN Management Fee Total Expense Ratio
A - Distribution USD 112092506 LU2352592658 0.90% /
B - Capitalisation USD 112108657 LU2352598341 0.90% /
DB - Capitalisation USD 112108666 LU2352594431 0.00% /
IA - Distribution USD 112060294 LU2352600261 0.45% /
IB - Capitalisation USD 112060289 LU2352600188 0.45% /
UA - Distribution USD 112108647 LU2352597293 0.55% /
UB - Capitalisation USD 112108680 LU2352597020 0.55% /
BH - Capitalisation EUR 112108655 LU2352598184 0.90% /
IBH - Capitalisation EUR 112060164 LU2352599828 0.45% /
Credit Suisse (Lux) Emerging Market Corporate Short Duration Bond Fund was launched on 15.09.2021. Credit Suisse (Lux) Emerging Market Corporate Short Duration Bond Fund -IBH- EUR was launched on 19.10.2021 There is no management fee for -DB- share classes. No TER is disclosed for share classes launched less than 6 months before closing.
Fund Performance
YTD Since Inception
A - Distribution USD / -1.04%
B - Capitalisation USD / -1.04%
DB - Capitalisation USD / -0.89%
IA - Distribution USD / -0.99%
IB - Capitalisation USD / -0.99%
UA - Distribution USD / -1.00%
UB - Capitalisation USD / -1.00%
BH - Capitalisation EUR / -1.09%
IBH - Capitalisation EUR / -0.46%
Notes
Forward foreign exchange contracts
Purchases Sales Maturity Valuation
Counterparty (In USD)
EUR 1,255,000 USD -1,461,975 09.11.2021 -9,323.39
Credit Suisse (Schweiz) AG - Zurich - Switzerland
EUR 70,330 USD -81,258 09.11.2021 148.11
Credit Suisse (Schweiz) AG - Zurich - Switzerland
EUR 267,700 USD -309,600 09.11.2021 260.74
Credit Suisse (Schweiz) AG - Zurich - Switzerland
EUR 503,400 USD -586,430 09.11.2021 -3,749.32
Credit Suisse (Schweiz) AG - Zurich - Switzerland
USD 4,373 EUR -3,780 09.11.2021 -2.66
Credit Suisse (Schweiz) AG - Zurich - Switzerland
EUR 267,700 USD -309,778 09.12.2021 294.74
Credit Suisse (Schweiz) AG - Zurich - Switzerland
EUR 267,700 USD -310,098 11.01.2022 297.15
Credit Suisse (Schweiz) AG - Zurich - Switzerland
Net unrealised loss on forward foreign exchange contracts -12,074.63

CS Investment Funds 1 • Audited Annual Report as at 31.10.2021
Credit Suisse (Lux) Emerging Market Corporate Short Duration Bond Fund (since 15.09.2021) Page 117
Statement of Net Assets (in USD) and Fund Evolution
The notes are an integral part of the financial statements.
31.10.2021
Assets
Investments in securities at market value 115,690,884.76Cash at banks and at brokers 3,652,650.55Income receivable 1,230,015.01
120,573,550.32
Liabilities
Provisions for accrued expenses 55,606.39Net unrealised loss on forward foreign exchange contracts 12,074.65
67,681.04
Net assets 120,505,869.28
Fund Evolution 31.10.2021
Total net assets USD 120,505,869.28
Net asset value per share
A - Distribution USD 98.96
B - Capitalisation USD 98.96
DB - Capitalisation USD 991.13
IA - Distribution USD 990.09
IB - Capitalisation USD 990.10
UA - Distribution USD 99.00
UB - Capitalisation USD 99.00
BH - Capitalisation EUR 98.91
IBH - Capitalisation EUR 995.44
Number of shares outstanding At the end of the period At the beginning of
the period
Number of shares
issued
Number of shares
redeemed
A - Distribution USD 70,278.167 0.000 70,278.167 0.000
B - Capitalisation USD 78,409.879 0.000 82,409.879 4,000.000
DB - Capitalisation USD 27,803.783 0.000 31,923.924 4,120.141
IA - Distribution USD 27,850.564 0.000 38,350.564 10,500.000
IB - Capitalisation USD 25,429.067 0.000 25,429.067 0.000
UA - Distribution USD 9,191.904 0.000 9,191.904 0.000
UB - Capitalisation USD 217,762.425 0.000 220,262.425 2,500.000
BH - Capitalisation EUR 8,730.418 0.000 8,730.418 0.000
IBH - Capitalisation EUR 1,750.000 0.000 1,750.000 0.000

CS Investment Funds 1 • Audited Annual Report as at 31.10.2021
Credit Suisse (Lux) Emerging Market Corporate Short Duration Bond Fund (since 15.09.2021) Page 118
Statement of Operations / Changes in Net Assets (in USD)
The notes are an integral part of the financial statements.
For the period from
15.09.2021 (inception date)
to 31.10.2021
Net assets at the beginning of the period 0.00
Income
Interest on investments in securities (net) 457,100.72
457,100.72
Expenses
Management fee 57,724.21
Depositary fee 7,838.46
Administration expenses 7,205.34
Printing and publication expenses 328.79
Audit, control, legal, representative bank and other expenses 23,717.38
"Taxe d'abonnement" 13,714.77
110,528.95
Net income (loss) 346,571.77
Realised gain (loss)
Net realised gain (loss) on sales of investments 154,803.95
Net realised gain (loss) on forward foreign exchange contracts -12,319.87
Net realised gain (loss) on foreign exchange -1,010.58
141,473.50
Net realised gain (loss) 488,045.27
Change in net unrealised appreciation (depreciation)
Change in net unrealised appreciation (depreciation) on investments -1,552,831.77
Change in net unrealised appreciation (depreciation) on forward foreign exchange contracts -12,074.63
-1,564,906.40
Net increase (decrease) in net assets as a result of operations -1,076,861.13
Subscriptions / Redemptions
Subscriptions 136,752,785.29
Redemptions -15,170,054.88
121,582,730.41
Net assets at the end of the period 120,505,869.28

CS Investment Funds 1 • Audited Annual Report as at 31.10.2021
Credit Suisse (Lux) Emerging Market Corporate Short Duration Bond Fund (since 15.09.2021) Page 119
Statement of Investments in Securities
The notes are an integral part of the financial statements. Any differences in the percentage of Net Assets are the result of roundings.
Breakdown by Country
Luxembourg 10.84
Cayman Islands 10.76
Turkey 6.22
Virgin Islands (UK) 5.89
Chile 5.65
Bermuda 5.28
Colombia 4.63
Mexico 4.44
Peru 4.31
India 4.04
Netherlands 3.86
Ireland 3.51
USA 3.32
Singapore 3.31
Ukraine 2.68
South Korea 2.28
Indonesia 1.98
Thailand 1.92
Uzbekistan 1.92
Georgia 1.42
Philippines 1.37
Brazil 1.25
Jersey 1.19
United Arab Emirates 0.86
Saudi-Arabia 0.83
Argentina 0.69
Hong Kong 0.68
People's Republic of China 0.64
Cyprus 0.22
Total 96.00
Breakdown by Economic Sector
Financial, investment and other div. companies 32.63
Banks and other credit institutions 21.37
Petroleum 9.60
Telecommunication 8.23
Countries and central governments 5.58
Real estate 5.37
Chemicals 2.57
Forestry, paper and forest products 2.16
Energy and water supply 1.68
Non-ferrous metals 1.31
Building materials and building industry 1.25
Miscellaneous services 1.19
Food and soft drinks 1.10
Electronics and semiconductors 0.97
Internet, software and IT services 0.53
Mining, coal and steel industry 0.30
Retailing, department stores 0.16
Total 96.00
Statement of Investments in Securities
Description Quantity /
Nominal
Valuation
(in USD)
% of net
assets
Securities listed on a stock exchange or other organised
markets
Bonds
USD ADCB FINANCE CAYMAN LTD 4%/18-29.03.2023 1,500,000 1,565,445.00 1.30USD AGILE GROUP HOLDINGS LTD 5.5%/21-170526 600,000 466,794.00 0.39USD ARAGVI FINANCE INTL 8.45%/21-290426 1,200,000 1,238,916.00 1.03USD ATENTO LUXCO 1 SA 8%/21-10.02.2026 1,500,000 1,599,090.00 1.33USD AUNA SA 6.5%/20-20.11.2025 1,500,000 1,564,350.00 1.30USD BAIDU 4.125%/15-30.06.2025 300,000 324,111.00 0.27USD BANCO DE CREDITO DEL PER 2.7%/19-
11.01.2025 1,000,000 1,027,450.00 0.85
USD BANCO DEL ESTADO -CHILE 2.704%/20-09.01.2025
1,000,000 1,030,630.00 0.86
USD BANCO INTERNAC DEL PERU 3.375%/18-180123 1,000,000 1,021,110.00 0.85USD BANCO SANTANDER (MEXICO) - INSTITUCION DE
BANCA MULTIPLE GRUPO FINANCIERO (REG -S-) 4.125%/12-09.11.2022
2,250,000 2,316,982.50 1.92
USD BANCO SANTANDER CHILE 2.7%/20-100125 1,000,000 1,030,280.00 0.85USD BANCOLOMBIA SA 3%/20-290125 1,000,000 1,011,200.00 0.84USD BANK OF PHILIPPINE ISLAN 2.5%/19-10.09.2024 600,000 623,124.00 0.52USD BANK RAKYAT INDONESIA 4.625%/18-200723 1,250,000 1,323,875.00 1.10USD BBVA BANCOMER SA TEXAS 1.875%/20-
18.09.2025 1,500,000 1,504,650.00 1.25
USD BHARAT PETROLEUM REG S 4.625%/12-251022 2,250,000 2,326,252.50 1.93USD BOC AVIATION LTD 2.75%/20-02.12.2023 1,000,000 1,028,660.00 0.85USD BOC AVIATION LTD 4%/19-250124 200,000 210,776.00 0.17USD BORETS FINANCE DAC 6%/20-17.09.2026 1,000,000 1,039,330.00 0.86USD CBQ FINANCE LTD 5%/18-24.05.2023 1,500,000 1,594,815.00 1.32USD CELULOSA ARAUCO Y CONSTITUCION 4.5%/14-
01.08.2024 500,000 533,115.00 0.44
USD CENTRAIS ELETRICAS BRASI 3.625%/040225 1,500,000 1,507,575.00 1.25USD CENTRAL CHINA REAL ESTATE (REG. -S-)
6.75%/16-08.11.2021 200,000 194,928.00 0.16
USD CHINA AOYUAN GROUP LTD 8.5%/19-230122 200,000 107,048.00 0.09USD CHINA CONSTRUCT BANK/HK S. -64- 1.25%/20-
04.08.2025 250,000 246,892.50 0.20
USD CHINA MERCHANTS BANK/HK 1.2%/20-10.09.2025
250,000 245,630.00 0.20
USD CIFI HOLDINGS GROUP 4.45%/21-170826 650,000 601,620.50 0.50USD COUNTRY GARDEN HLDGS 8%/18-27.01.2024 500,000 516,090.00 0.43USD CREDICORP LTD 2.75%/20-17.06.2025 1,000,000 1,018,780.00 0.85USD CREDIT BANK OF MOSCOW C 3.875%/21-
210926 1,500,000 1,463,385.00 1.21
USD CSN RESOURCES SA 7.625%/19-17.04.2026 1,500,000 1,584,060.00 1.31USD DAR AL-ARKAN SUKUK S 5 6.875%/18-210323 700,000 730,065.00 0.61USD DIB SUKUK LTD 2.95%/20-16.01.2026 600,000 622,692.00 0.52USD DIGICEL REG S 6.75%/15-010323 1,000,000 968,220.00 0.80USD ECOPETROL 4.125%/14-160125 500,000 518,280.00 0.43USD ECOPETROL 5.375%/15-26.06.2026 2,000,000 2,169,860.00 1.80USD EMBRAER NETHERLANDS 5.05%/15-150625 1,600,000 1,664,640.00 1.38USD EMIRATES NBD BANK PJSC 2.625%/20-180225 1,000,000 1,041,340.00 0.86USD EMPRESA NACIONAL DE TELECOMUNICACIONES
SA ENTEL (REG. -S-) 4.875%/13-30.10.2024 1,000,000 1,063,910.00 0.88
USD FAB SUKUK CO LTD 3.875%/19-22.01.2024 600,000 639,174.00 0.53USD FS LUXEMBOURG SARL 10%/20-15.12.2025 1,200,000 1,324,392.00 1.10USD GEOPARK LTD 6.5%/17-21.09.2024 1,200,000 1,237,740.00 1.03USD GLOBAL LOGISTIC PROPERTIES 3.875%/15-
04.06.2025 1,200,000 1,248,984.00 1.04
USD GOLD FIELDS OROGEN HOLD 5.125%/19-15.05.2024
1,502,000 1,612,442.06 1.34
USD GRAN TIERRA ENERGY INTL 6.25%/18-150225 850,000 791,222.50 0.66USD GRUPO BIMBO REG S 3.875%/14-270624 1,000,000 1,063,390.00 0.88USD GTLK EUROPE DAC 5.95%/19-17.04.2025 450,000 488,907.00 0.41USD HIDROVIAS INT FIN SARL 5.95%/18-240125 1,500,000 1,528,995.00 1.27USD ICBC B REGS 4.875%/15-210925 250,000 274,260.00 0.23USD INTERCEMENT FIN OP BV 5.75%/14-170724 400,000 373,252.00 0.31USD INVERSIONES CMPC REG S 4.375%/13-150523 2,000,000 2,072,860.00 1.72USD IRSA PROPIEDADES COMERCIALES (REG. -S-)
8.75%/16-23.03.2023 200,000 192,688.00 0.16
USD KENBOURNE INVEST SA 6.875%/19-261124 1,500,000 1,571,160.00 1.30USD KOC HOLDING (REG. -S-) 5.25%/16-15.03.2023 1,200,000 1,228,164.00 1.02USD KOC HOLDING AS 6.5%/19-110325 300,000 316,530.00 0.26USD KOSMOS ENERGY LTD 7.125%/19-04.04.2026 500,000 499,675.00 0.41USD KWG PROPERTY HOLDING (REG. -S-) 6%/17-
15.09.2022 500,000 437,515.00 0.36
USD LUKOIL INTERNATIONAL FINANCE (REG. -S-) 4.563%/13-24.04.2023
2,500,000 2,615,475.00 2.17
USD MAF GLOBAL SEC REG S 4.75%/14-070524 1,500,000 1,617,855.00 1.34USD MHP LUX SA 6.95%/18-030426 1,250,000 1,331,337.50 1.10USD MHP SE 7.75%/17-100524 250,000 270,517.50 0.22USD MIRAE ASSET DAEWOO CO 2.125%/20-300723 500,000 507,470.00 0.42USD MIRAE ASSET DAEWOO CO 2.625%/20-300725 700,000 713,874.00 0.59USD NATIONAL BANK OF UZBEKIS 4.85%/20-211025 2,250,000 2,316,240.00 1.92USD NEW METRO GLOBAL LTD 6.8%/20-050823 500,000 469,995.00 0.39USD NOOR SUKUK CO LTD 4.471%/18-24.04.2023 1,000,000 1,050,040.00 0.87USD ONGC VIDESH VANKORNEFT (REG. -S-)
2.875%/16-27.01.2022 1,500,000 1,506,210.00 1.25
USD PCCW HKT (REG. -S-) 3.75%/13-08.03.2023 2,500,000 2,585,400.00 2.15USD PETROPAVLOVSK 2016 8.125%/17-14.11.2022 1,400,000 1,437,534.00 1.19USD PETRORIO LUXEMBOURG 6.125%/21-090626 200,000 201,424.00 0.17USD PHILIPPINE NATIONAL BANK 4.25%/18-
27.04.2023 1,000,000 1,032,990.00 0.86
USD POLY REAL ESTATE FINANCE 3.875%/19-25.03.2024
750,000 775,942.50 0.64
USD POSCO 2.375%/19-12.11.2022 350,000 355,495.00 0.30

CS Investment Funds 1 • Audited Annual Report as at 31.10.2021
Credit Suisse (Lux) Emerging Market Corporate Short Duration Bond Fund (since 15.09.2021) Page 120
Statement of Investments in Securities (Continued)
The notes are an integral part of the financial statements. Any differences in the percentage of Net Assets are the result of roundings.
Description Quantity /
Nominal
Valuation
(in USD)
% of net
assets
USD PT BANK MANDIRI (PERSERO) TBK 3.75%/19-11.04.2024
750,000 788,940.00 0.65
USD PT BANK MANDIRI (PERSERO) TBK 4.75%/20-13.05.2025
250,000 274,602.50 0.23
USD PTT GLOBAL CHEM REG S 4.25%/12-190922 2,250,000 2,308,275.00 1.92USD QNB FINANCE LTD 3.5%/19-28.03.2024 600,000 633,888.00 0.53USD QNB FINANSBANK AS/TURKEY 6.875%/070924 1,500,000 1,610,025.00 1.34USD QTEL INTERNATIONAL (REG. -S-) 3.25%/12-
21.02.2023 1,500,000 1,546,680.00 1.28
USD REC LIMITED 3.5%/19-121224 500,000 522,150.00 0.43USD RELIANCE INDUSTRIES LTD 5.4%/12-14.02.2022 2,000,000 2,024,460.00 1.68USD RKPF OVERSEAS 2020 A LTD 5.2%/21-
12.01.2026 600,000 527,928.00 0.44
USD RONSHINE CHINA 10.5%/19-010322 400,000 221,800.00 0.18USD RUMO LUXEMBOURG SARL 5.875%/18-180125 250,000 258,392.50 0.21USD SAMBA FUNDING LTD 2.75%/19-02.10.2024 1,000,000 1,036,850.00 0.86USD SAUDI ARABIAN OIL CO 1.625%/20-24.11.2025 1,000,000 996,000.00 0.83USD SB CAPITAL REG S S 16 5.25%/13-230523 1,000,000 1,052,490.00 0.87USD SBERBANK (SUBORDINATED) (REG. -S-)
5.125%/12-29.10.2022 1,000,000 1,032,330.00 0.86
USD SHIMAO PROPERTY HLDGS 4.75%/17-030722 400,000 386,436.00 0.32USD SHIMAO PROPERTY HLDGS 6.125%/19-
21.02.2024 600,000 567,570.00 0.47
USD SINO OCEAN LAND IV 5.25%/19-30.04.2022 505,000 507,631.05 0.42USD SINO OCEAN LAND TRADE FINANCE I 6%/14-
30.07.2024 600,000 618,570.00 0.51
USD SK HYNIX INC 1.5%/21-19.01.2026 400,000 392,208.00 0.33USD SK HYNIX INC 3%/19-170924 750,000 782,340.00 0.65USD SOCIEDAD QUIMICA Y MINER 4.375%/14-
28.01.2025 1,000,000 1,072,130.00 0.89
USD SUAM FINANCE (REG -S-) 4.875%14-17.04.2024 1,750,000 1,883,140.00 1.56USD TBC BANK JSC 5.75%/19-19.06.2024 1,600,000 1,711,616.00 1.42USD TELECOM ARGENTINA SA 8.5%/20-06.08.2025 650,000 634,881.00 0.53USD TENCENT HOLD REG S T 4 3.8%/15-110225 300,000 320,106.00 0.27USD TOTAL PLAY TELECOM 7.5%/20-12.11.2025 450,000 468,949.50 0.39USD TUPRAS-TURKIYE PETROL RA 4.5%/17-
18.10.2024 450,000 447,264.00 0.37
USD TURK TELEKOMUNIKASYON AS 6.875%/19-28.02.2025
1,000,000 1,072,420.00 0.89
USD TURKCELL REG S 5.75%/15-151025 1,500,000 1,571,775.00 1.30USD TURKIYE VAKIFLAR BANKASI 5.25%/20-050225 800,000 787,776.00 0.65USD TURKIYE VAKIFLAR S 2018-2 5.75%/18-30012 200,000 204,626.00 0.17USD UKRAINE (REG. -S-) 7.75%/15-01.09.2023 1,000,000 1,067,340.00 0.89USD UKRAINE (REG. -S-) 7.75%/15-01.09.2025 500,000 541,125.00 0.45USD UKRAINE (REG. -S-) 7.75%/15-01.09.2026 1,500,000 1,619,520.00 1.34USD ULKER BISKUVI SANAYI AS 6.95%/20-301025 250,000 262,645.00 0.22USD USIMINAS INTERNAT S.A R.L. 5.875%/180726 1,500,000 1,579,215.00 1.31USD VANKE REAL ESTATE HK 4.15%/18-18.04.2023 600,000 618,378.00 0.51USD VOLCAN (REG. -S-) 5.375%/12-02.02.2022 400,000 401,732.00 0.33USD VOLCAN CIA MINERA SAA-CM 4.375%/21-
11.02.2026 1,200,000 1,175,364.00 0.98
USD YANLORD LAND HK CO LTD 5.125%/21-200526 200,000 195,116.00 0.16USD YUZHOU PROPERTIES 6%/17-25.01.2022 200,000 131,146.00 0.11
Total Bonds 112,190,952.61 93.10
Total securities listed on a stock exchange or other
organised markets 112,190,952.61 93.10
Money market instruments
USD TREASURY BILL 0%/21-121121 3,500,000 3,499,932.15 2.90
Total money market instruments 3,499,932.15 2.90
Total of Portfolio 115,690,884.76 96.00
Cash at banks and at brokers 3,652,650.55 3.03
Other net assets 1,162,333.97 0.97
Total net assets 120,505,869.28 100.00

CS Investment Funds 1 • Audited Annual Report as at 31.10.2021
Unaudited information Page 121
Remuneration
This disclosure should be read in conjunction with the Credit Suisse Compensation Policy (available on the Group’s website – https://www.credit-suisse.com/media/assets/corporate/docs/about-us/governance/compensation/compensation_policy.pdf), which provides more information on the remuneration principles and policies. Total Remuneration UCITS
At 31 December 2020, Credit Suisse Fund Management S.A. hereafter “CSFM” had total assets under management of CHF 73.7bn, of which CHF 57,6bn were in UCITS. The aggregated gross remuneration data that follows reflects amounts paid in respect of performance during 2020. Staff remuneration for the financial year ending 31 December 2020:
Total remuneration for the financial year ending 31 December 2020 paid by CSFM to 25 beneficiaries CHF 3,652,220 made up of: - CHF 3,088,857 fixed remuneration - CHF 563,363 variable remuneration
Which includes:
Remuneration paid to Senior Management CHF 598,070.00
Remuneration paid to Control Functions CHF 1,462,849.44
Remuneration paid to other staff members whose actions have a material impact on the risk profile of the funds managed n/a (*)
(*)To avoid disclosure of remuneration figures of individual employees, this category is consolidated under category “Control Functions”.
Total remuneration for the financial year ending 31 October 2021 paid by the UCITS fund to 0 beneficiary CHF 0, made up of: - CHF 0 fixed remuneration - CHF 0 variable remuneration
Which includes:
Remuneration paid to Senior Management CHF 0
Remuneration paid to Control Functions CHF 0
Remuneration paid to other staff members whose actions have a material impact on the risk profile of the fund CHF 0
Fixed remuneration consists of Directors fees paid to the Members of the Board, salaries and benefits paid. Variable remuneration consists of annual bonuses paid in
accordance with remuneration policies, including remuneration paid directly by the fund to the staff, e.g. through performance fees, if any.
The annual gross amounts of fixed and variable remuneration have been aggregated. The implementation of the Compensation Policy is, at least annually, subject to review by the Internal Audit function for compliance with the policies and procedures for
remuneration adopted by the Board of Directors of CSFM.
Delegates remuneration for the financial year ending 31 October 2021:
Credit Suisse Fund Management S.A. is not paying remuneration to the Identified Staff of the Delegates (portfolio management or risk management activities).
Total remuneration for the financial year ending 31 October 2021 paid by the UCITS to the Delegates (portfolio management or risk management activities).
CHF 18,458,376.13 made up of: - CHF 16,421,310.51 Management fees - CHF 2,037,065.62 Performance fees
The implementation of the Compensation Policy is, at least annually, subject to review by the Internal Audit function for compliance with the policies and procedures for remuneration adopted by the Board of CSFM. During 2020, no material changes were made to the remuneration policy.
General information in relation to Securities Financing Transactions ("SFT") and Total Return Swaps ("TRS")
Types of SFTs and TRS
As at 31.10.2021, the Company is engaged in Securities Lending activities. Re-use of collateral
The Company does not re-use collateral in relation to securities financing transactions. There is no cash collateral reinvestment. Safekeeping of collateral
The safekeeping of collateral is done by Credit Suisse (Luxembourg) S.A. (the "Depositary Bank"). The collateral received from securities lending activities are held in a pool. Settlement and clearing
The settlement and clearing of securities financing transactions occur bilaterally. Maturity tenor and collateral
The maturity tenor of the SFTs is always open maturity. The maturity tenor of the related collateral is disclosed in the section below.
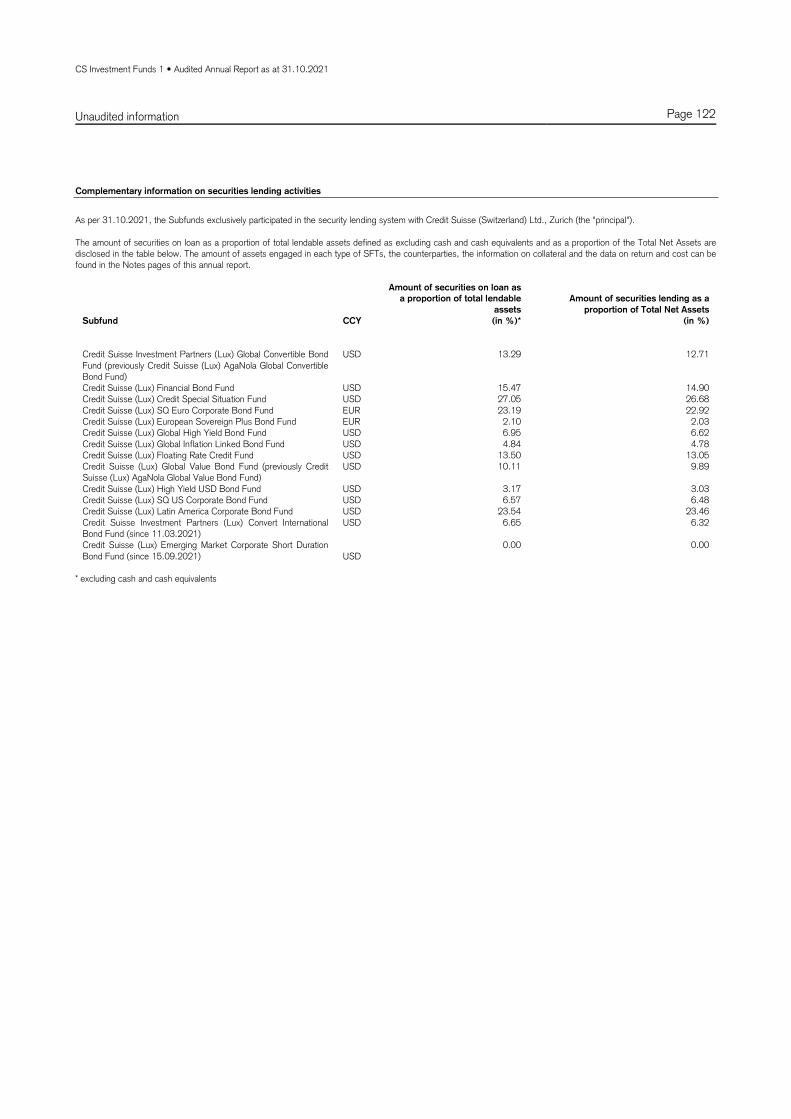
CS Investment Funds 1 • Audited Annual Report as at 31.10.2021
Unaudited information Page 122
Complementary information on securities lending activities
As per 31.10.2021, the Subfunds exclusively participated in the security lending system with Credit Suisse (Switzerland) Ltd., Zurich (the "principal"). The amount of securities on loan as a proportion of total lendable assets defined as excluding cash and cash equivalents and as a proportion of the Total Net Assets are disclosed in the table below. The amount of assets engaged in each type of SFTs, the counterparties, the information on collateral and the data on return and cost can be found in the Notes pages of this annual report.
Subfund CCY
Amount of securities on loan as
a proportion of total lendable
assets
(in %)*
Amount of securities lending as a
proportion of Total Net Assets
(in %)
Credit Suisse Investment Partners (Lux) Global Convertible Bond Fund (previously Credit Suisse (Lux) AgaNola Global Convertible Bond Fund)
USD 13.29 12.71
Credit Suisse (Lux) Financial Bond Fund USD 15.47 14.90 Credit Suisse (Lux) Credit Special Situation Fund USD 27.05 26.68 Credit Suisse (Lux) SQ Euro Corporate Bond Fund EUR 23.19 22.92 Credit Suisse (Lux) European Sovereign Plus Bond Fund EUR 2.10 2.03 Credit Suisse (Lux) Global High Yield Bond Fund USD 6.95 6.62 Credit Suisse (Lux) Global Inflation Linked Bond Fund USD 4.84 4.78 Credit Suisse (Lux) Floating Rate Credit Fund USD 13.50 13.05 Credit Suisse (Lux) Global Value Bond Fund (previously Credit Suisse (Lux) AgaNola Global Value Bond Fund)
USD 10.11 9.89
Credit Suisse (Lux) High Yield USD Bond Fund USD 3.17 3.03 Credit Suisse (Lux) SQ US Corporate Bond Fund USD 6.57 6.48 Credit Suisse (Lux) Latin America Corporate Bond Fund USD 23.54 23.46 Credit Suisse Investment Partners (Lux) Convert International Bond Fund (since 11.03.2021)
USD 6.65 6.32
Credit Suisse (Lux) Emerging Market Corporate Short Duration Bond Fund (since 15.09.2021) USD
0.00 0.00
* excluding cash and cash equivalents
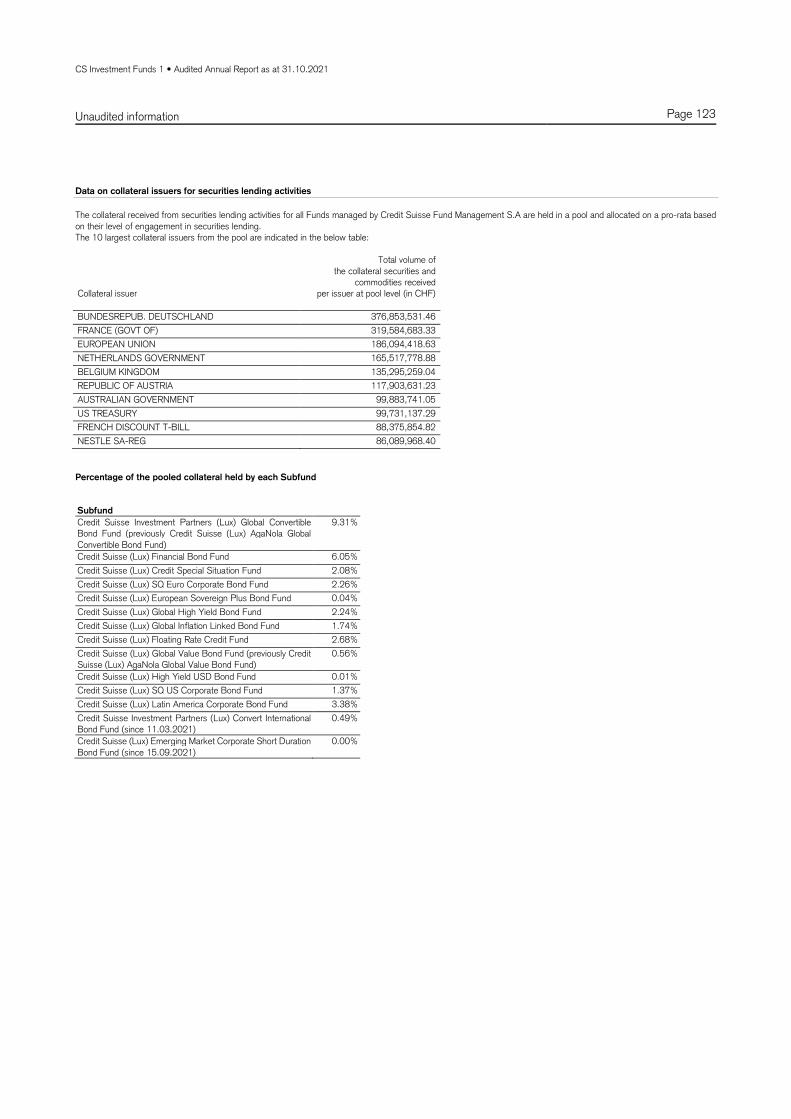
CS Investment Funds 1 • Audited Annual Report as at 31.10.2021
Unaudited information Page 123
Data on collateral issuers for securities lending activities
The collateral received from securities lending activities for all Funds managed by Credit Suisse Fund Management S.A are held in a pool and allocated on a pro-rata based on their level of engagement in securities lending. The 10 largest collateral issuers from the pool are indicated in the below table:
Collateral issuer
Total volume of the collateral securities and
commodities received per issuer at pool level (in CHF)
BUNDESREPUB. DEUTSCHLAND 376,853,531.46
FRANCE (GOVT OF) 319,584,683.33
EUROPEAN UNION 186,094,418.63
NETHERLANDS GOVERNMENT 165,517,778.88
BELGIUM KINGDOM 135,295,259.04
REPUBLIC OF AUSTRIA 117,903,631.23
AUSTRALIAN GOVERNMENT 99,883,741.05
US TREASURY 99,731,137.29
FRENCH DISCOUNT T-BILL 88,375,854.82
NESTLE SA-REG 86,089,968.40
Percentage of the pooled collateral held by each Subfund
Subfund
Credit Suisse Investment Partners (Lux) Global Convertible Bond Fund (previously Credit Suisse (Lux) AgaNola Global Convertible Bond Fund)
9.31%
Credit Suisse (Lux) Financial Bond Fund 6.05%
Credit Suisse (Lux) Credit Special Situation Fund 2.08%
Credit Suisse (Lux) SQ Euro Corporate Bond Fund 2.26%
Credit Suisse (Lux) European Sovereign Plus Bond Fund 0.04%
Credit Suisse (Lux) Global High Yield Bond Fund 2.24%
Credit Suisse (Lux) Global Inflation Linked Bond Fund 1.74%
Credit Suisse (Lux) Floating Rate Credit Fund 2.68%
Credit Suisse (Lux) Global Value Bond Fund (previously Credit Suisse (Lux) AgaNola Global Value Bond Fund)
0.56%
Credit Suisse (Lux) High Yield USD Bond Fund 0.01%
Credit Suisse (Lux) SQ US Corporate Bond Fund 1.37%
Credit Suisse (Lux) Latin America Corporate Bond Fund 3.38%
Credit Suisse Investment Partners (Lux) Convert International Bond Fund (since 11.03.2021)
0.49%
Credit Suisse (Lux) Emerging Market Corporate Short Duration Bond Fund (since 15.09.2021)
0.00%

CS Investment Funds 1 • Audited Annual Report as at 31.10.2021
Unaudited information Page 124
Maturity tenor of the collateral related to SFTs
Maturity tenor of collateral
Subfund CCY
Less
than
1 day
From
1 day to
1 week
From
1 week
to 1 month
From
1 month to
3 months
From
3 months
to 1 year
More than
1 year
Open
maturity
Credit Suisse Investment Partners (Lux) Global Convertible Bond Fund (previously Credit Suisse (Lux) AgaNola Global Convertible Bond Fund)
USD 0.00 0.00 1,398,270.33 13,270,003.60 12,926,499.07 193,705,621.67 66,261,939.85
Credit Suisse (Lux) Financial Bond Fund EUR 0.00 0.00 785,037.42 7,450,239.92 7,257,384.57 108,753,049.23 37,201,749.46
Credit Suisse (Lux) Credit Special Situation Fund
USD 0.00 0.00 311,755.00 2,958,648.15 2,882,061.21 43,188,140.47 14,773,603.06
Credit Suisse (Lux) SQ Euro Corporate Bond Fund
EUR 0.00 0.00 293,787.53 2,788,131.55 2,715,958.56 40,699,066.17 13,922,151.83
Credit Suisse (Lux) European Sovereign Plus Bond Fund
EUR 0.00 0.00 5,729.09 54,370.78 52,963.35 793,664.17 271,493.04
Credit Suisse (Lux) Global High Yield Bond Fund
USD 0.00 0.00 336,777.40 3,196,118.21 3,113,384.16 46,654,551.39 15,959,377.18
Credit Suisse (Lux) Global Inflation Linked Bond Fund
USD 0.00 0.00 261,233.86 2,479,187.42 2,415,011.69 36,189,330.03 12,379,481.76
Credit Suisse (Lux) Floating Rate Credit Fund USD 0.00 0.00 402,397.40 3,818,871.66 3,720,017.15 55,745,042.07 19,069,010.97
Credit Suisse (Lux) Global Value Bond Fund (previously Credit Suisse (Lux) AgaNola Global Value Bond Fund)
USD 0.00 0.00 83,656.59 793,926.01 773,374.61 11,589,140.14 3,964,360.46
Credit Suisse (Lux) High Yield USD Bond Fund
USD 0.00 0.00 1,871.31 17,759.29 17,299.58 259,236.92 88,678.59
Credit Suisse (Lux) SQ US Corporate Bond Fund
USD 0.00 0.00 206,056.89 1,955,541.47 1,904,920.73 28,545,536.73 9,764,727.64
Credit Suisse (Lux) Latin America Corporate Bond Fund
USD 0.00 0.00 507,754.99 4,818,746.69 4,694,009.63 70,340,472.54 24,061,749.58
Credit Suisse Investment Partners (Lux) Convert International Bond Fund (since 11.03.2021)
USD 0.00 0.00 72,851.27 691,380.32 673,483.39 10,092,254.59 3,452,312.64
Credit Suisse (Lux) Emerging Market Corporate Short Duration Bond Fund (since 15.09.2021)
USD 0.00 0.00 0.00 0.00 0.00 0.00 0.00
General information in relation to the Sustainable Finance Disclosure Regulation ("SFDR")
As requested in Art. 11(1) of Regulation (EU) 2019/2088 (SFDR), Subfunds as referred to in Art. 8 of that Regulation, shall describe the extent to which environmental or social characteristics are met. Products as referred to in SFDR Art. 9 shall describe the overall sustainability-related impact of the Subfund by means of relevant sustainability indicators. For Subfunds falling under Art. 8 or 9 of SFDR the respective information are disclosed on Subfund level below. Subfunds not falling under Art. 8 or 9 of SFDR are not listed below. The investments underlying those Subfunds do not take into account the EU criteria for environmentally sustainable economic activities.
Subfund
Credit Suisse Investment Partners (Lux) Global Convertible Bond Fund (previously Credit Suisse (Lux) AgaNola Global Convertible Bond Fund)
This Subfund promotes environmental, social and governance (ESG) characteristics (within the meaning of Art. 8 of SFDR) as explained in the prospectus. As requested in SFDR Art. 11(1)a, the ESG characteristics of the Subfund have been met by applying CSAM Sustainable Investing Policy and the specific investment process described in the prospectus of the Subfund in relation to the consideration of ESG factors for the fixed income products. In particular, ESG characteristics have been met by applying CSAM ESG security analysis based on ESG ratings from several service providers. The concrete portfolio construction has been based on CSAM ESG integrated credit view for all issuers of the Subfund universe which includes traditional issuer related credit rating combined with issuer related ESG rating. Therefore, securities whose financial return compensate for the inherent financial and sustainability related risks remained eligible for investing. The ESG rating breakdown below is a snapshot of existing MSCI ratings of issuers contained in the portfolio of the Subfund valid as of 31.10.2021. It does not represent an average for the reporting period and is not representative of the portfolio rating at any other day of the financial year. It is also not representative of CSAM ESG integrated credit view which is applied by the investment manager for the purpose of the portfolio construction. Hence, the rating below is not providing for a complete picture of how CSAM Sustainable Investing Policy is concretely applied for this specific Subfund.

CS Investment Funds 1 • Audited Annual Report as at 31.10.2021
Unaudited information Page 125
ESG Rating is provided by MSCI ESG and measured on a scale from AAA (highest rating) to CCC (lowest rating). The rating is based on the underlying issuers’ exposure to industry specific ESG risks, their ability to mitigate those risks relative to their peers and the risk of missing ESG related opportunities. The overall portfolio rating is calculated on an industry relative basis while the underlying individual E, S and G ratings are absolute. Hence, the overall rating cannot be seen as an average of the individual E, S and G ratings. For further information on the MSCI ESG Key Issue Hierarchy and the methodology for the calculation of the individual factors, please refer to: “https://www.msci.com/our-solutions/esg-investing”. Certain information ©2022 MSCI ESG Research LLC. Reproduced by permission. Although Credit Suisse Group AG and/or its affiliates information providers, including without limitation, MSCI ESG Research LLC and its affiliates (the “ESG Parties”), obtain information from sources they consider reliable, none of the ESG Parties warrants or guarantees the originality, accuracy and/or completeness, of any data herein and expressly disclaim all express or implied warranties, including those of merchantability and fitness for a particular purpose. None of the ESG Parties shall have any liability for any errors or omissions in connection with any data herein, or any liability for any direct, indirect, special, punitive, consequential or any other damages (including lost profits) even if notified of the possibility of such damages.
For further information about the present ESG disclosures, please refer to the ESG
Notes below.
Credit Suisse (Lux) Financial Bond Fund This Subfund promotes environmental, social and governance (ESG) characteristics (within the meaning of Art. 8 of SFDR) as explained in the prospectus. As requested in SFDR Art. 11(1)a, the ESG characteristics of the Subfund have been met by applying CSAM Sustainable Investing Policy and the specific investment process described in the prospectus of the Subfund in relation to the consideration of ESG factors for the fixed income products. In particular, ESG characteristics have been met by applying CSAM ESG security analysis based on ESG ratings from several service providers. The concrete portfolio construction has been based on CSAM ESG integrated credit view for all issuers of the Subfund universe which includes traditional issuer related credit rating combined with issuer related ESG rating. Therefore, securities whose financial return compensate for the inherent financial and sustainability related risks remained eligible for investing. The ESG rating breakdown below is a snapshot of existing MSCI ratings of issuers contained in the portfolio of the Subfund valid as of 31.10.2021. It does not represent an average for the reporting period and is not representative of the portfolio rating at any other day of the financial year. It is also not representative of CSAM ESG integrated credit view which is applied by the investment manager for the purpose of the portfolio construction. Hence, the rating below is not providing for a complete picture of how CSAM Sustainable Investing Policy is concretely applied for this specific Subfund.
ESG Rating is provided by MSCI ESG and measured on a scale from AAA (highest rating) to CCC (lowest rating). The rating is based on the underlying issuers’ exposure to industry specific ESG risks, their ability to mitigate those risks relative to their peers and the risk of missing ESG related opportunities. The overall portfolio rating is calculated on an industry relative basis while the underlying individual E, S and G ratings are absolute. Hence, the overall rating cannot be seen as an average of the individual E, S and G ratings. For further information on the MSCI ESG
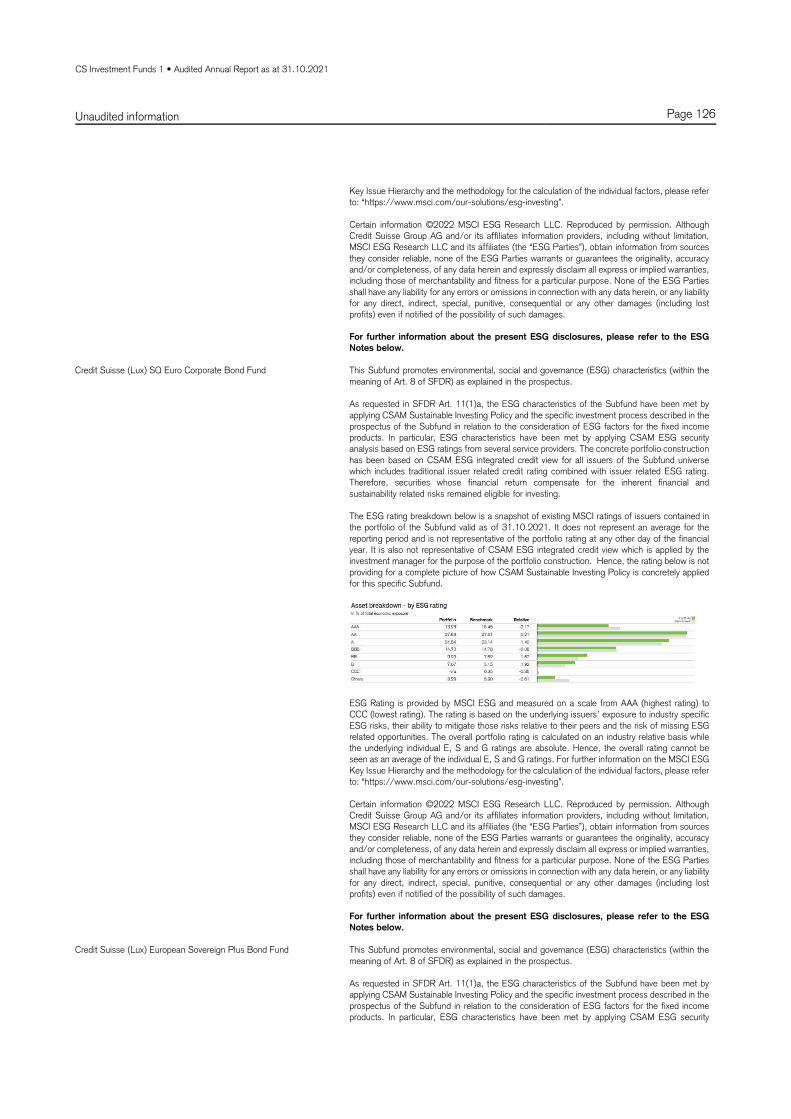
CS Investment Funds 1 • Audited Annual Report as at 31.10.2021
Unaudited information Page 126
Key Issue Hierarchy and the methodology for the calculation of the individual factors, please refer to: “https://www.msci.com/our-solutions/esg-investing”. Certain information ©2022 MSCI ESG Research LLC. Reproduced by permission. Although Credit Suisse Group AG and/or its affiliates information providers, including without limitation, MSCI ESG Research LLC and its affiliates (the “ESG Parties”), obtain information from sources they consider reliable, none of the ESG Parties warrants or guarantees the originality, accuracy and/or completeness, of any data herein and expressly disclaim all express or implied warranties, including those of merchantability and fitness for a particular purpose. None of the ESG Parties shall have any liability for any errors or omissions in connection with any data herein, or any liability for any direct, indirect, special, punitive, consequential or any other damages (including lost profits) even if notified of the possibility of such damages. For further information about the present ESG disclosures, please refer to the ESG
Notes below.
Credit Suisse (Lux) SQ Euro Corporate Bond Fund This Subfund promotes environmental, social and governance (ESG) characteristics (within the meaning of Art. 8 of SFDR) as explained in the prospectus. As requested in SFDR Art. 11(1)a, the ESG characteristics of the Subfund have been met by applying CSAM Sustainable Investing Policy and the specific investment process described in the prospectus of the Subfund in relation to the consideration of ESG factors for the fixed income products. In particular, ESG characteristics have been met by applying CSAM ESG security analysis based on ESG ratings from several service providers. The concrete portfolio construction has been based on CSAM ESG integrated credit view for all issuers of the Subfund universe which includes traditional issuer related credit rating combined with issuer related ESG rating. Therefore, securities whose financial return compensate for the inherent financial and sustainability related risks remained eligible for investing. The ESG rating breakdown below is a snapshot of existing MSCI ratings of issuers contained in the portfolio of the Subfund valid as of 31.10.2021. It does not represent an average for the reporting period and is not representative of the portfolio rating at any other day of the financial year. It is also not representative of CSAM ESG integrated credit view which is applied by the investment manager for the purpose of the portfolio construction. Hence, the rating below is not providing for a complete picture of how CSAM Sustainable Investing Policy is concretely applied for this specific Subfund.
ESG Rating is provided by MSCI ESG and measured on a scale from AAA (highest rating) to CCC (lowest rating). The rating is based on the underlying issuers’ exposure to industry specific ESG risks, their ability to mitigate those risks relative to their peers and the risk of missing ESG related opportunities. The overall portfolio rating is calculated on an industry relative basis while the underlying individual E, S and G ratings are absolute. Hence, the overall rating cannot be seen as an average of the individual E, S and G ratings. For further information on the MSCI ESG Key Issue Hierarchy and the methodology for the calculation of the individual factors, please refer to: “https://www.msci.com/our-solutions/esg-investing”. Certain information ©2022 MSCI ESG Research LLC. Reproduced by permission. Although Credit Suisse Group AG and/or its affiliates information providers, including without limitation, MSCI ESG Research LLC and its affiliates (the “ESG Parties”), obtain information from sources they consider reliable, none of the ESG Parties warrants or guarantees the originality, accuracy and/or completeness, of any data herein and expressly disclaim all express or implied warranties, including those of merchantability and fitness for a particular purpose. None of the ESG Parties shall have any liability for any errors or omissions in connection with any data herein, or any liability for any direct, indirect, special, punitive, consequential or any other damages (including lost profits) even if notified of the possibility of such damages. For further information about the present ESG disclosures, please refer to the ESG
Notes below.
Credit Suisse (Lux) European Sovereign Plus Bond Fund This Subfund promotes environmental, social and governance (ESG) characteristics (within the meaning of Art. 8 of SFDR) as explained in the prospectus. As requested in SFDR Art. 11(1)a, the ESG characteristics of the Subfund have been met by applying CSAM Sustainable Investing Policy and the specific investment process described in the prospectus of the Subfund in relation to the consideration of ESG factors for the fixed income products. In particular, ESG characteristics have been met by applying CSAM ESG security

CS Investment Funds 1 • Audited Annual Report as at 31.10.2021
Unaudited information Page 127
analysis based on ESG ratings from several service providers. The concrete portfolio construction has been based on CSAM ESG integrated credit view for all issuers of the Subfund universe which includes traditional issuer related credit rating combined with issuer related ESG rating. Therefore, securities whose financial return compensate for the inherent financial and sustainability related risks remained eligible for investing. The ESG rating breakdown below is a snapshot of existing MSCI ratings of issuers contained in the portfolio of the Subfund valid as of 31.10.2021. It does not represent an average for the reporting period and is not representative of the portfolio rating at any other day of the financial year. It is also not representative of CSAM ESG integrated credit view which is applied by the investment manager for the purpose of the portfolio construction. Hence, the rating below is not providing for a complete picture of how CSAM Sustainable Investing Policy is concretely applied for this specific Subfund.
ESG Rating is provided by MSCI ESG and measured on a scale from AAA (highest rating) to CCC (lowest rating). The rating is based on the underlying issuers’ exposure to industry specific ESG risks, their ability to mitigate those risks relative to their peers and the risk of missing ESG related opportunities. The overall portfolio rating is calculated on an industry relative basis while the underlying individual E, S and G ratings are absolute. Hence, the overall rating cannot be seen as an average of the individual E, S and G ratings. For further information on the MSCI ESG Key Issue Hierarchy and the methodology for the calculation of the individual factors, please refer to: “https://www.msci.com/our-solutions/esg-investing”. Certain information ©2022 MSCI ESG Research LLC. Reproduced by permission. Although Credit Suisse Group AG and/or its affiliates information providers, including without limitation, MSCI ESG Research LLC and its affiliates (the “ESG Parties”), obtain information from sources they consider reliable, none of the ESG Parties warrants or guarantees the originality, accuracy and/or completeness, of any data herein and expressly disclaim all express or implied warranties, including those of merchantability and fitness for a particular purpose. None of the ESG Parties shall have any liability for any errors or omissions in connection with any data herein, or any liability for any direct, indirect, special, punitive, consequential or any other damages (including lost profits) even if notified of the possibility of such damages. For further information about the present ESG disclosures, please refer to the ESG
Notes below.
Credit Suisse (Lux) Global Inflation Linked Bond Fund This Subfund promotes environmental, social and governance (ESG) characteristics (within the meaning of Art. 8 of SFDR) as explained in the prospectus. As requested in SFDR Art. 11(1)a, the ESG characteristics of the Subfund have been met by applying CSAM Sustainable Investing Policy and the specific investment process described in the prospectus of the Subfund in relation to the consideration of ESG factors for the fixed income products. In particular, ESG characteristics have been met by applying CSAM ESG security analysis based on ESG ratings from several service providers. The concrete portfolio construction has been based on CSAM ESG integrated credit view for all issuers of the Subfund universe which includes traditional issuer related credit rating combined with issuer related ESG rating. Therefore, securities whose financial return compensate for the inherent financial and sustainability related risks remained eligible for investing. The ESG rating breakdown below is a snapshot of existing MSCI ratings of issuers contained in the portfolio of the Subfund valid as of 31.10.2021. It does not represent an average for the reporting period and is not representative of the portfolio rating at any other day of the financial year. It is also not representative of CSAM ESG integrated credit view which is applied by the investment manager for the purpose of the portfolio construction. Hence, the rating below is not providing for a complete picture of how CSAM Sustainable Investing Policy is concretely applied for this specific Subfund.
ESG Rating is provided by MSCI ESG and measured on a scale from AAA (highest rating) to CCC (lowest rating). The rating is based on the underlying issuers’ exposure to industry specific ESG risks, their ability to mitigate those risks relative to their peers and the risk of missing ESG related opportunities. The overall portfolio rating is calculated on an industry relative basis while

CS Investment Funds 1 • Audited Annual Report as at 31.10.2021
Unaudited information Page 128
the underlying individual E, S and G ratings are absolute. Hence, the overall rating cannot be seen as an average of the individual E, S and G ratings. For further information on the MSCI ESG Key Issue Hierarchy and the methodology for the calculation of the individual factors, please refer to: “https://www.msci.com/our-solutions/esg-investing”. Certain information ©2022 MSCI ESG Research LLC. Reproduced by permission. Although Credit Suisse Group AG and/or its affiliates information providers, including without limitation, MSCI ESG Research LLC and its affiliates (the “ESG Parties”), obtain information from sources they consider reliable, none of the ESG Parties warrants or guarantees the originality, accuracy and/or completeness, of any data herein and expressly disclaim all express or implied warranties, including those of merchantability and fitness for a particular purpose. None of the ESG Parties shall have any liability for any errors or omissions in connection with any data herein, or any liability for any direct, indirect, special, punitive, consequential or any other damages (including lost profits) even if notified of the possibility of such damages. For further information about the present ESG disclosures, please refer to the ESG
Notes below.
Credit Suisse (Lux) Floating Rate Credit Fund This Subfund promotes environmental, social and governance (ESG) characteristics (within the meaning of Art. 8 of SFDR) as explained in the prospectus. As requested in SFDR Art. 11(1)a, the ESG characteristics of the Subfund have been met by applying CSAM Sustainable Investing Policy and the specific investment process described in the prospectus of the Subfund in relation to the consideration of ESG factors for the fixed income products. In particular, ESG characteristics have been met by applying CSAM ESG security analysis based on ESG ratings from several service providers. The concrete portfolio construction has been based on CSAM ESG integrated credit view for all issuers of the Subfund universe which includes traditional issuer related credit rating combined with issuer related ESG rating. Therefore, securities whose financial return compensate for the inherent financial and sustainability related risks remained eligible for investing. The ESG rating breakdown below is a snapshot of existing MSCI ratings of issuers contained in the portfolio of the Subfund valid as of 31.10.2021. It does not represent an average for the reporting period and is not representative of the portfolio rating at any other day of the financial year. It is also not representative of CSAM ESG integrated credit view which is applied by the investment manager for the purpose of the portfolio construction. Hence, the rating below is not providing for a complete picture of how CSAM Sustainable Investing Policy is concretely applied for this specific Subfund.
ESG Rating is provided by MSCI ESG and measured on a scale from AAA (highest rating) to CCC (lowest rating). The rating is based on the underlying issuers’ exposure to industry specific ESG risks, their ability to mitigate those risks relative to their peers and the risk of missing ESG related opportunities. The overall portfolio rating is calculated on an industry relative basis while the underlying individual E, S and G ratings are absolute. Hence, the overall rating cannot be seen as an average of the individual E, S and G ratings. For further information on the MSCI ESG Key Issue Hierarchy and the methodology for the calculation of the individual factors, please refer to: “https://www.msci.com/our-solutions/esg-investing”. Certain information ©2022 MSCI ESG Research LLC. Reproduced by permission. Although Credit Suisse Group AG and/or its affiliates information providers, including without limitation, MSCI ESG Research LLC and its affiliates (the “ESG Parties”), obtain information from sources they consider reliable, none of the ESG Parties warrants or guarantees the originality, accuracy and/or completeness, of any data herein and expressly disclaim all express or implied warranties, including those of merchantability and fitness for a particular purpose. None of the ESG Parties shall have any liability for any errors or omissions in connection with any data herein, or any liability for any direct, indirect, special, punitive, consequential or any other damages (including lost profits) even if notified of the possibility of such damages. For further information about the present ESG disclosures, please refer to the ESG
Notes below.
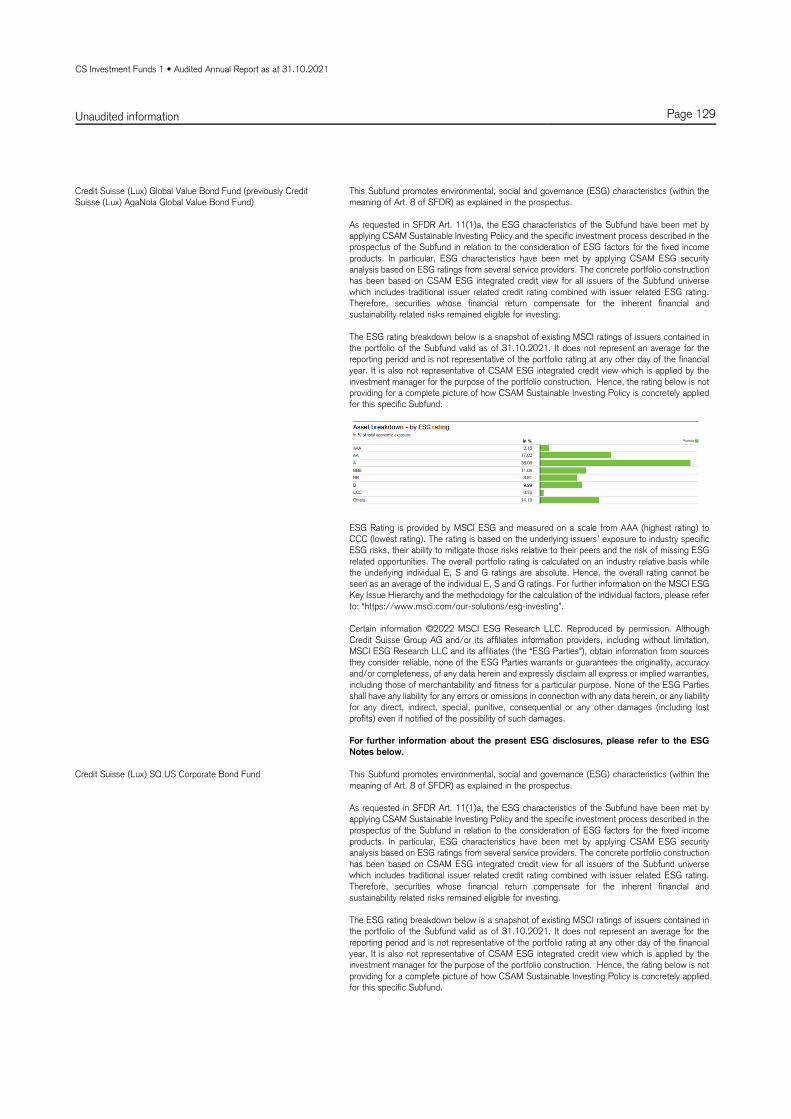
CS Investment Funds 1 • Audited Annual Report as at 31.10.2021
Unaudited information Page 129
Credit Suisse (Lux) Global Value Bond Fund (previously Credit Suisse (Lux) AgaNola Global Value Bond Fund)
This Subfund promotes environmental, social and governance (ESG) characteristics (within the meaning of Art. 8 of SFDR) as explained in the prospectus. As requested in SFDR Art. 11(1)a, the ESG characteristics of the Subfund have been met by applying CSAM Sustainable Investing Policy and the specific investment process described in the prospectus of the Subfund in relation to the consideration of ESG factors for the fixed income products. In particular, ESG characteristics have been met by applying CSAM ESG security analysis based on ESG ratings from several service providers. The concrete portfolio construction has been based on CSAM ESG integrated credit view for all issuers of the Subfund universe which includes traditional issuer related credit rating combined with issuer related ESG rating. Therefore, securities whose financial return compensate for the inherent financial and sustainability related risks remained eligible for investing. The ESG rating breakdown below is a snapshot of existing MSCI ratings of issuers contained in the portfolio of the Subfund valid as of 31.10.2021. It does not represent an average for the reporting period and is not representative of the portfolio rating at any other day of the financial year. It is also not representative of CSAM ESG integrated credit view which is applied by the investment manager for the purpose of the portfolio construction. Hence, the rating below is not providing for a complete picture of how CSAM Sustainable Investing Policy is concretely applied for this specific Subfund.
ESG Rating is provided by MSCI ESG and measured on a scale from AAA (highest rating) to CCC (lowest rating). The rating is based on the underlying issuers’ exposure to industry specific ESG risks, their ability to mitigate those risks relative to their peers and the risk of missing ESG related opportunities. The overall portfolio rating is calculated on an industry relative basis while the underlying individual E, S and G ratings are absolute. Hence, the overall rating cannot be seen as an average of the individual E, S and G ratings. For further information on the MSCI ESG Key Issue Hierarchy and the methodology for the calculation of the individual factors, please refer to: “https://www.msci.com/our-solutions/esg-investing”. Certain information ©2022 MSCI ESG Research LLC. Reproduced by permission. Although Credit Suisse Group AG and/or its affiliates information providers, including without limitation, MSCI ESG Research LLC and its affiliates (the “ESG Parties”), obtain information from sources they consider reliable, none of the ESG Parties warrants or guarantees the originality, accuracy and/or completeness, of any data herein and expressly disclaim all express or implied warranties, including those of merchantability and fitness for a particular purpose. None of the ESG Parties shall have any liability for any errors or omissions in connection with any data herein, or any liability for any direct, indirect, special, punitive, consequential or any other damages (including lost profits) even if notified of the possibility of such damages.
For further information about the present ESG disclosures, please refer to the ESG
Notes below.
Credit Suisse (Lux) SQ US Corporate Bond Fund This Subfund promotes environmental, social and governance (ESG) characteristics (within the meaning of Art. 8 of SFDR) as explained in the prospectus. As requested in SFDR Art. 11(1)a, the ESG characteristics of the Subfund have been met by applying CSAM Sustainable Investing Policy and the specific investment process described in the prospectus of the Subfund in relation to the consideration of ESG factors for the fixed income products. In particular, ESG characteristics have been met by applying CSAM ESG security analysis based on ESG ratings from several service providers. The concrete portfolio construction has been based on CSAM ESG integrated credit view for all issuers of the Subfund universe which includes traditional issuer related credit rating combined with issuer related ESG rating. Therefore, securities whose financial return compensate for the inherent financial and sustainability related risks remained eligible for investing. The ESG rating breakdown below is a snapshot of existing MSCI ratings of issuers contained in the portfolio of the Subfund valid as of 31.10.2021. It does not represent an average for the reporting period and is not representative of the portfolio rating at any other day of the financial year. It is also not representative of CSAM ESG integrated credit view which is applied by the investment manager for the purpose of the portfolio construction. Hence, the rating below is not providing for a complete picture of how CSAM Sustainable Investing Policy is concretely applied for this specific Subfund.

CS Investment Funds 1 • Audited Annual Report as at 31.10.2021
Unaudited information Page 130
ESG Rating is provided by MSCI ESG and measured on a scale from AAA (highest rating) to CCC (lowest rating). The rating is based on the underlying issuers’ exposure to industry specific ESG risks, their ability to mitigate those risks relative to their peers and the risk of missing ESG related opportunities. The overall portfolio rating is calculated on an industry relative basis while the underlying individual E, S and G ratings are absolute. Hence, the overall rating cannot be seen as an average of the individual E, S and G ratings. For further information on the MSCI ESG Key Issue Hierarchy and the methodology for the calculation of the individual factors, please refer to: “https://www.msci.com/our-solutions/esg-investing”. Certain information ©2022 MSCI ESG Research LLC. Reproduced by permission. Although Credit Suisse Group AG and/or its affiliates information providers, including without limitation, MSCI ESG Research LLC and its affiliates (the “ESG Parties”), obtain information from sources they consider reliable, none of the ESG Parties warrants or guarantees the originality, accuracy and/or completeness, of any data herein and expressly disclaim all express or implied warranties, including those of merchantability and fitness for a particular purpose. None of the ESG Parties shall have any liability for any errors or omissions in connection with any data herein, or any liability for any direct, indirect, special, punitive, consequential or any other damages (including lost profits) even if notified of the possibility of such damages. For further information about the present ESG disclosures, please refer to the ESG
Notes below.
Credit Suisse (Lux) Latin America Corporate Bond Fund This Subfund promotes environmental, social and governance (ESG) characteristics (within the meaning of Art. 8 of SFDR) as explained in the prospectus. As requested in SFDR Art. 11(1)a, the ESG characteristics of the Subfund have been met by applying CSAM Sustainable Investing Policy and the specific investment process described in the prospectus of the Subfund in relation to the consideration of ESG factors for the fixed income products. In particular, ESG characteristics have been met by applying CSAM ESG security analysis based on ESG ratings from several service providers. The concrete portfolio construction has been based on CSAM ESG integrated credit view for all issuers of the Subfund universe which includes traditional issuer related credit rating combined with issuer related ESG rating. Therefore, securities whose financial return compensate for the inherent financial and sustainability related risks remained eligible for investing. The ESG rating breakdown below is a snapshot of existing MSCI ratings of issuers contained in the portfolio of the Subfund valid as of 31.10.2021. It does not represent an average for the reporting period and is not representative of the portfolio rating at any other day of the financial year. It is also not representative of CSAM ESG integrated credit view which is applied by the investment manager for the purpose of the portfolio construction. Hence, the rating below is not providing for a complete picture of how CSAM Sustainable Investing Policy is concretely applied for this specific Subfund.
ESG Rating is provided by MSCI ESG and measured on a scale from AAA (highest rating) to CCC (lowest rating). The rating is based on the underlying issuers’ exposure to industry specific ESG risks, their ability to mitigate those risks relative to their peers and the risk of missing ESG related opportunities. The overall portfolio rating is calculated on an industry relative basis while the underlying individual E, S and G ratings are absolute. Hence, the overall rating cannot be seen as an average of the individual E, S and G ratings. For further information on the MSCI ESG Key Issue Hierarchy and the methodology for the calculation of the individual factors, please refer to: “https://www.msci.com/our-solutions/esg-investing”. Certain information ©2022 MSCI ESG Research LLC. Reproduced by permission. Although Credit Suisse Group AG and/or its affiliates information providers, including without limitation, MSCI ESG Research LLC and its affiliates (the “ESG Parties”), obtain information from sources they consider reliable, none of the ESG Parties warrants or guarantees the originality, accuracy and/or completeness, of any data herein and expressly disclaim all express or implied warranties,

CS Investment Funds 1 • Audited Annual Report as at 31.10.2021
Unaudited information Page 131
including those of merchantability and fitness for a particular purpose. None of the ESG Parties shall have any liability for any errors or omissions in connection with any data herein, or any liability for any direct, indirect, special, punitive, consequential or any other damages (including lost profits) even if notified of the possibility of such damages. For further information about the present ESG disclosures, please refer to the ESG
Notes below.
Credit Suisse (Lux) Emerging Market Corporate Short Duration Bond Fund (since 15.09.2021)
This Subfund promotes environmental, social and governance (ESG) characteristics (within the meaning of Art. 8 of SFDR) as explained in the prospectus. As requested in SFDR Art. 11(1)a, the ESG characteristics of the Subfund have been met by applying CSAM Sustainable Investing Policy and the specific investment process described in the prospectus of the Subfund in relation to the consideration of ESG factors for the fixed income products. In particular, ESG characteristics have been met by applying CSAM ESG security analysis based on ESG ratings from several service providers. The concrete portfolio construction has been based on CSAM ESG integrated credit view for all issuers of the Subfund universe which includes traditional issuer related credit rating combined with issuer related ESG rating. Therefore, securities whose financial return compensate for the inherent financial and sustainability related risks remained eligible for investing. The ESG rating breakdown below is a snapshot of existing MSCI ratings of issuers contained in the portfolio of the Subfund valid as of 31.10.2021. It does not represent an average for the reporting period and is not representative of the portfolio rating at any other day of the financial year. It is also not representative of CSAM ESG integrated credit view which is applied by the investment manager for the purpose of the portfolio construction. Hence, the rating below is not providing for a complete picture of how CSAM Sustainable Investing Policy is concretely applied for this specific Subfund.
ESG Rating is provided by MSCI ESG and measured on a scale from AAA (highest rating) to CCC (lowest rating). The rating is based on the underlying issuers’ exposure to industry specific ESG risks, their ability to mitigate those risks relative to their peers and the risk of missing ESG related opportunities. The overall portfolio rating is calculated on an industry relative basis while the underlying individual E, S and G ratings are absolute. Hence, the overall rating cannot be seen as an average of the individual E, S and G ratings. For further information on the MSCI ESG Key Issue Hierarchy and the methodology for the calculation of the individual factors, please refer to: “https://www.msci.com/our-solutions/esg-investing”. Certain information ©2022 MSCI ESG Research LLC. Reproduced by permission. Although Credit Suisse Group AG and/or its affiliates information providers, including without limitation, MSCI ESG Research LLC and its affiliates (the “ESG Parties”), obtain information from sources they consider reliable, none of the ESG Parties warrants or guarantees the originality, accuracy and/or completeness, of any data herein and expressly disclaim all express or implied warranties, including those of merchantability and fitness for a particular purpose. None of the ESG Parties shall have any liability for any errors or omissions in connection with any data herein, or any liability for any direct, indirect, special, punitive, consequential or any other damages (including lost profits) even if notified of the possibility of such damages. For further information about the present ESG disclosures, please refer to the ESG
Notes below.
Taxonomy Disclosures
Under Regulation (EU) 2020/852 (the "Taxonomy Regulation") a financial product qualifying as Article 8(1) under SFDR that promotes environmental characteristics must make additional disclosures as of 1 January 2022 on such objective and a description of how and to what extent its investments are in economic activities that qualify as environmentally sustainable under Article 3 of the Taxonomy Regulation. However, CS does not actively take into account the EU Taxonomy-alignment of investments in the investment decision process. Accordingly, the investments underlying these Subfunds do not take into account the EU criteria for environmentally sustainable economic activities. CS will keep the situation under continuous review. In addition, a financial product qualifying as Article 9(1), (2) or (3) under SFDR that has sustainable investment as its objective must make additional disclosures as of 1 January 2022 on such objective and a description of how and to what extent its investments are in economic activities that qualify as environmentally sustainable under Article 3 of the Taxonomy Regulation. These disclosures are provided per Subfund in the respective section.

CS Investment Funds 1 • Audited Annual Report as at 31.10.2021
Unaudited information Page 132
ESG Notes
The figures contained in this section are not audited. Where Environmental, Social and Governance (“ESG”) related information, statements and scorings are made in this report, CS may have, partially or entirely, relied on publicly available information, internally developed data and/or information obtained from other third-party sources which CS believes to be reliable. CS’ ability to verify such objectives may be limited by the reliability of the data available in respect of the underlying assets and the status of the regulations in relation to tracking and providing such data. CS has not independently verified any information obtained from these public and third-party sources and cannot make any representations or warranties as to its accuracy, completeness or reliability. It is possible that the data from ESG data providers may be incorrect, unavailable, or not fully updated. This is especially true where CS has limited access to data from external parties regarding the underlying elements of an investment, for example due to a lack of look-through data. Such data gaps could result in an incorrect assessment of a sustainability practice and/or related sustainability risks and opportunities. Credit Suisse Group AG and/or its affiliates (hereafter "CS") cannot make any guarantee about the content or completeness of such ESG disclosures, which remain subject to change and cannot be relied upon. In particular, CS shall not be liable for any errors or omissions in connection with any ESG data herein, or for any direct, indirect, special, punitive, consequential or any other damages (including lost profits). In the absence of a standardized, industry-wide ESG classification system, CS has developed its own ESG framework (the “CS Sustainable Investment Framework”). Therefore, investors should note that the ESG classification of the Subfunds reflects CS’ opinion and is based on the CS Sustainable Investment Framework which classification may vary from the classification made by third parties. The fact that a Subfund follows the CS Sustainable Investment Framework does not necessarily mean that it meets the investors overall investment objectives, nor their sustainability preferences. Given that sustainability regulation and guidelines are still developing, CS may need to review certain ESG classifications/descriptions as industry practices change and as more regulatory guidance becomes available. The ESG-performance of a portfolio might also differ from its financial performance and CS cannot make any representation as to the correlation between financial and ESG performance. Sustainability-related practices also differ by region, industry and ESG issue and are continually evolving. Consequently, sustainability-related practices may change over time. Similarly, new local sustainability requirements may result in additional compliance costs, disclosure obligations or other restrictions on the Subfunds. CS’ view on the appropriate classification may also evolve over time, including in response to regulatory guidance or changes in industry approach to classification. A change to the relevant classification may require further actions to be taken, e.g. further disclosures or new processes to capture data which may lead to additional costs.

CS Investment Funds 15, rue Jean MonnetL-2180 Luxembourgwww.credit-suisse.com


