Embed Size (px)
Citation preview
1
DESIGN, CONSTRUCTION, TRANSPORTATION, OPERATION AND POST-OCCUPANCY ANALYSIS FOR THE TEXAS A&M SOLAR DECATHLON HOUSE
Mini Malhotra
Research Assistant Energy Systems Laboratory
Eduardo Ramirez Mechanical Engineer
Wylie Associates, Houston, TX
Piljae Im Research Assistant
Energy Systems Laboratory
Soolyeon Cho, Ph.D. Assistant Professor
School of Architecture & Planning The Catholic University of America
Washington, D.C.
Josh Canez Department of Architecture
Nick Schaider
Department of Architecture
Jeff Haberl, Ph.D., P.E. Professor/Associate Director Energy Systems Laboratory
Pliny Fisk Associate Professor
Department of Architecture
Leslie Feigenbaum Assistant Dean
College of Architecture
Texas A&M University College Station, TX
ABSTRACT
This paper describes the design, construction, transportation, operation and post occupancy analysis of the 2007 Texas A&M Solar Decathlon House (TAMU SD house) 1. The TAMU SD house was developed to be a modular house that could grow into varying configurations, yet be completely powered from the solar radiation that falls on the footprint of the structure. To accomplish this, the Texas A&M team designed and simulated varying designs using building energy simulation (DOE-2), solar thermal analysis (F-CHART), photovoltaic analysis (PV F-CHART), lighting analysis (Ecotect, RADIANCE, DAYSIM), and other engineering analysis procedures. After approval from the USDOE, the construction of the house then took place on the Texas A&M campus and the house was transported to Washington, D.C., where the construction was completed and the house was prepared for the competition. After the competition the house is now on display on-campus at the George Bush Presidential Library in College Station, TX. INTRODUCTION
The Solar Decathlon is an international competition organized by the U.S. Department of Energy, which invites 20 universities to design, build, and operate the most attractive and energy-efficient solar-powered homes in the world. Figure 1 shows the Texas A&M entry on the National Mall at Washington, D.C. The focus of the TAMU SD house was sustainability, open source systems, disaster
1 A detail description of the house is included in Ramirez (2008)
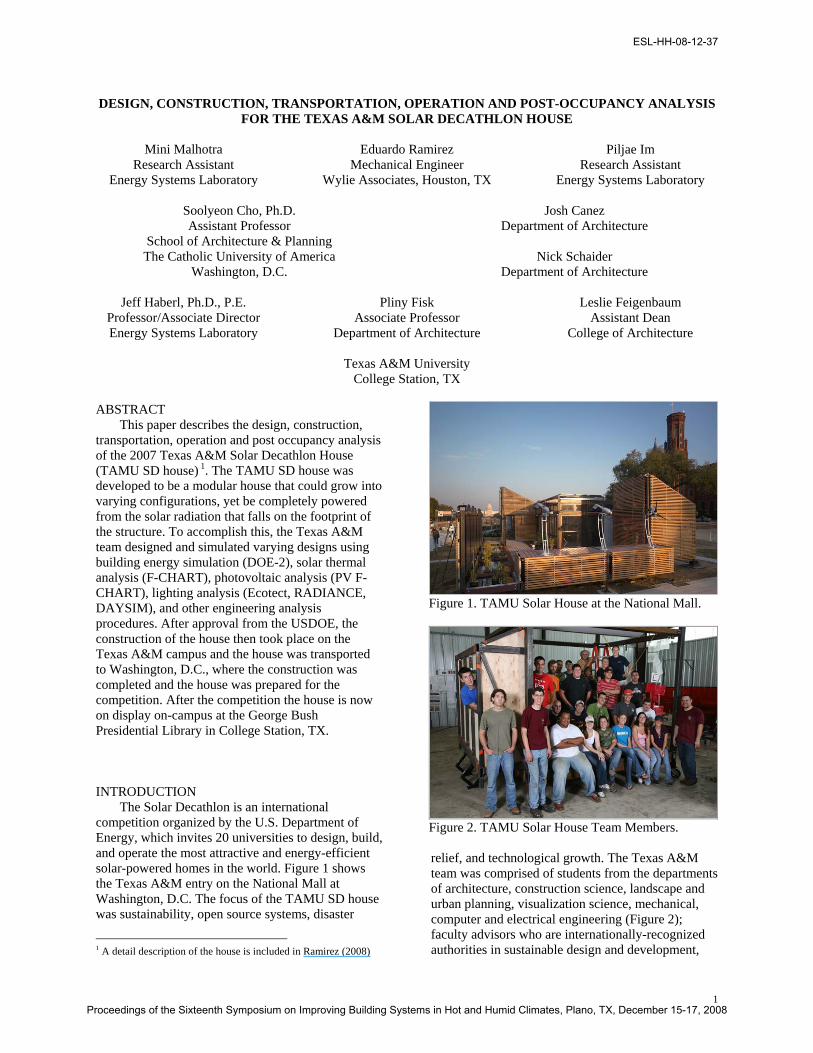
relief, and technological growth. The Texas A&M team was comprised of students from the departments of architecture, construction science, landscape and urban planning, visualization science, mechanical, computer and electrical engineering (Figure 2); faculty advisors who are internationally-recognized authorities in sustainable design and development,
Figure 1. TAMU Solar House at the National Mall.
Figure 2. TAMU Solar House Team Members.
ESL-HH-08-12-37
Proceedings of the Sixteenth Symposium on Improving Building Systems in Hot and Humid Climates, Plano, TX, December 15-17, 2008
2
building energy simulation, visualization and modeling, healthy communities, disaster recovery, and environmental psychology; support staff; and experts from other centers and research units at Texas A&M and the surrounding community (CARC 2007). DESIGN CONCEPT
The Texas A&M team adopted the groHome concept, invented by the team leader Pliny Fisk. It is a system for building homes and entire communities rather than one prototype or one custom home. The groHome building system utilizes a modularized, dimensionally coordinated, open source kit of parts, and is guided by green building principles to achieve high levels of carbon balancing. Beyond the individual home, the system expands to include a groCommunity – an efficient and sustainable community that can reduce transportation costs, reduce waste disposal, conserve water resources, and even produce food at the local level. The overall goal is to optimize not only the cost of home ownership but the total cost of life style (CARC 2007).
The basic structural frame of the groHome uses high-performance, light-weight, industrialized elements that can be carried to a site and set up with a small crew and minimal tools. Pedestal footings elevate the house above the ground to cause minimal damage to the earth. Onto the frame, prefabricated groWalls, groFloors and groRoofs equipped with all of the services and features of the home can be added. Designed to anticipate changing needs of the building owner and allow for upgrades, replacements and enhancements, the dimensionally coordinated component can be replaced or altered as the owner obtains more money or requires different features.
The solar systems are incorporated into groWalls and groRoofs to provide the energy needs. High-efficiency appliances and advanced lighting systems reduce energy demands significantly. These components can easily be replaced when the upgrades become available. In a groCommunity, community power generation strategies couple several houses together to reach a greater balance between loads and renewable resources. ARCHITECTURAL DESIGN
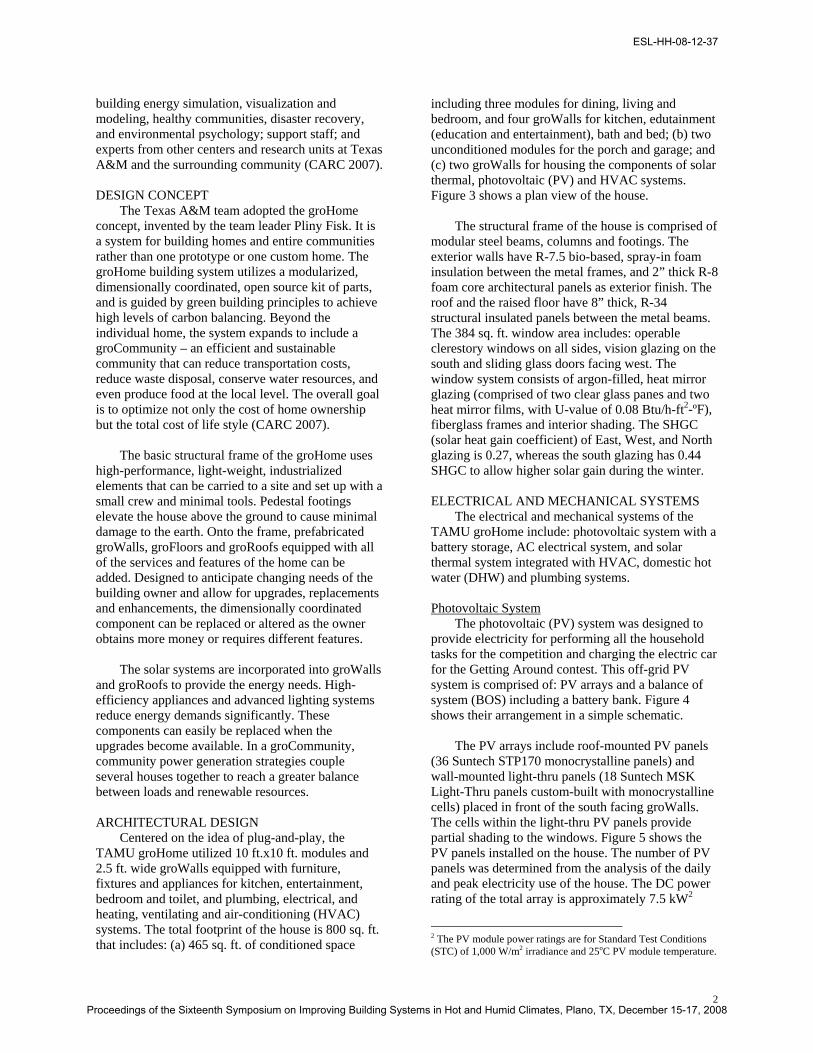
Centered on the idea of plug-and-play, the TAMU groHome utilized 10 ft.x10 ft. modules and 2.5 ft. wide groWalls equipped with furniture, fixtures and appliances for kitchen, entertainment, bedroom and toilet, and plumbing, electrical, and heating, ventilating and air-conditioning (HVAC) systems. The total footprint of the house is 800 sq. ft. that includes: (a) 465 sq. ft. of conditioned space
including three modules for dining, living and bedroom, and four groWalls for kitchen, edutainment (education and entertainment), bath and bed; (b) two unconditioned modules for the porch and garage; and (c) two groWalls for housing the components of solar thermal, photovoltaic (PV) and HVAC systems. Figure 3 shows a plan view of the house.
The structural frame of the house is comprised of modular steel beams, columns and footings. The exterior walls have R-7.5 bio-based, spray-in foam insulation between the metal frames, and 2” thick R-8 foam core architectural panels as exterior finish. The roof and the raised floor have 8” thick, R-34 structural insulated panels between the metal beams. The 384 sq. ft. window area includes: operable clerestory windows on all sides, vision glazing on the south and sliding glass doors facing west. The window system consists of argon-filled, heat mirror glazing (comprised of two clear glass panes and two heat mirror films, with U-value of 0.08 Btu/h-ft2-ºF), fiberglass frames and interior shading. The SHGC (solar heat gain coefficient) of East, West, and North glazing is 0.27, whereas the south glazing has 0.44 SHGC to allow higher solar gain during the winter. ELECTRICAL AND MECHANICAL SYSTEMS
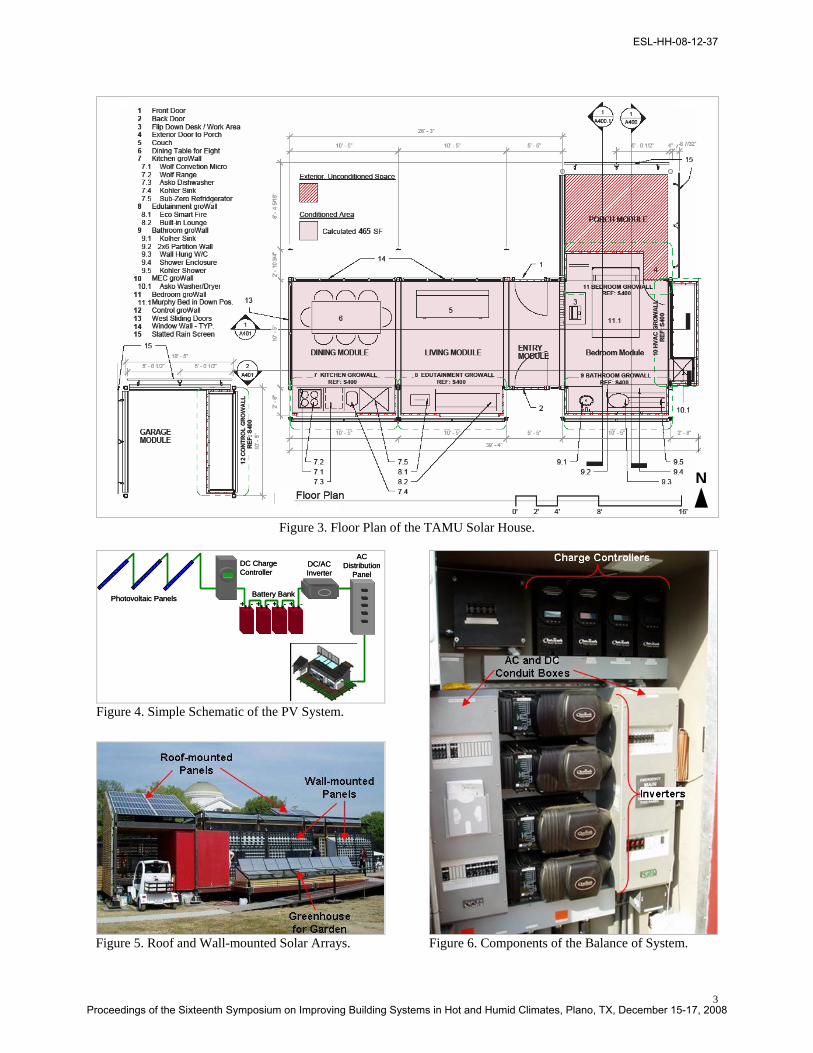
The electrical and mechanical systems of the TAMU groHome include: photovoltaic system with a battery storage, AC electrical system, and solar thermal system integrated with HVAC, domestic hot water (DHW) and plumbing systems. Photovoltaic System
The photovoltaic (PV) system was designed to provide electricity for performing all the household tasks for the competition and charging the electric car for the Getting Around contest. This off-grid PV system is comprised of: PV arrays and a balance of system (BOS) including a battery bank. Figure 4 shows their arrangement in a simple schematic.
The PV arrays include roof-mounted PV panels (36 Suntech STP170 monocrystalline panels) and wall-mounted light-thru panels (18 Suntech MSK Light-Thru panels custom-built with monocrystalline cells) placed in front of the south facing groWalls. The cells within the light-thru PV panels provide partial shading to the windows. Figure 5 shows the PV panels installed on the house. The number of PV panels was determined from the analysis of the daily and peak electricity use of the house. The DC power rating of the total array is approximately 7.5 kW2
2 The PV module power ratings are for Standard Test Conditions (STC) of 1,000 W/m2 irradiance and 25oC PV module temperature.
ESL-HH-08-12-37
Proceedings of the Sixteenth Symposium on Improving Building Systems in Hot and Humid Climates, Plano, TX, December 15-17, 2008
3
Figure 3. Floor Plan of the TAMU Solar House.
DC ChargeController
DC/AC Inverter
AC Distribution
Panel
Photovoltaic Panels+ + ++ - - -
Battery Bank-
DC ChargeController
DC/AC Inverter
AC Distribution
Panel
Photovoltaic Panels+ + ++ - - -+ + ++ - - -
Battery Bank-
Figure 4. Simple Schematic of the PV System.
Figure 5. Roof and Wall-mounted Solar Arrays. Figure 6. Components of the Balance of System.
N
ESL-HH-08-12-37
Proceedings of the Sixteenth Symposium on Improving Building Systems in Hot and Humid Climates, Plano, TX, December 15-17, 2008
4
The main components of BOS include: (i) 4 Outback MX60 charge controllers, 4 Outback FX3048 inverters, DC and AC conduit boxes containing circuit breakers and transformers, housed in the garage groWall (Figure 6), and (ii) a battery bank comprised of 24-2 volt, 1,766 Ah Surrette-Rolls 2KS 33PS batteries, which was located in a ventilated enclosure underneath a raised deck on the west side of the house for the competition.
All electricity loads in the house were carefully
balanced with the inverters to avoid overloading the system with excessive power draw. The batteries were wired in series to obtain 48 volt system voltage. This arrangement ensures uniform charging with minimum impedance that occurs in parallel arrangements of three or more strings of batteries, and is recommended for a prolonged battery life. The DC electricity generated by the PV panels charges the battery bank through the charge controllers. The 48V DC electricity from the batteries is converted to 240V AC electricity through four inverters for use in the house. The battery bank was sized to provide electricity for five days without charging, while allowing a maximum of 50% discharge level3, in order to be prepared for the possibility of overcast sky conditions throughout the 5-day competition.
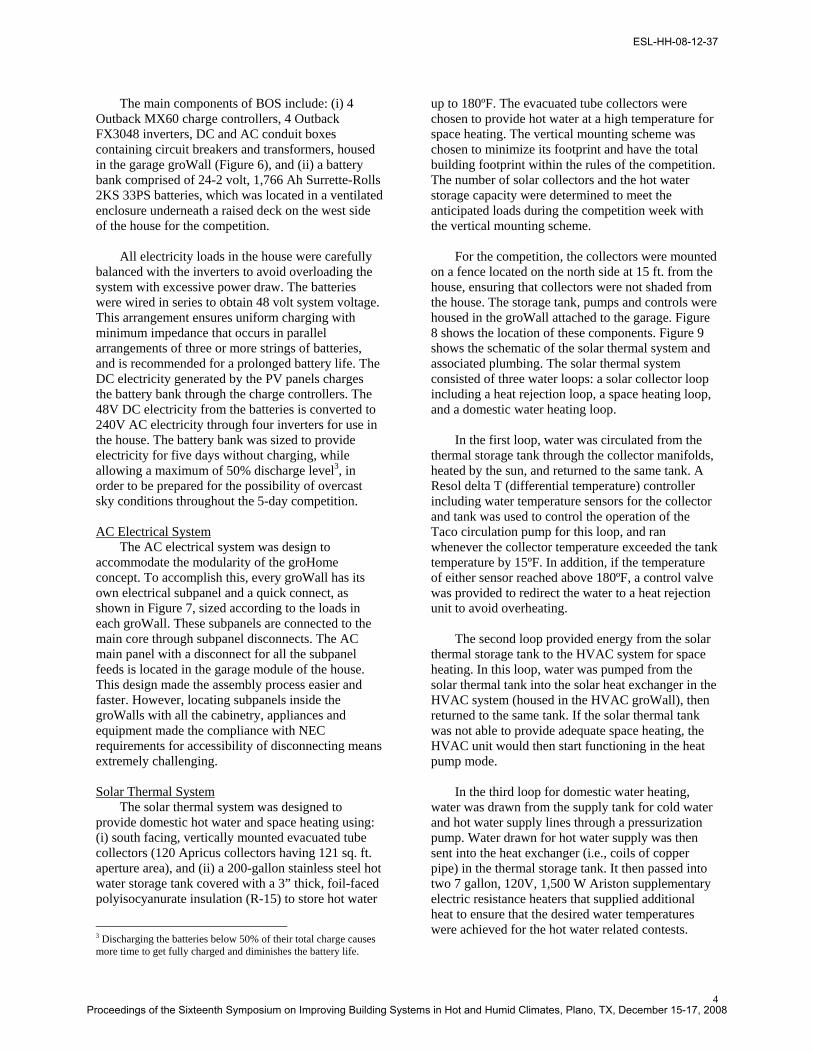
AC Electrical System
The AC electrical system was design to accommodate the modularity of the groHome concept. To accomplish this, every groWall has its own electrical subpanel and a quick connect, as shown in Figure 7, sized according to the loads in each groWall. These subpanels are connected to the main core through subpanel disconnects. The AC main panel with a disconnect for all the subpanel feeds is located in the garage module of the house. This design made the assembly process easier and faster. However, locating subpanels inside the groWalls with all the cabinetry, appliances and equipment made the compliance with NEC requirements for accessibility of disconnecting means extremely challenging. Solar Thermal System
The solar thermal system was designed to provide domestic hot water and space heating using: (i) south facing, vertically mounted evacuated tube collectors (120 Apricus collectors having 121 sq. ft. aperture area), and (ii) a 200-gallon stainless steel hot water storage tank covered with a 3” thick, foil-faced polyisocyanurate insulation (R-15) to store hot water
3 Discharging the batteries below 50% of their total charge causes more time to get fully charged and diminishes the battery life.
up to 180ºF. The evacuated tube collectors were chosen to provide hot water at a high temperature for space heating. The vertical mounting scheme was chosen to minimize its footprint and have the total building footprint within the rules of the competition. The number of solar collectors and the hot water storage capacity were determined to meet the anticipated loads during the competition week with the vertical mounting scheme.
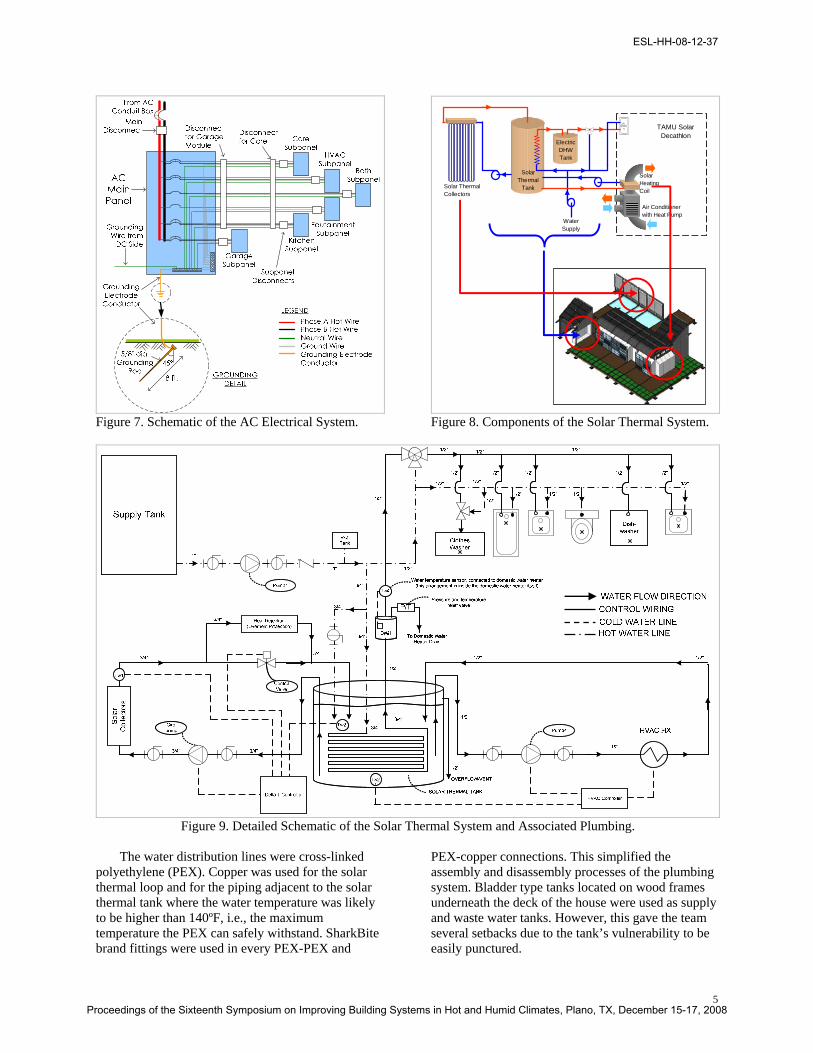
For the competition, the collectors were mounted
on a fence located on the north side at 15 ft. from the house, ensuring that collectors were not shaded from the house. The storage tank, pumps and controls were housed in the groWall attached to the garage. Figure 8 shows the location of these components. Figure 9 shows the schematic of the solar thermal system and associated plumbing. The solar thermal system consisted of three water loops: a solar collector loop including a heat rejection loop, a space heating loop, and a domestic water heating loop.
In the first loop, water was circulated from the thermal storage tank through the collector manifolds, heated by the sun, and returned to the same tank. A Resol delta T (differential temperature) controller including water temperature sensors for the collector and tank was used to control the operation of the Taco circulation pump for this loop, and ran whenever the collector temperature exceeded the tank temperature by 15ºF. In addition, if the temperature of either sensor reached above 180ºF, a control valve was provided to redirect the water to a heat rejection unit to avoid overheating.
The second loop provided energy from the solar thermal storage tank to the HVAC system for space heating. In this loop, water was pumped from the solar thermal tank into the solar heat exchanger in the HVAC system (housed in the HVAC groWall), then returned to the same tank. If the solar thermal tank was not able to provide adequate space heating, the HVAC unit would then start functioning in the heat pump mode.
In the third loop for domestic water heating, water was drawn from the supply tank for cold water and hot water supply lines through a pressurization pump. Water drawn for hot water supply was then sent into the heat exchanger (i.e., coils of copper pipe) in the thermal storage tank. It then passed into two 7 gallon, 120V, 1,500 W Ariston supplementary electric resistance heaters that supplied additional heat to ensure that the desired water temperatures were achieved for the hot water related contests.
ESL-HH-08-12-37
Proceedings of the Sixteenth Symposium on Improving Building Systems in Hot and Humid Climates, Plano, TX, December 15-17, 2008
5
The water distribution lines were cross-linked polyethylene (PEX). Copper was used for the solar thermal loop and for the piping adjacent to the solar thermal tank where the water temperature was likely to be higher than 140ºF, i.e., the maximum temperature the PEX can safely withstand. SharkBite brand fittings were used in every PEX-PEX and
PEX-copper connections. This simplified the assembly and disassembly processes of the plumbing system. Bladder type tanks located on wood frames underneath the deck of the house were used as supply and waste water tanks. However, this gave the team several setbacks due to the tank’s vulnerability to be easily punctured.
Air Conditioner with Heat Pump
Solar Heating Coil
SolarThermal
TankSolar ThermalCollectors
ElectricDHWTank
WaterSupply
TAMU Solar Decathlon
Figure 7. Schematic of the AC Electrical System.
Figure 8. Components of the Solar Thermal System.
Figure 9. Detailed Schematic of the Solar Thermal System and Associated Plumbing.
ESL-HH-08-12-37
Proceedings of the Sixteenth Symposium on Improving Building Systems in Hot and Humid Climates, Plano, TX, December 15-17, 2008
6
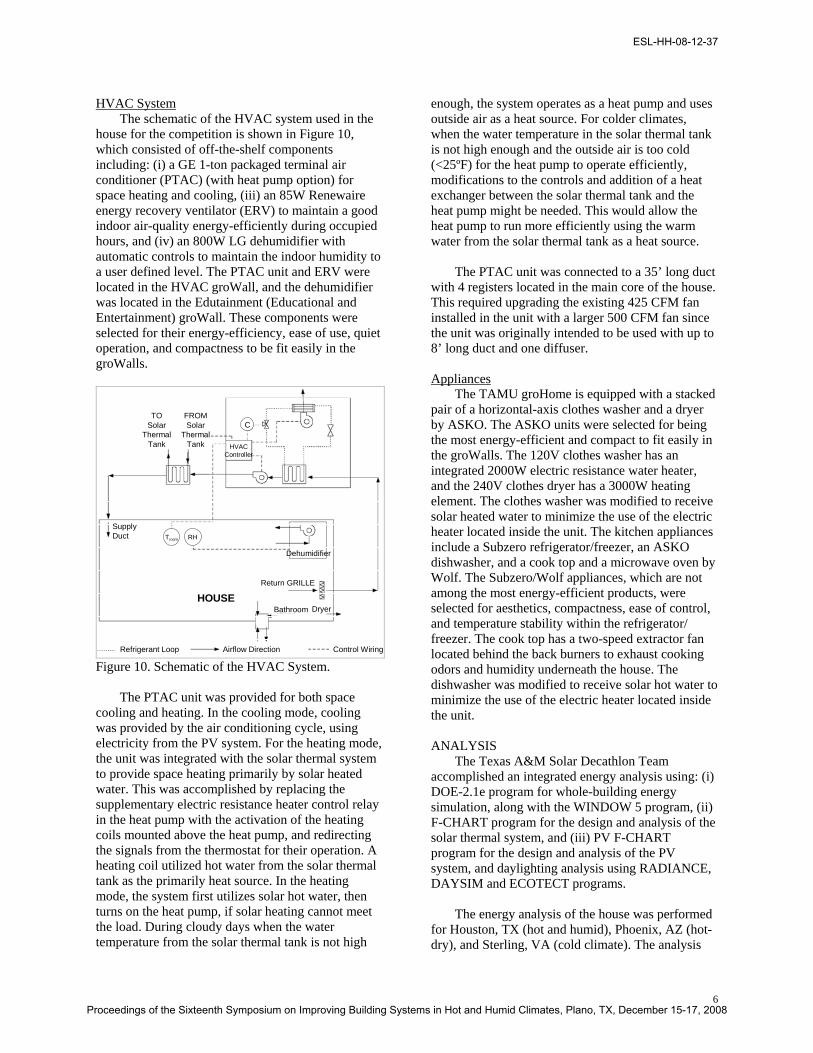
HVAC System The schematic of the HVAC system used in the
house for the competition is shown in Figure 10, which consisted of off-the-shelf components including: (i) a GE 1-ton packaged terminal air conditioner (PTAC) (with heat pump option) for space heating and cooling, (iii) an 85W Renewaire energy recovery ventilator (ERV) to maintain a good indoor air-quality energy-efficiently during occupied hours, and (iv) an 800W LG dehumidifier with automatic controls to maintain the indoor humidity to a user defined level. The PTAC unit and ERV were located in the HVAC groWall, and the dehumidifier was located in the Edutainment (Educational and Entertainment) groWall. These components were selected for their energy-efficiency, ease of use, quiet operation, and compactness to be fit easily in the groWalls.
TOSolar
Thermal Tank
FROMSolar
Thermal Tank
Supply Duct
HOUSEReturn GRILLE
HVAC Controller
C
Dehumidifier
RHTroom
Bathroom Dryer
Refrigerant Loop Airflow Direction Control Wiring
TOSolar
Thermal Tank
FROMSolar
Thermal Tank
Supply Duct
HOUSEReturn GRILLE
HVAC Controller
C
Dehumidifier
RHTroom
Bathroom Dryer
Refrigerant Loop Airflow Direction Control Wiring Figure 10. Schematic of the HVAC System.
The PTAC unit was provided for both space cooling and heating. In the cooling mode, cooling was provided by the air conditioning cycle, using electricity from the PV system. For the heating mode, the unit was integrated with the solar thermal system to provide space heating primarily by solar heated water. This was accomplished by replacing the supplementary electric resistance heater control relay in the heat pump with the activation of the heating coils mounted above the heat pump, and redirecting the signals from the thermostat for their operation. A heating coil utilized hot water from the solar thermal tank as the primarily heat source. In the heating mode, the system first utilizes solar hot water, then turns on the heat pump, if solar heating cannot meet the load. During cloudy days when the water temperature from the solar thermal tank is not high
enough, the system operates as a heat pump and uses outside air as a heat source. For colder climates, when the water temperature in the solar thermal tank is not high enough and the outside air is too cold (<25ºF) for the heat pump to operate efficiently, modifications to the controls and addition of a heat exchanger between the solar thermal tank and the heat pump might be needed. This would allow the heat pump to run more efficiently using the warm water from the solar thermal tank as a heat source.
The PTAC unit was connected to a 35’ long duct
with 4 registers located in the main core of the house. This required upgrading the existing 425 CFM fan installed in the unit with a larger 500 CFM fan since the unit was originally intended to be used with up to 8’ long duct and one diffuser. Appliances
The TAMU groHome is equipped with a stacked pair of a horizontal-axis clothes washer and a dryer by ASKO. The ASKO units were selected for being the most energy-efficient and compact to fit easily in the groWalls. The 120V clothes washer has an integrated 2000W electric resistance water heater, and the 240V clothes dryer has a 3000W heating element. The clothes washer was modified to receive solar heated water to minimize the use of the electric heater located inside the unit. The kitchen appliances include a Subzero refrigerator/freezer, an ASKO dishwasher, and a cook top and a microwave oven by Wolf. The Subzero/Wolf appliances, which are not among the most energy-efficient products, were selected for aesthetics, compactness, ease of control, and temperature stability within the refrigerator/ freezer. The cook top has a two-speed extractor fan located behind the back burners to exhaust cooking odors and humidity underneath the house. The dishwasher was modified to receive solar hot water to minimize the use of the electric heater located inside the unit. ANALYSIS
The Texas A&M Solar Decathlon Team accomplished an integrated energy analysis using: (i) DOE-2.1e program for whole-building energy simulation, along with the WINDOW 5 program, (ii) F-CHART program for the design and analysis of the solar thermal system, and (iii) PV F-CHART program for the design and analysis of the PV system, and daylighting analysis using RADIANCE, DAYSIM and ECOTECT programs.
The energy analysis of the house was performed for Houston, TX (hot and humid), Phoenix, AZ (hot-dry), and Sterling, VA (cold climate). The analysis
ESL-HH-08-12-37
Proceedings of the Sixteenth Symposium on Improving Building Systems in Hot and Humid Climates, Plano, TX, December 15-17, 2008
7
presented in this paper is for Houston and Sterling, only. The overall analysis procedure for the simulation is shown in Figure 11. This combination of tools allowed for rapid, yet accurate estimations of energy needs and the electricity production for various design alternatives of the building and systems throughout the analysis. Analysis of Energy Use
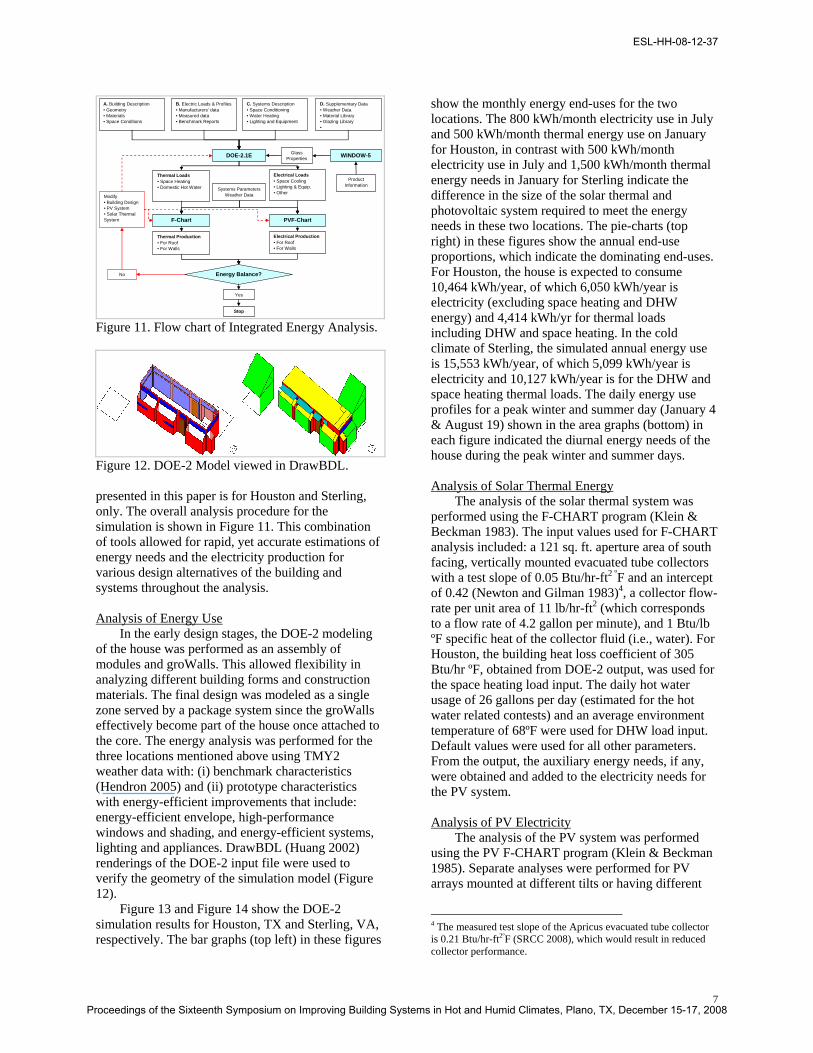
In the early design stages, the DOE-2 modeling of the house was performed as an assembly of modules and groWalls. This allowed flexibility in analyzing different building forms and construction materials. The final design was modeled as a single zone served by a package system since the groWalls effectively become part of the house once attached to the core. The energy analysis was performed for the three locations mentioned above using TMY2 weather data with: (i) benchmark characteristics (Hendron 2005) and (ii) prototype characteristics with energy-efficient improvements that include: energy-efficient envelope, high-performance windows and shading, and energy-efficient systems, lighting and appliances. DrawBDL (Huang 2002) renderings of the DOE-2 input file were used to verify the geometry of the simulation model (Figure 12).
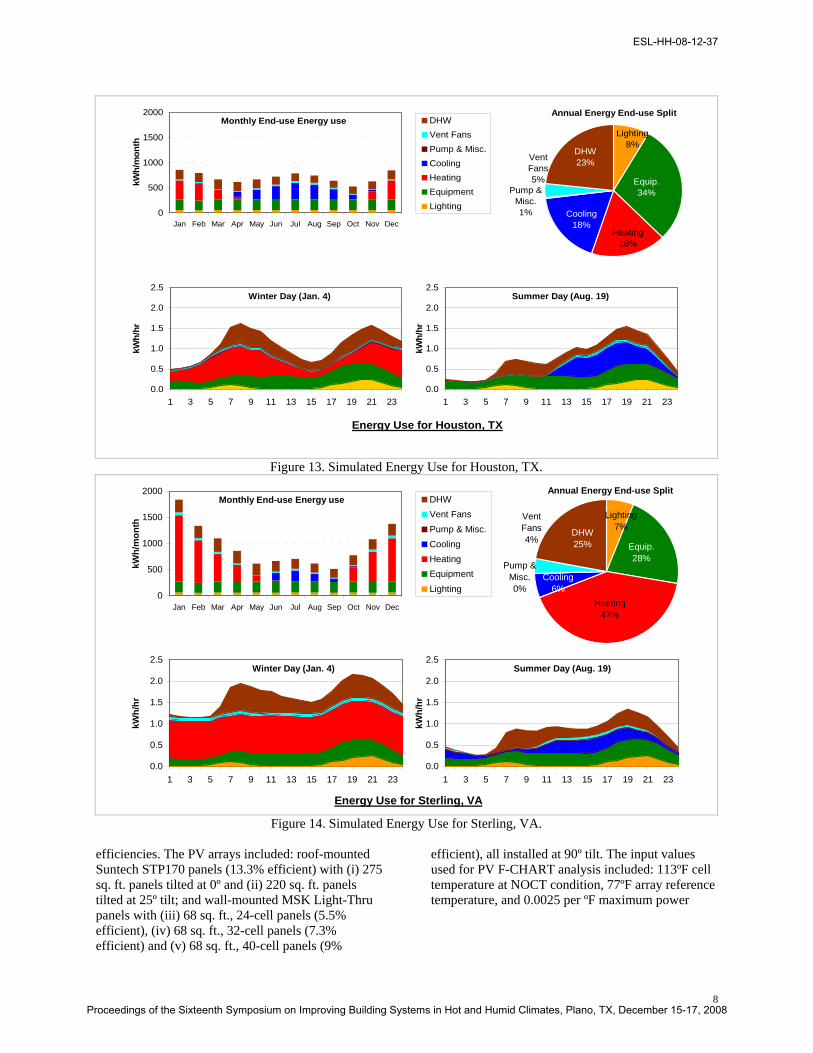
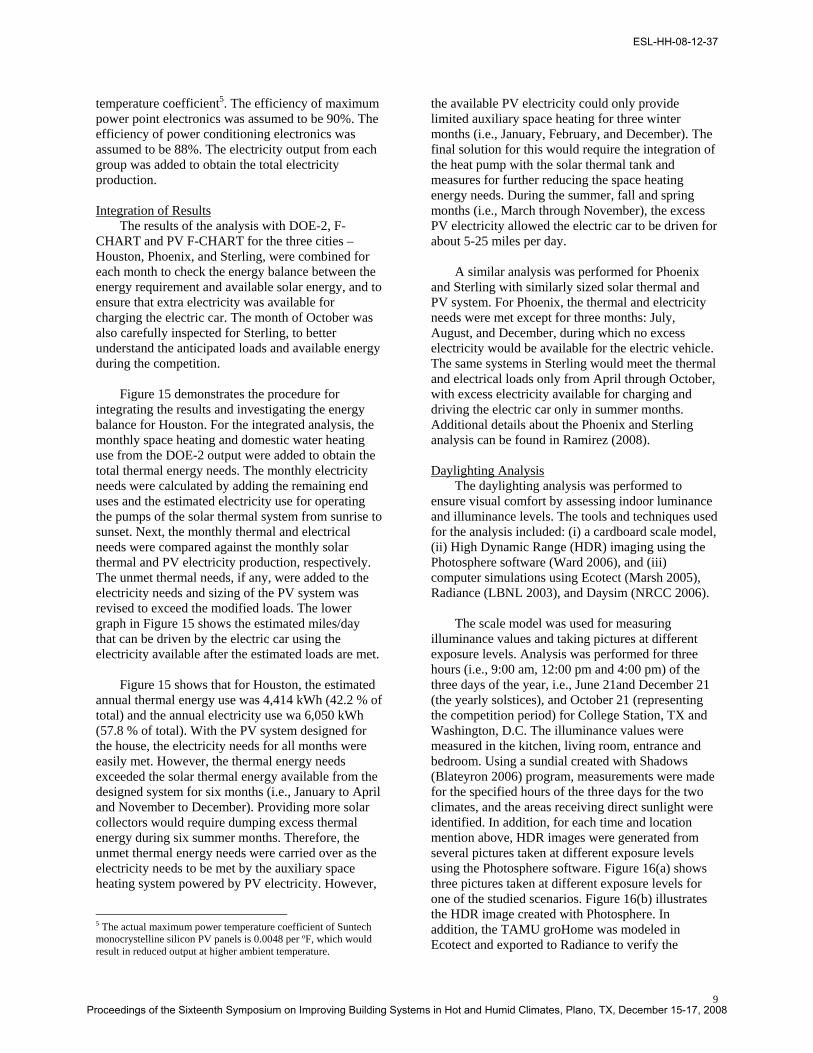
Figure 13 and Figure 14 show the DOE-2 simulation results for Houston, TX and Sterling, VA, respectively. The bar graphs (top left) in these figures
show the monthly energy end-uses for the two locations. The 800 kWh/month electricity use in July and 500 kWh/month thermal energy use on January for Houston, in contrast with 500 kWh/month electricity use in July and 1,500 kWh/month thermal energy needs in January for Sterling indicate the difference in the size of the solar thermal and photovoltaic system required to meet the energy needs in these two locations. The pie-charts (top right) in these figures show the annual end-use proportions, which indicate the dominating end-uses. For Houston, the house is expected to consume 10,464 kWh/year, of which 6,050 kWh/year is electricity (excluding space heating and DHW energy) and 4,414 kWh/yr for thermal loads including DHW and space heating. In the cold climate of Sterling, the simulated annual energy use is 15,553 kWh/year, of which 5,099 kWh/year is electricity and 10,127 kWh/year is for the DHW and space heating thermal loads. The daily energy use profiles for a peak winter and summer day (January 4 & August 19) shown in the area graphs (bottom) in each figure indicated the diurnal energy needs of the house during the peak winter and summer days. Analysis of Solar Thermal Energy
The analysis of the solar thermal system was performed using the F-CHART program (Klein & Beckman 1983). The input values used for F-CHART analysis included: a 121 sq. ft. aperture area of south facing, vertically mounted evacuated tube collectors with a test slope of 0.05 Btu/hr-ft2 ºF and an intercept of 0.42 (Newton and Gilman 1983)4, a collector flow-rate per unit area of 11 lb/hr-ft2 (which corresponds to a flow rate of 4.2 gallon per minute), and 1 Btu/lb ºF specific heat of the collector fluid (i.e., water). For Houston, the building heat loss coefficient of 305 Btu/hr ºF, obtained from DOE-2 output, was used for the space heating load input. The daily hot water usage of 26 gallons per day (estimated for the hot water related contests) and an average environment temperature of 68ºF were used for DHW load input. Default values were used for all other parameters. From the output, the auxiliary energy needs, if any, were obtained and added to the electricity needs for the PV system. Analysis of PV Electricity
The analysis of the PV system was performed using the PV F-CHART program (Klein & Beckman 1985). Separate analyses were performed for PV arrays mounted at different tilts or having different
4 The measured test slope of the Apricus evacuated tube collector is 0.21 Btu/hr-ft2ºF (SRCC 2008), which would result in reduced collector performance.
DOE-2.1E
A. Building Description• Geometry• Materials• Space Conditions
B. Electric Loads & Profiles• Manufacturers’ data• Measured data• Benchmark Reports
D. Supplementary Data• Weather Data• Material Library• Glazing Library•
Stop
Electrical Loads • Space Cooling• Lighting & Equip.• Other
F-Chart
Electrical Production• For Roof• For Walls
PVF-Chart
Thermal Loads• Space Heating • Domestic Hot Water
Thermal Production• For Roof• For Walls
Yes
No
Modify• Building Design• PV System• Solar Thermal System
Energy Balance?
Systems ParametersWeather Data
C. Systems Description • Space Conditioning• Water Heating• Lighting and Equipment
Product Information
WINDOW-5Glass Properties
Figure 11. Flow chart of Integrated Energy Analysis.
Figure 12. DOE-2 Model viewed in DrawBDL.
ESL-HH-08-12-37
Proceedings of the Sixteenth Symposium on Improving Building Systems in Hot and Humid Climates, Plano, TX, December 15-17, 2008
8
efficiencies. The PV arrays included: roof-mounted Suntech STP170 panels (13.3% efficient) with (i) 275 sq. ft. panels tilted at 0º and (ii) 220 sq. ft. panels tilted at 25º tilt; and wall-mounted MSK Light-Thru panels with (iii) 68 sq. ft., 24-cell panels (5.5% efficient), (iv) 68 sq. ft., 32-cell panels (7.3% efficient) and (v) 68 sq. ft., 40-cell panels (9%
efficient), all installed at 90º tilt. The input values used for PV F-CHART analysis included: 113ºF cell temperature at NOCT condition, 77ºF array reference temperature, and 0.0025 per ºF maximum power
Monthly End-use Energy use
0
500
1000
1500
2000
Jan Feb Mar Apr May Jun Jul Aug Sep Oct Nov Dec
kWh/
mon
th
DHW Vent FansPump & Misc.CoolingHeatingEquipmentLighting
Annual Energy End-use Split
Pump & Misc. 1%
Vent Fans 5%
DHW 23%
Cooling 18%
Heating 18%
Equip. 34%
Lighting 8%
Energy Use for Houston, TX
Winter Day (Jan. 4)
0.0
0.5
1.0
1.5
2.0
2.5
1 3 5 7 9 11 13 15 17 19 21 23
kWh/
hr
Summer Day (Aug. 19)
0.0
0.5
1.0
1.5
2.0
2.5
1 3 5 7 9 11 13 15 17 19 21 23
kWh/
hr
Figure 13. Simulated Energy Use for Houston, TX.
Summer Day (Aug. 19)
0.0
0.5
1.0
1.5
2.0
2.5
1 3 5 7 9 11 13 15 17 19 21 23
kWh/
hr
Monthly End-use Energy use
0
500
1000
1500
2000
Jan Feb Mar Apr May Jun Jul Aug Sep Oct Nov Dec
kWh/
mon
th
DHW Vent FansPump & Misc.CoolingHeatingEquipmentLighting
Annual Energy End-use Split
DHW 25% Equip.
28%
Lighting 7%
Heating 47%
Vent Fans 4%
Pump & Misc. 0%
Cooling 6%
Energy Use for Sterling, VA
Winter Day (Jan. 4)
0.0
0.5
1.0
1.5
2.0
2.5
1 3 5 7 9 11 13 15 17 19 21 23
kWh/
hr
Figure 14. Simulated Energy Use for Sterling, VA.
ESL-HH-08-12-37
Proceedings of the Sixteenth Symposium on Improving Building Systems in Hot and Humid Climates, Plano, TX, December 15-17, 2008
9
temperature coefficient5. The efficiency of maximum power point electronics was assumed to be 90%. The efficiency of power conditioning electronics was assumed to be 88%. The electricity output from each group was added to obtain the total electricity production. Integration of Results
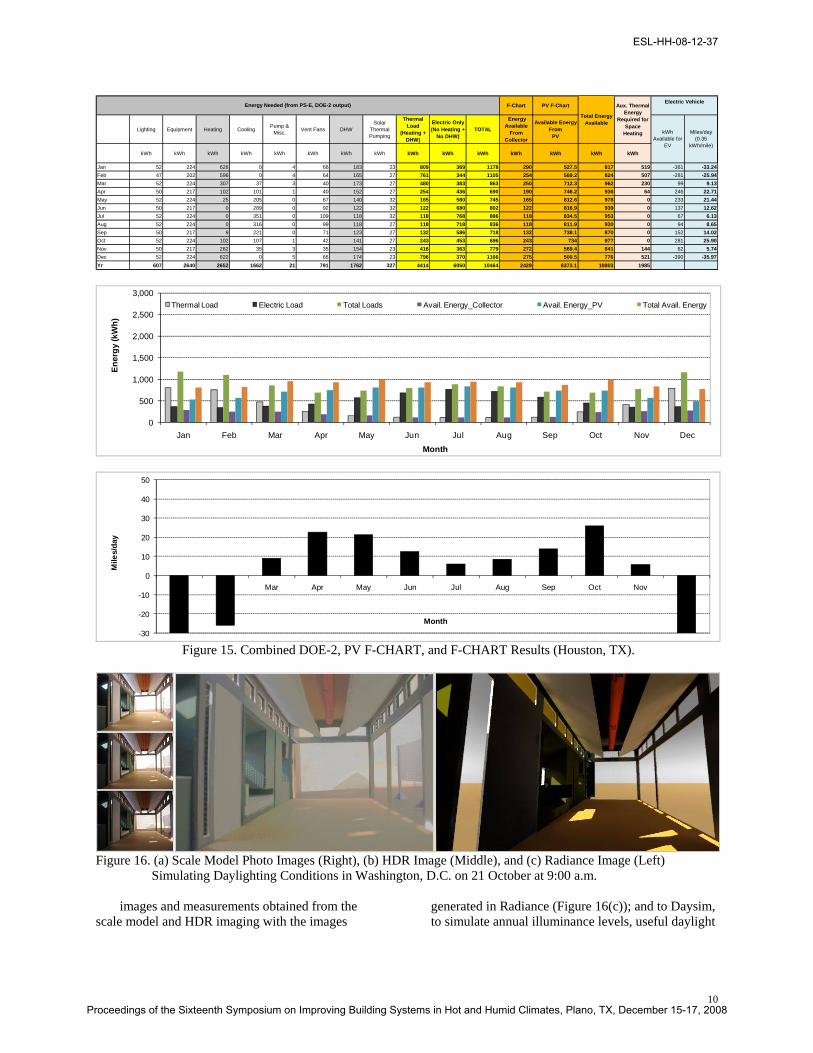
The results of the analysis with DOE-2, F-CHART and PV F-CHART for the three cities – Houston, Phoenix, and Sterling, were combined for each month to check the energy balance between the energy requirement and available solar energy, and to ensure that extra electricity was available for charging the electric car. The month of October was also carefully inspected for Sterling, to better understand the anticipated loads and available energy during the competition.
Figure 15 demonstrates the procedure for integrating the results and investigating the energy balance for Houston. For the integrated analysis, the monthly space heating and domestic water heating use from the DOE-2 output were added to obtain the total thermal energy needs. The monthly electricity needs were calculated by adding the remaining end uses and the estimated electricity use for operating the pumps of the solar thermal system from sunrise to sunset. Next, the monthly thermal and electrical needs were compared against the monthly solar thermal and PV electricity production, respectively. The unmet thermal needs, if any, were added to the electricity needs and sizing of the PV system was revised to exceed the modified loads. The lower graph in Figure 15 shows the estimated miles/day that can be driven by the electric car using the electricity available after the estimated loads are met.
Figure 15 shows that for Houston, the estimated annual thermal energy use was 4,414 kWh (42.2 % of total) and the annual electricity use wa 6,050 kWh (57.8 % of total). With the PV system designed for the house, the electricity needs for all months were easily met. However, the thermal energy needs exceeded the solar thermal energy available from the designed system for six months (i.e., January to April and November to December). Providing more solar collectors would require dumping excess thermal energy during six summer months. Therefore, the unmet thermal energy needs were carried over as the electricity needs to be met by the auxiliary space heating system powered by PV electricity. However,
5 The actual maximum power temperature coefficient of Suntech monocrystelline silicon PV panels is 0.0048 per ºF, which would result in reduced output at higher ambient temperature.
the available PV electricity could only provide limited auxiliary space heating for three winter months (i.e., January, February, and December). The final solution for this would require the integration of the heat pump with the solar thermal tank and measures for further reducing the space heating energy needs. During the summer, fall and spring months (i.e., March through November), the excess PV electricity allowed the electric car to be driven for about 5-25 miles per day.
A similar analysis was performed for Phoenix and Sterling with similarly sized solar thermal and PV system. For Phoenix, the thermal and electricity needs were met except for three months: July, August, and December, during which no excess electricity would be available for the electric vehicle. The same systems in Sterling would meet the thermal and electrical loads only from April through October, with excess electricity available for charging and driving the electric car only in summer months. Additional details about the Phoenix and Sterling analysis can be found in Ramirez (2008). Daylighting Analysis
The daylighting analysis was performed to ensure visual comfort by assessing indoor luminance and illuminance levels. The tools and techniques used for the analysis included: (i) a cardboard scale model, (ii) High Dynamic Range (HDR) imaging using the Photosphere software (Ward 2006), and (iii) computer simulations using Ecotect (Marsh 2005), Radiance (LBNL 2003), and Daysim (NRCC 2006).
The scale model was used for measuring illuminance values and taking pictures at different exposure levels. Analysis was performed for three hours (i.e., 9:00 am, 12:00 pm and 4:00 pm) of the three days of the year, i.e., June 21and December 21 (the yearly solstices), and October 21 (representing the competition period) for College Station, TX and Washington, D.C. The illuminance values were measured in the kitchen, living room, entrance and bedroom. Using a sundial created with Shadows (Blateyron 2006) program, measurements were made for the specified hours of the three days for the two climates, and the areas receiving direct sunlight were identified. In addition, for each time and location mention above, HDR images were generated from several pictures taken at different exposure levels using the Photosphere software. Figure 16(a) shows three pictures taken at different exposure levels for one of the studied scenarios. Figure 16(b) illustrates the HDR image created with Photosphere. In addition, the TAMU groHome was modeled in Ecotect and exported to Radiance to verify the
ESL-HH-08-12-37
Proceedings of the Sixteenth Symposium on Improving Building Systems in Hot and Humid Climates, Plano, TX, December 15-17, 2008
10
Figure 16. (a) Scale Model Photo Images (Right), (b) HDR Image (Middle), and (c) Radiance Image (Left) Simulating Daylighting Conditions in Washington, D.C. on 21 October at 9:00 a.m.
images and measurements obtained from the
scale model and HDR imaging with the images generated in Radiance (Figure 16(c)); and to Daysim, to simulate annual illuminance levels, useful daylight
F-Chart PV F-Chart
Lighting Equipment Heating Cooling Pump & Misc. Vent Fans DHW
Solar Thermal Pumping
Thermal Load
(Heating + DHW)
Electric Only (No Heating +
No DHW)TOTAL
Energy Available
From Collector
Available Energy From
PV
kWh kWh kWh kWh kWh kWh kWh kWh kWh kWh kWh kWh kWh kWh kWh
Jan 52 224 626 0 4 66 183 23 809 369 1178 290 527.5 817 519 -361 -33.24Feb 47 202 596 0 4 64 165 27 761 344 1105 254 569.2 824 507 -281 -25.94Mar 52 224 307 37 3 40 173 27 480 383 863 250 712.3 962 230 99 9.13Apr 50 217 102 101 1 40 152 27 254 436 690 190 746.2 936 64 246 22.71May 52 224 25 205 0 67 140 32 165 580 745 165 812.6 978 0 233 21.44Jun 50 217 0 289 0 92 122 32 122 680 802 122 816.9 939 0 137 12.62Jul 52 224 0 351 0 109 118 32 118 768 886 118 834.5 953 0 67 6.13Aug 52 224 0 316 0 99 118 27 118 718 836 118 811.9 930 0 94 8.65Sep 50 217 9 221 0 71 123 27 132 586 718 132 738.1 870 0 152 14.02Oct 52 224 102 107 1 42 141 27 243 453 696 243 734 977 0 281 25.90Nov 50 217 262 35 3 35 154 23 416 363 779 272 569.4 841 144 62 5.74Dec 52 224 622 0 5 66 174 23 796 370 1166 275 500.5 776 521 -390 -35.97Yr 607 2640 2652 1662 21 791 1762 327 4414 6050 10464 2429 8373.1 10803 1985
Energy Needed (from PS-E, DOE-2 output) Electric Vehicle
kWh Available for
EV
Miles/day (0.35
kWh/mile)
Total Energy Available
Aux. Thermal Energy
Required for Space
Heating
0
500
1,000
1,500
2,000
2,500
3,000
Jan Feb Mar Apr May Jun Jul Aug Sep Oct Nov Dec
Ener
gy (k
Wh)
Month
Thermal Load Electric Load Total Loads Avail. Energy_Collector Avail. Energy_PV Total Avail. Energy
0
500
1,000
1,500
2,000
2,500
3,000
Jan Feb Mar Apr May Jun Jul Aug Sep Oct Nov Dec
Ener
gy (k
Wh)
Month
Thermal Load Electric Load Total Loads Avail. Energy_Collector Avail. Energy_PV Total Avail. Energy
-30
-20
-10
0
10
20
30
40
50
Jan Feb Mar Apr May Jun Jul Aug Sep Oct Nov Dec
Mile
s/da
y
Month
Figure 15. Combined DOE-2, PV F-CHART, and F-CHART Results (Houston, TX).
ESL-HH-08-12-37
Proceedings of the Sixteenth Symposium on Improving Building Systems in Hot and Humid Climates, Plano, TX, December 15-17, 2008
11
index6 (UDI) and daylight autonomy7 (DA) levels for College Station and Washington, D.C. (Figure 17). This analysis identified several areas that needed redesigning, such as the west and north façade where direct sun light would cause visual discomfort for the occupants. Based on the results, the design was modified in order to improve daylighting. CONSTRUCTION ON-CAMPUS
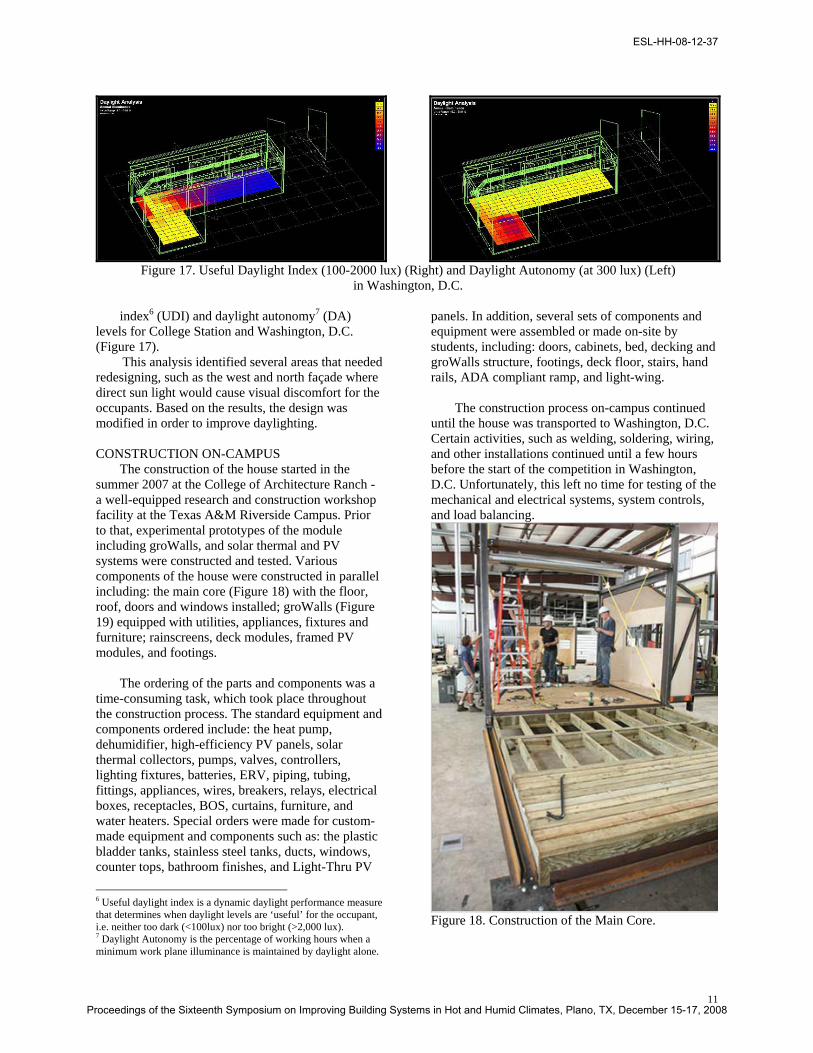
The construction of the house started in the summer 2007 at the College of Architecture Ranch - a well-equipped research and construction workshop facility at the Texas A&M Riverside Campus. Prior to that, experimental prototypes of the module including groWalls, and solar thermal and PV systems were constructed and tested. Various components of the house were constructed in parallel including: the main core (Figure 18) with the floor, roof, doors and windows installed; groWalls (Figure 19) equipped with utilities, appliances, fixtures and furniture; rainscreens, deck modules, framed PV modules, and footings.
The ordering of the parts and components was a time-consuming task, which took place throughout the construction process. The standard equipment and components ordered include: the heat pump, dehumidifier, high-efficiency PV panels, solar thermal collectors, pumps, valves, controllers, lighting fixtures, batteries, ERV, piping, tubing, fittings, appliances, wires, breakers, relays, electrical boxes, receptacles, BOS, curtains, furniture, and water heaters. Special orders were made for custom-made equipment and components such as: the plastic bladder tanks, stainless steel tanks, ducts, windows, counter tops, bathroom finishes, and Light-Thru PV
6 Useful daylight index is a dynamic daylight performance measure that determines when daylight levels are ‘useful’ for the occupant, i.e. neither too dark (<100lux) nor too bright (>2,000 lux). 7 Daylight Autonomy is the percentage of working hours when a minimum work plane illuminance is maintained by daylight alone.
panels. In addition, several sets of components and equipment were assembled or made on-site by students, including: doors, cabinets, bed, decking and groWalls structure, footings, deck floor, stairs, hand rails, ADA compliant ramp, and light-wing.
The construction process on-campus continued until the house was transported to Washington, D.C. Certain activities, such as welding, soldering, wiring, and other installations continued until a few hours before the start of the competition in Washington, D.C. Unfortunately, this left no time for testing of the mechanical and electrical systems, system controls, and load balancing.
Figure 18. Construction of the Main Core.
Figure 17. Useful Daylight Index (100-2000 lux) (Right) and Daylight Autonomy (at 300 lux) (Left)
in Washington, D.C.
ESL-HH-08-12-37
Proceedings of the Sixteenth Symposium on Improving Building Systems in Hot and Humid Climates, Plano, TX, December 15-17, 2008
12
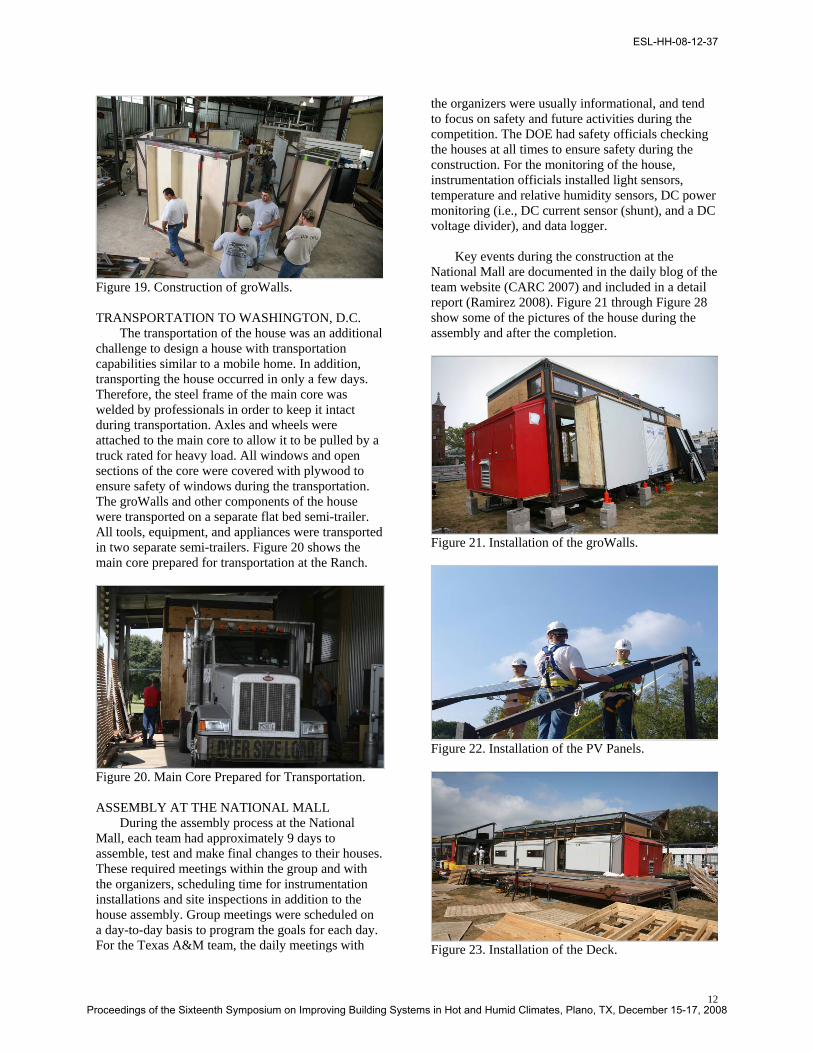
Figure 19. Construction of groWalls. TRANSPORTATION TO WASHINGTON, D.C.
The transportation of the house was an additional challenge to design a house with transportation capabilities similar to a mobile home. In addition, transporting the house occurred in only a few days. Therefore, the steel frame of the main core was welded by professionals in order to keep it intact during transportation. Axles and wheels were attached to the main core to allow it to be pulled by a truck rated for heavy load. All windows and open sections of the core were covered with plywood to ensure safety of windows during the transportation. The groWalls and other components of the house were transported on a separate flat bed semi-trailer. All tools, equipment, and appliances were transported in two separate semi-trailers. Figure 20 shows the main core prepared for transportation at the Ranch.
Figure 20. Main Core Prepared for Transportation. ASSEMBLY AT THE NATIONAL MALL
During the assembly process at the National Mall, each team had approximately 9 days to assemble, test and make final changes to their houses. These required meetings within the group and with the organizers, scheduling time for instrumentation installations and site inspections in addition to the house assembly. Group meetings were scheduled on a day-to-day basis to program the goals for each day. For the Texas A&M team, the daily meetings with
the organizers were usually informational, and tend to focus on safety and future activities during the competition. The DOE had safety officials checking the houses at all times to ensure safety during the construction. For the monitoring of the house, instrumentation officials installed light sensors, temperature and relative humidity sensors, DC power monitoring (i.e., DC current sensor (shunt), and a DC voltage divider), and data logger.
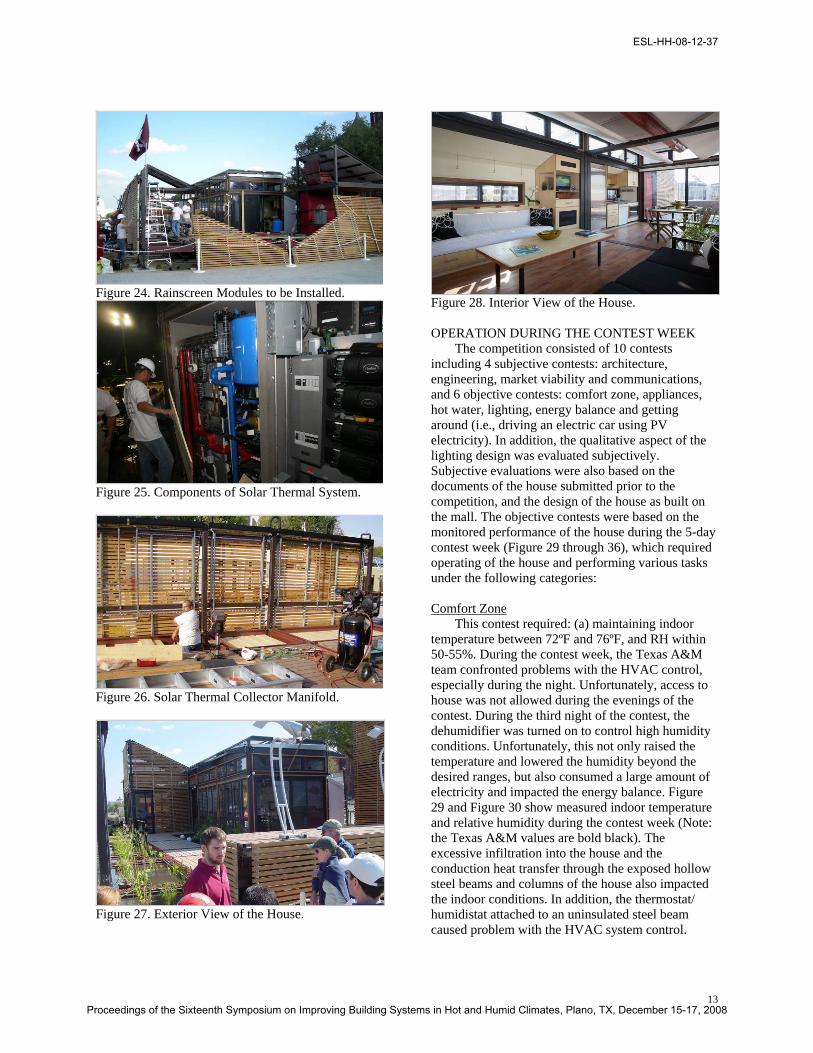
Key events during the construction at the National Mall are documented in the daily blog of the team website (CARC 2007) and included in a detail report (Ramirez 2008). Figure 21 through Figure 28 show some of the pictures of the house during the assembly and after the completion.
Figure 21. Installation of the groWalls.
Figure 22. Installation of the PV Panels.
Figure 23. Installation of the Deck.
ESL-HH-08-12-37
Proceedings of the Sixteenth Symposium on Improving Building Systems in Hot and Humid Climates, Plano, TX, December 15-17, 2008
13
Figure 24. Rainscreen Modules to be Installed.
Figure 25. Components of Solar Thermal System.
Figure 26. Solar Thermal Collector Manifold.
Figure 27. Exterior View of the House.
Figure 28. Interior View of the House. OPERATION DURING THE CONTEST WEEK
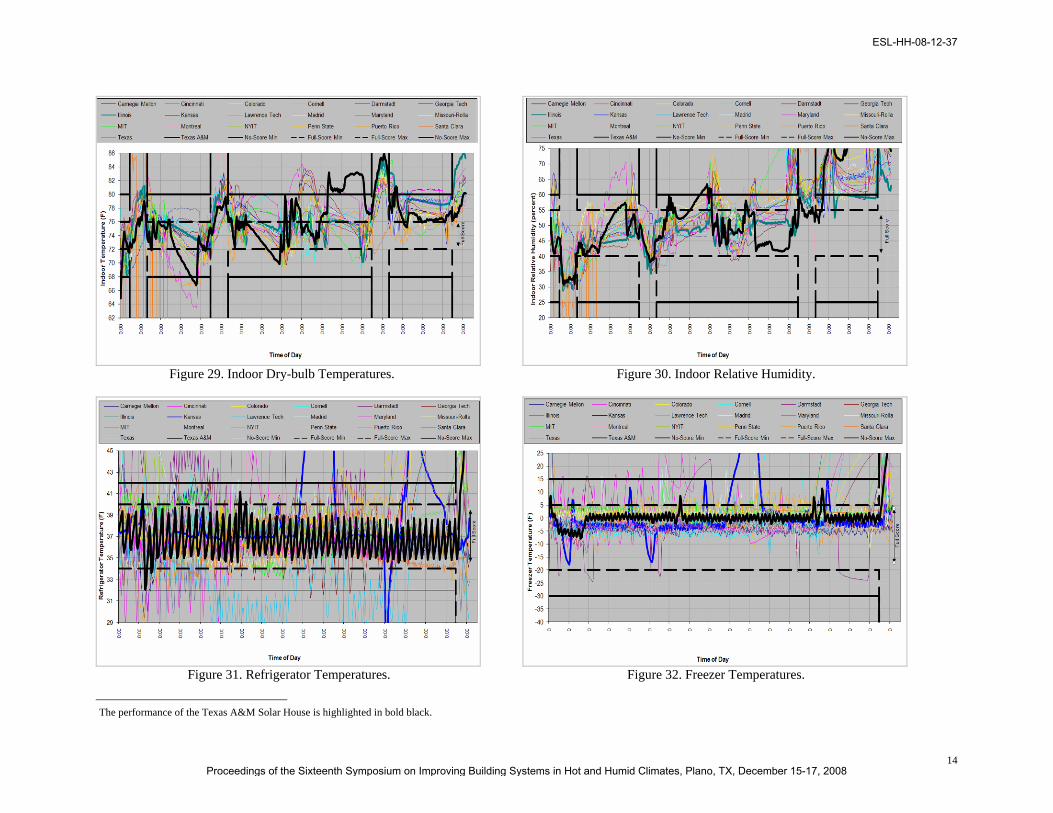
The competition consisted of 10 contests including 4 subjective contests: architecture, engineering, market viability and communications, and 6 objective contests: comfort zone, appliances, hot water, lighting, energy balance and getting around (i.e., driving an electric car using PV electricity). In addition, the qualitative aspect of the lighting design was evaluated subjectively. Subjective evaluations were also based on the documents of the house submitted prior to the competition, and the design of the house as built on the mall. The objective contests were based on the monitored performance of the house during the 5-day contest week (Figure 29 through 36), which required operating of the house and performing various tasks under the following categories: Comfort Zone
This contest required: (a) maintaining indoor temperature between 72ºF and 76ºF, and RH within 50-55%. During the contest week, the Texas A&M team confronted problems with the HVAC control, especially during the night. Unfortunately, access to house was not allowed during the evenings of the contest. During the third night of the contest, the dehumidifier was turned on to control high humidity conditions. Unfortunately, this not only raised the temperature and lowered the humidity beyond the desired ranges, but also consumed a large amount of electricity and impacted the energy balance. Figure 29 and Figure 30 show measured indoor temperature and relative humidity during the contest week (Note: the Texas A&M values are bold black). The excessive infiltration into the house and the conduction heat transfer through the exposed hollow steel beams and columns of the house also impacted the indoor conditions. In addition, the thermostat/ humidistat attached to an uninsulated steel beam caused problem with the HVAC system control.
ESL-HH-08-12-37
Proceedings of the Sixteenth Symposium on Improving Building Systems in Hot and Humid Climates, Plano, TX, December 15-17, 2008
14
8The performance of the Texas A&M Solar House is highlighted in bold black.
Figure 29. Indoor Dry-bulb Temperatures.8
Figure 30. Indoor Relative Humidity.
Figure 31. Refrigerator Temperatures. Figure 32. Freezer Temperatures.
ESL-HH-08-12-37
Proceedings of the Sixteenth Symposium on Improving Building Systems in Hot and Humid Climates, Plano, TX, December 15-17, 2008
15
9The performance of the Texas A&M Solar House is highlighted in bold black.
Figure 33. Indoor Light Levels. Figure 34. Global Horizontal Insolation.
Figure 35. Energy Balance.9 Figure 36. Battery Voltage.
ESL-HH-08-12-37
Proceedings of the Sixteenth Symposium on Improving Building Systems in Hot and Humid Climates, Plano, TX, December 15-17, 2008
16
These problems will need to be remedied to improve the operation of the house. Appliances
The appliance contest required: (a) maintaining refrigerator temperature within the 34ºF to 40ºF range, and freezer temperature within the 20ºF to 5ºF range; (b) using the dishwasher with normal settings to achieve 120ºF water temperature at some point during the cycle; (c) vaporizing 5 lbs of water in less than two hours using a cooking appliance; (d) washing and drying of 12 towels twice during the contest period while achieving 110F water temperature during the wash cycle; and (e) operating a computer and a television for specified period everyday during the contest.
Figure 31 and Figure 32show the refrigerator and freezer temperatures monitored during the contest week, which were within the limits most of the time to obtain full credit. The exception occurred during the time when the dinner contest was held. In addition, after observing a narrow throttling range of the freezer temperature during the first day, the freezer temperature set point was increased from -6ºF to 2ºF, to save electricity consumption while ensuring full credit. Hot Water
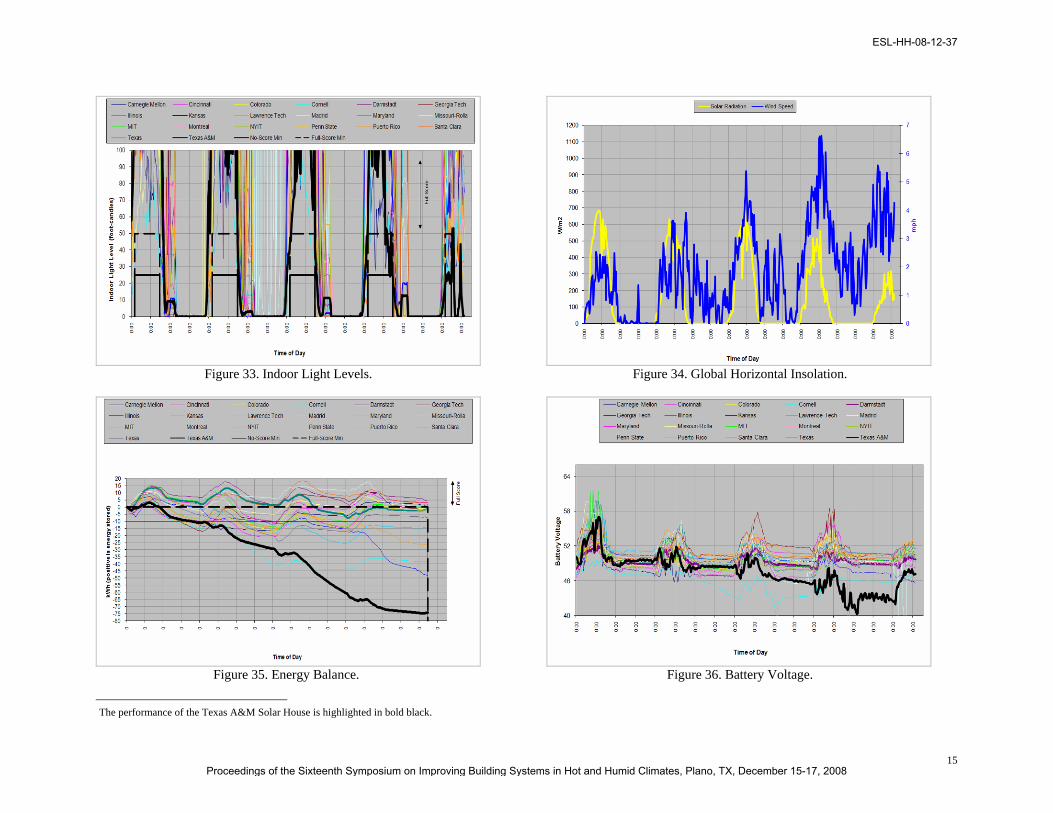
The hot water contest included two shower tests per day delivering 15 gallons of hot water at an average temperature of at least 110ºF in no more than 10 min. The Texas A&M team planned carefully for this contest during the design process. In order to cut the electricity consumption of the main pressurization pump, a 36 gallon pressurized tank was chosen. This allowed the team to provide one full shower test without starting the main pump. Due to the long distance between the water heaters and the shower, it was also necessary to remove the cold water from the hot water lines one minute before each shower test. Lighting
The lighting contest required: (a) maintaining daytime workstation lighting level above 50 fc; (b) maintaining minimum specified task lighting levels in the kitchen and lavatory; (c) operating all the installed interior and exterior lighting during evenings. Figure 34 shows the lighting levels at the work station, which was above the desired level for the first three days of the contest using daylighting only. Unfortunately, the lighting levels could not be maintained during the fourth day, due to the overcast sky conditions combined with shading of the light sensors during the public tours, and on the last day
due to a broken shading device on the east clerestory window, which took 20-30 minutes to be fixed. Energy Balance
The energy balance contest required providing all electricity for the building operation from solar energy. The getting around contest required driving an electric car charged using solar energy. Figure 34, Figure 35 and Figure 36 show the global horizontal insolation, energy balance and battery voltage, respectively, indicating the performance of the TAMU groHome PV system during the contest week. Unfortunately, the Texas A&M team was not able to maintain the energy balance due to several reasons. As observed from these figures, the PV system produced only 5.5 kWh during the first day of the competition (compared to 15 KWh from most teams). One of the reasons for this poor performance was a blown circuit breaker that disconnected about one half of the PV panels. This was not discovered until after the competition during the disassembly. FINAL STANDING
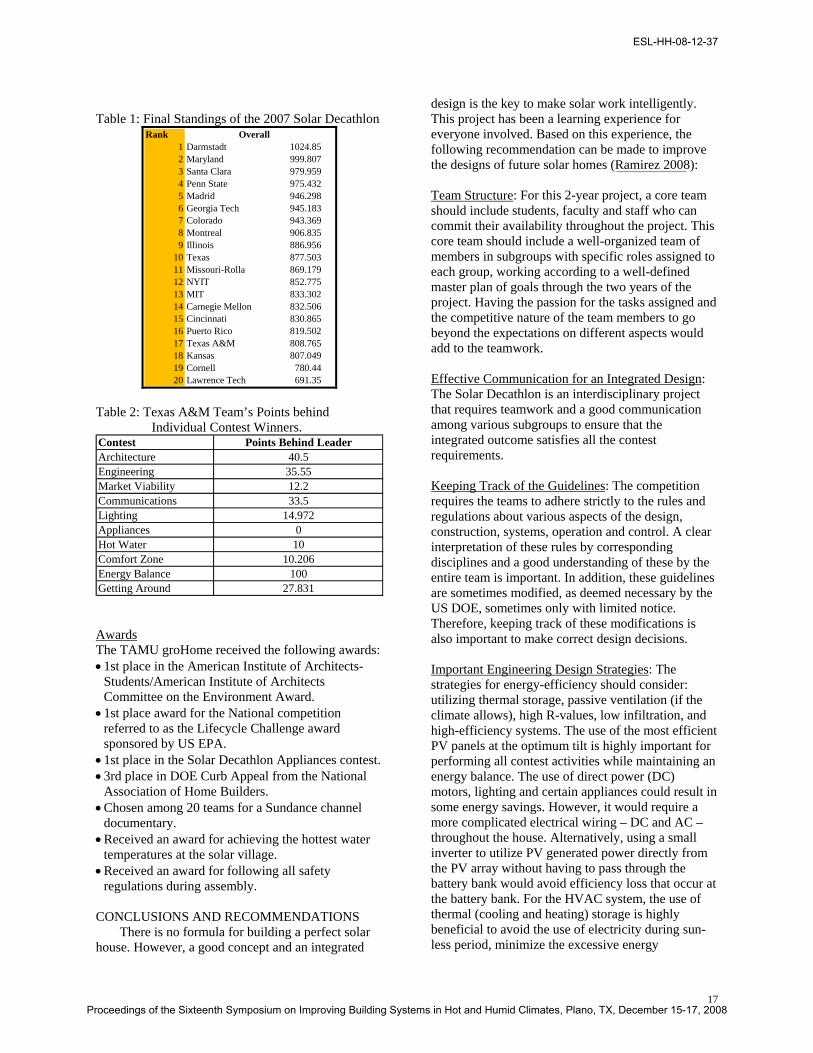
The final scores for the competition were obtained by summing all the scores obtained in each one of the ten contests. Table 1 shows the final ranking and scores for the competition. The Texas A&M team finished in 17th place overall, ahead of Kansas, Cornell, and Lawrence Tech. However, it scored well on the appliance contest (1st place), the market viability contest (8th place), and the comfort, hot water and getting around contests (9th place for each). Table 2 shows how the Texas A&M team did in each contest in comparison with the team that won the respective contest. The contests that had the largest point difference between the leader and the other universities were the Architecture contest, Engineering, Communications, Getting Around, and Energy Balance. Therefore, for future reference, strategies for placing higher in these contests need to be considered.
ESL-HH-08-12-37
Proceedings of the Sixteenth Symposium on Improving Building Systems in Hot and Humid Climates, Plano, TX, December 15-17, 2008
17
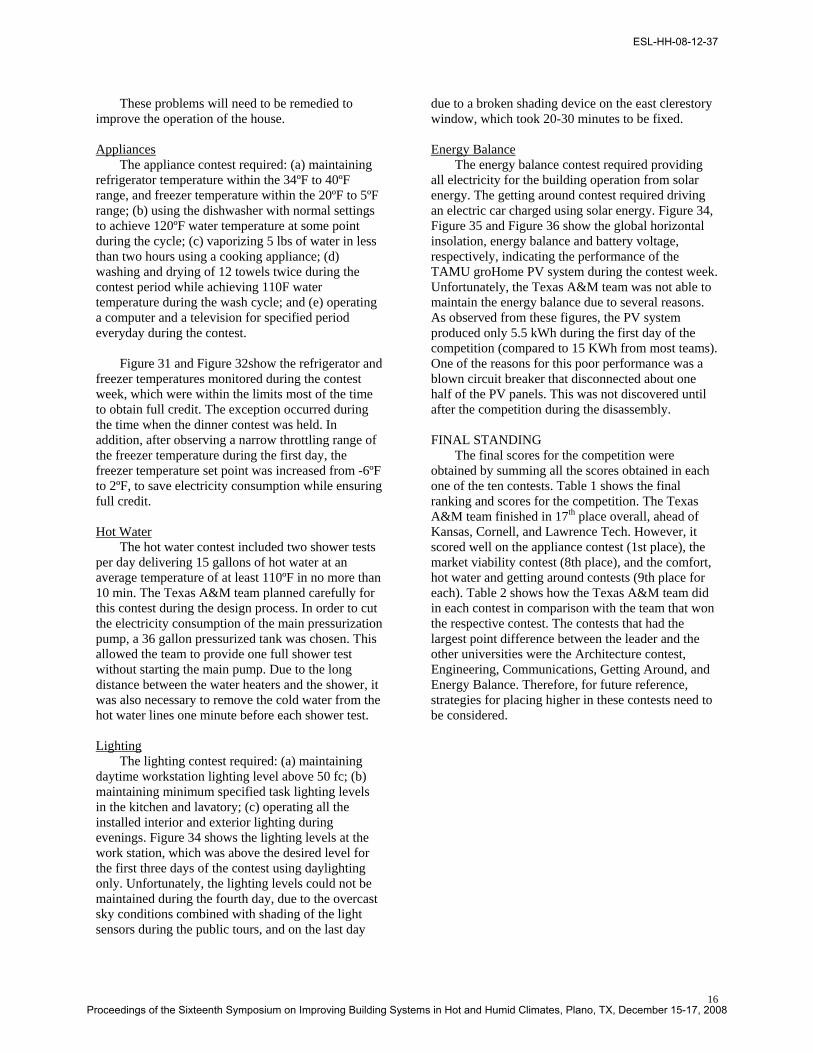
Table 1: Final Standings of the 2007 Solar Decathlon
Rank1 Darmstadt 1024.852 Maryland 999.8073 Santa Clara 979.9594 Penn State 975.4325 Madrid 946.2986 Georgia Tech 945.1837 Colorado 943.3698 Montreal 906.8359 Illinois 886.956
10 Texas 877.50311 Missouri-Rolla 869.17912 NYIT 852.77513 MIT 833.30214 Carnegie Mellon 832.50615 Cincinnati 830.86516 Puerto Rico 819.50217 Texas A&M 808.76518 Kansas 807.04919 Cornell 780.4420 Lawrence Tech 691.35
Overall
Table 2: Texas A&M Team’s Points behind
Individual Contest Winners. Contest Points Behind LeaderArchitecture 40.5Engineering 35.55Market Viability 12.2Communications 33.5Lighting 14.972Appliances 0Hot Water 10Comfort Zone 10.206Energy Balance 100Getting Around 27.831
Awards The TAMU groHome received the following awards: • 1st place in the American Institute of Architects-
Students/American Institute of Architects Committee on the Environment Award.
• 1st place award for the National competition referred to as the Lifecycle Challenge award sponsored by US EPA.
• 1st place in the Solar Decathlon Appliances contest. • 3rd place in DOE Curb Appeal from the National
Association of Home Builders. • Chosen among 20 teams for a Sundance channel
documentary. • Received an award for achieving the hottest water
temperatures at the solar village. • Received an award for following all safety
regulations during assembly. CONCLUSIONS AND RECOMMENDATIONS
There is no formula for building a perfect solar house. However, a good concept and an integrated
design is the key to make solar work intelligently. This project has been a learning experience for everyone involved. Based on this experience, the following recommendation can be made to improve the designs of future solar homes (Ramirez 2008): Team Structure: For this 2-year project, a core team should include students, faculty and staff who can commit their availability throughout the project. This core team should include a well-organized team of members in subgroups with specific roles assigned to each group, working according to a well-defined master plan of goals through the two years of the project. Having the passion for the tasks assigned and the competitive nature of the team members to go beyond the expectations on different aspects would add to the teamwork. Effective Communication for an Integrated Design: The Solar Decathlon is an interdisciplinary project that requires teamwork and a good communication among various subgroups to ensure that the integrated outcome satisfies all the contest requirements. Keeping Track of the Guidelines: The competition requires the teams to adhere strictly to the rules and regulations about various aspects of the design, construction, systems, operation and control. A clear interpretation of these rules by corresponding disciplines and a good understanding of these by the entire team is important. In addition, these guidelines are sometimes modified, as deemed necessary by the US DOE, sometimes only with limited notice. Therefore, keeping track of these modifications is also important to make correct design decisions. Important Engineering Design Strategies: The strategies for energy-efficiency should consider: utilizing thermal storage, passive ventilation (if the climate allows), high R-values, low infiltration, and high-efficiency systems. The use of the most efficient PV panels at the optimum tilt is highly important for performing all contest activities while maintaining an energy balance. The use of direct power (DC) motors, lighting and certain appliances could result in some energy savings. However, it would require a more complicated electrical wiring – DC and AC –throughout the house. Alternatively, using a small inverter to utilize PV generated power directly from the PV array without having to pass through the battery bank would avoid efficiency loss that occur at the battery bank. For the HVAC system, the use of thermal (cooling and heating) storage is highly beneficial to avoid the use of electricity during sun-less period, minimize the excessive energy
ESL-HH-08-12-37
Proceedings of the Sixteenth Symposium on Improving Building Systems in Hot and Humid Climates, Plano, TX, December 15-17, 2008
18
consumption during the night, and assure that all electricity from the PV panels are utilized. Early Completion to Allow for Testing: It is recommended that the construction be completed at least one month in advance in order to have sufficient time for testing of the mechanical and electrical systems, system controls and load balancing. Unfortunately, the Texas A&M team was not able to accomplish this before transporting the house to Washington, D.C. One of the reasons for this was that almost every single component of the house was designed, installed or constructed by the students and not professionals, which took more time than estimated. In addition, the design and assembly should be planned to minimize the amount of labor at the National Mall. Monitoring of the Systems: In addition to the prior testing of the systems, it is highly recommended to monitor the performance of each component of the systems whose operation is critical for the competition. The Texas A&M team became aware of the increasing negative energy balance on the second day of the competition. However, without any real-time performance data and prior test results as a baseline, the reason for the small PV output could not be diagnosed until after the competition when a blown circuit breaker of the PV system was found during the disassembly. Funding: This competition involves integration of the best technology which is quite often the most expensive. Having more-than-adequate funds provides a team with more options for superior products, equipment, and control systems; and if needed, for obtaining assistance from professionals. Also, many material contributions do not always involve the most efficient components. In addition, our team discovered that the best components were also being sought-after by other teams, which can put them in short supply. A Good Overall Design: To win a Solar Decathlon it is particularly important to succeed in the subjective contests since their evaluation may create point leads that are impossible to overcome. Although, it is not probable to win all the contests of the competition, an overall superior design and operation, and a high ranking in a number of individual subjective contests can lead to an overall success. REASSEMBLY AND POST-OCCUPANCY PERFORMANCE
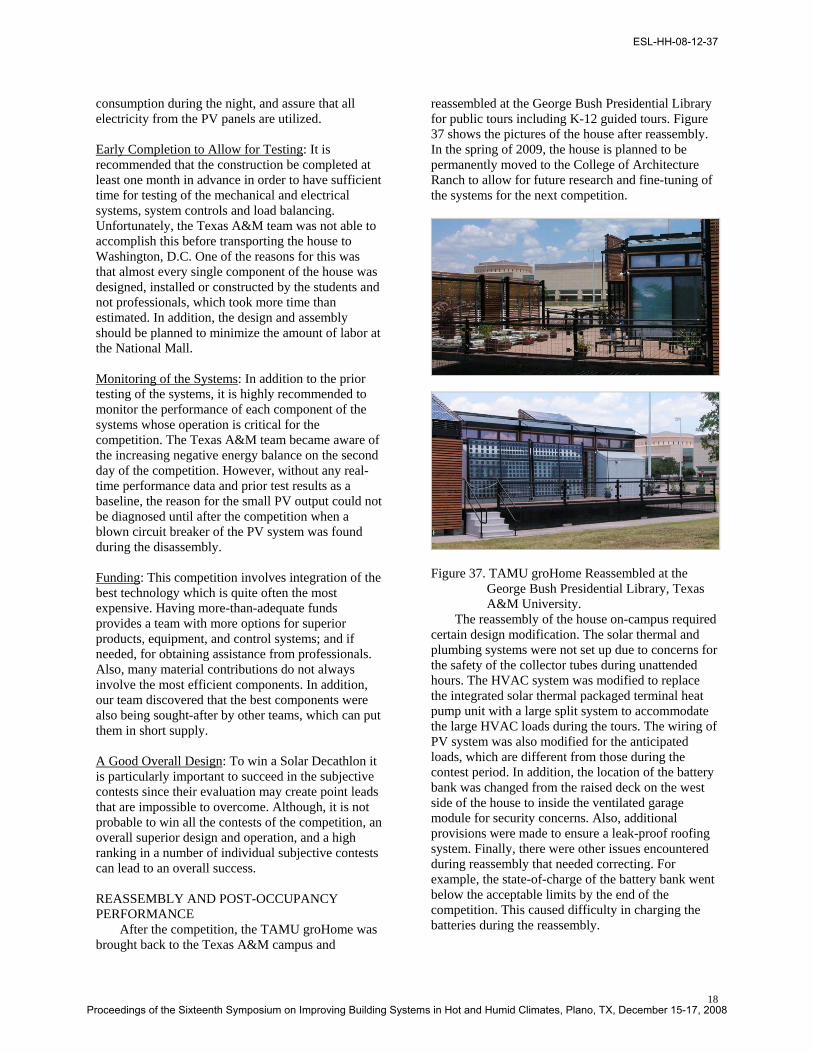
After the competition, the TAMU groHome was brought back to the Texas A&M campus and
reassembled at the George Bush Presidential Library for public tours including K-12 guided tours. Figure 37 shows the pictures of the house after reassembly. In the spring of 2009, the house is planned to be permanently moved to the College of Architecture Ranch to allow for future research and fine-tuning of the systems for the next competition.
Figure 37. TAMU groHome Reassembled at the
George Bush Presidential Library, Texas A&M University.
The reassembly of the house on-campus required certain design modification. The solar thermal and plumbing systems were not set up due to concerns for the safety of the collector tubes during unattended hours. The HVAC system was modified to replace the integrated solar thermal packaged terminal heat pump unit with a large split system to accommodate the large HVAC loads during the tours. The wiring of PV system was also modified for the anticipated loads, which are different from those during the contest period. In addition, the location of the battery bank was changed from the raised deck on the west side of the house to inside the ventilated garage module for security concerns. Also, additional provisions were made to ensure a leak-proof roofing system. Finally, there were other issues encountered during reassembly that needed correcting. For example, the state-of-charge of the battery bank went below the acceptable limits by the end of the competition. This caused difficulty in charging the batteries during the reassembly.
ESL-HH-08-12-37
Proceedings of the Sixteenth Symposium on Improving Building Systems in Hot and Humid Climates, Plano, TX, December 15-17, 2008
19
After the reassembly, we are monitoring the performance of the HVAC system using two HOBO data loggers for measuring indoor and outdoor temperature and humidity, and PV system using the Winverter software (RightHand Engineering 2006). This allows for system performance to be evaluated when merged with nearby solar data.
Figure 38 shows the measured indoor and outdoor temperature and humidity for a one-week period. During this period, the HVAC system operated only from 10 a.m. until 4 p.m. in the cooling mode, with the thermostat set at 80ºF with 4ºF throttling range. The figure shows that with the cooling system on, the temperature was reduced to approximately 85ºF and humidity levels held at 40% RH, while outdoor temperatures were above 95ºF.
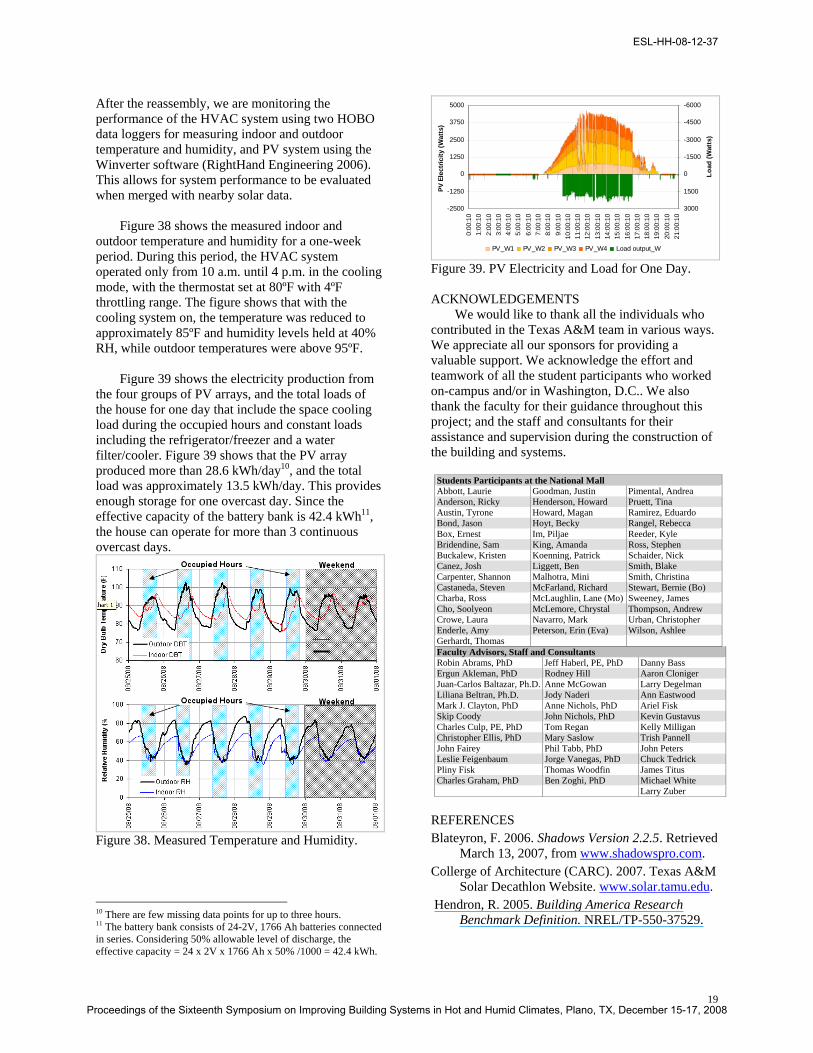
Figure 39 shows the electricity production from the four groups of PV arrays, and the total loads of the house for one day that include the space cooling load during the occupied hours and constant loads including the refrigerator/freezer and a water filter/cooler. Figure 39 shows that the PV array produced more than 28.6 kWh/day10, and the total load was approximately 13.5 kWh/day. This provides enough storage for one overcast day. Since the effective capacity of the battery bank is 42.4 kWh11, the house can operate for more than 3 continuous overcast days.
Figure 38. Measured Temperature and Humidity.
10 There are few missing data points for up to three hours. 11 The battery bank consists of 24-2V, 1766 Ah batteries connected in series. Considering 50% allowable level of discharge, the effective capacity = 24 x 2V x 1766 Ah x 50% /1000 = 42.4 kWh.
-2500
-1250
0
1250
2500
3750
5000
0:00
:10
1:00
:10
2:00
:10
3:00
:10
4:00
:10
5:00
:10
6:00
:10
7:00
:10
8:00
:10
9:00
:10
10:0
0:10
11:0
0:10
12:0
0:10
13:0
0:10
14:0
0:10
15:0
0:10
16:0
0:10
17:0
0:10
18:0
0:10
19:0
0:10
20:0
0:10
21:0
0:10
PV E
lect
ricity
(Wat
ts)
-6000
-4500
-3000
-1500
0
1500
3000
Load
(Wat
ts)
PV_W1 PV_W2 PV_W3 PV_W4 Load output_W
Figure 39. PV Electricity and Load for One Day. ACKNOWLEDGEMENTS
We would like to thank all the individuals who contributed in the Texas A&M team in various ways. We appreciate all our sponsors for providing a valuable support. We acknowledge the effort and teamwork of all the student participants who worked on-campus and/or in Washington, D.C.. We also thank the faculty for their guidance throughout this project; and the staff and consultants for their assistance and supervision during the construction of the building and systems.
Students Participants at the National Mall Abbott, Laurie Goodman, Justin Pimental, Andrea Anderson, Ricky Henderson, Howard Pruett, Tina Austin, Tyrone Howard, Magan Ramirez, Eduardo Bond, Jason Hoyt, Becky Rangel, Rebecca Box, Ernest Im, Piljae Reeder, Kyle Bridendine, Sam King, Amanda Ross, Stephen Buckalew, Kristen Koenning, Patrick Schaider, Nick Canez, Josh Liggett, Ben Smith, Blake Carpenter, Shannon Malhotra, Mini Smith, Christina Castaneda, Steven McFarland, Richard Stewart, Bernie (Bo) Charba, Ross McLaughlin, Lane (Mo) Sweeney, James Cho, Soolyeon McLemore, Chrystal Thompson, Andrew Crowe, Laura Navarro, Mark Urban, Christopher Enderle, Amy Peterson, Erin (Eva) Wilson, Ashlee Gerhardt, Thomas Faculty Advisors, Staff and Consultants Robin Abrams, PhD Jeff Haberl, PE, PhD Danny Bass Ergun Akleman, PhD Rodney Hill Aaron Cloniger Juan-Carlos Baltazar, Ph.D. Anne McGowan Larry Degelman Liliana Beltran, Ph.D. Jody Naderi Ann Eastwood Mark J. Clayton, PhD Anne Nichols, PhD Ariel Fisk Skip Coody John Nichols, PhD Kevin Gustavus Charles Culp, PE, PhD Tom Regan Kelly Milligan Christopher Ellis, PhD Mary Saslow Trish Pannell John Fairey Phil Tabb, PhD John Peters Leslie Feigenbaum Jorge Vanegas, PhD Chuck Tedrick Pliny Fisk Thomas Woodfin James Titus Charles Graham, PhD Ben Zoghi, PhD Michael White Larry Zuber
REFERENCES Blateyron, F. 2006. Shadows Version 2.2.5. Retrieved
March 13, 2007, from www.shadowspro.com. Collerge of Architecture (CARC). 2007. Texas A&M
Solar Decathlon Website. www.solar.tamu.edu. Hendron, R. 2005. Building America Research
Benchmark Definition. NREL/TP-550-37529.
ESL-HH-08-12-37
Proceedings of the Sixteenth Symposium on Improving Building Systems in Hot and Humid Climates, Plano, TX, December 15-17, 2008

20
Golden, CO: National Renewable Energy Laboratory.
Huang, J. 2002. DrawBDL, Version 2.02. Joe Huang and Associates. www.drawbdl.com.
Klein, S. A. and W. A. Beckman. 1993. F-Chart Solar Energy System Analysis: Windows Version. Middleton, WI: F-Chart Software.
Klein, S. A. and W. A. Beckman. 1994. PV F-Chart Photovoltaic System Analysis: DOS Version 3.3. Middleton, WI: F-Chart Software.
Lawrence Berkeley National Laboratory (LBNL). 2003. Radiance Version 3.5. Building Technologies Department. Berkeley, CA.
Marsh, A. 2005. ECOTECT Version 5.5. Square One Research LTD. www.squ1.com.
National Research Council Canada. 2006. DAYSIM: Dynamic Daylight Simulation. irc.nrc-nrc.gc.ca/ ie/lighting/daylight/daysim_e.html.
Newton, A. B. and S. F.Gilman. 1983. Solar Collector Performance Manual.Atlanta, GA: American Society of Heating, Refrigeration and Air-conditioning Engineers.
Ramirez, E. 2008. Engineering Design, Construction, Operation and Analysis of the 2007 Texas A&M University Solar Decathlon House. ESL-TR-08-05-01. Texas A&M University.
RightHand Engineering. 2006. Winverter-Monitor, FX-MX Version 2.6.0. RightHand Engineering, LLC. Available at: www.righthandeng.com.
Solar Rating and Certification Corporation (SRCC). 2008. Directory of SRCC Certified Solar Collector Ratings. Available at: www.solar-rating.org.
Ward, G. 2006. Photosphere 1.7. Anyhere Software. Available at: www.anyhere.com/.
ESL-HH-08-12-37
Proceedings of the Sixteenth Symposium on Improving Building Systems in Hot and Humid Climates, Plano, TX, December 15-17, 2008