Embed Size (px)
Citation preview

Diagnostic for the Programme for Country
Partnership (PCP)
The Kyrgyz Republic
Building a competitive manufacturing base for
strong and inclusive growth

This report benefited substantially from support and information provided by various
stakeholders in face-to-face consultations.
GOVERNMENT
Academy of Sciences of the Kyrgyz Republic;
Department of Fuel resources and heat supply under the SCIESU KR1;
Department of the Geology under the SCIESU KR;
Department of Industry, Fuel, Energy and Subsoil, Apparatus of Government of the Kyrgyz
Republic
Department of the Light Industry under the SCIESU KR;
Department of Management of EAEU and WTO under the SCIESU KR
Department of Mechanical Engineering under the SCIESU KR;
Department of Metallurgy and Construction Materials under the SCIESU KR;
Department of Renewable Energy Sources and Energy Saving under the SCIESU KR;
Division for Financial and Economic Analysis and development Monitoring, presidential
Administration of the Kyrgyz Republic
Member of Jogorku Kenesh
Ministry of Agriculture Food Industry and Land Reclamation of the Kyrgyz Republic Ministry of Economics
Ministry of Finance;
National Statistic Committee;
Research Institute of Energy and Economics under the SCIESU KR;
State Agency for Investment and Export Promotion under the Ministry of Economy of the KR
The State Committee of Industry, Energy and Subsoil Use of the KR
PRIVATE SECTOR
Ardamina (wearing apparel)
Art group Tumar (wearing apparel)
Ayu Holding Electrosila, production of transformers, distribution of electricity
Golden Nut walnut production (Food processing)
Interglass, glass Production Company
Imran, cleaning and washing wool
Kalininskaya HEPS, hydropower company
LLC “Avinion”
Tekstil Trans (wearing apparel)
Toiboss, production of meat products (Food processing)
Shoro, production of beverages (Food processing)
INDUSTRY ASSOCIATION
Association of Artisans
Association of poultry farmers of the KR
Association of producers, distributors and suppliers of agricultural products
Free Economic Zone
Kyrgyz Union of Industrialists and Entrepreneurs
Legprom Association
Stone Processing Association
1 The State Committee of Industry, Energy and Subsoil Use of the Kyrgyz Republic
Trade and Commerce chamber of the Kyrgyz Republic
DEVELOPMENT PARTNERS
Adviser to the Rector of the Kyrgyz Technical University
Asian Development Bank (ADB)
FAO
GIZ
IFC Country Officer
Professor from Kyrgyz-Russian Slavic University
Russian-Kyrgyz Fund Development
UNDP
USAID BGI
WFP
World Bank in the Kyrgyz Republic
NGOs
Institute of Hydropower Organization “Environmental Expertise”

i
CONTENT
EXECUTIVE SUMMARY VII
1. IDENTIFICATION OF KYRGYZSTAN’S CURRENT POSITION, PROSPECTS AND KEY
ISSUES 1
1.1. Introduction 1
1.2. Historical, Social and Macroeconomic Background 2
1.2.1. The transition recession and Soviet legacies 2
1.2.2. Satisfactory but unsteady growth 5
1.2.3. A labour market in the shadows 7
1.2.4. Critical environmental risks prevail 9
1.3. Implications of the Macroeconomic Policy Framework for Industrial Development 13
1.3.1. Monetary policy 13
1.3.2. Fiscal policy 16
1.4. Seizing the Opportunities of the Eurasian Economic Union 17
1.4.1. Eurasian Economic Union in brief 17
1.4.2. Key implications of the EAEU for the Kyrgyz Republic 18
1.4.3. Prospects of bridging other integration endeavours in the region 22
1.5. Challenges for Industrial Development of a Small Middle-Income Country 23
1.5.1. Weaknesses in the general framework conditions 23
1.5.2. A vulnerable and undiversified economy 26
1.5.3. Manufacturing misses out as a Driver of Growth and Employment 29
1.5.4. An inferior export performance 35
1.6. Analysis of Kyrgyzstan’s Cost Competitiveness 39
Appendix 45
2. INDUSTRIES FOR INCLUSIVE AND SUSTAINABLE DEVELOPMENT 46
2.1. Strong growth and inclusive development 47
2.1.1. The structural change perspective of development 47
2.1.2. What export performance and comparative advantage indicate 50
2.1.3. Identifying the potential of the strategic industries 52
2.1.4. Foreign demand for Kyrgyz products 58
2.1.5. Demands for Kyrgyz inputs in Global Value Chains (GVCs) 61
2.1.6. Development impacts of an expanding domestic economy 64

2.2. Strong growth and sustainable development 69
2.2.1. Greening manufacturing industries 69
2.2.2. Promotion of a Green Industry – hydropower sector 75
3. OBSTACLES FACING KYRGYZ FIRMS 84
3.1. Industry profiles 84
3.1.1. Agro-processing and the food and beverages industry 84
3.1.2. The textiles and wearing apparel industry 94
3.2. Firm-level analysis 100
3.2.1. Economic performance of Kyrgyz firms in international comparison 100
3.2.2. Important determinants of the performance of Kyrgyz firms 103
3.3. Obstacles and challenges 109
3.3.1. Key obstacles embedded in the business environment 109
3.3.2. Key obstacles to business operations 111
4 TOWARDS AN INCLUSIVE AND SUSTAINABLE INDUSTRIAL DEVELOPMENT
STRATEGY: RECOMMENDATIONS AND ACTIONS THAT COULD MAKE A DIFFERENCE
122
4.1 Objectives and Institutional Aspects of an Inclusive and Sustainable Industrial Development
Strategy 122
4.2 Linking industrial with regional development 123
4.3 Industrial Policy Measures for the Manufacturing Sector 125
4.3.1 Principles of industrial policy support 125
4.3.2 Import tariffs 126
4.3.3 FDI attraction 127
4.3.4 Specific Measures for the food and beverages industries 127
4.3.5 Specific Measures for the textiles and wearing apparel industries 130
4.4 Specific Measures for the Hydro Power Sector 132
4.5 A competitive exchange rate 136
4.6 Aligning macroeconomic policies with the needs of industrial development 137
4.7 Priority Areas in Improving the Economic Framework Conditions 139
4.7.1 Industry-related and export-oriented framework conditions 139
4.7.2 General framework conditions 143
4.7.3 Support for technological and managerial skills in the private sector 144
4.8 Prioritizing support for strong and inclusive growth 146

REFERENCES 147

List of Figures
Figure 1-1: Transition recessions and recovery in former Soviet Union states, 1986-2016 .............. 3
Figure 1-2: Development of Kyrgyz industry and manufacturing, 1990-2016 ................................... 4
Figure 1-3: Kyrgyz GDP growth, 1995-2016 ....................................................................................... 6
Figure 1-4: Poverty reduction in Kyrgyzstan, 1993-2015 ................................................................... 7
Figure 1-5: Decomposition of CO2 emissions (international comparison), 1995-2013 ................... 11
Figure 1-6: Decomposition of material use (international comparison), 1995-2013 ...................... 11
Figure 1-7: CO2 volume per capita and intensity effect of CO2 ....................................................... 12
Figure 1-8: Volume of material use per capita and intensity effect of material use ....................... 12
Figure 1-9: Real effective exchange rate development, 2000-2017 ................................................ 15
Figure 1-10: Kyrgyzstan’s average import tariffs and EAEU-induced changes, 2014-2015 ............. 21
Figure 1-11: EAEU common external tariff structure, 2016 ............................................................. 21
Figure 1-12: Quality of transport infrastructure and logistics performance, international
comparison ....................................................................................................................... 24
Figure 1-13: Broad economic structure, international comparison, 2006-2016 ............................. 28
Figure 1-14: Kyrgyz exports by technology content of goods, 1995-2015 ....................................... 29
Figure 1-15: Sector contributions to growth in Kyrgyzstan, 2003-2016 .......................................... 31
Figure 1-16: Gross industrial output and gold production, 2000-2016 ........................................... 31
Figure 1-17: Employment development in industry and manufacturing, 2000-2015 ..................... 32
Figure 1-18: Labour productivity and structural change in the Kyrgyz economy, 2000-2015 ......... 34
Figure 1-19: Development of export volume index, comparison with references groups and
countries ........................................................................................................................... 35
Figure 1-20: Export structure, comparison with references groups and countries, 2015 ............... 36
Figure 1-21: Manufacturing export intensity, comparison with references groups and countries . 37
Figure 1-22: Real manufacturing value added per capita, international comparison, 1991-2014 .. 38
Figure 1-23: Cost decomposition ..................................................................................................... 40
Figure 1-24: Labour costs in selected countries ............................................................................... 41
Figure 1-25: Sectoral labour productivity, comparison across LMIC, 1991-2012 ............................ 42
Figure 2-1: Real value added patterns by industry along countries’ economic development ........ 48
Figure 2-2: Employment-to-population ratio patterns .................................................................... 49
Figure 2-3: Real manufacturing value added per capita of the food and beverages, international
comparison ....................................................................................................................... 53
Figure 2-4: Real manufacturing value added per capita of fruit and vegetable processing,
international comparison ................................................................................................. 54
Figure 2-5: Real manufacturing value added per capita of dairy products, international comparison
.......................................................................................................................................... 54
Figure 2-6: Employment level in food and beverages, international comparison ........................... 55
Figure 2-7: Real manufacturing value added per capita of wearing, international comparison ..... 56
Figure 2-8: Employment level in wearing apparel, international comparison ................................. 57
Figure 2-9: Actual and predicted employment level in wearing apparel in Kyrgyzstan ................... 57
Figure 2-10: GVC participation 1 – Per centage of Kyrgyz industrial value added in foreign exports
.......................................................................................................................................... 63

Figure 2-11: GVC participation 2 – Foreign value added in Kyrgyzstan’s exports ............................ 64
Figure 2-12: Job intensity of manufacturing sectors in Kyrgyzstan, 2014 ........................................ 65
Figure 2-13: Total number of jobs generated (direct and indirect) when the exports of that sector
expands by 1 Mio USD in Kyrgyzstan, 2014 ...................................................................... 66
Figure 2-14 Total number of jobs generated by sector when each sector exports an additional 1
Mio USD, 2014 .................................................................................................................. 68
Figure 2-15: CO2 volume across sub-sector industries in Kyrgyzstan .............................................. 70
Figure 2-16: intensity effect of CO2 across sub-sector industries in Kyrgyzstan ............................. 71
Figure 2-17: Variation in CO2 volume (1995=1) ............................................................................... 71
Figure 2-18: Volume of material use across sub-sector industries in Kyrgyzstan ............................ 73
Figure 2-19: Intensity of material use across sub-sector industries in Kyrgyzstan .......................... 73
Figure 2-20: Variation in intensity effect of material use (1995=1) ................................................. 74
Figure 2-21: Hydropower capacity in Kyrgyzstan ............................................................................. 77
Figure 2-22: Hydropower generation in Kyrgyzstan......................................................................... 78
Figure 2-23: Map of locations of small hydropower potential in Kyrgyzstan .................................. 79
Figure 2-24: Density of resident population in the Kyrgyzstan (in 2006) ......................................... 79
Figure 3-1: Nominal production, employment and exports (as share in total manufacturing), 2015
.......................................................................................................................................... 91
Figure 3-2: Development of nominal production, exports, employment (Panel A) and wages and
labour productivity (Panel B) in the food and beverages industry, 2006-2015 ............... 93
Figure 3-3: Development of nominal production, exports, employment (Panel A) and wages and
labour productivity (Panel B) in the textiles and wearing apparel industry, 2006-2015 .. 97
Figure 3-4: Cost structure (in % of total production costs) and business performance of small
firms, 2011 ...................................................................................................................... 102
Figure 3-5: Comparison of cost structure (as % of total production costs) and business
performance of small and large Kyrgyz firms, 2011 ....................................................... 104
Figure 3-6: Comparison of cost structure (in % of total production costs) and business
performance of domestically- and foreign-owned firms, 2011 ...................................... 106
Figure 3-7: Comparison of cost structure (as % of total production costs) and business
performance of purely domestically-oriented and directly exporting firms, 2011 ........ 108
Figure 3-8: Regulatory burden (% of time of senior managers spent on dealing with government
regulations), 2007 and 2011 ........................................................................................... 110
Figure 3-9: Severity of obstacle posed by practices of informal firms, 2007 and 2011 ................. 111
Figure 3-10: Share of firms with formal training programs, 2007 and 2011.................................. 112
Figure 3-11: Prevalence of financing constraints, 2007 and 2011 ................................................. 114
Figure 3-12: Reasons for not applying for a credit or loan, 2007 and 2011 ................................... 115
Figure 3-13: Exporter entry and exit rates, 2012 ........................................................................... 117
Figure 3-14: Third year exporter survival rates by 3-digit ISIC code, 2009 .................................... 118
Figure 4-1: City Growth Points across Kyrgyz regions (oblasts) ..................................................... 124
Figure 4-2: Cumulative Renewable Energy Investment in Selected Countries, 2004-2015 ........... 134
Figure 4-3: Urban/rural population perspectives 2010-2100 ........................................................ 135

List of Tables
Table 1.1: Kyrgyzstan’s main export items, average 2006-2016 ...................................................... 30
Table 1.2: Assessment of individual elements for Kyrgyzstan’s cost competitiveness .................... 42
Table 2.1: Industries with the high potentials of value added, employment and exports (for
income range between 2,500 and 4,500 GDP per capita) ................................................ 50
Table 2.2: Revealed Comparative Advantage of Kyrgyzstan in 2015 ............................................... 51
Table 2.3: Kyrgyzstan’s major import partners for trade in vegetables ........................................... 59
Table 2.4: Kyrgyzstan’s major import partners for trade in fruits and nuts ..................................... 59
Table 2.5: Kyrgyzstan’s major import partners for trade in dairy products, eggs and honey.......... 59
Table 2.6: Kyrgyzstan’s major import partners for trade in cotton ................................................. 60
Table 2.7: Kyrgyzstan’s major import partners for trade in hides, skins and leather ...................... 60
Table 2.8: Kyrgyzstan’s major import partners for trade in apparel and clothing (not knitted or
crocheted) ......................................................................................................................... 60
Table 2.9: Kyrgyzstan’s major import partners for trade in apparel and clothing (knitted or
crocheted) ......................................................................................................................... 60
Table 2.10: Kyrgyzstan’s major import partners for trade in construction materials ...................... 61
Table 2.11: Kyrgyzstan’s major import partners for trade in glass and glassware .......................... 61
Table 2.12: Per centage of Kyrgyz value added in the exports of main trade partners, 2014 ......... 62
Table 2.13: Female employment share in Kyrgyz manufacturing industries, 2014 ......................... 67
Table 2.14: Estimated number of formal jobs at the average level of value added for a country at
Kyrgyzstan’s income level, 2014 ....................................................................................... 69
Table 2.15: Estimated number of formal jobs at a value added of a successful country at
Kyrgyzstan’s income level, 2014 ....................................................................................... 69
Table 2.16: Hydropower installed capacity vs potential .................................................................. 76
Table 2.17: The percent of river basin by country ........................................................................... 76
Table 2.18: SHP generation potential ;; ............................................................................................ 77
Table 2.19: Public investment projects financed by foreign and domestic funding, as a % of total 81
Table 3.1: Overview of Kyrgyz Farm Structures in 2012 .................................................................. 85
Table 3.2 Agricultural produce of the Kyrgyz Republic 2008-2015 (tonns) ..................................... 86
Table 3.3:Share of small firms, 2006-2015 ....................................................................................... 93
Table 3.4: Total (formal and informal) employment (2014-2016) and the degree of informality
(2014) ................................................................................................................................ 94
Table 3.5: Share of small firms, 2006-2015 ...................................................................................... 99
Table 3.6: Total (formal and informal) employment (2014-2016) and degree of informality (2014)
.......................................................................................................................................... 99
Table 3.7: Average nominal interest rate paid for loans, 2011 ...................................................... 116

Executive summary
The Kyrgyz Republic has experienced equitable growth for the last 10 years, being one of the most
equal countries in the group of lower-middle income countries. After a massive and prolonged
recession since independence, the country finally regained its 1991 GDP level in 2011 and has
been following a path of a steady growth, recently moving from a low to lower middle income
group. However, the equitable growth in Kyrgyzstan has not meant moving towards a creation of
a large middle class with a secure income source and a living standard sufficient to cover a
family’s living costs, education and social securities for better future. The equitable growth of the
country is rather closer to a situation where the majority of the people eke out a living by taking
up a lowly productive, often informal job or going abroad to find a job to support a family in the
home country. Thus, the society is equitable but still at a relatively low level of living standard.
The national poverty rate is at around 30%. The population living on less than USD 3.10 per day
had declined significantly from 75% in 2000 to 19% in 2009, but further progress towards the
elimination of poverty seems daunting for the country. An estimated 70% of the work-force is
active in the informal economy, contributing an estimated 28% of total value added, making the
country’s economy and citizens insecure and vulnerable. The unemployment rate is high among
young people with a markedly higher rate for women. The large inflow of remittances, which
accounts for 25% of GDP, reflects that past growth has not been successful for the generation of
decent jobs.
Strong and inclusive growth has to be the foremost priority for Kyrgyzstan. The manufacturing
sector usually makes a significant contribution to such growth, particularly at the development
stage of Kyrgyzstan. This growth engine for inclusive development, however, has not so far been
working in the country with a dominant share of gold production in manufacturing value added
and the rest of the manufacturing sector contributing to 7-10% of GDP. Resource-based
industries, such as mining and petroleum refining, create a limited number of jobs for a given
output and are prone to increase the burden on the natural environment.
Being a small open economy, Kyrgyzstan’s current position in the international economy points
out quite clearly that the country’s advantages are now in the industries based on the country’s
given natural resources - lands for the agro-industry, water for hydropower, and gold for metal
production – but it enjoys little advantage in other manufacturing industries, whose success
depends more on competitiveness created by the country. A lack of competitiveness in sectors
other than resource-based manufacturing industries almost across the board indicates the
importance of improving the country’s framework conditions in order to uplift the overall
profitability, chance of success and expansion, and attractiveness to investment of the country. A
lack of transparency and inefficiency in public administration is costing businesses and their
international competitiveness. The government’s initiative, Taza Koom programme, for a digital
transformation is a step forward to provide a platform to improve the efficiency, transparency
and accountability of public administration and to reduce the transactions costs of the private
sector through digitalization.

Joining the Eurasian Economic Union (EAEU) in 2015 improved access to the EAEU market and can
facilitate export-led growth in future, which has a central role to play in revitalizing the country’s
manufacturing sector for strong and inclusive growth. To reap the benefit of regional market
integration and promote trade and production networks with EAEU member countries,
Kyrgyzstan has to urgently develop the capacity to comply with the more advanced technical and
sanitary and phytosanitary standards of the EAEU. The country has to step up the efforts for
compliance with continued support from EAEU countries to facilitate greater access to an
enlarged regional market. The labour and energy costs of Kyrgyzstan are competitive relative to
those of countries in a similar income group, but the country has major logistical problems for
trade, taking much more time and money to move goods across boarders than others including
landlocked countries, such as Moldova and Laos. The quality of Kyrgyzstan’s road infrastructure is
in especially poor condition and in need of urgent rehabilitation and reconstruction because more
than 90 percent of freight transport is by road. Being a small country with limited domestic
demand, trade infrastructure is of critical importance for the country to succeed in exports and
participation in global value chains. For land-based connectivity, of particular importance is
China’s One Belt One Road (OBOR) initiative. Kyrgyzstan, being among the countries along the
route, the OBOR initiative can be instrumental for bringing much needed investments in
infrastructure.
Improved framework conditions will lay the foundation for building a competitive manufacturing
base. For strong and inclusive growth, the development of the food and beverages and light
industries like textiles and wearing apparel should take precedence. Kyrgyzstan’s inexpensive,
trainable labour and low energy costs are the advantages for the growth of such industries. Their
labour-intensive production processes and strong linkages with other industries, agriculture in
particular, could generate a large number of formal jobs in the country. For example, by reaching
only the average output level of the same income group, it is estimated that the Kyrgyz textiles
and wearing apparel industries could increase formal employment to 7.5 times of the current
level. This enormous inclusive growth potential has not been realized due to obstacles at firm
level as well as to the mentioned framework conditions.
Most of the firms in the food and beverages, textiles, and wearing apparel industries are small
and fragmented often operating in the informal sector. With the limited scale of production, firms
are unable to use an optimal production process and machinery to reach a productivity level
required to compete internationally. While the Kyrgyz firms have low labour and energy costs,
their low productivity wipes out their input costs advantage and makes their products less
competitive. Larger firms with formal employment have higher consistency in product quality,
enjoy economies of scale and higher productivity and can respond to large orders from
customers. These are some of the important firm characteristics necessary to compete in
international markets. Easy access to finance at a reasonable interest rate often makes the
difference in a decision on whether or not to invest and expand production to be formal or
remain informal and to pay a limited contribution to the government budget. Despite the
government efforts, this problem of access to finance especially by small and medium firms is
severe in Kyrgyzstan relative to the other countries in the same income group.

There is a limitation in the availability of domestic capital. A dedicated outreach strategy for
foreign direct investments is an essential part of driving exports growth. Domestic firms learn
from experienced foreign firms what would be necessary to succeed in terms of quality, costs,
logistics management, and marketing.
Strong and inclusive growth with focus on labour-intensive industries is one of the pillars of the
Kyrgyz Republic’s “40 steps to New Era”. Transparent and consistent policies will push the country
towards the achievements of the country’s long-term objectives and the Sustainable
Development Goals.

1
1. Identification of Kyrgyzstan’s current position, prospects and key issues
1.1. Introduction
The ultimate objective of any industrial development strategy is to raise the living standards of all
strata of society. At the core of such a strategy is the creation of new and the expansion of
existing economic opportunities in the manufacturing sector which has proven to coincide with
successful development processes (Kaldor, 1967; Rodrik, 2013; Szirmai and Verspagen, 2015;
Haraguchi, 2016b). Several features of the manufacturing sector ensure that the sector has
maintained its function as an engine of growth (Haraguchi et al., 2017) even in times where
numerous countries are struggling with ‘premature deindustrialisation’ (Rodrik, 2016). These
features include the fact that innovations and technological progress predominantly emanate
from manufacturing activities. This is equally applicable to developing countries such as the
Kyrgyz Republic, as technological progress can also take the form of imitation and adaptation of
existing technologies. Imitation is easier in the realm of manufacturing where part of the relevant
knowledge is codifiable or embodied in machinery. As a consequence, manufacturing industries
facilitate convergence across countries (Rodrik, 2013). Since innovation and imitation feed into
productivity growth, the manufacturing sector in countries that have embarked on a sustained
development trajectory is typically more productive than the rest of the economy. An additional
aspect is that, in principle, the manufacturing sector is capable of providing a large number of
well-paid jobs (Rodrik, 2012; UNIDO, 2015) in developing countries that feature a dual economy,
characterised by large productivity gaps between the agricultural and informal sectors, on the one
hand, and industry and modern services, on the other. The substantial remnants of a dual
economy structure are one of the key issues to be tackled in Kyrgyzstan’s development strategy.
The creation of employment opportunities in the formal economy is a prerequisite for an inclusive
industrial development. In this context, another characteristic of manufacturing may play out
favourably: strong backward and forward linkages of many manufacturing industries bring about
spillovers to other parts of the economy such as business-related services. Existing evidence
suggests that the inter-linkages between manufacturing and services have increased (Nordås and
Kim, 2013). This strengthening of the manufacturing-services nexus entails new opportunities for
developing countries because such linkages exist in low-tech, medium-tech and high-tech
industries alike and are not limited to high-tech industries. Therefore a dynamic manufacturing
sector generates jobs directly and indirectly in various inter-connected parts of the economy. As a
consequence, more people can participate in the growth process and benefit from rising
productivity and wages (UNIDO, 2015). While a necessary condition, bringing more people into
formal employment is not a sufficient condition for inclusive development. This is because
inclusiveness also implies that all parts of society have the same access to such jobs, irrespective
of gender, religion and ethnic affiliation. Moreover, social inclusiveness in manufacturing can only
be achieved when choices of technologies are aligned to a country’s resource and skill
endowment (UNIDO, 2015) and it must be embedded in the wider social fabric (Polanyi, 1957).

2
For Kyrgyzstan, which has only recently become a lower-middle-income country (LMIC) according
to the World Bank’s country classification by income groups, sustainable development also
necessitates poverty reduction to the extent that the remaining incidences of extreme poverty
are de facto eliminated.
An additional requirement of a successful development process is that high growth is sustained
over a long period. A sustained catching-up trajectory was estimated to require average GDP
growth rates of 5% per year or more for at least two decades (UNIDO, 2015) with a volatility of
growth as low as possible (Pritchett, 2000). The latter is a major challenge for developing
countries due to their dependence on commodities and resource-based manufactures which are
subject to pronounced price fluctuations on the world markets. The concentration of exports in a
few products poses a further threat to a sustained growth process.
A step-up in economic activity needs to be accompanied by a shift towards more efficient,
environmentally friendly and less resource-intensive production technologies in order to prevent
emissions from rising and a degradation of the natural environment. Moreover, an accelerated
depletion of key resources due to inefficiencies risks undermining an inclusive and sustainable
growth process as does the destruction and pollution of the natural habitat. For this reason
UNIDO promotes the concept of inclusive and sustainable industrial development (ISID) which is
part of the United Nation’s Sustainable Development Goal (SDG) 92 (UNIDO, 2015).
The remainder of this chapter reviews key economic and social developments in Kyrgyzstan as
well as the challenges ahead which need to be mastered and the opportunities to be taken
advantage of in order to ignite an industrial take-off and to embark on an inclusive and
sustainable growth path.
1.2. Historical, Social and Macroeconomic Background
1.2.1. The transition recession and Soviet legacies
The consequences of the transition recession and Soviet nostalgia are still felt today. Kyrgyzstan
is a landlocked, mountainous country located in the eastern part of Central Asia. With a
population of 6.1 million, it is a small economy with a limited resource base and highly dependent
on energy imports. After the collapse of the Soviet Union and its independence in 1991, the
Kyrgyz economy experienced a massive recession that was due to a plethora of factors ranging
from the immediate liberalisation of the economy under the auspices of the World Bank and IMF
to the loss of fiscal transfers from the Soviet Union, estimated at 10% of Kyrgyz GDP during the
late 1980s (Williamson, 1993), and the breakdown of Soviet payment mechanisms. Another key
factor was the disruption of trade flows between individual republics which had previously
guaranteed demand for output. The extent of the economic slump was aggravated by the fact
that the allocation of industries to Kyrgyzstan in the Soviet system did not necessarily coincide
2 SDG 9 is dedicated to building resilient infrastructure, promote inclusive and sustainable industrialisation and foster innovation.

3
with the country’s comparative advantages. By 1995, GDP had declined by 50% compared to the
1990 level (Figure 1-1).
Figure 1-1: Transition recessions and recovery in former Soviet Union states, 1986-2016
Source: World Development Indicators (WDI), wiiw calculations.
The transition recession meant an almost complete erosion of Kyrgyzstan’s industrial base (ADB,
2013a). Importantly, in contrast to neighbouring Kazakhstan and Uzbekistan, Kyrgyzstan lacked
own energy resources (except for rivers and the associated hydro power potential), making it
more difficult to attract foreign investment in the industrial sector. The country’s land-lockedness
also hampered the reorientation of exports to new markets. Kyrgyzstan’s accession to the WTO in
1998 did not really help to remedy this problem. For these reasons, it was only in 2011 that the
country reached its 1990 level of income – later than most other former Soviet republics. While a
long time ago, the experience of the transition period is important as there seems to be wide-
spread Soviet nostalgia, including amongst the ruling elite, which perceives Kyrgyzstan to have
been an industrial powerhouse in Soviet times.
Manufacturing was one of the sectors hit hardest by the economic turmoil, with its share in GDP
reduced to only 9% compared to one third at the beginning of the decade (Figure 1-2). The
decline of manufacturing activity was brought to an end in 1997 with the beginning of the
commercial exploitation of the Kumtor gold mine, operated by a Canadian mining company. In
addition to the actual mining activities, this also established an important downstream activity in
Kyrgyzstan, the smelting of the gold ore, which allows the country to export fine gold, mainly to
Switzerland. While gold mining gave a huge impetus to aggregate manufacturing production, it
obviously did not help resolve the problems of the traditional industries, such as textiles, which
suffered from an outflow of skills, ageing equipment and above all the lack of management and
marketing skills on the side of firms.
0
50
100
150
200
250
300
1986 1991 1996 2001 2006 2011 2016
rea
l G
DP
(1
99
0=
10
0)
Kyrgyzstan Kazakhstan Tajikistan
Turkmenistan Uzbekistan Russia
Ukraine Belarus Azerbaijan
Armenia Georgia

4
Figure 1-2: Development of Kyrgyz industry and manufacturing, 1990-2016
Note: Values are in per cent of GDP.
Source: World Development Indicators (WDI).
Lack of employment opportunities as the breeding ground for massive outward migration and a
rampant informal economy. The outward migration of the generally highly-skilled non-Kyrgyz
ethnic minorities after independence was substantial: between 1991 and 2000, about
620 thousand people left the country, including 378 thousand ethnic Russians (ADB, 2014a). This
outflow of talent in combination with incomplete reforms of the legal and regulatory framework,
including economic reforms that prevented an inflow of foreign direct investment and domestic
business development, caused a lack of employment opportunities and led to the formation of a
huge informal sector in the economy that is still prevalent today.
Installation of democratic structures, early market reforms did not result in a growth dividend.
In political terms, Kyrgyzstan with its mixed presidential-parliamentary system is arguably the
most democratic country in Central Asia, with a substantial degree of pluralism in politics
(reflecting not least competition between various ethnic clans). During the 1990s, Kyrgyzstan was
a front-runner in Central Asia in terms of market reforms which included price and foreign trade
liberalisation, privatisation, and de-regulation. This reform process needs to be completed,
including filling in the gaps in the regulatory framework.
Political remain but with signs of easing. The country featured repeated political turmoil in the
past. More recently, the political situation has been more stable. The presidential elections that
took place in October 2017 can be considered as a reassuring sign as the election process was
running relatively smooth. The change of presidency was effected without outbreaks of violence
for the first time in the history of the country.
0
5
10
15
20
25
30
35
40
1990 1992 1994 1996 1998 2000 2002 2004 2006 2008 2010 2012 2014 2016
valu
e a
dd
ed
sh
are
in %
share of industry share of manufacturing
Independence (1991)
Start of operations at
Kumtor gold mine (1997)

5
External vulnerabilities are structural and bound to remain. The country maintained a rather
open trade and investment policy. It was the first of the former Soviet republics to join the WTO
in 1998. This liberal stance on trade policy, in addition to its small economic size, results in a very
high openness ratio, even though with highly asymmetric contributions of exports and imports,
which in turn translate into a chronic and large trade deficit. So far, Kyrgyzstan has been able to
finance of the trade deficit thanks to the inflow of remittances, which account for approximately
25% of GDP, as well as official development assistance (about 7-11% of GDP) and to a growing
extent also foreign direct investment inflows (averaging 7.6% of GDP over the past 10 years)..
Environmental issues largely unresolved. Another legacy from the Soviet era is the
environmental threats posed by hazardous waste deposits from closed-down mining and
metallurgic facilities. Among the most pressing issues in this respect are the tailing dumps of
radioactive waste. While various international organisations provide assistance in the form of
environmental clean-up programmes, the waste storage problems remain largely unsolved.
1.2.2. Satisfactory but unsteady growth
An economy overly dependent on gold exports. After the transition recession, economic
recovery finally set in 1996 with the support of the export opportunities provided by the
operations at the Kumtor gold mine (ADB, 2014a). Kumtor is the fifth largest open pit gold mine in
the world and constitutes the backbone of the Kyrgyz industrial sector. Gold mining and smelting
account for approximately 7-10% of Kyrgyzstan’s GDP depending on annual mine output. With
exports in the order of 16-17 tons annually, gold is also by far the most important export item
contributing on average 45% to the country’s total goods exports.
While gold mining and the associated foreign direct investments provided a considerable boost to
the country’s industrial output, the strong reliance on just one commodity also increased the
volatility of the economy. Incidences such as the environmental accident in 2002 or the disruption
of operations due to strikes and protests from the local communities living in the neighbourhood
of the mine (Figure 1-3) add to the volatility in revenues from gold production, linked to geological
and technical factors on the hand and international prices fluctuations on the other hand. In the
past, the economic development in Kyrgyzstan was also repeatedly shocked by political
turbulences such as in 2005 or 2010.

6
Figure 1-3: Kyrgyz GDP growth, 1995-2016
Source: CISSTAT database, Asian Development Outlook 2017, EDB Macroreview 2017.
Despite the unsteady development, the average growth rate was reasonably high at 4.6% over the
past two decades (1996-2016). The aggregate growth performance is, despite all the structural
and institutional weaknesses of the economy, an indication of the country’s great economic
potential and made Kyrgyzstan graduate to the group of lower-middle-income countries in 2014,
surpassing the threshold of a GNI of USD 1,045.
Still, given the severity of the transition recession and the lack of oil and gas resources, Kyrgyzstan
remains the second poorest in the Central Asian region after Tajikistan.
Growth helped to reduce poverty but parts of society remain economically vulnerable.
Economic growth was not only reasonably high, but also socially-inclusive, benefiting those at the
bottom of the income ladder most. Poverty has declined markedly; for instance, absolute poverty
measured at national poverty line fell from 66% of the population in 2005 to 32% in 2016 (Figure
1-4). The decline in extreme poverty using the international poverty line (i.e. the share of
population living on less than USD 1.90 a day at 2011 PPP) was even more impressive: from 15.4%
of population in 2005 to just 1.3% by 2016. In this respect Kyrgyzstan has doubtlessly achieved
considerable progress. However, moderate poverty (the share of population living on less than
USD 3.10 per day at 2011 PPP) remains widespread at 17.5%, a rate that among former Soviet
republics is higher only in Georgia and Tajikistan (World Bank, 2016). Hence a considerable share
of the population, while not suffering from poverty, remain vulnerable and the return of more
widespread incidences of poverty cannot be ruled out in case of negative economic shocks. In this
context it should be mentioned that the standard of living may be somewhat higher in the
country than suggested by economic indicators such as GDP per capita at purchasing power
-6
-3
0
3
6
9
12
1995 2000 2005 2010 2015
GD
P g
row
th y
ear
-on
-yea
r in
%
forecast
EAEU
ADB
Transition recession
Contagion from
Russian crisis
Accident at Kumtor
‘Tulip revolution’
Great recession
Ethnic conflicts
Disruptions at Kumtor mine
Average growth rate

7
parity, which currently stands at USD 3,600. This is owed to the importance of informal activities
which – while imputed into official statistics – are likely to be underestimated. Still, a primary
objective of an Inclusive and Sustainable Industrial Development (ISID) strategy for Kyrgyzstan
must therefore be the eradication of remaining incidences of poverty.
Figure 1-4: Poverty reduction in Kyrgyzstan, 1993-2015
Note: Extreme and moderate poverty according to World Bank thresholds.
Source: World Development Indicators (WDI).
Improvements were also recorded in the realm of inequality. Between 2005 and 2015, the Gini
coefficient of consumption – which is one of the most appropriate measures for the dispersion of
living standards in a society – decreased from 0.29 to 0.23, especially thanks to improvements in
rural areas. This suggests that Kyrgyzstan is one of the most equal countries in the group of lower-
middle-income countries and also fares well in a global comparison. The trends in the living
standards mirrored the relative re-distribution of incomes towards the poor segments of the
population: the average annual growth of consumption by the poorest 40% of the population in
2005-2015 (5.1%) was much faster than of the population as a whole (3.4%) (World Bank, 2016).
The Gini coefficient of income inequality initially improved, too, but after the crisis of 2009-2010 it
started rising again and reached 0.42 by 2012 (ADBa, 2014).
1.2.3. A labour market in the shadows
A rampant informal economy erodes the tax base. An estimated 70% of the active workforce is
active in the informal economy3, accounting for an estimated 28% of total value added4. However,
3 National documents typically refer to the informal sector as the ‘non-observed’ economy. The non-observed economy comprises the
hidden economy and the informal economy. The former represents activities by registered companies which are not properly reported
(e.g. for reasons of tax avoidance) whereas the informal economy represents activities that are non-registered altogether (e.g. small-
scale street vendors). See: National Accounts of the Kyrgyz Republic 2010-2014, Annual publication (in Russian). National Statistical
Committee of the Kyrgyz Republic, 2015, pp. 242-243.
44.3
1.3
63.9
17.5
39.9
32.1
0.0
20.0
40.0
60.0
80.0
1993 2000 2002 2004 2006 2008 2010 2012 2014
po
vert
y ra
te
extreme poverty moderate poverty national poverty rate

8
alternative estimates put the contribution of the informal economy to more than 50% of GDP (e.g.
UNDP, 2006). The ubiquity of the informal sector is key feature of the Kyrgyz economy and one of
the main obstacles to a more dynamic productivity development (see also IMF, 2016a). The
transition of only half of the informal sector activities to the formal sector is estimated to increase
the country’s GDP growth by up to one quarter (Bozieva, 2016). The informal economy also has
critical implication for the state finances as the informal economy erodes the tax base. A good
illustration of the severity of the issue is the comparison of income tax paid by Kyrgyz residents
and foreign nationals residing in Kyrgyzstan: foreigners in Kyrgyzstan account for about 1% of the
workforce but their share in the total income tax paid amounts to 27% (SIAR Research and
Consulting, 2016). While expatriates, including employees of international organisations, earn
much higher wages than the average Kyrgyz employee, the exorbitant contribution of non-
residents to the income tax bill illustrates primarily the fiscal problem posed by informality. This
issue needs to be tackled by the authorities soon.
Informality holds back productivity but eases unemployment. Amidst all the problems it causes,
the prevalence of informal employment helped keeping the unemployment rate in official
statistics relatively stable at around 8-9%5. However, these figures mask a huge amount of
underemployment in the informal economy, especially though not exclusively in the agricultural
sector and trade services. Apart from informality, discrimination of women in the labour market,
which is partly rooted in the clear roles assigned to men and women in society, remains a serious
issue. While the ratio of average salaries between men and women is relatively moderate at 1.3
(which still does not make it acceptable), huge discrepancies persist in employment rates, which
are much higher for men throughout all age categories. For example, in the age category ranging
from 25-29, the gap in the employment rate between men and women amounts to more than 35
percentage points6 and starts to decline only slowly after the age of 407. Also, with 9% (2015), the
female unemployment rate is markedly higher than that of men (6.5%).
Inequalities in economic opportunities in the labour market remain due to the asymmetric access
to important functions and top management positions in an environment where personal
relationships and networks are often given priority over merit. The underrepresentation of
women in top political and management positions reflects this reality.
Young people hurt most by insufficient employment opportunities in the formal economy. One
of the main explanations for the mushrooming informal activities is the rigid of the Kyrgyz labour
market. Most affected by the insufficient supply of employment opportunities in the formal
segment of the private sector is Kyrgyzstan’s youth. Youth unemployment8 remains elevated at
15%, about twice the rate for the total labour force. Among the young, it is harder for females to
4 Data according to the National Statistical Committee of the Kyrgyz Republic (from the publication: Employment and unemployment.
Results of the integrated sample survey of households budgets and labour force in 2014). 5 In 2015 the unemployment rate was down to 7.5% according to national estimates.
6 The employment rate for male is 86.4% compared to 50.7% for females.
7 Data according to Russian Entrepreneurship, Number 1, 2016.
8 Youth unemployment here refers to unemployed persons aged 20-24 years according to national estimates. ILO estimates are very
similar though.

9
find employment resulting in an even higher unemployment rate (19% as of 2015). The most
vulnerable parts of the youth are young women aged between 15 and 24, which are typically
those who do not have any or have little work experience. Hence, while the country’s young
population constitutes a potential asset, the lack of formal jobs and the prospect of higher wages
in neighbouring Kazakhstan and above all Russia prevent Kyrgyzstan from collecting a
demographic dividend.
1.2.4. Critical environmental risks prevail
The current environmental dangers concern both air, land and water resources. As a country that
has predominantly a semi-arid climate, the consequences of climate change are strongly felt. The
extent of glacial retreat is expected to reach 30-40% by 2025 which has a direct impact on the
water content of rivers which as a consequence is equally bound to decrease by a quarter or more
(SIAR, 2013). This poses a challenge for sustainability but it also threatens the country’s industrial
potential whose energy generation is largely dependent on hydro power. This is just one example
that shows how closely sustained and sustainable development are intertwined.
Pollution and inefficient use of a key strategic resource due to inadequate facilities. Water
resources (including rivers and lakes) are threatened by chemical and organic pollution, that stem
mainly but not exclusively from numerous (untreated) dumps and waste tailings from mining
enterprises. Additional pollution reaches the water systems through sewages as only 56% of cities
and urban settlements dispose of centralised sewage systems with adequate facilities. And even
where treatment facilities exist, these often do not meet basic sanitary standards. Therefore
concerns about drinking water are well founded and further aggravated by the fact that more
than 90% of drinking water is used in agriculture – mainly for irrigation. This high share of water
out-take on the account of the agricultural sector is due to inefficient use of water resources
resulting from outdated irrigation technologies and a lack of water saving technologies.
Degradation of farm land puts the livelihood of the poorest population at risk. A major
environmental challenge that directly affects the economic prospects of more than 1.5 million
people still employed in rural areas9 is the degradation of agricultural land, reflected in soil
erosion, salinisation, loss of humus and contamination due to the use of fertilisers. As of 2011,
more than half of the agricultural land, including arable land and pastures, was subject to
degradation (Ubaidulaev, 2015). Soil degradation and other environmental pollution, including
the unsettled issues related to industrial waste deposits, undermines the sustainability of the
development process. Moreover, with the poorest parts of the population being most exposed to
the negative consequences of environmental degradation, the environmental problems also
counteract the efforts made in the fight against inequality.
Emissions and consumption of resources are growing fast. Focusing on the manufacturing sector,
a broad international comparison reveals that the growth of both pollution (measured by the
9 The general implications of environmental damages of course go far beyond direct economic consequences.

10
amount of CO2 emissions10) and the consumption of resources (measured by material use11) were
relatively high in Kyrgyzstan. In fact, the growth of CO2 emissions increased by some 140% over
the period 1995-2013, exceeding even the growth in upper middle income countries, the country
group which the highest increases among the broadly defined country groups (Figure 1-5). The
picture emerges for the growth of material use (
Figure 1-6).
Mitigation of environmental impacts exist but to a limited degree. The total growth of CO2-
emissions and material use can be decomposed into a growth effect, simply due to the expansion
of manufacturing production, a composition effect and an intensity effect. The composition effect
captures changes in the production structure within manufacturing as individual industries differ
with regards to their pollution and material use intensity. Finally, the intensity effect is the
intensity of CO2 emissions and material use within individual industries12. This latter effect
appears to be negligible. The intensity effect is important because it actually has the potential to
counter the growth of emissions and the consumption of resources through the switch to more
efficient and less-polluting production technologies. Indeed, the growth of CO2 emissions and
material use resulting from the expansion of production was somewhat reduced by the intensity
effect in Kyrgyzstan. In fact, the mitigating impact of the intensity effect was relatively larger than
in lower-middle income countries in general.
Overall, however, the trends in both CO2 emissions per capita and material use per capita are
worrisome because clearly positive and in the case of the latter strongly positive (Panel (a) in
Figure 1-7 and
Figure 1-8). An important fact, that is to be taken into account though, when looking at the
environmental data, is that the level of pollution and consumption of resources started at a quite
low level. In the case of CO2, the level of emissions per capita is still clearly below that of lower
middle income countries – partly reflected the fact that Kyrgyzstan is positioned at the lower
bound of the income brackets of this country group
10 CO2 emissions include both emissions due to the production of manufacturing goods and the emissions due to electricity use of the
sector. 11
Material use is intended to reflect the use of materials as intermediate inputs and includes minerals (ores), biomass and construction
materials but not fossil fuel. 12
The decomposition relies on input-output data from the EORA database (see Lenzen et al., 2012).

11
Figure 1-5: Decomposition of CO2 emissions (international comparison), 1995-2013
Source: EORA database.
Figure 1-6: Decomposition of material use (international comparison), 1995-2013
Source: EORA database.
Still, the fact that the intensity effect – which reflects the introduction of less-polluting production
techniques – shows much less of a downward trend than in other lower-middle income countries.
-100%
-50%
0%
50%
100%
150%
200%
High Income Upper Middle
Income
Lower Middle
Income
Low Income Kyrgyzstan
Total growth (1995-2013) Growth due to scale (1995-2013)Growth due to composition (1995-2013) Growth due to intensity (1995-2013)
-100%
-50%
0%
50%
100%
150%
200%
High Income Upper Middle
Income
Lower Middle
Income
Low Income Kyrgyzstan
Total growth (1995-2013) Growth due to scale (1995-2013)Growth due to composition (1995-2013) Growth due to intensity (1995-2013)

12
Figure 1-7: CO2 volume per capita and intensity effect of CO2
Panel (a): CO2 volume per capita Panel (b): Intensity effect of CO2
Note: LMI= lower-middle income countries; LI= lower income countries
Source: EORA database.
Figure 1-8: Volume of material use per capita and intensity effect of material use
Panel (a): Volume of material use per capita Panel (b): intensity effect of material use
Note: LMI= lower-middle income countries; LI= lower income countries
Source: EORA database.
0
1
2
3
4
5
6
7
8
19
95
19
96
19
97
19
98
19
99
20
00
20
01
20
02
20
03
20
04
20
05
20
06
20
07
20
08
20
09
20
10
20
11
20
12
20
13
LMI LI Kyrgyzstan
0
200000
400000
600000
800000
1000000
1200000
19
95
19
96
19
97
19
98
19
99
20
00
20
01
20
02
20
03
20
04
20
05
20
06
20
07
20
08
20
09
20
10
20
11
20
12
20
13
Kyrgyzstan LI LMI
0
5
10
15
20
25
30
35
19
95
19
96
19
97
19
98
19
99
20
00
20
01
20
02
20
03
20
04
20
05
20
06
20
07
20
08
20
09
20
10
20
11
20
12
20
13
LMI LI Kyrgyzstan
0
500000
1000000
1500000
2000000
2500000
19
95
19
96
19
97
19
98
19
99
20
00
20
01
20
02
20
03
20
04
20
05
20
06
20
07
20
08
20
09
20
10
20
11
20
12
20
13
LMI LI Kyrgyzstan

13
More efficient production techniques are needed for a sustainable industrial development. The
situation regarding material use is somewhat different as Kyrgyzstan has clearly outpaced other
lower-middle income countries. The developments regarding material use in manufacturing
points to rather inefficient and wasteful production techniques, calling for close monitoring and
improvements of the existing situation. As in the case of CO2-emissions, the mitigation from using
more resource-efficient modes of production is hardly gaining momentum over time. Clearly, the
mitigation measures both with regards to CO2 emissions and material use have to be scaled-up by
introducing modern and environmentally-friendly capital equipment if the country is to embark
on a manufacturing-driven development path. Otherwise, the acceleration of manufacturing
output will lead to serious environmental damage, as pollution levels and consumption of
resources were already rising strongly, despite a rather sluggish manufacturing sector
development.
1.3. Implications of the Macroeconomic Policy Framework for Industrial Development
A standard policy-mix applied with great discretion. The macroeconomic policy framework of the
Kyrgyz Republic is of high importance for its industrial transformation and export
competitiveness. The country follows a largely standard liberal approach in line with the
recommendations of the IMF: an inflation rate targeting regime with flexible exchange rate
arrangement in combination with fiscal consolidation13. However, the policy mix is generally
applied with great discretion in order to insulate against external shocks. Meeting the formal
inflation and fiscal targets may not suffice for achieving macroeconomic stability objectives in
light of high external and internal vulnerabilities. This needs to be highlighted as excessive
preoccupation with macroeconomic objectives could also be detrimental for sustained
industrialisation and external competitiveness. Meeting the twin objective of macroeconomic
stability and maintaining favourable conditions for industrialisation and external competitiveness
poses a formidable challenge for which the current policy macroeconomic framework may not be
optimal.
1.3.1. Monetary policy
Exposure to external shocks poses a challenge for the inflation targeting regime. The National
Bank of the Kyrgyz Republic (NBKR) has committed to an inflation targeting regime in combination
with a floating exchange rate arrangement permitting occasional interventions to smooth
excessive volatility of the som exchange rate (rather than attempting to influence the equilibrium
trend dynamics determined by macroeconomic fundamentals). As of September 2017, the policy
rate is kept at 5.0% to meet the inflation target range of 5-7% in the medium term. The gradual
lowering of the policy rate during 2016 from levels above 10% reflects the abating inflationary14
and exchange rate pressures.
13 In the future also constraints imposed by the EAEU framework may play an increasing role.
14 Inflation was in negative territory in the year 2016.
14
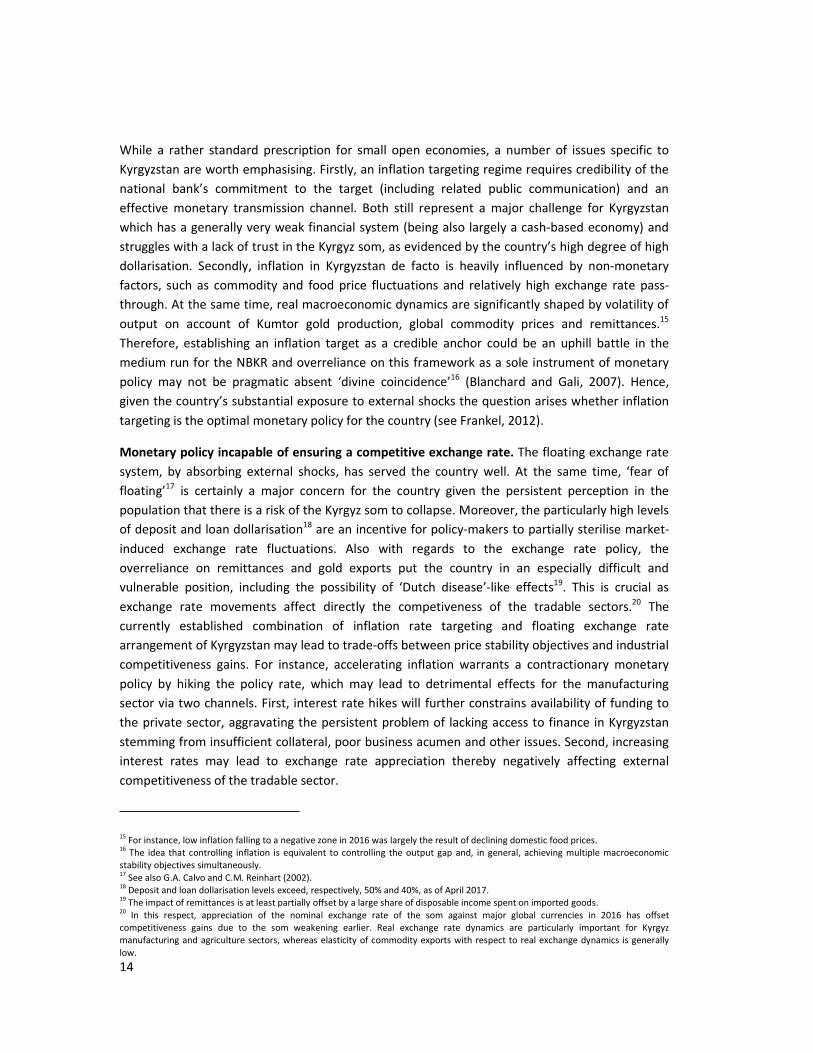
While a rather standard prescription for small open economies, a number of issues specific to
Kyrgyzstan are worth emphasising. Firstly, an inflation targeting regime requires credibility of the
national bank’s commitment to the target (including related public communication) and an
effective monetary transmission channel. Both still represent a major challenge for Kyrgyzstan
which has a generally very weak financial system (being also largely a cash-based economy) and
struggles with a lack of trust in the Kyrgyz som, as evidenced by the country’s high degree of high
dollarisation. Secondly, inflation in Kyrgyzstan de facto is heavily influenced by non-monetary
factors, such as commodity and food price fluctuations and relatively high exchange rate pass-
through. At the same time, real macroeconomic dynamics are significantly shaped by volatility of
output on account of Kumtor gold production, global commodity prices and remittances.15
Therefore, establishing an inflation target as a credible anchor could be an uphill battle in the
medium run for the NBKR and overreliance on this framework as a sole instrument of monetary
policy may not be pragmatic absent ‘divine coincidence’16 (Blanchard and Gali, 2007). Hence,
given the country’s substantial exposure to external shocks the question arises whether inflation
targeting is the optimal monetary policy for the country (see Frankel, 2012).
Monetary policy incapable of ensuring a competitive exchange rate. The floating exchange rate
system, by absorbing external shocks, has served the country well. At the same time, ‘fear of
floating’17 is certainly a major concern for the country given the persistent perception in the
population that there is a risk of the Kyrgyz som to collapse. Moreover, the particularly high levels
of deposit and loan dollarisation18 are an incentive for policy-makers to partially sterilise market-
induced exchange rate fluctuations. Also with regards to the exchange rate policy, the
overreliance on remittances and gold exports put the country in an especially difficult and
vulnerable position, including the possibility of ‘Dutch disease’-like effects19. This is crucial as
exchange rate movements affect directly the competiveness of the tradable sectors.20 The
currently established combination of inflation rate targeting and floating exchange rate
arrangement of Kyrgyzstan may lead to trade-offs between price stability objectives and industrial
competitiveness gains. For instance, accelerating inflation warrants a contractionary monetary
policy by hiking the policy rate, which may lead to detrimental effects for the manufacturing
sector via two channels. First, interest rate hikes will further constrains availability of funding to
the private sector, aggravating the persistent problem of lacking access to finance in Kyrgyzstan
stemming from insufficient collateral, poor business acumen and other issues. Second, increasing
interest rates may lead to exchange rate appreciation thereby negatively affecting external
competitiveness of the tradable sector.
15 For instance, low inflation falling to a negative zone in 2016 was largely the result of declining domestic food prices.
16 The idea that controlling inflation is equivalent to controlling the output gap and, in general, achieving multiple macroeconomic
stability objectives simultaneously. 17
See also G.A. Calvo and C.M. Reinhart (2002). 18
Deposit and loan dollarisation levels exceed, respectively, 50% and 40%, as of April 2017. 19
The impact of remittances is at least partially offset by a large share of disposable income spent on imported goods. 20
In this respect, appreciation of the nominal exchange rate of the som against major global currencies in 2016 has offset
competitiveness gains due to the som weakening earlier. Real exchange rate dynamics are particularly important for Kyrgyz
manufacturing and agriculture sectors, whereas elasticity of commodity exports with respect to real exchange dynamics is generally
low.

15
Even more important for industrial development than fluctuations in the exchange rate, are
unfavourable real exchange rate trend dynamics (‘chronic overvaluation’). In this respect, it is
worth noting that the country was facing an overvalued exchange rate for the most part of the
post-crisis period, with a peak in the real exchange rate at the end of 2014 (Figure 1-9).
Figure 1-9: Real effective exchange rate development, 2000-2017
Note: An increase (decrease) in the real exchange rate index indicates a real appreciation (depreciation).
Source: National Bank of the Kyrgyz Republic.
This conclusion is not primarily drawn from the fact that the real exchange rate index was
permanently above its 2010-level, a year in which the economic development was affected by the
political turbulences, but by the chronic current account deficit and the assessment by the IMF in
its recurring reviews of Kyrgyzstan (IMF, 2016b; 2017). These assessments are not necessarily
consistent over time21 but most analytical methods used by the IMF suggest a moderate-to-high
overvaluation over the past five years. Taking into account, that an industrial development
strategy is more likely to be successful with a slightly undervalued exchange rate, further
attempts to bring down the real exchange rate to a competitive levels could be considered22. The
need for a lower exchange rate is even more acute for trade with EAEU partner countries against
whose currencies the som is more strongly overvalued (see Figure 1-9). Hence, a careful analysis
21 In its early 2016 review of the country, the IMF estimated that Kyrgyzstan’s real exchange rate misalignment reached 14% in 2015
based on the current account method (IMF, 2016, p. 66) with the average index standing at 115 of its 2010-level. Less than one and a
half years later, based on the same methodology, the IMF comes to the conclusion that by the end of 2015, the Kyrgyz real exchange
rate was ‘broadly in line with fundamentals’ (IMF, 2017, p. 15) with the real exchange rate index standing at 109 in December 2015.
Even if this more conservative view on the equilibrium exchange rate from the last review is considered, the som has remained
overvalued throughout 2016 and 2017. 22
On the flipside of a substantial monetary policy easing and a depreciation of the som is the fact that over 90% of the country’s public
debt is denominated in foreign currency. This implies that a depreciation also directly worsens fiscal sustainability and thus the ability
of the government to conduct economic policy. These risks have already materialised in the past as the depreciation of som by 22% in
2015 led to the public debt-to-GDP ratio of Kyrgyzstan exceeding 60%.
75
100
125
150
20
00
m1
20
01
m1
20
02
m1
20
03
m1
20
04
m1
20
05
m1
20
06
m1
20
07
m1
20
08
m1
20
09
m1
20
10
m1
20
11
m1
20
12
m1
20
13
m1
20
14
m1
20
15
m1
20
16
m1
20
17
m1
20
18
m1
Re
al
eff
ect
ive
ex
cha
ng
e r
ate
(2
01
0=
10
0) REER (main partners) REER (EAEU partners)

16
of whether a ‘Dutch-disease’-like phenomenon induced by remittances or other factors are
behind the seeming upward trend in the real exchange rate is warranted. Also, it may be
questioned that under these circumstances inflation targeting, which tends to be pro-cyclical in
case of supply shocks and external shocks, is the optimal monetary policy regime.
1.3.2. Fiscal policy
Fiscal consolidation and debt sustainability at the top of the fiscal agenda. Fiscal policy is shaped
by public debt sustainability considerations in line with the IMF support programme and
accompanying conditionality and recommendations. Formally, Kyrgyzstan also has to fulfil fiscal
requirements under the EAEU framework23. In 2016 Kyrgyzstan pursued a rather loose fiscal
policy due to public investment programmes implemented to stimulate economic growth
(financed via external concessional loans). Yet, towards the end of the year the government
forced adjustments of its expenditures in attempt to achieve the fiscal deficit target. Since then
the Kyrgyz authorities have been on track with a fiscal consolidation effort to bring the fiscal
deficit to a more sustainable level of 3% in 2017 (down from 4.5% in 2016). Adjustment is
envisioned via improvements in tax administration, reduction of the informal economy,
optimisation of tax stimulus measures and cutting down on government expenditures.
While fiscal sustainability is imperative for macroeconomic stability, untimely and poorly planned
fiscal consolidation may undermine growth prospects. Naturally, fiscal consolidation in the short-
to-medium run will put binding constraints on the availability of public funds needed to finance
institutional reforms and public investment. Both are much needed in the near future in
Kyrgyzstan which suffers from multiple structural weaknesses and still low capacity to comply
with the EAEU technical regulations, which limits its ability to exploit opportunities that Eurasian
integration offers and in general hampers industrial competitiveness. An increase in the general
tax burden and removal of simplified tax regimes will put further pressure on the private sector in
an already difficult period of transition to a ‘new normal’—elimination of incomes from re-exports
via bazaars, lower potential growth rates of main trading partners, depressed commodity prices,
stricter technical, sanitary and phytosanitary (SPS) and customs regulations, higher competition
from the EAEU partners. Moreover, increasing the tax burden will make it more difficult to induce
firms to switch to the formal economy. Therefore it is important to ensure that fiscal
consolidation efforts on both expenditure and revenue side do not hamper public investment and
targeted incentives for firms supportive of industrial productivity and competitiveness.
Improvements in the fiscal administration needed. The major effort should focus on enhancing
the efficiency of tax administration and public expenditures, which is a difficult task per se with
many strings attached. In particular, the elimination of a simplified tax regime will have negative
effects on certain sectors (textiles and apparel), as well as investment activity (for instance,
23 While fiscal consolidation has been a crucial component of the IMF macroeconomic stabilisation programme that Kyrgyzstan has
been following, the country is also at least formally constrained now by the EAEU macroeconomic sustainability criteria. Actual
enforcement of these regulations is, however, lacking, and the EAEU members have been breaching the criteria in the past, including
Kyrgyzstan in 2016.

17
miscellaneous tax incentives24 were one of the components of the investment attractiveness
package offered in free economic zones of Kyrgyzstan). Moreover, the push for contraction of the
informal sector along with higher tax burden may have drastic social costs, especially in
impoverished rural regions relying largely on informal activity as a means of subsistence living.
Reduction of informal economy is yet an important step for arriving at a transparent and
competitive economy.
Creating fiscal space by reducing electricity subsidies. An urgent budgetary issue with implication
for the leeway of fiscal policy is the reform of the energy sector which is a drag on the budget due
to the highly subsidised electricity tariffs. While socially contentious, reforming the tariff system –
which suffers from obvious flaws visible from high feed-in tariffs compared to end-user prices and
in addition is prone to misuse – needs to be tackled urgently. It would create considerable fiscal
space as the annual energy subsidies amount to almost 70% of the wage bill of the public sector
and are 13 times higher than the budget allocations to the Monthly Benefit to Poor Families
(MBPF) programme (World Bank, 2017a). The savings achieved by the tariff reform could be
directly used to the benefit of the energy sector, for example by stepping-up public investments in
new hydropower capacity or in the modernisation of the grid.
Overall, achieving macroeconomic stability and arriving at predictable and transparent
macroeconomic policy is essential for fostering supportive business environment in general, and
for facilitating FDI inflows, which should become the key engine of industrial modernisation and
transformation of the country.
1.4. Seizing the Opportunities of the Eurasian Economic Union
Bottlenecks in industrial production need to be resolved to benefit from regional integration.
Kyrgyzstan’s accession to the Eurasian Economic Union (EAEU) constitutes the most important
economic integration step since the country’s entry into the WTO in 1998. EAEU membership has
important implications for shaping its industrial development path by facilitating access to the
large common market in proximity, inducing adoption of higher industrial production standards of
the bloc, sustaining inflow of remittances and access to strategically important inputs. The
bottlenecks that still prevent full access to the EAEU market however should be addressed
quickly.
1.4.1. Eurasian Economic Union in brief
In August 2015 the Kyrgyz Republic became a member of the Eurasian Economic Union. The bloc,
comprising now Armenia, Belarus, Kazakhstan, Kyrgyzstan and Russia, remains the most
24 According to the information brochure of the Free Economic Zone ‘Bishkek’, these incentives include a zero profit tax, zero property
tax rate and zero land tax rate. Moreover, rental costs of land and premises are very low (e.g. 1 USD per square metre per year in the
case of land plots).

18
successful attempt so far to reintegrate the post-Soviet economies. The following key
arrangements now constitute the economic core of the EAEU regulations:
• Customs union: shared customs territory with a common external tariff (CET) applied
to non-member countries, harmonisation of non-tariff measures and procedures,
unified commodity classification and customs code.
• ‘Four freedoms’: free movement of goods, services, labour and capital across the
EAEU member states.
• Economic policy coordination: the union attempts to harmonise macroeconomic
policies of the member states by enforcing sustainability criteria capping inflation
rate, general government debt and deficit levels, akin to the Maastricht criteria25.
1.4.2. Key implications of the EAEU for the Kyrgyz Republic
Elimination of trade barriers improves access to a large regional market. A key implication of
Kyrgyzstan’s EAEU membership is the improved access to a large regional market with an
aggregate GDP totalling over USD 1.5 trillion26 and a population exceeding 180 million. Market
access is bound to improve due to the dismantling of tariff and above all non-tariff barriers within
the bloc. For Kyrgyzstan, access to the EAEU market is of critical importance due its large size,
geographic proximity and cross-border infrastructure connectivity inherited from the Soviet
Union. Besides facilitating export-led growth, removal of barriers to trade lowers the cost of
strategically important imports, including fuels, gas, grain, metals, wood, chemicals and other
input products critical for Kyrgyzstan’s domestic industry (dependence on these imported inputs
ranges from 80 to 100%).
Membership entails trade facilitation support by EAEU institutions and regional partners.
Already now Kyrgyzstan receives substantial financial and technical assistance from EAEU
institutions and member states to align to the more advanced technical and sanitary and
phytosanitary (SPS) standards of the bloc. Compliance with these regulations and standards will
be instrumental for industrial modernisation of Kyrgyzstan by improving its product quality
monitoring capacity and trade infrastructure. The latter figure among the key obstacles for
Kyrgyzstan and prevents the country’s full access to the EAEU market. Bottlenecks include testing
and certification laboratories as well as poorly equipped border checkpoints. EAEU partners,
mostly Russia, have committed to financially support Kyrgyzstan experiencing difficulties with
funding its regulatory approximation and infrastructure development on its own (although those
were the preconditions for its accession to the EAEU). As of 2017 already 30 laboratories and 9
certification agencies in Kyrgyzstan were acknowledged by the EAEU authorities, implying that
their test results and certificates are to be recognised throughout the EAEU (see Box B1.1.).
25 In particular, annual CPI inflation rate of any member state should not exceed by more than 5 pp the lowest value in the bloc;
general government deficit is capped at 3% of GDP and general government debt at 50% of GDP. 26
2016 value, in current USD. Aggregate output decreased from USD 1.6 trillion in 2015 as a result of recession and currency
devaluation.

19
Non-compliance with EAEU regulations still inhibits exports. Despite the mentioned efforts
Kyrgyzstan struggles with complying with EAEU regulations and standards which still inhibits
exports from Kyrgyzstan to EAEU partners. So far, the country has not managed to take full
advantage of access to the EAEU market. In fact, mutual trade of Kyrgyzstan with the EAEU
partners in 2015, the year of accession, dropped by over 37%, followed by a moderate recovery in
2016 by 11%. Whereas in part this is an outcome of the lower value of oil imports from Russia due
to the slump in oil prices, recession or slowdown of economic growth in the EAEU countries, a
major factor is also related to Kyrgyz producers’ inability to satisfy the mandatory EAEU technical
and SPS requirements (largely based on the GOST standards27). The work on the elimination of
these barriers is conducted by the local authorities and EAEU authorities, but much further
progress needs to be made. According to the official (Eurasian Economic Commission) count of
regulatory non-tariff barriers, Kyrgyzstan has 40 regulations in place which are deemed to be
barriers. These include 7 associated with negotiated exemptions from the EAEU Treaty and 33
stemming from the lack of harmonised regulations.28 Besides formal barriers that still remain, the
bloc is characterised by a rather poor track record of compliance with the EAEU regulations, as it
is not uncommon that immediate political considerations and bargaining override the formal
agreements.29
Box B1.1. Financial support to Kyrgyzstan attached to its EAEU membership
• Russia provided USD 200 million to adjust to the EAEU regulations, in particular, 4 border
checkpoints (Manas, Osh, Torugart, Irkeshtam) were equipped according to EAEU standards
and 7 veterinary control checkpoints (Torugart, Irkeshtam, Dostuk, Kyzyl Bel, Kara-Suu, Manas
and Osh) were established.
• The Russia-Kyrgyz Development Fund (RKDF) was established to support modernisation of the
economy of Kyrgyzstan by providing loans for investment projects (directly and through
partner banks) at preferential interest rates of 4-7% for up to 5 years (up to 10 years for
projects over USD 5 million). The priority sectors are agriculture and food-processing, light
manufacturing, mining and metals, communication technologies, storage and transport
infrastructure, tourism, healthcare and energy infrastructure. Projects focusing on sustainable
development are particularly encouraged. As of September 2017, USD 249 million worth of
loans (out of USD 500 million USD of total funds provided by Russia) were disbursed, financing
over 700 investment projects.
• USD 100 million worth of technical assistance will be provided by Kazakhstan to improve
customs infrastructure, upgrade laboratories to comply with the EAEU standards.
• Russia’s largest state energy corporation Gazprom plans to invest up to USD 1.7 billion in
Kyrgyzstan to achieve a 60% coverage by its gas network.
• In 2017 Russia signed a protocol on writing off the remaining debt of Kyrgyzstan to Russia
totalling USD 240 million.
27 The GOST standards (Gossudarstwenny Standart) are a set of technical standards maintained by the Euro-Asian Council for
Standardization, Metrology and Certification, the regional standards organization of the Commonwealth of Independent States (CIS)
but which date back to the Soviet era. 28
‘White Book’ of barriers, exclusions and limitations in 2016 available at https://barriers.eaeunion.org/info/documents. 29
Some examples include disputes over petroleum prices and trade wars (restrictions imposed on dairy and meat imports) between
Belarus and Russia, a unilateral embargo imposed by Russia on a range of agricultural products from the Western countries. As regards
Kyrgyzstan, continued tensions with Kazakhstan over the inability of Kyrgyz agricultural producers to meet minimum safety
requirements resulted in a ban on transit via road transport via the territory of Kazakhstan at the end of 2016.

20
EAEU integration may facilitate FDI inflows to Kyrgyzstan. FDI prospects are likely to improve
due to direct investments from the EAEU members now facing fewer constraints. In addition,
while Kyrgyzstan’s tiny market is of little interest per se as a destination of exports, it is attractive
as a production base for exports to the rest of the EAEU, particularly, to Kazakhstan and Russia.
This is especially relevant for China, striving to develop its New Silk Road initiative in the region.
Stricter border controls and higher level of protectionism vis-à-vis non-EAEU trading partners as a
result of the Eurasian customs union regulations also make this avenue yet more likely. FDI
inflows could become a key element of industrial transformation of the Kyrgyz industry by
fostering integration into global value chains and supply networks and bringing in new
technological and organisational skills. Formally, the EAEU framework also calls for a coordinated
industrial policy, putting an emphasis on the automotive sector, heavy and light manufacturing
industries and also stressing sustainable manufacturing development. However, the real
prospects of this endeavour are not clear at the moment.
Maintained access to the labour market of the EAEU helps avoid a major macroeconomic shock.
Migrant remittances, coming mostly from Russia30, are critically important for Kyrgyzstan as a
source of income (remittances constitute 20-30% of its GDP) and means of financing its persistent
trade account deficit. Maintained access to the EAEU labour market as a part of the bloc’s ‘four
freedoms’ arrangement (no quotas and special permissions for labour migrants) helped
Kyrgyzstan to avoid a sharp permanent macroeconomic shock. On the flipside, easier access to
the EAEU labour market may also further exacerbate the problem of labour force outflow from
Kyrgyzstan, both skilled and unskilled, thereby eroding the its growth potential.
The Common External Tariff has led to increases of import duties against non-EAEU members.
Due to its very liberal trade regime, the adoption of the EAEU CET has led to an increase of Kyrgyz
import duties against non-EAEU members. Upon accession to the EAEU in 2015 the average MFN
import tariff rate of the Kyrgyz Republic increased from 4.5% to 6.9% (Figure 1-10). Kyrgyzstan
had a more liberal trade regime prior to its accession to the EAEU. Deterioration of the trade
regime with the WTO members caused by accession to the EAEU requires compensatory
negotiations to be carried out by Kyrgyzstan. As far as the impact on industrial development
prospects is concerned, the CET represents a double-edged sword: on the one hand, it better
shields manufacturing sectors of Kyrgyzstan from foreign competition (Figure 1-11). On the other
hand, the cost of some important intermediate inputs from non-EAEU partners (particularly for its
textile and apparel industry31) will also increase.
30 Over a quarter of Kyrgyzstan’s labour force is estimated to be employed in Russia. After a drop in 2015 (on account of recession in
Russia and the effects of Russian rouble depreciation eroding real incomes of migrants) inflow of remittances recovered in 2016. 31
The textile and apparel industry of Kyrgyzstan depends on imports of material inputs and equipment utilised in the production
process, over 60% of which are imported from China. Some estimates suggest cost of material inputs for the textile industry may
increase up to 20%.
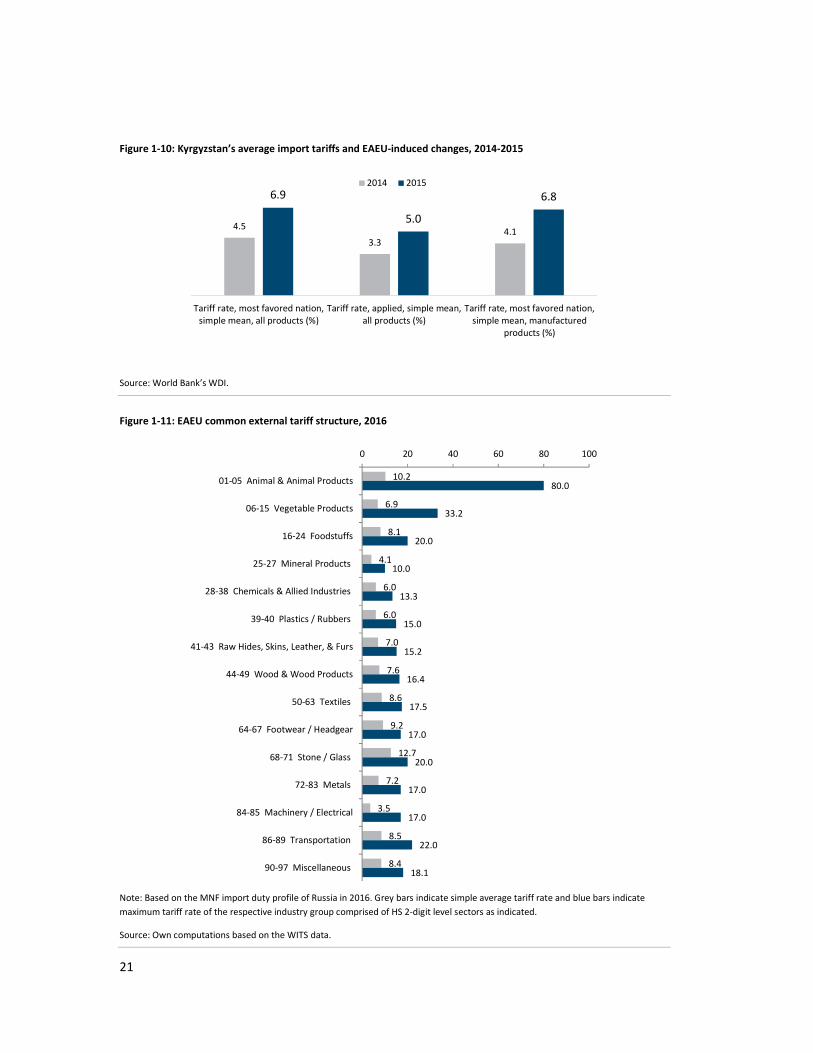
21
Figure 1-10: Kyrgyzstan’s average import tariffs and EAEU-induced changes, 2014-2015
Source: World Bank’s WDI.
Figure 1-11: EAEU common external tariff structure, 2016
Note: Based on the MNF import duty profile of Russia in 2016. Grey bars indicate simple average tariff rate and blue bars indicate
maximum tariff rate of the respective industry group comprised of HS 2-digit level sectors as indicated.
Source: Own computations based on the WITS data.
4.5
3.34.1
6.9
5.0
6.8
Tariff rate, most favored nation,
simple mean, all products (%)
Tariff rate, applied, simple mean,
all products (%)
Tariff rate, most favored nation,
simple mean, manufactured
products (%)
2014 2015
10.2
6.9
8.1
4.1
6.0
6.0
7.0
7.6
8.6
9.2
12.7
7.2
3.5
8.5
8.4
80.0
33.2
20.0
10.0
13.3
15.0
15.2
16.4
17.5
17.0
20.0
17.0
17.0
22.0
18.1
0 20 40 60 80 100
01-05 Animal & Animal Products
06-15 Vegetable Products
16-24 Foodstuffs
25-27 Mineral Products
28-38 Chemicals & Allied Industries
39-40 Plastics / Rubbers
41-43 Raw Hides, Skins, Leather, & Furs
44-49 Wood & Wood Products
50-63 Textiles
64-67 Footwear / Headgear
68-71 Stone / Glass
72-83 Metals
84-85 Machinery / Electrical
86-89 Transportation
90-97 Miscellaneous

22
The future of Kyrgyz bazaars is uncertain. The CET along with stricter external border controls
now precludes re-exports of cheap imports from China via Kyrgyz bazaars, which has strong
negative social implications as bazaars were a major source of employment and income of the
country32. On the positive side, according the EAEU arrangements, Kyrgyzstan is entitled to 1.9%
of the total customs revenues of the union—a new relatively stable stream of fiscal revenues for
the country, in addition to higher revenues from VAT taxation of imports from China (earlier
under a simplified tax regime).
EAEU also increases competitive pressures from EAEU members. Members of the EAEU have
industrial specialisation in many respects similar to that of Kyrgyzstan, being technically more
advanced. Within EAEU overlaps in production specialisation exist for example in food production
(with Kazakhstan, Armenia, Belarus and Russia) and textiles and apparel industries (Belarus33).
Since all countries also serve similar export destinations in these industries, export competition in
bound to intensify. First impacts of this competition effect are already felt. For example, in 2016
exports of agricultural and agro-processed goods declined, although the negative development is
at least partially attributable to Kyrgyzstan’s inability to comply with EAEU quality standards
(World Bank, 2017a).
1.4.3. Prospects of bridging other integration endeavours in the region
Albeit technically it is possible for the Kyrgyz Republic to pursue multiple integration agendas
even despite customs union arrangements (e.g. free trade agreements are still possible with rules
of origin in place), the EAEU membership certainly imposes political and institutional constraints
on developing economic ties with other countries and integration endeavours. The cooperation
choices are now limited by the legally binding commitments in the bloc and certain regulatory
competencies are in fact delegated to the EAEU supranational institutions. The EAEU framework
nevertheless provides adequate room for enhancing relationship with non-bloc partners, and
Kyrgyzstan should certainly try to diversify its export markets, mitigate its overly high economic
exposures to EAEU members, improve economic connectivity within the region, and integrate into
global value chains.
Of particular importance for Kyrgyzstan is the One Belt, One Road (OBOR) initiative led by China.
The Silk Road Economic Belt component of the OBOR initiative is aimed at improving land-based
connectivity throughout the Central Asia and beyond, and Kyrgyzstan is among the countries
along that route that will be directly affected by ambitious plans of China to improve cross-border
infrastructure throughout the region. China has already been a rather active investor in the
country, particularly, in large-scale infrastructure and energy projects, much needed in the
32 In particular, Dordoi and Kara-Suu markets are the major trade centres specialising in re-exports of goods (textiles and apparel) from
China to Tajikistan, Uzbekistan, Kazakhstan and Russia, especially important for employment and income generation of Kyrgyzstan.
Dordoi, with an employment of 54 thousand and a turnover of USD 4 billion, is estimated to provide means of living for as much as
15% of the population, and Kara-Suu, with a turnover of USD 600 million, employs some 16 thousand people. 33
Arguably, Belarus and Kyrgyzstan are not (yet) supplying the same quality segment of the Russian market for textiles and wearing
apparel (Jenish, 2014).

23
country.34 The OBOR initiative will take the investment in infrastructure efforts to much higher
levels, which will be instrumental for reindustrialisation and modernisation strategy of Kyrgyzstan.
So far, other EAEU members view the OBOR as an important opportunity for the bloc, rather than
as its competitor in the region, and also seek closer collaboration, in particular in areas concerning
cross-border motorway network and high-speed railroad construction.
Developing further ties with the EU also remains part of the integration agenda of Kyrgyzstan. In
January 2016, GSP+ treatment was granted to Kyrgyzstan by the EU for a period of 7 years
(eliminating tariffs for 6,200 products imported from Kyrgyzstan). Before that, since 1993 the
country had been a beneficiary of the GSP regime. However, converting these opportunities to
benefits still appears to be a challenge for Kyrgyzstan on account of high levels of protection of
the agri-food sector in the EU via non-tariff barriers, along with Kyrgyzstan’s weak infrastructure
and remoteness from European markets. The differences between the EAEU and the EU in terms
of technical and SPS standards may further limit export opportunities of Kyrgyzstan to the EU
market. At the same time, the EU remains among the main international donors investing in
Kyrgyzstan and encouraging structural reforms instrumental for its industrial modernisation, and
the country should make every effort to uphold the partnership.35
1.5. Challenges for Industrial Development of a Small Middle-Income Country
Kyrgyzstan faces numerous developmental challenges that are common to lower-middle-income
countries36 (LMIC). These challenges include elements in the general framework conditions as well
as structural issues and problems related specifically to the manufacturing sector.
1.5.1. Weaknesses in the general framework conditions
The general economic framework conditions need to comply with some minimum standards in
order to allow for a successful industrial development. Any industrial policy, even if well-designed
and tailored to the country’s capabilities, is bound to fail if the fundamental institutional
framework is inappropriate (Haraguchi, 2016b).
Transport and trade infrastructure in need of improvement. The quality of Kyrgyzstan’s road
infrastructure is judged to be inadequate with a third of the roads being in poor condition and in
need of rehabilitation or reconstruction (ADB, 2014b). In contrast, the railroad network is –
although all railroad lines are single-track lines – in a reasonable good condition (ADB, 2013a) and
in the process of expansion due to Chinese investments that form part of its ‘One Belt, One Road’
34 Some of the successful projects include the Junda and Tokmok oil refineries, the Datka-Kemin energy transmission line, the
construction of the North-South motorway and the Bishkek-Torugart road, and the Bishkek thermal power plant reconstruction. The
Export-Import Bank of China in 2016 topped the list of Kyrgyzstan’s major creditors (USD 1.4 billion of outstanding credit amount). 35
The EU has allocated EUR 184 million of bilateral aid for the period 2014-2020 along the lines of the Development Cooperation
Instrument; in addition, there is support via the Investment Facility for Central Asia in cooperation with the EIB and EBRD, as well as
other instruments supporting sustainable development projects. 36
The World Bank defines lower- middle-income countries as those with an income of USD 1,005-3,955 based on the GNI per capita
(using the World Bank Atlas method).

24
(OBOR) initiative. This suggests that companies using mainly railroad transport may face less
problems infrastructure-related problems than those who use road transport. However, the rail
network also has severe shortcomings. Above all, the current network is rather small and there is
no connection between the Southern and Northern part of the country37.
That may be the reason, why the Kyrgyz transport infrastructure – both road and rail – is
perceived to be of inferior quality in comparison to other lower-middle income countries and also
in comparison to Central Asia (Panel (a) in Figure 1-12).
Figure 1-12: Quality of transport infrastructure and logistics performance, international comparison
Panel (a) Quality of infrastructure (WEF)
37 Railroad transportation plays a minor role as more than 90% of freight traffic is carried by road according to national statistics
(ADB, 2013a with figures relating to the year 2010).
0.00
0.50
1.00
1.50
Quality ofroads
Quality ofrailroad
infrastructure
Quality ofport
infrastructure
Quality of airtransport
infrastructure
Availableairline seat
km/week
Kyrgyzstan Centra lAsia small LMIC LMIC

25
Panel (b) Logistics performance (World Bank)
Note: All indicators have been normalised so that 1 represents the value of LMIC. Larger values indicate a better performance.
Source: WEF Global Competitiveness Indicators; World Bank’s Logistics Performance Index.
Additionally, there are perceived problems related to the organisation of road transportation.
These transport services are mainly provided by privately-owned mini-buses or road carriers,
which are predominantly private entrepreneurs using old trucks, often dating back to the Soviet
era. This way of organising commercial transportation tends to be inefficient resulting in relatively
high transport rates (ADB, 2013a). The outdated transport vehicles are emission-intensive and
therefore problematic from an environmental perspective. With regards to rail transport,
consultations with a stakeholder relying on rail transport for export suggest that the quality of the
service is deemed acceptable but that prices charged are higher compared to other countries in
the region. Together with the fact that the predominant mode of transportation is road transport,
this explains the very low score of Kyrgyzstan with regards to the quality and competence
prevailing in logistic services (Panel (b) in Figure 1-12).
Transparency and quality of institutions matters for businesses activities. The Kyrgyz
government recognizes that improving the quality of institutions is very important and figures
prominently in recent policy initiatives (Step 20 in the “40 Steps to New Era”). A good example is
0.70
0.85
1.00
1.15Customs
Infrastructure
Internationalshipments
Logistics qualityand
competence
Tracking andtracing
Timeliness
Kyrgyzstan CentralAsia smallLMIC LMIC

26
the so-called Taza Koom programme38, which strives for a digital transformation of the Kyrgyz
society. Based on the construction of a modern ICT-infrastructure, the programme envisages –
among other things – the digitalisation of communication between government and citizens,
which would clearly improve the efficiency, transparency and accountability of public
administration at all levels.
The industrial development should take the existent economic framework into account. Since
institutions are slow to change and often the most pressing problems are left untouched until a
massive crisis occurs, chances are that the current governance problems will prevail in the
medium-term. Hence, a prudent and realistic assumption is that the industrial development
strategy will have to be designed for and implemented within the current institutional
confinements. In this respect a strong involvement of foreign companies – to the extent that they
can be attracted given the business environment – and international donor organisations seems
desirable. Another vehicle that could be used, but which so far did not prove very successful in
Kyrgyzstan, are free economic zones (FEZ) which are one way to circumvent parts of the
weaknesses in the institutional framework.
1.5.2. A vulnerable and undiversified economy
An inconspicuous economic structure. One of these challenges is a highly undiversified economy
which tends to makes the macroeconomic development vulnerable to industry-specific shocks. At
first glance, the economic structure of Kyrgyzstan reveals no major particularities: services
account for a growing share of value added reaching 56% in 2016, the value added share of the
industrial sector accounted for 29%, leaving 15% for the employment-intensive agricultural sector
(Figure 1-13).
Within the industrial sector, about 9% of GDP are due to the construction sector while only about
2% of value added stem from the generation and distribution of electricity, gas and water. The
latter is surprising as Kyrgyzstan’s hydroelectric power plants, mainly located at the Naryn River,
generate 90% of the country’s electricity consumption (although with pronounced seasonal
fluctuations). Given the lack of other energy sources such as oil, gas or coal, the country’s
abundant water resources and their potential for hydropower generation constitute an essential
industrial asset.
Zooming into the manufacturing sector reveals major structural weaknesses. The broad sector
composition of Kyrgyzstan’s economy is more or less in line with other LMIC, including small LMIC.
With 17% the manufacturing sector’s share in GDP is actually above the average of small LMIC
(Panel (a) in Figure 1-13). Even the comparison with successful small LMIC in South East Asia
(Panel (b) in Figure 1-13) does not suggest a major weakness or underdevelopment of the Kyrgyz
manufacturing sector as the country is more or less on par with Cambodia and Vietnam.
38 See: http://tazakoom.kg/site/concept/22

27
A closer look at the structure of the manufacturing sector, however, reveals severe structural
problems such as the country’s slim and undiversified manufacturing base. The Kyrgyz economy is
strongly dependent on gold production which is responsible for approximately 7% (ADBa, 2014)39
to 10% of the Kyrgyz GDP40, depending on the fluctuations in gold prices and mine output. This
implies that gold accounts for more than half of the country’s manufacturing value added leaving
some 7-10% of GDP for all other manufacturing activities.
As evidenced in Chapter 2, gold mining is capital intensive but does not generate a large number
of jobs. The same is true for the associated smelting and foundry activities which in the case of
the Kumtor gold are also located in Kyrgyzstan41. The required know-how is mainly provided by
the Canadian mining company operating the mine. The extreme importance of gold production
makes the country highly dependent on its natural endowments (UNESCO, 2015). In general, the
exploitation of natural resources can be seen as being in line with comparative advantages
because as a factor-driven economy42 – as classified by the World Economic Forum (WEF) –
Kyrgyzstan is supposed to compete primarily on prices relying on comparative advantages in
unskilled labour and natural resources. However, manufacturing activities need to be broadened
calling for a diversification strategy targeting other resource-based and labour-intensive
industries. An example would be a more intensive use of the existing water resources for hydro
power generation or the development of agro-food processing industries. The reliance on
commodities is reflected in the country’s export structure which is tilted towards gold with limited
diversification into other primary goods, resource-based manufactures and low-tech
manufactures (Figure 1-14). Among the latter, the export of cotton and textiles are important also
from an employment perspective. However, large parts of Kyrgyzstan’s garment exports are re-
export of products of Chinese origin that are sold on to Russia and Central Asian countries, mainly
Kazakhstan and Uzbekistan. The future prospect of this re-export business is uncertain once the
transition period for the textile sector for adopting the external tariff of the EAEU expires.
39 Average for the years 2001-2012.
40 ‘Canadian Court Freezes Kyrgyzstan Gold Mine Shares’ by David Trilling, Eurasianet, 15 October 2014,
http://www.eurasianet.org/print/70446 and ‘Kyrgyzstan ratchets up dispute against Canada’s Centerra Gold’ by Cecilia Jamasmie,
mining.com, 15 June 2016, http://www.mining.com/kyrgyzstan-ratchets-up-dispute-against-canadas-centerra-gold/ 41
Gold production in Kyrgyzstan is recorded as a manufacturing activity, allocated to NACE Rev. 2 industry class „precious metal
production (or industry 2420 in the ISIC Rev. 4 classification). 42
See http://reports.weforum.org/global-competitiveness-index/appendix-a-methodology-and-computation-of-the-global-
competitiveness-index-2016-2017/

28
Figure 1-13: Broad economic structure, international comparison, 2006-2016
Note: KGZ: Kyrgyzstan; LMIC: Lower-middle-income countries; CA: Central Asia; Small LMIC: Small lower-middle-income countries.
SLMIC are LMIC with less than 12.5 million inhabitants. Country groups are weighted averages. Based on nominal value added data.
Source: World Development Indicators (WDI).
Agriculture Industry Manufacturing Services
32.8
14.9
12.6
16.6
47.2
55.9
18.1
16.6
18.7
16.5
46.7
53.2
11.4
10.1
13.7
12.9
49.7
54.6
12.6
12.2
10.0
14.9
55.1
59.2
7.5
12.6
16.5
13.2
25.2
22.4
22.3
13.7
0 10 20 30 40 50 60
Agriculture 2006
2016
Manufacturing, Industry 2006
2016
Services 2006
2016
Agriculture 2006
2016
Manufacturing, Industry 2006
2016
Services 2006
2016
Agriculture 2006
2016
Manufacturing, Industry 2006
2016
Services 2006
2016
Agriculture 2006
2016
Manufacturing, Industry 2006
2016
Services 2006
2016
Kyr
gyzs
tan
LMIC
Ce
ntr
al A
sia
smal
l LM
IC
Panel (a) – Comparison with Central Asia and LMICs
35.3
19.5
8.4
8.8
37.0
48.0
32.0
26.7
19.8
17.2
40.2
41.6
18.7
18.2
19.4
15.9
42.7
45.5
10.6
8.6
32.5
0.0
41.8
51.6
19.3
23.7
8.1
14.5
19.2
20.5
15.1
39.8
0 10 20 30 40 50 60
Agriculture 2006
2016
Manufacturing, Industry 2006
2016
Services 2006
2016
Agriculture 2006
2016
Manufacturing, Industry 2006
2016
Services 2006
2016
Agriculture 2006
2016
Manufacturing, Industry 2006
2016
Services 2006
2016
Agriculture 2006
2016
Manufacturing, Industry 2006
2016
Services 2006
2016
Lao
sC
amb
od
iaV
ietn
amC
hin
a
Panel (b) – Comparison with South East Asian LMICs
and Chinal

29
Figure 1-14: Kyrgyz exports by technology content of goods, 1995-2015
Note: Data based on SITC-3 product classification mapped into product categories according to the classification by Lall (2000). Gold is
unclassified in this classification and therefore shown separately (along with other unclassified products).
Source: UNC Comtrade (download via WITS).
Several other key export items, while not re-exports in a strict sense, also rely exclusively on
foreign inputs. A point in case is the refined petroleum exports: the crude oil is imported from
neighbouring Kazakhstan, refined by Chinese-controlled refineries in Kyrgyzstan and then partly
re-exported, partly consumed domestically. Refined petroleum has advanced to the second most
important single export item of Kyrgyzstan after all-dominant gold exports (Table 1.1).
1.5.3. Manufacturing misses out as a Driver of Growth and Employment
Manufacturing adds volatility but only little growth to the Kyrgyz economy. Despite the strategic
importance of gold production, the manufacturing sector contributed only marginally to overall
economic growth over the past 15 years (Figure 1-15). Growth was mainly driven by the services
sector with the average contribution of manufacturing accounting for only 0.2 percentage points
(2003-2016). Looking at the development of industrial production (Figure 1-16) suggests that the
industrial sector’s contribution to the macroeconomic development was mainly volatility which in
turn moves in parallel with gold production. The huge fluctuations in gold production imply that
the volatility of economic growth (see Figure 1-3 above) is bound to stay even in the absence of
further political turbulences, unless Kyrgyzstan manages to diversify its production structure.
0%
10%
20%
30%
40%
50%
60%
1995 2000 2005 2010 2015
in %
of t
otal
exp
orts
primary goods resource-based manufactures
low-tech manufactures medium-tech manufactures
high-tech manufactures gold (and other non-classified goods)

30
Table 1.1: Kyrgyzstan’s main export items, average 2006-2016
product code
export value (USD millio)
share in total exports
product description
7108 576.4 45.5% Gold (unwrought, semi-manufactured forms, powder form)
2710 70.7 5.6% Petroleum oils (not crude)
0713 40.8 3.2% Vegetables, leguminous; shelled, whether or not skinned or split,
dried
6204 35.5 2.8% Coats; women's or girls' overcoats, carcoats, capes, cloaks,
anoraks, ski-jackets, wind-cheaters, wind-jackets (not knitted or
crocheted)
2716 32.6 2.6% Electrical energy (Optional Heading)
5201 25.7 2.0% Cotton; not carded or combed
6206 19.9 1.6% Blouses, shirts and shirt-blouses; women's or girls' (not knitted or
crocheted)
2616 19.1 1.5% Precious-metal ores and concentrates
8539 18.7 1.5% Lamps; electric filament or discharge lamps
7005 16.7 1.3% Glass; float glass and surface ground or polished glass, in sheets
2523 15.2 1.2% Portland cement and other cement
2401 12.6 1.0% Tobacco, unmanufactured; tobacco refuse
8708 12.2 1.0% Motor vehicles; parts and accessories
0809 11.0 0.9% Apricots, cherries, peaches (including nectarines), plums and sloes,
fresh
8802 10.2 0.8% Aircraft n.e.c. (e.g. helicopters, aeroplanes)
3923 9.6 0.8% Plastic articles for the conveyance or packing of goods; stoppers,
lids, caps and other closures of plastics
0401 9.0 0.7% Milk and cream; not concentrated, not containing added sugar or
other sweetening matter
6203 9.0 0.7% Overcoats, car-coats, capes, cloaks, anoraks, wind-cheaters, wind-
jackets and similar articles, men's or boys (not knitted or
crocheted)
8704 8.1 0.6% Vehicles; for the transport of goods
7204 7.3 0.6% Ferrous waste and scrap; remelting scrap ingots of iron or steel
Note: Classification by HS 4-digit product codes.
Source: UN Comtrade (download via WITS), wiiw calculations.

31
Figure 1-15: Sector contributions to growth in Kyrgyzstan, 2003-2016
Source: National Statistical Committee of the Kyrgyz Republic.
Figure 1-16: Gross industrial output and gold production, 2000-2016
Source: National Statistical Committee of the Kyrgyz Republic; for gold production, own calculations based on the Kumtor Gold
Company data.
Volatility hampers sustained economic growth. Volatility is a major obstacle for economic
development. A growth take off requires a high growth rate of approximately 5% or more but also
that the growth is sustained and not repeatedly interrupted. As such the volatility in the growth
rate hinders the longer-term development of the country and needs to be addressed urgently. Of
particularly concern is the poor performance of the manufacturing sector.
-8
-6
-4
-2
0
2
4
6
8
10
12
2003 2004 2005 2006 2007 2008 2009 2010 2011 2012 2013 2014 2015 2016
Co
ntr
ibu
tio
n t
o g
row
th i
n p
.p.,
Services, etc. other industry Manufacturing Agriculture
-60
-40
-20
0
20
40
60
80
100
2000 2001 2002 2003 2004 2005 2006 2007 2008 2009 2010 2011 2012 2013 2014 2015 2016
Industrial production, real growth in % Gold production, growth rates in %

32
Manufacturing fails to provide for stable and well-paid jobs. A major reason behind the
disappointing growth contribution of the manufacturing sector is its failure to create new
employment opportunities and to attract labour freed from the agricultural sector. This is true
especially for formal jobs, the number of which has dropped by about one third since 2011
(Panel (b) in Figure 1-17).
Figure 1-17: Employment development in industry and manufacturing, 2000-2015
Panel (a) – Industrial sector
Panel (b) – Manufacturing sector
Source: National Statistical Committee of the Kyrgyz Republic – LFS statistics and industrial statistics.
Total manufacturing employment, i.e. including informal jobs, was more stable but still hardly
contributing to job creation. It is worth mentioning that for both industry and manufacturing
employment, the data from Kyrgyzstan’s national statistics vary considerably depending on the
112 109
226 226
201
129
90 88
40
80
120
160
200
240
280
2009 2010 2011 2012 2013 2014 2015
em
plo
yme
n t
in '0
00
Industry - formal employment (LFS)Industry - total employment (LFS)Industry employment (industry statistics)Industry employees (industry statistics)
6162
173174170
91
58 4840
80
120
160
200
240
280
2009 2010 2011 2012 2013 2014 2015
em
plo
ym
en
tin
'0
00
Manufacturing - formal employment (LFS)
Manufacturing - total employment (LFS)
Manufacturing employment (industry statistics)
Manufacturing employees (industry statistics)

33
data source. According to the Kyrgyz Labour Force Survey (LFS), which is based on a
representative survey of individuals, the industrial sector employed some 226,000 thousand
people, with more than half assigned to the informal sector (Panel (a) in Figure 1-17). The data
from national industrial statistics are based on firm registers and suggest a considerably smaller
numbers for industrial employment: the total employment of registered companies was only
91,000 in 2016 whereas the number of employees was only 48,000. This is evidence of the high
number of one-person enterprises. Irrespective of which data sources are considered though, the
key problem is that neither the manufacturing sector nor the industrial sector were able to create
a sizeable number of additional jobs over the past years due to the lack of competitiveness in
labour intensive industries. .
The high degree of informality is a persistent problem plaguing the entire economy. Informality
is most widespread in the agricultural sector which is also characterised by very low productivity,
reaching only half of that in the average Kyrgyz economy. This is evidence of the presence of a
dual economy (Lewis, 1954). The concept of a dual economy describes a situation where
traditional sectors such as agriculture, still largely based on subsistence and semi-subsistence
farming with scarce modern agricultural equipment (UNECE, 2015), co-exist with modern sectors
that have embraced capitalist modes of production. The arising productivity differences between
traditional and modern sectors imply that structural change towards more productive sectors
constitutes low hanging fruits that could be harvested to boost aggregate productivity. So far,
however, this type of structural change has not been materialising in Kyrgyzstan.
Structural change is geared towards rather low productivity sectors instead of manufacturing.
Over the last decade more than 100,000 jobs disappeared in agriculture but employment has
shifted primarily to the trade services sector, construction and the tourism sector
(accommodation) (Figure 1-18). In contrast, hardly any of the work-force that left agriculture was
absorbed by the manufacturing sector. This is a sub-optimal structural development as labour
productivity in the main labour-absorbing sectors is also comparatively low. The low productivity
in these sectors is again partly explained by the high degree of informality. For example, 90% of
the employment in trade services is in the informal economy. In manufacturing, labour
productivity is about twice as high on the average in the economy (strongly influenced by the
metal production) so that the structural change bonus (Szirmai and Verspagen, 2015)43 would be
much higher if manufacturing were to attract additional labour in the formal part of the
economy44. The emphasis on the formal manufacturing sector is important because even in
manufacturing still 60% of employment constitute informal jobs.
43 Baumol (1967) was the first to point out the impact of structural change on economic growth. He was, however, focusing on the
potential risks of that, i.e. when an economy moves from high-productivity sectors (progressive sectors) to low-productivity sectors
(non-progressive sectors). This implies negative structural change, which is known in the literature also as Baumol’s growth disease. 44
Obviously, there exist some pockets of high productivity in the services sector such as banking and insurance or professional
services. However, it is doubtful whether these industries have the potential to absorb large amounts of labour.

34
Figure 1-18: Labour productivity and structural change in the Kyrgyz economy, 2000-2015
Note: The size of the bubbles indicates the size of the respective industry in terms of employment in thousands. Relative labour
productivity calculated as sector-level labour productivity over productivity across all sectors. Employment figures including informal
employment.
Source: National Statistical Committee of the Kyrgyz Republic – LSF statistics.
Informality is also widespread in several manufacturing industries. The high incidence of
informality also within the modern sectors signals that the Kyrgyz economy is a double dual
economy (Bertrand and Squire, 1980). In addition to the modern-traditional sector duality there is
also a duality within modern sectors arising from the prevalence of the informal economy which
flourishes due to the lack of formal employment opportunities. Overall, an estimated 70% of the
active work-force is active in the informal economy contributing an estimated 28% of total value
added (see also IMF, 2016b). Especially, promising industries such as textiles and garment
production are dominated by informal activities, causing not only problems for productivity but
also for reaching a minimum efficient scale of production.
Overall, the extent of informal activities is also one of the major reasons for the low labour
productivity in Kyrgyzstan, including in export-oriented manufacturing industries, which
contributes to the country’s lack of international cost competitiveness.
Agriculture
689
Mining
9
Manufacturing
174
Electricity, gas, steam
29
Water
14
Construction
266
Trade Services
365
Transportation
162
Accomodation
100
Information &
communication31
Finance &
insurance
26
Professional services
15
-1.00
0.00
1.00
2.00
3.00
4.00
-150 -100 -50 0 50 100 150
rela
tive
lab
ou
r p
rod
uct
ivit
y
change in employment 2005-2015

35
1.5.4. An inferior export performance
Lack of cost competitiveness and regional factors hold back export growth. The weak spots in
the otherwise relatively satisfactory growth performance of Kyrgyzstan over the past years are
the high volatility and the minor contribution of the industrial sector. Existing evidence from
countries that embarked on a steep and sustain growth trajectory suggest that their growth has
been primarily based on an expanding and internationally-competitive manufacturing sector
(UNIDO, 2015). The comparatively flat development of export volumes suggests that most
manufacturing industries lack international cost competitiveness (Figure 1-19). Kyrgyzstan’s
export development was far less dynamic than that of small LMIC which is an informative
comparator group in this context (panel (a) in Figure 1-19).
Figure 1-19: Development of export volume index, comparison with references groups and countries
(a) Reference groups (b) South East Asian LMIC and China
Note: Small LMIC and Central Asia are unweighted averages.
Source: UNCTAD trade database.
The fact that Central Asia as a whole shows an inferior export volume performance points
towards some region specific issues while the most recent drop in export volumes in Kyrgyzstan is
evidence of some country particularities. Hence, region specific aspects such as being land-locked
or the common Soviet legacy along with country specificities such as the mountainous terrain and
recurring political turmoil seem to play a role for Kyrgyzstan’s flat export development. The extent
of the weakness in export performance becomes obvious in a comparison with South East Asia
LMIC such as Laos, Vietnam or Cambodia. These countries illustrate how the export development
should look like and also that it is possible, once integration into international production
networks starts to take off (panel (b) in Figure 1-19)45. So far, however, Kyrgyzstan and the entire
45 Note also the difference in scale of the vertical axis in Figure 1-19.
50
100
150
200
250
300
2000 2005 2010 2015
ex
po
rt v
olu
me
ind
ex
(2
00
0 =
10
0)
Kyrgyzstan
LMIC
small LMIC
Central Asia
50
150
250
350
450
550
650
2000 2005 2010 2015
ex
po
rt v
olu
me
ind
ex
(2
00
0 =
10
0)
Kyrgyzstan
Cambodia
Laos
Vietnam
China

36
Central Asian region remains largely marginalised with respect to international production
activities.
The weakness of the manufacturing sector is discernible in the export structure. The key driver
behind Kyrgyzstan’s modest export performance is the weakness of the manufacturing sector.
This is discernible from the export structure of Kyrgyzstan (Figure 1-20) which reveals a relatively
large share of services exports, mainly transport services and tourism. The prominent share of
services exports, however, is not an indication of strong comparative advantages (though these
may exist for example in tourism) but rather from the small manufacturing base. Manufacturing
accounts for slightly more than half of total exports. While this is a higher share than prevailing in
the average small LMIC, it is still problematic given that half of manufacturing exports revenues is
accounted for by gold. Cambodia and Vietnam can once more be used as examples to
demonstrate how the export structures of catching-up countries with incipient competitive
manufacturing industries are supposed to look like. In these countries the share of manufacturing
exports amount to about two thirds or more.
Figure 1-20: Export structure, comparison with references groups and countries, 2015
Note: Small LMIC and Central Asia are unweighted averages.
Source: UNCTAD trade database.
This conclusion about the Kyrgyzstan’s manufacturing sector is confirmed by the cross-country
comparison of manufacturing exports per capita (manufacturing export intensity). Manufacturing
export intensity is particularly low in Kyrgyzstan, irrespective of whether LMIC or small LMIC are
used as reference groups (Figure 1-21). Moreover, it shows a stagnant trend over time since 2000
which is in contrast to all other countries and regions. A particular problem is that the country
holds only few revealed comparative advantages in the manufacturing sector apart from gold
production. The problems that Kyrgyz manufacturing faces seem to be broad based as the
29%
66%
32%
12%
57%
34%
33%
5%
17%
5%
46%
20%
40%
51%
26%
16%
34%
64%
76%
86%
25%
14%
28%
37%
17%
50%
33%
32%
6%
9%
0% 10% 20% 30% 40% 50% 60% 70% 80% 90% 100%
LMIC
Central Asia
small LMIC
Kyrgyzstan
Uzbekistan*
Armenia
Moldova
Cambodia
Vietnam
China
Commodidites Manufactures Services

37
performance of the manufacturing sector of Kyrgyzstan was found to be consistently low across
most manufacturing industries (Haraguchi, 2016b).
Figure 1-21: Manufacturing export intensity, comparison with references groups and countries
Panel (a) Panel (b)
Note: Manufacturing exports in constant USD 2005. LMIC = lower-middle-income countries. Small countries are countries with a
population of less than 12.5 million inhabitants in 2016.
Source: UNIDO database.
Shifting to a manufacturing-led growth model is warranted. The poor export performance of
Kyrgyzstan’s manufacturing sector risks a second ‘premature de-industrialisation’ (Rodrik, 2013) –
after the de-industrialisation that had occurred during the transition recession in the first half of
the 1990s. Premature de-industrialisation refers to the phenomenon that the share of
manufacturing in total GDP tends to start diminishing at a lower GDP per capita than used to be
the case in the past. This is also an issue for Kyrgyzstan which – at its current income level of
USD 1,045 (2016) – should see its manufacturing sector expanding and occupying increases shares
in terms of value added generation and employment. That the manufacturing sector is currently
losing in relative importance in the Kyrgyz economy is also shown by the development of real
manufacturing value added generated by the sector in per capita terms. Manufacturing value
added per capita (MVA per capita) is a useful summary indicator for developing countries as, in
addition to a sectors relative importance in the economy it also reflects the overall productivity of
a country in a comparison across countries.
The development of Kyrgyzstan’s MVA per capita has been shrinking considerably over time with
the largest losses incurred back in the 1990s during the transition recession (Figure 1-22).
Nevertheless, even in more recent years, manufacturing was lacking dynamism so that MVA per
0
100
200
300
400
500
2000 2005 2010 2015
man
ufac
turin
g ex
port
s pe
r ca
pita
KyrgyzstanCentral AsiaLMICsmall LMIC
0
200
400
600
800
1000
2000 2005 2010 2015
man
ufac
turin
g ex
port
s pe
r ca
pita
KyrgyzstanCambodiaLaosViet NamChina

38
capita was down to USD 65 in constant terms (2005). This development confirms, among other
things, the country’s structural developments, in particular the inability of the sector to attract
additional labour.
Figure 1-22: Real manufacturing value added per capita, international comparison, 1991-2014
Note: Manufacturing exports in constant USD 2005. LMIC = lower-middle-income countries. Small countries are countries with a
population of less than 12.5 million inhabitants in 2016.
Source: UNIDO database.
The comparison across countries also shows that Kyrgyzstan’s manufacturing sector is clearly
underperforming in terms of MVA per capita, reflecting mainly the sector’s low productivity and
only to a lesser extent the specialisation patterns. The reason why specialisation pattern are not
the primary reason for Kyrgyzstan’s low MVA per capita is the fact that the value added share of
manufacturing (as shown in section 1.5.2) is comparable to that of comparator country groups,
such as lower-middle income countries. It is also noteworthy, that Kyrgyzstan seems to be one of
the few former Soviet republics which did not achieve the turnaround in the MVA per capita
development after the transition recession which is observable in most of these countries,
including Armenia, Kazakhstan, Moldova and Uzbekistan. A glance at the developments in South
East Asian lower-middle income countries demonstrates again how the dynamics of MVA per
capita looks-like in countries experiencing a manufacturing-led growth take-off.
Putting the economy on a manufacturing-led growth trajectory is also warranted in Kyrgyzstan as
manufacturing has been the prime driver behind inclusive and sustained growth episodes in other
countries. One of the major reasons for this pattern are the strong forward and backward linkages
so that additional activity in a manufacturing industry does not only create employment and
demand in that particular industry but also in many related industries, including business related
0
100
200
300
400
500
600
Kyrgyzstan Central Asia LMIC small LMIC
con
sta
nt
US
D (
20
05
)
1991 2000 2014
0
100
200
300
400
500
600
Armenia Kazakhstan Moldova Tajikistan Uzbekistan
1991 2000 2014
0
100
200
300
400
500
600
Cambodia Laos Viet Nam
1991 2000 2014

39
services such as transportation, information and telecommunication services and professional
services. Moreover, manufacturing is less prone to overshooting and the creation of bubbles
which are a recurrent feature of the financial and the construction sector. For these reasons
manufacturing-led growth does not only tend to be more inclusive but also increases the
probability of sustained growth episodes.
A key issue for the country is therefore to enlarge and diversify its manufacturing base, thereby
reducing its overreliance on gold production. Diversification would support job creation in
manufacturing as the metallurgy sector is very capital intensive, creating comparatively fewer
employment opportunities. It also features fewer linkages to the rest of the economy as
compared to other manufacturing industries with an export potential in Kyrgyzstan, such as
textiles, garments and food processing. Moreover, as Chapter 2 illustrates, the overreliance on
gold production makes the economy emission and material intensive with limited dividends for
social inclusiveness. A second pressing reason why a diversification of manufacturing production
is imperative is the fact that Kumtor’s current mine-life extends only until 2023, with processing
operations continuing until 2026 (Eurasian Research Institute, 2015; UNCTAD, 2016). If export
revenues from gold production were to end according to this schedule46, this leaves a window of
opportunity of less than 10 years to implement a successful industrial development strategy. For
this to happen, the key factors that hold back Kyrgyzstan’s export development need to be
analysed.
1.6. Analysis of Kyrgyzstan’s Cost Competitiveness
Limited domestic demand calls for an export-led growth strategy. For Kyrgyzstan as a small open
factor-driven economy47 cost competitiveness is of key importance. Since the domestic market is
too small to provide the necessary demand to achieve the least efficient scale of production in
many manufacturing industries. This is a major point as insufficient aggregate demand (and not
only supply side constraints) may well limit the long-term economic performance of an economy
(Nassif et al., 2017; Szirmai and Verspagen, 2015). For this reason international cost
competitiveness is of critical importance. To analyse Kyrgyzstan’s cost competitiveness in more
detail, it is decomposed into its individual components (see Kahn, 2013). These components are
unit labour costs, unit input costs, unit capital costs and the price-cost mark-up (Figure 1-23).
46 According to information obtained from Kumtor, the current schedule for the mine’s remaining life may be pushed backwards
depending on the outcome of further explorations. However, since it is not guaranteed that further explorations will reveal gold
reserves that make further operations commercially viable, the year 2026 is a conservative estimate for the end of the Kumtor mine
operations. In any case, the new mines of Taldy-Bulak (Chinese joint venture) and new projects (e.g. Ishtamberdy, Solton-Sary, Terek
and Terekkan) are not capable of fully replacing Kumtor. 47
In terms of population Kyrgyzstan is a medium-sized country but it is a small economy in the sense that it is incapable of influencing
world prices.

40
Figure 1-23: Cost decomposition
Note: Firm-internal decomposition according to Kahn (2013); cost components beyond the boundary of the firm are added.
Source: Kahn (2013), wiiw representation.
The sum of all cost components, augmented by the mark-up, determines the internal cost
competitiveness of firms. It is the result of activities and processes within the boundary of the
firm. For each factor of production (capital, material inputs and capital) these cost components
can be separated into a price-related element – wages, input cost and the cost of capital (interest
rate) on the one hand and a productivity-related element. Each of these elements needs to be
scrutinised with a view to achieving international cost competitiveness. Besides the within-firm
elements, international cost competitiveness also depends on the general framework conditions
(discussed in section 1.5). While the framework conditions are typically beyond the control of
firms, they should fulfil some minimum standards in order not to jeopardise firms’ efforts to
achieve international competitiveness. The factors include for example transportation and
logistics costs and costs related to framework conditions such as import tariffs faced or bribes to
be paid at customs control. International cost competitiveness is given if total costs, including
profits and the cost elements beyond the control of individual firms, are equal to or lower than
world market prices. Given that the framework conditions have already been discussed, the focus
in this section is set on the firm-internal costs elements.
The cost decomposition reveals that Kyrgyzstan’s competitiveness problem stems primarily from
low levels of productivity (respectively output-capital ratios). This can best be shown for the

41
factor labour. Based on available information on labour costs, the wage level in Kyrgyzstan is
found to be very low compared to, for example, Armenia or Moldova (Figure 1-24).
Figure 1-24: Labour costs in selected countries
Note: Kyrgyzstan, Bulgaria: 2016, Armenia: 2014, Azerbaijan: 2015; Moldova: 2015; Ukraine: 2010; Turkey: 2012; wiiw calculations.
Selection of countries according to data availability.
Source: ILO database, National Statistical Committee of the Kyrgyz Republic.
Low labour productivity erodes advantages arising from low labour costs. This suggests that the
wage rate is highly competitive (see also UNCTAD, 2016) despite the fact that wage progression
was much faster than labour productivity growth over the past decade. An advantage with
regards to labour cost for Kyrgyzstan can also be identified in important export industries such as
textiles and wearing apparel48. In principle, this puts the country in a favourable position since at
its current income level it is supposed to hold (at least latent) comparative advantages in labour
intensive industries such as food-processing and beverages, textiles and wearing apparel. At the
same time this favourable condition is eroded by very low labour productivity. Real labour
productivity is particularly low in the manufacturing sector which is where it matters most
because it should be the country’s main tradable goods-producing sector. However, in Kyrgyzstan
real labour productivity in manufacturing is lower than in the services sector on average which is
in contrast with the situation in other LMIC. Moreover, labour productivity in manufacturing has
deteriorated markedly over time. In 2012 real labour productivity was only a fraction of that in
small LMIC and only half of that in Moldova and four times lower than that in poorer Tajikistan.
48 For more details see Chapter 3.
0.00
1.00
2.00
3.00
4.00
5.00
6.00
Kyrgyzstan Armenia Azerbaijan Moldova Ukraine Bulgaria Turkey
USD
pe
r h
ou
r
8.07

42
Figure 1-25: Sectoral labour productivity, comparison across LMIC, 1991-2012
Note: Real labour productivity in constant 2005 USD.
Source: UNIDO database.
Low input productivity and output-capital ratios add to the lack of cost competitiveness. An
analysis similar to that of labour inputs can be made for the other cost elements though
internationally comparable data is not available. But anecdotic evidence suggests that also for the
other cost elements (material inputs and capital) Kyrgyzstan’s major problems lie above all in the
productivity-related factors (Table 1.2). For example, the input efficiency is low because often the
output produced cannot be sold, due to various reasons such as insufficient quality or lack of
demand. This suggests that there are serious shortcomings in planning and marketing capacities
on the side of firms.
Table 1.2: Assessment of individual elements for Kyrgyzstan’s cost competitiveness
Domestic wages Low by international comparison
Labour productivity Extremely low by international comparison
Price of inputs Sector specific; but due to open trade regimes necessary inputs are available at world
market prices plus transportation cost
Input productivity Extremely low because of insufficient managerial and technological skills
Price of capital Varies across industries and firm size; general interest rate is high (≈20-30% p.a.) but
subsidised loans are available for special industries (e.g. textiles) at 5% p.a.
Output-capital ratio Output-capital ratio fluctuates with capacity utilisation and is low if demand is seasonal or
simply too low compared to the minimum efficient scale of production.
Cost mark-ups Sector-specific but in general the level of competition is relatively low which can be seen
from rather pronounced price differences for identical product.
Note: Main bottleneck; Issue of concern at least in some industries; No or minor problem.
Source: Firm internal decomposition according to Kahn (2013), wiiw representation.
0
2500
5000
7500
10000
Kyr
gyzs
tan
Ce
ntr
al A
sia
LMIC
Smal
l LM
IC
Kyr
gyzs
tan
Ce
ntr
al A
sia
LMIC
Smal
l LM
IC
Kyr
gyzs
tan
Ce
ntr
al A
sia
LMIC
Smal
l LM
IC
1991 2000 2012
agriculture manufacturing otherindustry services

43
There are important connections between the individual cost components. For example, the fact
that investment in machinery and equipment is low implies that capital-intensity is low and
workers have to use outdated machinery and equipment which are prone to break-downs. This in
turn, while improving the output-to-capital ratio in a static perspective, aggravates the labour
productivity problem over time.
Insufficient technological and managerial skills lead to limited scale of production and low
productivity. This constellation, in which the productivity-related elements are the main
bottlenecks for international cost competitiveness, is a common phenomenon in developing
countries (Kahn, 2013). What this means is that even if the same machinery and equipment were
to be used and even if the workforce was equally skilled and the quality of material inputs
comparable to advanced economies, developing countries would still have a non-competitive cost
structure. The disadvantages in labour and input productivity in fact are often prohibitively high
so that the country obtains cost competitiveness in basically no manufacturing industry. As
demonstrated, this seems to be applicable to Kyrgyzstan outside the realm of gold processing. The
low productivity is largely caused by the fragmented, small scale of production. The lack of
sufficient technical and managerial skills including the capacity to plan ahead and organise a firm’s
entire value chain have so far limited the expansion of production. Shortcomings in these skills
lead to inefficient processes and critical gaps in the supply chain. To a large extent, the required
skills and capabilities represent tacit knowledge that workers can only acquire during the
production process itself through learning by doing (Kahn, 2013). Codifyable knowledge (obtained
by formal training) is important too so that the education system and in particular vocational
education can make a difference. Nevertheless, tacit technological and managerial knowledge of
workers and managers, which are necessary to implement efficient work routines, are essential.
Obtaining international cost competitiveness requires support measures. The dilemma for
Kyrgyzstan is that acquiring the necessary skills and capacities obtained through learning-by-doing
requires production before international cost competitiveness has been achieved. For this reason
temporary loss-financing, i.e. covering the difference between current production costs and
internationally competitive prices, is necessary until international competitiveness is reached.
Financing may be provided by public sources or by foreign investors. The latter may find it
attractive to engage in temporary loss financing in return for expected high profits (‘economic
rents’) in the future. Such a foreign-led strategy obviously needs the full commitment from
government because learning processes are complex and may fail to materialise or can be
retarded due to numerous contracting failures. Contracting failures that hold back learning
progress include situations where entrepreneurs, when acting as first movers, cannot appropriate
the full benefit from their ‘discovery process’ (Hausmann and Rodrik, 2003) initiated with the
investment or because of low incentives for learning efforts (Kahn, 2013). Still, given the low state
capacity, an industrial strategy that is at least supported by FDI inflows appears as the most
promising scenario. For such an FDI-led industrial development strategy to be successful, the
government must signal its full commitment to potential investment projects. Moreover, it has to
ensure that the business environment is perceived at least acceptable by foreign investors.

44
While official development assistance typically plays a secondary role for industrial development,
the comparatively high rate of foreign aid money per capita (USD 129) indicates that international
donors contribute significantly to both public and private investment. Therefore, in the particular
case of Kyrgyzstan, international donors too can play an important role in a learning-based
strategy as demonstration projects can partly remove the first-mover problem.
Resource constraints necessitate setting priorities. A key issue in the context of an industrial
development strategy is the selection of priority industries. With a view to obtaining cost
competitiveness, a modest strategy aiming at labour-intensive industries is warranted. This is the
case, because the factor price elements (wages, price of inputs and price of capital) in the cost
decomposition are of different importance across industries. Obviously, the cost share
attributable to wages is more important in labour-intensive industries than in capital- and
technology-intensive industries. For this reason the period of cost financing can be expected to be
lower in labour-intensive industries. In other words, the gap that needs to be closed in order to
obtain international cost competitiveness is lower. This is all the more important for Kyrgyzstan
has only very limited fiscal leeway. In addition, foreign investors will find an industrial strategy
that is in line with – at least – latent comparative advantages of the country more convincing than
an overly ambitious government programme with only slim chances of success.
Chapter 2 argues why the development of labour intensive industries is crucial for Kyrgyzstan
from the perspective inclusive and sustainable growth.

45
Appendix
Appendix Table A1: Central Asia: Overview of economic fundamentals, 2016
Kazakhstan
Kyrgyzstan
Tajikistan
Turkmenistan
Uzbekistan
Territory 1)
Land area, km2)
2,699,700 191,800 139,960 469,930 425,400
Population
Population, mn pers., average 17.8 6.1 8.7 5.7 31.8
Real economy
GDP, USD bn 135.0
6.6
7.0
36.2
67.2
GDP real growth, in % 1.0
3.8
6.9
6.2
7.8
GDP per capita, USD at PPP 25,300 3,600 3,000 16,900 6,500
Consumption of households, in % of GDP 53.1
87.4
81.7 2)
10.7 3)
60.3
Government consumption, in % of GDP 11.8
18.3
15.0 2)
9.0 3)
15.8
Gross capital formation, in % of GDP 33.4
33.3
38.9 2)
49.8 3)
24.8
Exports of goods and services, in % of GDP 33.4
35.3 2)
10.3 2)
74.2 3)
20.6
Imports of goods and services, in % of GDP 38.8 75.8 2)
43.3 2)
44.0 3)
21.5
Industrial production, real growth, in % -1.1
4.9
16.0
.
6.6
Agricultural production, real growth, in % 5.4
3.0
5.2
.
6.6
Capital investment, real growth, in % 3.0 3.8 20.3 0.4 11.8
Consumer prices, growth rate, in % 14.6 0.4 6.1 6.2 4)
5.7 4)
Labour market
Employment (LFS), mn pers., average 8.6
2.4 2)
2.4 2)
.
13.3
Unemployment rate (LFS), in % 5.0
7.6 2)
2.4 2) 5)
.
.
Average monthly gross wages, USD 416 212 143 2)
362 2)
.
External sector
Exports of goods, USD bn 36.8
1.5
0.9 2)
14.0 2) 6)
10.0 2) 6)
Imports of goods, USD bn 35.3
3.9
3.4 2)
8.0 2) 6)
11.5 2) 6)
FDI inward stock, in % of GDP 96.1
77.9
34.7
100.2
13.5
FDI inward stock per capita in USD 7,333 839 276 6,358 282
Note: PPP: Purchasing power parity. LFS: Labour Force Survey.
1) Land area refers to the total area of a country excluding area under inland water bodies. It differs from the country area that includes area under inland
water bodies, but excludes offshore territorial waters (UNCTADstat). - 2) Data for 2015. - 3) Data for 2014. - 4) December to December of previous year. -
5) Unemployment rate by registration. - 6) UNCTAD estimates.
Sources: wiiw Annual Database incorporating national statistics, World Bank, CIS Stat, UNCTADstat, wiiw calculations.

46
2. Industries for inclusive and sustainable development
Making formal job creation a priority. The first chapter underscored the importance of strong
and inclusive growth for Kyrgyzstan as the country faces a relatively high level of poverty with a
large number of potentially vulnerable people, large share of informal employment in the
economy, and a high unemployment rate especially among young people, who often go abroad to
find a job. To overcome such socio-economic challenges, the foremost priority for the country’s
industry development should be to create a large number of formal manufacturing jobs, which
could absorb surplus labour from agricultural and informal sectors to boost the productivity of the
economy as a whole and increase productivity and wages of workers.
Focus on key manufacturing industries to improve the sectors lagging performance. The Kyrgyz
manufacturing sector has had a disappointing performance since the country’s independence. It
has trailed behind countries at a similar income level and in the same region. To depart from the
past developmental path and to make manufacturing contribute to inclusive growth, it is crucial
for the country to focus on key sectors which are promising in terms of growth potential and
employment creation, taking the country’s development conditions into consideration. To identify
such manufacturing industries, the following questions will be addressed:
• In which industries has Kyrgyzstan been increasing export competitiveness in recent
years?
• At its current development stage, which industries are likely to grow fastest in Kyrgyzstan
in terms of value added and employment creation?
• How is Kyrgyzstan performing in the industries in which the country is supposed to have a
comparative advantage?
• How many jobs could Kyrgyzstan create if the country increases its production volume to
the average its peer countries in terms of income or to a level of a successful country,
Honduras, which is at a similar development stage?
Taking evolving and endowment-based comparative advantages into account. Analysing the
above questions could point to the industries in which Kyrgyzstan is likely to have advantage due
to its current endowment structure according to the income level and demands for key trading
partners.. Discussion in Section 2.2 will focus on such industries. Besides comparative advantage,
there are country-specific advantages, which arise from a country’s demographic and geographic
characteristics. On this point, Section 2.3 argues for the development potential of the Kyrgyz
hydropower sector for sustainable growth due to the country’s abundant water resources.
Once the core set of industries are determined, the next chapter will provide a detailed analysis at
the firm level in order to find key bottlenecks, which are preventing the industries from realizing
their development potentials.
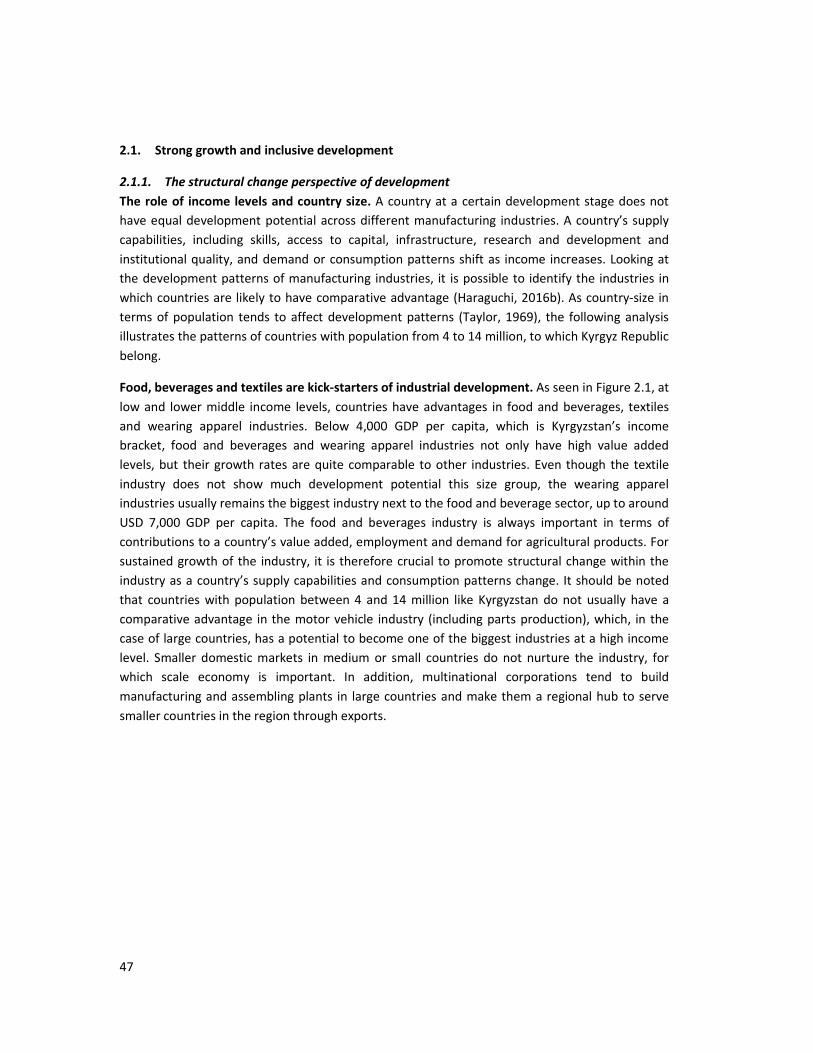
47
2.1. Strong growth and inclusive development
2.1.1. The structural change perspective of development
The role of income levels and country size. A country at a certain development stage does not
have equal development potential across different manufacturing industries. A country’s supply
capabilities, including skills, access to capital, infrastructure, research and development and
institutional quality, and demand or consumption patterns shift as income increases. Looking at
the development patterns of manufacturing industries, it is possible to identify the industries in
which countries are likely to have comparative advantage (Haraguchi, 2016b). As country-size in
terms of population tends to affect development patterns (Taylor, 1969), the following analysis
illustrates the patterns of countries with population from 4 to 14 million, to which Kyrgyz Republic
belong.
Food, beverages and textiles are kick-starters of industrial development. As seen in Figure 2.1, at
low and lower middle income levels, countries have advantages in food and beverages, textiles
and wearing apparel industries. Below 4,000 GDP per capita, which is Kyrgyzstan’s income
bracket, food and beverages and wearing apparel industries not only have high value added
levels, but their growth rates are quite comparable to other industries. Even though the textile
industry does not show much development potential this size group, the wearing apparel
industries usually remains the biggest industry next to the food and beverage sector, up to around
USD 7,000 GDP per capita. The food and beverages industry is always important in terms of
contributions to a country’s value added, employment and demand for agricultural products. For
sustained growth of the industry, it is therefore crucial to promote structural change within the
industry as a country’s supply capabilities and consumption patterns change. It should be noted
that countries with population between 4 and 14 million like Kyrgyzstan do not usually have a
comparative advantage in the motor vehicle industry (including parts production), which, in the
case of large countries, has a potential to become one of the biggest industries at a high income
level. Smaller domestic markets in medium or small countries do not nurture the industry, for
which scale economy is important. In addition, multinational corporations tend to build
manufacturing and assembling plants in large countries and make them a regional hub to serve
smaller countries in the region through exports.

48
Figure 2-1: Real value added patterns by industry along countries’ economic development
Source: UNIDO
The employment pattern for this size group shows that the food and beverages, textiles, and
wearing apparel industries are the three major sources of formal manufacturing employment at
least up to an income level of around USD 10,000 GDP per capita. The food and beverages
industry is relatively domestically-oriented with a large share of a country’s final output
consumed in the domestic market. Thus, the development of the food and beverages sector is
more predictable as the industry tends to increase value added and employment as income rises.
In contrast, the expansion of the wearing apparel industry hinges on the penetration of foreign
markets, especially in the case of small and medium-size countries, to realize the potential of
value added and employment increases as illustrated in Figure 2-1 and Figure 2-2. So the
competitiveness of the wearing apparel industry is an important indicator for a successful
industrialization at low and lower middle incomes.
Automation does not fundamentally alter industrial development patterns. There is an
increasing concern that robots and capital intensive equipment would replace workers in the food
and beverages, textiles and wearing apparel industries in the future and that they will not
generate a large number of formal jobs as they used to do in the past. However, automation is
likely to have much less impacts on jobs in light industries than transport equipment, electrical
machinery and resource-based industries (Hallward-Driemeier & Nayyar, 2017; UNCTAD, 2017).
Nevertheless, it is important for countries to lay the solid foundations for the development of
resource-based and high-tech industries for gradual diversification and upgrading of industrial
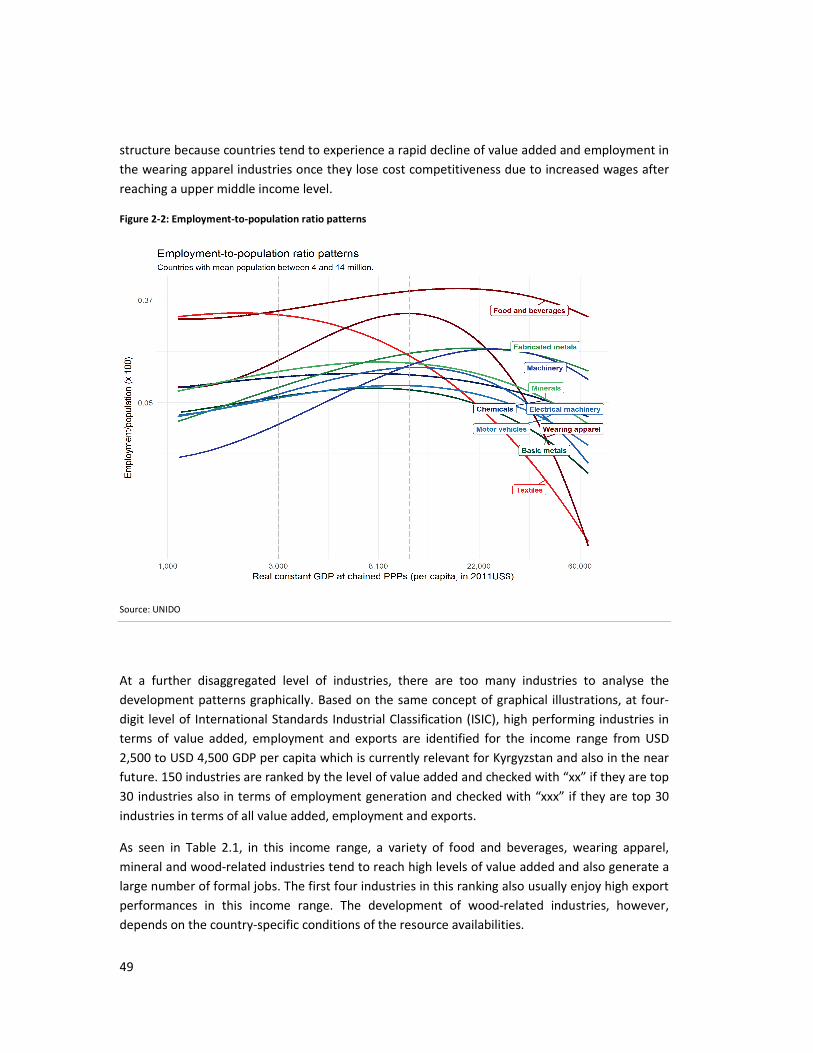
49
structure because countries tend to experience a rapid decline of value added and employment in
the wearing apparel industries once they lose cost competitiveness due to increased wages after
reaching a upper middle income level.
Figure 2-2: Employment-to-population ratio patterns
Source: UNIDO
At a further disaggregated level of industries, there are too many industries to analyse the
development patterns graphically. Based on the same concept of graphical illustrations, at four-
digit level of International Standards Industrial Classification (ISIC), high performing industries in
terms of value added, employment and exports are identified for the income range from USD
2,500 to USD 4,500 GDP per capita which is currently relevant for Kyrgyzstan and also in the near
future. 150 industries are ranked by the level of value added and checked with “xx” if they are top
30 industries also in terms of employment generation and checked with “xxx” if they are top 30
industries in terms of all value added, employment and exports.
As seen in Table 2.1, in this income range, a variety of food and beverages, wearing apparel,
mineral and wood-related industries tend to reach high levels of value added and also generate a
large number of formal jobs. The first four industries in this ranking also usually enjoy high export
performances in this income range. The development of wood-related industries, however,
depends on the country-specific conditions of the resource availabilities.

50
Table 2.1: Industries with the high potentials of value added, employment and exports (for income range between
2,500 and 4,500 GDP per capita)
1511 Processing/preserving of meat xxx
1810 Wearing apparel; except fur apparel xxx
2010 Sawmilling and planing of wood xxx
3610 Furniture xxx
1541 Bakery products xx
1553 Malt liquors and malt xx
1531 Grain mill products xx
2101 Pulp; paper and paperboard xx
2221 Printing xx
2695 Articles of concrete; cement and plaster xx
2102 Corrugated paper and paperboard xx
Source: UNIDO
2.1.2. What export performance and comparative advantage indicate
Comparative advantages exist in labour-intensive and some resource-based industries. The
revealed comparative advantages (RCA) of Kyrgyzstan in 2015 (Table 2.2) shows that the country
indeed has demonstrated its advantages in many food and beverages, textiles and wearing
apparel products relative to other manufactured products. It shows also advantages in some non-
metallic mineral products. Many of these products are used as construction materials, and
demand for such products tend to change along the expansion of the domestic economy. Thus,
the development of the non-metallic mineral industry is much more predictable than export-
oriented industries like the wearing apparel industry, which needs to develop international
competitiveness in order to reap its value added and employment creation potential.

51
Table 2.2: Revealed Comparative Advantage of Kyrgyzstan in 2015
RCA 2015 description
12.0 Natural, cultured pearls; precious, semi-precious stones; precious metals
9.9 Vegetables and certain roots and tubers; edible
4.8 Ores, slag and ash
4.3 Cotton
4.3 Tobacco and manufactured tobacco substitutes
3.6 Raw hides and skins (other than fur skins) and leather
3.6 Dairy produce; birds' eggs; natural honey; edible products of animal origin
2.9 Salt; sulphur; earths, stone; plastering materials, lime and cement
2.6 Glass and glassware
2.5 Fruit and nuts, edible; peel of citrus fruit or melons
2.2 Aircraft, spacecraft and parts thereof
2.2 Vegetable plaiting materials; vegetable products
2.0 Apparel and clothing accessories; not knitted or crocheted
1.9 Apparel and clothing accessories; knitted or crocheted
1.8 Silk
1.7 Lead and articles thereof
1.2 Stone, plaster, cement, asbestos, mica
1.1 Animal originated products
1.1 Commodities not specified according to kind
1.1 Preparations of cereals, flour, starch or milk; pastry cooks' products
1.1 Copper and articles thereof
Source: UNIDO
Given both the forward-looking potential based on industrial development patterns for the
income range of Kyrgyzstan’s near future and backward-looking assessment of the country’s past
export structure (RCA), the country could have strong development potential in the broad
categories of the food and beverages, textiles, wearing apparel, non-metallic mineral and also
perhaps basic metal industries. Among these, the non-metallic mineral industry tends to expand
as the country’s income increases because demand for the industry mainly comes from the
domestic market. The basic metals industry is one of a few already successful manufacturing
industries relative to the average performance of similar income countries. However, the industry
is capital intensive and has limited potential of job creation with high material intensive
production process posing an environmental risk.
Food and beverages as well as textiles and wearing apparel industries score high in terms of job
creation and inclusiveness. Due to the relatively small size of the country and importance of
inclusive development and job creation, the priority industries of Kyrgyzstan should be those with
high potentials of job creation and export growth. With a view to both growth and inclusiveness,
the food and beverages, textiles and wearing apparel industries should be given priority in the
country’s industrialization efforts. Rapid growth of these priority industries could create a large

52
number of formal manufacturing jobs, increase consumption, expand tax revenue for the
government, and increase investments in infrastructure and education, which could lay the solid
foundation for the growth of other manufacturing and related-service industries to facilitate
structural change and the catch-up of the Kyrgyz economy.
Low wages and a young labour force could be assets for achieving cost competitiveness. Being
labour-intensive, cost competitiveness would be a decisive factor for success in these industries.
Kyrgyzstan’s competitive wage level and abundant trainable labour force already provide the
country with distinct advantage, which are not available in many countries, especially those with a
higher GDP per capita. This means that, in such industries unlike in the cases of electronics,
machinery and motor vehicle industries, the country does not need to compete with
industrialized countries, which have already lost competitiveness in textiles and wearing apparel
industries. Kyrgyzstan’s competitors will be the countries at a similar income level and with similar
industrial development capabilities, which gives Kyrgyzstan a higher possibility of success.
Countries with recent experiences of rapid industrialization have rarely shown sudden changes in
economic structure, leap flogging from an agrarian economy to the one driven by capital-intensive
or high-tech manufacturing industries (Haraguchi, 2016a). Successful countries, which have
significantly reduced poverty, improved the welfare of citizens and modernized the economy in a
relatively short period of time, have scored an initial success in export-oriented light
manufacturing industries and invested in infrastructure and human capital for industrial
upgrading (e.g. Republic of Korea, Mauritius, China, and Vietnam and before them most of
industrialized countries like the United Kingdom and Japan). Thus, speeding up industrialisation
and fast improvements of living conditions is possible, but development strategies need to take a
structural change perspective, considering country-specific conditions and comparative
advantage.
2.1.3. Identifying the potential of the strategic industries
After having identified the Kyrgyz food and beverages, textiles and wearing apparel industries as
the strategic industries, the next step in the analysis consists of quantifying their growth potential
based on current value added generation and employment.
Switching from relative to absolute performance measures. Revealed comparative advantage
shown above is a relative measure as it is based on a comparison between the trade structures of
a country and the world as a whole. Thus, unless a country has exactly the same trade structure as
the world, it has always comparative advantages in some products regardless of the country’s
actual performance in the production of such products relative to other countries. It does not
mean that Kyrgyzstan’s actual performance in exporting the above products in Table 2.2 are
superior to those of other countries. If the country’s manufactured exports are less competitive
across the board, the RCA might show the products whose export performances are not as bad as
that of others.
When switching to a more objective performance measure of industries based on absolute output
or employment, the following considerations have to be taken into account:
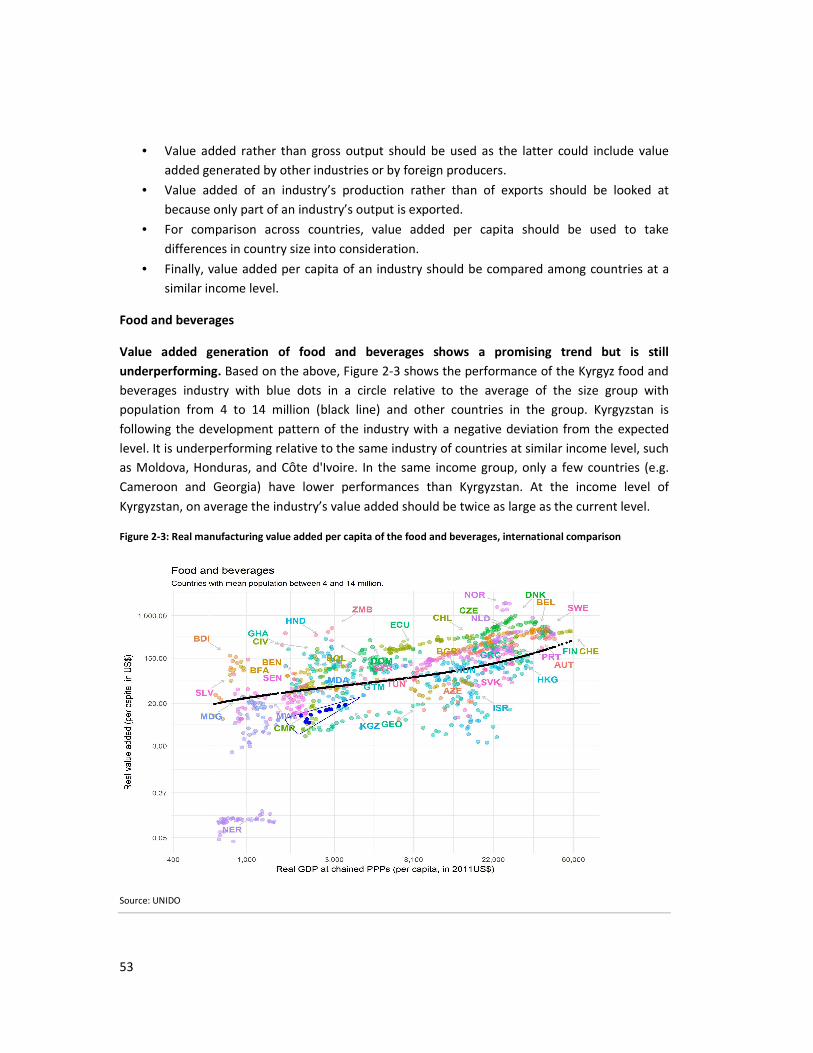
53
• Value added rather than gross output should be used as the latter could include value
added generated by other industries or by foreign producers.
• Value added of an industry’s production rather than of exports should be looked at
because only part of an industry’s output is exported.
• For comparison across countries, value added per capita should be used to take
differences in country size into consideration.
• Finally, value added per capita of an industry should be compared among countries at a
similar income level.
Food and beverages
Value added generation of food and beverages shows a promising trend but is still
underperforming. Based on the above, Figure 2-3 shows the performance of the Kyrgyz food and
beverages industry with blue dots in a circle relative to the average of the size group with
population from 4 to 14 million (black line) and other countries in the group. Kyrgyzstan is
following the development pattern of the industry with a negative deviation from the expected
level. It is underperforming relative to the same industry of countries at similar income level, such
as Moldova, Honduras, and Côte d'Ivoire. In the same income group, only a few countries (e.g.
Cameroon and Georgia) have lower performances than Kyrgyzstan. At the income level of
Kyrgyzstan, on average the industry’s value added should be twice as large as the current level.
Figure 2-3: Real manufacturing value added per capita of the food and beverages, international comparison
Source: UNIDO

54
Even looking at some specific products in the list of the county’s comparative advantage indicates
that Kyrgyzstan’s performance is much lower than the level expected at the country’s
development stage. As seen in Figure 2-4 and Figure 2-5, the value added per capita of vegetables
and fruits processing, and dairy products industries are lower than those of Senegal and
Azerbaijan and far below the level expected at the country’s income.
Figure 2-4: Real manufacturing value added per capita of fruit and vegetable processing, international comparison
Source: UNIDO
Figure 2-5: Real manufacturing value added per capita of dairy products, international comparison
Source: UNIDO

55
Formal employment has been decreasing. Consequently, the employment level of the food and
beverages industry in Kyrgyzstan (Figure 2-6) is lower than in most of the peer countries and has
been steadily decreasing since the mid-1990s. It is a serious concern for the county as the industry
is usually the most important manufacturing industry in terms of both value added and
employment across different income levels of countries in this size group. As such, a solid
production and marketing foundation needs to be developed from the early stage of
development for the industry’s sustained, long-term growth.
Figure 2-6: Employment level in food and beverages, international comparison
Source: UNIDO
Wearing apparel
Potential to octuplicate the value added in the wearing apparel industry. Within the textile and
textile products industry group, the wearing apparel industry is currently far more important than
the textile fabrics industry in Kyrgyzstan as seen in Figure 2-1 and Figure 2-2. The former has also
higher growth and employment generation potential at the income level of Kyrgyzstan. Thus, here
the analysis focuses on the wearing apparel industry. Kyrgyzstan has improved its performance in
recent years. The value added of the industry increased over the last ten years. However, since
the increase has started from an extremely low level, the current value added of the industry is
still far lower than expected for the country’s income level (Figure 2-7). At the current Kyrgyz
income level, the wearing apparel industry could be eight times bigger to match the average of
small lower middle income countries. In other words, there is still a large potential for the
industry to grow if the country continues to improve its competitiveness.
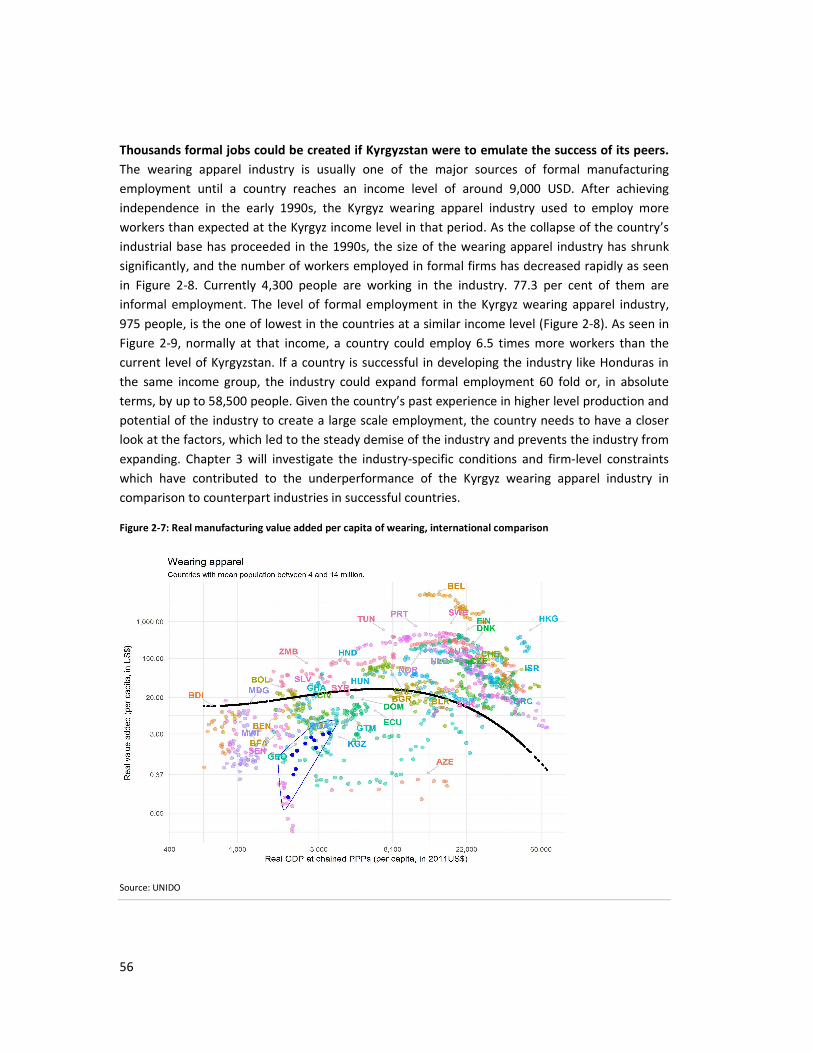
56
Thousands formal jobs could be created if Kyrgyzstan were to emulate the success of its peers.
The wearing apparel industry is usually one of the major sources of formal manufacturing
employment until a country reaches an income level of around 9,000 USD. After achieving
independence in the early 1990s, the Kyrgyz wearing apparel industry used to employ more
workers than expected at the Kyrgyz income level in that period. As the collapse of the country’s
industrial base has proceeded in the 1990s, the size of the wearing apparel industry has shrunk
significantly, and the number of workers employed in formal firms has decreased rapidly as seen
in Figure 2-8. Currently 4,300 people are working in the industry. 77.3 per cent of them are
informal employment. The level of formal employment in the Kyrgyz wearing apparel industry,
975 people, is the one of lowest in the countries at a similar income level (Figure 2-8). As seen in
Figure 2-9, normally at that income, a country could employ 6.5 times more workers than the
current level of Kyrgyzstan. If a country is successful in developing the industry like Honduras in
the same income group, the industry could expand formal employment 60 fold or, in absolute
terms, by up to 58,500 people. Given the country’s past experience in higher level production and
potential of the industry to create a large scale employment, the country needs to have a closer
look at the factors, which led to the steady demise of the industry and prevents the industry from
expanding. Chapter 3 will investigate the industry-specific conditions and firm-level constraints
which have contributed to the underperformance of the Kyrgyz wearing apparel industry in
comparison to counterpart industries in successful countries.
Figure 2-7: Real manufacturing value added per capita of wearing, international comparison
Source: UNIDO
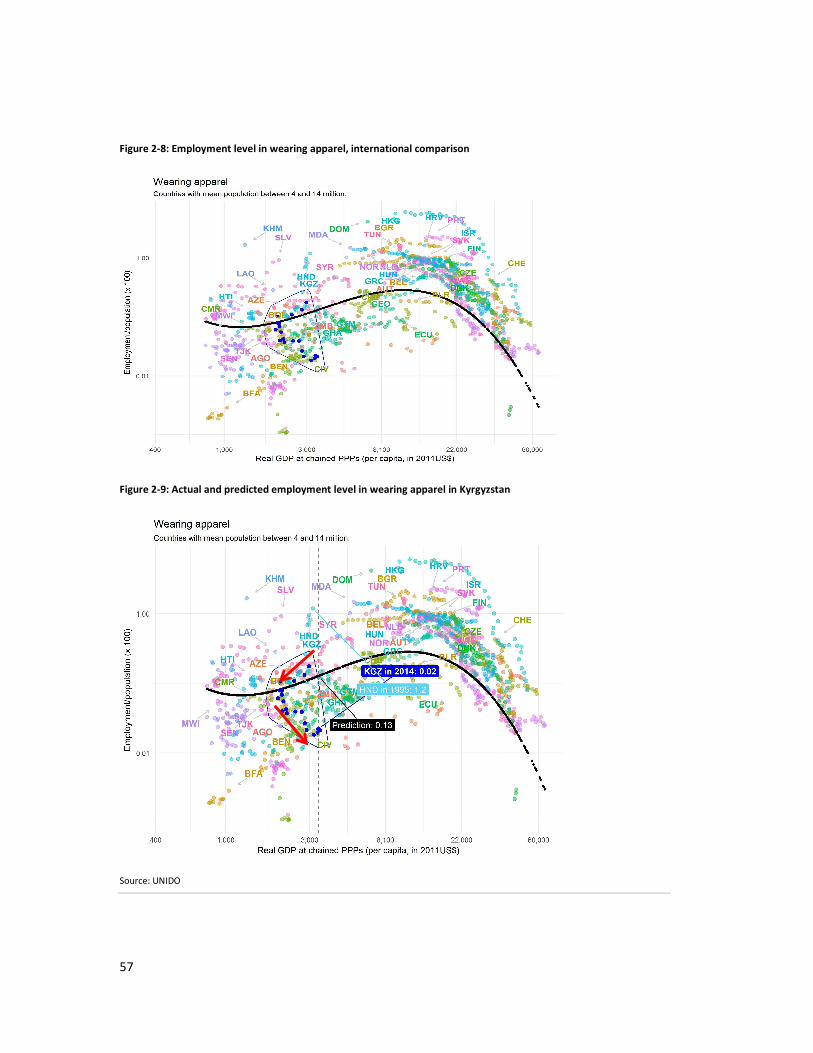
57
Figure 2-8: Employment level in wearing apparel, international comparison
Figure 2-9: Actual and predicted employment level in wearing apparel in Kyrgyzstan
Source: UNIDO

58
2.1.4. Foreign demand for Kyrgyz products
The following Tables 2.3 – 2.10 show the origin of demand for Kyrgyzstan’s major export products,
in which Kyrgyzstan holds comparative advantages (see Table 2.2), and how much. By far, gold is
the country’s largest export, which is mostly sold to Switzerland. The future performance of this
export is more likely to be dependent on continued availability of gold in the country more than
anything else. Thus, here the analysis focuses on other industries with high development
potential, which could be realized more by country and firm initiatives.
Export potential of mineral products appears to be limited. First of all, export values of non-
metallic mineral products are much smaller than those of foods, textiles and apparel products.
Generally, the mineral industry is domestically- oriented, and the demand for the industry’s
outputs tends to increase along with the expansion of domestic market. Often the bulky and
heavy outputs of the industry tend to limit the exports to neighbouring countries. Compared with
other industries, Kyrgyzstan’s mineral exports share of the imports of the neighbouring countries
is relatively high. As seen in Table 2.10 and Table 2.11, Kyrgyzstan is often ranked in top 5
exporters to the neighbouring countries. However, the export values are still small compared with
the exports of other products. This seems to indicate that the potential of this industry to increase
export revenues is limited relative to other products in which the country holds comparative
advantage (Table 2.2).
Massive export potential to neighbouring countries for wearing apparel. In contrast, the exports
of wearing apparel products present enormous potential. Just capturing around 0.5 per cent of
the Russian market makes it one of the country’s biggest exports in terms of export values (Table
2.8 and Table 2.9). Despite the high export values, the Kyrgyz market shares are ranked only as
15th and 17th in the non-knitted and knitted apparel and clothing accessories within Russian
markets, respectively. This shows how much the country could increase exports if the industry
became more competitive and could further penetrate foreign markets. Even in the case of the
closer and smaller market of Kazakhstan, Kyrgyzstan’s 1.7-1.8 per cent share in Kazakhstan’s
imports of wearing apparel products generated exports values more than 1.5 times larger than
Kyrgyzstan’s 4.5 per cent share in Kazakhstan’s imports of glass and glass ware. The world
demand for apparel products may not be growing as fast as for some high-tech products.
However, the sheer size of world demand for apparel products gives this industry a huge potential
for contributions to economic growth and employment generation. An increase of even half a per
cent share in a foreign market makes a significant difference. This leads to the question of how
Kyrgyzstan can improve the competitiveness of the wearing apparel industry which Chapter 3 will
discuss in detail.
Lucrative export niches in agricultural produce thanks to foreign business practices. With
regards to agricultural and agro-processing products, Kyrgyzstan is particularly successful in
exporting vegetable products to Turkey, accounting for the four per cent of Turkey’s imports of
the products around the world (Table 2.3). This is largely explained by the exports of kidney beans
by mainly Turkish exporting companies, which facilitate the exports working through Kyrgyzstan’s
supply chains (UNECE, 2015). This success should prompt the country to investigate whether it is

59
possible to replicate the success for the exports growth of other products driven by foreign
companies.
In general, Kyrgyzstan has better presences in some imports of smaller neighbouring countries. A
challenge for the country is to increase market share, even by a small margin, in large
neighbouring countries like China, Russia and India and start exporting to distant developed
economies. This would require a stable large scale production with consistency in product quality
in order to meet large volume orders from customers and regulatory requirements.
Table 2.3: Kyrgyzstan’s major import partners for trade in vegetables
Vegetables and certain roots and tubers; edible
Major trading
partners of Kyrgyzstan
Export values of
Kyrgyzstan (US$ in 1000)
Share of Kyrgyzstan in import of trading
partners (2016)
Ranking of Kyrgyzstan
among exporters
Turkey 30345.360 3.92% 4
Russian
Federation 10826.570 1.10% 10
Kazakhstan 4399.837 11.27% 2
Table 2.4: Kyrgyzstan’s major import partners for trade in fruits and nuts
Fruit and nuts, edible; peel of citrus fruit or melons
Major trading
partners of Kyrgyzstan
Export values of
Kyrgyzstan (US$ in 1000)
Share of Kyrgyzstan in import of trading
partners (2016)
Ranking of Kyrgyzstan
among exporters
Kazakhstan 10309.320 4.66% 5
Russian
Federation 9343.939 0.36% 23
Turkey 883.413 0.13% 37
Table 2.5: Kyrgyzstan’s major import partners for trade in dairy products, eggs and honey
Dairy produce; birds' eggs; natural honey; edible products of animal origin, not elsewhere specified or included
Major trading
partners of
Kyrgyzstan
Export values of
Kyrgyzstan (US$ in
1000)
Share of Kyrgyzstan in import of trading partners (2016)
Ranking of Kyrgyzstan among exporters
Russian
Federation 11663.210 0.50% 13
Kazakhstan 10749.280 6.25% 3
China 605.632 0.02% 37

60
Table 2.6: Kyrgyzstan’s major import partners for trade in cotton
Cotton
Major trading
partners of
Kyrgyzstan
Export values of
Kyrgyzstan (US$ in
1000)
Share of Kyrgyzstan in import of trading
partners (2016)
Ranking of Kyrgyzstan
among exporters
Turkey 10749.020 0.71% 14
Russian Federation
5798.804 2.29% 10
Uzbekistan 1060.382 19.99% 2
Table 2.7: Kyrgyzstan’s major import partners for trade in hides, skins and leather
Raw hides and skins (other than fur skins) and leather
Major trading
partners of
Kyrgyzstan
Export values of
Kyrgyzstan (US$ in
1000)
Share of Kyrgyzstan in import of trading partners (2016)
Ranking of Kyrgyzstan among exporters
China 6917.960 0.13% 36
Turkey 133.334 0.09% 49
Tajikistan 4.255 35.21% 2
Table 2.8: Kyrgyzstan’s major import partners for trade in apparel and clothing (not knitted or crocheted)
Apparel and clothing accessories; not knitted or crocheted
Major trading
partners of
Kyrgyzstan
Export values of
Kyrgyzstan (US$ in
1000)
Share in Share of Kyrgyzstan in import of
trading partners (2016)
Ranking of Kyrgyzstan
among exporters
Russian
Federation 20827.640 0.56% 15
Kazakhstan 13461.010 1.68% 6
Tajikistan 178.952 0.16% 6
Table 2.9: Kyrgyzstan’s major import partners for trade in apparel and clothing (knitted or crocheted)
Apparel and clothing accessories; knitted or crocheted
Major trading
partners of Kyrgyzstan
Export values of
Kyrgyzstan (US$ in 1000)
Share of Kyrgyzstan in import of trading partners (2016)
Ranking of Kyrgyzstan among exporters
Russian
Federation 17484.060 0.54% 17
Kazakhstan 15714.910 1.80% 4
Tajikistan 575.291 0.20% 3

61
Table 2.10: Kyrgyzstan’s major import partners for trade in construction materials
Salt; sulphur; earths, stone; plastering materials, lime and cement
Major trading
partners of
Kyrgyzstan
Export values of
Kyrgyzstan (US$ in
1000)
Share of Kyrgyzstan in import of trading
partners (2016)
Ranking of Kyrgyzstan
among exporters
Tajikistan 3846.741 56.20% 1
Uzbekistan 2686.660 6.70% 3
China 625.832 0.02% 48
Table 2.11: Kyrgyzstan’s major import partners for trade in glass and glassware
Glass and glassware
Major trading
partners of Kyrgyzstan
Export values of
Kyrgyzstan (US$ in 1000)
Share of Kyrgyzstan in import of trading partners (2016)
Ranking of Kyrgyzstan among exporters
Kazakhstan 9933.173 4.48% 4
Tajikistan 3589.206 16.68% 2
Uzbekistan 2397.570 5.43% 4
Source: UNIDO elaboration based on UN Comtrade.
2.1.5. Demands for Kyrgyz inputs in Global Value Chains (GVCs)
Kyrgyzstan’s involvement in global and even regional value chains is limited. Exports volumes
and the shares of Kyrgyzstan in trading partners’ imports mask the real contributions of exports to
Kyrgyzstan’s value added because exports are expressed as gross outputs which include foreign
value added entering in Kyrgyz exports as intermediate inputs. In contrast, value chain analysis
looks at Kyrgyz value added in a particular value chain. Table 2.12 shows how little Kyrgyzstan
participates in the value chains of its major trading partners. The country’s biggest value added
contribution is to Kazakhstan’s exports. For example, if Kazakhstan completes production and
exports final products of food and beverage value chains, Kyrgyzstan’s value added accounts for
the 1.5 per cent of that Kazakhstan’s exported values. For the exports of final products by other
countries, Kyrgyz value added accounts for less than one per cent. Especially, Kyrgyz participation
in the exports of final products by China and Turkey is negligible.

62
Table 2.12: Per centage of Kyrgyz value added in the exports of main trade partners, 2014
Countries in which the Value Chains finalizes
Foreign Sectors Value Chains Kazakhstan Pakistan Russia Mongolia China Turkey
Food, Beverages and Tobacco 1.5% 0.0% 0.1% 0.1% 0.0014% 0.0017%
Textiles Products 1.1% 0.2% 0.0% 0.1% 0.0004% 0.0010%
Leather, Leather and Footwear 1.0% 0.1% 0.0% 0.1% 0.0000% 0.0001%
Wood products 2.2% 0.0% 0.1% 0.0% 0.0000% 0.0001%
Paper products 1.3% 0.0% 0.1% 0.1% 0.0002% 0.0003%
Coke,refined petroleum 0.8% 0.1% 0.1% 0.2% 0.0013% 0.0017%
Chemicals 1.4% 0.0% 0.0% 0.1% 0.0020% 0.0029%
Rubber and plastics 1.6% 0.0% 0.1% 0.1% 0.0011% 0.0010%
Non-metallic mineral 1.1% 0.1% 0.2% 0.1% 0.0030% 0.0020%
Basic Metals and Fabricated Metal 0.6% 0.1% 0.1% 0.0% 0.0346% 0.0737%
Machinery, Nec 0.6% 0.1% 0.1% 0.1% 0.0010% 0.0018%
Electrical and Optical Equipment 0.6% 0.0% 0.1% 0.0% 0.0002% 0.0003%
Transport Equipment 1.4% 0.0% 0.0% 0.1% 0.0003% 0.0005%
Manufacturing, Nec; Recycling 0.3% 0.1% 0.1% 0.1% 0.0003% 0.0003%
Note: Textile products include both textile fabrics and wearing apparel.
Source: UNIDO calculations based on ADB Multi-Regional Input-Output data, 2017
Even though Kyrgyzstan’s GVC participation is limited as seen in the above table, still eight per
cent of the food and beverages industry’s value added and 15 per cent of the textiles products
industry’s value added came from GVC participation: i.e. the contribution of Kyrgyz value added
to foreign countries’ exports (Figure 2-10). This seemingly opposing picture indicates the total
value added including value added from non-GVC sources, such as domestic final consumption, is
small relative to other lower-middle income countries, pointing again to the county’s weak
production bases in these industries.

63
Figure 2-10: GVC participation 1 – Per centage of Kyrgyz industrial value added in foreign exports
A. Food, Beverages and Tobacco, in 2014 B. Textile Products, in 2014
Note: Textile products include both textile fabrics and wearing apparel.
Source: UNIDO calculations based on ADB Multi-Regional Input-Output data, 2017
High foreign value added content in Kyrgyz exports reflect critical gaps in the domestic supply
chains rather than strong inter-connections. GVC participation can be also assessed by the share
of foreign value added in Kyrgyzstan’s exports. As seen in Figure 2-11, for both food and
beverages, and textiles industries, foreign content in the Kyrgyz exports are relatively high among
Asian lower-middle income countries, reaching around 30 per cent. Vietnam and Cambodia,
which have higher shares of foreign value added in their exports than Kyrgyzstan, have much
higher export volumes of the two industries. As countries increase exports and upgrade their
products, share of foreign value added in exports also tends to increase. However, Kyrgyzstan
does not belong to this case. Even though the volumes of the country’s exports in these industries
are relatively small, already foreign value added shares are high. These results also confirm that
Kyrgyzstan has limited domestic capacity to participate in the GVCs of these industries.
8%
0%
5%
10%
15%
20%
25%
Ind
on
esi
a
Vie
t N
am
Sri L
anka
Ph
ilip
pin
es
Kyr
gyz
Re
pu
blic
Lao
PD
R
Cam
bo
dia
Pak
ista
n
Ind
ia
Bh
uta
n
Ban
glad
esh
Mo
ngo
lia
15%
0%
5%
10%
15%
20%
25%
Ban
glad
esh
Pak
ista
n
Sri L
anka
Kyr
gyz
Re
pu
blic
Ind
on
esia
Vie
t N
am
Lao
PD
R
Ind
ia
Cam
bo
dia
Ph
ilip
pin
es
Mo
ngo
lia
Bh
uta
n

64
Figure 2-11: GVC participation 2 – Foreign value added in Kyrgyzstan’s exports
A. Food, Beverages and Tobacco, in 2014 B. Textile Products, in 2014
Note: Textile products include both textile fabrics and wearing apparel.
Source: UNIDO calculations based on ADB Multi-Regional Input-Output data, 2017
2.1.6. Development impacts of an expanding domestic economy
Expansion of the industrial sector would boost employment in the textile sector. The
consideration of both supply and demand sides points to the fact that Kyrgyzstan has high
potential to develop agro-processing and textile products industries. Figure 2-2 has already
indicated the high potential of job creation in these industries by referring to the structural
change pattern of similar-size countries. Figure 2-12 specifically looks at the case of Kyrgyzstan. If
each industry increased outputs by one million USD in Kyrgyzstan, for example textile products
(including textiles and wearing apparel) and the wood products industries would increase 523 and
360 jobs, respectively. In contrast, the same output increase would add only 9 jobs to the basic
metals industry and 68 jobs to non-metallic mineral industries. The latter industries are capital
intensive and tend to use more capital than labour to produce outputs. This difference in
production technology clearly indicates the growth of the textiles industry is more inclusive; the
fruits of growth would be distributed to a large number of people instead of enriching a limited
number of skilled employees, managers and capital lenders.
0%
10%
20%
30%
40%
50%
60%
Vie
t N
am
Cam
bo
dia
Kyr
gyz
Rep
ub
lic
Bh
uta
n
Lao
Pe
op
le's
…
Mo
ngo
lia
Sri L
anka
Ind
on
esi
a
Ph
ilip
pin
es
Pak
ista
n
Ind
ia
Ban
glad
esh
0%
10%
20%
30%
40%
50%
60%
Vie
t N
am
Cam
bo
dia
Kyr
gyz
Re
pu
blic
Mo
ngo
lia
Ind
on
esi
a
Lao
Pe
op
le's
…
Ph
ilip
pin
es
Bh
uta
n
Sri L
anka
Ind
ia
Pak
ista
n
Ban
glad
esh

65
Figure 2-12: Job intensity of manufacturing sectors in Kyrgyzstan, 2014
Note: Textiles include both textile fabrics and wearing apparel. The electrical machinery industry was omitted from the analysis as it
shows clear inconsistency in the outputs and employment trends between UNIDO data and ADB MRIO data
Source: UNIDO calculations based on ADB Multi-Regional Input-Output data, 2017
Employment generation via the food and beverages industry is also sizeable but indirect. Figure
2-12 seems to indicate that the food and beverages industry does not generate many jobs as it
increases outputs. However, as an industry expands outputs, it creates jobs not only in the
industry but also other industries due to production linkages. To assess the impact of industrial
development on jobs, both jobs created in the same and other industries need to be counted. For
example, Figure 2-13 shows the total jobs created in the economy due to an increase in exports
by one million USD. The total number of jobs created by the food and beverages industry is the
third largest after the textiles and wood products industries. In fact the majority of jobs created
due to the export expansion of the food and beverages industry is in other sectors, mainly
agriculture. Thus, the textiles, and food and beverages industries are superior to others from the
perspectives of development potential as well as of social inclusiveness.
59
523
67
360
109
27 72
34 68
9 22 55
-
100
200
300
400
500
600
Foo
d a
nd
Be
vera
ges
Tex
tile
s
Leat
he
r
Wo
od
Pro
du
cts
Pap
er
and
Pri
nti
ng
Co
ke a
nd
Pe
tro
leu
m
Ch
em
ical
s
Ru
bb
er
and
Pla
stic
s
No
n-M
eta
llic
Min
era
l
Bas
ic M
eta
ls
Mac
hin
ery
, Ne
c
Tra
nsp
ort
Eq
uip
me
nt
Job
s /
Mio
USD
of
Ou
tpu
t
Total Job Intersity (Jobs per 1 Mio of Output)

66
Figure 2-13: Total number of jobs generated (direct and indirect) when the exports of that sector expands by 1 Mio
USD in Kyrgyzstan, 2014
Note: Textile products include both textile fabrics and wearing apparel.
Source: UNIDO calculations based on ADB Multi-Regional Input-Output data, 2017
The strategic industries also score high in terms of gender balance. As seen in Table 2.13, the
food and beverages and the textile and wearing apparel industries are among the highest in terms
of share of female employment in total employment. Within the textile products industry, the
wearing apparel industry hires more women than men in Kyrgyzstan. Thus, employment growth
in these industries creates nearly equal job opportunities for women and men. However, it is also
true that male workers are the dominant work force in other industries. Unless this is due to the
voluntary choice of women, this gender imbalance in the employment of capital- and technology-
intensive industries needs to be rectified as the value added and employment of these industries
in the economy will most likely increase as the country moves forward in its industrialization
process.
-
50
100
150
200
250
300
350
400
450
Other sectors
Same sector
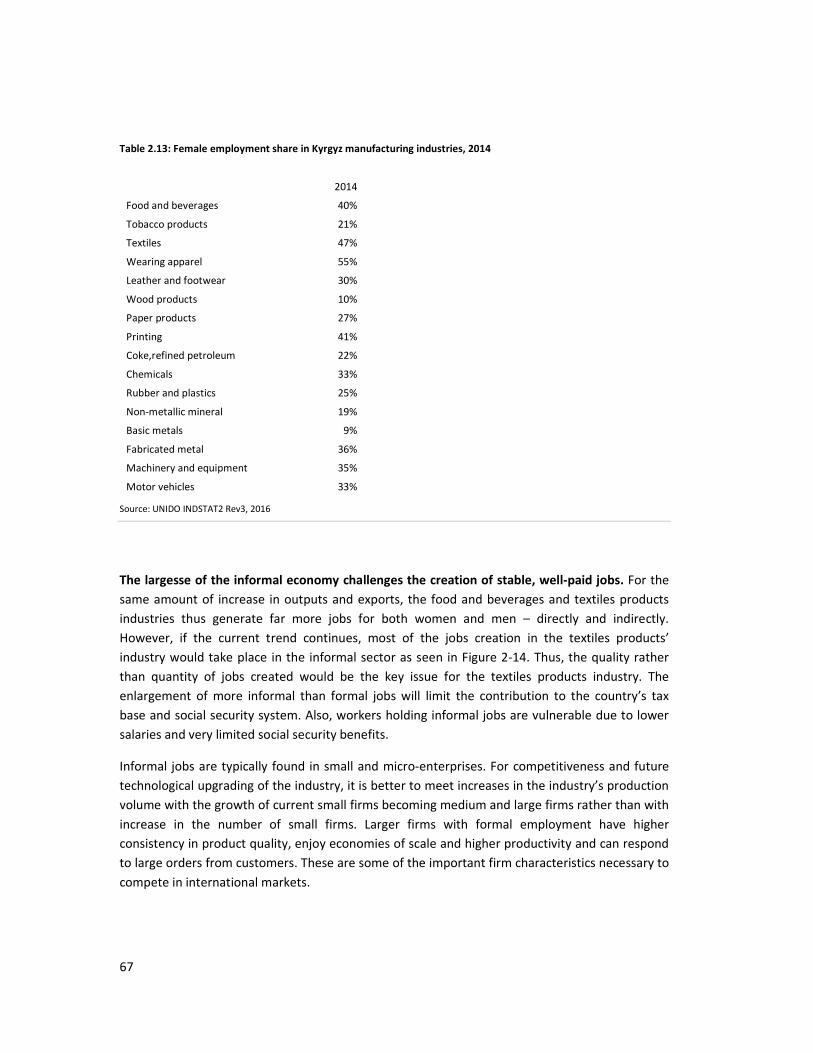
67
Table 2.13: Female employment share in Kyrgyz manufacturing industries, 2014
2014
Food and beverages 40%
Tobacco products 21%
Textiles 47%
Wearing apparel 55%
Leather and footwear 30%
Wood products 10%
Paper products 27%
Printing 41%
Coke,refined petroleum 22%
Chemicals 33%
Rubber and plastics 25%
Non-metallic mineral 19%
Basic metals 9%
Fabricated metal 36%
Machinery and equipment 35%
Motor vehicles 33%
Source: UNIDO INDSTAT2 Rev3, 2016
The largesse of the informal economy challenges the creation of stable, well-paid jobs. For the
same amount of increase in outputs and exports, the food and beverages and textiles products
industries thus generate far more jobs for both women and men – directly and indirectly.
However, if the current trend continues, most of the jobs creation in the textiles products’
industry would take place in the informal sector as seen in Figure 2-14. Thus, the quality rather
than quantity of jobs created would be the key issue for the textiles products industry. The
enlargement of more informal than formal jobs will limit the contribution to the country’s tax
base and social security system. Also, workers holding informal jobs are vulnerable due to lower
salaries and very limited social security benefits.
Informal jobs are typically found in small and micro-enterprises. For competitiveness and future
technological upgrading of the industry, it is better to meet increases in the industry’s production
volume with the growth of current small firms becoming medium and large firms rather than with
increase in the number of small firms. Larger firms with formal employment have higher
consistency in product quality, enjoy economies of scale and higher productivity and can respond
to large orders from customers. These are some of the important firm characteristics necessary to
compete in international markets.

68
Figure 2-14 Total number of jobs generated by sector when each sector exports an additional 1 Mio USD, 2014
Break-up of job generation by sector, manufacturing sectors only
Note: Textile products include both textile fabrics and wearing apparel.
Source: UNIDO calculations based on ADB Multi-Regional Input-Output data, 2017
Confirming the job creation potential of strategic industries for the formal economy. A
comparison with other countries at Kyrgyzstan’s income level reveals the large job creation
potential of the strategic manufacturing industries. Looking at only formal enterprises, if
Kyrgyzstan increased the value added of the food and beverages industry from the current level
of 106.4 million USD to the expected level (Kyrgzstan’s income level on the black line in Figure
2-3), formal jobs in the industry would increase from the current level of 11,338 to 27,432. In
addition, this expansion of the industry would create additional 593 jobs to other manufacturing
industries (Table 2.14). In the case of textiles products’ industry, formal employment would
increase 7.5 times to 19,079 with an additional 1,354 jobs in other manufacturing industries.
183
415
148
244
108
75
101
62
82
16
42
62
- 50 100 150 200 250 300 350 400 450
- 50 100 150 200 250 300 350 400 450
Food and Beverages
Textiles
Leather
Wood Products
Paper and Printing
Coke and Petroleum
Chemicals
Rubber and Plastics
Non-Metallic Mineral
Basic Metals
Machinery, Nec
Transport Equipment
Number of jobs
Formal Manufacturing Jobs (1) Informal Manufacturing Jobs (2) Agriculture and Mining Services

69
Table 2.14: Estimated number of formal jobs at the average level of value added for a country at Kyrgyzstan’s income
level, 2014
Current value
added
Average level Current
employment
After increase in
value added
Additions to other
man industries
Food and
beverages
106.4 million 259.0 million 11,338 27,432 593
Textiles and wearing apparel
17.7 million 143.3 million 2,519 19,079 1,354
Note: Textile products include both textile fabrics and wearing apparel. The value added figures in the table might differ from the
official statistics because the value added used here are at estimated constant prices
Source: UNIDO calculations based on ADB Multi-Regional Input-Output data, 2016
The number of formal jobs could be 20 times larger. Furthermore, if Kyrgyzstan expanded the
industry to the value added level of the food and beverages and textiles industries in Honduras,
which belongs to the same size and income group as Kyrgyzstan, the formal jobs in the Kyrgyz
food and beverages industry and the textiles industry would increase to 85,408 and 51,784 (more
than 20 times its present level). These assessments indicate there are enormous potential for
inclusive growth in these industries. The expansion of formal jobs in these industries would be
due to new jobs created as a result of an increase in production volume as well as shift from
informal to formal jobs.
Table 2.15: Estimated number of formal jobs at a value added of a successful country at Kyrgyzstan’s income level,
2014
Current value added
High level Current employment
After increase in
value added
Additions to other
man industries
Food and beverages
106.4 million 809.0 million 11,338 85,408 2,728
Textiles and
wearing apparel
17.7 million 403.7 million 2,519 51,784 4,565
Note: Textile products include both textile fabrics and wearing apparel. The value added figures in the table might differ from the
official statistics because the value added used here are at estimated constant prices
Source: UNIDO calculations based on ADB Multi-Regional Input-Output data, 2016
2.2. Strong growth and sustainable development
2.2.1. Greening manufacturing industries
Acceleration of industrial development also requires to focus on environment sustainability.
Both the supply- and demand-sides analyses indicated the rapid output growth potential of the
Kyrgyz food and beverages, textiles and wearing apparel industries. Not only is the country likely
to experience strong growth in these industries under right policy environment, they could also
generate a large number of jobs for both women and men, which is critical for the country to

70
address the socio-economic challenges discussed in Chapter 1. Strong and inclusive growth,
however, is not sufficient for the future industrial development of Kyrgyzstan. The county cannot
grow at the expense of its natural environment, which itself is the valuable asset of the country
for industries, energy and above all the long-term welfare of the citizens.
Chapter 1 showed that the levels of CO2 emission and material use of the Kyrgyz manufacturing
sector are comparable to those in lower middle income countries. However, the growth of CO2
emission and material use of the Kyrgyz manufacturing sector is faster than that of lower middle
income as well as other income groups. Strong growth of the manufacturing sector, that is
important for the country to realize the development impacts, could, however, make the path of
the country’s industrial development less sustainable.
CO2 emissions are high in the food and beverages industry and energy intensive industries.
Food and beverages among the most emission-intensive industries. The following figures
present where CO2 emissions come from within the manufacturing sector. Given the current
manufacturing structure, the main emitters of CO2 are the petroleum, chemical and non-metallic
mineral, food and beverages, metal, and textiles and wearing apparel industries (Figure 2-15).
Especially the first two industries account for nearly 40% of the total manufacturing CO2
emissions, and they are also high in terms of CO2 emission intensity, which is defined as the
amount of CO2 emission per value added. Moreover, as seen in comparisons with the CO2 growth
trends of different income groups, the Kyrgyz food and beverages, and petroleum, chemicals and
non-metallic mineral industries are increasing CO2 emissions faster than expected for the
countries in the same income group (and in other income groups) for the last two decades.
Figure 2-15: CO2 volume across sub-sector industries in Kyrgyzstan
Source: EORA MRIO, 2016
0100200300400500600700800900
Food &
Beverages
Textiles and
Wearing
Apparel
Wood and
Paper
Petroleum,
Chemical and
Non-Metallic
Mineral
Products
Metal Products Electrical and
Machinery
Transport
Equipment
Other
Manufacturing
Recycling
2013

71
Figure 2-16: intensity effect of CO2 across sub-sector industries in Kyrgyzstan
Source: EORA MRIO, 2016
Figure 2-17: Variation in CO2 volume (1995=1)
a) Food & Beverages b) Textiles and Wearing Apparel
-50
0
50
100
150
200
250
300
350
400
Food &
Beverages
Textiles and
Wearing
Apparel
Wood and
Paper
Petroleum,
Chemical and
Non-Metallic
Mineral
Products
Metal Products Electrical and
Machinery
Transport
Equipment
Other
Manufacturing
Recycling
2013
0
0.5
1
1.5
2
2.5
19
95
19
96
19
97
19
98
19
99
20
00
20
01
20
02
20
03
20
04
20
05
20
06
20
07
20
08
20
09
20
10
20
11
20
12
20
13
0
0.5
1
1.5
2
2.5
19
95
19
97
19
99
20
01
20
03
20
05
20
07
20
09
20
11
20
13
HI
UMI
LMI
LI
Kyrgyzstan

72
c) Petroleum, Chemical and Non-Metallic Mineral d) Metal Products
Source: EORA MRIO, 2016
For material use (including ores, biomass and construction materials), the metal products industry
is by far the largest user of natural resource materials. The industry also has a high intensity of
material use (amount per value added). At the income level of Kyrgyzstan, it should gradually
reduce the intensity of material use due to the application of better technology and improved
efficiency in production process as seen in the trend of LMIC in Figure 2-20.49 However, the
petroleum, chemicals and non-metallic, and metal products industries have not shown decreasing
trends yet and keep the very high levels of the intensity relative to any income group.
49 The Kyrgyz food and beverages, textiles and wearing apparel industries are reducing the intensity of material use faster than the
trends of lower middle income countries.
0
0.5
1
1.5
2
2.5
3
3.5
19
95
19
96
19
97
19
98
19
99
20
00
20
01
20
02
20
03
20
04
20
05
20
06
20
07
20
08
20
09
20
10
20
11
20
12
20
13
0
0.5
1
1.5
2
2.5
3
19
95
19
97
19
99
20
01
20
03
20
05
20
07
20
09
20
11
20
13
HI
UMI
LMI
LI
Kyrgyzstan

73
Figure 2-18: Volume of material use across sub-sector industries in Kyrgyzstan
Source: EORA MRIO, 2016
Figure 2-19: Intensity of material use across sub-sector industries in Kyrgyzstan
Source: EORA MRIO, 2016
02000400060008000
1000012000
Food &
Beverages
Textiles and
Wearing
Apparel
Wood and
Paper
Petroleum,
Chemical and
Non-Metallic
Mineral
Products
Metal Products Electrical and
Machinery
Transport
Equipment
Other
Manufacturing
Recycling
2013
0100020003000400050006000
Food &
Beverages
Textiles and
WearingApparel
Wood and
Paper
Petroleum,
Chemical andNon-Metallic
Mineral
Products
Metal Products Electrical and
Machinery
Transport
Equipment
Other
Manufacturing
Recycling
2013

74
Figure 2-20: Variation in intensity effect of material use (1995=1)
a) Petroleum, Chemical and Non-Metallic Mineral b) Metal Products
Source: EORA MRIO, 2016
Pollution-mitigation measures need to be stepped up. The analyses on CO2 emissions and
material use at sub-sector level point out two issues for the country to pursue inclusive and
sustainable development. First, while the food and beverages, and textiles and wearing apparel
industries have high potential for growth and employment generation, Kyrgyzstan has to take a
stronger measure to reduce emission intensity and adopt cleaner production process especially
for the food and beverages industry. This should be done in a way not to compromise the growth
potential of the industry. Relatively simple measures such as improving production organization
and keeping production floor clean could make difference in emission intensity without increasing
production costs. Improving energy efficiency could lead to cleaner production as well as lower
production costs (UNIDO, 2011).
Secondly, Kyrgyzstan has to significantly improve the emission and material intensity of the
resource-intensive industries, such as petroleum, chemicals and non-metallic mineral and metal
products industries. Both the current levels and intensity of CO2 emissions and material use in
these industries are not only high but lagging behind the countries in the same income group.
The disproportional contribution of the basic metal industry to the manufacturing value added
makes its manufacturing activities relatively dirty and detrimental to the environment of this
small country unless it significantly reduces CO2 emissions and material use.
Sustainability of industrial development must be made a priority. To achieve inclusive and
sustainable industrial development, therefore, focusing on the promotion of the labour intensive
industries would not be sufficient. The development of such industries could lead to higher
growth and employment generation, but there is no guarantee that the process is also
0
0.5
1
1.5
2
2.5
3
3.5
4
4.5
5
19
95
19
96
19
97
19
98
19
99
20
00
20
01
20
02
20
03
20
04
20
05
20
06
20
07
20
08
20
09
20
10
20
11
20
12
20
13
0
1
2
3
4
5
6
19
95
19
97
19
99
20
01
20
03
20
05
20
07
20
09
20
11
20
13
HI
UMI
LMI
LI
Kyrgyzstan
75
sustainable. For ISID, Kyrgyzstan needs to introduce specific measures to make the production of
especially the food and beverages and resource-intensive industries cleaner in addition to growth
promotion strategies of the labour intensive industries.
2.2.2. Promotion of a Green Industry – hydropower sector
Harnessing the potential of hydropower. In addition to greening existing industries, the
promotion of green industries could support the country’s growth and sustainable development.
The growth potential of the hydropower sector and the importance of it for sustainable
development of Kyrgyzstan have been repeatedly voiced by the government, different
stakeholders and development organizations during the two diagnostic missions of UNIDO. The
analysis in this Chapter confirms that the Kyrgyz hydropower sector could play a crucial role in the
country’s sustainable growth. The following sections discuss the potential of the sector and the
factors preventing the country from realizing the potential. Chapter 4 proposes the measures to
overcome the existing obstacles.
How much does Kyrgyzstan have the potential of developing hydropower including small
hydro?
Less than 20 per cent of hydropower capacity has been installed so far. Kyrgyzstan due to its
mountainous terrain (comprising 80 percent of its landmass) and climatic conditions has a very
large hydropower potential. It is the third largest in the former Soviet Union after the Russia
Federation and Tajikistan and amounts to the hydropower potentials of UK, France, Spain and
Germany combined (SlovakAid, 2006). The hydropower resources of Kyrgyzstan consist of 268
rivers, 97 major canals and 18 reservoirs (Ministry of Justice of the Kyrgyz Republic, 2015).
Generation potential is approximately 140-160 TWh, but only 9-10 percent has been exploited
(WSHPDR, 2016; Ministry of Justice of the Kyrgyz Republic, 2015; Ministry of Foreign Affairs of the
Kyrgyz Republic, n.d.), with installed capacity having reached 17 percent of its total potential (see
Table 2.16).
Of the potential sources of hydropower in the country, the Naryn River basin has 44 percent of
hydropower resources, while the Ferghana valley contains 23 percent, the Chui river basin - 8.1
percent, the Sary-Jaz river basin - 6.6 percent and the other basins -18.3 percent. About 33 larger
hydropower plants could be constructed on Naryn river, having a total capacity of 6,450 MW
(SlovakAid, 2006). Due to climate change and melting of the glaciers, scientists have predicted a
short-term increase in run of capacity, it could increase by 5 to10 percent by 2020 - 2025, but
after 2020 - 2025 the water-flow may decrease, which will reduce the capacity of hydroelectric
power generation (Zhupankhanet al., 2017; OECD, 2016; EBRD, 2013; GoK, 2009).

76
Table 2.16: Hydropower installed capacity vs potential50
Source: WSHPDR (2016); Ministry of Foreign Affairs of the Kyrgyz Republic (n.d)
Table 2.17: The percent of river basin by country
Source: Kushkumbayev S., Kushkumbayeva A. (2013)
Smaller scale hydropower potential (SHP)
Small hydropower plant (SHP) potential
There is significant potential for smaller scale hydropower what needs further investigation.
Potential for smaller scale 51 hydropower is up to 5-8 TWh, with only 2 percent utilised (see
50 International Center on Small Hydro Power and UNIDO defines small hydropower as having an installed capacity of up to 10 MW per
plant, however Kyrgyzstan’s local definition on small hydropower is up to 30 MW. Above this threshold plants are assumed to be larger
scale and might not benefit from government subsidies. Differences in definition can cause confusion.
Capacity, MW Generation, TWh
Total Hydropower potential 18,500 160
Total Hydropower instaled 3,072 14
Total instaled % 17% 9%
Large HPP poetntial 17,600 152
Large HPP instaled 3,030 13.9
Large HPP instaled % 17% 9%
SHP (up to 30MW) potential 900 8
SHP (up to 30MW) instaled 41.5 0.125
SHP instaled % 5% 2%
Syr
Darya
Amu
Darya
Kyrgyzstan 74% 2%
Kazakhstan 7% –
Uzbekistan 17% 9%
Tajikistan 3% 73%
Turkmenistan – 2%
Afghanistan – 14%

77
Figure 2-21 and Figure 2-22) (Ministry of Justice of the Kyrgyz Republic, 2015). About 980 small
(up to 10 MW) and micro (up to 1 MW) hydropower plants can be constructed on 172 streams.
The mountain rivers outflowing to Chui, Talas, Naryn, Sary Dzaz, Karadarya rivers and Issyk-Kul
Lake have the largest potential.
According to the study carried out in 2005 technical available generation potential of SHP would
be about 6,800 GWh with installed capacity of 1,900 MW from 249 SHPs (see Table 2.18). Thus,
about 7 SHP with a total installed capacity of 74 MW and total annual production of 220 GWh can
be constructed into the larger irrigation channels. Due to the high variation of estimations, it
would be advisable to conduct a new, on the ground study to estimate the technical, economical
and market potential of such a project (SlovakAid, 2006).
Table 2.18: SHP generation potential 52;53;54
Source: SlovakAid, 2006
Figure 2-21: Hydropower capacity in Kyrgyzstan
Source: WSHPDR (2016); Ministry of Foreign Affairs of the Kyrgyz Republic (n.d)
51 International Center on Small Hydro Power and UNIDO defines small hydropower as having an installed capacity of up to 10 MW per
plant, however Kyrgyzstan’s local definition on small hydropower is up to 30 MW. Above this threshold plants are assumed to be larger
scale and might not benefit from government subsidies. Differences in definition can cause confusion. 52
Technical potential: can be used by implementing of available technologies, limited by legislative, administrative and environmental
barriers. 53
Economical potential: part of the technical potential that can be economically viable, given the society constrains (legislation, fiscal
regulations, equipment operation costs, discount rates, inflation, etc.) 54
Market potential: Economic potential, minus market barriers (investment risks, expected benefits, etc.).
Tehnical
potential
Economical
potential
Market
potential
SHP up to
10MW6,800 GWh
from 876 GWh
to 2,000 GWh
from 282 GWh
to 760.5 GWh

78
Figure 2-22: Hydropower generation in Kyrgyzstan
Source: WSHPDR (2016); Ministry of Foreign Affairs of the Kyrgyz Republic (n.d)
According to statistics, in 1960 there were up to 200 hydropower stations in Kyrgyzstan (currently
12) with an annual electricity generation of about 285.3 GWh and installed capacity of 66.3 MW
(The Government of the Kyrgyz Republic, 2015). This source accounted for 32.7 percent of the
total electricity production in the republic.
Initiatives to develop small hydropower plant shave been taken. The concept of ‘SHP
development in Kyrgyzstan in 2015-2017’ was approved on 20 July 2015 by the Kyrgyz Republic
Government Decree No. 507 (UNDP, 2016). Currently there are 87-100 economically feasible
small hydropower sites55 with capacity of 180 MW and power generation of up to 1 TWh (Ministry
of Justice of the Kyrgyz Republic, 2015). Many locations suitable for SHP have maintained dams,
channels and other facilities from the SHP plants previously located there (ADB, 2013b). The
largest SHP potential is concentrated in the northern, southern and eastern areas (marked with
blue, Figure 2-23) (WSHPDR, 2016) (Monique, 2009). The location of SHP potential is connected to
the most densely resided areas of Kyrgyzstan (marked with grey, Figure 2-24). The density of
population is extremely uneven, the majority of it being concentrated in the valley and foothill
climatic zone, which is considered to be the area of comfort habitation and which covers about 20
per cent of the territory of the country (GoK, 2009).
55 SHP with installed capacity up to 30MW

79
Figure 2-23: Map of locations of small hydropower potential in Kyrgyzstan
Source: UNFCCC (2009)
Figure 2-24: Density of resident population in the Kyrgyzstan (in 2006)
Source: Global Environmental Facility (2009)i

80
What are the factors which are preventing the country from realizing the potential?
Regional instability
Most of the hydropower projects in Kyrgyzstan have their roots in Soviet engineering plans
developed in 1930s. After the collapse of the Soviet Union Kyrgyzstan’s intention to continue with
these plans faced much resistance from downstream countries, particularity Uzbekistan56 (Kasym,
2014) (Mirovalev, 2016).57 During the Soviet Union era the main agricultural objective was to
maximize the area under the irrigated crops and ensure enough water in the normal as well as dry
years. Kyrgyzstan’s reservoirs (existing and planned) would have ensured extra water for irrigation
purposes, rather than the energy needs of Kyrgyzstan.
The Almaty Agreement in 1992 was the first major joint water management agreement between
the Central Asian states after the downfall of the Soviet Union. The agreement in practice meant
that the old Soviet Union water-sharing regime safeguarding the downstream cotton growing
systems was agreed upon (Weinthal, 2002). The agreement was passed despite protests from
Kyrgyzstan. Thus, it appears that the three major economic powers of Central Asia (Kazakhstan,
Uzbekistan, and Turkmenistan) acted as hydro-hegemons and pushed through the agreement
that would guarantee the downstream irrigation industry. The reason for this appears to have
been that the three downstream countries had no real motivation to change the original Soviet
Union arrangement that was reiterated in the Almaty agreement 1992 (World Bank, 2004)
(Abdolvand, Mez, Winter, 2015. All the barter agreements that obliged Kyrgyzstan to operate the
reservoir in an irrigation mode, in exchange for coal and gas supplies from Uzbekistan and
Kazakhstan during the winter months, were breached by all the parties (Abbink, Moller, O’Hara,
2009). The inability of downstream basin countries to participate in a fairer basin-wide water
resources development might trigger a unilateral hydropower development by upstream
countries (Tajikistan, Kyrgyzstan) (Zhupankhan, Tussupova, Berndtsson, 2017). For example,
Kyrgyzstan plans to build a Kambarata-3 Hydro Power Plant to produce hydro-energy for export to
neighbouring states, which will give Kyrgyzstan significant leverage over Uzbekistan. However,
Tashkent strongly opposes this project, worrying that Kambarata will limit or disrupt the flow of
irrigation water essential to its cotton fields and farmers.58 As mentioned above this conflict of
interests has caused one of the key problems for hydropower development in Kyrgyzstan and
consequently most projects have been delayed (Kushkumbayev, Kushkumbayeva, 2013).
56 A common misconception appears to be that hydropower and irrigation demand is conflicting and incompatible. The problem with
hydropower production in the upper reaches is not water withdrawal and an overall reduction of water flows, but the amount and
time of water releases from the dams. The main concern for the downstream countries is that Kyrgyzstan would discharge water
mainly in winter times (energy needed for heating) when water for agriculture is not needed in Uzbekistan. 57
Hundreds of people were killed in violent ethnic clashes in the Kyrgyz part of the Ferghana valley in 1990 and 2010, and the latter
conflict prompted a brief exodus of hundreds of thousands of refugees. In 2015 Uzbek President I. Karimov warned: "Control over
water resources in the republics of Central Asia may lead to a full-scale war." 58
Shahbazov F. (2017). Will Central Asia Fight Over Water Resources? Forbes. Available from:
https://www.forbes.com/sites/realspin/2017/02/06/will-central-asia-fight-over-water-resources/#28b7a2a64c1f

81
Investment and legislation framework
The total public investment projects funded by domestic sources are from 2.5 to 10 per cent of
total investments between 2006 and 2012, and the rest was financed by international funding
sources (Table 2.19) (OECD, 2016). Taking into account regional instability and other factors
mentioned in this report59 not many foreign investors are willing to enter the Kyrgyz market yet
(Abdolvand, Mez, Winter, 2015). However, there are also other factors besides regional
instability that are jeopardising investment in Kyrgyzstan such as a weak legislative framework.
There is existing support for investors, but it isn’t functioning as intended. According to a UNDP
analysis there are a number of barriers hindering investment in the hydropower sector (UNDP,
2015), such as: (a) a lack of government guarantees for returns of investment, both local and
foreign investments, and constantly "jumping" exchange rates; (b) a lack of strict rules in Kyrgyz
legislation on land allocation and reliability of the use of water, land and excessive bureaucracy in
land acquisition; (c) a lack of strategic and long-term vision of local authorities on informing the
public about feasibility and advantages of small hydropower plants in local areas; (d) a lack of
guarantees from distribution companies on timely payment for electricity, etc. Historical legacies
are shaping water institutions in the region. The water administration is still characterized by a
predominantly hierarchical culture, strong fragmentation, and a lack of horizontal coordination
(Abdolvan, Mez, Winter, Mirsaeedi-Gloßner, Schutt, Rost, Bar, 2015). However, Kyrgyzstan seems
to be the only state in Central Asia where state authorities, including members of hydraulic
bureaucracies, have supported a policy of decentralization (Zinzania, Mengab, 2017).
Table 2.19: Public investment projects financed by foreign and domestic funding, as a % of total
Source: OECD (2016)
Electricity price and feed-in-tariff
The Government has continued to subsidize electricity rates, since the crisis in 2009. Electricity
costs have carried out a social security function, similar to the Soviet practice.60 According to
UNECE, tariff reforms are considered the single most important policy action needed to improve
the financial viability of the heating sector and to incentivise end-user energy efficiency (UNECE,
2017). Due to the slow pace of improvement in the sector, a situation has emerged whereby
people do not see why electricity rate increases should be accepted in return for poor service
59 Low electricity price, transparency and mismanagement, old infrastructure; legislation framework; etc.
60 This policy comes at a huge fiscal cost, mostly benefiting large, wealthy consumers who have more ways of using electricity (for
example, utilizing more house appliances), in contrast with its stated social objective.
2006 2007 2008 2009 2010 2011 2012
Foreign 92.4 89.2 90.9 92.6 94.4 95.5 97.4
Domestic 7.6 10.8 9.1 7.4 5.6 4.5 2.6

82
(Abdolvand, Mez, Winter, 2015). In November 2014, Resolution No. 660 came into force which
approved the Medium-Term Tariff Policy of the Kyrgyzstan for Electric and Thermal Energy, 2014-
2017, the price should have increased by 20 per cent annually, resulting in the rate of KGS 1.21
per kWh in 2017.61 As of October 2017, the electricity price was still KGS 0.77 for households (KGS
2.24 non-residential users), without any announced plans to increase it in the soonest future
(Government of the Kyrgyz Republic, 2014).62;63 The World Bank points out that the tariff
structure is believed to incentivize fraud with small commercial users reportedly registering
themselves as residential consumers to bypass the higher tariff category. Kyrgyzstan has one of
the lowest electricity tariffs in the world, low tariffs motivate higher demand, given weak
incentives to save energy. Residential demand has increased for almost 58 per cent during the
period 2007-2016 while the number of customers only increased by 12 per cent in this period.*64
Growing domestic demand means that the country has less surplus power to export and in fact
often resorts to costly imports (World Bank Group, 2017).65
A feed-in-tariff scheme to promote renewable energy (SHP up to 30 MW) has been adopted
through the Law on Renewable Energy Sources adopted in 2009, it would ensure the return on
investment for projects within eight years (Ministry of Energy and Industry of the Kyrgyz Republic,
2008). During the project payback period, tariff on electricity generated from SHP will be
determined by multiplying the maximum tariff (in 2017 it was 2.24 KGS for industrial users) for
ultimate consumers by a corresponding factor: 2.1.66 In 2013 the Ministry of Energy*67 estimated
payback period for SHP projects currently is very long (in 2017 electricity price was KGS 0.77)
(Stomaliev, 2013): (a) with the tariff rate of KGS 0.7 the payback period would be over 50 years;
(b) with the tariff rate of KGS 1.26 (the payback period would be between 17 and 21 years; (c)
with the tariff rate of KGS 1.32 the payback period would be between 15 and 20 years; (d) with
the tariff rate of KGS 2.25 the payback period would be between 6 and 9 years. Current low
electricity tariffs and bad billing management of distribution companies act as a disincentive to
foreign investment (SlovakAid, 2006).68
61 Households using more than 700 kW per month would pay the weighted average of the actual internal cost of supply and the cost of
imports, in 2016 the price was 2.16 KGS. Electricity consumption in the category <700kWh/month accounts for 81 per cent of
residential consumption and 52 per cent of total end-user consumption, therefore a large part of the consumption is below the
threshold, benefitting a large proportion of consumers who do not need the subsidized tariffs and also benefitting disproportionately
large consumers. 62
Kloop (2017). Tariffs for electricity and heating will not be raised until the end of 2017. Available from:
kloop.kg/blog/2017/02/09/tarify-na-elektrichestvo-i-otoplenie-ne-budut-povyshatsya-do-kontsa-2017-goda/ 63
Akcabar (2016). In Kyrgyzstan, tariffs for electricity will remain until the end of the year. Available from:
https://www.akchabar.kg/news/v-kyrgyzstane-tarify-na-elektroenergiyu-sohranyatsya-do-konca-goda/
64 The comparatively high energy consumption is a reflection of inefficient buildings and insufficient price
incentives. 65
On a scale of 0-8, with 8 indicating total reliability of supply and transparency of the tariff, Kyrgyzstan received 0; the average in
Eastern Europe and Central Asia (EECA) was 5.2 66
Hydropower Feed in Tariff is calculated by electricity price multiplying by factor 2.1. In 2017 it was 2.24x2.1=4.704 KGS. 67
In 2015 the Ministry of Energy and Industry was abolished, with a transfer of policy making responsibilities to a new State
Committee on Industry, Energy and Subsoil Use in 2016. 68
Considering that investors are usually looking for a payback period of within 5-7 years, for a lifetime of 30 years, small hydropower
plants could be seen as a sound investment

83
Ageing infrastructure
The electricity infrastructure in the Kyrgyzstan was built in the Soviet era, when Central Asia was
treated as one region. Current infrastructure is aged and inefficient, and needs modernization.
The energy sector in 2013 had a deficit of 4.6 billion USD, which had to be covered through loans,
in 2014 it was already 6.3 billion dollars (income is 12 billion USD expenses -18.3 billion USD). In
these conditions, the investment attractiveness of the industry suffers (Ministry of Foreign Affairs
of the Kyrgyz Republic, n.d.). The sector faces frequent outages during the winter months (due to
low water flows) and a high level of loss in electricity transmission (World Bank, 2014) (UNECE,
2017). The seasonal variation of the electricity load has a ratio of 3:1 between the month of the
highest demand (January) and the lowest demand (May). Overloading the systems in order to
meet the high winter demand has accelerated the deterioration process and increased the
number of service interruptions (Ministry of Foreign Affairs of the Kyrgyz Republic, n.d.) (Jorde,
Terenteva, 2009). A range of institutional barriers, such as an unsustainable tariff subsidy regime
(discussed in the previous section), have led to a significant financial burden on public budgets,
and resulted in a serious hold-up in the modernisation and expansion of the electricity, heat and
gas systems (IEA, 2015). However, recent infrastructure works during summer 2016 reportedly
resulted in a 10 percent reduction of outages in winter (UNECE, 2017).
Transparency and accountability
The Government of Kyrgyzstan has identified lack of transparency and accountability as one of the
key problems hindering faster economic development in the country, and by extension
hydropower projects. Exercised reforms so far have not achieved their goal. Power asymmetries
marginalize the role of non-government actors that would have an interest in alternative modes
of governance. Industry experts believe that only 15 percent of the electricity losses are technical
in nature; the rest of the missing volume reportedly went to generate electricity that was illegally
sold abroad (Marat, 2015).
Climate Change
It is recognized that the observed temperature has risen twice as fast in Central Asia as compared
to global levels since the 1970s (German Advisory Council on Global Change (WBGU), 2007).
Climate change is very evident in Central Asia, through the melting of the Tien Shan glaciers,
which are influencing hydropower potential. Scientists have observed that even in the most
glacier-friendly scenario, glaciers will lose up to two thirds (−60 per cent) of their 1955 mass by
the end of the 21st century, while in 2012 already 27 per cent has been lost (Sorg, Huss, Rohrer,
Stoffel, 2014) (Zhupankhan, Tussupova, Berndtsson 2017). The Government has already identified
the negative impacts on water resources as one of the most severe climate change risks for
Kyrgyzstan, and adaptation measures are important to secure safe and sufficient water resources
for their consumers within the country and its neighbouring states (GoK, 2009).

84
3. Obstacles facing Kyrgyz firms
The second chapter identified three key ‘strategic’ manufacturing industries in Kyrgyzstan with a
high potential for growth and employment creation, namely the food and beverages industry, the
textiles industry and the wearing apparel industry. All three industries were, however, shown to
underperform and lag well behind comparable industries in countries with similar income levels.
This naturally calls for the need to identify key underlying factors, which hinder growth and
employment creation in these three industries.
This chapter takes a closer look at the firm-level and sheds light on the key obstacles, which keep
Kyrgyz firms in the three strategic industries from fully exploiting their inclusive growth potentials
and therefore warrant attention and intervention. In particular, it identifies several general and
industry-specific obstacles, which are either embedded in the external market conditions of firms
or lie in the firm’s internal organisation.
In view of this, Section 3.1 establishes the profiles of the three strategic industries as a backdrop
for the ensuing firm-based analysis, while Section 3.2 conducts a thorough firm-level analysis. In
particular, section 3.2.1 establishes performance and profitability differences between Kyrgyz
firms in the three strategic industries and similar firms in benchmark countries. Section 3.2.2
sheds light on some of the key determinants of firm performance and success, which warrant
further attention and policy intervention. Section 3.2.3 discusses key general and industry-specific
obstacles, which keep Kyrgyz firms in the three industries from fully exploiting their growth
potential and acting as engines of economic and formal employment growth.
3.1. Industry profiles
3.1.1. Agro-processing and the food and beverages industry
The agro-industry and value chains
Kyrgyzstan’s economy is dominated by agriculture, which accounts for about 15% of GDP and 30%
of the labour force (FAO, 2015). However, agricultural value chains remain underdeveloped in the
country, with an estimated three-quarters of the people living in poverty and four-fifths in
extreme poverty residing in rural areas (FAO, 2015), with females and young people especially
vulnerable.
In Kyrgyzstan, over 75% of agricultural holdings are cultivated by small-scale farmers.
Traditionally, the productive capacity of the agri-sector in the country has been hindered by low
production volumes, a lack of permanent buyers and low levels of knowledge and skills in
agricultural technology and marketing techniques (Kaseeva, 2013). Error! Reference source not
found. below, utilizing FAO figures on the type of farm holdings in Kyrgyzstan, illustrates the
extent to which the sector is dominated by subsistence/micro operators.

85
Table 3.1: Overview of Kyrgyz Farm Structures in 2012
Farm Categories Quantity Arable Land in
Hectares
Arable Land as a
Percentage of Total
Holdings
Average Farm
Size
State Farms, Land Redistribution Fund and Collective Farms
621 298,700 23.4 481
Peasant Farms and Individual Entrepreneurs 344,492 891,800 69.9 2.6
Kitchen Gardens and Household Orchards 733,909 71,100 5.6 0.1
Arable Land owned by Processors, Protected
Areas, Forest Fund, Water Fund and Reserves
- 14,300 1.1 -
Total 1,079,013 1,275,900 100 1.2
Source: Kaseeva, 2013 (according to the National Statistical Committee).
Previous studies of the sector have identified a number of obstacles to realizing productive value
chain in the Kyrgyzstani agro-industrial sector. One issue is a fundamental lack of trust between
farmers and processors, with many agro-enterprises preferring to operate through intermediaries
or procurers, who collect produce from small holdings and sell it in bulk to enterprises or larger-
scale farmers. Many processors also typically prefer to work with cooperatives and major
suppliers in order to avoid red-tape (Kaseeva, 2013).
Small farmers have also been hitherto reluctant to join associations or cooperatives, and until
recently were rarely the target of government subsidies or support. A mobilization of these actors
would have several benefits, in terms of organization of product supplies, facilitating the
purchasing process and delivery of agricultural goods (Kaseeva, 2013). Small holders often
complain of issues in marketing their produce while processors and traders usually cite a lack of
raw materials as their main impediment. The small number of successful and active agri-value
chains in the country have often led by foreign, large scale operators, who are capable of “pulling”
the entire chain and driving cooperation through purchasing of products, rather than farmers
attempting to “drag” the supply chain from the bottom (Ibid).
Agricultural processing is also considered to be underdeveloped in Kyrgyzstan as it requires
significant financial investments (processing equipment/machineries, storage space), highly
qualified human resources and bridging connections with suppliers and various agro associations,
capacities which are often scarce within Kyrgyzstani agriculture. Considering the mountainous
topography of the country, the geographic location of processing companies may also pose
difficulties in some regions. A somewhat opaque business environment also causes some issues
for investors in terms of pricing, quality, volumes and locations of produce (The Microfinancing
Centre, 2011, p.11). Broadly speaking, Kyrgyz agriculture also suffers from a number of structural
impediments which prevent greater value addition, including:
• A lack of integration in regional value chains;

86
• Insufficient training in production and processing techniques, leading to losses and
inefficiencies;
• Difficulties in accessing market channels and a poor understanding of customer needs and requirements at the export and national markets;
• Lack of access to finance despite the relatively low investment requirements to develop
an agricultural business;
• Inappropriate technologies and facilities leading to production spoilage and poor product
quality and safety;
• Inability to ensure constant volume of deliveries at the request of the buyer and the seasonal nature of supply;
• Significant loss of production volumes for transportation due to lack of primary
processing of products (UNIDO, 2012).
Yet the Kyrgyz agricultural sector does also exhibit a number of promising factors overall,
including its recent accession to the nascent Eurasian Economic Union, which may help
strengthen intergration within regional value chains, its comparatively low cost-base for
production, and comparative advantages in some sectors, such as a positive reputation for
traditional agri- goods and crafts. In this vein, the Kyrgyz Government recently announced that it
expects agricultural exports in 2017 to climb from 450 thousand tons to 500 thousand tons
(Kabar, 2017). Moreover, the Association of Food Industries (AFIE), founded in the mid-2000s, has
managed to act as a focal point for actors in the food industry, and is active in marketing
Kyrgyzstan’s produce outside its borders. There are, thus, some positive trends which can be
further harnessed should productive capacities be increased in agriculture.
As one can observe from Table 3.2, meat and dairy products make up the greatest proportion of
the agri-sector’s production, most of which is either consumed on a subsistance basis, or is sold
through vendors for little profit.
Table 3.2 Agricultural produce of the Kyrgyz Republic 2008-2015 (tonns)
Krygyz Republic 2008 2009 2010 2011 2012 2013 2014 2015
Grain 648,608 747,228 702,052 915,728 552,303 718,542 611,851 847,573
Raw Cotton 94,578 49,669 73,890 100,024 83,594 65,090 67,385 43,431
Tobacco 13,314 11,370 8,328 9,043 7,284 6,316 4,149 1,122
Potatoes 648,449 641,145 584,729 492,292 423,047 673,079 545,956 608,674
Vegetables 449,805 438,222 492,857 644,621 506,286 519,629 569,934 791,150
Melon fields 118,068 108,262 135,958 134,018 167,335 187,574 194,874 230,194
Plodovoyagodny
Cultures
121,928 119,833 119,400 135,307 151,656 169,539 150,677 153,189
Grapes 5,095 5,865 1,513 4,302 4,953 5,131 2,866 3,758
Meat (in live weight) 211,456 226,687 198,273 227,395 239,885 245,788 259,117 259,614
Milk 662,382 711,689 837,065 888,958 809,048 963,527 1,054,906 1,063,054
Eggs (per million) 264,064 150,798 267,721 286,335 285,163 314,459 297,914 353,251
Wool (in physical
weight)
3,650 4,731 7,297 6,986 7,123 6,576 7,294 6,856
Source: National Statistical Committee of the Kyrgyz Republic, 2017

87
The agricultural sector is also characterised by weak linkages between suppliers and producers
domestically. The privatization of land holdings following independence in 1991 resulted in the
creation of a very large number of small private farms (estimated to comprise over 300,000
smallholder farmers with an average farm size of about three hectares), sharing an estimated 80-
95 per cent of total agricultural production (National Institute for Strategic Studies of the Kyrgyz
Republic, 2014). Agricultural goods are often exported in their raw state or unprocessed and thus
the opportunity to add value domestically through intermediate activities is lost.
The following is a brief overview as to production trends and some of the challenges to, and
opportunities for, agricultural value chains in Kyrgyzstan in various sub-sectors.
Dairy farming
Small-scale farming dominates the dairy sector, with few cooperatives and middle men often
selling raw milk to local processors. Cow’s milk is the most significant output, reaching an average
of 9 million USD of exports per annum in the period 2006-2016, though horse’s milk is also sold
for its healthgiving properties. Most of the milk and dairy products produced are for local
consumption, with approximately one-quarter produced for processing or export. Out of an
estimated 390 enterprises in Krygyzstan, 90% of output is thought to be accounted for by a few
large operators (UNIDO, 2016). This is thought to keep prices for some dairy products (and agri-
products generally) artificially high for consumers, allied to a high level of informality within the
sector. So, while consolidation within a sector often brings benefits in terms of overall production
levels, downside effects can occur in the absence of effective regulatory oversight, strong
competition laws and quality controls.
Pasture land is estimated to comprise roughly 87% of agricultural holdings, yet the market for
Kyrgyz meat products is considered to be relatively undeveloped, primarily owing to a heavy
dependence on foreign-sourced raw materials and other ingrediants needed for processing
(UNIDO, 2016). Moreover, the level of knowledge of animal husbandry techniques is often low,
accompanied by some outdated technology for dairy processes. Skilled expertise in associated
disciplines, such as agro-economists, stockbreeders, food scientists etc. are in relatively short
supply in Kyrgyzstan, as are tertiary education courses for upskilling and knowledge dissemination
in the dairy sector (Microfinancing Centre, 2011).
Since Kyrgyzstan became a member of the Eurasian Economic Union, it is estimated to have
exported over 130 million USD in milk products, particularly to Kazakhstan. However, the vast
majority of this total is believed to have been through informal channels (World Bank, 2015) due
to the difficulties of Kyrgyz farmers in meeting international standards. While milk exports
comprise one of the top five agricultural exports in the country, few dairy farmers think of that
occupation as their primary employment, leading to lower standards in terms of animal
husbandry. The average herd size is thus around three to five heads of cattle (World Bank, 2015).
There is thus much potential for a professionalization of the dairy sector, beginning with
standardization measures at the level of small farmers and moving up through the value chain,
88
increasing the capacities of cooperatives, traders and dairy marts. It is only through an integrated
approach that Kyrgyzstan can capitalize on the export potential in the sector, moving away from
subsistence-level production.
Though the dairy farming industry shows some of the best prospects for growth, an analysis
conducted by UNIDO experts has identified a number of barriers preventing greater productivity
in this sector. Such factors include:
• A lack of professionalization in the dairy sector;
• Low levels of animal maintenance and husbandry techniques;
• Low yields in dairy farming;
• Low levels of knowledge and access to veterinary medicine and curative medications.
• Moreover, previous external analyses have also cited some further impediments in this
regard, including a lack of integration of Kyrgyz farmers into modern supply chains, with
the majority of (often unprocessed) food stuffs usually sold at bazaars or open markets;
an unstable macro-economic and political climate; an unreliable judicial system; a lack of
FDI; and the preponderance of small holdings all serve to constraint prospects for
integration in regional supply chains (FAO, 2015).
Fisheries
In terms of fisheries, Kyrgyzstan has seen significantly diminished capacity in recent decades,
principally due to the break up of some of the large Soviet-era collectives which dominated
output during the twentieth century. There was a large loss of institutional capacity following the
dissolution of the Soviet Union, which led to heightened job insecurity in fisheries and rupturing
of supply chains (Thorpe et al., 2009). Some estimates posit that the capacity of the fisheries
sector was, recently, ten per cent of that before the dissolution of the Soviet Union (Merco Press,
2009). FAO figures seem to verify this precipituous fall in production, with the annual haul
declining from 1,400 tons in 1991-92 to 100-140 tons in 2008-9 (FAO, 2014).
Indigenous fishery production too faces a number of issues in Kyrgyzstan, especially in terms of
allowing fishermen to join value chains. In the post-Soviet era, Kyrgyz fisheries were bedevilled by
a number of structural barriers to value addition, including:
• A lack of suitable fish seed, which depressed yields significantly. Even today, this
continues to present a problem, to a lesser extent (UNIDO, 2017).
• Until recently, there were also restrictive fishing laws due to environmental concerns,
including a moratorium on fishing in Issyk-Kul lake and a ban on fishing whitefish and
trout from 2003, which lead to a substantial degree of poaching (it is thought that for this
reason, domestic supermarkets often import fish rather than trading with local operators)
(FAO , 2013).
• Fish farmers often lack sustainable relationships with buyers, which hampers their ability
to expand their operations.

89
• There is also a shortage of skills, technologies and expertise in some quarters to transition
to higher value added activities (FAO, 2013).
• Local consumption of fish is also low relative to global norms (at approximately 1kg per
capita as opposed to 16.5 kg globally) (UNIDO, 2016).
At present, commercial fish products in Kyrgyzstan are predominantly processed, sold either
frozen, thawed or fresh. The market is in the early stage of its life cycle, with little competition or
product diversification in the market at present (UNIDO, 2016). Moreover, it seems that
restaurants are often reluctant to purchase locally, citing some concerns over the provenance of
locally-sourced catch.
The fish market within the country is more consolidated than that of dairy farming, with two large
associations comprising 53 enterprises, of which 45 are engaged solely in fish production, with an
additional 3 also involved in fish processing, while two companies concentrate on feed and
equipment. The more integrated nature of labour in this sector offers better prospects for a more
accelerated upscaling of activities, given adequate assistance and support.
Even allowing for some of the structural obstacles to Kyrgyz exports, the picture has improved
somewhat in recent years. In 2014, production increased some 23% to 805 tons, while marketable
fish production increased to 1,100 tons in 2015 (UNIDO, 2017). The Government has also
announced an end to the moratorium on fishing in some of the country’s lakes, which should
prove beneficial in terms of reducing poaching, though it is still somewhat unclear what form the
future regulation will take.
Fruit and Vegetables
The fruit and vegetable sector is one of Kyrgzstan’s largest processing sectors, bearing 35
companies and 91 entrepreneurs (Ibid). The main food crops grown are wheat, barley, maize,
potatoes, vegetables and fruits, while sugar beet, cotton and tobacco are the most remunerative
crops. Yet the market value for this sector is considered to be reasonably small, given the small
population of the country (6.1 million), the tendency of rural populations to home produce fruit
and vegetables, traditions of conserving food for winter, and the relatively low purchasing power
of the Kyrgyz population at large (Helvetas Kyrgyzstan, 2004). Vegetable exports made up 5.12%
of Kyrgyz exports in 2015, while other food products comprised an additional 3.15% (World
Integrated Trade Solution, 2017).
The Kyrgyzstani fruit and vegetable industry suffers from some similar travails to the sub-sectors
previously discussed in this chapter, despite indigenous produce generally being considered to be
good quality. The country has limited arable land, with over 90% of its territory being 1,000
metres or more above sea level, and 40% above 3,000 metres (FAO, 2012). Semi-finished goods
such as juices, jams, tomato and fruit pastes, as well as dried vegetables, apricots and spices
provide most of the country’s exports in this sector. Quality management and product placement
are also often an issue: local fruit and vegetable companies have often found it difficult to
compete with imported products in local shops due to concerns on standardization and product
certification (Helvetas Kyrgyzstan, 2004). Further difficulties to the growth of this export sector

90
include irregular supplies and a reluctance to sell goods on credit to potential buyers (Helvetas
Kyrgyzstan, 2004). On the demand side, shop owners are also often reluctant to sell local goods
due to issues with trade requirements and service (Helvetas Kyrgyzstan, 2004).
The main underlying issue, which arguably causes most of the issues referenced immediately
above, is insufficient linkages between farmers and processors/traders. This has the effect of
creating a disjointed eco-system in the fruit and vegetable sector, whereby seed providers,
fertilizer suppliers, raw material producers, accessory and packaging providers, processors,
wholesalers and retailers can act independently of each other. This is sub-optimal on both sides,
as small farmers lack the credit and knowledge to improve their produce and yields, whereas
enterprises and processors struggle to distribute and promote agricultural outputs (Helvetas
Kyrgyzstan, 2004).
The case of the potato industry may be illustrative in terms of some of the issues faced by crop
producers in Kyrgyzstan. Production of potatoes comprises almost 60% of the domestic yield for
fruits and vegetables. However, negligible processing takes place within the country’s borders:
typically, middle men take unprocessed stocks and distribute them domestically and regionally,
keeping prices artificially high. It also results in little wealth creation for farmers, given the export
of potatoes to Russia, Kazakhstan and Uzbekistan, where they are processed into other foodstuffs
(UNIDO, 2016). Furthermore, in terms of food safety, few Kyrgyzstani inspectors are up-to-date
with regard to food technology, microbiology or product manufacturing techniques to meet
international standards, an important consideration in increasingly globalized food markets
(Government of the Kyrgyz Republic, 2014b).
A favourable climate for berries, particularly sea buckthorn, has resulted in cottage industries for
herbal plants, jams and jellies, and alternative medicines. Walnuts have been identified as
particularly promising in terms of export potential, with average yields of between 800 and 3000
tons per annum (Ibid). It is noteworthy that in the few cases of sustainable agro-value chains in
the country, the presence of a large multinational (in the case of walnuts, Agroplast of Germany)
has stimulated the development of the chain to include a cooperative, a local exporter and an
international importer (Kaseeva, 2013). Outside expertise, be it through the private sector or from
international development agencies, is thus desirable in terms of accelerating the integration of
such value chains.
However, considerable obstacles continue to exist for both farmers and processors in terms of
thefruit and vegetable sector, most notably:
• Small production yields;
• A lack of trust between producers;
• Outdated equipment;
• A lack of reliable information for investors and a lack of knowledge for crop production;
• Lack of access to financing;

91
• Underdeveloped logistics’ systems and issues with meeting international quality
standards, such as ISO 22000 and HACCP;
• Little control and traceability within some existing value chains (UNECE and GIZ, 2015).
Size and performance of the food and beverages industry
In the Kyrgyz manufacturing sector, the food and beverages industry – which builds on the various
agro-food value chains – plays a key role in terms of production, employment and exports. In
2015, it accounted for 16% of total manufacturing production and therefore ranked second,
behind the very dominant basic metals and fabricated metal industry, which accounted for 58% of
total manufacturing production (Figure 3-1). This, however, stands in stark contrast to its
fundamental importance in terms of employment. In 2015, the food and beverages industry
accounted for 22% of total manufacturing employment, which made it the second most important
employer in the manufacturing sector. Furthermore, a part of the industry’s output is exported. In
2015, the food and beverages industry accounted for 5% of total manufacturing exports, which
made it the fifth largest exporter in total manufacturing. Generally, however, exports are
dominated by the basic metals and fabricated metal industry with an export share of almost 60%.
Figure 3-1: Nominal production, employment and exports (as share in total manufacturing), 2015
Source: National Statistical Committee of the Kyrgyz Republic, UN COMTRADE.
Over the last couple of years, the food and beverages industry went through a process of change.
Official figures show a clear upward trend in nominal production, which doubled from around 232
16%
4%
5%
12%58%
22%
41%
1%
13%
9%
5%7%
6%
4%
59%
Production (2015) Employment (2015) Exports (2015)
Food Textiles Wood Petroleum Chemicals
Pharmeceuticals Rubber, plastic, minerals Metals Electronics Electrical equ.
Machinery Transport equ. Other

92
million US-$ in 2006 to 463 million US-$ in 2014 (Panel A of Figure 3-2). The pronounced decline in
nominal production (expressed in US dollar terms) observable in 2015 was the result of the strong
devaluation of the Kyrgyz Som relative to the US Dollar.69 In contrast, employment in the food and
beverages industry followed a clear downward trend and dropped by around 17% between 2006
and 2015. The loss in employment was particularly strong between 2007 and 2009, which
coincided with the global financial crisis. Similarly, exports also declined between 2006 and 2015.
After an initial increase between 2006 and 2008, they continuously fell (by around 30%) between
2008 and 2015.
In general, the food and beverages industry outperformed the manufacturing sector as a whole in
terms of labour productivity (Panel B of Figure 3-2). While labour productivity in the
manufacturing sector started to decline in 2008, labour productivity in the food and beverages
industry – which was already relatively high - continued to increase until 2009, bevor it levelled
off and stagnated at around 4,000 US-$. As a result, since 2008, the positive gap in labour
productivity between the food and beverages industry and the manufacturing sector as a whole
has been widening. On the contrary, average monthly wages in the food and beverages industry
remained generally low and only amounted to half of those paid in the manufacturing sector as a
whole – despite observable labour productivity improvements in the food and beverages industry.
Again, the pronounced declines in wages observable for 2015 were the result of the strong
devaluation of the Kyrgyz Som relative to the US Dollar.
69 The economic crisis in Russia and the related sharp drop in Kyrgyz exports and remittances contributed strongly to the depreciation
of the Kyrgyz Som.

93
Figure 3-2: Development of nominal production, exports, employment (Panel A) and wages and labour productivity
(Panel B) in the food and beverages industry, 2006-2015
Note: In Panel B, Manuf refers to the Manufacturing sector.
Source: National Statistical Committee of the Kyrgyz Republic, UN COMTRADE.
Firm-size structure and degree of informality
The Kyrgyz food and beverages industry is dominated by small enterprises (i.e. enterprises with
less than 51 employees) (Table 3.3). However, compared to the manufacturing sector as a whole,
the share of small enterprises is lower by about 10 percentage points. In 2006, the food and
beverages industry officially comprised 483 enterprises, of which around 61% - or a total of 294
enterprises – were small. Following a sharp but temporary decline in 2012, the share of small
enterprises again increased to almost 79% in 2015.
Table 3.3:Share of small firms, 2006-2015
ISIC Rev.
3.1 Industry 2006 2007 2008 2009 2010 2011 2012 2013 2014 2015
15-37 Manufacturing 70.9 70.7 73.3 74.2 60.8 60.7 35.9 58.5 61.9 87.4
15 Food and beverages 60.9 59.4 63.3 64.6 49.0 51.1 28.5 44.7 50.3 78.5
Source: National Statistical Committee of the Kyrgyz Republic.
20
21
22
23
24
25
Em
ploy
me
nt (
1,0
00)
100
200
300
400
500
Pro
duct
ion,
Exp
orts
(M
io U
S-$
)
2006
2007
2008
2009
2010
2011
2012
2013
2014
2015
Years
Production Exports Employment
Panel A
0
1000
2000
3000
4000
5000
Rea
l lab
our
pro
duct
ivity
(U
S-$
)
0
100
200
300
400
Ave
rag
e m
onth
ly w
age
s (U
S-$
)
200
6
200
7
200
8
200
9
201
0
201
1
201
2
201
3
201
4
201
5
Years
Wages Wages (Manuf)
Labour productivity Labour productivity (Manuf)
Panel B

94
Moreover, the degree of informality in the food and beverages industry is the second highest
(Table 3.4), after the wearing apparel industry (see Table 3.6 below).
Table 3.4: Total (formal and informal) employment (2014-2016) and the degree of informality (2014)
ISIC Rev. 3.1
Industry Formal* 2014
Formal & informal
2014
Formal & informal
2015
Formal & informal
2016
Degree of informality in
2014 (%) 15 Food and beverages 11,147 19,585 20,133 19,791 43.1
Source: National Statistical Committee of the Kyrgyz Republic and * UNIDO database.
3.1.2. The textiles and wearing apparel industry
The textile and wearing apparel industry and value chains
Globally, the garments industry has generally been growing strongly in the last decade or so, with
an aggregate growth of 33 billion USD between 2008 and 2012, for example, and a projected
global value of 1.56 trillion USD by 2017 (OECD, 2014). Yet textiles, clothing and leather
production cumulatively are thought to have comprised just 3.3% of Kyrgyz GDP in 2014 (State
Committee of Industry, Energy and Subsoil Use of the Kyrgyz Republic, 2017). Historically, the
Kyrgyz textiles industry and wearing apparel industry emerged during the Soviet times and date
back to the 1930s. Before the collapse of the Soviet Union and Kyrgyz Independence in 1991, the
textile and wearing apparel industries constituted a well-integrated value chain. The wearing
apparel industry consisted of 10 large factories, while the textile industry comprised mainly
medium-sized and large enterprises, which sourced raw materials, such as cotton or wool, from
South Kyrgyzstan and produced wool, cotton, and silk fabrics as raw inputs for garment
production (ILO, 2012).
However, with the collapse of the Soviet Union and the accompanying disruption of key economic
links, the ensuing general economic collapse also manifested in the textiles and wearing apparel
industry, as output collapsed, employment dropped and the value chain disintegrated.
The share of national production accounted for by various textile sub-sectors fell dramatically in
many areas. A number of factors are attributable to this, chief among them being agricultural
issues and a reputation of low quality for some locally-produced textiles. In terms of value chains,
it is noticeable that even today, over 90% of raw cotton sourced in Kyrgyzstan is exported directly
to China (Ibid). As the price of cotton is somewhat volatile, farmers are disinclined to update seed
stocks, and Kyrgyz producers face competition from neighbouring Uzbekistan, where the industry
receives government assistance (Ibid). Thus, value chains in the cotton industry remain severely
under developed, with neglible value added within the country’s borders.
Moreover, there are significant obstacles to sourcing other raw materials for garment production
in the country. Since 2010, the agricultural suppliers for woollen garments almost completely
reoriented their activities to the release of semi-coarse, coarse, and semi-fine wool. Of the total

95
volume of wool cut in recent years, the share of fine merino wool is 20-25%. Local producers can
thus only avail of very small reserves of fine merino wool (State Committee of Industry, Energy
and Subsoil Use of the Kyrgyz Republic, 2017).
In general, it has become unprofitable for farmers to develop merino sheep breeding, which is not
a focus of public support. It is much more profitable for them to expand coarse-wool sheep
breeding, where it is possible to get greater wool that is in high demand, and due to the fact that
it is less troublesome than fine-fleece, which requires special care and support for breeding. It
should also be noted that over the years, the quality of the processed wool deteriorated. The
deterioration of the quality of wool affected the quality of woollen yarn for knitwear enterprises,
in turn affecting the competitiveness of knitted clothes (Ibid).
In the face of these developments, today there are currently few local upstream raw materials
and fabrics manufacturers so that garments producers predominantly source inputs from abroad,
mainly from China. The majority of textile enterprises in Kyrgyzstan are small operators, with a
very significant informal presence in the sector. Following political disturbances in 2010, many
foreign investors left the Kyrgyz market. An estimated 95% of exports in the sector go to either
the Russian Federation or Kazakhstan, while 90% of products are exported via logistics agents.
The remaining 10% are sold on through bazaars in the main cities, Bishkek and Osh (Birkman et
al., 2012).
In contrast, in spite of these difficulties, overall the garment production sector of the economy
has picked up in recent years, particularly in terms of trade between Kyrgyzstan and Russia. For
example, in 2013 alone, this bilateral trade was worth 156 million USD alone, representing 9.6%
of total exports (UNCTAD, 2016).
A large proportion of this recent upswing has been accounted for by the domestic sewing
industry, which employs approximately 150,000 people, the majority of which work in Micro,
Small and Medium Enterprises (MSMEs). However, a note of caution must be sounded in this
regard, as due to the rather disproportionate scale of the shadow economy within the country, it
is difficult to confirm the relevant statistics with absolute certainty. The OECD’s Country Capability
Survey (2013) found that 76% of Kyrgyz clothing producers had 15 employees or less, 20% had
between 16 and 50 employees and just 4% had over 50 employees (OECD, 2014). Its low cost base
and a flexible system of labour remuneration have allowed it to achieve significant export growth
in Russian and Central Asian markets. However, there are still significant impediments to its
further growth, including low-quality raw materials and technology, low levels of qualified
employees and insufficient access to credit (State Committee of Industry, Energy and Subsoil Use,
2017). Furthermore, competition from South-East Asia (principally China, Bangladesh, Viet Nam
and Indonesia) have thus far acted as a disincentive to foreign garment operators from investing
in the country, hindering the scope to diversify production.

96
It is expected that Kyrgyzstan’s recent accession into the Eurasian Economic Union70, which
promises to remove tariff and non-tariff barriers to regional trade, should act as a stimulus in the
long-term. Kyrgyz textile products are predominantly exported to five countries: the top partner
countries in 2015 included Kazakhstan, Russian Federation, Turkey, China and Vietnam (World
Bank, 2017a).
Yet Kyrgyzstan still exhibits a number of comparative advantages in terms of its textile industry, at
least relative to its near neighbours in the Eurasian Economic Union. Firstly, the costs of
production in the country are significantly lower in Kyrgyzstan (particularly relative to
Kazakhstan), though it must also be borne in mind that the cost of production is lower still in
some ASEAN countries (World Bank, 2017a). Electricity costs and labour costs are deemed to be
low, with a monthly average wage of 150-500 USD in the textile industry, even allowing for a
relatively low level of productivity (UNCTAD, 2016).
Moreover, the longstanding tradition and skills inherited by many Kyrgyz garment SMEs, and their
familiarity with EEU markets, are also comparative advantages which may be drawn upon to
maintain strong export growth, especially given that tariff barriers have been imposed on trade
with non-EEU states such as China since Kyrgyzstan’s accession to the Union in 2015 (UNCTAD,
2016).
However, there continues to exist a number of structural issues which impede the process of
transitioning to higher value added activities in Kyrgyzstan. These include:
• A relatively low level of FDI in the sector;
• Limited sourcing options for yarns, fabrics and accessories;
• A lack of fixed capital investment to modernize technology;
• A lack of compliance with international quality standards (UNCTAD, 2016).
Size and performance of the textiles and wearing apparel industry
The Kyrgyz textiles and wearing apparel industry plays a non-negligible role in the overall
manufacturing sector. In 2015, it was of moderate importance and only accounted for 4% of total
manufacturing production, which still made it the fourth most important manufacturing industry
in terms of production, just behind the coke and refined petroleum industry (which ranked third,
with 5%) (Figure 3-1). However, with a share of 41%, the textiles and wearing apparel industry
was the single most important employer within the manufacturing sector. With around 7% of
total manufacturing exports, the textiles and wearing apparel industry was the third largest
manufacturing exporter in 2015, just behind the basic metals and fabricated metal industry (with
almost 60%) and the transport equipment industry (with around 8%).
70 The member countries of the EEU include the Russian Federation; Belarus; Kazakhstan; Kyrgyzstan; and Armenia.

97
Between 2006 and 2012, the industry underwent some significant changes. For instance, nominal
production in the textiles and wearing apparel industry increased markedly and almost doubled
from 118 million US-$ in 2006 to 204 million US-$ in 2012 (Panel A of Figure 3-3). However, after
2012, production collapsed and even dropped below the initial 2006 production level. Similarly to
production, exports continuously rose (with the exception of a short-term dip in 2009) and
increased by around 20% between 2006 and 2012. However, after 2012, exports collapsed and by
2015 almost fell below the initial 2006 level. In contrast to both production and exports, the
(formal) employment in the textiles and wearing apparel industry continuously declined
throughout the entire period: it dropped by 81% from around 200,000 in 2006 to around 38,000
in 2015, which was likely the result of substantial movement of employment into the informal
sector.
Figure 3-3: Development of nominal production, exports, employment (Panel A) and wages and labour productivity
(Panel B) in the textiles and wearing apparel industry, 2006-2015
Note: In Panel B, M refers to the Manufacturing sector, T to the textiles and WA to the wearing apparel industries.
Source: National Statistical Committee of the Kyrgyz Republic, UN COMTRADE and UNIDO database.
Furthermore, the Kyrgyz textile and wearing apparel industry is characterised by comparatively
low but over time increasing average monthly wages (Panel B of Figure 3-3). In 2006, average
monthly wages were low and only constituted a third of those paid in the manufacturing sector as
a whole. And while they almost tripled in US dollar terms between 2006 and 2014, the gap
between wages paid in the manufacturing sector and those paid in the textile and wearing
0
50
100
150
200
Em
ploy
me
nt (
1,0
00)
50
100
150
200
Pro
duct
ion,
Exp
orts
(M
io U
S-$
)
2006
2007
2008
2009
2010
2011
2012
2013
2014
2015
Years
Production Exports Employment
Panel A
0
5000
10000
15000
20000
25000
30000
Rea
l lab
our
pro
duct
ivity
(U
S-$
)
0
100
200
300
400
Ave
rage
mo
nthl
y w
age
s (U
S-$
)
2006
2007
2008
2009
2010
2011
2012
2013
2014
2015
Years
Wages Wages (M)
Labour productivity (T) Labour productivity (M)
Labour productivity (WA)
Panel B
98
apparel industry failed to narrow. Unlike wages, labour productivity in the textiles and especially
wearing apparel industries has been consistently higher than in the manufacturing sector as a
whole. In 2006, labour productivity in the textiles and wearing apparel industries was almost
twice and four times higher, respectively, than in the manufacturing sector as a whole.
Furthermore, due to strong labour productivity improvements in both industries – particularly in
the wearing apparel industry – the gap between these two industries and the manufacturing
sector as a whole broadened significantly between 2009 and 2012.

99
Firm-size structure and degree of informality
The Kyrgyz textiles and wearing apparel industry is strongly dominated by small enterprises (Table
3.5). The underrepresentation of medium and large enterprises may be the result of the
considerably more difficult regulatory environment and the higher cost and administrative burden
associated with meeting all necessary requirements (ADB, 2013a). In 2006, the textiles and
wearing apparel industry officially comprised 171 enterprises, of which almost 80% - or a total of
135 enterprises – were small. Following a decline in 2012, the share of small enterprises rose
again and reached around 87% in 2015.
Table 3.5: Share of small firms, 2006-2015
ISIC
Rev. 3.1 Industry 2006 2007 2008 2009 2010 2011 2012 2013 2014 2015
15-37 Manufacturing 70.9 70.7 73.3 74.2 60.8 60.7 35.9 58.5 61.9 87.4
17-18 Textiles, wearing apparel 78.9 80.7 78.0 77.3 67.3 61.7 35.0 56.2 57.4 86.8
Source: National Statistical Committee of the Kyrgyz Republic.
Furthermore, with only around 28% in 2014, the degree of informality in the textiles industry was
moderate and only half as high as in the manufacturing sector as a whole (Table 3.6). This is likely
the result of the relatively high capital intensity of production in the textiles industry, which
generates a non-negligible entry barrier for resource- and capital-deficient informal firms. In
contrast, the wearing apparel industry is characterized by an extreme degree of informality. In
2014, around 97% of total employment in the industry was informal, which made it the industry
with the highest level of informality in Kyrgyz manufacturing. In the wearing apparel industry, low
entry barriers facilitate informality since production requires relatively little capital and with low
monthly rents vacant factories can be rented and equipped with affordable machinery. For
instance, in the sewing industry, sewing machines can be bought at 250 US-$, and a production
line of only 5 sewing machines already allows for operation.
Table 3.6: Total (formal and informal) employment (2014-2016) and degree of informality (2014)
ISIC Rev.
3.1 Industry
Formal*
2014
Formal & informal
2014
Formal & informal
2015
Formal & informal
2016
Degree of informality in
2014 (%)
15-37 Manufacturing 41,491 92,173 96,441 86,793 55.0
17 Textiles 1,544 2,146 2,415 1,832 28.1
18 Wearing apparel, fur 975 33,325 34,771 26,453 97.1
Source: National Statistical Committee of the Kyrgyz Republic and *UNIDO database.

100
3.2. Firm-level analysis
In what follows, a detailed firm-level analysis is conducted which relies on three key data sources:
First, it exploits firm-level information contained in the Enterprise Survey (ES), which is a joint
initiative of the World Bank (WB) and the European Bank for Reconstruction and Development
(EBRD). Enterprise Surveys are conducted by means of face‐to‐face interviews with managers,
owners or directors of establishments on a three‐ to four‐year rotation. They collect information
on the quality of individual firms’ business environment, how it is perceived by them and how it
changes over time, identifying various constraints or obstacles to firm performance and growth
and capturing the effects of a country’s business environment on firms’ international
competitiveness. It focuses on the formal private, non-agricultural sector of an economy. For the
ensuing analysis, the last two ES-surveys are used, namely ES-2009 and ES-2013, which refer to
fiscal year 2007 and 2011, respectively.
Second, it uses information from stakeholder interviews in the three strategic industries, which
were conducted during a field mission between October 7 and 12, 2017 in the Bishkek area and its
vicinity to collect additional information of relevance.
Finally, whenever necessary, additional secondary sources were used for the sake of
completeness.
Methodologically, the analysis relies on country-benchmarking and uses other countries as
comparators to tease out, and potentially explain, apparent differences and identify key obstacles
to firms’ growth and competitiveness. In particular, the following main benchmark countries are
used: Cambodia (KHM), the People’s Democratic Republic of Laos (LAO) and Vietnam (VNM),
which are all Low-Middle Income Countries and have similar income levels as Kyrgyzstan, but, in
contrast to Kyrgyzstan, have successful textiles and wearing apparel industries. Another
benchmark country is Moldova (MDA), which is a landlocked Low-Middle Income Country and
geographically and economically similar to Kyrgyzstan, but has a more successful food and
beverages industry. Finally, due to the common economic history as former country of the Soviet
Union and as one major export destination of Kyrgyz products, neighbouring Kazakhstan (KAZ) is
also included in the analysis.
3.2.1. Economic performance of Kyrgyz firms in international comparison
Previous chapters have emphasised the rather disappointing performance not only of the Kyrgyz
manufacturing sector as a whole but also of the three strategic industries, which stay well behind
their performance and inclusive growth potentials. Similar performance deficiencies also
materialise at the firm-level, which becomes particularly obvious when compared to similar firms
in the more successful industries of the benchmark countries.
Higher labour costs and inferior performance of small Kyrgyz firms. In order to determine the
relative performance of small Kyrgyz firms, they are compared with small firms in the same
industry of the benchmark country (that is Moldova for the food and beverages industry, Laos for
the textiles industry and Vietnam for the wearing apparel industry) with similar legal status,

101
ownership structure, age and export intensity. Due to the lack of sufficient data for small Kyrgyz
textiles firms, the benchmarking analysis for the textiles industry is based on large firms instead.
The cost structure of small Kyrgyz firms – captured in terms of the share of raw materials, fuel,
electricity and labour costs in total costs – differs from the cost structure of similar firms in
benchmarking countries. This particularly applies to higher labour costs, which not only include
salaries and wages but also bonuses and social security payments (Figure 3-4). Labour cost shares
are higher among small Kyrgyz firms in the more labour-intensive food and beverages industry,
but particularly in the wearing apparel industry, where labour costs represent around 50% of total
production costs. In this respect, small Kyrgyz firms are outperformed by similar firms in
benchmarking countries. In terms of labour productivity, differences are particularly strong in the
food and beverages industry, where the labour productivity of Kyrgyz firms is only half of that of
similar Moldovan firms, which points to substantial efficiency-issues of small Kyrgyz firms. The
situation is less bleak in the textiles and garment industries where Kyrgyz firms seem to even have
slight labour productivity advantages.
Interestingly, in terms of capital productivity, either measured as sales over the market value of
machinery and equipment (M&E) or of total property, plant and equipment (PPE), Kyrgyz firms
fare quite well. Relative capital productivity advantages characterise Kyrgyz firms in the food and
beverages and textiles industries, while the rather limited information for the wearing apparel
industry points to substantial capital productivity deficiencies (M&E-based). Overall production
costs as well as (labour and capital) productivity deficiencies obviously also affect the profitability
of Kyrgyz firms, as reflected in their gross and net profit margins. Irrespective of strategic industry
considered, the net profit margin tends to be lower among Kyrgyz firms. The profitability-
discrepancy is the highest in the textiles industry where net profit margins of Kyrgyz firms only
amount to a tenth of Laotian firms. In view of their limited profitability, Kyrgyz firms lack internal
funds and therefore have little financial leeway to finance and expand their businesses and to
grow and thrive.
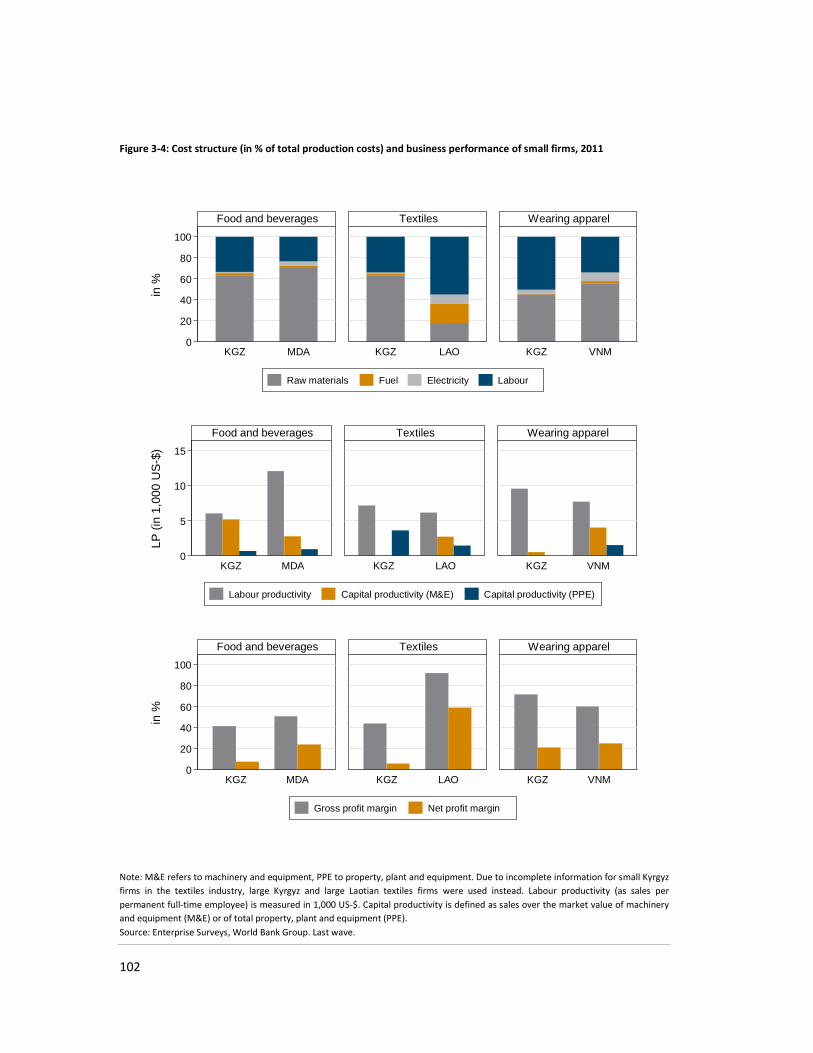
102
Figure 3-4: Cost structure (in % of total production costs) and business performance of small firms, 2011
Note: M&E refers to machinery and equipment, PPE to property, plant and equipment. Due to incomplete information for small Kyrgyz
firms in the textiles industry, large Kyrgyz and large Laotian textiles firms were used instead. Labour productivity (as sales per
permanent full-time employee) is measured in 1,000 US-$. Capital productivity is defined as sales over the market value of machinery
and equipment (M&E) or of total property, plant and equipment (PPE).
Source: Enterprise Surveys, World Bank Group. Last wave.
0
20
40
60
80
100
KGZ MDA KGZ LAO KGZ VNM
Food and beverages Textiles Wearing apparel
Raw materials Fuel Electricity Labour
in %
0
5
10
15
KGZ MDA KGZ LAO KGZ VNM
Food and beverages Textiles Wearing apparel
Labour productivity Capital productivity (M&E) Capital productivity (PPE)
LP (
in 1
,000
US
-$)
0
20
40
60
80
100
KGZ MDA KGZ LAO KGZ VNM
Food and beverages Textiles Wearing apparel
Gross profit margin Net profit margin
in %

103
3.2.2. Important determinants of the performance of Kyrgyz firms
In general, the performance of firms is determined by numerous factors, some of which are more
important than others. In this respect, business upscaling, FDI and exporting are three important
factors that are considered to have important performance and growth-enhancing effects and will
therefore be considered in what follows.
For instance, business growth (i.e. business upscaling) – from small to large – is advantageous
since larger firms tend to be more productive as a result of easier access to (new) technology,
finance, skilled workforce, or managerial skills (Castany et al., 2005; Van Biesebroeck, 2005;
Pagés, 2010) as well as more substantial investments in training, advertising or R&D. Similarly,
due to economies of scale, larger enterprises also tend to be more efficient, and consequently,
more cost-competitive. FDI can bring modern technologies, managerial skills, and production and
marketing networks to industries and act as engine of growth, which could have important
demonstration effects on local firms. Finally, in the context of the learning-by-exporting
hypothesis, exporting can translate into better business performance since internationally
operating firms can tap into and harness global knowledge to improve their products, production
processes, productivity, cost competitiveness, profitability and growth prospects.
Upscaling is associated with better business performance. Important insights as to the effects of,
and consequently the need for, business upscaling can be derived from a benchmarking analysis
between small and large Kyrgyz firms with similar firm characteristics in the same industry. It
helps to demonstrate, what potential for improvement and growth lingers in small firms that
awaits utilization. For the textiles and garment industries, the benchmarking analysis was based
on Laotian firms and Vietnamese firms, respectively, due to insufficient firm level information for
Kyrgyz firms.
In general, business upscaling, in terms of small firms becoming big, has little effect on the cost
structure in the food and beverages and wearing apparel industries. The cost structure only
changes in the textile industry, where the transition to a large firm reduces the electricity cost
share but substantially inflates the fuel cost share, which could be the result of a stronger reliance
on fuel-driven production processes (Figure 3-5). However, business upscaling helps to boost
productivity and profitability, particularly among firms in the food and beverages industry. This
underscores the importance of upscaling for further growth, particularly for the underperforming
firms in the food and beverages industry. Furthermore, upscaling helps to improve firm
performance, as labour and capital productivity increase substantially. The only exception is in the
textiles industry where the labour productivity of firms halves, as they grow big. The most
substantial productivity improvements emerge for the food and beverages industry, where labour
productivity increases four-fold and capital productivity increases between five-and twenty-fold,
depending on its definition.

104
Figure 3-5: Comparison of cost structure (as % of total production costs) and business performance of small and large
Kyrgyz firms, 2011
Note: Due to insufficient data, the upscaling-analysis in the textiles and wearing apparel industries is based on Laotian and Vietnamese
firms, respectively. For the food and beverages industry, Kyrgyz firms are used. Labour productivity (as sales per permanent full-time
employee) in 1,000 US-$. Capital productivity is defined as sales over the market value of machinery and equipment (M&E) or of total
property, plant and equipment (PPE).
Source: Enterprise Surveys, World Bank Group. Last wave.

105
Moreover, productivity-improvements also materialise in the textiles industry, predominantly in
terms of a doubling of the capital productivity, and the wearing apparel industry, where labour
productivity increases slightly and capital productivity (PPE-based) doubles. Interestingly, except
for food and beverages industry, both gross and net profit margins hardly improve as a result of
business upscaling. Thus, the success of large firms is likely to come from lower prices with lower
costs, which make their product competitive and allow them to sell a large volume of products.
Foreign ownership is an important driver of business performance in all strategic industries. A
similar benchmarking analysis between purely domestically-owned firms, and firms with some
foreign ownership participation, is conducted to shed light on the potential effects of foreign
ownership on firm performance, profitability, and consequently firm growth. Due to insufficient
data for Kyrgyz firms, the analysis uses Moldovan firms for the food and beverages industry,
Laotian firms for the textiles industry, and Vietnamese firms for the wearing apparel industry.
Generally, some foreign ownership participation is associated with a noteworthy change in the
cost structure (Figure 3-6). In the labour-intensive industries (food and beverages and wearing
apparel), it leads to an increase in the labour cost share. In the capital-intensive textiles industry,
both fuel and electricity cost shares increase, which is likely the result of a higher degree of
mechanization of production. Furthermore, except for the wearing apparel industry, productivity
improves substantially. In the food and beverages industry, labour productivity triples, while in
the textile and garment industries, labour productivity doubles and almost doubles, respectively.
In the textiles industry, capital productivity also improves to some extent. In addition, both gross
and net profit margins increase, with the largest improvements observable in the food and
beverages industry, where gross profit margins increase four-fold while net profit margins more
than triple.

106
Figure 3-6: Comparison of cost structure (in % of total production costs) and business performance of domestically-
and foreign-owned firms, 2011
Note: Moldovan firms are used for the food and beverages industry, Laotian firms for the textiles industry, and Vietnamese firms for
the wearing apparel industry. No information is available for capital productivity for domestic and foreign-owned firms in the food and
beverages industry. Labour productivity (as sales per permanent full-time employee) in 1000 US-$. Capital productivity is defined as
sales over the market value of machinery and equipment (M&E) or of total property, plant and equipment (PPE).
Source: Enterprise Surveys, World Bank Group. Last wave.
0
20
40
60
80
100
Domestic Foreign Domestic Foreign Domestic Foreign
Food and beverages Textiles Wearing apparel
Raw materials Fuel Electricity Labour
in %
0
5
10
15
20
Domestic Foreign Domestic Foreign Domestic Foreign
Food and beverages Textiles Wearing apparel
Labour productivity Capital productivity (M&E) Capital productivity (PPE)
LP (
in 1
,000
US
-$)
0
20
40
60
80
100
Domestic Foreign Domestic Foreign Domestic Foreign
Food and beverages Textiles Wearing apparel
Gross profit margin Net profit margin
in %

107
Exporting helps improve business performance, but only selectively so. In order to identify the
potential effects of exporting, a similar benchmarking analysis is conducted between firms, which
cater to domestic markets only, and firms, which export directly, on the other. Due to insufficient
data for Kyrgyz firms, the analysis uses Moldovan firms for the food and beverages industry,
Laotian firms for the textiles industry, and Vietnamese firms for the wearing apparel industry.
A shift from purely domestic markets to foreign markets is associated with changes in the cost
structure as well as productivity and profitability improvements, particularly in the food and
beverages industry (Figure 3-7). This underlines the need for export-promotion and support to
fully exploit the associated performance and growth improvements. In the labour-intensive food
and beverages and wearing apparel industries, the labour cost share increases, whereas in the
textiles industry, the raw materials cost share rises substantially, which is likely the result of the
participation in global value chains and the more intense acquisition of raw materials from
abroad. Moreover, particularly in the food and beverages industry and the textile industry, but to
some extent also in the wearing apparel industry, exporting is associated with an improvement in
productivity. Again, productivity-improvements are strongest in the food and beverages and
textiles industries, where labour productivity increases four-fold and two-fold, respectively.
Capital productivity (PPE-based) also increases in the textiles and wearing apparel industries.
Additionally, gross and net profit margins consistently improve and almost triple in the food and
beverages industry but tend to remain unchanged or even fall slightly in the textiles and wearing
apparel industries.

108
Figure 3-7: Comparison of cost structure (as % of total production costs) and business performance of purely
domestically-oriented and directly exporting firms, 2011
Note: Moldovan firms are used for the food and beverages industry, Laotian firms for the textiles industry, and Vietnamese firms for
the wearing apparel industry. No information is available for capital productivity for domestic and foreign-owned firms in the food and
beverages industry. Labour productivity (as sales per permanent full-time employee) in 1000 US-$.
Source: Enterprise Surveys, World Bank Group. Last wave.

109
3.3. Obstacles and challenges
3.3.1. Key obstacles embedded in the business environment
Kyrgyz firms in the three strategic industries operate in business environments characterised by
partly sizeable obstacles, which tend to affect their business operations, disrupt strategic and
operative processes and ultimately impair their performance and undermine their growth
prospects.
Complex and costly regulatory environment. Kyrgyz firms in the three industries operate in fairly
complex regulatory environments that are time-consuming and costly to comply with. Since the
regulatory environment and the cost and administrative burden associated with meeting all
necessary requirements increase with firm size (ADB, 2013a), firms have a strong incentive to stay
small and forego any opportunity for growth.
The degree of regulatory burden, as measured by the percentage of total senior management’s
time spent in a typical week on dealing with requirements imposed by the government, differs
across industries. In 2011, senior managers of Kyrgyz firms in the food and beverages industry and
the textiles industry spent around 10% of their time on dealing with government regulations
(Error! Reference source not found.). In contrast, in the wearing apparel industry, the time spent
on dealing with government regulations was twice as high (20%). Between 2007 and 2011, Kyrgyz
firms in all three industries experienced an increase in the regulatory burden, which was relatively
minor in the textiles industry but more pronounced in the food and beverages industry and
strongest in the wearing apparel industry, where the time spent on dealing with government
regulations almost quadrupled. The regulatory burden of Kyrgyz firms in the food and beverages
industry as well as the textile industry is on average comparable to all benchmark countries. In
contrast, in the Kyrgyz wearing apparel industry, the extent of regulatory burden is relatively high
and is only surpassed by the Cambodian garment industry, where senior managers spend almost
twice as much time on dealing with government requirements as in Kyrgyzstan.

110
Figure 3-8: Regulatory burden (% of time of senior managers spent on dealing with government regulations), 2007
and 2011
Source: Enterprise Surveys, World Bank Group. Last 2 waves.
Practices of informal firms are harmful to business operations. Formal Kyrgyz firms in the three
strategic industries operate in business environments characterised by a relatively high degree of
informality, which negatively affects and obstructs their business operations. This high degree of
informality, particularly in the wearing apparel industry, is of major concern as it not only leads to
low labour productivity, but also holds off and retards potential and nascent labour productivity
improvements, which are crucial for the improvements in their international cost competitiveness
and growth.
In 2011, formal Kyrgyz firms in the food and beverages industry as well as the wearing apparel
industry considered practices of informal firms as a moderate obstacle to their business
operations (Error! Reference source not found.). In contrast, formal Kyrgyz firms in the textiles
industry considered practices of informal firms even as a major obstacle to their business
operations. In the case of the textiles industry, practices of informal firms became even more
detrimental between 2007 and 2011. In general, as can be seen from a comparison with all
benchmark countries, the negative effects of informal firm practices are highest in Kyrgyzstan,
particularly in the food and beverages and textiles industries.
KGZ
MDA
KAZVNM
KHM
LAO
0
10
20
30
40
2011
0 10 20 30 402007
Food and beverages
KGZ
MDA
KAZ
LAO
KHM
VNM0
10
20
30
40
2011
0 10 20 30 402007
Textiles
KGZ
KAZ
MDALAO
KHM
VNM0
10
20
30
40
2011
0 10 20 30 402007
Wearing apparel

111
Figure 3-9: Severity of obstacle posed by practices of informal firms, 2007 and 2011
Note: 0: no obstacle, 1: minor obstacle, 2: moderate obstacle, 3: major obstacle, 4: very severe obstacle.
Source: Enterprise Surveys, World Bank Group. Last 2 waves.
Interviews with stakeholders in the three industries revealed that the lack of tax payments and
the resulting cost-advantages of informal firms are the key concern for formal firms, particularly
smaller formal firms, which renders them comparatively less cost-competitive and disadvantaged.
In view of this, stakeholders emphasised that except for the attempt to compete in terms of
superior quality and services, no particular counter-strategy was in place.
3.3.2. Key obstacles to business operations
Cross-cutting issues
Lack of skilled workers results in a strong need for complementary training activities. An above-
average proportion of Kyrgyz firms in the three strategic industries offers formal training
programs to their employees. In 2011, almost 70% of all firms in the textiles industry offered
formal training programs to their employees, which was by large the highest number among all
benchmark countries (Error! Reference source not found.). In the food and beverages industry
and the wearing apparel industry, around 40% of firms offered formal training programs to their
employees, which is again higher than in the other benchmark countries and only comparable to
the situation in Moldova.
KGZ
KAZ
MDA
VNM KHMLAO
0
1
2
3
4
2011
0 1 2 3 42007
Food and beverages
KGZ
MDA
VNM
KHM
LAO
0
1
2
3
4
2011
0 1 2 3 42007
Textiles
KGZ
MDA
KAZ
KHM
VNM
LAO
0
1
2
3
4
2011
0 1 2 3 42007
Wearing apparel

112
Figure 3-10: Share of firms with formal training programs, 2007 and 2011
Source: Enterprise Surveys, World Bank Group. Last 2 waves.
Stakeholder interviews in the three industries have shown that the strong prevalence of training
activities is associated with severe difficulties in finding appropriately skilled employees. Despite
the relatively high unemployment rate in the country, entrepreneurs have a hard time filling
vacant positions with well-qualified and trained personnel. It seems comparatively easy to find
skilled personnel at the management level, while skilled and well-trained personnel at the
production level is especially hard to find. In particular, stakeholders in the food and beverages
industry emphasised the lack of technicians and specialists (such as VET-specialist or
microbiologists). Stakeholders in the textiles industry stressed the lack of skilled dyers and
machine operators while stakeholders in the garment industry highlighted that skilled sewers,
machine operators, electric repair personnel and programmers (for programming of more
complex knitting patterns) are difficult to find.
Stakeholders generally stressed that their difficulties with finding appropriately skilled employees
are predominantly the result of low-quality and deficient or altogether lacking education schemes
and systems, particularly as concerns (technical) vocational training systems and schools. Hence,
in view of this, many entrepreneurs offer necessary training, either in the form of basic and short-
term on-the-job practical training or vocational training in terms of medium- to long-term
0
20
40
60
80
100
KGZ KAZ MDA KHM LAO VNM
Foo
d &
bev
era
ges
Tex
tiles
Wea
ring
ap
pare
l
Foo
d &
bev
era
ges
Tex
tiles
Wea
ring
ap
pare
l
Foo
d &
bev
era
ges
Tex
tiles
Wea
ring
ap
pare
l
Foo
d &
bev
era
ges
Tex
tiles
Wea
ring
ap
pare
l
Foo
d &
bev
era
ges
Tex
tiles
Wea
ring
ap
pare
l
Foo
d &
bev
era
ges
Tex
tiles
Wea
ring
ap
pare
l
2007 2011

113
theoretical and on-the-job training schemes, which last between a few days and up to three years.
Partly with the help from international organizations, some firms send their employees abroad for
further training in order to enable them to operate locally used foreign machinery and
equipment. In the textiles industry, the lack of training facilities is seen as a result of the general
decline of production (ILO, 2012). Hence, the Association of Light Industry (Legprom), which has
around 600 members (predominantly apparel businesses), is taking important counter-measures.
It closely cooperates with four vocational schools and has also established several vocational
training centres. However, skill shortage remains an issue since not all graduates enter the Kyrgyz
textiles and wearing apparel industries due to the availability of more lucrative and attractive jobs
outside Kyrgyzstan.
The lack of qualified personnel in Kyrgyz firms is, of course, problematic as both unfilled positions
and inadequately educated employees adversely affect their performance, profitability and
growth prospects. A comparison of Kyrgyz firms with low (below 50%) and high (above 50%)
shares of skilled workers among production workers underscores the importance of skilled
employees at the production level. This analysis demonstrates that relative to Kyrgyz firms with
low high-skilled production shares, Kyrgyz firms with high-skilled production shares have higher
labour productivities (6,033 US-$ per permanent full-time employee as compared to 5,463 US-$)
as well as higher gross profit margins (of 38% as compared to 32%) and net profit margins (of 11%
as compared to only 3%). In this context, the effectiveness, and therefore the importance, of
training are further substantiated by a comparison of Kyrgyz firms with and without training
activities. It shows that the additional time and resources spent on training pay off since training
is associated with higher labour productivity (6,378 US-$ per permanent full-time employee as
compared to 5,430 US-$), higher capital productivity (in terms of the ratio of sales to machinery
investment) (17.5 as compared to 4.6) and higher gross profit margins (44.5% as compared to
33.7%).
Sizeable financing constraints: low and falling credit constraints but non-negligible credit
application obstacles. Kyrgyz firms face sizeable constraints when they seek credits from the
banking sector. On the one hand, in connection with credit application processes, Kyrgyz firms
face or anticipate various obstacles, which prevent them from applying for credits or loans in the
first place, despite their need. In 2011, such application obstacles were particularly strong in the
wearing apparel industry, where 60% of all firms reported that despite the need for a credit, they
refrained from applying for one (Error! Reference source not found.). With 40% and around 20%,
application obstacles were more moderate in the Kyrgyz textiles and food and beverages
industries, respectively. However, all in all, in comparison with all other benchmark countries,
application obstacles were highest in the Kyrgyz wearing apparel industry, only somewhat
comparable to the Laotian textile industry. Furthermore, application obstacles in the Kyrgyz
textiles industry were fourth largest, only comparable to those in the Kazakh food and beverages
and wearing apparel industries or the Laotian wearing apparel industry.
On the other hand, they encounter credit constraints whenever their credit applications are
rejected by the respective bank. Among Kyrgyz firms, such credit constraints were still prevalent
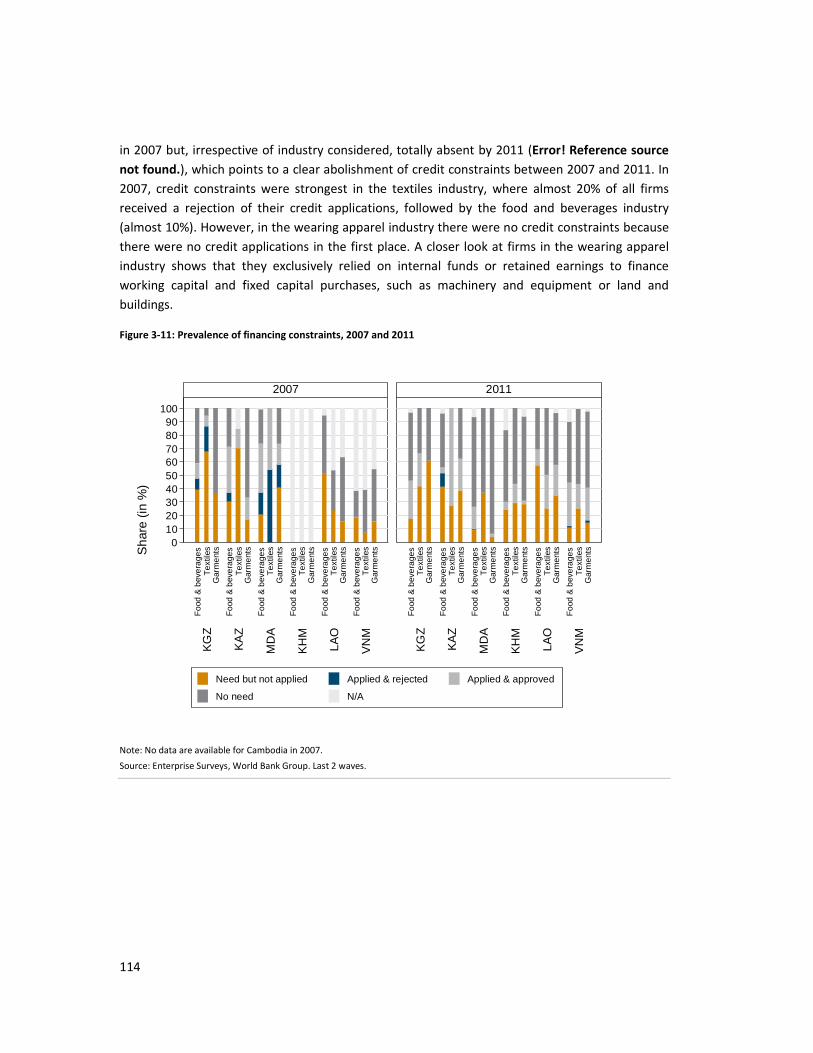
114
in 2007 but, irrespective of industry considered, totally absent by 2011 (Error! Reference source
not found.), which points to a clear abolishment of credit constraints between 2007 and 2011. In
2007, credit constraints were strongest in the textiles industry, where almost 20% of all firms
received a rejection of their credit applications, followed by the food and beverages industry
(almost 10%). However, in the wearing apparel industry there were no credit constraints because
there were no credit applications in the first place. A closer look at firms in the wearing apparel
industry shows that they exclusively relied on internal funds or retained earnings to finance
working capital and fixed capital purchases, such as machinery and equipment or land and
buildings.
Figure 3-11: Prevalence of financing constraints, 2007 and 2011
Note: No data are available for Cambodia in 2007.
Source: Enterprise Surveys, World Bank Group. Last 2 waves.
0102030405060708090
100
KG
Z
KA
Z
MD
A
KH
M
LAO
VN
M
KG
Z
KA
Z
MD
A
KH
M
LAO
VN
M
Foo
d &
bev
era
ges
Tex
tiles
Gar
men
ts
Foo
d &
bev
era
ges
Tex
tiles
Gar
men
ts
Foo
d &
bev
era
ges
Tex
tiles
Gar
men
ts
Foo
d &
bev
era
ges
Tex
tiles
Gar
men
ts
Foo
d &
bev
era
ges
Tex
tiles
Gar
men
ts
Foo
d &
bev
era
ges
Tex
tiles
Gar
men
ts
Foo
d &
bev
era
ges
Tex
tiles
Gar
men
ts
Foo
d &
bev
era
ges
Tex
tiles
Gar
men
ts
Foo
d &
bev
era
ges
Tex
tiles
Gar
men
ts
Foo
d &
bev
era
ges
Tex
tiles
Gar
men
ts
Foo
d &
bev
era
ges
Tex
tiles
Gar
men
ts
Foo
d &
bev
era
ges
Tex
tiles
Gar
men
ts
2007 2011
Need but not applied Applied & rejected Applied & approved
No need N/A
Sha
re (
in %
)

115
Figure 3-12: Reasons for not applying for a credit or loan, 2007 and 2011
Note: No data are available for Cambodia and textiles industry in Moldova for 2007.
Source: Enterprise Surveys, World Bank Group. Last 2 waves.
Kyrgyz firms highlight three key application obstacles, which keep them from applying for bank
loans or credits, namely unfavourable interest rates, complex procedures and high collateral
requirements (Figure 3-12). In 2011, Kyrgyz firms in the wearing apparel industry quoted
unfavourable interest rates as the only and single most important reason for not applying for
credits, which helps to explain why Kyrgyz wearing apparel firms abstained from applying for
credits in the first place. Unfavourable interest rates were also the single most important reason
among firms in the food and beverages industry. In contrast, complex application procedures
were the most important application obstacle among firms in the textiles industry. This is
different from what was reported in 2007, when high collateral requirements were the key reason
for not applying for a credit in the wearing apparel industry and also of greater importance in the
food and beverages industry. Table 3.7 provides nominal interest rates firms report having to pay
and highlights that Kyrgyz firms indeed pay comparatively high interest rates (20% on average) for
their credits or loans.
0102030405060708090
100K
GZ
KA
Z
MD
A
KH
M
LAO
VN
M
KG
Z
KA
Z
MD
A
KH
M
LAO
VN
M
Foo
d &
bev
erag
es
Tex
tiles
Gar
men
ts
Foo
d &
bev
erag
es
Tex
tiles
Gar
men
ts
Foo
d &
bev
erag
es
Tex
tiles
Gar
men
ts
Foo
d &
bev
erag
es
Tex
tiles
Gar
men
ts
Foo
d &
bev
erag
es
Tex
tiles
Gar
men
ts
Foo
d &
bev
erag
es
Tex
tiles
Gar
men
ts
Foo
d &
bev
erag
es
Tex
tiles
Gar
men
ts
Foo
d &
bev
erag
es
Tex
tiles
Gar
men
ts
Foo
d &
bev
erag
es
Tex
tiles
Gar
men
ts
Foo
d &
bev
erag
es
Tex
tiles
Gar
men
ts
Foo
d &
bev
erag
es
Tex
tiles
Gar
men
ts
Foo
d &
bev
erag
es
Tex
tiles
Gar
men
ts
2007 2011
Unfavorable interest rates Complex application procedure
High collateral requirements Insufficient size of loan
Informal payment required Did not think it would be approved
Other (not specified)
Sha
re (
in %
)

116
Table 3.7: Average nominal interest rate paid for loans, 2011
Country 2011
Kyrgyz Republic 19.9
Kazakhstan 12.5
Moldova 15.4
Note: unavailable for Cambodia, Laos and Vietnam.
Source: Enterprise Surveys, World Bank Group. Last wave. European and Central Asian module only.
Interviews with stakeholders in the three strategic industries showed that access to finance was a
more acute obstacle for smaller firms, which have fewer fixed assets that could act as collateral,
generally have a considerably harder time repaying expensive loans due to lower profit margins,
and hardly have the necessary time and resources to handle the complex application procedures.
Limited access to finance is, of course, problematic as it undermines firms’ investment potential
and forces financially weak firms to either scale down or totally abandon planned investment
projects. In the Kyrgyz case, where many firms still operate outdated and inefficient production
technologies, limited access to external funds strongly decelerates the shift to more efficient and
productive leading-edge production technologies and inhibits the expansion of existing
production processes and lines. Consequently, financially constrained Kyrgyz firms are unable to
exploit existing growth potentials. Moreover, in the light of generally stronger financing obstacles
among smaller firms and the predominance of small firms in the three strategic industries, the
size of unexploited growth potential is substantial.
Low quality competitiveness of exporters leads to a high degree of exporter churning and low
survival of new exporters. Kyrgyz firms increasingly enter foreign markets to move outside the
confines of their small local market. Generally, exporting is important as it allows exporters to
access, learn from and exploit international knowledge, which helps them to improve their
products, production processes, productivity, and profitability and to grow. The associated
performance and profitability advantages of exporters relative to non-exporters have already
been established above. However, while the entry rate of new exporters into foreign markets is
relatively high and promising, at the same time, the exit rate of exporters is relatively high as well,
which is indicative of an extensive shake-out of Kyrgyz exporters in foreign markets due to their
relatively poor international competitiveness. For instance, in 2012, around 50% of Kyrgyz
manufacturing firms started exporting while in the same year, around 46% of Kyrgyz exporting
manufacturing firms exited foreign markets and stopped exporting, resulting in a slightly positive
net exporter entry rate (
Similar dynamics are also observable in the three strategic industries. In the food and beverages
industry, with 87% and 86%, respectively, entry and exit rates were highest in the manufacture of
grain mill products, starches and starch products, and prepared animal feeds. In contrast,

117
exporter entry and exit rates were lowest in the manufacture of dairy products, which also had
the highest net exporter entry rate of around 10%. In the textiles industry, exporter entry and exit
rates were highest in spinning, weaving and finishing of textiles. However, with around 21%, the
net exporter entry was highest in the manufacture of knitted and crocheted fabrics and articles.
Finally, in the wearing apparel industry, with almost 80%, exporter entry rates were particularly
high in dressing and dyeing of fur and manufacture of articles of fur. This industry was also the
most successful net exporter, with the highest net exporter entry rate of 44%.
).
Similar dynamics are also observable in the three strategic industries. In the food and beverages
industry, with 87% and 86%, respectively, entry and exit rates were highest in the manufacture of
grain mill products, starches and starch products, and prepared animal feeds. In contrast,
exporter entry and exit rates were lowest in the manufacture of dairy products, which also had
the highest net exporter entry rate of around 10%. In the textiles industry, exporter entry and exit
rates were highest in spinning, weaving and finishing of textiles. However, with around 21%, the
net exporter entry was highest in the manufacture of knitted and crocheted fabrics and articles.
Finally, in the wearing apparel industry, with almost 80%, exporter entry rates were particularly
high in dressing and dyeing of fur and manufacture of articles of fur. This industry was also the
most successful net exporter, with the highest net exporter entry rate of 44%.
Figure 3-13: Exporter entry and exit rates, 2012
0
20
40
60
80
100
in %
Man
ufa
ctu
ring
Mea
t, fis
h, fr
uit
Da
iry p
rodu
cts
Gra
in m
ill p
rodu
cts
Oth
er
foo
d p
rodu
cts
Be
vera
ges
Tex
tiles
Oth
er
text
iles
Kni
tted/
croc
hete
d fa
bric
s
Wea
ring
ap
pare
l
Fu
r
Entry rate Exit rate

118
Source: Exporter Dynamic Database.
However, in the face of fierce international competition, only a small fraction of new exporting
Kyrgyz firms manages to survive beyond the third year after starting to export. This is another
clear sign of the weak competitiveness of Kyrgyz exporting firms, since shortly after entry into
foreign markets, the majority of new exporters is forced out again. In 2009, only every sixth new
manufacturing exporter survived in the foreign market beyond the third year of exporting (Figure
3-14). In the food and beverages industry, third year survival rates were particularly low in
production, processing and preservation of meat, fish, fruit, vegetables, oils and fats, and
manufacture of other food products, where only every tenth new exporter survived beyond the
third year of exporting. In the textiles industry, the situation was even worse in spinning, weaving
and finishing of textile, where only every twentieth new exporter survived beyond the third year
of exporting, and worst in manufacture of grain mill products, starches and starch products, and
prepared animal feeds, where not a single new exporter survived the third year of exporting.
Finally, the situation was worst in the wearing apparel industry: in manufacture of wearing
apparel (except fur apparel) only every 33rd new exporter survived the third year of exporting,
while in dressing and dyeing of fur and manufacture of articles of fur, none of the new exporters
survived beyond the third year of exporting.
Figure 3-14: Third year exporter survival rates by 3-digit ISIC code, 2009
Source: Exporter Dynamic Database.
0
5
10
15
20
in %
Man
ufa
ctur
ing
Mea
t, fis
h, fr
uit
Da
iry p
rodu
cts
Gra
in m
ill p
rod
ucts
Oth
er
food
pro
du
cts
Bev
era
ges
Te
xtile
s
Oth
er
text
iles
Kni
tted/
croc
hete
d fa
bric
s
We
arin
g a
ppa
rel
Fur
119
The high level of exporter churning and the low third-year exporter survival rates point to obvious
competitiveness deficiencies of Kyrgyz products, which could be due to either low cost or low
quality competitiveness. Stakeholder interviews revealed that it is an issue of low quality
competitiveness. Kyrgyz products suffer from quality deficiencies, which makes them
internationally less competitive. This becomes obvious in Kyrgyzstan’s current situation. In
particular, as a member of the Eurasian Economic Union (EAEU), it has pledged to adopt the
technical regulations and sanitary, phytosanitary and veterinary requirements of the Customs
Union in order to ensure the safety of products and prevent diseases and pests in plants and
animals. Consequently, all exporters need to obtain mandatory certificates for their products to
move them freely within the EAEU. However, stakeholders emphasised that they were
encountering difficulties with meeting quality standards and, consequently, acquiring quality
certificates, which would allow them to export to and fully profit from the EAEU. Quality
standards are also in force in other potential destination markets (such as the EU), which
currently also makes these markets inaccessible for low-quality Kyrgyz products.
The importance of quality standards and certificates is also reflected in the performance and
profitability advantages of Kyrgyz firms, which have international quality certificates over firms,
which lack such certificates. A comparison of Kyrgyz firms with and without international quality
certificates demonstrates that international quality certificates are essential for successful
exporting activities and are associated with higher labour productivity (6,033 US-$ per permanent
full-time employee compared to 5,617 US-$) and capital productivity (in terms of the ratio of sales
to machinery investment) (10.5 compared to only 5.2). Furthermore, international quality
certificates are profitability-enhancing in terms of higher gross profit margins (44.4% as compared
to 38.5%) as well as net profit margins (12.4% as compared to only 6%).
Industry-specific obstacles
In addition to general and broad obstacles that affect business operations and undermine
performance and growth prospects of Kyrgyz firms in all industries of interest, there are also some
very industry-specific obstacles, which warrant emphasis and discussion.
Food and beverages industry
Disintegrated and dispersed small-scale raw material producers cause substantial costs. As a
consequence of the land reform policies of the 1990s, the raw material base of the food and
beverages industry disintegrated into a large number of small-scale raw material producers and
suppliers. The concomitant disestablishment of economic facilities at the village-level forces
processors in the food and beverages industry to cooperate with numerous different small-scale
producers instead of a few large suppliers, which causes high coordination costs on their end.
Stakeholders in the industry emphasised that, while some villages have already joined forces and
re-established village-level cooperatives, still more needs to be done to facilitate the acquisition

120
of raw materials. This would help processors in the food and beverages industry to reduce costs
and raise profitability.
Insufficient laboratory infrastructure to meet EAEU sanitary and phytosanitary requirements
necessitates the use of expensive and time-consuming foreign alternatives. As a member of the
EAEU, the Kyrgyz Republic pledged to also adapt its provisions on sanitary and phytosanitary (SPS)
standards in the food and beverages industry, which necessitates the acquisition and provision of
mandatory certificates for exports within the EAEU. Stakeholder interviews revealed that the
current bio-laboratory infrastructure is deficient in size, quality, endowment and skills and
therefore unable to issue the necessary quality certificates to exporters in the food and beverages
industry, which would prove their compliance with EAEU SPS requirements and guarantee barrier-
free exports within the EAEU. Consequently, many necessary tests need to be conducted abroad,
which is not only more time-consuming and administratively burdensome, but also more costly.
However, given recent developments, the situation is expected to improve as currently two
phytosanitary laboratories are being built (in the Talas region) and another three laboratories are
in the pipeline.71 Moreover, repeated border issues with Kazakhstan related to phytosanitary
norms also further inhibit exports of particular agricultural products, such as potatoes72, milk or
meat. Currently, due to the violation of phytosanitary norms, Kazakhstan has imposed a ban on
the transit of milk (from five Kyrgyz milk processing enterprises73) and meat, which some
stakeholders in the food and beverages industry consider a key obstacle to their current business
operations. This further underlines the need for a high-quality bio-laboratory infrastructure in
order for Kyrgyz agricultural exporters to fully penetrate and benefit from the larger EAEU market.
Low quality of raw materials affects the quality of final products. Stakeholders raised concerns
about the quality of raw materials and of the production practices of raw material producers
(farmers). Due to a lack of professional knowledge about high-quality cultivation, raw materials
are often of low quality. Similarly, raw material producers sometimes do not follow the necessary
quality standards in their production processes. In particular, stakeholders in the meat industry
highlighted that cattle farmers tended to ignore essential quality standards when slaughtering
their cattle, which is problematic for the ensuing complete chain of quality proof that is necessary
for exports. In particular, firms in the food and beverages industry may face severe difficulties
attaining the quality certificates that are necessary to access and export within the EAEU.
Textiles and wearing apparel industry
Absence of thread production. Currently, due to the absence of thread production in the Kyrgyz
Republic, the textiles and wearing apparel production chain is fragmented and incomplete.
Interviews with stakeholders in the industry show that threads are imported (from e.g.
71 #35 Kyrgyzstan Agriculture Bulletin, BFC: https://issuu.com/bfc-pub/docs/_bfc-kyrgyzstan-agri-bulletin-35-ja. 72
Kazakhstan bans import of potatoes from Kyrgyzstan, May 6, 2016: https://24.kg/archive/en/evraziasoyuz/180323-news24.html/. 73
Kazakhstan bans imports of dairy products from Kyrgyzstan, AZERNEWS, October 18, 2017: https://www.azernews.az/region/120596.html.
121
Uzbekistan, Tajikistan but also China), which creates some unnecessary problems and costs. First,
imported threads seem to be of unsatisfactory quality, which causes concerns for the overall
quality and competitiveness of the final product. Second, the value-added tax (VAT) that needs to
be paid on imports of thread can only be claimed and refunded 6 months after the purchase,
which creates temporary cash-flow issues and requires non-negligible additional administrative
efforts. Third, the whole buying and importing process of thread is logistically complex and costly.
Towards an inclusive and sustainable industrial development strategy: Recommendations and
Actions that could make a difference

122
4 Towards an inclusive and sustainable industrial development strategy:
Recommendations and Actions that could make a difference
4.1 Objectives and Institutional Aspects of an Inclusive and Sustainable Industrial
Development Strategy
Making an inclusive and sustainable industrial development a key priority. The negligible
contribution of the industrial sector to Kyrgyzstan’s economic growth and its inability to generate
a substantial amount of jobs – in particular formal jobs – demonstrate the urgent need for an
industrial development strategy. While there are numerous sector-specific programmes, e.g. for
the development of the food and processing industry, and a National Strategy for Sustainable
development, currently in the process of being revised, so far no comprehensive industrial
development strategy exists. This is bound to change though as the Kyrgyz government is
currently working out a concept for the sustainable development of industry that should set the
general framework and priorities.
A prerequisite for a successful industrial strategy is that it is designed and implemented in an
inclusive and sustainable manner. It is imperative that the re-industrialisation of the country is
transparent, open to and to the benefit of all parts of the society, thereby supporting social goals
such as combat against poverty. Furthermore, environmental sustainability needs to be an
integral part of the industrial development strategy, ensuring an efficient use of natural
resources, a check on pollution and an increasing use of renewable energy and resources. These
objectives are in line with the country’s National Sustainable Development Strategy already in
place.
A strong re-industrialisation push should take the form of an inclusive and sustainable industrial
development (ISID) that revitalises manufacturing activities and exports and makes use of the
abundant renewable energy resources efficiently. The challenges and opportunities brought
about by the country’s accession to the Eurasian Economic Union (EAEU) and the prospect of a
depletion of the Kumtor gold mine by 2023 make the need for an accelerated industrial
development even more acute.
A strong and clear institutional framework can support the effective implementation of
industrial development programmes. Experiences from other countries such as Brazil suggest
that the appropriate institutional setting facilitates the design and the implementation of a
comprehensive industrial policy programme (OECD, 2013) that has many linkages to other policy
field (e.g. education, energy, health, environment, technology). In that respect, the installation of
the State Committee of Industry, Energy and Subsoil Use, which is a government unit, is a step in
the right direction. This State Committee was created in 2016 in order to align and improve
coherence between the policies in the interrelated fields of industry, energy and mining. The
State Committee should closely co-ordinate all industrial development plans with other
stakeholders, in particular the Ministry of the Economy which is responsible for the formulation of

123
Kyrgyzstan’s medium-term (2018-2022) and long-term (until 2040) development strategy. The co-
ordination of the industrial development agenda can also be supported by the Inter-Ministerial
Working Committee that was established within the office of the Vice Prime Minister and has
therefore the backing of the top level government, which is important for a successful
implementation (Wade, 2016).
Programmes and plans need proper implementation and evaluation. An important element for
the success of industrial development programmes is monitoring and evaluation. Realistically, not
all initiatives launched under a broad-based industrial development strategy will be successes.
Failures need to be seen as part of the process and can strongly contribute to learning, provided
all activities are properly monitored and evaluated. The evaluation needs to be taken into account
at the design stage of policy programmes.
The general objectives of the industrial development well known by stakeholders. The
objectives of an inclusive and sustainable industrial development these can be broadly defined as
(i) pushing up the real GDP growth rate beyond the 5% level in a permanent manner by increasing
the growth contribution of the industrial sector and (ii) the creation of formal jobs in the industrial
sector. In order to arrive at these overarching objectives, industrial development policies must
strive for
• a re-industrialisation and the diversification of the production and export structure within
manufacturing;
• the improvement of the cost competitiveness to improve the export performance; and
• an expansion of the formal economy.
These targets reflect the fact that as a small economy, Kyrgyzstan’s industrial development is
dependent on exports because of domestic demand constraints. Moreover, public support
programmes should be granted exclusively to firms operating in the formal sector which may be
an issue in certain instances (e.g. the textile and wearing apparel industry). In this respect, the
Export Development Strategy, which is currently revised and updated, already launched some
specific initiatives such as the 350 million som interest rate support programme for export-
oriented industries.
4.2 Linking industrial with regional development
The industrial development strategy should be linked with regional development plans. Even
within a small country such as Kyrgyzstan, economically relevant resources and capabilities are
rather unevenly distributed across the territory. Therefore synergies between the industrial
development strategy and the incipient Regional Policy Concept and the 20 growth points (cities)
that have been defined therein74. These growth points will have varying interests across and
within each of the strategic industries. For example, the cities Bishkek and Osh will have particular
74 Some information on the key elements of the Regional Policy Plan has been kindly provided by the Kyrgyz authorities.

124
interest in incentives provided for the textile and wearing apparel industries, whereas for Naryn
oblast support measures for the development of hydro power may be seen as the first priority.
The necessity of in-depth knowledge about local conditions calls for making the regional
dimension an integral element of inclusive and sustainable industrial development. Therefore, in
line with Step 21 of the “40 Steps to New Era”, depending on the financial resources granted to
the envisaged business services centres within each of these city growth points, these centres
could be involved as key actors in the implementation of concrete actions for industrial
development.
Figure 4-1: City Growth Points across Kyrgyz regions (oblasts)
Note: 20 city growth points as defined in current Regional Policy Concept of the Kyrgyz Republic
Source: Regional policy concept of the Kyrgyz Republic (presentation); map: Oriental Express Asia available at
https://kyrgyzstan.orexca.com/img/kyrgyzstan/map.jpg.
Despite this regional focus, the instruments for industrial development available can and should
be designed at the national level. A rule-based approach is strongly recommended, with the
conditions and eligibility criteria of support programmes clearly defined. These rules must be
transparent and clearly communicated from the outset. In addition, any support provided should
be temporary and contingent on progress achieved with regards to international cost
competitiveness. For example, any interest rate support for the textile industry should be
available for all formal firms, irrespective of where they are located. The regional dimension,
R egio n Gro wth po ints
Chui oblast Bishkek, Tokmok, Kara-Balta
Issyk-Kul oblast Karakol, Balykchi
Naryn oblast Naryn, Kochkorka
Talas oblast Talas
Osh oblast Osh, Uzgen, Kara-Suu, Sary-Tash
Batken oblast Batken, Isfana, Kadamjay
Djalal-Abad oblast Djalal-Abad,Tash-Kumyr, Kara-Kul, Kerben, Kochkor-Ata

125
however, comes into play when it comes to public investments and the provision of public goods.
An example would be the decision where to establish a vocational training centre for textile
workers and designers.
4.3 Industrial Policy Measures for the Manufacturing Sector
4.3.1 Principles of industrial policy support
Conventional industrial policy tools are essential to nurture manufacturing development.
Classical industrial policy instruments remain key ingredients of an industrial policy strategy.
Given the identified lack of cost competitiveness across most manufacturing industries, some
budgetary resources need to be pledged for temporary loss financing of firms in strategic
industries. For any support provided, a carrot-and-stick approach should be applied. That is, there
should be continued support for firms which can give evidence of successful learning and a
narrowing of the cost gap to international price competitiveness. At the same time, support is to
be discontinued for firms where no such progress has been achieved or is to be expected within
the pre-defined time periods. The sources for loss financing may partly come from financial
incentives provided by the government, but equally from foreign investors and – given the high
ODA intensity of the country - also from international donors.
Industrial policy support should focus on improving cost competitiveness. With regard to
financial incentives, Kyrgyzstan has recently launched several interest rate subsidy programmes.
For example, an interest subsidy programme worth 700 million som for the agro-food sector75
was implemented, and the Ministry of the Economy earmarked 350,000 million som for an
interest subsidy programme targeted at export-oriented firms, including textile and garment
producers76. Discussions with stakeholders suggest that these programmes, together with the
operations of the Russian-Kyrgyz Development Fund (RKDF), have helped to ease the problem of
obtaining finance at an affordable interest rate for eligible firms. Given the impact of these
measures to ease credit constraints, further actions could be considered to support Step 11 of “40
Steps to New Era” – export support. Hence, the current focus on interest rate support
mechanisms appears appropriate and could be supplemented by other forms of subsidies
programmes, depending on the obstacle the support measure is destined to tackle. For example,
training subsidies in form of tax credits and tax rebates would make it less costly for firms to
provide in-house trainings for new personnel. Irrespective of the form in which they are provided,
all subsidies should be in line with the overriding target of achieving cost competitiveness. In this
respect it may be useful bearing in mind that Kyrgyzstan’s cost competitiveness is suffering not
only from insufficient capital equipment of firms but also from a lack of planning and
organisational capacity. This calls for measures that support improving management and
75 The programme is part of the Food Industry Development Programme for 2017-2021.
76 This programme forms part of the National Export Promotion Strategy for 2018-2022 which is still under development, although the
interest rate programme is already in place. The public interest rate support brings the interest rate to be paid by firms down to 10%
while the government covers the difference to the market rate (all loans are provided by commercial banks).

126
organisational capacity within firms. In other words, industrial policy incentives should not focus
on physical investment only but pay at least equal attention to organisational learning processes.
Tax subsidies may also prove useful for luring informal firms into the formal sector. Such tax
incentives will, by lowering the tax burden, make staying in the shadows relatively less attractive.
Transparent and non-discriminatory allocation of subsidies. Subsidies are to be used within the
confinements of the General Agreement on Tariffs and Trade (GATT) within the WTO. As a
consequence, subsidies contingent on export and local content subsidies are ruled out. Kyrgyzstan
is also bound by the WTO Agreement on Subsidies and Countervailing Measures (ASCM) but
sufficient room for manoeuvre in the field of subsidies remains77. With regard to the design of
subsidy programmes, it is important that subsidies, including outright grants, are not provided in a
discriminatory manner, i.e. handed-out to selected firms only. Rather there need to be clear and
transparent eligibility criteria for firms to obtain support. This way equal access to support
programmes can be guaranteed.
Widening and strengthening additional support measures based on existing institutions. Direct
financial support for firms is useful for helping firms to achieve international cost
competitiveness. Still, further action and institutions may be useful. The State Agency for
Investment and Export Promotion is a very good example for such additional action. The facilities
of this agency could be widened to include financial support for exporting firms78 and could,
following the example of Russia in 201179, finally evolve into a full-fledged export credit agency
(ECA). Another tool Kyrgyzstan could envisage is the establishment of some sort of a business
angel fund. Business angels are typically people with an above average education and a
professional or business career who invest in and counsel young entrepreneurs. Especially, the
counselling aspect would be important and could be publicly supported, given the weaknesses in
managerial, technical and organisation skills. Funding of the operations would also fit into the
operations of the RKDF, founded in 2014, with the objective of supporting structural change in
Kyrgyzstan.
4.3.2 Import tariffs
In default of an independent tariff policy, trying to influence the EAEU Common External Tariffs
seems the most effective approach. Compliance with EAEU Common External Tariffs (CET) rules
out using tariff policy as an industrial policy tool. Absent any national tariff autonomy, the Kyrgyz
government should try to influence the CET via the Eurasian Economic Commission in its favour.
In particular, the government should prevent changes in the tariff schedules from further eroding
77 The Eurasian Economic Union (EAEU) also contains an Agreement on Unified Rules for Granting Industrial Subsidies but as of 2017
this is not deemed to impose any substantive restrictions. 78
The State Agency for Investment and Export Promotion was initially established as an investment promotion agency (in 2014). While
its mandate has been broadened to include export promotion, so far it can only provide advisory services. 79
Establishment of the Export Insurance Agency of Russia (EXIAR).

127
the manufacturing sector80. In case of import surges from EAEU partners, Kyrgyzstan should be
prepared to make use of safeguard measures foreseen in the EAEU agreement.
4.3.3 FDI attraction
The EAEU has the potential to boost FDI from Russia and China. Kyrgyzstan’s high dependence
on foreign technologies implies that foreign direct investment (FDI) can have a huge impact on
industrial development. Some of the current disadvantages of Kyrgyzstan in attracting FDI, such as
a small domestic market and its relatively remote location, are difficult to alter. Nevertheless, the
recent improvements in infrastructure – thanks mainly to investments from China in the context
of its One Belt One Road initiative – as well as EAEU accession make Kyrgyzstan potentially a much
more attractive location for FDI investors. The most promising sources for FDI are Russia and
China.
Attracting FDI in strategic industries should be made a priority. While the harsh business
environment (ADB, 2013a) remains an obstacle for investors, FDI inflows have been relatively high
since 2010, amounting to between USD 300 mn (2012) and USD 1.1 bn (2014). Since these FDI
inflows are still highly concentrated in resource-based industrial activities (mainly mining and
more recently oil refining), a priority of an FDI attraction policy should be to foster FDI inflows in
industries that were identified as strategic. Apart from a modernisation of equipment, FDI inflows
would also bring in foreign managerial and organisation skills that are dearly needed. From the
perspective of technology spillovers, a particularly supportive type of FDI for Kyrgyzstan would be
joint ventures between foreign and Kyrgyz companies.
The aforementioned State Agency for Investment and Export Promotion already has FDI
promotion tools in place. The impact of the current FDI attraction strategy, however, appears to
be limited because the agency does not offer more to potential foreign investors then the general
economic framework conditions such as a low corporate tax rate (10%). Hence, additional
incentives for foreign investors may be envisaged. Another important aspect in the context of FDI
promotion is the national treatment of foreign investors and protection against expropriation81. In
this respect, solving the current legal disputes with major existing FDI investors82 would probably
help to confirm the Kyrgyz government’s commitment to these principles.
4.3.4 Specific Measures for the food and beverages industries
The analysis of obstacles to the business operations of Kyrgyz firms in the food and beverages
industry points to a number of measures and initiatives, which can be taken to overcome them
and fully exploit the industry’s growth and employment generation potentials.
80 So far, Kyrgyzstan could not reap the full export potential from EAEU. Rather in the short-term, export performance was negatively
affected, especially in the field of agricultural and agro-processed goods where exporters found it hard to comply with the stricter
enforcement of enhanced quality standards by EAEU partners (World Bank, 2017a). 81
See http://www.invest.gov.kg/en/why-kyrgyzstan/liberal-legislation-and-benefits-for-inv/ 82
Noteworthy in this respect is the legal dispute with the Canadian gold mining company Kumtor, the largest FDI investor in the
country.

128
More investments are needed to update and expand the bio-laboratory infrastructure.
Currently, there is a lack of modern veterinary and phytosanitary laboratories in Kyrgyzstan, which
could issue the necessary quality certificates to exporters, in compliance with EAEU sanitary and
phytosanitary (SPS) requirements. Hence, substantial investments are needed not only to
modernise the existing but outdated bio-laboratory infrastructure but also to enlarge it to make it
more easily accessible to exporters throughout Kyrgyzstan, who frequently have to send their
food products to Kazakhstan for more expensive testing. Since 2015, sizeable funds have yearly
been re-allocated from the Kyrgyz budget for this purpose (1.5 million soms in 2015, 26.5 million
soms in 2016, and 29.9 million soms in 2017).83 Furthermore, the Cabinet of Ministers allocated
5.9 million soms for the repair of the Issyk-Kul Laboratory for Plant Quarantine, which began in
2016.84 Moreover, the Russian Federation and Kazakhstan provide additional financial support for
the swift modernisation of the Kyrgyz bio-laboratory infrastructure.85 As a result of all these
efforts, by the end of 2017, 13 phytosanitary and veterinary laboratories are planned to be put
into operation.86
Furthermore, the skills of the laboratory staff are outdated and inadequate to fulfil the new and
more sophisticated tests that need to be conducted in compliance with all SPS requirements.
Hence, complementary training is necessary to teach the current staff how to operate the new
equipment and conduct all the necessary tests. International specialists, who possess the
necessary expertise and skills, best offer such training activities in cooperation with the Kyrgyz
government. There is generally also a shortage of professionals with the appropriate level of
technical skills to staff and run the existing and future testing facilities, which necessitates efforts
to improve the quality of education in the required fields and an overhaul of the current curricula
to meet new needs and standards.
Production and service cooperatives as means to integrate and coordinate raw material
producers. The disestablishment of village-level distribution facilities in the course of the land
reforms of the 1990s has left food and beverages processors with the difficulty of having to
coordinate with numerous small-scale raw material producers. In this context, cooperatives
should be actively promoted, which solve the problem of the large number of small-scale raw
material producers. Production cooperatives could bundle labour and means of production to
produce more sizeable production volumes, which makes them attractive to processors. Service
cooperatives, which go beyond pure production cooperatives and combine production functions
with storage, marketing or distribution functions, could also market and sell their produce, in
total, to processors. For such rather complex cooperatives to work, however, managerial skills are
needed that are typically not found among farmers. Furthermore, there is a need for investments
83 Kyrgyzstan annually increases cost of creation phytosanitary laboratories, KG 24, 2 June, 2017:
https://24.kg/english/53527_Kyrgyzstan_annually_increases_cost_of_creation_phytosanitary_laboratories/. 84
Ibid. 85
EEC: http://www.eurasiancommission.org/en/nae/news/Pages/17-03-2017-2.aspx. 86
Kabar, 9 March, 2017: http://kabar.kg/eng/news/zheenbekov-the-opening-of-phytosanitary-laboratories-in-the-country-is-the-
result-of-kyrgyzstans-accession-to-eeu/.
129
to establish the necessary infrastructure so that affordable funds need to be made available for
the construction of the necessary collection, storage/cooling and distribution facilities. Currently,
due to the high risk linked to agricultural lending and its generally lower profitability, agricultural
lending is rather underdeveloped in Kyrgyzstan, with the Kyrgyz Agricultural Finance Corporation
(non-bank financial institution) as the key player.
In general, the number of active cooperatives in Kyrgyzstan is low. In 2011, there were 1,400
registered cooperatives, of which only 400 were active (Lerman, 2013). The majority of registered
cooperatives was production cooperatives. The low number of cooperatives can to a large extent
be explained by (i) farmers’ wish to preserve their independence, (ii) lack of information about the
merits of cooperatives, and (iii) the lack of trust in managers and other members of the
cooperative (Lerman, 2013). A large-scale country-wide information campaign could help to
acquaint the rural population with the workings and merits of cooperatives and encourage their
widespread establishment.
Training and information activities to guarantee raw materials of better quality. Due to the
absence of professional knowledge about high-quality cultivation (which shows in the use of low-
quality seeds, several seeds reproductions, or the non-use of fertilizers, among others) and farm
management, raw materials for the food and beverages industry are often of low quality.
Capacity-building initiatives are needed, such as training and information campaigns, to teach raw
material producers how and where to acquire high-quality inputs (such as seeds), where to
purchase and how to use fertilizers, and how to adjust their production processes to produce
high-quality raw materials, which fulfil all the necessary quality standards, particularly those
necessary for export. The establishment of demonstration and training units or centres would
greatly help in this respect. Furthermore, poor storage and cooling facilities affect the quality of
farmers’ produce, which is a cause of concern for processors. However, due to limited funds, raw
material producers are often unable to acquire the necessary high-quality inputs for the
production process, upgrade or build good storage and cooling facilities, or invest in technological
upgrading, which calls for special agricultural lending schemes particularly tailored to their needs
with affordable interest rates and sensible payback periods. Some Kyrgyz food and beverages
firms, particularly big exporters, provide their raw material suppliers with the necessary high-
quality inputs (such as seeds, fertilizers etc.), which guarantees their continuous supply with the
needed high-quality raw materials.
Easier access to finance helps to enable and encourage necessary investments. Raw material
producers and food and beverage processors face substantial barriers to finance, which keeps
them from raising the necessary funds to buy not only the required inputs for the production
process (fuel, seeds, feed, fertilisers, etc.) but also to invest in new and productivity-enhancing
machinery and equipment, such as modern storage, cooling, packaging or feeding facilities. As a
consequence, prevailing potentials for productivity improvements, growth or employment
generation are inhibited. Both, the rather underdeveloped lending landscape and the terms and
conditions of available funding schemes form almost insurmountable barriers, which limit the
access of Kyrgyz firms in the sector to funds. Currently, agricultural lending schemes are in limited

130
supply and the banking system is rather small, though alternatives, such as microcredit
institutions, exist. But most importantly, barriers are predominantly associated with complex and
time consuming application procedures as well as high interest rates and high collateral
requirements, which affect small firms the most. Given the predominance of small firms in the
industry, MSME-oriented funding mechanisms are needed. However, some important
developments are on the way as the Ministry of Agriculture and Food Processing Industry has
recently implemented a funding scheme and offers 700 million Soms of subsidised credit loans to
the agricultural sector for its development.
Foreign investors can contribute greatly to agricultural and processing performance
improvements. Starting at the level of individual farmers, all the way up the value chain, there is a
strong need for an increase in production capacities and qualities. Lack of knowledge,
unsustainable production processes, small-scale production or outdated machinery and
equipment all contribute to generally low levels of productivity and profitability, while poor
knowledge about high-quality cultivation and production processes or the lack of compliance with
Hazard Analysis and Critical Control Points (HACCP) standards result in low-quality inputs, which
undermine the industry’s full export potential. In this context, as direct sources of capital, skills
and technology, foreign investors, both in agro- and food and beverages production, could play a
key role by bringing in skills to improve production processes, increasing production scales, or
assisting in technological upgrading and innovation.87 Apart from leading-edge machinery and
equipment for production, the overall logistics infrastructure represents a priority area of
investment, as modern and sanitized storage facilities and cooling systems are in dire need.
Furthermore, foreign skills and knowledge could also help to address currently unattractive
packaging and design, upscale and expand marketing strategies and increase product
diversification. In the latter case, the development of new products unique to the region could
create the necessary comparative advantage and export potential. The stronger presence of
foreign investors could also help Kyrgyz agro-processors to specialize and become competitive in
particular production stages and more strongly integrate into regional and global value chains.
In the past, the food and beverages industry was able to attract foreign investors – particularly
from the region – and next to mining, has been the third top FDI recipient (UNCTAD, 2015).
Furthermore, according to fDi.Markets88, of all 51 greenfield investment project announcements
between 2003 and 2017, three were realised in the food and tobacco industry with an overall
investment volume of 75.5 million Euro, which created 376 jobs in total.
4.3.5 Specific Measures for the textiles and wearing apparel industries
Similarly, the analysis of obstacles in the textiles and wearing apparel industries points to some
key issues, which calls for counter-measures to guarantee that the industries can utilise their full
growth and employment generation potentials.
87 In the agricultural sector, entry of foreign investors is limited to joint ventures or non-equity forms of production, since the use of
agricultural land is limited to Kyrgyz nations. 88
fDi Markets is a database collecting information on cross-border investment monitor (see. https://www.fdimarkets.com/). The
investment projects listed therein reflect committed greenfield investment projects as well as announcements of such projects.

131
Re-establishment of full production chain to fully exploit production and income generation
potentials. To fill the gap in the textiles and wearing apparel production chain, the missing thread
production, which is currently substituted by imports also from China, needs to be revitalised. The
inferior quality of imported thread paired with the increase in tariffs as a result of the
implementation of the common external tariff (CET) of the EAEU, calls for the import substitution
of threads by domestic production, either through new entrants or vertically integrating existing
local firms. This would not only guarantee a quicker and cheaper supply with local thread but also
allow local cotton and wool producers (farmers) to cater to a bigger market and also provide local
produces with the opportunity to capture more of the value chain and generate more income.
Currently, some promising initiatives in this direction are already in place89 or in the pipeline.
However, since thread production is highly capital-intensive, substantial investments are
necessary to acquire high-quality production facilities. Hence, for this purpose, sizeable funds
need to be made available in terms of low-interest loans. An important funding source is the
Russian-Kyrgyz Development Fund (RKDF), which offers medium- to long-term concessional loans
at interest rates of between 4 and 5% to firms in priority sectors, such as the light industry. As of
August 11, 2017 761 projects worth 246 million US-$ have already been approved, predominantly
in agriculture and the manufacturing industry. Foreign investors could also play an important role
in this context, not only as a source of capital but also of skills, knowledge and know-how.
A more dedicated FDI outreach strategy needs to be encouraged in the textiles industry. Despite
low costs of production, so far, FDI promotion strategies of the past have failed to attract sizeable
foreign investments into the textiles and wearing apparel industries, due to political instability,
governance issues, and competition from lower-cost markets in South-East Asia, (UNCTAD, 2016).
Hence, in view of the positive effects of FDI, a more dedicated and effective FDI promotion
strategy needs to be developed and implemented. Superior access to capital, skills, know-how
and technology through foreign investors would help the textiles industry to address some of its
key challenges by easing access to needed funds, modernising the currently outdated technology,
improving production efficiency or improving poor design and product differentiation capabilities.
Better marketing of Kyrgyz apparel products in regional and global markets to diversify export
markets. Exports of Kyrgyz apparels are regionally concentrated in a few markets: 95% of apparel
exports go to either the Russian Federation or Kazakhstan, which exposes textiles exporters to
strong uncertainties and volatilities stemming from these two markets. Hence, to expand the
customer base and more strongly differentiate export markets, better marketing and an
improvement of the poor marketing capabilities are needed to better place Kyrgyz textiles and
garments products in regional and global markets, particularly in the EAEU.
Better access to finance is imperative for the full exploitation of growth and employment
generation potentials. Firms in the textiles and garment industries still greatly work with old and
outdated machinery and poor equipment. To replace, update and expand existing production
89 Kyrgyzstan: new Tekstil Trans factory to boost textile sector, February 6, 2017:
https://fashionunited.uk/news/business/kyrgyzstan-new-tekstil-trans-factory-to-boost-textile-sector/2017020623406.

132
processes and develop new production capabilities, substantial investments are needed.
However, firms in the industries face non-negligible barriers to finance, which keep them from
exploiting existing growth and employment generation potentials. High interest rates, too
complex application processes and high collateral requirements are most problematic, particularly
for small firms. In view of the rather small banking sector, additional funding sources need to be
made available, which offer administratively simple credits at affordable interest rates. An
important source in this respect is the RKDF, which offers loans of up to 1 million US-$ (at 5% p.a.
in US-$ or at 10% p.a. in KGS), for a period of five years to SMEs.
Upscaling of business operations is key for competitiveness in production to increase. The
majority of firms in the textiles industry operate small-scale production facilities at relatively low
productivity levels, which makes them unattractive and unable to compete for large orders from
big customers. Hence, investments in the expansion of business operations are necessary, which
are, however, made difficult by the sizeable financing barriers that exist in the banking sector and
the lack of affordable and attractive alternatives. In this respect, the Association of Light Industry
(Legprom) is taking important steps. In line with the objective of developing clusters, it is in the
process of setting up a large industrial park (technopolis), which puts textile and garment firms
‘under one roof’. It therefore helps to reduce industry fragmentation and exploit prevailing
production and marketing synergies to increase productivity, product quality, product design
capacities, competitiveness and market outreach. For this purpose, the government already
provided 41 hectar of land.
Compliance with international quality standards needed for products to become exportable,
particularly to the EAEU. Currently many firms in the Kyrgyz textiles and wearing apparel
industries are unable to meet regional and international quality standards or, as has become
necessary since Kyrgyzstan’s accession to the EAEU, the technical regulations of the EAEU. As a
consequence, textiles and wearing apparel firms are unable to acquire the necessary quality
certificates, which bars them from exporting to the EAEU or other markets, such as the EU. Hence,
measures are necessary to improve production processes and subsequently the quality of
products, to ensure their exportability to the EAEU, or even the EU.
4.4 Specific Measures for the Hydro Power Sector
Based on the analysis of the current situation of hydropower generation, there are a number of
initiatives that can be taken to overcome the existing problems which have prevented the
exploitation of the country’s vast hydropower potential to a greater extent.
Food-Water-Energy Nexus and mediation – cooperation the best solution for regional stability
and investment attraction. The International Union for the Conservation of Nature (IUCN), the
EastWest Institute (EWI) and the International Water Association (IWA) assessed potential
pathways for cooperation in Central Asia across the food-water-energy nexus to respond to high-

133
priority challenges. They came up with five Action Plans, which addressed high-priority nexus
challenges with project proposals (IWA, 2015), recommending inter alia:
• A system of payment in exchange for ecosystem service provision, ensuring that wealthier
downstream users cooperate financially in protecting upstream water resources.
Upstream country’s decisions can impact the quality and quantity of water resources for
downstream countries. If upstream and downstream countries share costs, and in effect,
would create a system of payment in exchange for ecosystem service, it could provide
better collaboration and better success in solving challenges. The funds will be used to
monitor and improve water quality.
• Building an integrated basin-wide information system on natural resource use. In order
improve cooperation between upstream and downstream countries, a system should be
created for strengthening information exchange and cooperation at the regional and
national levels.
• Strengthening regional economic integration as a catalyst to simultaneously minimize
border disputes.
• A network of training centres for improved irrigation capacity building and service. There
is high land degradation due to inappropriate irrigation techniques represents a huge
problem to upstream and downstream countries. It is necessary to raise the professional
skills of water specialists, farmers, and water user associations through the establishment
of professional training centers. These centers could improve knowledge on the use of
water in the basin, and equip water users to continue re-evaluating water use practices.
• A network of Nexus Knowledge & Innovation Centres to tackle food insecurity. This would
improve working knowledge on nexus issues, and would create cooperation on the nexus
at regional and national levels. It would define each country’s water demand, and would
verify existing data on water use and water needs (IWA, 2015).
Kazakhstan could play an important role here as a regional mediator in Central Asian water
questions, and as it is economically the strongest of the Central Asian countries. The Chu-Talas
Commission (Kazakhstan-Kyrgyzstan) is taken as a success story for water cooperation in Central
Asia supported by the United Nations Economic Commission for Europe (UNECE) and other
donors (Zinzania, Mengab, 2017). All the countries in the region agree with its strategic objectives,
but cannot find mutually acceptable forms of water resource use. Nevertheless, if achieved,
regional cooperation would be beneficial for all the involved parties.
Electricity tariff increase. To make the electricity sector more sustainable, it is important to
increase electricity tariffs. It would help to solve inefficiency in production, limit rising wasteful
demand and provide funds for investments in the sector. However, it should be noted that it is
important to strengthen targeted assistance to low income households as part of the social
security dimension of such a reform package. Currently the safety net does not cover all in need
and offers only modest support to the extreme poor.

134
Increasing the price will help create jobs, improve comfort and health, and increase the reliability
and quality of energy services, and in general will improve the quality of life for Kyrgyz citizens.
However, there is considerable scepticism amongst the populace regarding such plans, presenting
a political challenge for policymakers in the country.
Coherent policies. Hydropower project planners highlight the need for guidance through
integrated programmes and coherent policies in the energy sector as regulatory documents often
lack coverage on how to follow and implement requirements (Ministry of Energy and Industry of
the Kyrgyz Republic, 2013).
Figure 4-2: Cumulative Renewable Energy Investment in Selected Countries, 2004-2015
Source: UNECE (2017)
Hydropower project planning. It is very important to determine the criteria for the selection of
economically feasible projects. Project planners should take into account manifold aspects,
among others: hydrological, geological, technical, and territorial socio-economic conditions as
well as seismic activities, landslides, sedimentation, as well as demographics and changing
urban/rural population (GoK, 2009; Ministry of Justice of the Kyrgyz Republic, 2015; Abdolvand et
al., 2015).

135
Figure 4-3: Urban/rural population perspectives 2010-2100
Source: GoK (2009)
The education system – knowledge sharing. Several studies have pointed out that the key
setback for hydropower development is a lack of local qualified experts who can install and
maintain hydropower projects. The few Kyrgyz specialists available are in high demand and they
are generally unmotivated to share or teach their knowledge because there are few incentives for
knowledge sharing. The situation could be improved by government involvement and organised
training courses.
Green Energy Systems. Due to seasonality, streams are more likely (than larger rivers) to freeze in
winter. This leads to unfavourable economic conditions for commercial SHP plants (WSHPDR,
2016). Therefore, it is advisable to combine them with other RE systems to ensure a continuous
energy supply (IHA).
Financial support. A major barrier for rural renewable energy projects is affordability and the
absence of financial mechanisms that are adapted to the renewable energy connected to the
isolated grids (not connected to the central electricity grid). Financial support in the form of (i)
affordable credits, (ii) subsidies on construction materials or (iii) donor support from the Kyrgyz
Government or international organisations could help in this regard.
One person in charge in community projects – could help operation & maintenance. Non-repair
of damaged systems has been identified as a major restriction in many rural community based
projects (Nachtnebel, 2014; Liu, Pistorius, 2012). Reasons for non-repair of SHP systems included
non-availability of spare parts, high cost of repair and maintenance, long travel distances as
well as negligence interfered with the repair. Improving these aspects might help avoiding
negligence issues (Liu, Pistorius, 2012).
Women’s involvement could help informational barriers. Public acceptance of renewable energy
has been identified as one of the main barriers to SHP development in Kyrgyzstan (Nachtnebel,

136
2014). In studies it has been observed that women were less impartial and more interested in
maintenance of RE systems. The reason for this is that men are often responsible for the labour-
intensive duties of RE systems (e.g. assembling/refilling a solar barrel by hand), while women are
the actual beneficiaries (e.g.in homemaking tasks). Therefore, greater involvement of rural
woman in SHP project would help them to be successful in long run (Liu, Pistorius, 2012).
4.5 A competitive exchange rate
A slightly undervalued real exchange rate increases the chances of a successful industrial
development. In contrast to the sector-specific issues discussed in the previous section, the
exchange rate is often considered as the most horizontal industry policy tool. Kyrgyzstan has no
official exchange rate target and maintains a managed float strategy with occasional interventions
to mitigate fluctuations in the exchange rate of the Som. As a result, and partly due to the inflow
of foreign assistance, the economy has operated with an almost chronically overvalued exchange
rate. With regards to trade with EAEU partners, the exchange rate appears to be even more
strongly overvalued, especially since 2015. This overvalued real exchange rate acts like a uniform
tax on Kyrgyz exports and undermines the competitiveness of Kyrgyz products. With the ongoing
dismantlement of remaining barriers to trade within the EAEU, such factors as competitive
exchange rate become even more important.
Cross-country evidence (e.g. Rodrik, 2008) shows that an overvalued exchange rate makes the
already difficult task of engineering an industrial development even more difficult. This implies
that Kyrgyzstan would be well advised to aim for a slightly undervalued exchange rate in order not
to undermine other efforts in this respect. Since the interest rate has been brought down
drastically in the course of 2016 (World Bank, 2017a) to 5%, the government may consider
additional measures. In particular, it could use the managed float regime (either direct
interventions to lower the som exchange rate or lifting of interventions that prevent the exchange
rate to decline) to weaken the exchange rate, while at the same time keeping an eye on the
impact of a depreciation on debt sustainability90. How exactly and at what speed the exchange
rate depreciation should be engineered is to be seen but it should be borne in mind that a
competitive exchange rate is, in combination with industrial policy measures, a sine qua non
condition for an export-led industrial development strategy as is necessary for Kyrgyzstan.
Kyrgyzstan could benefit from a proper exchange rate co-ordination within the EAEU. In light of
the EAEU arrangements, pressures on exchange rates in one of the EAEU partners also induce the
need for symmetric adjustments in other members. Some form of exchange rate coordination is
desirable in the context of the EAEU to avoid beggar-thy-neighbour scenarios, which already
became an issue recently as the sharp depreciation of the Russian rouble in 2014 forced a cascade
90 This is imperative as foreign debt is denominated in foreign currency so that a depreciation of the domestic currency raises the
foreign debt (in domestic currency terms).

137
of devaluations in the partner countries pressurized and displeased by sudden significant external
competitiveness gains of the Russian producers.
4.6 Aligning macroeconomic policies with the needs of industrial development
The general monetary and fiscal policy frameworks ought to be supportive of reindustrialization
and competitiveness, which appears to be a challenge on account of the multiple external and
internal vulnerabilities in Kyrgyzstan. Great pragmatism should be taken in implementing
monetary and fiscal policies to ensure this does not lead to detrimental effects for industrial
competitiveness.
Balancing public investments and industrial support measures with the need for fiscal
consolidation. While public debt sustainability should remain the guiding principle of fiscal policy
framework, it is important that fiscal consolidation effort is carefully adjusted as regards its
specific revenue and expenditure components. In particular, it is important to avoid excessive
pressures on the already struggling agricultural and manufacturing sectors and ensure that public
investment capable of crowding-in private investment does not fall victim to fiscal consolidation
efforts.
The primary focus of fiscal policy should rather be on permanent measures improving efficiency of
tax administration and effectiveness of public spending in light of weak institutions. Similarly,
efforts to broaden and diversify the tax base should continue, but caution should be exercised to
smooth social costs of contracting informal economy. So rather than trying to suppress informal
sector activities, the industrial policy measures should lure informal firms into the formal
economy.
The overdue review of the subsidies (IMF, 2017) that is demanded by the IMF in the context of
the current 3-year (2016-2018) Extended Credit Facility (ECF), may also lead to higher revenues if
it leads to a tariff reform in the energy sector that curtails existing energy subsidies. These
additional proceeds may be channelled into the support for industrial development.
Monetary policy is severely constrained by the need to satisfy multiple objectives
simultaneously. Given the absence of external sector stability – a prerequisite for effective
inflation targeting – the effectiveness of the current monetary policy framework is questionable.
The situation is aggravated through weak monetary policy transmission channels on account of a
weak financial system and high dollarization. The de facto capacity of the current monetary policy
setup to anchor inflationary expectations and mitigate nominal shocks is rather limited.
Nevertheless, monetary policy should strive to find the right balance between external
competitiveness, risks for the financial sector and keeping inflation at bay. As conventional tools
of the inflation targeting framework alone do not provide sufficient instruments to allow for a
more flexible approach to simultaneously address these objectives, this calls for a mix of
instruments to be implemented to insulate against free movement of speculative capital, i.e.
capital controls and macroprudential measures focusing on capital flow management thereby
relaxing the constraints of the ‘impossible trilemma’ should such a need emerge.

138
Considering a switch to a nominal GDP targeting regime. Alternatively, Kyrgyz authorities may
also wish to consider the possibility of switching from an inflation targeting to a nominal GDP
targeting policy. For this reason an alternative monetary regime, in particular a nominal GDP
targeting approach may constitute a more appropriate policy framework that is better suited to
deal with terms-of-trade and other external shocks (Frankel, 2012) and maintaining a stable and
competitive real exchange rate and low real interest rates. Given the current inflation target (5-
7%) and the average real growth rate in the past (approximately 5%), a target set at around 10-
12% appears to be reasonable. The nominal GDP targeting approach would avoid unreasonable
monetary reactions in case of external shocks or internal supply shocks (e.g. further incidences at
Kumtor gold mine). The advantage of this regime over the current inflation targeting regime is
that it would allow Kyrgyzstan to follow a more rule based monetary policy without constant need
to resort to discretionary policy action as under the current inflation targeting policy.
Synchronising wages with productivity growth. Wage policies need to be pursued with care,
pursuing the double objective of further reducing poverty and raising living standards on the one
hand and improving international cost competitiveness on the other hand. Until now, the wage
level in Kyrgyzstan, especially in the two strategic manufacturing industries, are very low by
international standards. Nevertheless, wage increases over the past decade have been quite high
compared to the development of labour productivity. For this reason a wage setting rule that
aims for wage progression aligned with labour productivity growth should be installed (see for
example also Nassif et al., 2017). This should help to maintain the currently highly competitive
wage rates. At the same time minimum wage rates in all sectors should be increased to a level
where they are binding since current minimum wage levels are far below market rates. How this
wage policy approach and minimum wage rates can be applied to the informal economy is
unclear but implementing the scheme in the formal part of the private sector could be a first step.
139
4.7 Priority Areas in Improving the Economic Framework Conditions
Focus on the key weaknesses in the broader economic framework. Like many developing
countries, Kyrgyzstan faces a plethora of problems related to the economic framework conditions.
Given the severe resource constraints it is imperative to identify the key bottlenecks that impede
industrial development, hold back entrepreneurship and firm growth. According to information
obtained from stakeholders the main obstacles for businesses, which the Kyrgyz government may
want to consider prioritising, are summarised in the following. To this we add transportation and
logistics as an issue which the Kyrgyz authorities have already make one of their priority actions.
The impediments to growth include public goods which are typically beyond the control of firms
as well as shortcomings in the management capacity and entrepreneurial spirit on the side of
entrepreneurs themselves. With regards to the latter, the main responsibility lies with the firms
themselves but public action may help to overcome some obstacles without interfering directly
with private sector activities. In contrast, in the case of public goods, by definition the
government has a prime responsibility. The public goods include both industry- and trade-specific
elements as well as general framework conditions.
4.7.1 Industry-related and export-oriented framework conditions
Weak trade infrastructure annihilates opportunities of export-oriented industries. A key issue
for Kyrgyz manufacturing firms are technical regulations91, standards and certifications. These
issues are an increasingly important issue for firms worldwide but the situation is particularly
acute in Kyrgyzstan, affecting domestic sales as well as export activities. To some extent the
problem lies within the firms as many of them are unable to meet international or even regional
quality and safety standards. For example, for firms in the informal economy official export
activity is ruled out due to the lack of necessary certifications. But even for registered firms
compliance with standards and technical regulations is difficult. This can be considered as the first
layer of the standardisation and certification problem.
The second layer is the fact that with the accession to the EAEU, Kyrgyz firms have to comply with
technical regulation of the customs union if they were to benefit from the large common market.
The technical regulations of the EAEU are more demanding than Kyrgyz national regulations
(UNECE, 2015). The EAEU’s approach to technical regulations is a Unified List of Products, which
are subject to mandatory requirements. This Unified List includes most of Kyrgyzstan’s major
export items, including products of the light-industry (e.g. knitted goods, garments, carpets, fur
products) as well as food products and beverages (UNECE, 2015). Moreover, Kyrgyz firms are also
struggling with fulfilling international and regional (i.e. EAEU) standards, including sanitary and
phytosanitary (SPS) control measures. The national registry of standards, maintained by the
Centre for Standardisation and Metrology (CSM) is dominated by the regional – i.e. CIS – GOST92
standard. While there are attempts to harmonise GOST standards with international standards
91 A technical regulation is a legal act that defines the set of safety requirements that a product has to comply with.
92 GOST standards were originally developed by the government of the Soviet Union and means ‘State Standard’ (gosudarstvennyy
standart).

140
(ISO), important differences remain for example in the field of SPS rules. The GOST standards are
numerous and detailed, making it difficult for the private sector to fulfil them. The standards are
equally difficult to supervise and control. Compliance with the required standards is challenging
especially for a small country like Kyrgyzstan which features insufficiently funded and staffed SPS
agencies.
Hence, Kyrgyzstan currently finds itself in the difficult situation that it is bound to comply with the
GOST-based SPS system. Given that the Kyrgyz food industry is mainly exporting to EAEU partners
(Russia and Kazakhstan) plus Uzbekistan, it is still advisable to strive for compliance with the
requirements of the GOST standards. The SPS requirements illustrate well the general
infrastructure-related problems associated with standardisation and certification: the lack of up-
to-date certification bodies and testing laboratories where domestic exporters could obtain all
necessary certificates. This constitutes the third layer of the standardisation and certification
problem. Due to the insufficient capacity of national laboratories, EAEU members such as
Kazakhstan do not recognise certificates of compliance for food products issued in Kyrgyzstan and
insist on a re-certification by an accredited laboratory in Kazakhstan (UNECE, 2015).
Some changes for the better but still a long way to go. Public authorities seem to be fully aware
of the problem and there has been substantial improvement since EAEU accession thanks to
Russian support for the establishment of testing and certification facilities in Kyrgyzstan.
Nevertheless, consultations with firms from the food and beverages industry revealed that as of
October 2017 there are still instances where food products need to be sent abroad for testing
which creates extra costs. Moreover, all food and beverage companies that are HACCP certified –
an UN food safety standard that is increasingly requested by EAEU partners93 – have obtained
their certification from foreign certification companies. These certificates are expensive and are
an option only for the larger companies in Kyrgyzstan.
Another common problem is inefficiencies and hold-ups at border controls (UNECE, 2015). Most
of the border control posts are not equipped with up-to date facilities that allow for a speedy
border clearance. Given the insufficient domestic capacities, support from EAEU partners in
improving the quality of the services at border control posts seems inevitable. Hence, in order to
speed up the build-up of appropriate trade infrastructure, Kyrgyzstan is dependent on foreign
support from EAEU partners and international donors. Technical co-operation should hence be
focussed on this area.
Another issue with customs control are informal payments. According to a survey by UNECE
(2015), more than 70% of the firms that were interviewed reported that they make in the process
of customs clearance. These payments may serve the purpose of speeding up the process and
avoid long delays or risk the damage of goods in the course of physical inspection. But at the same
93 HACCP stands for Hazard Analysis and Critical Control Points and are a set of food safety testing principles recommended by the
Codex Alimentarium issued by the United Nation’s FAO.

141
time they also add to the costs of businesses therefore counteracting international
competitiveness.
Skill shortages show up mainly at the secondary level of education. The opinions of businessmen
and businesswomen on the availability of skilled labour force vary considerably across firms and
sectors but there is a general pattern. Most stakeholders were of the opinion that the skills of
engineers and other professionals with tertiary education were deemed adequate, while severe
shortcomings at the secondary level were reported (e.g. machine operators, technicians for repair
works). The low and apparently deteriorating qualification of medium-skilled workers is related to
the insufficient quality of vocational training schools. Major problems of vocational training
schools include the lack of modern equipment which would allow training apprentices on up-to-
date machinery; outdated curricula and a lack of knowledge on the side of vocational education
teachers. While international donor organisations such as ADB and GIZ of Germany implemented
several vocational education and skill development projects, especially in the garment industry, as
of 2017 the availability of skilled textile workers has been reported to be a critical issue.
Larger firms (respectively industry associations such as Legprom) respond to the shortage of
qualified skilled workers by providing in-house training for new staff or establish a technical
training centre in co-operation with existing vocational training schools. The latter have been
realised with the technical and financial support from international donors.
In order to ease this problem of a skill shortage at the medium skill level, more investment in
vocational schools is needed. The initial vocational training is a public good which is why the
government clearly has a responsibility in this area. At the same time, current status quo when
many firms train their staff in-house anyway may suggest the implementation of a dual vocational
training system. In such a dual system apprentices receive formal education at vocational schools
but practical training in the firm where they are already employed during the duration of the
apprenticeship (see Box B4.1). This approach envisages a burden-sharing between government
and the private sector which has the potential to be advantageous to both sides.
Given the budgetary constraints, initiatives in the realm of vocational training need to focus on
and be tailored to the requirements of the strategic industries. By providing training subsidies, for
example, the government could increase the interest of private firms to train apprentices. This
would be in line with the envisaged investments into the education and training system for ‘light
industries’ that feature prominently in the government’s ‘Jany Dorogo – Kyrk Kadam’ (40 Steps)
programme as one of the public policy measures supporting the creation of clusters in these
industries94. Importantly, the quality of the training provided by firms and their capacity with
respect to qualified and experienced staff needs to be closely monitored.
94 See Kadam 25 of the programme.

142
Box B4.1 The dual system in Germany
An essential feature of vocational education and training in Germany is the so-called dual system.
Under the dual system the initial vocational training takes place at two different places, a
company and a vocational school. Typically, the initial vocational training period under the dual
system is three years (Hippach-Schneider et al., 2007) and young people can start their training
immediately after completion of compulsory education with no additional requirements. Trainees
learning under the dual system enter a private-law vocational training contract (Lehrlingsvertrag)
with a company. The actual training takes place mainly in that company where trainees typically
spend 3-4 days per week but supplemented with 1-2 days training at a part-time vocational school
(Hippach-Schneider et al., 2007). The in-company training of apprentices is monitored by the relevant autonomous industrial bodies (Chambers). These bodies also control the quality and
suitability of enterprises and the training personal. Upon completion of the vocational training
course, trainees have to pass an examination (Lehrabschlussprüfung) and receive their certificate.
The dual system is an institutional arrangement whose primary function is to guarantee the
supply of well-trained skilled workers. Binding requirements in the training directives by the
Federal Government ensure a uniform standard concerning the training quality. As a consequence
people completing an initial vocational training programme for one of the 344 training
occupations have the necessary qualifications and competences to practice an occupation as a
skilled worker (Facharbeiter). The German government actively supports the in-company training
of young people in the framework of the dual system. This means that the government aims at increasing the supply of training places. An illustrative example is the Federal Ministry of
Education and Research’s ‘Jobstarter’ Programme which supplements the ‘apprenticeship pact’ of
2004 (Nationaler Pakt für Ausbildung und Fachkräftenachwuchs in Deutschland) between the
Federal Government and the employers’ association of German industry (Hippach-Schneider et
al., 2007).
It is often argued that the German vocational training system for skilled workers is one of the
major strong points in Germany’s industrial policy that to a large extent takes the form of
Ordnungspolitik, the German variant of general framework polices. The fact that skilled workers
are to a large extent trained within companies means that workers from the very beginning of
their vocational training gain practical on-the-job experience but at the same time they also receive formal education at vocational schools. Since the cost for vocational training has to be
borne by the companies themselves (with public incentives for offering vocational training or
disincentives for companies not doing so) the investment in skilled workers in the dual system is
also more likely to be aligned with demand in industries. This is because firms in declining
industries with no need for additional personnel are less likely to offer initial training places. The
fact that the in-company training takes place in a framework of well-defined qualification criteria
and that actual training is also monitored ensures that trainees receive high quality education and
training. Another advantage of the dual system is that young people learning in companies
acquire highly specialised skills needed in the particular company with which they have their
training contract. This specialised knowledge is important in industries that build on incremental (and partly non-codified) in-house knowledge such as the automobile industry or the machinery
industry (Bock-Schappelwein et al., 2013).

143
4.7.2 General framework conditions
Continue co-operations with neighbouring countries to improve transport and logistics
infrastructure. As in most developing countries, there are severe shortcomings in road and rail
infrastructure which are partly due to geographical factors (such as land-lockedness and an
average elevation of 2,750 meters above the sea level95). In the case of the road infrastructure the
main issue is the degradation of roads which is owed to a lack of fresh investments and
maintenance. In contrast, the railroad network is in reasonable condition but the network is very
limited and the Northern part of the network is directly not linked the network in the Southern
part of the country.
While, apart from one company in the non-metallic mineral resources sector, firms did not
mention transport and logistics (high tariffs charged by freight forwarders) as one of the key
obstacles that foil their business opportunities, improvements in this area are supportive of cost
competitiveness.
Therefore it is reasonable that the government fully commits and supports further improvements
in the physical transport infrastructure. Interesting projects already under discussion include the
railroad line from Osh to the Chinese border post at Torugart and further to the nearby terminal
of Kashgar (China) – would lower transport costs for firms in the South of Kyrgyzstan. In fact, this
railroad project could be of strategic importance as it would turn Kyrgyzstan into a transit country
linking Uzbekistan with China. In general, Kyrgyzstan should welcome the provision of foreign
finance for infrastructure projects such as those, which form part of China’s “One Road – One
Belt“-strategy, should be supported by Kyrgyz authorities.
Lack of legal certainty for firms risks to hold back investment in manufacturing activities. There
is overwhelming consensus that the respect of property is one of the quintessential requirements
for the functioning of a market economy. In this respect, the positive aspect in Kyrgyzstan is that
the liberal economic stance makes it comparatively easy to set up a business. For this reason
Kyrgyzstan also fares comparatively well in the Doing Business Ranking of the World Bank,
occupying rank 75 in 2016, far ahead of more dynamic lower middle income countries such as
Cambodia (131) or Laos (139) (World Bank, 2017a). While the law provides for a standard
protection of investments (domestic and foreign), loose enforcement of these laws undermines
the security of existing investments and private property (UNCTAD, 2017). For these reasons
there remains a perceived risk of expropriations and illegal seizing of existing companies by
private groups. This perception in the private sector is in line with a study by the World Bank and
the Swiss Cooperation Office in Kyrgyzstan (2011), according to which only 34 per cent of
respondents were satisfied with court protection of property rights. In this context it is
noteworthy that legal disputes between the Kyrgyz government and foreign investors are
numerous and typically lengthy. While conflicts with foreign investors are discouraging for
potential new investors so urgently needed, the even bigger problem associated with the lack of
95 Given the mountainous terrain, there is for example no connection between the Southern railway line leading from Issyk-Kul
region via Bishkek to Kazakhstan and the Southern lines.

144
sufficient protection of property rights is that small domestic firms that happen to be successful
are a primary target for illegal seizing by private groups. Such firms typically do not have the
financial means to enter into a legal case with the government, so that for many firms the most
effective form of protection against such action is to get on good terms with government
authorities.
Irrespective of whether these concerns about illegal seizing of existing companies are valid and to
what extent, the government must signal its clear assertiveness to change this situation for the
better. Since even in ‘light-industries’ such as textiles the amount of investments at stake is much
higher than, for example, in most services industries, the manufacturing sector can only develop
and grow, when entrepreneurs can rely on an effective protection of their assets and businesses.
In present environment, a private-market driven industrial development strategy has a limited
chance to succeed.
Curb the rampant informal sector activities by providing incentives for the formal sector. With
between a quarter (official national data) and more than half (UNDP) of value added produced in
the informal sector, the shadow economy constitutes an obstacle to industrial development for at
least three reasons. First of all, productivity is considerably lower in the informal economy
because it is characterised by small scale production and under-employment of workers. Secondly
it is also a drain on the national budget due to the foregone tax payments and social security
contributions. Thirdly, people employed in the informal sector cannot rely on even minimum
labour standards or minimum wages.
Given that informality is also wide-spread in strategic manufacturing industries such as garment
production, a fierce move against the shadow economy is not recommendable as it would be
disastrous from a social (employment) and an industrial development perspective. Instead, a
more viable solution to get on terms with the issue of informality seems to be to provide strong
incentives for firms to move to the formal economy. An appropriate starting point for this would
be tax incentives (see section 4.3). To further the establishment of formal firms, also outright tax
holidays for informal firms that decide to register could be considered. Such a measure would be
characterised by high visibility and therefore would also be a strong signal.
Fighting extra costs. The high incidence of bribery adds extra costs to businesses directly but also
leads to wasteful use and outright abuse of public funds. The fight for transparency and
accountability should be made a priority. In this respect the formally declared Step 20 in the “40
steps to New Era”, in the country’s digital strategy Taza Koom sets the way forward.
4.7.3 Support for technological and managerial skills in the private sector
Strengthening the sense of entrepreneurship. Consultation with stakeholders suggests that many
businessmen and businesswomen consider the collection of information on business processes
and market potential of their products as the sole responsibility of the government. While public
investment and export promotion agencies and industry associations (e.g. the Kyrgyz Union
Manufacturers and Entrepreneurs or Legprom for the textile industry) should be able to provide
valuable information about market prospects, it should be the responsibility of entrepreneurs

145
themselves to collect and analyse such information. The same is true for necessary documents
and certificates needed for export. Some awareness raising that entrepreneurship involves not
only the technological capability to produce a product but that the production process requires
careful planning, co-ordination of procedures within the firm, identification of market potential
and also marketing and branding is therefore warranted. The business angels concept (see section
4.3) could be one instrument to strengthen the much-quoted entrepreneurial spirit also in Kyrgyz
firms.
Mind the gaps in industrial value chains. Consultations with stakeholders revealed that in several
industries, including the textile sector and agro-food processing, the lack of complete domestic
value chains can create disadvantages for domestic firms vis-à-vis foreign competitors. In the
textile industry, for example, both domestic cotton and wool are available. Currently, however, it
seems that neither cotton nor wool processing is profitable in Kyrgyzstan due to the low volumes
involved but also the low quality of these inputs. Given the low wages in Kyrgyzstan and the long
tradition in garment production, there are clear comparative advantages in this industry but these
could be sharpened if the existing domestic inputs could be better exploited. This would require
investment in the physical infrastructure for textile processing and a quality upgrading. A cluster
approach, as envisaged in Kyrgyzstan’s regional development plan, appears to be highly
appropriate for analysing holes in the domestic value chains in strategic industries. At the same
time, absent any large foreign investments96, closing the existing gaps in value chains also requires
government support for such investments (or outright public investments). The recent opening of
a textile factory producing fabrics, which benefited from a subsidised loan from the Russian-
Kyrgyz Development Fund, is a good example of the initiatives that are needed. Still, there are far
too few such investments, and gaps in the value chain, notably in the production of yarns, persist.
This suggests that additional public resources for loss financing of new operations that attempt to
fill gaps in domestic value chains are warranted. Such support is required in the initial phase but
can only be granted temporarily with clear indications about the period over which such support
is granted. Also, such support should only be released after careful identification of essential
inputs along the value chain where latent comparative advantages exist. This requires a proper
assessment of import substitution, i.e. domestic production, and relying on the integration into
regional value chains, in cases where regional partners can provide required inputs at lower costs
or in superior quality. For such assessments, public authorities should enter into close dialogue
with private sector actors. This way, an appropriate trade-off can be struck between closing the
most critical gaps in the domestic value chains in strategic industries and exploiting the benefits
from trade with (regional) partners.
96 The involvement of Turkish business in specific agro-industries (e.g. kidney beans) can have a strong positive impact on export
activities.

146
4.8 Prioritizing support for strong and inclusive growth
Some of the constraints facing Kyrgyzstan are specific to the country and industries; however,
many of the challenges discussed in this Chapter are common in lower-middle income countries.
Kyrgyzstan cannot address all the shortcomings in a short period of time to improve the
competitiveness of the manufacturing industries across the board. Given the financial and human
resource limitations, again common across countries at a similar income level, Kyrgyzstan should
focus its efforts on the industries which have strong and inclusive growth potential to make a
significant difference in the socio-economic conditions within the period of country’s medium
development plan. To realize the full potential, policies from macro to micro levels should be
aligned for the purpose of making the labour intensive industries competitive. Such multi-level
support include competitive exchange rates, investments in transport infrastructure,
establishments of testing laboratories, technical upgrading to meet regional and international
product standards, ease of access to finance for upscaling and modernizing production
equipment, and attracting foreign capital, technologies and managerial skills through FDIs. The
focus should encompass not only the level of national policies but addressing the bottlenecks of
the targeted industries through the coherence and coordination of bilateral and multilateral
assistance programmes. Strong competitiveness orientation across stakeholders is the key for
strong and inclusive growth; therefore, the performances of the industries should be regularly
compared with and evaluated against the benchmark industries in successful countries at a similar
income level and comparable geographic conditions.

147
References
Abbink, K., Moller L.C., O’Hara S. (2009). Sources of Mistrust: An Experimental Case Study of a Central Asian
Water Conflict. Environ Resource Econ. Published 2010. 45:283–318 DOI 10.1007/s10640-009-9316-2
Abdolvand B., Mez L., Winter K., Mirsaeedi-Gloßner S., Schutt B., Rost K.T., Bar J. (2015). The dimension of water in Central Asia: security concerns. Environ Earth Sci 73: 897. https://doi.org/10.1007/s12665-014-
3579-9
ADB (2013a). Private Sector Assessment Update: The Kyrgyz Republic. 2013, Mandaluyong City, Philippines:
Asian Development Bank.
ADB (2013b). Power Sector Improvement Project, Study on the Wholesale Electricity Transaction
Settlement System, Volume 2 - International Experiences. Draft final Report-Version 2. June, 2013.
ADB (2014a). The Kyrgyz Republic: Strategic assessment of the economy—Promoting inclusive growth,
Mandaluyong City, Philippines: Asian Development Bank.
ADB (2014b). Country Partnership Strategy, Kyrgyz Republic. 2013-2017. Sector Assessment: Transport,
Mandaluyong City, Philippines: Asian Development Bank.
Akcabar (2016). In Kyrgyzstan, tariffs for electricity will remain until the end of the year. Available from:
https://www.akchabar.kg/news/v-kyrgyzstane-tarify-na-elektroenergiyu-sohranyatsya-do-konca-goda/
Bai, J., Jayachandran, S., Malesky, E. J., Olken, B. A. (2017). Firm Growth and Corruption: Empirical Evidence
from Vietnam. Mimeo.
Baumol, W.J. (1967). Macroeconomics of unbalanced growth: the anatomy of urban crisis, American
Economic Review, 57(3), pp. 415‑426.
Bertrand, T., & Squire, L. (1980). The Relevance of the Dual Economy Model: A Case Study of Thailand.
Oxford Economic Papers, 32(3), pp. 480-511.
Birkman L., Kaloshkina, M., Khan, M., Shavurov, U. and Smallhouse, S. (2012). Textile and Apparel Cluster in
Kyrgyzstan. Harvard Business School. http://www.isc.hbs.edu/resources/courses/moc-course-at-
harvard/Documents/pdf/student-
projects/Kyrgyzstan_Textile%20and%20Apparel%20Cluster_Final_May%204%202012.pdf [Accessed: 19
October 2017].
Blanchard, O., Gali, J. (2007). Real Wage Rigidities and the New Keynesian Model, Journal of Money, Credit
and Banking, 39, pp. 35–65.
Bock-Schappelwein, J., Hölzl, W., Janger, J., and Reinstaller, A., (2013). Die Rolle von Bildung für die
wirtschaftlichen Perspektiven Österreichs, WIFO Monthly Report 2/2013, pp. 121-133.
Bozieva, Z.A. (2016). Level and Scale of Shadow Economy in Kyrgyzstan. Herald of Kyrgyz-Slavic University of
Kyrgyzstan, Volume 6(6).
Calvo G.A. and C.M. Reinhart (2002), Fear of Floating, The Quarterly Journal of Economics, Oxford University
Press, Vol. 117(2), pp. 379-408.
Castany, L., López-Bazo, E. and Moreno, R. (2005). Differences in Total Factor Productivity Across Firm Size.
A Distributional Analysis, University of Barcelona Working Paper.

148
EBRD (2013). Kyrgyz Republic: Water Supply and Sanitation Strategy. Available from:
www.adb.org/projects/46350- 001/main
Eurasian Research Institute (2015). Overview of the Gold Mining Industry of Kyrgyzstan, weekly e-bulletin,
No.38, 20 October – 26 October 2015.
FAO (2012). AQUASTAT. Kyrgyzstan. Viewable at:
http://www.fao.org/nr/water/aquastat/countries_regions/KGZ/ [Accessed : 23 October 2017].
FAO (2013). Fish Species Introductions in the Kyrgyz Republic. Available at:
http://www.fao.org/docrep/018/i3268e/i3268e.pdf [Accessed: 23 October 2017].
FAO (2014). Fishery and Aquaculture Profiles. Kyrgyz Republic. Available at:
http://www.fao.org/fishery/facp/KGZ/en [Accessed: 23 October 2017].
FAO (2015). FAO Country Programming Framework. Kyrgyz Republic. 2015-17. Available at:
http://www.fao.org/3/a-au213e.pdf [Accessed: 15 October 2017].
Frankel, J. (2012). Product price targeting—a new improved way of inflation targeting, MAS Macroeconomic
Review, XI(1), pp. 78-81.
German Advisory Council on Global Change (WBGU) (2007). Climate Change as a Security Risk. German
Advisory Council on Global Change; Earthscan: London, UK, 2007; p. 271.
Government of the Kyrgyz Republic (2009). Second National Communication of the Kyrgyz Republic to the
UN Framework Convention on Climate Change. Available from:
www.unfccc.int/resource/docs/natc/kyrnc2e.pdf
Government of the Kyrgyz Republic (2014a). Resolution No. 660 from 20 November 2014. Available from:
www.gov.kg
Government of the Kyrgyz Republic (2014b). Governmental Plan for Export Development of the Kyrgyz
Republic 2015-2017. Annex.
Government of the Kyrgyz Republic (2015). The Kyrgyz Republic Government Decree No 507 of 20 July
2015. Available from http://cbd. minjust.gov.kg/act/view/ru-ru/97764?cl=ru-ru
Hallward-Driemeier, M., & Nayyar, G. (2017). Trouble in the Making? The Future of Manufacturing-Led
Development: The World Bank.
Haraguchi, N. (2016a). Manufacturing Development: The Role of Comparative Advantage, Productivity
Growth, and Country Specific Conditions. In A. Noman & J. Stiglitz (Eds.), Efficiency, Finance, and
Varieties of Industrial Policy (pp. 390-446). New York: Columbia University Press.
Haraguchi, N. (2016b). Structural change and manufacturing development. In J. Weiss & M. Tribe (Eds.),
Routledge Handbook of Industry and Development. Oxford and New York: Routledge.
Haraguchi, N., Cheng, C.F.C., Smeets, E. (2017). The Importance of Manufacturing in Economic
Development: Has This Changed?, World Development, 93.
Hausmann, R., and Rodrik, D., (2003). Economic development as self-discovery, Journal of Development
Economics, 72(2), pp. 603-633.
Helvetas Kyrgyzstan (2004). Fruit and Vegetable Processing Industry in Kyrgyzstan Development Strategy.
Available at: http://www.value-chains.org/dyn/bds/docs/302/Fruit%20-
%20Veg%20Processing%20Industry%20Dev%20Strategy.pdf [Accessed: 23 October 2017].

149
Hippach-Schneider, U., Krause, M., and Woll, C., (2007). Vocational education and training in Germany.
Short description, Cedefop Panorama series, 138.
IEA (2015). Energy Policies Beyond IEA Countries: Caspian and Black Sea Regions 2015, International Energy
Agency Publications, Paris. Available from: http://dx.doi.org/10.1787/9789264228719-en
IHA (n.d). Clean energy systems. Available from: https://www.hydropower.org/topics/policy/clean-energy-
systems
ILO (2012). Skills for Trade and Economic Diversification in the Kyrgyz garment sector. Employment Report
No. 19.
IMF (2016a). Kyrgyz Republic: Selected issues, International Monetary Fund Country Report No. 16/56,
February.
IMF (2016b). Kyrgyz Republic. Staff Report for the 2015 Article IV Consultation and First Review under the
Three-Year Arrangement under the Extended Credit Facility, IMF Country Report, No. 16/55, February
2016.
IMF (2017). Kyrgyz Republic. Third Review under the Three-Year Arrangement under the Extended Credit
Facility, IMF Country Report, No. 17/143, June 2017.
IWA (2015). Triggering the Cooperation Across the Food-Water-Energy Nexus in Central Asia. Available
from: http://www.iwa-network.org/news/triggering-the-cooperation-across-the-food-water-energy-
nexus-in-central-asia/
Jenish, N. (2014). Export-driven SME Development in Kyrgyzstan: The Garment Manufacturing Sector,
University of Central Asia Working Paper, No. 26.
Jorde, K. and Terenteva, O. (2009). Regional Reports on Renewable Energies-8 Country Analyses on
Potentials and Markets in Central Asia. Kyrgyzstan. Eschborn. Available from
www.giz.de/expertise/downloads/gtz2009-enregionalreport-zentralasien-gesamtpublikation.pdf
Kahn, M.H. (2013). Technology Policies and Learning with Imperfect Governance, in : Stiglitz, J.E., Lin, J.Y.
(eds), The Industrial Policy Revolution I, Pagrave McMillan, New York.
Kaldor, N., (1967). Strategic Factors in Economic Development, New York: Ithaca.
Kaseeva, G. (2013). Processor Driven Integration of Small Farmers Into Value Chains in Kyrgyzstan. FAO:
Rome. Available at: http://www.fao.org/3/a-au849e.pdf [Accessed: 23 October 2017].
Kasym E. (2014). Central Asia’s Hydropower Spat. The Diplomat. Available from:
https://thediplomat.com/2014/12/central-asias-hydropower-spat/
Kloop (news agency) (2017). Tariffs for electricity and heating will not be raised until the end of 2017.
Available from: https://kloop.kg/blog/2017/02/09/tarify-na-elektrichestvo-i-otoplenie-ne-budut-
povyshatsya-do-kontsa-2017-goda/
Kushkumbayev S., Kushkumbayeva A. (2013). Water and Energy Issues in the Context of International and
Political Disputes in Central Asia. Published by Oxford University Press. doi: 10.1093/chinesejil/jmt018;
Advance Access publication 9 June 2013.
Lenzen, M., Kanemoto, K., Moran, D., Geschke, A. (2012). Mapping the structure of the world economy,
Environmental Science & Technology, 46(15), pp. 8374-8381.

150
Lerman, Z. (2013). Cooperative development in Central Asia. FAO Regional Office for Europe and Central
Asia, Policy Studies on Rural Transition No. 2013-4.
Lewis, W.A. (1954). Economic development with unlimited supplies of labour, Manchester School of
Economic and Social Studies, 22(2), pp. 139–191.
Liu F.M.M., Pistorius T. (2012). Coping with the energy crisis: Impact assessment and potentials of non
traditional renewable energy in rural Kyrgyzstan. Energy Policy 44 (2012) 130–139.
Magistrelli, G. (2016). Introducing the Baltic Experience in Modernizing Sanitary and Phytosanitary
Measures, in: ADB (ed.) Modernizing sanitary and phytosanitary measures to expand trade and ensure
food safety—2nd CAREC trade facilitation learning opportunity: Sharing the Baltic experience,
Mandaluyong City, Philippines: ADB, 2016.
Marat E. (2015). Global money laundering and its domestic political consequences in Kyrgyzstan, Central
Asian Survey, 34:1, 46-56, DOI: 10.1080/02634937.2015.1010854
Merco Press (South Atlantic News Agency) (2009). FAO Working to Recover Fisheries in World’s Second
Largest Mountain Lake. Viewable here: http://en.mercopress.com/2009/10/21/fao-working-to-recover-
fisheries-in-worlds-second-largest-mountain-lake [Accessed: 23 October 2017].
Microfinancing Centre (2011). Research on Agricultural Value Chains in Kyrgyzstan. Available at:
http://mfc.org.pl/mfcwp/wp-content/uploads/2016/04/Value-chains-in-Kyrgyzstan-report-final.pdf
[Accessed: 23 October 2017].
Ministry of Energy and Industry of the Kyrgyz Republic (2008). Law of the Kyrgyz Republic on December 31,
2008 No283 “On renewable energy source”. Available from http://nature.gov.kg/
Ministry of Energy and Industry of the Kyrgyz Republic (2013). Renewable Energy Sources Development.
Available from: http://www.unescap.org/sites/default/files/C_Kyrgyz_Orozaliev_E.pdf
Ministry of Foreign affairs of the Kyrgyz Republic (n.d.). Energy and Water Resources. Available from:
http://www.mfa.gov.kg/contents/view/id/91
Ministry of Justice of the Kyrgyz Republic (2015). The concept of small hydropower development of the
Kyrgyz Republic until 2017. Available from: http://cbd.minjust.gov.kg/act/view/ru-ru/97764
Mirovalev M. (2016). Are 'Water Wars' imminent in Central Asia? Al Jazeera. Available from:
http://www.aljazeera.com/indepth/features/2016/03/water-wars-imminent-central-asia-
160321064118684.html
Monique, B. (2009). Small Hydro Power Development in Kyrgyzstan. Project ID 3931. Request for CEO
endorsement/ approval project type: medium sized project from the GEF Trust Fund. Washington, D.C.,
17 December 2014. Available from www.thegef.org/gef/sites/thegef.org/files/repository/Kyrgyzstan-
MSproject-12-17-09(2).pdf
Nachtnebel H.P. (2014). Technical Report of the Mission to Kyrgyzstan. UNIDO Supply of Reliable Energy to
Rural First Aid Stations. Final version: February 2014
Nassif, A., Bresser-Pereira, L.C., Feijo, C. (2017). The case for reindustrialisation in developing countries:
towards the connection between the macroeconomic regime and the industrial policy in Brazil,
Cambridge Journal of Economics, (forthcoming).
National Institute for Strategic Studies of the Kyrgyz Republic (2014). Dairy Industry in Kyrgyzstan and
Opportunities for India. Available at: https://www.embassyofindia.kg/pdf/REPORT-ON-DAIRY-
SECTOR.docx [Accessed: 23 October 2017].

151
Nordås, H.K., and Kim, Y., (2013). The Role of Services for Competitiveness in Manufacturing. OECD Trade
Policy Papers, 148, OECD Publishing.
OECD (2013). Perspectives on Global Development: Industrial Policies in a Changing World, OECD
Publishing.
OECD (2014). Expanding the Garment Industry in the Kyrgyz Republic: 15. Viewable here:
https://www.oecd.org/globalrelations/ExpandingtheGarmentIndustry.pdf [Accessed: 23 October 2017].
OECD (2016). Financing Climate Action in Eastern Europe, the Caucasus and Central Asia. Available from
www.oecd.org/environment/outreach/Kyrgyzstan_Financing_Climate_Action.Nov2016.pdf
Pagés, C. (2010). The Age of Productivity, Palgrave Macmillan, USA.
Polanyi, K. (1957). The Great Transformation: The Political and Economic Origins of Our Time, Beacon Press,
Boston Massachusetts.
Pritchett, L. (2000). Understanding Patterns of Economic Growth: Searching for Hills among Plateaus,
Mountains, and Plains, The World Bank Economic Review, 14(2), pp. 221–50.
Rodrik, D. (2008). The real exchange rate and economic growth, Brookings Papers on Economic Activity, Vol.
2, pp. 365-412.
Rodrik, D., (2012). The Manufacturing Imperative, project-syndicate, 10 August 2012, http://www.project-
syndicate.org/commentary/the-manufacturing-imperative.
Rodrik, D., (2013). Unconditional Convergence in Manufacturing, Quarterly Journal of Economics, 128 (1),
pp. 165-204.
Rodrik, D. (2016). Premature deindustrialization, Journal of Economic Growth, 21(1), pp 1-33, March.
Shahbazov F. (2017). Will Central Asia Fight Over Water Resources? Forbes. Available from:
https://www.forbes.com/sites/realspin/2017/02/06/will-central-asia-fight-over-water-
resources/#28b7a2a64c1f
SIAR Research and Consulting (2013). Use of Water Resources in Kyrgyzstan and Central Asia, Survey report,
Bishkek.
SIAR Research and Consulting (2016). Analysis of the losses of the national economy of the Republic of
Kyrgyzstan due to the lack of development of information systems, Research Report, September.
SlovakAid (2006). Slovak-Kyrgyz Partnership on Fostering Market Penetration of Renewable Energy Sources
in Kyrgyz Republic. Civic Environmental Foundation UNISON. Ref. No. ACU/2005/04/KG/07
Sorg A., Huss M., Rohrer M., Stoffel M. (2014). The days of plenty might soon be over in glacierized Central
Asian catchments. Environ. Res. Lett. 9 (2014) 104018 (8pp)
State Committee of Industry, Energy and Subsoil Use of the Kyrgyz Republic (2017). Private communication.
Stomaliev, A. (2013). Development of renewable energy sector in the Kyrgyz Republic. Ministry of Energy of
the Kyrgyz Republic. Presentation at the 16th CAREC Energy Sector Coordinating Committee Meeting,
10-12 September 2013. Available from http://www.carecprogram.org/uploads/events/2013/ESCC-
Meeting-KAZ/005_104_209_Development-of-Renewable-Energy-Sector-in-the-KyrgyzRepublic.pdf
Szirmai, A. and B. Verspagen (2015). Manufacturing and economic growth in developing countries, 1950-
2005. Structural Change and Economic Dynamics, 34(C), pp. 46-59.

152
Taylor, L. J. (1969). Development Patterns: A Simulation Study. The Quarterly Journal of Economics, 83(2),
220-241.
Thorpe. A. et al. (2009). The Collapse of the Fisheries Sector in Kyrgyzstan: An Analysis of its Roots and
Prospects for Survival. Journal of Communist and Post-Communist Studies, 42 (1), pp. 141-163.
Available at: http://www.citeulike.org/article/5309915 [Accessed: 23 October 2017].
Tulin, Dj. (2003). Shadow economy in Kyrgyzstan, MANAS Journal of Social Studies Academic, pp. 95-98.
Ubaidulaev, M.B. (2015). Problems of ground resources in Kyrgyzstan, Agro-food economy, Nizhny
Novgorod, No. 2.
UNCTAD (2016). Investment Policy Review. Kyrgyzstan, New York and Geneva. Available at:
http://unctad.org/en/PublicationsLibrary/diaepcb2015d3_en.pdf [Accessed: 04 October 2017].
UNCTAD (2017). Trade and Development Report 2017. Beyond Austerity: Towards a Global New Deal, New
York and Geneva.
UNDP (2006). The Shadow Economy in the Kyrgyz Republic. Trends, Estimates and Policy Options, Bishkek.
UNDP (2015). Kyrgyzstan is working on a concept to develop small hydro energy. Available from:
http://www.kg.undp.org/content/kyrgyzstan/en/home/presscenter/pressreleases/2015/02/17/kyrgyzst
an-is-working-on-a-concept-to-develop-small-hydro-energy.html
UNDP (2016). Challenges and ways of development of the small hydropower in the Kyrgyz Republic.
Available from:
http://www.kg.undp.org/content/kyrgyzstan/en/home/presscenter/articles/2016/03/03/challenges-
and-ways-of-development-of-the-small-hydropower-in-the-kyrgyz-republic.html
UNECE (2015). Regulatory and Procedural Barriers to Trade in Kyrgyzstan. Available at:
https://www.unece.org/fileadmin/DAM/trade/Publications/ECE_TRADE_412E-Kyrgyzstan.pdf
[Accessed: 27 October 2017].
UNECE (2017). Renewable Energy Status Report. Available from:
https://www.unece.org/fileadmin/DAM/energy/se/pp/renew/Renewable_energy_report_2017_web.pd
f
UNECE and GIZ (2015). Promotion of Sustainable Development in the Kyrgyz Republic: Food Safety within
GIZ Programme. Available at:
https://www.unece.org/fileadmin/DAM/trade/agr/meetings/ge.02/2015/Presentations-DDP-
Workshop/01July_Baizhumanova.pdf [Accessed: 23 October 2017].
UNESCO (2015). UNESCO Science Report: towards 2030, UNESCO Publishing. Paris
UNIDO (2011). Industrial Development Report 2011, "Industrial Energy Efficiency for Sustainable Wealth
Creation: Capturring Environmental, Economic and Social Dividends".
UNIDO (2012). Feasibility Study for the Establishment of a Fruit and Vegetable Supply Chain. Available at:
https://open.unido.org/api/documents/3364403/download/Project%20Document%20120410
[Accessed: 23 October 2017].
UNIDO (2015). Industrial Development Report 2016. The Role of Technology and Innovation in Inclusive and
Sustainable Industrial Development. Vienna.
UNIDO (2016). Development of Productive Industries and Strengthening Linkages with the Tourism Sector in
the Issyk-Kul Region, Kyrgyz Republic. Available at:

153
https://open.unido.org/api/documents/5340368/download/0_PRODOC_Linking%20tourism%20and%20
productive%20industries%20in%20Kyrgyz%20Republic.pdf [Accessed: 23 October 2017].
UNIDO (2017). Value Chain Selection Report. Linking the Tourism Industry to Productive Activities in the
Issyk-Kul region of the Kyrgyz Republic. Available at:
https://open.unido.org/api/documents/5340368/download/0_PRODOC_Linking%20tourism%20and%20
productive%20industries%20in%20Kyrgyz%20Republic.pdf [Accessed: 23 October 2017].
Van Biesebroeck, J. (2005). Firm Size Matters: Growth and Productivity Growth in African Manufacturing.
Economic Development and Cultural Change, 53(3), 545-583.
Wade R.H. (2016). Industrial Policy in Response to the Middle-Income Trap and the Third Wave of the
Digital Revolution, Global Policy, 7, pp. 469–480.
Weinthal, E. (2002). State Making and Environmental Cooperation: Linking Domestic and International
Cooperation in Central Asia; MIT Press: Cambridge, MA, USA; London, UK.
Williamson J. (1993), Economic Consequences of Soviet Disintegration, Institute for International
Economics, Washington DC.
World Bank (2004). Water Energy Nexus in Central Asia. Improving Regional Cooperation in the Syr Darya
Basin. Available from:
http://siteresources.worldbank.org/INTUZBEKISTAN/Resources/Water_Energy_Nexus_final.pdf
World Bank (2012). Fighting Corruption in Public Services. Chronicling Georgia’s Reforms, Washington DC.
World Bank (2014). Electric power transmission and distribution losses (% of output). Available from:
https://data.worldbank.org/indicator/EG.ELC.LOSS.ZS?end=2014&locations=KG&start=1990&view=char
t
World Bank (2015). Project Information Document Appraisal Stage. Integrated Dairy Productivity
Improvement Project (P155412). Available at:
http://documents.worldbank.org/curated/en/521031468047341997/pdf/PID-Appraisal-Print-P155412-
04-11-2016-1460394086678.pdf [Accessed: 23 October 2017].
World Bank (2016). Kyrgyz Republic: From Vulnerability to Prosperity, Systematic country diagnostic
concept note, November.
World Bank (2017a). Kyrgyz Republic: A resilient economy…on a slow growth trajectory, Kyrgyz Republic
Economic Update No. 5, Spring. Available from:
http://documents.worldbank.org/curated/en/710331496766602711/pdf/115684-WP-PUBLIC-add-
series-SpringKGZBEUFinal.pdf
World Bank (2017b). Doing Business 2017: Equal Opportunity for All, Washington, DC.
World Bank and Swiss Cooperation Office in Kyrgyzstan (2011). Kyrgyz Republic judicial system diagnostic:
measuring progress and identifying needs, Washington, DC.
World Economic Forum (2016). The Global Competitiveness Report 2016–2017, September 2016. Geneva.
World Integrated Trade Solution (2017). Kyrgyz Republic Product Exports and Imports 2015. Available at:
https://wits.worldbank.org/CountryProfile/en/Country/KGZ/Year/LTST/TradeFlow/EXPIMP/Partner/WL
D/Product/All-Groups [23 October 2017].
154
WSHPDR (2016). The World Small Hydropower Development Report 2016: United Nations Industrial
Development Organization, Vienna, and International Center on Small Hydro Power, Hangzhou.
Available from: http://www.smallhydroworld.org/
Zhupankhan A., Tussupova K., Berndtsson R. (2017). Could Changing Power Relationships Lead to Better
Water Sharing in Central Asia? Water 2017, 9, 139; doi:10.3390/w9020139
Zinzania A., Mengab F. (2017). The Circle of Hydro-Hegemony Between Riparian States, Development
Policies and Borderlands: Evidence From the Talas Waterscape (Kyrgyzstan-Kazakhstan). Elsevier in
Geoforum, Volume 85, pp. 112-121, October.