Embed Size (px)
Citation preview
Calhoun: The NPS Institutional Archive
Theses and Dissertations Thesis Collection
1992-09
Direct fire synchronization.
Lamont, Robert W.
Monterey, California. Naval Postgraduate School
http://hdl.handle.net/10945/23644


DJDLEY KNOXWY
NAVAL POST61 ^o}1001


Dv.
N/
NAVAL POSTGRADUATE SCHOOLMonterey, California
THESIS
DIRECT FIRE SYNCHRONIZATION
by
Robert W. Lamont
September 1992•
Thesis Advisor: Harold J. Larson
Approved for public release; distribution is unlimited

Unclassified
ECURITY CLASSIFICATION OF THIS PAGE
REPORT DOCUMENTATION PAGEForm ApprovedOMB No. 0704-0188
a. REPORT SECURITY CLASSIFICATION
NCLASSIFIED1b. RESTRICTIVE MARKINGS
i. SECURITY CLASSIFICATION AUTHORITY
>. DECLASSIFICATION/DOWNGRADING SCHEDULE
3. DISTRIBUTION/AVAILABILITY OF REPORTApproved for public release; distribution is unlimited
PERFORMING ORGANIZATION REPORT NUMBER(S) 5. MONITORING ORGANIZATION REPORT NUMBER(S)
a. NAME OF PERFORMING ORGANIZATION
aval Postgraduate School
6b. OFFICE SYMBOL)
OR
7a. NAME OF MONITORING ORGANIZATION
c. ADDRESS (City, State, and ZIP Code)
lonterey, CA 93943-5000
7b. ADDRESS (City, State, and ZIP Code)
i. NAME OF FUNDING/SPONSORINGORGANIZATION
8b. OFFICE SYMBOL 9. PROCUREMENT INSTRUMENT IDENTIFICATION NUMBER
:. ADDRESS (City, State, and ZIP Code) 10. SOURCE OF FUNDING NUMBERSPROGRAMELEMENT NO.
PROJECTNO.
TASKNO.
WORK UNITACCESSION NO
1. TITLE (Including Security Classification)
HRECT FIRE SYNCHRONIZATION
2 PERSONAL AUTHOR(S)
obert W. Lamont3 TYPE OF REPORT/tester's thesis
13b. TIME COVEREDFROM TO
14. DATE OF REPORT (Year, Month, Day)
1992, SEPTEMBER15. Page Count
756. SUPPLEMENTAL NOTATIONhe views expressed in this thesis are those of the author and do not reflect the official policy or position of the
)epartment of Defense or the U.S. Government.7. COSATI CODESFIELD GROUP SUB-GROUP
18. SUBJECT TERMS (Continue on reverse if necessary and identify by block number)
Synchronization, Defense in Sector, Direct Fire
9. ABSTRACT (Continue on reverse if necessary and identify by block number)
This thesis analyzes defense in sector missions adapted from the National Training Center and conducted with the
Janus(A) high resolution combat model to check for relationships which influence direct fire synchronization. This
analysis should enhance the monitoring of unit performance in the area of concentration or massing of fires
consistent with the commander's intent. The combat fighting vehicle, which combines the characteristics of mobility
with high volumes of firepower, dominates the desert battlefield and is the focus of this study. Graphical methodsand analytic techniques are developed to describe the battle in terms of direct fire synchronization and a mission
measure of effectiveness (MOE). This research is being conducted under the U.S. Army's Battle Enhanced Analysis
Methodologies (BEAM) study, which is developing objective doctrinal AirLand battle measures and visuals displays
to enhance training analysis. The thesis also describes the training environment of the NTC, defense in sector
doctrine for both the U.S. Army and the U.S. Marine Corps with emphasis on asymmetries, and threat offensive
doctrine.
DISTRIBUTION/AVAILABILTIY OF ABSTRACT
(XlUNCLASSIFIED/UNLIMITED SAMEASRPT.n DTIC
1a. REPORT SECURITY CLASSIFICATION
Unclassified
!2a. NAME OF RESPONSIBLE INDIVIDUAL
Harold J. Larson
22b. TELEPHONE (Include Area Code)
(408)646-2473
22c. OFFICE SYMBOLOR/La
DD Form 1473, JUN 86 Previous editions are obselete.
S/N0102-LF-014-6603SECURITY CLASSIFICATION OF THIS PAGE
Unclassified
Approved for public release; distribution is unlimited
Direct Fire Synchronization
by
Robert W.y
LamontMajor, United States Marine Corps
BS, United States Naval Academy, 1978
Submitted in partial fulfillmentof the requirements for the degree
MASTER OF SCIENCE IN OPERATIONS RESEARCH
from the
NAVAL POSTGRADUATE SCHOOLSeptember 1992
ABSTRACT
This thesis analyzes defense in sector missions adapted from the National
Training Center and conducted with the Janus(A) high resolution combat model to
check for relationships which influence direct fire synchronization. This analysis
should enhance the monitoring of unit performance in the area of concentration or
massing of fires consistent with the commander's intent. The combat fighting vehicle,
which combines the characteristics of mobility with high volumes of firepower,
dominates the desert battlefield and is the focus of this study. Graphical methods and
analytic techniques are developed to describe the battle in terms of direct fire
synchronization and a mission measure of effectiveness (MOE). This research is
being conducted under the U.S. Army's Battle Enhanced Analysis Methodologies
(BEAM) study, which is developing objective doctrinal AirLand battle measures and
visual displays to enhance training analysis. The thesis also describes the training
environment of the NTC, defense in sector doctrine for both the U.S. Army and the
U.S. Marine Corps with emphasis on asymmetries, and threat offensive doctrine.
in
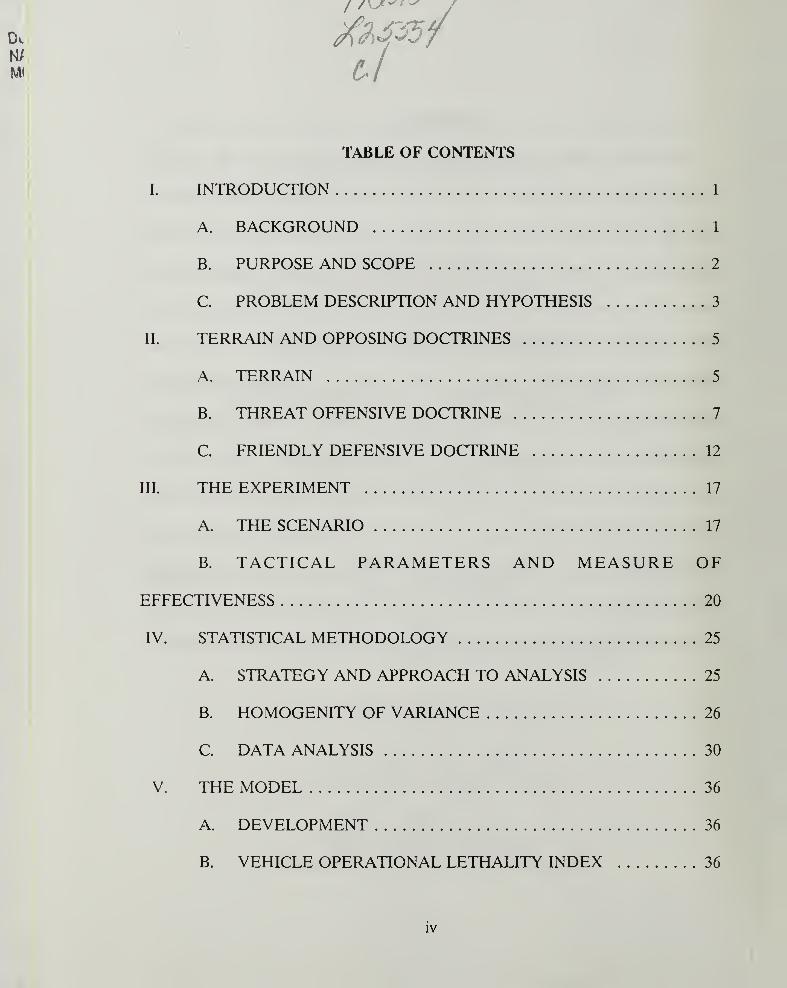
TABLE OF CONTENTS
I. INTRODUCTION 1
A. BACKGROUND 1
B. PURPOSE AND SCOPE 2
C. PROBLEM DESCRIPTION AND HYPOTHESIS 3
II. TERRAIN AND OPPOSING DOCTRINES 5
A. TERRAIN 5
B. THREAT OFFENSIVE DOCTRINE 7
C. FRIENDLY DEFENSIVE DOCTRINE 12
III. THE EXPERIMENT 17
A. THE SCENARIO 17
B. TACTICAL PARAMETERS AND MEASURE OF
EFFECTIVENESS 20
IV. STATISTICAL METHODOLOGY 25
A. STRATEGY AND APPROACH TO ANALYSIS 25
B. HOMOGENITY OF VARIANCE 26
C. DATA ANALYSIS 30
V. THE MODEL 36
A. DEVELOPMENT 36
B. VEHICLE OPERATIONAL LETHALITY INDEX 36
IV
DUDLEY KNOX LIBRARYNAVAL POSTGRADUATE SCHOOIMONTEREY CA 93343-5101
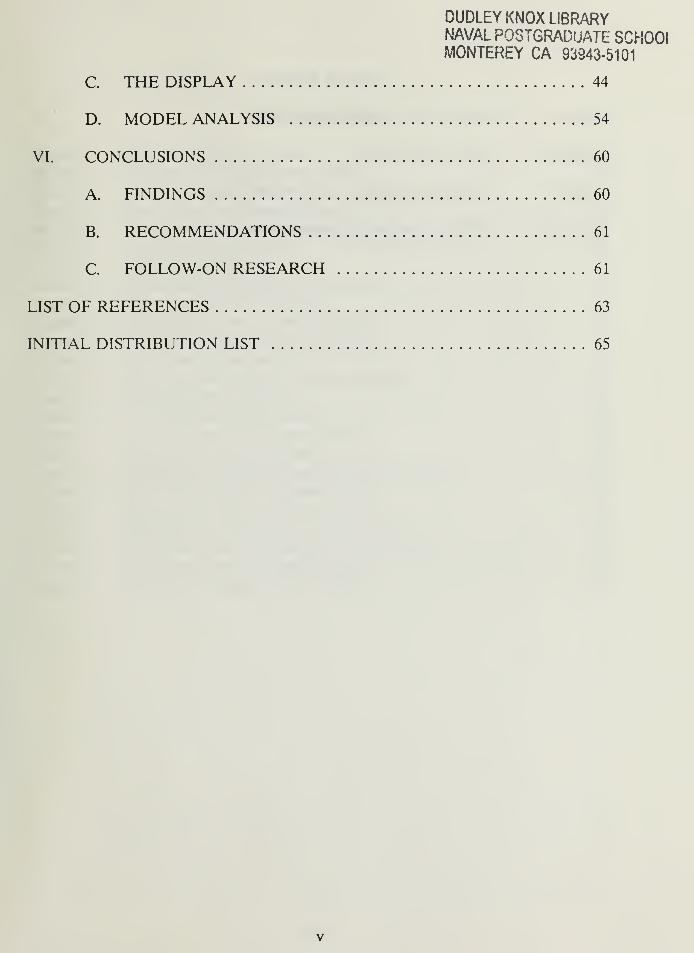
C. THE DISPLAY 44
D. MODEL ANALYSIS 54
VI. CONCLUSIONS 60
A. FINDINGS 60
B. RECOMMENDATIONS 61
C. FOLLOW-ON RESEARCH 61
LIST OF REFERENCES 63
INITIAL DISTRIBUTION LIST 65
Dv
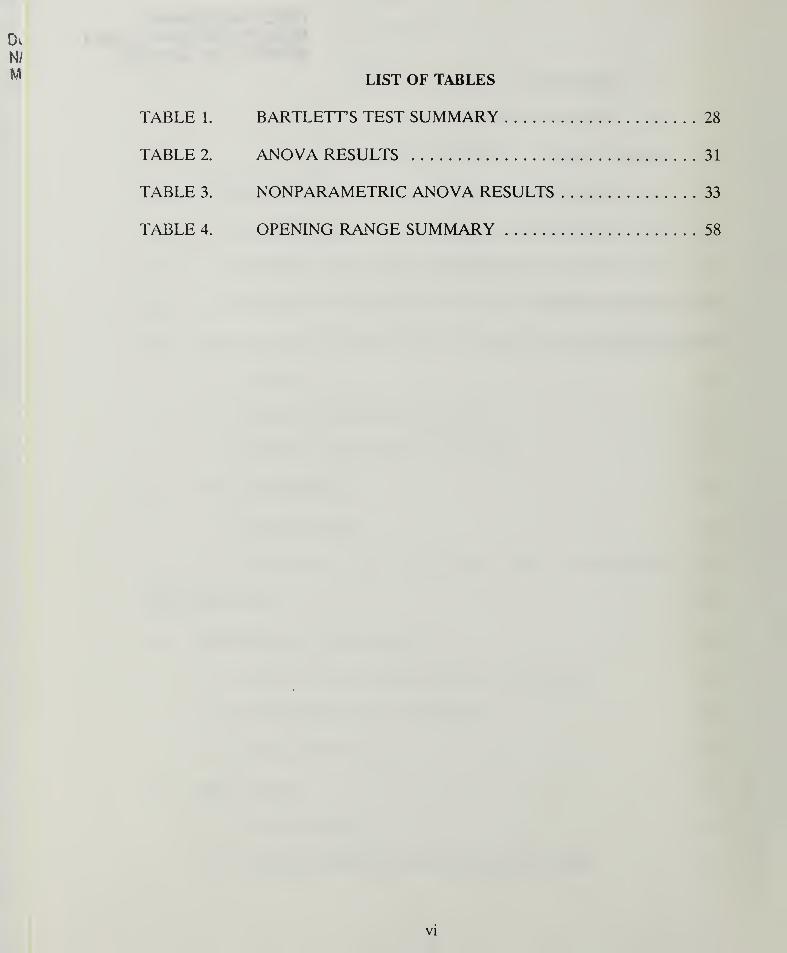
WM LIST OF TABLES
TABLE 1. BARTLETTS TEST SUMMARY 28
TABLE 2. ANOVA RESULTS 31
TABLE 3. NONPARAMETRIC ANOVA RESULTS 33
TABLE 4. OPENING RANGE SUMMARY 58
VI
LIST OF FIGURES
Figure 1. Scenario Manuever Areas 7
Figure 2. Motorized Rifle Regiment (MRR) 9
Figure 3. Echelon Attach Concept 10
Figure 4. Blue Force Task Organization 15
Figure 5. Blue Force Defense in Sector Dispositions 18
Figure 6. OPFOR Plan of Attack 19
Figure 7. Experiment Design 21
Figure 8. Janus (A) Simulation MOE Results 25
Figure 9. Experimental Cells Box Plots 27
Figure 10. ANOVA Summary of MOE Results 30
Figure 11. Operational Lethality Index Factors 37
Figure 12. Gun-Missile Paradox 38
Figure 13. Threat Organizational Factors Example 40
Figure 14. M-l Tank P(hit) Curve 43
Figure 15. TOW Missile P(hit) Curve 45
Figure 16. Combat Potential Surface Concept 47
Figure 17. Historical Scenario at Start 48
Figure 18. Engagement Area Positioning Scheme at Start 50
Figure 19. HAW-MAW-LAW Approach at Start 51
Figure 20. Historical Scenario at 120 minutes 52
Figure 21. Engagemet Area Scenario at 120 minutes 53
Figure 22. HAW-MAW-LAW Scenario at 120 minutes 54
Figure 23. Optimum Opening Range Problem 55
Figure 24. Operational Lethality Index (OLI) 57
vn

D.
NM
I. INTRODUCTION
A. BACKGROUND
The National Training Center (NTC) is located in the high desert of southern
California. Since the establishment of the NTC, in June 1981, the center has been
tasked with a twofold mission. First, the NTC is to provide visiting units with the
most demanding training environment, short of war, that is consistent with safety
limitations. This is accomplished with a dedicated opposing force (OPFOR) whose
mission is to emulate soviet style tactics during free-play, force-on-force exercises.
Second, data collected from these engagements by an extensive instrumentation
array located on both combat forces and the surrounding terrain is to be used to
assess unit organization, weapons systems, tactics, and doctrine.
In 1986 a Government Accounting Office (GAO) study stated that the full
potential of the NTC had not been realized. It acknowledged that the first objective
was being met, but illuminated some shortfalls with respect to the second. These
included both an inability to use objective data for assessment of organizations and
to obtain solutions to battlefield deficiencies. To help overcome these limitations the
study called Battle Enhanced Analysis Methodologies (BEAM) was initiated at the
U.S. Army's TRADOC Analysis Command-Monterey (TRAC-MTRY). [Ref l:p. 2]
The goal of the BEAM program is to develop objective measures of AirLand
Battle (ALB) doctrine tenets to resolve deficiencies in the data collection required
at Combat Training Centers and improve identification of key performance
weaknesses in the use of tactical AirLand Battle doctrine. The four tenets of ALB
doctrine are agility, initiative, depth, and synchronization. The measures developed
by BEAM are envisioned as being graphical in nature, to be used in doctrinal
training analysis during or after a combat simulation. The underlying concept is to
show the warfighter how well the battle is going with respect to the ALB tenets. [Ref
l:p. 3]
The U.S. Army's Janus(A) combat model is a high resolution computer
simulation that allows both interactive and systemic operations. Developed by
researchers at the Combat Simulation Center, Livermore National Laboratory,
Janus(A) is an event scheduling, stochastic model that defines weapon systems as
entities. Each of these entities has its own characteristics that defines it within the
combat model as a whole. This precise level of modelling allows such factors as
weapon capabilities, ammunition and fuel status, and terrain effects, to be
represented in a realistic manner. This high fidelity modelling allows Janus(A) to
investigate the effects of new weapons and tactics to produce plausible results. [Ref.
2:p. 9] Janus(A) is used extensively in this research to generate the data required
to investigate the issue of direct fire synchronization.
B. PURPOSE AND SCOPE
Analysis efforts in direct fire synchronization at the NTC have so far been
subjective in nature. No formal study has been done on this subject. Observer-
Controllers and analysts have recognized shortfalls in unit direct fire synchronization
but quantitative analysis of "what happened" to support the study of these trends is
lacking. [Ref. 18] This thesis presents a quantitative analysis of direct fire
synchronization based on Janus battles using an actual NTC scenario. The goal of
this study is to quantify direct fire synchronization performance to assist the unit
commander in determining if his forces are complying with his intent and vision of
the battle.
The scope of this thesis is limited by the following constraints and assumptions:
o The Janus(A) combat model is representative of actual attrition and battlefield
effects.
o Battles were conducted on desert terrain represented by the physical
environment of the NTC's Siberia training area.
o The same defense in sector mission was used as the basis for all battles
conducted in this research.
o Mechanized forces of both sides were operating consistent with the organization
equipment mixes and doctrine employment schemes outlined in the second
chapter.
The analysis procedure can easily be extended to other battles, missions, and forces
but extrapolation of the analysis results outside the above constraints could lead to
false conclusions.
C. PROBLEM DESCRIPTION AND HYPOTHESIS
Two key problems must be addressed in this research. First, can direct fire
synchronization be captured as envisioned by the BEAM project? Second, what
impact, if any, does varying the battlefield in time and space have on direct fire
synchronization? The above questions provide the required structure to advance the
hypothesis investigated in this thesis.
The following hypothesis will be tested for validity using data analysis: given a
task force defense in sector mission conducted with the Janus(A) model under NTC
conditions, there exists a relationship between the degree of direct fire
synchronization and the mission's outcome. It is further hypothesized that this
synchronization is best achieved when subordinate elements are positioned for
mutual support and execution is decentralized consistent with the commander's
intent. Such a relationship could lead to a quantified task force training standard,
that is displayed graphically, for direct fire synchronization in the defense.
A two step approach is utilized to investigate the problems advanced in this
study. First, a simulation and data analysis will be conducted to see which tactical
parameters, when systematically varied in a scenario, influence the MOE. Parameters
that appear to impact battle outcome will then be modelled in such a way that the
warfighter will be able to change the input parameters based on his operational
scheme. The second step of the study will utilize this model to build a display that
graphically shows a unit their synchronization potential level or combat power. This
display will include the human factors engineering required to provide relevant
combat information to the warfighter.
II. TERRAIN AND OPPOSING DOCTRINES
A. TERRAIN
Because the NTC is used to establish the scenario under investigation, a
knowledge of desert terrain and how it impacts the weapons systems of both sides
is key to understanding the interactions between tactical parameters in the study. The
following are the military aspects of terrain: observation and fields of fire, cover and
concealment, obstacles, key terrain, and avenues of approach. Terrain analysis
focuses on these factors [Ref 3:p. 4-9].
While observation involves target acquisition systems, both optical and
electronic, this paper focuses on horizontal or point to point visibility described by
a unit's field of fire. Overlapping these fields of fire is a prerequisite for the
concentration of combat power and implies a potential for direct fire synchronization.
Line-of-sight on the flat and open areas of the NTC is only interrupted on the slopes,
which are cut with wadies formed from drainage patterns of the surrounding high
ground. This results in many areas where a weapon's combat power, when positioned
correctly, is largely limited only by the maximum range to which it can reach and the
accuracy associated with that range. [Ref 4:p.2]
Concealment is protection from observation. Cover is protection from the
effects of fire. [Ref 3:p. 4-9] Vegetation is a historical source of concealment for
military operations. At the NTC, ground covering is extremely sparse. Available
vegetation is composed of eighty-five percent creosote brush scrub and fifteen
percent Joshua tree woodland shade scale scrub. Cover for vehicles is limited to
wadies and the rolling nature of the valley floor or rock outcroppings. [Ref 4:p.l] The
lack of cover and concealment emphasizes the importance of accurate long range
fires. [Ref 5:p. 1-1]
Rapid change in elevation is the chief obstacle to mechanized movement at the
NTC. The lack of precipitation, four inches on average per year, means there are no
permanent water obstacles. [Ref 4:p. 2] Man-made obstacles include minefields and
earthworks construction. Limitations on time, lift, and barrier material result in large
areas of the battlefield being wide open to movement by mechanized forces. Such
an environment is conducive to the concentration of combat power for both the
attacker and defender.
Key terrain are those points on the battlefield that provide a marked tactical
advantage to the side that controls them. The number of points that constitute key
terrain in a desert environment are limited. Choke points or defiles between
mountains and hills are areas through which enemy movement can be controlled.
High ground has the potential to increase line-of-sight, and in turn, the combat power
of units that occupy it. The value of terrain is more likely to be defined in terms of
fighting positions for individual vehicles or small units rather than geographic
formations on whose control would hinge a battle. [Ref 5:p. 5-1] The focus for
desert warfare is the destruction of the enemy. To this end the value of direct fire
synchronization takes on additional importance.
National Training Center (South)fN
Terrain
GO
SLOW GO
NO GO
$Q KILOMETERS
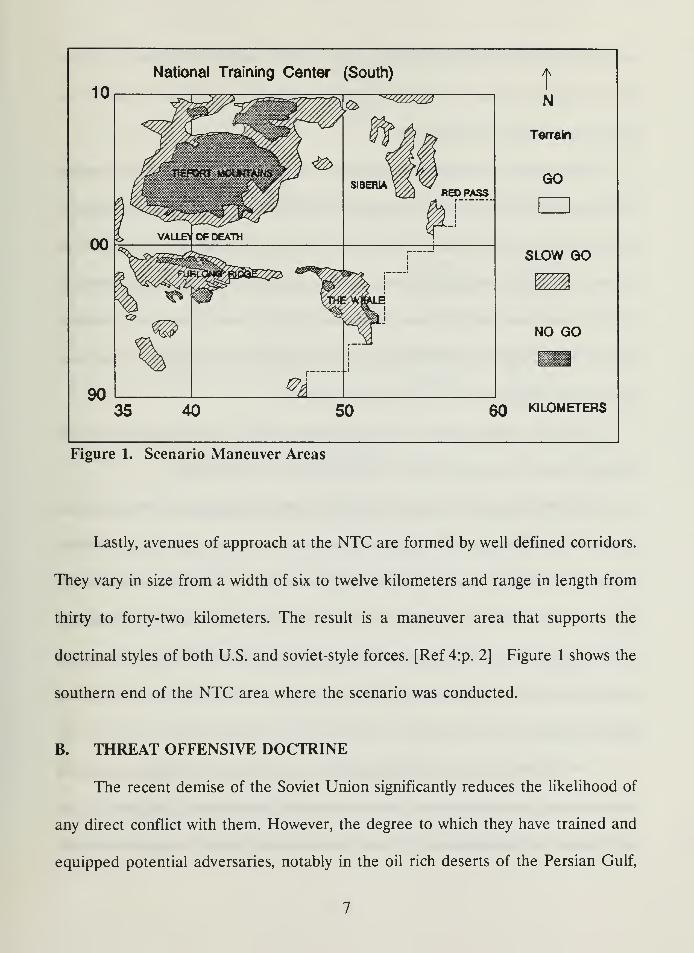
Figure 1. Scenario Maneuver Areas
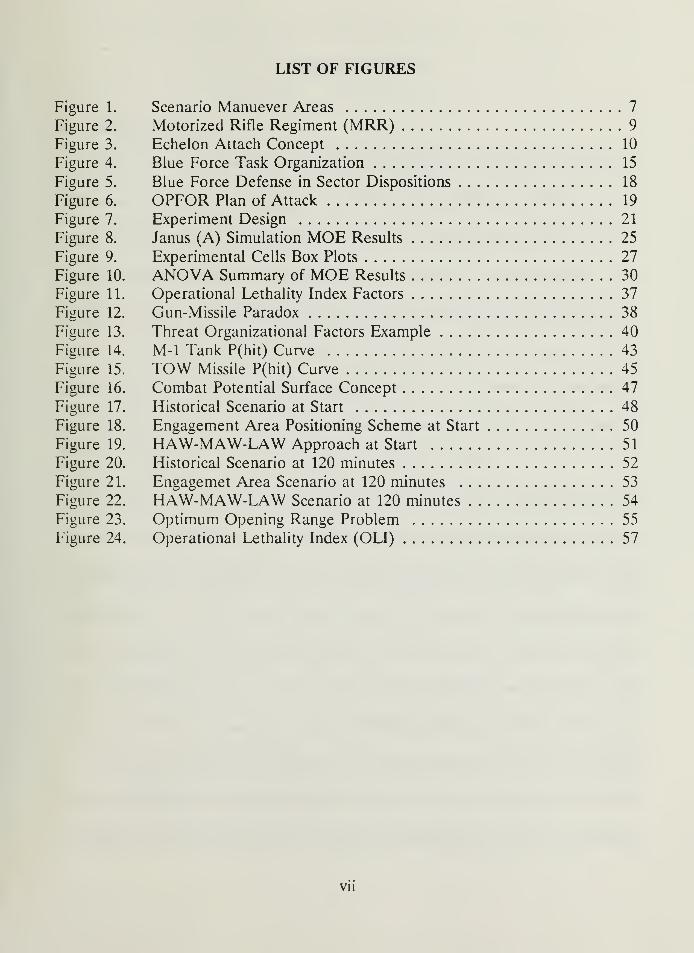
Lastly, avenues of approach at the NTC are formed by well defined corridors.
They vary in size from a width of six to twelve kilometers and range in length from
thirty to forty-two kilometers. The result is a maneuver area that supports the
doctrinal styles of both U.S. and soviet-style forces. [Ref 4:p. 2] Figure 1 shows the
southern end of the NTC area where the scenario was conducted.
B. THREAT OFFENSIVE DOCTRINE
The recent demise of the Soviet Union significantly reduces the likelihood of
any direct conflict with them. However, the degree to which they have trained and
equipped potential adversaries, notably in the oil rich deserts of the Persian Gulf,
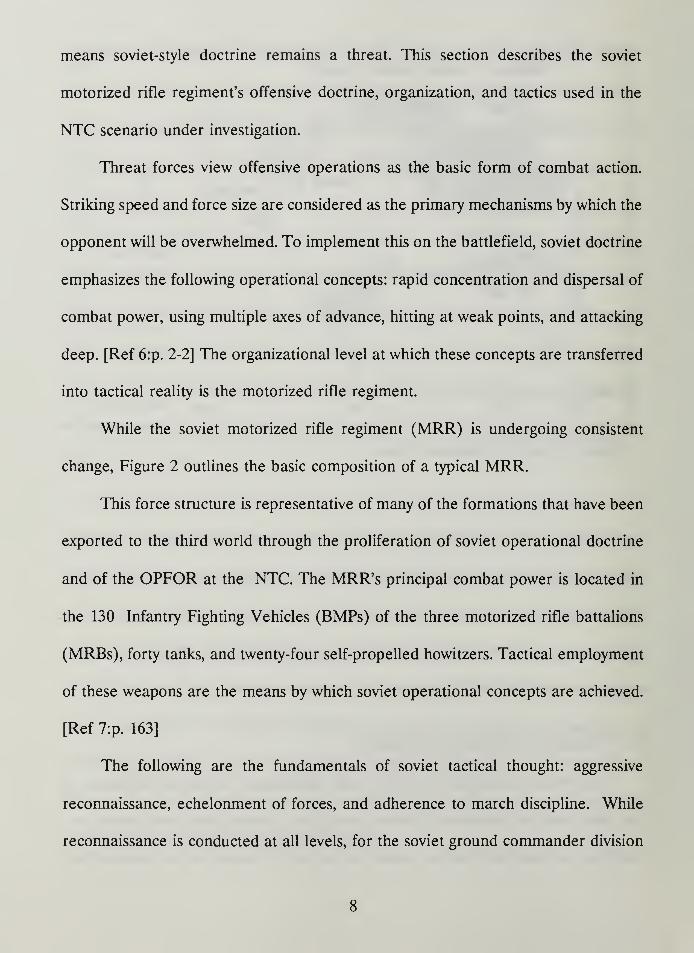
means soviet-style doctrine remains a threat. This section describes the soviet
motorized rifle regiment's offensive doctrine, organization, and tactics used in the
NTC scenario under investigation.
Threat forces view offensive operations as the basic form of combat action.
Striking speed and force size are considered as the primary mechanisms by which the
opponent will be overwhelmed. To implement this on the battlefield, soviet doctrine
emphasizes the following operational concepts: rapid concentration and dispersal of
combat power, using multiple axes of advance, hitting at weak points, and attacking
deep. [Ref 6:p. 2-2] The organizational level at which these concepts are transferred
into tactical reality is the motorized rifle regiment.
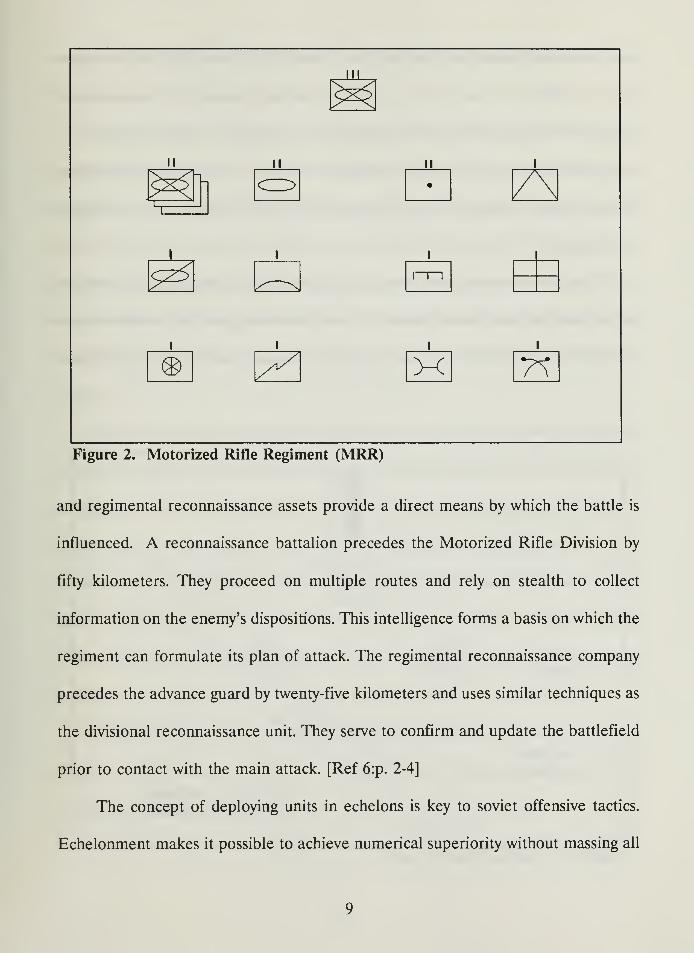
While the soviet motorized rifle regiment (MRR) is undergoing consistent
change, Figure 2 outlines the basic composition of a typical MRR.
This force structure is representative of many of the formations that have been
exported to the third world through the proliferation of soviet operational doctrine
and of the OPFOR at the NTC. The MRR's principal combat power is located in
the 130 Infantry Fighting Vehicles (BMPs) of the three motorized rifle battalions
(MRBs), forty tanks, and twenty-four self-propelled howitzers. Tactical employment
of these weapons are the means by which soviet operational concepts are achieved.
[Ref 7:p. 163]
The following are the fundamentals of soviet tactical thought: aggressive
reconnaissance, echelonment of forces, and adherence to march discipline. While
reconnaissance is conducted at all levels, for the soviet ground commander division
8
IIIX
H -
II
1
II
•
1
1 1 1
1Ai
&®
1X T\
Figure 2. Motorized Rifle Regiment (MRR)
and regimental reconnaissance assets provide a direct means by which the battle is
influenced. A reconnaissance battalion precedes the Motorized Rifle Division by
fifty kilometers. They proceed on multiple routes and rely on stealth to collect
information on the enemy's dispositions. This intelligence forms a basis on which the
regiment can formulate its plan of attack. The regimental reconnaissance company
precedes the advance guard by twenty-five kilometers and uses similar techniques as
the divisional reconnaissance unit. They serve to confirm and update the battlefield
prior to contact with the main attack. [Ref 6:p. 2-4]
The concept of deploying units in echelons is key to soviet offensive tactics.
Echelonment makes it possible to achieve numerical superiority without massing all
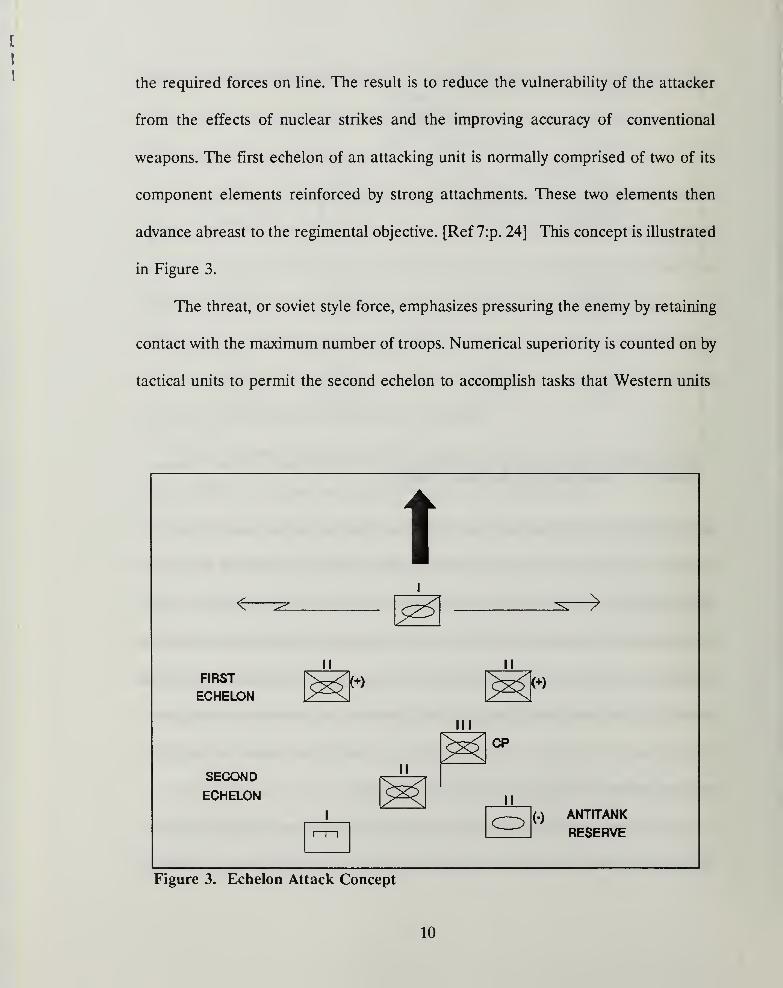
the required forces on line. The result is to reduce the vulnerability of the attacker
from the effects of nuclear strikes and the improving accuracy of conventional
weapons. The first echelon of an attacking unit is normally comprised of two of its
component elements reinforced by strong attachments. These two elements then
advance abreast to the regimental objective. [Ref 7:p. 24] This concept is illustrated
in Figure 3.
The threat, or soviet style force, emphasizes pressuring the enemy by retaining
contact with the maximum number of troops. Numerical superiority is counted on by
tactical units to permit the second echelon to accomplish tasks that Western units
/
11
ANTITANK
RESERVE
XFIRST
ECHELON
SECONDECHELON
-"*
II IIX <+) Mw
IIIX CP
IIX n1 cr> (-)
1 1 1
Figure 3. Echelon Attack Concept
10
would use their reserves for. In general, soviet doctrine uses small reserves whose
focus is on anti-tank operations. [Ref 7:p. 24]
By combining the concepts of echelonment and attack frontage, the threat
forces are able to achieve the correlation of forces that they view are required to win.
A superiority of at least three to one in tanks, six to one in artillery, and four to one
in motorized rifle strength is viewed as desirable for the attack. However, if the
enemy can be neutralized with fire support, or surprised by maneuver, then these
ratios can fall to the point where the threat is outnumbered by as much as three to
one. [Ref 7:p. 24] This adds a degree of unpredictability to the threat operational
scheme.
March formations and techniques provide the tactical glue by which the MRR
commander fights his unit. The regiment is normally organized for the march by
reinforcing three rifle battalions with a company from the tank battalion and forming
a company size anti-tank reserve. These reinforced units then march along two routes
echeloned as described above. The regiment will remain in march formation until
forced to deploy laterally into prebattle formation. As the regiment continues to close
on the enemy, the commander will elect to push through the opposition in prebattle
formation to retain speed, or continue to deploy his unit into attack formation.
If the enemy situation is vague, the regimental commander will task his forward
MRB to push forward security elements. This is accomplished by placing a reinforced
company five to ten kilometers forward of the battalion. This company will act as a
Forward Security Element (FSE). A Combat Reconnaissance Patrol (CRP),
11
consisting of a reinforced platoon, is deployed approximately ten kilometers to the
front of the FSE. This advanced guard will ensure favorable deployment of the main
force once contact with the enemy is gained. [Ref 6:p. 2-4]
If threat reconnaissance elements are able to pin-point the enemy defenses,
then the first element to strike the defensive line may be the forward detachment.
The mission of the forward detachment is to disrupt the continuity of the defense.
This is accomplished by seizing key terrain, a choke point or high ground, on which
the defensive positions are situated. Another technique is for the forward detachment
to pin elements of the defending force in place to allow the main body to concentrate
on a smaller fraction of the defensive line. This concept hinges on the ability of long-
range reconnaissance patrols to identify critical targets at which to strike. [Ref 7:p.
56.]
C. FRIENDLY DEFENSIVE DOCTRINE
AirLand Battle Doctrine (ALB) articulates the Army's method of applying
combat power to the battlefield. Combat power is generated by combining the
following factors: maneuver, firepower, protection, and leadership. The first two
factors are key to direct fire synchronization. [Ref. 3:p. 11]
Maneuver is the alignment of friendly forces which obtains a positional
advantage over the enemy. During offensive operations, or while counter attacking
in the defense, movement of ground units can be used to achieve positional
advantage. However, friendly movement is not a prerequisite to maneuver. In the
defense, if the enemy is drawn into a disadvantageous position where friendly fires
12
are massed or his attack formation is disrupted, then maneuver is used as a defeat
mechanism without ground movement. [Ref. 3:p. 12]
Firepower is the destructive force which is used in removing both the enemy's
ability and will to fight. Maneuver can be facilitated when firepower is used to
suppress the enemy's ability to counter friendly movement and thus insure a position
of advantage is reached. Firepower may also be used independently of maneuver to
destroy, delay, or disrupt uncommitted enemy forces. [Ref. 3:p. 12]
AirLand battle doctrine recognizes the following four basic tenets: initiative,
agility, depth, and synchronization. The ability to successfully fight under this
framework can determine battlefield success. Agility is the ability to act faster than
the enemy. Initiative is seen as setting the terms of the battle. Depth is viewed as
the extension of operations in space, time, and resources. Lastly, synchronization is
the arrangement of battlefield activities in time, space, and purpose to produce
maximum relative combat power at the decisive point. [Ref. 3:p. 15-17]
Synchronization includes concentration of forces and fires. The integration of
firepower and maneuver is seen as a recurring theme in both Army and Marine
Corps doctrinal literature. Such synchronization need not depend solely on the
explicit coordination. The commander extends his span of control beyond the physical
limitations of his communications architecture by insuring his subordinates
understand the intent of his operational plans. In the chaos of battle, if
communications fail and face-to-face coordination is impossible, such implicit
coordination can provide the vehicle by which synchronization is achieved. [Ref. 3:p.
13
17] For direct fire forces to achieve concentration, their weapon systems must be
able to overlap effective fires. Currently, the maximum range of gun and missile
systems is about four kilometers. The width of a zone of attack for a MRR can
extend from three to eight kilometers. [Ref. 9:p. 4-55] This means that for a
battalion to mass sufficient numbers of antiarmor weapons to defeat a MRR, its
defensive sector should not exceed a width that would prevent the concentration of
direct fire. Based on these physical limitations of the weapon systems this would
allow for a frontage of four to eight kilometers. Thus, it seems that the battalion
provides the highest organizational level at which direct fire synchronization is
achieved, and as such, is the focus of this study.
While pure battalion organizations are assigned tactical missions, the cross-
attachment of subordinate elements between infantry and tank battalions is a
fundamental concept that increases mission flexibility. The synergistic effects that
result from combining the individual strengths and weaknesses of dissimilar units is
one of the ways to increase combat power. The company is the lowest level at which
cross-attachment occurs and once complete the resulting organization is referred to
as a team. A battalion that is organized for a combat mission is called a task force.
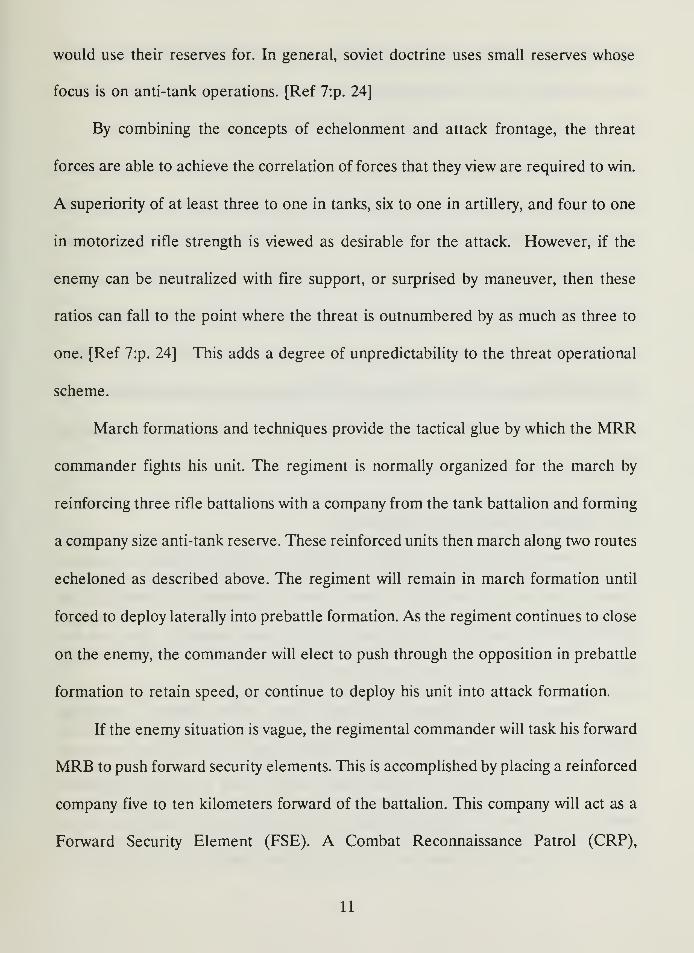
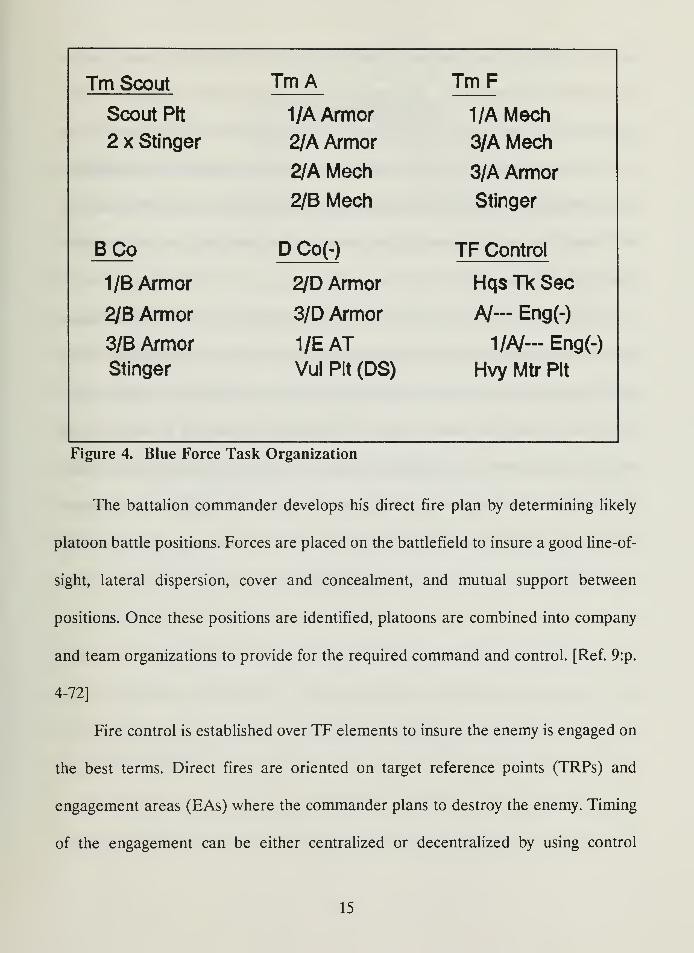
Figure 4 outlines the task organization used by the friendly force in the
historical NTC scenario. [Ref. 8:p.l2] This organization remains constant during the
course of this study. FM 71-123 Tactics, Techniques, and Procedures for Combined
Arms Heavy Forces, outlines the doctrinal employment of this task force (TF) during
the defense in sector (DIS) mission.
14
Tm Scout TmA TmFScout Pit 1/A Armor 1/A Mech
2 x Stinger 2/A Armor 3/A Mech
2/A Mech 3/A Armor
2/B Mech Stinger
BCo D Co(-) TF Control
1/B Armor 2/D Armor Hqs Tk Sec
2/B Armor 3/D Armor A/- Eng(-)
3/B Armor 1/EAT 1/A/- Eng(-)
Stinger Vul Pit (DS) Hvy Mtr Pit
Figure 4. Blue Force Task Organization
The battalion commander develops his direct fire plan by determining likely
platoon battle positions. Forces are placed on the battlefield to insure a good line-of-
sight, lateral dispersion, cover and concealment, and mutual support between
positions. Once these positions are identified, platoons are combined into company
and team organizations to provide for the required command and control. [Ref. 9:p.
4-72]
Fire control is established over TF elements to insure the enemy is engaged on
the best terms. Direct fires are oriented on target reference points (TRPs) and
engagement areas (EAs) where the commander plans to destroy the enemy. Timing
of the engagement can be either centralized or decentralized by using control
15
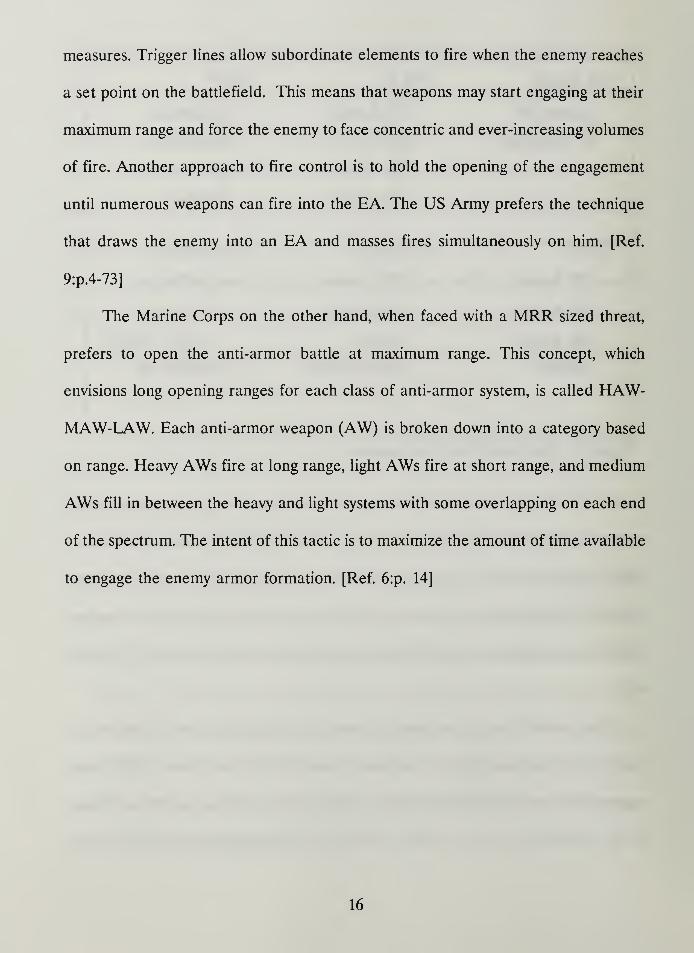
measures. Trigger lines allow subordinate elements to fire when the enemy reaches
a set point on the battlefield. This means that weapons may start engaging at their
maximum range and force the enemy to face concentric and ever-increasing volumes
of fire. Another approach to fire control is to hold the opening of the engagement
until numerous weapons can fire into the EA. The US Army prefers the technique
that draws the enemy into an EA and masses fires simultaneously on him. [Ref.
9:p.4-73]
The Marine Corps on the other hand, when faced with a MRR sized threat,
prefers to open the anti-armor battle at maximum range. This concept, which
envisions long opening ranges for each class of anti-armor system, is called HAW-
MAW-LAW. Each anti-armor weapon (AW) is broken down into a category based
on range. Heavy AWs fire at long range, light AWs fire at short range, and medium
AWs fill in between the heavy and light systems with some overlapping on each end
of the spectrum. The intent of this tactic is to maximize the amount of time available
to engage the enemy armor formation. [Ref. 6:p. 14]
16
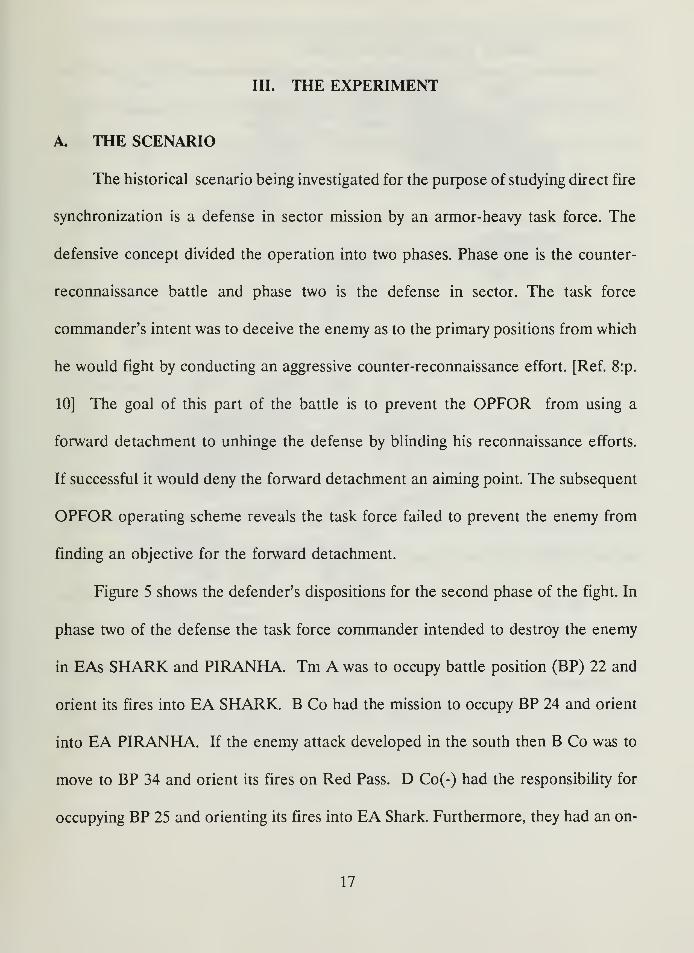
III. THE EXPERIMENT
A. THE SCENARIO
The historical scenario being investigated for the purpose of studying direct fire
synchronization is a defense in sector mission by an armor-heavy task force. The
defensive concept divided the operation into two phases. Phase one is the counter-
reconnaissance battle and phase two is the defense in sector. The task force
commander's intent was to deceive the enemy as to the primary positions from which
he would fight by conducting an aggressive counter-reconnaissance effort. [Ref. 8:p.
10] The goal of this part of the battle is to prevent the OPFOR from using a
forward detachment to unhinge the defense by blinding his reconnaissance efforts.
If successful it would deny the forward detachment an aiming point. The subsequent
OPFOR operating scheme reveals the task force failed to prevent the enemy from
finding an objective for the forward detachment.
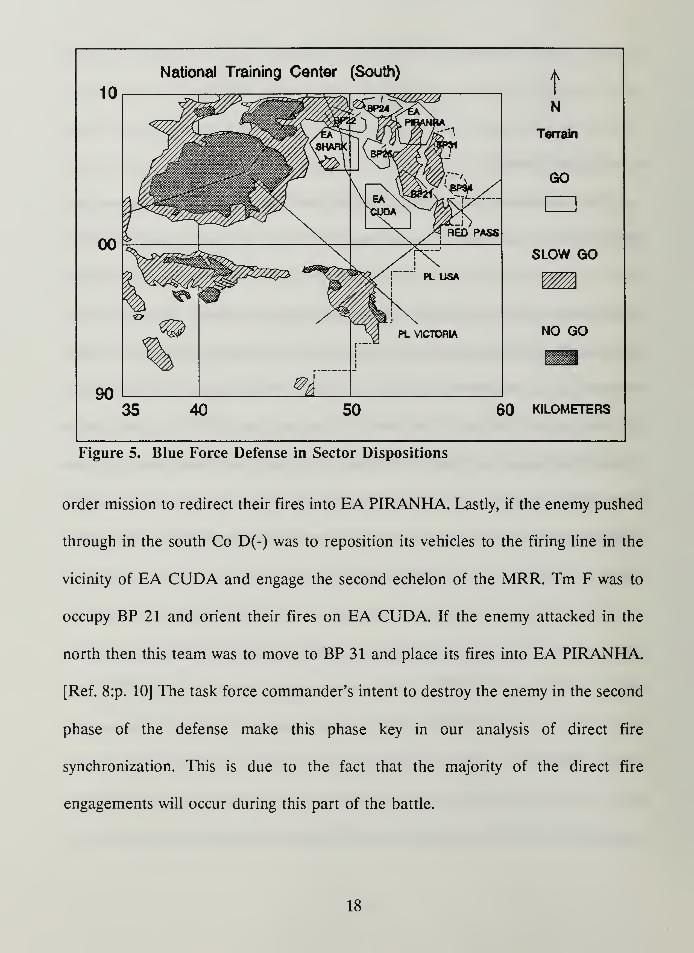
Figure 5 shows the defender's dispositions for the second phase of the fight. In
phase two of the defense the task force commander intended to destroy the enemy
in EAs SHARK and PIRANHA. Tm A was to occupy battle position (BP) 22 and
orient its fires into EA SHARK. B Co had the mission to occupy BP 24 and orient
into EA PIRANHA. If the enemy attack developed in the south then B Co was to
move to BP 34 and orient its fires on Red Pass. D Co(-) had the responsibility for
occupying BP 25 and orienting its fires into EA Shark. Furthermore, they had an on-
17
National Training Center (South)
10r— —=T1 V773 ^cr^S7^*rr7>A^I ^&ZZZ&
PL VICTORIA
tN
Terrain
GO
SLOW GO
NO GO
60 KILOMETERS
Figure 5. Blue Force Defense in Sector Dispositions
order mission to redirect their fires into EA PIRANHA. Lastly, if the enemy pushed
through in the south Co D(-) was to reposition its vehicles to the firing line in the
vicinity of EA CUDA and engage the second echelon of the MRR. Tm F was to
occupy BP 21 and orient their fires on EA CUDA. If the enemy attacked in the
north then this team was to move to BP 31 and place its fires into EA PIRANHA
[Ref. 8:p. 10] The task force commander's intent to destroy the enemy in the second
phase of the defense make this phase key in our analysis of direct fire
synchronization. This is due to the fact that the majority of the direct fire
engagements will occur during this part of the battle.
18
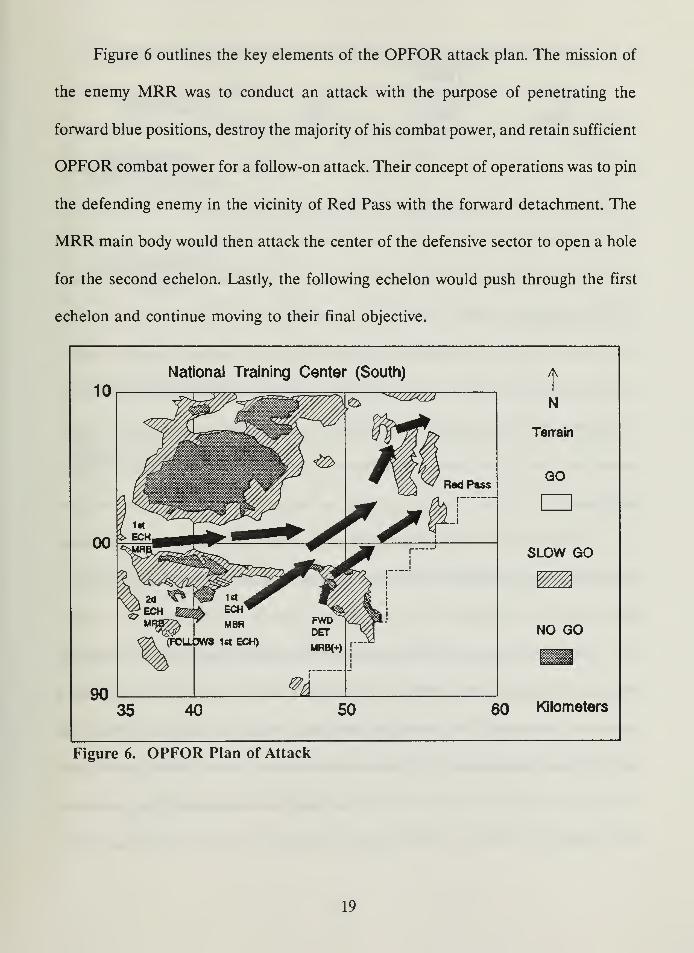
Figure 6 outlines the key elements of the OPFOR attack plan. The mission of
the enemy MRR was to conduct an attack with the purpose of penetrating the
forward blue positions, destroy the majority of his combat power, and retain sufficient
OPFOR combat power for a follow-on attack. Their concept of operations was to pin
the defending enemy in the vicinity of Red Pass with the forward detachment. The
MRR main body would then attack the center of the defensive sector to open a hole
for the second echelon. Lastly, the following echelon would push through the first
echelon and continue moving to their final objective.
National Training Center (South)
Red Pass
tN
Terrain
GO
SLOW GO
NO GO
60 Kilometers
Figure 6. OPFOR Plan of Attack
19
B. TACTICAL PARAMETERS AND MEASURE OF EFFECTIVENESS
In 1914 F. W. Lanchester formulated two differential equation models for
combat attrition under specific conditions. He contrasted a battlefield that was
partitioned into a series of one-on-one duels with one in which firers could
concentrate on surviving enemy from dispersed locations to generate a many-on-one
scenario. The result of this effort was Lanchester's square law of combat which
illustrates the advantage of concentrating combat power. [Ref. 10:p. 63] While these
combat models are useful in the study of warfare at the aggregated level, and are
imbedded in many low resolution simulations, they fail to capture the spatial aspects
of the battalion level fight. Tactical parameters were selected to test the concept of
concentration of force, and hence the influence of direct fire synchronization, in high
resolution simulations where spatial aspects play a role in determining the battle
outcome.
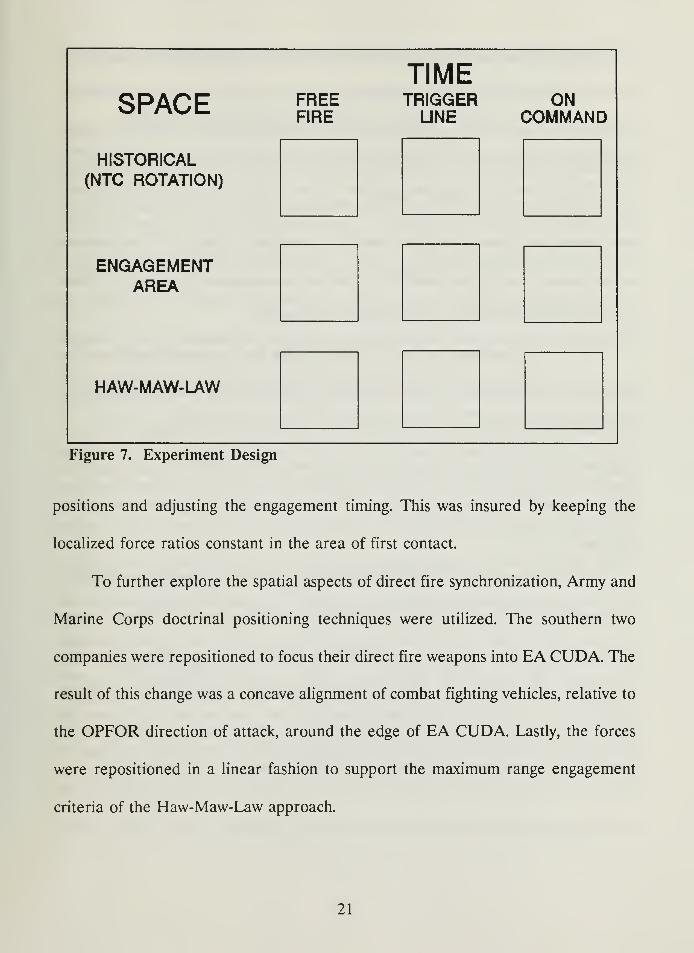
Timing the start of the engagement and vehicle positioning are the two key
doctrinal factors for effective direct fire. Figure 7 outlines the experiment in matrix
form.
Vehicle locations were first run from the historical scenario at the NTC. This
became the baseline case against which other parameters could be tested. During
these runs it was noted that the initial direct fire battles were conducted by the two
companies in the southern half of the defensive sector. It was decided that changes
in vehicle dispositions would be limited to these two companies. The goal was to
limit changes in direct fire effectiveness to the actual influence of moving vehicle
20
SPACE FREEFIRE
TIMETRIGGERUNE (
ONCOMMAND
HISTORICAL(NTC ROTATION)
ENGAGEMENTAREA
HAW-MAW-UWV
Figure 7. Experiment Design
positions and adjusting the engagement timing. This was insured by keeping the
localized force ratios constant in the area of first contact.
To further explore the spatial aspects of direct fire synchronization, Army and
Marine Corps doctrinal positioning techniques were utilized. The southern two
companies were repositioned to focus their direct fire weapons into EA CUDA. The
result of this change was a concave alignment of combat fighting vehicles, relative to
the OPFOR direction of attack, around the edge of EA CUDA. Lastly, the forces
were repositioned in a linear fashion to support the maximum range engagement
criteria of the Haw-Maw-Law approach.
21
Timing of the initial engagement was varied from no control through strict
positive control by the battalion commander. The free fire runs allowed the defender
to open fire when an enemy vehicle came within effective weapons range. The trigger
line, used to evaluate the second timing approach, was Phase Line Lisa or any enemy
vehicle that entered EA CUDA. This allowed the southern two companies to fire as
independent elements when the situation permitted. Lastly, an on-command
technique was tested to see the effects of starting an engagement only in self defense
or when directed to do so by the battalion commander.
The tactical parameters for the OPFOR were held constant throughout the
experiment. His movement and attack plan, as outlined in the previous section, did
not change. His vehicles were kept in a free fire status and allowed to start an
engagement at any time the defender was observed within effective range. Again the
idea here was to limit the impact of factors outside the parameters under
investigation.
To capture the results of each simulation run a measure of effectiveness (MOE)
was developed to reflect the degree of direct fire synchronization. Changes in force
levels on both sides provide a quantitative method for measuring direct fire
synchronization. The more effectively that combat power is applied to the enemy the
higher his losses will be. This destruction will in turn attenuate the effects of his
direct fires and maximize the number of friendly forces that survive the battle.
22
The direct fire synchronization MOE is shown below. It includes the quantifiable
BN/TFMOE=(a)%ENEMYKILLED+(\-a)%FRIENDLYSURVIVAL
mission objectives of enemy force destruction and friendly force survival. The percent
of enemy killed is the sum of the combat vehicles destroyed in the battle divided by
the total starting enemy strength. Friendly survival was found by subtracting the
number of friendly combat vehicles killed in the engagement from the starting total
and dividing by the initial number of combat vehicles. These two aspects can be
weighted by the commander using an a value between zero and one. During this
study, a was set at .5 to equally weight the two goals. [Ref. ll:p. 38]
If run as a "fight-to-the-finish", the attrition results from the scenario tend to
level out as both sides drive each others combat power down toward zero. This in
turn obscures the influence of the tactical parameters under investigation as other
factors, such as the counter-attacking force and non-combat elements, impact the
computation of the MOE. By tracking the temporal direct fire intensity, the battle
can be partitioned into periods of interest. The two key periods, from a direct fire
synchronization point of view, are the combat during the initial contact with the
forward detachment and main body of the MRR. These two key events are
conducted in succession and end at approximately 120 minutes into the Janus(A)
simulation. [Ref. 8:p. 45] This point in the battle was selected to compute the MOE
for each run. Hence, by limiting the factors external to the experiment, to the
greatest extent that a controlled simulation would allow, the tactical parameters of
23

the study are reflected in the MOE and statistical techniques can be used to analyze
their influence on the battle outcome.
24
IV. STATISTICAL METHODOLOGY
A. STRATEGY AND APPROACH TO ANALYSIS
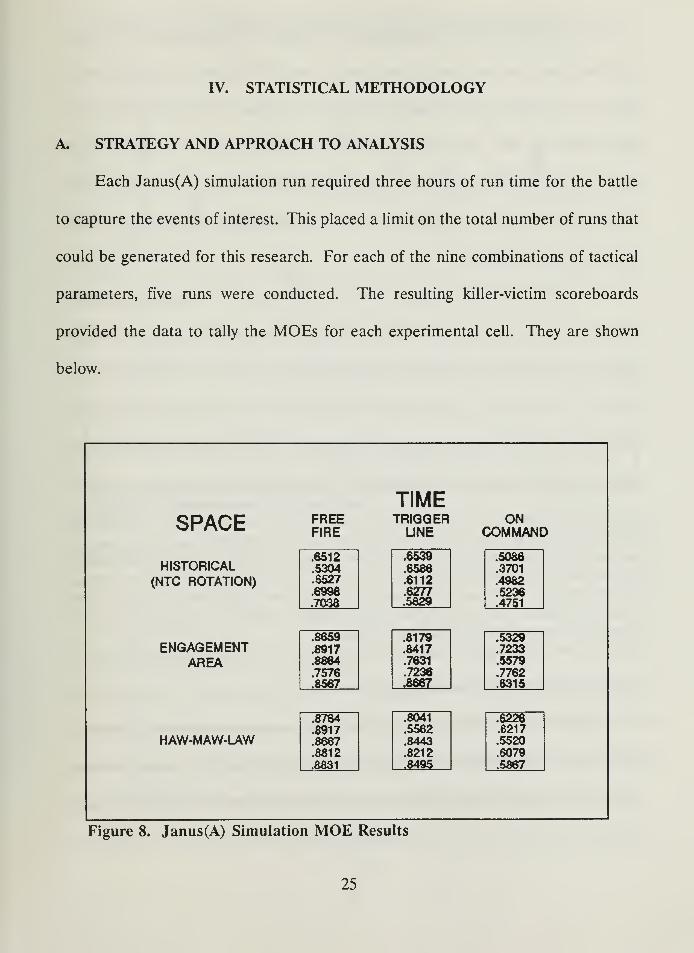
Each Janus(A) simulation run required three hours of run time for the battle
to capture the events of interest. This placed a limit on the total number of runs that
could be generated for this research. For each of the nine combinations of tactical
parameters, five runs were conducted. The resulting killer-victim scoreboards
provided the data to tally the MOEs for each experimental cell. They are shown
below.
SPACE
HISTORICAL(NTC ROTATION)
ENGAGEMENTAREA
FREEFIRE
TIMETRIGGERLINE
ONCOMMAND
.6512 .6539 .5086
.5304 .6586 .3701
.6527 .6112 .4982
.6996 .6277 .5236
.7036 .5629 .4751
.8659 .8179 .5329
.8917 .8417 .7233
.8884 .7631 .5579
.7576 .7236 .7762
.8567 .8667 .6315
HAW-MAW-LAW
.8764 .8041 .6226
.8917 .5562 .6217
.8667 .8443 .5520
.8812 .8212 .6079
.8631 .8495 .5867
Figure 8. Janus(A) Simulation MOE Results
25
The MOE result from the actual battle data was .3799. Only one of the forty-
five simulations runs was below the historical result. This may in part be due to
differences in direct fire intensity attributable to human degradation during the
battle. [Ref.8, p. 58] In addition, the simulated battles were stopped after 120
minutes into the battle while the historical engagement was run as a fight to the
finish; this increased time available for attrition may account for the lower MOE
results during the rotation.
This data will form a basis to test the interaction of the tactical parameters
utilizing analysis of variance (ANOVA) techniques. Because ANOVA methodology
requires an underlying assumption of homogeneity of variance between cells, the
variance of the output, as represented by the MOE, was investigated. Initially, the
spread of the MOE was studied using box plots. This in turn was followed by
Bartlett's test for homogeneity of variance. If the hypothesis underlying the ANOVA
approach fails, then the data will be transformed in an attempt to establish the
framework required by ANOVA techniques. Lastly, each of the tactical parameters
will be developed to see which positively effect the MOE and if there is any
interaction between the parameters of interest.
B. HOMOGENEITY OF VARIANCE
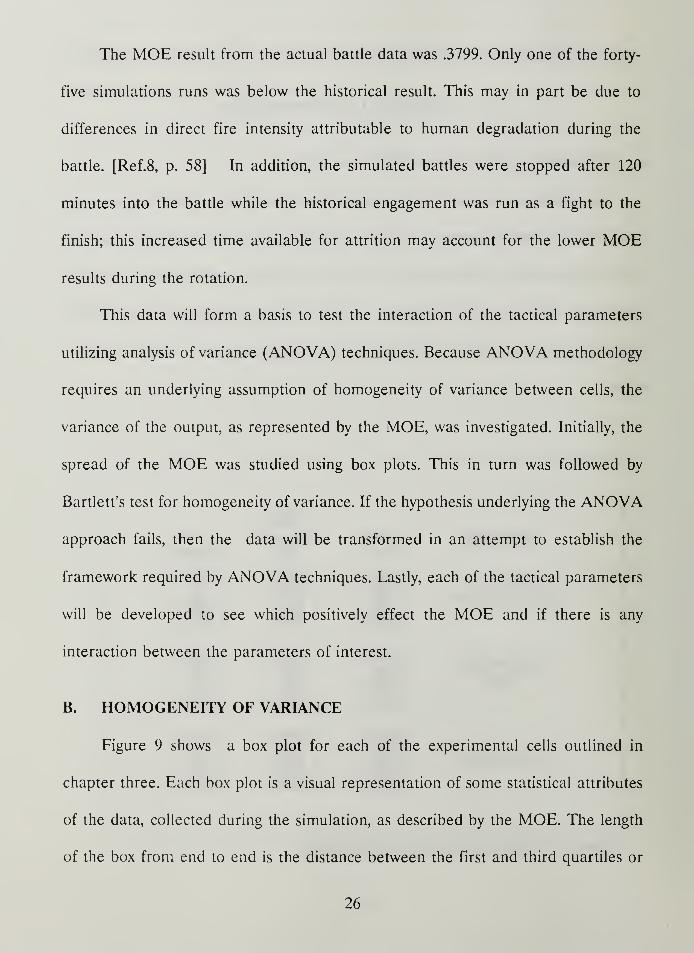
Figure 9 shows a box plot for each of the experimental cells outlined in
chapter three. Each box plot is a visual representation of some statistical attributes
of the data, collected during the simulation, as described by the MOE. The length
of the box from end to end is the distance between the first and third quartiles or
26
BOX PLOTS FOR TACTICAL PARAMETERS
ID
UJ C>o2
z
o
1I
4 6
CELL NUMBER
Figure 9. Experimental Cells Box Plots
interquartile range (IQR). The line through the box is the median and the circle
within the box is the mean. The Xs above and below the box mark the points at
which the adjacent values fall. These points extend as far as 1.5 IQRs beyond the
range of the box and must end at a data observation. This explains the folding back
effect of cell 8 which is unduly influenced by the single outlier. This point can be
seen as the circle below the box plot. [Ref. 17, p. 53.] One drawback to the graphical
representation is that only the final outcomes are communicated. Sensitivity to
sample size of five observations in the above statistics, is masked in the display.
27
The assumption of homogeneity of variance appears to be doubtful when the
length of the box plot in cell six is contrasted with that of cell seven. If these two
cells are dropped from the analysis, the remaining box plots appear to be roughly
similar in size. This suggests a more precise technique be employed to test the
hypothesis of equal variance.
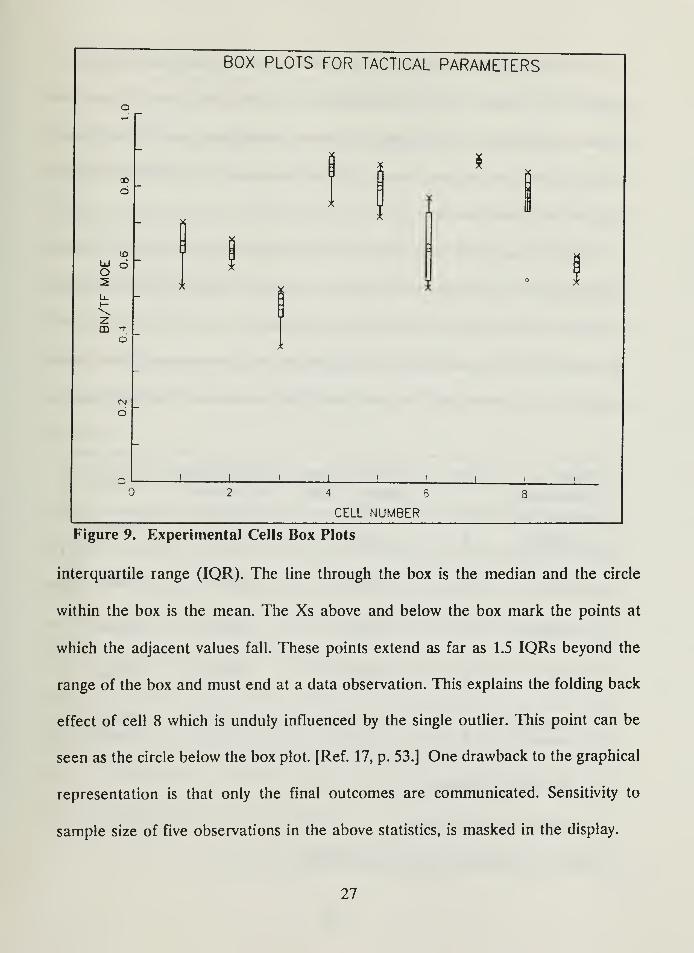
Bartlett's test for homogeneity of variance was utilized on the experimental
MOE results. This test uses a Chi-Square value, with eight degrees of freedom
(number of cells less one). The significance level was set at a =.05. [Ref. 12, p. 249]
The result of this test was rejection of the hypothesis of equal variance. This rejection
led to attempts to transform the data to see if the variance could be stabilized.
DATA/ DoF Chi -Sq Value Chi -Sq Value
Transforms Bartlett's Test* AcceptanceOutcome
Original 8 25.56 15.50 Reject
Arcsin 8 23.50 15.50 Reject
SqRoot 8 26.46 15.50 Reject
Log 8 28.40 15.50 Reject
Data less
Cells 8 & 7.6 11.45 12.59 Fail to
Reject
Ho: Equal Variance
* Less correction factor.
TABLE 1. BARTLETT'S TEST SUMMARY
28
The MOE employed must lie between zero and one. The usual transformations
for this type of data, to stabilize the variance, include arcsin, square root, and log.
First, the arcsin transformation was conducted and while it lowered the %2statistic
from 25.56, with the original values, to 23.5 it fell well short of the acceptance level
of fifteen. The square root transformation raised the %2value to 26.46. Lastly, the log
transform resulted in a %2
statistic of 28.4 and Bartlett's test again rejected the
hypothesis that the variance was the same across the experimental cells. The attempts
to transform the data are summarized in Table 1. Thus, it appears that ANOVA
techniques may be used to gain some insights into trends between parameters but the
associated statistical confidence limits that these procedures normally provide may
not be valid.
The large variability in cell six may partly be explained by the combination of
tactical parameters that this cell represents. This cell combines the highest volume
of initial direct fire, as represented by the mass achieved with the engagement area
technique, with the strictest method of control. The "on command" tactical parameter
required that units on a hold fire status be allowed to fire for self defense or when
it was deemed that orders from the battalion commander to initiate the engagement
were received at the company level. This required manual input from the experiment
controller. Human induced judgmental decisions may have increased the variability
of these MOE results. Conversely, the very small variance of cell seven is explained
by the complete lack of human interaction.
29
0.8
S 0.6
Li.
S 0.4
0.2
Engagement Area
Haw-Maw-Law
NTC Historical
TriggerLine
OnCommand
_L
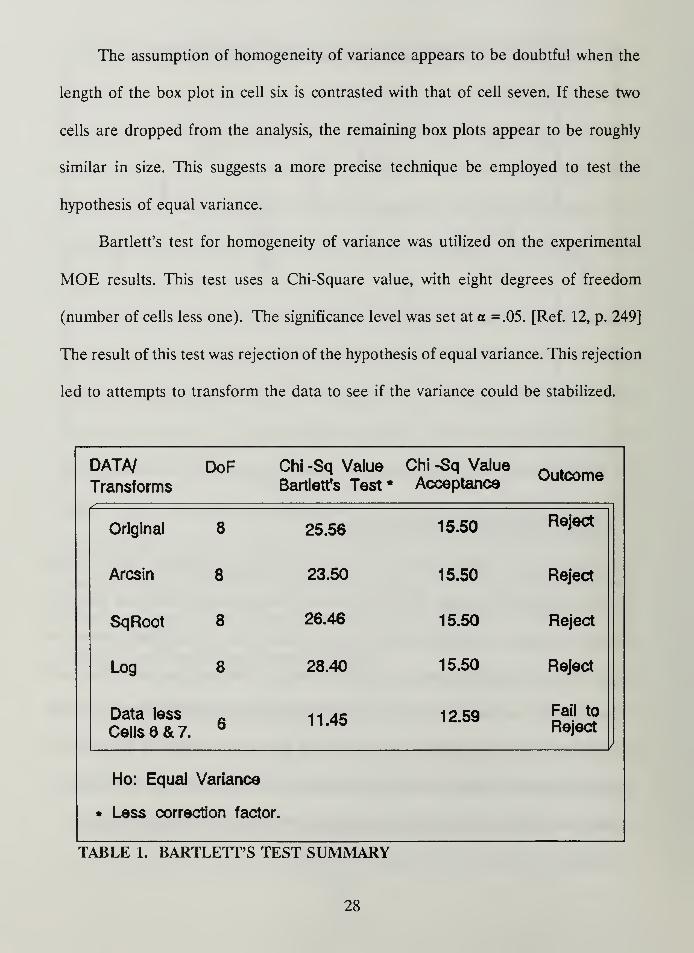
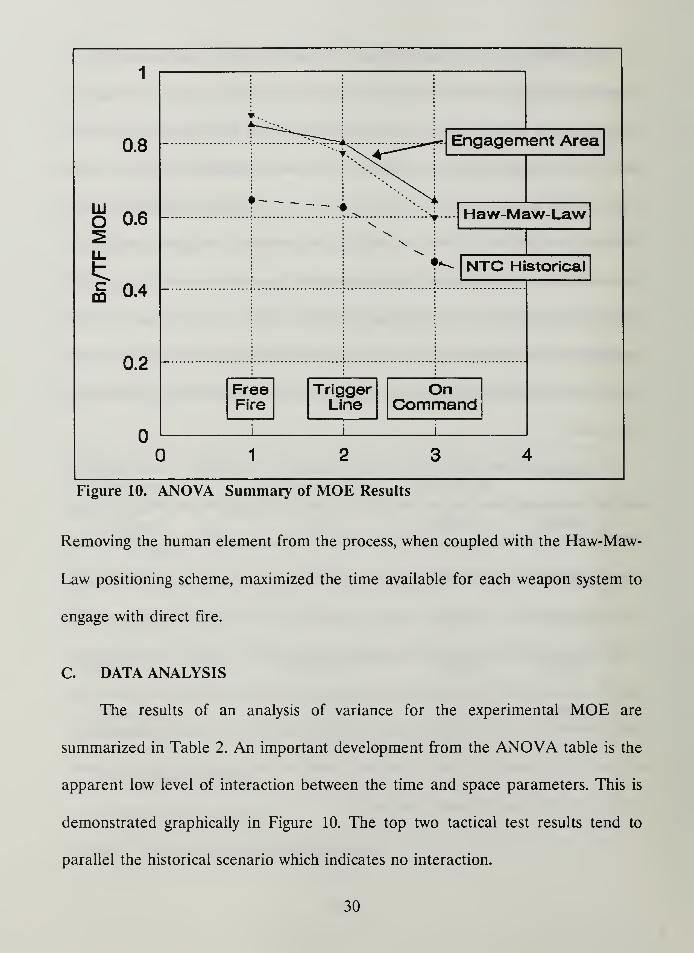
Figure 10. ANOVA Summary of MOE Results
Removing the human element from the process, when coupled with the Haw-Maw-
Law positioning scheme, maximized the time available for each weapon system to
engage with direct fire.
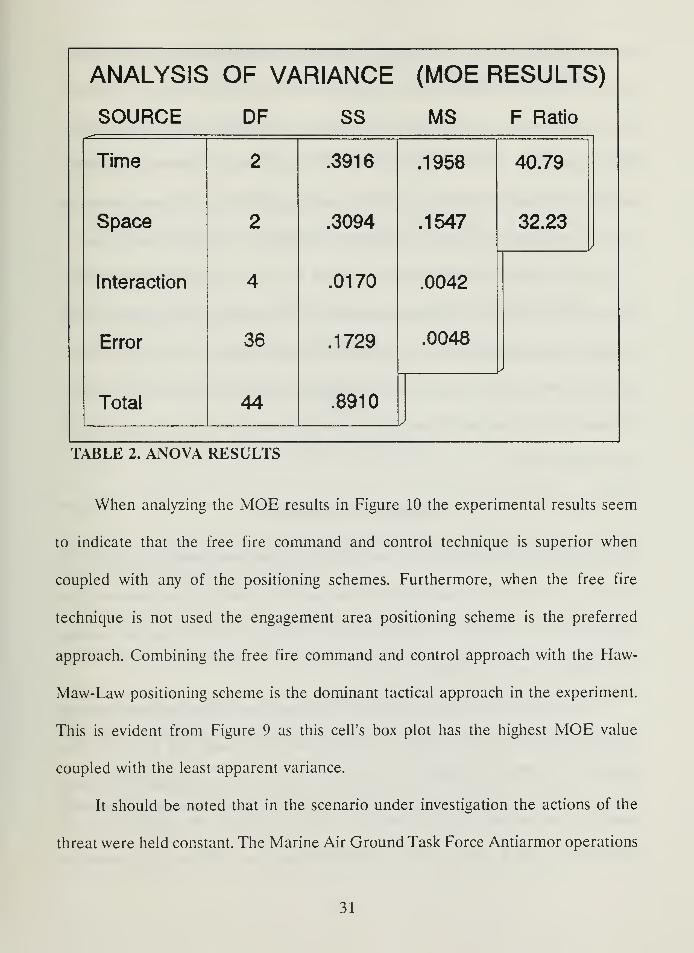
C. DATA ANALYSIS
The results of an analysis of variance for the experimental MOE are
summarized in Table 2. An important development from the ANOVA table is the
apparent low level of interaction between the time and space parameters. This is
demonstrated graphically in Figure 10. The top two tactical test results tend to
parallel the historical scenario which indicates no interaction.
30
ANALYSIS OF VARIANCE (MOE RESULTS)
SOURCE DF SS MS F Ratio
Time 2 .3916 .1958 40.79
Space
Interaction
2
4
.3094
.0170
.1547
.0042
32.23
Error
Total
36
44
.1729
.8910
.0048
*
j
TABLE 2. ANOVA RESULTS
When analyzing the MOE results in Figure 10 the experimental results seem
to indicate that the free fire command and control technique is superior when
coupled with any of the positioning schemes. Furthermore, when the free fire
technique is not used the engagement area positioning scheme is the preferred
approach. Combining the free fire command and control approach with the Haw-
Maw-Law positioning scheme is the dominant tactical approach in the experiment.
This is evident from Figure 9 as this cell's box plot has the highest MOE value
coupled with the least apparent variance.
It should be noted that in the scenario under investigation the actions of the
threat were held constant. The Marine Air Ground Task Force Antiarmor operations
31
manual (FMFM 2-12) warns that a chief drawback of the Haw-Maw-Law positioning
scheme is that early engagements at long range may reveal the defender's operating
methodology before his full firepower weight can be brought to bear on the attacker.
[Ref. 6, p. 3-13] The MOE from our experiment does not capture any penalty
against the defender if he fires early. The visual model of direct fire synchronization
needs to incorporate the aspect of firepower density over both space and time.
The last aspect of our statistical analysis is to see if the tactical parameters
make a difference that is statistically significant. The strategy will be to use box plots
to explore the hypothesis that the parameters have no impact and the medians are
equal. Notched box plots can provide a hypothesis test that is sensitive to the number
of observations in the experiment. The following formula was used to establish the
ends of the notches.
Median ±\.51x{IQRJsfn)
When comparing cell 6 with cell 7, the notched regions were bounded by (.48, .77)
and (.87, .89) respectively and failed to overlap. This provides strong evidence that
the difference in medians is attributed to the tactical parameters and not random
fluctuations of the data. [Ref. 14:p. 62.]
Since the data set failed to conform to the constraint of equal variance required
of classical statistical methodology, a nonparametric approach was also used. The
MOE outcomes were ranked and an analysis of variance was performed. The results
paralleled the earlier ANOVA findings. Table 3 outlines the results from this
methodology. The P value for the interaction effects was .1889 and the alternative
32
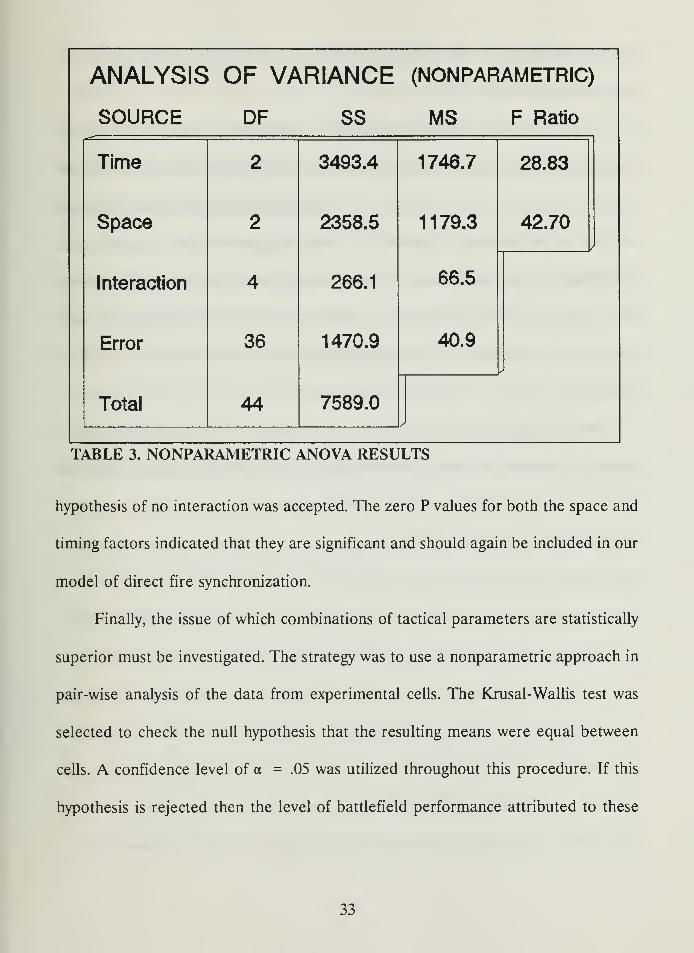
ANALYSIS OF VARIANCE (NONPARAMETRIC)
SOURCE DF SS MS F Ratio
Time 2 3493.4 1746.7 28.83
Space
Interaction
2
4
2358.5
266.1
1 1 79.3
66.5
42.70
Error
Total
36
44
1470.9
7589.0
40.9
•
/
TABLE 3. NONPARAMETRIC ANOVA RESULTS
hypothesis of no interaction was accepted. The zero P values for both the space and
timing factors indicated that they are significant and should again be included in our
model of direct fire synchronization.
Finally, the issue of which combinations of tactical parameters are statistically
superior must be investigated. The strategy was to use a nonparametric approach in
pair-wise analysis of the data from experimental cells. The Krusal-Wallis test was
selected to check the null hypothesis that the resulting means were equal between
cells. A confidence level of a = .05 was utilized throughout this procedure. If this
hypothesis is rejected then the level of battlefield performance attributed to these
33
tactical techniques can be quantified and insight gained as to which operational
approach is preferred.
First, the NTC historical positioning scheme was contrasted with the
engagement area and Haw-Maw-Law approach. In each test the result was found
significant. Either of the doctrinal positioning concepts would have been preferred
to those of the historical scenario. This finding suggests that the battalion under
investigation would benefit from increased training on the doctrinal employment of
their weapon systems. Execution of current tactical methodology would have
improved the performance, as defined by the MOE, of the blue force in the NTC
scenario.
The engagement area technique was contrasted with the Haw-Maw-Law
positioning scheme for each of the command and control procedures. Across the
board, no statistical difference in mean MOE performance was detected between the
two positioning approaches. Given a simulation in which the threat force scheme of
maneuver remains unchanged, the engagement area approach of massing fires for a
shorter duration of time was found indistinguishable from the more linear Haw-Maw-
Law technique that maximized the time available to employ antitank weapons.
Next, the influence of the various command and control approaches was
investigated. In all cases the on-command technique, in which the battalion
commander retained strict positive control over the direct fires of the task force, was
found to be statistically different from the two decentralized methods. The lower
mean MOE associated with this command and control technique suggests that it is
34
the least preferred approach for initiating a direct fire engagement. For the
engagement area positioning scheme no difference in mean MOE performance was
detected when the free fire approach was contrasted with using a trigger line to start
the battle. Conversely, with the Haw-Maw-Law tactic the free fire method statistically
out performed the trigger line approach.
Thus, our nonparametric analysis has resulted in the identification of three
dominant tactical approaches for this scenario. If an engagement area is utilized then
either the free fire or trigger line command and control approaches seem to yield
good results. On the other hand, if a Haw-Maw-Law tactic is employed then it should
be coupled with a free fire command and control technique. This insight supports the
original hypothesis of this study that the MOE for direct fire synchronization is
maximized when execution is decentralized consistent with the commander's intent.
35
V. THE MODEL
A. DEVELOPMENT
The main focus of the BEAM project is to produce diagnostic displays that are
meaningful to the warfighter. The approach to this problem will be to represent the
time and space parameters of synchronization in a graphical display. This display
must be ergonomically friendly to the warfighter and require minimal additional
training to interpret. A combat potential surface, which models the killing
characteristics of the armored fighting vehicles under investigation, can be utilized
to show the warfighter areas where the prerequisites of direct fire synchronization
have been achieved. This will demand that vehicle combat power is quantified.
Since this display is envisioned as a training tool, intended for inclusion in
exercise after-action reviews, it will be a widely disseminated product. This will
require the classified probabilities of hit, for various weapon systems, not be utilized
in model development. An alternative modelling technique is introduced to insure
the combat potential surface is realistic and unclassified.
B. VEHICLE OPERATIONAL LETHALITY INDEX
Because the majority of the MRR's combat power is located in the armored
fighting vehicles which are embedded in its organization, the antiarmor lethality of
the U.S. Task Force is key to halting their attack. The two main platforms which
influence the battle are the M-l Abrams tank and the M-2 Bradley Infantry Fighting
36
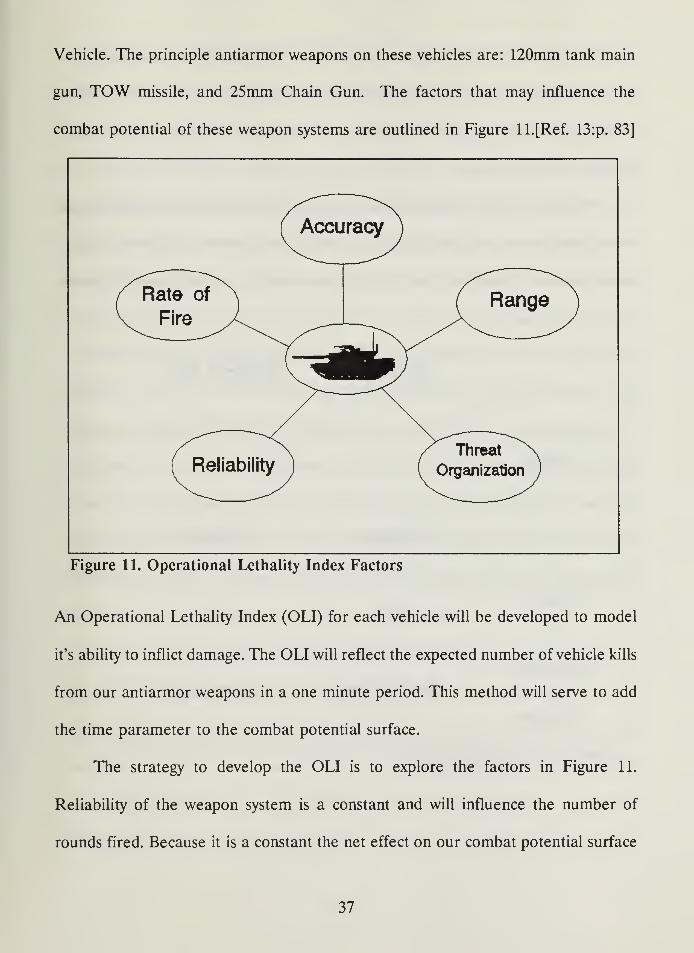
Vehicle. The principle antiarmor weapons on these vehicles are: 120mm tank main
gun, TOW missile, and 25mm Chain Gun. The factors that may influence the
combat potential of these weapon systems are outlined in Figure ll.[Ref. 13:p. 83]
Figure 11. Operational Lethality Index Factors
An Operational Lethality Index (OLI) for each vehicle will be developed to model
it's ability to inflict damage. The OLI will reflect the expected number of vehicle kills
from our antiarmor weapons in a one minute period. This method will serve to add
the time parameter to the combat potential surface.
The strategy to develop the OLI is to explore the factors in Figure 11.
Reliability of the weapon system is a constant and will influence the number of
rounds fired. Because it is a constant the net effect on our combat potential surface
37
would be to lower it by a uniform height. Given our small time interval of one
minute the likelihood of failure is very small and this aspect of the model will not be
developed further. Apart from reliability, the armament of tanks and APCs have
distinctive characteristics.
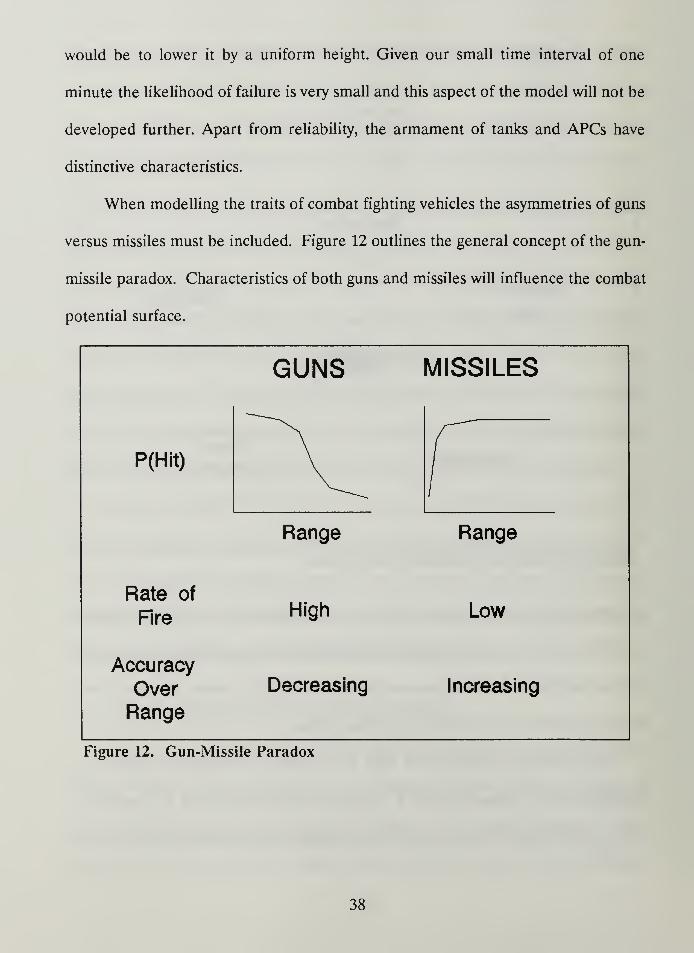
When modelling the traits of combat fighting vehicles the asymmetries of guns
versus missiles must be included. Figure 12 outlines the general concept of the gun-
missile paradox. Characteristics of both guns and missiles will influence the combat
potential surface.
GUNS MISSILES
P(Hit) "~V f
Range Range
Rate of
FireHigh Low
Accuracy
Over Decreasing Increasing
Range
Figure 12. Gun-Missile Paradox
38
The number of rounds that a tank can fire at an armored target in one minute
interval is fairly constant. This is driven by the fact that the main gun is used to
destroy vehicles with either light or heavy armor. By changing ammunition types the
tank may use its main fire control system in each of the engagements. The physical
characteristics of these 120mm rounds are so similar that their handling time in
battle is basically the same. The tank rate of fire is set at three rounds per minute,
accounting for reload time, the interval of time for dust to settle between rounds, and
gunner lay adjustments. These conditions do not hold for the APC.
Both the M-2 Bradley and the BMP-2 are equipped with a dual main
armament. Each APC carries a heavy anti-tank missile and a rapid fire cannon. This
combination produces the ability to kill both heavily and lightly armored vehicles but
at different rates, with the two different weapons. This makes the employment times
of each weapon dependent on the types of targets on the battlefield. It is assumed
that each gunner will use anti-tank (AT) missiles when firing at tanks and reserve his
cannon fire for APCs. This aspect of the model is captured in threat organization
(T/O) factors that are used to adjust the lethality of APCs.
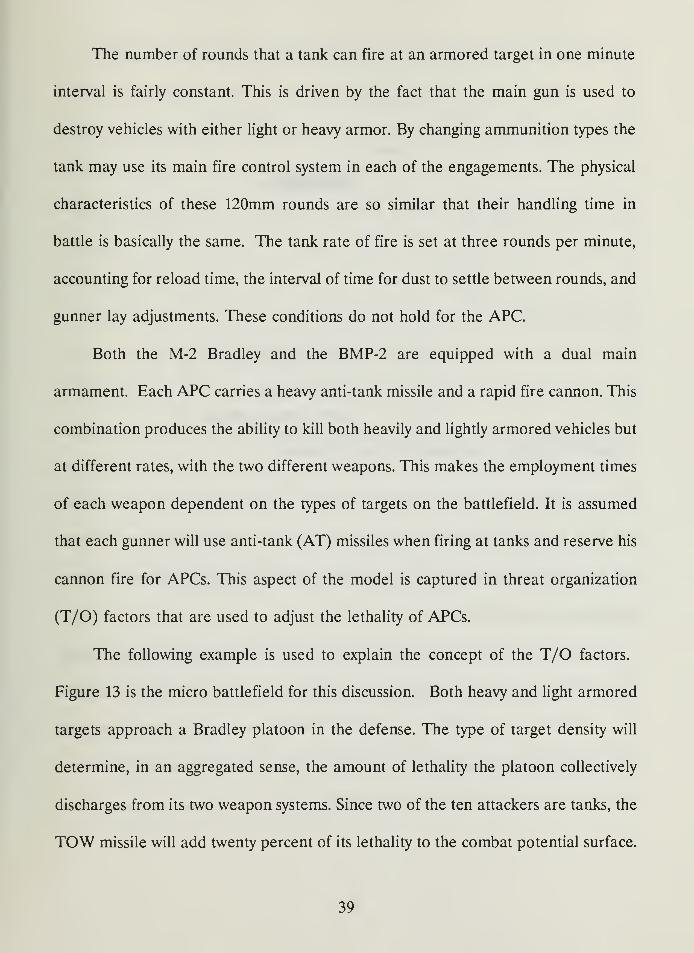
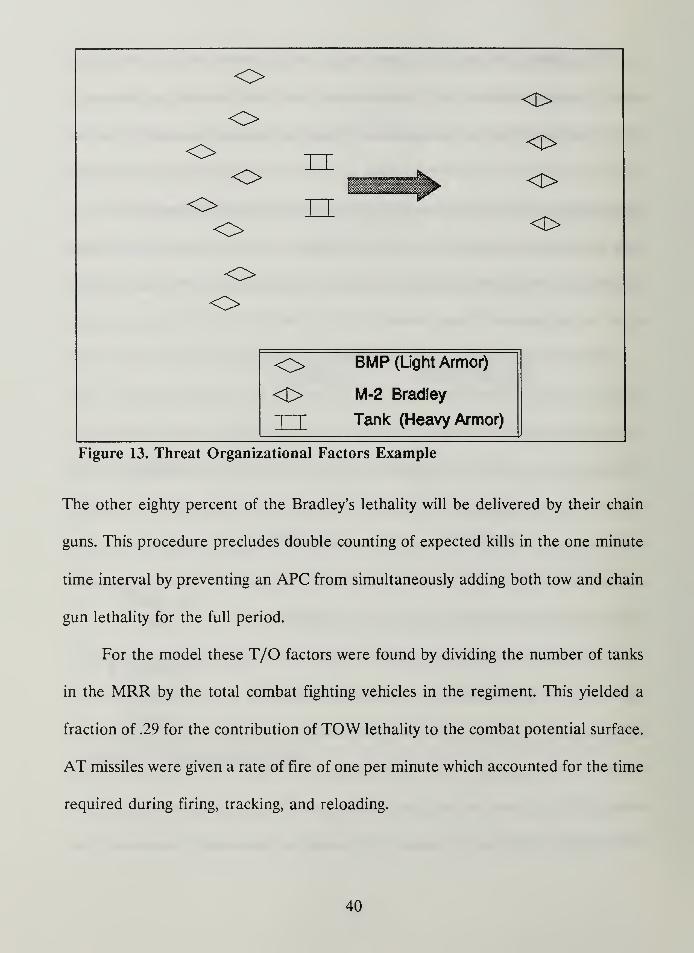
The following example is used to explain the concept of the T/O factors.
Figure 13 is the micro battlefield for this discussion. Both heavy and light armored
targets approach a Bradley platoon in the defense. The type of target density will
determine, in an aggregated sense, the amount of lethality the platoon collectively
discharges from its two weapon systems. Since two of the ten attackers are tanks, the
TOW missile will add twenty percent of its lethality to the combat potential surface.
39
oo <D>
<> I_Lo L Ooo Ooo
o BMP (Light Armor)
<t> M-2 Bradley
1 1
Tank (Heavy Armor)
Figure 13. Threat Organizational Factors Example
The other eighty percent of the Bradley's lethality will be delivered by their chain
guns. This procedure precludes double counting of expected kills in the one minute
time interval by preventing an APC from simultaneously adding both tow and chain
gun lethality for the full period.
For the model these T/O factors were found by dividing the number of tanks
in the MRR by the total combat fighting vehicles in the regiment. This yielded a
fraction of .29 for the contribution of TOW lethality to the combat potential surface.
AT missiles were given a rate of fire of one per minute which accounted for the time
required during firing, tracking, and reloading.
40
A similar approach was used with the chain gun. If a Bradley was not firing at
a tank, then the chain gun would add seventy-one percent of its lethality to the
combat potential surface. Because the chain gun produces less of a dust signature
when firing than a tank, its rate of fire will tend to be higher. This accounted for the
ability of the chain gun to rapidly re-engage a target and apply burst-on-target
techniques to walk rounds onto the enemy. Each APC was considered able to deliver
four bursts per minute of well aimed fire with their chain gun.
The range and accuracy factors of the vehicle's weapon systems combine to
form the probability that a target is hit and killed. This is explained as the probability
of a kill given a hit times the probability of a hit. A kill is defined as sufficient
damage to remove a vehicle from further influencing the battle at hand. Since we
have assumed gunners will use the correct type of ammunition against the target, the
likelihood of a kill given a hit is essentially one. This conclusion rests on the fact
that, while a vehicle may survive a hit, damage to the combat subsystems of fire
control and boresighting, communications, and the track mobility mechanisms will
render it not repairable before the battle will end. This result allows the model to
focus on the probability of a hit to capture the factors of accuracy and range.
Because probability of hit data is restricted another approach was required to model
this aspect of the OLI.
Seth Bonder proposed one method for attenuating Lanchester attrition
coefficients over range using the formula below:
41
a(r)=aox(l-(r/Rmax)r
with a(r) being the Lanchester coefficient for the current range r. [Ref. 10:p. 5-6] a^
is the maximum value of the attrition coefficient at point blank range. The part of
the equation in parenthesis and raised to the power 11 accounts for the range effects
and serves as an unclassified probability of a hit in the model. Rmax is the maximum
employment range of the weapon system. /* is used as a shaping constant to fit the
probability of a hit curve to the characteristics of each main armament. This method
is currently used in the VECTOR series of combat models. [Ref. 10:p. 91.]
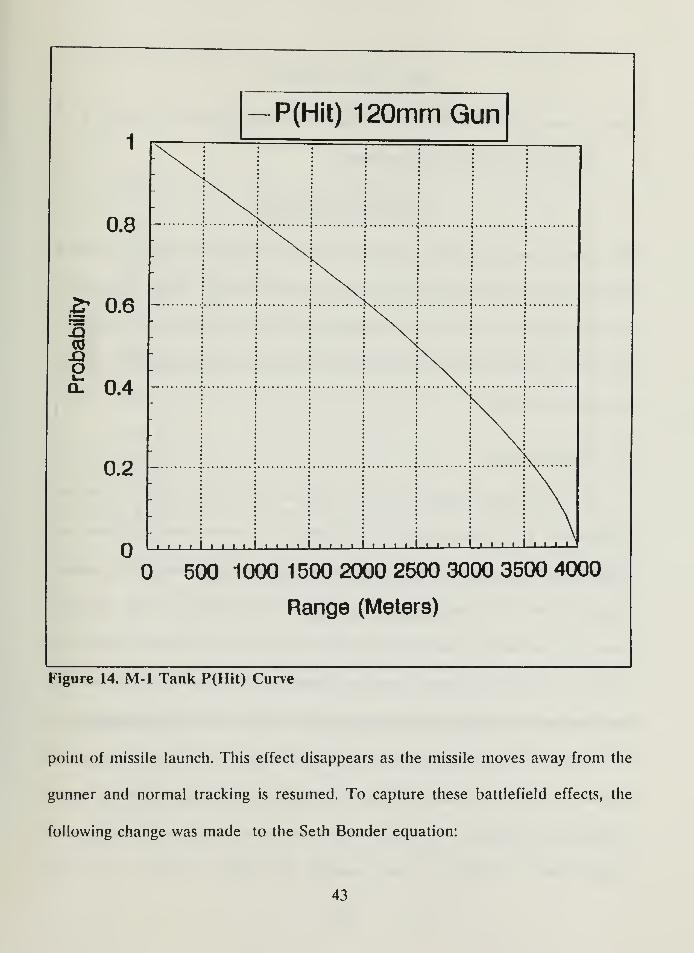
The end points of each curve are based on the technical characteristics of the
weapon. The shaping coefficient is then fit to the range at which the probability of
a hit is fifty percent, information which is available in unclassified form. For gun
weapon systems this approach worked well to capture the effects of decreasing
probability of a hit over range. Figure 14 portrays this approach for the M-l tank.
Missile systems required a modification to the Seth Bonder equation. When
a gunner fires a missile, the back blast and violent launch of the projectile briefly
interrupt the tracking process. This period of gunner dazzle lasts approximately one
to two seconds. During this time, the missile is traveling down range at two hundred
meters per second. When the effects described above are combined with the
warhead's sixty-five meter arming distance, the result is a dead zone around the
42
0.8
& 0.6
4-QO£ 0.4
0.2
-P(Hit) 120mm Gun
\J
•
j
.... i .... i .... i .... i . . . . i .... i .... i^500 1000 1 500 2000 2500 3000 3500 4000
Range (Meters)
Figure 14. Ml Tank P(Hit) Curve
point of missile launch. This effect disappears as the missile moves away from the
gunner and normal tracking is resumed. To capture these battlefield effects, the
following change was made to the Seth Bonder equation:
43
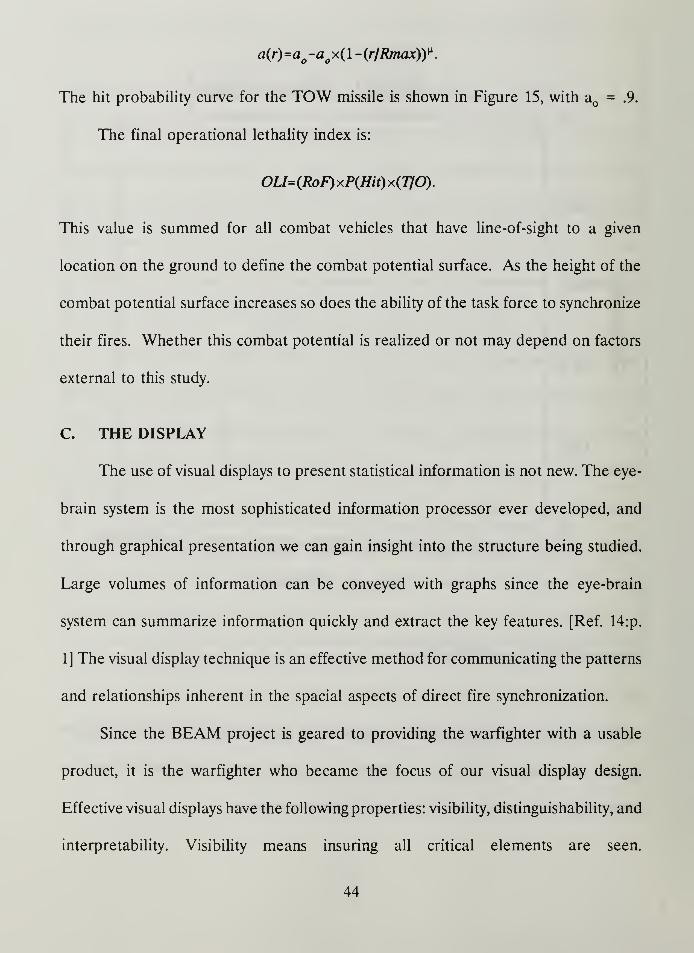
a(r)=a -aox(l-(r/Rmwc)r.
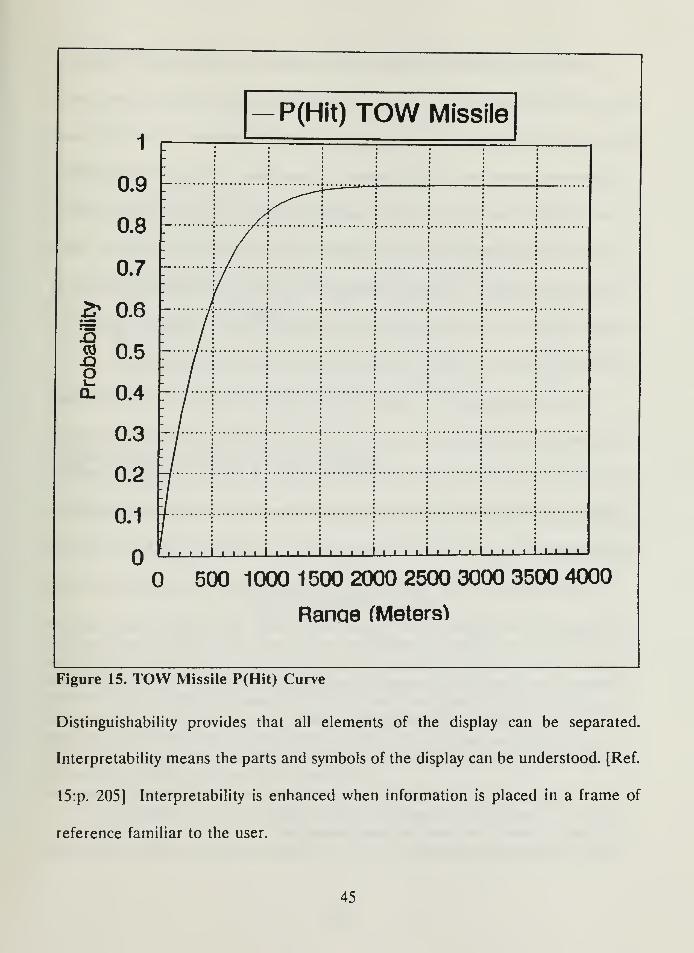
The hit probability curve for the TOW missile is shown in Figure 15, with a = .9.
The final operational lethality index is:
OU=(RoF) xP(Hit) x(770).
This value is summed for all combat vehicles that have line-of-sight to a given
location on the ground to define the combat potential surface. As the height of the
combat potential surface increases so does the ability of the task force to synchronize
their fires. Whether this combat potential is realized or not may depend on factors
external to this study.
C. THE DISPLAY
The use of visual displays to present statistical information is not new. The eye-
brain system is the most sophisticated information processor ever developed, and
through graphical presentation we can gain insight into the structure being studied.
Large volumes of information can be conveyed with graphs since the eye-brain
system can summarize information quickly and extract the key features. [Ref. 14:p.
1] The visual display technique is an effective method for communicating the patterns
and relationships inherent in the spacial aspects of direct fire synchronization.
Since the BEAM project is geared to providing the warfighter with a usable
product, it is the warfighter who became the focus of our visual display design.
Effective visual displays have the following properties: visibility, distinguishability, and
interpretability. Visibility means insuring all critical elements are seen.
44
0.9
0.8
0.7
£• 0.6
1 0.5OQl 0.4
0.3
0.2
0.1
- P(Hit) TOW Missile
;: : i «
; |/| |
J|
! / I
| |I
I "ft| |
I |
:/!!![ I !
;/ I ! ! I ! I
l/ I I ! I I i
| I | |j !
1 L.I..1..L.I 1 I L 1 1 1 I 1 1 t 1 1 1 1 t t 1 1 1 1 1 1 1 1
. , , , i t I IX
500 1000 1 500 2000 2500 3000 3500 4000
Ranae (Meters^
Figure 15. TOW Missile P(Hit) Curve
Distinguishability provides that all elements of the display can be separated.
Interpretability means the parts and symbols of the display can be understood. [Ref.
15:p. 205] Interpretability is enhanced when information is placed in a frame of
reference familiar to the user.
45
The frame of reference which is most accepted to communicate information
about military operations is the map. All warfighters receive map training during
their entry level programs and are comfortable with this medium. A map of the area
of operations, overlaid with a grid system of measurement, will provide the backdrop
to the display. This will provide the warfighter directly with the range parameter
developed in the model. The time parameter will be introduced by taking "snap-
shots" of the battlefield during the engagement. The battle can then be animated at
different points in time to depict direct fire synchronization. The third aspect that
the visual display must show is the height of the combat potential surface.
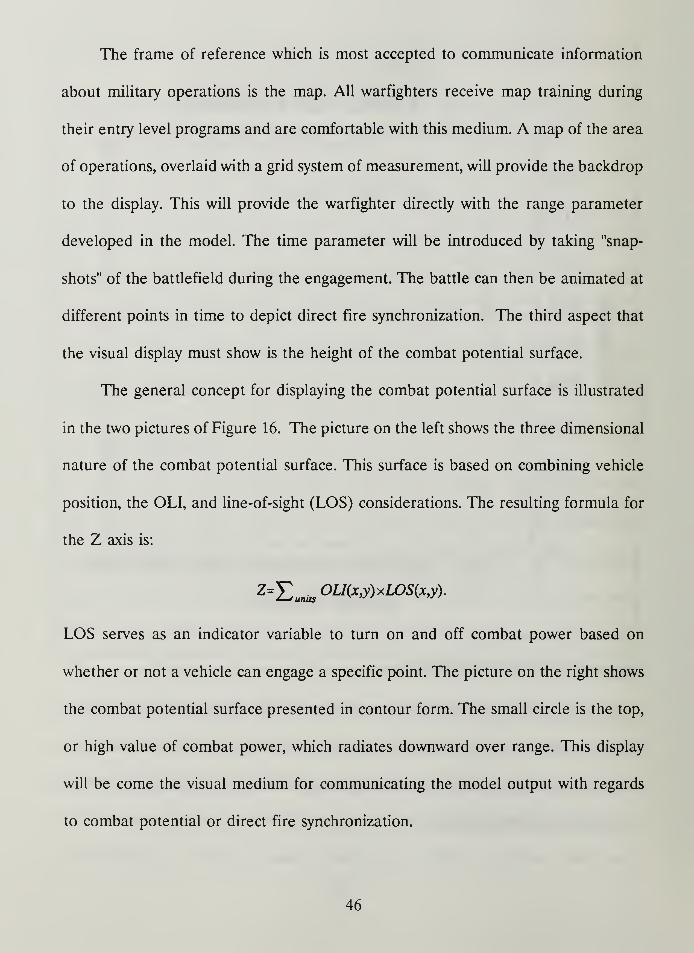
The general concept for displaying the combat potential surface is illustrated
in the two pictures of Figure 16. The picture on the left shows the three dimensional
nature of the combat potential surface. This surface is based on combining vehicle
position, the OLI, and line-of-sight (LOS) considerations. The resulting formula for
the Z axis is:
Z=Y,units
OLI{x,y)xLOS{x,y).
LOS serves as an indicator variable to turn on and off combat power based on
whether or not a vehicle can engage a specific point. The picture on the right shows
the combat potential surface presented in contour form. The small circle is the top,
or high value of combat power, which radiates downward over range. This display
will be come the visual medium for communicating the model output with regards
to combat potential or direct fire synchronization.
46
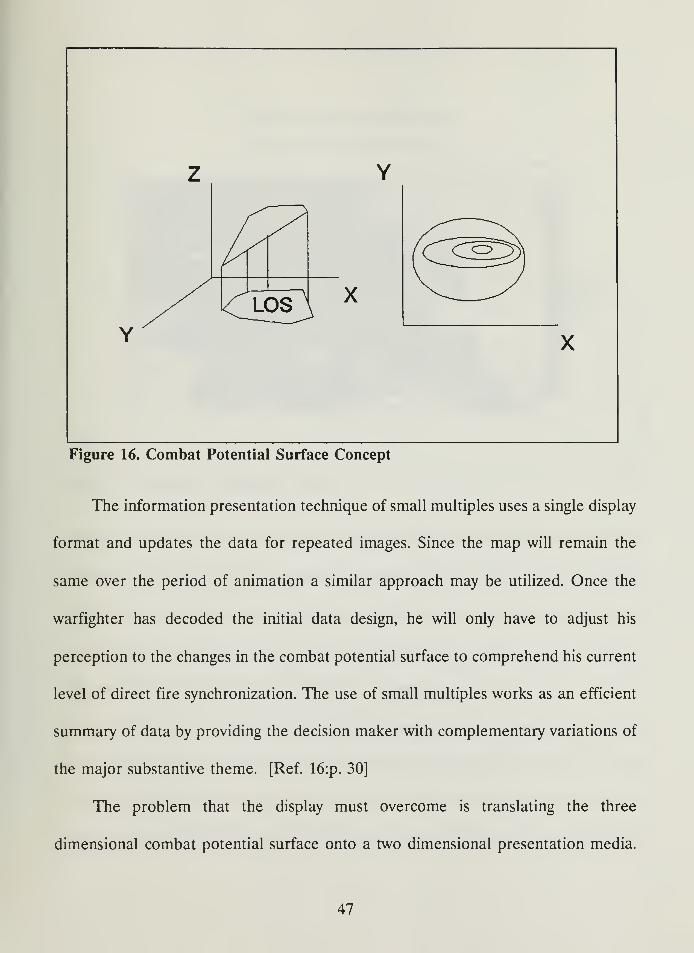
Figure 16. Combat Potential Surface Concept
The information presentation technique of small multiples uses a single display
format and updates the data for repeated images. Since the map will remain the
same over the period of animation a similar approach may be utilized. Once the
warfighter has decoded the initial data design, he will only have to adjust his
perception to the changes in the combat potential surface to comprehend his current
level of direct fire synchronization. The use of small multiples works as an efficient
summary of data by providing the decision maker with complementary variations of
the major substantive theme. [Ref. 16:p. 30]
The problem that the display must overcome is translating the three
dimensional combat potential surface onto a two dimensional presentation media.
47

HISTORICAL NTC SCENARIO
(COMBAT POTENTIAL DENSITY SURFACE)
BATTLE TIME: MINS
£
^nm-
4HBIcombatpotentialSCORE(F[k,tMmin)
Figure 17. Historical Scenario at Start
Color can be an important channel for conveying information. It has been shown that
the use of color in a display can reduce visual search time by fifty to seventy percent
and increase accuracy at the same time. [Ref. 16:p. 216] The presentation problem
is overcome by contouring the combat potential surface based on a color scheme.
The warfighter's familiarity with elevation contours on a map provides a starting
point for this approach. Theories of vision show that the human cognitive processing
gives considerable and decisive weight to contour information. [Ref. 16:p. 94]
Lastly, a familiar frame of reference was used to color code the contours. Red is used
to show hot areas with a large volume of direct fire. Conversely, blue represented the
48

cool areas where combat potential is low. Green and yellow are used as transitional
links between these two extremes.
The assignment of color to the combat potential surface was tied to the
synchronization requirement for the battalion. The task force is attempting to overlap
the killing potential of the subordinate company/teams. If the commander is
successful in his positioning scheme then the effective combat power of two teams
will range the same area where he intends to destroy the enemy. For this study,
effective combat power is defined as half of the total expected kills that a company
potentially could inflict in a one minute period. This resulted in an upper bound on
the coloring scheme of forty-two. The red and yellow areas show battlefield locations
where the expected killing potential of two companies are massed. The blue and
green areas represent points where the battalion can inflict damage on the enemy,
but only one company's killing potential is present. This implies that the prerequisite
conditions for direct fire synchronization have not been established at the battalion
level.
The final key component of the display is the operational overlay of the
battalion's defensive plan. This uses common military symbols, found in the doctrinal
literature, to visually show the commander's intent of how the battle will be
conducted. The contours of the combat potential surface will show if direct fires were
allocated within EAs according to the battalion commander's plan. This display can
serve as a key tool in the after-action review process to help commanders, at all
levels, visualize how well their elements performed direct fire synchronization.
49

ENGAGEMENT AREA MODIFICATIONNTC SCENARIO
(COMBAT POTENT!AL DENSITY SURFACE)
BATTLE TIME: MINS
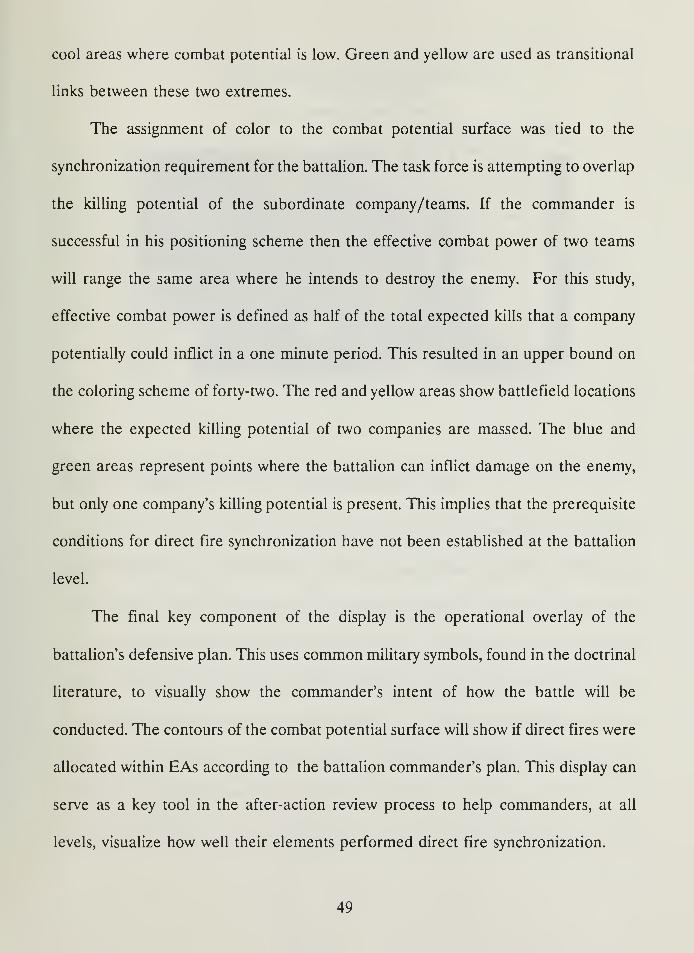
Figure 18. Engagement Area Positioning Scheme at Start
Figure 17 is an example display based on the initial positions of the NTC
historical scenario. It shows that the task force had massed some fires in EA Shark
and to a lesser extent overlapped a few areas in EA Cuda. When this is contrasted
with the engagement area dispositions, Figure 18, it is seen that the repositioning of
vehicles can greatly increase the combat potential in EA Cuda. The nature of the
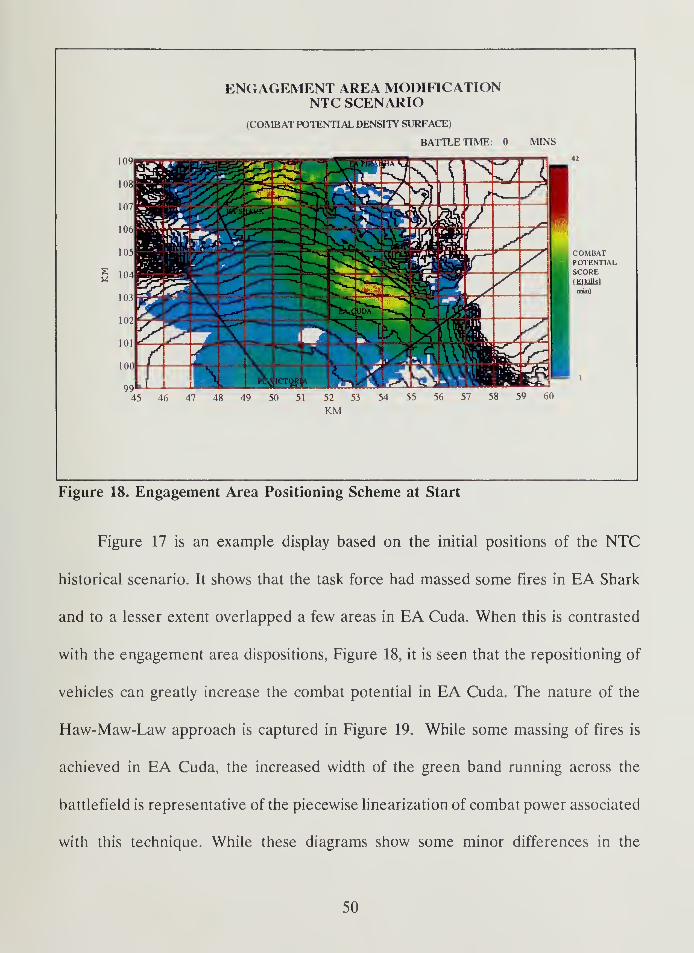
Haw-Maw-Law approach is captured in Figure 19. While some massing of fires is
achieved in EA Cuda, the increased width of the green band running across the
battlefield is representative of the piecewise linearization of combat power associated
with this technique. While these diagrams show some minor differences in the
50

HAW-MAW-LAW MODIFICATIONNTC SCENARIO
(COMBAT POTENTIAL DENSITY SURFACE)
BATTLE TIME: MINS
Figure 19. Haw-Maw-Law Approach at Start
relative synchronization of fires they do not appear to account for the statistically
different MOE results noted in Chapter IV.
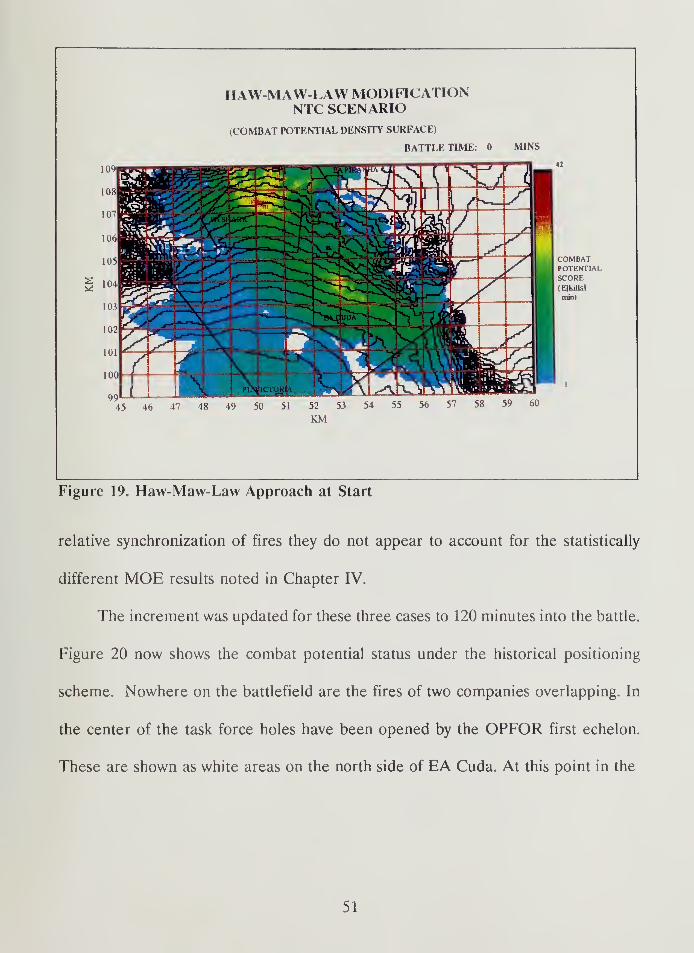
The increment was updated for these three cases to 120 minutes into the battle.
Figure 20 now shows the combat potential status under the historical positioning
scheme. Nowhere on the battlefield are the fires of two companies overlapping. In
the center of the task force holes have been opened by the OPFOR first echelon.
These are shown as white areas on the north side of EA Cuda. At this point in the
51

HISTORICAL NTC SCENARIO
(COMBAT POTENTIAL DENSITY SURFACE)
BATTLE TIME: 120 MINS
45 46 47 48 49 SO 55 56 57 58 59 60
Figure 20. Historical Scenario at 120 minutes
engagement the enemy has destroyed the counter-reconnaissance forces from the
southern end of the sector and is well on his way to passing the second echelon
through the defense.
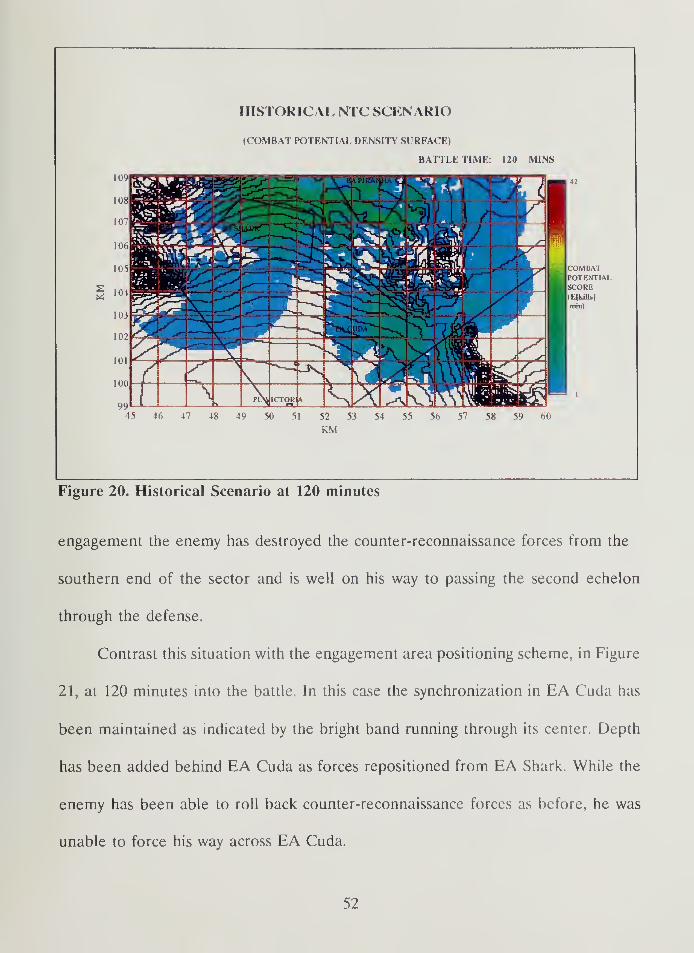
Contrast this situation with the engagement area positioning scheme, in Figure
21, at 120 minutes into the battle. In this case the synchronization in EA Cuda has
been maintained as indicated by the bright band running through its center. Depth
has been added behind EA Cuda as forces repositioned from EA Shark. While the
enemy has been able to roll back counter-reconnaissance forces as before, he was
unable to force his way across EA Cuda.
52

ENGAGEMENT AREA MODIFICATIONNTC SCENARIO
(COMBAT POTENTIAL DENSITY SURFACE)
BATTLE TIME: 120 MINS
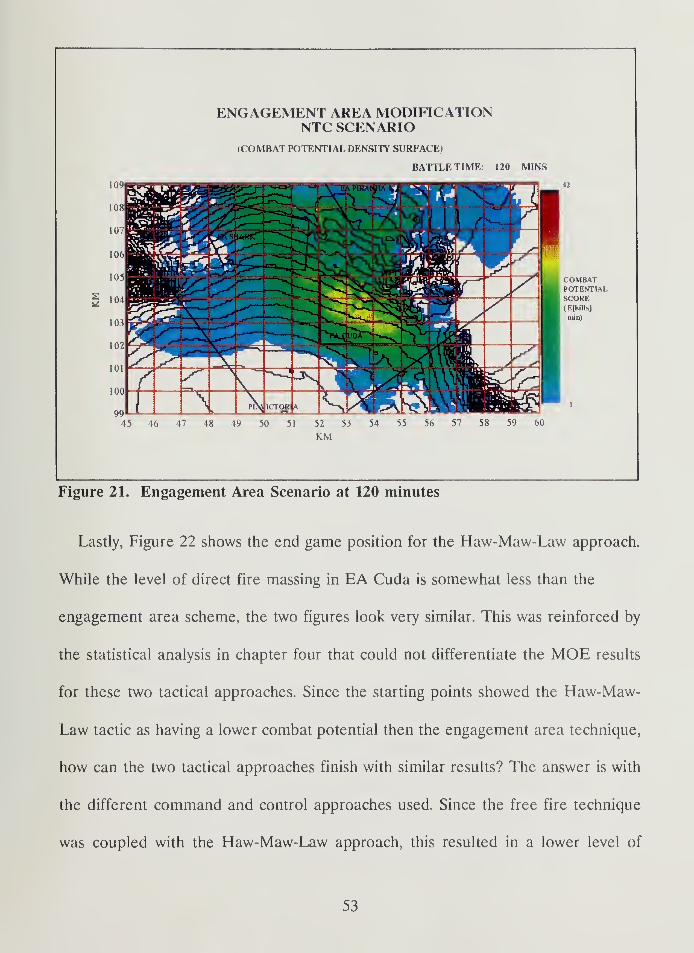
Figure 21. Engagement Area Scenario at 120 minutes
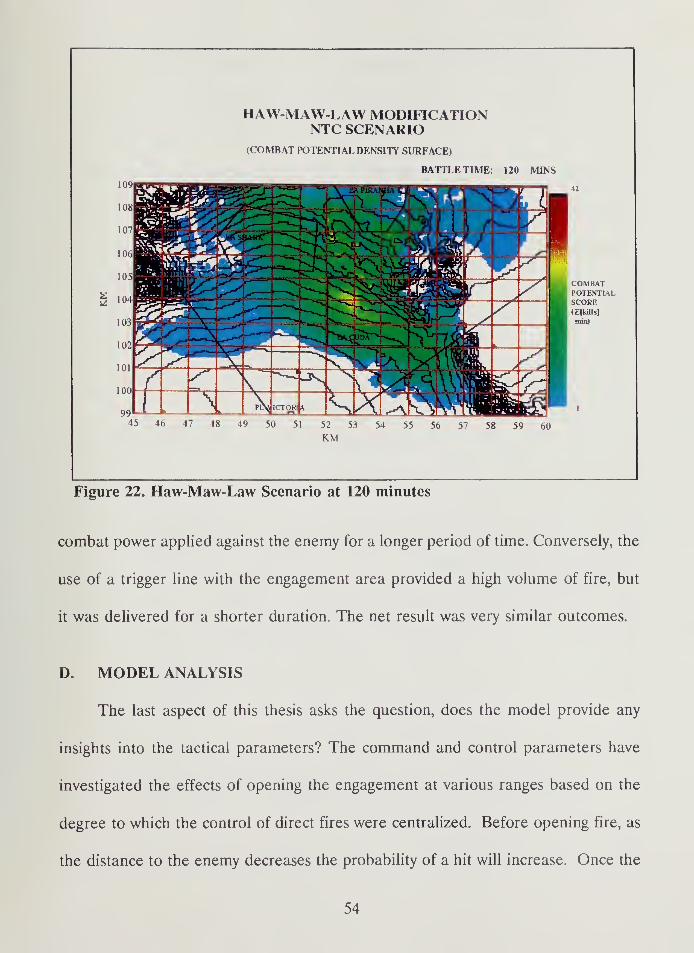
Lastly, Figure 22 shows the end game position for the Haw-Maw-Law approach.
While the level of direct fire massing in EA Cuda is somewhat less than the
engagement area scheme, the two figures look very similar. This was reinforced by
the statistical analysis in chapter four that could not differentiate the MOE results
for these two tactical approaches. Since the starting points showed the Haw-Maw-
Law tactic as having a lower combat potential then the engagement area technique,
how can the two tactical approaches finish with similar results? The answer is with
the different command and control approaches used. Since the free fire technique
was coupled with the Haw-Maw-Law approach, this resulted in a lower level of
53

HAW-MAW-LAW MODIFICATIONNTC SCENARIO
(COMBAT POTENTIAL DENSITY SURFACE)
BATTLE TIME: 120 MINS
J"
Figure 22. Haw-Maw-Law Scenario at 120 minutes
combat power applied against the enemy for a longer period of time. Conversely, the
use of a trigger line with the engagement area provided a high volume of fire, but
it was delivered for a shorter duration. The net result was very similar outcomes.
D. MODEL ANALYSIS
The last aspect of this thesis asks the question, does the model provide any
insights into the tactical parameters? The command and control parameters have
investigated the effects of opening the engagement at various ranges based on the
degree to which the control of direct fires were centralized. Before opening fire, as
the distance to the enemy decreases the probability of a hit will increase. Once the
54

battle is joined, the dynamics of the engagement will rapidly alter the static
dispositions on which the defense is established. The key point to discover then, is
at what opening range is the OLI value maximized?
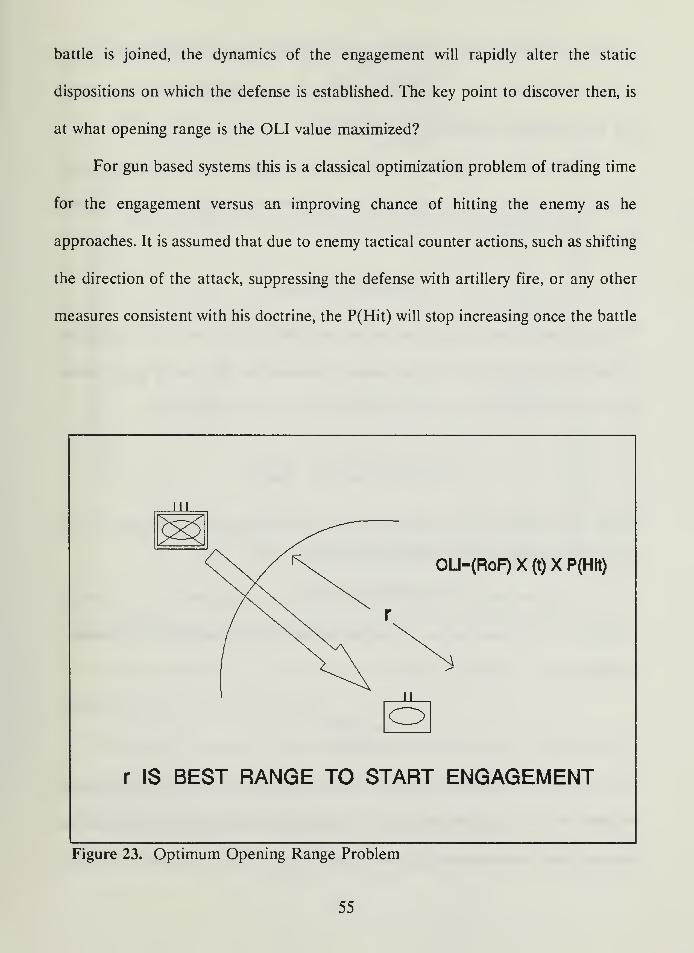
For gun based systems this is a classical optimization problem of trading time
for the engagement versus an improving chance of hitting the enemy as he
approaches. It is assumed that due to enemy tactical counter actions, such as shifting
the direction of the attack, suppressing the defense with artillery fire, or any other
measures consistent with his doctrine, the P(Hit) will stop increasing once the battle
OU-(RoF) X (t) X P(Hit)
G>
r IS BEST RANGE TO START ENGAGEMENT
Figure 23. Optimum Opening Range Problem
55
is joined. For the purpose of this analysis it is assumed that the P(hit) remains fixed
at the initial firing value. This model captures the active nature of the enemy which
was not investigated in the simulation scenario.
If the OLI is expanded beyond the one minute interval and the threat
organization factors are discounted as weapon system specific, then the resulting
formula is:
OLI=(Rof)x(t)xP(Hit).
Time and current target range are the two variables in this scheme. To simplify the
process, time available for the engagement is expressed as the opening range divided
by the rate of enemy advance (RoA). The result of this substitution is:
OLI=(Rof)x(-^-)x(l--^—y.RoA Rmax
Figure 24 is a graph of this function over opening range and shows the nature of the
OLI for an engagement under these conditions.
To find the optimal range at which to start the engagement we set the first
derivative to zero and solved. It can be shown that this results in the following
expression,
_ Rmaxr
"(i+n)
These results yielded optimal opening ranges for the two gun based weapon
systems. For the missile based systems this analysis was simplified by the fact the
these functions are monotonically increasing in form. Their maximum will occur at
56
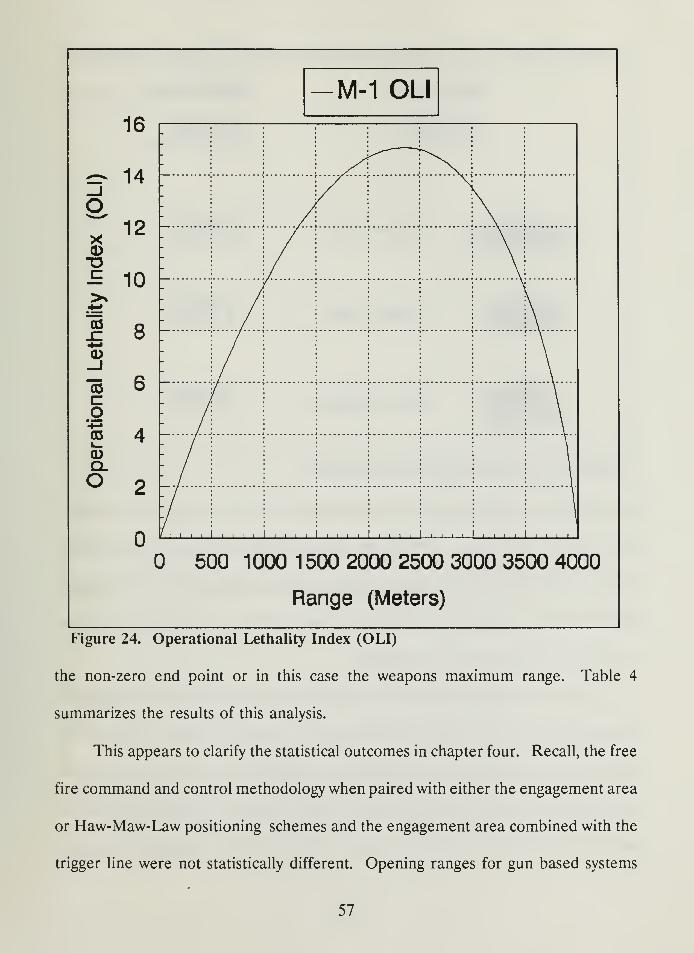
M-1 OLI
16
— 14
O
CDoc
ID
COcoCO1—CDQ.O
12
10
8
6
4
— ', ! J y/- !- !— *<* 1
500 1000 1500 2000 2500 3000 3500 4000
Range (Meters)
Figure 24. Operational Lethality Index (OLI)
the non-zero end point or in this case the weapons maximum range. Table 4
summarizes the results of this analysis.
This appears to clarify the statistical outcomes in chapter four. Recall, the free
fire command and control methodology when paired with either the engagement area
or Haw-Maw-Law positioning schemes and the engagement area combined with the
trigger line were not statistically different. Opening ranges for gun based systems
57
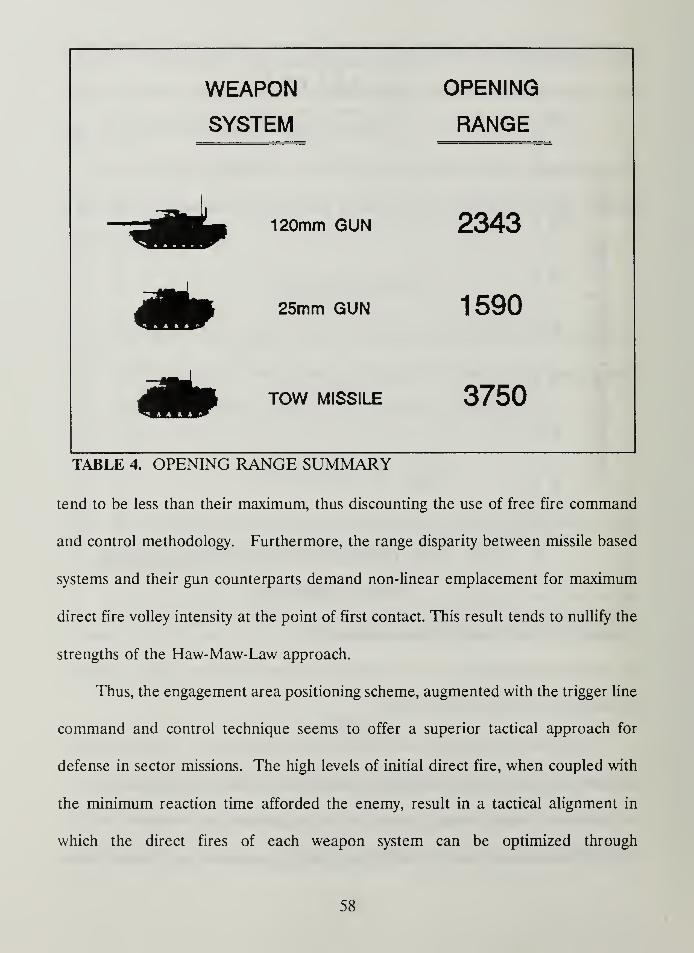
WEAPON
SYSTEM
OPENING
RANGE
^ 120mm GUN 2343
4b 25mm GUN 1590
*» TOW MISSILE 3750
TABLE 4. OPENING RANGE SUMMARY
tend to be less than their maximum, thus discounting the use of free fire command
and control methodology. Furthermore, the range disparity between missile based
systems and their gun counterparts demand non-linear emplacement for maximum
direct fire volley intensity at the point of first contact. This result tends to nullify the
strengths of the Haw-Maw-Law approach.
Thus, the engagement area positioning scheme, augmented with the trigger line
command and control technique seems to offer a superior tactical approach for
defense in sector missions. The high levels of initial direct fire, when coupled with
the minimum reaction time afforded the enemy, result in a tactical alignment in
which the direct fires of each weapon system can be optimized through
58

synchronization. This was demonstrated in the graphical displays associated with the
BEAM project.
59
VI. CONCLUSIONS
A. FINDINGS
The following hypothesis was tested for validity. Direct fire synchronization in
the defense is best achieved when subordinate elements are positioned for mutual
support and execution is decentralized consistent with the commander's intent.
Statistical analysis of simulation results, as measured by the battalion/task force
MOE, confirmed the hypothesis.
The best tactical approach for the defense in sector mission is to combine the
engagement area positioning scheme with the trigger line execution methodology. If
the enemy is faced with constrained freedom of action, then the Haw-Maw-Law
approach holds some promise when coupled with the free fire technique. The ability
of the enemy to shift his point of attack following initial contact will help determine
whether intensity of the opening fires should be traded for increased engagement
time.
Capturing the influence of direct fire synchronization as envisioned by the
BEAM project does indeed appear possible. The combat potential surface provides
the warfighter with a familiar visual reference through which to objectively explore
his tactical dispositions. The commander can track the concentrations of his combat
power relative to the operational graphics to see how well subordinate units are
complying with his intent. This should provide for centralized planning and
60
decentralized execution. These two components are key to battlefield
synchronization.
As an after action review tool, the combat potential surface holds great
promise. Since the potential of the battalion can be tracked before the start of the
engagement, locating battlefield shortfalls beyond the scope of tactical dispositions
is now possible in an objective manner. For example, if the OPFOR is able to push
through an area where direct fires have been massed then the problem can be traced
to lack of gunnery technique or failure in boresighting vice inadequate vehicle
positioning.
B. RECOMMENDATIONS
The Combat Potential Surface should be included in the instrumental upgrade
of the NTC's data collection and processing equipment. The format, speed,
exportability of this display make it well suited to the future training process of Army
battalions during defense in sector missions. This display has further potential to be
incorporated at Army schools that use Janus(A) in their instruction.
C. FOLLOW-ON RESEARCH
While the Combat Potential Surface has done a good job at capturing vehicle
mounted anti-tank weapon systems the dismounted side of task force operations has
not been modelled. Further efforts could include adding infantry weapons such as the
Dragon or other hand held weapons to the display. Furthermore, a display that
focused on the dismounted aspects of the battle could provide insights into the
61
combat conducted in the non-armor fight. This display would show the combat
potential of infantry weapons in closed terrain.
Lastly, weapons still in development could be added to the display once their
operating parameters had been determined. This would allow for the visualization
of the battlefield contribution of systems like the Hyper-velocity Anti-Tank Missile.
Various tactical approaches could be modelled to gain insight as to the effect of
different weapon parameters and their input to combat potential.
62
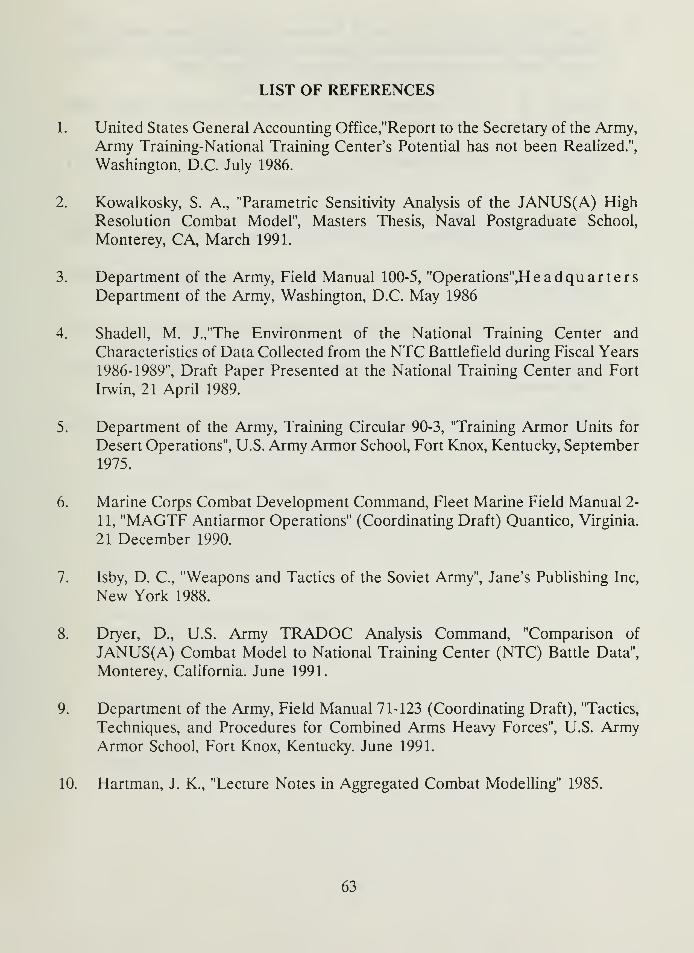
LIST OF REFERENCES
1. United States General Accounting Office,"Report to the Secretary of the Army,
Army Training-National Training Center's Potential has not been Realized.",
Washington, D.C. July 1986.
2. Kowalkosky, S. A., "Parametric Sensitivity Analysis of the JANUS(A) High
Resolution Combat Model", Masters Thesis, Naval Postgraduate School,
Monterey, CA, March 1991.
3. Department of the Army, Field Manual 100-5, "Operations",H e ad quartersDepartment of the Army, Washington, D.C. May 1986
4. Shadell, M. J.,"The Environment of the National Training Center and
Characteristics of Data Collected from the NTC Battlefield during Fiscal Years
1986-1989", Draft Paper Presented at the National Training Center and Fort
Irwin, 21 April 1989.
5. Department of the Army, Training Circular 90-3, "Training Armor Units for
Desert Operations", U.S. Army Armor School, Fort Knox, Kentucky, September
1975.
6. Marine Corps Combat Development Command, Fleet Marine Field Manual 2-
11, "MAGTF Antiarmor Operations" (Coordinating Draft) Quantico, Virginia.
21 December 1990.
7. Isby, D. C, "Weapons and Tactics of the Soviet Army", Jane's Publishing Inc,
New York 1988.
8. Dryer, D., U.S. Army TRADOC Analysis Command, "Comparison of
JANUS(A) Combat Model to National Training Center (NTC) Battle Data",
Monterey, California. June 1991.
9. Department of the Army, Field Manual 71-123 (Coordinating Draft), "Tactics,
Techniques, and Procedures for Combined Arms Heavy Forces", U.S. ArmyArmor School, Fort Knox, Kentucky. June 1991.
10. Hartman, J. K., "Lecture Notes in Aggregated Combat Modelling" 1985.
63
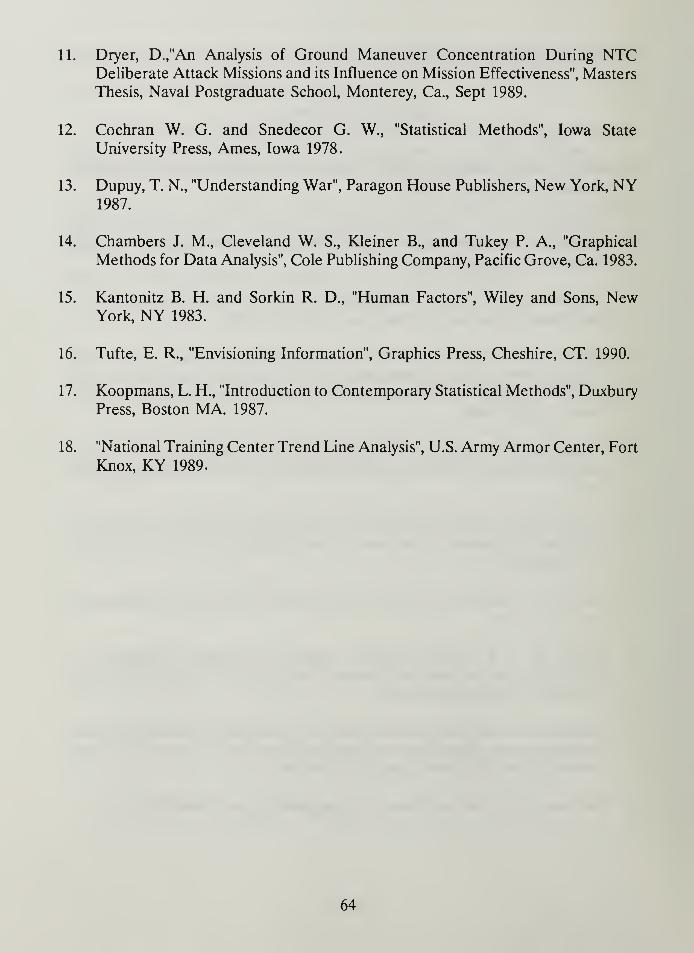
11. Dryer, D.,"An Analysis of Ground Maneuver Concentration During NTCDeliberate Attack Missions and its Influence on Mission Effectiveness", Masters
Thesis, Naval Postgraduate School, Monterey, Ca., Sept 1989.
12. Cochran W. G. and Snedecor G. W., "Statistical Methods", Iowa State
University Press, Ames, Iowa 1978.
13. Dupuy, T. N., "Understanding War", Paragon House Publishers, New York, NY1987.
14. Chambers J. M., Cleveland W. S., Kleiner B., and Tukey P. A., "Graphical
Methods for Data Analysis", Cole Publishing Company, Pacific Grove, Ca. 1983.
15. Kantonitz B. H. and Sorkin R. D., "Human Factors", Wiley and Sons, NewYork, NY 1983.
16. Tufte, E. R., "Envisioning Information", Graphics Press, Cheshire, CT. 1990.
17. Koopmans, L. H., "Introduction to Contemporary Statistical Methods", DuxburyPress, Boston MA. 1987.
18. "National Training Center Trend Line Analysis", U.S. Army Armor Center, Fort
Knox, KY 1989.
64
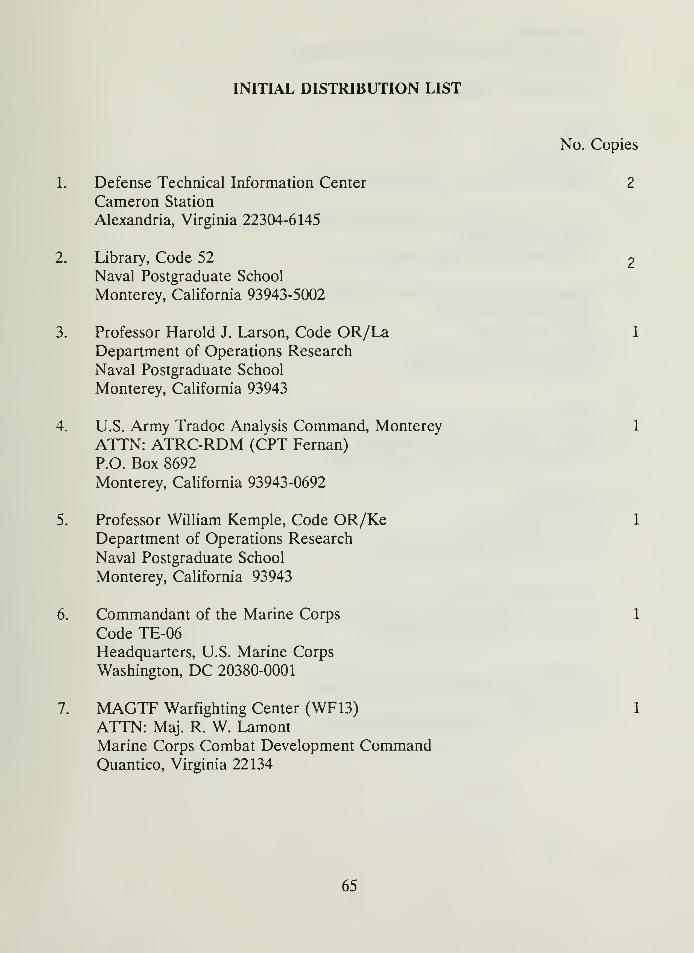
INITIAL DISTRIBUTION LIST
No. Copies
1. Defense Technical Information Center 2
Cameron Station
Alexandria, Virginia 22304-6145
2. Library, Code 522
Naval Postgraduate School
Monterey, California 93943-5002
3. Professor Harold J. Larson, Code OR/La 1
Department of Operations Research
Naval Postgraduate School
Monterey, California 93943
4. U.S. Army Tradoc Analysis Command, Monterey 1
ATTN: ATRC-RDM (CPT Fernan)
P.O. Box 8692
Monterey, California 93943-0692
5. Professor William Kemple, Code OR/Ke 1
Department of Operations Research
Naval Postgraduate School
Monterey, California 93943
6. Commandant of the Marine Corps 1
Code TE-06Headquarters, U.S. Marine Corps
Washington, DC 20380-0001
7. MAGTF Warfighting Center (WF13) 1
ATTN: Maj. R. W. LamontMarine Corps Combat Development CommandQuantico, Virginia 22134
65
8. CommanderU.S. Army Training and Doctrine CommandATTN: ATCDFort Monroe, Virginia 23651-5000
9. Chief
ARI Field Unit
P.O. Box 5787
Presidio of Monterey, California 93944-5011
10. U.S. Army Combined Arms Research Library (CARL)ATTN: ATZL-SWS-LFort Leavenworth, Kansas 66027-7000
11. Deputy Undersecretary of the Army for
Operations Research
ATTN: Mr. Hollis
Room 2E660, The Pentagon
Washington, DC 20310-0102
12. Director
Center for Army Lessons Learned (CALL)ATTN: ATZL-CTL (CPT Robinson)
Fort Leavenworth, Kansas 66027-7000
13. CommanderOperation GroupATTN: ATZL-TAL-OFort Irwin, California 92310-5000
14. Commanding General
National Training Center and Fort Irwin
Fort Irwin, California 92310-5000
15. CommanderU.S. Army TRADOC Analysis CommandATTN: ATRCFort Leavenworth, Kansas 66027-5200
66


DUDLEY KNOX LIBRARY
NAVAL POSTGRADUATE SCHOOI
MONTEREY CA 93943-5101
GAYLORD S