Embed Size (px)
Citation preview
30
CHAPTER III
RESEARCH PROCEDURES
This chapter presents: (1) research method; (2) research variables; (3)
operational definition; (4) population and samples; (5) techniques for collecting
the data; (6) research instrument analysis; (7) research treatments; (8) techniques
for analyzing data; and (9) pre-requisite analysis.
3.1 Research Method
Based on the problems and the objectives, this research used the pretest-
posttest two treatment design. In this design, the writer has three groups of
samples: the first is experimental group by using SQ3R strategy, the second is
experimental study by using ETR strategy, and the third is control group. There
were two experimental groups. Both of them were given pretest, treatment of
SQ3R and ETR strategies, and posttest, while in control group the students were
given pretest and posttest without treatment (Cohen, Manion & Morrison, 2007,
pp. 278-279).
The design is as follows:
EG1 O1 Xa O2
EG2 O3 Xb O4
CG O5 - O6
Where :
O1 : pre-test for experimental group using SQ3R strategy
31
O2 : post-test for experimental group using SQ3R strategy
O3 : pre-test for experimental group using ETR strategy
O4 : post-test for experimental group using ETR strategy
O5 : pre-test with no treatment for control group
O6 : post-test with no treatment for control group
Xa : treatment for reading comprehension using SQ3R strategy
Xb : treatment for reading comprehension using ETR strategy
- : no treatment
EG1 : experimental group 1 using SQ3R strategy
EG2 : experimental group 2 using ETR strategy
CG : control group using no treatment
3.2 Research Variables
There are two kinds of research variables, they are independent variable
and dependent variable. Creswell (2012, p. 116) argues that an independent
variableis an attribute or characteristic that influences or affects an outcome or
dependent variable. And he also argues that dependent variable is an attribute or
characteristic that is dependent on or influenced by the independent variable
(Creswell, 2012, p. 115).
There are three variables in this research, two independent variables and
one dependent variable. SQ3R and ETR strategies are as independent variables.
The students’ narrative reading achievement is as dependent variable.
32
3.3 Operational Definition
1. Teaching
Teaching is guiding and facilitating learning, enabling the learner to learn,
and setting the conditions for learning. In other words, teaching is the process of
transfering the knowledge, sharing the information, and guiding the learner to do
something between the teacher and students, in order to help them understand and
develop their ability in learning process.
2. Reading
Reading is an activity to get much knowledge. People are blind without
reading because knowledge and information get from reading. To understand
what has been read, the readers need to comprehend it.
3. Narrative
Narrative text is a kind of genre aimed to entertain, to gain and hold the
readers’ interest in a story. Narrative text is also a sequence of events of story.
Language features neccessary in narrative are usually specific, often individual
participants with defined identities
4. SQ3R Strategy
SQ3R strategy is one of the popular strategies that helps students to build
their background knowledge of the text. Students learn best when they attach new
information to previous knowledge.
5. ETR Strategy
ETR is a strategy of teaching that can be applied to improve the students’
reading comprehension. This ETR method can help the students to activate their
33
background knowledge in drawing the meaning of a text or story. Then, relate it to
the new information that they have got from the text after the reading process.
3.4 Population and Sample
3.4.1 Population
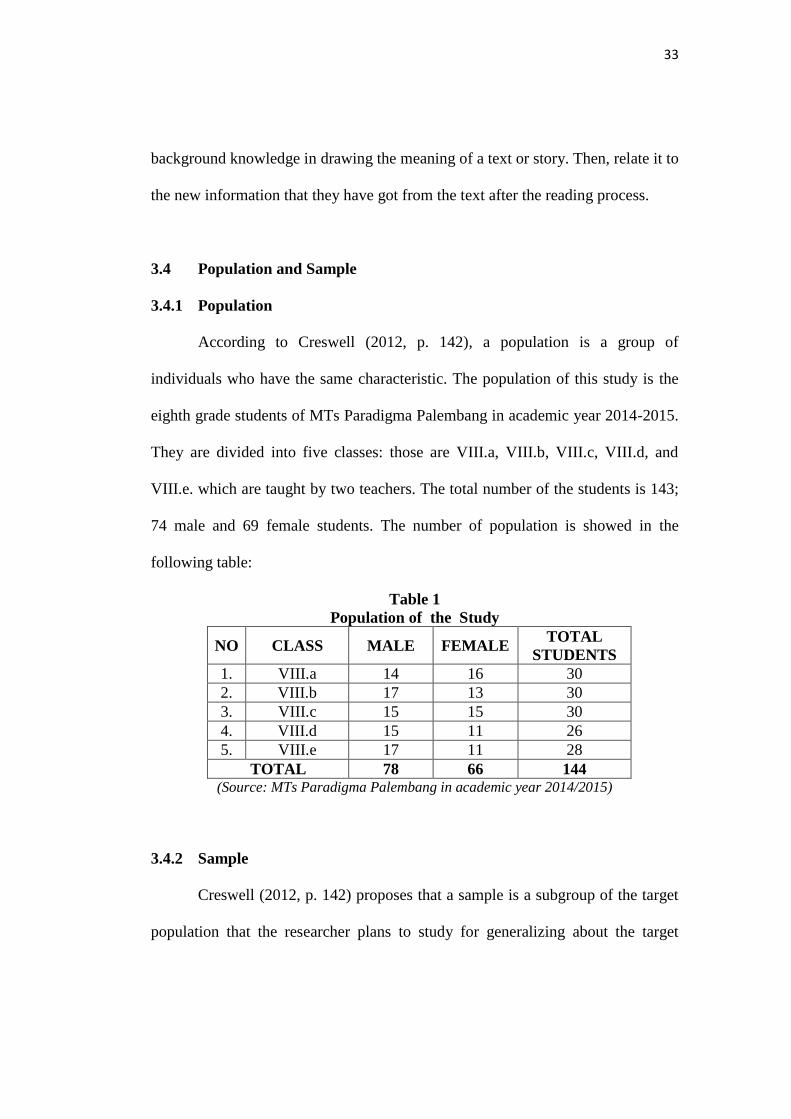
According to Creswell (2012, p. 142), a population is a group of
individuals who have the same characteristic. The population of this study is the
eighth grade students of MTs Paradigma Palembang in academic year 2014-2015.
They are divided into five classes: those are VIII.a, VIII.b, VIII.c, VIII.d, and
VIII.e. which are taught by two teachers. The total number of the students is 143;
74 male and 69 female students. The number of population is showed in the
following table:
Table 1 Population of the Study
NO CLASS MALE FEMALE TOTAL STUDENTS
1. VIII.a 14 16 30 2. VIII.b 17 13 30 3. VIII.c 15 15 30 4. VIII.d 15 11 26 5. VIII.e 17 11 28
TOTAL 78 66 144 (Source: MTs Paradigma Palembang in academic year 2014/2015)
3.4.2 Sample
Creswell (2012, p. 142) proposes that a sample is a subgroup of the target
population that the researcher plans to study for generalizing about the target
34
population. To select the sample, the writer used purposive sampling technique.
Frankel and Wallen (2009, p. 99) also state that :
“Purposive sampling is different from convenience sampling in that researchers do not simply study who is available but rather use their judgment to select a sample that they believe, based on prior information, will provide the data they need.”
The writer chose purposive sampling because the writer tried to find the
samples that were at least nearly the same result in English subject, especially in
reading skill. The writer got some information from the teacher and the result of
students’ scores from the teacher. The writer chose the sample because they had
some poor English competence, especially in reading skill and had the same
number of the students as consideration. And then the writer took the sample for
each experimental and control groups.
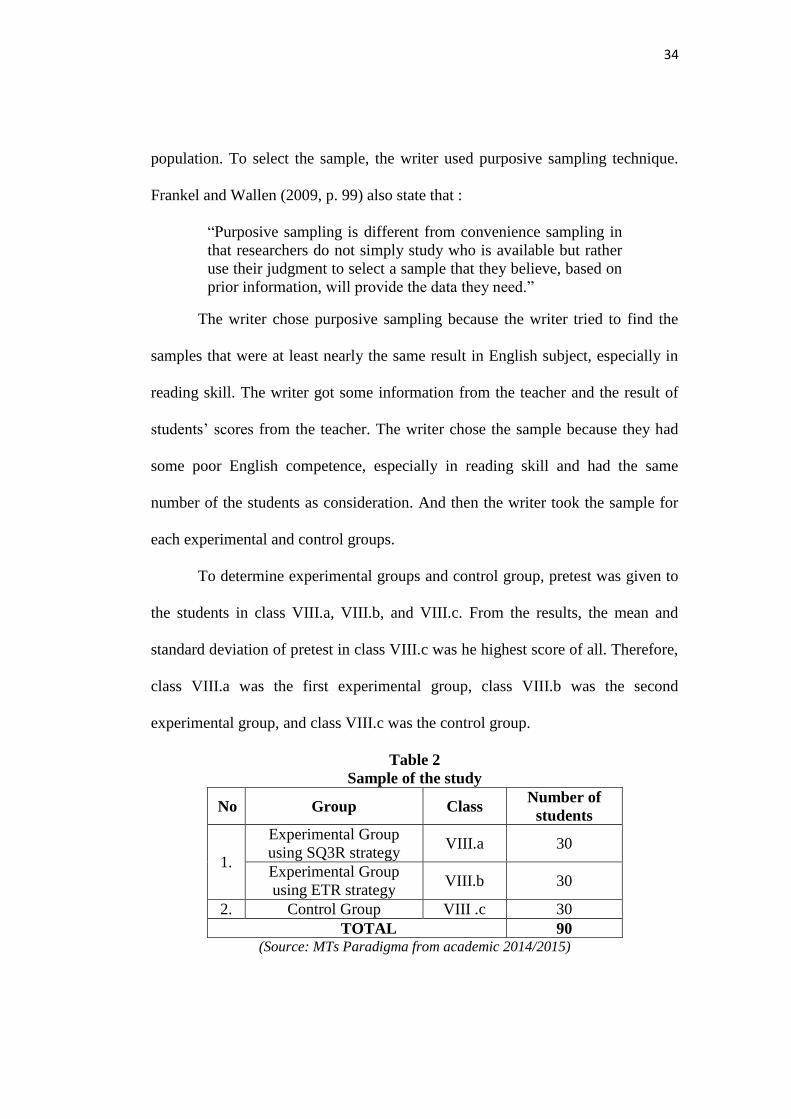
To determine experimental groups and control group, pretest was given to
the students in class VIII.a, VIII.b, and VIII.c. From the results, the mean and
standard deviation of pretest in class VIII.c was he highest score of all. Therefore,
class VIII.a was the first experimental group, class VIII.b was the second
experimental group, and class VIII.c was the control group.
Table 2 Sample of the study
No Group Class Number of
students
1.
Experimental Group using SQ3R strategy
VIII.a 30
Experimental Group using ETR strategy
VIII.b 30
2. Control Group VIII .c 30 TOTAL 90
(Source: MTs Paradigma from academic 2014/2015)
35
3.5 Technique for Collecting the Data
3.5.1 Tests
In collecting the data, the writer used narrative reading test. There were
two tests, pretest and posttest that were given to the sample of this study. Arikunto
(2010, p. 193) defines that test is a series of questions or exercises or other means
of measuring skill, knowledge, intelligence, and capacities of an individual or a
group.
In constructing the test, the writer did some steps: (1) preparing the test;
(2) asking the validators on the appropriateness; (3) trying out the test. The writer
did the try out at SMP NU Palembang which is the same characteristic as the
sample; (4) analyzing the result, whether or not it is valid and reliable; (5)
producing the final test; (6) conducting the test.
The purpose of the test is to know the result of teaching narrative reading
text by using SQ3R and ETR strategies. Narrative reading test in the pretest
administered before treatment and post-test was administered after treatment. The
test items in the post-test are the same as those of pre-test, because the purpose of
giving them is to know the progress of student narrative reading achievement
before and after treatment.
3.5.1.1 Pretest
Pretest is done before treatment is given. The pretest is administered to
assess students’ narrative reading achievement before treatment. Both control and
experiment group should answer forty questions of narrative reading texts.
36
3.5.1.2 Posttest
The posttest is administered to control group and experiment group after
pretest and treatment. The type of post-test item was the same as the pre-test. This
test aim is to measure students’ narrative reading achievement after treatment. The
result of this test was compared with the result of pre-test in order to know effect
of teaching reading through SQ3R and ETR strategies on students’ narrative
reading achievement. From the post-test, the writer is able to get the data that can
be used to measure the students’ progress taught by using SQ3R and ETR
strategies.
3.5.2 Research Instrument Analysis
3.5.2.1 Validity Test
Validity refers to the appropriateness, meaningfulness, correctness, and
usefulness of the inferences a researcher makes. The validity is the most important
idea to consider when preparing or selecting an instrument for use (Fraenkel,
Wallen, & Hyun, 2012, p. 147).
1. Construct Validity
Fraenkel, et. al, (2012, p. 148) state that construct validity refers to the
nature of the psychological construct or characteristic being measured. The writer
asked three lecturers as validator to estimate her instruments. They are Hilma
Suryani, M. Pd., Winny Riznanda, M. Pd., and Amalia Hasanah, S. S., M. Pd. The
writer asked three validators to add criteria for scoring item questions, to give
37
clear directions and separated each paragraph followed by questions of every text,
to revise some item questions of the test and to revise a few things in lesson plan.
From the validator, it can be assumed that the test instruments and lesson plan are
appropriate to be used for the research study.
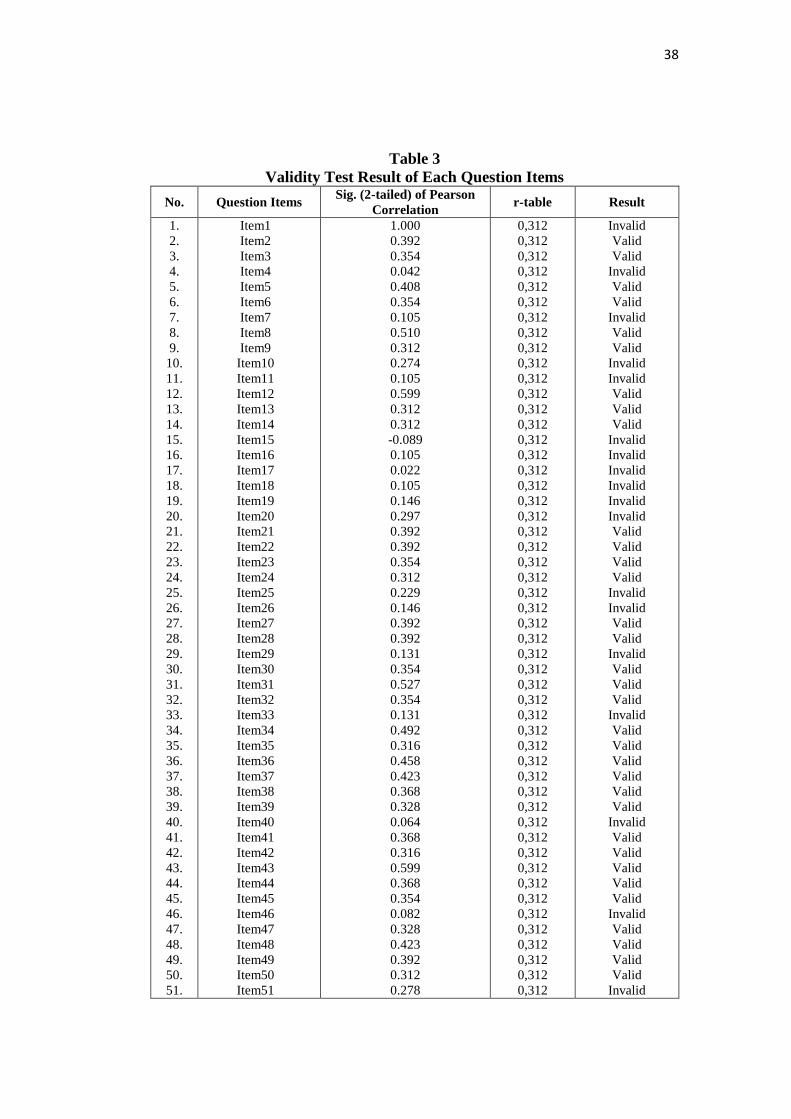
2. Validity of Each Question Item
In this case, the writer had already tried out her research instruments at
SMP Nahdatul Ulama (NU) Palembang. The try out of the test was carried out on
Wednesday, February 25th, 2015 at 10.30-11.20. The research instruments of the
test were tested to 40 students of the eighth grade students (VIII.1). The writer did
try out to find out the validity of each question items. There were 60 questions
given to the students. According to Basrowi and Soenyono (2007, p. 24), a
question item is considered valid if r-output is higher than r-table (0,312). The
result analysis of validity of each question by using Pearson Correlation formula
in SPSS 16 found that there were 40 questions item valid. They are questions item
number 2, 3, 5, 6, 8, 9, 12, 13, 14, 21, 22, 23, 24, 27, 28, 30, 31, 32, 34, 35, 36, 37,
38, 39, 41, 42, 43, 44, 45, 47, 48, 49, 50, 53, 54, 56, 57, 58, 59, 60. Then, there
were 20 questions item invalid. They are questions item number 1, 4, 7, 10, 11,
15, 16, 17, 18, 19, 20, 25, 26, 29, 33, 40, 46, 51, 52, 55. Therefore, since there
were 40 questions item valid, so 40 question items were used. The result analysis
of validity test in each questions item was displayed in the following table:
38
Table 3 Validity Test Result of Each Question Items
No. Question Items Sig. (2-tailed) of Pearson
Correlation r-table Result
1. 2. 3. 4. 5. 6. 7. 8. 9. 10. 11. 12. 13. 14. 15. 16. 17. 18. 19. 20. 21. 22. 23. 24. 25. 26. 27. 28. 29. 30. 31. 32. 33. 34. 35. 36. 37. 38. 39. 40. 41. 42. 43. 44. 45. 46. 47. 48. 49. 50. 51.
Item1 Item2 Item3 Item4 Item5 Item6 Item7 Item8 Item9 Item10 Item11 Item12 Item13 Item14 Item15 Item16 Item17 Item18 Item19 Item20 Item21 Item22 Item23 Item24 Item25 Item26 Item27 Item28 Item29 Item30 Item31 Item32 Item33 Item34 Item35 Item36 Item37 Item38 Item39 Item40 Item41 Item42 Item43 Item44 Item45 Item46 Item47 Item48 Item49 Item50 Item51
1.000 0.392 0.354 0.042 0.408 0.354 0.105 0.510 0.312 0.274 0.105 0.599 0.312 0.312 -0.089 0.105 0.022 0.105 0.146 0.297 0.392 0.392 0.354 0.312 0.229 0.146 0.392 0.392 0.131 0.354 0.527 0.354 0.131 0.492 0.316 0.458 0.423 0.368 0.328 0.064 0.368 0.316 0.599 0.368 0.354 0.082 0.328 0.423 0.392 0.312 0.278
0,312 0,312 0,312 0,312 0,312 0,312 0,312 0,312 0,312 0,312 0,312 0,312 0,312 0,312 0,312 0,312 0,312 0,312 0,312 0,312 0,312 0,312 0,312 0,312 0,312 0,312 0,312 0,312 0,312 0,312 0,312 0,312 0,312 0,312 0,312 0,312 0,312 0,312 0,312 0,312 0,312 0,312 0,312 0,312 0,312 0,312 0,312 0,312 0,312 0,312 0,312
Invalid Valid Valid
Invalid Valid Valid
Invalid Valid Valid
Invalid Invalid Valid Valid Valid
Invalid Invalid Invalid Invalid Invalid Invalid Valid Valid Valid Valid
Invalid Invalid Valid Valid
Invalid Valid Valid Valid
Invalid Valid Valid Valid Valid Valid Valid
Invalid Valid Valid Valid Valid Valid
Invalid Valid Valid Valid Valid
Invalid
39
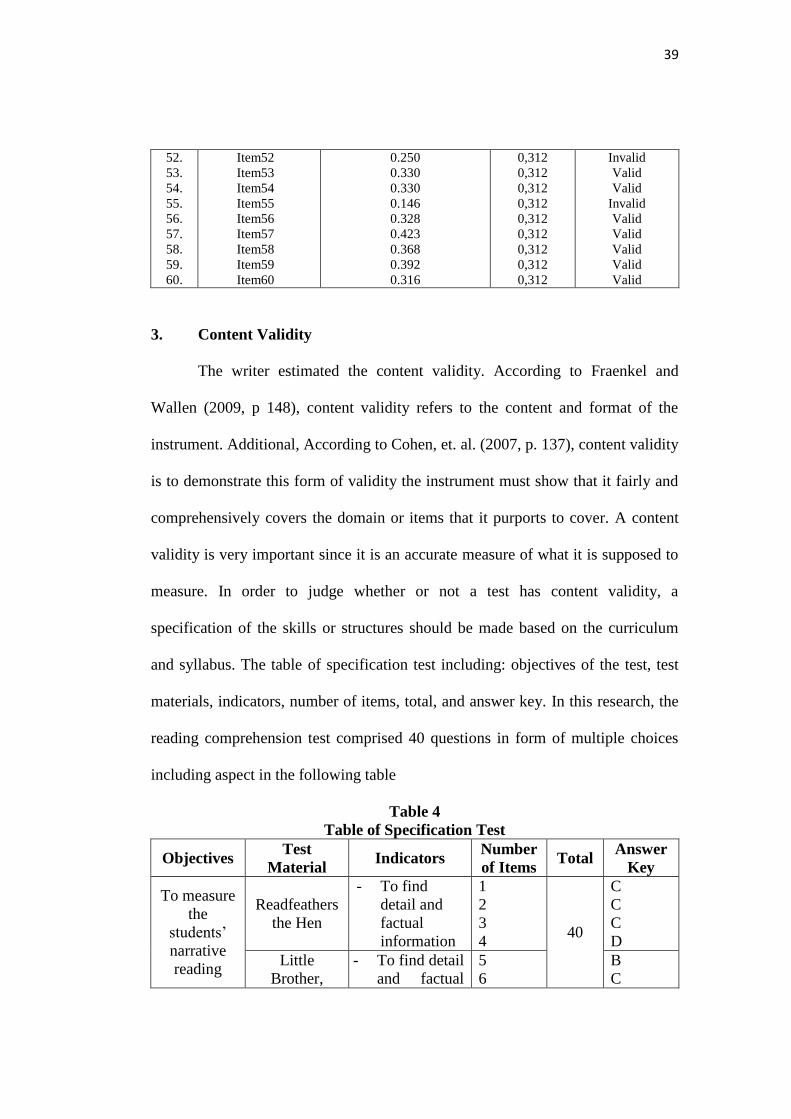
52. 53. 54. 55. 56. 57. 58. 59. 60.
Item52 Item53 Item54 Item55 Item56 Item57 Item58 Item59 Item60
0.250 0.330 0.330 0.146 0.328 0.423 0.368 0.392 0.316
0,312 0,312 0,312 0,312 0,312 0,312 0,312 0,312 0,312
Invalid Valid Valid
Invalid Valid Valid Valid Valid Valid
3. Content Validity
The writer estimated the content validity. According to Fraenkel and
Wallen (2009, p 148), content validity refers to the content and format of the
instrument. Additional, According to Cohen, et. al. (2007, p. 137), content validity
is to demonstrate this form of validity the instrument must show that it fairly and
comprehensively covers the domain or items that it purports to cover. A content
validity is very important since it is an accurate measure of what it is supposed to
measure. In order to judge whether or not a test has content validity, a
specification of the skills or structures should be made based on the curriculum
and syllabus. The table of specification test including: objectives of the test, test
materials, indicators, number of items, total, and answer key. In this research, the
reading comprehension test comprised 40 questions in form of multiple choices
including aspect in the following table
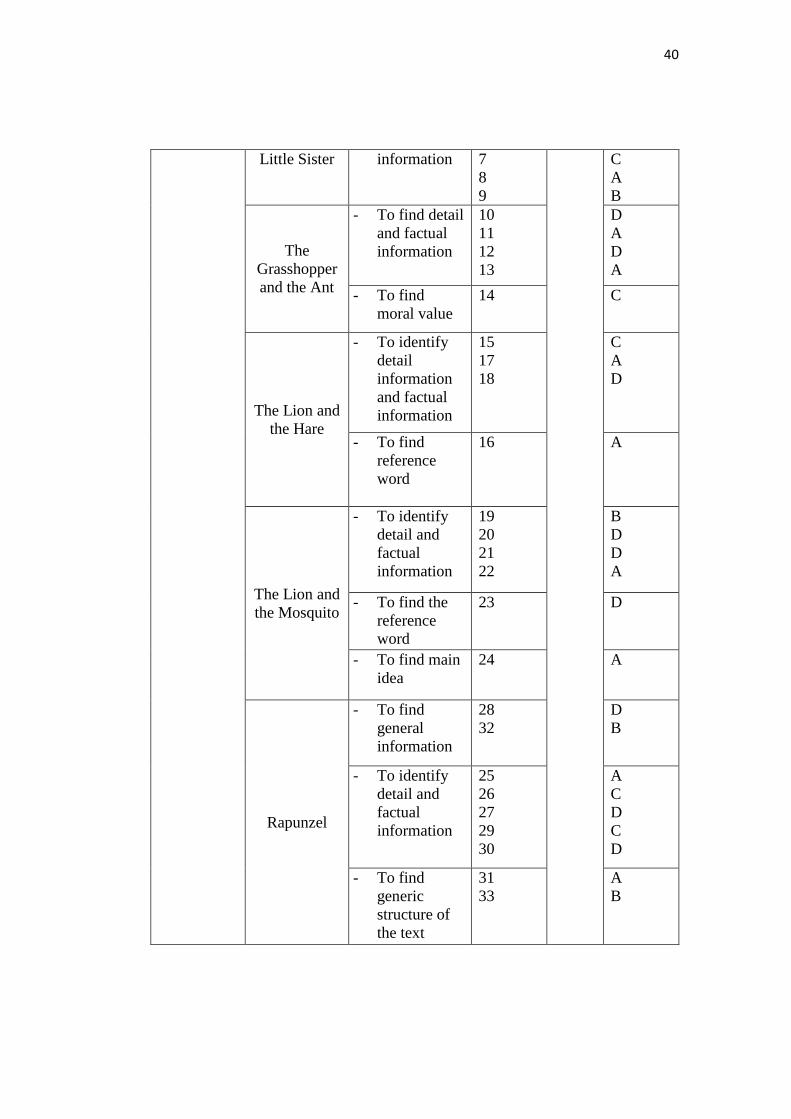
Table 4 Table of Specification Test
Objectives Test Material
Indicators Number of Items
Total Answer Key
To measure the
students’ narrative reading
Readfeathers the Hen
- To find detail and factual information
1 2 3 4
40
C C C D
Little Brother,
- To find detail and factual
5 6
B C
40
Little Sister information 7 8 9
C A B
The Grasshopper and the Ant
- To find detail and factual information
10 11 12 13
D A D A
- To find moral value
14 C
The Lion and the Hare
- To identify detail information and factual information
15 17 18
C A D
- To find reference word
16 A
The Lion and the Mosquito
- To identify detail and factual information
19 20 21 22
B D D A
- To find the reference word
23
D
- To find main idea
24 A
Rapunzel
- To find general information
28 32
D B
- To identify detail and factual information
25 26 27 29 30
A C D C D
- To find generic structure of the text
31 33
A B
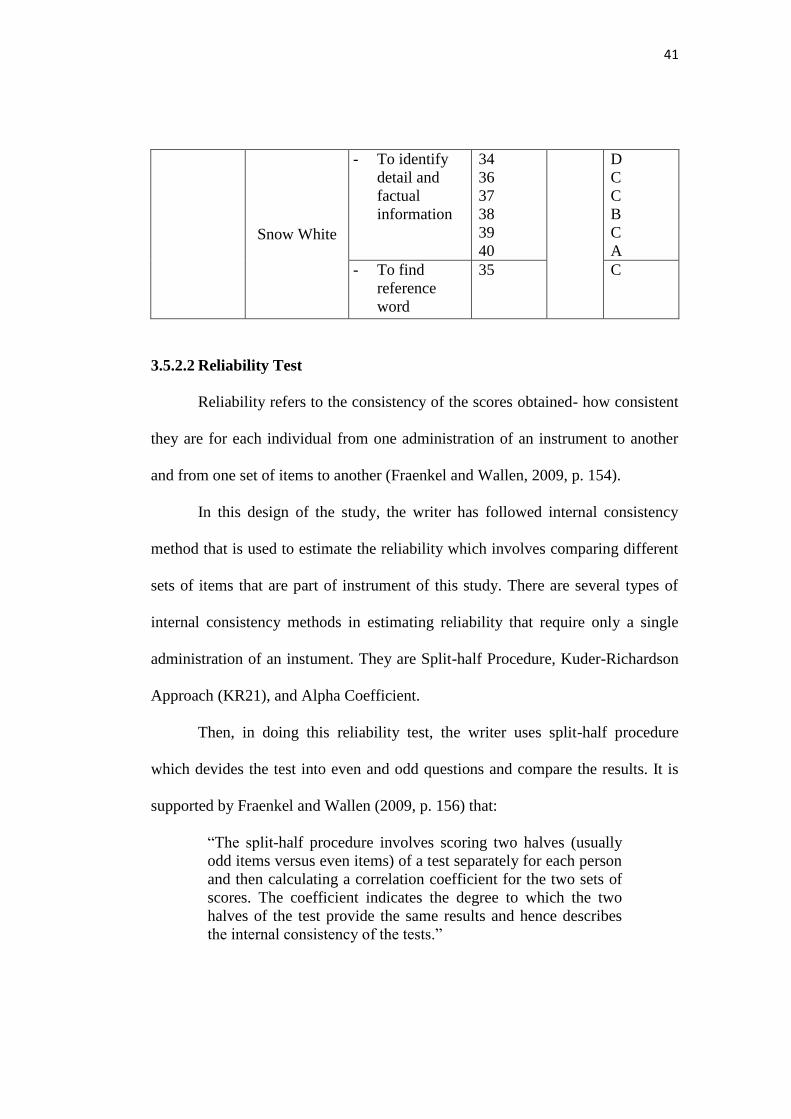
41
Snow White
- To identify detail and factual information
34 36 37 38 39 40
D C C B C A
- To find reference word
35 C
3.5.2.2 Reliability Test
Reliability refers to the consistency of the scores obtained- how consistent
they are for each individual from one administration of an instrument to another
and from one set of items to another (Fraenkel and Wallen, 2009, p. 154).
In this design of the study, the writer has followed internal consistency
method that is used to estimate the reliability which involves comparing different
sets of items that are part of instrument of this study. There are several types of
internal consistency methods in estimating reliability that require only a single
administration of an instument. They are Split-half Procedure, Kuder-Richardson
Approach (KR21), and Alpha Coefficient.
Then, in doing this reliability test, the writer uses split-half procedure
which devides the test into even and odd questions and compare the results. It is
supported by Fraenkel and Wallen (2009, p. 156) that:
“The split-half procedure involves scoring two halves (usually odd items versus even items) of a test separately for each person and then calculating a correlation coefficient for the two sets of scores. The coefficient indicates the degree to which the two halves of the test provide the same results and hence describes the internal consistency of the tests.”
42
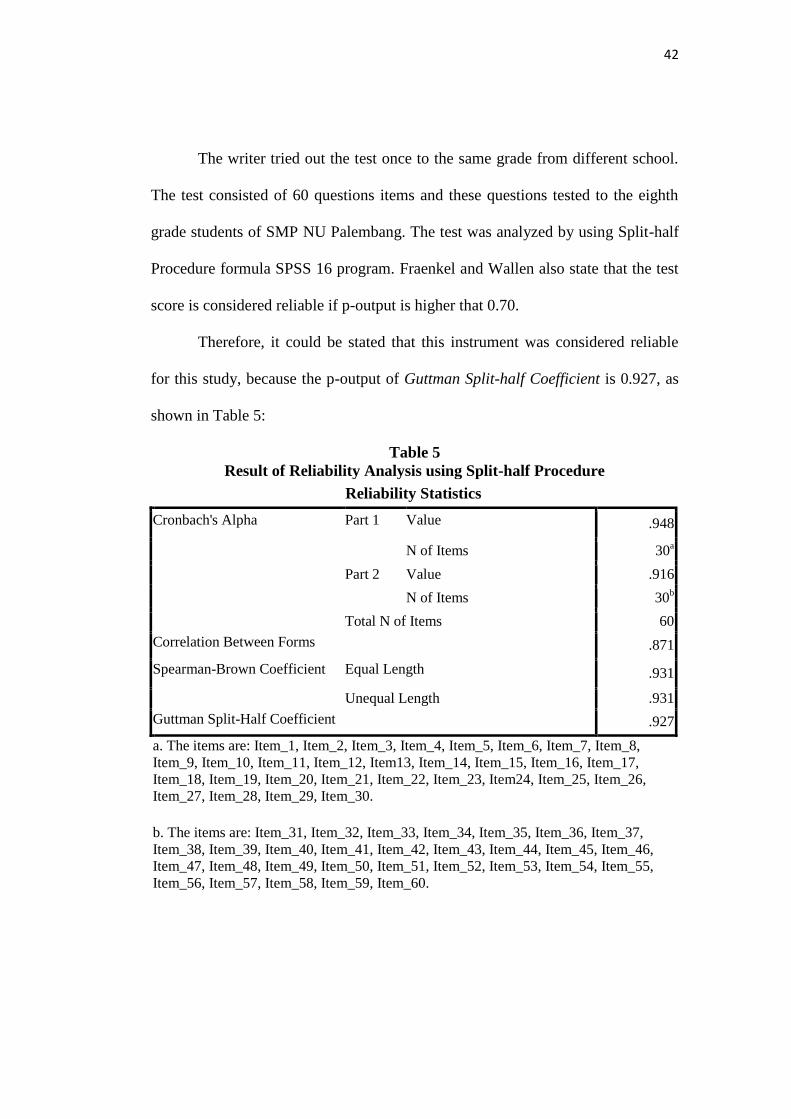
The writer tried out the test once to the same grade from different school.
The test consisted of 60 questions items and these questions tested to the eighth
grade students of SMP NU Palembang. The test was analyzed by using Split-half
Procedure formula SPSS 16 program. Fraenkel and Wallen also state that the test
score is considered reliable if p-output is higher that 0.70.
Therefore, it could be stated that this instrument was considered reliable
for this study, because the p-output of Guttman Split-half Coefficient is 0.927, as
shown in Table 5:
Table 5 Result of Reliability Analysis using Split-half Procedure
Reliability Statistics
Cronbach's Alpha Part 1 Value .948
N of Items 30a
Part 2 Value .916
N of Items 30b
Total N of Items 60
Correlation Between Forms .871
Spearman-Brown Coefficient Equal Length .931
Unequal Length .931
Guttman Split-Half Coefficient .927
a. The items are: Item_1, Item_2, Item_3, Item_4, Item_5, Item_6, Item_7, Item_8, Item_9, Item_10, Item_11, Item_12, Item13, Item_14, Item_15, Item_16, Item_17, Item_18, Item_19, Item_20, Item_21, Item_22, Item_23, Item24, Item_25, Item_26, Item_27, Item_28, Item_29, Item_30.
b. The items are: Item_31, Item_32, Item_33, Item_34, Item_35, Item_36, Item_37, Item_38, Item_39, Item_40, Item_41, Item_42, Item_43, Item_44, Item_45, Item_46, Item_47, Item_48, Item_49, Item_50, Item_51, Item_52, Item_53, Item_54, Item_55, Item_56, Item_57, Item_58, Item_59, Item_60.
43
3.5.3 Research Treatment
Treatments were designed at least for fourteen meetings including pretest
and posttest activities for each strategy.
3.5.3.1 Readability Test
In this study, treatments were given after pretest, it was done to know the
students’ scores in reading comprehension by using SQ3R strategy and ETR
strategy for each pretest.
Readability test is done to know the appropiate level of reading texts for
students’ class level in comprehensing the reading texts. It means that readability
test is done to put the reading texts in an appropiate class meeting based on the
difficulty level of each reading text during research treatments. Readability test is
measured using online readability score test which is accessed in
http//www.readability-score.com.
There are seven categories in reading text level. They are: (a) very easy
level whenever the result of flesch reading ease score is within 90-100, (b) easy
text level whenever the result of flesch reading ease score is within 80-89, (c)
fairly easy text level when the result of flesch reading ease score is within 70-79,
(d) standard text level when the flesch reading ease score is within 60-69, (e)
fairly difficult text level when the flesch reading ease score is within 50-59, (f)
difficult text level the flesch reading ease score is within 30-49, (g) very
confusing text level the flesch reading ease score is within 0-29.
44
The writer determined the different level of the text from easy to difficult
in the treatment because each meeting could be structured well. Besides, the
students were not shocked and confused when they read the text.
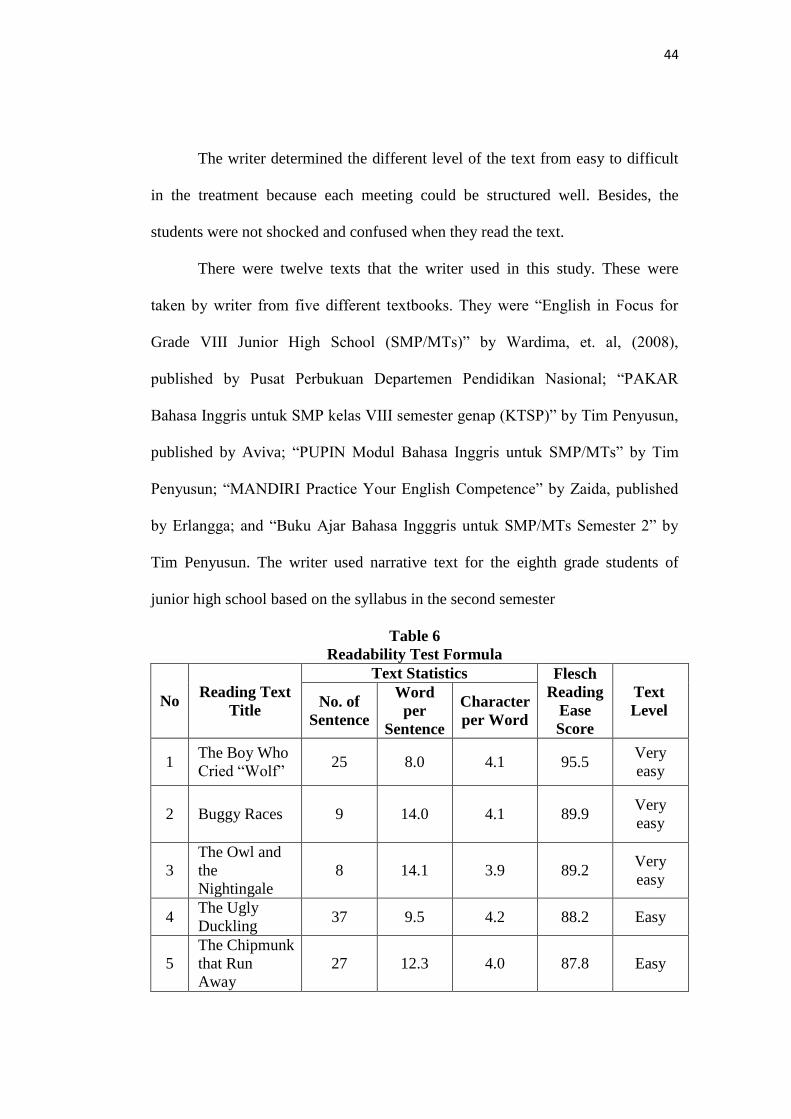
There were twelve texts that the writer used in this study. These were
taken by writer from five different textbooks. They were “English in Focus for
Grade VIII Junior High School (SMP/MTs)” by Wardima, et. al, (2008),
published by Pusat Perbukuan Departemen Pendidikan Nasional; “PAKAR
Bahasa Inggris untuk SMP kelas VIII semester genap (KTSP)” by Tim Penyusun,
published by Aviva; “PUPIN Modul Bahasa Inggris untuk SMP/MTs” by Tim
Penyusun; “MANDIRI Practice Your English Competence” by Zaida, published
by Erlangga; and “Buku Ajar Bahasa Ingggris untuk SMP/MTs Semester 2” by
Tim Penyusun. The writer used narrative text for the eighth grade students of
junior high school based on the syllabus in the second semester
Table 6 Readability Test Formula
No Reading Text Title
Text Statistics Flesch Reading
Ease Score
Text Level No. of
Sentence
Word per
Sentence
Character per Word
1 The Boy Who Cried “Wolf”
25 8.0 4.1 95.5 Very easy
2 Buggy Races 9 14.0 4.1 89.9 Very easy
3 The Owl and the Nightingale
8 14.1 3.9 89.2 Very easy
4 The Ugly Duckling
37 9.5 4.2 88.2 Easy
5 The Chipmunk that Run Away
27 12.3 4.0 87.8 Easy
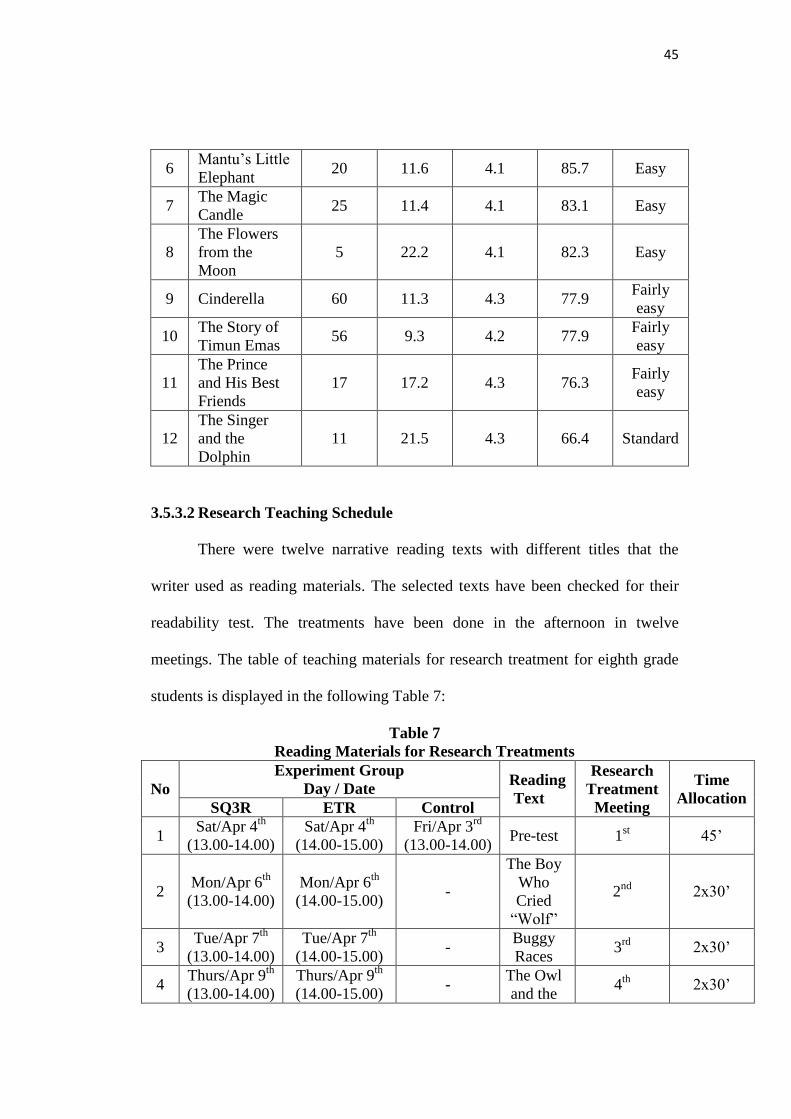
45
6 Mantu’s Little Elephant
20 11.6 4.1 85.7 Easy
7 The Magic Candle
25 11.4 4.1 83.1 Easy
8 The Flowers from the Moon
5 22.2 4.1 82.3 Easy
9 Cinderella 60 11.3 4.3 77.9 Fairly easy
10 The Story of Timun Emas
56 9.3 4.2 77.9 Fairly easy
11 The Prince and His Best Friends
17 17.2 4.3 76.3 Fairly easy
12 The Singer and the Dolphin
11 21.5 4.3 66.4 Standard
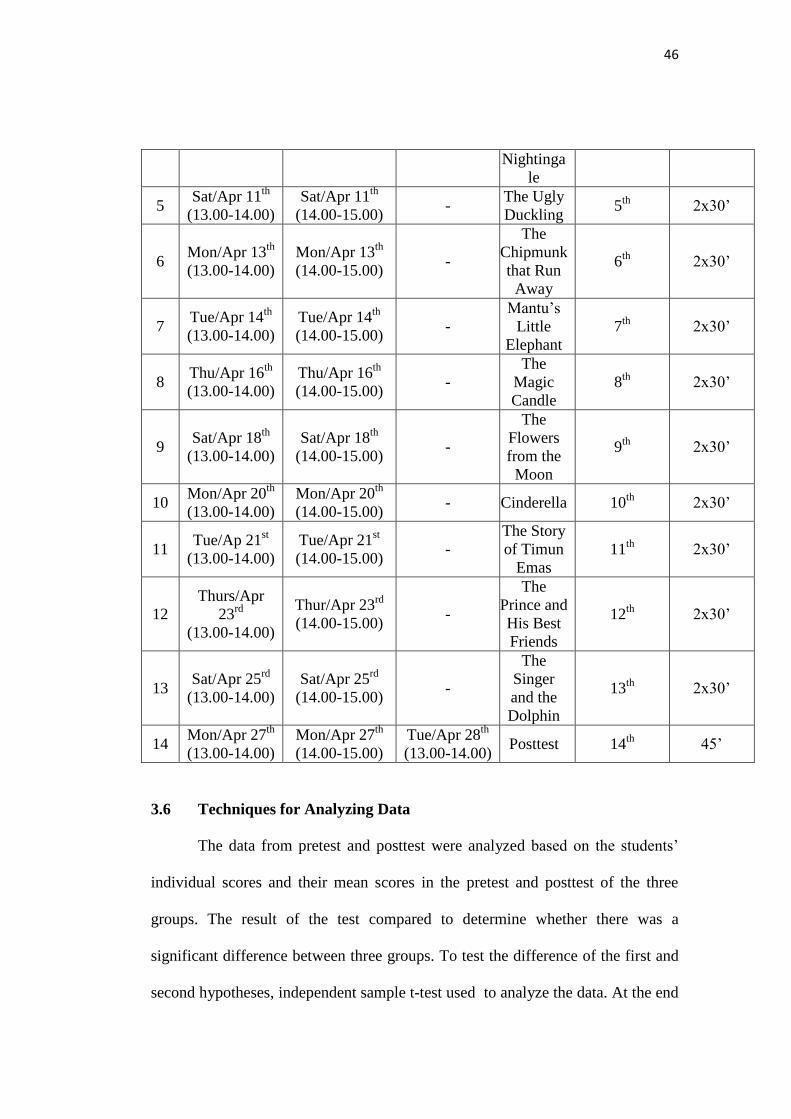
3.5.3.2 Research Teaching Schedule
There were twelve narrative reading texts with different titles that the
writer used as reading materials. The selected texts have been checked for their
readability test. The treatments have been done in the afternoon in twelve
meetings. The table of teaching materials for research treatment for eighth grade
students is displayed in the following Table 7:
Table 7 Reading Materials for Research Treatments
No Experiment Group
Day / Date Reading Text
Research Treatment
Meeting
Time Allocation
SQ3R ETR Control
1 Sat/Apr 4th
(13.00-14.00) Sat/Apr 4th
(14.00-15.00) Fri/Apr 3rd
(13.00-14.00) Pre-test 1st 45’
2 Mon/Apr 6th
(13.00-14.00) Mon/Apr 6th (14.00-15.00)
-
The Boy Who Cried
“Wolf”
2nd 2x30’
3 Tue/Apr 7th
(13.00-14.00) Tue/Apr 7th
(14.00-15.00) -
Buggy Races
3rd 2x30’
4 Thurs/Apr 9th
(13.00-14.00) Thurs/Apr 9th (14.00-15.00)
- The Owl and the
4th 2x30’
46
Nightingale
5 Sat/Apr 11th
(13.00-14.00) Sat/Apr 11th
(14.00-15.00) -
The Ugly Duckling
5th 2x30’
6 Mon/Apr 13th (13.00-14.00)
Mon/Apr 13th (14.00-15.00)
-
The Chipmunk that Run Away
6th 2x30’
7 Tue/Apr 14th (13.00-14.00)
Tue/Apr 14th (14.00-15.00)
- Mantu’s
Little Elephant
7th 2x30’
8 Thu/Apr 16th (13.00-14.00)
Thu/Apr 16th (14.00-15.00)
- The
Magic Candle
8th 2x30’
9 Sat/Apr 18th
(13.00-14.00) Sat/Apr 18th
(14.00-15.00) -
The Flowers from the Moon
9th 2x30’
10 Mon/Apr 20th (13.00-14.00)
Mon/Apr 20th (14.00-15.00)
- Cinderella 10th 2x30’
11 Tue/Ap 21st
(13.00-14.00) Tue/Apr 21st (14.00-15.00)
- The Story of Timun
Emas 11th 2x30’
12 Thurs/Apr
23rd (13.00-14.00)
Thur/Apr 23rd (14.00-15.00)
-
The Prince and His Best Friends
12th 2x30’
13 Sat/Apr 25rd
(13.00-14.00) Sat/Apr 25rd
(14.00-15.00) -
The Singer and the Dolphin
13th 2x30’
14 Mon/Apr 27th (13.00-14.00)
Mon/Apr 27th (14.00-15.00)
Tue/Apr 28th
(13.00-14.00) Posttest 14th 45’
3.6 Techniques for Analyzing Data
The data from pretest and posttest were analyzed based on the students’
individual scores and their mean scores in the pretest and posttest of the three
groups. The result of the test compared to determine whether there was a
significant difference between three groups. To test the difference of the first and
second hypotheses, independent sample t-test used to analyze the data. At the end
47
of this analysis, the researcher applied one way annova to determine the third
acceptable hypotheses. by using SPSS for windows version 16.0.
3.6.1 Data Description
Data description illustrate two analyses. They are distribution of
frequency data and descriptive statistic.
3.6.1.1 Distribution of Frequency Data
In distributions of frequency data, the students’ score, frequency,
percentage are achieved. The distributions of frequency data are obtained from
students’ pretest score in control group, students’ posttest score in control group,
students’ pretest score in experimental group, and students’ posttest score in
experimental group.
3.6.1.2 Descriptive Statistics
In descriptive statistic, number of sample, the score of minimal, maximal,
mean, standard deviation, and standard error of mean are obtained. Descriptive
statistics are obtained from student’s pretest and posttest scores in control groups
and experimental groups.
3.6.2 Pre-requisite Analysis
Before analyzing the data, pre-requisite analysis should be done to see
whether tha data obtained are normal or homogenous
48
3.6.2.1 Normality Test
Normality test was done to know whether the results of the students’
pretest and posttest in control and experimental groups are normal or not. In
analyzing the normality, the writer used Kolmogorov-Smirnov test in SPSS 16.
The data were obtained from the students’ pretest and posttest in control and
experimental groups. The test is considered normal whenever it is higher than
0.05.
3.6.2.2 Homogeneity Test
Homogeneity test was done to know whether the results of the students’
pretest and posttest in control and experimental groups are homogenous or not. In
analyzing the homogeneity, the writer used the Levene Statistics in SPSS 16. The
result is obtained from the students’ pretest and posttest in control and
experimental groups. The test is considered homogenous whenever it is higher
than 0.05.
3.6.3 Hypotheses Testings
Hypothesis testing is a procedure for making decisions about results by
comparing an observed value of a sample with a population value to determine if
no difference or relationship exists between the values (Creswel, 2012, p. 187).
In this study, there were some hypotheses testings. They were as follows:
49
3.6.3.1 Hypotheses Testing in Measuring a Significant Difference on
Narrative Reading Text Between the Students’ Who are Taught by
Using SQ3R and Those are Not
In measuring significant difference on students’ posttest scores in the first
experimental and control groups, an independent sample t-test was used. A
significant difference was found whenever the p-output is lower than mean
significant difference at 0.05 levels and t-value is higher than t-table (Fraenkel &
Wallen, 2009, p. 229).
3.6.3.2 Hypotheses Testing in Measuring a Significant Difference on
Narrative Reading Text Between the Students’ Who are Taught by
Using ETR and Those are not
In measuring significant difference on students’ posttest scores in the
second experimental and control groups, an independent sample t-test was used. A
significant difference was found whenever the p-output is lower than mean
significant difference at 0.05 levels and t-value is higher than t-table (Fraenkel &
Wallen, 2009, p. 229).
3.6.3.3 Hypotheses Testing in Measuring a Significant Difference on
Students’ Narrative Reading Text Between Those Who are Taught by
Using SQ3R Strategy, ETR Strategy, and the Teacher’s Method
In this study, one-way ANOVA was used to measure a significant
difference on the eighth grade students’ narrative reading text after taught by
50
using SQ3R, ETR and the students’ posttest score in control group. A significant
difference is found whenever the p-output is lower than mean signinificant
difference at 0.05 levels and F-value is higher than t-table (Fraenkel & Wallen,
2009, p. 232).